Wilberforce, OH Map & Demographics
Wilberforce Map
Wilberforce Overview
$15,125
PER CAPITA INCOME
$87,841
AVG FAMILY INCOME
$79,423
AVG HOUSEHOLD INCOME
27.5%
WAGE / INCOME GAP [ % ]
72.5¢/ $1
WAGE / INCOME GAP [ $ ]
0.39
INEQUALITY / GINI INDEX
2,190
TOTAL POPULATION
906
MALE POPULATION
1,284
FEMALE POPULATION
70.56
MALES / 100 FEMALES
141.72
FEMALES / 100 MALES
20.2
MEDIAN AGE
3.3
AVG FAMILY SIZE
2.6
AVG HOUSEHOLD SIZE
1,128
LABOR FORCE [ PEOPLE ]
55.5%
PERCENT IN LABOR FORCE
12.8%
UNEMPLOYMENT RATE
Wilberforce Zip Codes
Wilberforce Area Codes
Income in Wilberforce
Income Overview in Wilberforce
Per Capita Income in Wilberforce is $15,125, while median incomes of families and households are $87,841 and $79,423 respectively.
| Characteristic | Number | Measure |
| Per Capita Income | 2,190 | $15,125 |
| Median Family Income | 159 | $87,841 |
| Mean Family Income | 159 | $104,087 |
| Median Household Income | 248 | $79,423 |
| Mean Household Income | 248 | $89,944 |
| Income Deficit | 159 | $0 |
| Wage / Income Gap (%) | 2,190 | 27.45% |
| Wage / Income Gap ($) | 2,190 | 72.55¢ per $1 |
| Gini / Inequality Index | 2,190 | 0.39 |
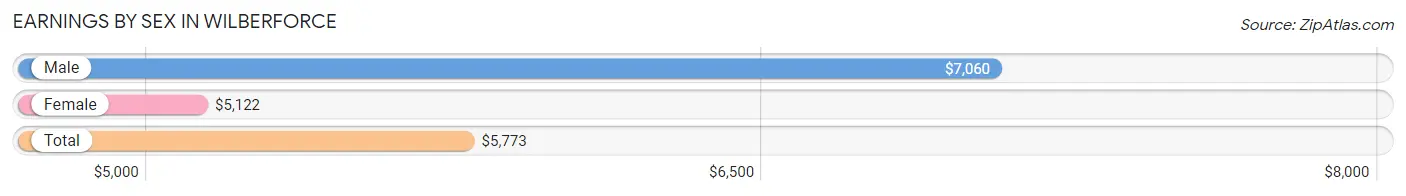
Earnings by Sex in Wilberforce
Average Earnings in Wilberforce are $5,773, $7,060 for men and $5,122 for women, a difference of 27.5%.
| Sex | Number | Average Earnings |
| Male | 697 (41.3%) | $7,060 |
| Female | 991 (58.7%) | $5,122 |
| Total | 1,688 (100.0%) | $5,773 |
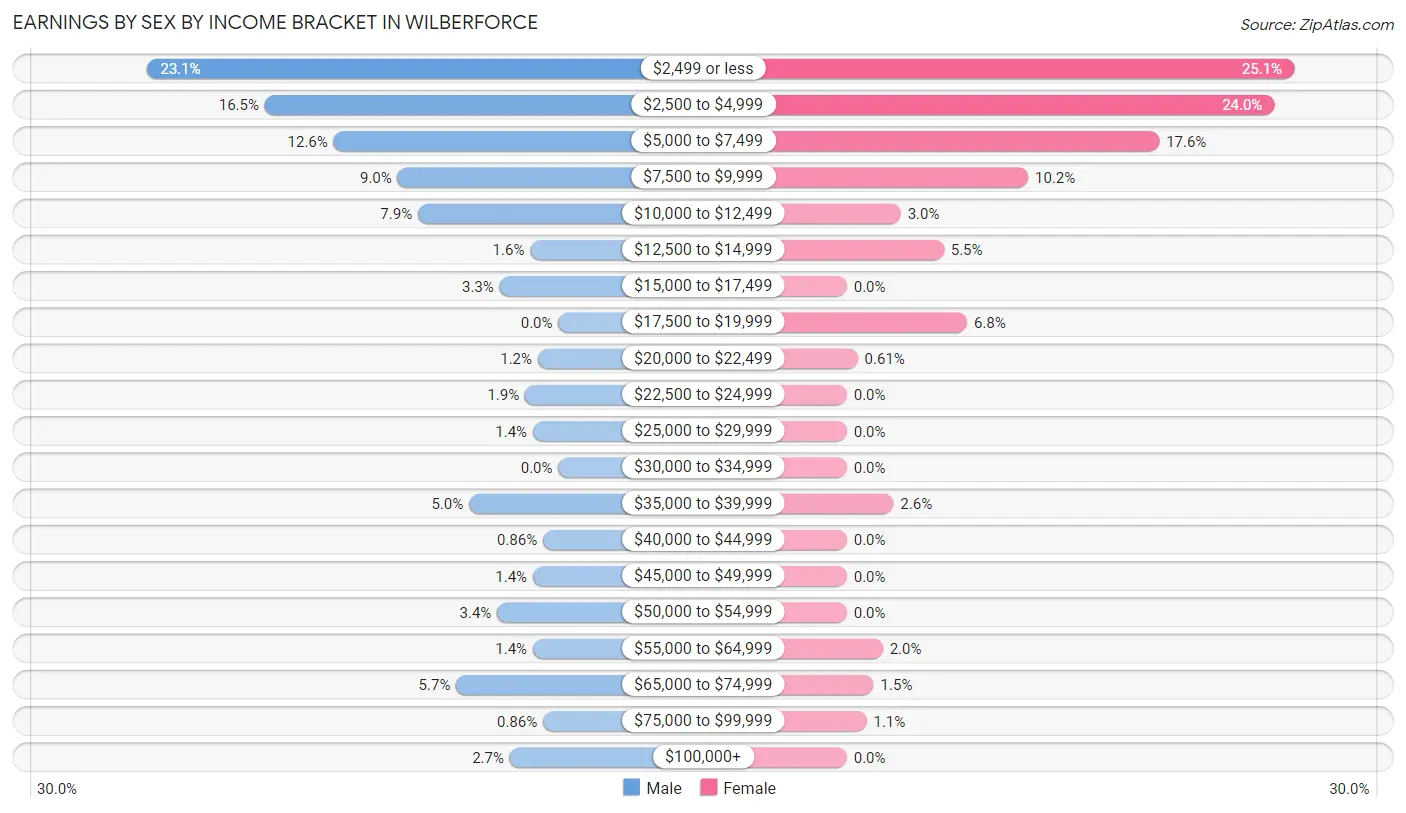
Earnings by Sex by Income Bracket in Wilberforce
The most common earnings brackets in Wilberforce are $2,499 or less for men (161 | 23.1%) and $2,499 or less for women (249 | 25.1%).
| Income | Male | Female |
| $2,499 or less | 161 (23.1%) | 249 (25.1%) |
| $2,500 to $4,999 | 115 (16.5%) | 238 (24.0%) |
| $5,000 to $7,499 | 88 (12.6%) | 174 (17.6%) |
| $7,500 to $9,999 | 63 (9.0%) | 101 (10.2%) |
| $10,000 to $12,499 | 55 (7.9%) | 30 (3.0%) |
| $12,500 to $14,999 | 11 (1.6%) | 54 (5.4%) |
| $15,000 to $17,499 | 23 (3.3%) | 0 (0.0%) |
| $17,500 to $19,999 | 0 (0.0%) | 67 (6.8%) |
| $20,000 to $22,499 | 8 (1.1%) | 6 (0.6%) |
| $22,500 to $24,999 | 13 (1.9%) | 0 (0.0%) |
| $25,000 to $29,999 | 10 (1.4%) | 0 (0.0%) |
| $30,000 to $34,999 | 0 (0.0%) | 0 (0.0%) |
| $35,000 to $39,999 | 35 (5.0%) | 26 (2.6%) |
| $40,000 to $44,999 | 6 (0.9%) | 0 (0.0%) |
| $45,000 to $49,999 | 10 (1.4%) | 0 (0.0%) |
| $50,000 to $54,999 | 24 (3.4%) | 0 (0.0%) |
| $55,000 to $64,999 | 10 (1.4%) | 20 (2.0%) |
| $65,000 to $74,999 | 40 (5.7%) | 15 (1.5%) |
| $75,000 to $99,999 | 6 (0.9%) | 11 (1.1%) |
| $100,000+ | 19 (2.7%) | 0 (0.0%) |
| Total | 697 (100.0%) | 991 (100.0%) |
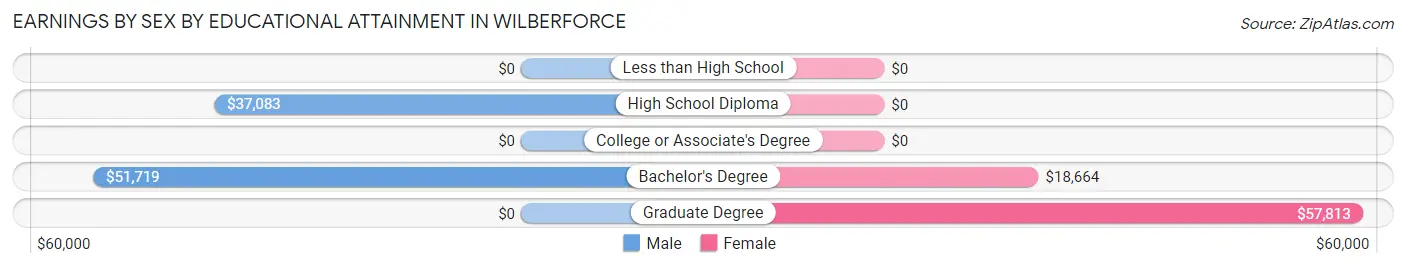
Earnings by Sex by Educational Attainment in Wilberforce
| Educational Attainment | Male Income | Female Income |
| Less than High School | - | - |
| High School Diploma | $37,083 | $0 |
| College or Associate's Degree | - | - |
| Bachelor's Degree | $51,719 | $18,664 |
| Graduate Degree | - | - |
| Total | $51,641 | $0 |
Family Income in Wilberforce
Family Income Brackets in Wilberforce
According to the Wilberforce family income data, there are 55 families falling into the $100,000 to $149,999 income range, which is the most common income bracket and makes up 34.6% of all families.
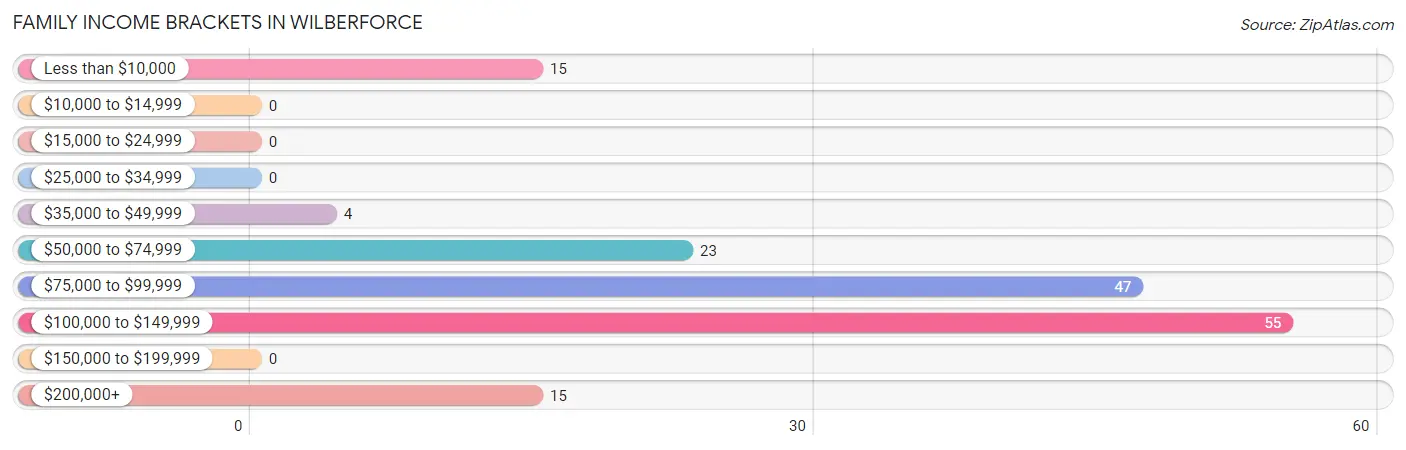
| Income Bracket | # Families | % Families |
| Less than $10,000 | 15 | 9.4% |
| $10,000 to $14,999 | 0 | 0.0% |
| $15,000 to $24,999 | 0 | 0.0% |
| $25,000 to $34,999 | 0 | 0.0% |
| $35,000 to $49,999 | 4 | 2.5% |
| $50,000 to $74,999 | 23 | 14.5% |
| $75,000 to $99,999 | 47 | 29.6% |
| $100,000 to $149,999 | 55 | 34.6% |
| $150,000 to $199,999 | 0 | 0.0% |
| $200,000+ | 15 | 9.4% |
Family Income by Famaliy Size in Wilberforce
2-person families (70 | 44.0%) account for the highest median family income in Wilberforce with $125,000 per family, while 2-person families (70 | 44.0%) have the highest median income of $62,500 per family member.
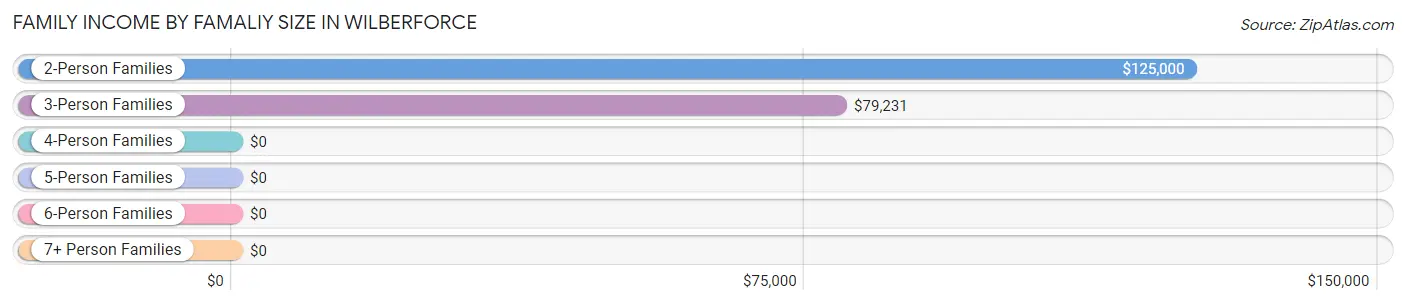
| Income Bracket | # Families | Median Income |
| 2-Person Families | 70 (44.0%) | $125,000 |
| 3-Person Families | 66 (41.5%) | $79,231 |
| 4-Person Families | 10 (6.3%) | $0 |
| 5-Person Families | 0 (0.0%) | $0 |
| 6-Person Families | 0 (0.0%) | $0 |
| 7+ Person Families | 13 (8.2%) | $0 |
| Total | 159 (100.0%) | $87,841 |
Family Income by Number of Earners in Wilberforce
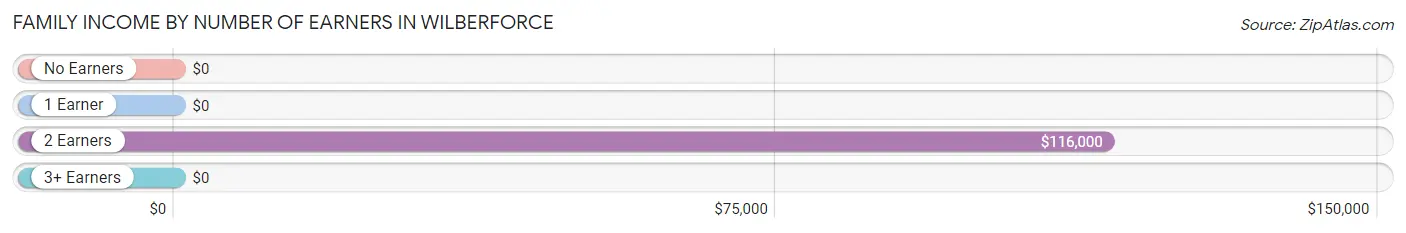
| Number of Earners | # Families | Median Income |
| No Earners | 49 (30.8%) | $0 |
| 1 Earner | 24 (15.1%) | $0 |
| 2 Earners | 86 (54.1%) | $116,000 |
| 3+ Earners | 0 (0.0%) | $0 |
| Total | 159 (100.0%) | $87,841 |
Household Income in Wilberforce
Household Income Brackets in Wilberforce
With 69 households falling in the category, the $100,000 to $149,999 income range is the most frequent in Wilberforce, accounting for 27.8% of all households.
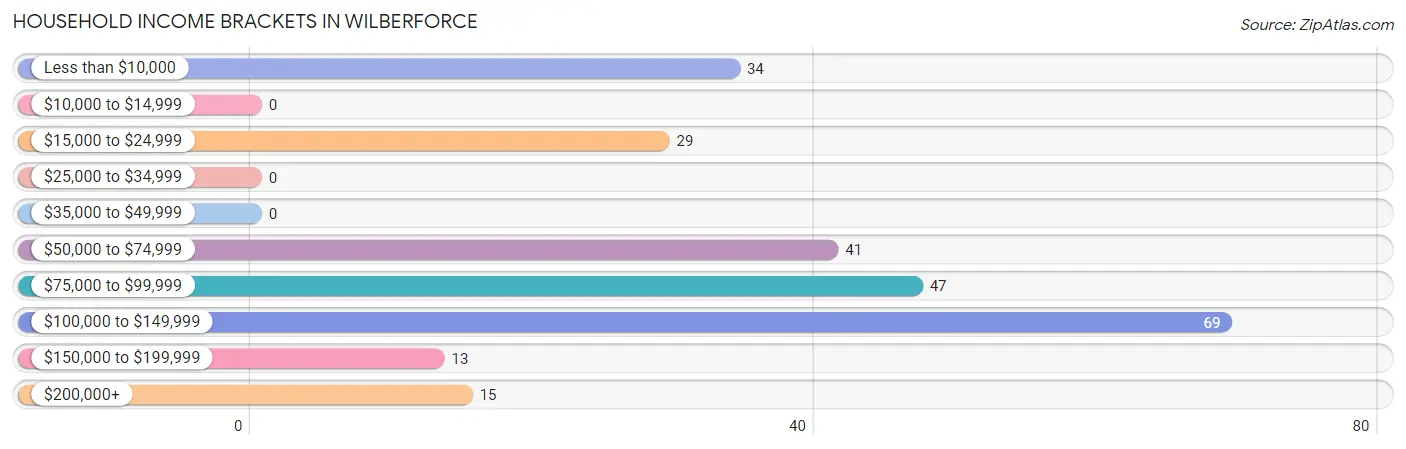
| Income Bracket | # Households | % Households |
| Less than $10,000 | 34 | 13.7% |
| $10,000 to $14,999 | 0 | 0.0% |
| $15,000 to $24,999 | 29 | 11.7% |
| $25,000 to $34,999 | 0 | 0.0% |
| $35,000 to $49,999 | 0 | 0.0% |
| $50,000 to $74,999 | 41 | 16.5% |
| $75,000 to $99,999 | 47 | 19.0% |
| $100,000 to $149,999 | 69 | 27.8% |
| $150,000 to $199,999 | 13 | 5.2% |
| $200,000+ | 15 | 6.0% |
Household Income by Householder Age in Wilberforce
The median household income in Wilberforce is $79,423, with the highest median household income of $117,292 found in the 45 to 64 years age bracket for the primary householder. A total of 64 households (25.8%) fall into this category.
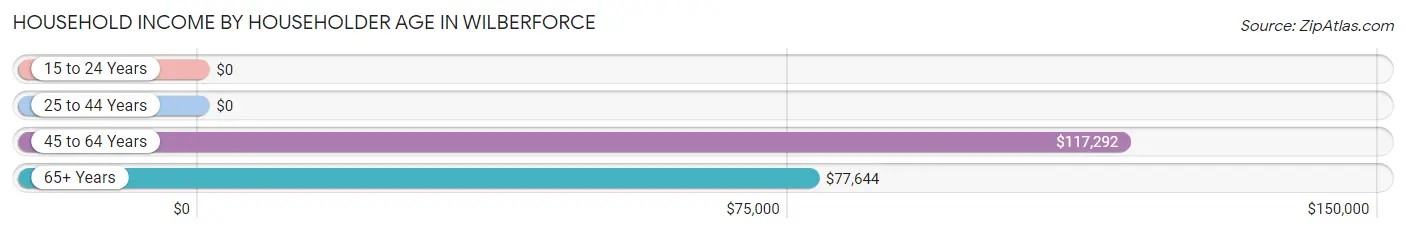
| Income Bracket | # Households | Median Income |
| 15 to 24 Years | 0 (0.0%) | $0 |
| 25 to 44 Years | 87 (35.1%) | $0 |
| 45 to 64 Years | 64 (25.8%) | $117,292 |
| 65+ Years | 97 (39.1%) | $77,644 |
| Total | 248 (100.0%) | $79,423 |
Poverty in Wilberforce
Income Below Poverty by Sex and Age in Wilberforce
With 12.9% poverty level for males and 4.1% for females among the residents of Wilberforce, 75 year old and over males and 25 to 34 year old females are the most vulnerable to poverty, with 19 males (65.5%) and 15 females (19.0%) in their respective age groups living below the poverty level.
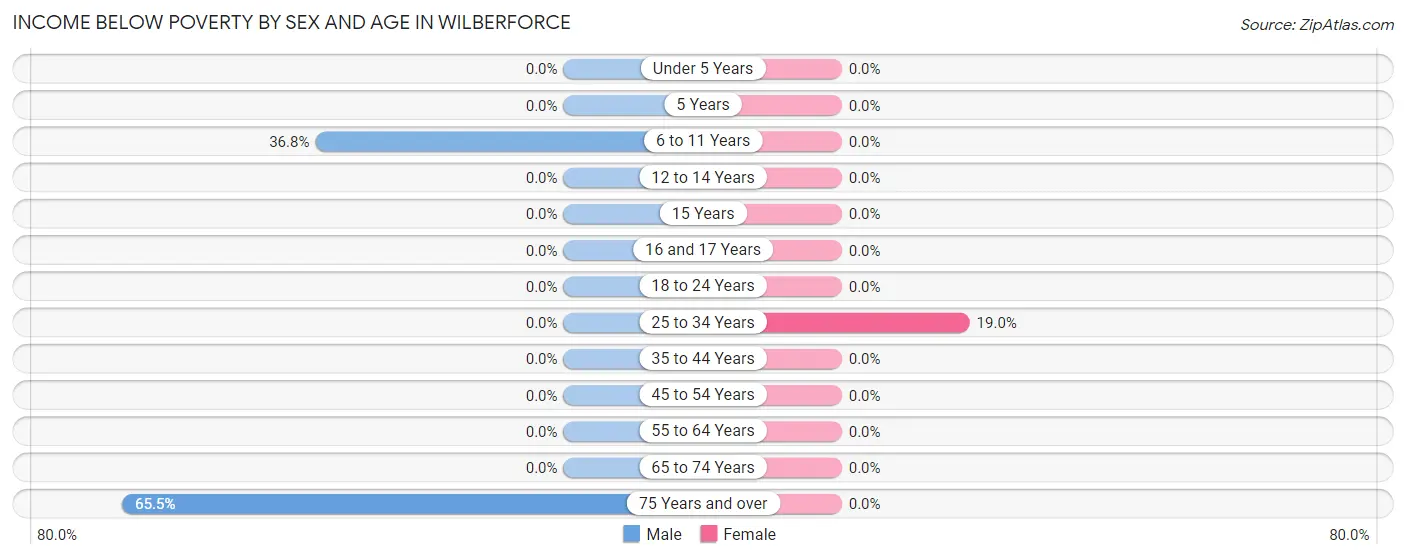
| Age Bracket | Male | Female |
| Under 5 Years | 0 (0.0%) | 0 (0.0%) |
| 5 Years | 0 (0.0%) | 0 (0.0%) |
| 6 to 11 Years | 21 (36.8%) | 0 (0.0%) |
| 12 to 14 Years | 0 (0.0%) | 0 (0.0%) |
| 15 Years | 0 (0.0%) | 0 (0.0%) |
| 16 and 17 Years | 0 (0.0%) | 0 (0.0%) |
| 18 to 24 Years | 0 (0.0%) | 0 (0.0%) |
| 25 to 34 Years | 0 (0.0%) | 15 (19.0%) |
| 35 to 44 Years | 0 (0.0%) | 0 (0.0%) |
| 45 to 54 Years | 0 (0.0%) | 0 (0.0%) |
| 55 to 64 Years | 0 (0.0%) | 0 (0.0%) |
| 65 to 74 Years | 0 (0.0%) | 0 (0.0%) |
| 75 Years and over | 19 (65.5%) | 0 (0.0%) |
| Total | 40 (12.9%) | 15 (4.1%) |
Income Above Poverty by Sex and Age in Wilberforce
According to the poverty statistics in Wilberforce, males aged under 5 years and females aged under 5 years are the age groups that are most secure financially, with 100.0% of males and 100.0% of females in these age groups living above the poverty line.
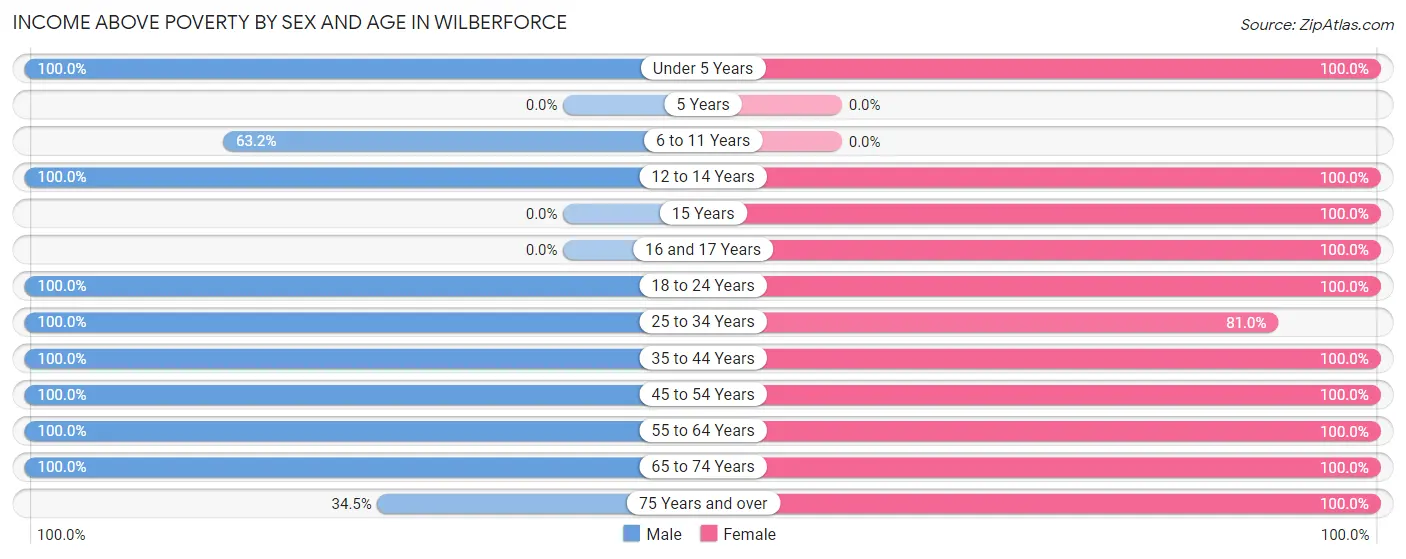
| Age Bracket | Male | Female |
| Under 5 Years | 12 (100.0%) | 12 (100.0%) |
| 5 Years | 0 (0.0%) | 0 (0.0%) |
| 6 to 11 Years | 36 (63.2%) | 0 (0.0%) |
| 12 to 14 Years | 15 (100.0%) | 43 (100.0%) |
| 15 Years | 0 (0.0%) | 19 (100.0%) |
| 16 and 17 Years | 0 (0.0%) | 32 (100.0%) |
| 18 to 24 Years | 34 (100.0%) | 6 (100.0%) |
| 25 to 34 Years | 56 (100.0%) | 64 (81.0%) |
| 35 to 44 Years | 23 (100.0%) | 13 (100.0%) |
| 45 to 54 Years | 27 (100.0%) | 35 (100.0%) |
| 55 to 64 Years | 25 (100.0%) | 49 (100.0%) |
| 65 to 74 Years | 31 (100.0%) | 32 (100.0%) |
| 75 Years and over | 10 (34.5%) | 44 (100.0%) |
| Total | 269 (87.1%) | 349 (95.9%) |
Income Below Poverty Among Married-Couple Families in Wilberforce
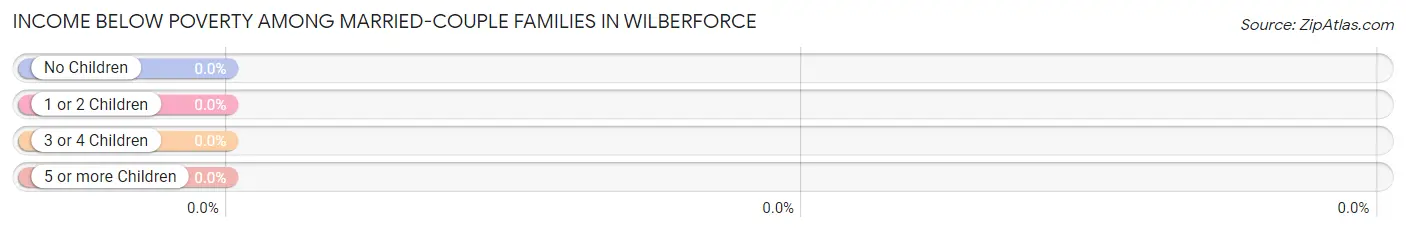
| Children | Above Poverty | Below Poverty |
| No Children | 66 (100.0%) | 0 (0.0%) |
| 1 or 2 Children | 10 (100.0%) | 0 (0.0%) |
| 3 or 4 Children | 0 (0.0%) | 0 (0.0%) |
| 5 or more Children | 13 (100.0%) | 0 (0.0%) |
| Total | 89 (100.0%) | 0 (0.0%) |
Income Below Poverty Among Single-Parent Households in Wilberforce
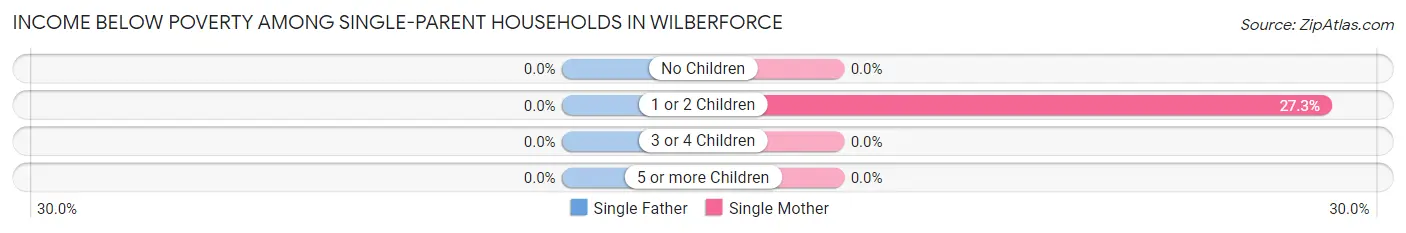
| Children | Single Father | Single Mother |
| No Children | 0 (0.0%) | 0 (0.0%) |
| 1 or 2 Children | 0 (0.0%) | 15 (27.3%) |
| 3 or 4 Children | 0 (0.0%) | 0 (0.0%) |
| 5 or more Children | 0 (0.0%) | 0 (0.0%) |
| Total | 0 (0.0%) | 15 (22.7%) |
Income Below Poverty Among Married-Couple vs Single-Parent Households in Wilberforce
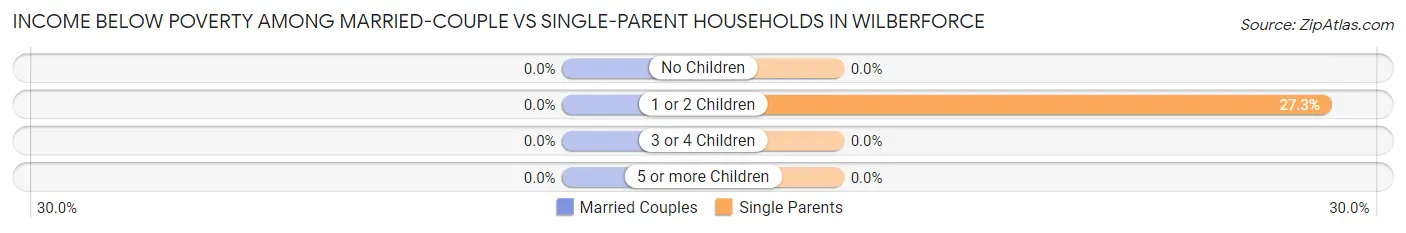
| Children | Married-Couple Families | Single-Parent Households |
| No Children | 0 (0.0%) | 0 (0.0%) |
| 1 or 2 Children | 0 (0.0%) | 15 (27.3%) |
| 3 or 4 Children | 0 (0.0%) | 0 (0.0%) |
| 5 or more Children | 0 (0.0%) | 0 (0.0%) |
| Total | 0 (0.0%) | 15 (21.4%) |
Race in Wilberforce
The most populous races in Wilberforce are Black / African American (1,299 | 59.3%), White / Caucasian (765 | 34.9%), and Two or more Races (97 | 4.4%).
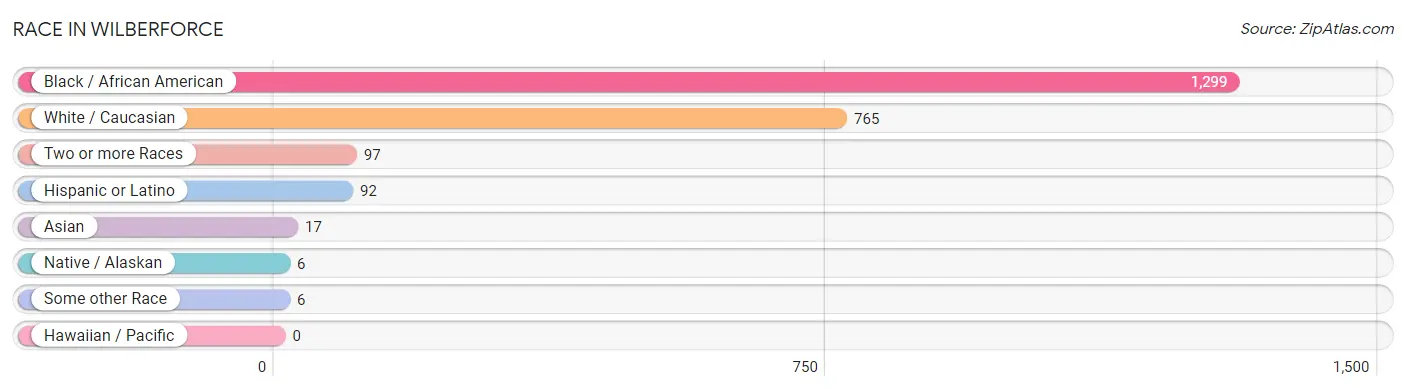
| Race | # Population | % Population |
| Asian | 17 | 0.8% |
| Black / African American | 1,299 | 59.3% |
| Hawaiian / Pacific | 0 | 0.0% |
| Hispanic or Latino | 92 | 4.2% |
| Native / Alaskan | 6 | 0.3% |
| White / Caucasian | 765 | 34.9% |
| Two or more Races | 97 | 4.4% |
| Some other Race | 6 | 0.3% |
| Total | 2,190 | 100.0% |
Ancestry in Wilberforce
The most populous ancestries reported in Wilberforce are German (291 | 13.3%), Swiss (115 | 5.2%), Irish (108 | 4.9%), Bahamian (107 | 4.9%), and Subsaharan African (104 | 4.8%), together accounting for 33.1% of all Wilberforce residents.
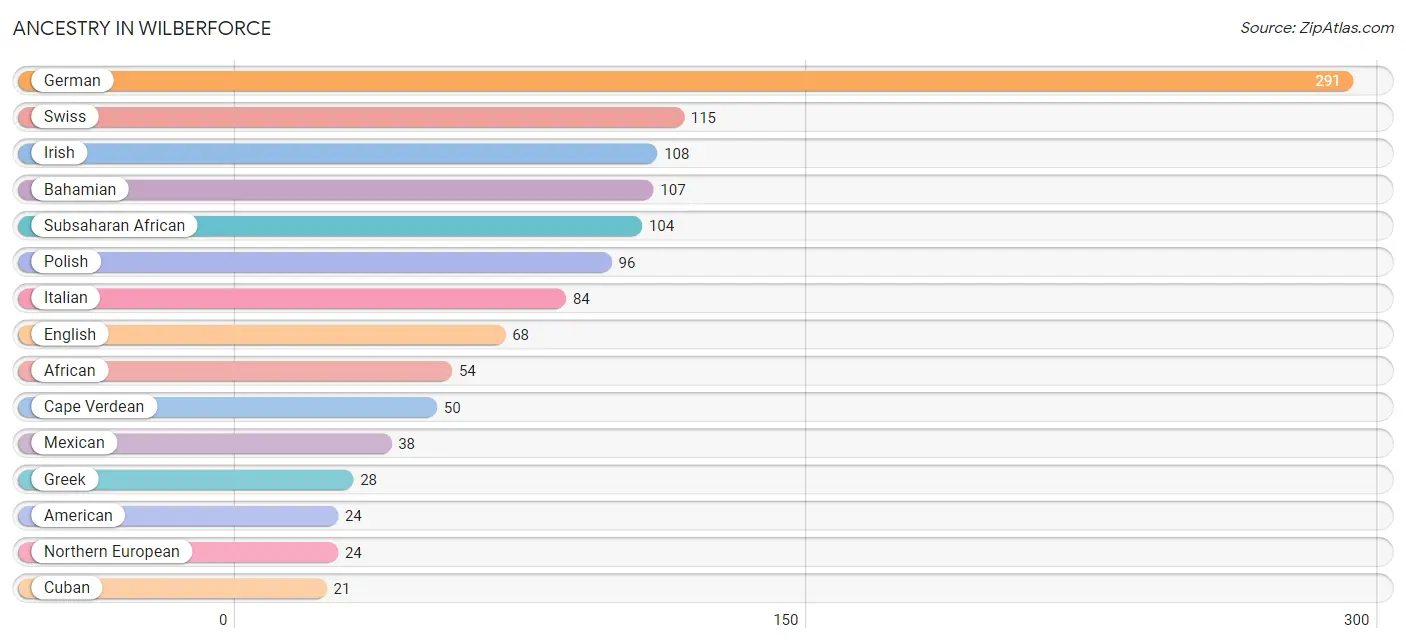
| Ancestry | # Population | % Population |
| African | 54 | 2.5% |
| American | 24 | 1.1% |
| Bahamian | 107 | 4.9% |
| British | 11 | 0.5% |
| Cape Verdean | 50 | 2.3% |
| Central American | 12 | 0.5% |
| Croatian | 19 | 0.9% |
| Cuban | 21 | 1.0% |
| Dutch | 18 | 0.8% |
| Ecuadorian | 6 | 0.3% |
| English | 68 | 3.1% |
| French | 11 | 0.5% |
| French Canadian | 3 | 0.1% |
| German | 291 | 13.3% |
| Greek | 28 | 1.3% |
| Haitian | 5 | 0.2% |
| Indian (Asian) | 7 | 0.3% |
| Irish | 108 | 4.9% |
| Italian | 84 | 3.8% |
| Korean | 12 | 0.5% |
| Mexican | 38 | 1.7% |
| Nicaraguan | 12 | 0.5% |
| Northern European | 24 | 1.1% |
| Norwegian | 5 | 0.2% |
| Polish | 96 | 4.4% |
| Scotch-Irish | 11 | 0.5% |
| Scottish | 11 | 0.5% |
| Serbian | 19 | 0.9% |
| South American | 6 | 0.3% |
| Sri Lankan | 6 | 0.3% |
| Subsaharan African | 104 | 4.8% |
| Swedish | 13 | 0.6% |
| Swiss | 115 | 5.2% |
| Thai | 10 | 0.5% | View All 34 Rows |
Immigrants in Wilberforce
The most numerous immigrant groups reported in Wilberforce came from Latin America (113 | 5.2%), Bahamas (107 | 4.9%), Caribbean (107 | 4.9%), Europe (24 | 1.1%), and Bosnia and Herzegovina (19 | 0.9%), together accounting for 16.9% of all Wilberforce residents.
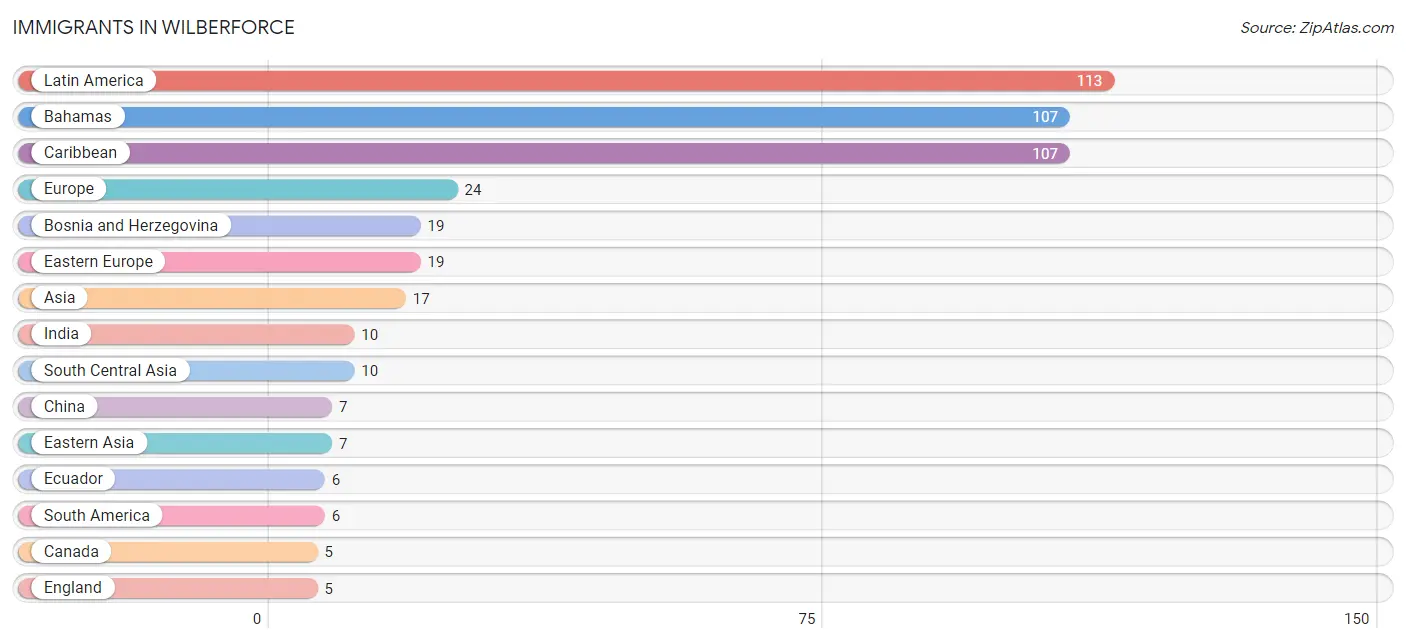
| Immigration Origin | # Population | % Population |
| Asia | 17 | 0.8% |
| Bahamas | 107 | 4.9% |
| Bosnia and Herzegovina | 19 | 0.9% |
| Canada | 5 | 0.2% |
| Caribbean | 107 | 4.9% |
| China | 7 | 0.3% |
| Eastern Asia | 7 | 0.3% |
| Eastern Europe | 19 | 0.9% |
| Ecuador | 6 | 0.3% |
| England | 5 | 0.2% |
| Europe | 24 | 1.1% |
| India | 10 | 0.5% |
| Latin America | 113 | 5.2% |
| Northern Europe | 5 | 0.2% |
| South America | 6 | 0.3% |
| South Central Asia | 10 | 0.5% | View All 16 Rows |
Sex and Age in Wilberforce
Sex and Age in Wilberforce
The most populous age groups in Wilberforce are 20 to 24 Years (336 | 37.1%) for men and 15 to 19 Years (583 | 45.4%) for women.
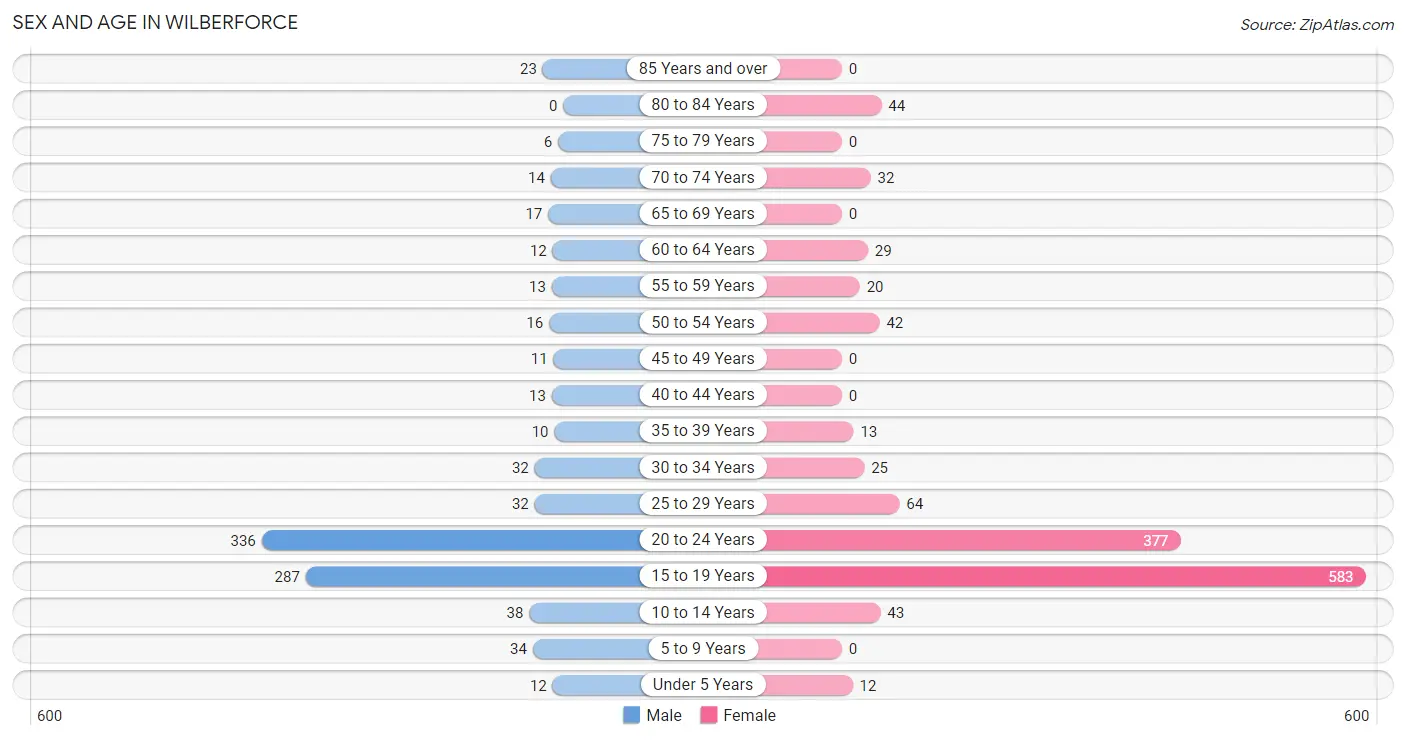
| Age Bracket | Male | Female |
| Under 5 Years | 12 (1.3%) | 12 (0.9%) |
| 5 to 9 Years | 34 (3.7%) | 0 (0.0%) |
| 10 to 14 Years | 38 (4.2%) | 43 (3.4%) |
| 15 to 19 Years | 287 (31.7%) | 583 (45.4%) |
| 20 to 24 Years | 336 (37.1%) | 377 (29.4%) |
| 25 to 29 Years | 32 (3.5%) | 64 (5.0%) |
| 30 to 34 Years | 32 (3.5%) | 25 (1.9%) |
| 35 to 39 Years | 10 (1.1%) | 13 (1.0%) |
| 40 to 44 Years | 13 (1.4%) | 0 (0.0%) |
| 45 to 49 Years | 11 (1.2%) | 0 (0.0%) |
| 50 to 54 Years | 16 (1.8%) | 42 (3.3%) |
| 55 to 59 Years | 13 (1.4%) | 20 (1.6%) |
| 60 to 64 Years | 12 (1.3%) | 29 (2.3%) |
| 65 to 69 Years | 17 (1.9%) | 0 (0.0%) |
| 70 to 74 Years | 14 (1.5%) | 32 (2.5%) |
| 75 to 79 Years | 6 (0.7%) | 0 (0.0%) |
| 80 to 84 Years | 0 (0.0%) | 44 (3.4%) |
| 85 Years and over | 23 (2.5%) | 0 (0.0%) |
| Total | 906 (100.0%) | 1,284 (100.0%) |
Families and Households in Wilberforce
Median Family Size in Wilberforce
The median family size in Wilberforce is 3.31 persons per family, with married-couple families (89 | 56.0%) accounting for the largest median family size of 3.38 persons per family. On the other hand, single male/father families (4 | 2.5%) represent the smallest median family size with 2.00 persons per family.
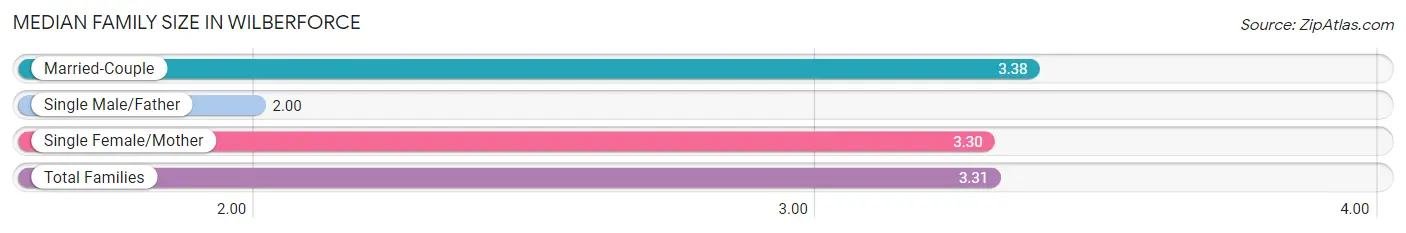
| Family Type | # Families | Family Size |
| Married-Couple | 89 (56.0%) | 3.38 |
| Single Male/Father | 4 (2.5%) | 2.00 |
| Single Female/Mother | 66 (41.5%) | 3.30 |
| Total Families | 159 (100.0%) | 3.31 |
Median Household Size in Wilberforce
The median household size in Wilberforce is 2.62 persons per household, with single male/father households (4 | 1.6%) accounting for the largest median household size of 5 persons per household. non-family households (89 | 35.9%) represent the smallest median household size with 1.24 persons per household.
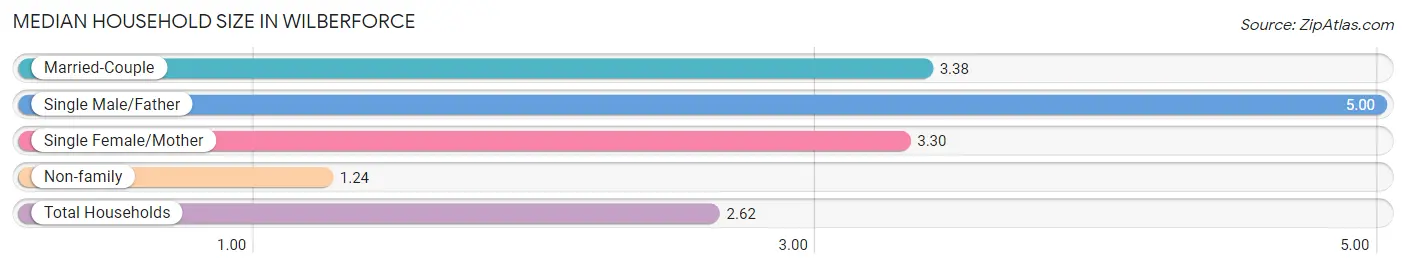
| Household Type | # Households | Household Size |
| Married-Couple | 89 (35.9%) | 3.38 |
| Single Male/Father | 4 (1.6%) | 5.00 |
| Single Female/Mother | 66 (26.6%) | 3.30 |
| Non-family | 89 (35.9%) | 1.24 |
| Total Households | 248 (100.0%) | 2.62 |
Household Size by Marriage Status in Wilberforce
Out of a total of 248 households in Wilberforce, 159 (64.1%) are family households, while 89 (35.9%) are nonfamily households. The most numerous type of family households are 2-person households, comprising 66, and the most common type of nonfamily households are 1-person households, comprising 66.
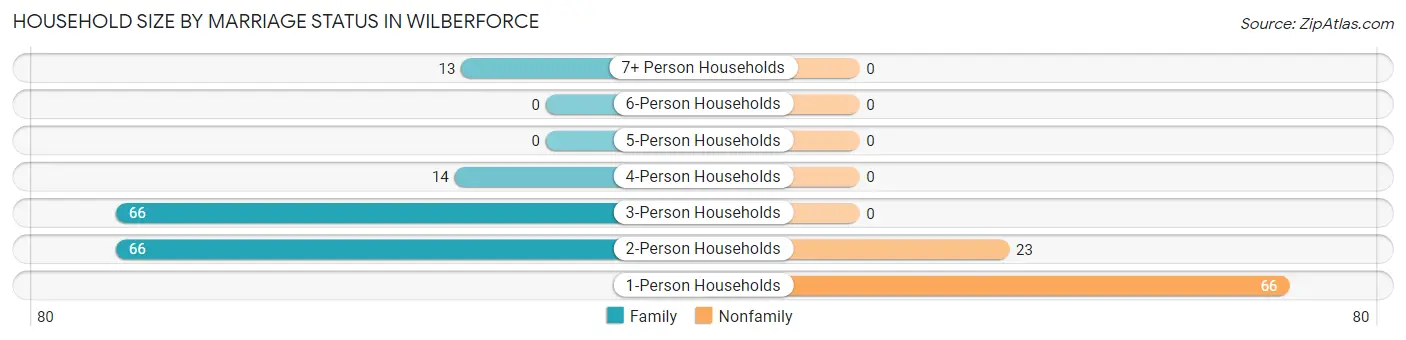
| Household Size | Family Households | Nonfamily Households |
| 1-Person Households | - | 66 (26.6%) |
| 2-Person Households | 66 (26.6%) | 23 (9.3%) |
| 3-Person Households | 66 (26.6%) | 0 (0.0%) |
| 4-Person Households | 14 (5.7%) | 0 (0.0%) |
| 5-Person Households | 0 (0.0%) | 0 (0.0%) |
| 6-Person Households | 0 (0.0%) | 0 (0.0%) |
| 7+ Person Households | 13 (5.2%) | 0 (0.0%) |
| Total | 159 (64.1%) | 89 (35.9%) |
Female Fertility in Wilberforce
Fertility by Age in Wilberforce
| Age Bracket | Women with Births | Births / 1,000 Women |
| 15 to 19 years | 0 (0.0%) | 0.0 |
| 20 to 34 years | 0 (0.0%) | 0.0 |
| 35 to 50 years | 0 (0.0%) | 0.0 |
| Total | 0 (0.0%) | 0.0 |
Fertility by Age by Marriage Status in Wilberforce
| Age Bracket | Married | Unmarried |
| 15 to 19 years | 0 (0.0%) | 0 (0.0%) |
| 20 to 34 years | 0 (0.0%) | 0 (0.0%) |
| 35 to 50 years | 0 (0.0%) | 0 (0.0%) |
| Total | 0 (0.0%) | 0 (0.0%) |
Fertility by Education in Wilberforce
| Educational Attainment | Women with Births | Births / 1,000 Women |
| Less than High School | 0 (0.0%) | 0.0 |
| High School Diploma | 0 (0.0%) | 0.0 |
| College or Associate's Degree | 0 (0.0%) | 0.0 |
| Bachelor's Degree | 0 (0.0%) | 0.0 |
| Graduate Degree | 0 (0.0%) | 0.0 |
| Total | 0 (0.0%) | 0.0 |
Fertility by Education by Marriage Status in Wilberforce
| Educational Attainment | Married | Unmarried |
| Less than High School | 0 (0.0%) | 0 (0.0%) |
| High School Diploma | 0 (0.0%) | 0 (0.0%) |
| College or Associate's Degree | 0 (0.0%) | 0 (0.0%) |
| Bachelor's Degree | 0 (0.0%) | 0 (0.0%) |
| Graduate Degree | 0 (0.0%) | 0 (0.0%) |
| Total | 0 (0.0%) | 0 (0.0%) |
Employment Characteristics in Wilberforce
Employment by Class of Employer in Wilberforce
Among the 842 employed individuals in Wilberforce, private company employees (552 | 65.6%), not-for-profit organizations (112 | 13.3%), and state government employees (90 | 10.7%) make up the most common classes of employment.
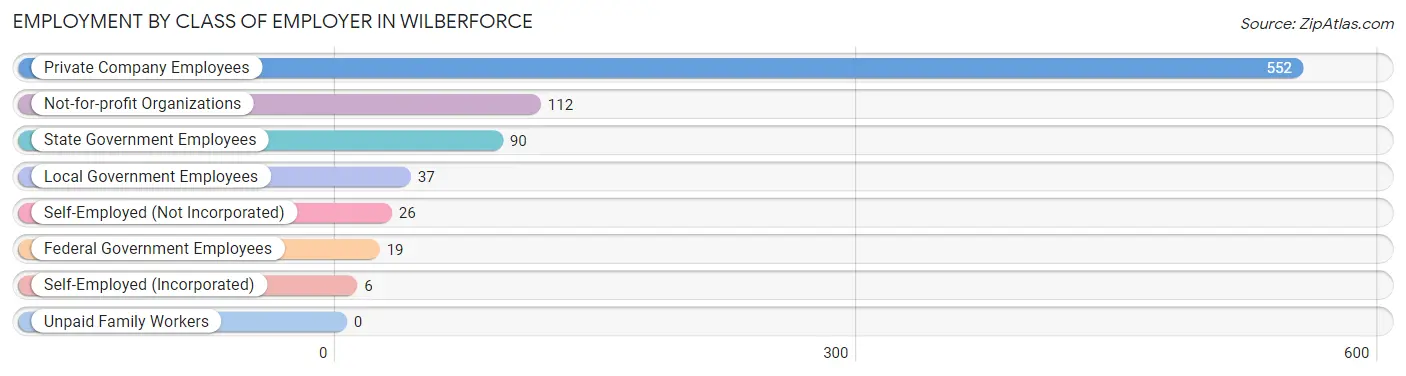
| Employer Class | # Employees | % Employees |
| Private Company Employees | 552 | 65.6% |
| Self-Employed (Incorporated) | 6 | 0.7% |
| Self-Employed (Not Incorporated) | 26 | 3.1% |
| Not-for-profit Organizations | 112 | 13.3% |
| Local Government Employees | 37 | 4.4% |
| State Government Employees | 90 | 10.7% |
| Federal Government Employees | 19 | 2.3% |
| Unpaid Family Workers | 0 | 0.0% |
| Total | 842 | 100.0% |
Employment Status by Age in Wilberforce
According to the labor force statistics for Wilberforce, out of the total population over 16 years of age (2,032), 55.5% or 1,128 individuals are in the labor force, with 12.8% or 144 of them unemployed. The age group with the highest labor force participation rate is 35 to 44 years, with 100.0% or 36 individuals in the labor force. Within the labor force, the 20 to 24 years age range has the highest percentage of unemployed individuals, with 17.9% or 85 of them being unemployed.
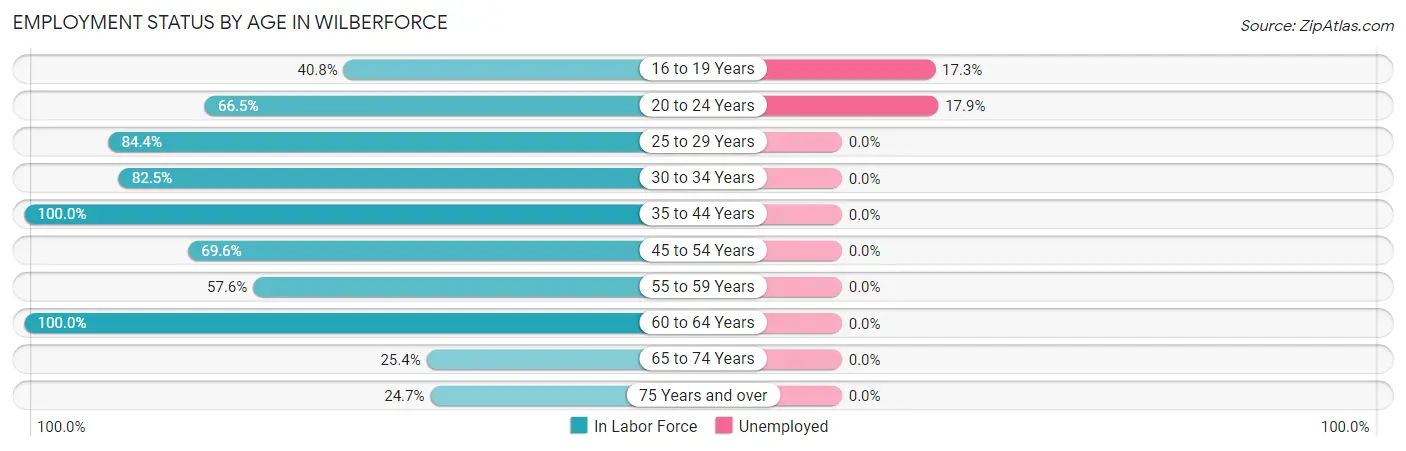
| Age Bracket | In Labor Force | Unemployed |
| 16 to 19 Years | 347 (40.8%) | 60 (17.3%) |
| 20 to 24 Years | 474 (66.5%) | 85 (17.9%) |
| 25 to 29 Years | 81 (84.4%) | 0 (0.0%) |
| 30 to 34 Years | 47 (82.5%) | 0 (0.0%) |
| 35 to 44 Years | 36 (100.0%) | 0 (0.0%) |
| 45 to 54 Years | 48 (69.6%) | 0 (0.0%) |
| 55 to 59 Years | 19 (57.6%) | 0 (0.0%) |
| 60 to 64 Years | 41 (100.0%) | 0 (0.0%) |
| 65 to 74 Years | 16 (25.4%) | 0 (0.0%) |
| 75 Years and over | 18 (24.7%) | 0 (0.0%) |
| Total | 1,128 (55.5%) | 144 (12.8%) |
Employment Status by Educational Attainment in Wilberforce
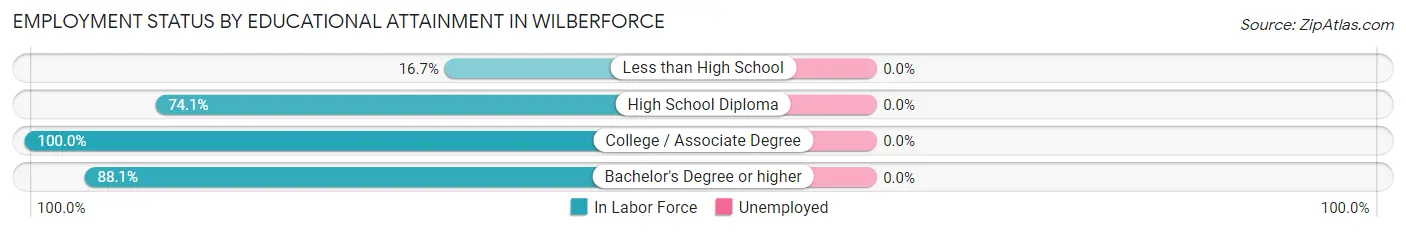
| Educational Attainment | In Labor Force | Unemployed |
| Less than High School | 5 (16.7%) | 0 (0.0%) |
| High School Diploma | 40 (74.1%) | 0 (0.0%) |
| College / Associate Degree | 72 (100.0%) | 0 (0.0%) |
| Bachelor's Degree or higher | 155 (88.1%) | 0 (0.0%) |
| Total | 272 (81.9%) | 0 (0.0%) |
Employment Occupations by Sex in Wilberforce
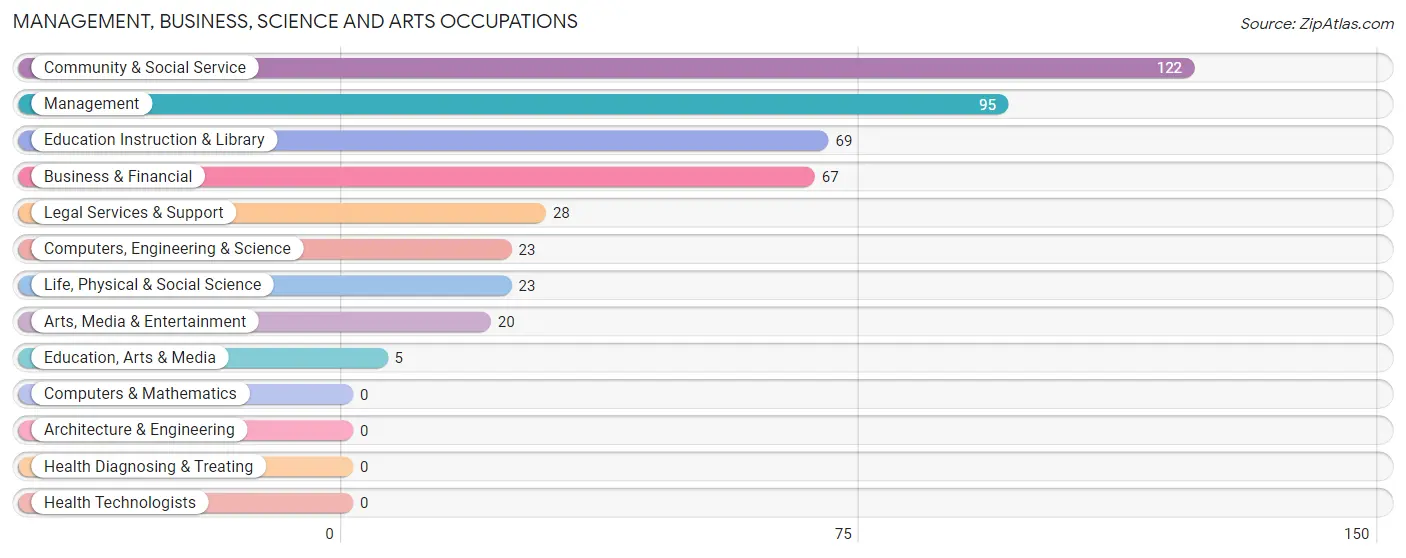
Management, Business, Science and Arts Occupations
The most common Management, Business, Science and Arts occupations in Wilberforce are Community & Social Service (122 | 12.5%), Management (95 | 9.7%), Education Instruction & Library (69 | 7.1%), Business & Financial (67 | 6.9%), and Legal Services & Support (28 | 2.9%).
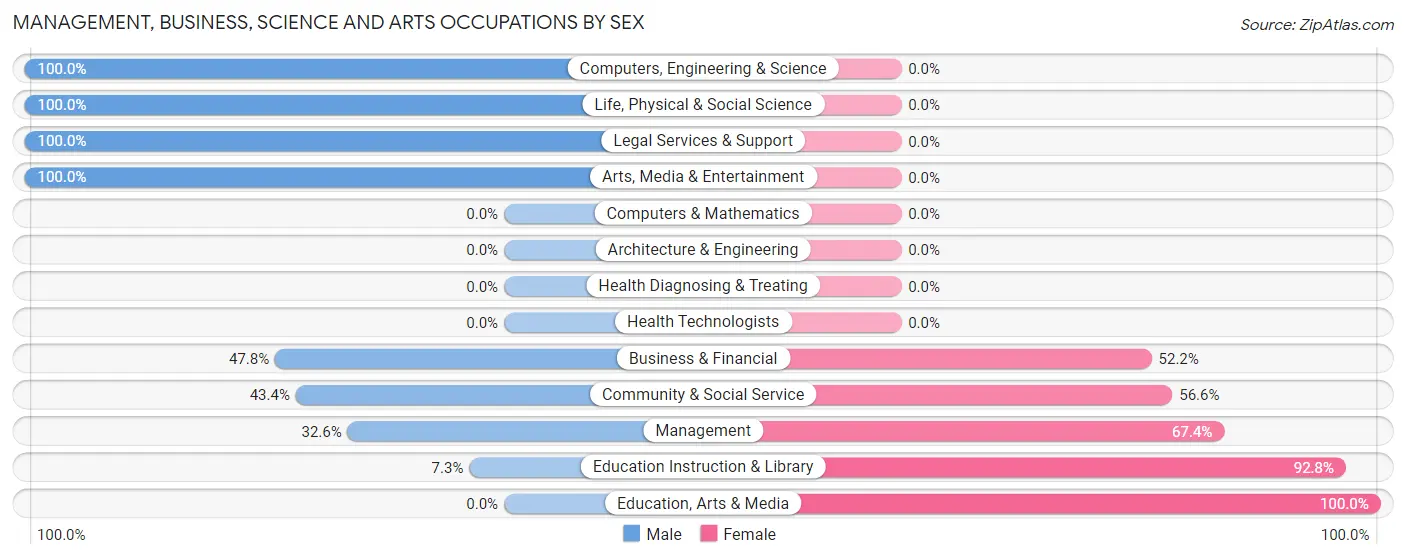
Management, Business, Science and Arts Occupations by Sex
Within the Management, Business, Science and Arts occupations in Wilberforce, the most male-oriented occupations are Computers, Engineering & Science (100.0%), Life, Physical & Social Science (100.0%), and Legal Services & Support (100.0%), while the most female-oriented occupations are Education, Arts & Media (100.0%), Education Instruction & Library (92.7%), and Management (67.4%).
| Occupation | Male | Female |
| Management | 31 (32.6%) | 64 (67.4%) |
| Business & Financial | 32 (47.8%) | 35 (52.2%) |
| Computers, Engineering & Science | 23 (100.0%) | 0 (0.0%) |
| Computers & Mathematics | 0 (0.0%) | 0 (0.0%) |
| Architecture & Engineering | 0 (0.0%) | 0 (0.0%) |
| Life, Physical & Social Science | 23 (100.0%) | 0 (0.0%) |
| Community & Social Service | 53 (43.4%) | 69 (56.6%) |
| Education, Arts & Media | 0 (0.0%) | 5 (100.0%) |
| Legal Services & Support | 28 (100.0%) | 0 (0.0%) |
| Education Instruction & Library | 5 (7.2%) | 64 (92.7%) |
| Arts, Media & Entertainment | 20 (100.0%) | 0 (0.0%) |
| Health Diagnosing & Treating | 0 (0.0%) | 0 (0.0%) |
| Health Technologists | 0 (0.0%) | 0 (0.0%) |
| Total (Category) | 139 (45.3%) | 168 (54.7%) |
| Total (Overall) | 364 (37.3%) | 613 (62.7%) |
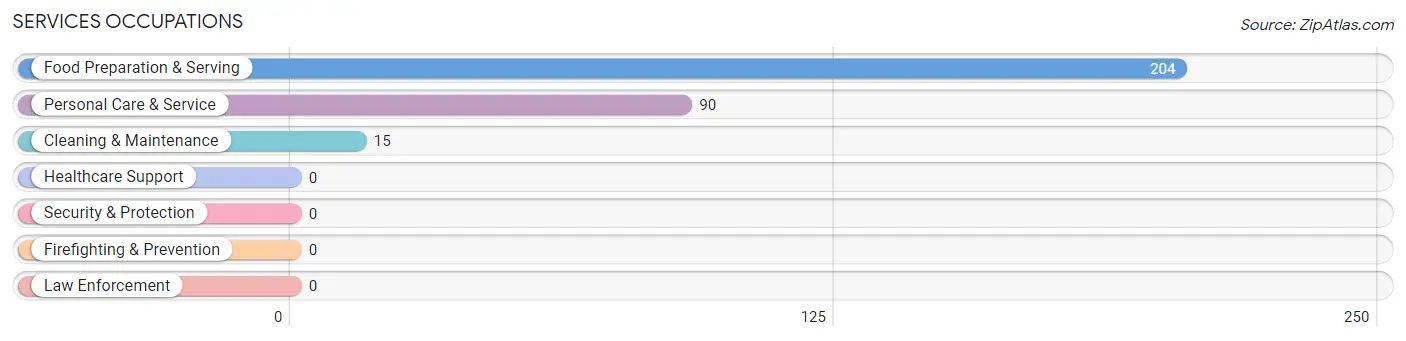
Services Occupations
The most common Services occupations in Wilberforce are Food Preparation & Serving (204 | 20.9%), Personal Care & Service (90 | 9.2%), and Cleaning & Maintenance (15 | 1.5%).
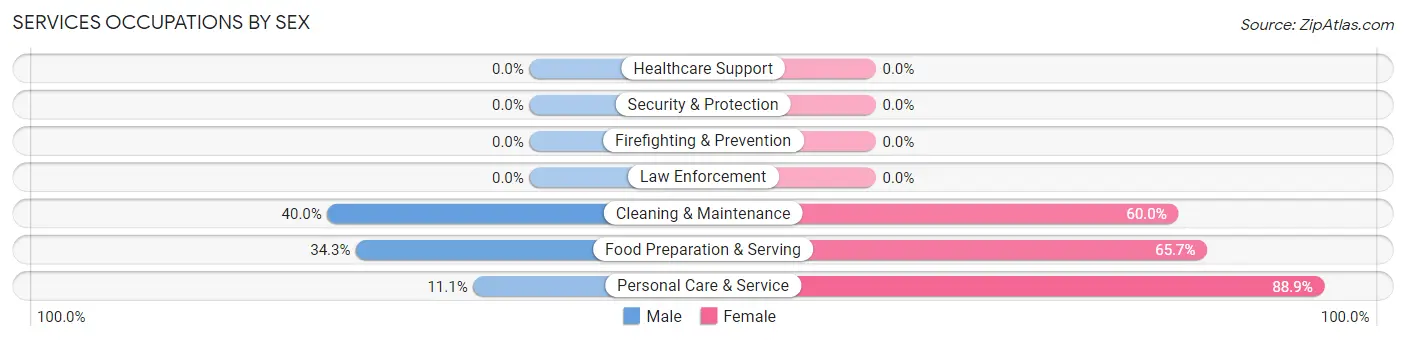
Services Occupations by Sex
Within the Services occupations in Wilberforce, the most male-oriented occupations are Cleaning & Maintenance (40.0%), Food Preparation & Serving (34.3%), and Personal Care & Service (11.1%), while the most female-oriented occupations are Personal Care & Service (88.9%), Food Preparation & Serving (65.7%), and Cleaning & Maintenance (60.0%).
| Occupation | Male | Female |
| Healthcare Support | 0 (0.0%) | 0 (0.0%) |
| Security & Protection | 0 (0.0%) | 0 (0.0%) |
| Firefighting & Prevention | 0 (0.0%) | 0 (0.0%) |
| Law Enforcement | 0 (0.0%) | 0 (0.0%) |
| Food Preparation & Serving | 70 (34.3%) | 134 (65.7%) |
| Cleaning & Maintenance | 6 (40.0%) | 9 (60.0%) |
| Personal Care & Service | 10 (11.1%) | 80 (88.9%) |
| Total (Category) | 86 (27.8%) | 223 (72.2%) |
| Total (Overall) | 364 (37.3%) | 613 (62.7%) |
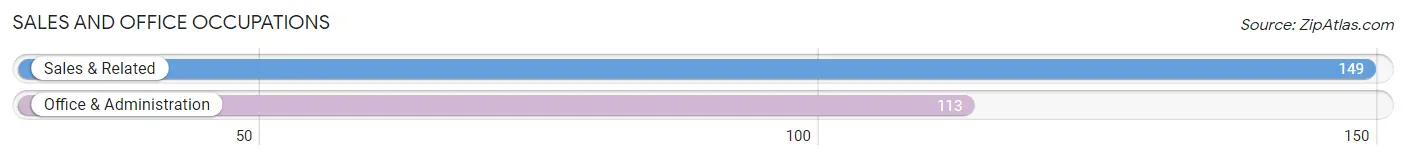
Sales and Office Occupations
The most common Sales and Office occupations in Wilberforce are Sales & Related (149 | 15.2%), and Office & Administration (113 | 11.6%).
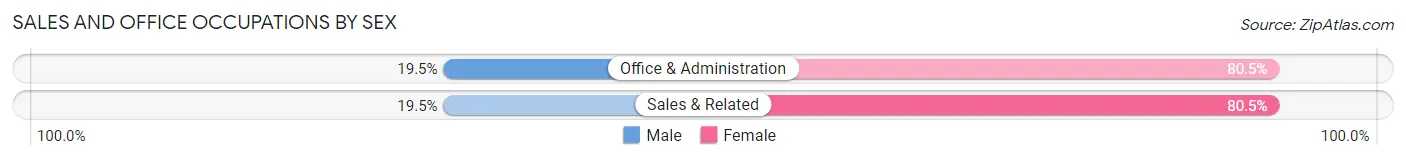
Sales and Office Occupations by Sex
| Occupation | Male | Female |
| Sales & Related | 29 (19.5%) | 120 (80.5%) |
| Office & Administration | 22 (19.5%) | 91 (80.5%) |
| Total (Category) | 51 (19.5%) | 211 (80.5%) |
| Total (Overall) | 364 (37.3%) | 613 (62.7%) |
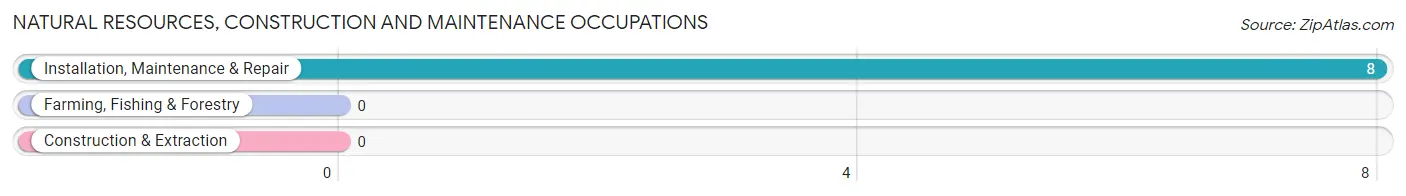
Natural Resources, Construction and Maintenance Occupations
The most common Natural Resources, Construction and Maintenance occupations in Wilberforce are , and Installation, Maintenance & Repair (8 | 0.8%).
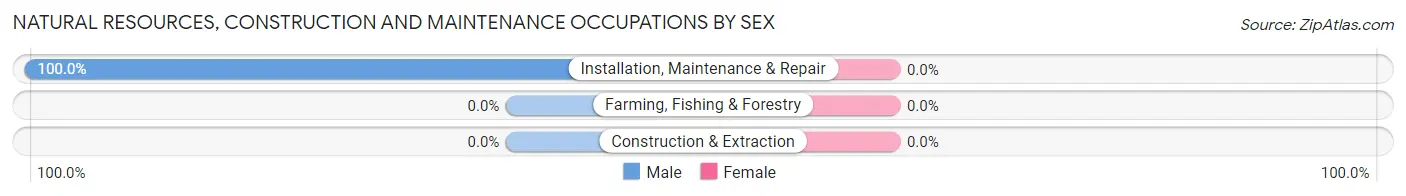
Natural Resources, Construction and Maintenance Occupations by Sex
| Occupation | Male | Female |
| Farming, Fishing & Forestry | 0 (0.0%) | 0 (0.0%) |
| Construction & Extraction | 0 (0.0%) | 0 (0.0%) |
| Installation, Maintenance & Repair | 8 (100.0%) | 0 (0.0%) |
| Total (Category) | 8 (100.0%) | 0 (0.0%) |
| Total (Overall) | 364 (37.3%) | 613 (62.7%) |
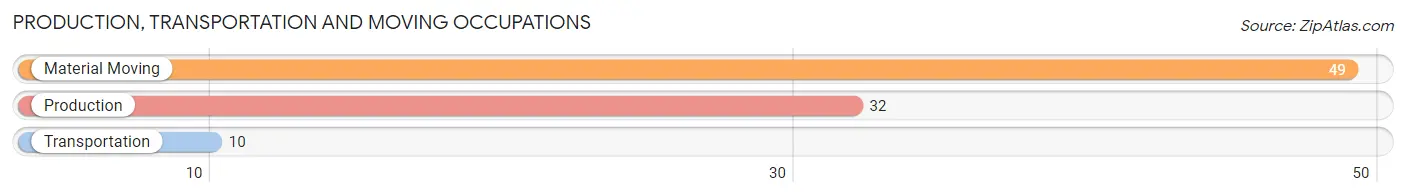
Production, Transportation and Moving Occupations
The most common Production, Transportation and Moving occupations in Wilberforce are Material Moving (49 | 5.0%), Production (32 | 3.3%), and Transportation (10 | 1.0%).
Production, Transportation and Moving Occupations by Sex
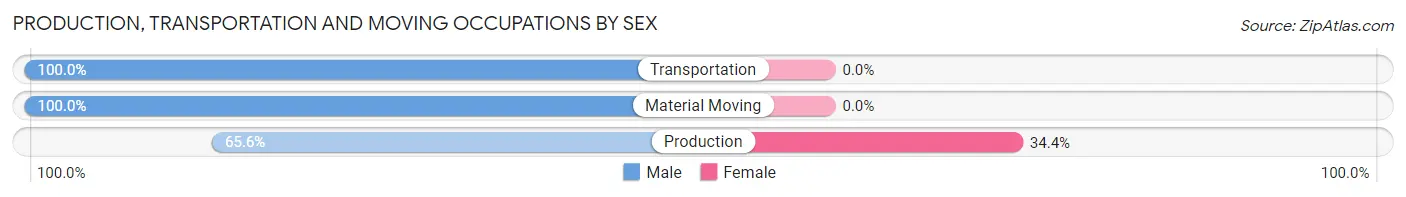
| Occupation | Male | Female |
| Production | 21 (65.6%) | 11 (34.4%) |
| Transportation | 10 (100.0%) | 0 (0.0%) |
| Material Moving | 49 (100.0%) | 0 (0.0%) |
| Total (Category) | 80 (87.9%) | 11 (12.1%) |
| Total (Overall) | 364 (37.3%) | 613 (62.7%) |
Employment Industries by Sex in Wilberforce
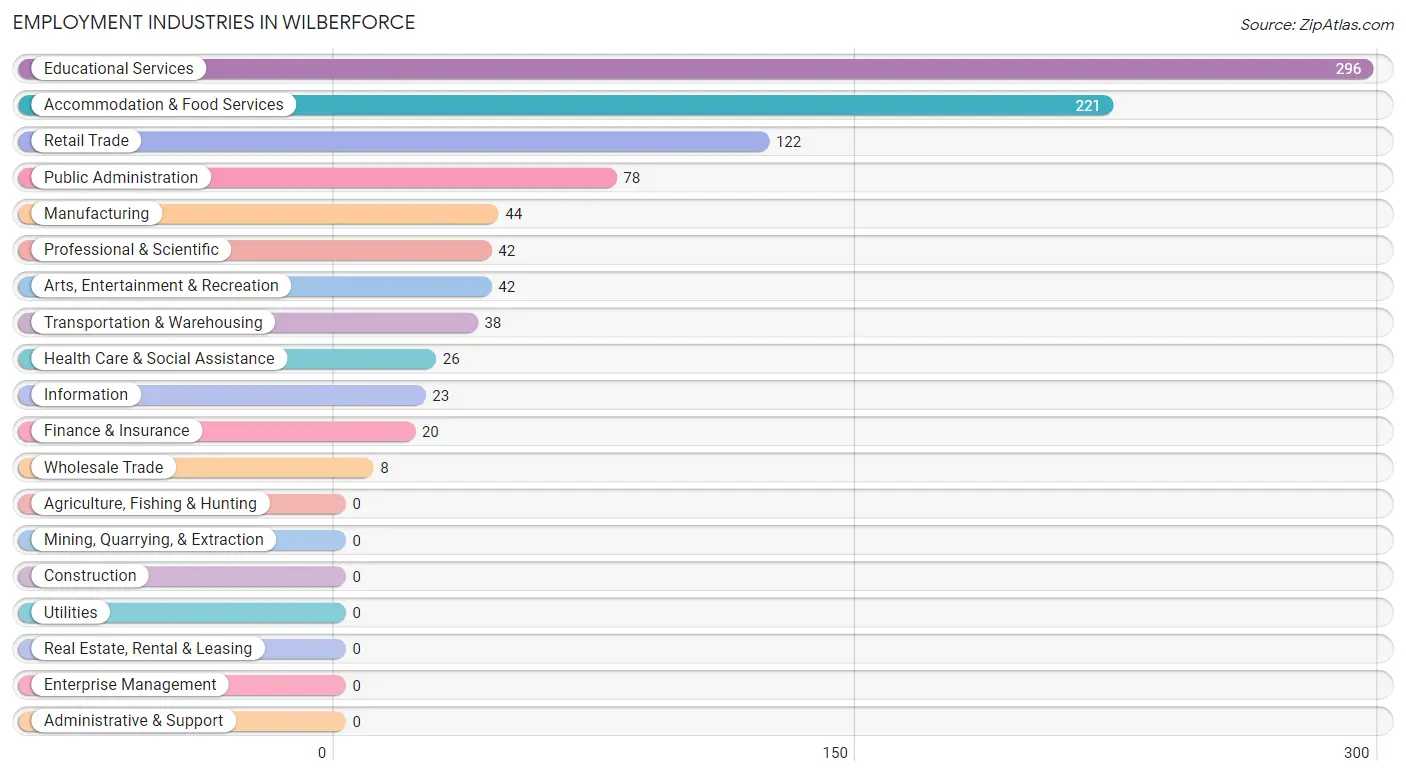
Employment Industries in Wilberforce
The major employment industries in Wilberforce include Educational Services (296 | 30.3%), Accommodation & Food Services (221 | 22.6%), Retail Trade (122 | 12.5%), Public Administration (78 | 8.0%), and Manufacturing (44 | 4.5%).
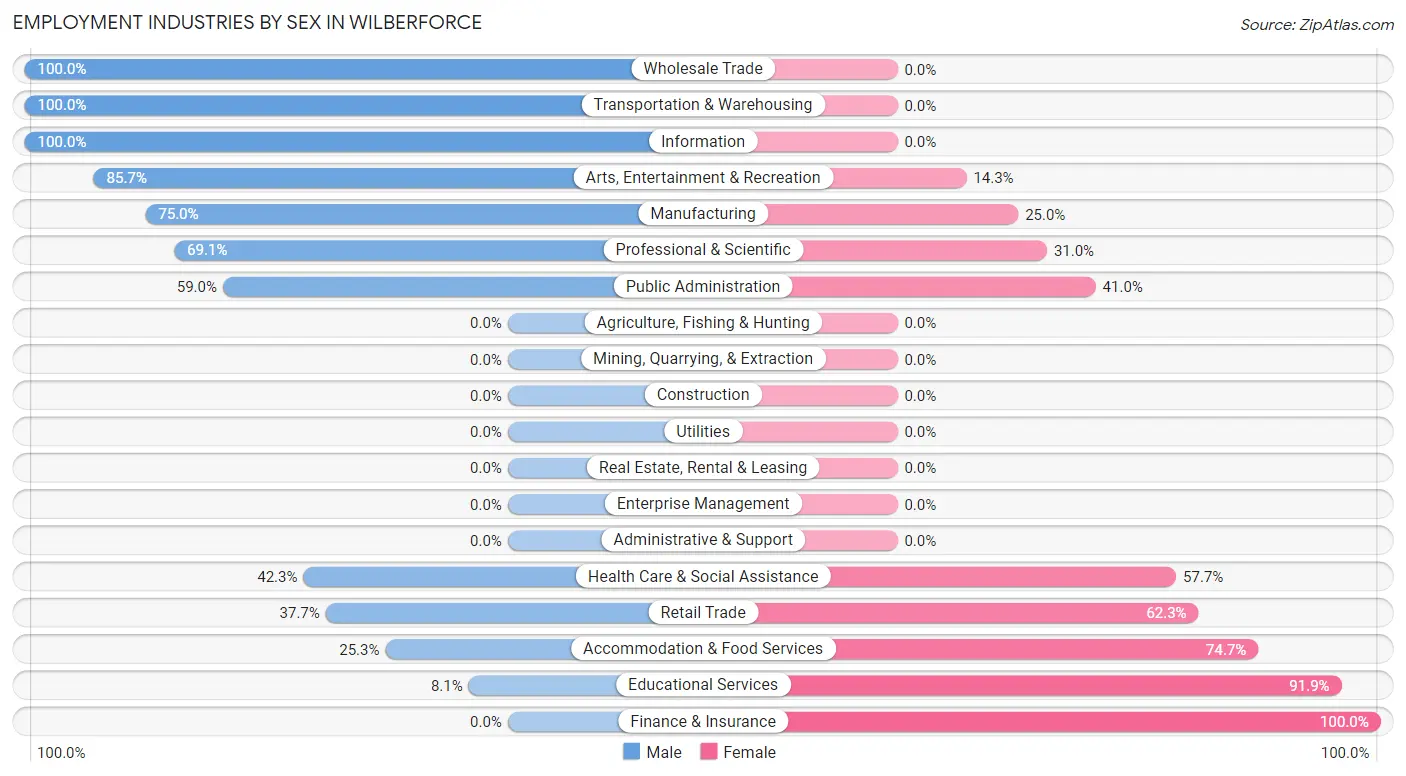
Employment Industries by Sex in Wilberforce
The Wilberforce industries that see more men than women are Wholesale Trade (100.0%), Transportation & Warehousing (100.0%), and Information (100.0%), whereas the industries that tend to have a higher number of women are Finance & Insurance (100.0%), Educational Services (91.9%), and Accommodation & Food Services (74.7%).
| Industry | Male | Female |
| Agriculture, Fishing & Hunting | 0 (0.0%) | 0 (0.0%) |
| Mining, Quarrying, & Extraction | 0 (0.0%) | 0 (0.0%) |
| Construction | 0 (0.0%) | 0 (0.0%) |
| Manufacturing | 33 (75.0%) | 11 (25.0%) |
| Wholesale Trade | 8 (100.0%) | 0 (0.0%) |
| Retail Trade | 46 (37.7%) | 76 (62.3%) |
| Transportation & Warehousing | 38 (100.0%) | 0 (0.0%) |
| Utilities | 0 (0.0%) | 0 (0.0%) |
| Information | 23 (100.0%) | 0 (0.0%) |
| Finance & Insurance | 0 (0.0%) | 20 (100.0%) |
| Real Estate, Rental & Leasing | 0 (0.0%) | 0 (0.0%) |
| Professional & Scientific | 29 (69.1%) | 13 (30.9%) |
| Enterprise Management | 0 (0.0%) | 0 (0.0%) |
| Administrative & Support | 0 (0.0%) | 0 (0.0%) |
| Educational Services | 24 (8.1%) | 272 (91.9%) |
| Health Care & Social Assistance | 11 (42.3%) | 15 (57.7%) |
| Arts, Entertainment & Recreation | 36 (85.7%) | 6 (14.3%) |
| Accommodation & Food Services | 56 (25.3%) | 165 (74.7%) |
| Public Administration | 46 (59.0%) | 32 (41.0%) |
| Total | 364 (37.3%) | 613 (62.7%) |
Education in Wilberforce
School Enrollment in Wilberforce
The most common levels of schooling among the 1,688 students in Wilberforce are college / undergraduate (1,485 | 88.0%), high school (93 | 5.5%), and middle school (54 | 3.2%).
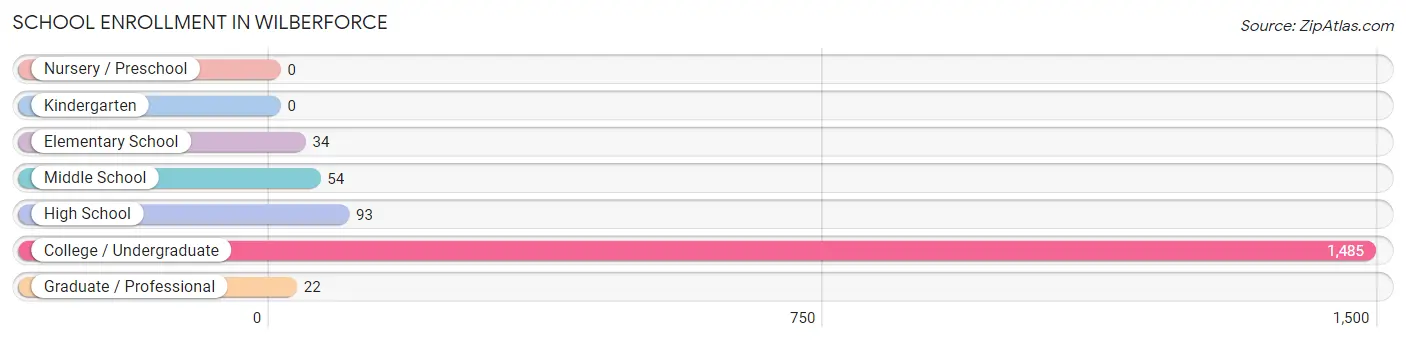
| School Level | # Students | % Students |
| Nursery / Preschool | 0 | 0.0% |
| Kindergarten | 0 | 0.0% |
| Elementary School | 34 | 2.0% |
| Middle School | 54 | 3.2% |
| High School | 93 | 5.5% |
| College / Undergraduate | 1,485 | 88.0% |
| Graduate / Professional | 22 | 1.3% |
| Total | 1,688 | 100.0% |
School Enrollment by Age by Funding Source in Wilberforce
Out of a total of 1,688 students who are enrolled in schools in Wilberforce, 333 (19.7%) attend a private institution, while the remaining 1,355 (80.3%) are enrolled in public schools. The age group of 20 to 24 year olds has the highest likelihood of being enrolled in private schools, with 162 (23.0% in the age bracket) enrolled. Conversely, the age group of 5 to 9 year old has the lowest likelihood of being enrolled in a private school, with 34 (100.0% in the age bracket) attending a public institution.
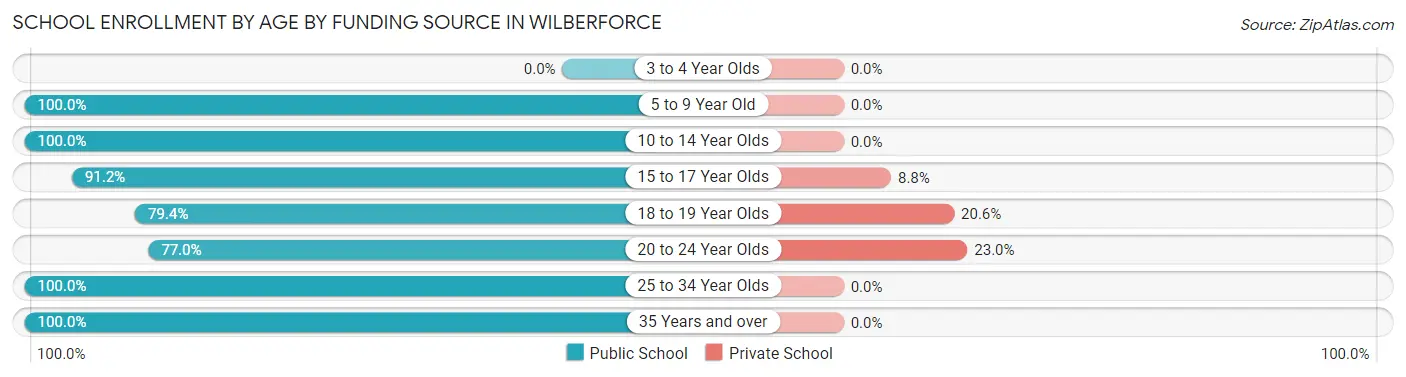
| Age Bracket | Public School | Private School |
| 3 to 4 Year Olds | 0 (0.0%) | 0 (0.0%) |
| 5 to 9 Year Old | 34 (100.0%) | 0 (0.0%) |
| 10 to 14 Year Olds | 66 (100.0%) | 0 (0.0%) |
| 15 to 17 Year Olds | 62 (91.2%) | 6 (8.8%) |
| 18 to 19 Year Olds | 637 (79.4%) | 165 (20.6%) |
| 20 to 24 Year Olds | 541 (77.0%) | 162 (23.0%) |
| 25 to 34 Year Olds | 8 (100.0%) | 0 (0.0%) |
| 35 Years and over | 7 (100.0%) | 0 (0.0%) |
| Total | 1,355 (80.3%) | 333 (19.7%) |
Educational Attainment by Field of Study in Wilberforce
Social sciences (51 | 15.7%), business (45 | 13.9%), liberal arts & history (39 | 12.0%), physical & health sciences (35 | 10.8%), and communications (33 | 10.2%) are the most common fields of study among 324 individuals in Wilberforce who have obtained a bachelor's degree or higher.
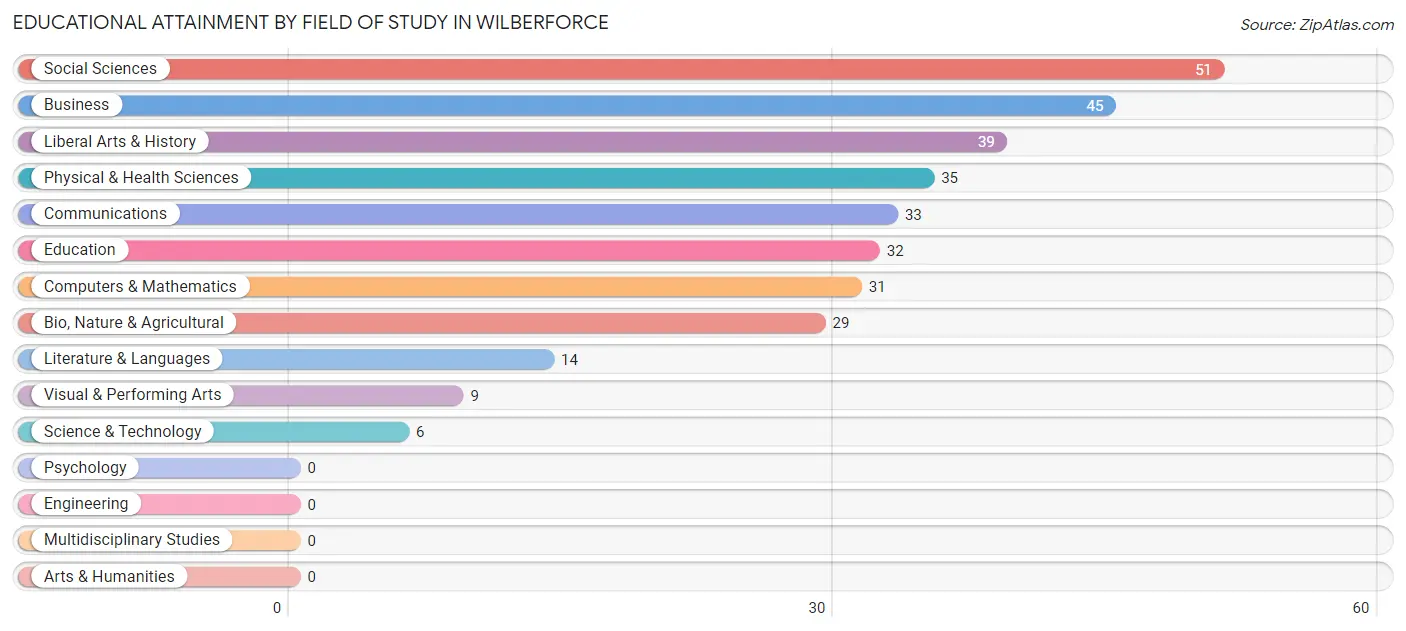
| Field of Study | # Graduates | % Graduates |
| Computers & Mathematics | 31 | 9.6% |
| Bio, Nature & Agricultural | 29 | 8.9% |
| Physical & Health Sciences | 35 | 10.8% |
| Psychology | 0 | 0.0% |
| Social Sciences | 51 | 15.7% |
| Engineering | 0 | 0.0% |
| Multidisciplinary Studies | 0 | 0.0% |
| Science & Technology | 6 | 1.8% |
| Business | 45 | 13.9% |
| Education | 32 | 9.9% |
| Literature & Languages | 14 | 4.3% |
| Liberal Arts & History | 39 | 12.0% |
| Visual & Performing Arts | 9 | 2.8% |
| Communications | 33 | 10.2% |
| Arts & Humanities | 0 | 0.0% |
| Total | 324 | 100.0% |
Transportation & Commute in Wilberforce
Vehicle Availability by Sex in Wilberforce
The most prevalent vehicle ownership categories in Wilberforce are males with 2 vehicles (58, accounting for 45.7%) and females with 2 vehicles (38, making up 40.6%).
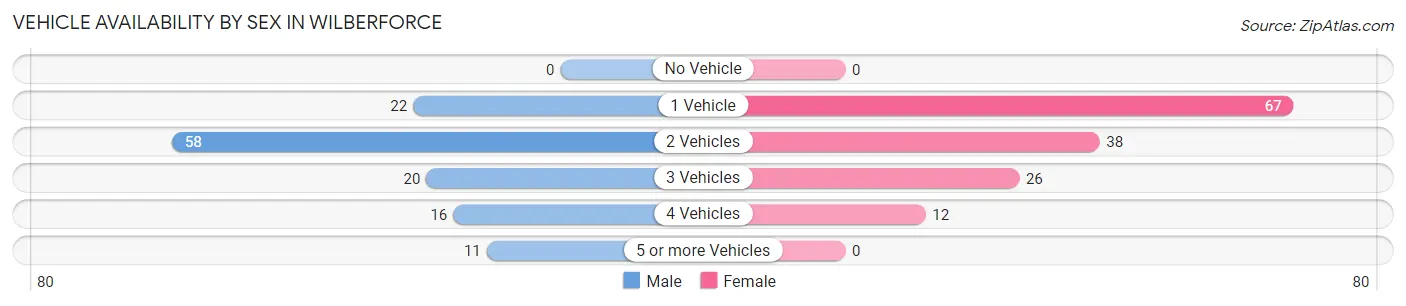
| Vehicles Available | Male | Female |
| No Vehicle | 0 (0.0%) | 0 (0.0%) |
| 1 Vehicle | 22 (17.3%) | 67 (46.9%) |
| 2 Vehicles | 58 (45.7%) | 38 (26.6%) |
| 3 Vehicles | 20 (15.8%) | 26 (18.2%) |
| 4 Vehicles | 16 (12.6%) | 12 (8.4%) |
| 5 or more Vehicles | 11 (8.7%) | 0 (0.0%) |
| Total | 127 (100.0%) | 143 (100.0%) |
Commute Time in Wilberforce
The most frequently occuring commute durations in Wilberforce are 5 to 9 minutes (303 commuters, 45.0%), 10 to 14 minutes (133 commuters, 19.8%), and 25 to 29 minutes (57 commuters, 8.5%).
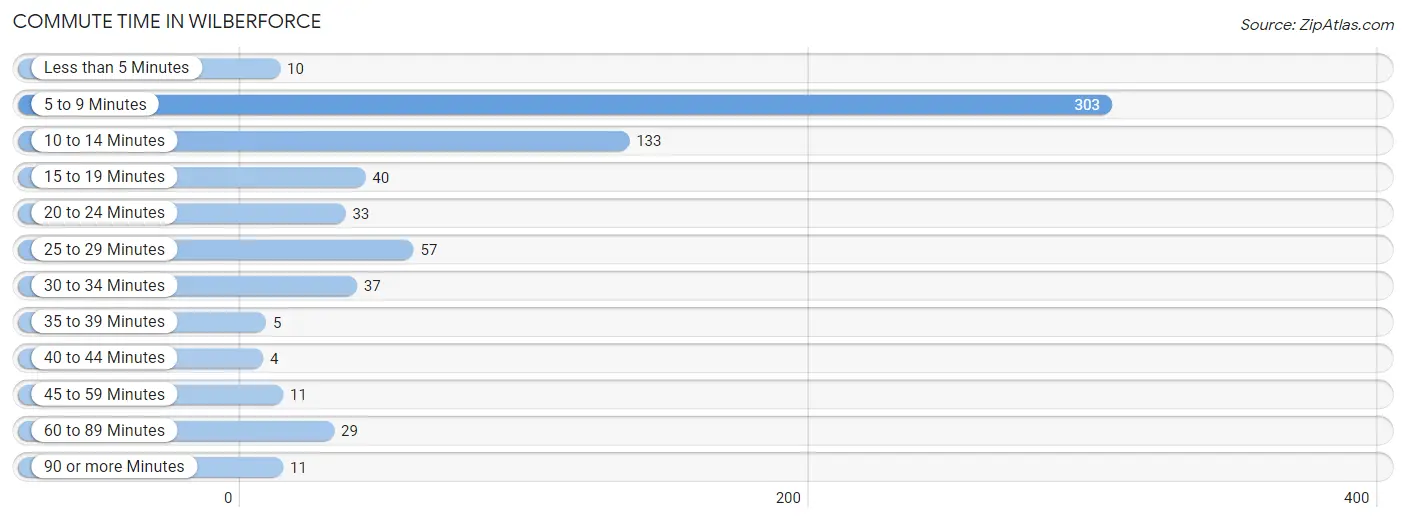
| Commute Time | # Commuters | % Commuters |
| Less than 5 Minutes | 10 | 1.5% |
| 5 to 9 Minutes | 303 | 45.0% |
| 10 to 14 Minutes | 133 | 19.8% |
| 15 to 19 Minutes | 40 | 5.9% |
| 20 to 24 Minutes | 33 | 4.9% |
| 25 to 29 Minutes | 57 | 8.5% |
| 30 to 34 Minutes | 37 | 5.5% |
| 35 to 39 Minutes | 5 | 0.7% |
| 40 to 44 Minutes | 4 | 0.6% |
| 45 to 59 Minutes | 11 | 1.6% |
| 60 to 89 Minutes | 29 | 4.3% |
| 90 or more Minutes | 11 | 1.6% |
Commute Time by Sex in Wilberforce
The most common commute times in Wilberforce are 5 to 9 minutes (78 commuters, 30.6%) for males and 5 to 9 minutes (225 commuters, 53.8%) for females.
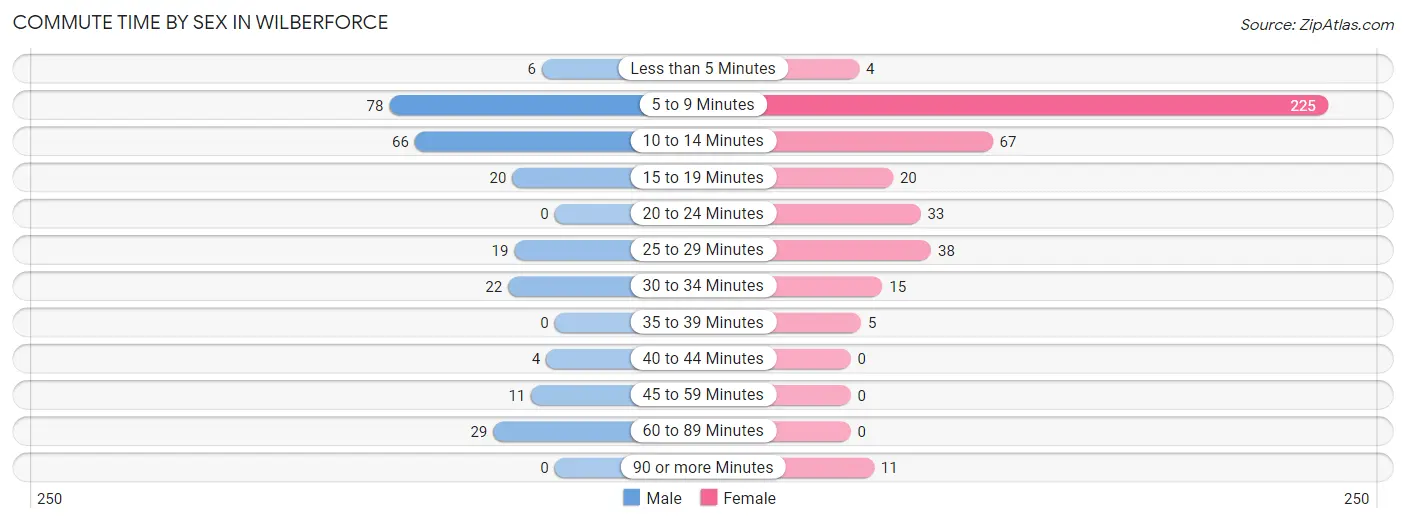
| Commute Time | Male | Female |
| Less than 5 Minutes | 6 (2.4%) | 4 (1.0%) |
| 5 to 9 Minutes | 78 (30.6%) | 225 (53.8%) |
| 10 to 14 Minutes | 66 (25.9%) | 67 (16.0%) |
| 15 to 19 Minutes | 20 (7.8%) | 20 (4.8%) |
| 20 to 24 Minutes | 0 (0.0%) | 33 (7.9%) |
| 25 to 29 Minutes | 19 (7.4%) | 38 (9.1%) |
| 30 to 34 Minutes | 22 (8.6%) | 15 (3.6%) |
| 35 to 39 Minutes | 0 (0.0%) | 5 (1.2%) |
| 40 to 44 Minutes | 4 (1.6%) | 0 (0.0%) |
| 45 to 59 Minutes | 11 (4.3%) | 0 (0.0%) |
| 60 to 89 Minutes | 29 (11.4%) | 0 (0.0%) |
| 90 or more Minutes | 0 (0.0%) | 11 (2.6%) |
Time of Departure to Work by Sex in Wilberforce
The most frequent times of departure to work in Wilberforce are 4:00 PM to 11:59 PM (68, 26.7%) for males and 4:00 PM to 11:59 PM (165, 39.5%) for females.
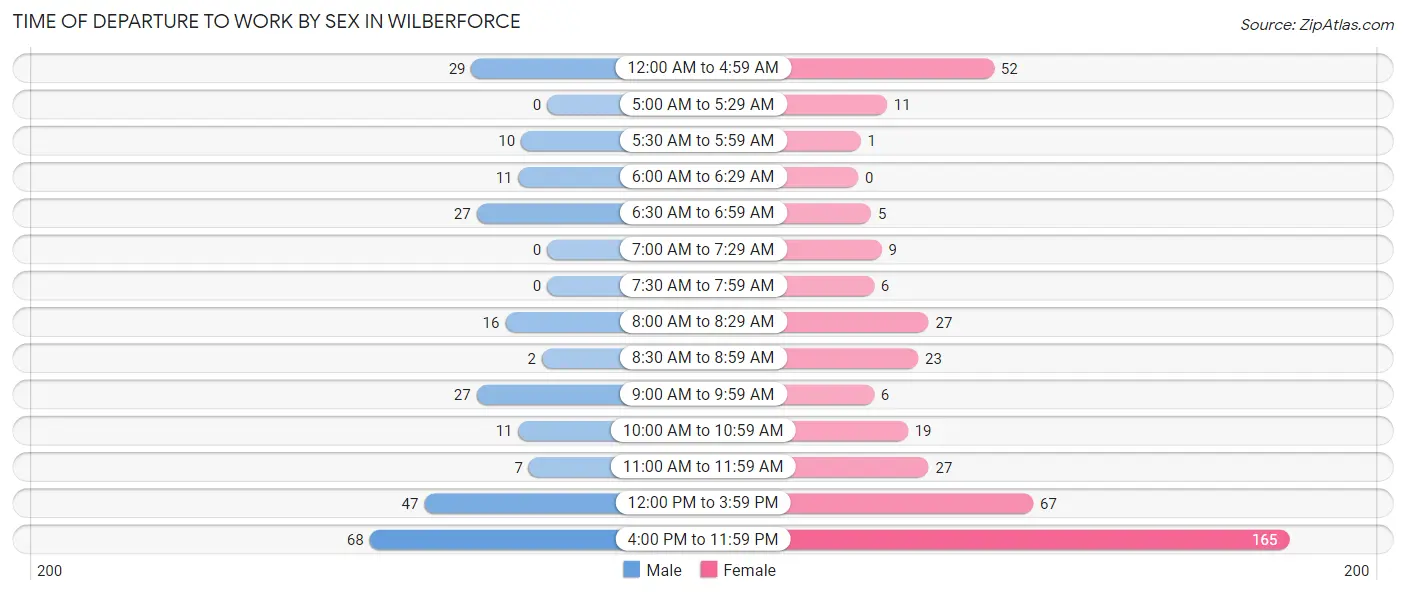
| Time of Departure | Male | Female |
| 12:00 AM to 4:59 AM | 29 (11.4%) | 52 (12.4%) |
| 5:00 AM to 5:29 AM | 0 (0.0%) | 11 (2.6%) |
| 5:30 AM to 5:59 AM | 10 (3.9%) | 1 (0.2%) |
| 6:00 AM to 6:29 AM | 11 (4.3%) | 0 (0.0%) |
| 6:30 AM to 6:59 AM | 27 (10.6%) | 5 (1.2%) |
| 7:00 AM to 7:29 AM | 0 (0.0%) | 9 (2.1%) |
| 7:30 AM to 7:59 AM | 0 (0.0%) | 6 (1.4%) |
| 8:00 AM to 8:29 AM | 16 (6.3%) | 27 (6.5%) |
| 8:30 AM to 8:59 AM | 2 (0.8%) | 23 (5.5%) |
| 9:00 AM to 9:59 AM | 27 (10.6%) | 6 (1.4%) |
| 10:00 AM to 10:59 AM | 11 (4.3%) | 19 (4.5%) |
| 11:00 AM to 11:59 AM | 7 (2.8%) | 27 (6.5%) |
| 12:00 PM to 3:59 PM | 47 (18.4%) | 67 (16.0%) |
| 4:00 PM to 11:59 PM | 68 (26.7%) | 165 (39.5%) |
| Total | 255 (100.0%) | 418 (100.0%) |
Housing Occupancy in Wilberforce
Occupancy by Ownership in Wilberforce
Of the total 248 dwellings in Wilberforce, owner-occupied units account for 204 (82.3%), while renter-occupied units make up 44 (17.7%).
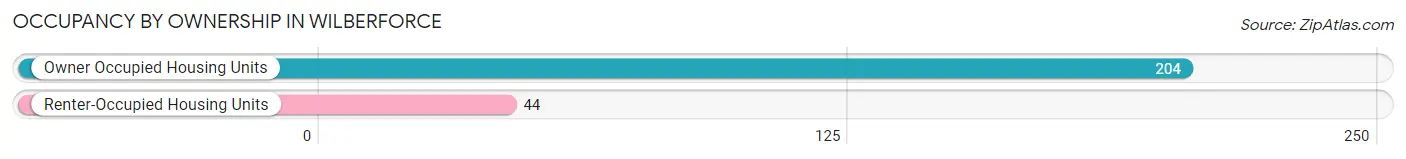
| Occupancy | # Housing Units | % Housing Units |
| Owner Occupied Housing Units | 204 | 82.3% |
| Renter-Occupied Housing Units | 44 | 17.7% |
| Total Occupied Housing Units | 248 | 100.0% |
Occupancy by Household Size in Wilberforce
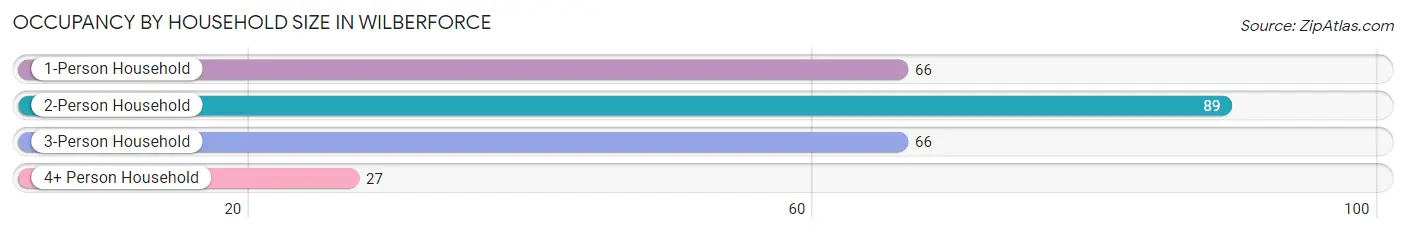
| Household Size | # Housing Units | % Housing Units |
| 1-Person Household | 66 | 26.6% |
| 2-Person Household | 89 | 35.9% |
| 3-Person Household | 66 | 26.6% |
| 4+ Person Household | 27 | 10.9% |
| Total Housing Units | 248 | 100.0% |
Occupancy by Ownership by Household Size in Wilberforce
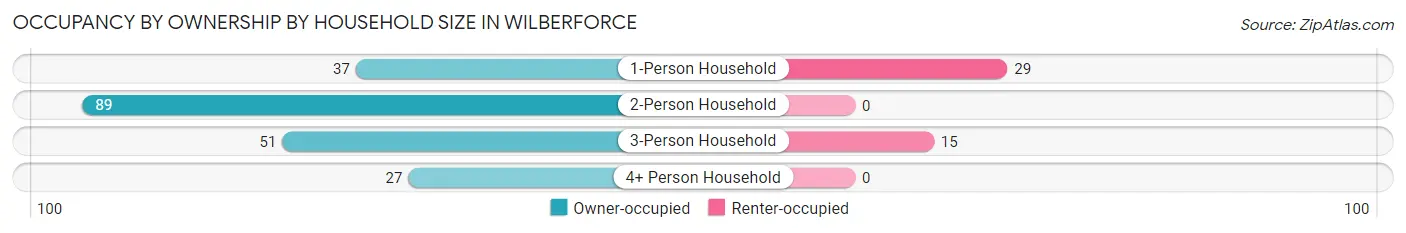
| Household Size | Owner-occupied | Renter-occupied |
| 1-Person Household | 37 (56.1%) | 29 (43.9%) |
| 2-Person Household | 89 (100.0%) | 0 (0.0%) |
| 3-Person Household | 51 (77.3%) | 15 (22.7%) |
| 4+ Person Household | 27 (100.0%) | 0 (0.0%) |
| Total Housing Units | 204 (82.3%) | 44 (17.7%) |
Occupancy by Educational Attainment in Wilberforce
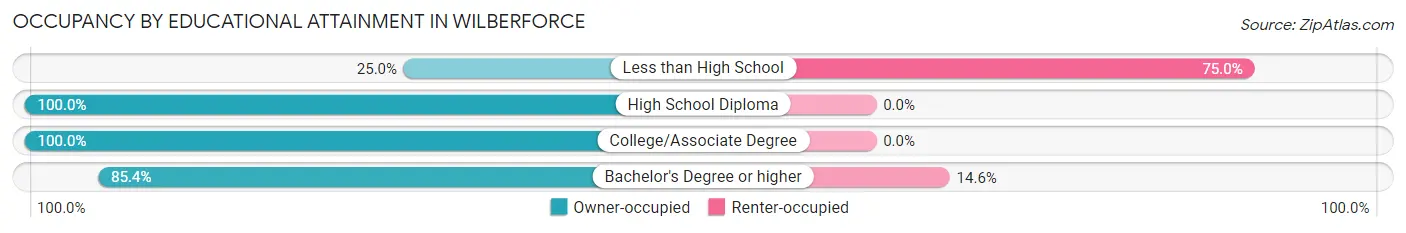
| Household Size | Owner-occupied | Renter-occupied |
| Less than High School | 5 (25.0%) | 15 (75.0%) |
| High School Diploma | 14 (100.0%) | 0 (0.0%) |
| College/Associate Degree | 15 (100.0%) | 0 (0.0%) |
| Bachelor's Degree or higher | 170 (85.4%) | 29 (14.6%) |
Occupancy by Age of Householder in Wilberforce
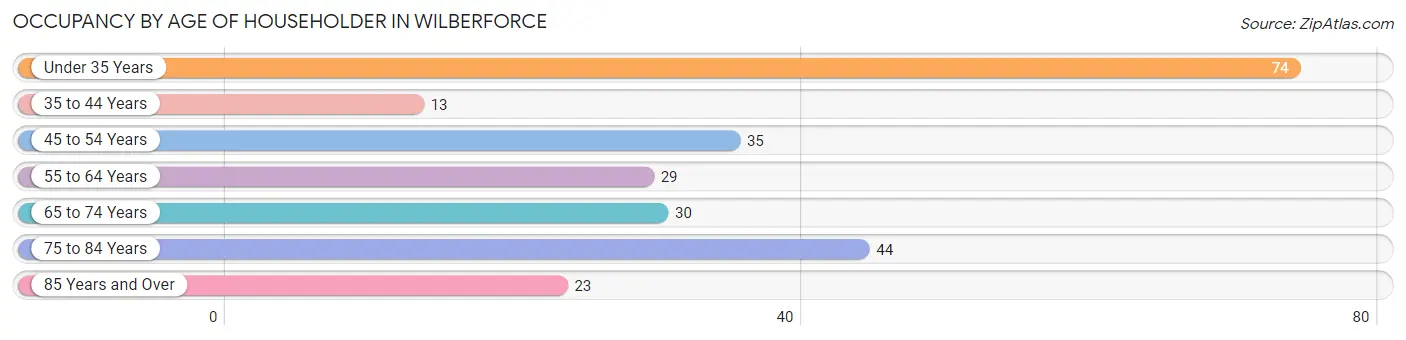
| Age Bracket | # Households | % Households |
| Under 35 Years | 74 | 29.8% |
| 35 to 44 Years | 13 | 5.2% |
| 45 to 54 Years | 35 | 14.1% |
| 55 to 64 Years | 29 | 11.7% |
| 65 to 74 Years | 30 | 12.1% |
| 75 to 84 Years | 44 | 17.7% |
| 85 Years and Over | 23 | 9.3% |
| Total | 248 | 100.0% |
Housing Finances in Wilberforce
Median Income by Occupancy in Wilberforce
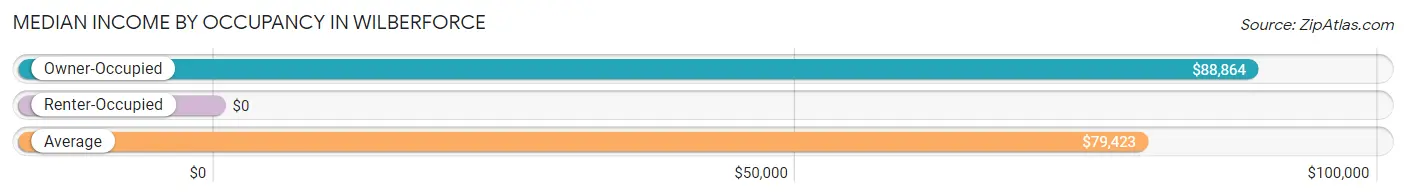
| Occupancy Type | # Households | Median Income |
| Owner-Occupied | 204 (82.3%) | $88,864 |
| Renter-Occupied | 44 (17.7%) | $0 |
| Average | 248 (100.0%) | $79,423 |
Occupancy by Householder Income Bracket in Wilberforce
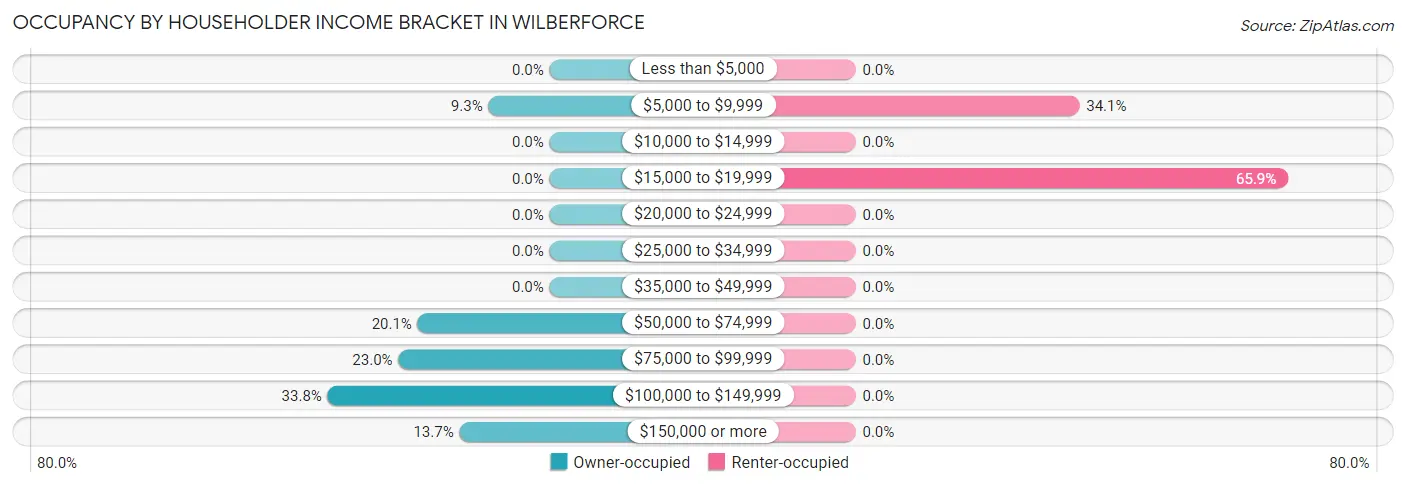
| Income Bracket | Owner-occupied | Renter-occupied |
| Less than $5,000 | 0 (0.0%) | 0 (0.0%) |
| $5,000 to $9,999 | 19 (9.3%) | 15 (34.1%) |
| $10,000 to $14,999 | 0 (0.0%) | 0 (0.0%) |
| $15,000 to $19,999 | 0 (0.0%) | 29 (65.9%) |
| $20,000 to $24,999 | 0 (0.0%) | 0 (0.0%) |
| $25,000 to $34,999 | 0 (0.0%) | 0 (0.0%) |
| $35,000 to $49,999 | 0 (0.0%) | 0 (0.0%) |
| $50,000 to $74,999 | 41 (20.1%) | 0 (0.0%) |
| $75,000 to $99,999 | 47 (23.0%) | 0 (0.0%) |
| $100,000 to $149,999 | 69 (33.8%) | 0 (0.0%) |
| $150,000 or more | 28 (13.7%) | 0 (0.0%) |
| Total | 204 (100.0%) | 44 (100.0%) |
Monthly Housing Cost Tiers in Wilberforce
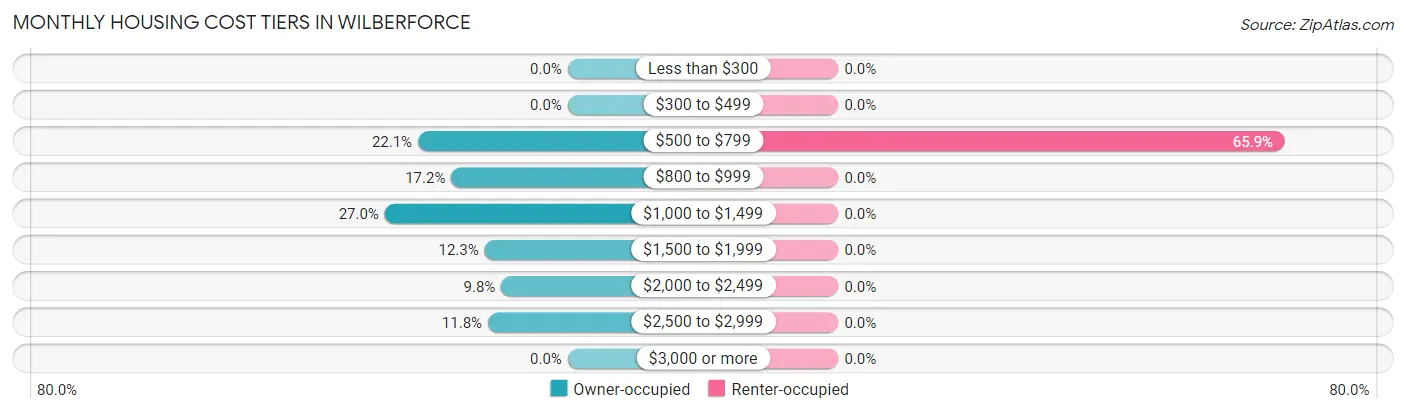
| Monthly Cost | Owner-occupied | Renter-occupied |
| Less than $300 | 0 (0.0%) | 0 (0.0%) |
| $300 to $499 | 0 (0.0%) | 0 (0.0%) |
| $500 to $799 | 45 (22.1%) | 29 (65.9%) |
| $800 to $999 | 35 (17.2%) | 0 (0.0%) |
| $1,000 to $1,499 | 55 (27.0%) | 0 (0.0%) |
| $1,500 to $1,999 | 25 (12.2%) | 0 (0.0%) |
| $2,000 to $2,499 | 20 (9.8%) | 0 (0.0%) |
| $2,500 to $2,999 | 24 (11.8%) | 0 (0.0%) |
| $3,000 or more | 0 (0.0%) | 0 (0.0%) |
| Total | 204 (100.0%) | 44 (100.0%) |
Physical Housing Characteristics in Wilberforce
Housing Structures in Wilberforce
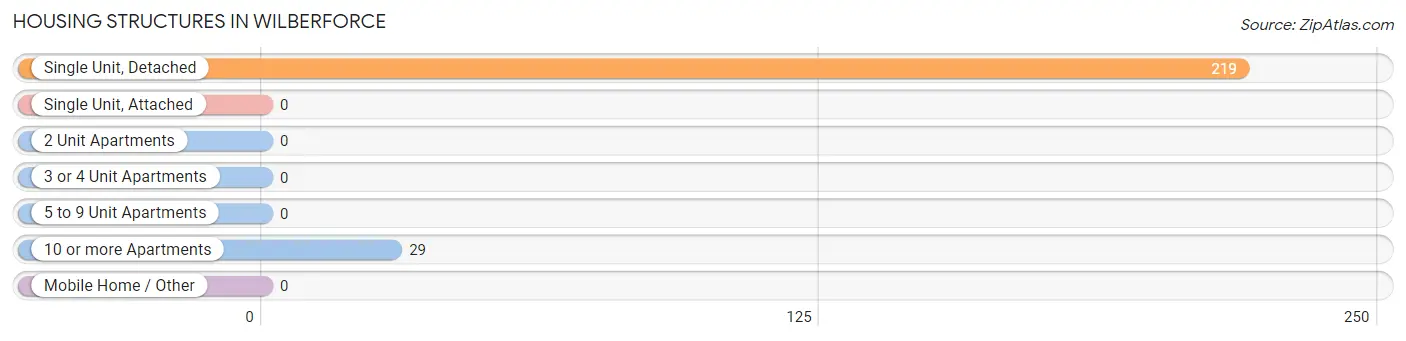
| Structure Type | # Housing Units | % Housing Units |
| Single Unit, Detached | 219 | 88.3% |
| Single Unit, Attached | 0 | 0.0% |
| 2 Unit Apartments | 0 | 0.0% |
| 3 or 4 Unit Apartments | 0 | 0.0% |
| 5 to 9 Unit Apartments | 0 | 0.0% |
| 10 or more Apartments | 29 | 11.7% |
| Mobile Home / Other | 0 | 0.0% |
| Total | 248 | 100.0% |
Housing Structures by Occupancy in Wilberforce
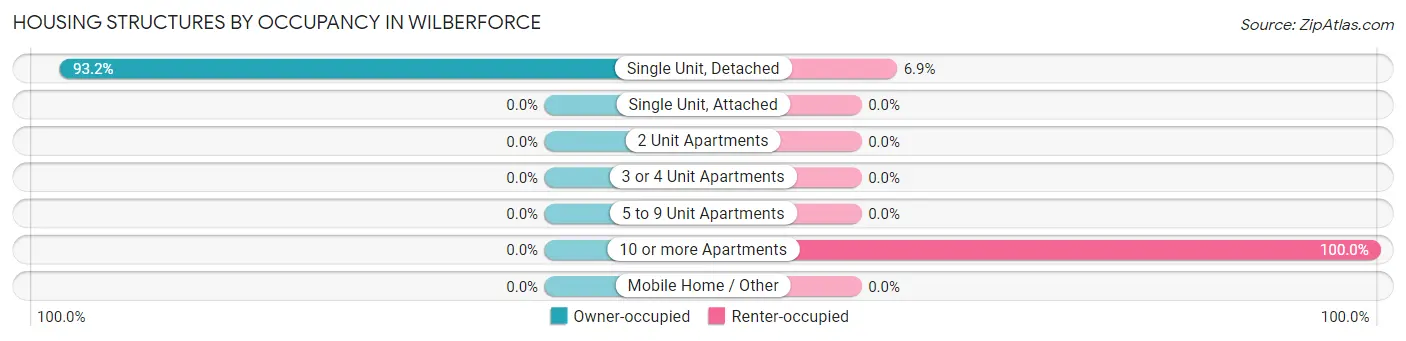
| Structure Type | Owner-occupied | Renter-occupied |
| Single Unit, Detached | 204 (93.1%) | 15 (6.9%) |
| Single Unit, Attached | 0 (0.0%) | 0 (0.0%) |
| 2 Unit Apartments | 0 (0.0%) | 0 (0.0%) |
| 3 or 4 Unit Apartments | 0 (0.0%) | 0 (0.0%) |
| 5 to 9 Unit Apartments | 0 (0.0%) | 0 (0.0%) |
| 10 or more Apartments | 0 (0.0%) | 29 (100.0%) |
| Mobile Home / Other | 0 (0.0%) | 0 (0.0%) |
| Total | 204 (82.3%) | 44 (17.7%) |
Housing Structures by Number of Rooms in Wilberforce
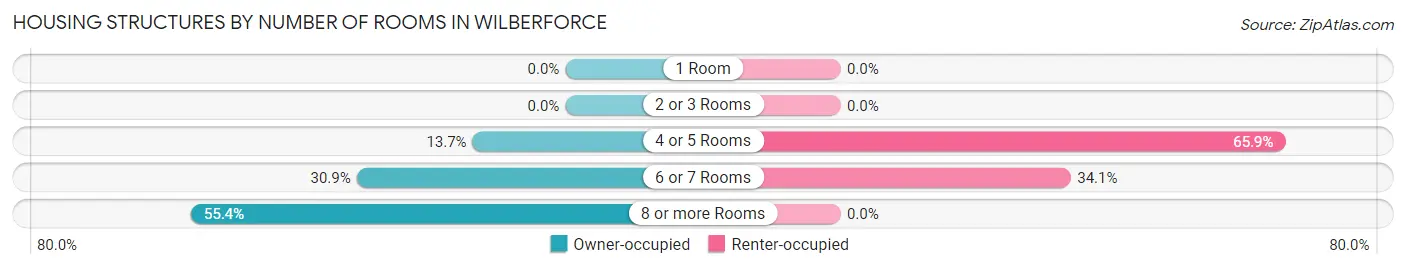
| Number of Rooms | Owner-occupied | Renter-occupied |
| 1 Room | 0 (0.0%) | 0 (0.0%) |
| 2 or 3 Rooms | 0 (0.0%) | 0 (0.0%) |
| 4 or 5 Rooms | 28 (13.7%) | 29 (65.9%) |
| 6 or 7 Rooms | 63 (30.9%) | 15 (34.1%) |
| 8 or more Rooms | 113 (55.4%) | 0 (0.0%) |
| Total | 204 (100.0%) | 44 (100.0%) |
Housing Structure by Heating Type in Wilberforce
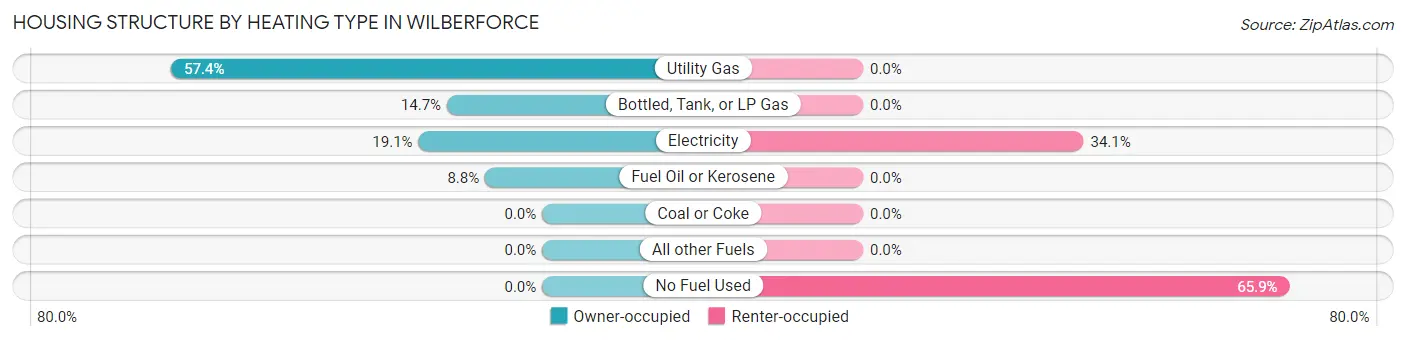
| Heating Type | Owner-occupied | Renter-occupied |
| Utility Gas | 117 (57.4%) | 0 (0.0%) |
| Bottled, Tank, or LP Gas | 30 (14.7%) | 0 (0.0%) |
| Electricity | 39 (19.1%) | 15 (34.1%) |
| Fuel Oil or Kerosene | 18 (8.8%) | 0 (0.0%) |
| Coal or Coke | 0 (0.0%) | 0 (0.0%) |
| All other Fuels | 0 (0.0%) | 0 (0.0%) |
| No Fuel Used | 0 (0.0%) | 29 (65.9%) |
| Total | 204 (100.0%) | 44 (100.0%) |
Household Vehicle Usage in Wilberforce
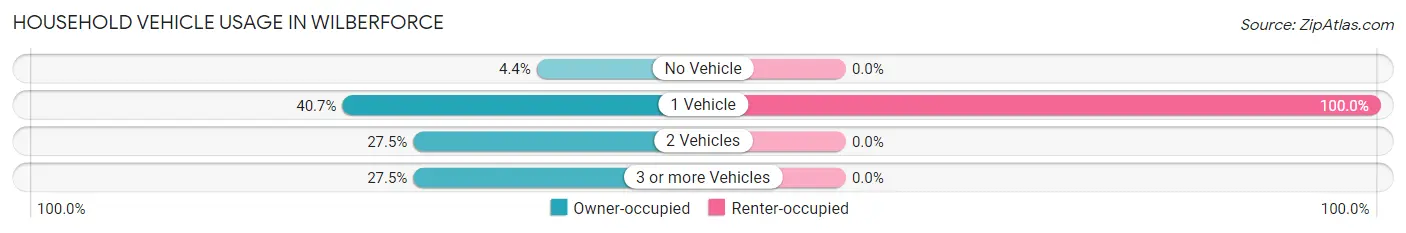
| Vehicles per Household | Owner-occupied | Renter-occupied |
| No Vehicle | 9 (4.4%) | 0 (0.0%) |
| 1 Vehicle | 83 (40.7%) | 44 (100.0%) |
| 2 Vehicles | 56 (27.5%) | 0 (0.0%) |
| 3 or more Vehicles | 56 (27.5%) | 0 (0.0%) |
| Total | 204 (100.0%) | 44 (100.0%) |
Real Estate & Mortgages in Wilberforce
Real Estate and Mortgage Overview in Wilberforce
| Characteristic | Without Mortgage | With Mortgage |
| Housing Units | 59 | 145 |
| Median Property Value | $205,300 | $219,900 |
| Median Household Income | - | - |
| Monthly Housing Costs | $718 | $0 |
| Real Estate Taxes | $3,106 | $0 |
Property Value by Mortgage Status in Wilberforce
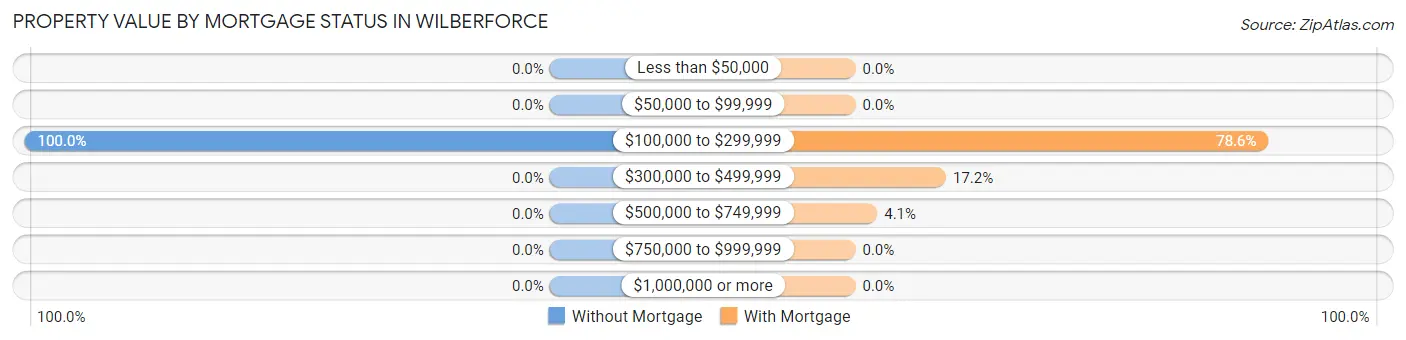
| Property Value | Without Mortgage | With Mortgage |
| Less than $50,000 | 0 (0.0%) | 0 (0.0%) |
| $50,000 to $99,999 | 0 (0.0%) | 0 (0.0%) |
| $100,000 to $299,999 | 59 (100.0%) | 114 (78.6%) |
| $300,000 to $499,999 | 0 (0.0%) | 25 (17.2%) |
| $500,000 to $749,999 | 0 (0.0%) | 6 (4.1%) |
| $750,000 to $999,999 | 0 (0.0%) | 0 (0.0%) |
| $1,000,000 or more | 0 (0.0%) | 0 (0.0%) |
| Total | 59 (100.0%) | 145 (100.0%) |
Household Income by Mortgage Status in Wilberforce
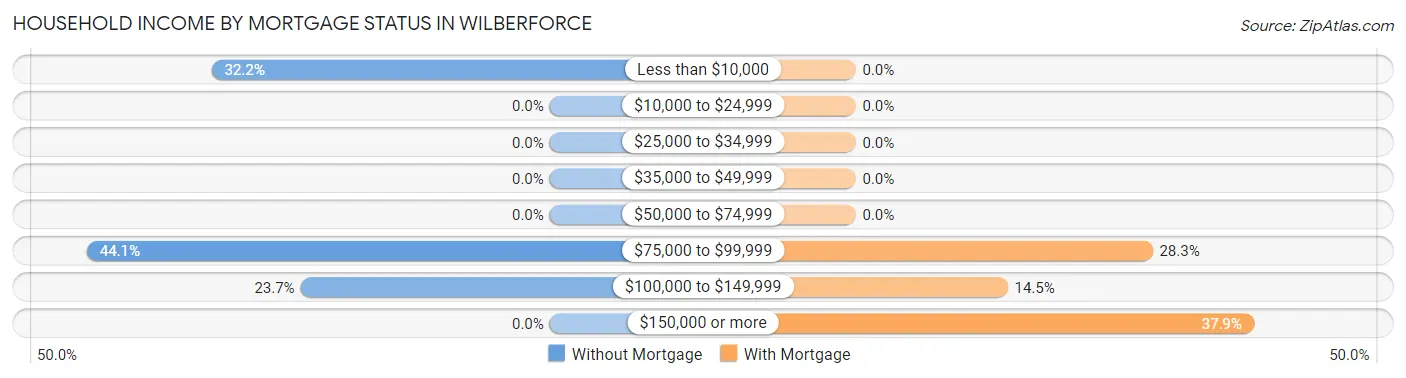
| Household Income | Without Mortgage | With Mortgage |
| Less than $10,000 | 19 (32.2%) | 0 (0.0%) |
| $10,000 to $24,999 | 0 (0.0%) | 0 (0.0%) |
| $25,000 to $34,999 | 0 (0.0%) | 0 (0.0%) |
| $35,000 to $49,999 | 0 (0.0%) | 0 (0.0%) |
| $50,000 to $74,999 | 0 (0.0%) | 0 (0.0%) |
| $75,000 to $99,999 | 26 (44.1%) | 41 (28.3%) |
| $100,000 to $149,999 | 14 (23.7%) | 21 (14.5%) |
| $150,000 or more | 0 (0.0%) | 55 (37.9%) |
| Total | 59 (100.0%) | 145 (100.0%) |
Property Value to Household Income Ratio in Wilberforce
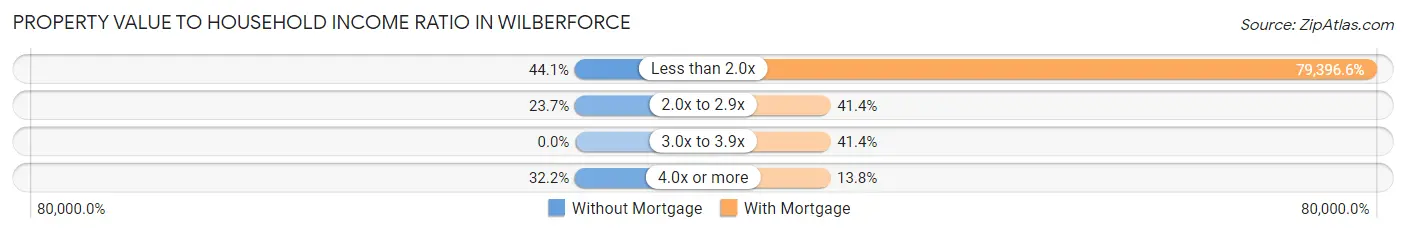
| Value-to-Income Ratio | Without Mortgage | With Mortgage |
| Less than 2.0x | 26 (44.1%) | 115,125 (79,396.6%) |
| 2.0x to 2.9x | 14 (23.7%) | 60 (41.4%) |
| 3.0x to 3.9x | 0 (0.0%) | 60 (41.4%) |
| 4.0x or more | 19 (32.2%) | 20 (13.8%) |
| Total | 59 (100.0%) | 145 (100.0%) |
Real Estate Taxes by Mortgage Status in Wilberforce
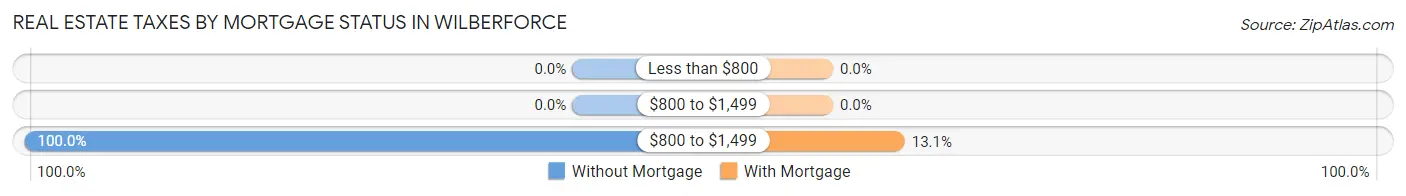
| Property Taxes | Without Mortgage | With Mortgage |
| Less than $800 | 0 (0.0%) | 0 (0.0%) |
| $800 to $1,499 | 0 (0.0%) | 0 (0.0%) |
| $800 to $1,499 | 59 (100.0%) | 19 (13.1%) |
| Total | 59 (100.0%) | 145 (100.0%) |
Health & Disability in Wilberforce
Health Insurance Coverage by Age in Wilberforce
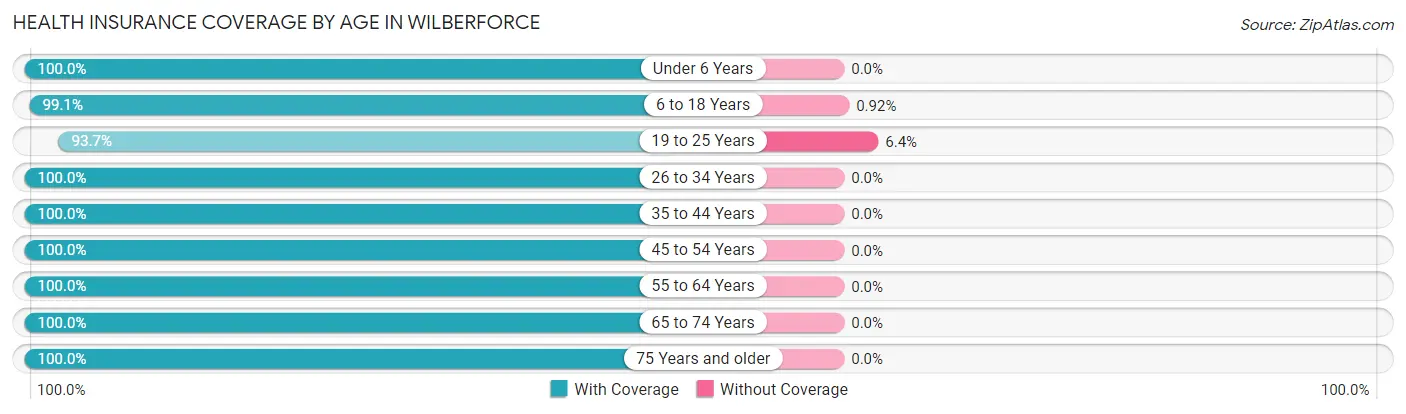
| Age Bracket | With Coverage | Without Coverage |
| Under 6 Years | 24 (100.0%) | 0 (0.0%) |
| 6 to 18 Years | 644 (99.1%) | 6 (0.9%) |
| 19 to 25 Years | 1,003 (93.6%) | 68 (6.4%) |
| 26 to 34 Years | 124 (100.0%) | 0 (0.0%) |
| 35 to 44 Years | 36 (100.0%) | 0 (0.0%) |
| 45 to 54 Years | 69 (100.0%) | 0 (0.0%) |
| 55 to 64 Years | 74 (100.0%) | 0 (0.0%) |
| 65 to 74 Years | 63 (100.0%) | 0 (0.0%) |
| 75 Years and older | 73 (100.0%) | 0 (0.0%) |
| Total | 2,110 (96.6%) | 74 (3.4%) |
Health Insurance Coverage by Citizenship Status in Wilberforce
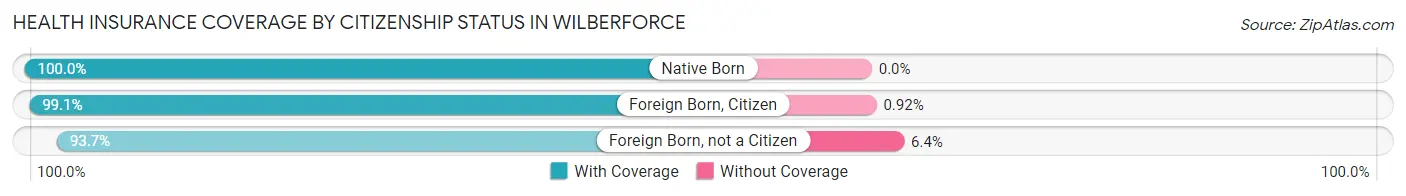
| Citizenship Status | With Coverage | Without Coverage |
| Native Born | 24 (100.0%) | 0 (0.0%) |
| Foreign Born, Citizen | 644 (99.1%) | 6 (0.9%) |
| Foreign Born, not a Citizen | 1,003 (93.6%) | 68 (6.4%) |
Health Insurance Coverage by Household Income in Wilberforce
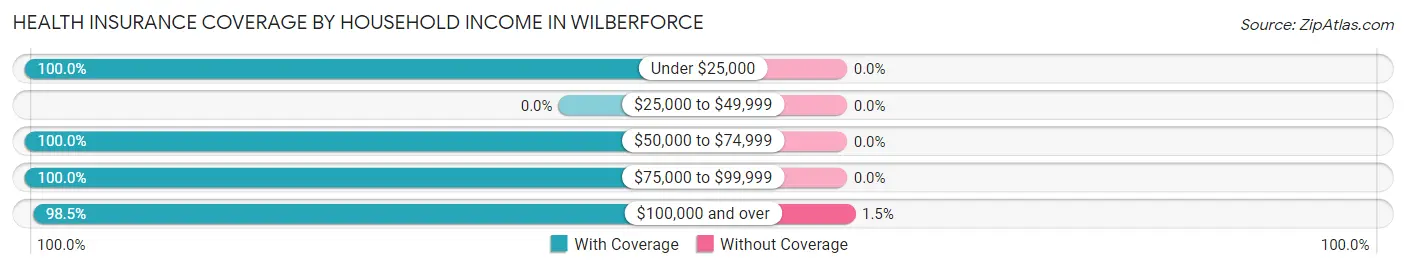
| Household Income | With Coverage | Without Coverage |
| Under $25,000 | 84 (100.0%) | 0 (0.0%) |
| $25,000 to $49,999 | 0 (0.0%) | 0 (0.0%) |
| $50,000 to $74,999 | 149 (100.0%) | 0 (0.0%) |
| $75,000 to $99,999 | 157 (100.0%) | 0 (0.0%) |
| $100,000 and over | 255 (98.5%) | 4 (1.5%) |
Public vs Private Health Insurance Coverage by Age in Wilberforce
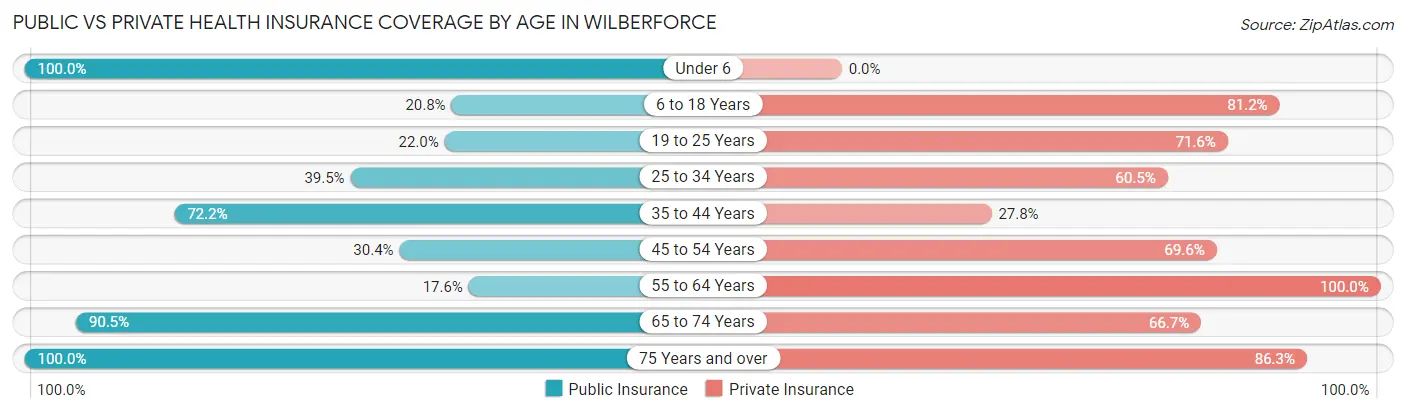
| Age Bracket | Public Insurance | Private Insurance |
| Under 6 | 24 (100.0%) | 0 (0.0%) |
| 6 to 18 Years | 135 (20.8%) | 528 (81.2%) |
| 19 to 25 Years | 236 (22.0%) | 767 (71.6%) |
| 25 to 34 Years | 49 (39.5%) | 75 (60.5%) |
| 35 to 44 Years | 26 (72.2%) | 10 (27.8%) |
| 45 to 54 Years | 21 (30.4%) | 48 (69.6%) |
| 55 to 64 Years | 13 (17.6%) | 74 (100.0%) |
| 65 to 74 Years | 57 (90.5%) | 42 (66.7%) |
| 75 Years and over | 73 (100.0%) | 63 (86.3%) |
| Total | 634 (29.0%) | 1,607 (73.6%) |
Disability Status by Sex by Age in Wilberforce
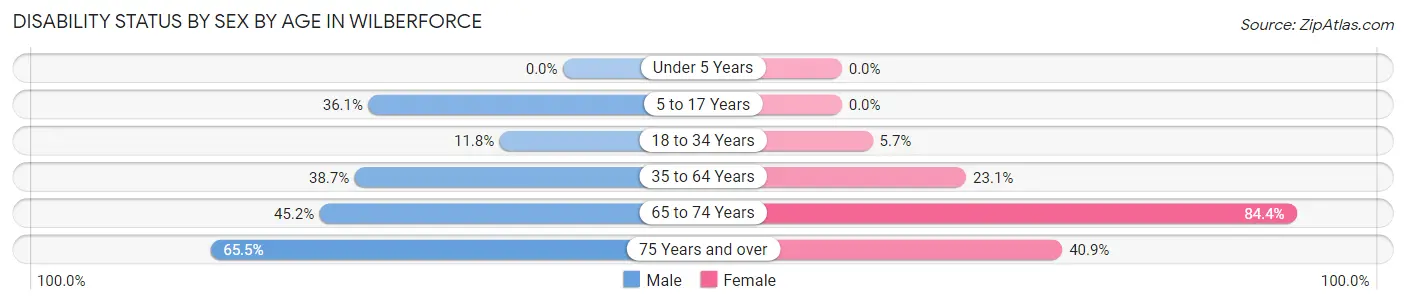
| Age Bracket | Male | Female |
| Under 5 Years | 0 (0.0%) | 0 (0.0%) |
| 5 to 17 Years | 26 (36.1%) | 0 (0.0%) |
| 18 to 34 Years | 80 (11.7%) | 56 (5.7%) |
| 35 to 64 Years | 29 (38.7%) | 24 (23.1%) |
| 65 to 74 Years | 14 (45.2%) | 27 (84.4%) |
| 75 Years and over | 19 (65.5%) | 18 (40.9%) |
Disability Class by Sex by Age in Wilberforce
Disability Class: Hearing Difficulty
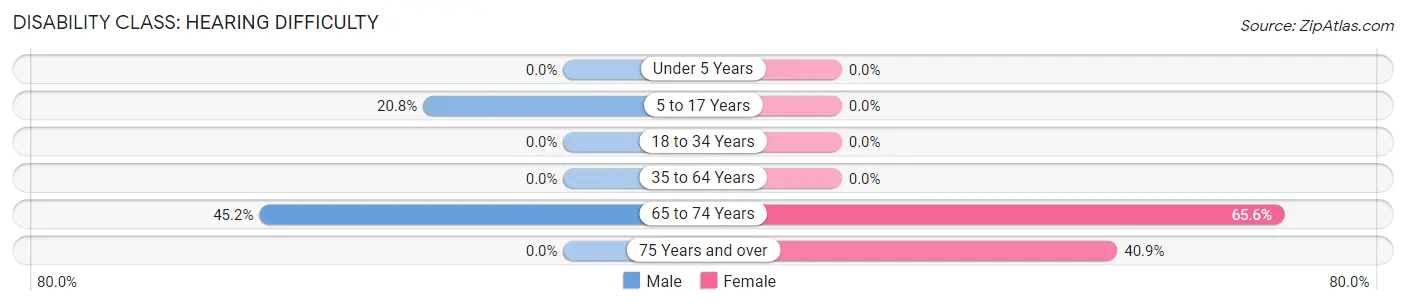
| Age Bracket | Male | Female |
| Under 5 Years | 0 (0.0%) | 0 (0.0%) |
| 5 to 17 Years | 15 (20.8%) | 0 (0.0%) |
| 18 to 34 Years | 0 (0.0%) | 0 (0.0%) |
| 35 to 64 Years | 0 (0.0%) | 0 (0.0%) |
| 65 to 74 Years | 14 (45.2%) | 21 (65.6%) |
| 75 Years and over | 0 (0.0%) | 18 (40.9%) |
Disability Class: Vision Difficulty
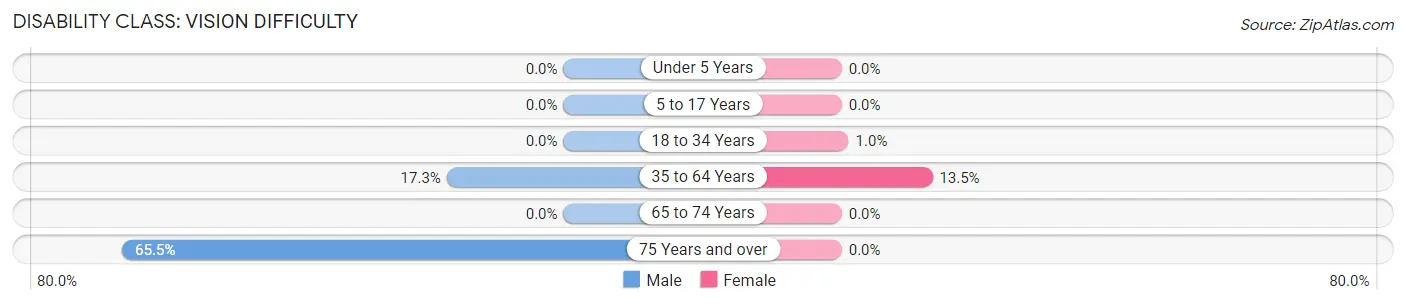
| Age Bracket | Male | Female |
| Under 5 Years | 0 (0.0%) | 0 (0.0%) |
| 5 to 17 Years | 0 (0.0%) | 0 (0.0%) |
| 18 to 34 Years | 0 (0.0%) | 10 (1.0%) |
| 35 to 64 Years | 13 (17.3%) | 14 (13.5%) |
| 65 to 74 Years | 0 (0.0%) | 0 (0.0%) |
| 75 Years and over | 19 (65.5%) | 0 (0.0%) |
Disability Class: Cognitive Difficulty
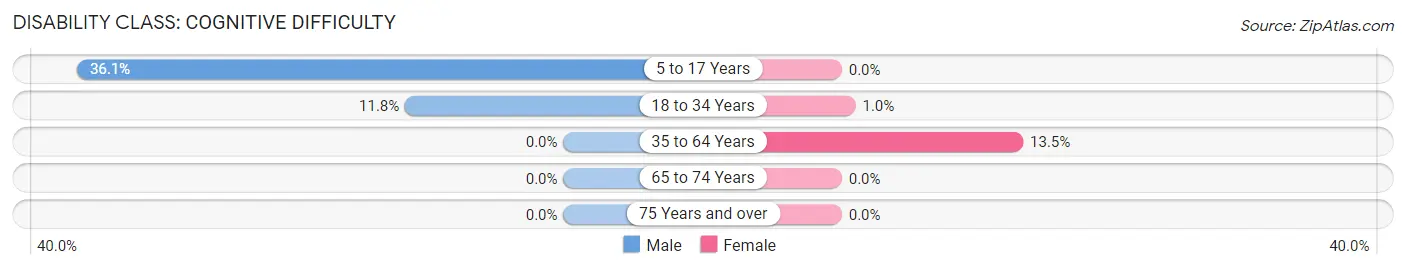
| Age Bracket | Male | Female |
| 5 to 17 Years | 26 (36.1%) | 0 (0.0%) |
| 18 to 34 Years | 80 (11.7%) | 10 (1.0%) |
| 35 to 64 Years | 0 (0.0%) | 14 (13.5%) |
| 65 to 74 Years | 0 (0.0%) | 0 (0.0%) |
| 75 Years and over | 0 (0.0%) | 0 (0.0%) |
Disability Class: Ambulatory Difficulty
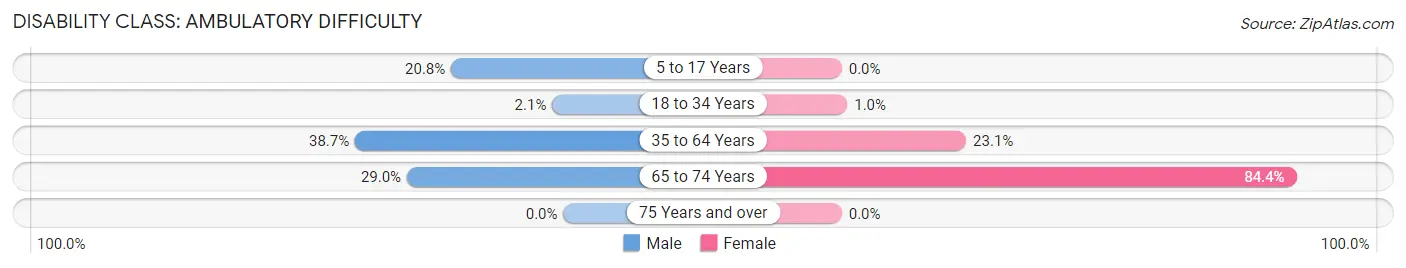
| Age Bracket | Male | Female |
| 5 to 17 Years | 15 (20.8%) | 0 (0.0%) |
| 18 to 34 Years | 14 (2.1%) | 10 (1.0%) |
| 35 to 64 Years | 29 (38.7%) | 24 (23.1%) |
| 65 to 74 Years | 9 (29.0%) | 27 (84.4%) |
| 75 Years and over | 0 (0.0%) | 0 (0.0%) |
Disability Class: Self-Care Difficulty
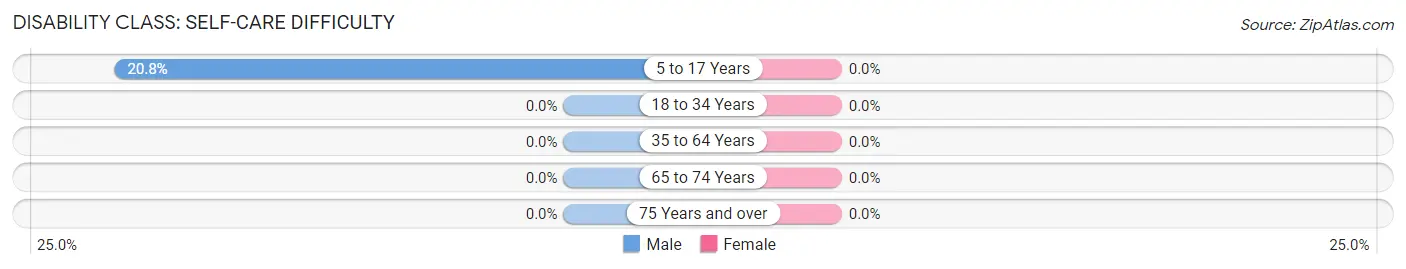
| Age Bracket | Male | Female |
| 5 to 17 Years | 15 (20.8%) | 0 (0.0%) |
| 18 to 34 Years | 0 (0.0%) | 0 (0.0%) |
| 35 to 64 Years | 0 (0.0%) | 0 (0.0%) |
| 65 to 74 Years | 0 (0.0%) | 0 (0.0%) |
| 75 Years and over | 0 (0.0%) | 0 (0.0%) |
Technology Access in Wilberforce
Computing Device Access in Wilberforce
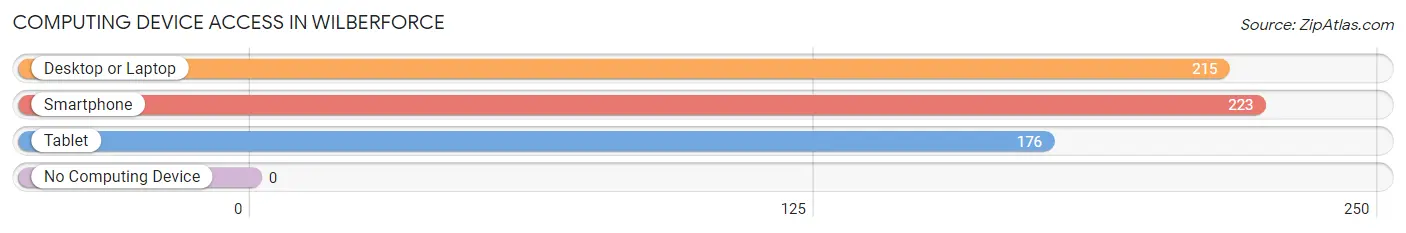
| Device Type | # Households | % Households |
| Desktop or Laptop | 215 | 86.7% |
| Smartphone | 223 | 89.9% |
| Tablet | 176 | 71.0% |
| No Computing Device | 0 | 0.0% |
| Total | 248 | 100.0% |
Internet Access in Wilberforce
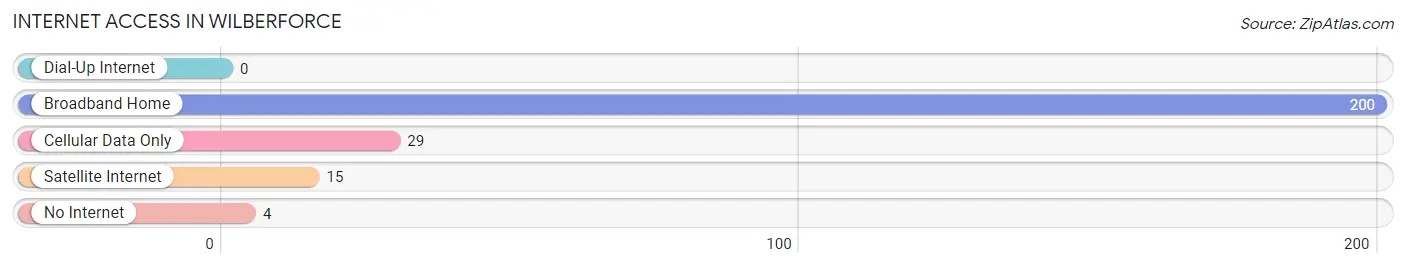
| Internet Type | # Households | % Households |
| Dial-Up Internet | 0 | 0.0% |
| Broadband Home | 200 | 80.6% |
| Cellular Data Only | 29 | 11.7% |
| Satellite Internet | 15 | 6.0% |
| No Internet | 4 | 1.6% |
| Total | 248 | 100.0% |
Wilberforce Summary
Wilberforce, Ohio is a small village located in Greene County, Ohio. It is situated on the banks of the Little Miami River, approximately 25 miles east of Dayton. The village was founded in 1856 by the Reverend William Wilberforce, a former slave who had escaped to freedom in Canada. The village was named in his honor.
Geography
Wilberforce is located at 39°45'N, 83°59'W (39.75, -83.98). It is situated on the banks of the Little Miami River, approximately 25 miles east of Dayton. The village is located in the Miami Valley region of Ohio, and is part of the Dayton Metropolitan Statistical Area. The village has a total area of 0.3 square miles, all of which is land.
Demographics
As of the 2010 census, Wilberforce had a population of 1,072. The racial makeup of the village was 79.2% African American, 17.2% White, 0.3% Native American, 0.2% Asian, 0.1% Pacific Islander, 0.7% from other races, and 2.5% from two or more races. Hispanic or Latino of any race were 1.7% of the population.
Economy
Wilberforce is home to Wilberforce University, a historically black college founded in 1856. The university is the oldest private historically black college in the United States. The village is also home to Central State University, a public university founded in 1887.
The village is home to several small businesses, including a grocery store, a gas station, a hardware store, and a few restaurants. The village also has a post office, a library, and a few churches.
History
Wilberforce was founded in 1856 by the Reverend William Wilberforce, a former slave who had escaped to freedom in Canada. The village was named in his honor. Wilberforce was the first village in the United States to be founded by a former slave.
In 1887, Wilberforce University was founded in the village. The university is the oldest private historically black college in the United States.
In the early 20th century, Wilberforce was a center of African-American culture and education. The village was home to several prominent African-American leaders, including W.E.B. Du Bois, Mary McLeod Bethune, and Booker T. Washington.
In the late 20th century, Wilberforce experienced a period of economic decline. The village was hit hard by the recession of the early 1980s, and many businesses closed. In recent years, the village has seen a resurgence in economic activity, with new businesses opening and the village becoming a popular tourist destination.
Common Questions
What is Per Capita Income in Wilberforce?
Per Capita income in Wilberforce is $15,125.
What is the Median Family Income in Wilberforce?
Median Family Income in Wilberforce is $87,841.
What is the Median Household income in Wilberforce?
Median Household Income in Wilberforce is $79,423.
What is Income or Wage Gap in Wilberforce?
Income or Wage Gap in Wilberforce is 27.5%.
Women in Wilberforce earn 72.5 cents for every dollar earned by a man.
What is Inequality or Gini Index in Wilberforce?
Inequality or Gini Index in Wilberforce is 0.39.
What is the Total Population of Wilberforce?
Total Population of Wilberforce is 2,190.
What is the Total Male Population of Wilberforce?
Total Male Population of Wilberforce is 906.
What is the Total Female Population of Wilberforce?
Total Female Population of Wilberforce is 1,284.
What is the Ratio of Males per 100 Females in Wilberforce?
There are 70.56 Males per 100 Females in Wilberforce.
What is the Ratio of Females per 100 Males in Wilberforce?
There are 141.72 Females per 100 Males in Wilberforce.
What is the Median Population Age in Wilberforce?
Median Population Age in Wilberforce is 20.2 Years.
What is the Average Family Size in Wilberforce
Average Family Size in Wilberforce is 3.3 People.
What is the Average Household Size in Wilberforce
Average Household Size in Wilberforce is 2.6 People.
How Large is the Labor Force in Wilberforce?
There are 1,128 People in the Labor Forcein in Wilberforce.
What is the Percentage of People in the Labor Force in Wilberforce?
55.5% of People are in the Labor Force in Wilberforce.
What is the Unemployment Rate in Wilberforce?
Unemployment Rate in Wilberforce is 12.8%.