Kelleys Island, OH Map & Demographics
Kelleys Island Map
Kelleys Island Overview
$67,176
PER CAPITA INCOME
$100,278
AVG FAMILY INCOME
$74,375
AVG HOUSEHOLD INCOME
36.1%
WAGE / INCOME GAP [ % ]
63.9¢/ $1
WAGE / INCOME GAP [ $ ]
0.51
INEQUALITY / GINI INDEX
221
TOTAL POPULATION
122
MALE POPULATION
99
FEMALE POPULATION
123.23
MALES / 100 FEMALES
81.15
FEMALES / 100 MALES
65.3
MEDIAN AGE
2.2
AVG FAMILY SIZE
1.9
AVG HOUSEHOLD SIZE
104
LABOR FORCE [ PEOPLE ]
47.9%
PERCENT IN LABOR FORCE
20.2%
UNEMPLOYMENT RATE
Kelleys Island Zip Codes
Income in Kelleys Island
Income Overview in Kelleys Island
Per Capita Income in Kelleys Island is $67,176, while median incomes of families and households are $100,278 and $74,375 respectively.
| Characteristic | Number | Measure |
| Per Capita Income | 221 | $67,176 |
| Median Family Income | 74 | $100,278 |
| Mean Family Income | 74 | $159,519 |
| Median Household Income | 117 | $74,375 |
| Mean Household Income | 117 | $122,426 |
| Income Deficit | 74 | $0 |
| Wage / Income Gap (%) | 221 | 36.06% |
| Wage / Income Gap ($) | 221 | 63.94¢ per $1 |
| Gini / Inequality Index | 221 | 0.51 |
Earnings by Sex in Kelleys Island
Average Earnings in Kelleys Island are $37,273, $55,714 for men and $35,625 for women, a difference of 36.1%.

| Sex | Number | Average Earnings |
| Male | 74 (61.7%) | $55,714 |
| Female | 46 (38.3%) | $35,625 |
| Total | 120 (100.0%) | $37,273 |
Earnings by Sex by Income Bracket in Kelleys Island
The most common earnings brackets in Kelleys Island are $55,000 to $64,999 for men (19 | 25.7%) and $35,000 to $39,999 for women (12 | 26.1%).
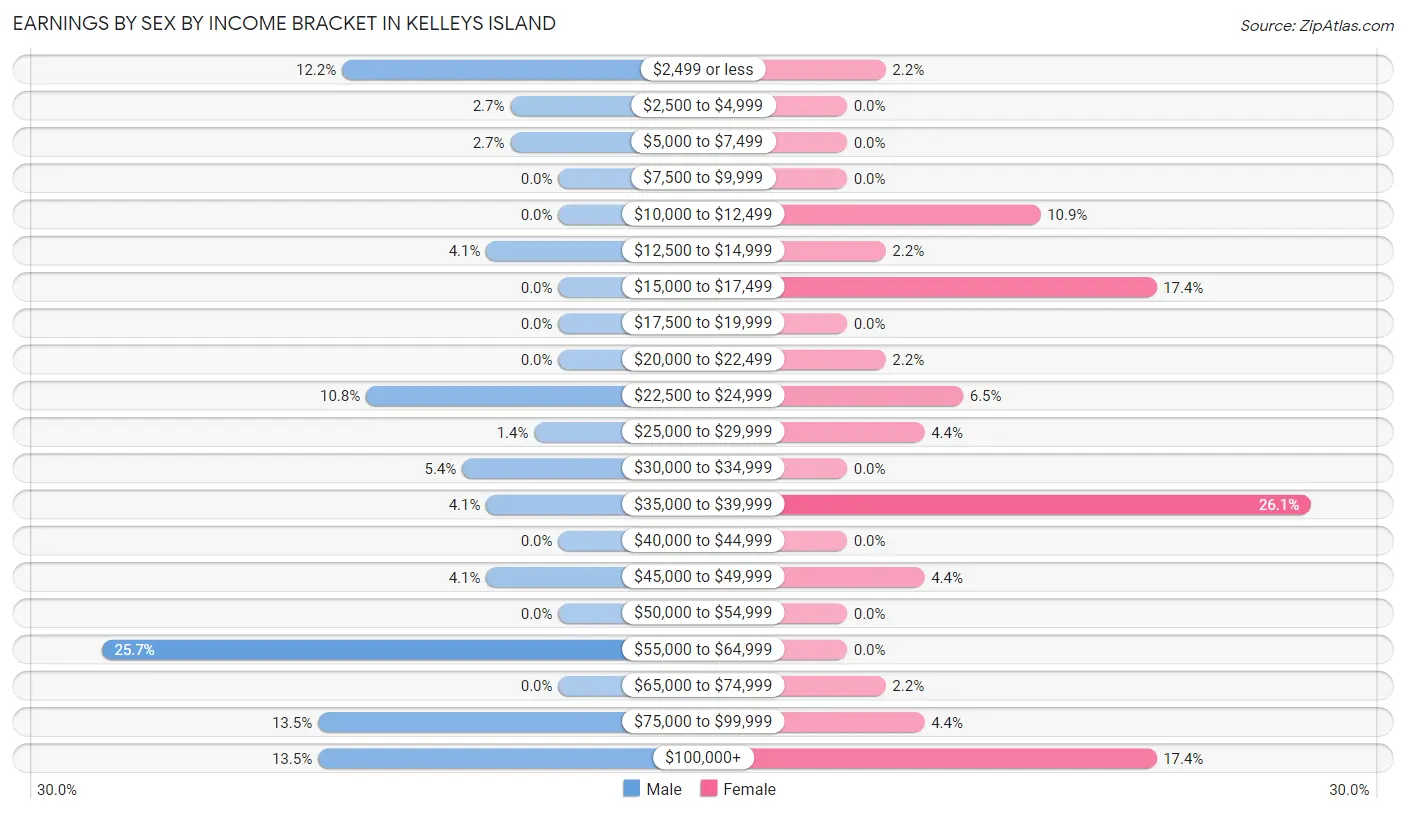
| Income | Male | Female |
| $2,499 or less | 9 (12.2%) | 1 (2.2%) |
| $2,500 to $4,999 | 2 (2.7%) | 0 (0.0%) |
| $5,000 to $7,499 | 2 (2.7%) | 0 (0.0%) |
| $7,500 to $9,999 | 0 (0.0%) | 0 (0.0%) |
| $10,000 to $12,499 | 0 (0.0%) | 5 (10.9%) |
| $12,500 to $14,999 | 3 (4.1%) | 1 (2.2%) |
| $15,000 to $17,499 | 0 (0.0%) | 8 (17.4%) |
| $17,500 to $19,999 | 0 (0.0%) | 0 (0.0%) |
| $20,000 to $22,499 | 0 (0.0%) | 1 (2.2%) |
| $22,500 to $24,999 | 8 (10.8%) | 3 (6.5%) |
| $25,000 to $29,999 | 1 (1.3%) | 2 (4.3%) |
| $30,000 to $34,999 | 4 (5.4%) | 0 (0.0%) |
| $35,000 to $39,999 | 3 (4.1%) | 12 (26.1%) |
| $40,000 to $44,999 | 0 (0.0%) | 0 (0.0%) |
| $45,000 to $49,999 | 3 (4.1%) | 2 (4.3%) |
| $50,000 to $54,999 | 0 (0.0%) | 0 (0.0%) |
| $55,000 to $64,999 | 19 (25.7%) | 0 (0.0%) |
| $65,000 to $74,999 | 0 (0.0%) | 1 (2.2%) |
| $75,000 to $99,999 | 10 (13.5%) | 2 (4.3%) |
| $100,000+ | 10 (13.5%) | 8 (17.4%) |
| Total | 74 (100.0%) | 46 (100.0%) |
Earnings by Sex by Educational Attainment in Kelleys Island
Average earnings in Kelleys Island are $55,357 for men and $35,625 for women, a difference of 35.6%. Men with an educational attainment of graduate degree enjoy the highest average annual earnings of $250,001, while those with high school diploma education earn the least with $46,250. Women with an educational attainment of college or associate's degree earn the most with the average annual earnings of $35,625, while those with high school diploma education have the smallest earnings of $25,625.
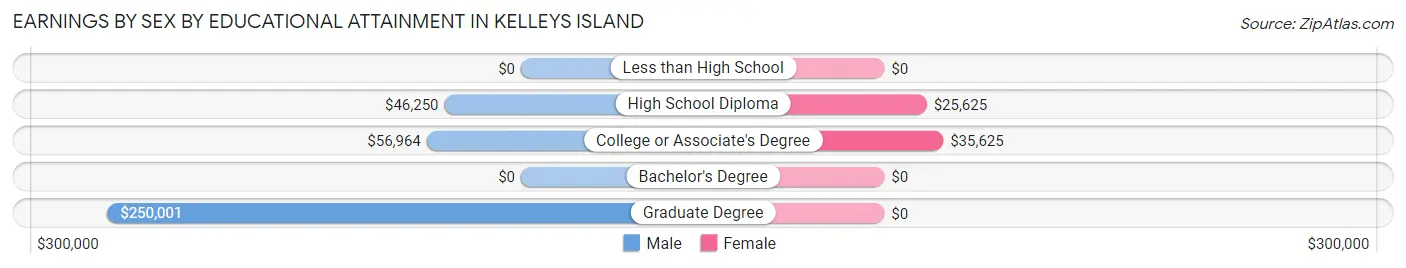
| Educational Attainment | Male Income | Female Income |
| Less than High School | - | - |
| High School Diploma | $46,250 | $25,625 |
| College or Associate's Degree | $56,964 | $35,625 |
| Bachelor's Degree | - | - |
| Graduate Degree | $250,001 | $0 |
| Total | $55,357 | $35,625 |
Family Income in Kelleys Island
Family Income Brackets in Kelleys Island
According to the Kelleys Island family income data, there are 16 families falling into the $100,000 to $149,999 income range, which is the most common income bracket and makes up 21.6% of all families.
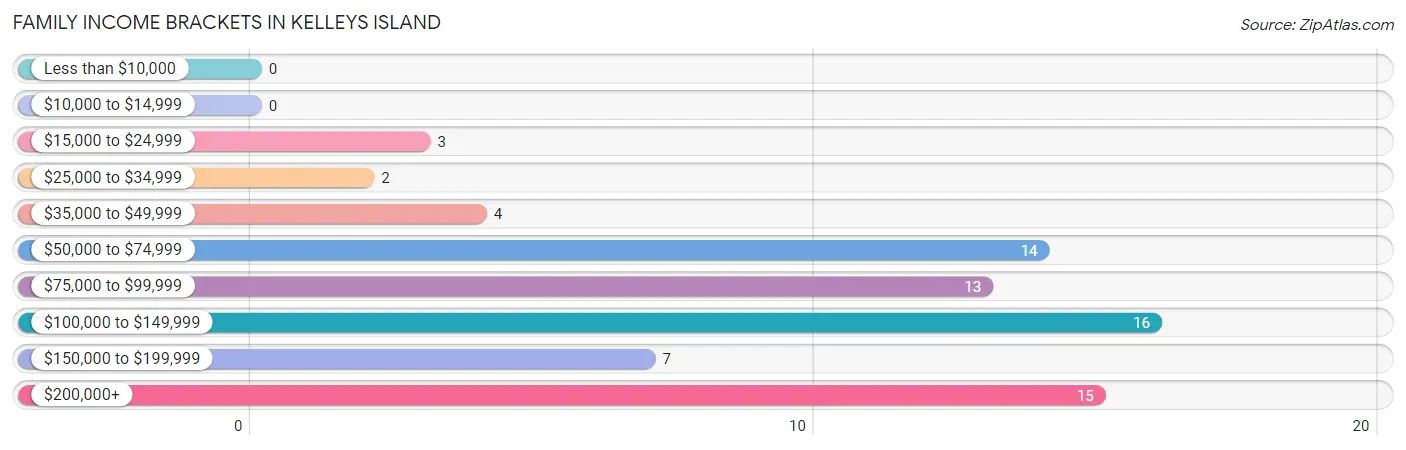
| Income Bracket | # Families | % Families |
| Less than $10,000 | 0 | 0.0% |
| $10,000 to $14,999 | 0 | 0.0% |
| $15,000 to $24,999 | 3 | 4.1% |
| $25,000 to $34,999 | 2 | 2.7% |
| $35,000 to $49,999 | 4 | 5.4% |
| $50,000 to $74,999 | 14 | 18.9% |
| $75,000 to $99,999 | 13 | 17.6% |
| $100,000 to $149,999 | 16 | 21.6% |
| $150,000 to $199,999 | 7 | 9.5% |
| $200,000+ | 15 | 20.3% |
Family Income by Famaliy Size in Kelleys Island
2-person families (68 | 91.9%) account for the highest median family income in Kelleys Island with $100,556 per family, while 2-person families (68 | 91.9%) have the highest median income of $50,278 per family member.
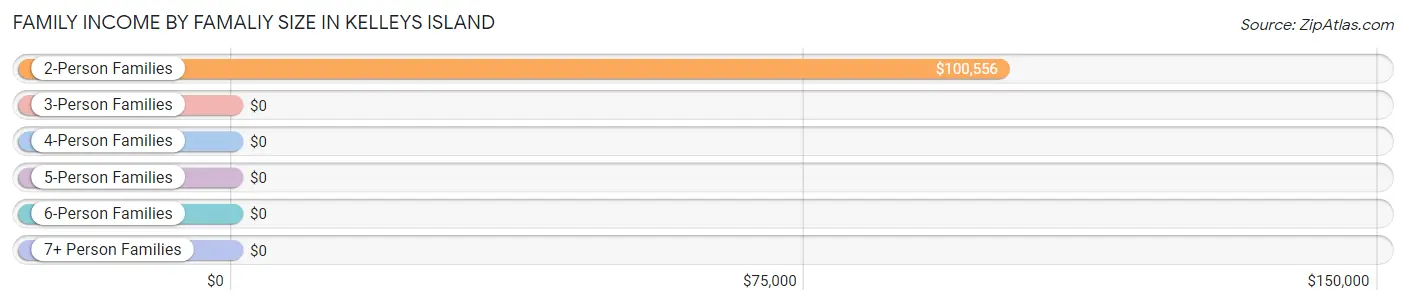
| Income Bracket | # Families | Median Income |
| 2-Person Families | 68 (91.9%) | $100,556 |
| 3-Person Families | 2 (2.7%) | $0 |
| 4-Person Families | 4 (5.4%) | $0 |
| 5-Person Families | 0 (0.0%) | $0 |
| 6-Person Families | 0 (0.0%) | $0 |
| 7+ Person Families | 0 (0.0%) | $0 |
| Total | 74 (100.0%) | $100,278 |
Family Income by Number of Earners in Kelleys Island
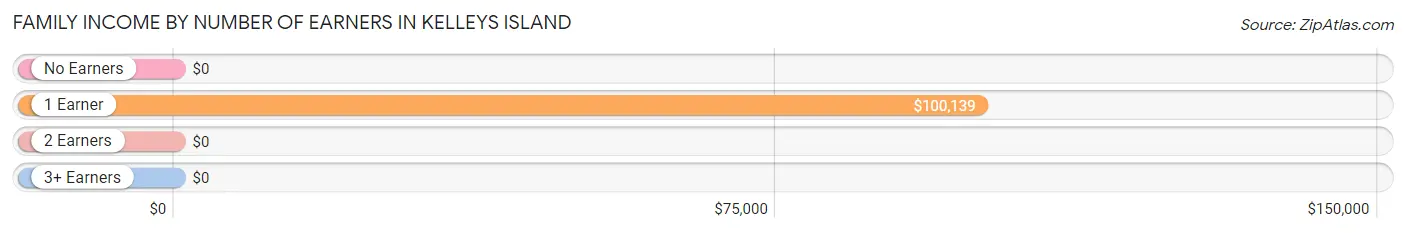
| Number of Earners | # Families | Median Income |
| No Earners | 30 (40.5%) | $0 |
| 1 Earner | 17 (23.0%) | $100,139 |
| 2 Earners | 27 (36.5%) | $0 |
| 3+ Earners | 0 (0.0%) | $0 |
| Total | 74 (100.0%) | $100,278 |
Household Income in Kelleys Island
Household Income Brackets in Kelleys Island
With 25 households falling in the category, the $50,000 to $74,999 income range is the most frequent in Kelleys Island, accounting for 21.4% of all households.
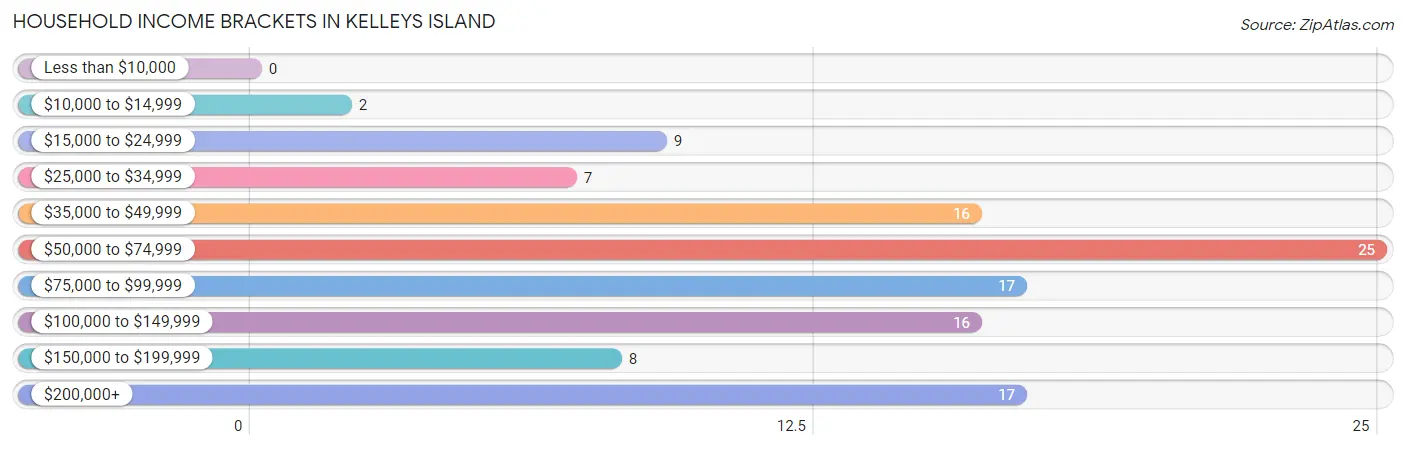
| Income Bracket | # Households | % Households |
| Less than $10,000 | 0 | 0.0% |
| $10,000 to $14,999 | 2 | 1.7% |
| $15,000 to $24,999 | 9 | 7.7% |
| $25,000 to $34,999 | 7 | 6.0% |
| $35,000 to $49,999 | 16 | 13.7% |
| $50,000 to $74,999 | 25 | 21.4% |
| $75,000 to $99,999 | 17 | 14.5% |
| $100,000 to $149,999 | 16 | 13.7% |
| $150,000 to $199,999 | 8 | 6.8% |
| $200,000+ | 17 | 14.5% |
Household Income by Householder Age in Kelleys Island
The median household income in Kelleys Island is $74,375, with the highest median household income of $63,906 found in the 65+ years age bracket for the primary householder. A total of 63 households (53.8%) fall into this category.
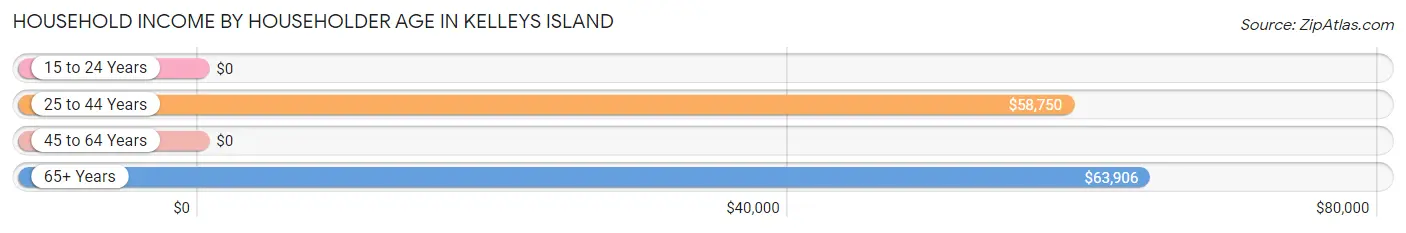
| Income Bracket | # Households | Median Income |
| 15 to 24 Years | 0 (0.0%) | $0 |
| 25 to 44 Years | 18 (15.4%) | $58,750 |
| 45 to 64 Years | 36 (30.8%) | $0 |
| 65+ Years | 63 (53.8%) | $63,906 |
| Total | 117 (100.0%) | $74,375 |
Poverty in Kelleys Island
Income Below Poverty by Sex and Age in Kelleys Island
With 6.6% poverty level for males and 2.0% for females among the residents of Kelleys Island, 18 to 24 year old males and 65 to 74 year old females are the most vulnerable to poverty, with 3 males (37.5%) and 2 females (4.0%) in their respective age groups living below the poverty level.
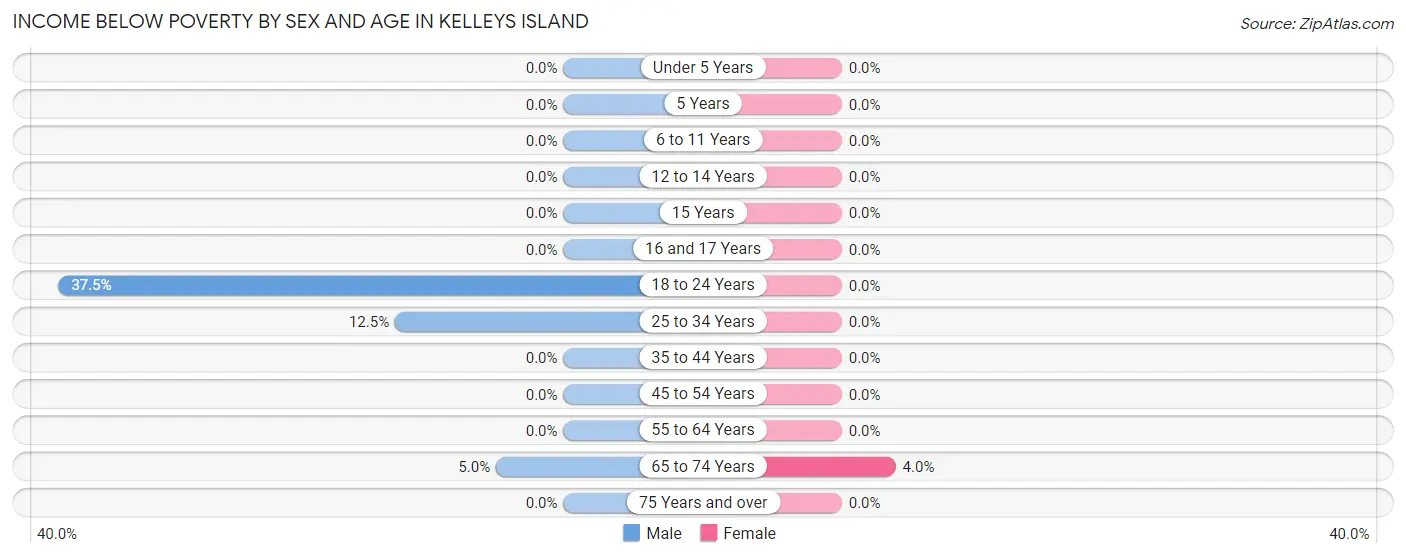
| Age Bracket | Male | Female |
| Under 5 Years | 0 (0.0%) | 0 (0.0%) |
| 5 Years | 0 (0.0%) | 0 (0.0%) |
| 6 to 11 Years | 0 (0.0%) | 0 (0.0%) |
| 12 to 14 Years | 0 (0.0%) | 0 (0.0%) |
| 15 Years | 0 (0.0%) | 0 (0.0%) |
| 16 and 17 Years | 0 (0.0%) | 0 (0.0%) |
| 18 to 24 Years | 3 (37.5%) | 0 (0.0%) |
| 25 to 34 Years | 3 (12.5%) | 0 (0.0%) |
| 35 to 44 Years | 0 (0.0%) | 0 (0.0%) |
| 45 to 54 Years | 0 (0.0%) | 0 (0.0%) |
| 55 to 64 Years | 0 (0.0%) | 0 (0.0%) |
| 65 to 74 Years | 2 (5.0%) | 2 (4.0%) |
| 75 Years and over | 0 (0.0%) | 0 (0.0%) |
| Total | 8 (6.6%) | 2 (2.0%) |
Income Above Poverty by Sex and Age in Kelleys Island
According to the poverty statistics in Kelleys Island, males aged 5 years and females aged under 5 years are the age groups that are most secure financially, with 100.0% of males and 100.0% of females in these age groups living above the poverty line.
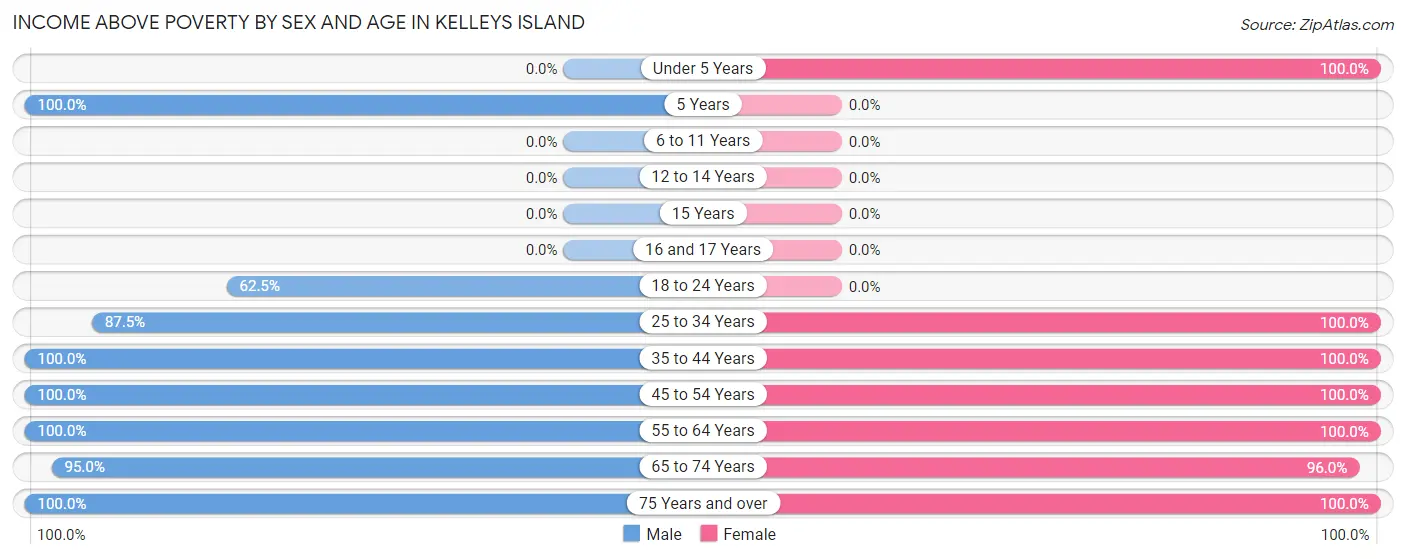
| Age Bracket | Male | Female |
| Under 5 Years | 0 (0.0%) | 2 (100.0%) |
| 5 Years | 2 (100.0%) | 0 (0.0%) |
| 6 to 11 Years | 0 (0.0%) | 0 (0.0%) |
| 12 to 14 Years | 0 (0.0%) | 0 (0.0%) |
| 15 Years | 0 (0.0%) | 0 (0.0%) |
| 16 and 17 Years | 0 (0.0%) | 0 (0.0%) |
| 18 to 24 Years | 5 (62.5%) | 0 (0.0%) |
| 25 to 34 Years | 21 (87.5%) | 3 (100.0%) |
| 35 to 44 Years | 7 (100.0%) | 4 (100.0%) |
| 45 to 54 Years | 9 (100.0%) | 13 (100.0%) |
| 55 to 64 Years | 19 (100.0%) | 18 (100.0%) |
| 65 to 74 Years | 38 (95.0%) | 48 (96.0%) |
| 75 Years and over | 13 (100.0%) | 9 (100.0%) |
| Total | 114 (93.4%) | 97 (98.0%) |
Income Below Poverty Among Married-Couple Families in Kelleys Island
The poverty statistics for married-couple families in Kelleys Island show that 2.8% or 2 of the total 72 families live below the poverty line. Families with no children have the highest poverty rate of 2.9%, comprising of 2 families. On the other hand, families with 1 or 2 children have the lowest poverty rate of 0.0%, which includes 0 families.
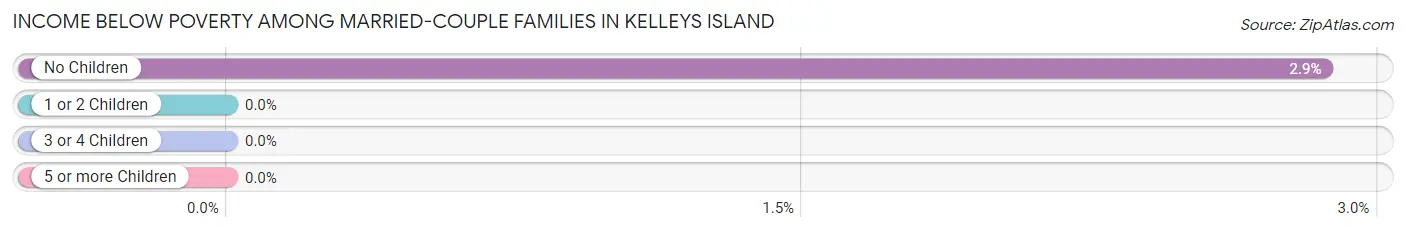
| Children | Above Poverty | Below Poverty |
| No Children | 68 (97.1%) | 2 (2.9%) |
| 1 or 2 Children | 2 (100.0%) | 0 (0.0%) |
| 3 or 4 Children | 0 (0.0%) | 0 (0.0%) |
| 5 or more Children | 0 (0.0%) | 0 (0.0%) |
| Total | 70 (97.2%) | 2 (2.8%) |
Income Below Poverty Among Single-Parent Households in Kelleys Island
| Children | Single Father | Single Mother |
| No Children | 0 (0.0%) | 0 (0.0%) |
| 1 or 2 Children | 0 (0.0%) | 0 (0.0%) |
| 3 or 4 Children | 0 (0.0%) | 0 (0.0%) |
| 5 or more Children | 0 (0.0%) | 0 (0.0%) |
| Total | 0 (0.0%) | 0 (0.0%) |
Income Below Poverty Among Married-Couple vs Single-Parent Households in Kelleys Island
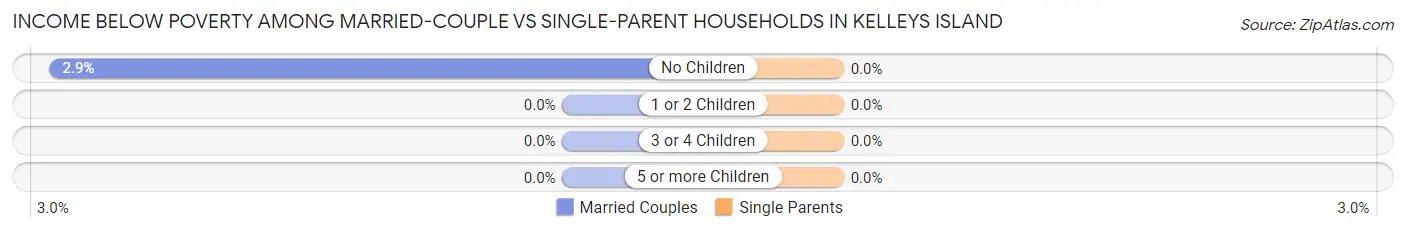
| Children | Married-Couple Families | Single-Parent Households |
| No Children | 2 (2.9%) | 0 (0.0%) |
| 1 or 2 Children | 0 (0.0%) | 0 (0.0%) |
| 3 or 4 Children | 0 (0.0%) | 0 (0.0%) |
| 5 or more Children | 0 (0.0%) | 0 (0.0%) |
| Total | 2 (2.8%) | 0 (0.0%) |
Race in Kelleys Island
The most populous races in Kelleys Island are White / Caucasian (219 | 99.1%), Hispanic or Latino (13 | 5.9%), and Two or more Races (2 | 0.9%).
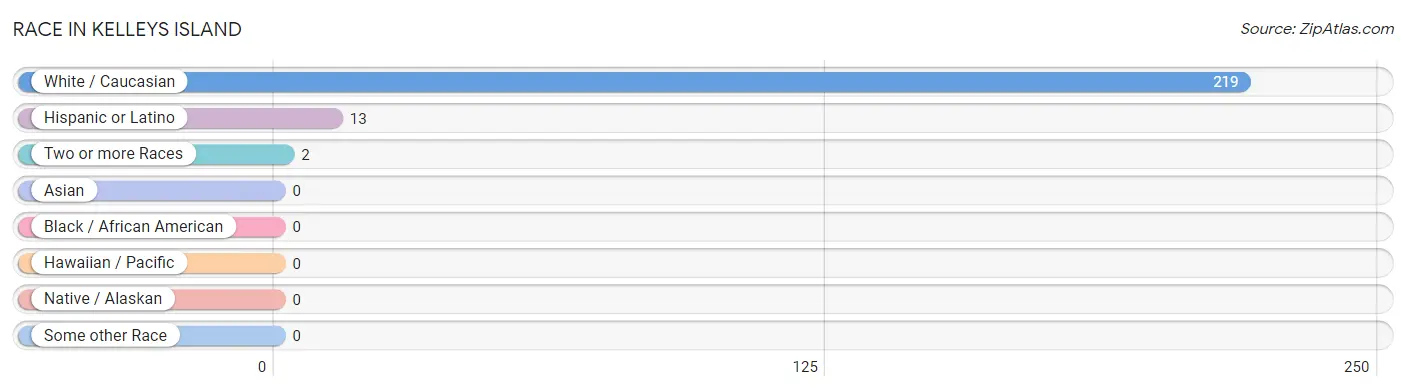
| Race | # Population | % Population |
| Asian | 0 | 0.0% |
| Black / African American | 0 | 0.0% |
| Hawaiian / Pacific | 0 | 0.0% |
| Hispanic or Latino | 13 | 5.9% |
| Native / Alaskan | 0 | 0.0% |
| White / Caucasian | 219 | 99.1% |
| Two or more Races | 2 | 0.9% |
| Some other Race | 0 | 0.0% |
| Total | 221 | 100.0% |
Ancestry in Kelleys Island
The most populous ancestries reported in Kelleys Island are German (74 | 33.5%), English (51 | 23.1%), Irish (31 | 14.0%), Polish (24 | 10.9%), and Italian (15 | 6.8%), together accounting for 88.2% of all Kelleys Island residents.
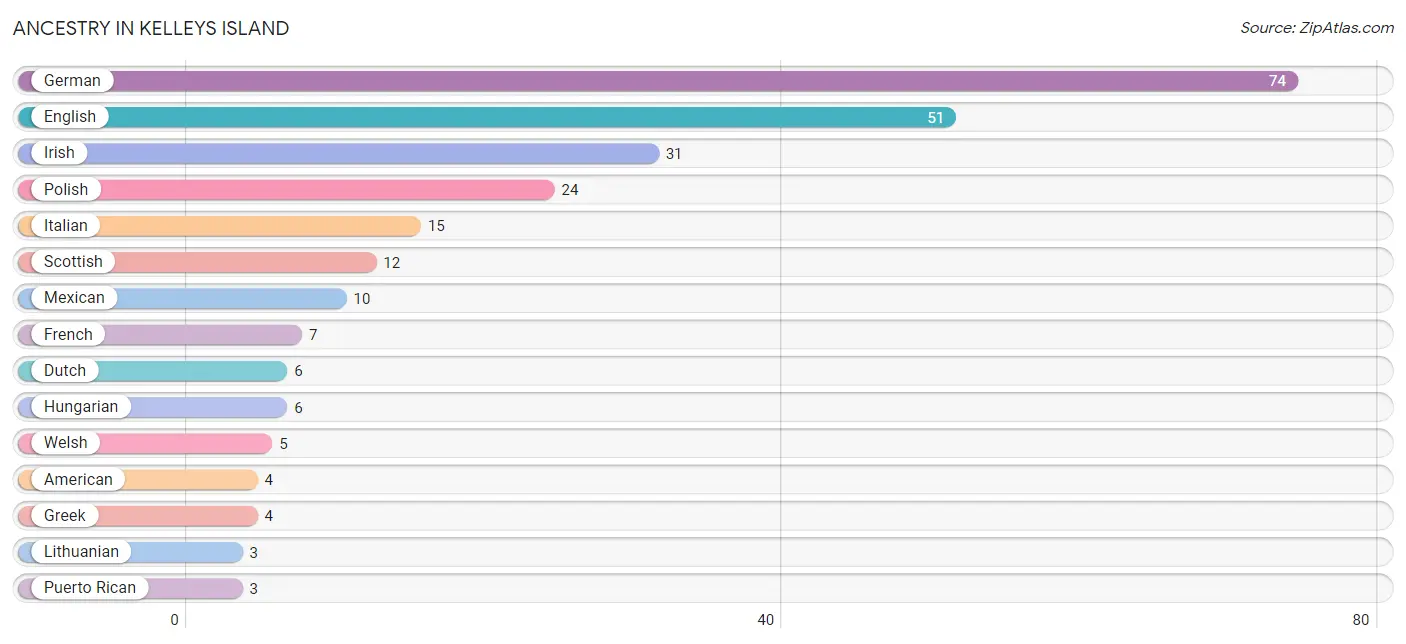
| Ancestry | # Population | % Population |
| American | 4 | 1.8% |
| Austrian | 1 | 0.4% |
| Bulgarian | 1 | 0.4% |
| Croatian | 1 | 0.4% |
| Dutch | 6 | 2.7% |
| English | 51 | 23.1% |
| European | 2 | 0.9% |
| French | 7 | 3.2% |
| French Canadian | 2 | 0.9% |
| German | 74 | 33.5% |
| Greek | 4 | 1.8% |
| Hungarian | 6 | 2.7% |
| Irish | 31 | 14.0% |
| Italian | 15 | 6.8% |
| Lithuanian | 3 | 1.4% |
| Mexican | 10 | 4.5% |
| Polish | 24 | 10.9% |
| Puerto Rican | 3 | 1.4% |
| Scottish | 12 | 5.4% |
| Slovak | 2 | 0.9% |
| Welsh | 5 | 2.3% | View All 21 Rows |
Immigrants in Kelleys Island
The most numerous immigrant groups reported in Kelleys Island came from Europe (2 | 0.9%), Germany (2 | 0.9%), and Western Europe (2 | 0.9%), together accounting for 2.7% of all Kelleys Island residents.
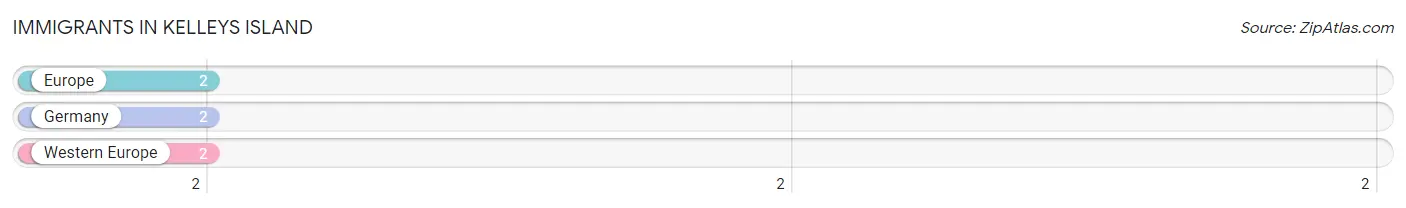
| Immigration Origin | # Population | % Population |
| Europe | 2 | 0.9% |
| Germany | 2 | 0.9% |
| Western Europe | 2 | 0.9% | View All 3 Rows |
Sex and Age in Kelleys Island
Sex and Age in Kelleys Island
The most populous age groups in Kelleys Island are 70 to 74 Years (25 | 20.5%) for men and 65 to 69 Years (35 | 35.3%) for women.
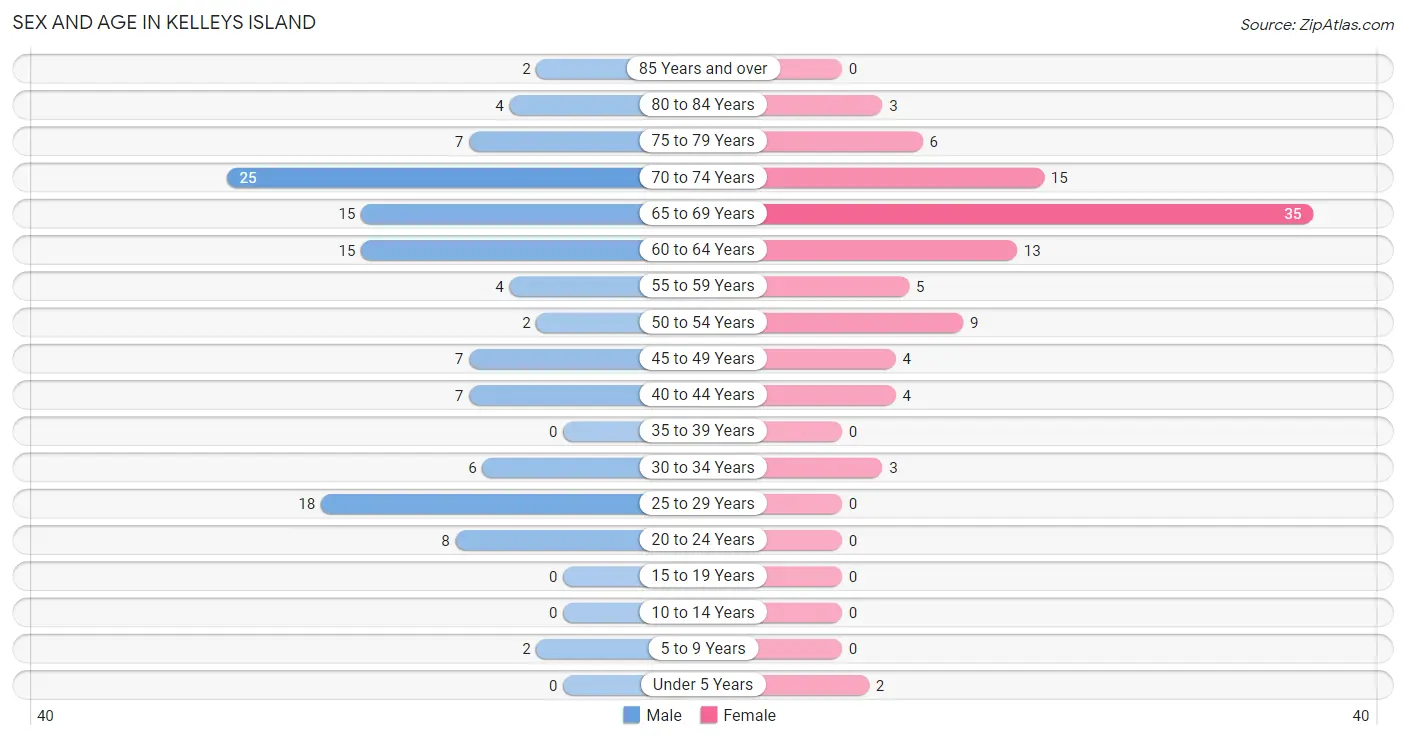
| Age Bracket | Male | Female |
| Under 5 Years | 0 (0.0%) | 2 (2.0%) |
| 5 to 9 Years | 2 (1.6%) | 0 (0.0%) |
| 10 to 14 Years | 0 (0.0%) | 0 (0.0%) |
| 15 to 19 Years | 0 (0.0%) | 0 (0.0%) |
| 20 to 24 Years | 8 (6.6%) | 0 (0.0%) |
| 25 to 29 Years | 18 (14.7%) | 0 (0.0%) |
| 30 to 34 Years | 6 (4.9%) | 3 (3.0%) |
| 35 to 39 Years | 0 (0.0%) | 0 (0.0%) |
| 40 to 44 Years | 7 (5.7%) | 4 (4.0%) |
| 45 to 49 Years | 7 (5.7%) | 4 (4.0%) |
| 50 to 54 Years | 2 (1.6%) | 9 (9.1%) |
| 55 to 59 Years | 4 (3.3%) | 5 (5.1%) |
| 60 to 64 Years | 15 (12.3%) | 13 (13.1%) |
| 65 to 69 Years | 15 (12.3%) | 35 (35.3%) |
| 70 to 74 Years | 25 (20.5%) | 15 (15.1%) |
| 75 to 79 Years | 7 (5.7%) | 6 (6.1%) |
| 80 to 84 Years | 4 (3.3%) | 3 (3.0%) |
| 85 Years and over | 2 (1.6%) | 0 (0.0%) |
| Total | 122 (100.0%) | 99 (100.0%) |
Families and Households in Kelleys Island
Median Family Size in Kelleys Island
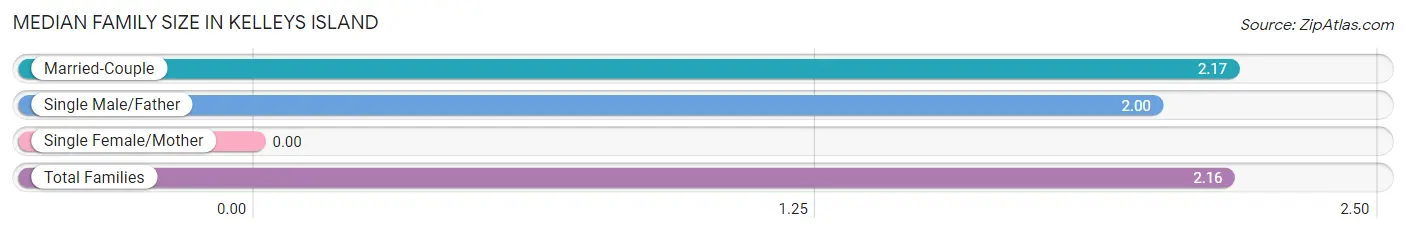
| Family Type | # Families | Family Size |
| Married-Couple | 72 (97.3%) | 2.17 |
| Single Male/Father | 2 (2.7%) | 2.00 |
| Single Female/Mother | 0 (0.0%) | - |
| Total Families | 74 (100.0%) | 2.16 |
Median Household Size in Kelleys Island
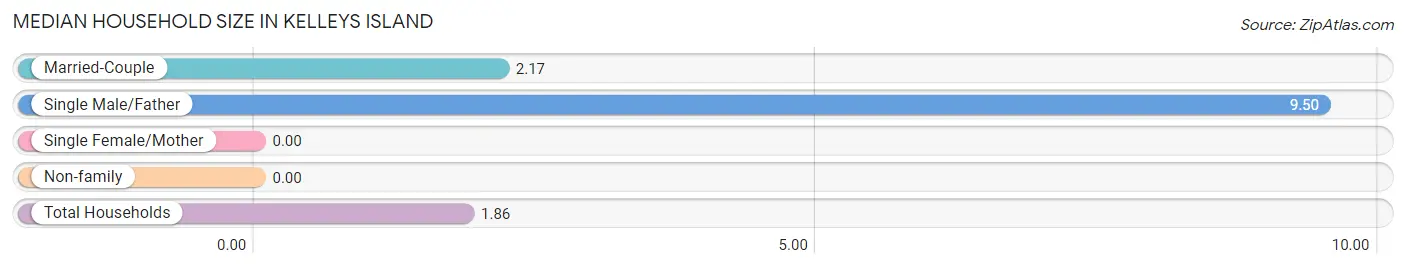
| Household Type | # Households | Household Size |
| Married-Couple | 72 (61.5%) | 2.17 |
| Single Male/Father | 2 (1.7%) | 9.50 |
| Single Female/Mother | 0 (0.0%) | - |
| Non-family | 43 (36.7%) | - |
| Total Households | 117 (100.0%) | 1.86 |
Household Size by Marriage Status in Kelleys Island
Out of a total of 117 households in Kelleys Island, 74 (63.2%) are family households, while 43 (36.7%) are nonfamily households. The most numerous type of family households are 2-person households, comprising 66, and the most common type of nonfamily households are 1-person households, comprising 43.
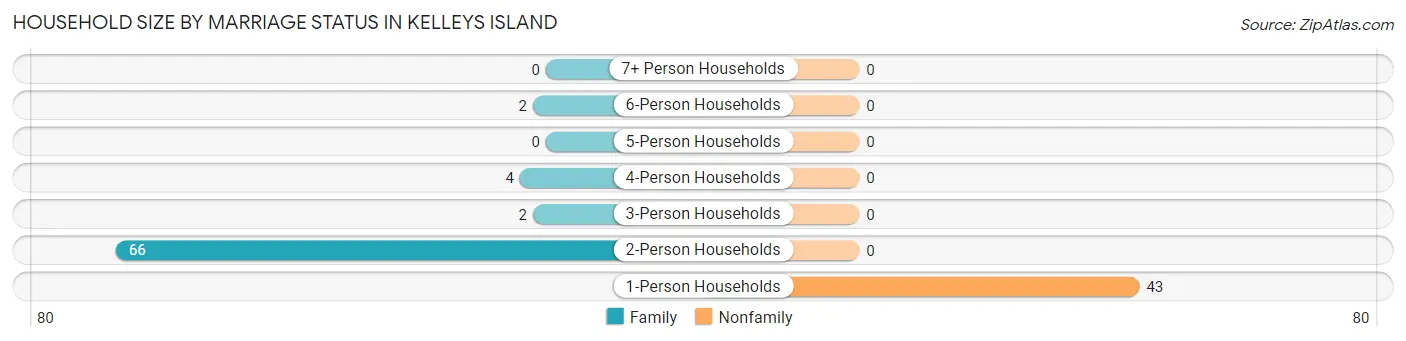
| Household Size | Family Households | Nonfamily Households |
| 1-Person Households | - | 43 (36.7%) |
| 2-Person Households | 66 (56.4%) | 0 (0.0%) |
| 3-Person Households | 2 (1.7%) | 0 (0.0%) |
| 4-Person Households | 4 (3.4%) | 0 (0.0%) |
| 5-Person Households | 0 (0.0%) | 0 (0.0%) |
| 6-Person Households | 2 (1.7%) | 0 (0.0%) |
| 7+ Person Households | 0 (0.0%) | 0 (0.0%) |
| Total | 74 (63.2%) | 43 (36.7%) |
Female Fertility in Kelleys Island
Fertility by Age in Kelleys Island
Average fertility rate in Kelleys Island is 167.0 births per 1,000 women. Women in the age bracket of 35 to 50 years have the highest fertility rate with 222.0 births per 1,000 women. Women in the age bracket of 35 to 50 years acount for 100.0% of all women with births.
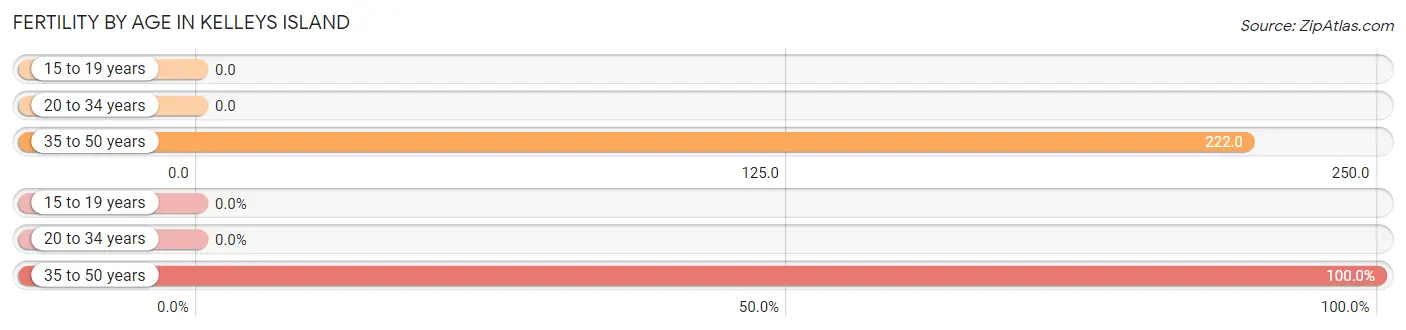
| Age Bracket | Women with Births | Births / 1,000 Women |
| 15 to 19 years | 0 (0.0%) | 0.0 |
| 20 to 34 years | 0 (0.0%) | 0.0 |
| 35 to 50 years | 2 (100.0%) | 222.0 |
| Total | 2 (100.0%) | 167.0 |
Fertility by Age by Marriage Status in Kelleys Island
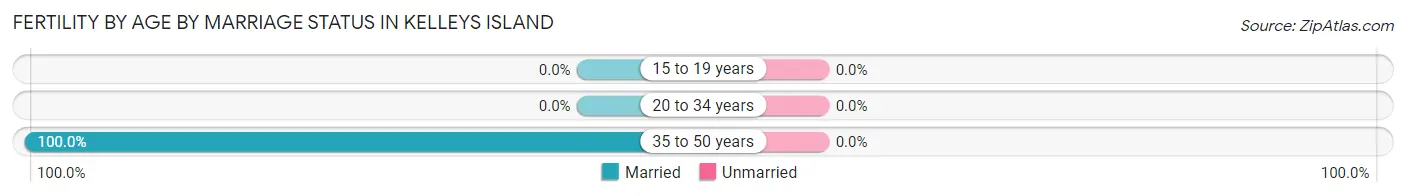
| Age Bracket | Married | Unmarried |
| 15 to 19 years | 0 (0.0%) | 0 (0.0%) |
| 20 to 34 years | 0 (0.0%) | 0 (0.0%) |
| 35 to 50 years | 2 (100.0%) | 0 (0.0%) |
| Total | 2 (100.0%) | 0 (0.0%) |
Fertility by Education in Kelleys Island
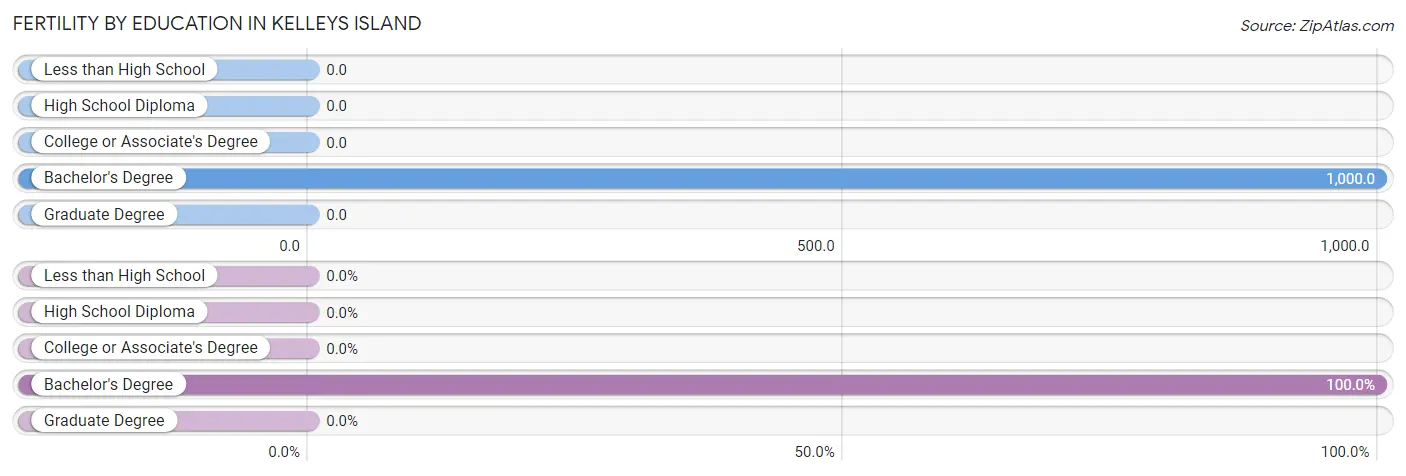
| Educational Attainment | Women with Births | Births / 1,000 Women |
| Less than High School | 0 (0.0%) | 0.0 |
| High School Diploma | 0 (0.0%) | 0.0 |
| College or Associate's Degree | 0 (0.0%) | 0.0 |
| Bachelor's Degree | 2 (100.0%) | 1,000.0 |
| Graduate Degree | 0 (0.0%) | 0.0 |
| Total | 2 (100.0%) | 167.0 |
Fertility by Education by Marriage Status in Kelleys Island
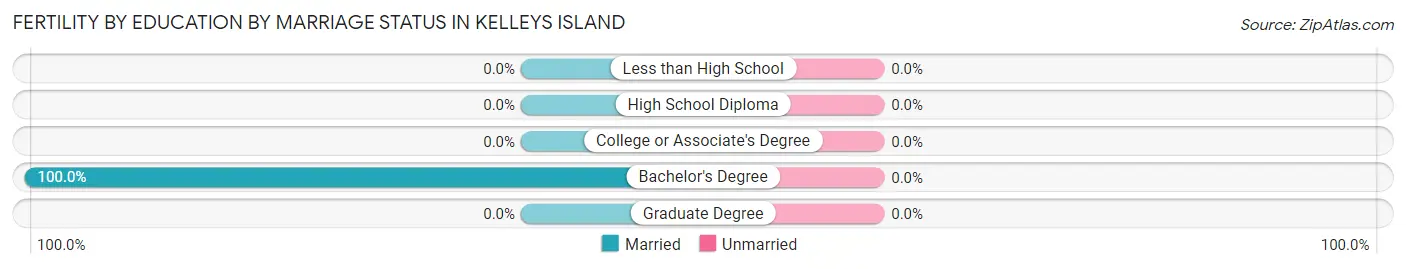
| Educational Attainment | Married | Unmarried |
| Less than High School | 0 (0.0%) | 0 (0.0%) |
| High School Diploma | 0 (0.0%) | 0 (0.0%) |
| College or Associate's Degree | 0 (0.0%) | 0 (0.0%) |
| Bachelor's Degree | 2 (100.0%) | 0 (0.0%) |
| Graduate Degree | 0 (0.0%) | 0 (0.0%) |
| Total | 2 (100.0%) | 0 (0.0%) |
Employment Characteristics in Kelleys Island
Employment by Class of Employer in Kelleys Island
Among the 83 employed individuals in Kelleys Island, private company employees (55 | 66.3%), self-employed (incorporated) (12 | 14.5%), and local government employees (8 | 9.6%) make up the most common classes of employment.
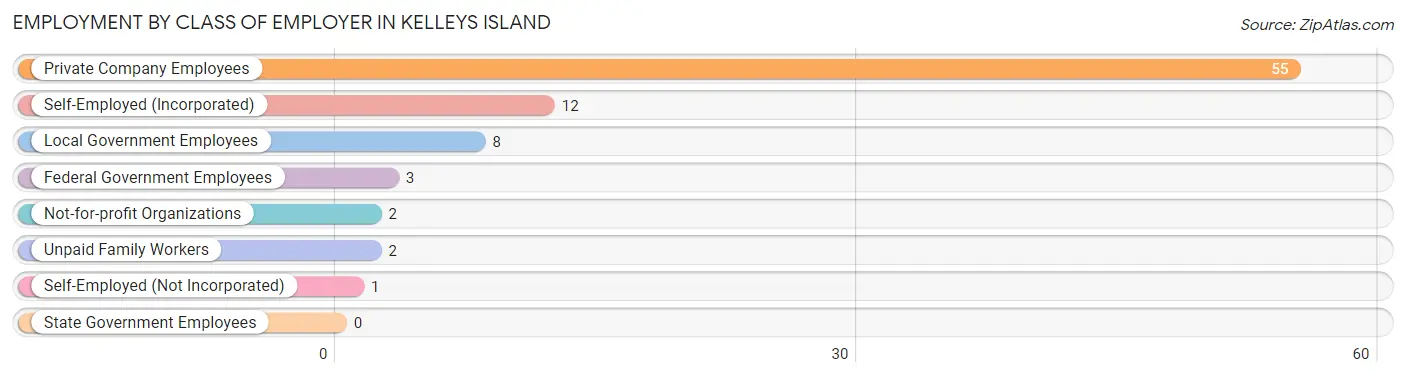
| Employer Class | # Employees | % Employees |
| Private Company Employees | 55 | 66.3% |
| Self-Employed (Incorporated) | 12 | 14.5% |
| Self-Employed (Not Incorporated) | 1 | 1.2% |
| Not-for-profit Organizations | 2 | 2.4% |
| Local Government Employees | 8 | 9.6% |
| State Government Employees | 0 | 0.0% |
| Federal Government Employees | 3 | 3.6% |
| Unpaid Family Workers | 2 | 2.4% |
| Total | 83 | 100.0% |
Employment Status by Age in Kelleys Island
According to the labor force statistics for Kelleys Island, out of the total population over 16 years of age (217), 47.9% or 104 individuals are in the labor force, with 20.2% or 21 of them unemployed. The age group with the highest labor force participation rate is 20 to 24 years, with 100.0% or 8 individuals in the labor force. Within the labor force, the 30 to 34 years age range has the highest percentage of unemployed individuals, with 100.0% or 9 of them being unemployed.
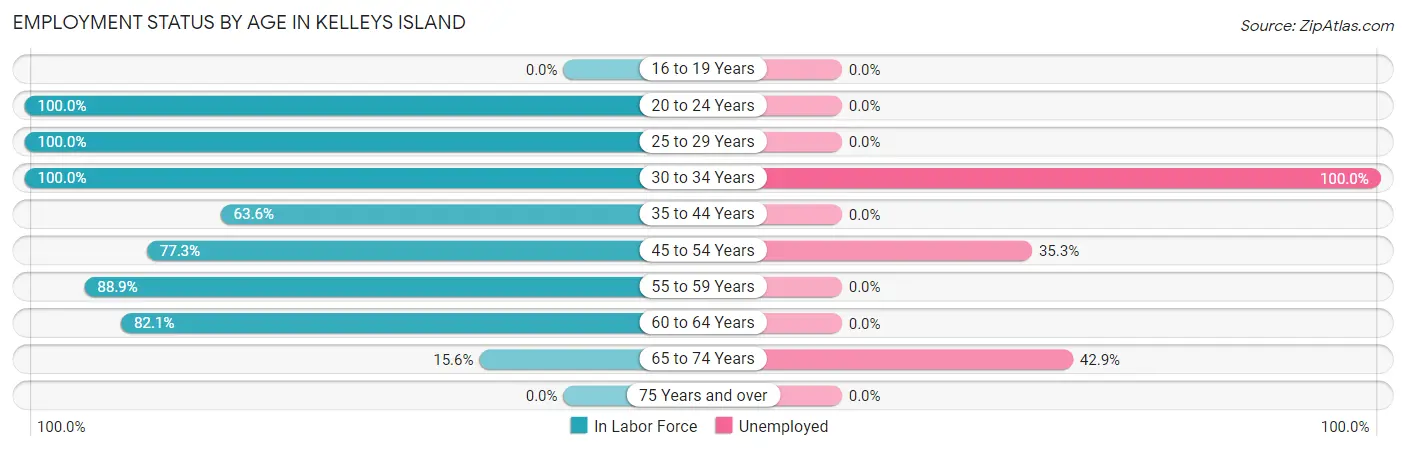
| Age Bracket | In Labor Force | Unemployed |
| 16 to 19 Years | 0 (0.0%) | 0 (0.0%) |
| 20 to 24 Years | 8 (100.0%) | 0 (0.0%) |
| 25 to 29 Years | 18 (100.0%) | 0 (0.0%) |
| 30 to 34 Years | 9 (100.0%) | 9 (100.0%) |
| 35 to 44 Years | 7 (63.6%) | 0 (0.0%) |
| 45 to 54 Years | 17 (77.3%) | 6 (35.3%) |
| 55 to 59 Years | 8 (88.9%) | 0 (0.0%) |
| 60 to 64 Years | 23 (82.1%) | 0 (0.0%) |
| 65 to 74 Years | 14 (15.6%) | 6 (42.9%) |
| 75 Years and over | 0 (0.0%) | 0 (0.0%) |
| Total | 104 (47.9%) | 21 (20.2%) |
Employment Status by Educational Attainment in Kelleys Island
According to labor force statistics for Kelleys Island, 84.5% of individuals (82) out of the total population between 25 and 64 years of age (97) are in the labor force, with 18.3% or 15 of them being unemployed. The group with the highest labor force participation rate are those with the educational attainment of less than high school, with 100.0% or 5 individuals in the labor force. Within the labor force, individuals with less than high school education have the highest percentage of unemployment, with 60.0% or 3 of them being unemployed.
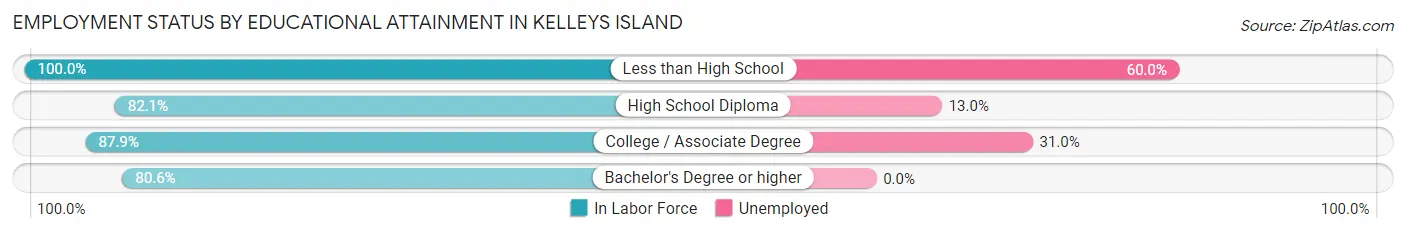
| Educational Attainment | In Labor Force | Unemployed |
| Less than High School | 5 (100.0%) | 3 (60.0%) |
| High School Diploma | 23 (82.1%) | 4 (13.0%) |
| College / Associate Degree | 29 (87.9%) | 10 (31.0%) |
| Bachelor's Degree or higher | 25 (80.6%) | 0 (0.0%) |
| Total | 82 (84.5%) | 18 (18.3%) |
Employment Occupations by Sex in Kelleys Island
Management, Business, Science and Arts Occupations
The most common Management, Business, Science and Arts occupations in Kelleys Island are Management (26 | 31.3%), Business & Financial (13 | 15.7%), Health Diagnosing & Treating (4 | 4.8%), Computers, Engineering & Science (2 | 2.4%), and Life, Physical & Social Science (2 | 2.4%).
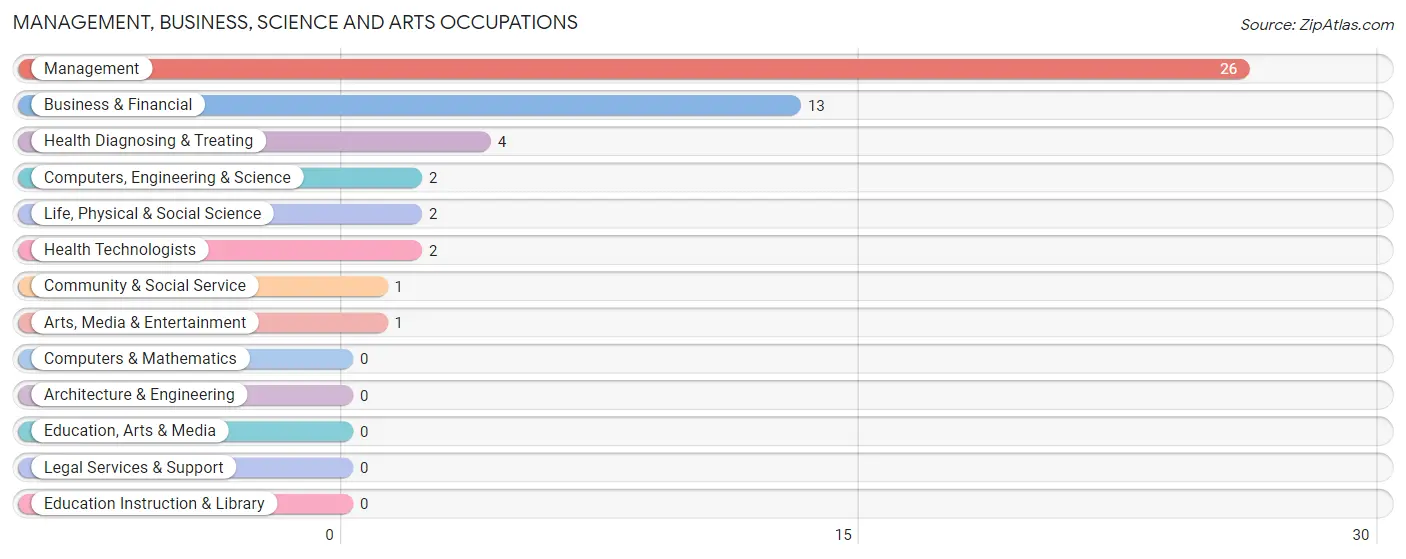
Management, Business, Science and Arts Occupations by Sex
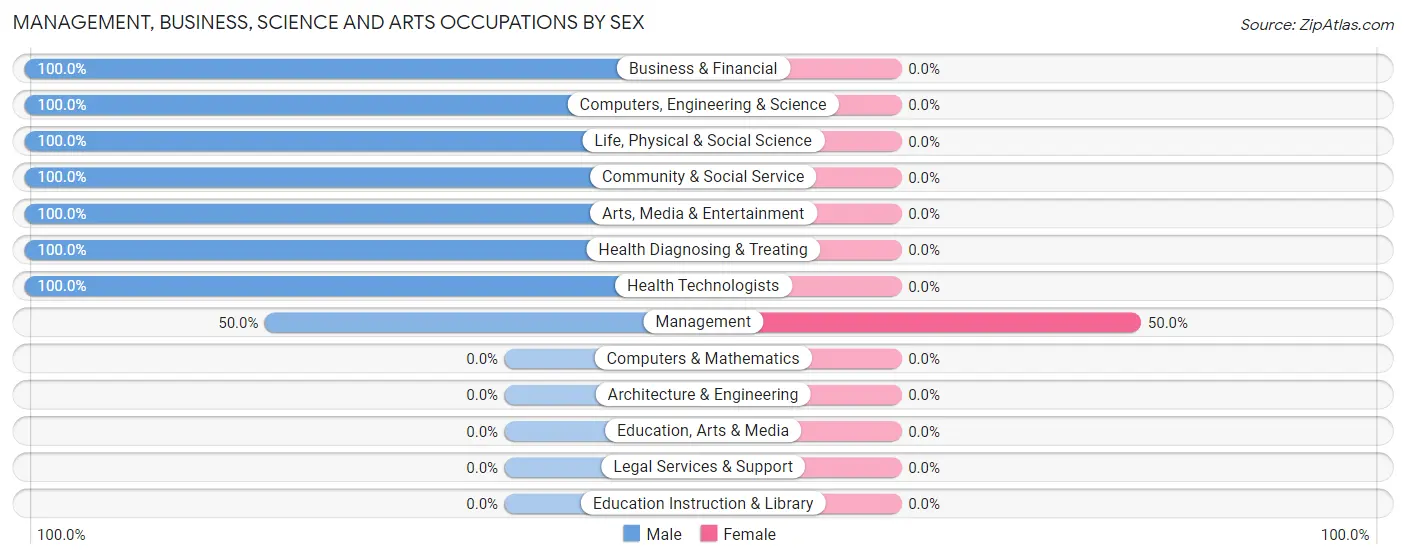
| Occupation | Male | Female |
| Management | 13 (50.0%) | 13 (50.0%) |
| Business & Financial | 13 (100.0%) | 0 (0.0%) |
| Computers, Engineering & Science | 2 (100.0%) | 0 (0.0%) |
| Computers & Mathematics | 0 (0.0%) | 0 (0.0%) |
| Architecture & Engineering | 0 (0.0%) | 0 (0.0%) |
| Life, Physical & Social Science | 2 (100.0%) | 0 (0.0%) |
| Community & Social Service | 1 (100.0%) | 0 (0.0%) |
| Education, Arts & Media | 0 (0.0%) | 0 (0.0%) |
| Legal Services & Support | 0 (0.0%) | 0 (0.0%) |
| Education Instruction & Library | 0 (0.0%) | 0 (0.0%) |
| Arts, Media & Entertainment | 1 (100.0%) | 0 (0.0%) |
| Health Diagnosing & Treating | 4 (100.0%) | 0 (0.0%) |
| Health Technologists | 2 (100.0%) | 0 (0.0%) |
| Total (Category) | 33 (71.7%) | 13 (28.3%) |
| Total (Overall) | 58 (69.9%) | 25 (30.1%) |
Services Occupations
The most common Services occupations in Kelleys Island are Food Preparation & Serving (2 | 2.4%), and Personal Care & Service (2 | 2.4%).
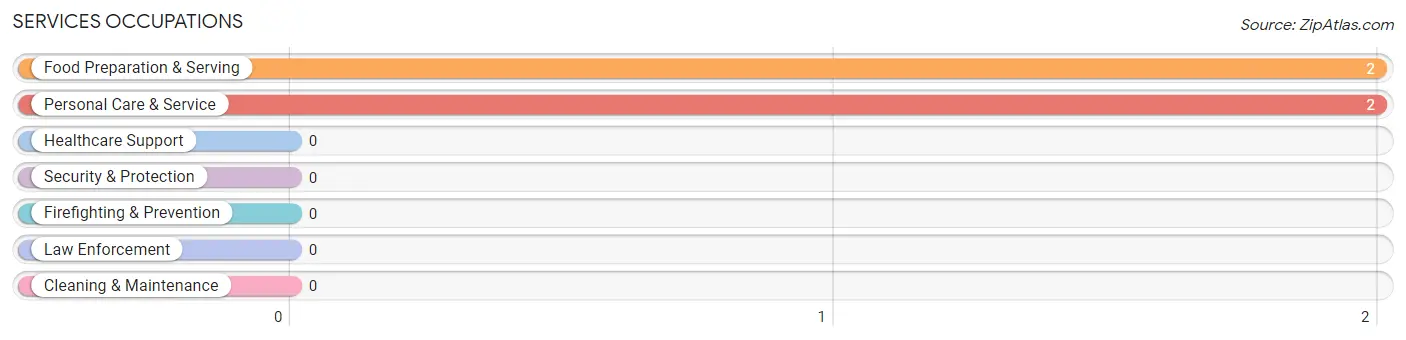
Services Occupations by Sex
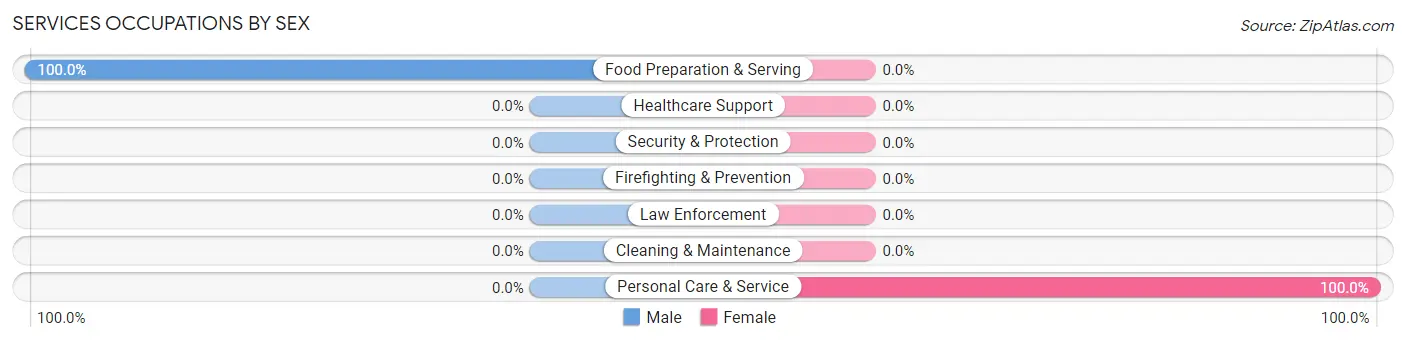
| Occupation | Male | Female |
| Healthcare Support | 0 (0.0%) | 0 (0.0%) |
| Security & Protection | 0 (0.0%) | 0 (0.0%) |
| Firefighting & Prevention | 0 (0.0%) | 0 (0.0%) |
| Law Enforcement | 0 (0.0%) | 0 (0.0%) |
| Food Preparation & Serving | 2 (100.0%) | 0 (0.0%) |
| Cleaning & Maintenance | 0 (0.0%) | 0 (0.0%) |
| Personal Care & Service | 0 (0.0%) | 2 (100.0%) |
| Total (Category) | 2 (50.0%) | 2 (50.0%) |
| Total (Overall) | 58 (69.9%) | 25 (30.1%) |
Sales and Office Occupations
The most common Sales and Office occupations in Kelleys Island are Sales & Related (10 | 12.0%), and Office & Administration (4 | 4.8%).
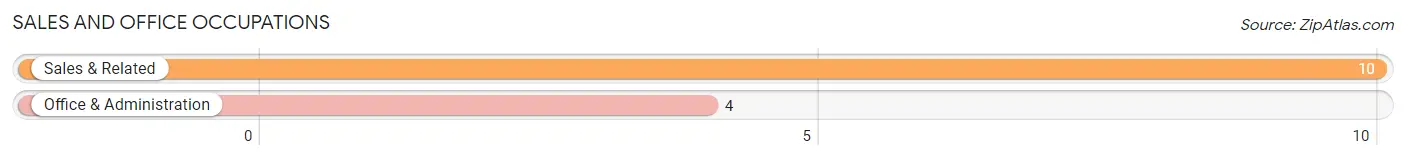
Sales and Office Occupations by Sex
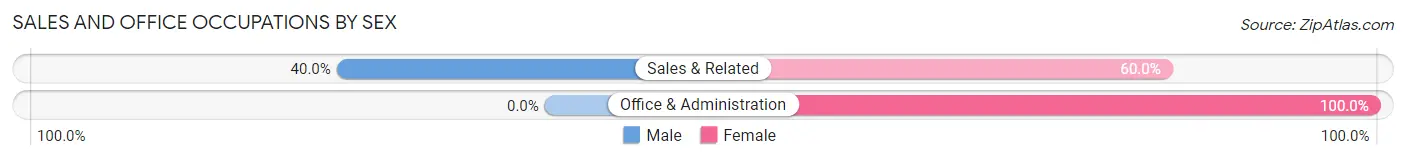
| Occupation | Male | Female |
| Sales & Related | 4 (40.0%) | 6 (60.0%) |
| Office & Administration | 0 (0.0%) | 4 (100.0%) |
| Total (Category) | 4 (28.6%) | 10 (71.4%) |
| Total (Overall) | 58 (69.9%) | 25 (30.1%) |
Natural Resources, Construction and Maintenance Occupations
The most common Natural Resources, Construction and Maintenance occupations in Kelleys Island are Installation, Maintenance & Repair (3 | 3.6%), and Construction & Extraction (2 | 2.4%).
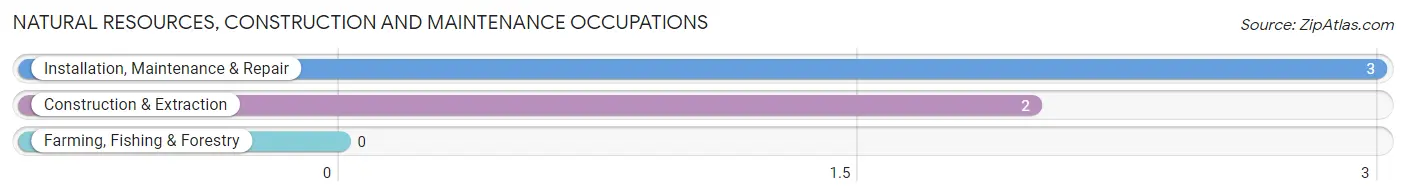
Natural Resources, Construction and Maintenance Occupations by Sex
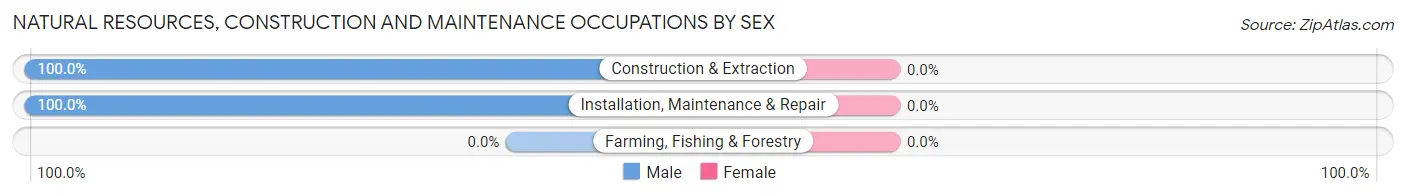
| Occupation | Male | Female |
| Farming, Fishing & Forestry | 0 (0.0%) | 0 (0.0%) |
| Construction & Extraction | 2 (100.0%) | 0 (0.0%) |
| Installation, Maintenance & Repair | 3 (100.0%) | 0 (0.0%) |
| Total (Category) | 5 (100.0%) | 0 (0.0%) |
| Total (Overall) | 58 (69.9%) | 25 (30.1%) |
Production, Transportation and Moving Occupations
The most common Production, Transportation and Moving occupations in Kelleys Island are Production (7 | 8.4%), and Transportation (7 | 8.4%).
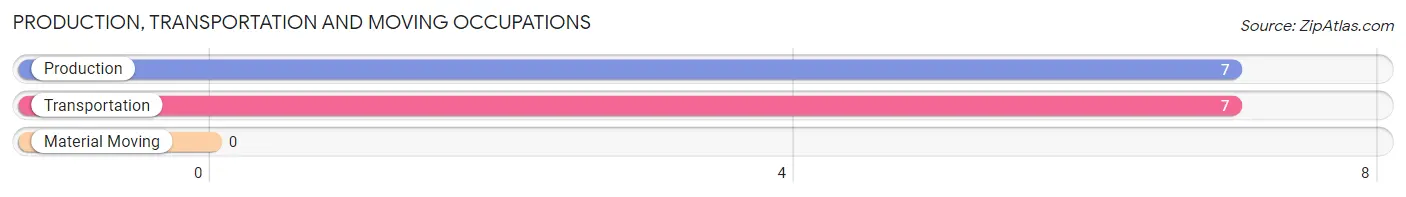
Production, Transportation and Moving Occupations by Sex
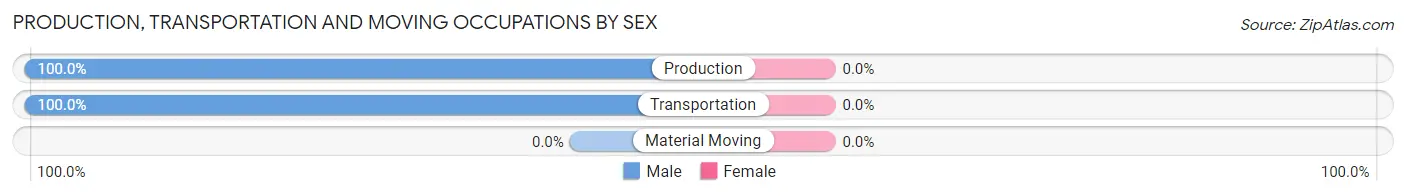
| Occupation | Male | Female |
| Production | 7 (100.0%) | 0 (0.0%) |
| Transportation | 7 (100.0%) | 0 (0.0%) |
| Material Moving | 0 (0.0%) | 0 (0.0%) |
| Total (Category) | 14 (100.0%) | 0 (0.0%) |
| Total (Overall) | 58 (69.9%) | 25 (30.1%) |
Employment Industries by Sex in Kelleys Island
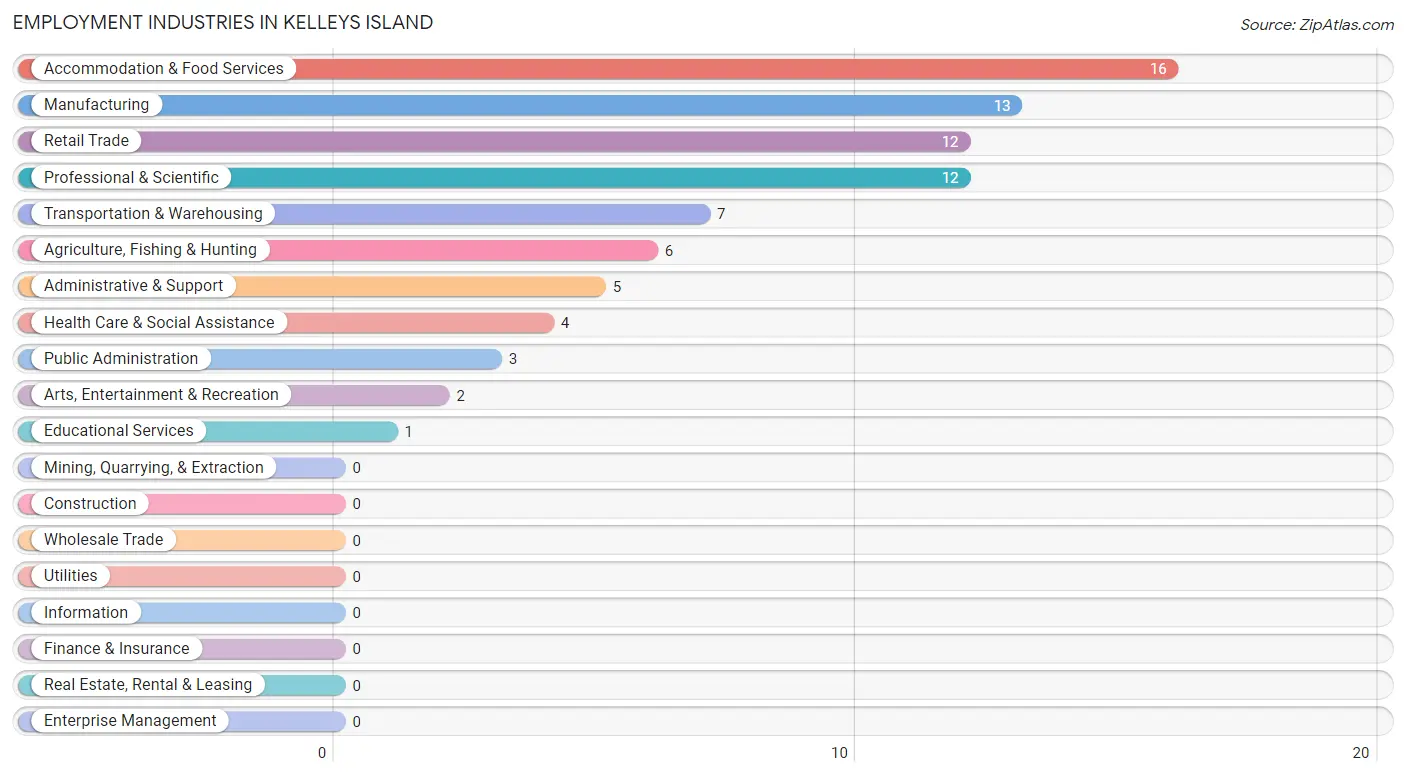
Employment Industries in Kelleys Island
The major employment industries in Kelleys Island include Accommodation & Food Services (16 | 19.3%), Manufacturing (13 | 15.7%), Retail Trade (12 | 14.5%), Professional & Scientific (12 | 14.5%), and Transportation & Warehousing (7 | 8.4%).
Employment Industries by Sex in Kelleys Island
The Kelleys Island industries that see more men than women are Educational Services (100.0%), Health Care & Social Assistance (100.0%), and Professional & Scientific (91.7%), whereas the industries that tend to have a higher number of women are Agriculture, Fishing & Hunting (100.0%), Arts, Entertainment & Recreation (50.0%), and Transportation & Warehousing (42.9%).
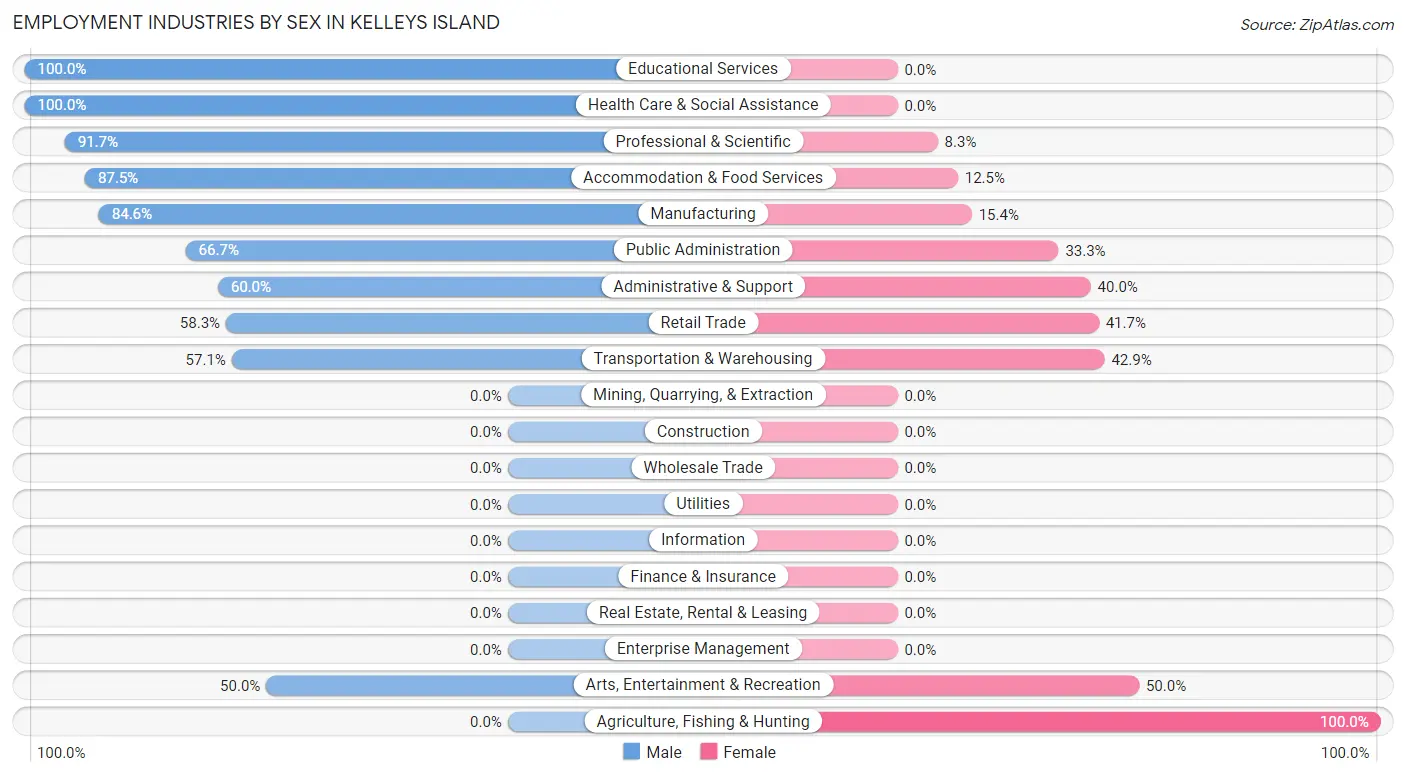
| Industry | Male | Female |
| Agriculture, Fishing & Hunting | 0 (0.0%) | 6 (100.0%) |
| Mining, Quarrying, & Extraction | 0 (0.0%) | 0 (0.0%) |
| Construction | 0 (0.0%) | 0 (0.0%) |
| Manufacturing | 11 (84.6%) | 2 (15.4%) |
| Wholesale Trade | 0 (0.0%) | 0 (0.0%) |
| Retail Trade | 7 (58.3%) | 5 (41.7%) |
| Transportation & Warehousing | 4 (57.1%) | 3 (42.9%) |
| Utilities | 0 (0.0%) | 0 (0.0%) |
| Information | 0 (0.0%) | 0 (0.0%) |
| Finance & Insurance | 0 (0.0%) | 0 (0.0%) |
| Real Estate, Rental & Leasing | 0 (0.0%) | 0 (0.0%) |
| Professional & Scientific | 11 (91.7%) | 1 (8.3%) |
| Enterprise Management | 0 (0.0%) | 0 (0.0%) |
| Administrative & Support | 3 (60.0%) | 2 (40.0%) |
| Educational Services | 1 (100.0%) | 0 (0.0%) |
| Health Care & Social Assistance | 4 (100.0%) | 0 (0.0%) |
| Arts, Entertainment & Recreation | 1 (50.0%) | 1 (50.0%) |
| Accommodation & Food Services | 14 (87.5%) | 2 (12.5%) |
| Public Administration | 2 (66.7%) | 1 (33.3%) |
| Total | 58 (69.9%) | 25 (30.1%) |
Education in Kelleys Island
School Enrollment in Kelleys Island
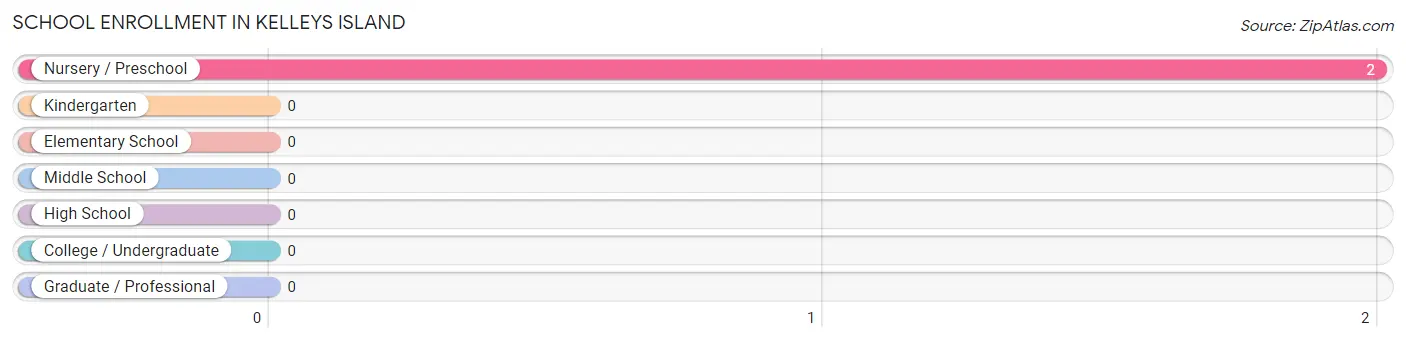
| School Level | # Students | % Students |
| Nursery / Preschool | 2 | 100.0% |
| Kindergarten | 0 | 0.0% |
| Elementary School | 0 | 0.0% |
| Middle School | 0 | 0.0% |
| High School | 0 | 0.0% |
| College / Undergraduate | 0 | 0.0% |
| Graduate / Professional | 0 | 0.0% |
| Total | 2 | 100.0% |
School Enrollment by Age by Funding Source in Kelleys Island
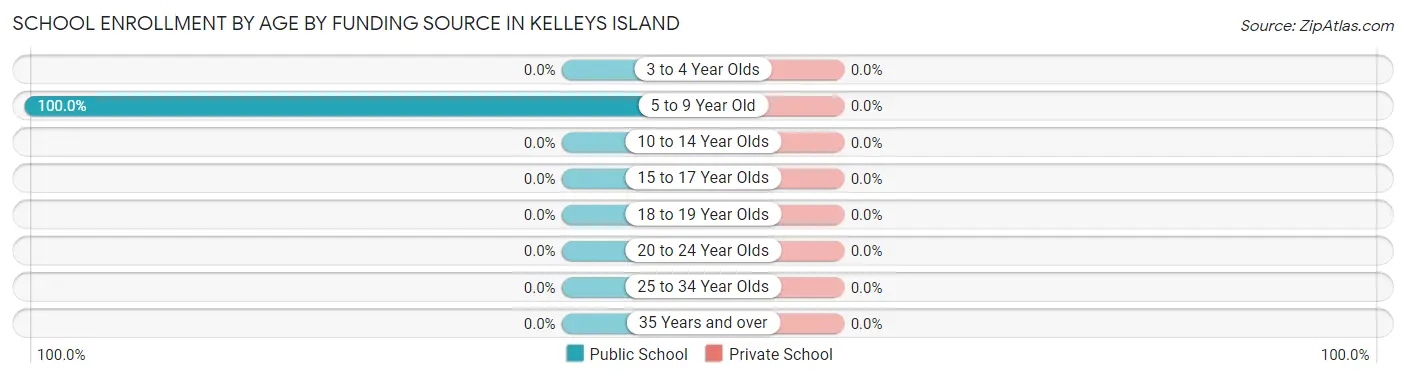
| Age Bracket | Public School | Private School |
| 3 to 4 Year Olds | 0 (0.0%) | 0 (0.0%) |
| 5 to 9 Year Old | 2 (100.0%) | 0 (0.0%) |
| 10 to 14 Year Olds | 0 (0.0%) | 0 (0.0%) |
| 15 to 17 Year Olds | 0 (0.0%) | 0 (0.0%) |
| 18 to 19 Year Olds | 0 (0.0%) | 0 (0.0%) |
| 20 to 24 Year Olds | 0 (0.0%) | 0 (0.0%) |
| 25 to 34 Year Olds | 0 (0.0%) | 0 (0.0%) |
| 35 Years and over | 0 (0.0%) | 0 (0.0%) |
| Total | 2 (100.0%) | 0 (0.0%) |
Educational Attainment by Field of Study in Kelleys Island
Education (33 | 34.0%), business (26 | 26.8%), arts & humanities (13 | 13.4%), science & technology (7 | 7.2%), and bio, nature & agricultural (5 | 5.1%) are the most common fields of study among 97 individuals in Kelleys Island who have obtained a bachelor's degree or higher.
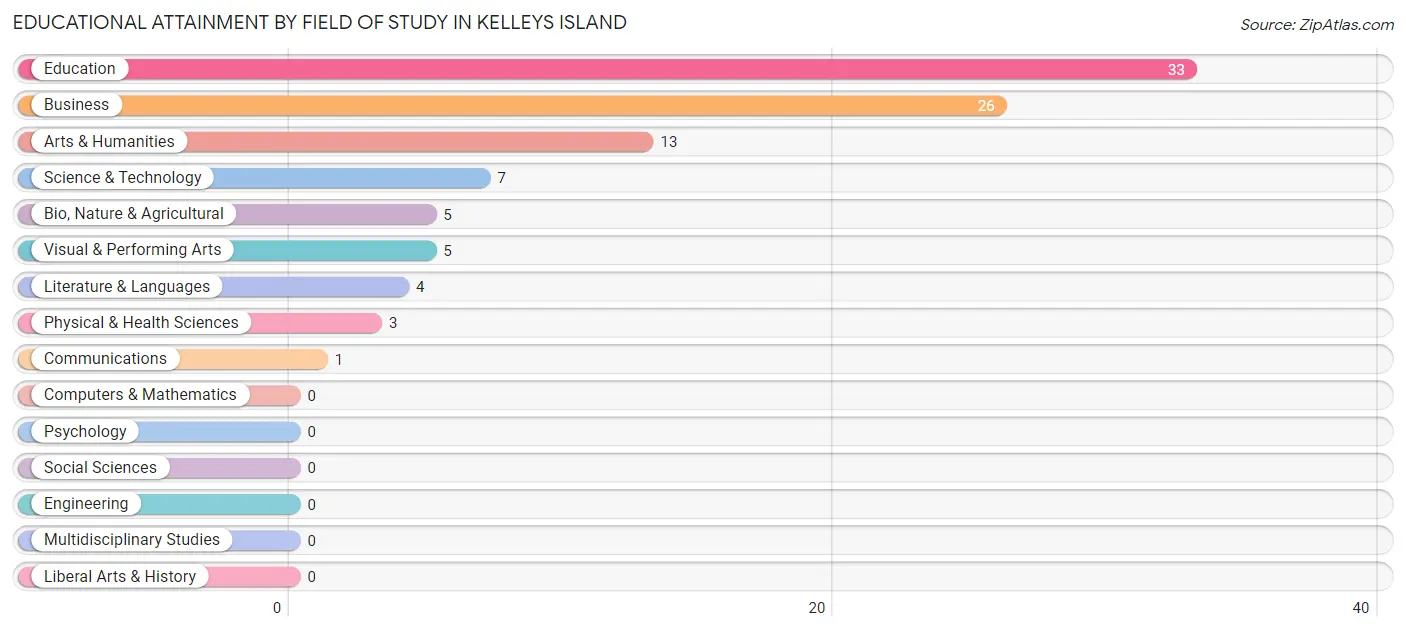
| Field of Study | # Graduates | % Graduates |
| Computers & Mathematics | 0 | 0.0% |
| Bio, Nature & Agricultural | 5 | 5.1% |
| Physical & Health Sciences | 3 | 3.1% |
| Psychology | 0 | 0.0% |
| Social Sciences | 0 | 0.0% |
| Engineering | 0 | 0.0% |
| Multidisciplinary Studies | 0 | 0.0% |
| Science & Technology | 7 | 7.2% |
| Business | 26 | 26.8% |
| Education | 33 | 34.0% |
| Literature & Languages | 4 | 4.1% |
| Liberal Arts & History | 0 | 0.0% |
| Visual & Performing Arts | 5 | 5.1% |
| Communications | 1 | 1.0% |
| Arts & Humanities | 13 | 13.4% |
| Total | 97 | 100.0% |
Transportation & Commute in Kelleys Island
Vehicle Availability by Sex in Kelleys Island
The most prevalent vehicle ownership categories in Kelleys Island are males with 3 vehicles (25, accounting for 43.1%) and females with 3 vehicles (7, making up 100.0%).
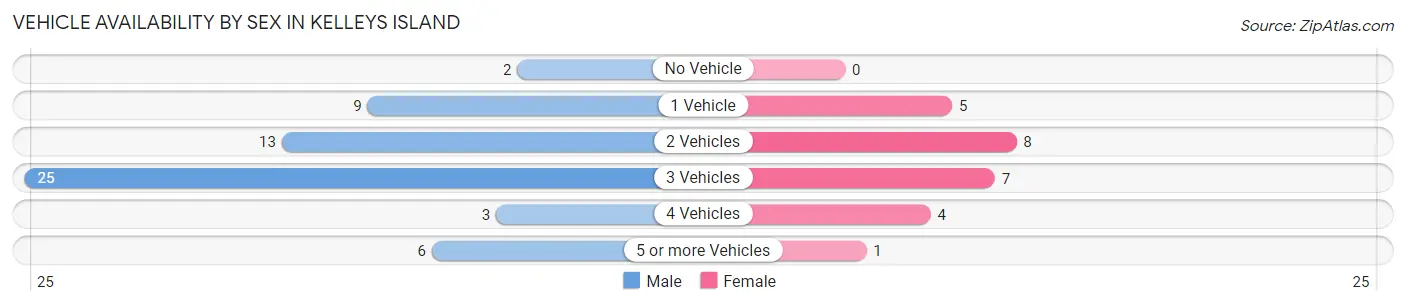
| Vehicles Available | Male | Female |
| No Vehicle | 2 (3.5%) | 0 (0.0%) |
| 1 Vehicle | 9 (15.5%) | 5 (20.0%) |
| 2 Vehicles | 13 (22.4%) | 8 (32.0%) |
| 3 Vehicles | 25 (43.1%) | 7 (28.0%) |
| 4 Vehicles | 3 (5.2%) | 4 (16.0%) |
| 5 or more Vehicles | 6 (10.3%) | 1 (4.0%) |
| Total | 58 (100.0%) | 25 (100.0%) |
Commute Time in Kelleys Island
The most frequently occuring commute durations in Kelleys Island are 5 to 9 minutes (21 commuters, 31.8%), less than 5 minutes (16 commuters, 24.2%), and 10 to 14 minutes (12 commuters, 18.2%).
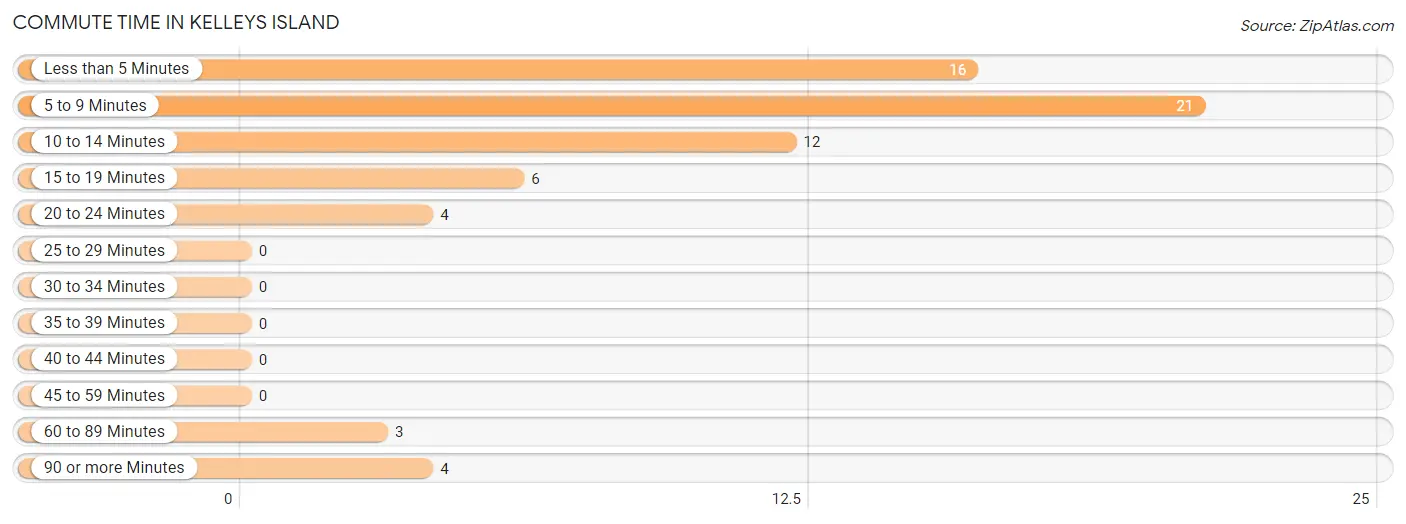
| Commute Time | # Commuters | % Commuters |
| Less than 5 Minutes | 16 | 24.2% |
| 5 to 9 Minutes | 21 | 31.8% |
| 10 to 14 Minutes | 12 | 18.2% |
| 15 to 19 Minutes | 6 | 9.1% |
| 20 to 24 Minutes | 4 | 6.1% |
| 25 to 29 Minutes | 0 | 0.0% |
| 30 to 34 Minutes | 0 | 0.0% |
| 35 to 39 Minutes | 0 | 0.0% |
| 40 to 44 Minutes | 0 | 0.0% |
| 45 to 59 Minutes | 0 | 0.0% |
| 60 to 89 Minutes | 3 | 4.5% |
| 90 or more Minutes | 4 | 6.1% |
Commute Time by Sex in Kelleys Island
The most common commute times in Kelleys Island are 5 to 9 minutes (14 commuters, 29.2%) for males and 5 to 9 minutes (7 commuters, 38.9%) for females.
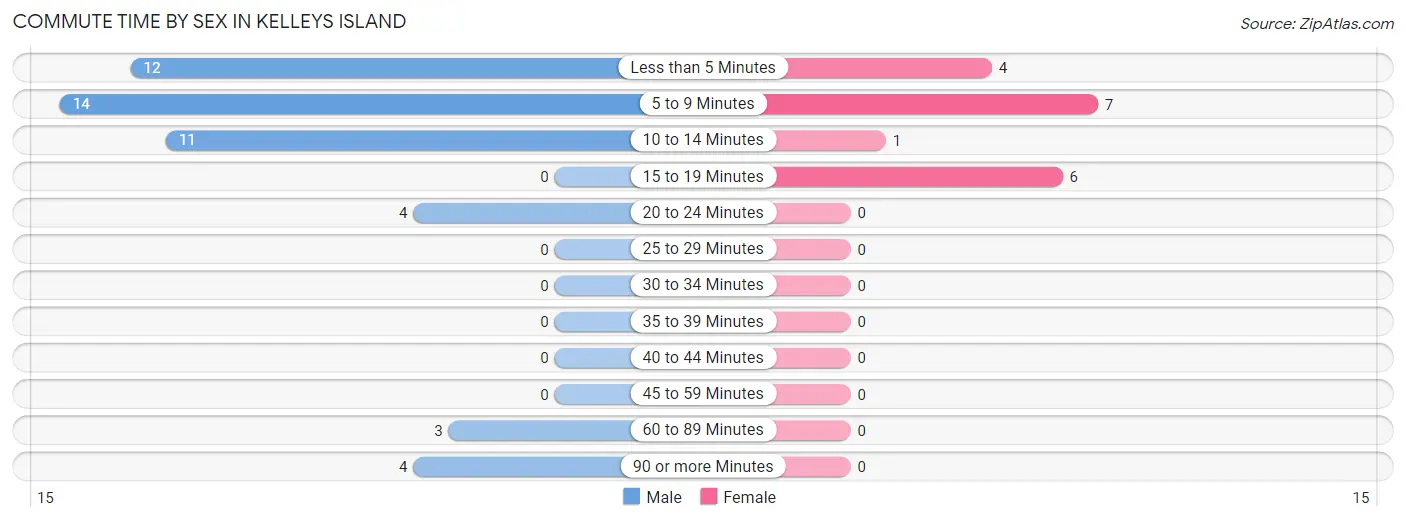
| Commute Time | Male | Female |
| Less than 5 Minutes | 12 (25.0%) | 4 (22.2%) |
| 5 to 9 Minutes | 14 (29.2%) | 7 (38.9%) |
| 10 to 14 Minutes | 11 (22.9%) | 1 (5.6%) |
| 15 to 19 Minutes | 0 (0.0%) | 6 (33.3%) |
| 20 to 24 Minutes | 4 (8.3%) | 0 (0.0%) |
| 25 to 29 Minutes | 0 (0.0%) | 0 (0.0%) |
| 30 to 34 Minutes | 0 (0.0%) | 0 (0.0%) |
| 35 to 39 Minutes | 0 (0.0%) | 0 (0.0%) |
| 40 to 44 Minutes | 0 (0.0%) | 0 (0.0%) |
| 45 to 59 Minutes | 0 (0.0%) | 0 (0.0%) |
| 60 to 89 Minutes | 3 (6.2%) | 0 (0.0%) |
| 90 or more Minutes | 4 (8.3%) | 0 (0.0%) |
Time of Departure to Work by Sex in Kelleys Island
The most frequent times of departure to work in Kelleys Island are 9:00 AM to 9:59 AM (16, 33.3%) for males and 7:30 AM to 7:59 AM (7, 38.9%) for females.
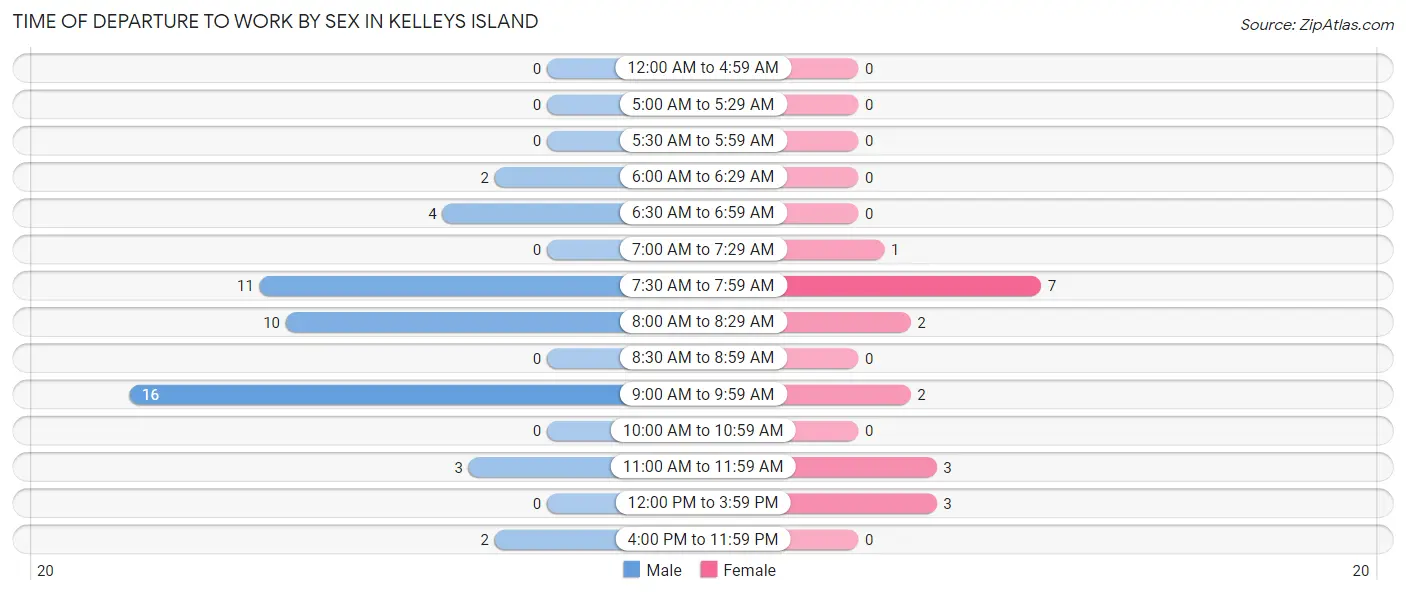
| Time of Departure | Male | Female |
| 12:00 AM to 4:59 AM | 0 (0.0%) | 0 (0.0%) |
| 5:00 AM to 5:29 AM | 0 (0.0%) | 0 (0.0%) |
| 5:30 AM to 5:59 AM | 0 (0.0%) | 0 (0.0%) |
| 6:00 AM to 6:29 AM | 2 (4.2%) | 0 (0.0%) |
| 6:30 AM to 6:59 AM | 4 (8.3%) | 0 (0.0%) |
| 7:00 AM to 7:29 AM | 0 (0.0%) | 1 (5.6%) |
| 7:30 AM to 7:59 AM | 11 (22.9%) | 7 (38.9%) |
| 8:00 AM to 8:29 AM | 10 (20.8%) | 2 (11.1%) |
| 8:30 AM to 8:59 AM | 0 (0.0%) | 0 (0.0%) |
| 9:00 AM to 9:59 AM | 16 (33.3%) | 2 (11.1%) |
| 10:00 AM to 10:59 AM | 0 (0.0%) | 0 (0.0%) |
| 11:00 AM to 11:59 AM | 3 (6.2%) | 3 (16.7%) |
| 12:00 PM to 3:59 PM | 0 (0.0%) | 3 (16.7%) |
| 4:00 PM to 11:59 PM | 2 (4.2%) | 0 (0.0%) |
| Total | 48 (100.0%) | 18 (100.0%) |
Housing Occupancy in Kelleys Island
Occupancy by Ownership in Kelleys Island
Of the total 117 dwellings in Kelleys Island, owner-occupied units account for 111 (94.9%), while renter-occupied units make up 6 (5.1%).
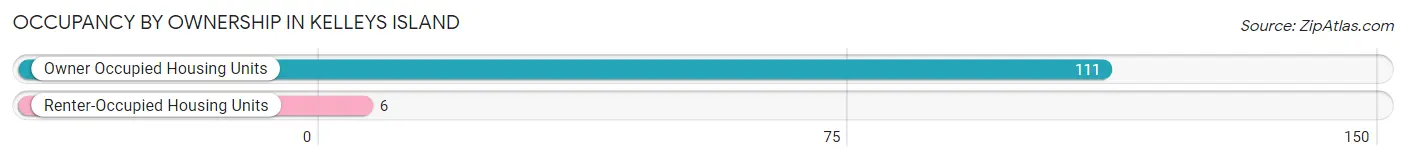
| Occupancy | # Housing Units | % Housing Units |
| Owner Occupied Housing Units | 111 | 94.9% |
| Renter-Occupied Housing Units | 6 | 5.1% |
| Total Occupied Housing Units | 117 | 100.0% |
Occupancy by Household Size in Kelleys Island
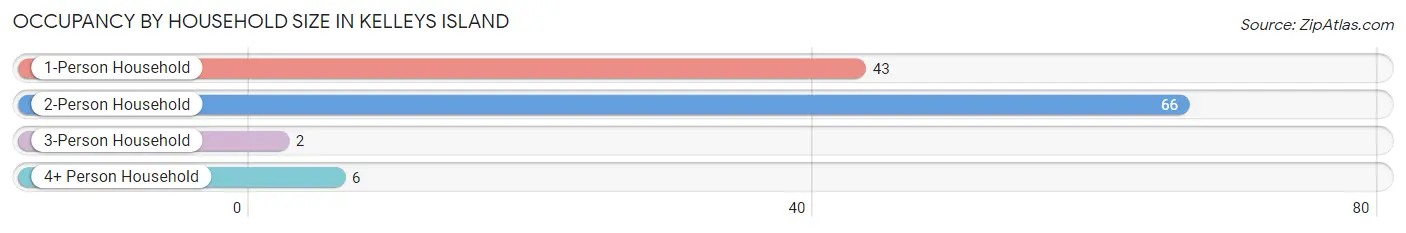
| Household Size | # Housing Units | % Housing Units |
| 1-Person Household | 43 | 36.7% |
| 2-Person Household | 66 | 56.4% |
| 3-Person Household | 2 | 1.7% |
| 4+ Person Household | 6 | 5.1% |
| Total Housing Units | 117 | 100.0% |
Occupancy by Ownership by Household Size in Kelleys Island
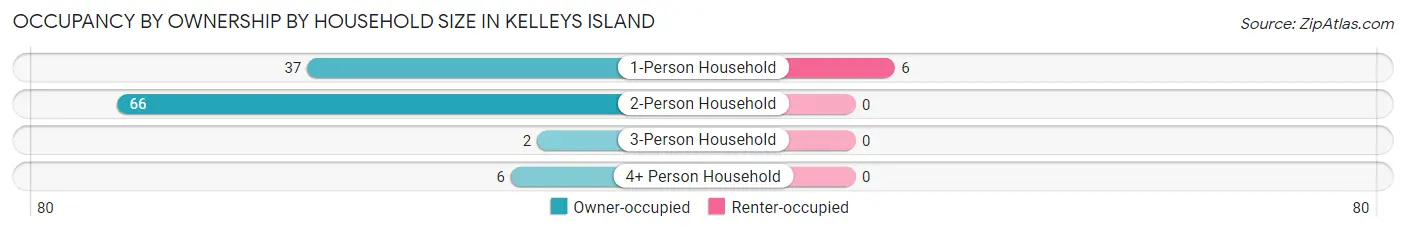
| Household Size | Owner-occupied | Renter-occupied |
| 1-Person Household | 37 (86.1%) | 6 (14.0%) |
| 2-Person Household | 66 (100.0%) | 0 (0.0%) |
| 3-Person Household | 2 (100.0%) | 0 (0.0%) |
| 4+ Person Household | 6 (100.0%) | 0 (0.0%) |
| Total Housing Units | 111 (94.9%) | 6 (5.1%) |
Occupancy by Educational Attainment in Kelleys Island
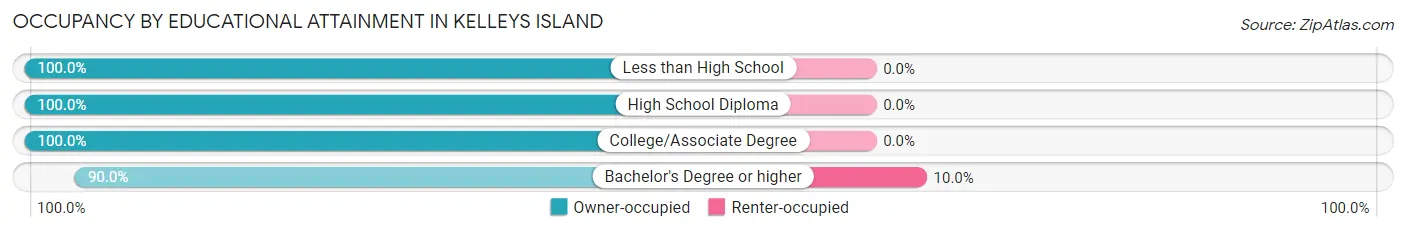
| Household Size | Owner-occupied | Renter-occupied |
| Less than High School | 2 (100.0%) | 0 (0.0%) |
| High School Diploma | 10 (100.0%) | 0 (0.0%) |
| College/Associate Degree | 45 (100.0%) | 0 (0.0%) |
| Bachelor's Degree or higher | 54 (90.0%) | 6 (10.0%) |
Occupancy by Age of Householder in Kelleys Island
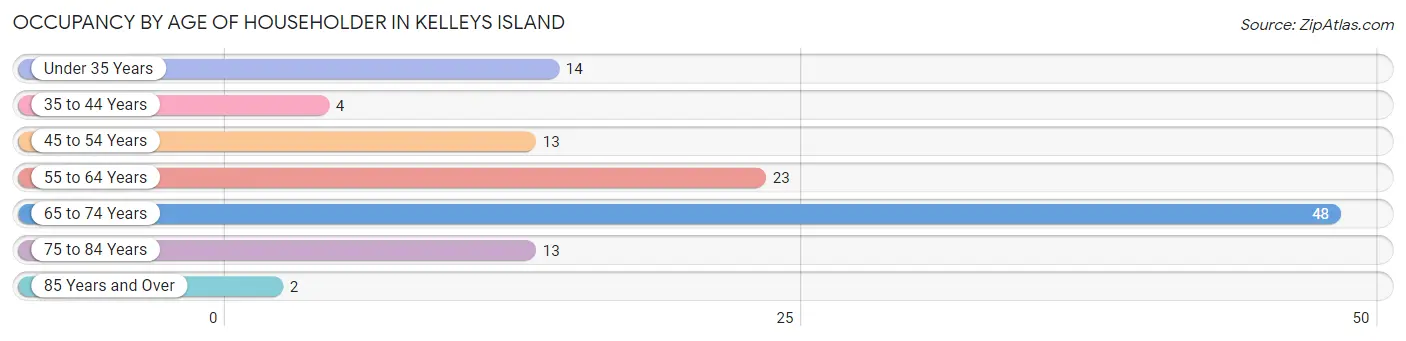
| Age Bracket | # Households | % Households |
| Under 35 Years | 14 | 12.0% |
| 35 to 44 Years | 4 | 3.4% |
| 45 to 54 Years | 13 | 11.1% |
| 55 to 64 Years | 23 | 19.7% |
| 65 to 74 Years | 48 | 41.0% |
| 75 to 84 Years | 13 | 11.1% |
| 85 Years and Over | 2 | 1.7% |
| Total | 117 | 100.0% |
Housing Finances in Kelleys Island
Median Income by Occupancy in Kelleys Island
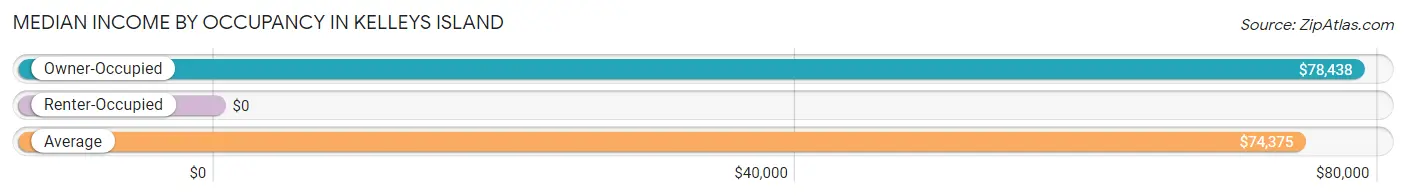
| Occupancy Type | # Households | Median Income |
| Owner-Occupied | 111 (94.9%) | $78,438 |
| Renter-Occupied | 6 (5.1%) | $0 |
| Average | 117 (100.0%) | $74,375 |
Occupancy by Householder Income Bracket in Kelleys Island
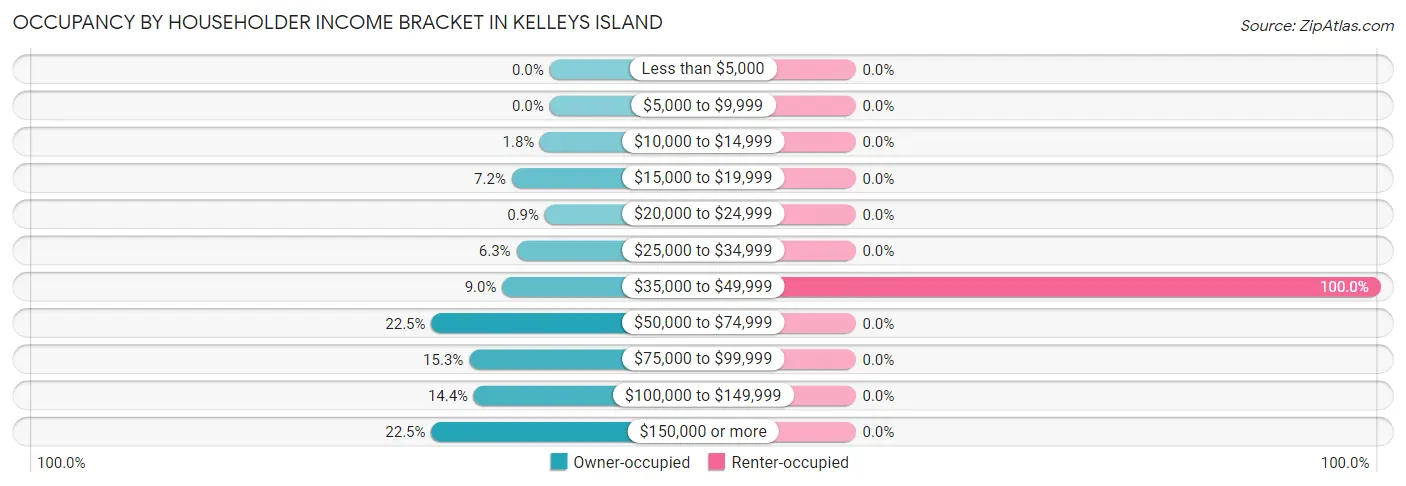
| Income Bracket | Owner-occupied | Renter-occupied |
| Less than $5,000 | 0 (0.0%) | 0 (0.0%) |
| $5,000 to $9,999 | 0 (0.0%) | 0 (0.0%) |
| $10,000 to $14,999 | 2 (1.8%) | 0 (0.0%) |
| $15,000 to $19,999 | 8 (7.2%) | 0 (0.0%) |
| $20,000 to $24,999 | 1 (0.9%) | 0 (0.0%) |
| $25,000 to $34,999 | 7 (6.3%) | 0 (0.0%) |
| $35,000 to $49,999 | 10 (9.0%) | 6 (100.0%) |
| $50,000 to $74,999 | 25 (22.5%) | 0 (0.0%) |
| $75,000 to $99,999 | 17 (15.3%) | 0 (0.0%) |
| $100,000 to $149,999 | 16 (14.4%) | 0 (0.0%) |
| $150,000 or more | 25 (22.5%) | 0 (0.0%) |
| Total | 111 (100.0%) | 6 (100.0%) |
Monthly Housing Cost Tiers in Kelleys Island
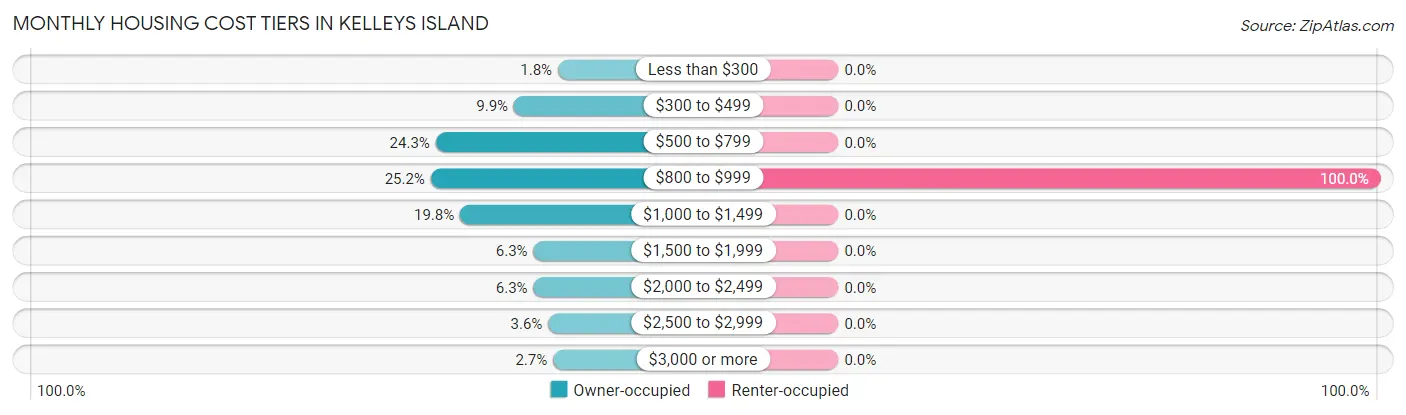
| Monthly Cost | Owner-occupied | Renter-occupied |
| Less than $300 | 2 (1.8%) | 0 (0.0%) |
| $300 to $499 | 11 (9.9%) | 0 (0.0%) |
| $500 to $799 | 27 (24.3%) | 0 (0.0%) |
| $800 to $999 | 28 (25.2%) | 6 (100.0%) |
| $1,000 to $1,499 | 22 (19.8%) | 0 (0.0%) |
| $1,500 to $1,999 | 7 (6.3%) | 0 (0.0%) |
| $2,000 to $2,499 | 7 (6.3%) | 0 (0.0%) |
| $2,500 to $2,999 | 4 (3.6%) | 0 (0.0%) |
| $3,000 or more | 3 (2.7%) | 0 (0.0%) |
| Total | 111 (100.0%) | 6 (100.0%) |
Physical Housing Characteristics in Kelleys Island
Housing Structures in Kelleys Island
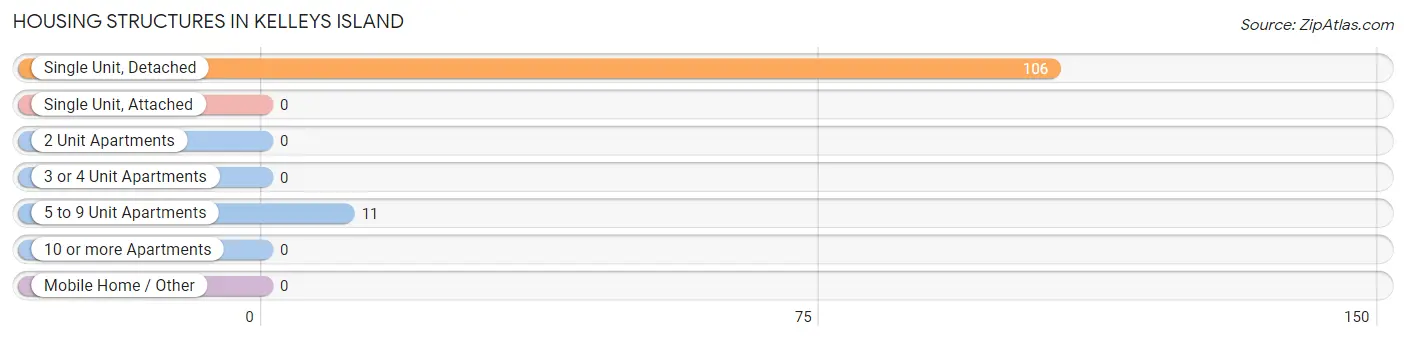
| Structure Type | # Housing Units | % Housing Units |
| Single Unit, Detached | 106 | 90.6% |
| Single Unit, Attached | 0 | 0.0% |
| 2 Unit Apartments | 0 | 0.0% |
| 3 or 4 Unit Apartments | 0 | 0.0% |
| 5 to 9 Unit Apartments | 11 | 9.4% |
| 10 or more Apartments | 0 | 0.0% |
| Mobile Home / Other | 0 | 0.0% |
| Total | 117 | 100.0% |
Housing Structures by Occupancy in Kelleys Island
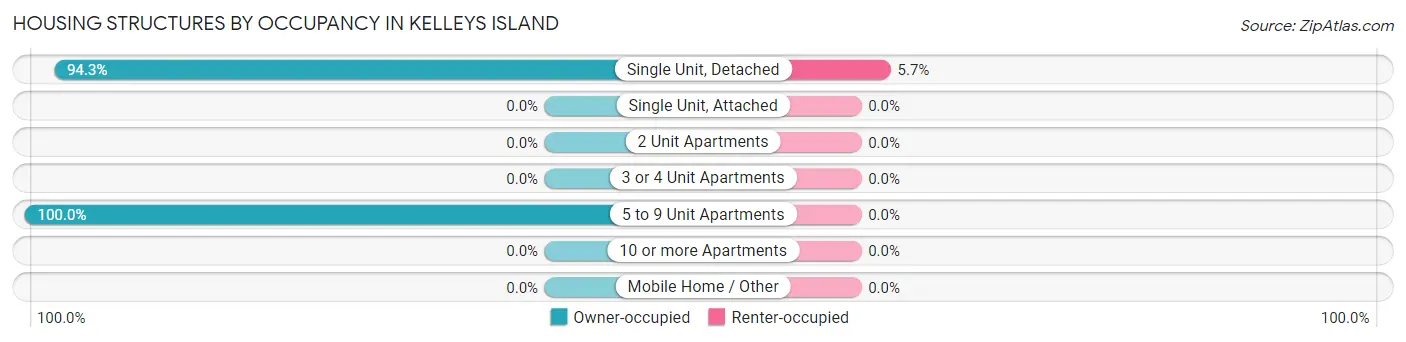
| Structure Type | Owner-occupied | Renter-occupied |
| Single Unit, Detached | 100 (94.3%) | 6 (5.7%) |
| Single Unit, Attached | 0 (0.0%) | 0 (0.0%) |
| 2 Unit Apartments | 0 (0.0%) | 0 (0.0%) |
| 3 or 4 Unit Apartments | 0 (0.0%) | 0 (0.0%) |
| 5 to 9 Unit Apartments | 11 (100.0%) | 0 (0.0%) |
| 10 or more Apartments | 0 (0.0%) | 0 (0.0%) |
| Mobile Home / Other | 0 (0.0%) | 0 (0.0%) |
| Total | 111 (94.9%) | 6 (5.1%) |
Housing Structures by Number of Rooms in Kelleys Island
| Number of Rooms | Owner-occupied | Renter-occupied |
| 1 Room | 9 (8.1%) | 0 (0.0%) |
| 2 or 3 Rooms | 2 (1.8%) | 0 (0.0%) |
| 4 or 5 Rooms | 30 (27.0%) | 6 (100.0%) |
| 6 or 7 Rooms | 40 (36.0%) | 0 (0.0%) |
| 8 or more Rooms | 30 (27.0%) | 0 (0.0%) |
| Total | 111 (100.0%) | 6 (100.0%) |
Housing Structure by Heating Type in Kelleys Island
| Heating Type | Owner-occupied | Renter-occupied |
| Utility Gas | 2 (1.8%) | 0 (0.0%) |
| Bottled, Tank, or LP Gas | 55 (49.5%) | 0 (0.0%) |
| Electricity | 39 (35.1%) | 6 (100.0%) |
| Fuel Oil or Kerosene | 0 (0.0%) | 0 (0.0%) |
| Coal or Coke | 0 (0.0%) | 0 (0.0%) |
| All other Fuels | 15 (13.5%) | 0 (0.0%) |
| No Fuel Used | 0 (0.0%) | 0 (0.0%) |
| Total | 111 (100.0%) | 6 (100.0%) |
Household Vehicle Usage in Kelleys Island
| Vehicles per Household | Owner-occupied | Renter-occupied |
| No Vehicle | 2 (1.8%) | 0 (0.0%) |
| 1 Vehicle | 45 (40.5%) | 0 (0.0%) |
| 2 Vehicles | 23 (20.7%) | 6 (100.0%) |
| 3 or more Vehicles | 41 (36.9%) | 0 (0.0%) |
| Total | 111 (100.0%) | 6 (100.0%) |
Real Estate & Mortgages in Kelleys Island
Real Estate and Mortgage Overview in Kelleys Island
| Characteristic | Without Mortgage | With Mortgage |
| Housing Units | 69 | 42 |
| Median Property Value | $307,900 | $287,500 |
| Median Household Income | $56,806 | $20 |
| Monthly Housing Costs | $713 | $3 |
| Real Estate Taxes | $3,056 | $0 |
Property Value by Mortgage Status in Kelleys Island
| Property Value | Without Mortgage | With Mortgage |
| Less than $50,000 | 0 (0.0%) | 0 (0.0%) |
| $50,000 to $99,999 | 3 (4.3%) | 2 (4.8%) |
| $100,000 to $299,999 | 30 (43.5%) | 23 (54.8%) |
| $300,000 to $499,999 | 25 (36.2%) | 8 (19.1%) |
| $500,000 to $749,999 | 3 (4.3%) | 3 (7.1%) |
| $750,000 to $999,999 | 1 (1.5%) | 6 (14.3%) |
| $1,000,000 or more | 7 (10.1%) | 0 (0.0%) |
| Total | 69 (100.0%) | 42 (100.0%) |
Household Income by Mortgage Status in Kelleys Island
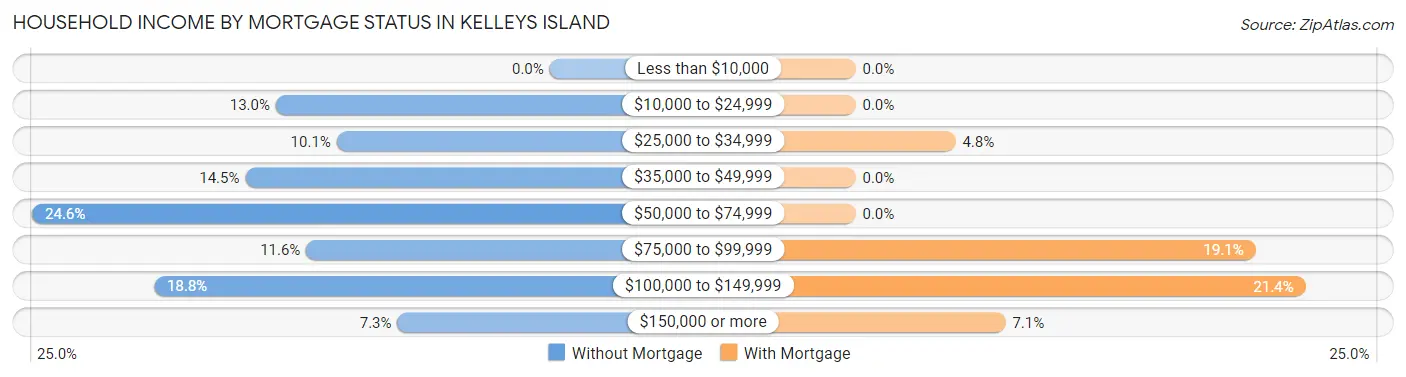
| Household Income | Without Mortgage | With Mortgage |
| Less than $10,000 | 0 (0.0%) | 0 (0.0%) |
| $10,000 to $24,999 | 9 (13.0%) | 0 (0.0%) |
| $25,000 to $34,999 | 7 (10.1%) | 2 (4.8%) |
| $35,000 to $49,999 | 10 (14.5%) | 0 (0.0%) |
| $50,000 to $74,999 | 17 (24.6%) | 0 (0.0%) |
| $75,000 to $99,999 | 8 (11.6%) | 8 (19.1%) |
| $100,000 to $149,999 | 13 (18.8%) | 9 (21.4%) |
| $150,000 or more | 5 (7.2%) | 3 (7.1%) |
| Total | 69 (100.0%) | 42 (100.0%) |
Property Value to Household Income Ratio in Kelleys Island
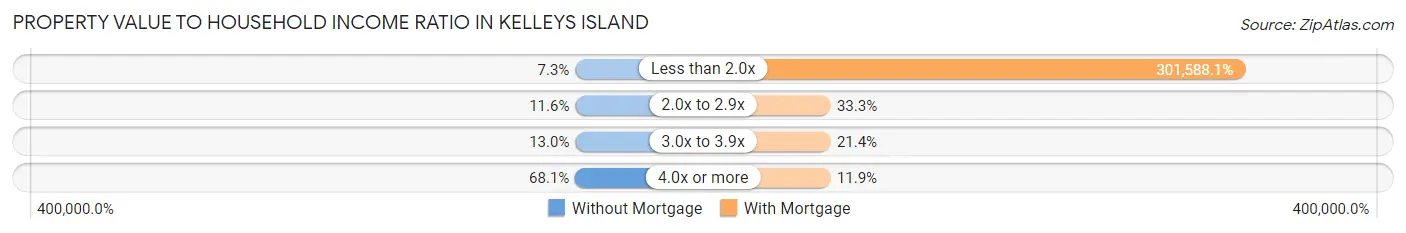
| Value-to-Income Ratio | Without Mortgage | With Mortgage |
| Less than 2.0x | 5 (7.2%) | 126,667 (301,588.1%) |
| 2.0x to 2.9x | 8 (11.6%) | 14 (33.3%) |
| 3.0x to 3.9x | 9 (13.0%) | 9 (21.4%) |
| 4.0x or more | 47 (68.1%) | 5 (11.9%) |
| Total | 69 (100.0%) | 42 (100.0%) |
Real Estate Taxes by Mortgage Status in Kelleys Island
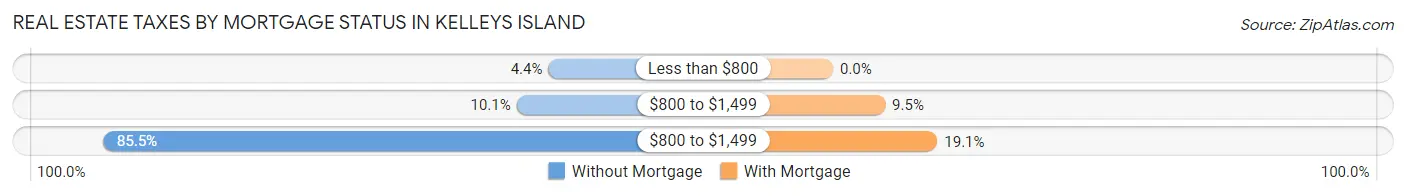
| Property Taxes | Without Mortgage | With Mortgage |
| Less than $800 | 3 (4.3%) | 0 (0.0%) |
| $800 to $1,499 | 7 (10.1%) | 4 (9.5%) |
| $800 to $1,499 | 59 (85.5%) | 8 (19.1%) |
| Total | 69 (100.0%) | 42 (100.0%) |
Health & Disability in Kelleys Island
Health Insurance Coverage by Age in Kelleys Island
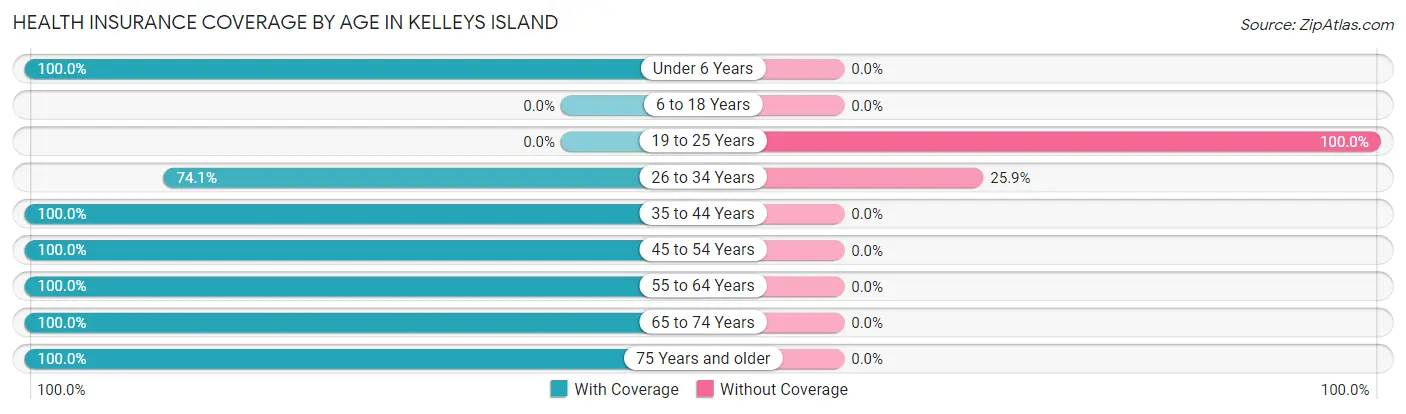
| Age Bracket | With Coverage | Without Coverage |
| Under 6 Years | 4 (100.0%) | 0 (0.0%) |
| 6 to 18 Years | 0 (0.0%) | 0 (0.0%) |
| 19 to 25 Years | 0 (0.0%) | 8 (100.0%) |
| 26 to 34 Years | 20 (74.1%) | 7 (25.9%) |
| 35 to 44 Years | 11 (100.0%) | 0 (0.0%) |
| 45 to 54 Years | 22 (100.0%) | 0 (0.0%) |
| 55 to 64 Years | 37 (100.0%) | 0 (0.0%) |
| 65 to 74 Years | 90 (100.0%) | 0 (0.0%) |
| 75 Years and older | 22 (100.0%) | 0 (0.0%) |
| Total | 206 (93.2%) | 15 (6.8%) |
Health Insurance Coverage by Citizenship Status in Kelleys Island
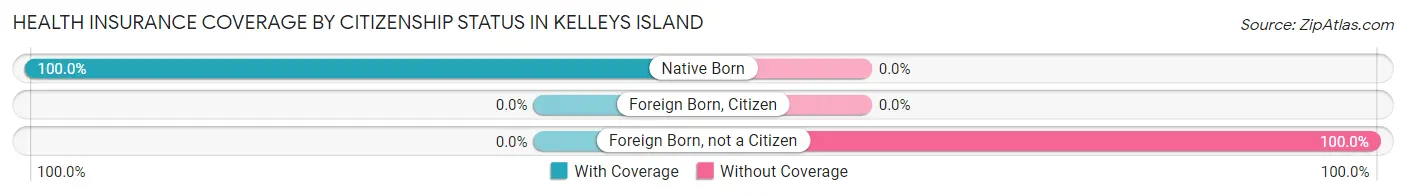
| Citizenship Status | With Coverage | Without Coverage |
| Native Born | 4 (100.0%) | 0 (0.0%) |
| Foreign Born, Citizen | 0 (0.0%) | 0 (0.0%) |
| Foreign Born, not a Citizen | 0 (0.0%) | 8 (100.0%) |
Health Insurance Coverage by Household Income in Kelleys Island
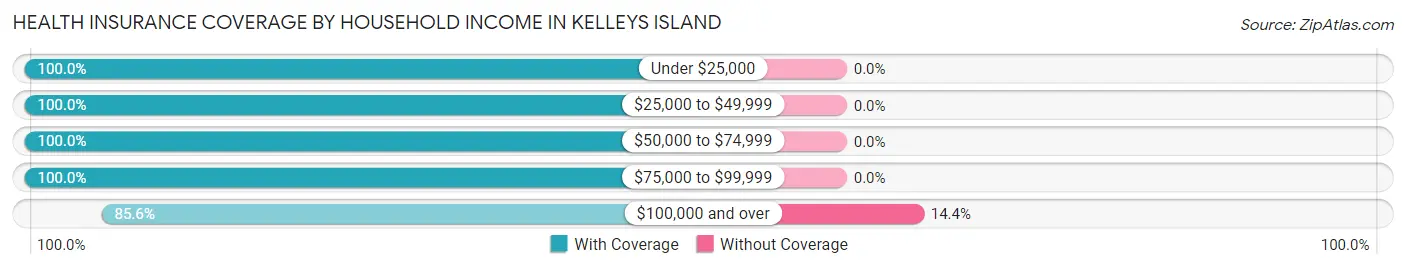
| Household Income | With Coverage | Without Coverage |
| Under $25,000 | 14 (100.0%) | 0 (0.0%) |
| $25,000 to $49,999 | 28 (100.0%) | 0 (0.0%) |
| $50,000 to $74,999 | 45 (100.0%) | 0 (0.0%) |
| $75,000 to $99,999 | 27 (100.0%) | 0 (0.0%) |
| $100,000 and over | 89 (85.6%) | 15 (14.4%) |
Public vs Private Health Insurance Coverage by Age in Kelleys Island
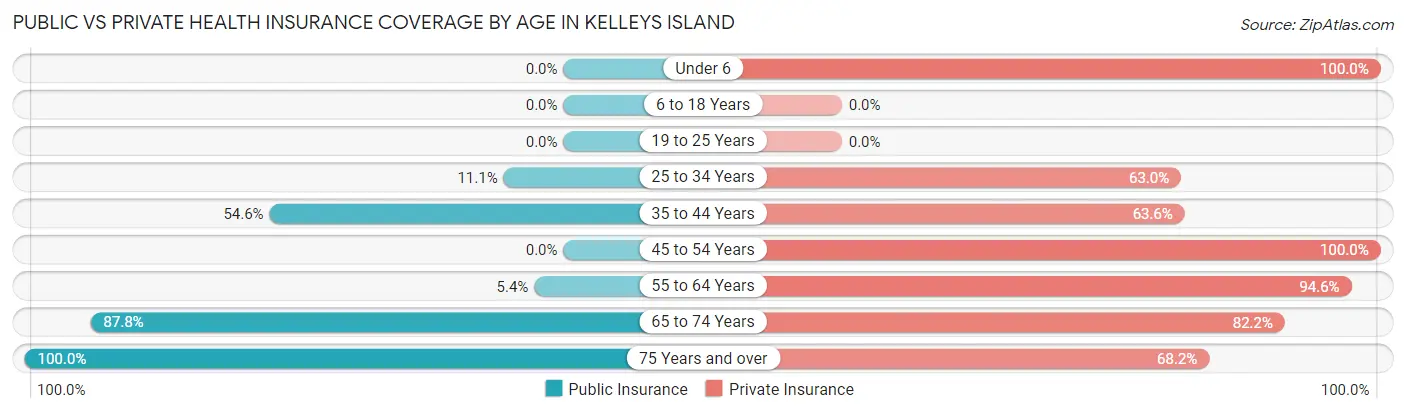
| Age Bracket | Public Insurance | Private Insurance |
| Under 6 | 0 (0.0%) | 4 (100.0%) |
| 6 to 18 Years | 0 (0.0%) | 0 (0.0%) |
| 19 to 25 Years | 0 (0.0%) | 0 (0.0%) |
| 25 to 34 Years | 3 (11.1%) | 17 (63.0%) |
| 35 to 44 Years | 6 (54.5%) | 7 (63.6%) |
| 45 to 54 Years | 0 (0.0%) | 22 (100.0%) |
| 55 to 64 Years | 2 (5.4%) | 35 (94.6%) |
| 65 to 74 Years | 79 (87.8%) | 74 (82.2%) |
| 75 Years and over | 22 (100.0%) | 15 (68.2%) |
| Total | 112 (50.7%) | 174 (78.7%) |
Disability Status by Sex by Age in Kelleys Island
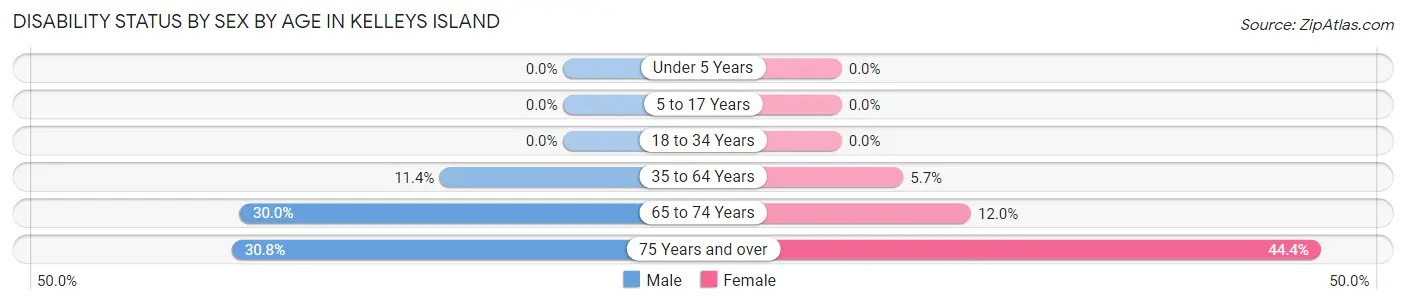
| Age Bracket | Male | Female |
| Under 5 Years | 0 (0.0%) | 0 (0.0%) |
| 5 to 17 Years | 0 (0.0%) | 0 (0.0%) |
| 18 to 34 Years | 0 (0.0%) | 0 (0.0%) |
| 35 to 64 Years | 4 (11.4%) | 2 (5.7%) |
| 65 to 74 Years | 12 (30.0%) | 6 (12.0%) |
| 75 Years and over | 4 (30.8%) | 4 (44.4%) |
Disability Class by Sex by Age in Kelleys Island
Disability Class: Hearing Difficulty
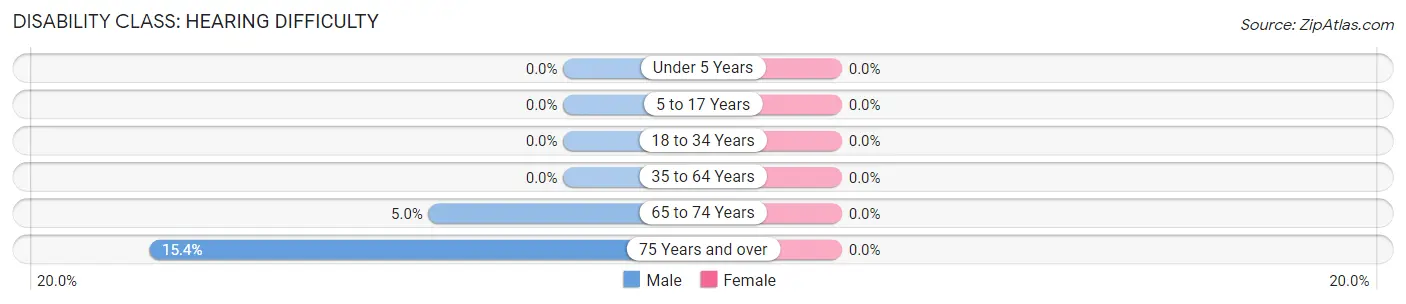
| Age Bracket | Male | Female |
| Under 5 Years | 0 (0.0%) | 0 (0.0%) |
| 5 to 17 Years | 0 (0.0%) | 0 (0.0%) |
| 18 to 34 Years | 0 (0.0%) | 0 (0.0%) |
| 35 to 64 Years | 0 (0.0%) | 0 (0.0%) |
| 65 to 74 Years | 2 (5.0%) | 0 (0.0%) |
| 75 Years and over | 2 (15.4%) | 0 (0.0%) |
Disability Class: Vision Difficulty
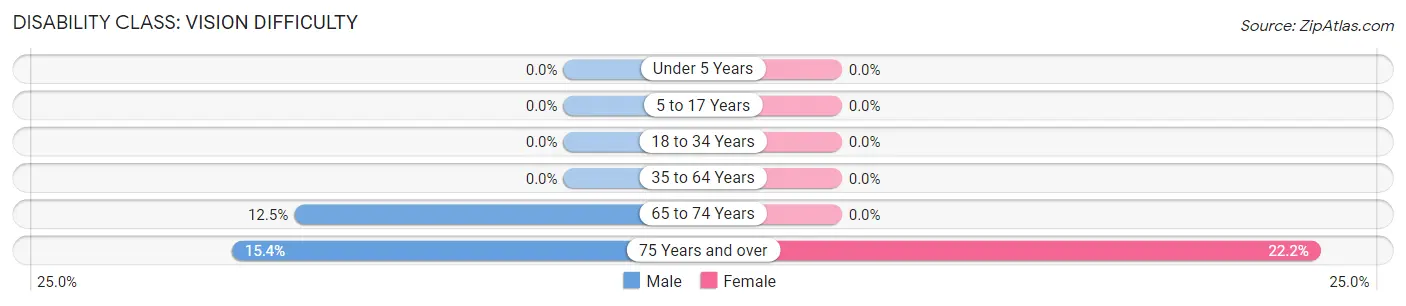
| Age Bracket | Male | Female |
| Under 5 Years | 0 (0.0%) | 0 (0.0%) |
| 5 to 17 Years | 0 (0.0%) | 0 (0.0%) |
| 18 to 34 Years | 0 (0.0%) | 0 (0.0%) |
| 35 to 64 Years | 0 (0.0%) | 0 (0.0%) |
| 65 to 74 Years | 5 (12.5%) | 0 (0.0%) |
| 75 Years and over | 2 (15.4%) | 2 (22.2%) |
Disability Class: Cognitive Difficulty
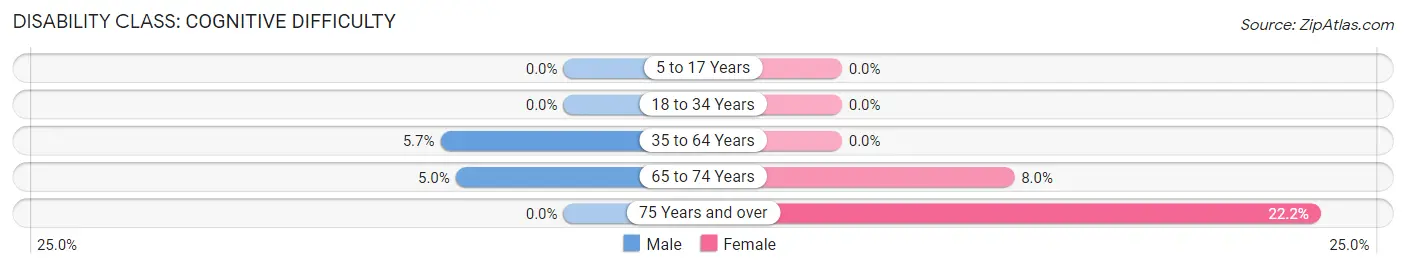
| Age Bracket | Male | Female |
| 5 to 17 Years | 0 (0.0%) | 0 (0.0%) |
| 18 to 34 Years | 0 (0.0%) | 0 (0.0%) |
| 35 to 64 Years | 2 (5.7%) | 0 (0.0%) |
| 65 to 74 Years | 2 (5.0%) | 4 (8.0%) |
| 75 Years and over | 0 (0.0%) | 2 (22.2%) |
Disability Class: Ambulatory Difficulty
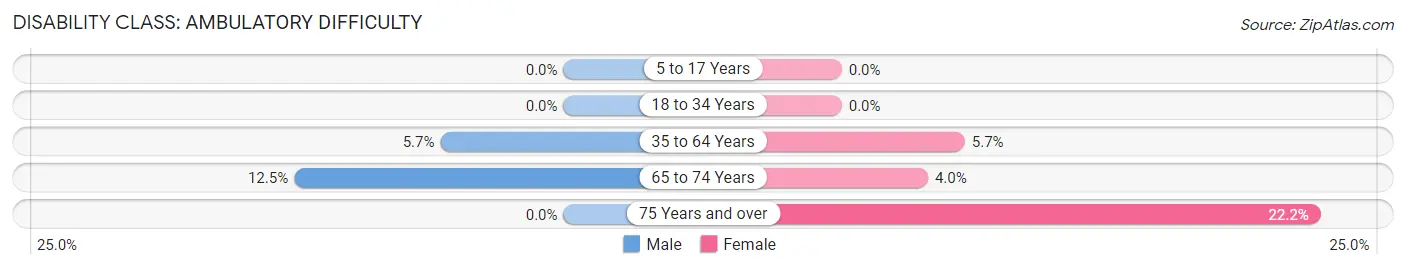
| Age Bracket | Male | Female |
| 5 to 17 Years | 0 (0.0%) | 0 (0.0%) |
| 18 to 34 Years | 0 (0.0%) | 0 (0.0%) |
| 35 to 64 Years | 2 (5.7%) | 2 (5.7%) |
| 65 to 74 Years | 5 (12.5%) | 2 (4.0%) |
| 75 Years and over | 0 (0.0%) | 2 (22.2%) |
Disability Class: Self-Care Difficulty
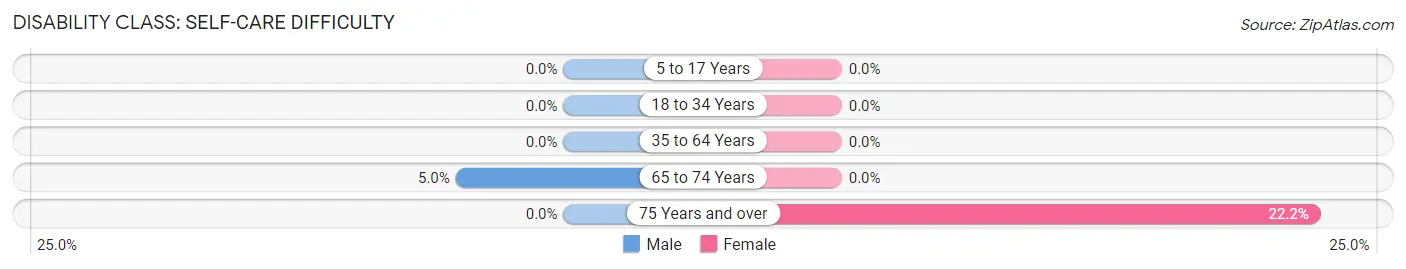
| Age Bracket | Male | Female |
| 5 to 17 Years | 0 (0.0%) | 0 (0.0%) |
| 18 to 34 Years | 0 (0.0%) | 0 (0.0%) |
| 35 to 64 Years | 0 (0.0%) | 0 (0.0%) |
| 65 to 74 Years | 2 (5.0%) | 0 (0.0%) |
| 75 Years and over | 0 (0.0%) | 2 (22.2%) |
Technology Access in Kelleys Island
Computing Device Access in Kelleys Island
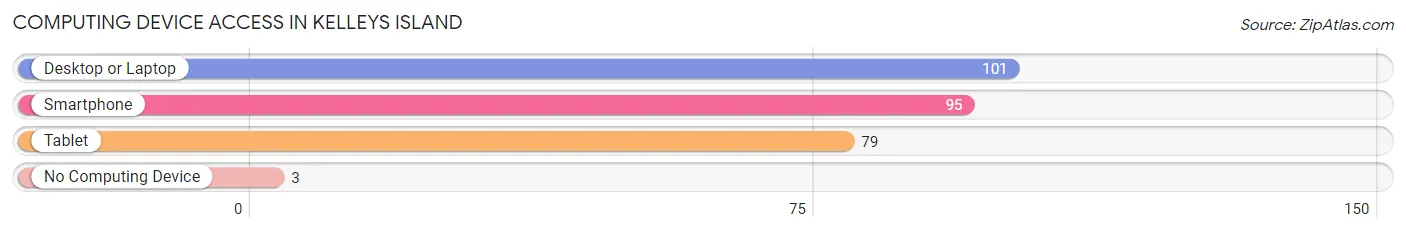
| Device Type | # Households | % Households |
| Desktop or Laptop | 101 | 86.3% |
| Smartphone | 95 | 81.2% |
| Tablet | 79 | 67.5% |
| No Computing Device | 3 | 2.6% |
| Total | 117 | 100.0% |
Internet Access in Kelleys Island
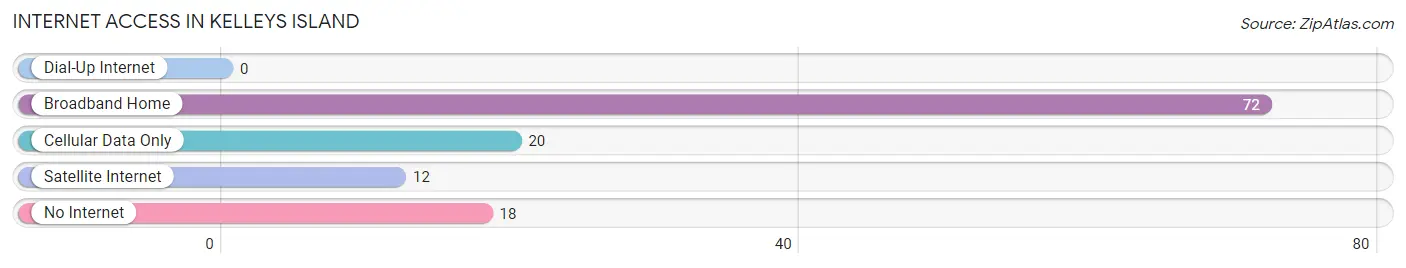
| Internet Type | # Households | % Households |
| Dial-Up Internet | 0 | 0.0% |
| Broadband Home | 72 | 61.5% |
| Cellular Data Only | 20 | 17.1% |
| Satellite Internet | 12 | 10.3% |
| No Internet | 18 | 15.4% |
| Total | 117 | 100.0% |
Kelleys Island Summary
Kelleys Island is a small island located in Lake Erie, off the coast of Ohio. It is the largest of the American Lake Erie Islands and is a popular tourist destination. The island is home to a variety of attractions, including a state park, a winery, and a variety of restaurants and shops.
Geography
Kelleys Island is located in Lake Erie, approximately 4 miles north of Marblehead, Ohio. The island is approximately 2.5 miles long and 1.5 miles wide, with a total area of 2.8 square miles. The island is composed of limestone and is surrounded by shallow waters. The highest point on the island is the Glacial Grooves, which are a series of grooves carved into the limestone by glaciers during the last ice age.
The island is accessible by ferry from Marblehead, Ohio, and by air from the nearby island of Put-in-Bay. The island is also accessible by private boat.
History
Kelleys Island was first inhabited by Native Americans, who used the island as a fishing and hunting ground. The first European settlers arrived in the early 1800s, and the island was officially settled in 1810. The island was named after its first settler, Datus Kelley, who purchased the island from the Native Americans.
In the late 1800s, the island became a popular tourist destination, and many of the island’s current attractions were built during this time. The island was also home to a number of quarries, which provided limestone for the construction of buildings in the surrounding area.
Economy
Kelleys Island’s economy is largely based on tourism. The island is home to a variety of attractions, including a state park, a winery, and a variety of restaurants and shops. The island also has a number of bed and breakfasts, hotels, and vacation rentals.
The island is also home to a number of businesses, including a marina, a grocery store, and a number of other retail stores. The island also has a number of quarries, which provide limestone for the construction of buildings in the surrounding area.
Demographics
As of the 2010 census, the population of Kelleys Island was 367. The population is largely composed of retirees and seasonal residents. The median age of the population is 57.7 years, and the median household income is $50,000.
The island is predominantly white, with 97.3% of the population identifying as white. The remaining 2.7% of the population is composed of African Americans, Asians, and other races.
Conclusion
Kelleys Island is a small island located in Lake Erie, off the coast of Ohio. It is the largest of the American Lake Erie Islands and is a popular tourist destination. The island is home to a variety of attractions, including a state park, a winery, and a variety of restaurants and shops. The island’s economy is largely based on tourism, and the population is largely composed of retirees and seasonal residents. Kelleys Island is a unique and beautiful destination, and is a great place to visit for a relaxing getaway.
Common Questions
What is Per Capita Income in Kelleys Island?
Per Capita income in Kelleys Island is $67,176.
What is the Median Family Income in Kelleys Island?
Median Family Income in Kelleys Island is $100,278.
What is the Median Household income in Kelleys Island?
Median Household Income in Kelleys Island is $74,375.
What is Income or Wage Gap in Kelleys Island?
Income or Wage Gap in Kelleys Island is 36.1%.
Women in Kelleys Island earn 63.9 cents for every dollar earned by a man.
What is Inequality or Gini Index in Kelleys Island?
Inequality or Gini Index in Kelleys Island is 0.51.
What is the Total Population of Kelleys Island?
Total Population of Kelleys Island is 221.
What is the Total Male Population of Kelleys Island?
Total Male Population of Kelleys Island is 122.
What is the Total Female Population of Kelleys Island?
Total Female Population of Kelleys Island is 99.
What is the Ratio of Males per 100 Females in Kelleys Island?
There are 123.23 Males per 100 Females in Kelleys Island.
What is the Ratio of Females per 100 Males in Kelleys Island?
There are 81.15 Females per 100 Males in Kelleys Island.
What is the Median Population Age in Kelleys Island?
Median Population Age in Kelleys Island is 65.3 Years.
What is the Average Family Size in Kelleys Island
Average Family Size in Kelleys Island is 2.2 People.
What is the Average Household Size in Kelleys Island
Average Household Size in Kelleys Island is 1.9 People.
How Large is the Labor Force in Kelleys Island?
There are 104 People in the Labor Forcein in Kelleys Island.
What is the Percentage of People in the Labor Force in Kelleys Island?
47.9% of People are in the Labor Force in Kelleys Island.
What is the Unemployment Rate in Kelleys Island?
Unemployment Rate in Kelleys Island is 20.2%.