South Lebanon, OH Map & Demographics
South Lebanon Map
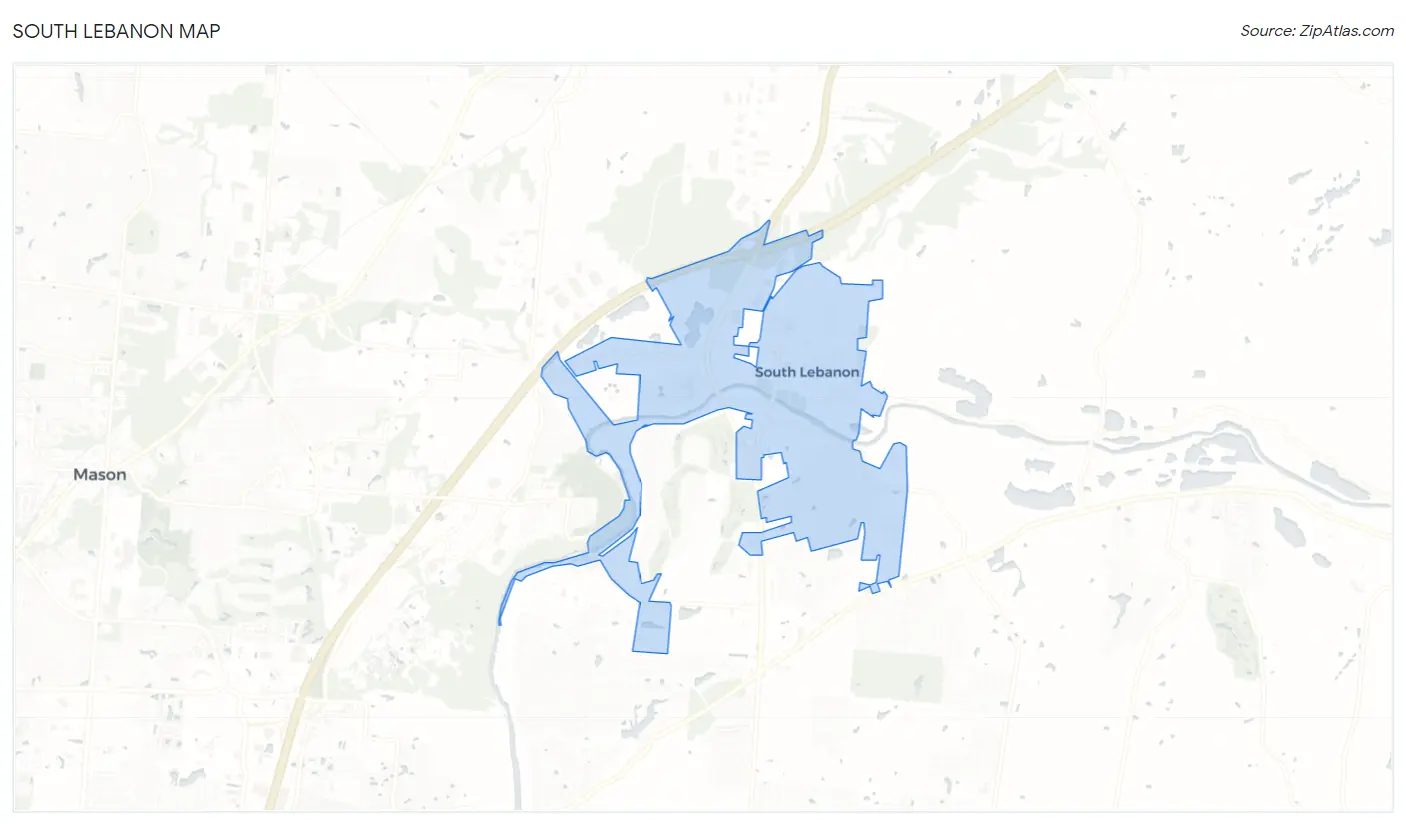
South Lebanon Overview
$39,783
PER CAPITA INCOME
$127,692
AVG FAMILY INCOME
$108,194
AVG HOUSEHOLD INCOME
12.8%
WAGE / INCOME GAP [ % ]
87.2¢/ $1
WAGE / INCOME GAP [ $ ]
0.44
INEQUALITY / GINI INDEX
6,376
TOTAL POPULATION
2,930
MALE POPULATION
3,446
FEMALE POPULATION
85.03
MALES / 100 FEMALES
117.61
FEMALES / 100 MALES
33.5
MEDIAN AGE
3.5
AVG FAMILY SIZE
2.9
AVG HOUSEHOLD SIZE
3,536
LABOR FORCE [ PEOPLE ]
77.0%
PERCENT IN LABOR FORCE
14.4%
UNEMPLOYMENT RATE
South Lebanon Zip Codes
South Lebanon Area Codes
Income in South Lebanon
Income Overview in South Lebanon
Per Capita Income in South Lebanon is $39,783, while median incomes of families and households are $127,692 and $108,194 respectively.
| Characteristic | Number | Measure |
| Per Capita Income | 6,376 | $39,783 |
| Median Family Income | 1,540 | $127,692 |
| Mean Family Income | 1,540 | $148,384 |
| Median Household Income | 2,179 | $108,194 |
| Mean Household Income | 2,179 | $126,206 |
| Income Deficit | 1,540 | $0 |
| Wage / Income Gap (%) | 6,376 | 12.75% |
| Wage / Income Gap ($) | 6,376 | 87.25¢ per $1 |
| Gini / Inequality Index | 6,376 | 0.44 |
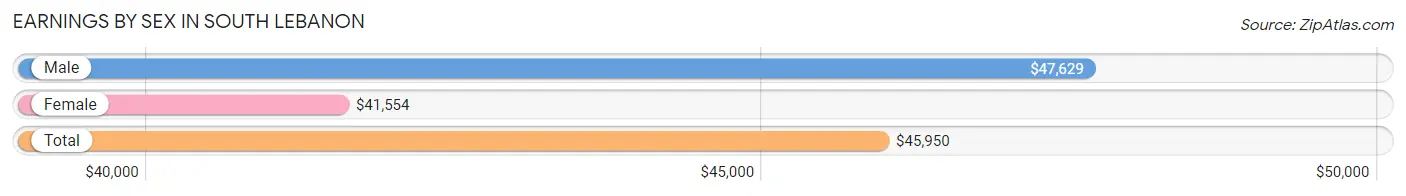
Earnings by Sex in South Lebanon
Average Earnings in South Lebanon are $45,950, $47,629 for men and $41,554 for women, a difference of 12.8%.
| Sex | Number | Average Earnings |
| Male | 1,997 (54.5%) | $47,629 |
| Female | 1,669 (45.5%) | $41,554 |
| Total | 3,666 (100.0%) | $45,950 |
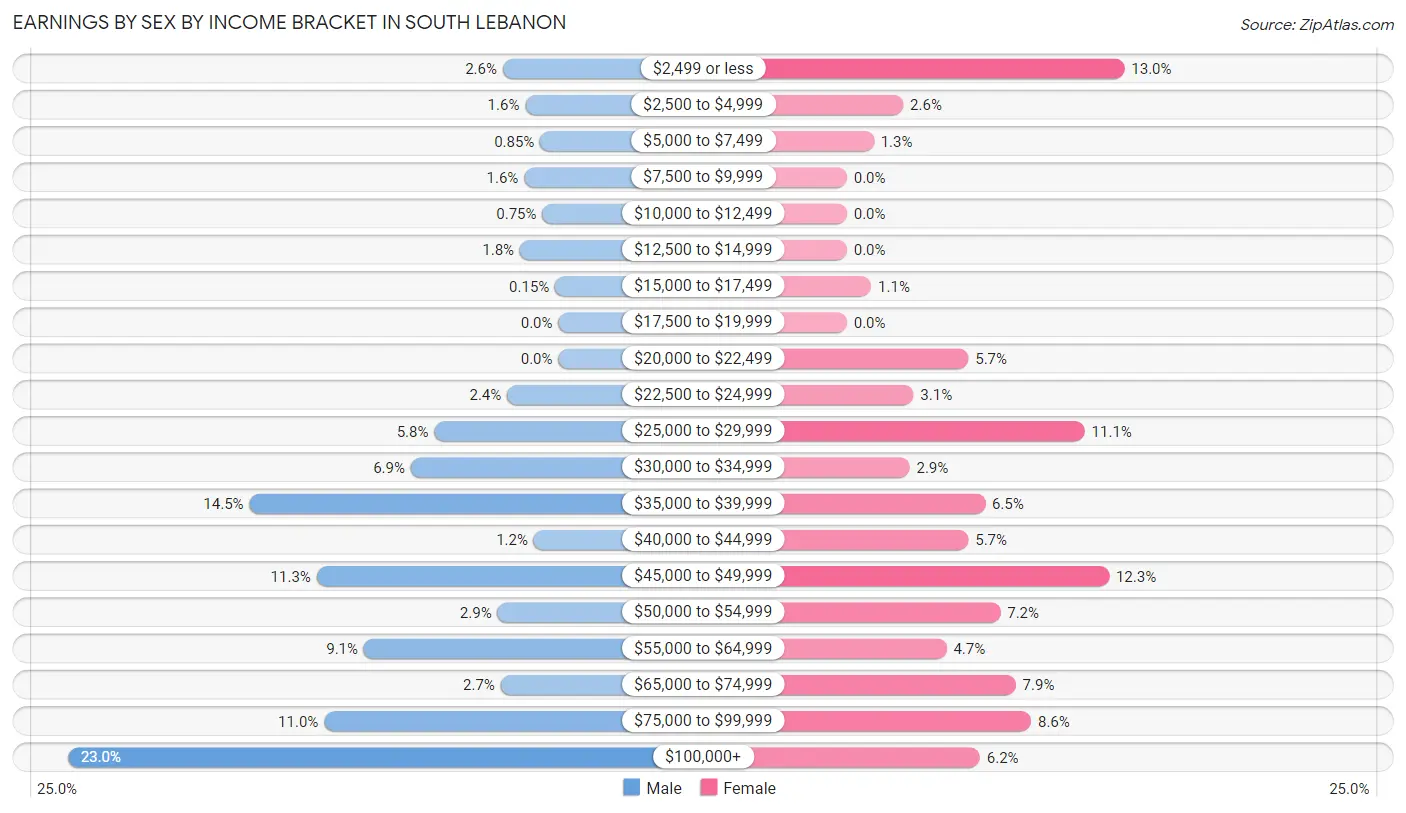
Earnings by Sex by Income Bracket in South Lebanon
The most common earnings brackets in South Lebanon are $100,000+ for men (459 | 23.0%) and $2,499 or less for women (217 | 13.0%).
| Income | Male | Female |
| $2,499 or less | 52 (2.6%) | 217 (13.0%) |
| $2,500 to $4,999 | 31 (1.5%) | 44 (2.6%) |
| $5,000 to $7,499 | 17 (0.9%) | 21 (1.3%) |
| $7,500 to $9,999 | 32 (1.6%) | 0 (0.0%) |
| $10,000 to $12,499 | 15 (0.7%) | 0 (0.0%) |
| $12,500 to $14,999 | 36 (1.8%) | 0 (0.0%) |
| $15,000 to $17,499 | 3 (0.2%) | 19 (1.1%) |
| $17,500 to $19,999 | 0 (0.0%) | 0 (0.0%) |
| $20,000 to $22,499 | 0 (0.0%) | 95 (5.7%) |
| $22,500 to $24,999 | 48 (2.4%) | 52 (3.1%) |
| $25,000 to $29,999 | 116 (5.8%) | 186 (11.1%) |
| $30,000 to $34,999 | 138 (6.9%) | 49 (2.9%) |
| $35,000 to $39,999 | 289 (14.5%) | 108 (6.5%) |
| $40,000 to $44,999 | 23 (1.1%) | 95 (5.7%) |
| $45,000 to $49,999 | 226 (11.3%) | 205 (12.3%) |
| $50,000 to $54,999 | 57 (2.9%) | 120 (7.2%) |
| $55,000 to $64,999 | 182 (9.1%) | 78 (4.7%) |
| $65,000 to $74,999 | 54 (2.7%) | 132 (7.9%) |
| $75,000 to $99,999 | 219 (11.0%) | 144 (8.6%) |
| $100,000+ | 459 (23.0%) | 104 (6.2%) |
| Total | 1,997 (100.0%) | 1,669 (100.0%) |
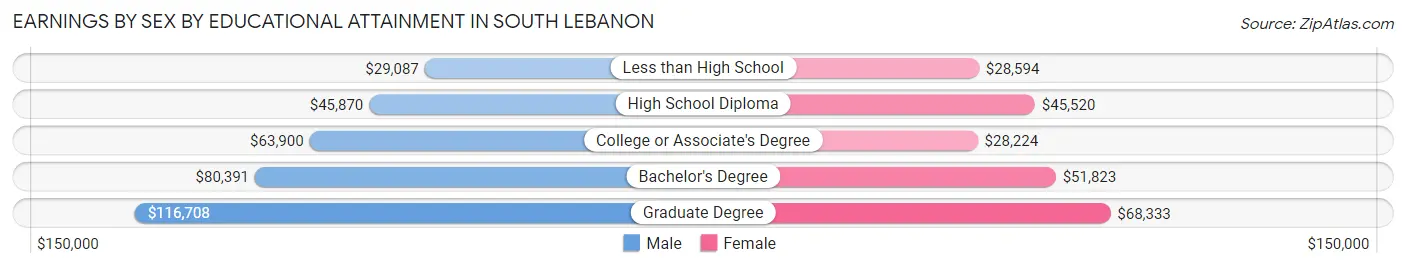
Earnings by Sex by Educational Attainment in South Lebanon
Average earnings in South Lebanon are $58,781 for men and $45,934 for women, a difference of 21.9%. Men with an educational attainment of graduate degree enjoy the highest average annual earnings of $116,708, while those with less than high school education earn the least with $29,087. Women with an educational attainment of graduate degree earn the most with the average annual earnings of $68,333, while those with college or associate's degree education have the smallest earnings of $28,224.
| Educational Attainment | Male Income | Female Income |
| Less than High School | $29,087 | $28,594 |
| High School Diploma | $45,870 | $45,520 |
| College or Associate's Degree | $63,900 | $28,224 |
| Bachelor's Degree | $80,391 | $51,823 |
| Graduate Degree | $116,708 | $68,333 |
| Total | $58,781 | $45,934 |
Family Income in South Lebanon
Family Income Brackets in South Lebanon
According to the South Lebanon family income data, there are 521 families falling into the $200,000+ income range, which is the most common income bracket and makes up 33.8% of all families.
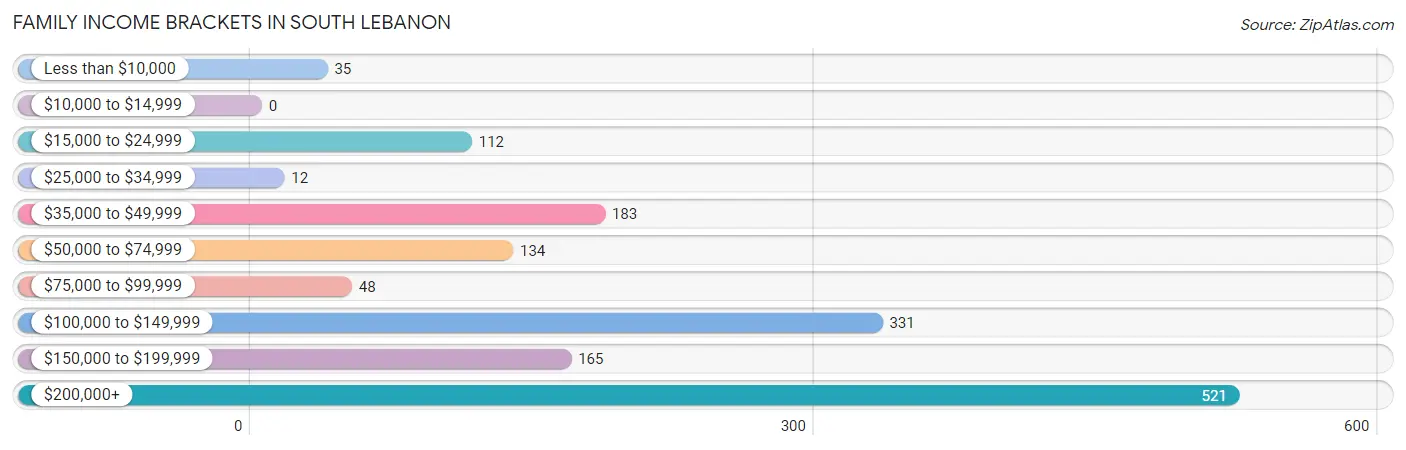
| Income Bracket | # Families | % Families |
| Less than $10,000 | 35 | 2.3% |
| $10,000 to $14,999 | 0 | 0.0% |
| $15,000 to $24,999 | 112 | 7.3% |
| $25,000 to $34,999 | 12 | 0.8% |
| $35,000 to $49,999 | 183 | 11.9% |
| $50,000 to $74,999 | 134 | 8.7% |
| $75,000 to $99,999 | 48 | 3.1% |
| $100,000 to $149,999 | 331 | 21.5% |
| $150,000 to $199,999 | 165 | 10.7% |
| $200,000+ | 521 | 33.8% |
Family Income by Famaliy Size in South Lebanon
4-person families (413 | 26.8%) account for the highest median family income in South Lebanon with $188,639 per family, while 4-person families (413 | 26.8%) have the highest median income of $47,160 per family member.
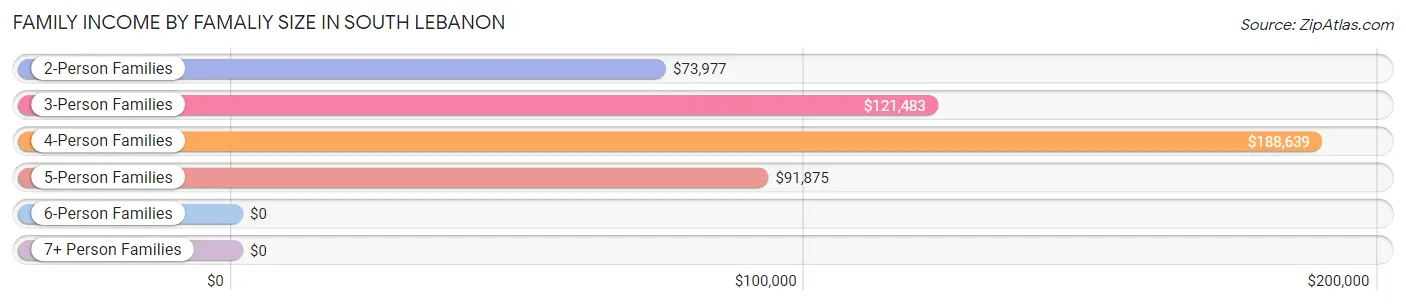
| Income Bracket | # Families | Median Income |
| 2-Person Families | 497 (32.3%) | $73,977 |
| 3-Person Families | 255 (16.6%) | $121,483 |
| 4-Person Families | 413 (26.8%) | $188,639 |
| 5-Person Families | 82 (5.3%) | $91,875 |
| 6-Person Families | 191 (12.4%) | $0 |
| 7+ Person Families | 102 (6.6%) | $0 |
| Total | 1,540 (100.0%) | $127,692 |
Family Income by Number of Earners in South Lebanon
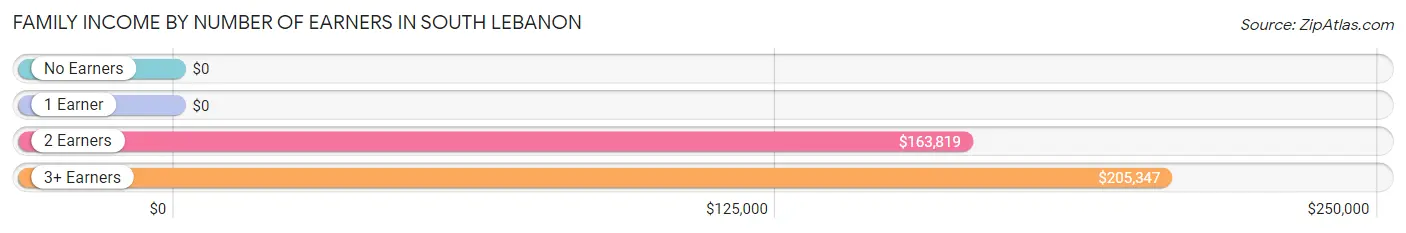
| Number of Earners | # Families | Median Income |
| No Earners | 160 (10.4%) | $0 |
| 1 Earner | 276 (17.9%) | $0 |
| 2 Earners | 757 (49.2%) | $163,819 |
| 3+ Earners | 347 (22.5%) | $205,347 |
| Total | 1,540 (100.0%) | $127,692 |
Household Income in South Lebanon
Household Income Brackets in South Lebanon
With 567 households falling in the category, the $200,000+ income range is the most frequent in South Lebanon, accounting for 26.0% of all households. In contrast, only 46 households (2.1%) fall into the less than $10,000 income bracket, making it the least populous group.
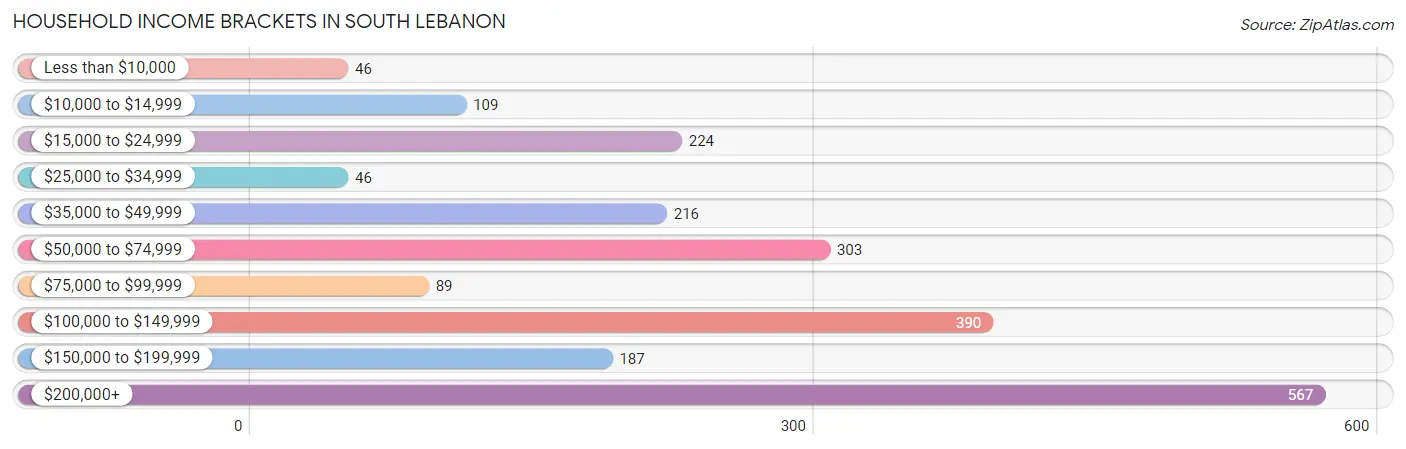
| Income Bracket | # Households | % Households |
| Less than $10,000 | 46 | 2.1% |
| $10,000 to $14,999 | 109 | 5.0% |
| $15,000 to $24,999 | 224 | 10.3% |
| $25,000 to $34,999 | 46 | 2.1% |
| $35,000 to $49,999 | 216 | 9.9% |
| $50,000 to $74,999 | 303 | 13.9% |
| $75,000 to $99,999 | 89 | 4.1% |
| $100,000 to $149,999 | 390 | 17.9% |
| $150,000 to $199,999 | 187 | 8.6% |
| $200,000+ | 567 | 26.0% |
Household Income by Householder Age in South Lebanon
The median household income in South Lebanon is $108,194, with the highest median household income of $138,167 found in the 25 to 44 years age bracket for the primary householder. A total of 856 households (39.3%) fall into this category. Meanwhile, the 15 to 24 years age bracket for the primary householder has the lowest median household income of $0, with 77 households (3.5%) in this group.
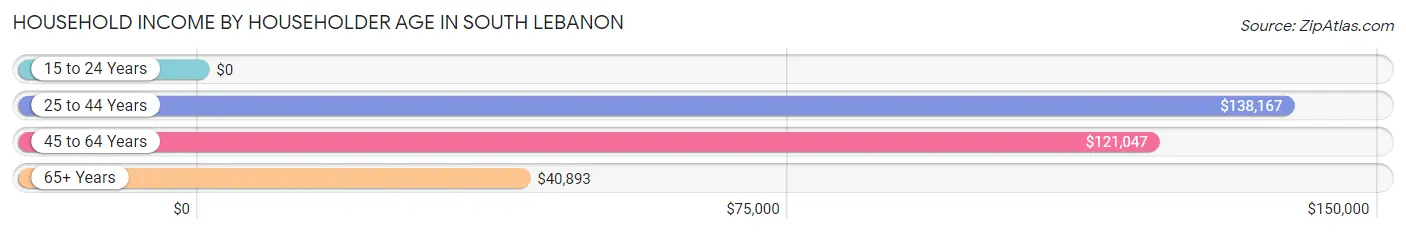
| Income Bracket | # Households | Median Income |
| 15 to 24 Years | 77 (3.5%) | $0 |
| 25 to 44 Years | 856 (39.3%) | $138,167 |
| 45 to 64 Years | 840 (38.6%) | $121,047 |
| 65+ Years | 406 (18.6%) | $40,893 |
| Total | 2,179 (100.0%) | $108,194 |
Poverty in South Lebanon
Income Below Poverty by Sex and Age in South Lebanon
With 6.7% poverty level for males and 8.6% for females among the residents of South Lebanon, 16 and 17 year old males and 65 to 74 year old females are the most vulnerable to poverty, with 34 males (30.9%) and 95 females (42.2%) in their respective age groups living below the poverty level.
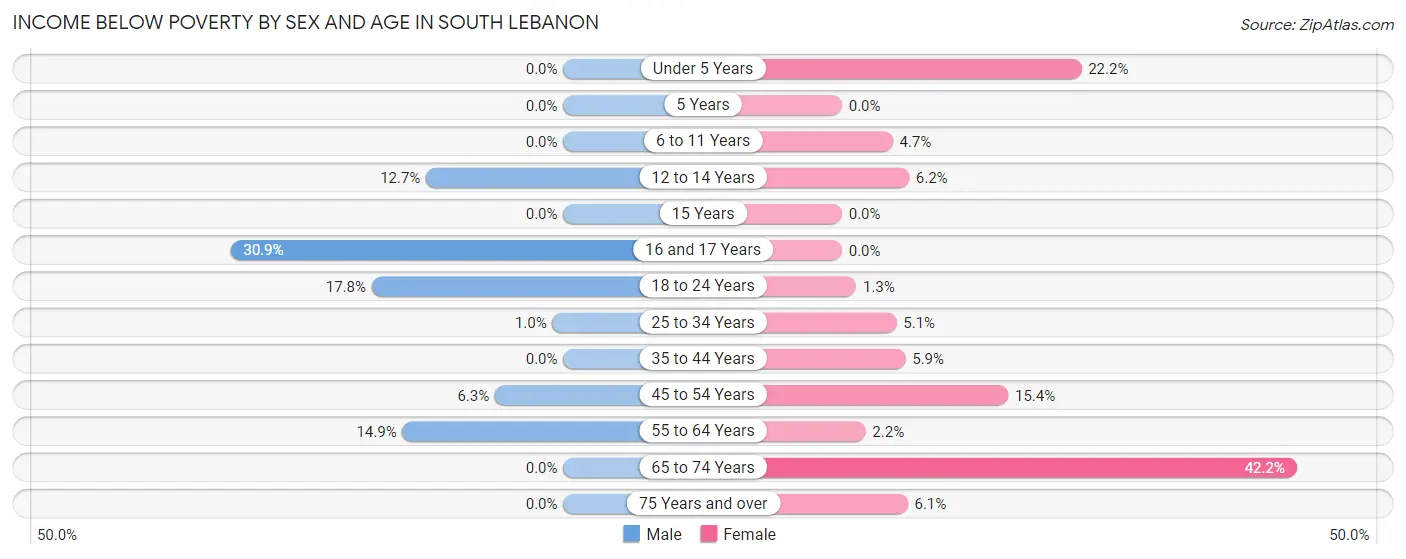
| Age Bracket | Male | Female |
| Under 5 Years | 0 (0.0%) | 26 (22.2%) |
| 5 Years | 0 (0.0%) | 0 (0.0%) |
| 6 to 11 Years | 0 (0.0%) | 28 (4.7%) |
| 12 to 14 Years | 7 (12.7%) | 28 (6.2%) |
| 15 Years | 0 (0.0%) | 0 (0.0%) |
| 16 and 17 Years | 34 (30.9%) | 0 (0.0%) |
| 18 to 24 Years | 61 (17.8%) | 2 (1.3%) |
| 25 to 34 Years | 4 (1.0%) | 21 (5.1%) |
| 35 to 44 Years | 0 (0.0%) | 30 (5.9%) |
| 45 to 54 Years | 22 (6.3%) | 50 (15.4%) |
| 55 to 64 Years | 66 (14.9%) | 8 (2.2%) |
| 65 to 74 Years | 0 (0.0%) | 95 (42.2%) |
| 75 Years and over | 0 (0.0%) | 5 (6.1%) |
| Total | 194 (6.7%) | 293 (8.6%) |
Income Above Poverty by Sex and Age in South Lebanon
According to the poverty statistics in South Lebanon, males aged under 5 years and females aged 5 years are the age groups that are most secure financially, with 100.0% of males and 100.0% of females in these age groups living above the poverty line.
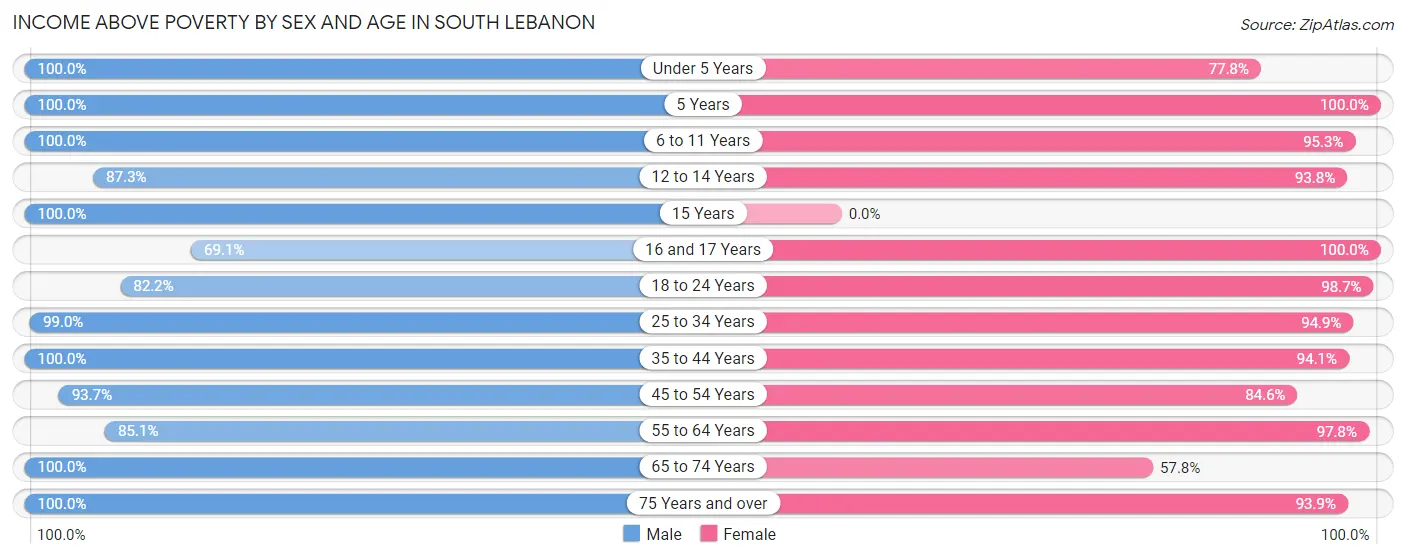
| Age Bracket | Male | Female |
| Under 5 Years | 268 (100.0%) | 91 (77.8%) |
| 5 Years | 31 (100.0%) | 5 (100.0%) |
| 6 to 11 Years | 83 (100.0%) | 567 (95.3%) |
| 12 to 14 Years | 48 (87.3%) | 422 (93.8%) |
| 15 Years | 111 (100.0%) | 0 (0.0%) |
| 16 and 17 Years | 76 (69.1%) | 167 (100.0%) |
| 18 to 24 Years | 282 (82.2%) | 149 (98.7%) |
| 25 to 34 Years | 396 (99.0%) | 394 (94.9%) |
| 35 to 44 Years | 503 (100.0%) | 479 (94.1%) |
| 45 to 54 Years | 325 (93.7%) | 274 (84.6%) |
| 55 to 64 Years | 376 (85.1%) | 358 (97.8%) |
| 65 to 74 Years | 139 (100.0%) | 130 (57.8%) |
| 75 Years and over | 69 (100.0%) | 77 (93.9%) |
| Total | 2,707 (93.3%) | 3,113 (91.4%) |
Income Below Poverty Among Married-Couple Families in South Lebanon
The poverty statistics for married-couple families in South Lebanon show that 1.6% or 19 of the total 1,202 families live below the poverty line. Families with no children have the highest poverty rate of 5.1%, comprising of 19 families. On the other hand, families with 1 or 2 children have the lowest poverty rate of 0.0%, which includes 0 families.
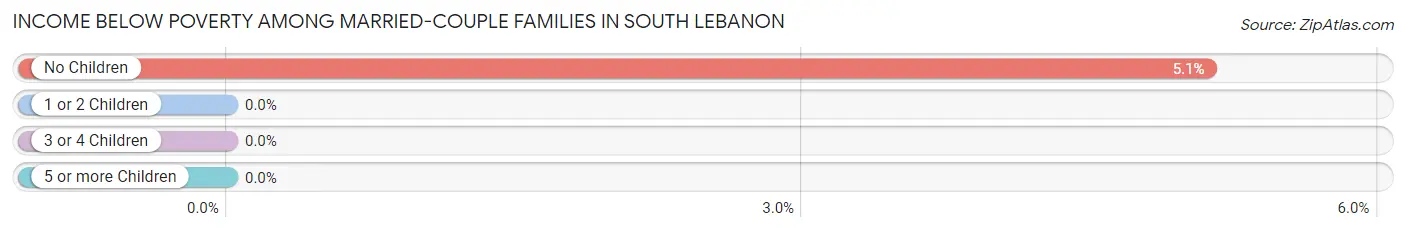
| Children | Above Poverty | Below Poverty |
| No Children | 353 (94.9%) | 19 (5.1%) |
| 1 or 2 Children | 654 (100.0%) | 0 (0.0%) |
| 3 or 4 Children | 74 (100.0%) | 0 (0.0%) |
| 5 or more Children | 102 (100.0%) | 0 (0.0%) |
| Total | 1,183 (98.4%) | 19 (1.6%) |
Income Below Poverty Among Single-Parent Households in South Lebanon
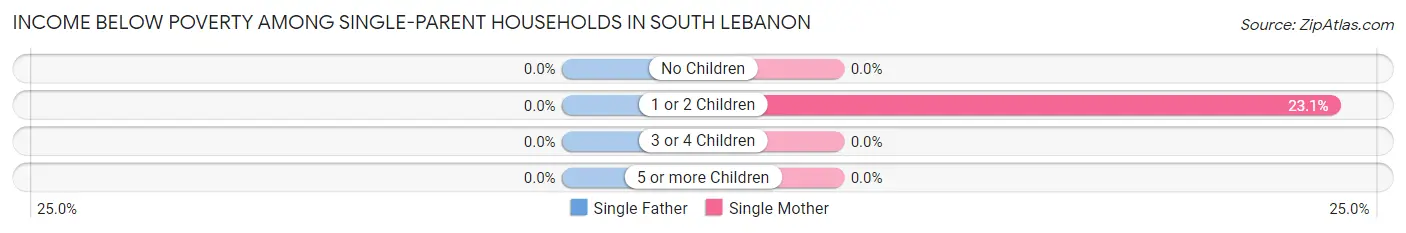
| Children | Single Father | Single Mother |
| No Children | 0 (0.0%) | 0 (0.0%) |
| 1 or 2 Children | 0 (0.0%) | 62 (23.1%) |
| 3 or 4 Children | 0 (0.0%) | 0 (0.0%) |
| 5 or more Children | 0 (0.0%) | 0 (0.0%) |
| Total | 0 (0.0%) | 62 (22.7%) |
Income Below Poverty Among Married-Couple vs Single-Parent Households in South Lebanon
The poverty data for South Lebanon shows that 19 of the married-couple family households (1.6%) and 62 of the single-parent households (18.3%) are living below the poverty level. Within the married-couple family households, those with no children have the highest poverty rate, with 19 households (5.1%) falling below the poverty line. Among the single-parent households, those with 1 or 2 children have the highest poverty rate, with 62 household (21.1%) living below poverty.
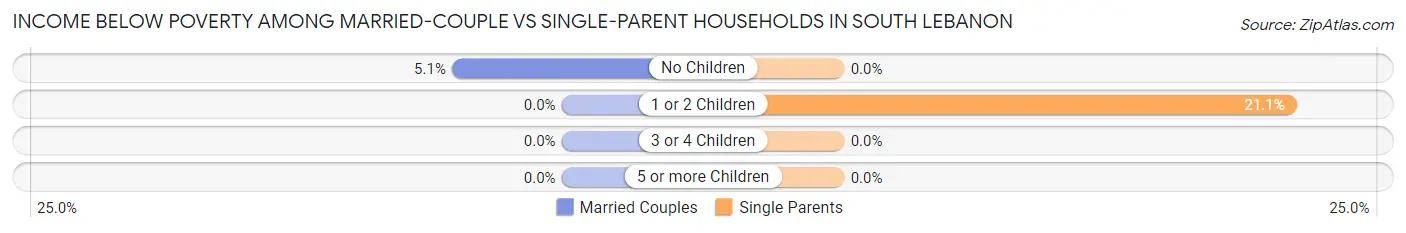
| Children | Married-Couple Families | Single-Parent Households |
| No Children | 19 (5.1%) | 0 (0.0%) |
| 1 or 2 Children | 0 (0.0%) | 62 (21.1%) |
| 3 or 4 Children | 0 (0.0%) | 0 (0.0%) |
| 5 or more Children | 0 (0.0%) | 0 (0.0%) |
| Total | 19 (1.6%) | 62 (18.3%) |
Race in South Lebanon
The most populous races in South Lebanon are White / Caucasian (5,535 | 86.8%), Some other Race (456 | 7.1%), and Hispanic or Latino (266 | 4.2%).
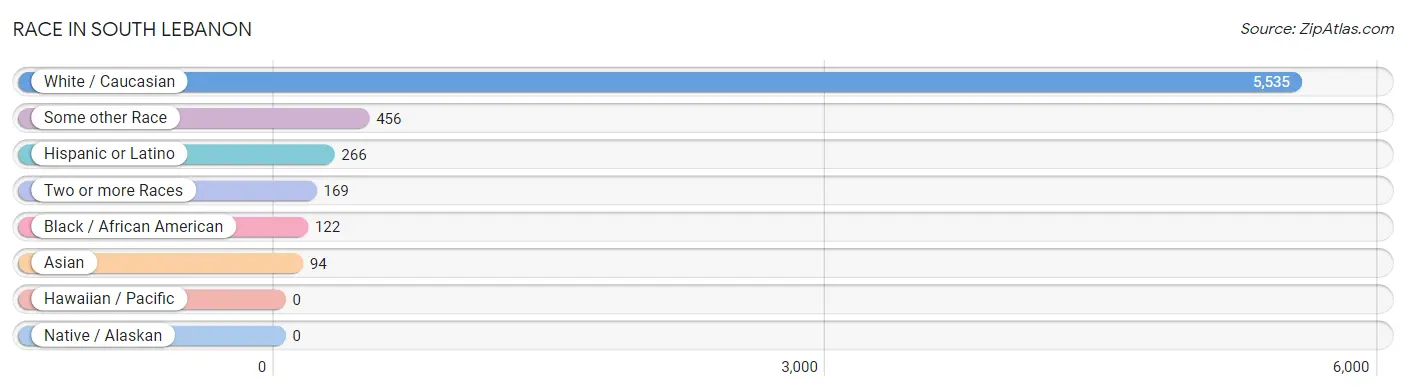
| Race | # Population | % Population |
| Asian | 94 | 1.5% |
| Black / African American | 122 | 1.9% |
| Hawaiian / Pacific | 0 | 0.0% |
| Hispanic or Latino | 266 | 4.2% |
| Native / Alaskan | 0 | 0.0% |
| White / Caucasian | 5,535 | 86.8% |
| Two or more Races | 169 | 2.6% |
| Some other Race | 456 | 7.1% |
| Total | 6,376 | 100.0% |
Ancestry in South Lebanon
The most populous ancestries reported in South Lebanon are English (1,310 | 20.5%), German (1,125 | 17.6%), Irish (626 | 9.8%), European (234 | 3.7%), and Italian (223 | 3.5%), together accounting for 55.2% of all South Lebanon residents.
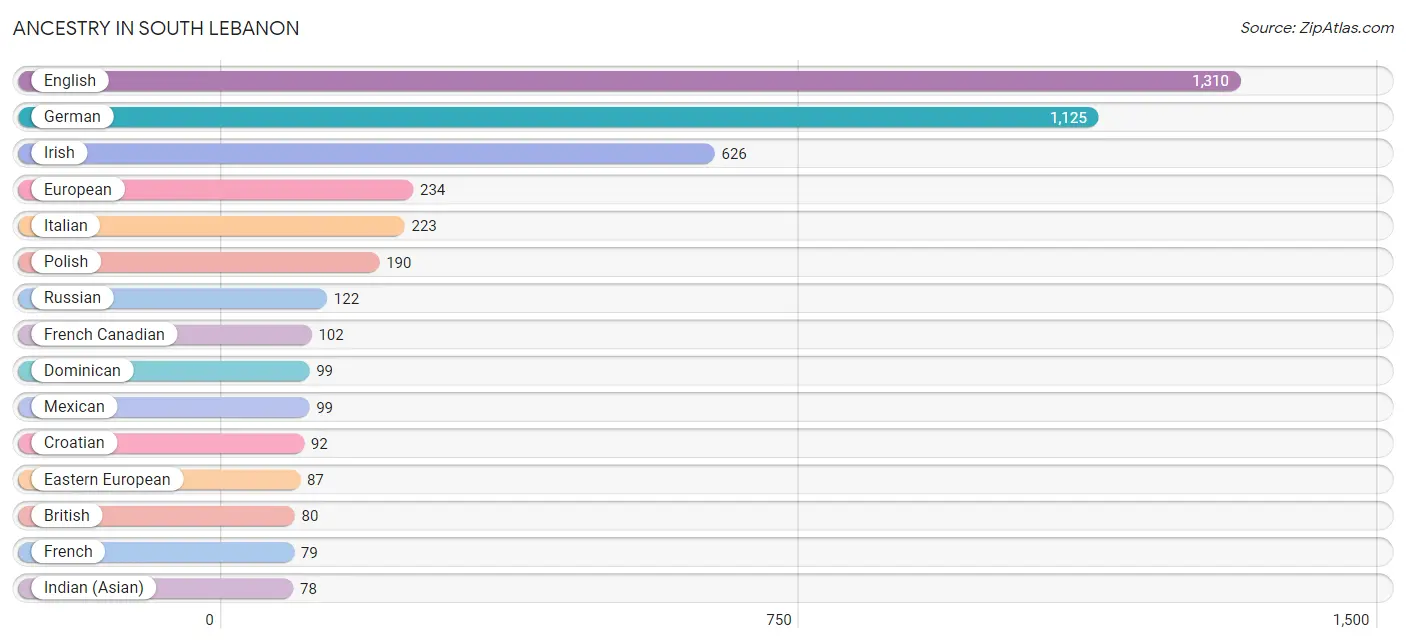
| Ancestry | # Population | % Population |
| American | 77 | 1.2% |
| Austrian | 13 | 0.2% |
| Brazilian | 6 | 0.1% |
| British | 80 | 1.3% |
| Cherokee | 1 | 0.0% |
| Colombian | 5 | 0.1% |
| Croatian | 92 | 1.4% |
| Czech | 10 | 0.2% |
| Dominican | 99 | 1.5% |
| Dutch | 9 | 0.1% |
| Eastern European | 87 | 1.4% |
| English | 1,310 | 20.5% |
| European | 234 | 3.7% |
| French | 79 | 1.2% |
| French Canadian | 102 | 1.6% |
| German | 1,125 | 17.6% |
| Greek | 6 | 0.1% |
| Hungarian | 24 | 0.4% |
| Indian (Asian) | 78 | 1.2% |
| Irish | 626 | 9.8% |
| Italian | 223 | 3.5% |
| Mexican | 99 | 1.5% |
| Polish | 190 | 3.0% |
| Puerto Rican | 63 | 1.0% |
| Russian | 122 | 1.9% |
| Scotch-Irish | 47 | 0.7% |
| Scottish | 48 | 0.7% |
| Slavic | 2 | 0.0% |
| Slovene | 24 | 0.4% |
| South American | 5 | 0.1% |
| Swedish | 10 | 0.2% |
| Swiss | 24 | 0.4% |
| Thai | 16 | 0.3% | View All 33 Rows |
Immigrants in South Lebanon
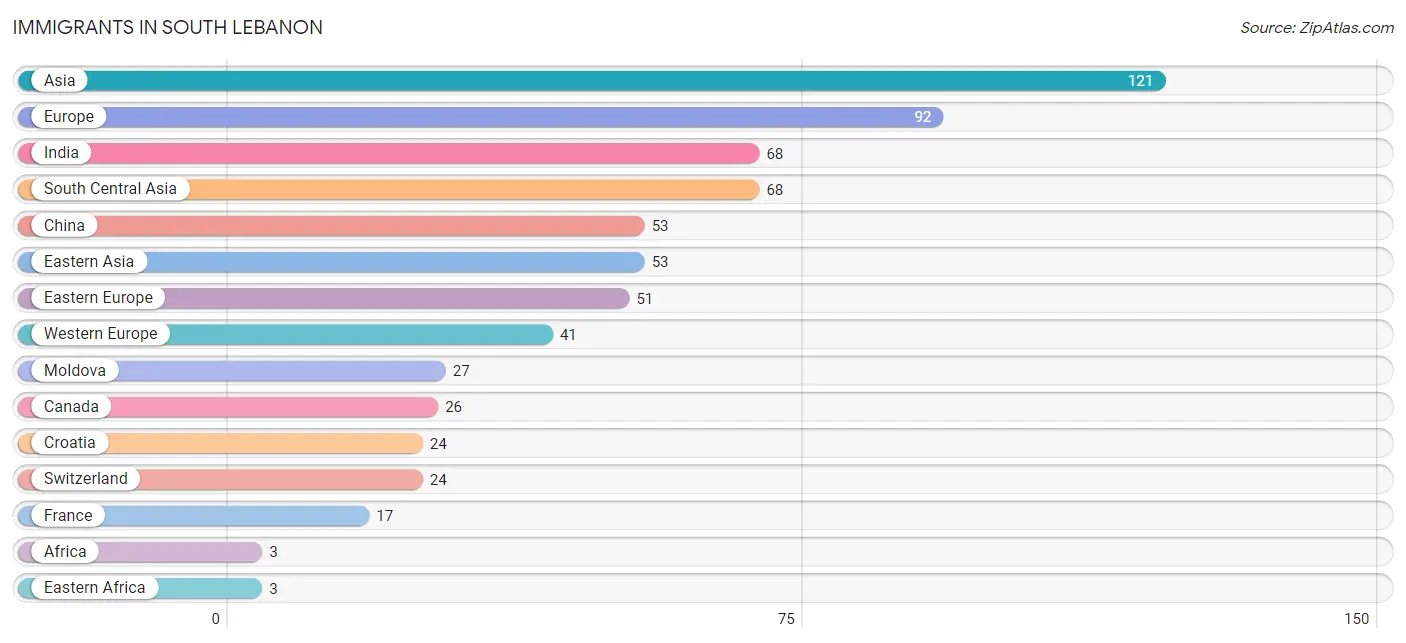
The most numerous immigrant groups reported in South Lebanon came from Asia (121 | 1.9%), Europe (92 | 1.4%), India (68 | 1.1%), South Central Asia (68 | 1.1%), and China (53 | 0.8%), together accounting for 6.3% of all South Lebanon residents.
| Immigration Origin | # Population | % Population |
| Africa | 3 | 0.1% |
| Asia | 121 | 1.9% |
| Canada | 26 | 0.4% |
| China | 53 | 0.8% |
| Croatia | 24 | 0.4% |
| Eastern Africa | 3 | 0.1% |
| Eastern Asia | 53 | 0.8% |
| Eastern Europe | 51 | 0.8% |
| Ethiopia | 3 | 0.1% |
| Europe | 92 | 1.4% |
| France | 17 | 0.3% |
| India | 68 | 1.1% |
| Moldova | 27 | 0.4% |
| South Central Asia | 68 | 1.1% |
| Switzerland | 24 | 0.4% |
| Western Europe | 41 | 0.6% | View All 16 Rows |
Sex and Age in South Lebanon
Sex and Age in South Lebanon
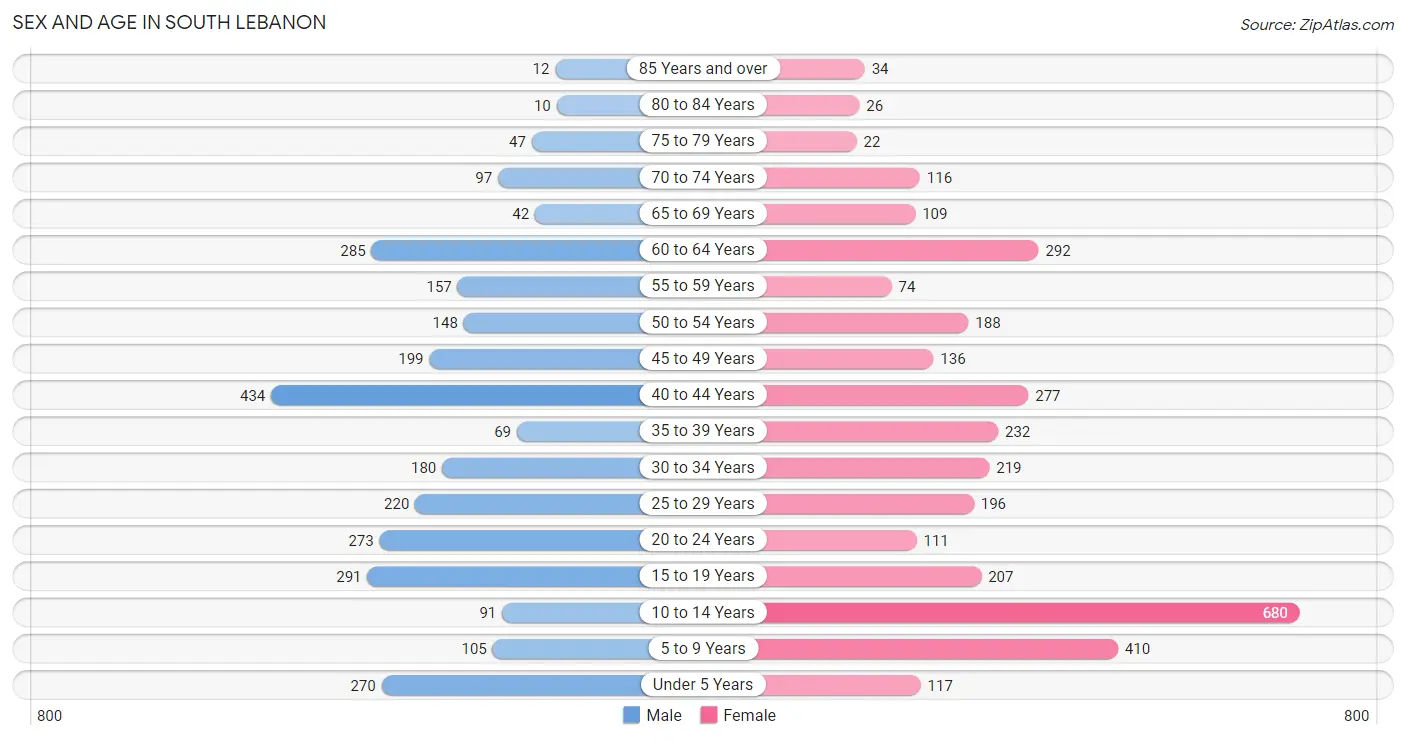
The most populous age groups in South Lebanon are 40 to 44 Years (434 | 14.8%) for men and 10 to 14 Years (680 | 19.7%) for women.
| Age Bracket | Male | Female |
| Under 5 Years | 270 (9.2%) | 117 (3.4%) |
| 5 to 9 Years | 105 (3.6%) | 410 (11.9%) |
| 10 to 14 Years | 91 (3.1%) | 680 (19.7%) |
| 15 to 19 Years | 291 (9.9%) | 207 (6.0%) |
| 20 to 24 Years | 273 (9.3%) | 111 (3.2%) |
| 25 to 29 Years | 220 (7.5%) | 196 (5.7%) |
| 30 to 34 Years | 180 (6.1%) | 219 (6.4%) |
| 35 to 39 Years | 69 (2.4%) | 232 (6.7%) |
| 40 to 44 Years | 434 (14.8%) | 277 (8.0%) |
| 45 to 49 Years | 199 (6.8%) | 136 (4.0%) |
| 50 to 54 Years | 148 (5.1%) | 188 (5.5%) |
| 55 to 59 Years | 157 (5.4%) | 74 (2.1%) |
| 60 to 64 Years | 285 (9.7%) | 292 (8.5%) |
| 65 to 69 Years | 42 (1.4%) | 109 (3.2%) |
| 70 to 74 Years | 97 (3.3%) | 116 (3.4%) |
| 75 to 79 Years | 47 (1.6%) | 22 (0.6%) |
| 80 to 84 Years | 10 (0.3%) | 26 (0.7%) |
| 85 Years and over | 12 (0.4%) | 34 (1.0%) |
| Total | 2,930 (100.0%) | 3,446 (100.0%) |
Families and Households in South Lebanon
Median Family Size in South Lebanon
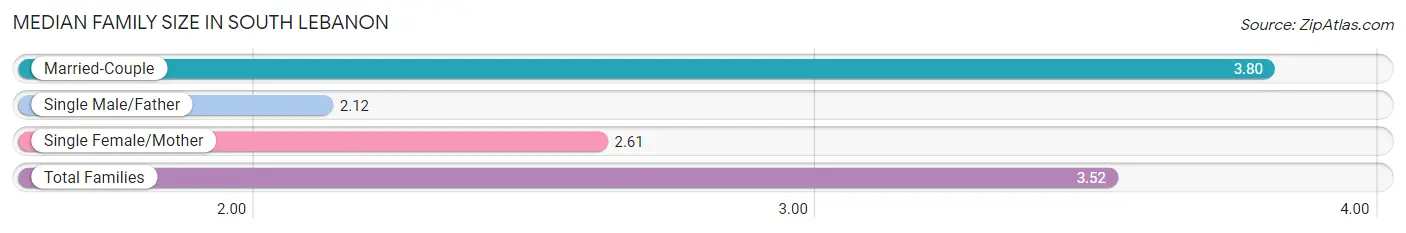
The median family size in South Lebanon is 3.52 persons per family, with married-couple families (1,202 | 78.0%) accounting for the largest median family size of 3.8 persons per family. On the other hand, single male/father families (65 | 4.2%) represent the smallest median family size with 2.12 persons per family.
| Family Type | # Families | Family Size |
| Married-Couple | 1,202 (78.0%) | 3.80 |
| Single Male/Father | 65 (4.2%) | 2.12 |
| Single Female/Mother | 273 (17.7%) | 2.61 |
| Total Families | 1,540 (100.0%) | 3.52 |
Median Household Size in South Lebanon
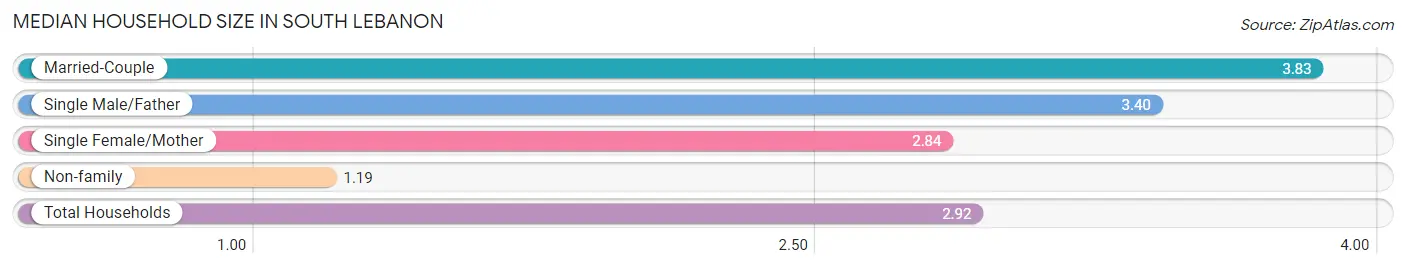
The median household size in South Lebanon is 2.92 persons per household, with married-couple households (1,202 | 55.2%) accounting for the largest median household size of 3.83 persons per household. non-family households (639 | 29.3%) represent the smallest median household size with 1.19 persons per household.
| Household Type | # Households | Household Size |
| Married-Couple | 1,202 (55.2%) | 3.83 |
| Single Male/Father | 65 (3.0%) | 3.40 |
| Single Female/Mother | 273 (12.5%) | 2.84 |
| Non-family | 639 (29.3%) | 1.19 |
| Total Households | 2,179 (100.0%) | 2.92 |
Household Size by Marriage Status in South Lebanon
Out of a total of 2,179 households in South Lebanon, 1,540 (70.7%) are family households, while 639 (29.3%) are nonfamily households. The most numerous type of family households are 4-person households, comprising 485, and the most common type of nonfamily households are 1-person households, comprising 522.
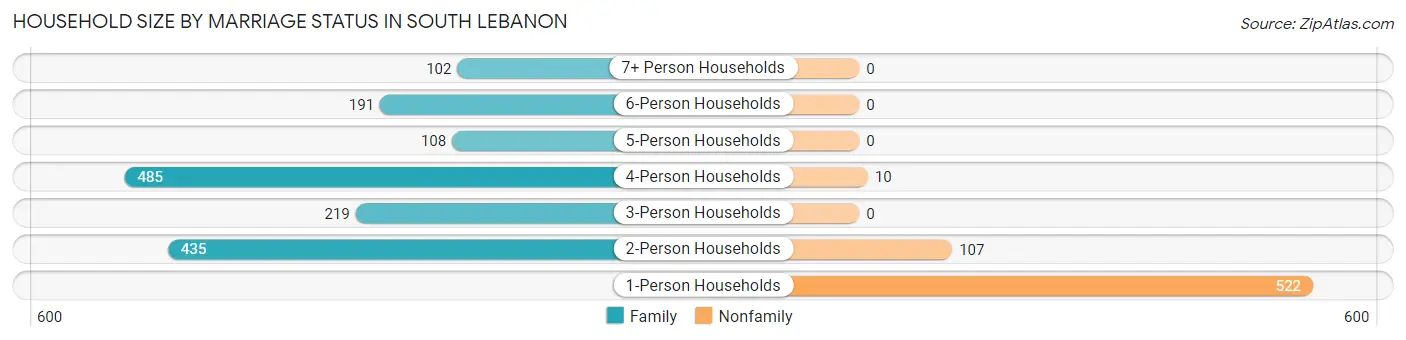
| Household Size | Family Households | Nonfamily Households |
| 1-Person Households | - | 522 (24.0%) |
| 2-Person Households | 435 (20.0%) | 107 (4.9%) |
| 3-Person Households | 219 (10.1%) | 0 (0.0%) |
| 4-Person Households | 485 (22.3%) | 10 (0.5%) |
| 5-Person Households | 108 (5.0%) | 0 (0.0%) |
| 6-Person Households | 191 (8.8%) | 0 (0.0%) |
| 7+ Person Households | 102 (4.7%) | 0 (0.0%) |
| Total | 1,540 (70.7%) | 639 (29.3%) |
Female Fertility in South Lebanon
Fertility by Age in South Lebanon
Average fertility rate in South Lebanon is 58.0 births per 1,000 women. Women in the age bracket of 15 to 19 years have the highest fertility rate with 145.0 births per 1,000 women. Women in the age bracket of 20 to 34 years acount for 63.4% of all women with births.
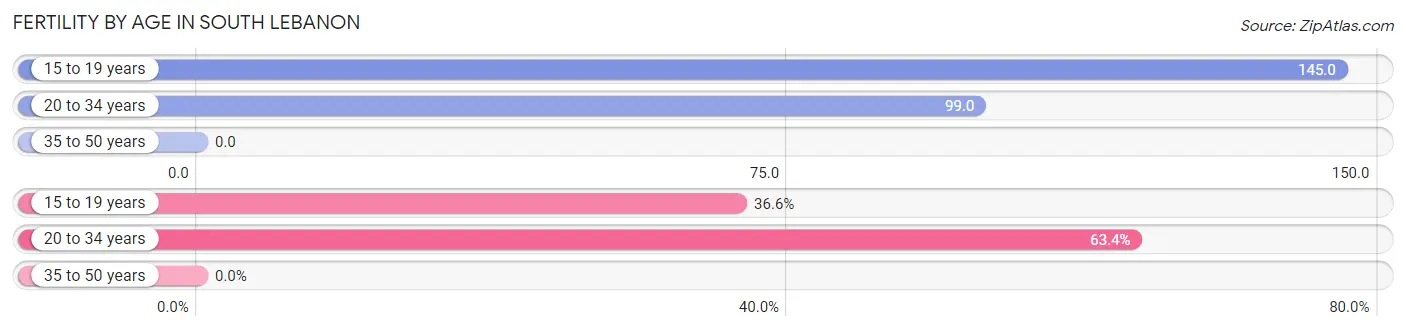
| Age Bracket | Women with Births | Births / 1,000 Women |
| 15 to 19 years | 30 (36.6%) | 145.0 |
| 20 to 34 years | 52 (63.4%) | 99.0 |
| 35 to 50 years | 0 (0.0%) | 0.0 |
| Total | 82 (100.0%) | 58.0 |
Fertility by Age by Marriage Status in South Lebanon
63.4% of women with births (82) in South Lebanon are married. The highest percentage of unmarried women with births falls into 15 to 19 years age bracket with 100.0% of them unmarried at the time of birth, while the lowest percentage of unmarried women with births belong to 20 to 34 years age bracket with 0.0% of them unmarried.
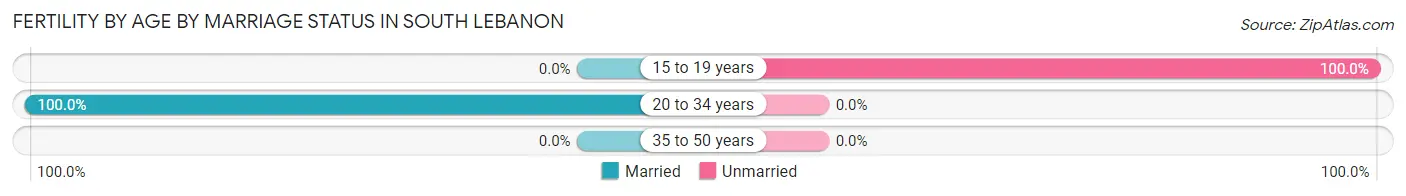
| Age Bracket | Married | Unmarried |
| 15 to 19 years | 0 (0.0%) | 30 (100.0%) |
| 20 to 34 years | 52 (100.0%) | 0 (0.0%) |
| 35 to 50 years | 0 (0.0%) | 0 (0.0%) |
| Total | 52 (63.4%) | 30 (36.6%) |
Fertility by Education in South Lebanon
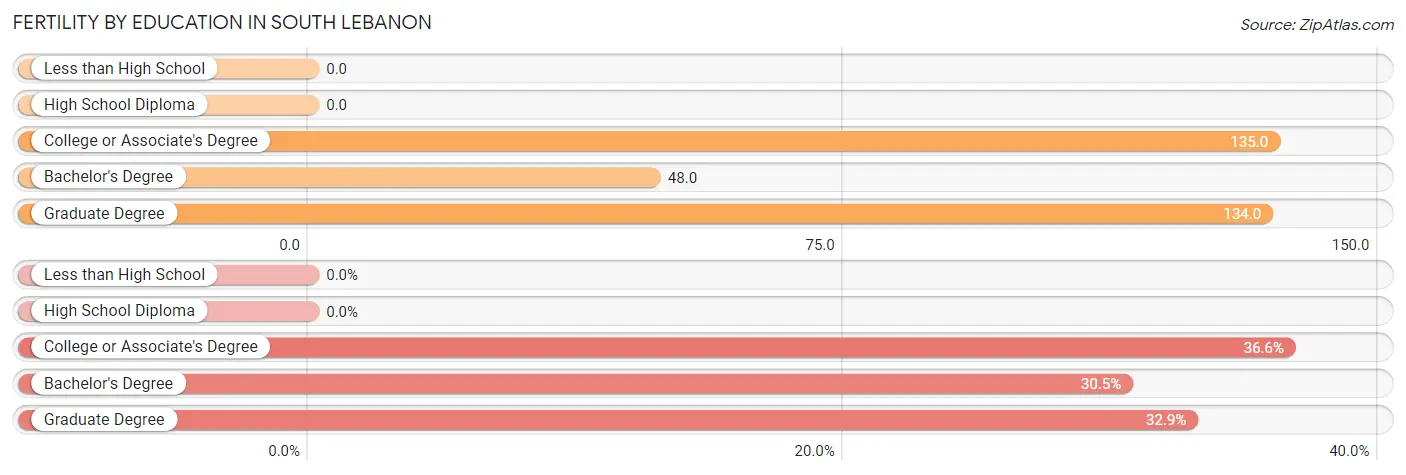
| Educational Attainment | Women with Births | Births / 1,000 Women |
| Less than High School | 0 (0.0%) | 0.0 |
| High School Diploma | 0 (0.0%) | 0.0 |
| College or Associate's Degree | 30 (36.6%) | 135.0 |
| Bachelor's Degree | 25 (30.5%) | 48.0 |
| Graduate Degree | 27 (32.9%) | 134.0 |
| Total | 82 (100.0%) | 58.0 |
Fertility by Education by Marriage Status in South Lebanon
36.6% of women with births in South Lebanon are unmarried. Women with the educational attainment of bachelor's degree are most likely to be married with 100.0% of them married at childbirth, while women with the educational attainment of college or associate's degree are least likely to be married with 100.0% of them unmarried at childbirth.
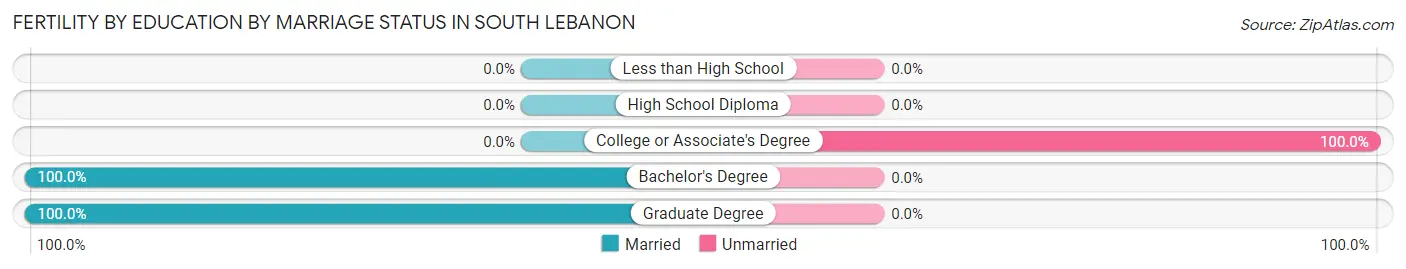
| Educational Attainment | Married | Unmarried |
| Less than High School | 0 (0.0%) | 0 (0.0%) |
| High School Diploma | 0 (0.0%) | 0 (0.0%) |
| College or Associate's Degree | 0 (0.0%) | 30 (100.0%) |
| Bachelor's Degree | 25 (100.0%) | 0 (0.0%) |
| Graduate Degree | 27 (100.0%) | 0 (0.0%) |
| Total | 52 (63.4%) | 30 (36.6%) |
Employment Characteristics in South Lebanon
Employment by Class of Employer in South Lebanon
Among the 2,995 employed individuals in South Lebanon, private company employees (2,284 | 76.3%), not-for-profit organizations (206 | 6.9%), and local government employees (169 | 5.6%) make up the most common classes of employment.
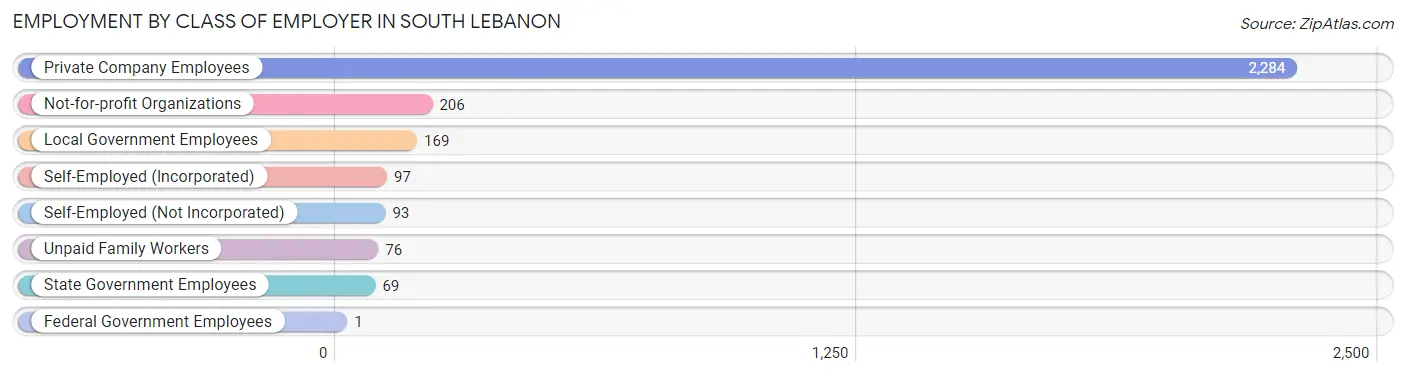
| Employer Class | # Employees | % Employees |
| Private Company Employees | 2,284 | 76.3% |
| Self-Employed (Incorporated) | 97 | 3.2% |
| Self-Employed (Not Incorporated) | 93 | 3.1% |
| Not-for-profit Organizations | 206 | 6.9% |
| Local Government Employees | 169 | 5.6% |
| State Government Employees | 69 | 2.3% |
| Federal Government Employees | 1 | 0.0% |
| Unpaid Family Workers | 76 | 2.5% |
| Total | 2,995 | 100.0% |
Employment Status by Age in South Lebanon
According to the labor force statistics for South Lebanon, out of the total population over 16 years of age (4,592), 77.0% or 3,536 individuals are in the labor force, with 14.4% or 509 of them unemployed. The age group with the highest labor force participation rate is 30 to 34 years, with 97.5% or 389 individuals in the labor force. Within the labor force, the 60 to 64 years age range has the highest percentage of unemployed individuals, with 66.6% or 371 of them being unemployed.
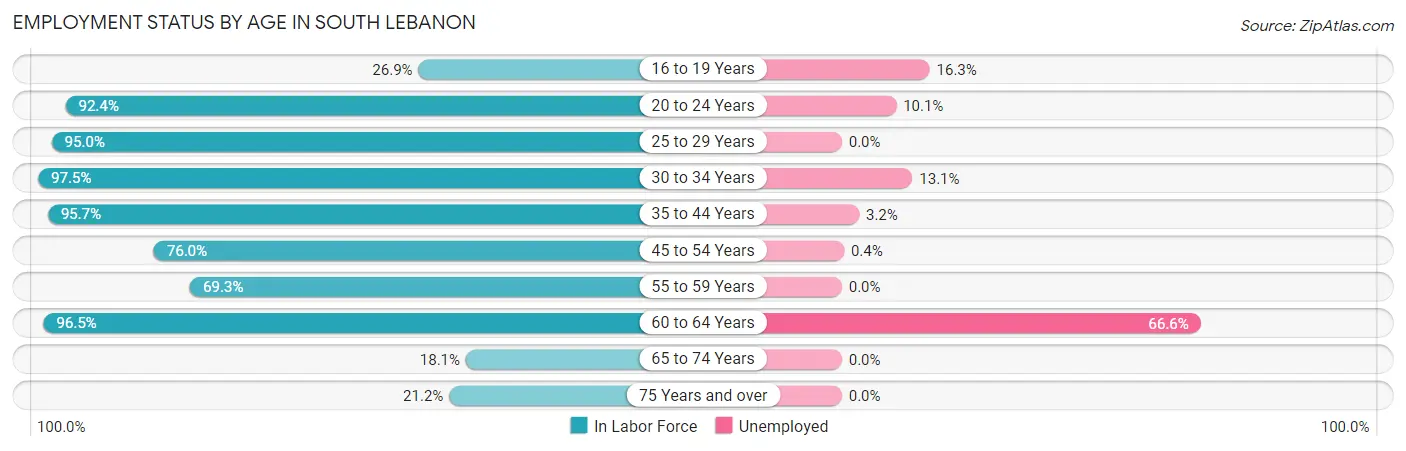
| Age Bracket | In Labor Force | Unemployed |
| 16 to 19 Years | 104 (26.9%) | 17 (16.3%) |
| 20 to 24 Years | 355 (92.4%) | 36 (10.1%) |
| 25 to 29 Years | 395 (95.0%) | 0 (0.0%) |
| 30 to 34 Years | 389 (97.5%) | 51 (13.1%) |
| 35 to 44 Years | 968 (95.7%) | 31 (3.2%) |
| 45 to 54 Years | 510 (76.0%) | 2 (0.4%) |
| 55 to 59 Years | 160 (69.3%) | 0 (0.0%) |
| 60 to 64 Years | 557 (96.5%) | 371 (66.6%) |
| 65 to 74 Years | 66 (18.1%) | 0 (0.0%) |
| 75 Years and over | 32 (21.2%) | 0 (0.0%) |
| Total | 3,536 (77.0%) | 509 (14.4%) |
Employment Status by Educational Attainment in South Lebanon
According to labor force statistics for South Lebanon, 90.1% of individuals (2,979) out of the total population between 25 and 64 years of age (3,306) are in the labor force, with 15.3% or 456 of them being unemployed. The group with the highest labor force participation rate are those with the educational attainment of bachelor's degree or higher, with 95.2% or 1,499 individuals in the labor force. Within the labor force, individuals with high school diploma education have the highest percentage of unemployment, with 37.7% or 371 of them being unemployed.
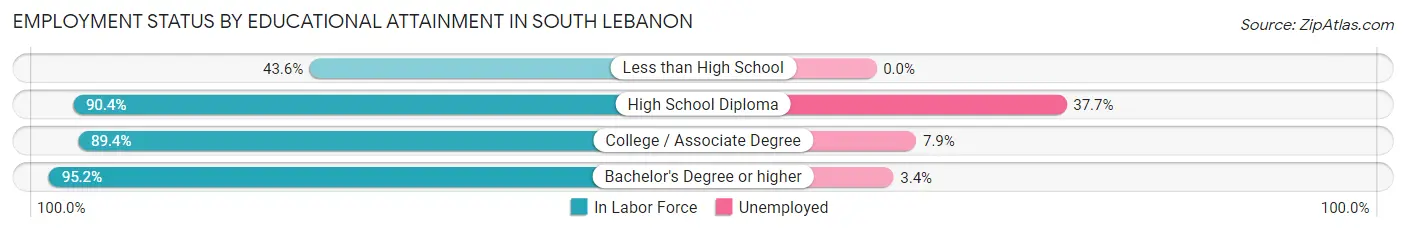
| Educational Attainment | In Labor Force | Unemployed |
| Less than High School | 75 (43.6%) | 0 (0.0%) |
| High School Diploma | 984 (90.4%) | 411 (37.7%) |
| College / Associate Degree | 420 (89.4%) | 37 (7.9%) |
| Bachelor's Degree or higher | 1,499 (95.2%) | 54 (3.4%) |
| Total | 2,979 (90.1%) | 506 (15.3%) |
Employment Occupations by Sex in South Lebanon
Management, Business, Science and Arts Occupations
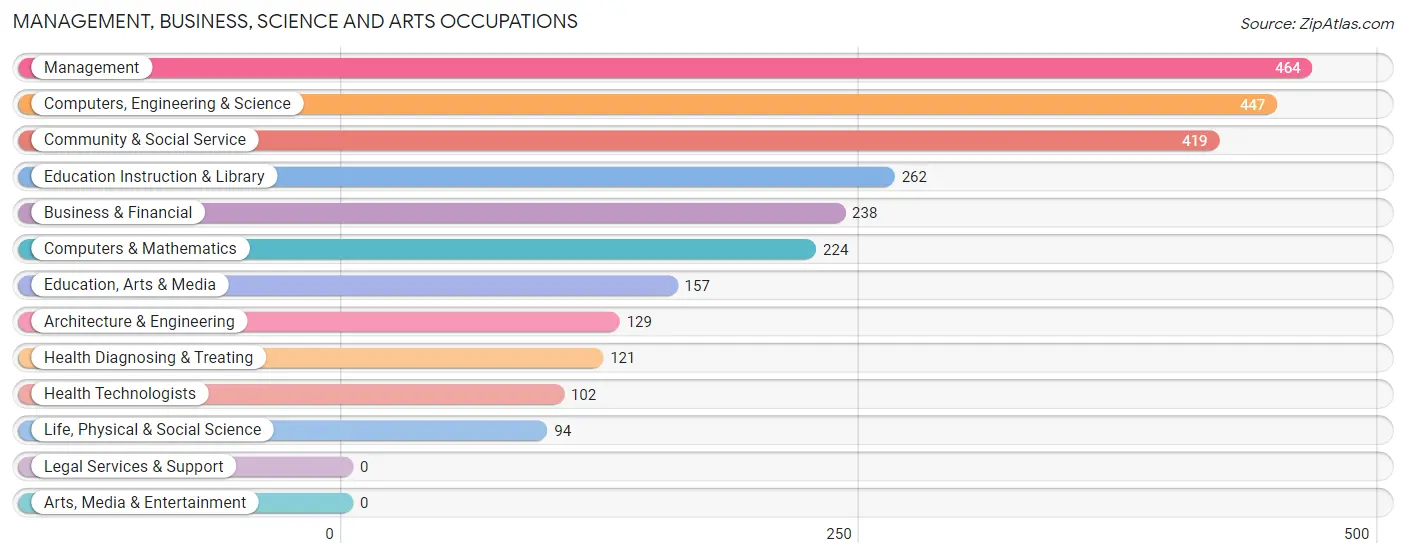
The most common Management, Business, Science and Arts occupations in South Lebanon are Management (464 | 15.3%), Computers, Engineering & Science (447 | 14.8%), Community & Social Service (419 | 13.8%), Education Instruction & Library (262 | 8.6%), and Business & Financial (238 | 7.9%).
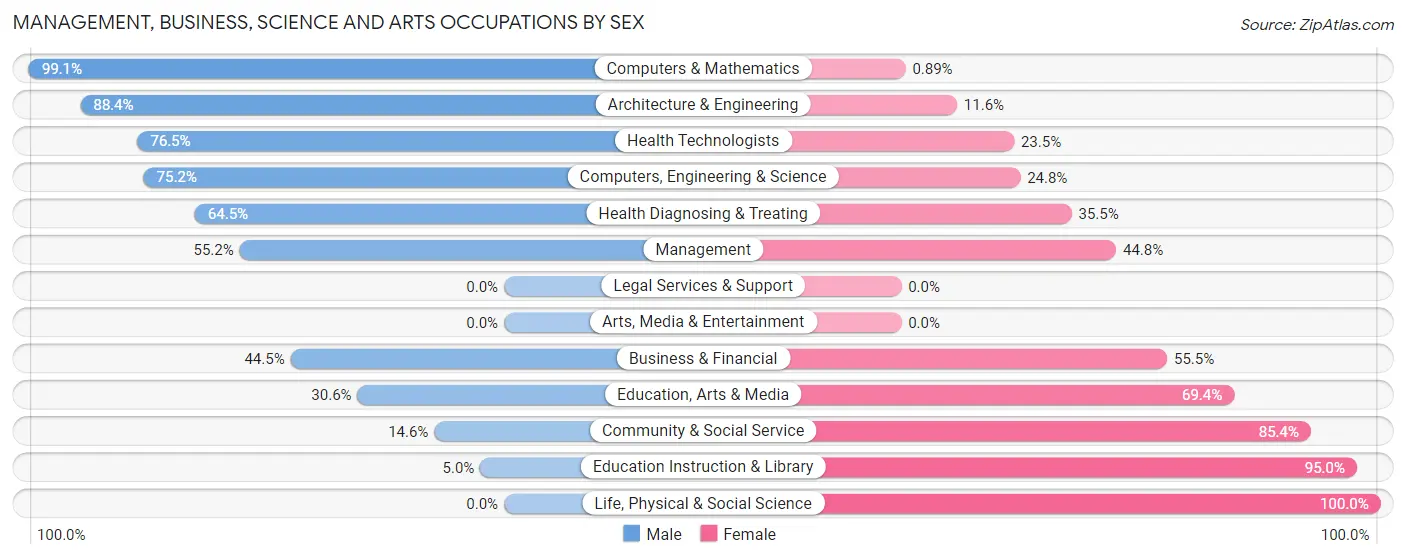
Management, Business, Science and Arts Occupations by Sex
Within the Management, Business, Science and Arts occupations in South Lebanon, the most male-oriented occupations are Computers & Mathematics (99.1%), Architecture & Engineering (88.4%), and Health Technologists (76.5%), while the most female-oriented occupations are Life, Physical & Social Science (100.0%), Education Instruction & Library (95.0%), and Community & Social Service (85.4%).
| Occupation | Male | Female |
| Management | 256 (55.2%) | 208 (44.8%) |
| Business & Financial | 106 (44.5%) | 132 (55.5%) |
| Computers, Engineering & Science | 336 (75.2%) | 111 (24.8%) |
| Computers & Mathematics | 222 (99.1%) | 2 (0.9%) |
| Architecture & Engineering | 114 (88.4%) | 15 (11.6%) |
| Life, Physical & Social Science | 0 (0.0%) | 94 (100.0%) |
| Community & Social Service | 61 (14.6%) | 358 (85.4%) |
| Education, Arts & Media | 48 (30.6%) | 109 (69.4%) |
| Legal Services & Support | 0 (0.0%) | 0 (0.0%) |
| Education Instruction & Library | 13 (5.0%) | 249 (95.0%) |
| Arts, Media & Entertainment | 0 (0.0%) | 0 (0.0%) |
| Health Diagnosing & Treating | 78 (64.5%) | 43 (35.5%) |
| Health Technologists | 78 (76.5%) | 24 (23.5%) |
| Total (Category) | 837 (49.6%) | 852 (50.4%) |
| Total (Overall) | 1,707 (56.4%) | 1,321 (43.6%) |
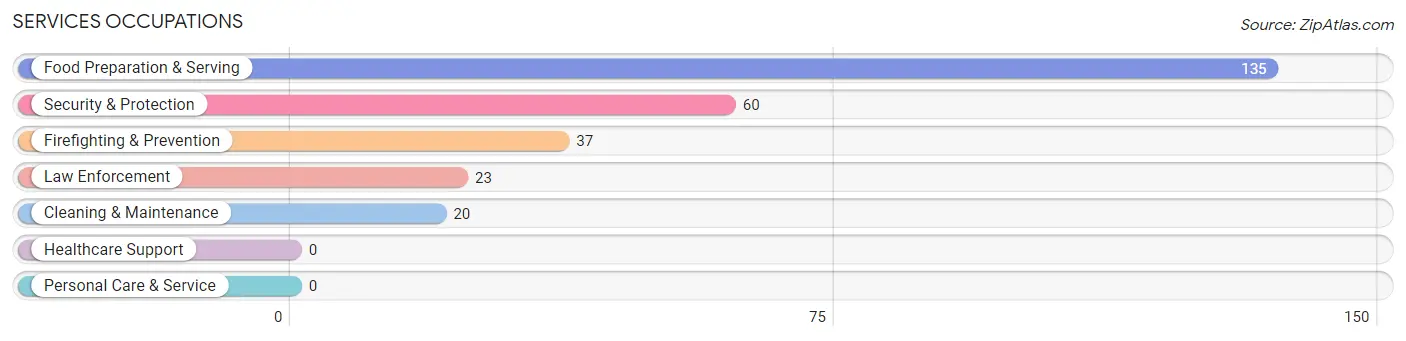
Services Occupations
The most common Services occupations in South Lebanon are Food Preparation & Serving (135 | 4.5%), Security & Protection (60 | 2.0%), Firefighting & Prevention (37 | 1.2%), Law Enforcement (23 | 0.8%), and Cleaning & Maintenance (20 | 0.7%).
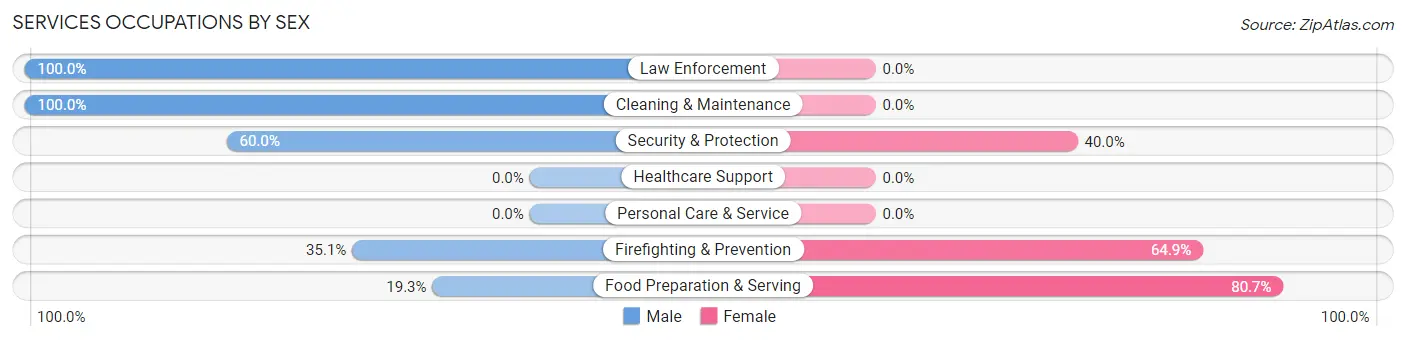
Services Occupations by Sex
Within the Services occupations in South Lebanon, the most male-oriented occupations are Law Enforcement (100.0%), Cleaning & Maintenance (100.0%), and Security & Protection (60.0%), while the most female-oriented occupations are Food Preparation & Serving (80.7%), Firefighting & Prevention (64.9%), and Security & Protection (40.0%).
| Occupation | Male | Female |
| Healthcare Support | 0 (0.0%) | 0 (0.0%) |
| Security & Protection | 36 (60.0%) | 24 (40.0%) |
| Firefighting & Prevention | 13 (35.1%) | 24 (64.9%) |
| Law Enforcement | 23 (100.0%) | 0 (0.0%) |
| Food Preparation & Serving | 26 (19.3%) | 109 (80.7%) |
| Cleaning & Maintenance | 20 (100.0%) | 0 (0.0%) |
| Personal Care & Service | 0 (0.0%) | 0 (0.0%) |
| Total (Category) | 82 (38.1%) | 133 (61.9%) |
| Total (Overall) | 1,707 (56.4%) | 1,321 (43.6%) |
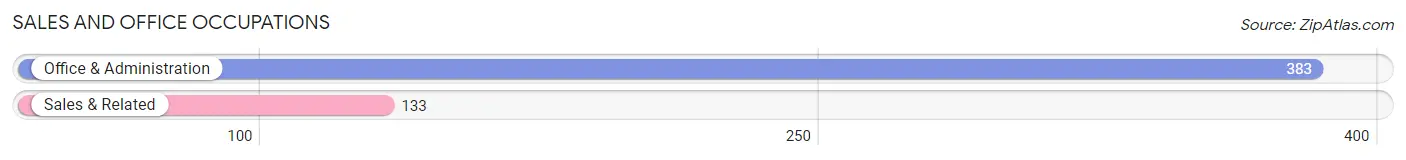
Sales and Office Occupations
The most common Sales and Office occupations in South Lebanon are Office & Administration (383 | 12.7%), and Sales & Related (133 | 4.4%).
Sales and Office Occupations by Sex
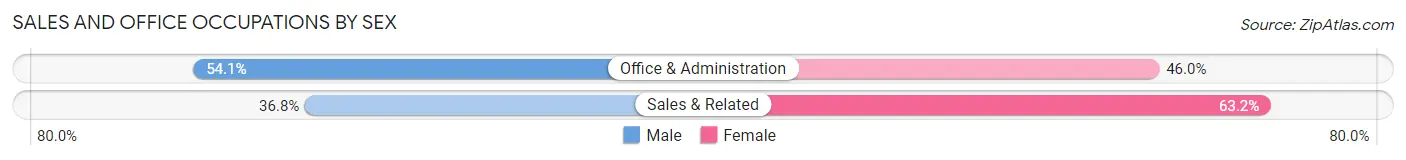
| Occupation | Male | Female |
| Sales & Related | 49 (36.8%) | 84 (63.2%) |
| Office & Administration | 207 (54.0%) | 176 (46.0%) |
| Total (Category) | 256 (49.6%) | 260 (50.4%) |
| Total (Overall) | 1,707 (56.4%) | 1,321 (43.6%) |
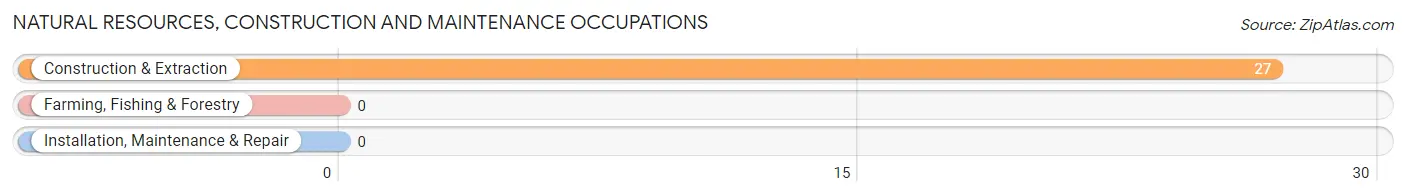
Natural Resources, Construction and Maintenance Occupations
The most common Natural Resources, Construction and Maintenance occupations in South Lebanon are , and Construction & Extraction (27 | 0.9%).
Natural Resources, Construction and Maintenance Occupations by Sex
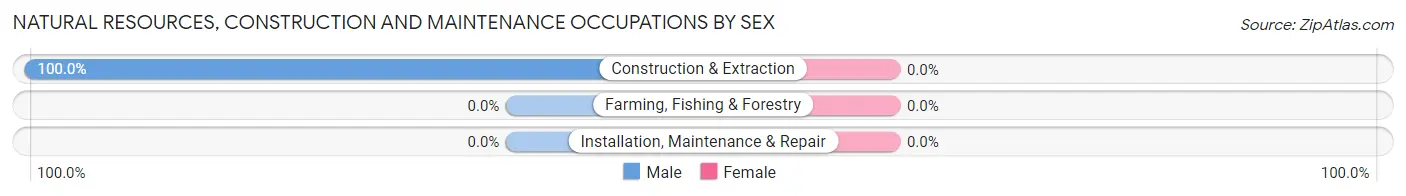
| Occupation | Male | Female |
| Farming, Fishing & Forestry | 0 (0.0%) | 0 (0.0%) |
| Construction & Extraction | 27 (100.0%) | 0 (0.0%) |
| Installation, Maintenance & Repair | 0 (0.0%) | 0 (0.0%) |
| Total (Category) | 27 (100.0%) | 0 (0.0%) |
| Total (Overall) | 1,707 (56.4%) | 1,321 (43.6%) |
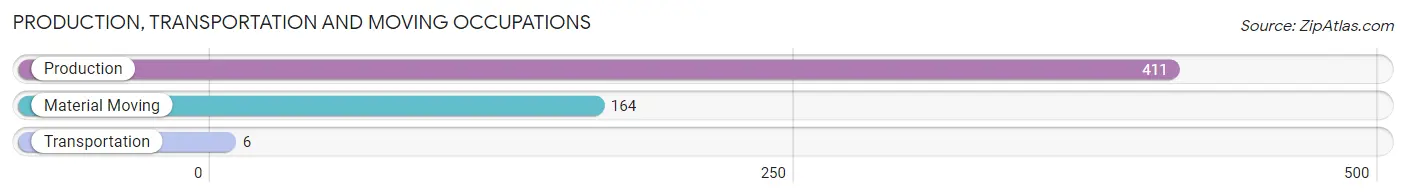
Production, Transportation and Moving Occupations
The most common Production, Transportation and Moving occupations in South Lebanon are Production (411 | 13.6%), Material Moving (164 | 5.4%), and Transportation (6 | 0.2%).
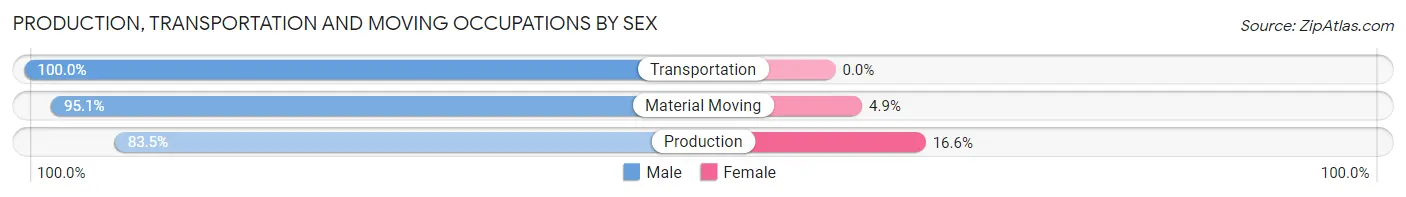
Production, Transportation and Moving Occupations by Sex
| Occupation | Male | Female |
| Production | 343 (83.5%) | 68 (16.6%) |
| Transportation | 6 (100.0%) | 0 (0.0%) |
| Material Moving | 156 (95.1%) | 8 (4.9%) |
| Total (Category) | 505 (86.9%) | 76 (13.1%) |
| Total (Overall) | 1,707 (56.4%) | 1,321 (43.6%) |
Employment Industries by Sex in South Lebanon
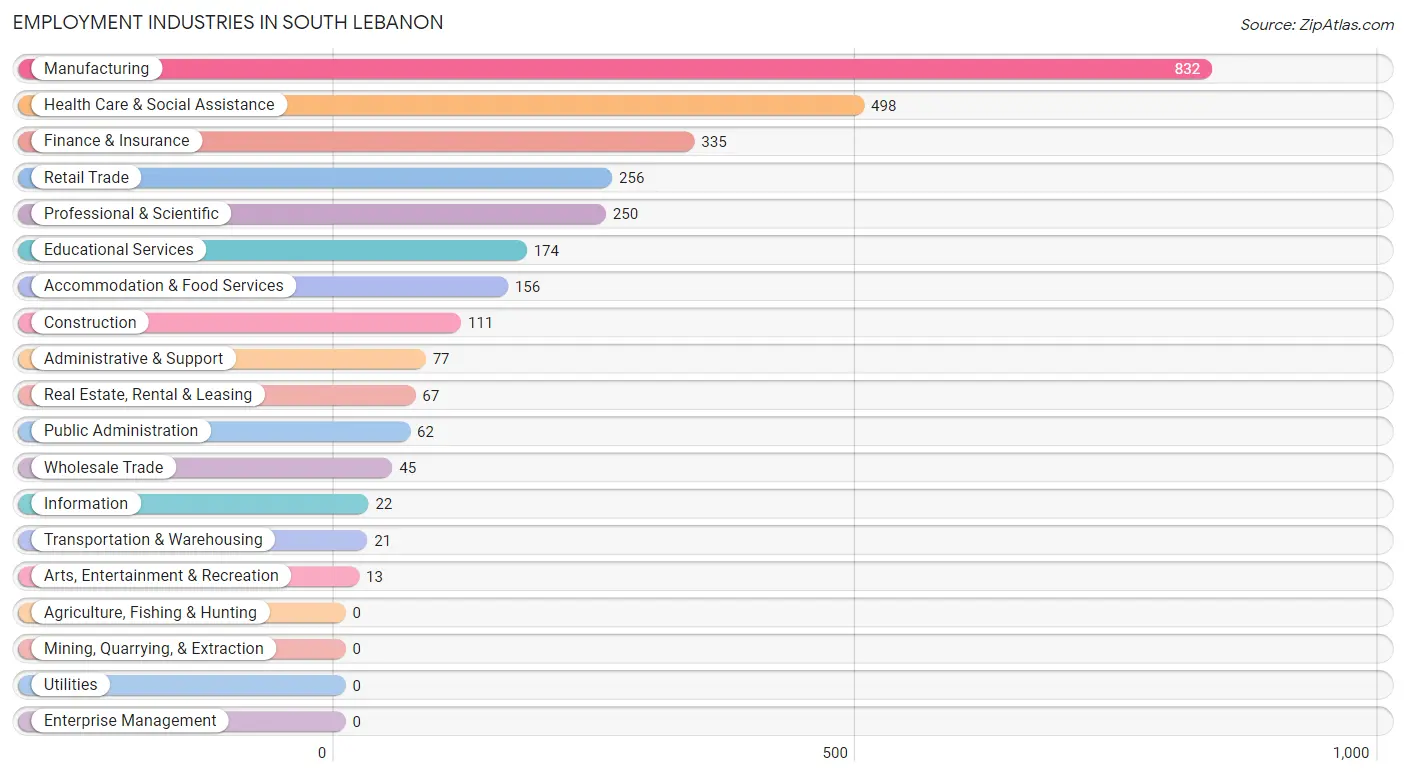
Employment Industries in South Lebanon
The major employment industries in South Lebanon include Manufacturing (832 | 27.5%), Health Care & Social Assistance (498 | 16.5%), Finance & Insurance (335 | 11.1%), Retail Trade (256 | 8.5%), and Professional & Scientific (250 | 8.3%).
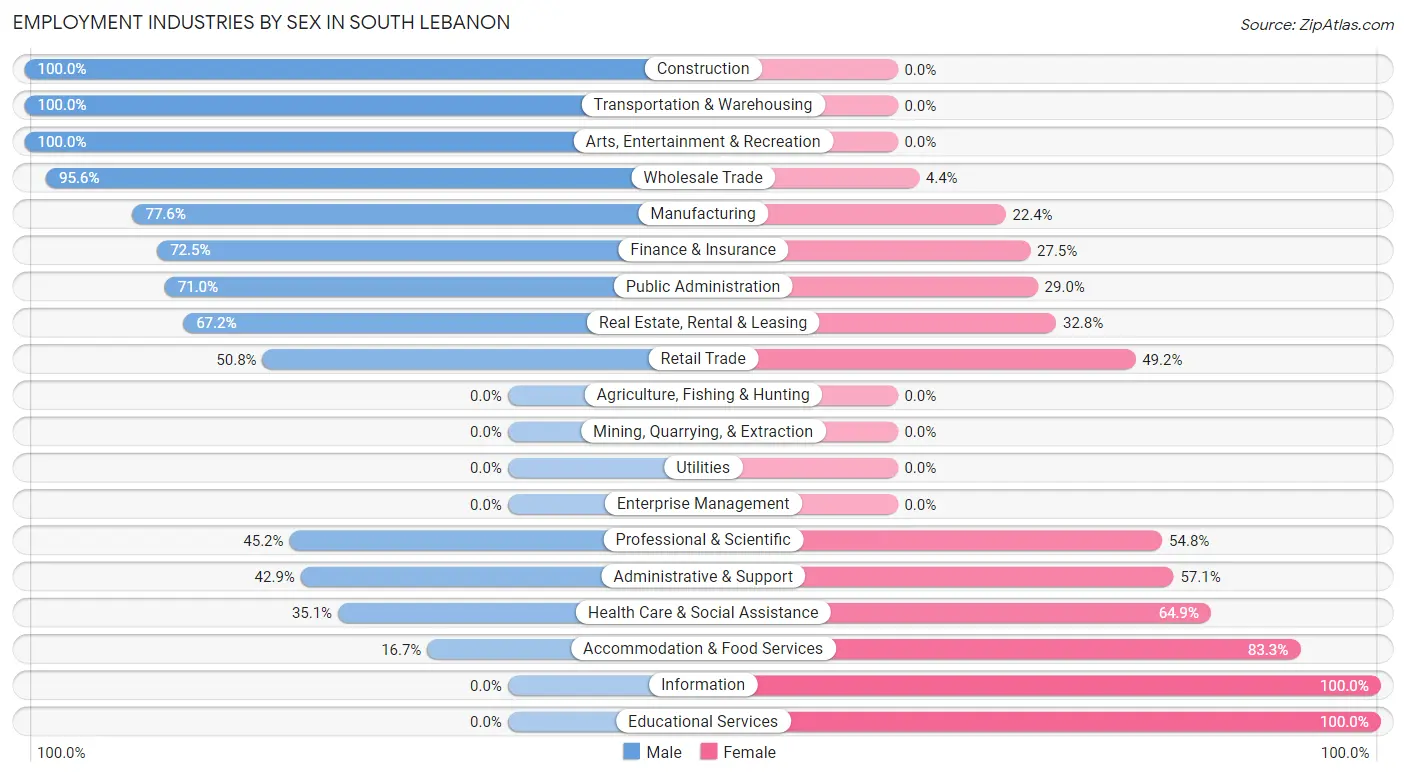
Employment Industries by Sex in South Lebanon
The South Lebanon industries that see more men than women are Construction (100.0%), Transportation & Warehousing (100.0%), and Arts, Entertainment & Recreation (100.0%), whereas the industries that tend to have a higher number of women are Information (100.0%), Educational Services (100.0%), and Accommodation & Food Services (83.3%).
| Industry | Male | Female |
| Agriculture, Fishing & Hunting | 0 (0.0%) | 0 (0.0%) |
| Mining, Quarrying, & Extraction | 0 (0.0%) | 0 (0.0%) |
| Construction | 111 (100.0%) | 0 (0.0%) |
| Manufacturing | 646 (77.6%) | 186 (22.4%) |
| Wholesale Trade | 43 (95.6%) | 2 (4.4%) |
| Retail Trade | 130 (50.8%) | 126 (49.2%) |
| Transportation & Warehousing | 21 (100.0%) | 0 (0.0%) |
| Utilities | 0 (0.0%) | 0 (0.0%) |
| Information | 0 (0.0%) | 22 (100.0%) |
| Finance & Insurance | 243 (72.5%) | 92 (27.5%) |
| Real Estate, Rental & Leasing | 45 (67.2%) | 22 (32.8%) |
| Professional & Scientific | 113 (45.2%) | 137 (54.8%) |
| Enterprise Management | 0 (0.0%) | 0 (0.0%) |
| Administrative & Support | 33 (42.9%) | 44 (57.1%) |
| Educational Services | 0 (0.0%) | 174 (100.0%) |
| Health Care & Social Assistance | 175 (35.1%) | 323 (64.9%) |
| Arts, Entertainment & Recreation | 13 (100.0%) | 0 (0.0%) |
| Accommodation & Food Services | 26 (16.7%) | 130 (83.3%) |
| Public Administration | 44 (71.0%) | 18 (29.0%) |
| Total | 1,707 (56.4%) | 1,321 (43.6%) |
Education in South Lebanon
School Enrollment in South Lebanon
The most common levels of schooling among the 2,033 students in South Lebanon are elementary school (601 | 29.6%), middle school (595 | 29.3%), and high school (470 | 23.1%).
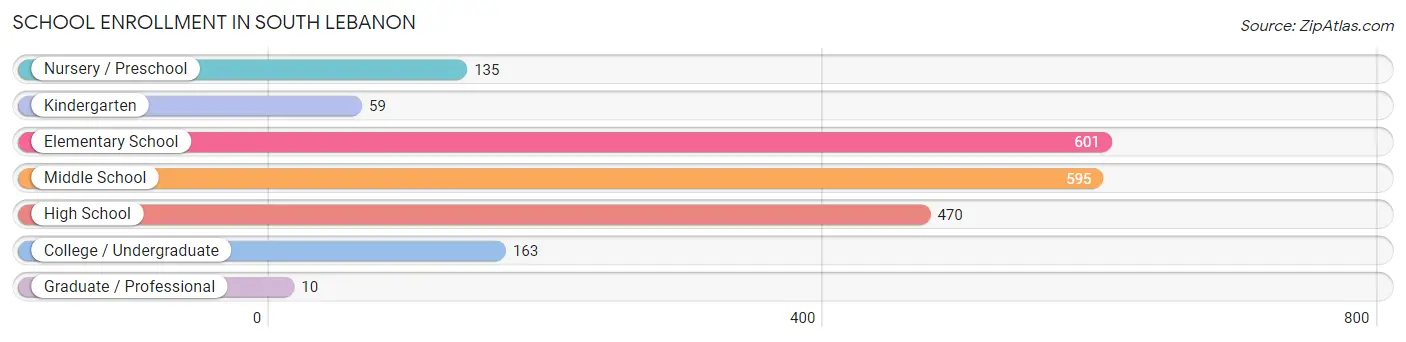
| School Level | # Students | % Students |
| Nursery / Preschool | 135 | 6.6% |
| Kindergarten | 59 | 2.9% |
| Elementary School | 601 | 29.6% |
| Middle School | 595 | 29.3% |
| High School | 470 | 23.1% |
| College / Undergraduate | 163 | 8.0% |
| Graduate / Professional | 10 | 0.5% |
| Total | 2,033 | 100.0% |
School Enrollment by Age by Funding Source in South Lebanon
Out of a total of 2,033 students who are enrolled in schools in South Lebanon, 191 (9.4%) attend a private institution, while the remaining 1,842 (90.6%) are enrolled in public schools. The age group of 3 to 4 year olds has the highest likelihood of being enrolled in private schools, with 61 (58.7% in the age bracket) enrolled. Conversely, the age group of 5 to 9 year old has the lowest likelihood of being enrolled in a private school, with 515 (100.0% in the age bracket) attending a public institution.
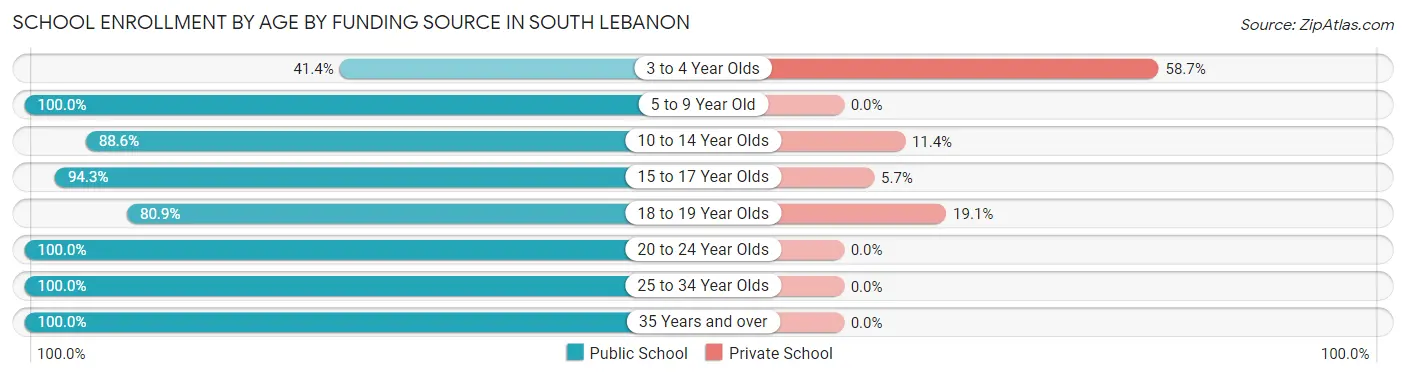
| Age Bracket | Public School | Private School |
| 3 to 4 Year Olds | 43 (41.3%) | 61 (58.7%) |
| 5 to 9 Year Old | 515 (100.0%) | 0 (0.0%) |
| 10 to 14 Year Olds | 683 (88.6%) | 88 (11.4%) |
| 15 to 17 Year Olds | 366 (94.3%) | 22 (5.7%) |
| 18 to 19 Year Olds | 89 (80.9%) | 21 (19.1%) |
| 20 to 24 Year Olds | 112 (100.0%) | 0 (0.0%) |
| 25 to 34 Year Olds | 10 (100.0%) | 0 (0.0%) |
| 35 Years and over | 23 (100.0%) | 0 (0.0%) |
| Total | 1,842 (90.6%) | 191 (9.4%) |
Educational Attainment by Field of Study in South Lebanon
Business (395 | 20.4%), engineering (269 | 13.9%), education (216 | 11.2%), bio, nature & agricultural (172 | 8.9%), and science & technology (166 | 8.6%) are the most common fields of study among 1,936 individuals in South Lebanon who have obtained a bachelor's degree or higher.
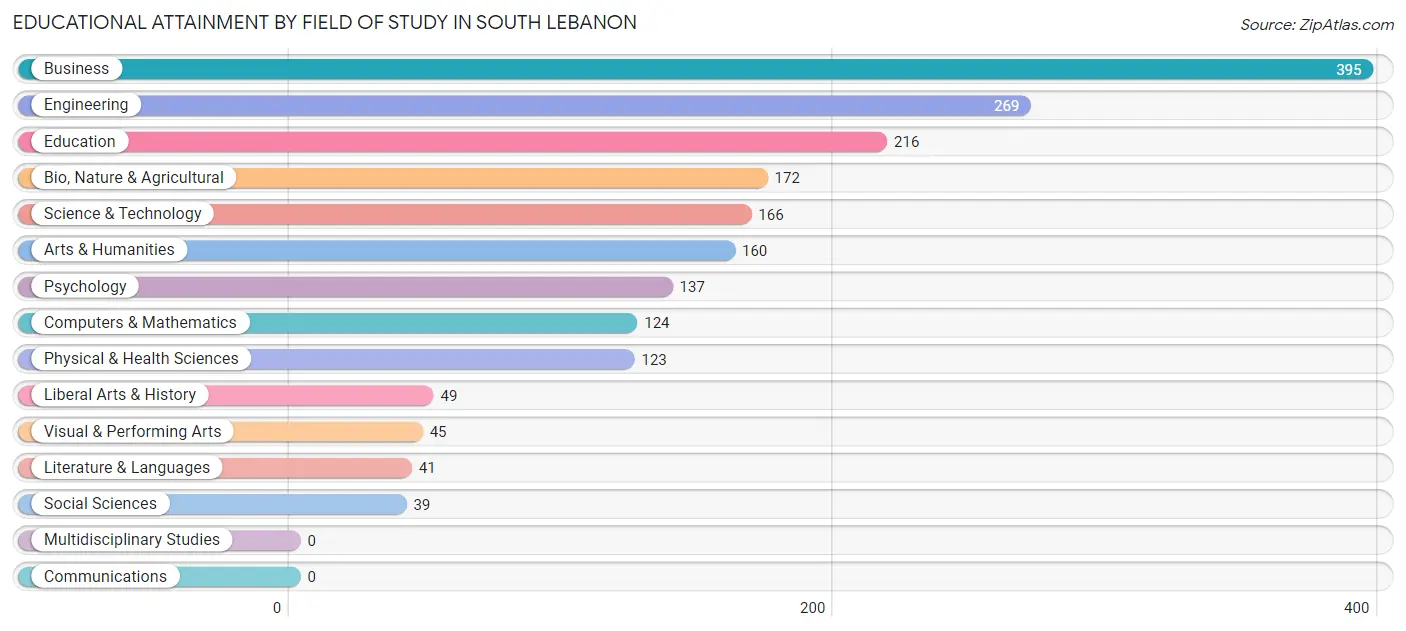
| Field of Study | # Graduates | % Graduates |
| Computers & Mathematics | 124 | 6.4% |
| Bio, Nature & Agricultural | 172 | 8.9% |
| Physical & Health Sciences | 123 | 6.4% |
| Psychology | 137 | 7.1% |
| Social Sciences | 39 | 2.0% |
| Engineering | 269 | 13.9% |
| Multidisciplinary Studies | 0 | 0.0% |
| Science & Technology | 166 | 8.6% |
| Business | 395 | 20.4% |
| Education | 216 | 11.2% |
| Literature & Languages | 41 | 2.1% |
| Liberal Arts & History | 49 | 2.5% |
| Visual & Performing Arts | 45 | 2.3% |
| Communications | 0 | 0.0% |
| Arts & Humanities | 160 | 8.3% |
| Total | 1,936 | 100.0% |
Transportation & Commute in South Lebanon
Vehicle Availability by Sex in South Lebanon
The most prevalent vehicle ownership categories in South Lebanon are males with 2 vehicles (625, accounting for 36.8%) and females with 2 vehicles (536, making up 48.3%).
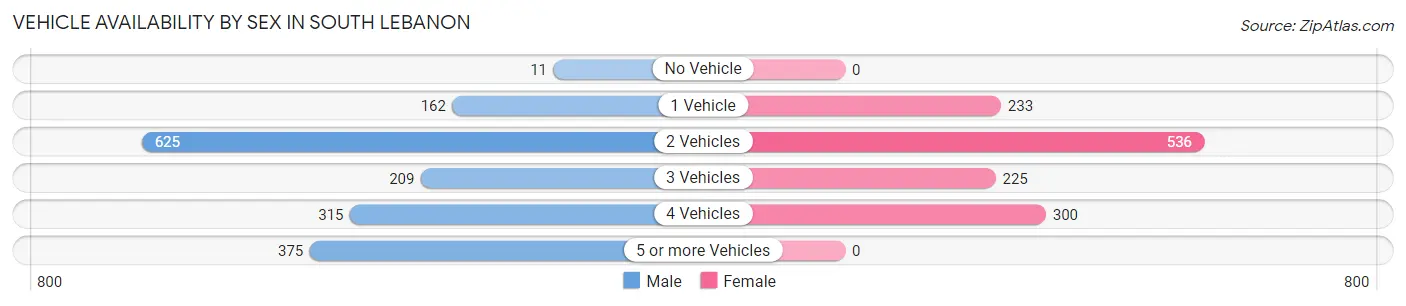
| Vehicles Available | Male | Female |
| No Vehicle | 11 (0.6%) | 0 (0.0%) |
| 1 Vehicle | 162 (9.6%) | 233 (18.0%) |
| 2 Vehicles | 625 (36.8%) | 536 (41.4%) |
| 3 Vehicles | 209 (12.3%) | 225 (17.4%) |
| 4 Vehicles | 315 (18.6%) | 300 (23.2%) |
| 5 or more Vehicles | 375 (22.1%) | 0 (0.0%) |
| Total | 1,697 (100.0%) | 1,294 (100.0%) |
Commute Time in South Lebanon
The most frequently occuring commute durations in South Lebanon are 20 to 24 minutes (570 commuters, 22.3%), 30 to 34 minutes (465 commuters, 18.2%), and 15 to 19 minutes (430 commuters, 16.8%).
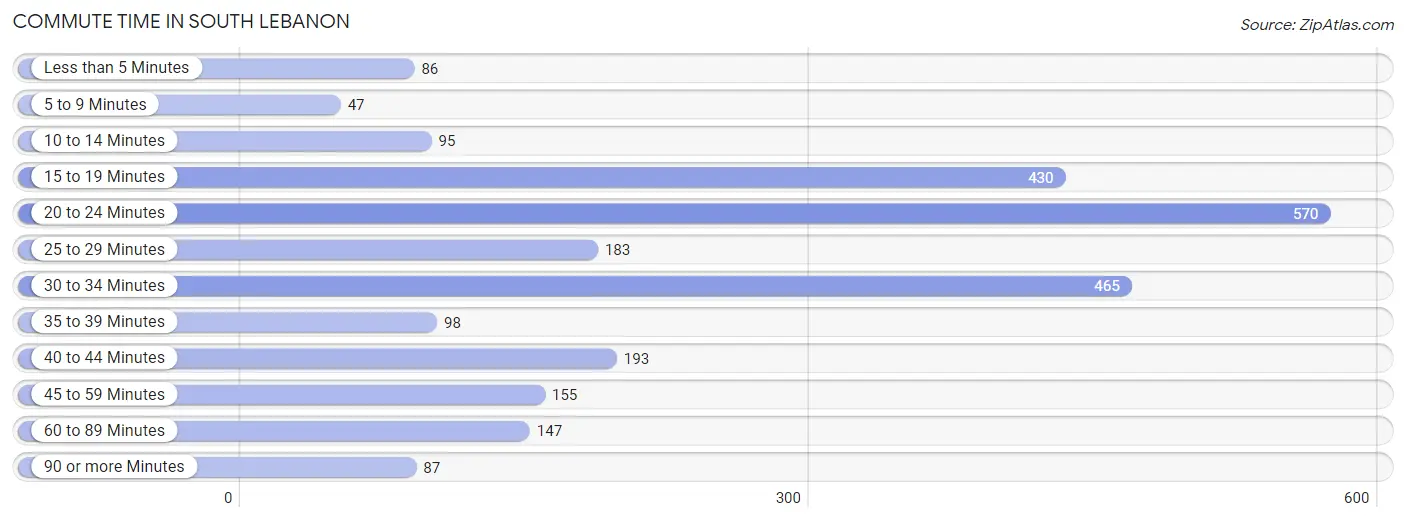
| Commute Time | # Commuters | % Commuters |
| Less than 5 Minutes | 86 | 3.4% |
| 5 to 9 Minutes | 47 | 1.8% |
| 10 to 14 Minutes | 95 | 3.7% |
| 15 to 19 Minutes | 430 | 16.8% |
| 20 to 24 Minutes | 570 | 22.3% |
| 25 to 29 Minutes | 183 | 7.2% |
| 30 to 34 Minutes | 465 | 18.2% |
| 35 to 39 Minutes | 98 | 3.8% |
| 40 to 44 Minutes | 193 | 7.5% |
| 45 to 59 Minutes | 155 | 6.1% |
| 60 to 89 Minutes | 147 | 5.8% |
| 90 or more Minutes | 87 | 3.4% |
Commute Time by Sex in South Lebanon
The most common commute times in South Lebanon are 20 to 24 minutes (432 commuters, 31.1%) for males and 15 to 19 minutes (321 commuters, 27.5%) for females.
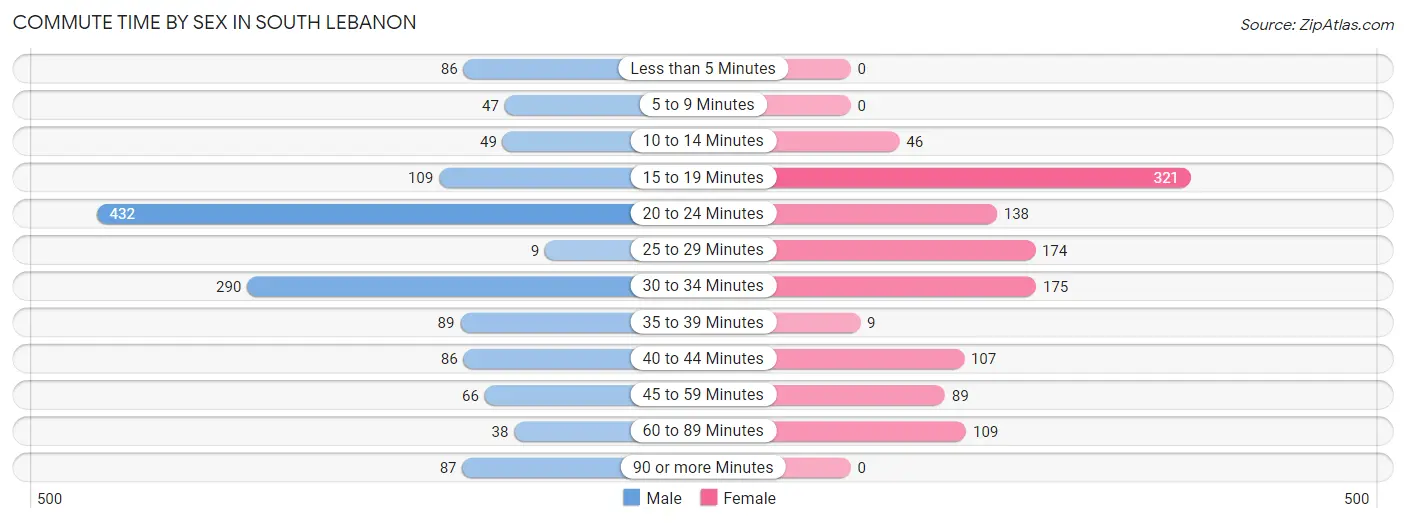
| Commute Time | Male | Female |
| Less than 5 Minutes | 86 (6.2%) | 0 (0.0%) |
| 5 to 9 Minutes | 47 (3.4%) | 0 (0.0%) |
| 10 to 14 Minutes | 49 (3.5%) | 46 (3.9%) |
| 15 to 19 Minutes | 109 (7.9%) | 321 (27.5%) |
| 20 to 24 Minutes | 432 (31.1%) | 138 (11.8%) |
| 25 to 29 Minutes | 9 (0.6%) | 174 (14.9%) |
| 30 to 34 Minutes | 290 (20.9%) | 175 (15.0%) |
| 35 to 39 Minutes | 89 (6.4%) | 9 (0.8%) |
| 40 to 44 Minutes | 86 (6.2%) | 107 (9.2%) |
| 45 to 59 Minutes | 66 (4.8%) | 89 (7.6%) |
| 60 to 89 Minutes | 38 (2.7%) | 109 (9.3%) |
| 90 or more Minutes | 87 (6.3%) | 0 (0.0%) |
Time of Departure to Work by Sex in South Lebanon
The most frequent times of departure to work in South Lebanon are 8:00 AM to 8:29 AM (323, 23.3%) for males and 7:00 AM to 7:29 AM (317, 27.1%) for females.
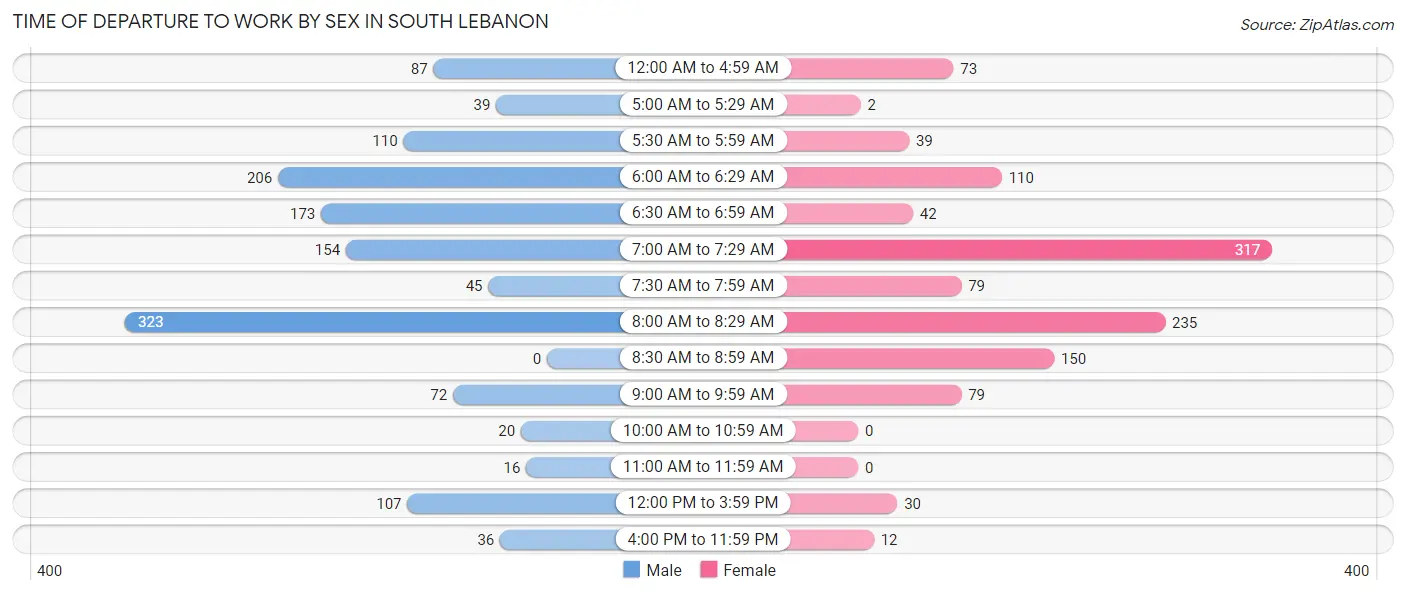
| Time of Departure | Male | Female |
| 12:00 AM to 4:59 AM | 87 (6.3%) | 73 (6.2%) |
| 5:00 AM to 5:29 AM | 39 (2.8%) | 2 (0.2%) |
| 5:30 AM to 5:59 AM | 110 (7.9%) | 39 (3.3%) |
| 6:00 AM to 6:29 AM | 206 (14.8%) | 110 (9.4%) |
| 6:30 AM to 6:59 AM | 173 (12.5%) | 42 (3.6%) |
| 7:00 AM to 7:29 AM | 154 (11.1%) | 317 (27.1%) |
| 7:30 AM to 7:59 AM | 45 (3.2%) | 79 (6.8%) |
| 8:00 AM to 8:29 AM | 323 (23.3%) | 235 (20.1%) |
| 8:30 AM to 8:59 AM | 0 (0.0%) | 150 (12.8%) |
| 9:00 AM to 9:59 AM | 72 (5.2%) | 79 (6.8%) |
| 10:00 AM to 10:59 AM | 20 (1.4%) | 0 (0.0%) |
| 11:00 AM to 11:59 AM | 16 (1.1%) | 0 (0.0%) |
| 12:00 PM to 3:59 PM | 107 (7.7%) | 30 (2.6%) |
| 4:00 PM to 11:59 PM | 36 (2.6%) | 12 (1.0%) |
| Total | 1,388 (100.0%) | 1,168 (100.0%) |
Housing Occupancy in South Lebanon
Occupancy by Ownership in South Lebanon
Of the total 2,179 dwellings in South Lebanon, owner-occupied units account for 1,612 (74.0%), while renter-occupied units make up 567 (26.0%).
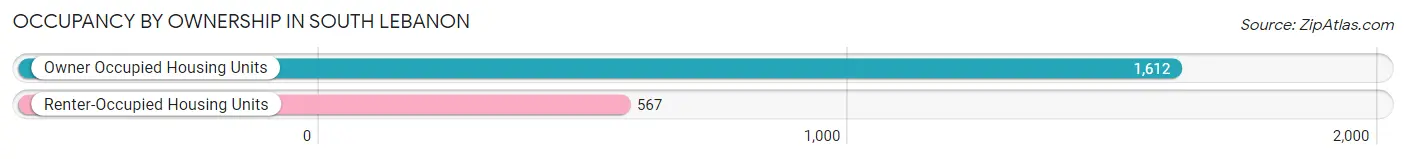
| Occupancy | # Housing Units | % Housing Units |
| Owner Occupied Housing Units | 1,612 | 74.0% |
| Renter-Occupied Housing Units | 567 | 26.0% |
| Total Occupied Housing Units | 2,179 | 100.0% |
Occupancy by Household Size in South Lebanon
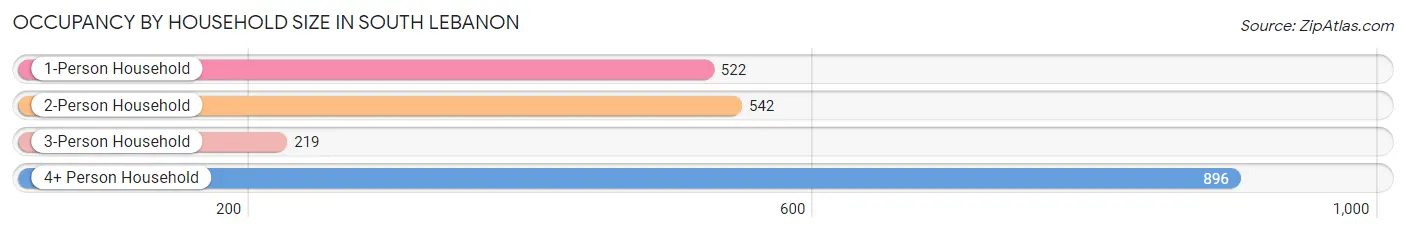
| Household Size | # Housing Units | % Housing Units |
| 1-Person Household | 522 | 24.0% |
| 2-Person Household | 542 | 24.9% |
| 3-Person Household | 219 | 10.1% |
| 4+ Person Household | 896 | 41.1% |
| Total Housing Units | 2,179 | 100.0% |
Occupancy by Ownership by Household Size in South Lebanon
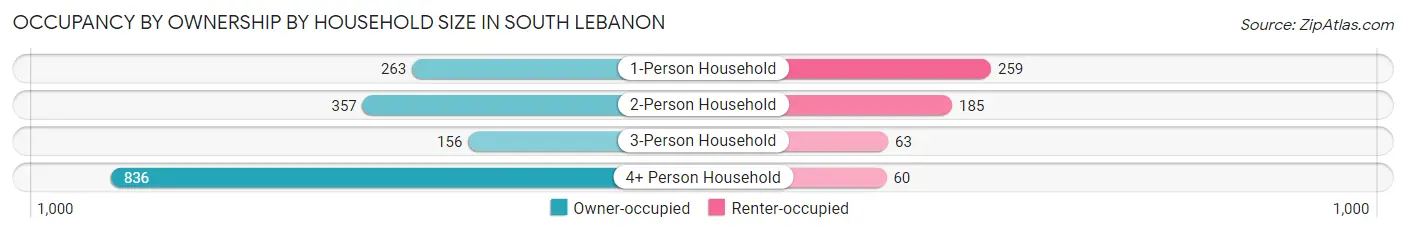
| Household Size | Owner-occupied | Renter-occupied |
| 1-Person Household | 263 (50.4%) | 259 (49.6%) |
| 2-Person Household | 357 (65.9%) | 185 (34.1%) |
| 3-Person Household | 156 (71.2%) | 63 (28.8%) |
| 4+ Person Household | 836 (93.3%) | 60 (6.7%) |
| Total Housing Units | 1,612 (74.0%) | 567 (26.0%) |
Occupancy by Educational Attainment in South Lebanon
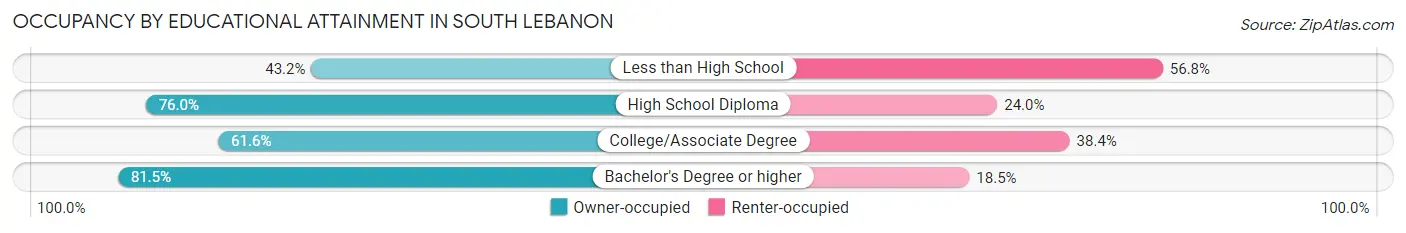
| Household Size | Owner-occupied | Renter-occupied |
| Less than High School | 82 (43.2%) | 108 (56.8%) |
| High School Diploma | 620 (76.0%) | 196 (24.0%) |
| College/Associate Degree | 143 (61.6%) | 89 (38.4%) |
| Bachelor's Degree or higher | 767 (81.5%) | 174 (18.5%) |
Occupancy by Age of Householder in South Lebanon
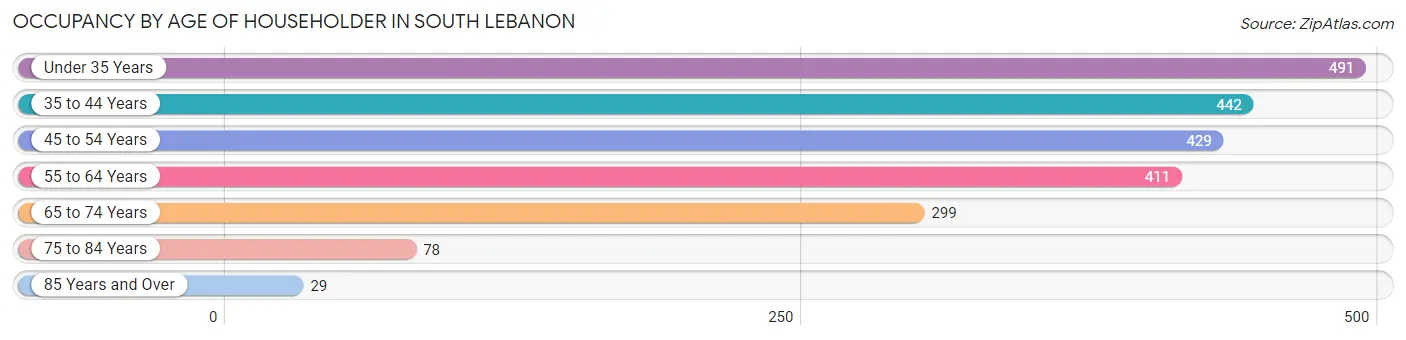
| Age Bracket | # Households | % Households |
| Under 35 Years | 491 | 22.5% |
| 35 to 44 Years | 442 | 20.3% |
| 45 to 54 Years | 429 | 19.7% |
| 55 to 64 Years | 411 | 18.9% |
| 65 to 74 Years | 299 | 13.7% |
| 75 to 84 Years | 78 | 3.6% |
| 85 Years and Over | 29 | 1.3% |
| Total | 2,179 | 100.0% |
Housing Finances in South Lebanon
Median Income by Occupancy in South Lebanon
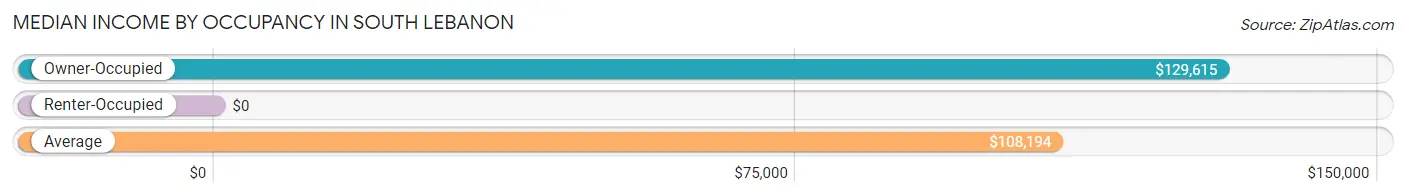
| Occupancy Type | # Households | Median Income |
| Owner-Occupied | 1,612 (74.0%) | $129,615 |
| Renter-Occupied | 567 (26.0%) | $0 |
| Average | 2,179 (100.0%) | $108,194 |
Occupancy by Householder Income Bracket in South Lebanon
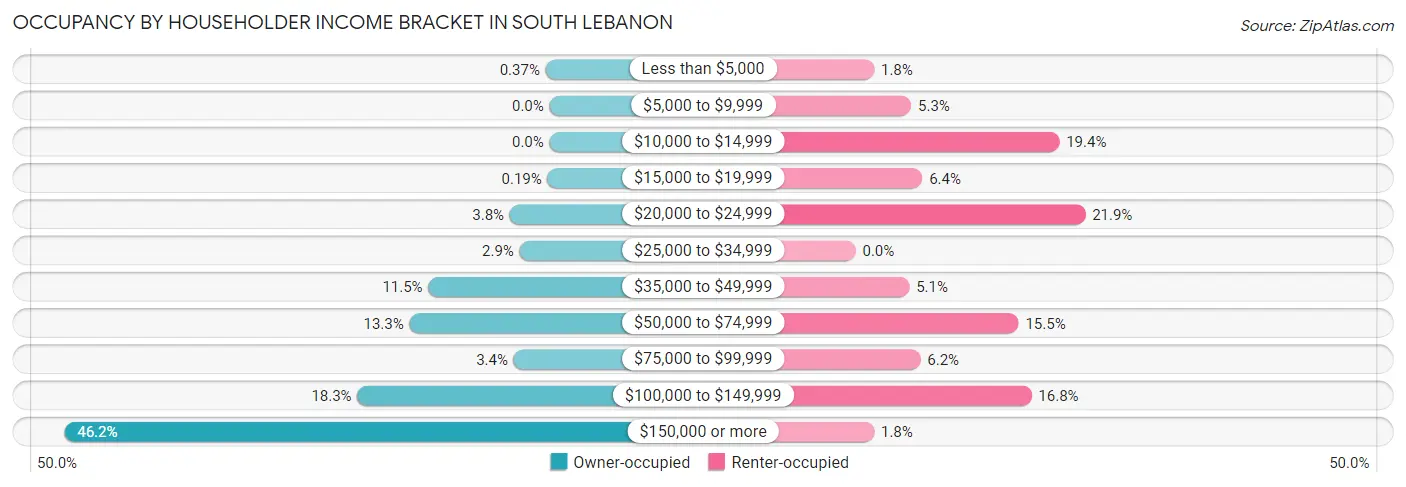
| Income Bracket | Owner-occupied | Renter-occupied |
| Less than $5,000 | 6 (0.4%) | 10 (1.8%) |
| $5,000 to $9,999 | 0 (0.0%) | 30 (5.3%) |
| $10,000 to $14,999 | 0 (0.0%) | 110 (19.4%) |
| $15,000 to $19,999 | 3 (0.2%) | 36 (6.4%) |
| $20,000 to $24,999 | 61 (3.8%) | 124 (21.9%) |
| $25,000 to $34,999 | 46 (2.9%) | 0 (0.0%) |
| $35,000 to $49,999 | 186 (11.5%) | 29 (5.1%) |
| $50,000 to $74,999 | 215 (13.3%) | 88 (15.5%) |
| $75,000 to $99,999 | 55 (3.4%) | 35 (6.2%) |
| $100,000 to $149,999 | 295 (18.3%) | 95 (16.8%) |
| $150,000 or more | 745 (46.2%) | 10 (1.8%) |
| Total | 1,612 (100.0%) | 567 (100.0%) |
Monthly Housing Cost Tiers in South Lebanon
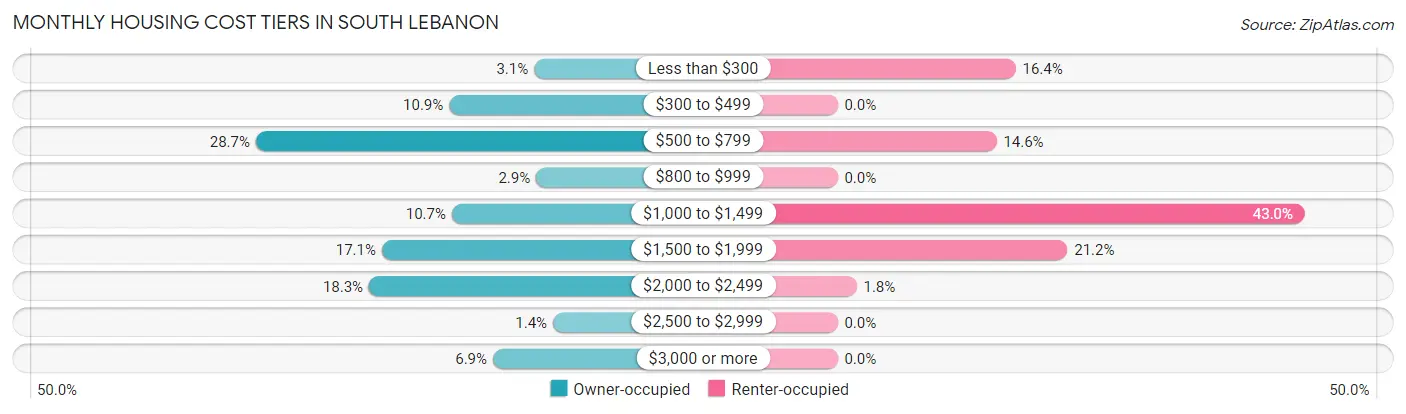
| Monthly Cost | Owner-occupied | Renter-occupied |
| Less than $300 | 50 (3.1%) | 93 (16.4%) |
| $300 to $499 | 176 (10.9%) | 0 (0.0%) |
| $500 to $799 | 463 (28.7%) | 83 (14.6%) |
| $800 to $999 | 47 (2.9%) | 0 (0.0%) |
| $1,000 to $1,499 | 172 (10.7%) | 244 (43.0%) |
| $1,500 to $1,999 | 276 (17.1%) | 120 (21.2%) |
| $2,000 to $2,499 | 295 (18.3%) | 10 (1.8%) |
| $2,500 to $2,999 | 22 (1.4%) | 0 (0.0%) |
| $3,000 or more | 111 (6.9%) | 0 (0.0%) |
| Total | 1,612 (100.0%) | 567 (100.0%) |
Physical Housing Characteristics in South Lebanon
Housing Structures in South Lebanon
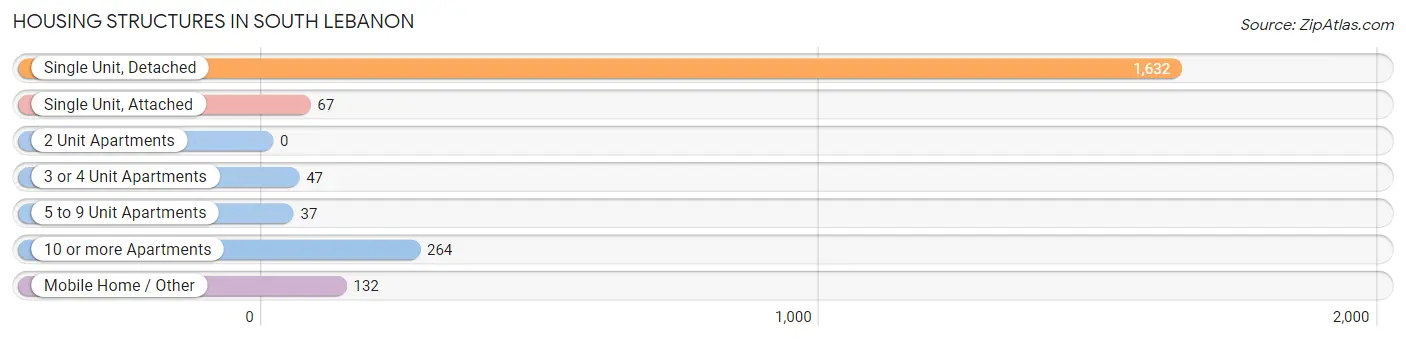
| Structure Type | # Housing Units | % Housing Units |
| Single Unit, Detached | 1,632 | 74.9% |
| Single Unit, Attached | 67 | 3.1% |
| 2 Unit Apartments | 0 | 0.0% |
| 3 or 4 Unit Apartments | 47 | 2.2% |
| 5 to 9 Unit Apartments | 37 | 1.7% |
| 10 or more Apartments | 264 | 12.1% |
| Mobile Home / Other | 132 | 6.1% |
| Total | 2,179 | 100.0% |
Housing Structures by Occupancy in South Lebanon
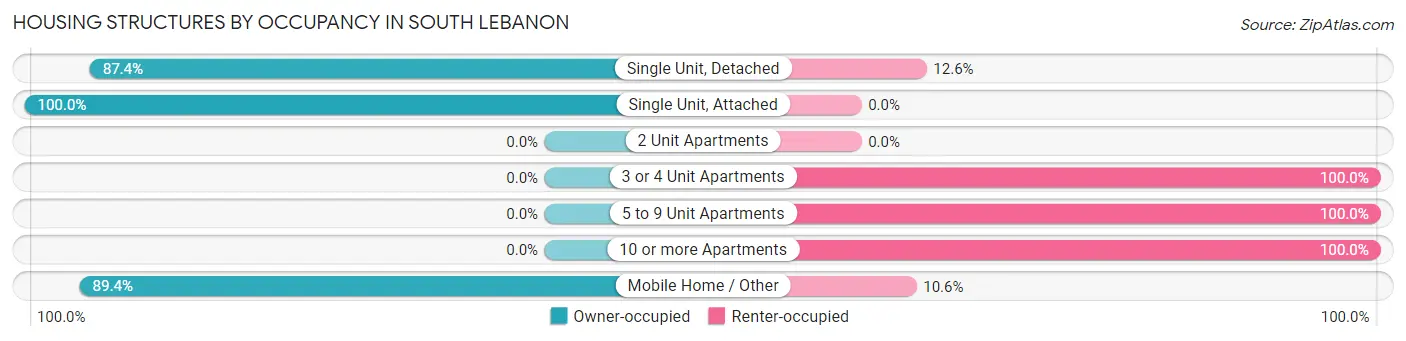
| Structure Type | Owner-occupied | Renter-occupied |
| Single Unit, Detached | 1,427 (87.4%) | 205 (12.6%) |
| Single Unit, Attached | 67 (100.0%) | 0 (0.0%) |
| 2 Unit Apartments | 0 (0.0%) | 0 (0.0%) |
| 3 or 4 Unit Apartments | 0 (0.0%) | 47 (100.0%) |
| 5 to 9 Unit Apartments | 0 (0.0%) | 37 (100.0%) |
| 10 or more Apartments | 0 (0.0%) | 264 (100.0%) |
| Mobile Home / Other | 118 (89.4%) | 14 (10.6%) |
| Total | 1,612 (74.0%) | 567 (26.0%) |
Housing Structures by Number of Rooms in South Lebanon
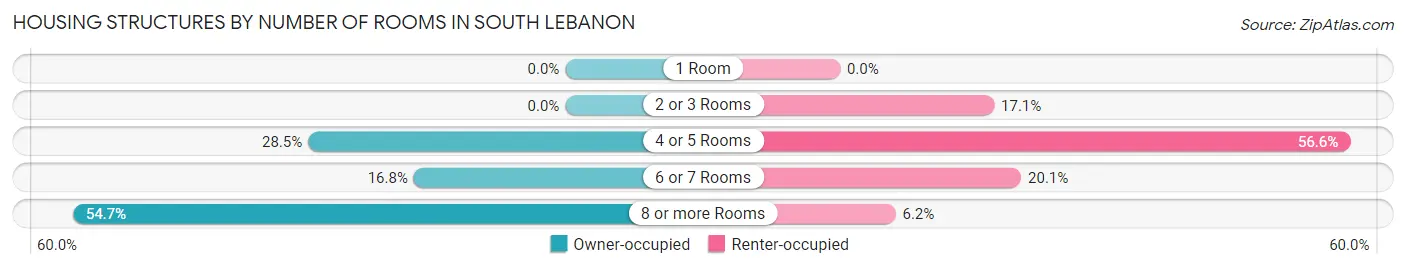
| Number of Rooms | Owner-occupied | Renter-occupied |
| 1 Room | 0 (0.0%) | 0 (0.0%) |
| 2 or 3 Rooms | 0 (0.0%) | 97 (17.1%) |
| 4 or 5 Rooms | 460 (28.5%) | 321 (56.6%) |
| 6 or 7 Rooms | 271 (16.8%) | 114 (20.1%) |
| 8 or more Rooms | 881 (54.6%) | 35 (6.2%) |
| Total | 1,612 (100.0%) | 567 (100.0%) |
Housing Structure by Heating Type in South Lebanon
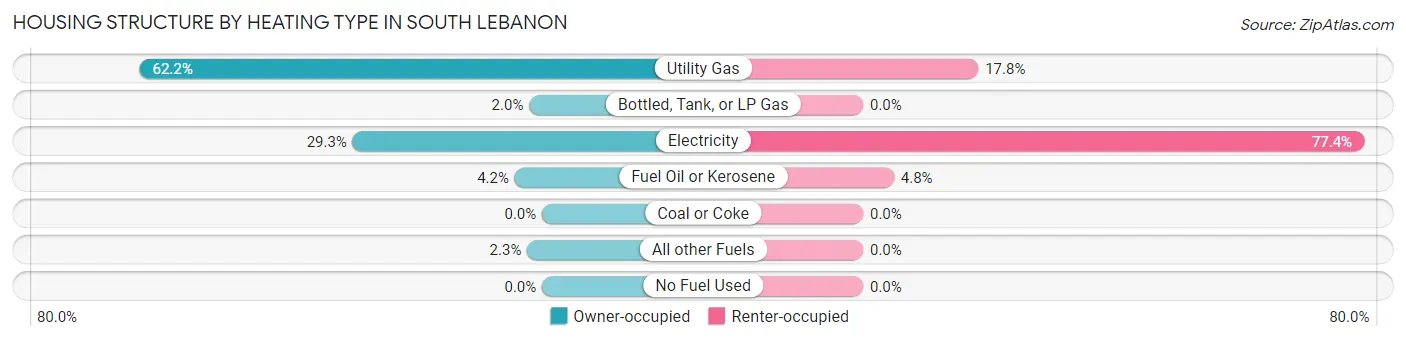
| Heating Type | Owner-occupied | Renter-occupied |
| Utility Gas | 1,003 (62.2%) | 101 (17.8%) |
| Bottled, Tank, or LP Gas | 32 (2.0%) | 0 (0.0%) |
| Electricity | 472 (29.3%) | 439 (77.4%) |
| Fuel Oil or Kerosene | 68 (4.2%) | 27 (4.8%) |
| Coal or Coke | 0 (0.0%) | 0 (0.0%) |
| All other Fuels | 37 (2.3%) | 0 (0.0%) |
| No Fuel Used | 0 (0.0%) | 0 (0.0%) |
| Total | 1,612 (100.0%) | 567 (100.0%) |
Household Vehicle Usage in South Lebanon
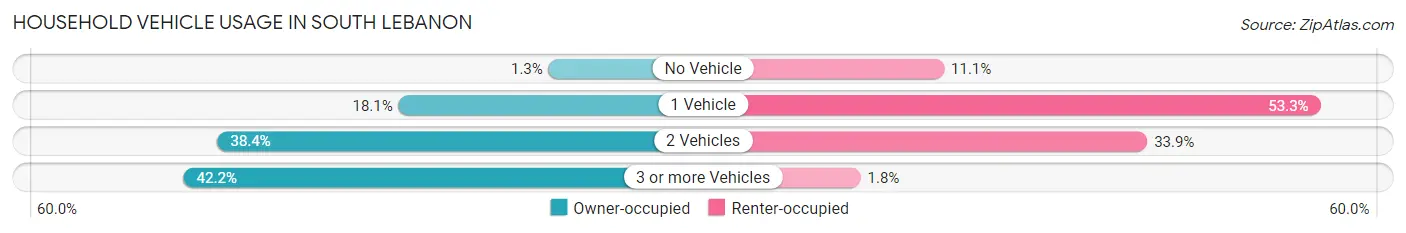
| Vehicles per Household | Owner-occupied | Renter-occupied |
| No Vehicle | 21 (1.3%) | 63 (11.1%) |
| 1 Vehicle | 292 (18.1%) | 302 (53.3%) |
| 2 Vehicles | 619 (38.4%) | 192 (33.9%) |
| 3 or more Vehicles | 680 (42.2%) | 10 (1.8%) |
| Total | 1,612 (100.0%) | 567 (100.0%) |
Real Estate & Mortgages in South Lebanon
Real Estate and Mortgage Overview in South Lebanon
| Characteristic | Without Mortgage | With Mortgage |
| Housing Units | 646 | 966 |
| Median Property Value | $152,400 | $304,600 |
| Median Household Income | $90,833 | $506 |
| Monthly Housing Costs | $614 | $111 |
| Real Estate Taxes | $2,344 | $27 |
Property Value by Mortgage Status in South Lebanon
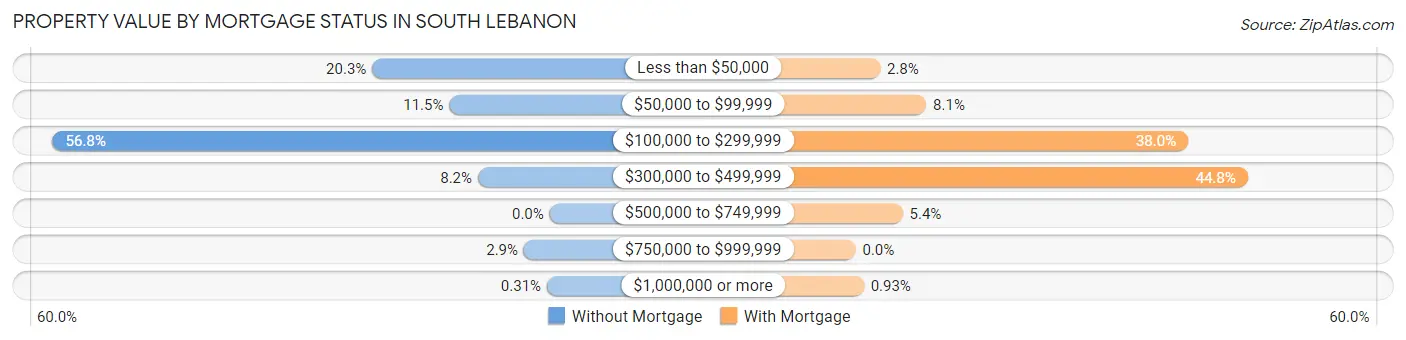
| Property Value | Without Mortgage | With Mortgage |
| Less than $50,000 | 131 (20.3%) | 27 (2.8%) |
| $50,000 to $99,999 | 74 (11.5%) | 78 (8.1%) |
| $100,000 to $299,999 | 367 (56.8%) | 367 (38.0%) |
| $300,000 to $499,999 | 53 (8.2%) | 433 (44.8%) |
| $500,000 to $749,999 | 0 (0.0%) | 52 (5.4%) |
| $750,000 to $999,999 | 19 (2.9%) | 0 (0.0%) |
| $1,000,000 or more | 2 (0.3%) | 9 (0.9%) |
| Total | 646 (100.0%) | 966 (100.0%) |
Household Income by Mortgage Status in South Lebanon
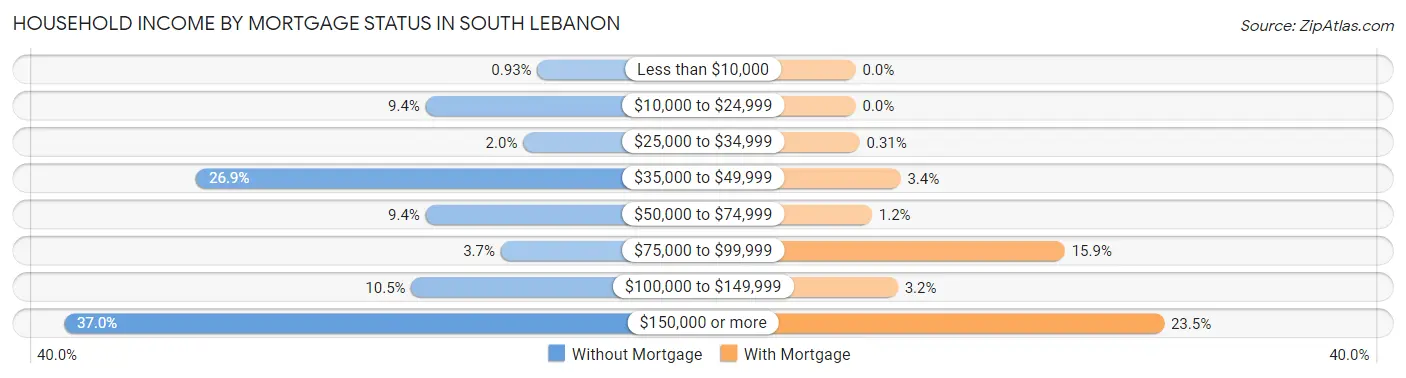
| Household Income | Without Mortgage | With Mortgage |
| Less than $10,000 | 6 (0.9%) | 0 (0.0%) |
| $10,000 to $24,999 | 61 (9.4%) | 0 (0.0%) |
| $25,000 to $34,999 | 13 (2.0%) | 3 (0.3%) |
| $35,000 to $49,999 | 174 (26.9%) | 33 (3.4%) |
| $50,000 to $74,999 | 61 (9.4%) | 12 (1.2%) |
| $75,000 to $99,999 | 24 (3.7%) | 154 (15.9%) |
| $100,000 to $149,999 | 68 (10.5%) | 31 (3.2%) |
| $150,000 or more | 239 (37.0%) | 227 (23.5%) |
| Total | 646 (100.0%) | 966 (100.0%) |
Property Value to Household Income Ratio in South Lebanon
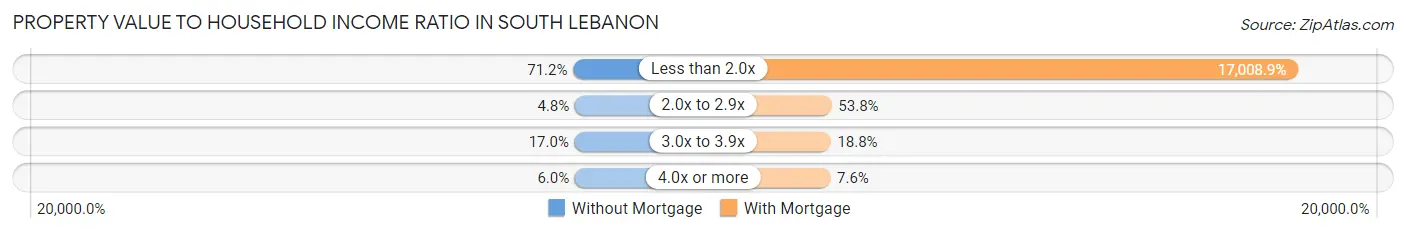
| Value-to-Income Ratio | Without Mortgage | With Mortgage |
| Less than 2.0x | 460 (71.2%) | 164,306 (17,008.9%) |
| 2.0x to 2.9x | 31 (4.8%) | 520 (53.8%) |
| 3.0x to 3.9x | 110 (17.0%) | 182 (18.8%) |
| 4.0x or more | 39 (6.0%) | 73 (7.6%) |
| Total | 646 (100.0%) | 966 (100.0%) |
Real Estate Taxes by Mortgage Status in South Lebanon
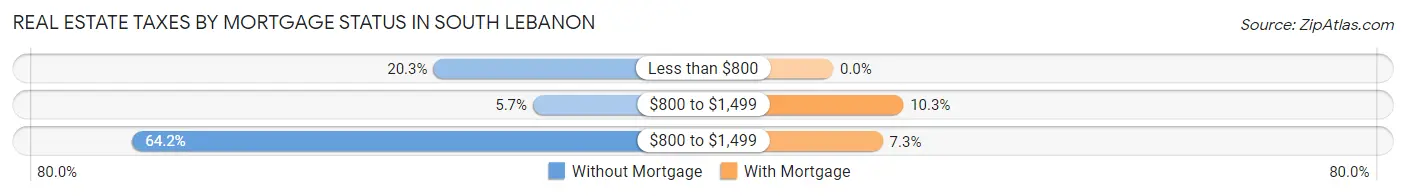
| Property Taxes | Without Mortgage | With Mortgage |
| Less than $800 | 131 (20.3%) | 0 (0.0%) |
| $800 to $1,499 | 37 (5.7%) | 99 (10.2%) |
| $800 to $1,499 | 415 (64.2%) | 70 (7.2%) |
| Total | 646 (100.0%) | 966 (100.0%) |
Health & Disability in South Lebanon
Health Insurance Coverage by Age in South Lebanon
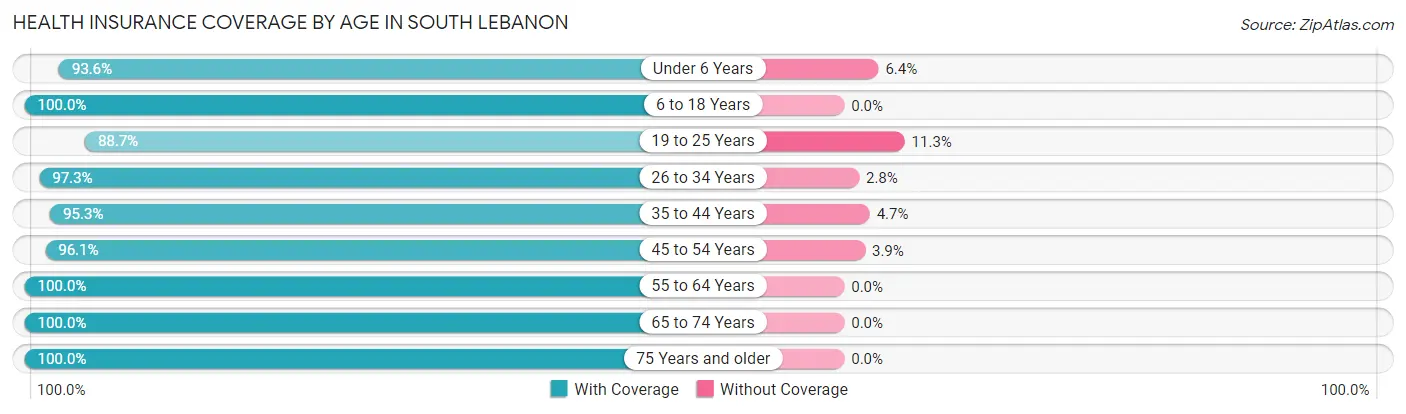
| Age Bracket | With Coverage | Without Coverage |
| Under 6 Years | 396 (93.6%) | 27 (6.4%) |
| 6 to 18 Years | 1,721 (100.0%) | 0 (0.0%) |
| 19 to 25 Years | 410 (88.7%) | 52 (11.3%) |
| 26 to 34 Years | 743 (97.3%) | 21 (2.8%) |
| 35 to 44 Years | 964 (95.3%) | 48 (4.7%) |
| 45 to 54 Years | 645 (96.1%) | 26 (3.9%) |
| 55 to 64 Years | 808 (100.0%) | 0 (0.0%) |
| 65 to 74 Years | 364 (100.0%) | 0 (0.0%) |
| 75 Years and older | 151 (100.0%) | 0 (0.0%) |
| Total | 6,202 (97.3%) | 174 (2.7%) |
Health Insurance Coverage by Citizenship Status in South Lebanon
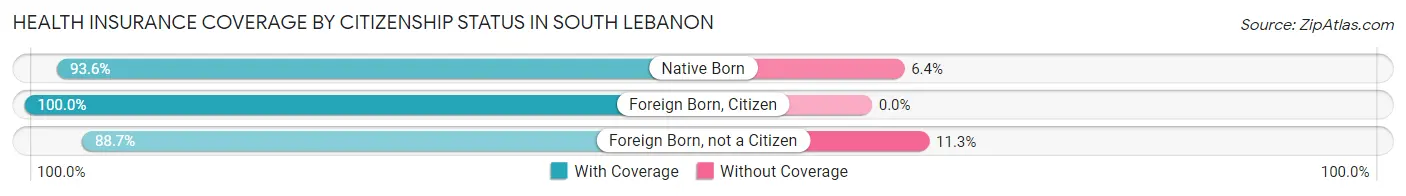
| Citizenship Status | With Coverage | Without Coverage |
| Native Born | 396 (93.6%) | 27 (6.4%) |
| Foreign Born, Citizen | 1,721 (100.0%) | 0 (0.0%) |
| Foreign Born, not a Citizen | 410 (88.7%) | 52 (11.3%) |
Health Insurance Coverage by Household Income in South Lebanon
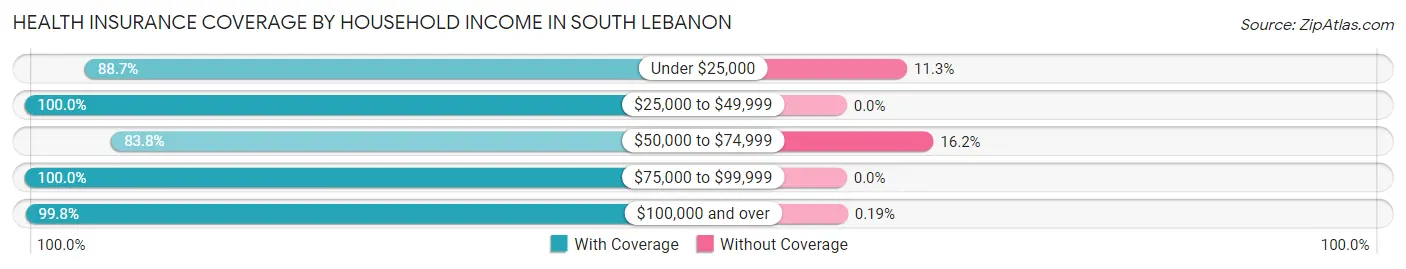
| Household Income | With Coverage | Without Coverage |
| Under $25,000 | 573 (88.7%) | 73 (11.3%) |
| $25,000 to $49,999 | 678 (100.0%) | 0 (0.0%) |
| $50,000 to $74,999 | 480 (83.8%) | 93 (16.2%) |
| $75,000 to $99,999 | 204 (100.0%) | 0 (0.0%) |
| $100,000 and over | 4,250 (99.8%) | 8 (0.2%) |
Public vs Private Health Insurance Coverage by Age in South Lebanon
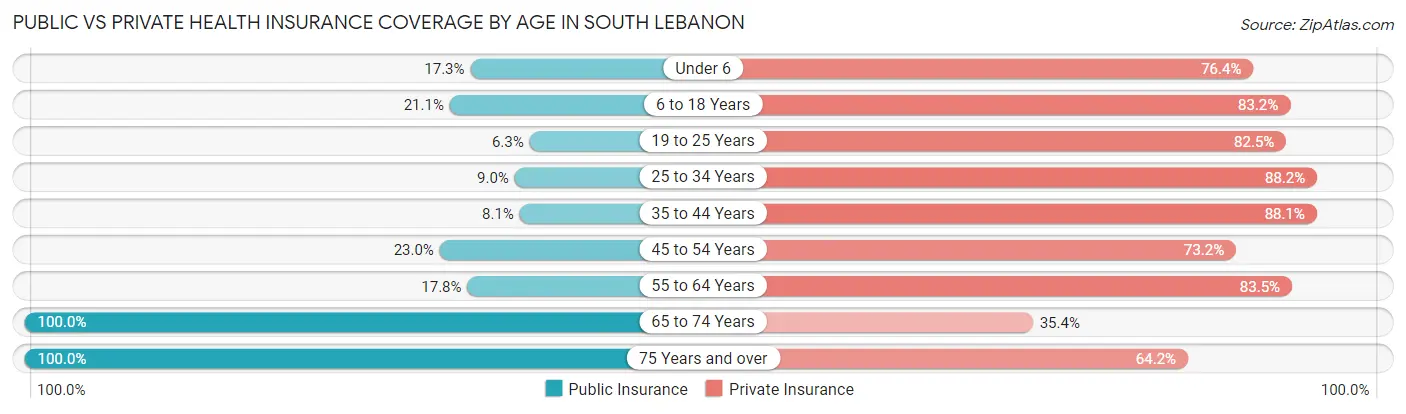
| Age Bracket | Public Insurance | Private Insurance |
| Under 6 | 73 (17.3%) | 323 (76.4%) |
| 6 to 18 Years | 363 (21.1%) | 1,432 (83.2%) |
| 19 to 25 Years | 29 (6.3%) | 381 (82.5%) |
| 25 to 34 Years | 69 (9.0%) | 674 (88.2%) |
| 35 to 44 Years | 82 (8.1%) | 892 (88.1%) |
| 45 to 54 Years | 154 (23.0%) | 491 (73.2%) |
| 55 to 64 Years | 144 (17.8%) | 675 (83.5%) |
| 65 to 74 Years | 364 (100.0%) | 129 (35.4%) |
| 75 Years and over | 151 (100.0%) | 97 (64.2%) |
| Total | 1,429 (22.4%) | 5,094 (79.9%) |
Disability Status by Sex by Age in South Lebanon
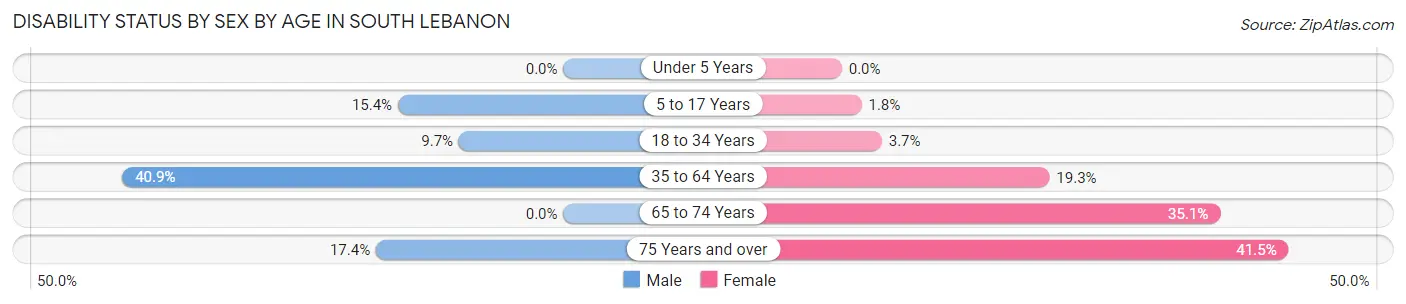
| Age Bracket | Male | Female |
| Under 5 Years | 0 (0.0%) | 0 (0.0%) |
| 5 to 17 Years | 64 (15.3%) | 23 (1.8%) |
| 18 to 34 Years | 72 (9.7%) | 21 (3.7%) |
| 35 to 64 Years | 529 (40.9%) | 231 (19.3%) |
| 65 to 74 Years | 0 (0.0%) | 79 (35.1%) |
| 75 Years and over | 12 (17.4%) | 34 (41.5%) |
Disability Class by Sex by Age in South Lebanon
Disability Class: Hearing Difficulty
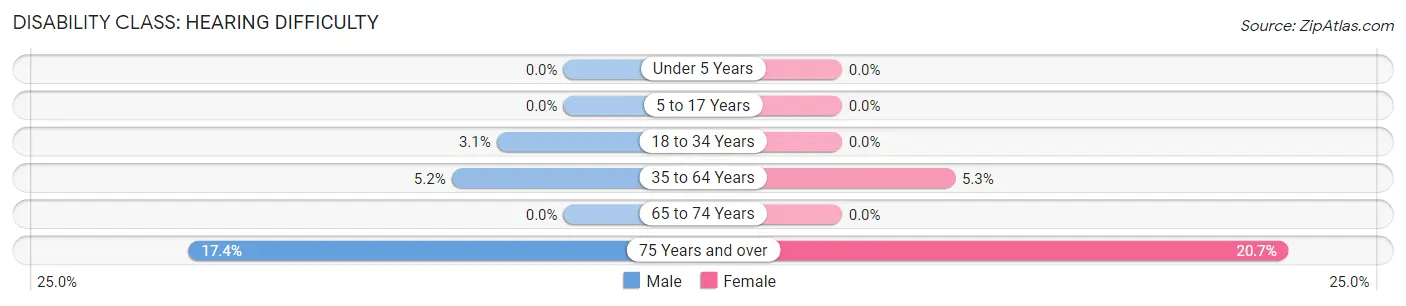
| Age Bracket | Male | Female |
| Under 5 Years | 0 (0.0%) | 0 (0.0%) |
| 5 to 17 Years | 0 (0.0%) | 0 (0.0%) |
| 18 to 34 Years | 23 (3.1%) | 0 (0.0%) |
| 35 to 64 Years | 67 (5.2%) | 63 (5.2%) |
| 65 to 74 Years | 0 (0.0%) | 0 (0.0%) |
| 75 Years and over | 12 (17.4%) | 17 (20.7%) |
Disability Class: Vision Difficulty
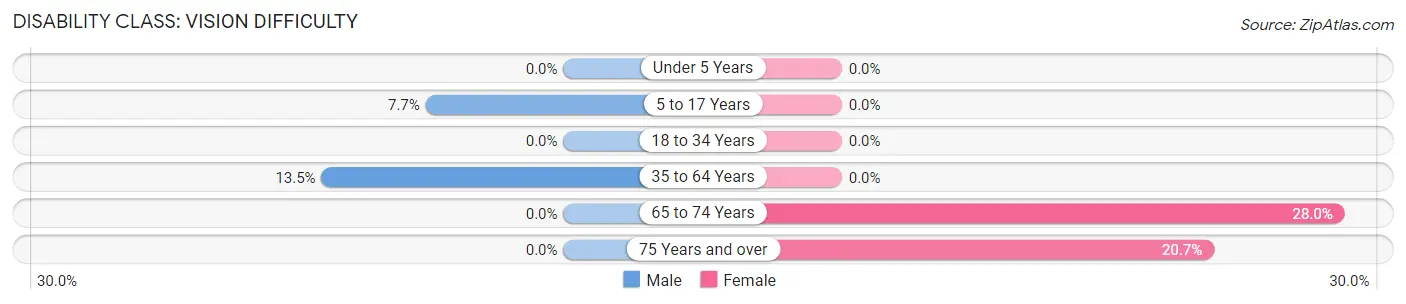
| Age Bracket | Male | Female |
| Under 5 Years | 0 (0.0%) | 0 (0.0%) |
| 5 to 17 Years | 32 (7.7%) | 0 (0.0%) |
| 18 to 34 Years | 0 (0.0%) | 0 (0.0%) |
| 35 to 64 Years | 174 (13.5%) | 0 (0.0%) |
| 65 to 74 Years | 0 (0.0%) | 63 (28.0%) |
| 75 Years and over | 0 (0.0%) | 17 (20.7%) |
Disability Class: Cognitive Difficulty
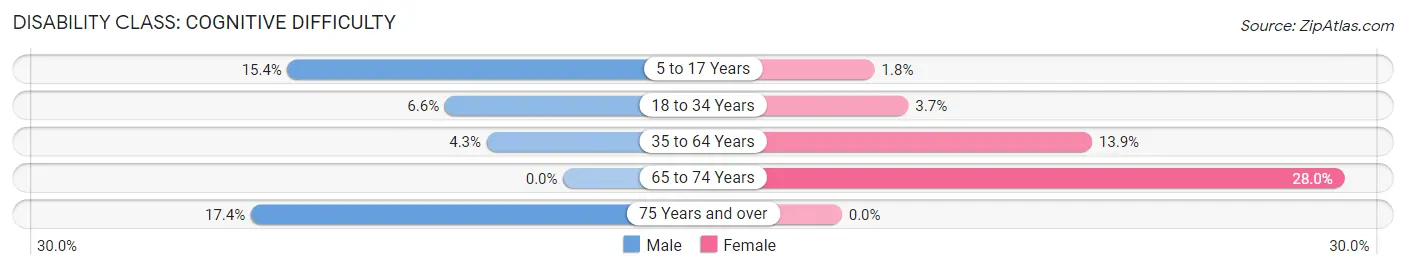
| Age Bracket | Male | Female |
| 5 to 17 Years | 64 (15.3%) | 23 (1.8%) |
| 18 to 34 Years | 49 (6.6%) | 21 (3.7%) |
| 35 to 64 Years | 55 (4.3%) | 167 (13.9%) |
| 65 to 74 Years | 0 (0.0%) | 63 (28.0%) |
| 75 Years and over | 12 (17.4%) | 0 (0.0%) |
Disability Class: Ambulatory Difficulty
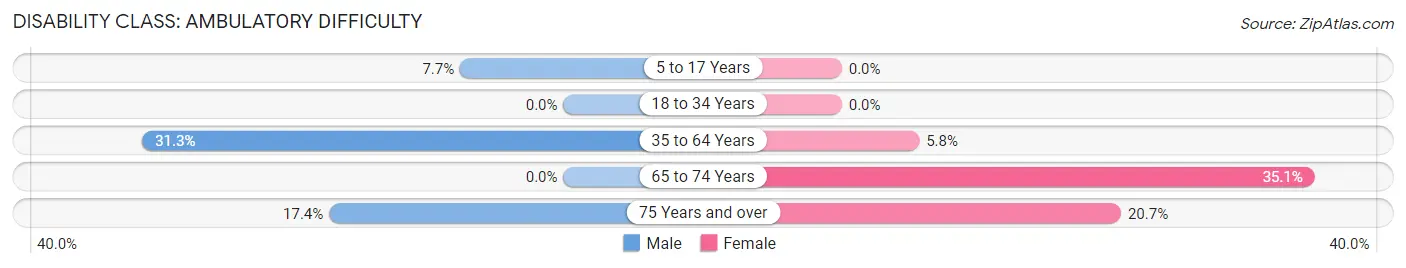
| Age Bracket | Male | Female |
| 5 to 17 Years | 32 (7.7%) | 0 (0.0%) |
| 18 to 34 Years | 0 (0.0%) | 0 (0.0%) |
| 35 to 64 Years | 404 (31.3%) | 69 (5.8%) |
| 65 to 74 Years | 0 (0.0%) | 79 (35.1%) |
| 75 Years and over | 12 (17.4%) | 17 (20.7%) |
Disability Class: Self-Care Difficulty
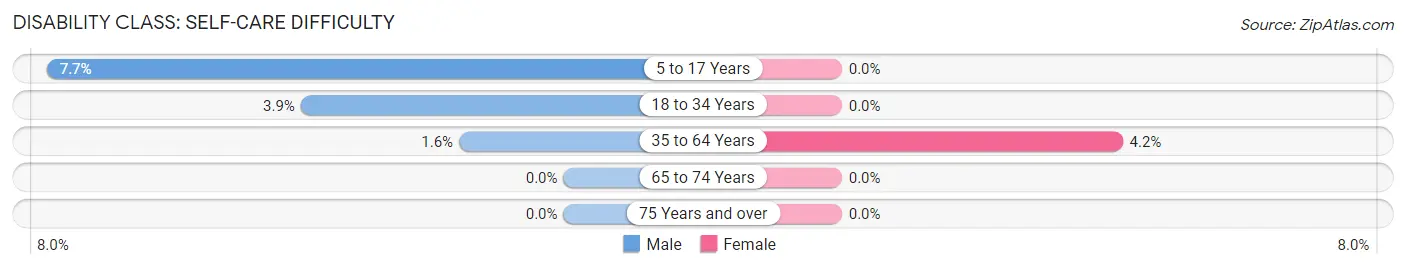
| Age Bracket | Male | Female |
| 5 to 17 Years | 32 (7.7%) | 0 (0.0%) |
| 18 to 34 Years | 29 (3.9%) | 0 (0.0%) |
| 35 to 64 Years | 20 (1.5%) | 50 (4.2%) |
| 65 to 74 Years | 0 (0.0%) | 0 (0.0%) |
| 75 Years and over | 0 (0.0%) | 0 (0.0%) |
Technology Access in South Lebanon
Computing Device Access in South Lebanon
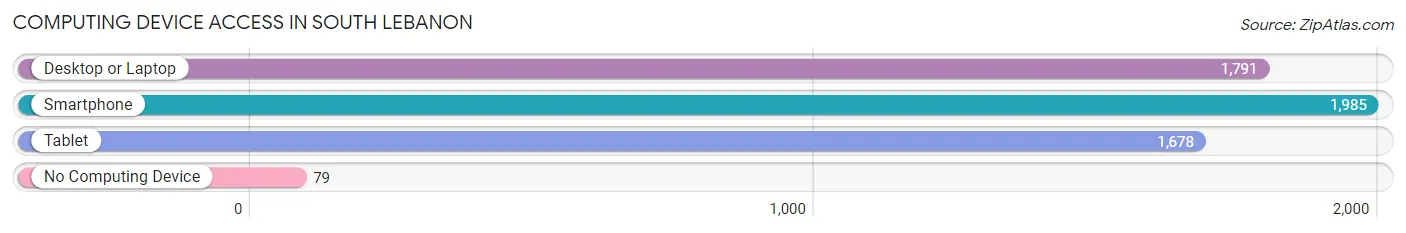
| Device Type | # Households | % Households |
| Desktop or Laptop | 1,791 | 82.2% |
| Smartphone | 1,985 | 91.1% |
| Tablet | 1,678 | 77.0% |
| No Computing Device | 79 | 3.6% |
| Total | 2,179 | 100.0% |
Internet Access in South Lebanon
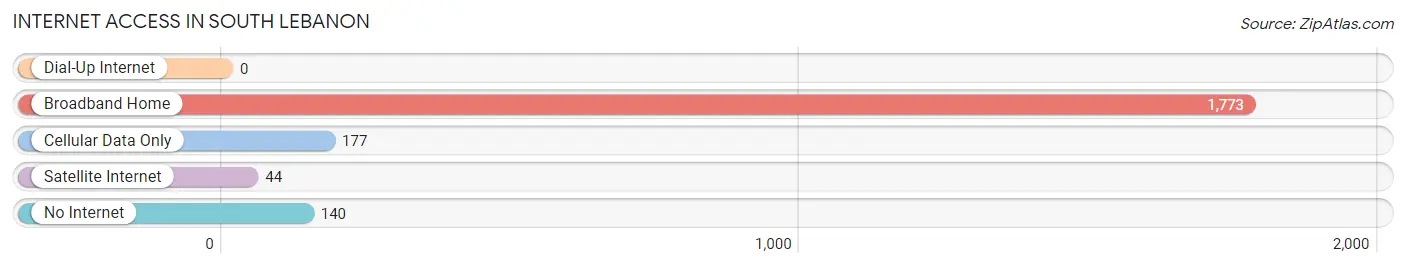
| Internet Type | # Households | % Households |
| Dial-Up Internet | 0 | 0.0% |
| Broadband Home | 1,773 | 81.4% |
| Cellular Data Only | 177 | 8.1% |
| Satellite Internet | 44 | 2.0% |
| No Internet | 140 | 6.4% |
| Total | 2,179 | 100.0% |
South Lebanon Summary
History
South Lebanon is a village located in Warren County, Ohio, United States. It is part of the Cincinnati metropolitan area. The village was founded in 1817 by a group of settlers from Lebanon, Connecticut. The settlers named the village after their hometown. The village was incorporated in 1867.
South Lebanon has a rich history that dates back to the early 1800s. The village was originally part of Turtlecreek Township, which was established in 1803. The first settlers in the area were from Lebanon, Connecticut, and they named the village after their hometown. The village was officially incorporated in 1867.
The village has seen many changes over the years. In the late 1800s, the village was a thriving agricultural community. The village was home to several mills, including a grist mill, a saw mill, and a woolen mill. The village also had a blacksmith shop, a general store, and a post office.
In the early 1900s, the village began to grow and develop. The village was home to several businesses, including a bank, a hotel, a movie theater, and a variety of stores. The village also had a school, a library, and a fire department.
In the 1950s, the village began to experience a decline in population. This was due to the growth of nearby cities, such as Cincinnati and Dayton. The village also experienced a decline in industry, as many of the mills and factories closed.
In the late 20th century, the village began to experience a resurgence. The village was home to several new businesses, including a grocery store, a hardware store, and a restaurant. The village also had a new library and a new fire station.
Geography
South Lebanon is located in Warren County, Ohio, United States. It is part of the Cincinnati metropolitan area. The village is situated on the Little Miami River, which is a tributary of the Ohio River. The village is located approximately 25 miles northeast of Cincinnati.
The village has a total area of 1.2 square miles, all of which is land. The village is located in a rural area, with rolling hills and farmland. The village is bordered by Turtlecreek Township to the north, Clearcreek Township to the east, and Hamilton Township to the south.
Economy
South Lebanon is a small village with a population of approximately 2,000 people. The village is home to several businesses, including a grocery store, a hardware store, and a restaurant. The village also has a library and a fire station.
The village is home to several manufacturing companies, including a plastics manufacturer and a metal fabrication company. The village is also home to several small businesses, such as a bakery, a florist, and a furniture store.
The village is home to several farms, which produce a variety of crops, including corn, soybeans, and wheat. The village is also home to several wineries, which produce a variety of wines.
Demographics
As of the 2010 census, the village had a population of 2,039 people. The racial makeup of the village was 97.3% White, 0.7% African American, 0.2% Native American, 0.4% Asian, 0.1% Pacific Islander, 0.3% from other races, and 1.0% from two or more races. Hispanic or Latino of any race were 1.2% of the population.
The median household income in the village was $50,972, and the median family income was $60,972. The per capita income for the village was $25,972. About 4.3% of families and 5.3% of the population were below the poverty line, including 6.3% of those under age 18 and 4.3% of those age 65 or over.
Common Questions
What is Per Capita Income in South Lebanon?
Per Capita income in South Lebanon is $39,783.
What is the Median Family Income in South Lebanon?
Median Family Income in South Lebanon is $127,692.
What is the Median Household income in South Lebanon?
Median Household Income in South Lebanon is $108,194.
What is Income or Wage Gap in South Lebanon?
Income or Wage Gap in South Lebanon is 12.8%.
Women in South Lebanon earn 87.2 cents for every dollar earned by a man.
What is Inequality or Gini Index in South Lebanon?
Inequality or Gini Index in South Lebanon is 0.44.
What is the Total Population of South Lebanon?
Total Population of South Lebanon is 6,376.
What is the Total Male Population of South Lebanon?
Total Male Population of South Lebanon is 2,930.
What is the Total Female Population of South Lebanon?
Total Female Population of South Lebanon is 3,446.
What is the Ratio of Males per 100 Females in South Lebanon?
There are 85.03 Males per 100 Females in South Lebanon.
What is the Ratio of Females per 100 Males in South Lebanon?
There are 117.61 Females per 100 Males in South Lebanon.
What is the Median Population Age in South Lebanon?
Median Population Age in South Lebanon is 33.5 Years.
What is the Average Family Size in South Lebanon
Average Family Size in South Lebanon is 3.5 People.
What is the Average Household Size in South Lebanon
Average Household Size in South Lebanon is 2.9 People.
How Large is the Labor Force in South Lebanon?
There are 3,536 People in the Labor Forcein in South Lebanon.
What is the Percentage of People in the Labor Force in South Lebanon?
77.0% of People are in the Labor Force in South Lebanon.
What is the Unemployment Rate in South Lebanon?
Unemployment Rate in South Lebanon is 14.4%.