Uniontown, OH Map & Demographics
Uniontown Map
Uniontown Overview
$44,787
PER CAPITA INCOME
$118,257
AVG FAMILY INCOME
$93,668
AVG HOUSEHOLD INCOME
45.2%
WAGE / INCOME GAP [ % ]
54.8¢/ $1
WAGE / INCOME GAP [ $ ]
0.42
INEQUALITY / GINI INDEX
6,948
TOTAL POPULATION
3,565
MALE POPULATION
3,383
FEMALE POPULATION
105.38
MALES / 100 FEMALES
94.89
FEMALES / 100 MALES
43.5
MEDIAN AGE
3.1
AVG FAMILY SIZE
2.7
AVG HOUSEHOLD SIZE
3,354
LABOR FORCE [ PEOPLE ]
62.9%
PERCENT IN LABOR FORCE
4.0%
UNEMPLOYMENT RATE
Uniontown Zip Codes
Income in Uniontown
Income Overview in Uniontown
Per Capita Income in Uniontown is $44,787, while median incomes of families and households are $118,257 and $93,668 respectively.
| Characteristic | Number | Measure |
| Per Capita Income | 6,948 | $44,787 |
| Median Family Income | 1,981 | $118,257 |
| Mean Family Income | 1,981 | $134,972 |
| Median Household Income | 2,605 | $93,668 |
| Mean Household Income | 2,605 | $116,483 |
| Income Deficit | 1,981 | $0 |
| Wage / Income Gap (%) | 6,948 | 45.22% |
| Wage / Income Gap ($) | 6,948 | 54.78¢ per $1 |
| Gini / Inequality Index | 6,948 | 0.42 |
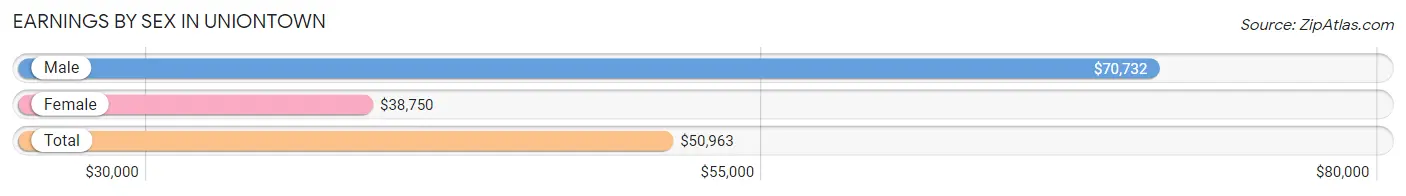
Earnings by Sex in Uniontown
Average Earnings in Uniontown are $50,963, $70,732 for men and $38,750 for women, a difference of 45.2%.
| Sex | Number | Average Earnings |
| Male | 1,856 (52.5%) | $70,732 |
| Female | 1,682 (47.5%) | $38,750 |
| Total | 3,538 (100.0%) | $50,963 |
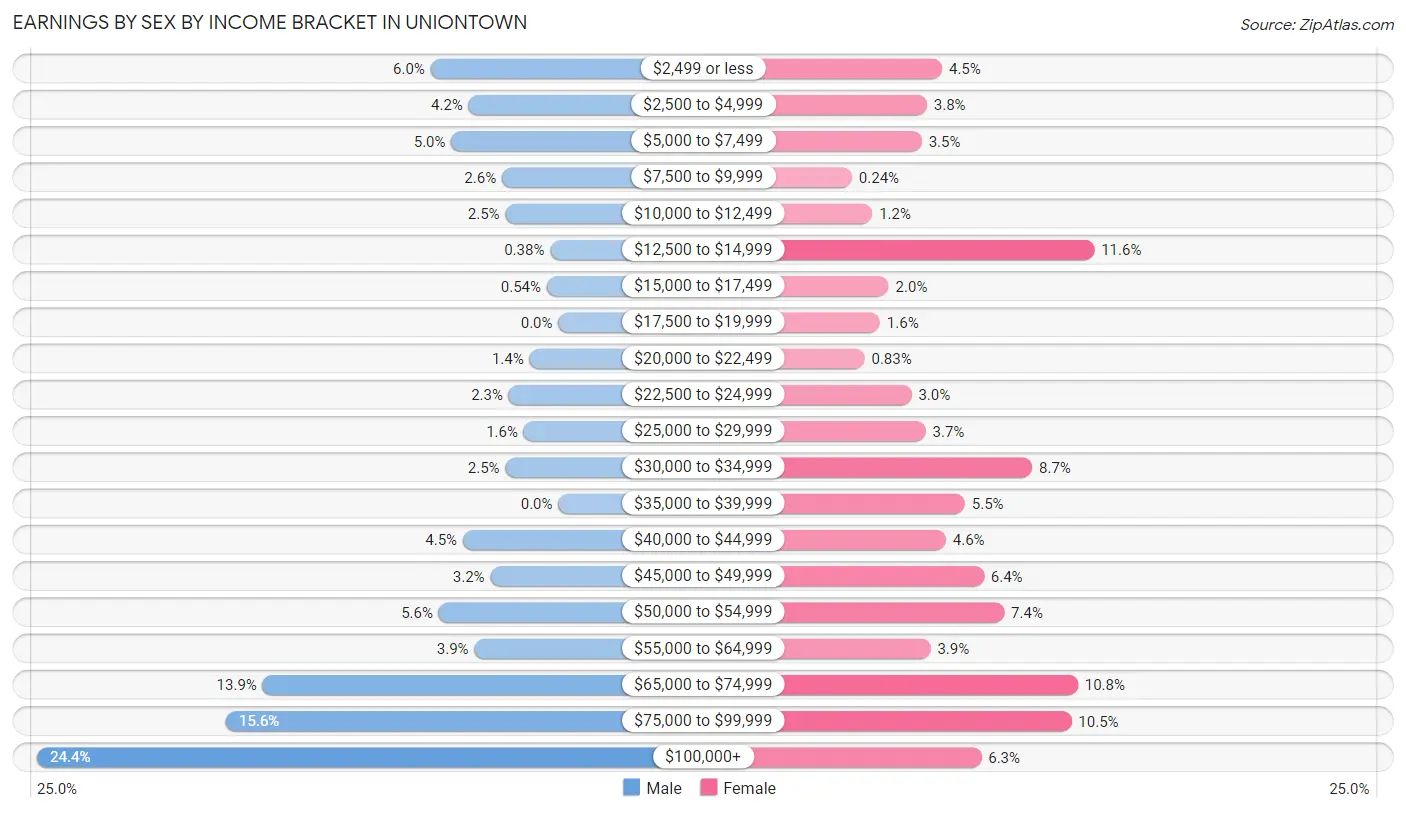
Earnings by Sex by Income Bracket in Uniontown
The most common earnings brackets in Uniontown are $100,000+ for men (453 | 24.4%) and $12,500 to $14,999 for women (195 | 11.6%).
| Income | Male | Female |
| $2,499 or less | 111 (6.0%) | 75 (4.5%) |
| $2,500 to $4,999 | 78 (4.2%) | 63 (3.7%) |
| $5,000 to $7,499 | 93 (5.0%) | 59 (3.5%) |
| $7,500 to $9,999 | 49 (2.6%) | 4 (0.2%) |
| $10,000 to $12,499 | 46 (2.5%) | 20 (1.2%) |
| $12,500 to $14,999 | 7 (0.4%) | 195 (11.6%) |
| $15,000 to $17,499 | 10 (0.5%) | 33 (2.0%) |
| $17,500 to $19,999 | 0 (0.0%) | 26 (1.5%) |
| $20,000 to $22,499 | 25 (1.3%) | 14 (0.8%) |
| $22,500 to $24,999 | 43 (2.3%) | 51 (3.0%) |
| $25,000 to $29,999 | 30 (1.6%) | 62 (3.7%) |
| $30,000 to $34,999 | 46 (2.5%) | 146 (8.7%) |
| $35,000 to $39,999 | 0 (0.0%) | 93 (5.5%) |
| $40,000 to $44,999 | 83 (4.5%) | 78 (4.6%) |
| $45,000 to $49,999 | 59 (3.2%) | 108 (6.4%) |
| $50,000 to $54,999 | 104 (5.6%) | 124 (7.4%) |
| $55,000 to $64,999 | 73 (3.9%) | 66 (3.9%) |
| $65,000 to $74,999 | 257 (13.9%) | 182 (10.8%) |
| $75,000 to $99,999 | 289 (15.6%) | 177 (10.5%) |
| $100,000+ | 453 (24.4%) | 106 (6.3%) |
| Total | 1,856 (100.0%) | 1,682 (100.0%) |
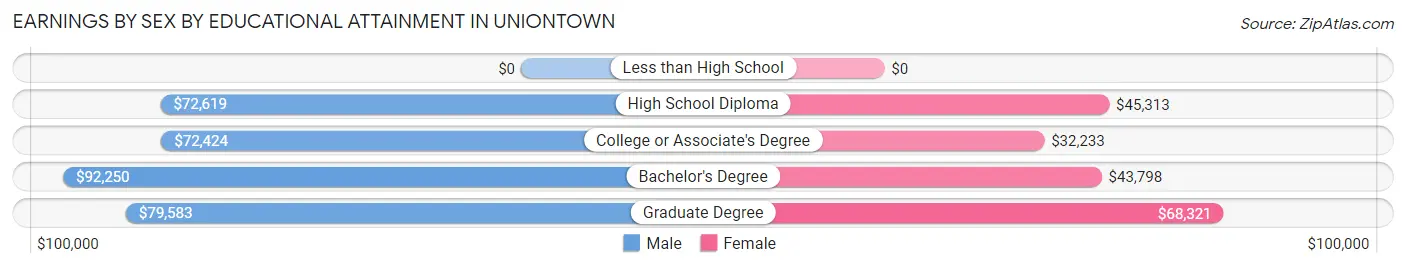
Earnings by Sex by Educational Attainment in Uniontown
Average earnings in Uniontown are $74,100 for men and $45,000 for women, a difference of 39.3%. Men with an educational attainment of bachelor's degree enjoy the highest average annual earnings of $92,250, while those with college or associate's degree education earn the least with $72,424. Women with an educational attainment of graduate degree earn the most with the average annual earnings of $68,321, while those with college or associate's degree education have the smallest earnings of $32,233.
| Educational Attainment | Male Income | Female Income |
| Less than High School | - | - |
| High School Diploma | $72,619 | $45,313 |
| College or Associate's Degree | $72,424 | $32,233 |
| Bachelor's Degree | $92,250 | $43,798 |
| Graduate Degree | $79,583 | $68,321 |
| Total | $74,100 | $45,000 |
Family Income in Uniontown
Family Income Brackets in Uniontown
According to the Uniontown family income data, there are 644 families falling into the $100,000 to $149,999 income range, which is the most common income bracket and makes up 32.5% of all families. Conversely, the $10,000 to $14,999 income bracket is the least frequent group with only 26 families (1.3%) belonging to this category.
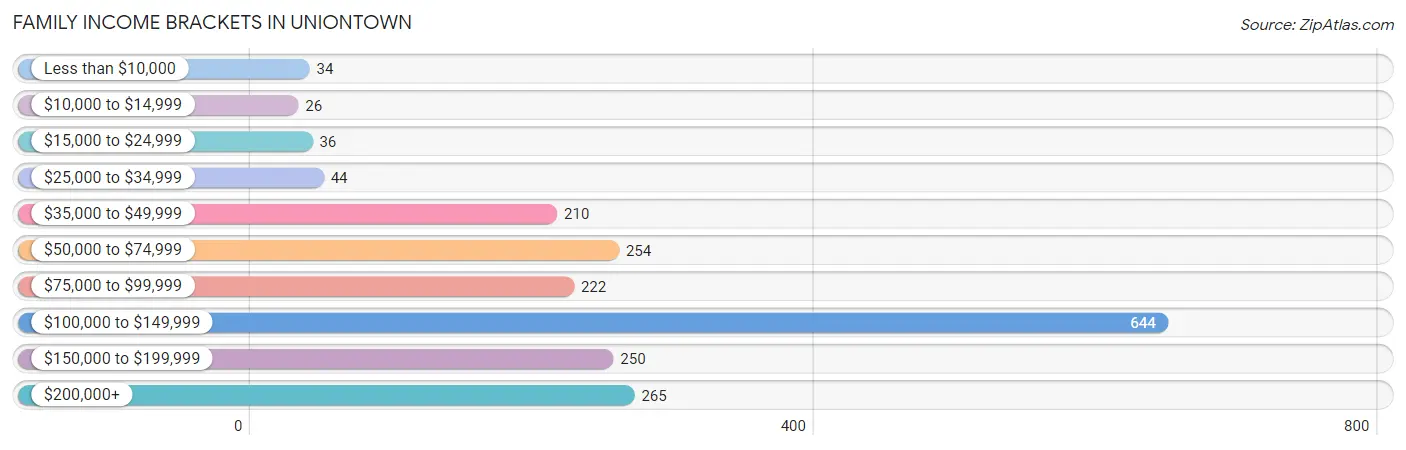
| Income Bracket | # Families | % Families |
| Less than $10,000 | 34 | 1.7% |
| $10,000 to $14,999 | 26 | 1.3% |
| $15,000 to $24,999 | 36 | 1.8% |
| $25,000 to $34,999 | 44 | 2.2% |
| $35,000 to $49,999 | 210 | 10.6% |
| $50,000 to $74,999 | 254 | 12.8% |
| $75,000 to $99,999 | 222 | 11.2% |
| $100,000 to $149,999 | 644 | 32.5% |
| $150,000 to $199,999 | 250 | 12.6% |
| $200,000+ | 265 | 13.4% |
Family Income by Famaliy Size in Uniontown
5-person families (189 | 9.5%) account for the highest median family income in Uniontown with $162,981 per family, while 3-person families (355 | 17.9%) have the highest median income of $43,917 per family member.
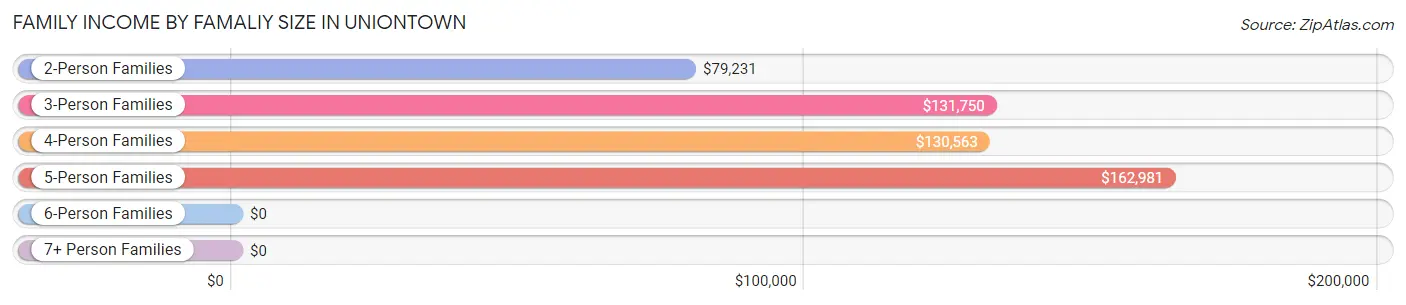
| Income Bracket | # Families | Median Income |
| 2-Person Families | 966 (48.8%) | $79,231 |
| 3-Person Families | 355 (17.9%) | $131,750 |
| 4-Person Families | 431 (21.8%) | $130,563 |
| 5-Person Families | 189 (9.5%) | $162,981 |
| 6-Person Families | 12 (0.6%) | $0 |
| 7+ Person Families | 28 (1.4%) | $0 |
| Total | 1,981 (100.0%) | $118,257 |
Family Income by Number of Earners in Uniontown
The median family income in Uniontown is $118,257, with families comprising 3+ earners (301) having the highest median family income of $149,219, while families with no earners (405) have the lowest median family income of $57,321, accounting for 15.2% and 20.4% of families, respectively.
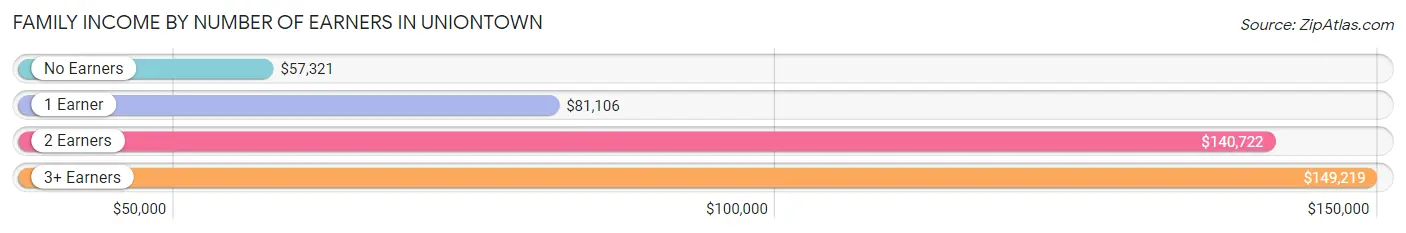
| Number of Earners | # Families | Median Income |
| No Earners | 405 (20.4%) | $57,321 |
| 1 Earner | 579 (29.2%) | $81,106 |
| 2 Earners | 696 (35.1%) | $140,722 |
| 3+ Earners | 301 (15.2%) | $149,219 |
| Total | 1,981 (100.0%) | $118,257 |
Household Income in Uniontown
Household Income Brackets in Uniontown
With 656 households falling in the category, the $100,000 to $149,999 income range is the most frequent in Uniontown, accounting for 25.2% of all households. In contrast, only 26 households (1.0%) fall into the $10,000 to $14,999 income bracket, making it the least populous group.
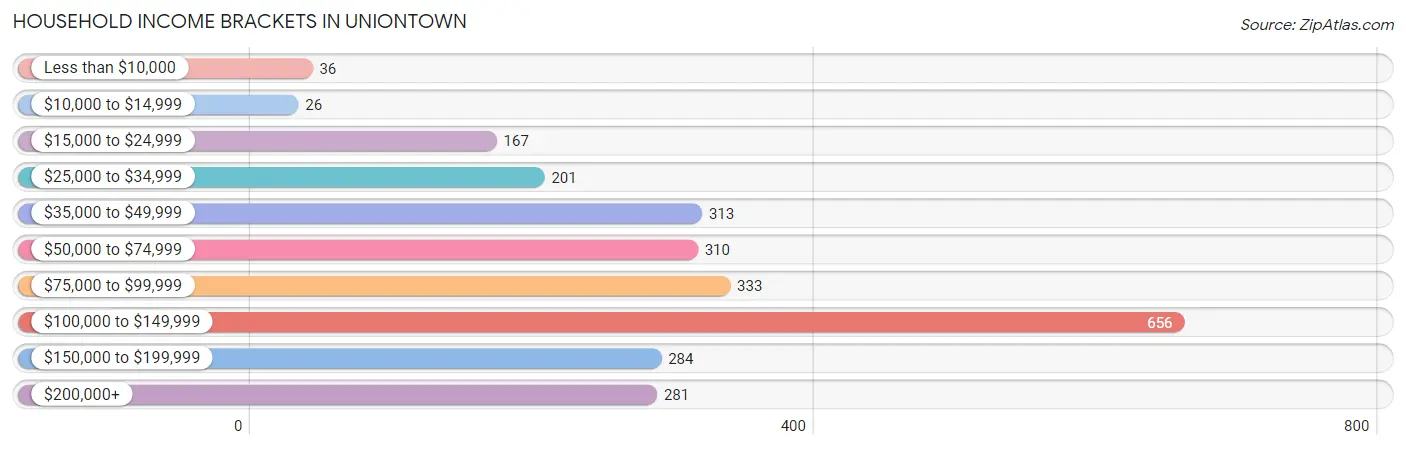
| Income Bracket | # Households | % Households |
| Less than $10,000 | 36 | 1.4% |
| $10,000 to $14,999 | 26 | 1.0% |
| $15,000 to $24,999 | 167 | 6.4% |
| $25,000 to $34,999 | 201 | 7.7% |
| $35,000 to $49,999 | 313 | 12.0% |
| $50,000 to $74,999 | 310 | 11.9% |
| $75,000 to $99,999 | 333 | 12.8% |
| $100,000 to $149,999 | 656 | 25.2% |
| $150,000 to $199,999 | 284 | 10.9% |
| $200,000+ | 281 | 10.8% |
Household Income by Householder Age in Uniontown
The median household income in Uniontown is $93,668, with the highest median household income of $129,821 found in the 45 to 64 years age bracket for the primary householder. A total of 997 households (38.3%) fall into this category.
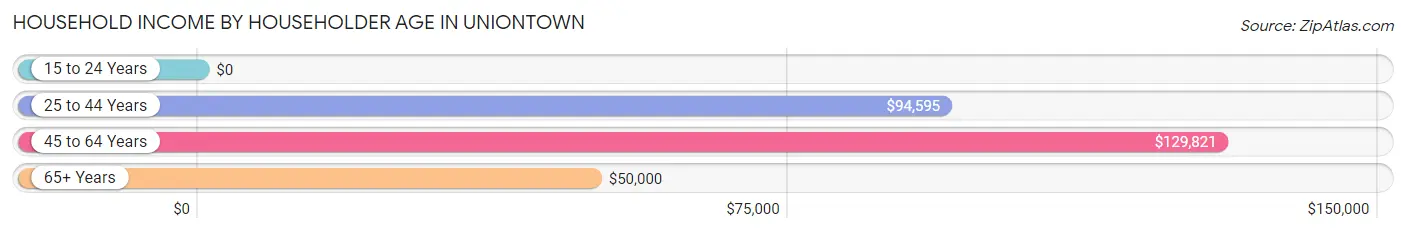
| Income Bracket | # Households | Median Income |
| 15 to 24 Years | 0 (0.0%) | $0 |
| 25 to 44 Years | 698 (26.8%) | $94,595 |
| 45 to 64 Years | 997 (38.3%) | $129,821 |
| 65+ Years | 910 (34.9%) | $50,000 |
| Total | 2,605 (100.0%) | $93,668 |
Poverty in Uniontown
Income Below Poverty by Sex and Age in Uniontown
With 3.3% poverty level for males and 5.0% for females among the residents of Uniontown, 12 to 14 year old males and 12 to 14 year old females are the most vulnerable to poverty, with 36 males (20.0%) and 33 females (22.6%) in their respective age groups living below the poverty level.
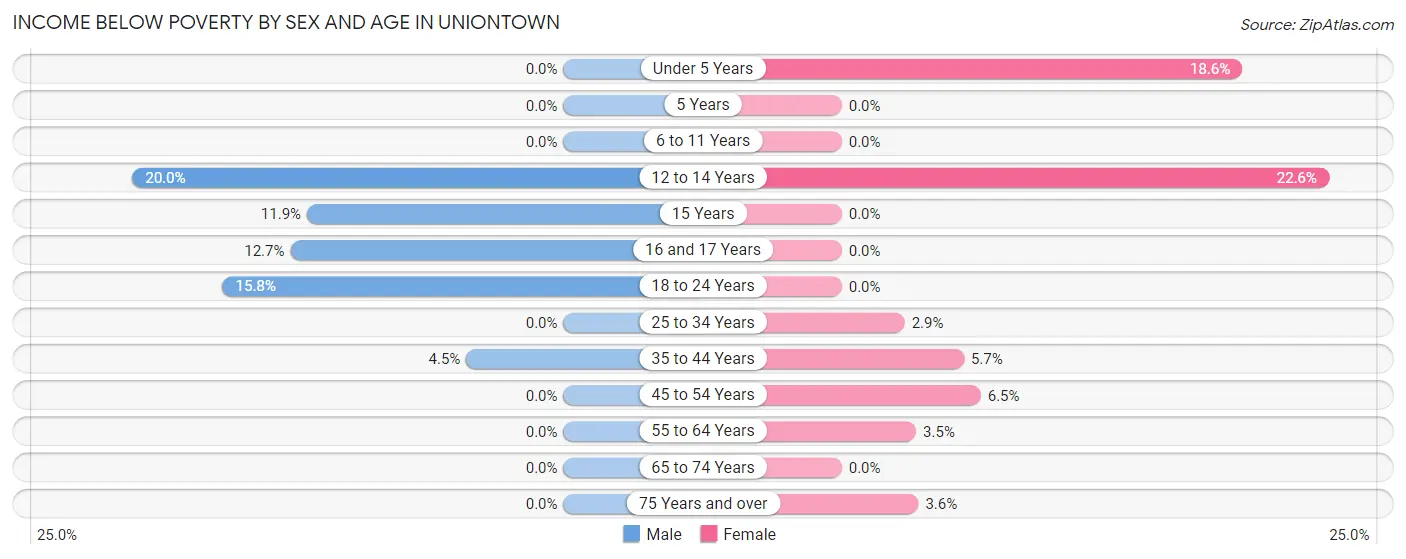
| Age Bracket | Male | Female |
| Under 5 Years | 0 (0.0%) | 44 (18.6%) |
| 5 Years | 0 (0.0%) | 0 (0.0%) |
| 6 to 11 Years | 0 (0.0%) | 0 (0.0%) |
| 12 to 14 Years | 36 (20.0%) | 33 (22.6%) |
| 15 Years | 10 (11.9%) | 0 (0.0%) |
| 16 and 17 Years | 19 (12.7%) | 0 (0.0%) |
| 18 to 24 Years | 34 (15.8%) | 0 (0.0%) |
| 25 to 34 Years | 0 (0.0%) | 9 (2.9%) |
| 35 to 44 Years | 17 (4.5%) | 25 (5.7%) |
| 45 to 54 Years | 0 (0.0%) | 33 (6.5%) |
| 55 to 64 Years | 0 (0.0%) | 14 (3.5%) |
| 65 to 74 Years | 0 (0.0%) | 0 (0.0%) |
| 75 Years and over | 0 (0.0%) | 11 (3.6%) |
| Total | 116 (3.3%) | 169 (5.0%) |
Income Above Poverty by Sex and Age in Uniontown
According to the poverty statistics in Uniontown, males aged under 5 years and females aged 5 years are the age groups that are most secure financially, with 100.0% of males and 100.0% of females in these age groups living above the poverty line.
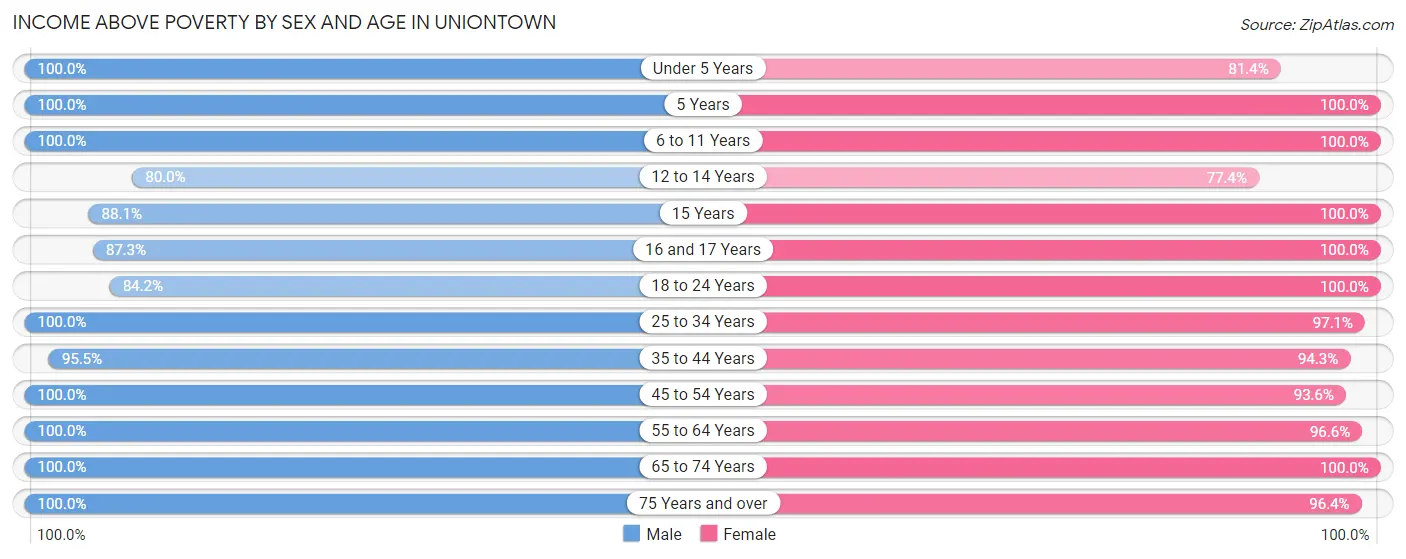
| Age Bracket | Male | Female |
| Under 5 Years | 155 (100.0%) | 193 (81.4%) |
| 5 Years | 47 (100.0%) | 27 (100.0%) |
| 6 to 11 Years | 383 (100.0%) | 343 (100.0%) |
| 12 to 14 Years | 144 (80.0%) | 113 (77.4%) |
| 15 Years | 74 (88.1%) | 13 (100.0%) |
| 16 and 17 Years | 131 (87.3%) | 45 (100.0%) |
| 18 to 24 Years | 181 (84.2%) | 138 (100.0%) |
| 25 to 34 Years | 309 (100.0%) | 299 (97.1%) |
| 35 to 44 Years | 360 (95.5%) | 416 (94.3%) |
| 45 to 54 Years | 520 (100.0%) | 479 (93.5%) |
| 55 to 64 Years | 381 (100.0%) | 392 (96.6%) |
| 65 to 74 Years | 536 (100.0%) | 458 (100.0%) |
| 75 Years and over | 228 (100.0%) | 298 (96.4%) |
| Total | 3,449 (96.8%) | 3,214 (95.0%) |
Income Below Poverty Among Married-Couple Families in Uniontown
The poverty statistics for married-couple families in Uniontown show that 1.0% or 17 of the total 1,706 families live below the poverty line. Families with 5 or more children have the highest poverty rate of 60.7%, comprising of 17 families. On the other hand, families with no children have the lowest poverty rate of 0.0%, which includes 0 families.
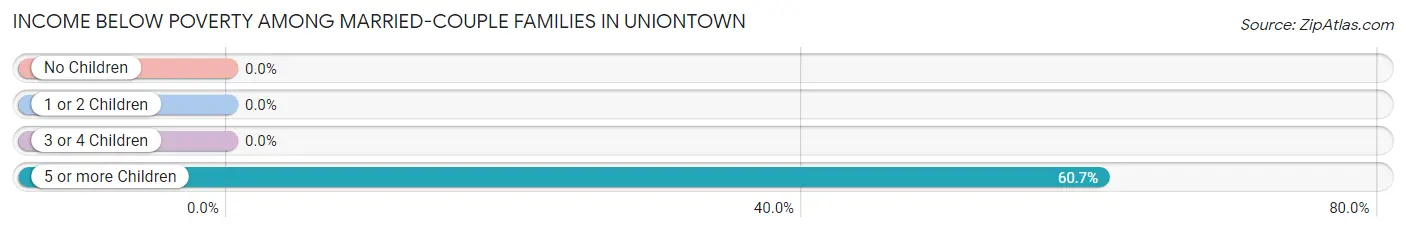
| Children | Above Poverty | Below Poverty |
| No Children | 993 (100.0%) | 0 (0.0%) |
| 1 or 2 Children | 542 (100.0%) | 0 (0.0%) |
| 3 or 4 Children | 143 (100.0%) | 0 (0.0%) |
| 5 or more Children | 11 (39.3%) | 17 (60.7%) |
| Total | 1,689 (99.0%) | 17 (1.0%) |
Income Below Poverty Among Single-Parent Households in Uniontown
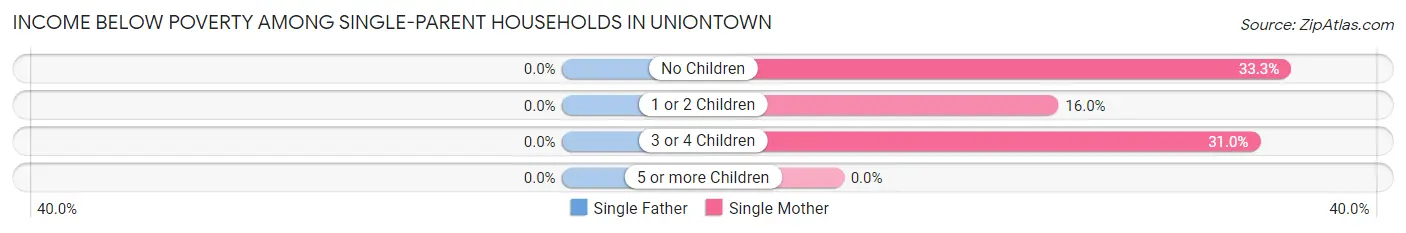
| Children | Single Father | Single Mother |
| No Children | 0 (0.0%) | 17 (33.3%) |
| 1 or 2 Children | 0 (0.0%) | 16 (16.0%) |
| 3 or 4 Children | 0 (0.0%) | 9 (31.0%) |
| 5 or more Children | 0 (0.0%) | 0 (0.0%) |
| Total | 0 (0.0%) | 42 (23.3%) |
Income Below Poverty Among Married-Couple vs Single-Parent Households in Uniontown
The poverty data for Uniontown shows that 17 of the married-couple family households (1.0%) and 42 of the single-parent households (15.3%) are living below the poverty level. Within the married-couple family households, those with 5 or more children have the highest poverty rate, with 17 households (60.7%) falling below the poverty line. Among the single-parent households, those with 3 or 4 children have the highest poverty rate, with 9 household (31.0%) living below poverty.
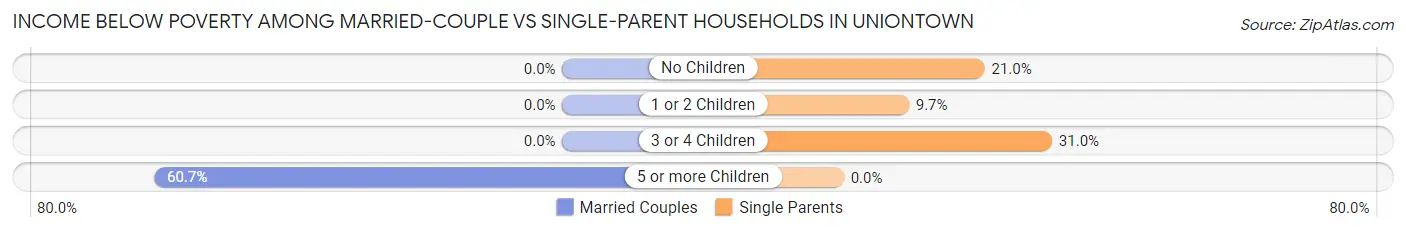
| Children | Married-Couple Families | Single-Parent Households |
| No Children | 0 (0.0%) | 17 (21.0%) |
| 1 or 2 Children | 0 (0.0%) | 16 (9.7%) |
| 3 or 4 Children | 0 (0.0%) | 9 (31.0%) |
| 5 or more Children | 17 (60.7%) | 0 (0.0%) |
| Total | 17 (1.0%) | 42 (15.3%) |
Race in Uniontown
The most populous races in Uniontown are White / Caucasian (6,548 | 94.2%), Two or more Races (221 | 3.2%), and Hispanic or Latino (119 | 1.7%).
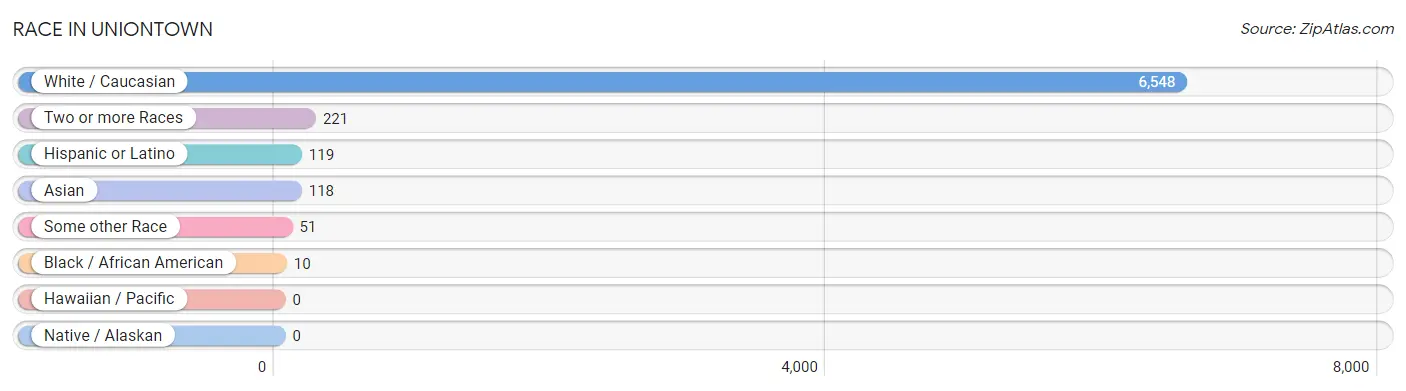
| Race | # Population | % Population |
| Asian | 118 | 1.7% |
| Black / African American | 10 | 0.1% |
| Hawaiian / Pacific | 0 | 0.0% |
| Hispanic or Latino | 119 | 1.7% |
| Native / Alaskan | 0 | 0.0% |
| White / Caucasian | 6,548 | 94.2% |
| Two or more Races | 221 | 3.2% |
| Some other Race | 51 | 0.7% |
| Total | 6,948 | 100.0% |
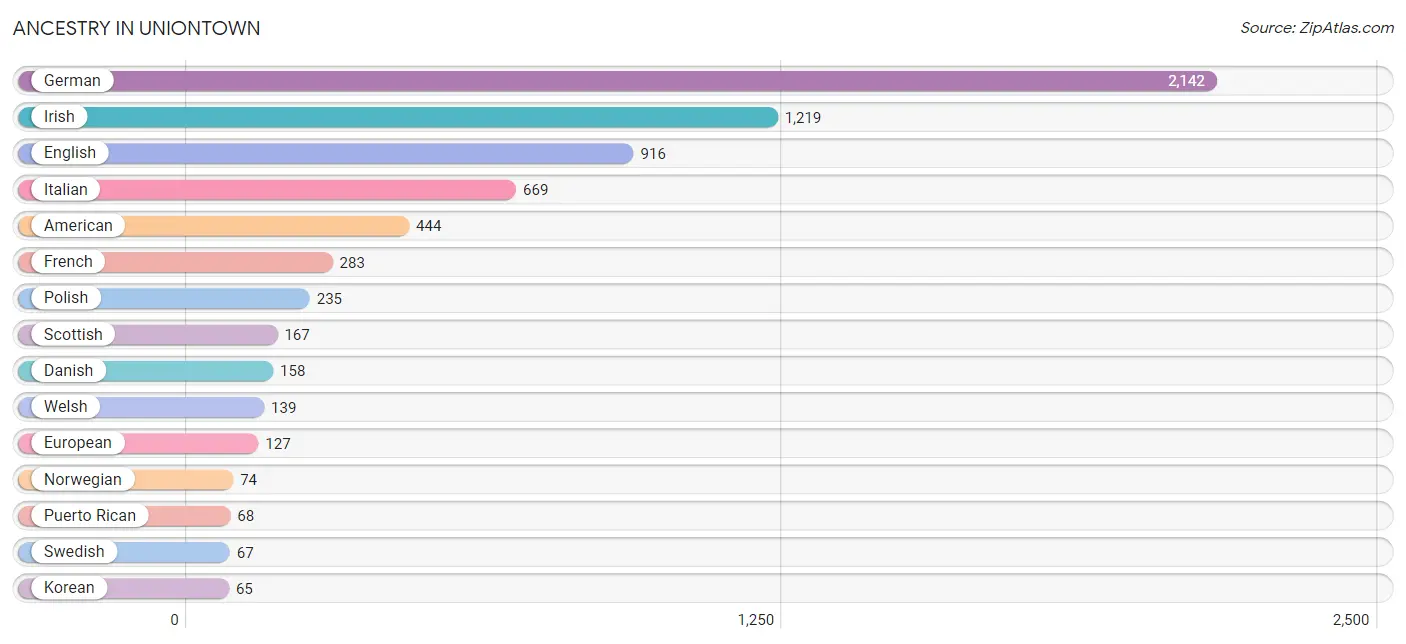
Ancestry in Uniontown
The most populous ancestries reported in Uniontown are German (2,142 | 30.8%), Irish (1,219 | 17.5%), English (916 | 13.2%), Italian (669 | 9.6%), and American (444 | 6.4%), together accounting for 77.6% of all Uniontown residents.
| Ancestry | # Population | % Population |
| American | 444 | 6.4% |
| Arab | 14 | 0.2% |
| Australian | 6 | 0.1% |
| Bhutanese | 22 | 0.3% |
| British | 64 | 0.9% |
| Burmese | 8 | 0.1% |
| Canadian | 7 | 0.1% |
| Central American Indian | 29 | 0.4% |
| Croatian | 3 | 0.0% |
| Danish | 158 | 2.3% |
| Dutch | 52 | 0.7% |
| Eastern European | 38 | 0.5% |
| English | 916 | 13.2% |
| European | 127 | 1.8% |
| Finnish | 8 | 0.1% |
| French | 283 | 4.1% |
| French Canadian | 16 | 0.2% |
| German | 2,142 | 30.8% |
| Greek | 24 | 0.4% |
| Hungarian | 52 | 0.7% |
| Indian (Asian) | 51 | 0.7% |
| Irish | 1,219 | 17.5% |
| Italian | 669 | 9.6% |
| Korean | 65 | 0.9% |
| Lebanese | 14 | 0.2% |
| Norwegian | 74 | 1.1% |
| Pakistani | 16 | 0.2% |
| Pennsylvania German | 8 | 0.1% |
| Peruvian | 26 | 0.4% |
| Polish | 235 | 3.4% |
| Puerto Rican | 68 | 1.0% |
| Romanian | 23 | 0.3% |
| Russian | 7 | 0.1% |
| Scandinavian | 15 | 0.2% |
| Scotch-Irish | 25 | 0.4% |
| Scottish | 167 | 2.4% |
| Serbian | 3 | 0.0% |
| Slovak | 60 | 0.9% |
| Slovene | 22 | 0.3% |
| South American | 26 | 0.4% |
| Swedish | 67 | 1.0% |
| Swiss | 62 | 0.9% |
| Ukrainian | 42 | 0.6% |
| Welsh | 139 | 2.0% |
| Yugoslavian | 10 | 0.1% | View All 45 Rows |
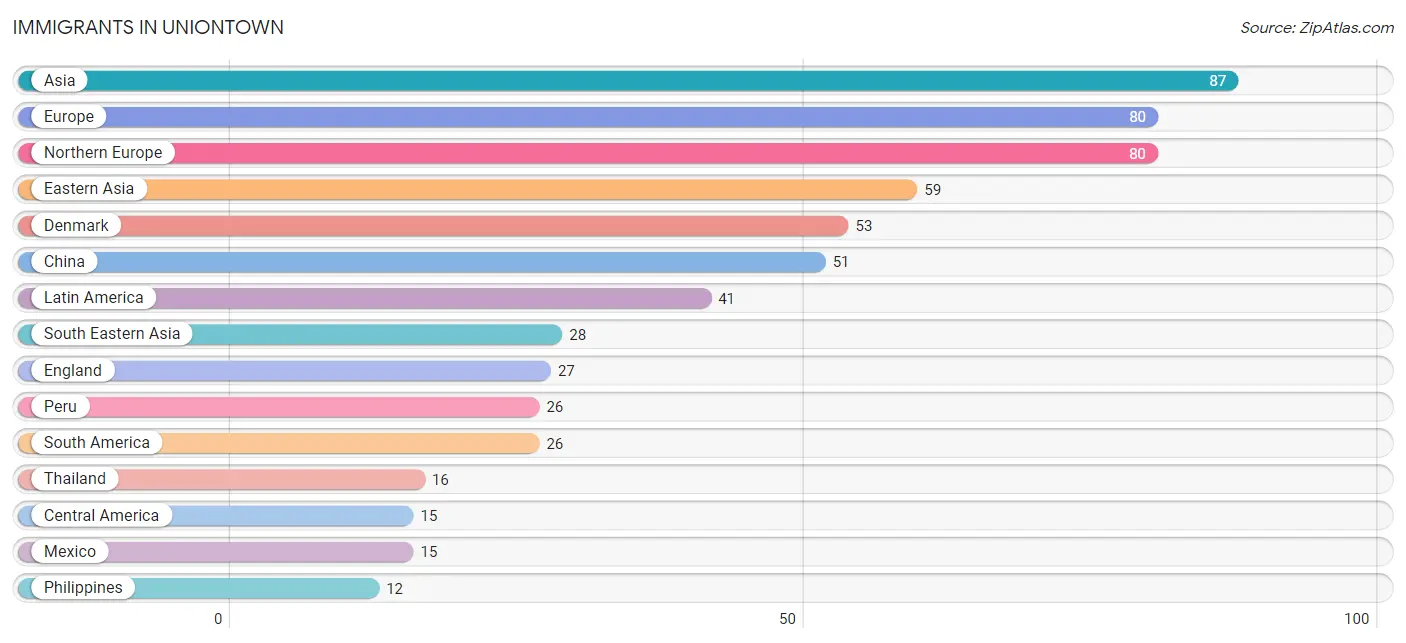
Immigrants in Uniontown
The most numerous immigrant groups reported in Uniontown came from Asia (87 | 1.3%), Europe (80 | 1.1%), Northern Europe (80 | 1.1%), Eastern Asia (59 | 0.9%), and Denmark (53 | 0.8%), together accounting for 5.2% of all Uniontown residents.
| Immigration Origin | # Population | % Population |
| Asia | 87 | 1.3% |
| Canada | 6 | 0.1% |
| Central America | 15 | 0.2% |
| China | 51 | 0.7% |
| Denmark | 53 | 0.8% |
| Eastern Asia | 59 | 0.9% |
| England | 27 | 0.4% |
| Europe | 80 | 1.1% |
| Hong Kong | 7 | 0.1% |
| Korea | 8 | 0.1% |
| Latin America | 41 | 0.6% |
| Mexico | 15 | 0.2% |
| Northern Europe | 80 | 1.1% |
| Peru | 26 | 0.4% |
| Philippines | 12 | 0.2% |
| South America | 26 | 0.4% |
| South Eastern Asia | 28 | 0.4% |
| Taiwan | 9 | 0.1% |
| Thailand | 16 | 0.2% | View All 19 Rows |
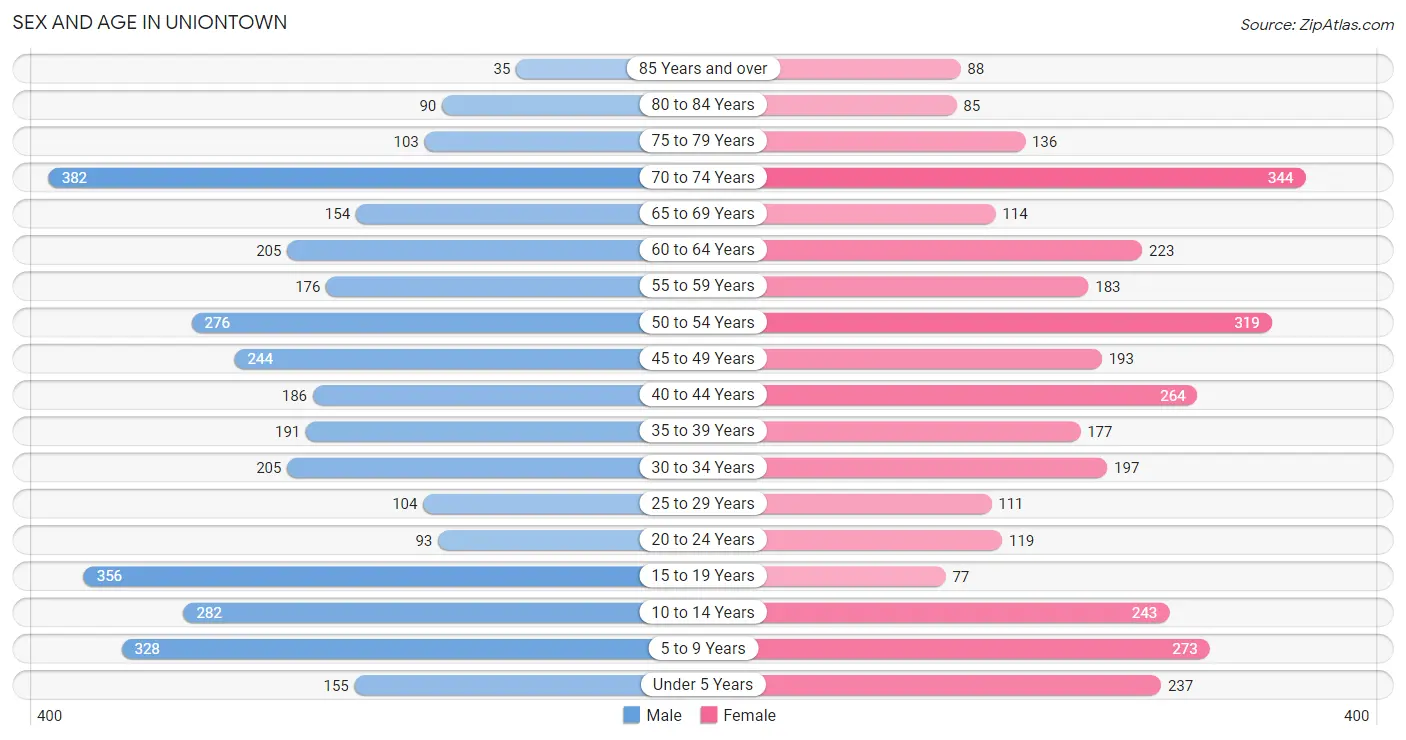
Sex and Age in Uniontown
Sex and Age in Uniontown
The most populous age groups in Uniontown are 70 to 74 Years (382 | 10.7%) for men and 70 to 74 Years (344 | 10.2%) for women.
| Age Bracket | Male | Female |
| Under 5 Years | 155 (4.3%) | 237 (7.0%) |
| 5 to 9 Years | 328 (9.2%) | 273 (8.1%) |
| 10 to 14 Years | 282 (7.9%) | 243 (7.2%) |
| 15 to 19 Years | 356 (10.0%) | 77 (2.3%) |
| 20 to 24 Years | 93 (2.6%) | 119 (3.5%) |
| 25 to 29 Years | 104 (2.9%) | 111 (3.3%) |
| 30 to 34 Years | 205 (5.8%) | 197 (5.8%) |
| 35 to 39 Years | 191 (5.4%) | 177 (5.2%) |
| 40 to 44 Years | 186 (5.2%) | 264 (7.8%) |
| 45 to 49 Years | 244 (6.8%) | 193 (5.7%) |
| 50 to 54 Years | 276 (7.7%) | 319 (9.4%) |
| 55 to 59 Years | 176 (4.9%) | 183 (5.4%) |
| 60 to 64 Years | 205 (5.8%) | 223 (6.6%) |
| 65 to 69 Years | 154 (4.3%) | 114 (3.4%) |
| 70 to 74 Years | 382 (10.7%) | 344 (10.2%) |
| 75 to 79 Years | 103 (2.9%) | 136 (4.0%) |
| 80 to 84 Years | 90 (2.5%) | 85 (2.5%) |
| 85 Years and over | 35 (1.0%) | 88 (2.6%) |
| Total | 3,565 (100.0%) | 3,383 (100.0%) |
Families and Households in Uniontown
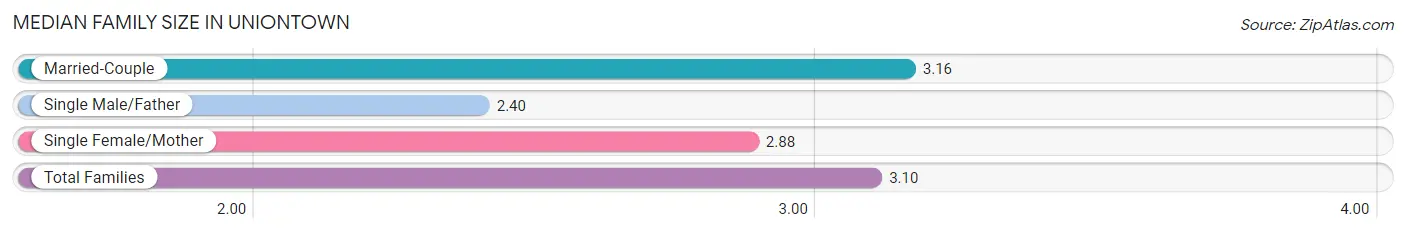
Median Family Size in Uniontown
The median family size in Uniontown is 3.10 persons per family, with married-couple families (1,706 | 86.1%) accounting for the largest median family size of 3.16 persons per family. On the other hand, single male/father families (95 | 4.8%) represent the smallest median family size with 2.40 persons per family.
| Family Type | # Families | Family Size |
| Married-Couple | 1,706 (86.1%) | 3.16 |
| Single Male/Father | 95 (4.8%) | 2.40 |
| Single Female/Mother | 180 (9.1%) | 2.88 |
| Total Families | 1,981 (100.0%) | 3.10 |
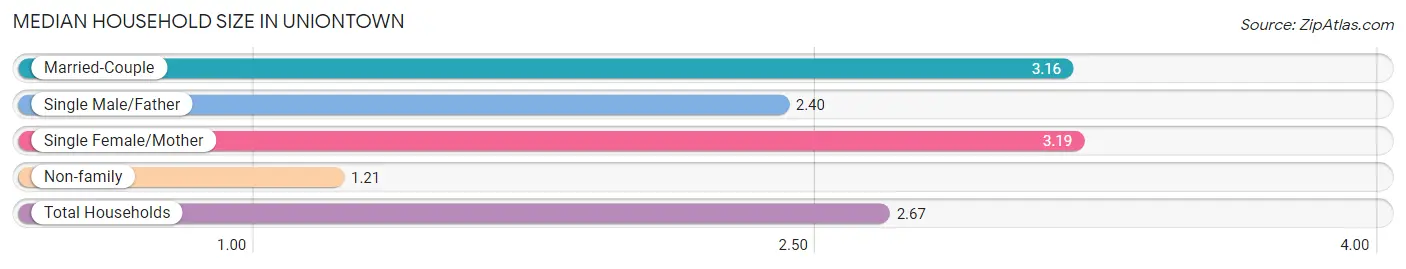
Median Household Size in Uniontown
The median household size in Uniontown is 2.67 persons per household, with single female/mother households (180 | 6.9%) accounting for the largest median household size of 3.19 persons per household. non-family households (624 | 23.9%) represent the smallest median household size with 1.21 persons per household.
| Household Type | # Households | Household Size |
| Married-Couple | 1,706 (65.5%) | 3.16 |
| Single Male/Father | 95 (3.6%) | 2.40 |
| Single Female/Mother | 180 (6.9%) | 3.19 |
| Non-family | 624 (23.9%) | 1.21 |
| Total Households | 2,605 (100.0%) | 2.67 |
Household Size by Marriage Status in Uniontown
Out of a total of 2,605 households in Uniontown, 1,981 (76.0%) are family households, while 624 (23.9%) are nonfamily households. The most numerous type of family households are 2-person households, comprising 966, and the most common type of nonfamily households are 1-person households, comprising 497.
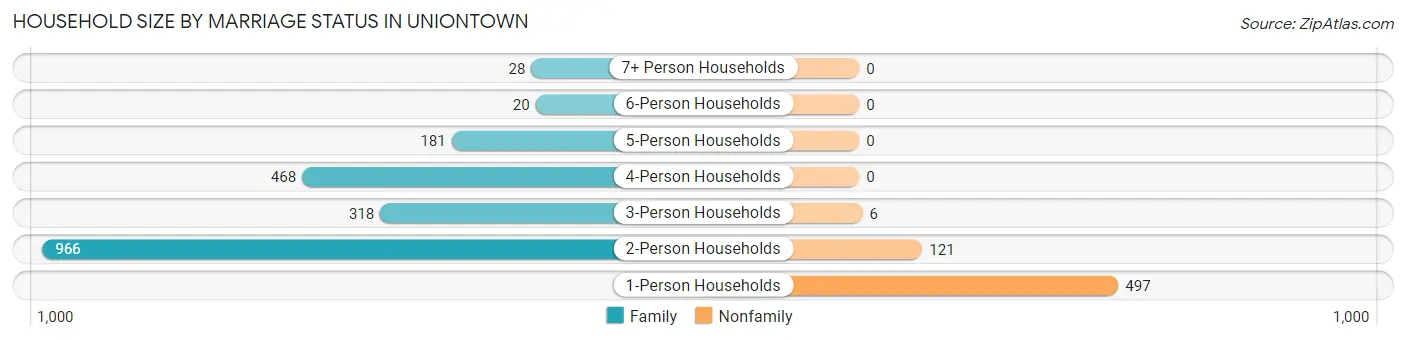
| Household Size | Family Households | Nonfamily Households |
| 1-Person Households | - | 497 (19.1%) |
| 2-Person Households | 966 (37.1%) | 121 (4.6%) |
| 3-Person Households | 318 (12.2%) | 6 (0.2%) |
| 4-Person Households | 468 (18.0%) | 0 (0.0%) |
| 5-Person Households | 181 (7.0%) | 0 (0.0%) |
| 6-Person Households | 20 (0.8%) | 0 (0.0%) |
| 7+ Person Households | 28 (1.1%) | 0 (0.0%) |
| Total | 1,981 (76.0%) | 624 (23.9%) |
Female Fertility in Uniontown
Fertility by Age in Uniontown
Average fertility rate in Uniontown is 14.0 births per 1,000 women. Women in the age bracket of 20 to 34 years have the highest fertility rate with 42.0 births per 1,000 women. Women in the age bracket of 20 to 34 years acount for 100.0% of all women with births.
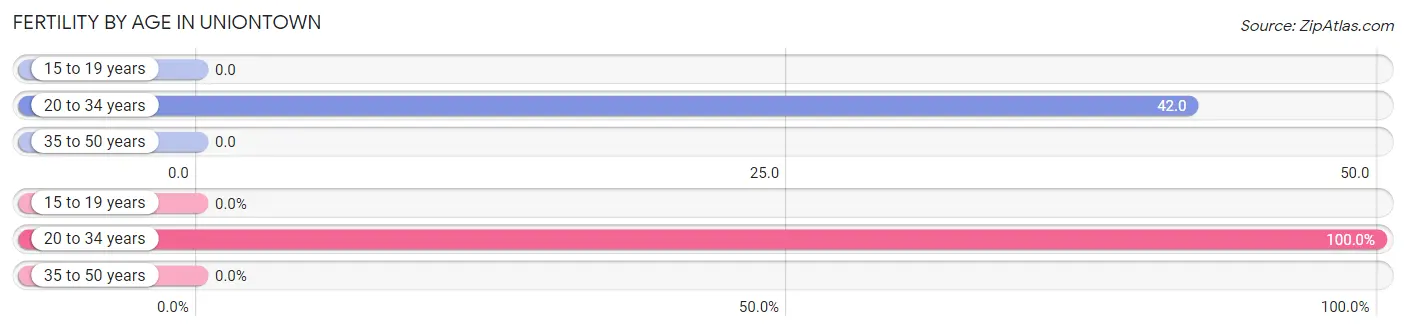
| Age Bracket | Women with Births | Births / 1,000 Women |
| 15 to 19 years | 0 (0.0%) | 0.0 |
| 20 to 34 years | 18 (100.0%) | 42.0 |
| 35 to 50 years | 0 (0.0%) | 0.0 |
| Total | 18 (100.0%) | 14.0 |
Fertility by Age by Marriage Status in Uniontown
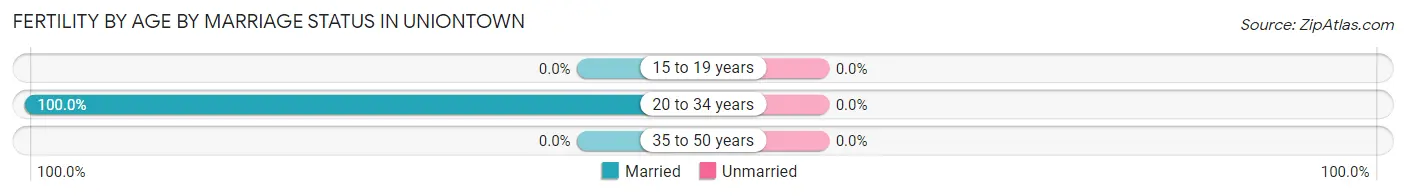
| Age Bracket | Married | Unmarried |
| 15 to 19 years | 0 (0.0%) | 0 (0.0%) |
| 20 to 34 years | 18 (100.0%) | 0 (0.0%) |
| 35 to 50 years | 0 (0.0%) | 0 (0.0%) |
| Total | 18 (100.0%) | 0 (0.0%) |
Fertility by Education in Uniontown
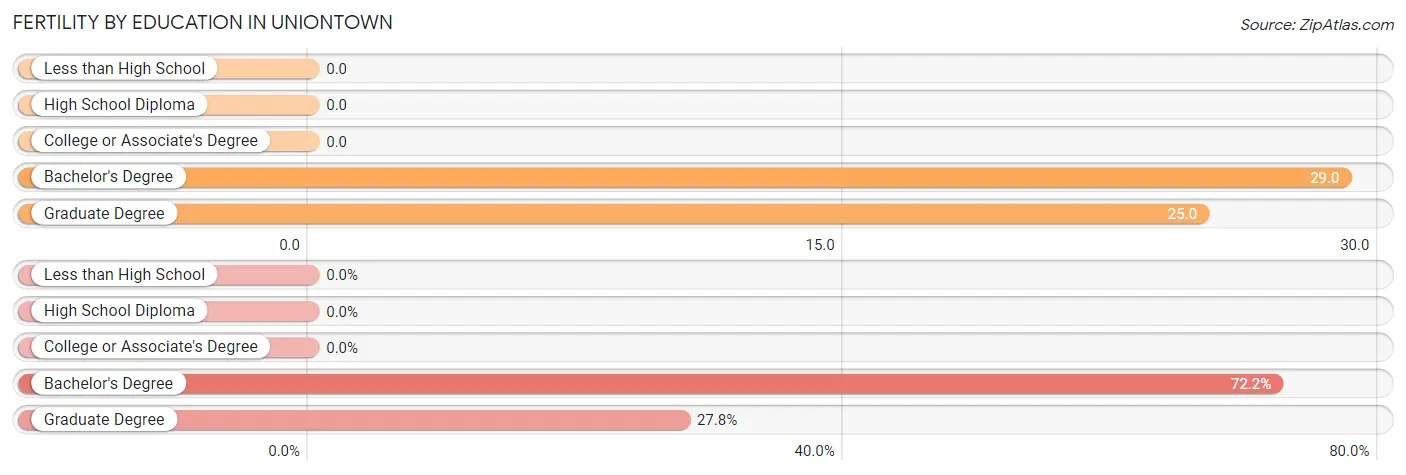
| Educational Attainment | Women with Births | Births / 1,000 Women |
| Less than High School | 0 (0.0%) | 0.0 |
| High School Diploma | 0 (0.0%) | 0.0 |
| College or Associate's Degree | 0 (0.0%) | 0.0 |
| Bachelor's Degree | 13 (72.2%) | 29.0 |
| Graduate Degree | 5 (27.8%) | 25.0 |
| Total | 18 (100.0%) | 14.0 |
Fertility by Education by Marriage Status in Uniontown
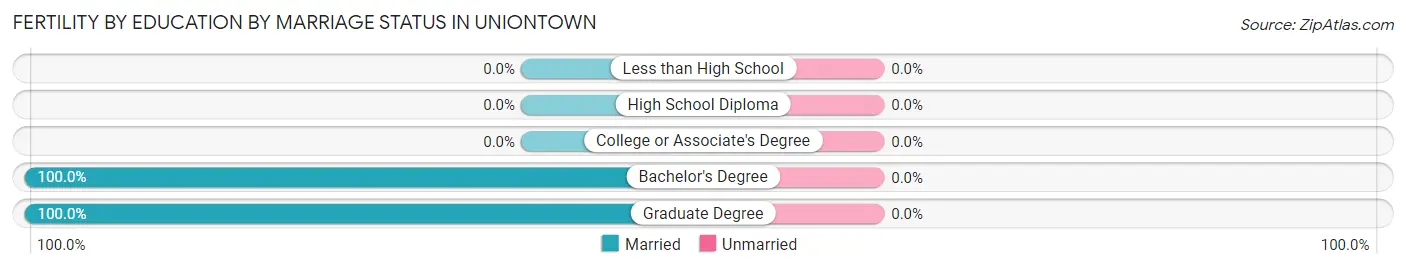
| Educational Attainment | Married | Unmarried |
| Less than High School | 0 (0.0%) | 0 (0.0%) |
| High School Diploma | 0 (0.0%) | 0 (0.0%) |
| College or Associate's Degree | 0 (0.0%) | 0 (0.0%) |
| Bachelor's Degree | 13 (100.0%) | 0 (0.0%) |
| Graduate Degree | 5 (100.0%) | 0 (0.0%) |
| Total | 18 (100.0%) | 0 (0.0%) |
Employment Characteristics in Uniontown
Employment by Class of Employer in Uniontown
Among the 3,213 employed individuals in Uniontown, private company employees (1,982 | 61.7%), not-for-profit organizations (390 | 12.1%), and local government employees (382 | 11.9%) make up the most common classes of employment.
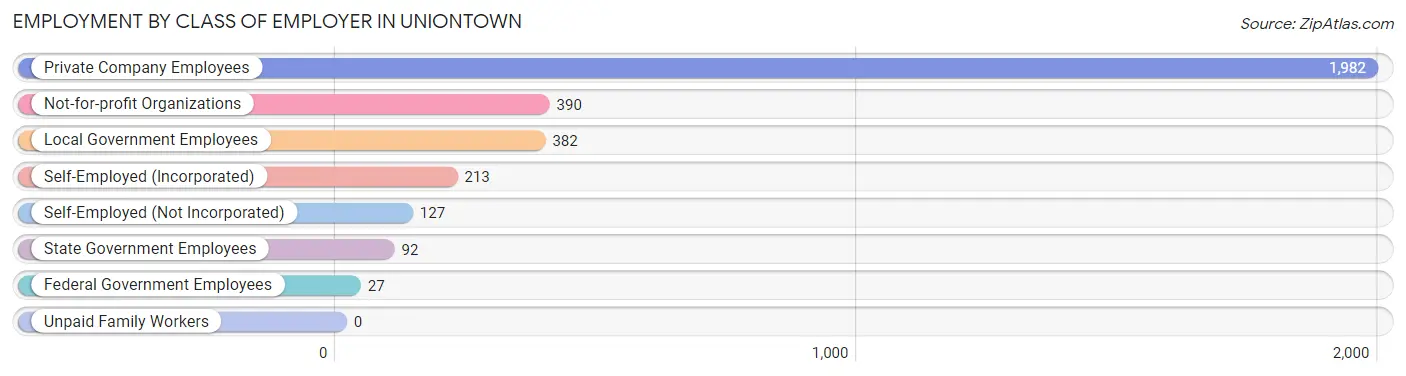
| Employer Class | # Employees | % Employees |
| Private Company Employees | 1,982 | 61.7% |
| Self-Employed (Incorporated) | 213 | 6.6% |
| Self-Employed (Not Incorporated) | 127 | 4.0% |
| Not-for-profit Organizations | 390 | 12.1% |
| Local Government Employees | 382 | 11.9% |
| State Government Employees | 92 | 2.9% |
| Federal Government Employees | 27 | 0.8% |
| Unpaid Family Workers | 0 | 0.0% |
| Total | 3,213 | 100.0% |
Employment Status by Age in Uniontown
According to the labor force statistics for Uniontown, out of the total population over 16 years of age (5,333), 62.9% or 3,354 individuals are in the labor force, with 4.0% or 134 of them unemployed. The age group with the highest labor force participation rate is 25 to 29 years, with 92.6% or 199 individuals in the labor force. Within the labor force, the 20 to 24 years age range has the highest percentage of unemployed individuals, with 30.1% or 55 of them being unemployed.
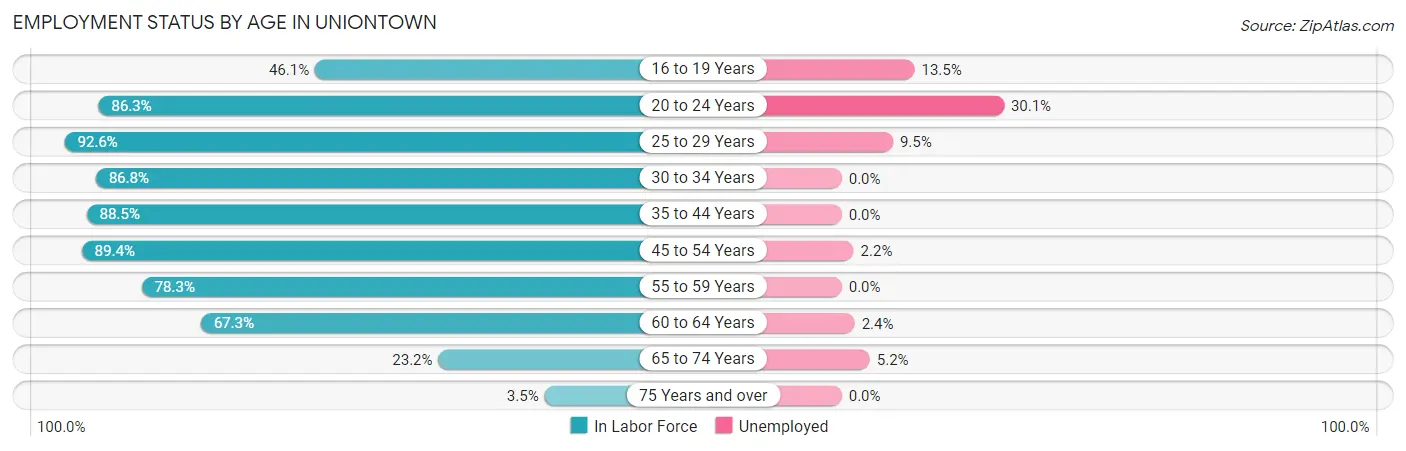
| Age Bracket | In Labor Force | Unemployed |
| 16 to 19 Years | 155 (46.1%) | 21 (13.5%) |
| 20 to 24 Years | 183 (86.3%) | 55 (30.1%) |
| 25 to 29 Years | 199 (92.6%) | 19 (9.5%) |
| 30 to 34 Years | 349 (86.8%) | 0 (0.0%) |
| 35 to 44 Years | 724 (88.5%) | 0 (0.0%) |
| 45 to 54 Years | 923 (89.4%) | 20 (2.2%) |
| 55 to 59 Years | 281 (78.3%) | 0 (0.0%) |
| 60 to 64 Years | 288 (67.3%) | 7 (2.4%) |
| 65 to 74 Years | 231 (23.2%) | 12 (5.2%) |
| 75 Years and over | 19 (3.5%) | 0 (0.0%) |
| Total | 3,354 (62.9%) | 134 (4.0%) |
Employment Status by Educational Attainment in Uniontown
According to labor force statistics for Uniontown, 84.9% of individuals (2,763) out of the total population between 25 and 64 years of age (3,254) are in the labor force, with 1.7% or 47 of them being unemployed. The group with the highest labor force participation rate are those with the educational attainment of bachelor's degree or higher, with 90.4% or 1,275 individuals in the labor force. Within the labor force, individuals with bachelor's degree or higher education have the highest percentage of unemployment, with 3.6% or 46 of them being unemployed.
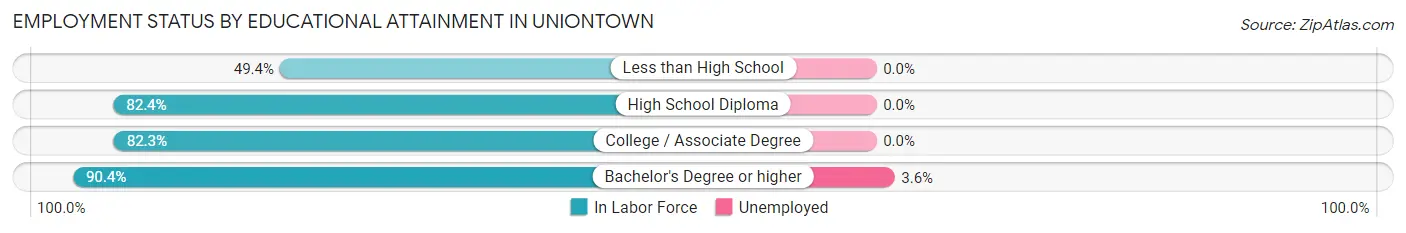
| Educational Attainment | In Labor Force | Unemployed |
| Less than High School | 44 (49.4%) | 0 (0.0%) |
| High School Diploma | 493 (82.4%) | 0 (0.0%) |
| College / Associate Degree | 952 (82.3%) | 0 (0.0%) |
| Bachelor's Degree or higher | 1,275 (90.4%) | 51 (3.6%) |
| Total | 2,763 (84.9%) | 55 (1.7%) |
Employment Occupations by Sex in Uniontown
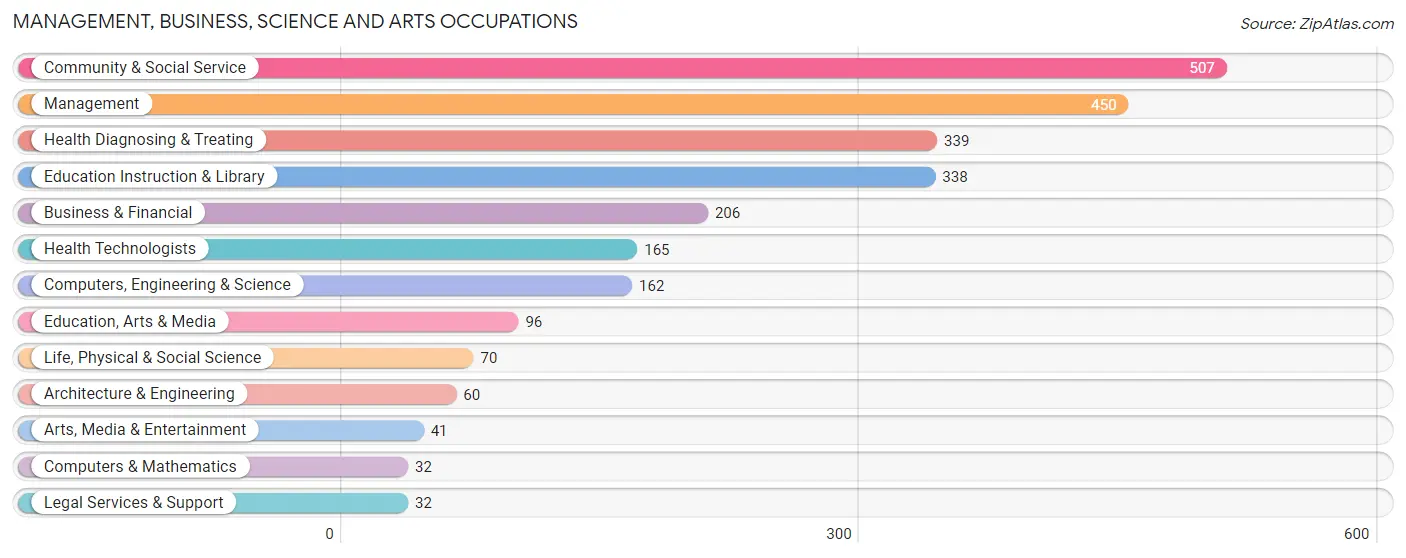
Management, Business, Science and Arts Occupations
The most common Management, Business, Science and Arts occupations in Uniontown are Community & Social Service (507 | 15.8%), Management (450 | 14.0%), Health Diagnosing & Treating (339 | 10.5%), Education Instruction & Library (338 | 10.5%), and Business & Financial (206 | 6.4%).
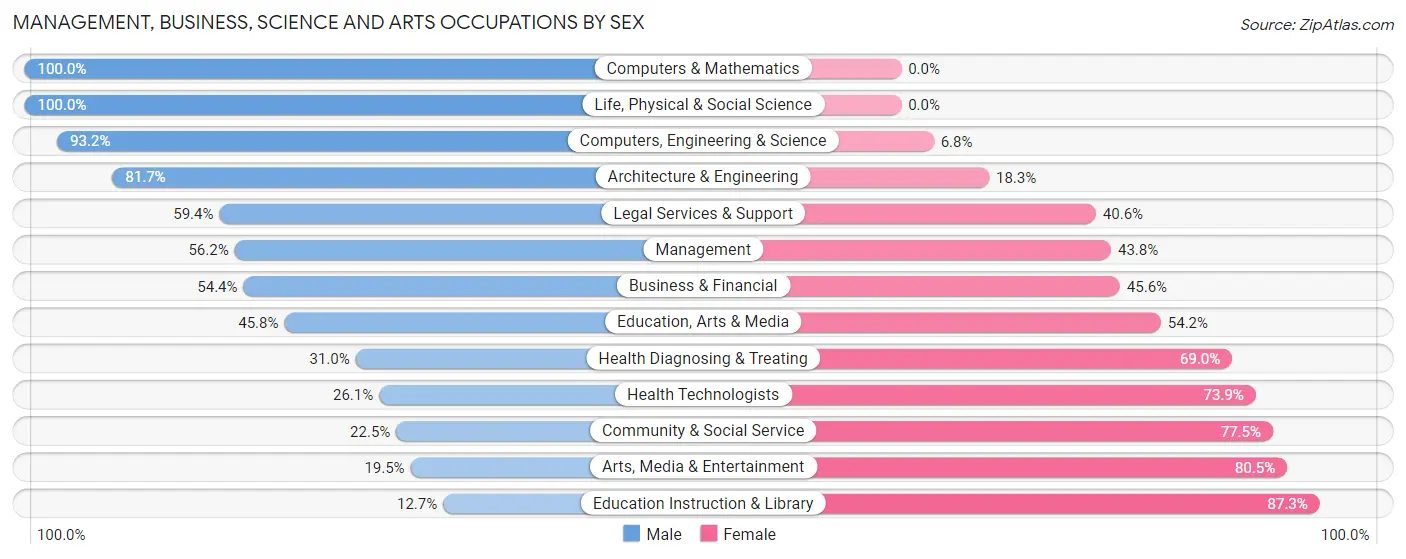
Management, Business, Science and Arts Occupations by Sex
Within the Management, Business, Science and Arts occupations in Uniontown, the most male-oriented occupations are Computers & Mathematics (100.0%), Life, Physical & Social Science (100.0%), and Computers, Engineering & Science (93.2%), while the most female-oriented occupations are Education Instruction & Library (87.3%), Arts, Media & Entertainment (80.5%), and Community & Social Service (77.5%).
| Occupation | Male | Female |
| Management | 253 (56.2%) | 197 (43.8%) |
| Business & Financial | 112 (54.4%) | 94 (45.6%) |
| Computers, Engineering & Science | 151 (93.2%) | 11 (6.8%) |
| Computers & Mathematics | 32 (100.0%) | 0 (0.0%) |
| Architecture & Engineering | 49 (81.7%) | 11 (18.3%) |
| Life, Physical & Social Science | 70 (100.0%) | 0 (0.0%) |
| Community & Social Service | 114 (22.5%) | 393 (77.5%) |
| Education, Arts & Media | 44 (45.8%) | 52 (54.2%) |
| Legal Services & Support | 19 (59.4%) | 13 (40.6%) |
| Education Instruction & Library | 43 (12.7%) | 295 (87.3%) |
| Arts, Media & Entertainment | 8 (19.5%) | 33 (80.5%) |
| Health Diagnosing & Treating | 105 (31.0%) | 234 (69.0%) |
| Health Technologists | 43 (26.1%) | 122 (73.9%) |
| Total (Category) | 735 (44.2%) | 929 (55.8%) |
| Total (Overall) | 1,691 (52.5%) | 1,527 (47.4%) |
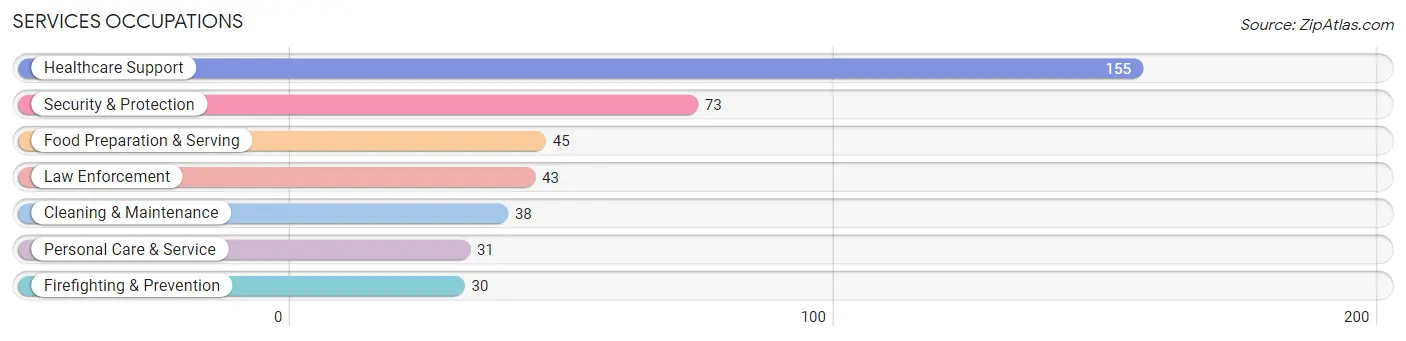
Services Occupations
The most common Services occupations in Uniontown are Healthcare Support (155 | 4.8%), Security & Protection (73 | 2.3%), Food Preparation & Serving (45 | 1.4%), Law Enforcement (43 | 1.3%), and Cleaning & Maintenance (38 | 1.2%).
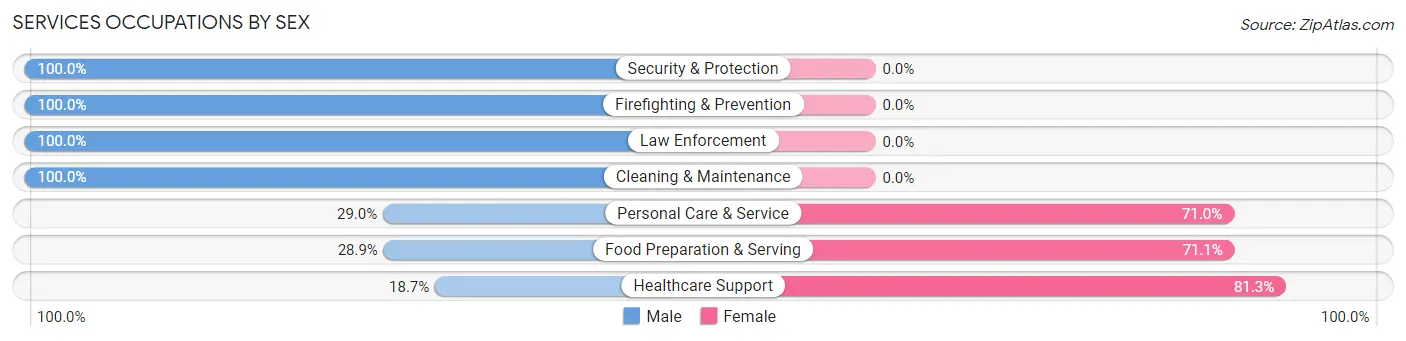
Services Occupations by Sex
Within the Services occupations in Uniontown, the most male-oriented occupations are Security & Protection (100.0%), Firefighting & Prevention (100.0%), and Law Enforcement (100.0%), while the most female-oriented occupations are Healthcare Support (81.3%), Food Preparation & Serving (71.1%), and Personal Care & Service (71.0%).
| Occupation | Male | Female |
| Healthcare Support | 29 (18.7%) | 126 (81.3%) |
| Security & Protection | 73 (100.0%) | 0 (0.0%) |
| Firefighting & Prevention | 30 (100.0%) | 0 (0.0%) |
| Law Enforcement | 43 (100.0%) | 0 (0.0%) |
| Food Preparation & Serving | 13 (28.9%) | 32 (71.1%) |
| Cleaning & Maintenance | 38 (100.0%) | 0 (0.0%) |
| Personal Care & Service | 9 (29.0%) | 22 (71.0%) |
| Total (Category) | 162 (47.4%) | 180 (52.6%) |
| Total (Overall) | 1,691 (52.5%) | 1,527 (47.4%) |
Sales and Office Occupations
The most common Sales and Office occupations in Uniontown are Sales & Related (444 | 13.8%), and Office & Administration (399 | 12.4%).
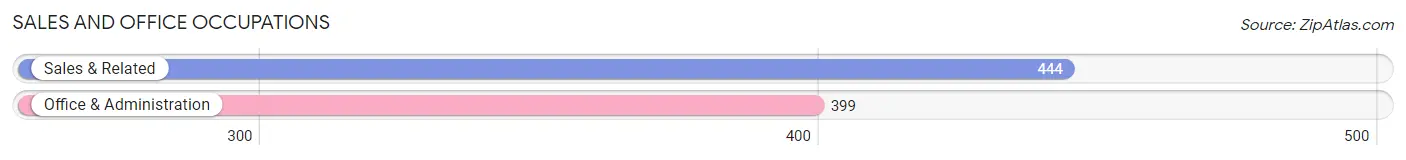
Sales and Office Occupations by Sex
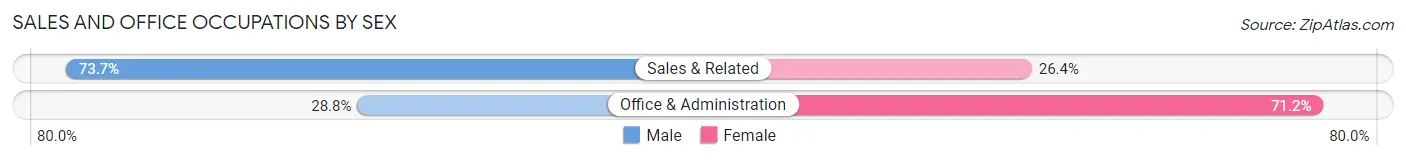
| Occupation | Male | Female |
| Sales & Related | 327 (73.7%) | 117 (26.4%) |
| Office & Administration | 115 (28.8%) | 284 (71.2%) |
| Total (Category) | 442 (52.4%) | 401 (47.6%) |
| Total (Overall) | 1,691 (52.5%) | 1,527 (47.4%) |
Natural Resources, Construction and Maintenance Occupations
The most common Natural Resources, Construction and Maintenance occupations in Uniontown are Construction & Extraction (104 | 3.2%), Installation, Maintenance & Repair (79 | 2.5%), and Farming, Fishing & Forestry (7 | 0.2%).
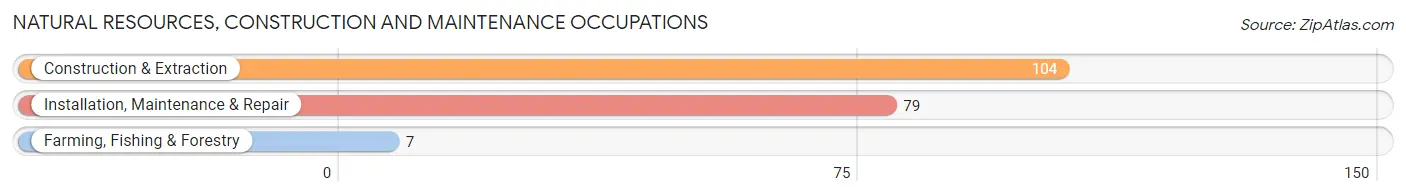
Natural Resources, Construction and Maintenance Occupations by Sex
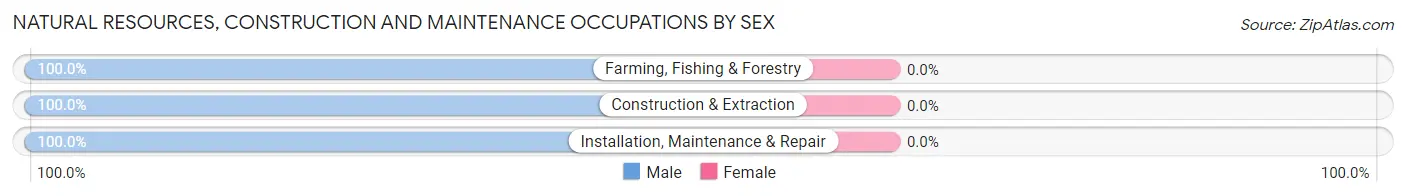
| Occupation | Male | Female |
| Farming, Fishing & Forestry | 7 (100.0%) | 0 (0.0%) |
| Construction & Extraction | 104 (100.0%) | 0 (0.0%) |
| Installation, Maintenance & Repair | 79 (100.0%) | 0 (0.0%) |
| Total (Category) | 190 (100.0%) | 0 (0.0%) |
| Total (Overall) | 1,691 (52.5%) | 1,527 (47.4%) |
Production, Transportation and Moving Occupations
The most common Production, Transportation and Moving occupations in Uniontown are Material Moving (92 | 2.9%), Production (69 | 2.1%), and Transportation (18 | 0.6%).
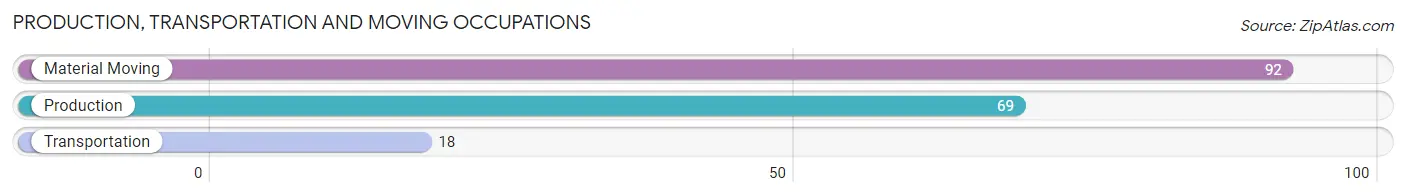
Production, Transportation and Moving Occupations by Sex
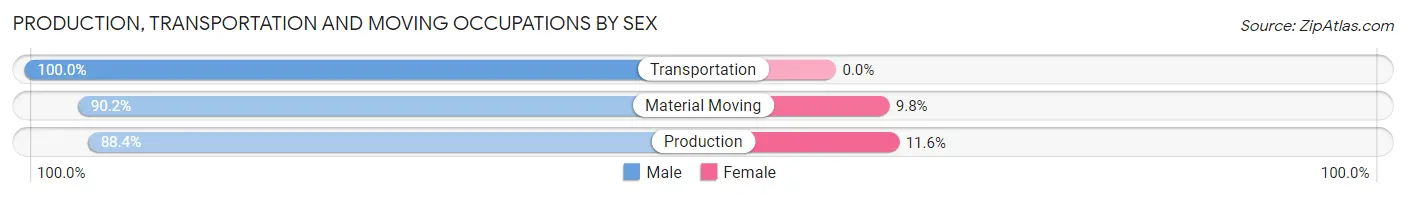
| Occupation | Male | Female |
| Production | 61 (88.4%) | 8 (11.6%) |
| Transportation | 18 (100.0%) | 0 (0.0%) |
| Material Moving | 83 (90.2%) | 9 (9.8%) |
| Total (Category) | 162 (90.5%) | 17 (9.5%) |
| Total (Overall) | 1,691 (52.5%) | 1,527 (47.4%) |
Employment Industries by Sex in Uniontown
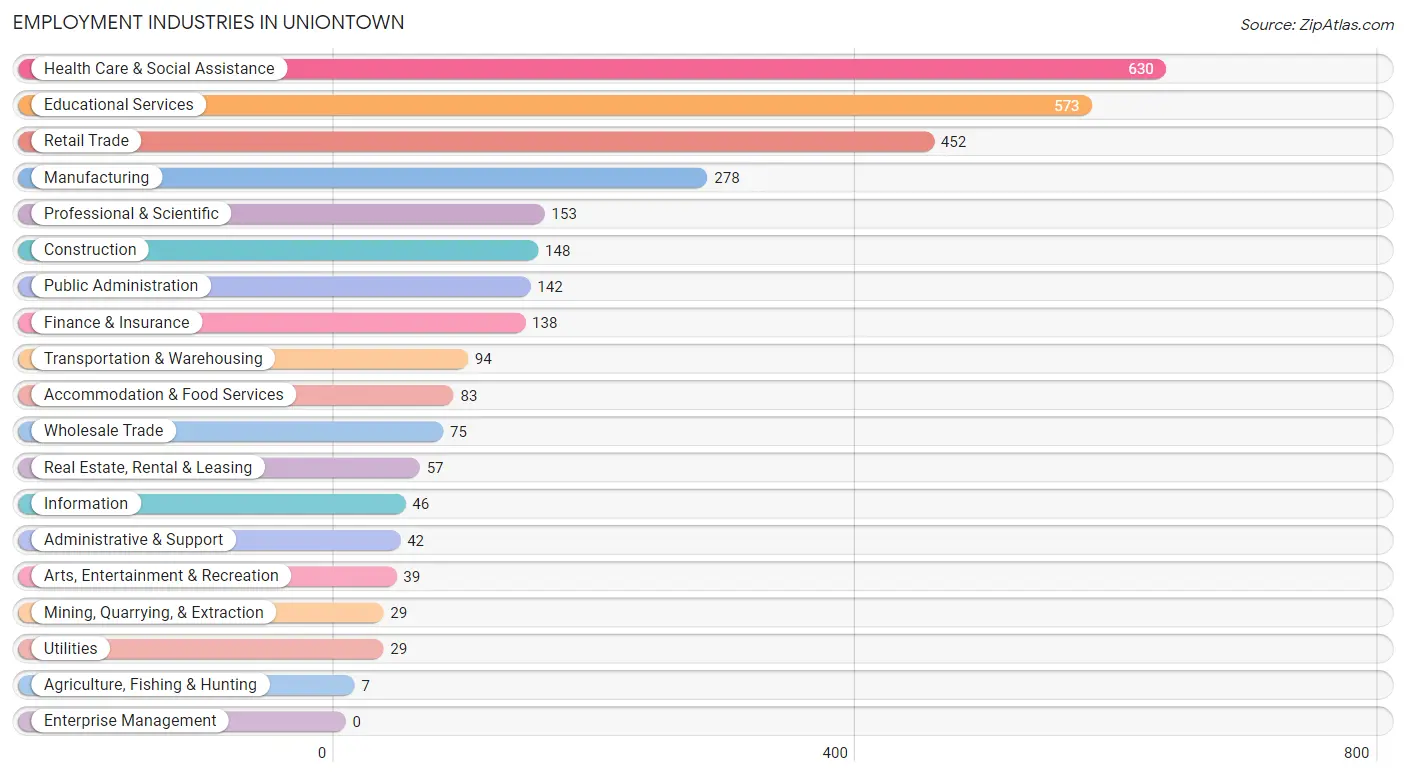
Employment Industries in Uniontown
The major employment industries in Uniontown include Health Care & Social Assistance (630 | 19.6%), Educational Services (573 | 17.8%), Retail Trade (452 | 14.1%), Manufacturing (278 | 8.6%), and Professional & Scientific (153 | 4.8%).
Employment Industries by Sex in Uniontown
The Uniontown industries that see more men than women are Agriculture, Fishing & Hunting (100.0%), Mining, Quarrying, & Extraction (100.0%), and Utilities (100.0%), whereas the industries that tend to have a higher number of women are Educational Services (76.4%), Health Care & Social Assistance (75.4%), and Accommodation & Food Services (72.3%).
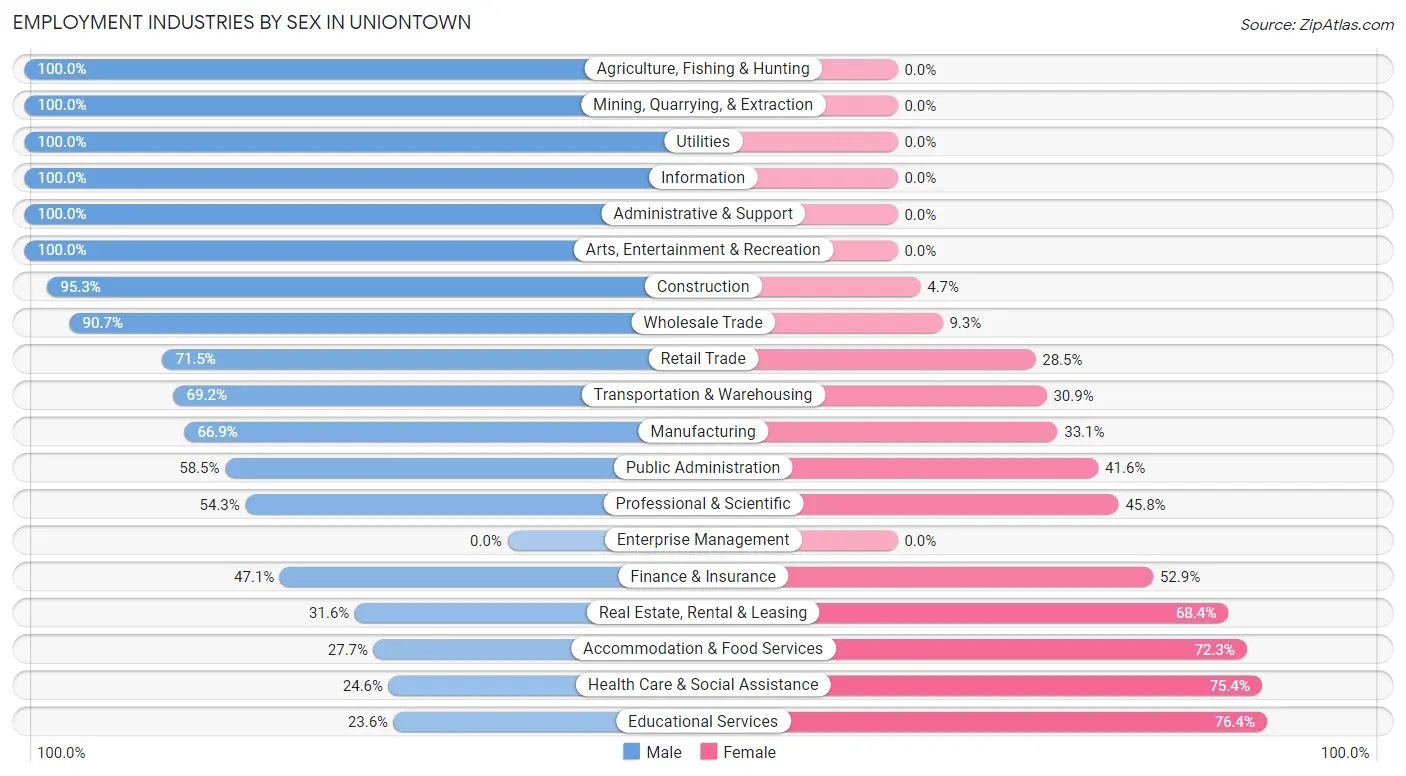
| Industry | Male | Female |
| Agriculture, Fishing & Hunting | 7 (100.0%) | 0 (0.0%) |
| Mining, Quarrying, & Extraction | 29 (100.0%) | 0 (0.0%) |
| Construction | 141 (95.3%) | 7 (4.7%) |
| Manufacturing | 186 (66.9%) | 92 (33.1%) |
| Wholesale Trade | 68 (90.7%) | 7 (9.3%) |
| Retail Trade | 323 (71.5%) | 129 (28.5%) |
| Transportation & Warehousing | 65 (69.2%) | 29 (30.8%) |
| Utilities | 29 (100.0%) | 0 (0.0%) |
| Information | 46 (100.0%) | 0 (0.0%) |
| Finance & Insurance | 65 (47.1%) | 73 (52.9%) |
| Real Estate, Rental & Leasing | 18 (31.6%) | 39 (68.4%) |
| Professional & Scientific | 83 (54.2%) | 70 (45.8%) |
| Enterprise Management | 0 (0.0%) | 0 (0.0%) |
| Administrative & Support | 42 (100.0%) | 0 (0.0%) |
| Educational Services | 135 (23.6%) | 438 (76.4%) |
| Health Care & Social Assistance | 155 (24.6%) | 475 (75.4%) |
| Arts, Entertainment & Recreation | 39 (100.0%) | 0 (0.0%) |
| Accommodation & Food Services | 23 (27.7%) | 60 (72.3%) |
| Public Administration | 83 (58.5%) | 59 (41.5%) |
| Total | 1,691 (52.5%) | 1,527 (47.4%) |
Education in Uniontown
School Enrollment in Uniontown
The most common levels of schooling among the 1,983 students in Uniontown are elementary school (508 | 25.6%), middle school (505 | 25.5%), and high school (353 | 17.8%).
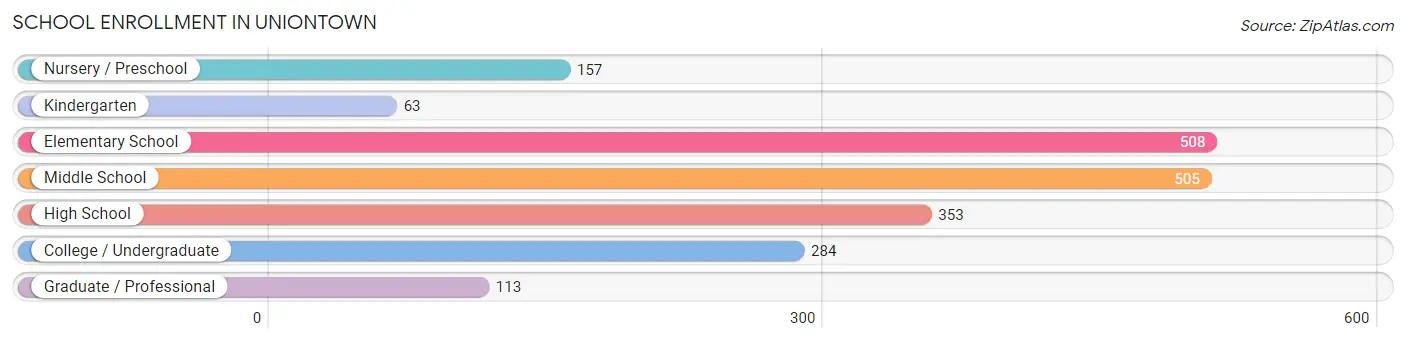
| School Level | # Students | % Students |
| Nursery / Preschool | 157 | 7.9% |
| Kindergarten | 63 | 3.2% |
| Elementary School | 508 | 25.6% |
| Middle School | 505 | 25.5% |
| High School | 353 | 17.8% |
| College / Undergraduate | 284 | 14.3% |
| Graduate / Professional | 113 | 5.7% |
| Total | 1,983 | 100.0% |
School Enrollment by Age by Funding Source in Uniontown
Out of a total of 1,983 students who are enrolled in schools in Uniontown, 230 (11.6%) attend a private institution, while the remaining 1,753 (88.4%) are enrolled in public schools. The age group of 35 years and over has the highest likelihood of being enrolled in private schools, with 49 (57.0% in the age bracket) enrolled. Conversely, the age group of 3 to 4 year olds has the lowest likelihood of being enrolled in a private school, with 119 (100.0% in the age bracket) attending a public institution.
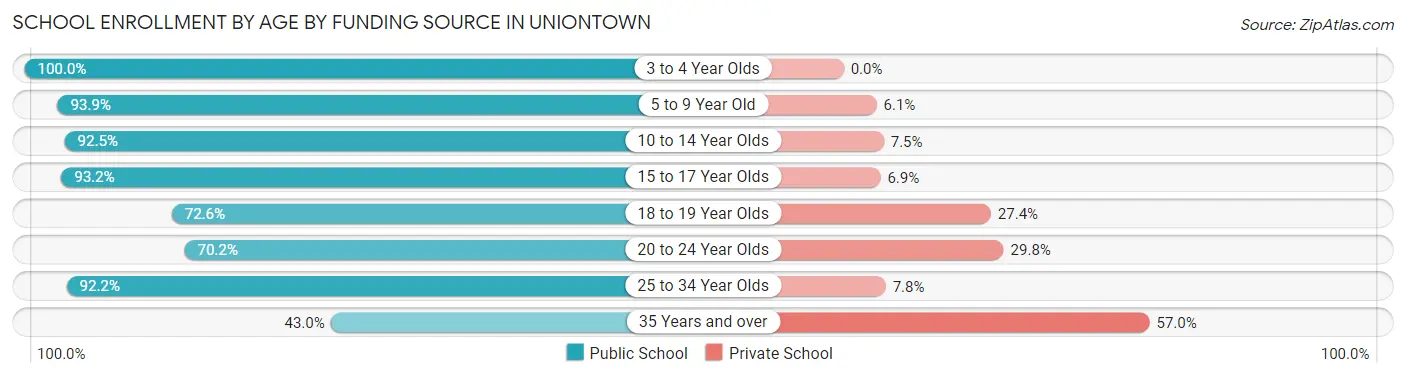
| Age Bracket | Public School | Private School |
| 3 to 4 Year Olds | 119 (100.0%) | 0 (0.0%) |
| 5 to 9 Year Old | 551 (93.9%) | 36 (6.1%) |
| 10 to 14 Year Olds | 471 (92.5%) | 38 (7.5%) |
| 15 to 17 Year Olds | 272 (93.1%) | 20 (6.9%) |
| 18 to 19 Year Olds | 90 (72.6%) | 34 (27.4%) |
| 20 to 24 Year Olds | 106 (70.2%) | 45 (29.8%) |
| 25 to 34 Year Olds | 106 (92.2%) | 9 (7.8%) |
| 35 Years and over | 37 (43.0%) | 49 (57.0%) |
| Total | 1,753 (88.4%) | 230 (11.6%) |
Educational Attainment by Field of Study in Uniontown
Education (510 | 24.7%), business (499 | 24.1%), arts & humanities (162 | 7.8%), science & technology (155 | 7.5%), and psychology (142 | 6.9%) are the most common fields of study among 2,067 individuals in Uniontown who have obtained a bachelor's degree or higher.
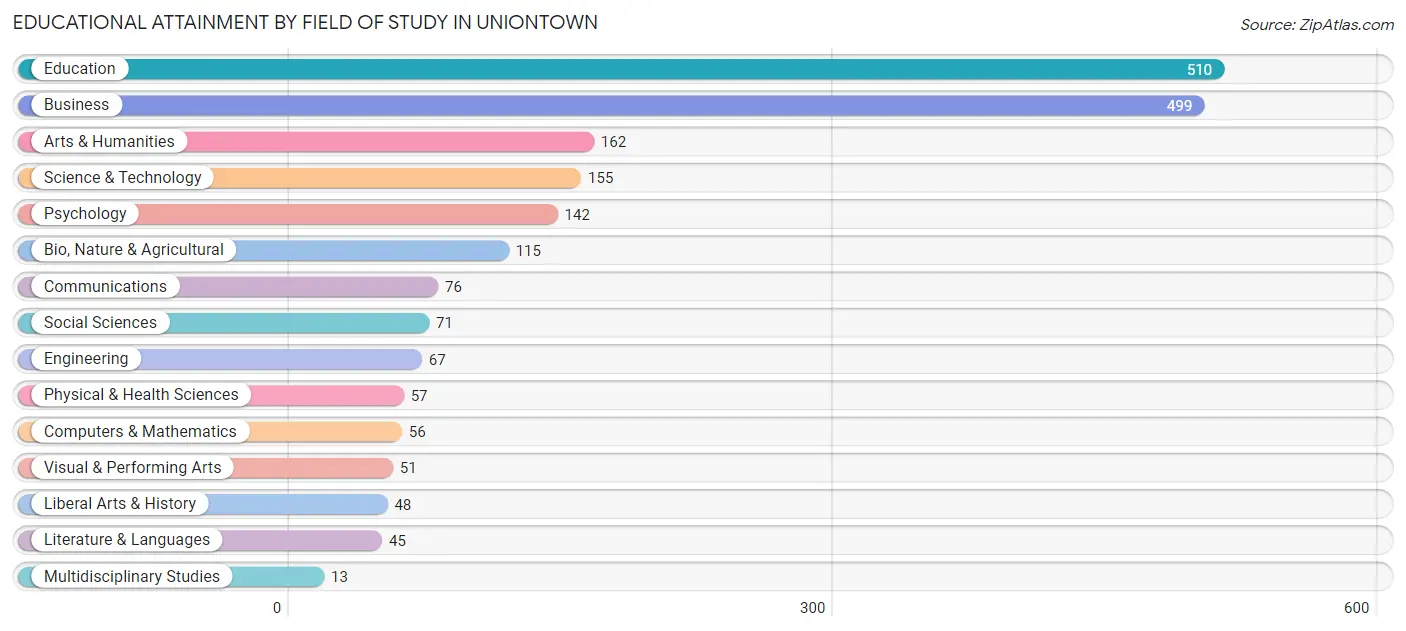
| Field of Study | # Graduates | % Graduates |
| Computers & Mathematics | 56 | 2.7% |
| Bio, Nature & Agricultural | 115 | 5.6% |
| Physical & Health Sciences | 57 | 2.8% |
| Psychology | 142 | 6.9% |
| Social Sciences | 71 | 3.4% |
| Engineering | 67 | 3.2% |
| Multidisciplinary Studies | 13 | 0.6% |
| Science & Technology | 155 | 7.5% |
| Business | 499 | 24.1% |
| Education | 510 | 24.7% |
| Literature & Languages | 45 | 2.2% |
| Liberal Arts & History | 48 | 2.3% |
| Visual & Performing Arts | 51 | 2.5% |
| Communications | 76 | 3.7% |
| Arts & Humanities | 162 | 7.8% |
| Total | 2,067 | 100.0% |
Transportation & Commute in Uniontown
Vehicle Availability by Sex in Uniontown
The most prevalent vehicle ownership categories in Uniontown are males with 2 vehicles (807, accounting for 47.7%) and females with 2 vehicles (713, making up 53.0%).
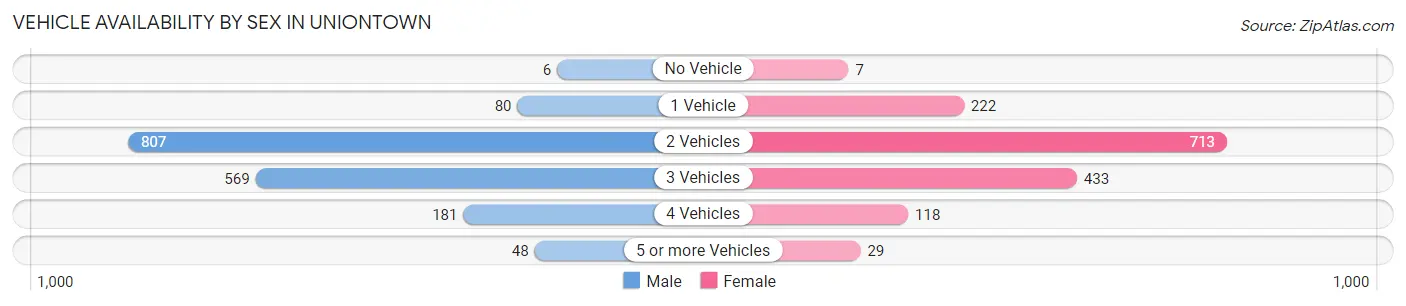
| Vehicles Available | Male | Female |
| No Vehicle | 6 (0.4%) | 7 (0.5%) |
| 1 Vehicle | 80 (4.7%) | 222 (14.6%) |
| 2 Vehicles | 807 (47.7%) | 713 (46.9%) |
| 3 Vehicles | 569 (33.7%) | 433 (28.4%) |
| 4 Vehicles | 181 (10.7%) | 118 (7.7%) |
| 5 or more Vehicles | 48 (2.8%) | 29 (1.9%) |
| Total | 1,691 (100.0%) | 1,522 (100.0%) |
Commute Time in Uniontown
The most frequently occuring commute durations in Uniontown are 15 to 19 minutes (521 commuters, 17.9%), 30 to 34 minutes (494 commuters, 17.0%), and 10 to 14 minutes (491 commuters, 16.9%).
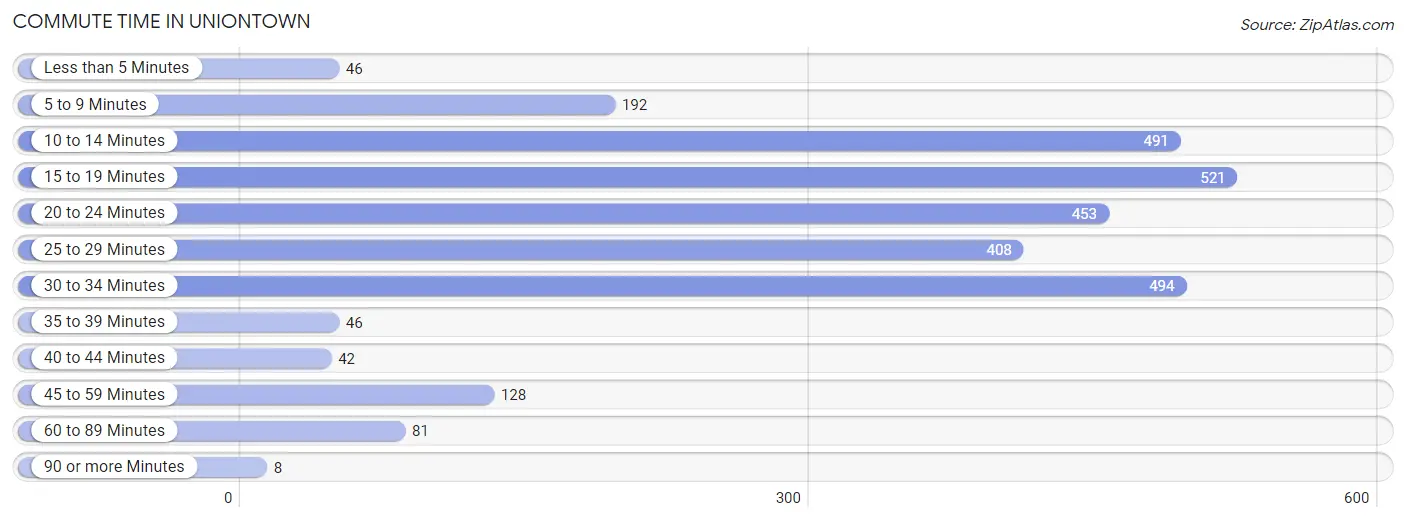
| Commute Time | # Commuters | % Commuters |
| Less than 5 Minutes | 46 | 1.6% |
| 5 to 9 Minutes | 192 | 6.6% |
| 10 to 14 Minutes | 491 | 16.9% |
| 15 to 19 Minutes | 521 | 17.9% |
| 20 to 24 Minutes | 453 | 15.6% |
| 25 to 29 Minutes | 408 | 14.0% |
| 30 to 34 Minutes | 494 | 17.0% |
| 35 to 39 Minutes | 46 | 1.6% |
| 40 to 44 Minutes | 42 | 1.4% |
| 45 to 59 Minutes | 128 | 4.4% |
| 60 to 89 Minutes | 81 | 2.8% |
| 90 or more Minutes | 8 | 0.3% |
Commute Time by Sex in Uniontown
The most common commute times in Uniontown are 30 to 34 minutes (282 commuters, 18.3%) for males and 10 to 14 minutes (260 commuters, 18.9%) for females.
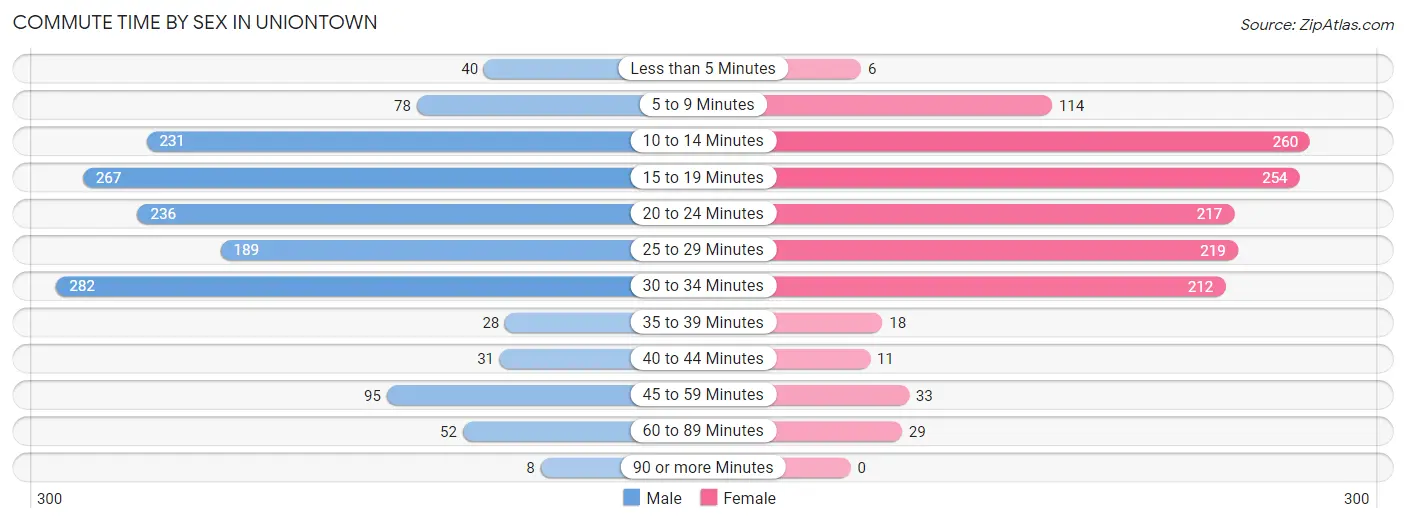
| Commute Time | Male | Female |
| Less than 5 Minutes | 40 (2.6%) | 6 (0.4%) |
| 5 to 9 Minutes | 78 (5.1%) | 114 (8.3%) |
| 10 to 14 Minutes | 231 (15.0%) | 260 (18.9%) |
| 15 to 19 Minutes | 267 (17.4%) | 254 (18.5%) |
| 20 to 24 Minutes | 236 (15.3%) | 217 (15.8%) |
| 25 to 29 Minutes | 189 (12.3%) | 219 (16.0%) |
| 30 to 34 Minutes | 282 (18.3%) | 212 (15.4%) |
| 35 to 39 Minutes | 28 (1.8%) | 18 (1.3%) |
| 40 to 44 Minutes | 31 (2.0%) | 11 (0.8%) |
| 45 to 59 Minutes | 95 (6.2%) | 33 (2.4%) |
| 60 to 89 Minutes | 52 (3.4%) | 29 (2.1%) |
| 90 or more Minutes | 8 (0.5%) | 0 (0.0%) |
Time of Departure to Work by Sex in Uniontown
The most frequent times of departure to work in Uniontown are 7:00 AM to 7:29 AM (399, 26.0%) for males and 7:00 AM to 7:29 AM (354, 25.8%) for females.
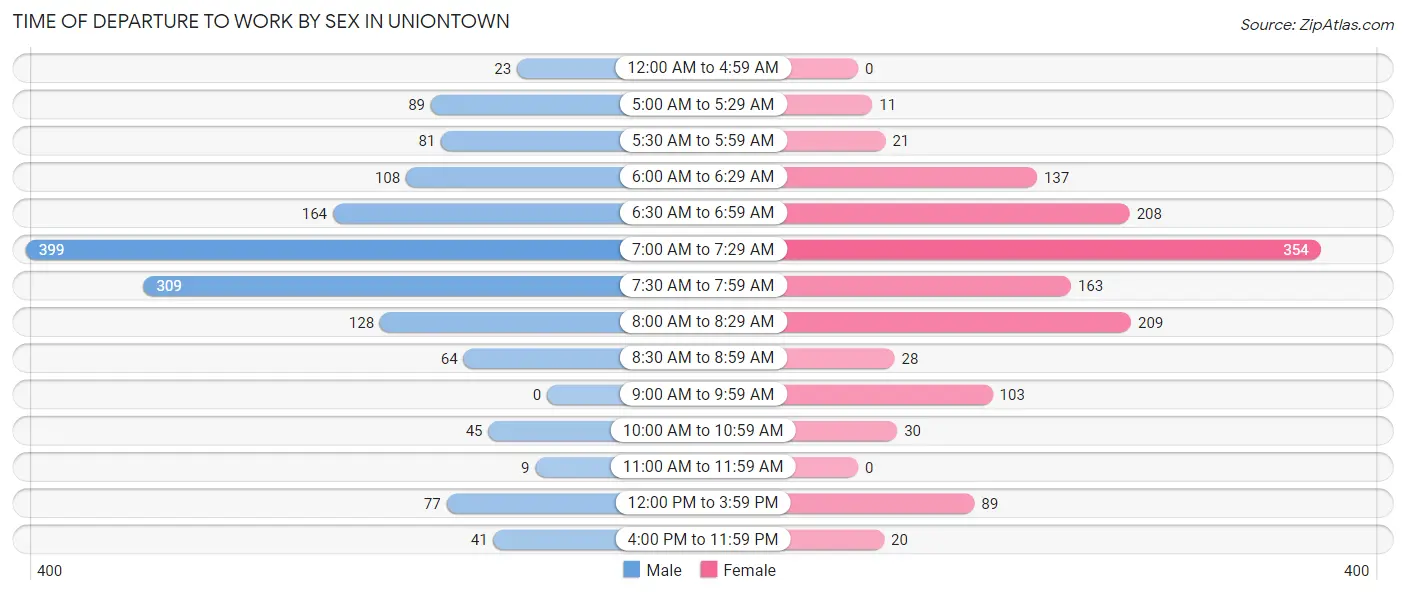
| Time of Departure | Male | Female |
| 12:00 AM to 4:59 AM | 23 (1.5%) | 0 (0.0%) |
| 5:00 AM to 5:29 AM | 89 (5.8%) | 11 (0.8%) |
| 5:30 AM to 5:59 AM | 81 (5.3%) | 21 (1.5%) |
| 6:00 AM to 6:29 AM | 108 (7.0%) | 137 (10.0%) |
| 6:30 AM to 6:59 AM | 164 (10.7%) | 208 (15.1%) |
| 7:00 AM to 7:29 AM | 399 (26.0%) | 354 (25.8%) |
| 7:30 AM to 7:59 AM | 309 (20.1%) | 163 (11.9%) |
| 8:00 AM to 8:29 AM | 128 (8.3%) | 209 (15.2%) |
| 8:30 AM to 8:59 AM | 64 (4.2%) | 28 (2.0%) |
| 9:00 AM to 9:59 AM | 0 (0.0%) | 103 (7.5%) |
| 10:00 AM to 10:59 AM | 45 (2.9%) | 30 (2.2%) |
| 11:00 AM to 11:59 AM | 9 (0.6%) | 0 (0.0%) |
| 12:00 PM to 3:59 PM | 77 (5.0%) | 89 (6.5%) |
| 4:00 PM to 11:59 PM | 41 (2.7%) | 20 (1.5%) |
| Total | 1,537 (100.0%) | 1,373 (100.0%) |
Housing Occupancy in Uniontown
Occupancy by Ownership in Uniontown
Of the total 2,605 dwellings in Uniontown, owner-occupied units account for 2,311 (88.7%), while renter-occupied units make up 294 (11.3%).
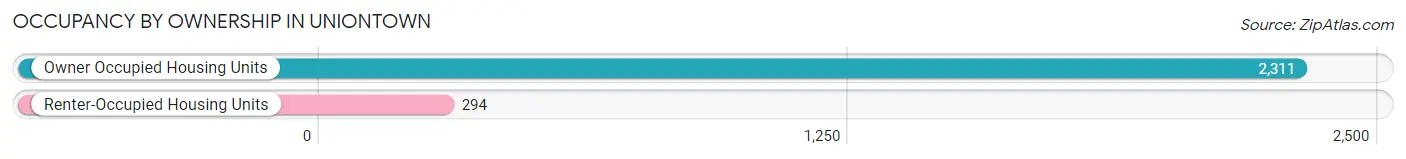
| Occupancy | # Housing Units | % Housing Units |
| Owner Occupied Housing Units | 2,311 | 88.7% |
| Renter-Occupied Housing Units | 294 | 11.3% |
| Total Occupied Housing Units | 2,605 | 100.0% |
Occupancy by Household Size in Uniontown
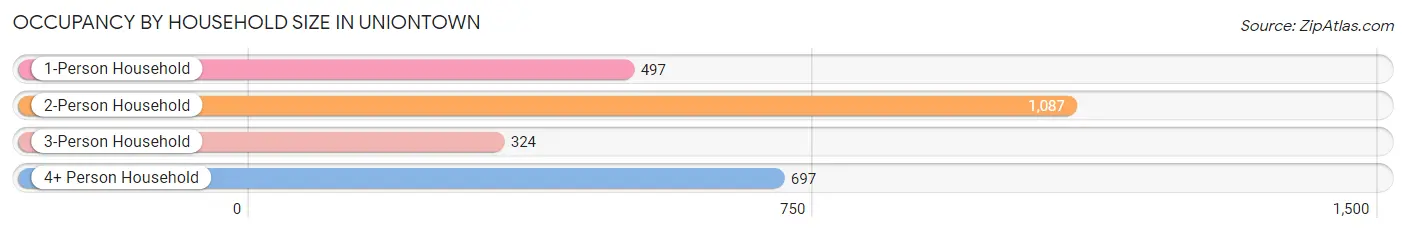
| Household Size | # Housing Units | % Housing Units |
| 1-Person Household | 497 | 19.1% |
| 2-Person Household | 1,087 | 41.7% |
| 3-Person Household | 324 | 12.4% |
| 4+ Person Household | 697 | 26.8% |
| Total Housing Units | 2,605 | 100.0% |
Occupancy by Ownership by Household Size in Uniontown
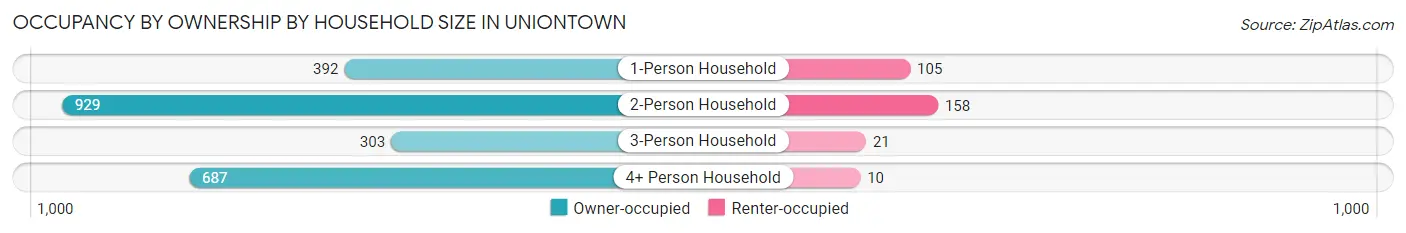
| Household Size | Owner-occupied | Renter-occupied |
| 1-Person Household | 392 (78.9%) | 105 (21.1%) |
| 2-Person Household | 929 (85.5%) | 158 (14.5%) |
| 3-Person Household | 303 (93.5%) | 21 (6.5%) |
| 4+ Person Household | 687 (98.6%) | 10 (1.4%) |
| Total Housing Units | 2,311 (88.7%) | 294 (11.3%) |
Occupancy by Educational Attainment in Uniontown
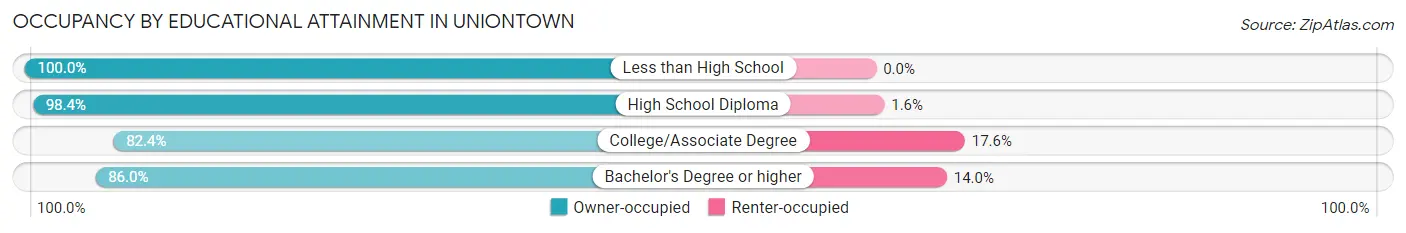
| Household Size | Owner-occupied | Renter-occupied |
| Less than High School | 108 (100.0%) | 0 (0.0%) |
| High School Diploma | 673 (98.4%) | 11 (1.6%) |
| College/Associate Degree | 671 (82.4%) | 143 (17.6%) |
| Bachelor's Degree or higher | 859 (86.0%) | 140 (14.0%) |
Occupancy by Age of Householder in Uniontown
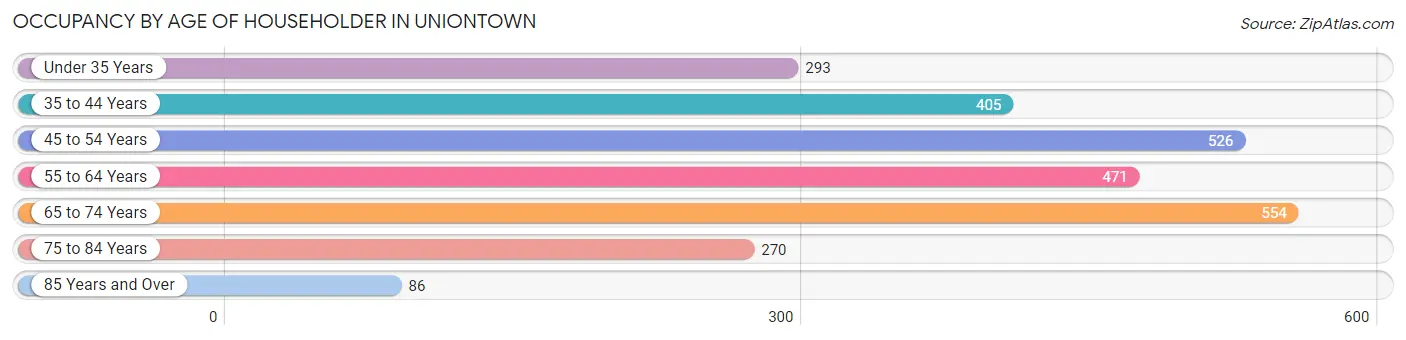
| Age Bracket | # Households | % Households |
| Under 35 Years | 293 | 11.3% |
| 35 to 44 Years | 405 | 15.5% |
| 45 to 54 Years | 526 | 20.2% |
| 55 to 64 Years | 471 | 18.1% |
| 65 to 74 Years | 554 | 21.3% |
| 75 to 84 Years | 270 | 10.4% |
| 85 Years and Over | 86 | 3.3% |
| Total | 2,605 | 100.0% |
Housing Finances in Uniontown
Median Income by Occupancy in Uniontown
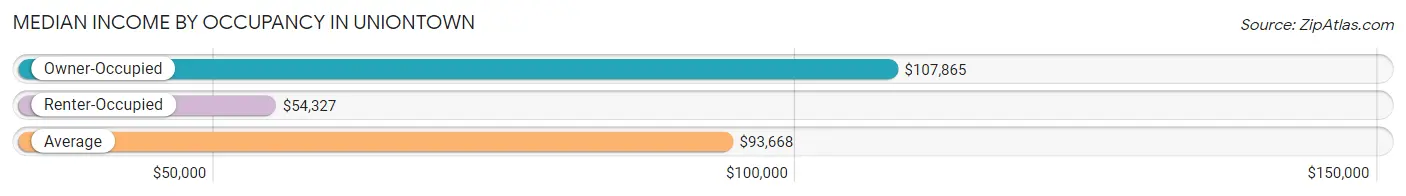
| Occupancy Type | # Households | Median Income |
| Owner-Occupied | 2,311 (88.7%) | $107,865 |
| Renter-Occupied | 294 (11.3%) | $54,327 |
| Average | 2,605 (100.0%) | $93,668 |
Occupancy by Householder Income Bracket in Uniontown
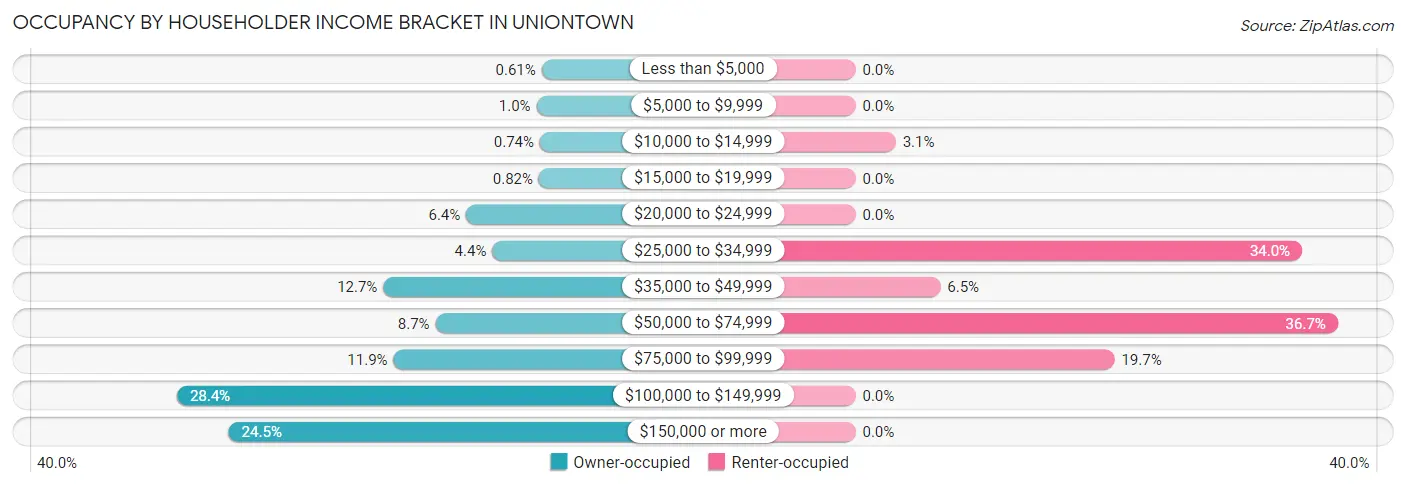
| Income Bracket | Owner-occupied | Renter-occupied |
| Less than $5,000 | 14 (0.6%) | 0 (0.0%) |
| $5,000 to $9,999 | 23 (1.0%) | 0 (0.0%) |
| $10,000 to $14,999 | 17 (0.7%) | 9 (3.1%) |
| $15,000 to $19,999 | 19 (0.8%) | 0 (0.0%) |
| $20,000 to $24,999 | 147 (6.4%) | 0 (0.0%) |
| $25,000 to $34,999 | 101 (4.4%) | 100 (34.0%) |
| $35,000 to $49,999 | 293 (12.7%) | 19 (6.5%) |
| $50,000 to $74,999 | 201 (8.7%) | 108 (36.7%) |
| $75,000 to $99,999 | 275 (11.9%) | 58 (19.7%) |
| $100,000 to $149,999 | 656 (28.4%) | 0 (0.0%) |
| $150,000 or more | 565 (24.4%) | 0 (0.0%) |
| Total | 2,311 (100.0%) | 294 (100.0%) |
Monthly Housing Cost Tiers in Uniontown
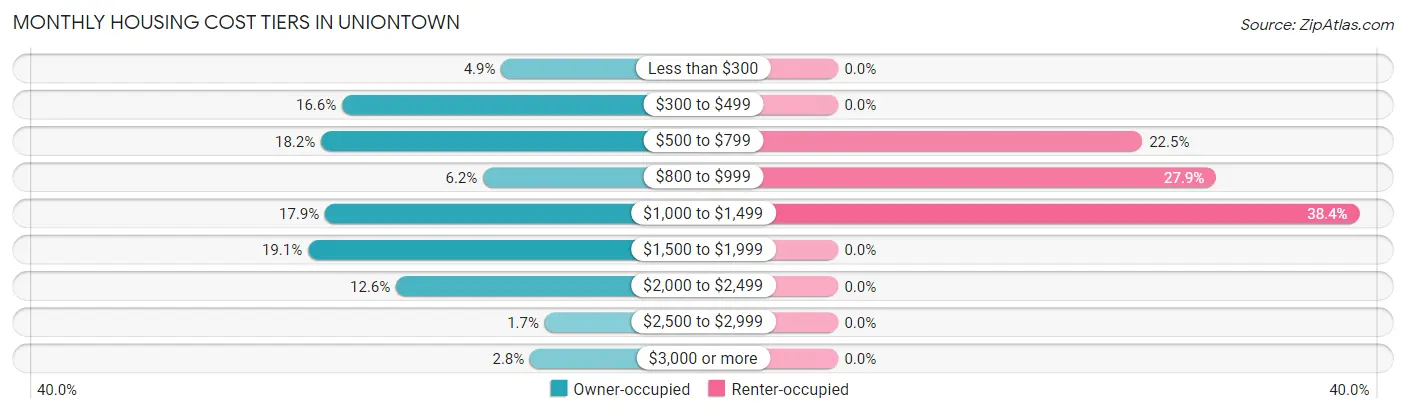
| Monthly Cost | Owner-occupied | Renter-occupied |
| Less than $300 | 113 (4.9%) | 0 (0.0%) |
| $300 to $499 | 384 (16.6%) | 0 (0.0%) |
| $500 to $799 | 420 (18.2%) | 66 (22.5%) |
| $800 to $999 | 144 (6.2%) | 82 (27.9%) |
| $1,000 to $1,499 | 413 (17.9%) | 113 (38.4%) |
| $1,500 to $1,999 | 442 (19.1%) | 0 (0.0%) |
| $2,000 to $2,499 | 292 (12.6%) | 0 (0.0%) |
| $2,500 to $2,999 | 39 (1.7%) | 0 (0.0%) |
| $3,000 or more | 64 (2.8%) | 0 (0.0%) |
| Total | 2,311 (100.0%) | 294 (100.0%) |
Physical Housing Characteristics in Uniontown
Housing Structures in Uniontown
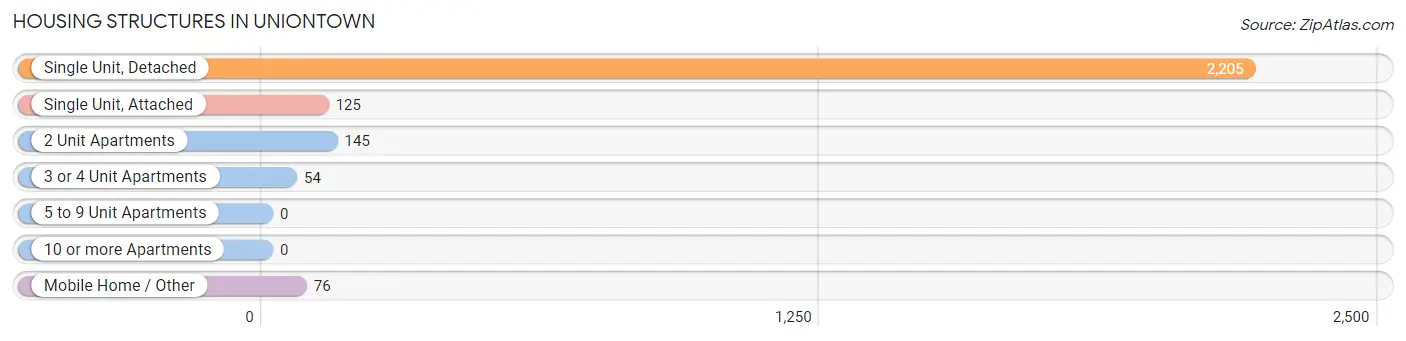
| Structure Type | # Housing Units | % Housing Units |
| Single Unit, Detached | 2,205 | 84.6% |
| Single Unit, Attached | 125 | 4.8% |
| 2 Unit Apartments | 145 | 5.6% |
| 3 or 4 Unit Apartments | 54 | 2.1% |
| 5 to 9 Unit Apartments | 0 | 0.0% |
| 10 or more Apartments | 0 | 0.0% |
| Mobile Home / Other | 76 | 2.9% |
| Total | 2,605 | 100.0% |
Housing Structures by Occupancy in Uniontown
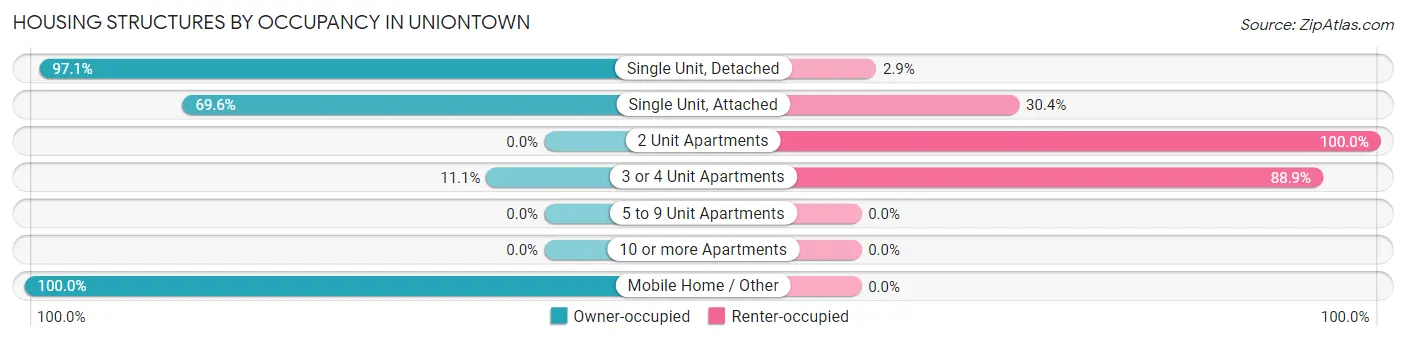
| Structure Type | Owner-occupied | Renter-occupied |
| Single Unit, Detached | 2,142 (97.1%) | 63 (2.9%) |
| Single Unit, Attached | 87 (69.6%) | 38 (30.4%) |
| 2 Unit Apartments | 0 (0.0%) | 145 (100.0%) |
| 3 or 4 Unit Apartments | 6 (11.1%) | 48 (88.9%) |
| 5 to 9 Unit Apartments | 0 (0.0%) | 0 (0.0%) |
| 10 or more Apartments | 0 (0.0%) | 0 (0.0%) |
| Mobile Home / Other | 76 (100.0%) | 0 (0.0%) |
| Total | 2,311 (88.7%) | 294 (11.3%) |
Housing Structures by Number of Rooms in Uniontown
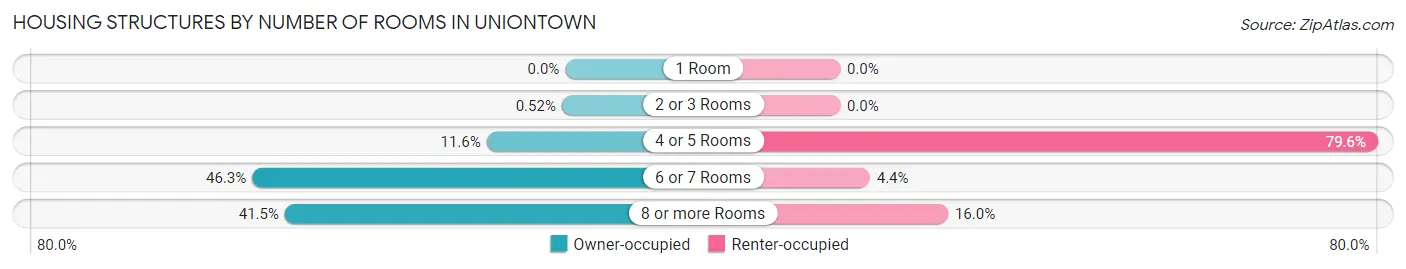
| Number of Rooms | Owner-occupied | Renter-occupied |
| 1 Room | 0 (0.0%) | 0 (0.0%) |
| 2 or 3 Rooms | 12 (0.5%) | 0 (0.0%) |
| 4 or 5 Rooms | 269 (11.6%) | 234 (79.6%) |
| 6 or 7 Rooms | 1,071 (46.3%) | 13 (4.4%) |
| 8 or more Rooms | 959 (41.5%) | 47 (16.0%) |
| Total | 2,311 (100.0%) | 294 (100.0%) |
Housing Structure by Heating Type in Uniontown
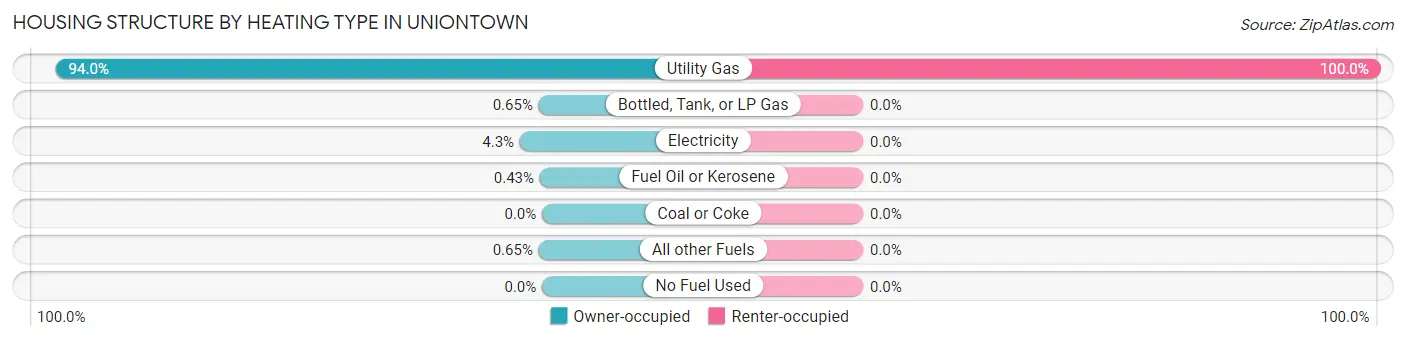
| Heating Type | Owner-occupied | Renter-occupied |
| Utility Gas | 2,172 (94.0%) | 294 (100.0%) |
| Bottled, Tank, or LP Gas | 15 (0.6%) | 0 (0.0%) |
| Electricity | 99 (4.3%) | 0 (0.0%) |
| Fuel Oil or Kerosene | 10 (0.4%) | 0 (0.0%) |
| Coal or Coke | 0 (0.0%) | 0 (0.0%) |
| All other Fuels | 15 (0.6%) | 0 (0.0%) |
| No Fuel Used | 0 (0.0%) | 0 (0.0%) |
| Total | 2,311 (100.0%) | 294 (100.0%) |
Household Vehicle Usage in Uniontown
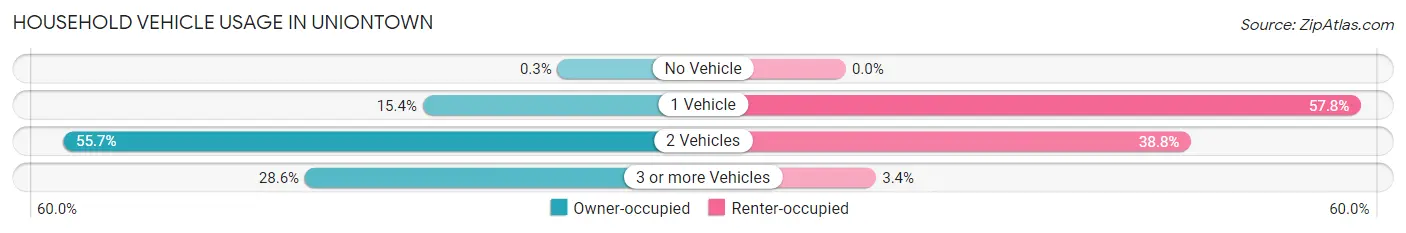
| Vehicles per Household | Owner-occupied | Renter-occupied |
| No Vehicle | 7 (0.3%) | 0 (0.0%) |
| 1 Vehicle | 356 (15.4%) | 170 (57.8%) |
| 2 Vehicles | 1,287 (55.7%) | 114 (38.8%) |
| 3 or more Vehicles | 661 (28.6%) | 10 (3.4%) |
| Total | 2,311 (100.0%) | 294 (100.0%) |
Real Estate & Mortgages in Uniontown
Real Estate and Mortgage Overview in Uniontown
| Characteristic | Without Mortgage | With Mortgage |
| Housing Units | 967 | 1,344 |
| Median Property Value | $190,800 | $238,200 |
| Median Household Income | $52,426 | $486 |
| Monthly Housing Costs | $494 | $64 |
| Real Estate Taxes | $2,813 | $6 |
Property Value by Mortgage Status in Uniontown
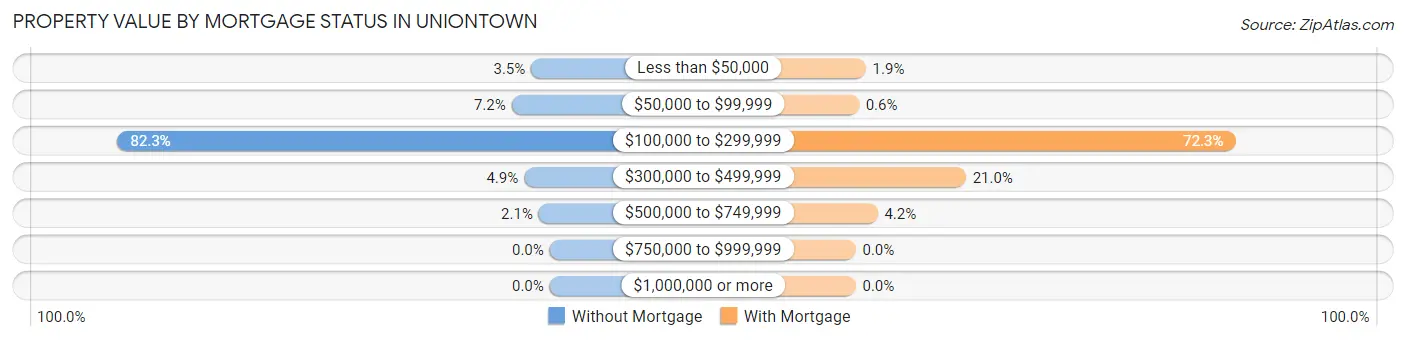
| Property Value | Without Mortgage | With Mortgage |
| Less than $50,000 | 34 (3.5%) | 26 (1.9%) |
| $50,000 to $99,999 | 70 (7.2%) | 8 (0.6%) |
| $100,000 to $299,999 | 796 (82.3%) | 972 (72.3%) |
| $300,000 to $499,999 | 47 (4.9%) | 282 (21.0%) |
| $500,000 to $749,999 | 20 (2.1%) | 56 (4.2%) |
| $750,000 to $999,999 | 0 (0.0%) | 0 (0.0%) |
| $1,000,000 or more | 0 (0.0%) | 0 (0.0%) |
| Total | 967 (100.0%) | 1,344 (100.0%) |
Household Income by Mortgage Status in Uniontown
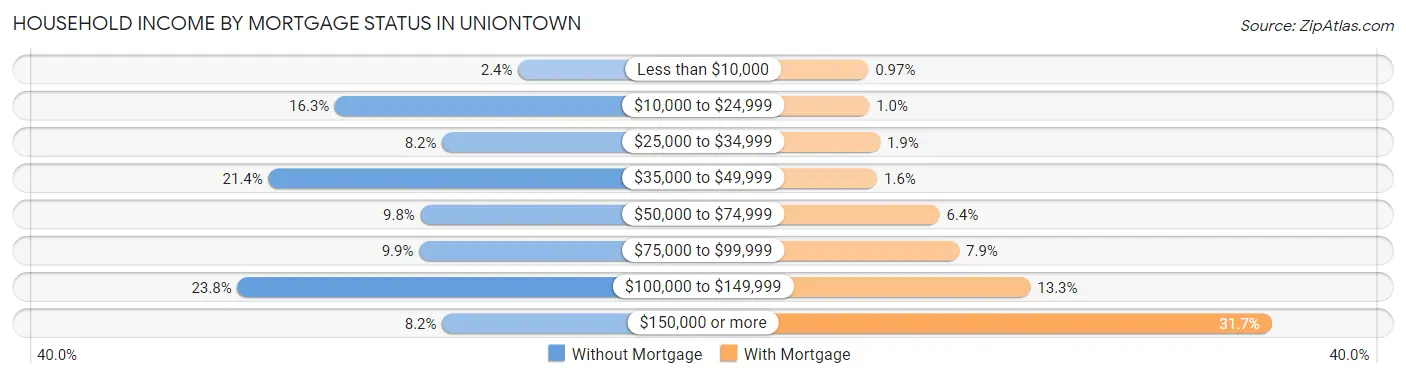
| Household Income | Without Mortgage | With Mortgage |
| Less than $10,000 | 23 (2.4%) | 13 (1.0%) |
| $10,000 to $24,999 | 158 (16.3%) | 14 (1.0%) |
| $25,000 to $34,999 | 79 (8.2%) | 25 (1.9%) |
| $35,000 to $49,999 | 207 (21.4%) | 22 (1.6%) |
| $50,000 to $74,999 | 95 (9.8%) | 86 (6.4%) |
| $75,000 to $99,999 | 96 (9.9%) | 106 (7.9%) |
| $100,000 to $149,999 | 230 (23.8%) | 179 (13.3%) |
| $150,000 or more | 79 (8.2%) | 426 (31.7%) |
| Total | 967 (100.0%) | 1,344 (100.0%) |
Property Value to Household Income Ratio in Uniontown
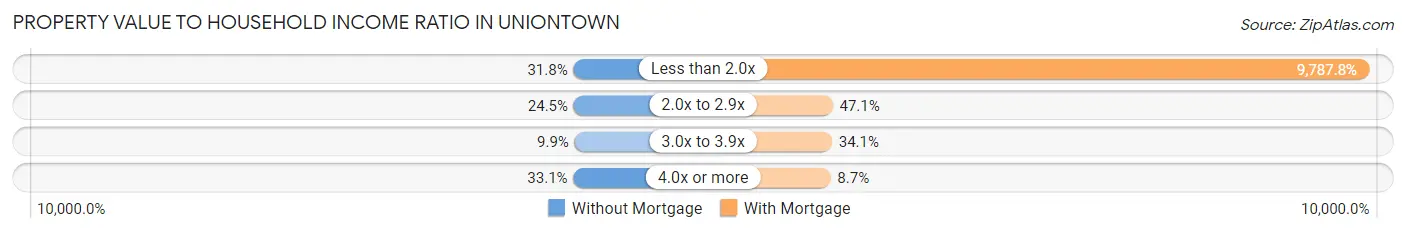
| Value-to-Income Ratio | Without Mortgage | With Mortgage |
| Less than 2.0x | 307 (31.8%) | 131,548 (9,787.8%) |
| 2.0x to 2.9x | 237 (24.5%) | 633 (47.1%) |
| 3.0x to 3.9x | 96 (9.9%) | 458 (34.1%) |
| 4.0x or more | 320 (33.1%) | 117 (8.7%) |
| Total | 967 (100.0%) | 1,344 (100.0%) |
Real Estate Taxes by Mortgage Status in Uniontown
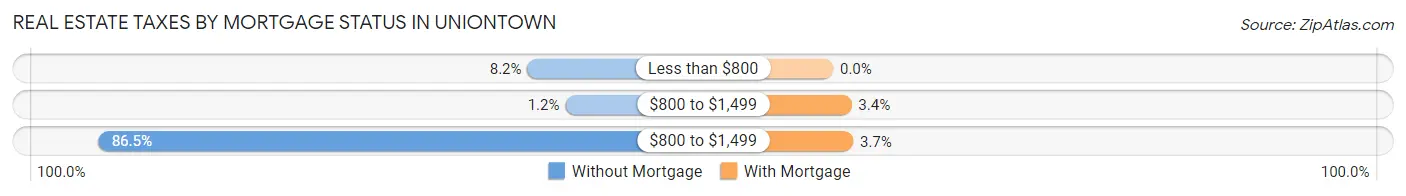
| Property Taxes | Without Mortgage | With Mortgage |
| Less than $800 | 79 (8.2%) | 0 (0.0%) |
| $800 to $1,499 | 12 (1.2%) | 45 (3.4%) |
| $800 to $1,499 | 836 (86.5%) | 49 (3.6%) |
| Total | 967 (100.0%) | 1,344 (100.0%) |
Health & Disability in Uniontown
Health Insurance Coverage by Age in Uniontown
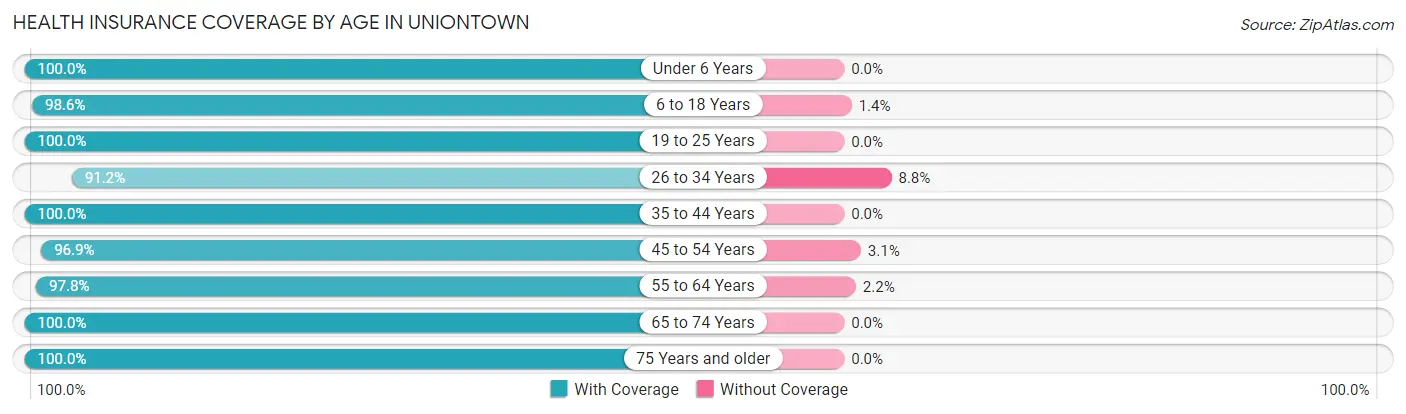
| Age Bracket | With Coverage | Without Coverage |
| Under 6 Years | 466 (100.0%) | 0 (0.0%) |
| 6 to 18 Years | 1,414 (98.6%) | 20 (1.4%) |
| 19 to 25 Years | 324 (100.0%) | 0 (0.0%) |
| 26 to 34 Years | 507 (91.2%) | 49 (8.8%) |
| 35 to 44 Years | 818 (100.0%) | 0 (0.0%) |
| 45 to 54 Years | 1,000 (96.9%) | 32 (3.1%) |
| 55 to 64 Years | 770 (97.8%) | 17 (2.2%) |
| 65 to 74 Years | 994 (100.0%) | 0 (0.0%) |
| 75 Years and older | 537 (100.0%) | 0 (0.0%) |
| Total | 6,830 (98.3%) | 118 (1.7%) |
Health Insurance Coverage by Citizenship Status in Uniontown
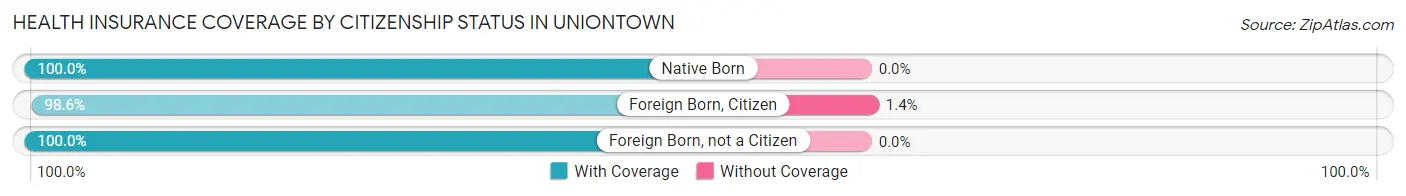
| Citizenship Status | With Coverage | Without Coverage |
| Native Born | 466 (100.0%) | 0 (0.0%) |
| Foreign Born, Citizen | 1,414 (98.6%) | 20 (1.4%) |
| Foreign Born, not a Citizen | 324 (100.0%) | 0 (0.0%) |
Health Insurance Coverage by Household Income in Uniontown
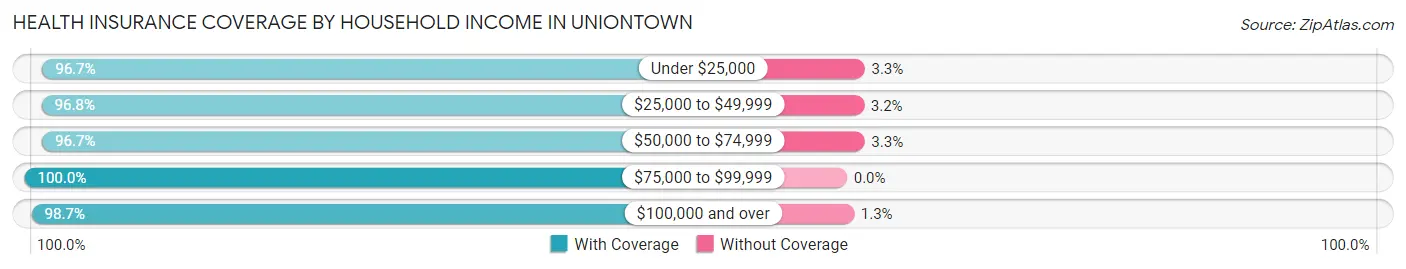
| Household Income | With Coverage | Without Coverage |
| Under $25,000 | 408 (96.7%) | 14 (3.3%) |
| $25,000 to $49,999 | 881 (96.8%) | 29 (3.2%) |
| $50,000 to $74,999 | 615 (96.7%) | 21 (3.3%) |
| $75,000 to $99,999 | 878 (100.0%) | 0 (0.0%) |
| $100,000 and over | 4,048 (98.7%) | 54 (1.3%) |
Public vs Private Health Insurance Coverage by Age in Uniontown
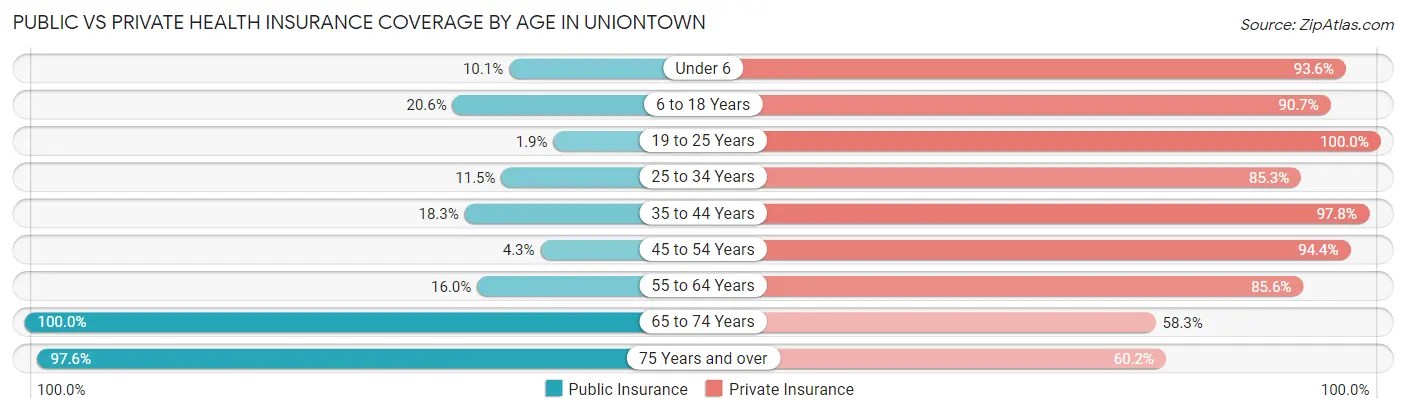
| Age Bracket | Public Insurance | Private Insurance |
| Under 6 | 47 (10.1%) | 436 (93.6%) |
| 6 to 18 Years | 295 (20.6%) | 1,301 (90.7%) |
| 19 to 25 Years | 6 (1.8%) | 324 (100.0%) |
| 25 to 34 Years | 64 (11.5%) | 474 (85.3%) |
| 35 to 44 Years | 150 (18.3%) | 800 (97.8%) |
| 45 to 54 Years | 44 (4.3%) | 974 (94.4%) |
| 55 to 64 Years | 126 (16.0%) | 674 (85.6%) |
| 65 to 74 Years | 994 (100.0%) | 579 (58.3%) |
| 75 Years and over | 524 (97.6%) | 323 (60.2%) |
| Total | 2,250 (32.4%) | 5,885 (84.7%) |
Disability Status by Sex by Age in Uniontown
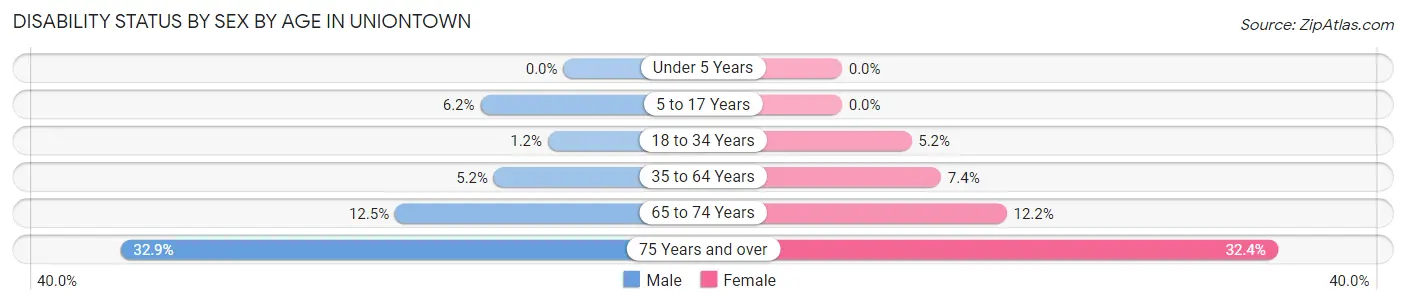
| Age Bracket | Male | Female |
| Under 5 Years | 0 (0.0%) | 0 (0.0%) |
| 5 to 17 Years | 52 (6.2%) | 0 (0.0%) |
| 18 to 34 Years | 6 (1.1%) | 23 (5.2%) |
| 35 to 64 Years | 66 (5.2%) | 100 (7.4%) |
| 65 to 74 Years | 67 (12.5%) | 56 (12.2%) |
| 75 Years and over | 75 (32.9%) | 100 (32.4%) |
Disability Class by Sex by Age in Uniontown
Disability Class: Hearing Difficulty
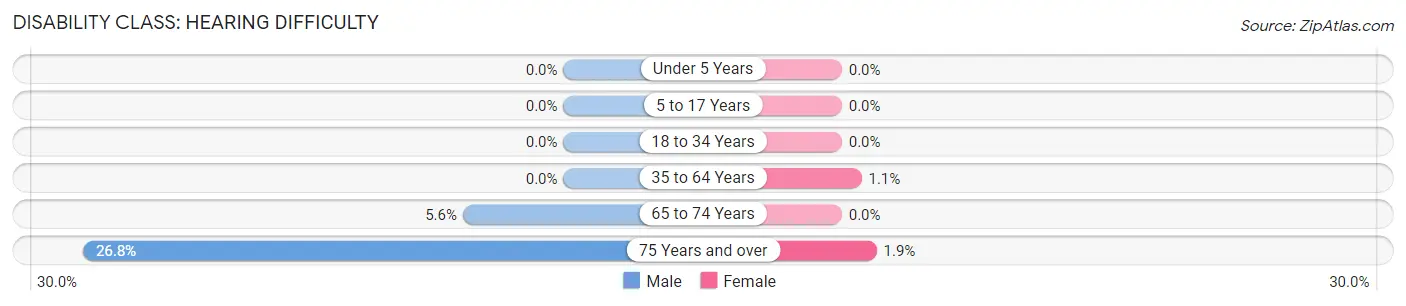
| Age Bracket | Male | Female |
| Under 5 Years | 0 (0.0%) | 0 (0.0%) |
| 5 to 17 Years | 0 (0.0%) | 0 (0.0%) |
| 18 to 34 Years | 0 (0.0%) | 0 (0.0%) |
| 35 to 64 Years | 0 (0.0%) | 15 (1.1%) |
| 65 to 74 Years | 30 (5.6%) | 0 (0.0%) |
| 75 Years and over | 61 (26.8%) | 6 (1.9%) |
Disability Class: Vision Difficulty
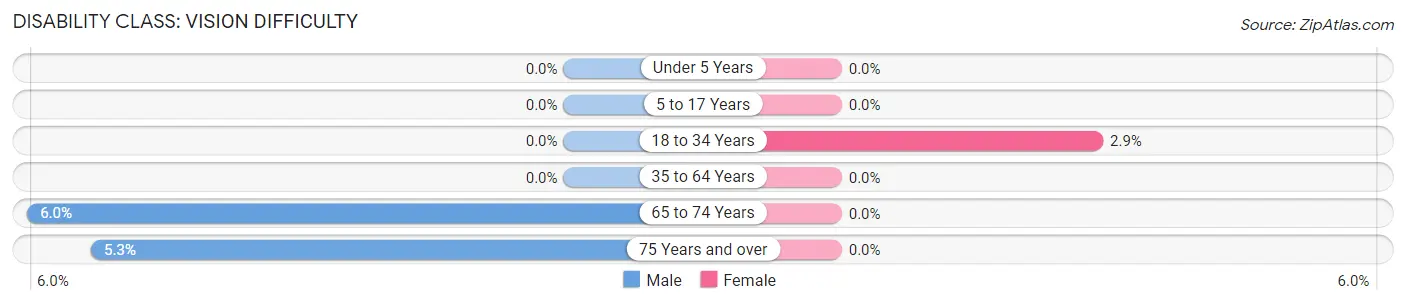
| Age Bracket | Male | Female |
| Under 5 Years | 0 (0.0%) | 0 (0.0%) |
| 5 to 17 Years | 0 (0.0%) | 0 (0.0%) |
| 18 to 34 Years | 0 (0.0%) | 13 (2.9%) |
| 35 to 64 Years | 0 (0.0%) | 0 (0.0%) |
| 65 to 74 Years | 32 (6.0%) | 0 (0.0%) |
| 75 Years and over | 12 (5.3%) | 0 (0.0%) |
Disability Class: Cognitive Difficulty
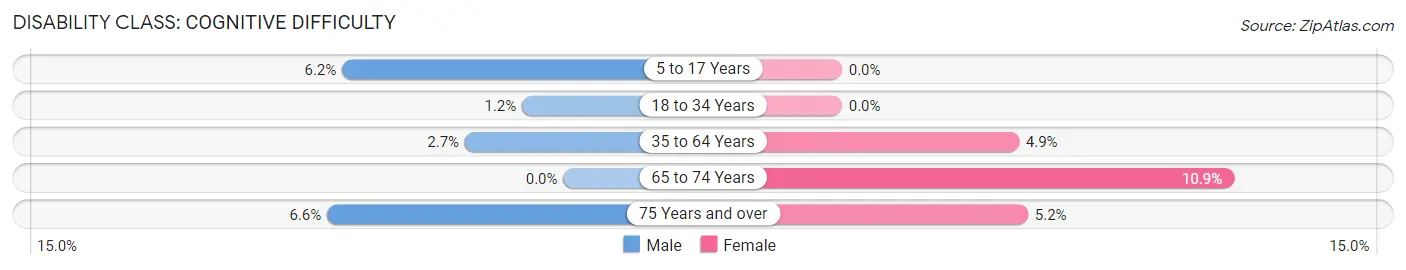
| Age Bracket | Male | Female |
| 5 to 17 Years | 52 (6.2%) | 0 (0.0%) |
| 18 to 34 Years | 6 (1.1%) | 0 (0.0%) |
| 35 to 64 Years | 35 (2.7%) | 67 (4.9%) |
| 65 to 74 Years | 0 (0.0%) | 50 (10.9%) |
| 75 Years and over | 15 (6.6%) | 16 (5.2%) |
Disability Class: Ambulatory Difficulty
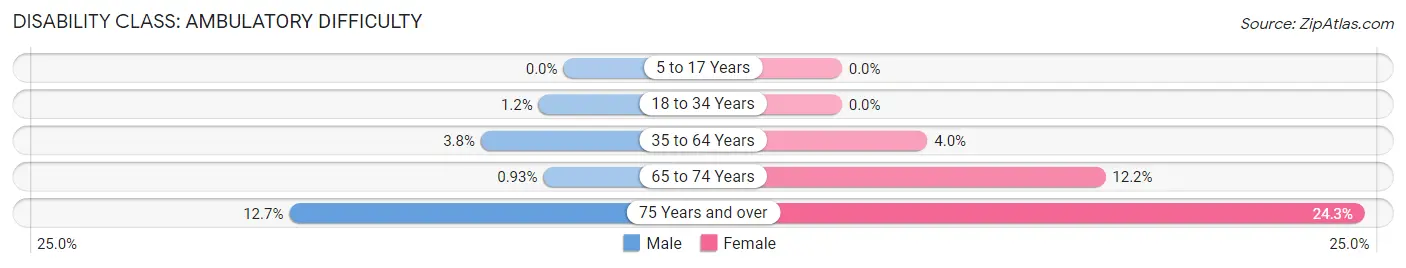
| Age Bracket | Male | Female |
| 5 to 17 Years | 0 (0.0%) | 0 (0.0%) |
| 18 to 34 Years | 6 (1.1%) | 0 (0.0%) |
| 35 to 64 Years | 49 (3.8%) | 54 (4.0%) |
| 65 to 74 Years | 5 (0.9%) | 56 (12.2%) |
| 75 Years and over | 29 (12.7%) | 75 (24.3%) |
Disability Class: Self-Care Difficulty

| Age Bracket | Male | Female |
| 5 to 17 Years | 0 (0.0%) | 0 (0.0%) |
| 18 to 34 Years | 6 (1.1%) | 10 (2.2%) |
| 35 to 64 Years | 12 (0.9%) | 5 (0.4%) |
| 65 to 74 Years | 0 (0.0%) | 0 (0.0%) |
| 75 Years and over | 12 (5.3%) | 19 (6.1%) |
Technology Access in Uniontown
Computing Device Access in Uniontown
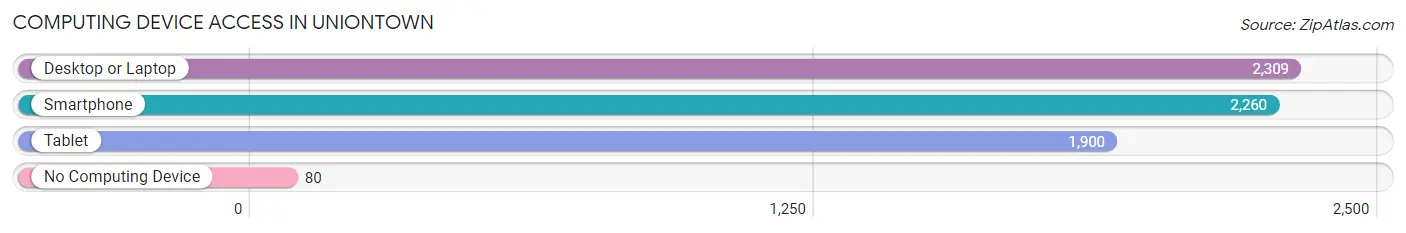
| Device Type | # Households | % Households |
| Desktop or Laptop | 2,309 | 88.6% |
| Smartphone | 2,260 | 86.8% |
| Tablet | 1,900 | 72.9% |
| No Computing Device | 80 | 3.1% |
| Total | 2,605 | 100.0% |
Internet Access in Uniontown
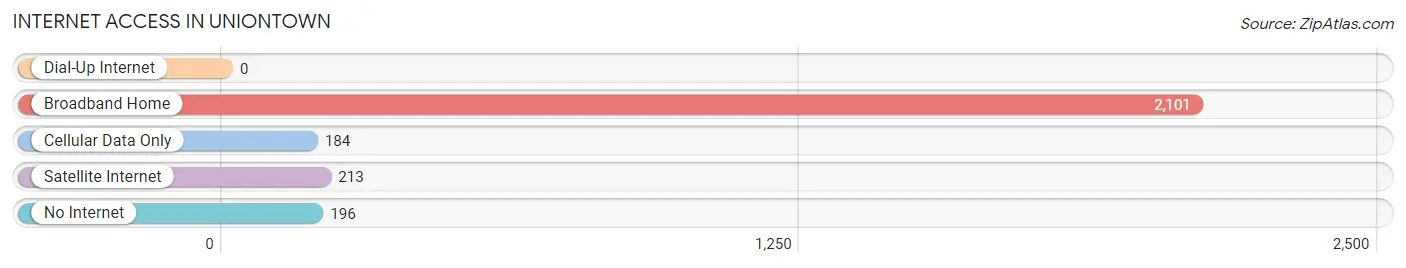
| Internet Type | # Households | % Households |
| Dial-Up Internet | 0 | 0.0% |
| Broadband Home | 2,101 | 80.6% |
| Cellular Data Only | 184 | 7.1% |
| Satellite Internet | 213 | 8.2% |
| No Internet | 196 | 7.5% |
| Total | 2,605 | 100.0% |
Uniontown Summary
Introduction
Uniontown is a small village located in Stark County, Ohio. It is situated in the northeastern part of the state, approximately 25 miles south of Akron and 40 miles south of Cleveland. The village is home to approximately 1,500 people and is part of the Canton-Massillon Metropolitan Statistical Area. Uniontown is a rural community with a rich history and a strong sense of community.
History
Uniontown was founded in 1815 by a group of settlers from Uniontown, Pennsylvania. The village was originally known as Union, but the name was changed to Uniontown in 1817. The village was incorporated in 1837 and has remained a small, rural community ever since.
The village was an important stop on the Underground Railroad, with many of the local residents helping to hide and transport escaped slaves. Uniontown was also home to a number of prominent abolitionists, including John Brown, who was born in the village in 1800.
Geography
Uniontown is located in northeastern Ohio, approximately 25 miles south of Akron and 40 miles south of Cleveland. The village is situated in the rolling hills of Stark County, with the Tuscarawas River running through the center of town. The village is surrounded by farmland and is home to several small lakes and ponds.
Economy
Uniontown is a small, rural community with a limited economy. The village is home to a few small businesses, including a grocery store, a hardware store, and a few restaurants. The village is also home to a number of small farms, which produce a variety of crops, including corn, soybeans, and wheat.
Demographics
As of the 2010 census, Uniontown had a population of 1,500 people. The racial makeup of the village was 97.3% White, 0.7% African American, 0.3% Native American, 0.3% Asian, and 1.3% from other races. The median household income was $45,000, and the median home value was $125,000.
Conclusion
Uniontown is a small, rural village located in northeastern Ohio. The village has a rich history and a strong sense of community. The economy is limited, but the village is home to a few small businesses and farms. The population is predominantly white, with a median household income of $45,000 and a median home value of $125,000. Uniontown is a great place to live and work, and it is a great example of a small, rural community.
Common Questions
What is Per Capita Income in Uniontown?
Per Capita income in Uniontown is $44,787.
What is the Median Family Income in Uniontown?
Median Family Income in Uniontown is $118,257.
What is the Median Household income in Uniontown?
Median Household Income in Uniontown is $93,668.
What is Income or Wage Gap in Uniontown?
Income or Wage Gap in Uniontown is 45.2%.
Women in Uniontown earn 54.8 cents for every dollar earned by a man.
What is Inequality or Gini Index in Uniontown?
Inequality or Gini Index in Uniontown is 0.42.
What is the Total Population of Uniontown?
Total Population of Uniontown is 6,948.
What is the Total Male Population of Uniontown?
Total Male Population of Uniontown is 3,565.
What is the Total Female Population of Uniontown?
Total Female Population of Uniontown is 3,383.
What is the Ratio of Males per 100 Females in Uniontown?
There are 105.38 Males per 100 Females in Uniontown.
What is the Ratio of Females per 100 Males in Uniontown?
There are 94.89 Females per 100 Males in Uniontown.
What is the Median Population Age in Uniontown?
Median Population Age in Uniontown is 43.5 Years.
What is the Average Family Size in Uniontown
Average Family Size in Uniontown is 3.1 People.
What is the Average Household Size in Uniontown
Average Household Size in Uniontown is 2.7 People.
How Large is the Labor Force in Uniontown?
There are 3,354 People in the Labor Forcein in Uniontown.
What is the Percentage of People in the Labor Force in Uniontown?
62.9% of People are in the Labor Force in Uniontown.
What is the Unemployment Rate in Uniontown?
Unemployment Rate in Uniontown is 4.0%.