Beach City, OH Map & Demographics
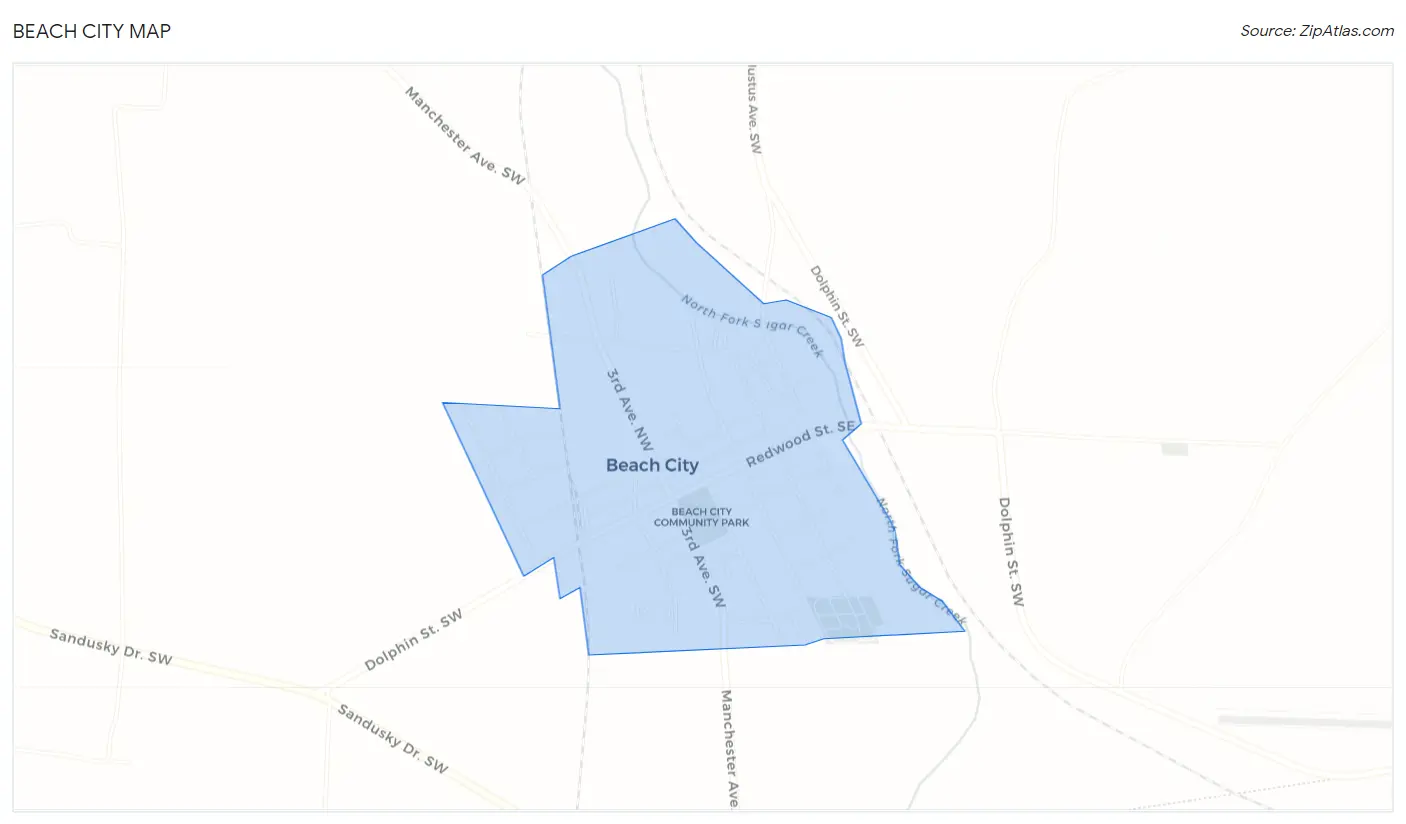
Beach City Map
Beach City Overview
$30,193
PER CAPITA INCOME
$76,786
AVG FAMILY INCOME
$62,188
AVG HOUSEHOLD INCOME
42.4%
WAGE / INCOME GAP [ % ]
57.6¢/ $1
WAGE / INCOME GAP [ $ ]
0.36
INEQUALITY / GINI INDEX
658
TOTAL POPULATION
311
MALE POPULATION
347
FEMALE POPULATION
89.63
MALES / 100 FEMALES
111.58
FEMALES / 100 MALES
42.7
MEDIAN AGE
2.8
AVG FAMILY SIZE
2.3
AVG HOUSEHOLD SIZE
322
LABOR FORCE [ PEOPLE ]
57.1%
PERCENT IN LABOR FORCE
1.9%
UNEMPLOYMENT RATE
Beach City Zip Codes
Beach City Area Codes
Income in Beach City
Income Overview in Beach City
Per Capita Income in Beach City is $30,193, while median incomes of families and households are $76,786 and $62,188 respectively.
| Characteristic | Number | Measure |
| Per Capita Income | 658 | $30,193 |
| Median Family Income | 192 | $76,786 |
| Mean Family Income | 192 | $75,995 |
| Median Household Income | 289 | $62,188 |
| Mean Household Income | 289 | $67,508 |
| Income Deficit | 192 | $0 |
| Wage / Income Gap (%) | 658 | 42.40% |
| Wage / Income Gap ($) | 658 | 57.60¢ per $1 |
| Gini / Inequality Index | 658 | 0.36 |
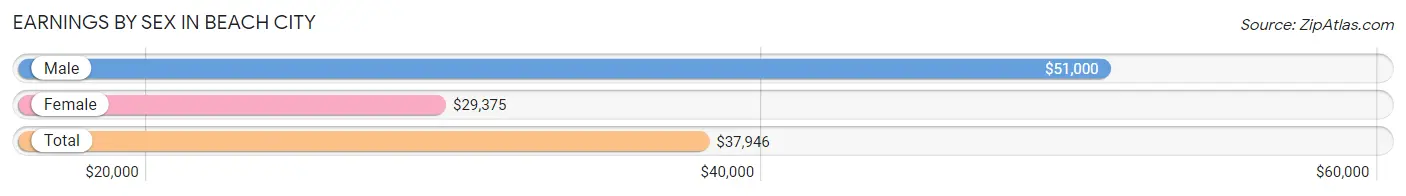
Earnings by Sex in Beach City
Average Earnings in Beach City are $37,946, $51,000 for men and $29,375 for women, a difference of 42.4%.
| Sex | Number | Average Earnings |
| Male | 194 (55.6%) | $51,000 |
| Female | 155 (44.4%) | $29,375 |
| Total | 349 (100.0%) | $37,946 |
Earnings by Sex by Income Bracket in Beach City
The most common earnings brackets in Beach City are $75,000 to $99,999 for men (47 | 24.2%) and $25,000 to $29,999 for women (32 | 20.6%).
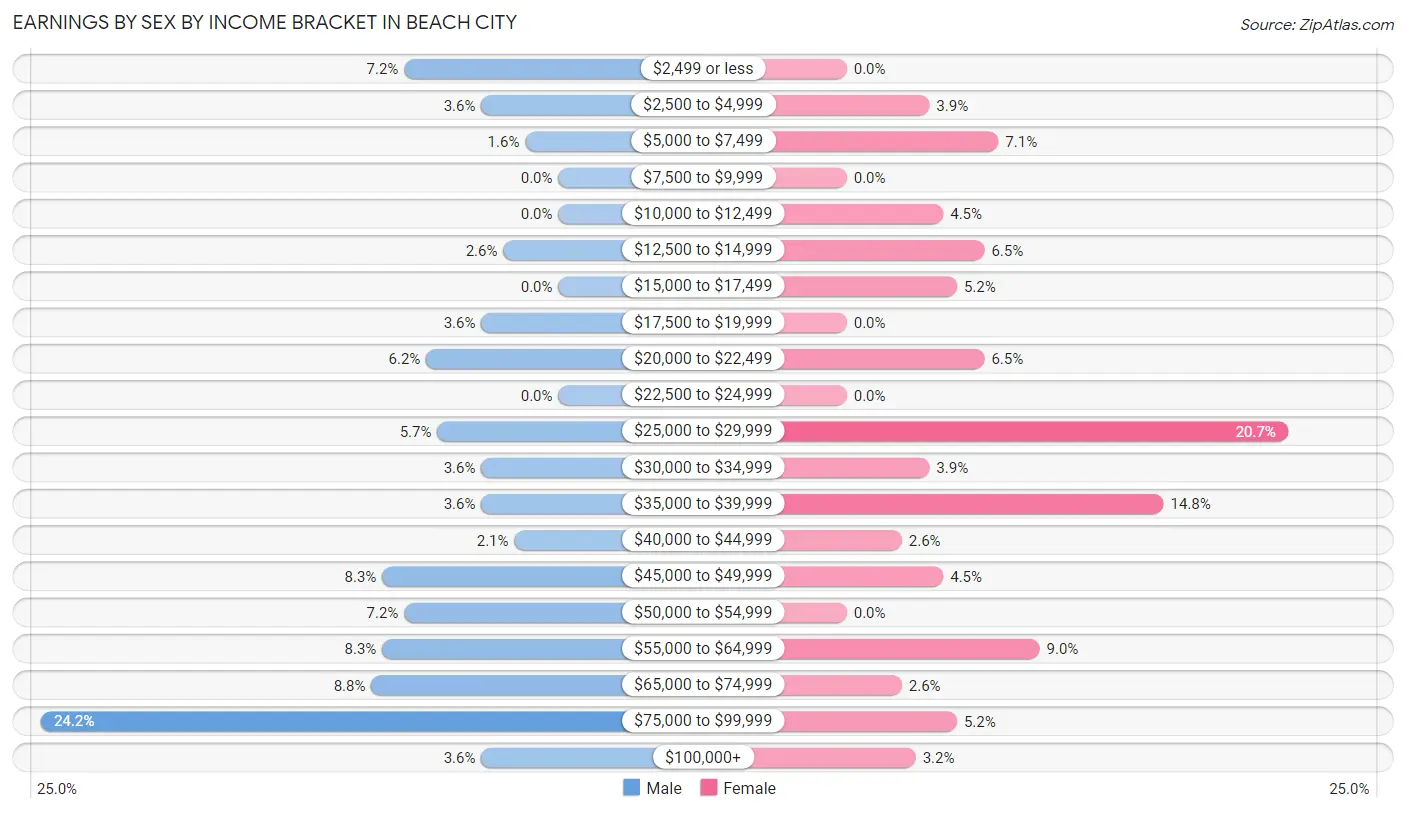
| Income | Male | Female |
| $2,499 or less | 14 (7.2%) | 0 (0.0%) |
| $2,500 to $4,999 | 7 (3.6%) | 6 (3.9%) |
| $5,000 to $7,499 | 3 (1.5%) | 11 (7.1%) |
| $7,500 to $9,999 | 0 (0.0%) | 0 (0.0%) |
| $10,000 to $12,499 | 0 (0.0%) | 7 (4.5%) |
| $12,500 to $14,999 | 5 (2.6%) | 10 (6.5%) |
| $15,000 to $17,499 | 0 (0.0%) | 8 (5.2%) |
| $17,500 to $19,999 | 7 (3.6%) | 0 (0.0%) |
| $20,000 to $22,499 | 12 (6.2%) | 10 (6.5%) |
| $22,500 to $24,999 | 0 (0.0%) | 0 (0.0%) |
| $25,000 to $29,999 | 11 (5.7%) | 32 (20.6%) |
| $30,000 to $34,999 | 7 (3.6%) | 6 (3.9%) |
| $35,000 to $39,999 | 7 (3.6%) | 23 (14.8%) |
| $40,000 to $44,999 | 4 (2.1%) | 4 (2.6%) |
| $45,000 to $49,999 | 16 (8.3%) | 7 (4.5%) |
| $50,000 to $54,999 | 14 (7.2%) | 0 (0.0%) |
| $55,000 to $64,999 | 16 (8.3%) | 14 (9.0%) |
| $65,000 to $74,999 | 17 (8.8%) | 4 (2.6%) |
| $75,000 to $99,999 | 47 (24.2%) | 8 (5.2%) |
| $100,000+ | 7 (3.6%) | 5 (3.2%) |
| Total | 194 (100.0%) | 155 (100.0%) |
Earnings by Sex by Educational Attainment in Beach City
Average earnings in Beach City are $56,250 for men and $29,107 for women, a difference of 48.2%. Men with an educational attainment of graduate degree enjoy the highest average annual earnings of $80,500, while those with college or associate's degree education earn the least with $45,313. Women with an educational attainment of college or associate's degree earn the most with the average annual earnings of $55,250, while those with high school diploma education have the smallest earnings of $26,042.
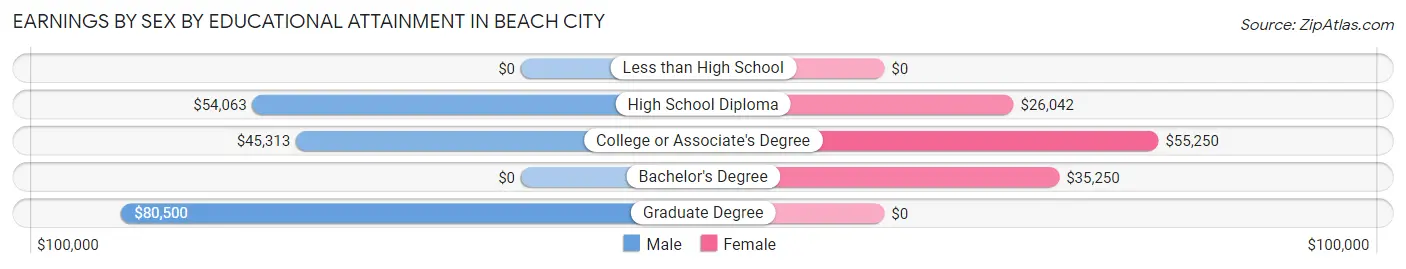
| Educational Attainment | Male Income | Female Income |
| Less than High School | - | - |
| High School Diploma | $54,063 | $26,042 |
| College or Associate's Degree | $45,313 | $55,250 |
| Bachelor's Degree | - | - |
| Graduate Degree | $80,500 | $0 |
| Total | $56,250 | $29,107 |
Family Income in Beach City
Family Income Brackets in Beach City
According to the Beach City family income data, there are 50 families falling into the $75,000 to $99,999 income range, which is the most common income bracket and makes up 26.0% of all families.
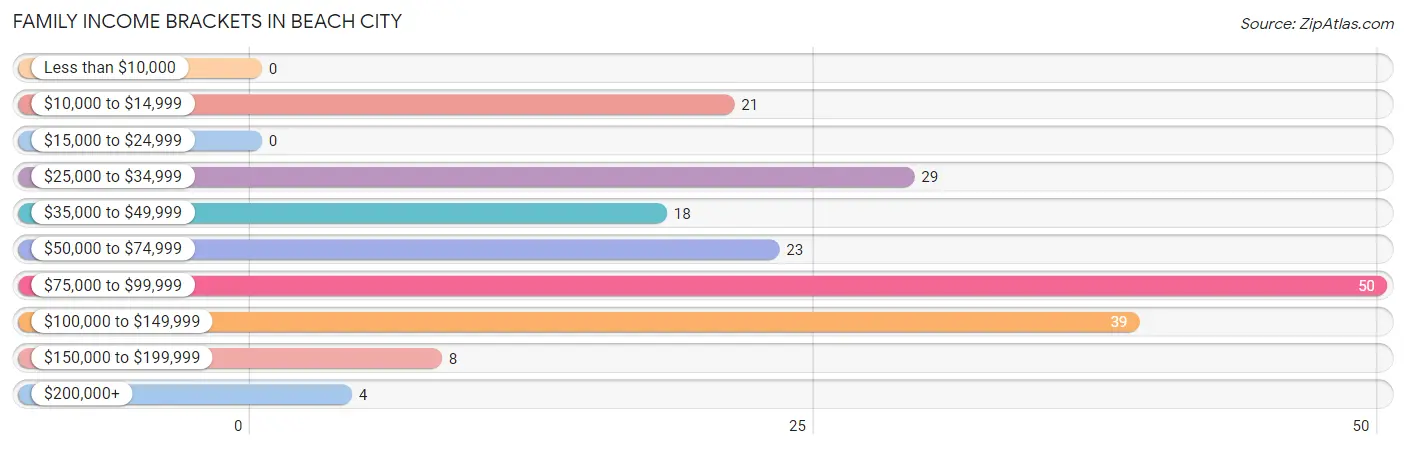
| Income Bracket | # Families | % Families |
| Less than $10,000 | 0 | 0.0% |
| $10,000 to $14,999 | 21 | 10.9% |
| $15,000 to $24,999 | 0 | 0.0% |
| $25,000 to $34,999 | 29 | 15.1% |
| $35,000 to $49,999 | 18 | 9.4% |
| $50,000 to $74,999 | 23 | 12.0% |
| $75,000 to $99,999 | 50 | 26.0% |
| $100,000 to $149,999 | 39 | 20.3% |
| $150,000 to $199,999 | 8 | 4.2% |
| $200,000+ | 4 | 2.1% |
Family Income by Famaliy Size in Beach City
4-person families (42 | 21.9%) account for the highest median family income in Beach City with $118,125 per family, while 3-person families (28 | 14.6%) have the highest median income of $31,389 per family member.
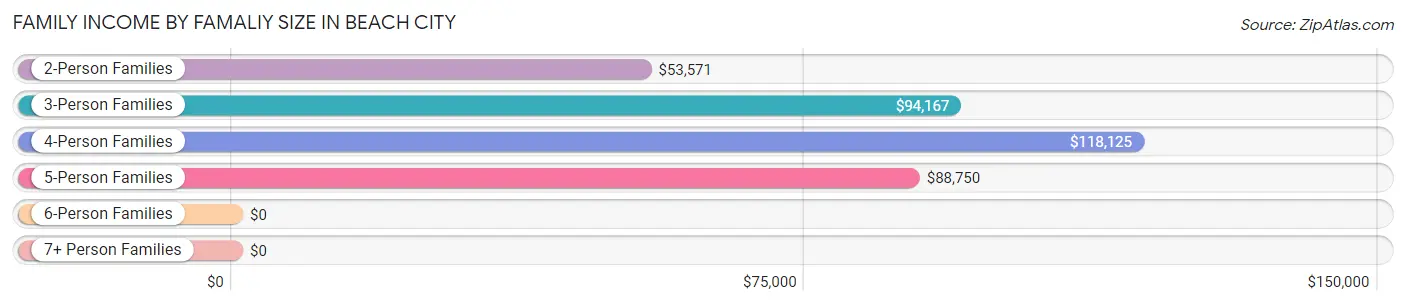
| Income Bracket | # Families | Median Income |
| 2-Person Families | 114 (59.4%) | $53,571 |
| 3-Person Families | 28 (14.6%) | $94,167 |
| 4-Person Families | 42 (21.9%) | $118,125 |
| 5-Person Families | 8 (4.2%) | $88,750 |
| 6-Person Families | 0 (0.0%) | $0 |
| 7+ Person Families | 0 (0.0%) | $0 |
| Total | 192 (100.0%) | $76,786 |
Family Income by Number of Earners in Beach City
The median family income in Beach City is $76,786, with families comprising 3+ earners (21) having the highest median family income of $107,250, while families with no earners (30) have the lowest median family income of $33,750, accounting for 10.9% and 15.6% of families, respectively.
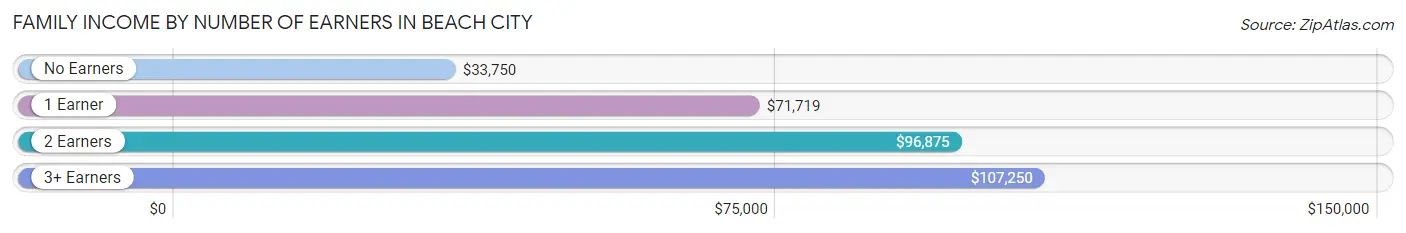
| Number of Earners | # Families | Median Income |
| No Earners | 30 (15.6%) | $33,750 |
| 1 Earner | 71 (37.0%) | $71,719 |
| 2 Earners | 70 (36.5%) | $96,875 |
| 3+ Earners | 21 (10.9%) | $107,250 |
| Total | 192 (100.0%) | $76,786 |
Household Income in Beach City
Household Income Brackets in Beach City
With 70 households falling in the category, the $75,000 to $99,999 income range is the most frequent in Beach City, accounting for 24.2% of all households. In contrast, only 5 households (1.7%) fall into the $200,000+ income bracket, making it the least populous group.
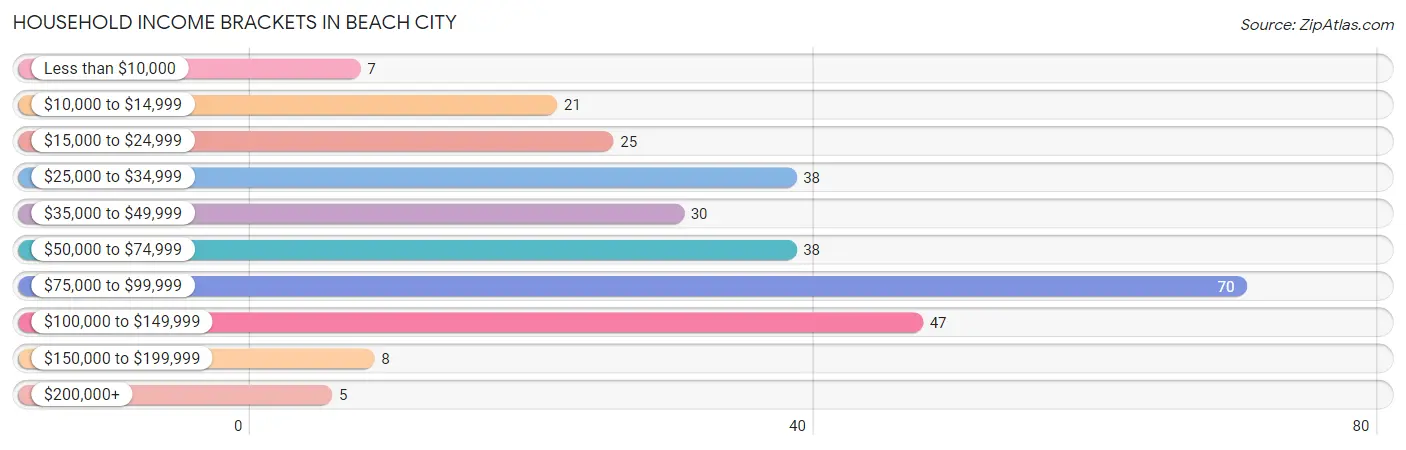
| Income Bracket | # Households | % Households |
| Less than $10,000 | 7 | 2.4% |
| $10,000 to $14,999 | 21 | 7.3% |
| $15,000 to $24,999 | 25 | 8.7% |
| $25,000 to $34,999 | 38 | 13.1% |
| $35,000 to $49,999 | 30 | 10.4% |
| $50,000 to $74,999 | 38 | 13.1% |
| $75,000 to $99,999 | 70 | 24.2% |
| $100,000 to $149,999 | 47 | 16.3% |
| $150,000 to $199,999 | 8 | 2.8% |
| $200,000+ | 5 | 1.7% |
Household Income by Householder Age in Beach City
The median household income in Beach City is $62,188, with the highest median household income of $82,750 found in the 25 to 44 years age bracket for the primary householder. A total of 88 households (30.4%) fall into this category. Meanwhile, the 15 to 24 years age bracket for the primary householder has the lowest median household income of $0, with 18 households (6.2%) in this group.
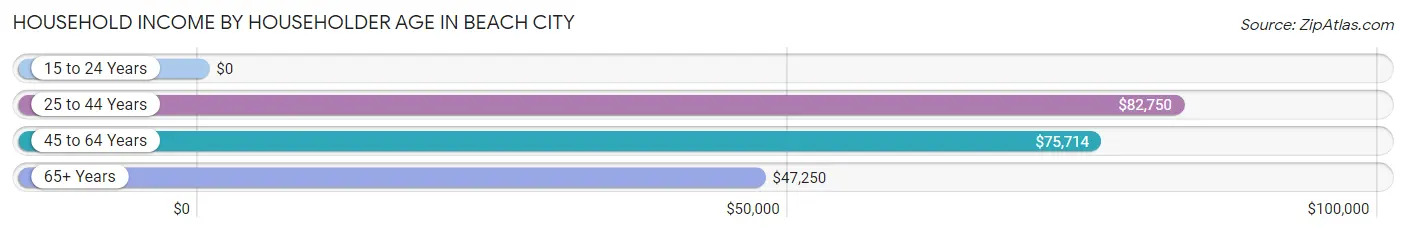
| Income Bracket | # Households | Median Income |
| 15 to 24 Years | 18 (6.2%) | $0 |
| 25 to 44 Years | 88 (30.4%) | $82,750 |
| 45 to 64 Years | 108 (37.4%) | $75,714 |
| 65+ Years | 75 (26.0%) | $47,250 |
| Total | 289 (100.0%) | $62,188 |
Poverty in Beach City
Income Below Poverty by Sex and Age in Beach City
With 6.8% poverty level for males and 13.8% for females among the residents of Beach City, 18 to 24 year old males and under 5 year old females are the most vulnerable to poverty, with 14 males (24.6%) and 10 females (58.8%) in their respective age groups living below the poverty level.
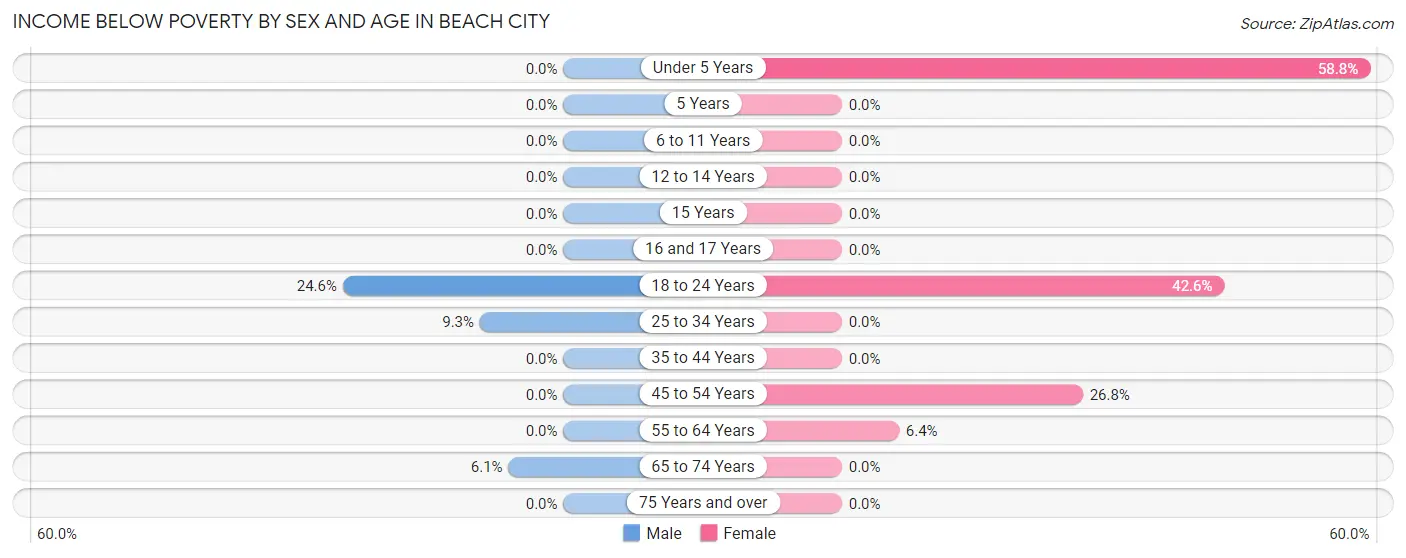
| Age Bracket | Male | Female |
| Under 5 Years | 0 (0.0%) | 10 (58.8%) |
| 5 Years | 0 (0.0%) | 0 (0.0%) |
| 6 to 11 Years | 0 (0.0%) | 0 (0.0%) |
| 12 to 14 Years | 0 (0.0%) | 0 (0.0%) |
| 15 Years | 0 (0.0%) | 0 (0.0%) |
| 16 and 17 Years | 0 (0.0%) | 0 (0.0%) |
| 18 to 24 Years | 14 (24.6%) | 23 (42.6%) |
| 25 to 34 Years | 4 (9.3%) | 0 (0.0%) |
| 35 to 44 Years | 0 (0.0%) | 0 (0.0%) |
| 45 to 54 Years | 0 (0.0%) | 11 (26.8%) |
| 55 to 64 Years | 0 (0.0%) | 4 (6.4%) |
| 65 to 74 Years | 3 (6.1%) | 0 (0.0%) |
| 75 Years and over | 0 (0.0%) | 0 (0.0%) |
| Total | 21 (6.8%) | 48 (13.8%) |
Income Above Poverty by Sex and Age in Beach City
According to the poverty statistics in Beach City, males aged under 5 years and females aged 5 years are the age groups that are most secure financially, with 100.0% of males and 100.0% of females in these age groups living above the poverty line.
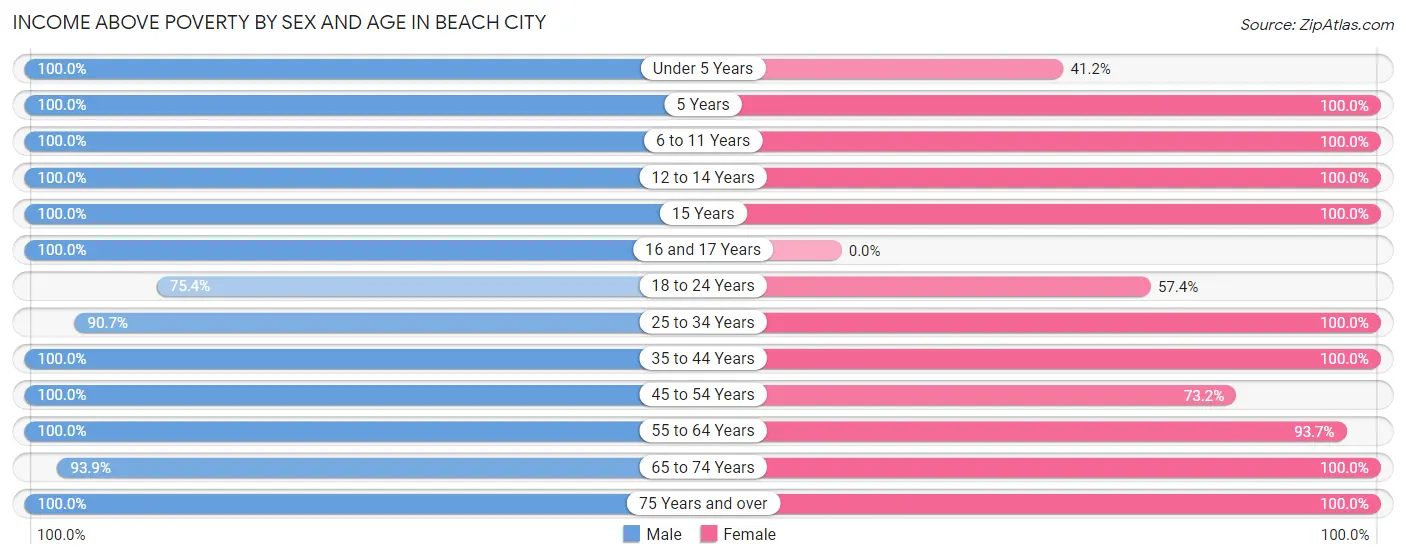
| Age Bracket | Male | Female |
| Under 5 Years | 10 (100.0%) | 7 (41.2%) |
| 5 Years | 3 (100.0%) | 3 (100.0%) |
| 6 to 11 Years | 8 (100.0%) | 31 (100.0%) |
| 12 to 14 Years | 6 (100.0%) | 9 (100.0%) |
| 15 Years | 4 (100.0%) | 3 (100.0%) |
| 16 and 17 Years | 3 (100.0%) | 0 (0.0%) |
| 18 to 24 Years | 43 (75.4%) | 31 (57.4%) |
| 25 to 34 Years | 39 (90.7%) | 19 (100.0%) |
| 35 to 44 Years | 32 (100.0%) | 38 (100.0%) |
| 45 to 54 Years | 52 (100.0%) | 30 (73.2%) |
| 55 to 64 Years | 30 (100.0%) | 59 (93.6%) |
| 65 to 74 Years | 46 (93.9%) | 38 (100.0%) |
| 75 Years and over | 14 (100.0%) | 31 (100.0%) |
| Total | 290 (93.2%) | 299 (86.2%) |
Income Below Poverty Among Married-Couple Families in Beach City
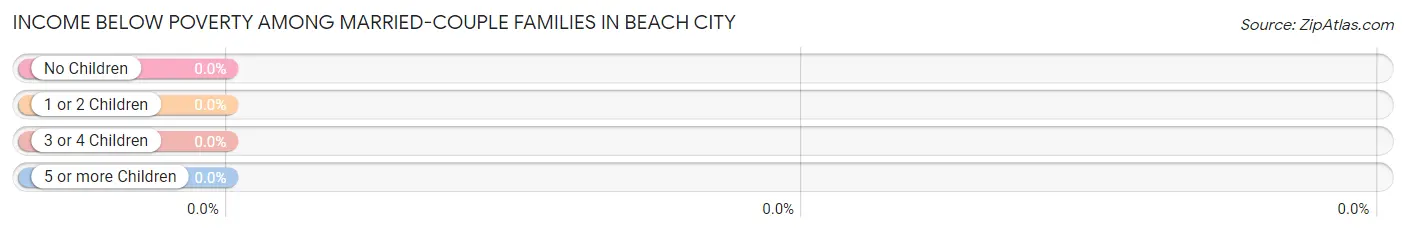
| Children | Above Poverty | Below Poverty |
| No Children | 106 (100.0%) | 0 (0.0%) |
| 1 or 2 Children | 22 (100.0%) | 0 (0.0%) |
| 3 or 4 Children | 6 (100.0%) | 0 (0.0%) |
| 5 or more Children | 0 (0.0%) | 0 (0.0%) |
| Total | 134 (100.0%) | 0 (0.0%) |
Income Below Poverty Among Single-Parent Households in Beach City
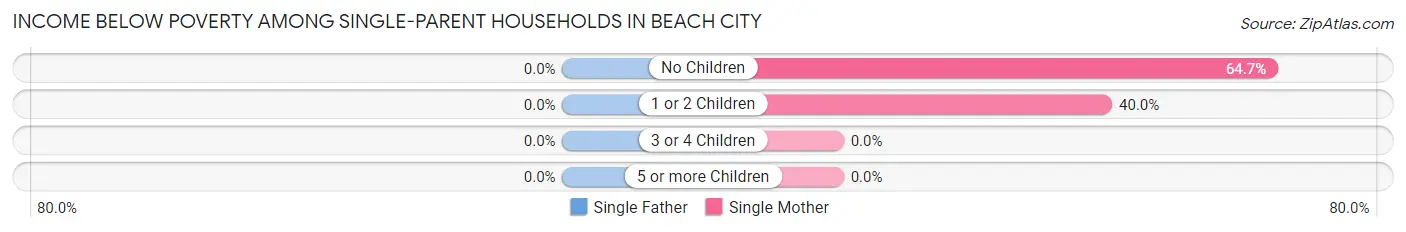
| Children | Single Father | Single Mother |
| No Children | 0 (0.0%) | 11 (64.7%) |
| 1 or 2 Children | 0 (0.0%) | 10 (40.0%) |
| 3 or 4 Children | 0 (0.0%) | 0 (0.0%) |
| 5 or more Children | 0 (0.0%) | 0 (0.0%) |
| Total | 0 (0.0%) | 21 (50.0%) |
Income Below Poverty Among Married-Couple vs Single-Parent Households in Beach City
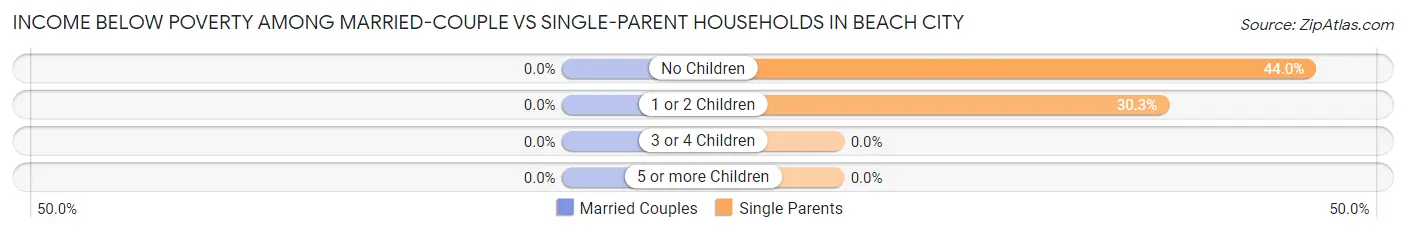
| Children | Married-Couple Families | Single-Parent Households |
| No Children | 0 (0.0%) | 11 (44.0%) |
| 1 or 2 Children | 0 (0.0%) | 10 (30.3%) |
| 3 or 4 Children | 0 (0.0%) | 0 (0.0%) |
| 5 or more Children | 0 (0.0%) | 0 (0.0%) |
| Total | 0 (0.0%) | 21 (36.2%) |
Race in Beach City
The most populous races in Beach City are White / Caucasian (631 | 95.9%), Two or more Races (14 | 2.1%), and Asian (13 | 2.0%).
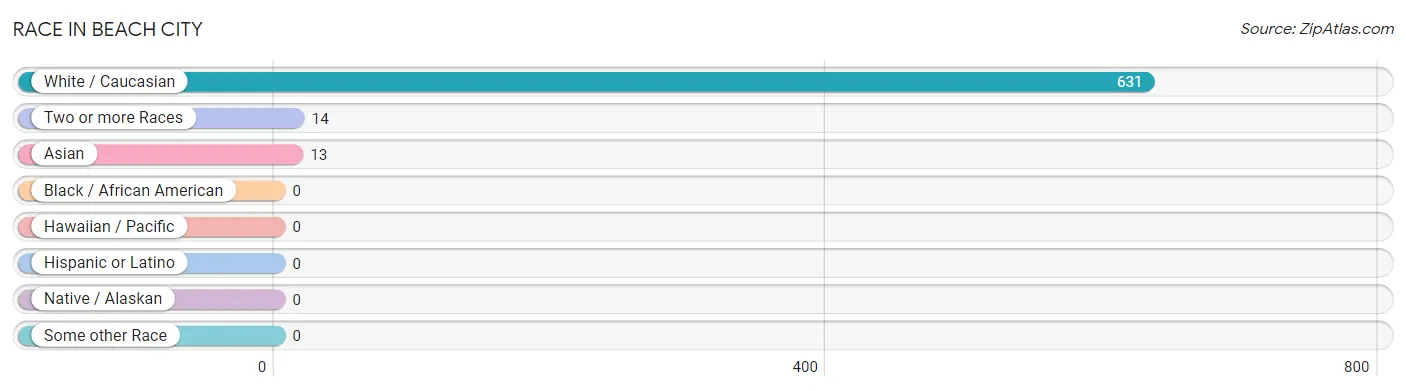
| Race | # Population | % Population |
| Asian | 13 | 2.0% |
| Black / African American | 0 | 0.0% |
| Hawaiian / Pacific | 0 | 0.0% |
| Hispanic or Latino | 0 | 0.0% |
| Native / Alaskan | 0 | 0.0% |
| White / Caucasian | 631 | 95.9% |
| Two or more Races | 14 | 2.1% |
| Some other Race | 0 | 0.0% |
| Total | 658 | 100.0% |
Ancestry in Beach City
The most populous ancestries reported in Beach City are German (229 | 34.8%), Irish (175 | 26.6%), English (49 | 7.4%), Italian (49 | 7.4%), and Hungarian (29 | 4.4%), together accounting for 80.7% of all Beach City residents.
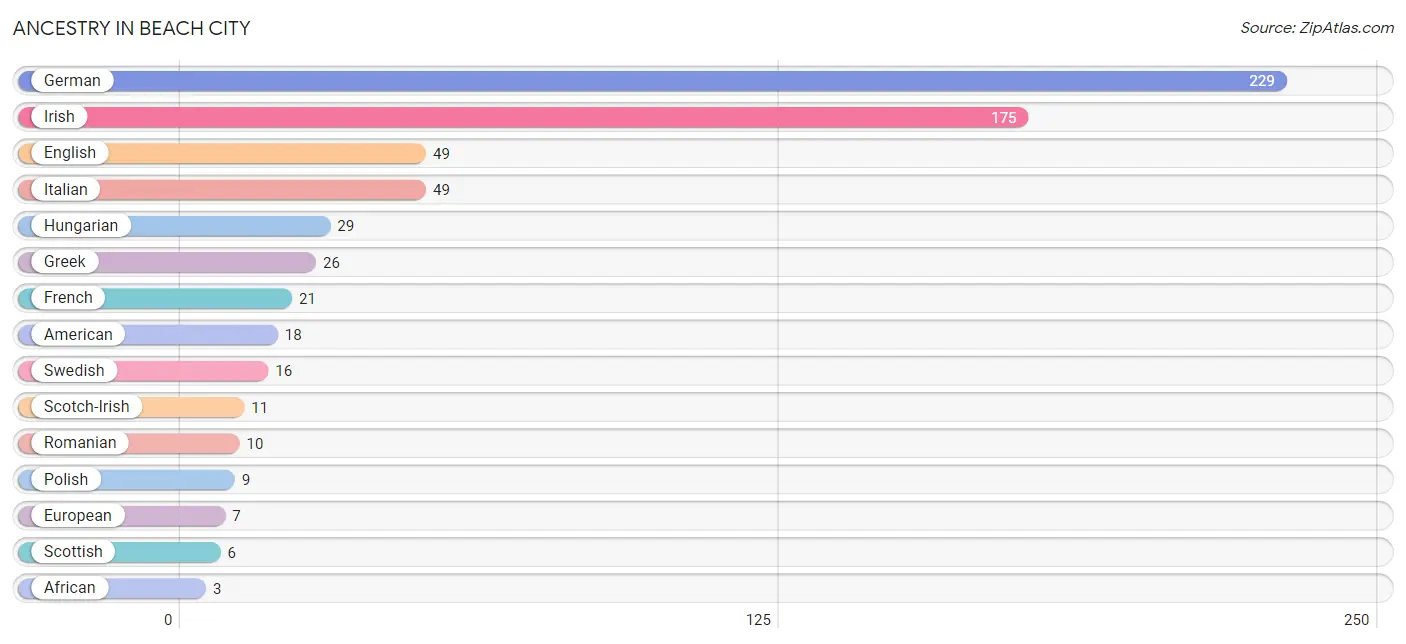
| Ancestry | # Population | % Population |
| African | 3 | 0.5% |
| American | 18 | 2.7% |
| Blackfeet | 2 | 0.3% |
| Czechoslovakian | 3 | 0.5% |
| English | 49 | 7.4% |
| European | 7 | 1.1% |
| French | 21 | 3.2% |
| German | 229 | 34.8% |
| Greek | 26 | 4.0% |
| Hungarian | 29 | 4.4% |
| Irish | 175 | 26.6% |
| Italian | 49 | 7.4% |
| Polish | 9 | 1.4% |
| Romanian | 10 | 1.5% |
| Scandinavian | 3 | 0.5% |
| Scotch-Irish | 11 | 1.7% |
| Scottish | 6 | 0.9% |
| Subsaharan African | 3 | 0.5% |
| Swedish | 16 | 2.4% |
| Swiss | 3 | 0.5% | View All 20 Rows |
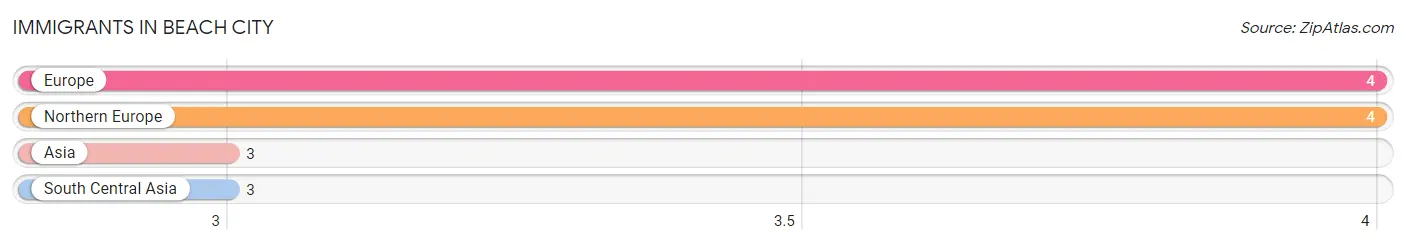
Immigrants in Beach City
The most numerous immigrant groups reported in Beach City came from Europe (4 | 0.6%), Northern Europe (4 | 0.6%), Asia (3 | 0.5%), and South Central Asia (3 | 0.5%), together accounting for 2.1% of all Beach City residents.
| Immigration Origin | # Population | % Population |
| Asia | 3 | 0.5% |
| Europe | 4 | 0.6% |
| Northern Europe | 4 | 0.6% |
| South Central Asia | 3 | 0.5% | View All 4 Rows |
Sex and Age in Beach City
Sex and Age in Beach City
The most populous age groups in Beach City are 20 to 24 Years (43 | 13.8%) for men and 20 to 24 Years (54 | 15.6%) for women.
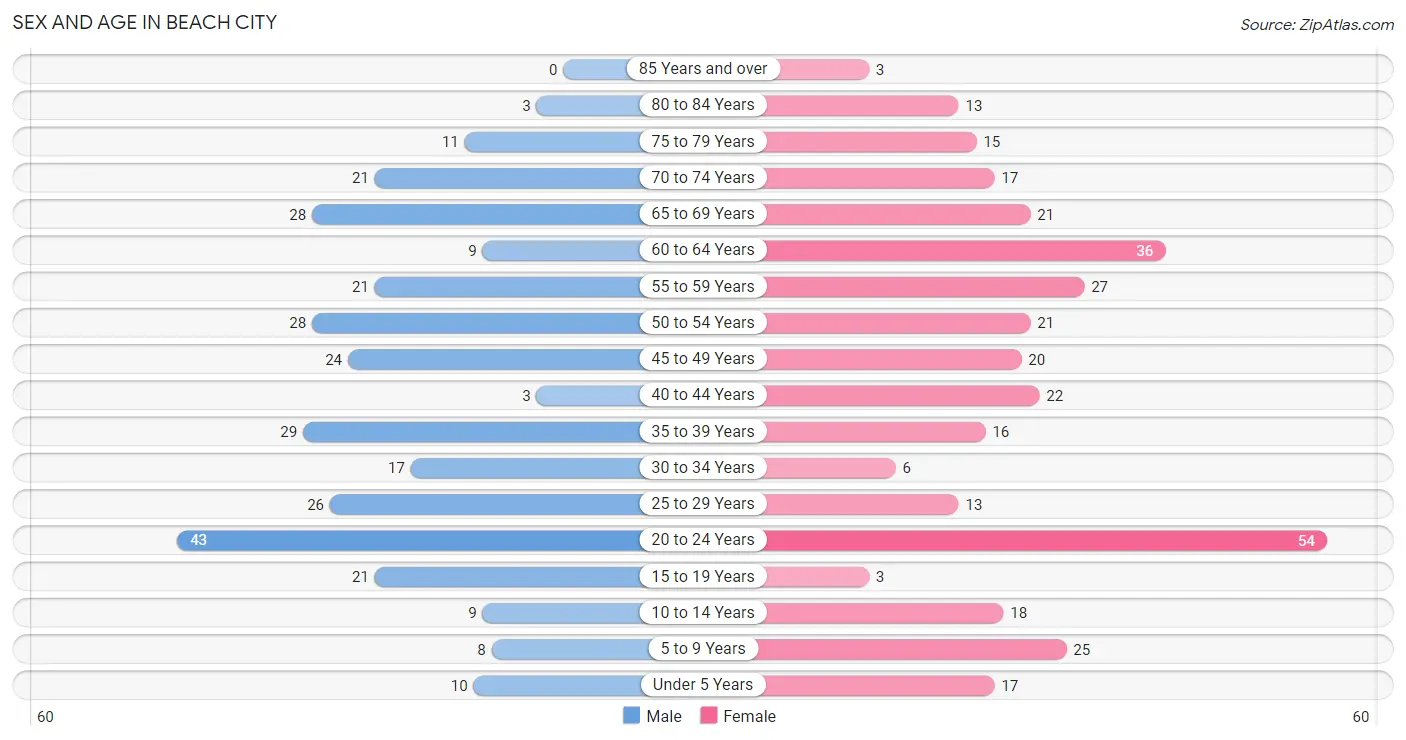
| Age Bracket | Male | Female |
| Under 5 Years | 10 (3.2%) | 17 (4.9%) |
| 5 to 9 Years | 8 (2.6%) | 25 (7.2%) |
| 10 to 14 Years | 9 (2.9%) | 18 (5.2%) |
| 15 to 19 Years | 21 (6.8%) | 3 (0.9%) |
| 20 to 24 Years | 43 (13.8%) | 54 (15.6%) |
| 25 to 29 Years | 26 (8.4%) | 13 (3.7%) |
| 30 to 34 Years | 17 (5.5%) | 6 (1.7%) |
| 35 to 39 Years | 29 (9.3%) | 16 (4.6%) |
| 40 to 44 Years | 3 (1.0%) | 22 (6.3%) |
| 45 to 49 Years | 24 (7.7%) | 20 (5.8%) |
| 50 to 54 Years | 28 (9.0%) | 21 (6.0%) |
| 55 to 59 Years | 21 (6.8%) | 27 (7.8%) |
| 60 to 64 Years | 9 (2.9%) | 36 (10.4%) |
| 65 to 69 Years | 28 (9.0%) | 21 (6.0%) |
| 70 to 74 Years | 21 (6.8%) | 17 (4.9%) |
| 75 to 79 Years | 11 (3.5%) | 15 (4.3%) |
| 80 to 84 Years | 3 (1.0%) | 13 (3.7%) |
| 85 Years and over | 0 (0.0%) | 3 (0.9%) |
| Total | 311 (100.0%) | 347 (100.0%) |
Families and Households in Beach City
Median Family Size in Beach City
The median family size in Beach City is 2.78 persons per family, with single male/father families (16 | 8.3%) accounting for the largest median family size of 3.06 persons per family. On the other hand, married-couple families (134 | 69.8%) represent the smallest median family size with 2.67 persons per family.
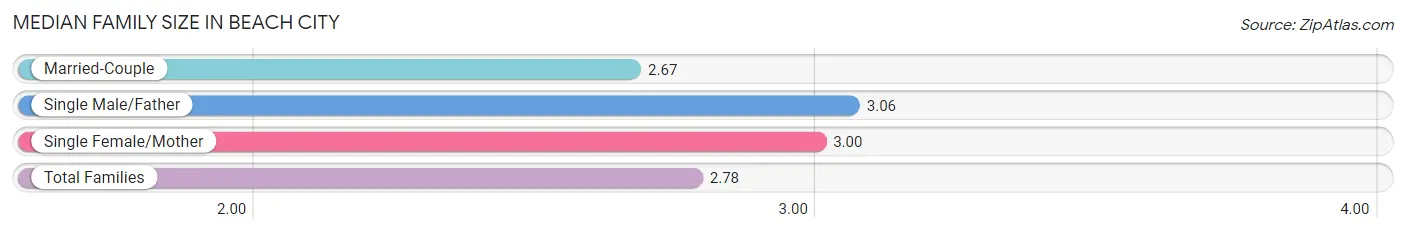
| Family Type | # Families | Family Size |
| Married-Couple | 134 (69.8%) | 2.67 |
| Single Male/Father | 16 (8.3%) | 3.06 |
| Single Female/Mother | 42 (21.9%) | 3.00 |
| Total Families | 192 (100.0%) | 2.78 |
Median Household Size in Beach City
The median household size in Beach City is 2.28 persons per household, with single female/mother households (42 | 14.5%) accounting for the largest median household size of 3.31 persons per household. non-family households (97 | 33.6%) represent the smallest median household size with 1.15 persons per household.
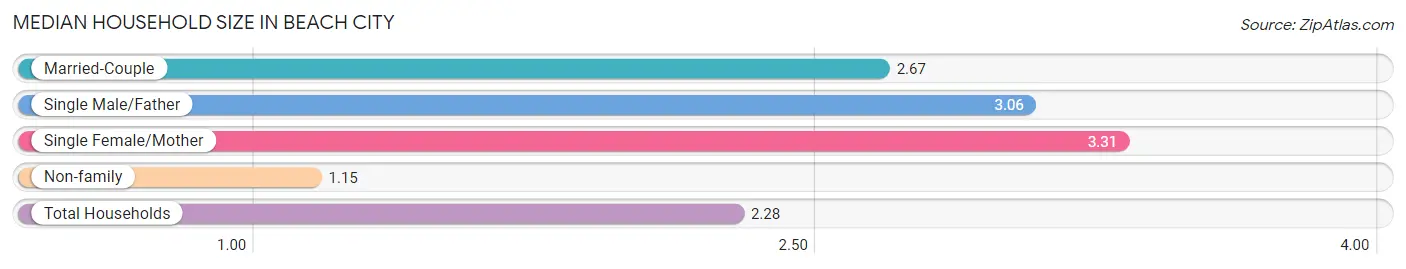
| Household Type | # Households | Household Size |
| Married-Couple | 134 (46.4%) | 2.67 |
| Single Male/Father | 16 (5.5%) | 3.06 |
| Single Female/Mother | 42 (14.5%) | 3.31 |
| Non-family | 97 (33.6%) | 1.15 |
| Total Households | 289 (100.0%) | 2.28 |
Household Size by Marriage Status in Beach City
Out of a total of 289 households in Beach City, 192 (66.4%) are family households, while 97 (33.6%) are nonfamily households. The most numerous type of family households are 2-person households, comprising 103, and the most common type of nonfamily households are 1-person households, comprising 84.
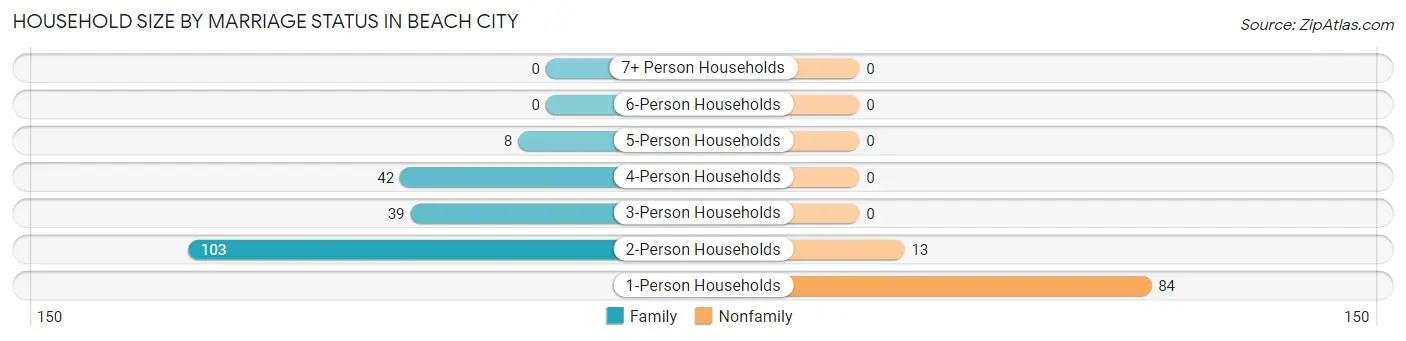
| Household Size | Family Households | Nonfamily Households |
| 1-Person Households | - | 84 (29.1%) |
| 2-Person Households | 103 (35.6%) | 13 (4.5%) |
| 3-Person Households | 39 (13.5%) | 0 (0.0%) |
| 4-Person Households | 42 (14.5%) | 0 (0.0%) |
| 5-Person Households | 8 (2.8%) | 0 (0.0%) |
| 6-Person Households | 0 (0.0%) | 0 (0.0%) |
| 7+ Person Households | 0 (0.0%) | 0 (0.0%) |
| Total | 192 (66.4%) | 97 (33.6%) |
Female Fertility in Beach City
Fertility by Age in Beach City
Average fertility rate in Beach City is 22.0 births per 1,000 women. Women in the age bracket of 35 to 50 years have the highest fertility rate with 49.0 births per 1,000 women. Women in the age bracket of 35 to 50 years acount for 100.0% of all women with births.
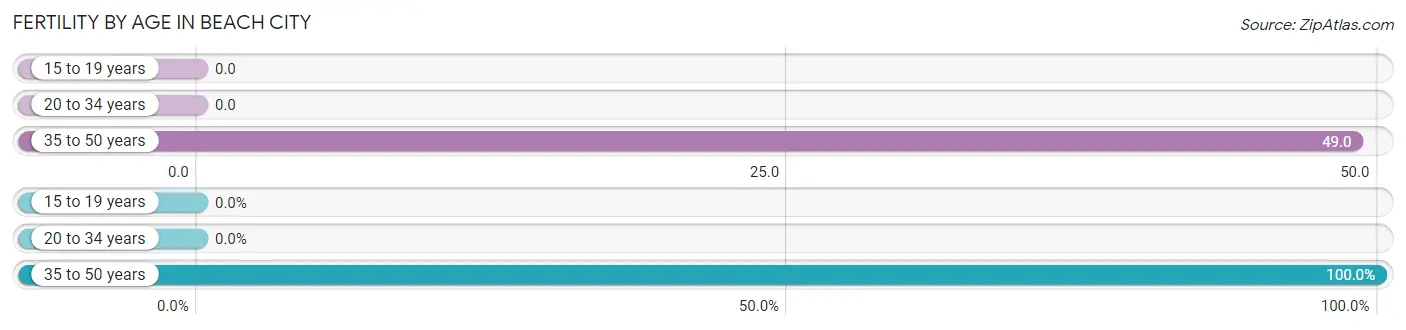
| Age Bracket | Women with Births | Births / 1,000 Women |
| 15 to 19 years | 0 (0.0%) | 0.0 |
| 20 to 34 years | 0 (0.0%) | 0.0 |
| 35 to 50 years | 3 (100.0%) | 49.0 |
| Total | 3 (100.0%) | 22.0 |
Fertility by Age by Marriage Status in Beach City
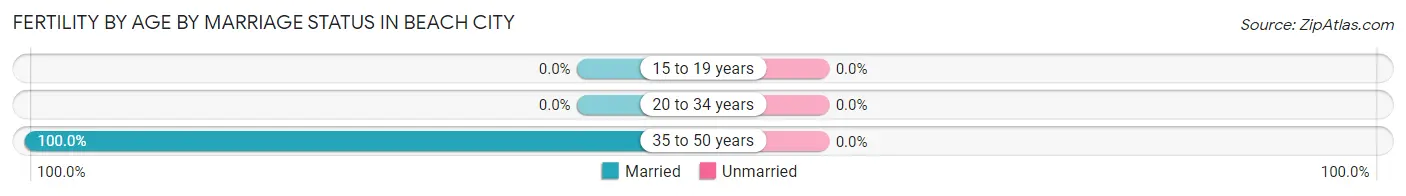
| Age Bracket | Married | Unmarried |
| 15 to 19 years | 0 (0.0%) | 0 (0.0%) |
| 20 to 34 years | 0 (0.0%) | 0 (0.0%) |
| 35 to 50 years | 3 (100.0%) | 0 (0.0%) |
| Total | 3 (100.0%) | 0 (0.0%) |
Fertility by Education in Beach City
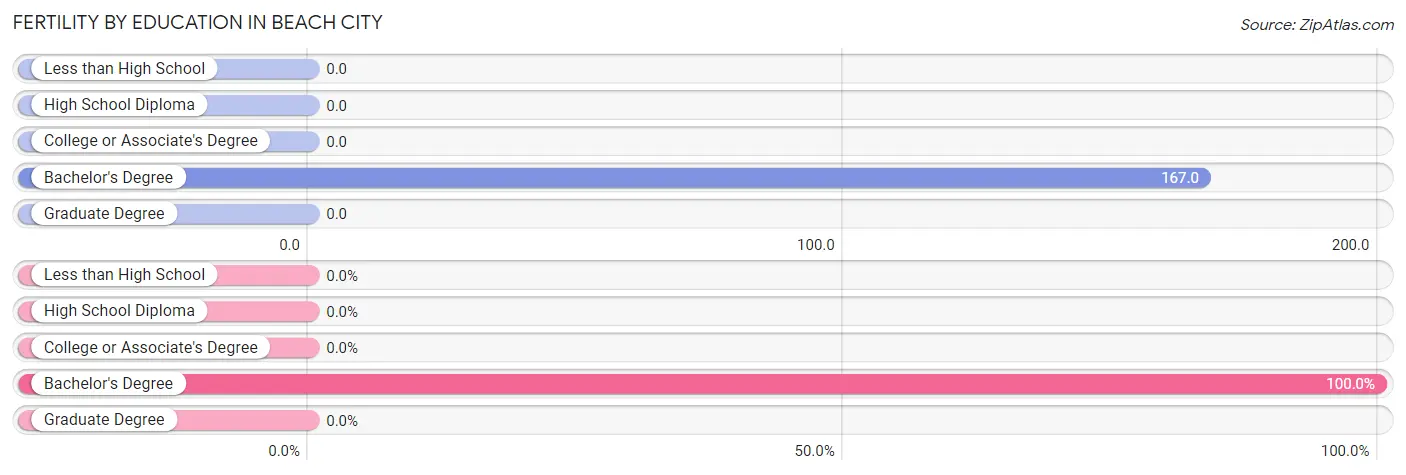
| Educational Attainment | Women with Births | Births / 1,000 Women |
| Less than High School | 0 (0.0%) | 0.0 |
| High School Diploma | 0 (0.0%) | 0.0 |
| College or Associate's Degree | 0 (0.0%) | 0.0 |
| Bachelor's Degree | 3 (100.0%) | 167.0 |
| Graduate Degree | 0 (0.0%) | 0.0 |
| Total | 3 (100.0%) | 22.0 |
Fertility by Education by Marriage Status in Beach City
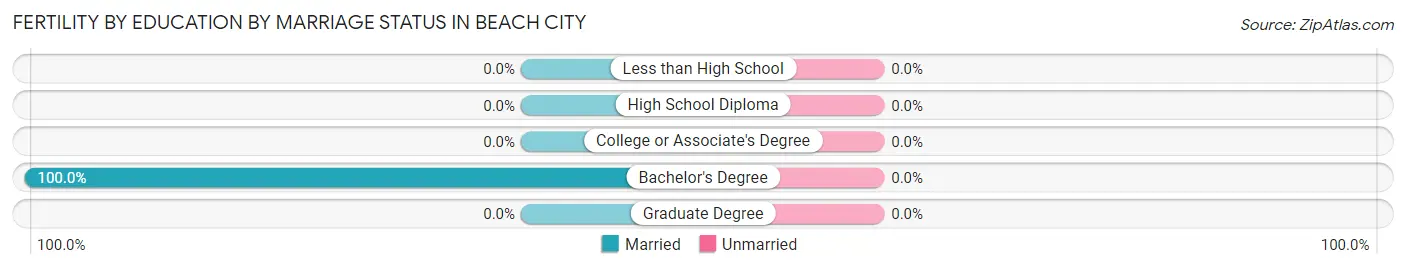
| Educational Attainment | Married | Unmarried |
| Less than High School | 0 (0.0%) | 0 (0.0%) |
| High School Diploma | 0 (0.0%) | 0 (0.0%) |
| College or Associate's Degree | 0 (0.0%) | 0 (0.0%) |
| Bachelor's Degree | 3 (100.0%) | 0 (0.0%) |
| Graduate Degree | 0 (0.0%) | 0 (0.0%) |
| Total | 3 (100.0%) | 0 (0.0%) |
Employment Characteristics in Beach City
Employment by Class of Employer in Beach City
Among the 302 employed individuals in Beach City, private company employees (258 | 85.4%), self-employed (not incorporated) (18 | 6.0%), and local government employees (12 | 4.0%) make up the most common classes of employment.
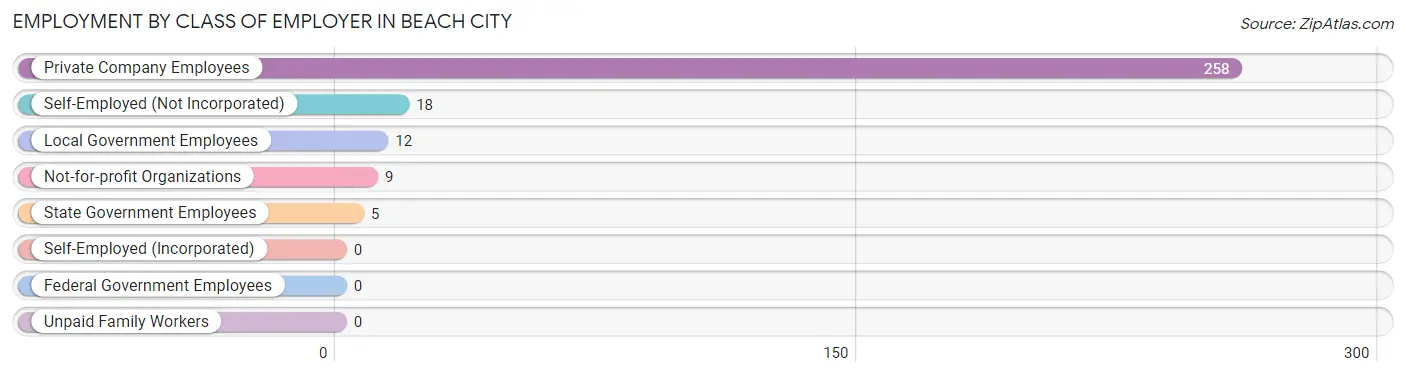
| Employer Class | # Employees | % Employees |
| Private Company Employees | 258 | 85.4% |
| Self-Employed (Incorporated) | 0 | 0.0% |
| Self-Employed (Not Incorporated) | 18 | 6.0% |
| Not-for-profit Organizations | 9 | 3.0% |
| Local Government Employees | 12 | 4.0% |
| State Government Employees | 5 | 1.7% |
| Federal Government Employees | 0 | 0.0% |
| Unpaid Family Workers | 0 | 0.0% |
| Total | 302 | 100.0% |
Employment Status by Age in Beach City
According to the labor force statistics for Beach City, out of the total population over 16 years of age (564), 57.1% or 322 individuals are in the labor force, with 1.9% or 6 of them unemployed. The age group with the highest labor force participation rate is 30 to 34 years, with 100.0% or 23 individuals in the labor force. Within the labor force, the 25 to 29 years age range has the highest percentage of unemployed individuals, with 9.7% or 3 of them being unemployed.
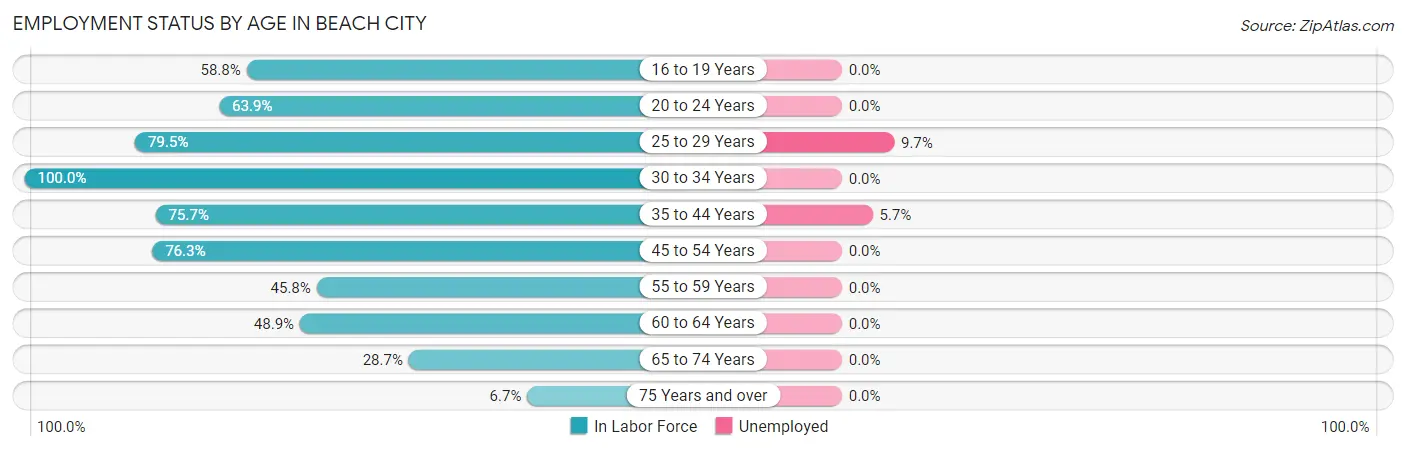
| Age Bracket | In Labor Force | Unemployed |
| 16 to 19 Years | 10 (58.8%) | 0 (0.0%) |
| 20 to 24 Years | 62 (63.9%) | 0 (0.0%) |
| 25 to 29 Years | 31 (79.5%) | 3 (9.7%) |
| 30 to 34 Years | 23 (100.0%) | 0 (0.0%) |
| 35 to 44 Years | 53 (75.7%) | 3 (5.7%) |
| 45 to 54 Years | 71 (76.3%) | 0 (0.0%) |
| 55 to 59 Years | 22 (45.8%) | 0 (0.0%) |
| 60 to 64 Years | 22 (48.9%) | 0 (0.0%) |
| 65 to 74 Years | 25 (28.7%) | 0 (0.0%) |
| 75 Years and over | 3 (6.7%) | 0 (0.0%) |
| Total | 322 (57.1%) | 6 (1.9%) |
Employment Status by Educational Attainment in Beach City
According to labor force statistics for Beach City, 69.8% of individuals (222) out of the total population between 25 and 64 years of age (318) are in the labor force, with 2.7% or 6 of them being unemployed. The group with the highest labor force participation rate are those with the educational attainment of bachelor's degree or higher, with 100.0% or 30 individuals in the labor force. Within the labor force, individuals with college / associate degree education have the highest percentage of unemployment, with 4.5% or 3 of them being unemployed.
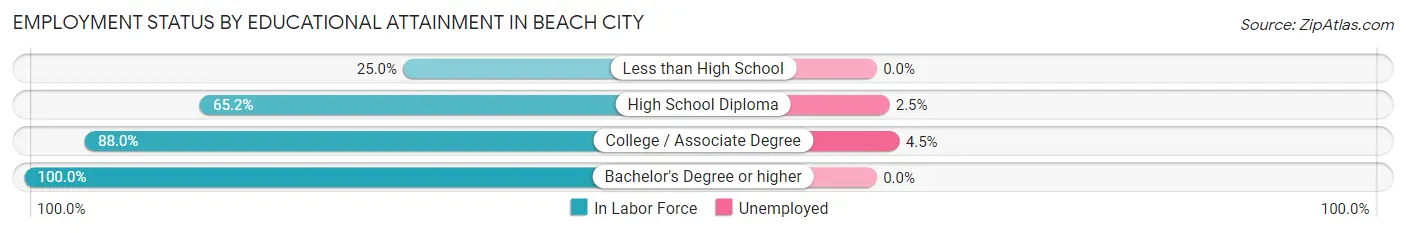
| Educational Attainment | In Labor Force | Unemployed |
| Less than High School | 8 (25.0%) | 0 (0.0%) |
| High School Diploma | 118 (65.2%) | 5 (2.5%) |
| College / Associate Degree | 66 (88.0%) | 3 (4.5%) |
| Bachelor's Degree or higher | 30 (100.0%) | 0 (0.0%) |
| Total | 222 (69.8%) | 9 (2.7%) |
Employment Occupations by Sex in Beach City
Management, Business, Science and Arts Occupations
The most common Management, Business, Science and Arts occupations in Beach City are Health Diagnosing & Treating (32 | 10.1%), Management (29 | 9.2%), Community & Social Service (16 | 5.1%), Health Technologists (16 | 5.1%), and Computers, Engineering & Science (12 | 3.8%).
Management, Business, Science and Arts Occupations by Sex
Within the Management, Business, Science and Arts occupations in Beach City, the most male-oriented occupations are Computers, Engineering & Science (100.0%), Computers & Mathematics (100.0%), and Life, Physical & Social Science (100.0%), while the most female-oriented occupations are Business & Financial (100.0%), Legal Services & Support (100.0%), and Arts, Media & Entertainment (100.0%).
| Occupation | Male | Female |
| Management | 14 (48.3%) | 15 (51.7%) |
| Business & Financial | 0 (0.0%) | 4 (100.0%) |
| Computers, Engineering & Science | 12 (100.0%) | 0 (0.0%) |
| Computers & Mathematics | 4 (100.0%) | 0 (0.0%) |
| Architecture & Engineering | 0 (0.0%) | 0 (0.0%) |
| Life, Physical & Social Science | 8 (100.0%) | 0 (0.0%) |
| Community & Social Service | 4 (25.0%) | 12 (75.0%) |
| Education, Arts & Media | 0 (0.0%) | 0 (0.0%) |
| Legal Services & Support | 0 (0.0%) | 1 (100.0%) |
| Education Instruction & Library | 4 (36.4%) | 7 (63.6%) |
| Arts, Media & Entertainment | 0 (0.0%) | 4 (100.0%) |
| Health Diagnosing & Treating | 0 (0.0%) | 32 (100.0%) |
| Health Technologists | 0 (0.0%) | 16 (100.0%) |
| Total (Category) | 30 (32.3%) | 63 (67.7%) |
| Total (Overall) | 171 (54.1%) | 145 (45.9%) |
Services Occupations
The most common Services occupations in Beach City are Food Preparation & Serving (38 | 12.0%), Cleaning & Maintenance (14 | 4.4%), Healthcare Support (3 | 0.9%), Security & Protection (3 | 0.9%), and Firefighting & Prevention (3 | 0.9%).
Services Occupations by Sex
Within the Services occupations in Beach City, the most male-oriented occupations are Healthcare Support (100.0%), Security & Protection (100.0%), and Firefighting & Prevention (100.0%), while the most female-oriented occupations are Food Preparation & Serving (73.7%), and Cleaning & Maintenance (64.3%).
| Occupation | Male | Female |
| Healthcare Support | 3 (100.0%) | 0 (0.0%) |
| Security & Protection | 3 (100.0%) | 0 (0.0%) |
| Firefighting & Prevention | 3 (100.0%) | 0 (0.0%) |
| Law Enforcement | 0 (0.0%) | 0 (0.0%) |
| Food Preparation & Serving | 10 (26.3%) | 28 (73.7%) |
| Cleaning & Maintenance | 5 (35.7%) | 9 (64.3%) |
| Personal Care & Service | 0 (0.0%) | 0 (0.0%) |
| Total (Category) | 21 (36.2%) | 37 (63.8%) |
| Total (Overall) | 171 (54.1%) | 145 (45.9%) |
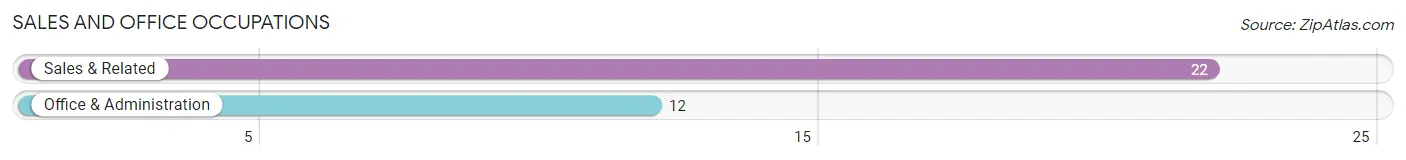
Sales and Office Occupations
The most common Sales and Office occupations in Beach City are Sales & Related (22 | 7.0%), and Office & Administration (12 | 3.8%).
Sales and Office Occupations by Sex
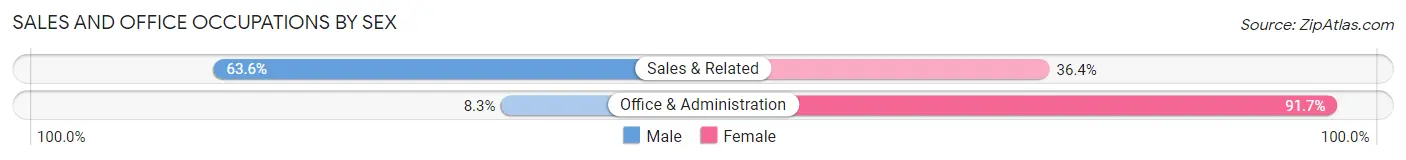
| Occupation | Male | Female |
| Sales & Related | 14 (63.6%) | 8 (36.4%) |
| Office & Administration | 1 (8.3%) | 11 (91.7%) |
| Total (Category) | 15 (44.1%) | 19 (55.9%) |
| Total (Overall) | 171 (54.1%) | 145 (45.9%) |
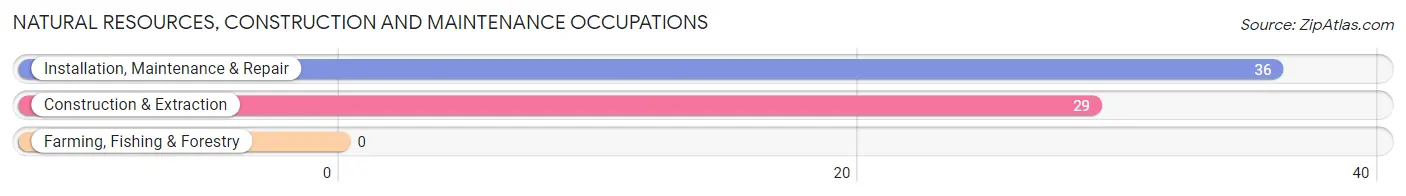
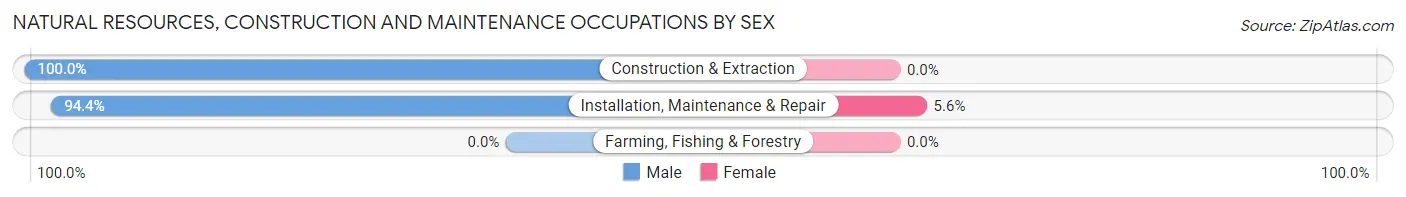
Natural Resources, Construction and Maintenance Occupations
The most common Natural Resources, Construction and Maintenance occupations in Beach City are Installation, Maintenance & Repair (36 | 11.4%), and Construction & Extraction (29 | 9.2%).
Natural Resources, Construction and Maintenance Occupations by Sex
| Occupation | Male | Female |
| Farming, Fishing & Forestry | 0 (0.0%) | 0 (0.0%) |
| Construction & Extraction | 29 (100.0%) | 0 (0.0%) |
| Installation, Maintenance & Repair | 34 (94.4%) | 2 (5.6%) |
| Total (Category) | 63 (96.9%) | 2 (3.1%) |
| Total (Overall) | 171 (54.1%) | 145 (45.9%) |
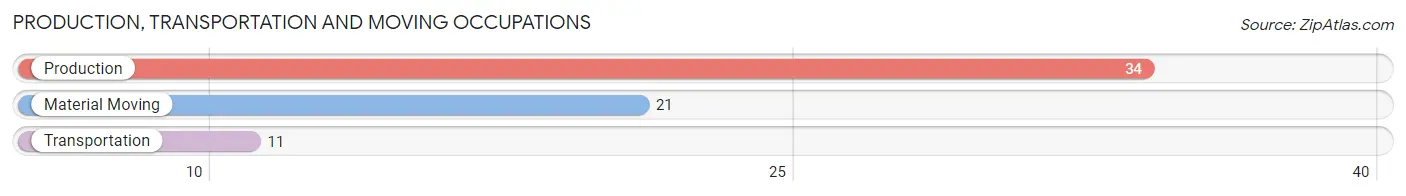
Production, Transportation and Moving Occupations
The most common Production, Transportation and Moving occupations in Beach City are Production (34 | 10.8%), Material Moving (21 | 6.7%), and Transportation (11 | 3.5%).
Production, Transportation and Moving Occupations by Sex
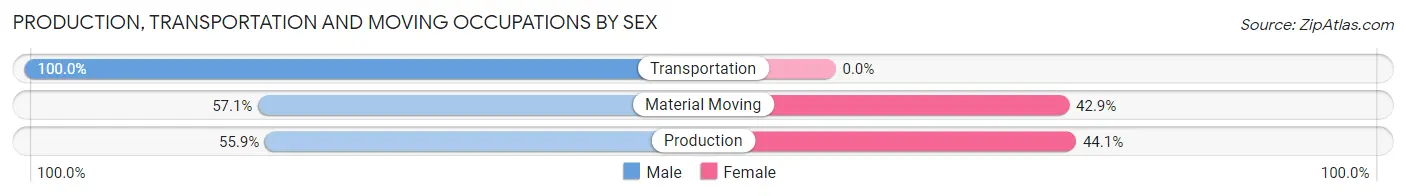
| Occupation | Male | Female |
| Production | 19 (55.9%) | 15 (44.1%) |
| Transportation | 11 (100.0%) | 0 (0.0%) |
| Material Moving | 12 (57.1%) | 9 (42.9%) |
| Total (Category) | 42 (63.6%) | 24 (36.4%) |
| Total (Overall) | 171 (54.1%) | 145 (45.9%) |
Employment Industries by Sex in Beach City
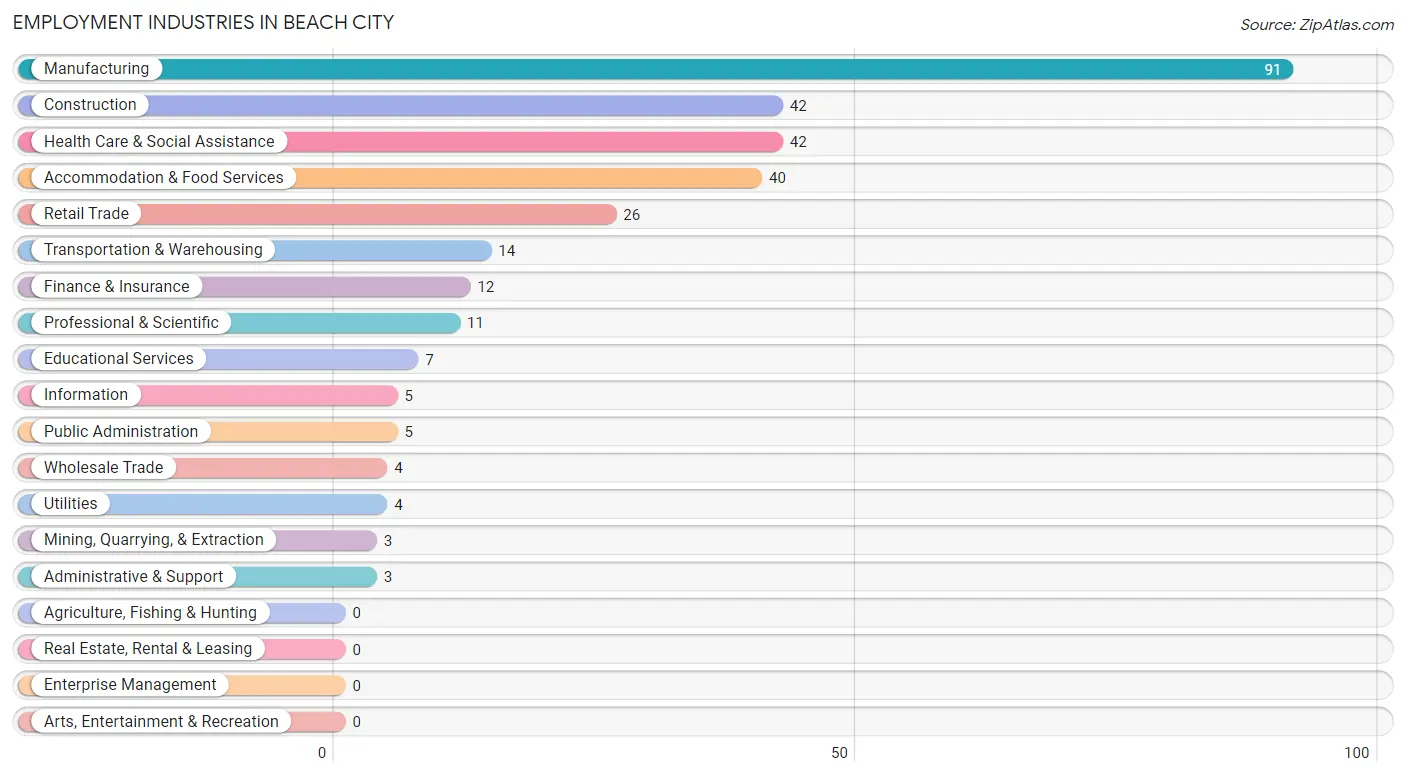
Employment Industries in Beach City
The major employment industries in Beach City include Manufacturing (91 | 28.8%), Construction (42 | 13.3%), Health Care & Social Assistance (42 | 13.3%), Accommodation & Food Services (40 | 12.7%), and Retail Trade (26 | 8.2%).
Employment Industries by Sex in Beach City
The Beach City industries that see more men than women are Mining, Quarrying, & Extraction (100.0%), Construction (100.0%), and Wholesale Trade (100.0%), whereas the industries that tend to have a higher number of women are Administrative & Support (100.0%), Educational Services (100.0%), and Public Administration (100.0%).
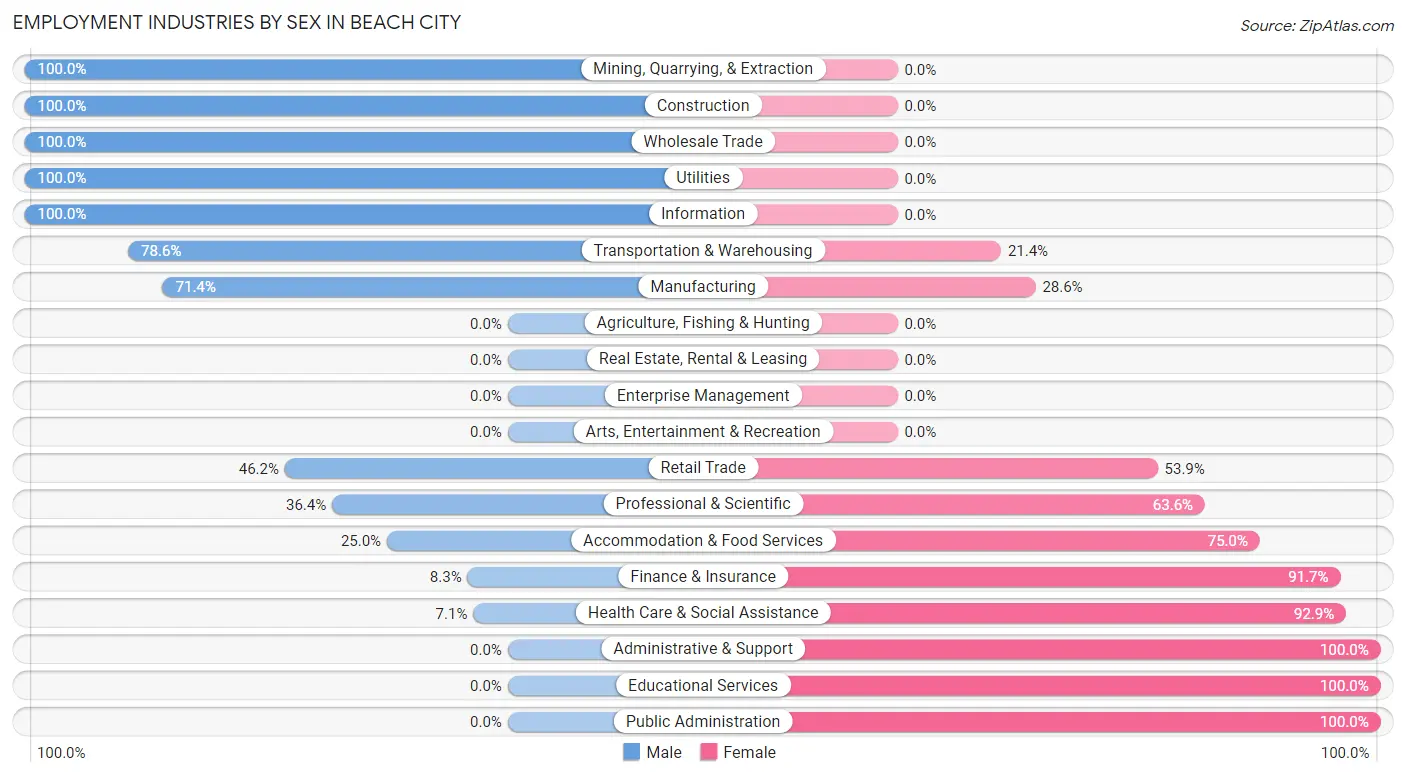
| Industry | Male | Female |
| Agriculture, Fishing & Hunting | 0 (0.0%) | 0 (0.0%) |
| Mining, Quarrying, & Extraction | 3 (100.0%) | 0 (0.0%) |
| Construction | 42 (100.0%) | 0 (0.0%) |
| Manufacturing | 65 (71.4%) | 26 (28.6%) |
| Wholesale Trade | 4 (100.0%) | 0 (0.0%) |
| Retail Trade | 12 (46.2%) | 14 (53.8%) |
| Transportation & Warehousing | 11 (78.6%) | 3 (21.4%) |
| Utilities | 4 (100.0%) | 0 (0.0%) |
| Information | 5 (100.0%) | 0 (0.0%) |
| Finance & Insurance | 1 (8.3%) | 11 (91.7%) |
| Real Estate, Rental & Leasing | 0 (0.0%) | 0 (0.0%) |
| Professional & Scientific | 4 (36.4%) | 7 (63.6%) |
| Enterprise Management | 0 (0.0%) | 0 (0.0%) |
| Administrative & Support | 0 (0.0%) | 3 (100.0%) |
| Educational Services | 0 (0.0%) | 7 (100.0%) |
| Health Care & Social Assistance | 3 (7.1%) | 39 (92.9%) |
| Arts, Entertainment & Recreation | 0 (0.0%) | 0 (0.0%) |
| Accommodation & Food Services | 10 (25.0%) | 30 (75.0%) |
| Public Administration | 0 (0.0%) | 5 (100.0%) |
| Total | 171 (54.1%) | 145 (45.9%) |
Education in Beach City
School Enrollment in Beach City
The most common levels of schooling among the 112 students in Beach City are middle school (27 | 24.1%), college / undergraduate (26 | 23.2%), and elementary school (24 | 21.4%).
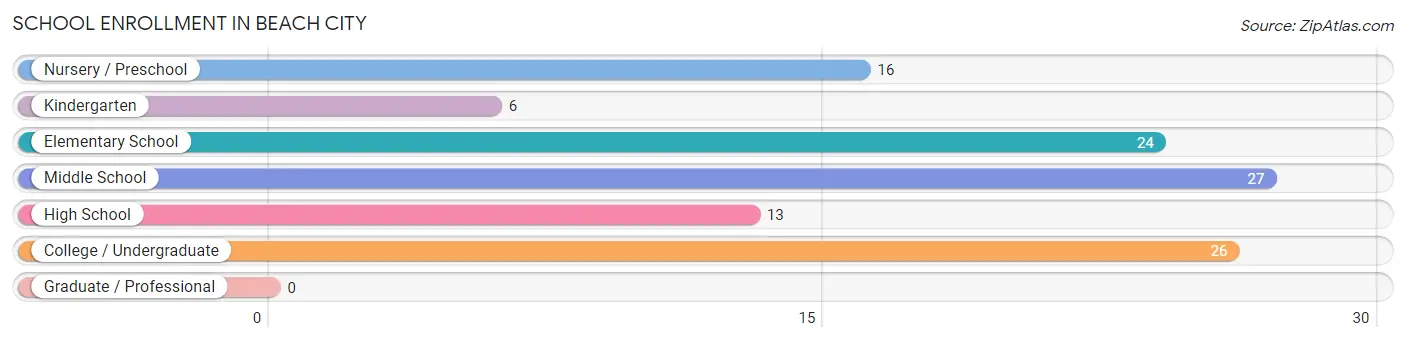
| School Level | # Students | % Students |
| Nursery / Preschool | 16 | 14.3% |
| Kindergarten | 6 | 5.4% |
| Elementary School | 24 | 21.4% |
| Middle School | 27 | 24.1% |
| High School | 13 | 11.6% |
| College / Undergraduate | 26 | 23.2% |
| Graduate / Professional | 0 | 0.0% |
| Total | 112 | 100.0% |
School Enrollment by Age by Funding Source in Beach City
Out of a total of 112 students who are enrolled in schools in Beach City, 3 (2.7%) attend a private institution, while the remaining 109 (97.3%) are enrolled in public schools. The age group of 5 to 9 year old has the highest likelihood of being enrolled in private schools, with 3 (9.1% in the age bracket) enrolled. Conversely, the age group of 3 to 4 year olds has the lowest likelihood of being enrolled in a private school, with 13 (100.0% in the age bracket) attending a public institution.
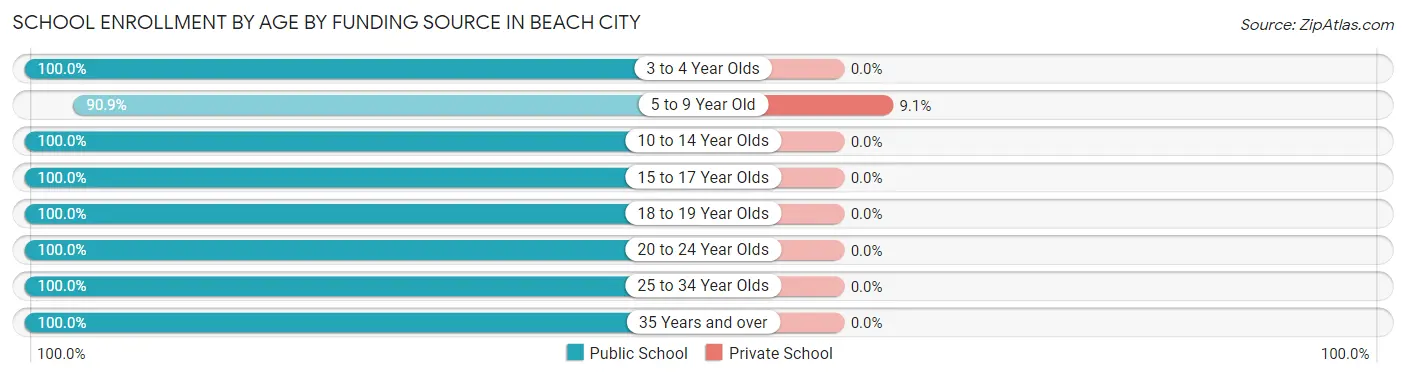
| Age Bracket | Public School | Private School |
| 3 to 4 Year Olds | 13 (100.0%) | 0 (0.0%) |
| 5 to 9 Year Old | 30 (90.9%) | 3 (9.1%) |
| 10 to 14 Year Olds | 27 (100.0%) | 0 (0.0%) |
| 15 to 17 Year Olds | 3 (100.0%) | 0 (0.0%) |
| 18 to 19 Year Olds | 10 (100.0%) | 0 (0.0%) |
| 20 to 24 Year Olds | 17 (100.0%) | 0 (0.0%) |
| 25 to 34 Year Olds | 7 (100.0%) | 0 (0.0%) |
| 35 Years and over | 2 (100.0%) | 0 (0.0%) |
| Total | 109 (97.3%) | 3 (2.7%) |
Educational Attainment by Field of Study in Beach City
Bio, nature & agricultural (8 | 26.7%), business (7 | 23.3%), liberal arts & history (5 | 16.7%), psychology (4 | 13.3%), and education (4 | 13.3%) are the most common fields of study among 30 individuals in Beach City who have obtained a bachelor's degree or higher.
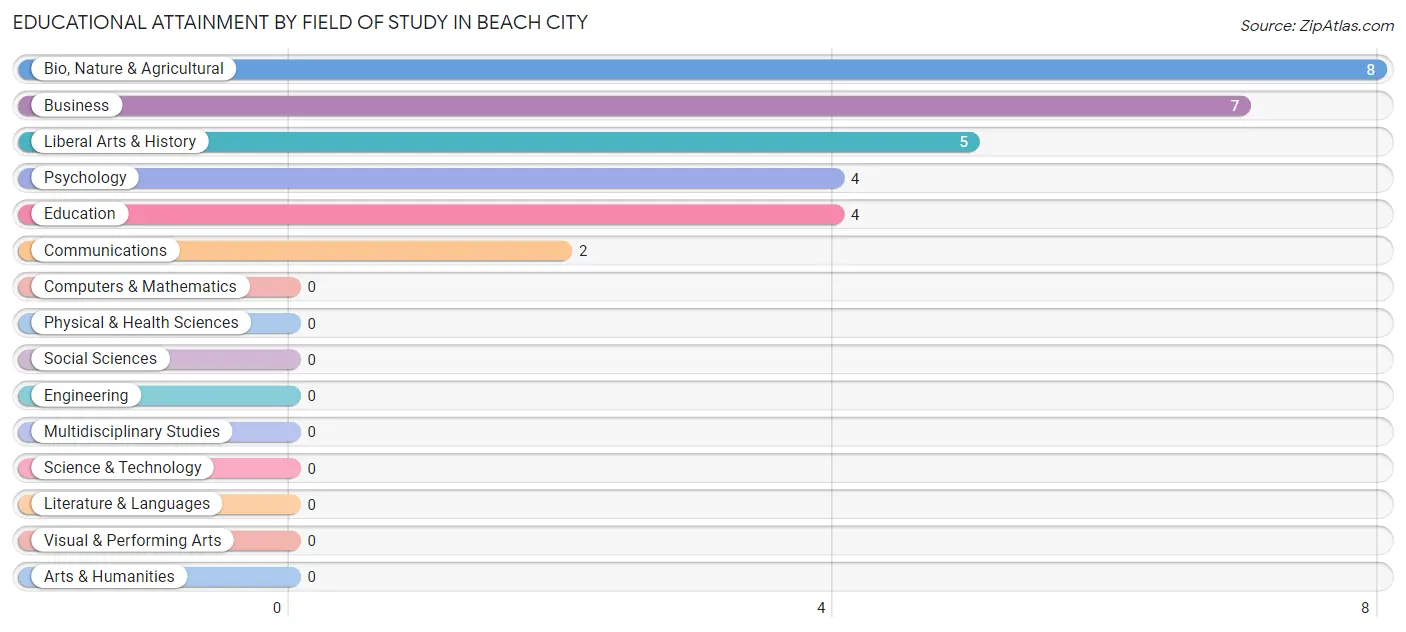
| Field of Study | # Graduates | % Graduates |
| Computers & Mathematics | 0 | 0.0% |
| Bio, Nature & Agricultural | 8 | 26.7% |
| Physical & Health Sciences | 0 | 0.0% |
| Psychology | 4 | 13.3% |
| Social Sciences | 0 | 0.0% |
| Engineering | 0 | 0.0% |
| Multidisciplinary Studies | 0 | 0.0% |
| Science & Technology | 0 | 0.0% |
| Business | 7 | 23.3% |
| Education | 4 | 13.3% |
| Literature & Languages | 0 | 0.0% |
| Liberal Arts & History | 5 | 16.7% |
| Visual & Performing Arts | 0 | 0.0% |
| Communications | 2 | 6.7% |
| Arts & Humanities | 0 | 0.0% |
| Total | 30 | 100.0% |
Transportation & Commute in Beach City
Vehicle Availability by Sex in Beach City
The most prevalent vehicle ownership categories in Beach City are males with 2 vehicles (63, accounting for 37.5%) and females with 2 vehicles (28, making up 47.0%).
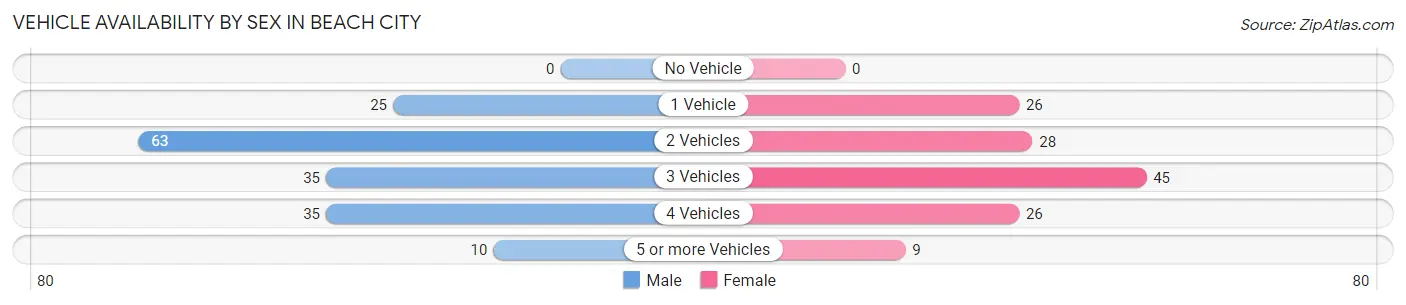
| Vehicles Available | Male | Female |
| No Vehicle | 0 (0.0%) | 0 (0.0%) |
| 1 Vehicle | 25 (14.9%) | 26 (19.4%) |
| 2 Vehicles | 63 (37.5%) | 28 (20.9%) |
| 3 Vehicles | 35 (20.8%) | 45 (33.6%) |
| 4 Vehicles | 35 (20.8%) | 26 (19.4%) |
| 5 or more Vehicles | 10 (5.9%) | 9 (6.7%) |
| Total | 168 (100.0%) | 134 (100.0%) |
Commute Time in Beach City
The most frequently occuring commute durations in Beach City are 10 to 14 minutes (45 commuters, 16.2%), 30 to 34 minutes (42 commuters, 15.1%), and 20 to 24 minutes (36 commuters, 13.0%).
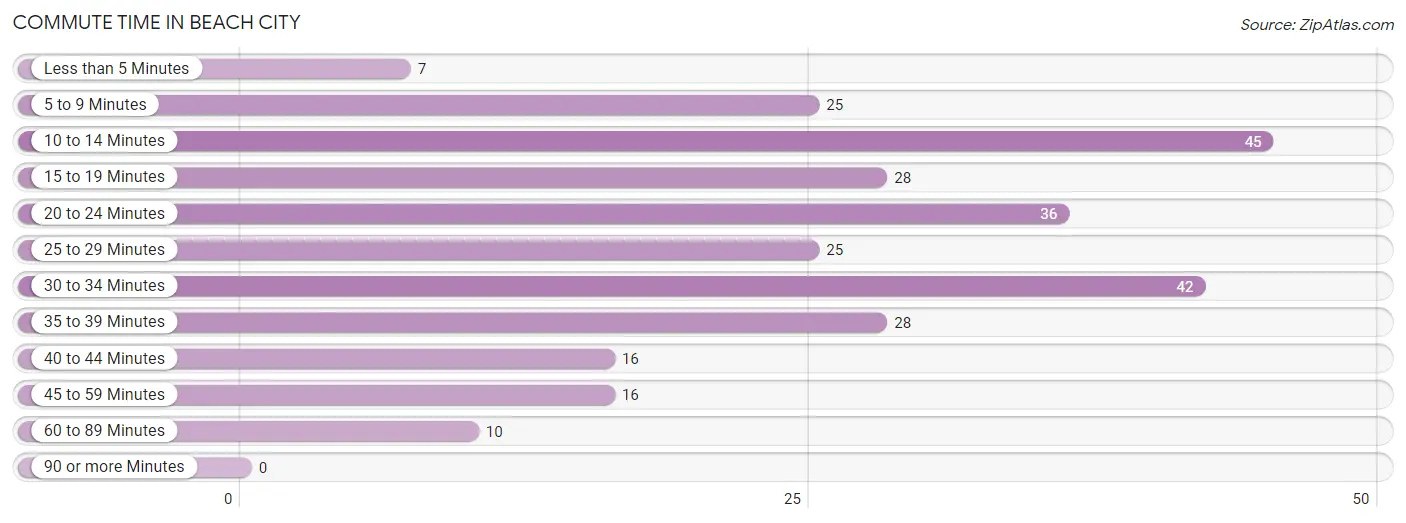
| Commute Time | # Commuters | % Commuters |
| Less than 5 Minutes | 7 | 2.5% |
| 5 to 9 Minutes | 25 | 9.0% |
| 10 to 14 Minutes | 45 | 16.2% |
| 15 to 19 Minutes | 28 | 10.1% |
| 20 to 24 Minutes | 36 | 13.0% |
| 25 to 29 Minutes | 25 | 9.0% |
| 30 to 34 Minutes | 42 | 15.1% |
| 35 to 39 Minutes | 28 | 10.1% |
| 40 to 44 Minutes | 16 | 5.8% |
| 45 to 59 Minutes | 16 | 5.8% |
| 60 to 89 Minutes | 10 | 3.6% |
| 90 or more Minutes | 0 | 0.0% |
Commute Time by Sex in Beach City
The most common commute times in Beach City are 10 to 14 minutes (31 commuters, 20.5%) for males and 5 to 9 minutes (23 commuters, 18.1%) for females.
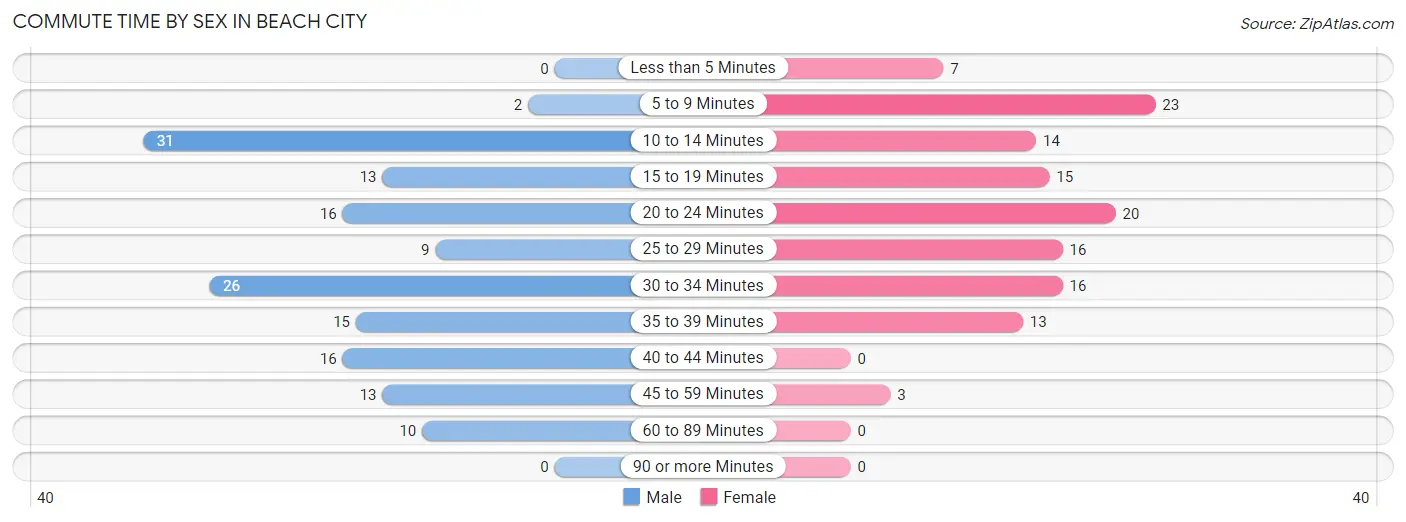
| Commute Time | Male | Female |
| Less than 5 Minutes | 0 (0.0%) | 7 (5.5%) |
| 5 to 9 Minutes | 2 (1.3%) | 23 (18.1%) |
| 10 to 14 Minutes | 31 (20.5%) | 14 (11.0%) |
| 15 to 19 Minutes | 13 (8.6%) | 15 (11.8%) |
| 20 to 24 Minutes | 16 (10.6%) | 20 (15.8%) |
| 25 to 29 Minutes | 9 (6.0%) | 16 (12.6%) |
| 30 to 34 Minutes | 26 (17.2%) | 16 (12.6%) |
| 35 to 39 Minutes | 15 (9.9%) | 13 (10.2%) |
| 40 to 44 Minutes | 16 (10.6%) | 0 (0.0%) |
| 45 to 59 Minutes | 13 (8.6%) | 3 (2.4%) |
| 60 to 89 Minutes | 10 (6.6%) | 0 (0.0%) |
| 90 or more Minutes | 0 (0.0%) | 0 (0.0%) |
Time of Departure to Work by Sex in Beach City
The most frequent times of departure to work in Beach City are 5:30 AM to 5:59 AM (33, 21.8%) for males and 7:00 AM to 7:29 AM (35, 27.6%) for females.
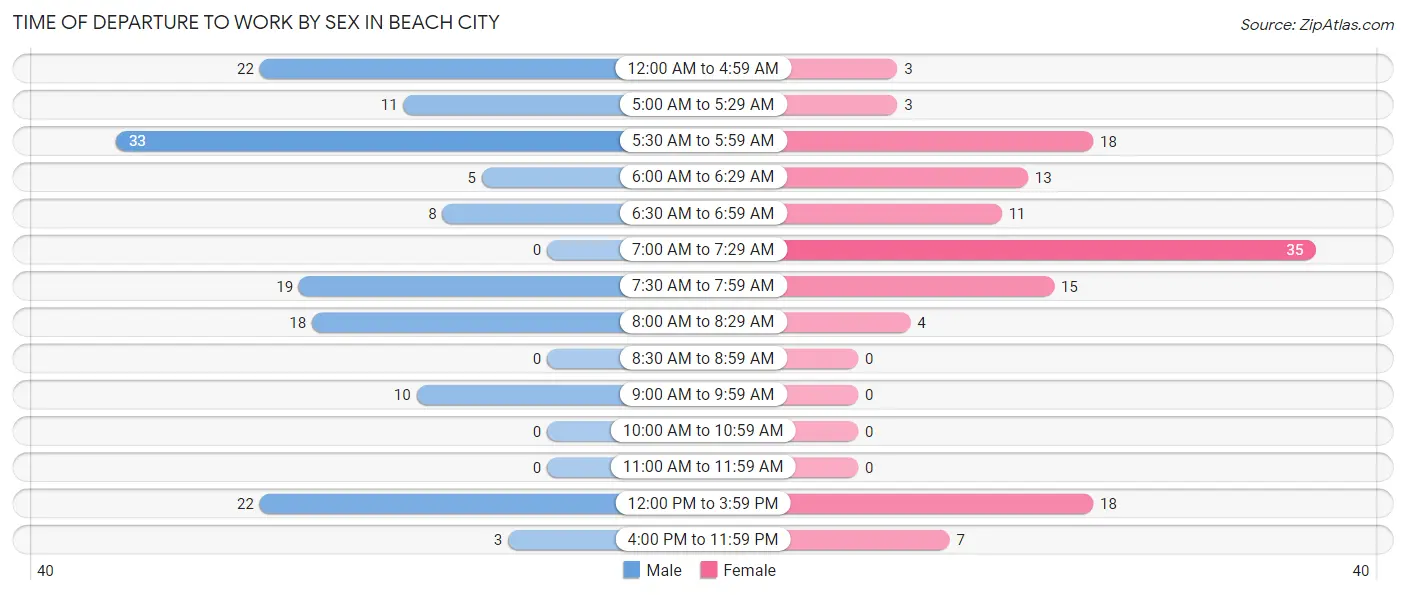
| Time of Departure | Male | Female |
| 12:00 AM to 4:59 AM | 22 (14.6%) | 3 (2.4%) |
| 5:00 AM to 5:29 AM | 11 (7.3%) | 3 (2.4%) |
| 5:30 AM to 5:59 AM | 33 (21.8%) | 18 (14.2%) |
| 6:00 AM to 6:29 AM | 5 (3.3%) | 13 (10.2%) |
| 6:30 AM to 6:59 AM | 8 (5.3%) | 11 (8.7%) |
| 7:00 AM to 7:29 AM | 0 (0.0%) | 35 (27.6%) |
| 7:30 AM to 7:59 AM | 19 (12.6%) | 15 (11.8%) |
| 8:00 AM to 8:29 AM | 18 (11.9%) | 4 (3.2%) |
| 8:30 AM to 8:59 AM | 0 (0.0%) | 0 (0.0%) |
| 9:00 AM to 9:59 AM | 10 (6.6%) | 0 (0.0%) |
| 10:00 AM to 10:59 AM | 0 (0.0%) | 0 (0.0%) |
| 11:00 AM to 11:59 AM | 0 (0.0%) | 0 (0.0%) |
| 12:00 PM to 3:59 PM | 22 (14.6%) | 18 (14.2%) |
| 4:00 PM to 11:59 PM | 3 (2.0%) | 7 (5.5%) |
| Total | 151 (100.0%) | 127 (100.0%) |
Housing Occupancy in Beach City
Occupancy by Ownership in Beach City
Of the total 289 dwellings in Beach City, owner-occupied units account for 164 (56.8%), while renter-occupied units make up 125 (43.2%).
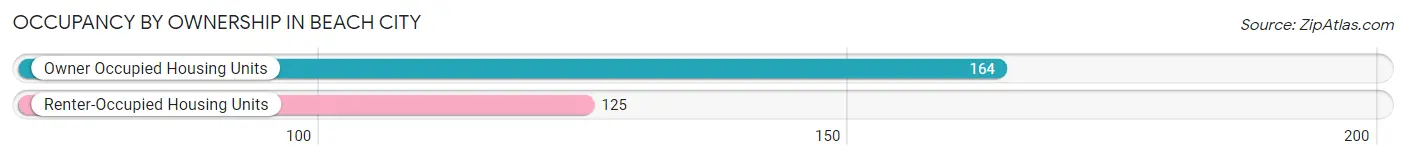
| Occupancy | # Housing Units | % Housing Units |
| Owner Occupied Housing Units | 164 | 56.8% |
| Renter-Occupied Housing Units | 125 | 43.2% |
| Total Occupied Housing Units | 289 | 100.0% |
Occupancy by Household Size in Beach City
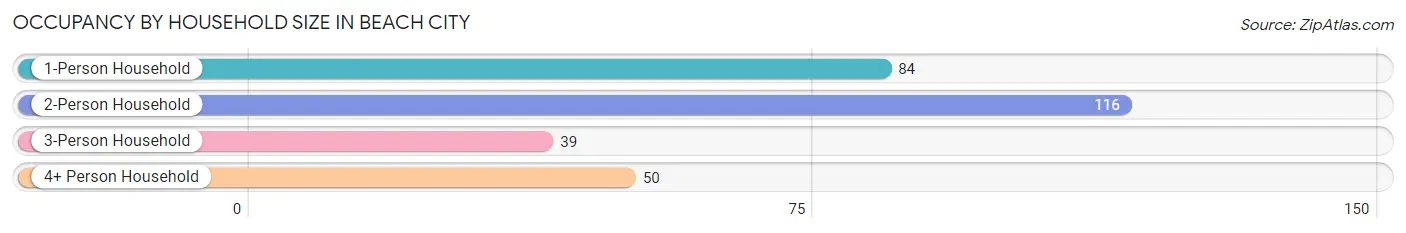
| Household Size | # Housing Units | % Housing Units |
| 1-Person Household | 84 | 29.1% |
| 2-Person Household | 116 | 40.1% |
| 3-Person Household | 39 | 13.5% |
| 4+ Person Household | 50 | 17.3% |
| Total Housing Units | 289 | 100.0% |
Occupancy by Ownership by Household Size in Beach City
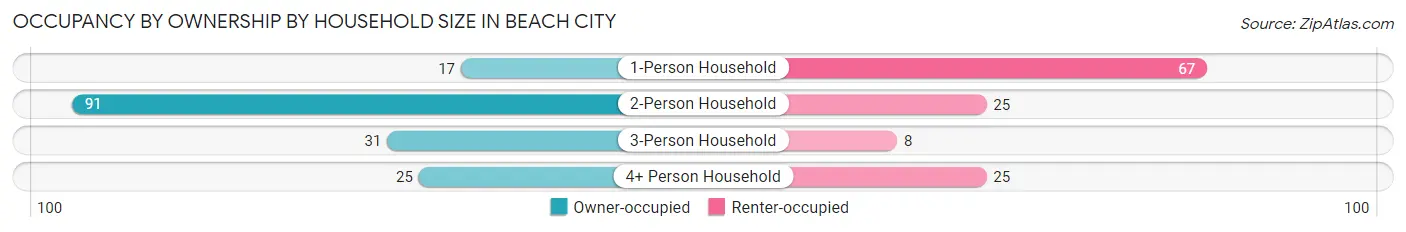
| Household Size | Owner-occupied | Renter-occupied |
| 1-Person Household | 17 (20.2%) | 67 (79.8%) |
| 2-Person Household | 91 (78.4%) | 25 (21.5%) |
| 3-Person Household | 31 (79.5%) | 8 (20.5%) |
| 4+ Person Household | 25 (50.0%) | 25 (50.0%) |
| Total Housing Units | 164 (56.8%) | 125 (43.2%) |
Occupancy by Educational Attainment in Beach City
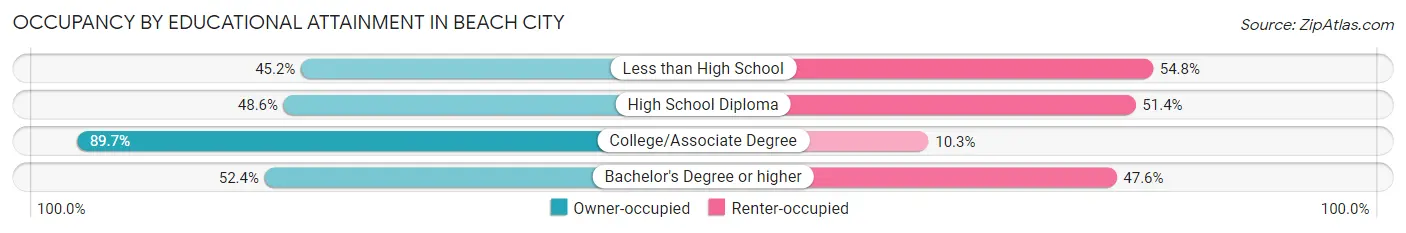
| Household Size | Owner-occupied | Renter-occupied |
| Less than High School | 14 (45.2%) | 17 (54.8%) |
| High School Diploma | 87 (48.6%) | 92 (51.4%) |
| College/Associate Degree | 52 (89.7%) | 6 (10.3%) |
| Bachelor's Degree or higher | 11 (52.4%) | 10 (47.6%) |
Occupancy by Age of Householder in Beach City
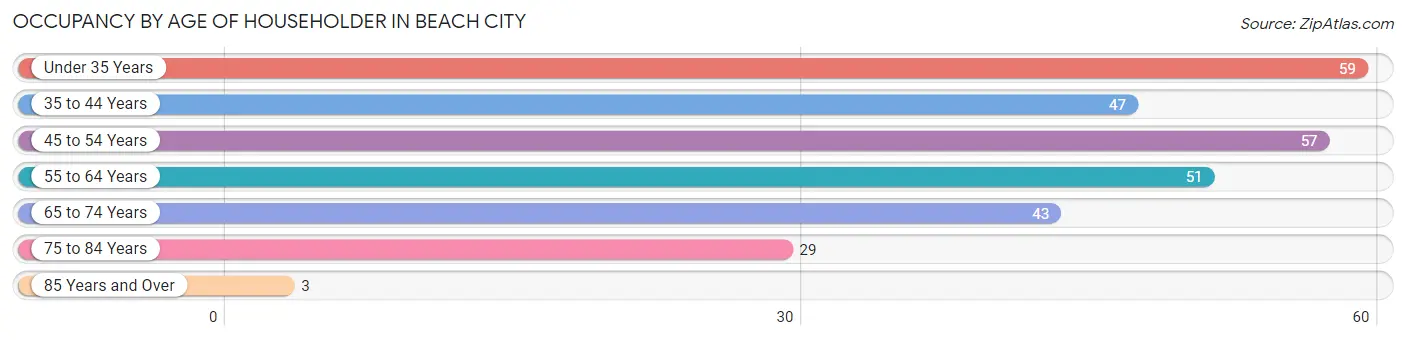
| Age Bracket | # Households | % Households |
| Under 35 Years | 59 | 20.4% |
| 35 to 44 Years | 47 | 16.3% |
| 45 to 54 Years | 57 | 19.7% |
| 55 to 64 Years | 51 | 17.6% |
| 65 to 74 Years | 43 | 14.9% |
| 75 to 84 Years | 29 | 10.0% |
| 85 Years and Over | 3 | 1.0% |
| Total | 289 | 100.0% |
Housing Finances in Beach City
Median Income by Occupancy in Beach City
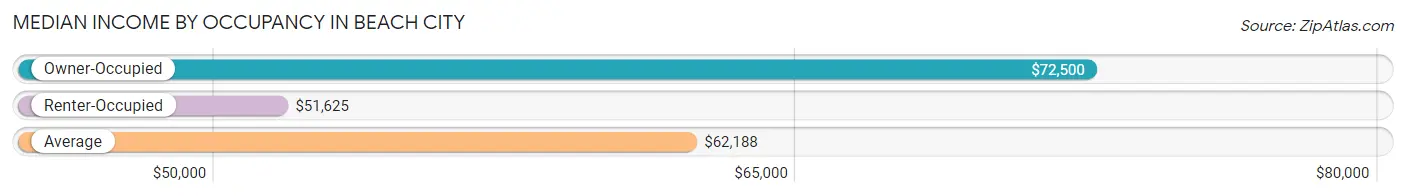
| Occupancy Type | # Households | Median Income |
| Owner-Occupied | 164 (56.8%) | $72,500 |
| Renter-Occupied | 125 (43.2%) | $51,625 |
| Average | 289 (100.0%) | $62,188 |
Occupancy by Householder Income Bracket in Beach City
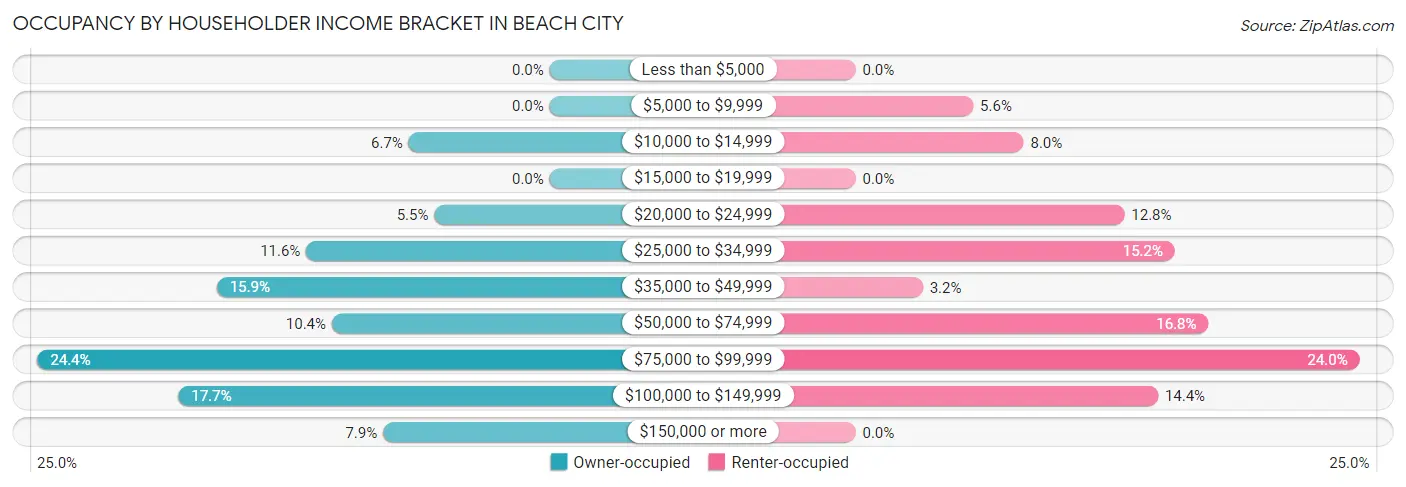
| Income Bracket | Owner-occupied | Renter-occupied |
| Less than $5,000 | 0 (0.0%) | 0 (0.0%) |
| $5,000 to $9,999 | 0 (0.0%) | 7 (5.6%) |
| $10,000 to $14,999 | 11 (6.7%) | 10 (8.0%) |
| $15,000 to $19,999 | 0 (0.0%) | 0 (0.0%) |
| $20,000 to $24,999 | 9 (5.5%) | 16 (12.8%) |
| $25,000 to $34,999 | 19 (11.6%) | 19 (15.2%) |
| $35,000 to $49,999 | 26 (15.9%) | 4 (3.2%) |
| $50,000 to $74,999 | 17 (10.4%) | 21 (16.8%) |
| $75,000 to $99,999 | 40 (24.4%) | 30 (24.0%) |
| $100,000 to $149,999 | 29 (17.7%) | 18 (14.4%) |
| $150,000 or more | 13 (7.9%) | 0 (0.0%) |
| Total | 164 (100.0%) | 125 (100.0%) |
Monthly Housing Cost Tiers in Beach City
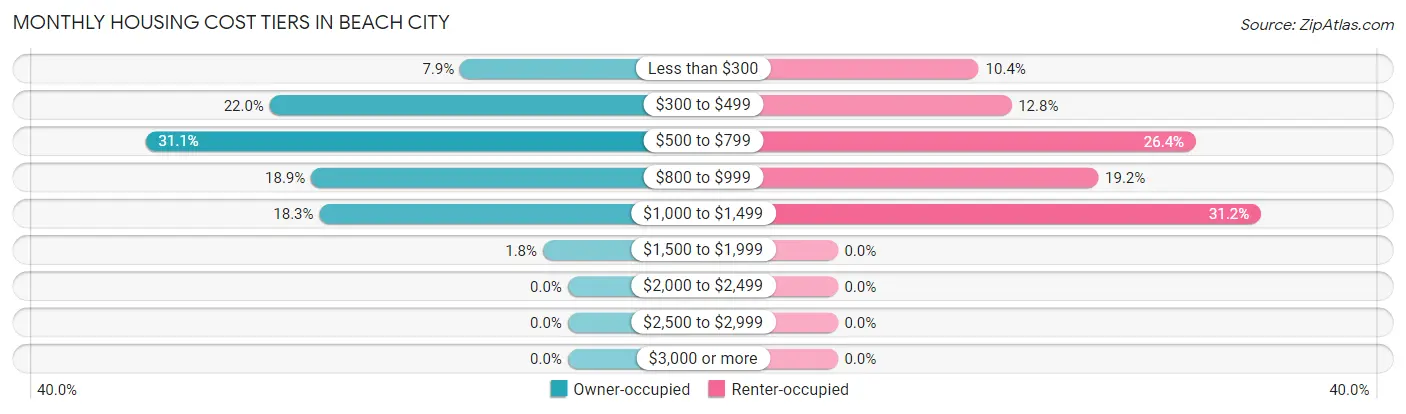
| Monthly Cost | Owner-occupied | Renter-occupied |
| Less than $300 | 13 (7.9%) | 13 (10.4%) |
| $300 to $499 | 36 (22.0%) | 16 (12.8%) |
| $500 to $799 | 51 (31.1%) | 33 (26.4%) |
| $800 to $999 | 31 (18.9%) | 24 (19.2%) |
| $1,000 to $1,499 | 30 (18.3%) | 39 (31.2%) |
| $1,500 to $1,999 | 3 (1.8%) | 0 (0.0%) |
| $2,000 to $2,499 | 0 (0.0%) | 0 (0.0%) |
| $2,500 to $2,999 | 0 (0.0%) | 0 (0.0%) |
| $3,000 or more | 0 (0.0%) | 0 (0.0%) |
| Total | 164 (100.0%) | 125 (100.0%) |
Physical Housing Characteristics in Beach City
Housing Structures in Beach City
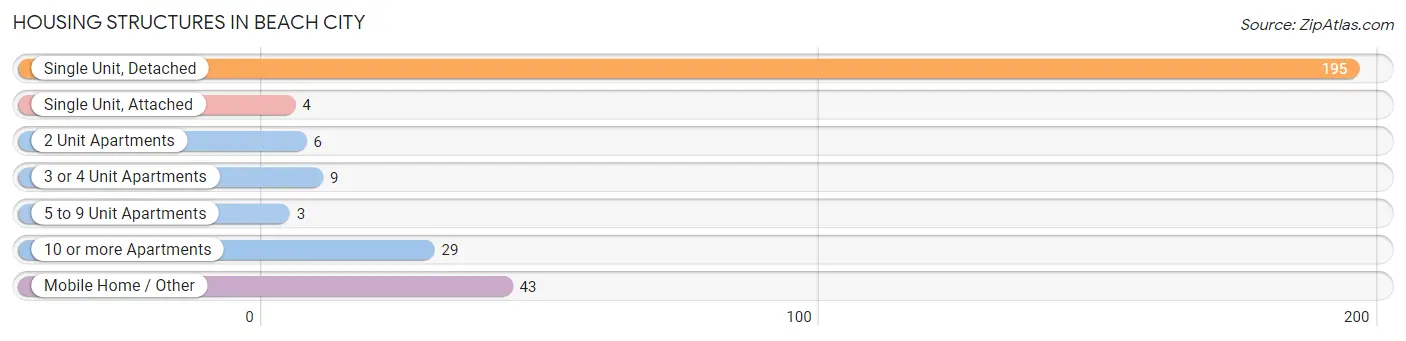
| Structure Type | # Housing Units | % Housing Units |
| Single Unit, Detached | 195 | 67.5% |
| Single Unit, Attached | 4 | 1.4% |
| 2 Unit Apartments | 6 | 2.1% |
| 3 or 4 Unit Apartments | 9 | 3.1% |
| 5 to 9 Unit Apartments | 3 | 1.0% |
| 10 or more Apartments | 29 | 10.0% |
| Mobile Home / Other | 43 | 14.9% |
| Total | 289 | 100.0% |
Housing Structures by Occupancy in Beach City
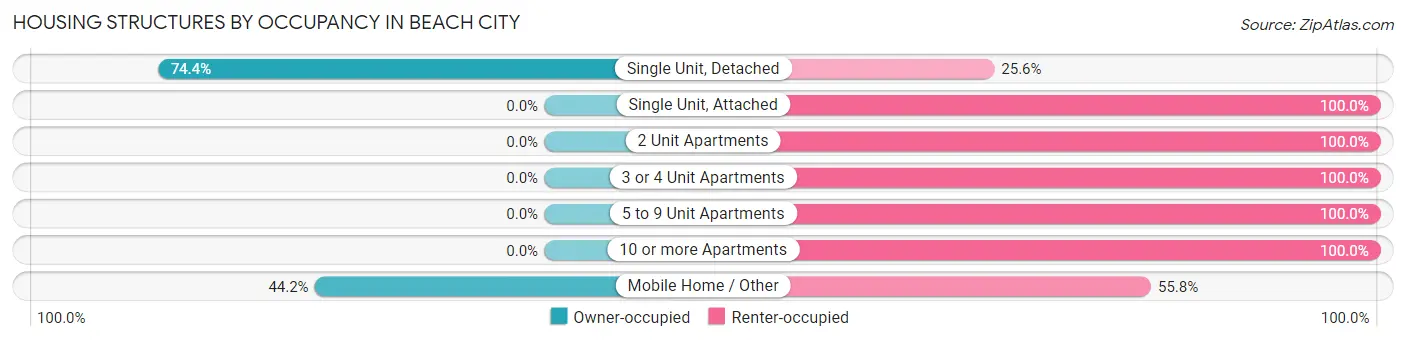
| Structure Type | Owner-occupied | Renter-occupied |
| Single Unit, Detached | 145 (74.4%) | 50 (25.6%) |
| Single Unit, Attached | 0 (0.0%) | 4 (100.0%) |
| 2 Unit Apartments | 0 (0.0%) | 6 (100.0%) |
| 3 or 4 Unit Apartments | 0 (0.0%) | 9 (100.0%) |
| 5 to 9 Unit Apartments | 0 (0.0%) | 3 (100.0%) |
| 10 or more Apartments | 0 (0.0%) | 29 (100.0%) |
| Mobile Home / Other | 19 (44.2%) | 24 (55.8%) |
| Total | 164 (56.8%) | 125 (43.2%) |
Housing Structures by Number of Rooms in Beach City
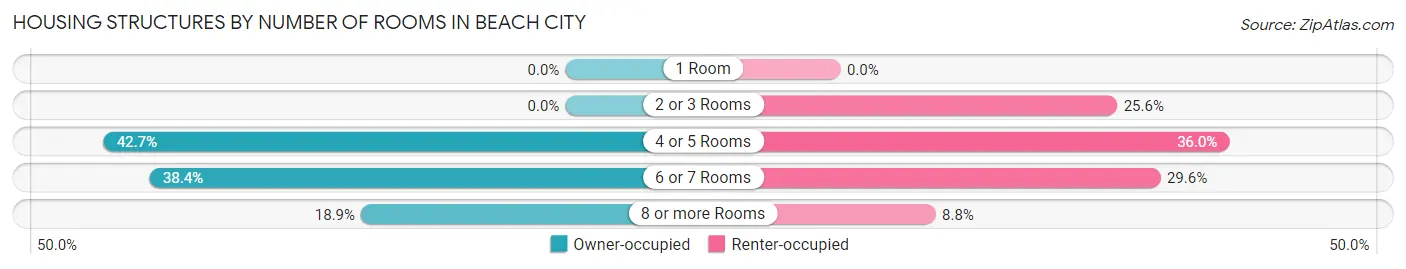
| Number of Rooms | Owner-occupied | Renter-occupied |
| 1 Room | 0 (0.0%) | 0 (0.0%) |
| 2 or 3 Rooms | 0 (0.0%) | 32 (25.6%) |
| 4 or 5 Rooms | 70 (42.7%) | 45 (36.0%) |
| 6 or 7 Rooms | 63 (38.4%) | 37 (29.6%) |
| 8 or more Rooms | 31 (18.9%) | 11 (8.8%) |
| Total | 164 (100.0%) | 125 (100.0%) |
Housing Structure by Heating Type in Beach City
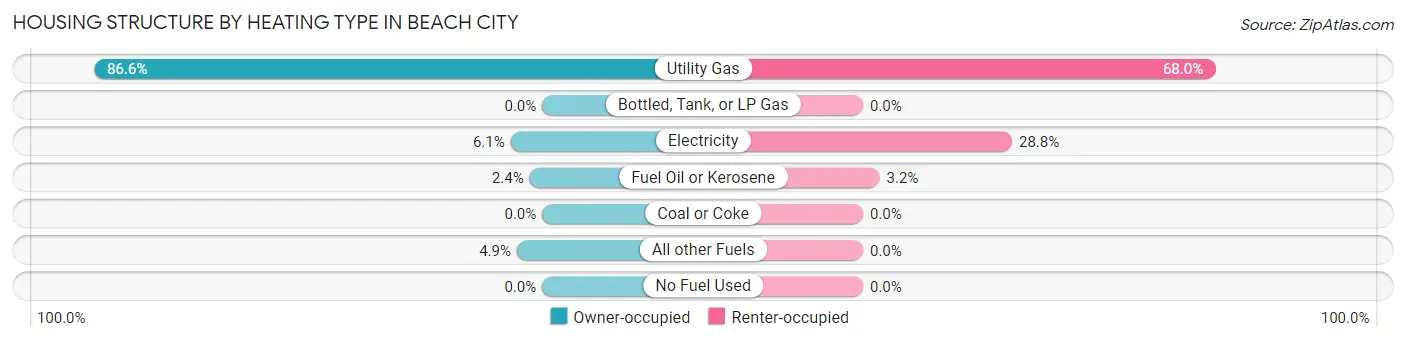
| Heating Type | Owner-occupied | Renter-occupied |
| Utility Gas | 142 (86.6%) | 85 (68.0%) |
| Bottled, Tank, or LP Gas | 0 (0.0%) | 0 (0.0%) |
| Electricity | 10 (6.1%) | 36 (28.8%) |
| Fuel Oil or Kerosene | 4 (2.4%) | 4 (3.2%) |
| Coal or Coke | 0 (0.0%) | 0 (0.0%) |
| All other Fuels | 8 (4.9%) | 0 (0.0%) |
| No Fuel Used | 0 (0.0%) | 0 (0.0%) |
| Total | 164 (100.0%) | 125 (100.0%) |
Household Vehicle Usage in Beach City
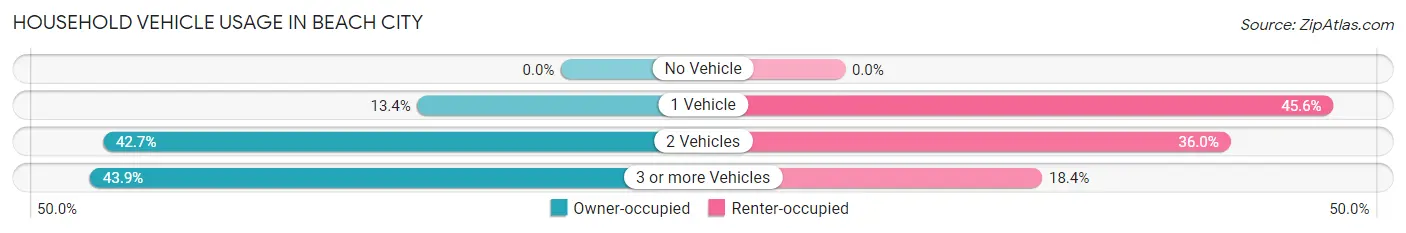
| Vehicles per Household | Owner-occupied | Renter-occupied |
| No Vehicle | 0 (0.0%) | 0 (0.0%) |
| 1 Vehicle | 22 (13.4%) | 57 (45.6%) |
| 2 Vehicles | 70 (42.7%) | 45 (36.0%) |
| 3 or more Vehicles | 72 (43.9%) | 23 (18.4%) |
| Total | 164 (100.0%) | 125 (100.0%) |
Real Estate & Mortgages in Beach City
Real Estate and Mortgage Overview in Beach City
| Characteristic | Without Mortgage | With Mortgage |
| Housing Units | 82 | 82 |
| Median Property Value | $118,400 | $101,400 |
| Median Household Income | $48,750 | $13 |
| Monthly Housing Costs | $457 | $0 |
| Real Estate Taxes | $1,250 | $0 |
Property Value by Mortgage Status in Beach City
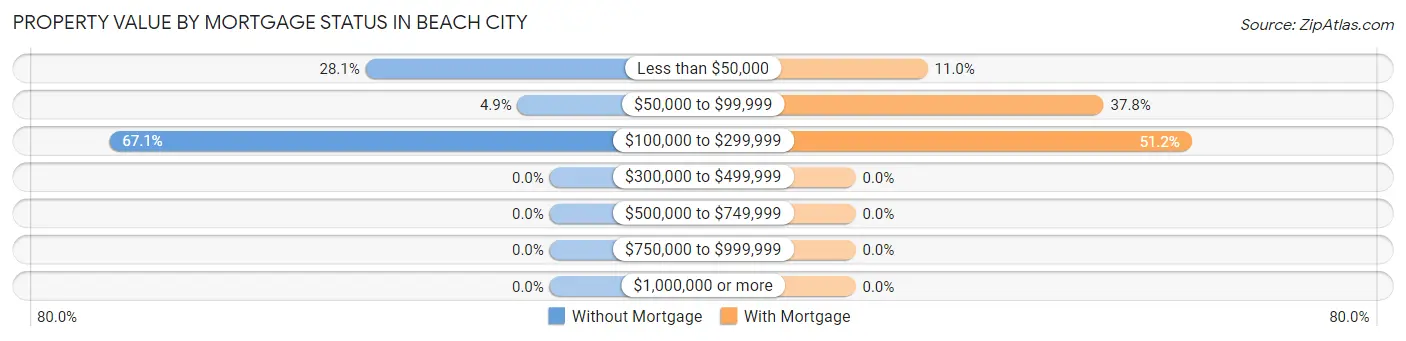
| Property Value | Without Mortgage | With Mortgage |
| Less than $50,000 | 23 (28.1%) | 9 (11.0%) |
| $50,000 to $99,999 | 4 (4.9%) | 31 (37.8%) |
| $100,000 to $299,999 | 55 (67.1%) | 42 (51.2%) |
| $300,000 to $499,999 | 0 (0.0%) | 0 (0.0%) |
| $500,000 to $749,999 | 0 (0.0%) | 0 (0.0%) |
| $750,000 to $999,999 | 0 (0.0%) | 0 (0.0%) |
| $1,000,000 or more | 0 (0.0%) | 0 (0.0%) |
| Total | 82 (100.0%) | 82 (100.0%) |
Household Income by Mortgage Status in Beach City
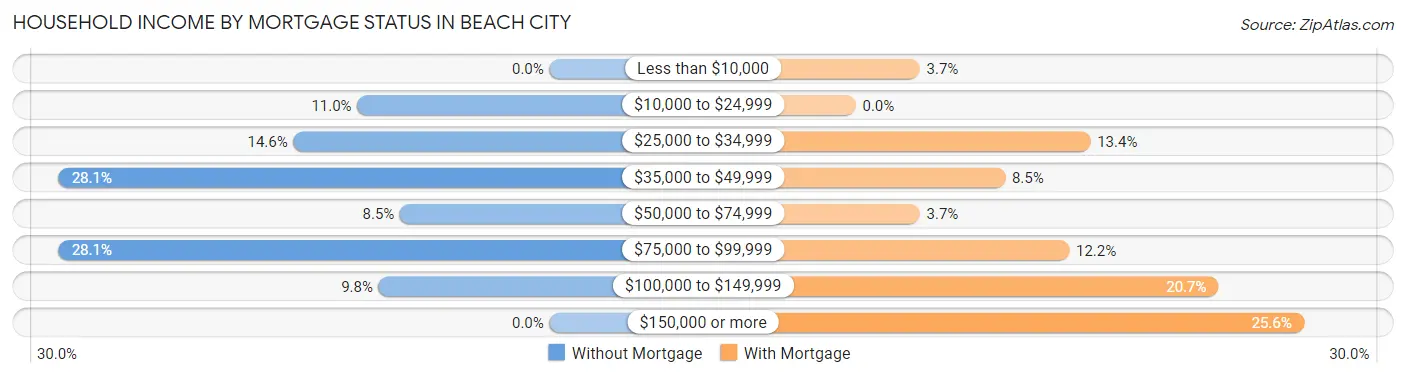
| Household Income | Without Mortgage | With Mortgage |
| Less than $10,000 | 0 (0.0%) | 3 (3.7%) |
| $10,000 to $24,999 | 9 (11.0%) | 0 (0.0%) |
| $25,000 to $34,999 | 12 (14.6%) | 11 (13.4%) |
| $35,000 to $49,999 | 23 (28.1%) | 7 (8.5%) |
| $50,000 to $74,999 | 7 (8.5%) | 3 (3.7%) |
| $75,000 to $99,999 | 23 (28.1%) | 10 (12.2%) |
| $100,000 to $149,999 | 8 (9.8%) | 17 (20.7%) |
| $150,000 or more | 0 (0.0%) | 21 (25.6%) |
| Total | 82 (100.0%) | 82 (100.0%) |
Property Value to Household Income Ratio in Beach City
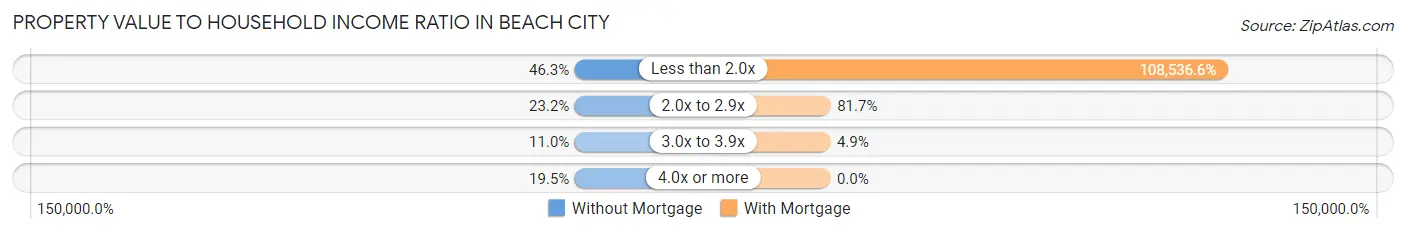
| Value-to-Income Ratio | Without Mortgage | With Mortgage |
| Less than 2.0x | 38 (46.3%) | 89,000 (108,536.6%) |
| 2.0x to 2.9x | 19 (23.2%) | 67 (81.7%) |
| 3.0x to 3.9x | 9 (11.0%) | 4 (4.9%) |
| 4.0x or more | 16 (19.5%) | 0 (0.0%) |
| Total | 82 (100.0%) | 82 (100.0%) |
Real Estate Taxes by Mortgage Status in Beach City
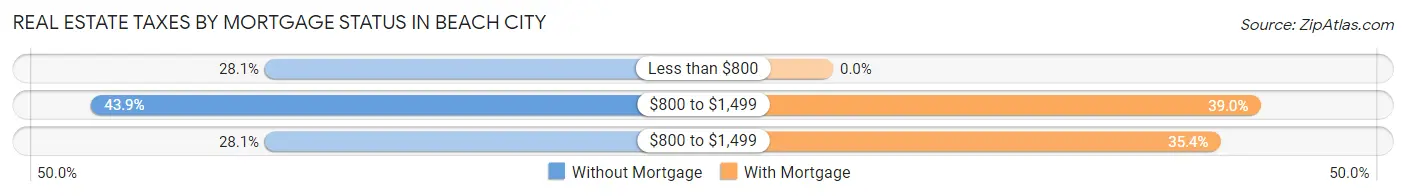
| Property Taxes | Without Mortgage | With Mortgage |
| Less than $800 | 23 (28.1%) | 0 (0.0%) |
| $800 to $1,499 | 36 (43.9%) | 32 (39.0%) |
| $800 to $1,499 | 23 (28.1%) | 29 (35.4%) |
| Total | 82 (100.0%) | 82 (100.0%) |
Health & Disability in Beach City
Health Insurance Coverage by Age in Beach City
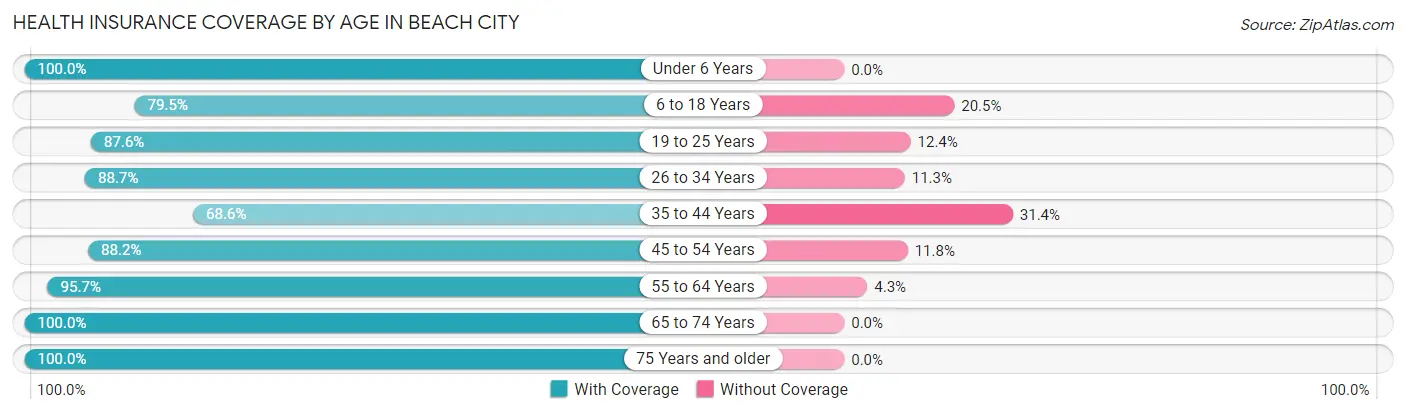
| Age Bracket | With Coverage | Without Coverage |
| Under 6 Years | 33 (100.0%) | 0 (0.0%) |
| 6 to 18 Years | 62 (79.5%) | 16 (20.5%) |
| 19 to 25 Years | 85 (87.6%) | 12 (12.4%) |
| 26 to 34 Years | 55 (88.7%) | 7 (11.3%) |
| 35 to 44 Years | 48 (68.6%) | 22 (31.4%) |
| 45 to 54 Years | 82 (88.2%) | 11 (11.8%) |
| 55 to 64 Years | 89 (95.7%) | 4 (4.3%) |
| 65 to 74 Years | 87 (100.0%) | 0 (0.0%) |
| 75 Years and older | 45 (100.0%) | 0 (0.0%) |
| Total | 586 (89.1%) | 72 (10.9%) |
Health Insurance Coverage by Citizenship Status in Beach City
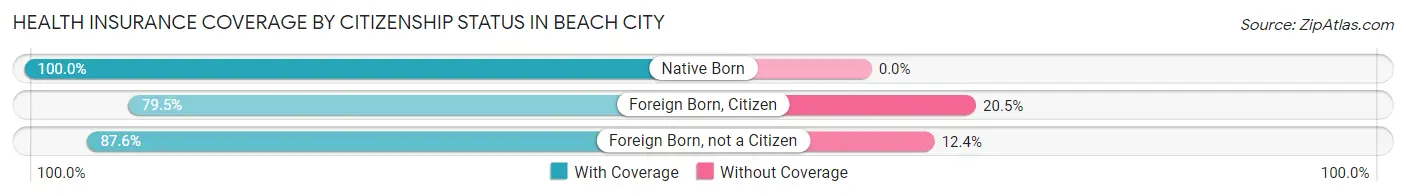
| Citizenship Status | With Coverage | Without Coverage |
| Native Born | 33 (100.0%) | 0 (0.0%) |
| Foreign Born, Citizen | 62 (79.5%) | 16 (20.5%) |
| Foreign Born, not a Citizen | 85 (87.6%) | 12 (12.4%) |
Health Insurance Coverage by Household Income in Beach City
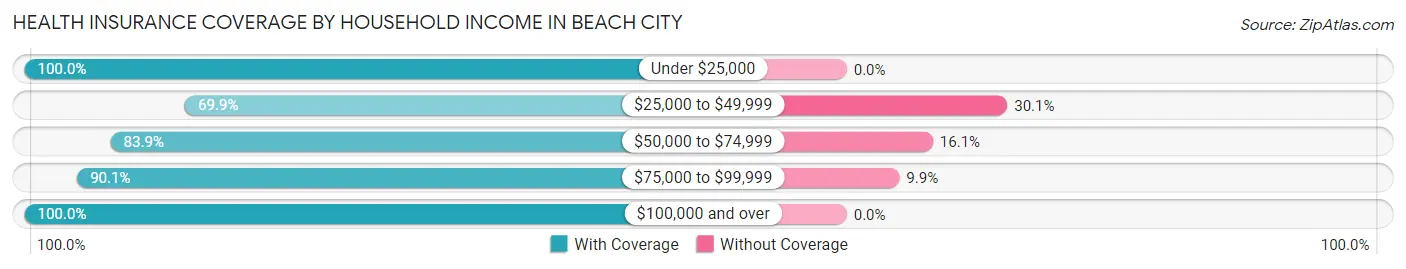
| Household Income | With Coverage | Without Coverage |
| Under $25,000 | 90 (100.0%) | 0 (0.0%) |
| $25,000 to $49,999 | 100 (69.9%) | 43 (30.1%) |
| $50,000 to $74,999 | 78 (83.9%) | 15 (16.1%) |
| $75,000 to $99,999 | 128 (90.1%) | 14 (9.9%) |
| $100,000 and over | 190 (100.0%) | 0 (0.0%) |
Public vs Private Health Insurance Coverage by Age in Beach City
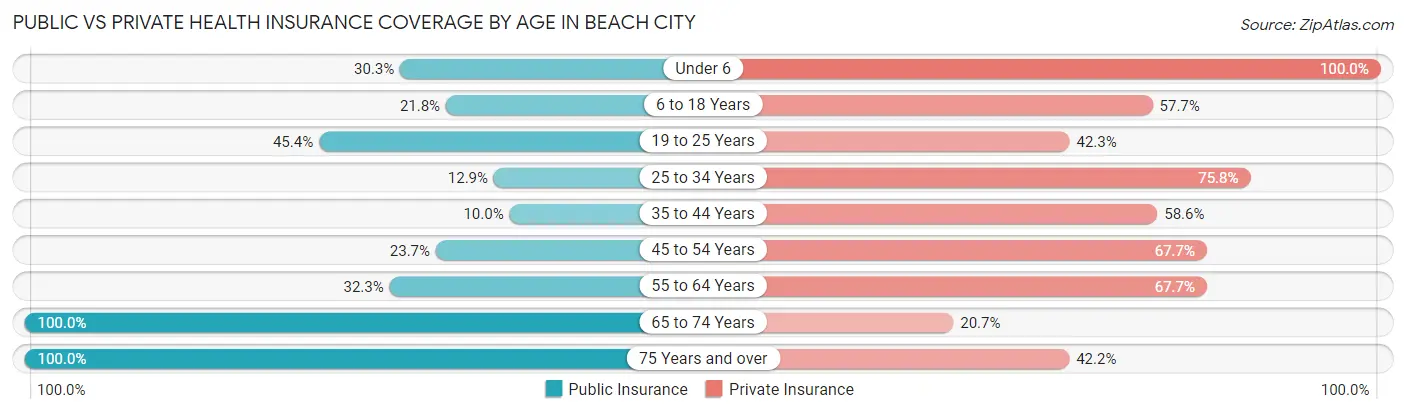
| Age Bracket | Public Insurance | Private Insurance |
| Under 6 | 10 (30.3%) | 33 (100.0%) |
| 6 to 18 Years | 17 (21.8%) | 45 (57.7%) |
| 19 to 25 Years | 44 (45.4%) | 41 (42.3%) |
| 25 to 34 Years | 8 (12.9%) | 47 (75.8%) |
| 35 to 44 Years | 7 (10.0%) | 41 (58.6%) |
| 45 to 54 Years | 22 (23.7%) | 63 (67.7%) |
| 55 to 64 Years | 30 (32.3%) | 63 (67.7%) |
| 65 to 74 Years | 87 (100.0%) | 18 (20.7%) |
| 75 Years and over | 45 (100.0%) | 19 (42.2%) |
| Total | 270 (41.0%) | 370 (56.2%) |
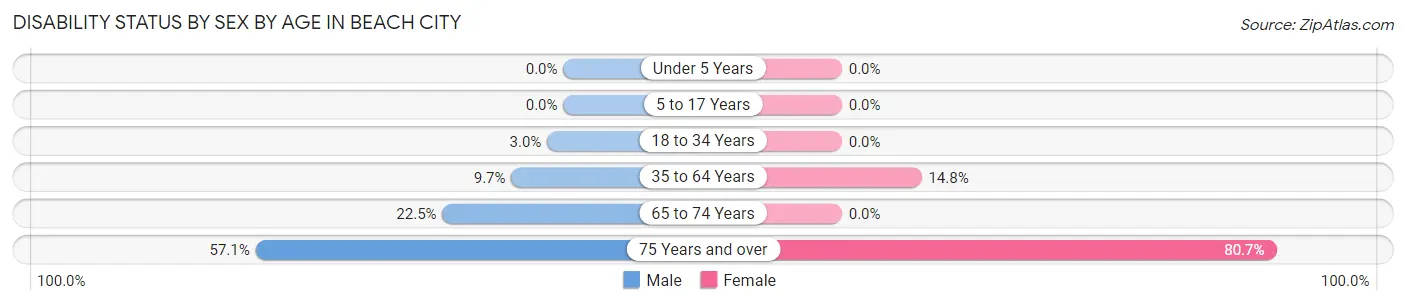
Disability Status by Sex by Age in Beach City
| Age Bracket | Male | Female |
| Under 5 Years | 0 (0.0%) | 0 (0.0%) |
| 5 to 17 Years | 0 (0.0%) | 0 (0.0%) |
| 18 to 34 Years | 3 (3.0%) | 0 (0.0%) |
| 35 to 64 Years | 11 (9.7%) | 21 (14.8%) |
| 65 to 74 Years | 11 (22.5%) | 0 (0.0%) |
| 75 Years and over | 8 (57.1%) | 25 (80.6%) |
Disability Class by Sex by Age in Beach City
Disability Class: Hearing Difficulty
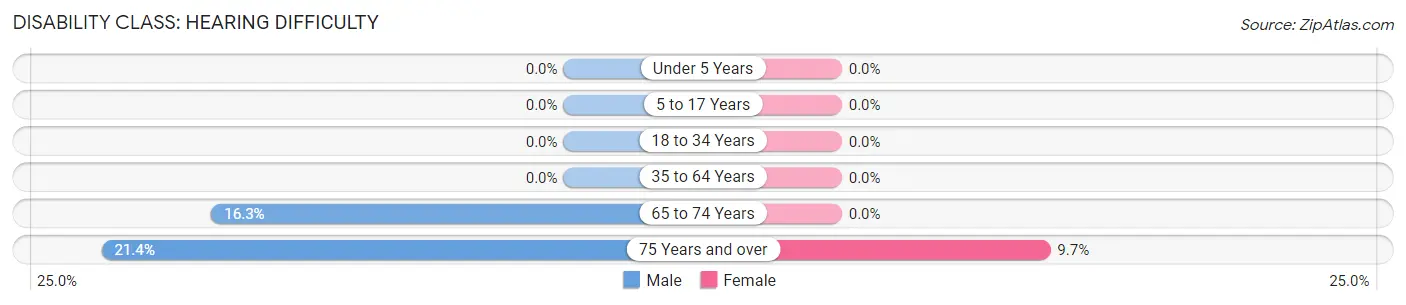
| Age Bracket | Male | Female |
| Under 5 Years | 0 (0.0%) | 0 (0.0%) |
| 5 to 17 Years | 0 (0.0%) | 0 (0.0%) |
| 18 to 34 Years | 0 (0.0%) | 0 (0.0%) |
| 35 to 64 Years | 0 (0.0%) | 0 (0.0%) |
| 65 to 74 Years | 8 (16.3%) | 0 (0.0%) |
| 75 Years and over | 3 (21.4%) | 3 (9.7%) |
Disability Class: Vision Difficulty
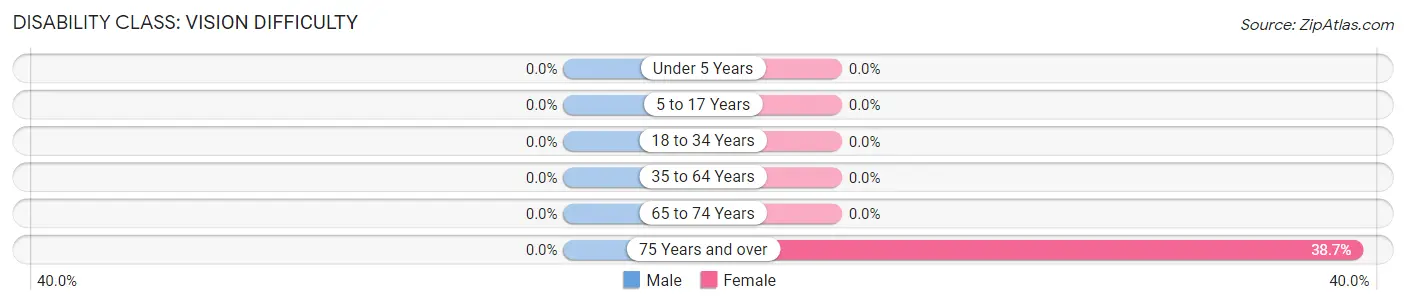
| Age Bracket | Male | Female |
| Under 5 Years | 0 (0.0%) | 0 (0.0%) |
| 5 to 17 Years | 0 (0.0%) | 0 (0.0%) |
| 18 to 34 Years | 0 (0.0%) | 0 (0.0%) |
| 35 to 64 Years | 0 (0.0%) | 0 (0.0%) |
| 65 to 74 Years | 0 (0.0%) | 0 (0.0%) |
| 75 Years and over | 0 (0.0%) | 12 (38.7%) |
Disability Class: Cognitive Difficulty
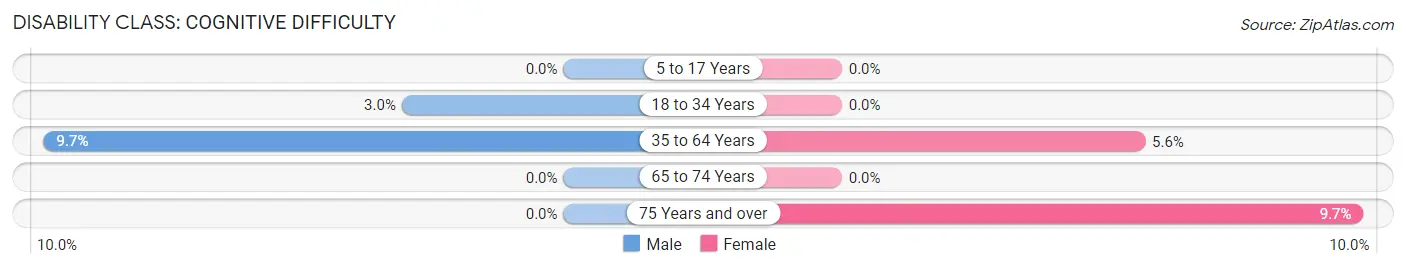
| Age Bracket | Male | Female |
| 5 to 17 Years | 0 (0.0%) | 0 (0.0%) |
| 18 to 34 Years | 3 (3.0%) | 0 (0.0%) |
| 35 to 64 Years | 11 (9.7%) | 8 (5.6%) |
| 65 to 74 Years | 0 (0.0%) | 0 (0.0%) |
| 75 Years and over | 0 (0.0%) | 3 (9.7%) |
Disability Class: Ambulatory Difficulty
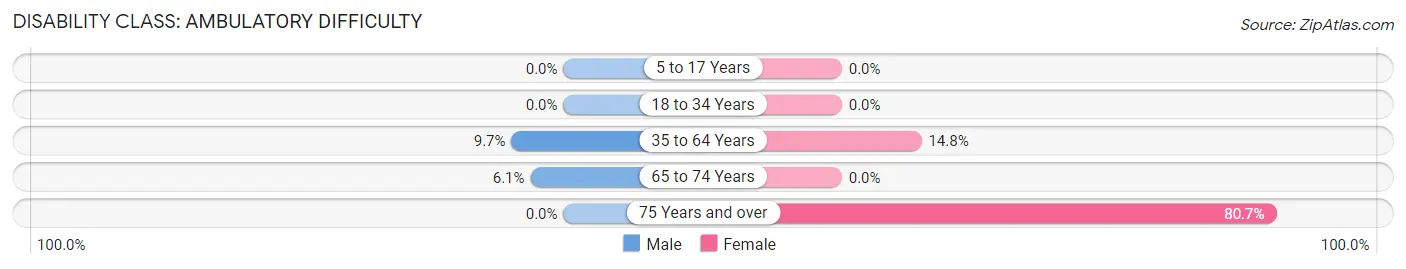
| Age Bracket | Male | Female |
| 5 to 17 Years | 0 (0.0%) | 0 (0.0%) |
| 18 to 34 Years | 0 (0.0%) | 0 (0.0%) |
| 35 to 64 Years | 11 (9.7%) | 21 (14.8%) |
| 65 to 74 Years | 3 (6.1%) | 0 (0.0%) |
| 75 Years and over | 0 (0.0%) | 25 (80.6%) |
Disability Class: Self-Care Difficulty
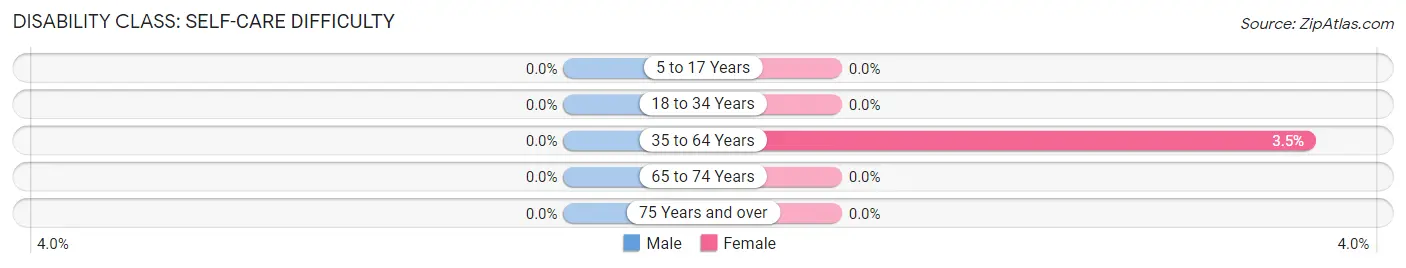
| Age Bracket | Male | Female |
| 5 to 17 Years | 0 (0.0%) | 0 (0.0%) |
| 18 to 34 Years | 0 (0.0%) | 0 (0.0%) |
| 35 to 64 Years | 0 (0.0%) | 5 (3.5%) |
| 65 to 74 Years | 0 (0.0%) | 0 (0.0%) |
| 75 Years and over | 0 (0.0%) | 0 (0.0%) |
Technology Access in Beach City
Computing Device Access in Beach City
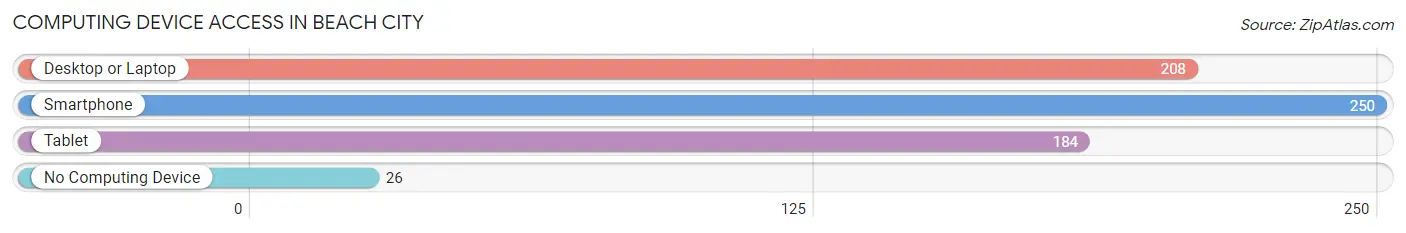
| Device Type | # Households | % Households |
| Desktop or Laptop | 208 | 72.0% |
| Smartphone | 250 | 86.5% |
| Tablet | 184 | 63.7% |
| No Computing Device | 26 | 9.0% |
| Total | 289 | 100.0% |
Internet Access in Beach City
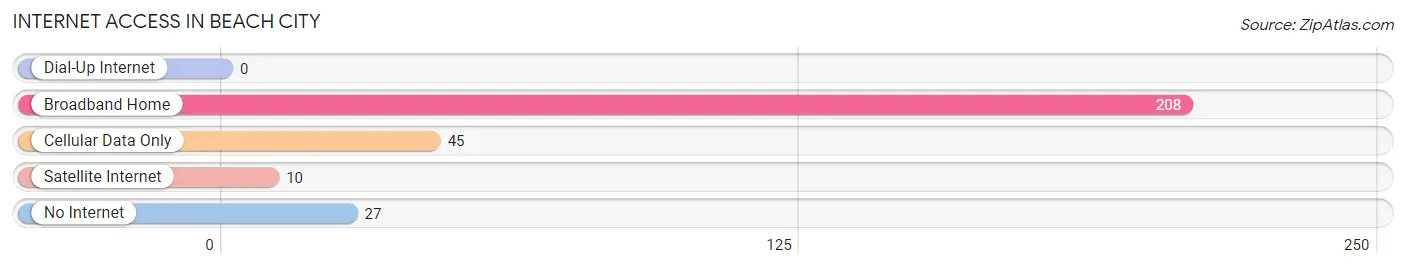
| Internet Type | # Households | % Households |
| Dial-Up Internet | 0 | 0.0% |
| Broadband Home | 208 | 72.0% |
| Cellular Data Only | 45 | 15.6% |
| Satellite Internet | 10 | 3.5% |
| No Internet | 27 | 9.3% |
| Total | 289 | 100.0% |
Beach City Summary
Beach City is a small village located in Tuscarawas County, Ohio. It is situated on the banks of the Tuscarawas River, approximately 25 miles south of Canton and 40 miles north of New Philadelphia. The village has a population of approximately 1,500 people and is part of the Dover, Ohio Micropolitan Statistical Area.
History
Beach City was founded in 1817 by a group of settlers from Pennsylvania. The village was originally known as “Beach’s Landing” after the first settler, John Beach. The village was officially incorporated in 1837 and was renamed Beach City in 1845.
The village was an important stop on the Ohio and Erie Canal, which was completed in 1832. The canal provided a transportation route for goods and people between the Ohio River and Lake Erie. The canal also provided a source of income for the village, as it was a popular stop for travelers.
The village was also an important stop on the Underground Railroad. It was a safe haven for escaped slaves, who were hidden in the homes of sympathetic residents.
Geography
Beach City is located in the Appalachian Plateau region of Ohio. The village is situated on the banks of the Tuscarawas River, which flows through the village. The village is surrounded by rolling hills and wooded areas.
The village is located approximately 25 miles south of Canton and 40 miles north of New Philadelphia. The nearest major cities are Akron, Cleveland, and Pittsburgh, which are all located within a two-hour drive of Beach City.
Economy
The economy of Beach City is largely based on agriculture and tourism. The village is home to several small farms, which produce a variety of crops, including corn, soybeans, and wheat. The village also has several small businesses, including a grocery store, a hardware store, and a restaurant.
The village is also a popular tourist destination. The village is home to several historic sites, including the Beach City Canal Museum, which is located in the former canal lockhouse. The village also has several parks, including the Beach City Park, which features a playground, picnic areas, and a walking trail.
Demographics
As of the 2010 census, the population of Beach City was 1,500. The racial makeup of the village was 97.3% White, 0.7% African American, 0.3% Native American, 0.3% Asian, and 1.3% from other races. The median household income was $41,250, and the median family income was $50,000.
The village is served by the Dover City School District. The village is also home to several churches, including the Beach City United Methodist Church, the Beach City Presbyterian Church, and the Beach City Baptist Church.
Beach City is a small village with a rich history and a vibrant economy. The village is home to several historic sites, parks, and businesses, and is a popular tourist destination. The village is also home to a diverse population, with a median household income of $41,250. Beach City is an ideal place to live, work, and play.
Common Questions
What is Per Capita Income in Beach City?
Per Capita income in Beach City is $30,193.
What is the Median Family Income in Beach City?
Median Family Income in Beach City is $76,786.
What is the Median Household income in Beach City?
Median Household Income in Beach City is $62,188.
What is Income or Wage Gap in Beach City?
Income or Wage Gap in Beach City is 42.4%.
Women in Beach City earn 57.6 cents for every dollar earned by a man.
What is Inequality or Gini Index in Beach City?
Inequality or Gini Index in Beach City is 0.36.
What is the Total Population of Beach City?
Total Population of Beach City is 658.
What is the Total Male Population of Beach City?
Total Male Population of Beach City is 311.
What is the Total Female Population of Beach City?
Total Female Population of Beach City is 347.
What is the Ratio of Males per 100 Females in Beach City?
There are 89.63 Males per 100 Females in Beach City.
What is the Ratio of Females per 100 Males in Beach City?
There are 111.58 Females per 100 Males in Beach City.
What is the Median Population Age in Beach City?
Median Population Age in Beach City is 42.7 Years.
What is the Average Family Size in Beach City
Average Family Size in Beach City is 2.8 People.
What is the Average Household Size in Beach City
Average Household Size in Beach City is 2.3 People.
How Large is the Labor Force in Beach City?
There are 322 People in the Labor Forcein in Beach City.
What is the Percentage of People in the Labor Force in Beach City?
57.1% of People are in the Labor Force in Beach City.
What is the Unemployment Rate in Beach City?
Unemployment Rate in Beach City is 1.9%.