Zip Codes with the Highest Percentage of Population Employed in Life, Physical & Social Science in Springfield, OH
RELATED REPORTS & OPTIONS
Life, Physical & Social Science
Springfield
Compare Zip Codes
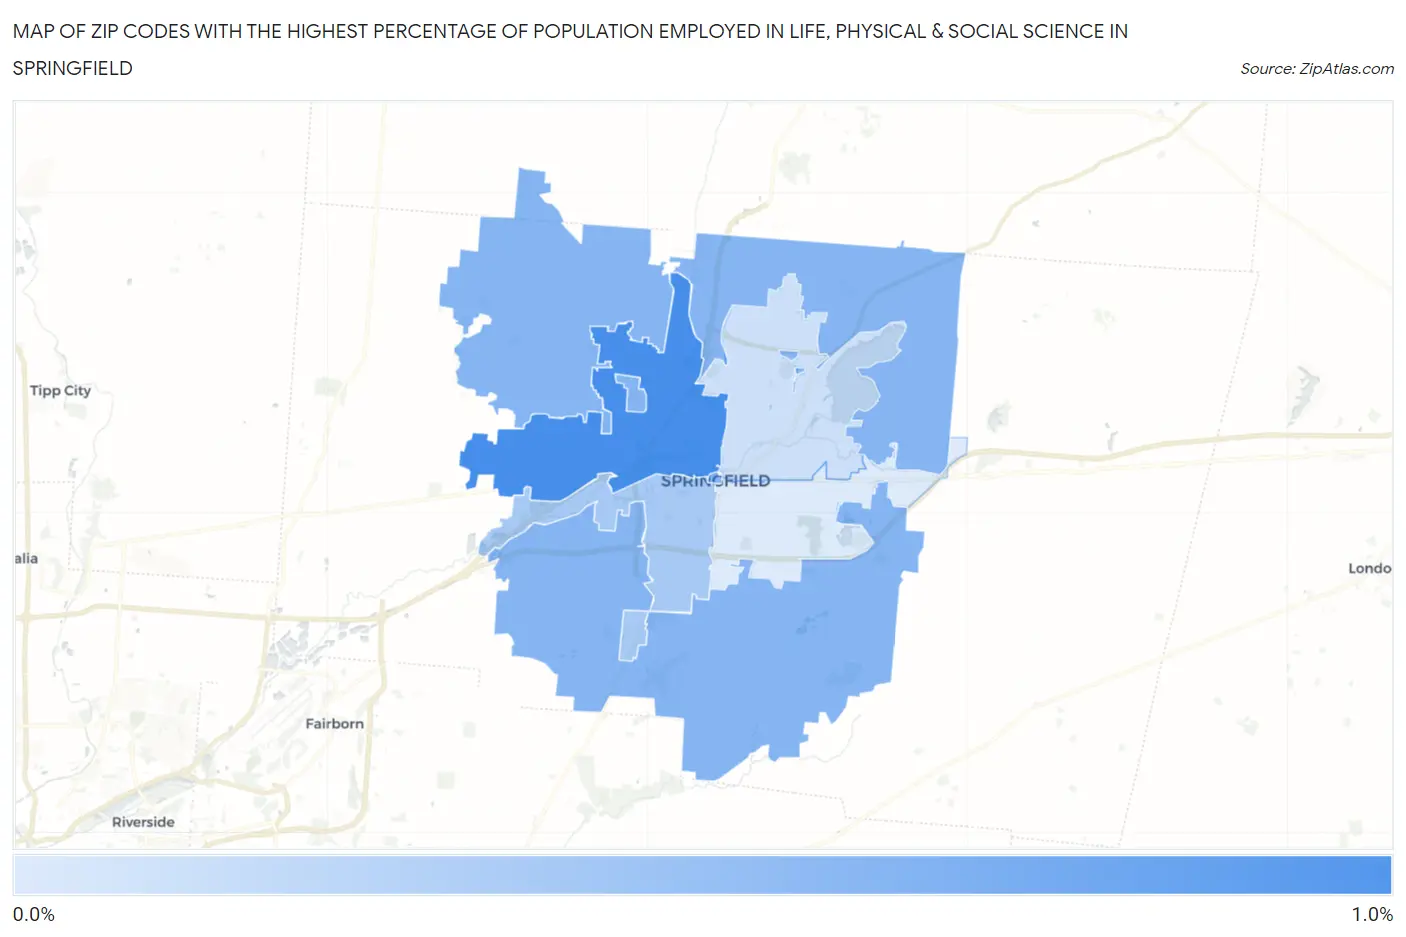
Map of Zip Codes with the Highest Percentage of Population Employed in Life, Physical & Social Science in Springfield
0.059%
0.90%
Zip Codes with the Highest Percentage of Population Employed in Life, Physical & Social Science in Springfield, OH
| Zip Code | % Employed | vs State | vs National | |
| 1. | 45504 | 0.90% | 0.90%(+0.003)#292 | 1.1%(-0.190)#9,947 |
| 2. | 45502 | 0.55% | 0.90%(-0.348)#436 | 1.1%(-0.541)#13,909 |
| 3. | 45506 | 0.36% | 0.90%(-0.537)#529 | 1.1%(-0.731)#16,277 |
| 4. | 45503 | 0.15% | 0.90%(-0.744)#649 | 1.1%(-0.937)#18,653 |
| 5. | 45505 | 0.059% | 0.90%(-0.838)#676 | 1.1%(-1.03)#19,295 |
1
Common Questions
What are the Top 3 Zip Codes with the Highest Percentage of Population Employed in Life, Physical & Social Science in Springfield, OH?
Top 3 Zip Codes with the Highest Percentage of Population Employed in Life, Physical & Social Science in Springfield, OH are:
What zip code has the Highest Percentage of Population Employed in Life, Physical & Social Science in Springfield, OH?
45504 has the Highest Percentage of Population Employed in Life, Physical & Social Science in Springfield, OH with 0.90%.
What is the Percentage of Population Employed in Life, Physical & Social Science in Springfield, OH?
Percentage of Population Employed in Life, Physical & Social Science in Springfield is 0.32%.
What is the Percentage of Population Employed in Life, Physical & Social Science in Ohio?
Percentage of Population Employed in Life, Physical & Social Science in Ohio is 0.90%.
What is the Percentage of Population Employed in Life, Physical & Social Science in the United States?
Percentage of Population Employed in Life, Physical & Social Science in the United States is 1.1%.