Cities with the Highest Percentage of Population Employed in Life, Physical & Social Science in Vermont
RELATED REPORTS & OPTIONS
Life, Physical & Social Science
Vermont
Compare Cities
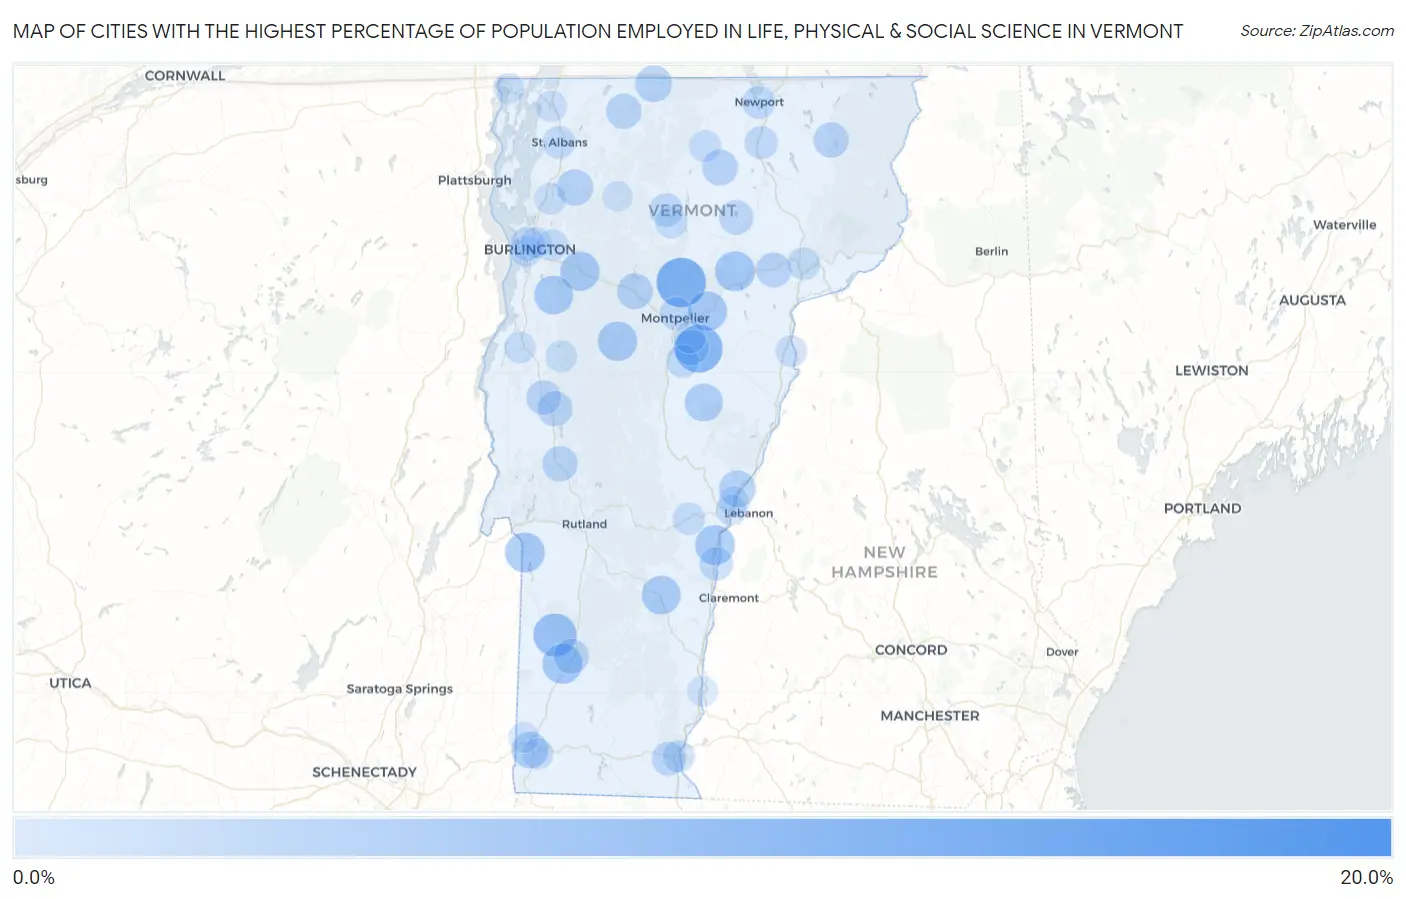
Map of Cities with the Highest Percentage of Population Employed in Life, Physical & Social Science in Vermont
0.0%
20.0%
Cities with the Highest Percentage of Population Employed in Life, Physical & Social Science in Vermont
| City | % Employed | vs State | vs National | |
| 1. | Pawlet | 18.5% | 1.2%(+17.3)#1 | 1.1%(+17.4)#83 |
| 2. | Weston | 11.1% | 1.2%(+9.92)#2 | 1.1%(+10.0)#197 |
| 3. | Worcester | 10.8% | 1.2%(+9.62)#3 | 1.1%(+9.72)#206 |
| 4. | Websterville | 9.8% | 1.2%(+8.61)#4 | 1.1%(+8.71)#236 |
| 5. | Dorset | 7.2% | 1.2%(+6.00)#5 | 1.1%(+6.10)#407 |
| 6. | Cabot | 5.5% | 1.2%(+4.31)#6 | 1.1%(+4.41)#666 |
| 7. | Manchester | 5.5% | 1.2%(+4.26)#7 | 1.1%(+4.36)#680 |
| 8. | Poultney | 5.4% | 1.2%(+4.17)#8 | 1.1%(+4.27)#700 |
| 9. | Hartland | 5.3% | 1.2%(+4.11)#9 | 1.1%(+4.21)#722 |
| 10. | Waitsfield | 5.2% | 1.2%(+3.98)#10 | 1.1%(+4.08)#753 |
| 11. | Plainfield | 5.2% | 1.2%(+3.96)#11 | 1.1%(+4.07)#756 |
| 12. | Richmond | 5.0% | 1.2%(+3.78)#12 | 1.1%(+3.89)#796 |
| 13. | Proctorsville | 4.9% | 1.2%(+3.66)#13 | 1.1%(+3.76)#828 |
| 14. | Hinesburg | 4.8% | 1.2%(+3.65)#14 | 1.1%(+3.76)#830 |
| 15. | South Hero | 4.4% | 1.2%(+3.20)#15 | 1.1%(+3.30)#995 |
| 16. | Chelsea | 4.3% | 1.2%(+3.08)#16 | 1.1%(+3.19)#1,045 |
| 17. | Killington | 3.7% | 1.2%(+2.49)#17 | 1.1%(+2.60)#1,342 |
| 18. | Norwich | 3.7% | 1.2%(+2.48)#18 | 1.1%(+2.58)#1,355 |
| 19. | Old Bennington | 3.6% | 1.2%(+2.42)#19 | 1.1%(+2.52)#1,395 |
| 20. | Richford | 3.5% | 1.2%(+2.30)#20 | 1.1%(+2.40)#1,488 |
| 21. | Fairfax | 3.4% | 1.2%(+2.23)#21 | 1.1%(+2.33)#1,534 |
| 22. | St. George | 3.3% | 1.2%(+2.16)#22 | 1.1%(+2.26)#1,574 |
| 23. | Waterbury | 3.1% | 1.2%(+1.94)#23 | 1.1%(+2.04)#1,753 |
| 24. | Albany | 3.1% | 1.2%(+1.87)#24 | 1.1%(+1.97)#1,833 |
| 25. | Brandon | 2.9% | 1.2%(+1.68)#25 | 1.1%(+1.78)#1,994 |
| 26. | Island Pond | 2.8% | 1.2%(+1.65)#26 | 1.1%(+1.76)#2,018 |
| 27. | Enosburg Falls | 2.8% | 1.2%(+1.65)#27 | 1.1%(+1.75)#2,023 |
| 28. | South Barre | 2.8% | 1.2%(+1.60)#28 | 1.1%(+1.71)#2,087 |
| 29. | East Middlebury | 2.8% | 1.2%(+1.60)#29 | 1.1%(+1.71)#2,089 |
| 30. | Manchester Center | 2.7% | 1.2%(+1.55)#30 | 1.1%(+1.65)#2,166 |
| 31. | Danville | 2.7% | 1.2%(+1.54)#31 | 1.1%(+1.64)#2,184 |
| 32. | Middletown Springs | 2.6% | 1.2%(+1.44)#32 | 1.1%(+1.54)#2,309 |
| 33. | Middlebury | 2.5% | 1.2%(+1.35)#33 | 1.1%(+1.46)#2,441 |
| 34. | Greensboro | 2.4% | 1.2%(+1.19)#34 | 1.1%(+1.29)#2,722 |
| 35. | Huntington Center | 2.2% | 1.2%(+0.957)#35 | 1.1%(+1.06)#3,134 |
| 36. | West Brattleboro | 2.1% | 1.2%(+0.950)#36 | 1.1%(+1.05)#3,143 |
| 37. | Burlington | 2.0% | 1.2%(+0.792)#37 | 1.1%(+0.895)#3,454 |
| 38. | Hyde Park | 1.9% | 1.2%(+0.684)#38 | 1.1%(+0.787)#3,723 |
| 39. | South Lincoln | 1.9% | 1.2%(+0.675)#39 | 1.1%(+0.778)#3,748 |
| 40. | Windsor | 1.9% | 1.2%(+0.661)#40 | 1.1%(+0.764)#3,780 |
| 41. | Montpelier | 1.7% | 1.2%(+0.540)#41 | 1.1%(+0.643)#4,112 |
| 42. | Orleans | 1.7% | 1.2%(+0.483)#42 | 1.1%(+0.586)#4,283 |
| 43. | Newport | 1.6% | 1.2%(+0.436)#43 | 1.1%(+0.539)#4,409 |
| 44. | Williamstown | 1.5% | 1.2%(+0.346)#44 | 1.1%(+0.449)#4,685 |
| 45. | New Haven | 1.5% | 1.2%(+0.333)#45 | 1.1%(+0.436)#4,748 |
| 46. | St Albans | 1.5% | 1.2%(+0.316)#46 | 1.1%(+0.419)#4,805 |
| 47. | St Johnsbury | 1.4% | 1.2%(+0.230)#47 | 1.1%(+0.333)#5,169 |
| 48. | Woodstock | 1.4% | 1.2%(+0.195)#48 | 1.1%(+0.298)#5,280 |
| 49. | Brattleboro | 1.2% | 1.2%(-0.014)#49 | 1.1%(+0.089)#6,231 |
| 50. | Lowell | 1.1% | 1.2%(-0.119)#50 | 1.1%(-0.016)#6,774 |
| 51. | Morrisville | 1.1% | 1.2%(-0.131)#51 | 1.1%(-0.028)#6,832 |
| 52. | Milton | 0.93% | 1.2%(-0.263)#52 | 1.1%(-0.160)#7,609 |
| 53. | Barre | 0.91% | 1.2%(-0.286)#53 | 1.1%(-0.183)#7,774 |
| 54. | Bristol | 0.89% | 1.2%(-0.307)#54 | 1.1%(-0.204)#7,900 |
| 55. | Vergennes | 0.85% | 1.2%(-0.345)#55 | 1.1%(-0.242)#8,155 |
| 56. | Stamford | 0.85% | 1.2%(-0.346)#56 | 1.1%(-0.243)#8,167 |
| 57. | Wells River | 0.85% | 1.2%(-0.346)#57 | 1.1%(-0.243)#8,170 |
| 58. | Lincoln | 0.81% | 1.2%(-0.381)#58 | 1.1%(-0.278)#8,393 |
| 59. | Essex Junction | 0.78% | 1.2%(-0.410)#59 | 1.1%(-0.307)#8,573 |
| 60. | South Burlington | 0.77% | 1.2%(-0.429)#60 | 1.1%(-0.326)#8,710 |
| 61. | Bennington | 0.73% | 1.2%(-0.466)#61 | 1.1%(-0.363)#8,979 |
| 62. | Swanton | 0.67% | 1.2%(-0.526)#62 | 1.1%(-0.423)#9,429 |
| 63. | Winooski | 0.52% | 1.2%(-0.670)#63 | 1.1%(-0.567)#10,596 |
| 64. | Alburgh | 0.46% | 1.2%(-0.735)#64 | 1.1%(-0.632)#11,078 |
| 65. | White River Junction | 0.44% | 1.2%(-0.756)#65 | 1.1%(-0.653)#11,241 |
| 66. | Proctor | 0.41% | 1.2%(-0.781)#66 | 1.1%(-0.678)#11,416 |
| 67. | Wilder | 0.40% | 1.2%(-0.796)#67 | 1.1%(-0.693)#11,525 |
| 68. | Westminster | 0.37% | 1.2%(-0.822)#68 | 1.1%(-0.719)#11,745 |
| 69. | North Bennington | 0.34% | 1.2%(-0.851)#69 | 1.1%(-0.748)#11,961 |
| 70. | Jeffersonville | 0.23% | 1.2%(-0.961)#70 | 1.1%(-0.858)#12,626 |
1
2Common Questions
What are the Top 10 Cities with the Highest Percentage of Population Employed in Life, Physical & Social Science in Vermont?
Top 10 Cities with the Highest Percentage of Population Employed in Life, Physical & Social Science in Vermont are:
#1
10.8%
#2
9.8%
#3
7.2%
#4
5.5%
#5
5.5%
#6
5.4%
#7
5.3%
#8
5.2%
#9
5.2%
#10
5.0%
What city has the Highest Percentage of Population Employed in Life, Physical & Social Science in Vermont?
Worcester has the Highest Percentage of Population Employed in Life, Physical & Social Science in Vermont with 10.8%.
What is the Percentage of Population Employed in Life, Physical & Social Science in the State of Vermont?
Percentage of Population Employed in Life, Physical & Social Science in Vermont is 1.2%.
What is the Percentage of Population Employed in Life, Physical & Social Science in the United States?
Percentage of Population Employed in Life, Physical & Social Science in the United States is 1.1%.