Marietta, OH Map & Demographics
Marietta Map
Marietta Overview
$36,388
PER CAPITA INCOME
$65,596
AVG FAMILY INCOME
$44,401
AVG HOUSEHOLD INCOME
40.8%
WAGE / INCOME GAP [ % ]
59.2¢/ $1
WAGE / INCOME GAP [ $ ]
$10,793
FAMILY INCOME DEFICIT
0.58
INEQUALITY / GINI INDEX
13,366
TOTAL POPULATION
6,623
MALE POPULATION
6,743
FEMALE POPULATION
98.22
MALES / 100 FEMALES
101.81
FEMALES / 100 MALES
39.4
MEDIAN AGE
2.7
AVG FAMILY SIZE
2.0
AVG HOUSEHOLD SIZE
6,435
LABOR FORCE [ PEOPLE ]
57.4%
PERCENT IN LABOR FORCE
5.6%
UNEMPLOYMENT RATE
Marietta Zip Codes
Marietta Area Codes
Income in Marietta
Income Overview in Marietta
Per Capita Income in Marietta is $36,388, while median incomes of families and households are $65,596 and $44,401 respectively.
| Characteristic | Number | Measure |
| Per Capita Income | 13,366 | $36,388 |
| Median Family Income | 3,097 | $65,596 |
| Mean Family Income | 3,097 | $106,364 |
| Median Household Income | 6,073 | $44,401 |
| Mean Household Income | 6,073 | $78,159 |
| Income Deficit | 3,097 | $10,793 |
| Wage / Income Gap (%) | 13,366 | 40.81% |
| Wage / Income Gap ($) | 13,366 | 59.19¢ per $1 |
| Gini / Inequality Index | 13,366 | 0.58 |
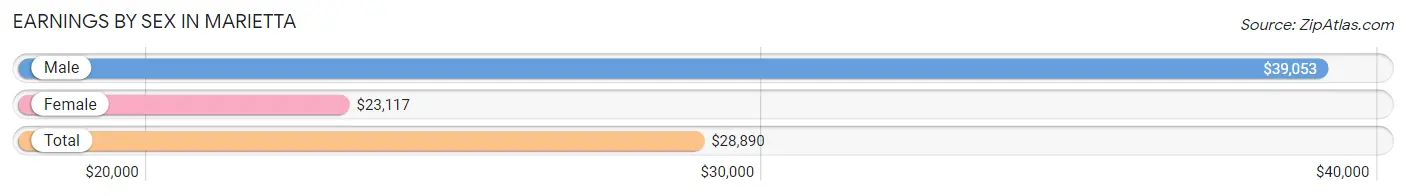
Earnings by Sex in Marietta
Average Earnings in Marietta are $28,890, $39,053 for men and $23,117 for women, a difference of 40.8%.
| Sex | Number | Average Earnings |
| Male | 3,665 (54.0%) | $39,053 |
| Female | 3,126 (46.0%) | $23,117 |
| Total | 6,791 (100.0%) | $28,890 |
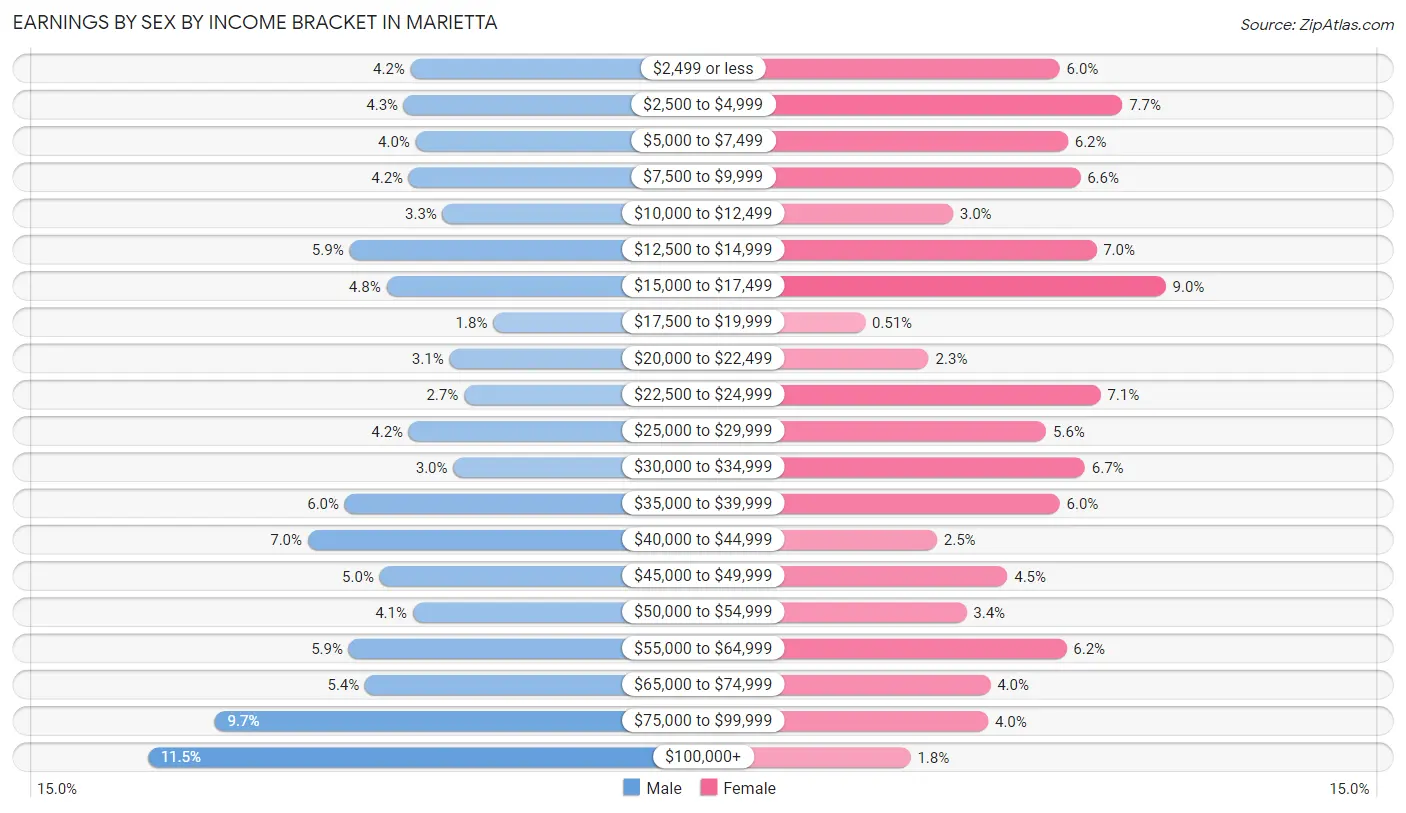
Earnings by Sex by Income Bracket in Marietta
The most common earnings brackets in Marietta are $100,000+ for men (423 | 11.5%) and $15,000 to $17,499 for women (280 | 9.0%).
| Income | Male | Female |
| $2,499 or less | 152 (4.2%) | 187 (6.0%) |
| $2,500 to $4,999 | 159 (4.3%) | 242 (7.7%) |
| $5,000 to $7,499 | 147 (4.0%) | 194 (6.2%) |
| $7,500 to $9,999 | 154 (4.2%) | 205 (6.6%) |
| $10,000 to $12,499 | 119 (3.3%) | 93 (3.0%) |
| $12,500 to $14,999 | 215 (5.9%) | 219 (7.0%) |
| $15,000 to $17,499 | 177 (4.8%) | 280 (9.0%) |
| $17,500 to $19,999 | 67 (1.8%) | 16 (0.5%) |
| $20,000 to $22,499 | 112 (3.1%) | 72 (2.3%) |
| $22,500 to $24,999 | 97 (2.6%) | 223 (7.1%) |
| $25,000 to $29,999 | 154 (4.2%) | 175 (5.6%) |
| $30,000 to $34,999 | 108 (2.9%) | 209 (6.7%) |
| $35,000 to $39,999 | 220 (6.0%) | 187 (6.0%) |
| $40,000 to $44,999 | 258 (7.0%) | 79 (2.5%) |
| $45,000 to $49,999 | 184 (5.0%) | 141 (4.5%) |
| $50,000 to $54,999 | 150 (4.1%) | 105 (3.4%) |
| $55,000 to $64,999 | 216 (5.9%) | 193 (6.2%) |
| $65,000 to $74,999 | 199 (5.4%) | 126 (4.0%) |
| $75,000 to $99,999 | 354 (9.7%) | 124 (4.0%) |
| $100,000+ | 423 (11.5%) | 56 (1.8%) |
| Total | 3,665 (100.0%) | 3,126 (100.0%) |
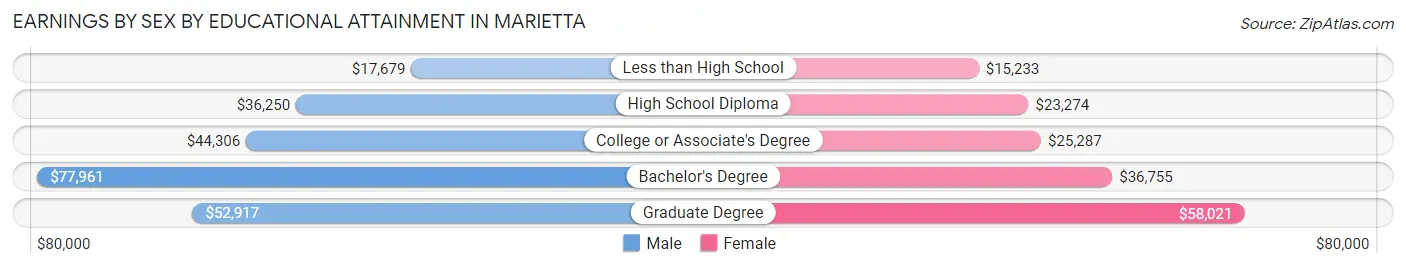
Earnings by Sex by Educational Attainment in Marietta
Average earnings in Marietta are $45,900 for men and $26,689 for women, a difference of 41.8%. Men with an educational attainment of bachelor's degree enjoy the highest average annual earnings of $77,961, while those with less than high school education earn the least with $17,679. Women with an educational attainment of graduate degree earn the most with the average annual earnings of $58,021, while those with less than high school education have the smallest earnings of $15,233.
| Educational Attainment | Male Income | Female Income |
| Less than High School | $17,679 | $15,233 |
| High School Diploma | $36,250 | $23,274 |
| College or Associate's Degree | $44,306 | $25,287 |
| Bachelor's Degree | $77,961 | $36,755 |
| Graduate Degree | $52,917 | $58,021 |
| Total | $45,900 | $26,689 |
Family Income in Marietta
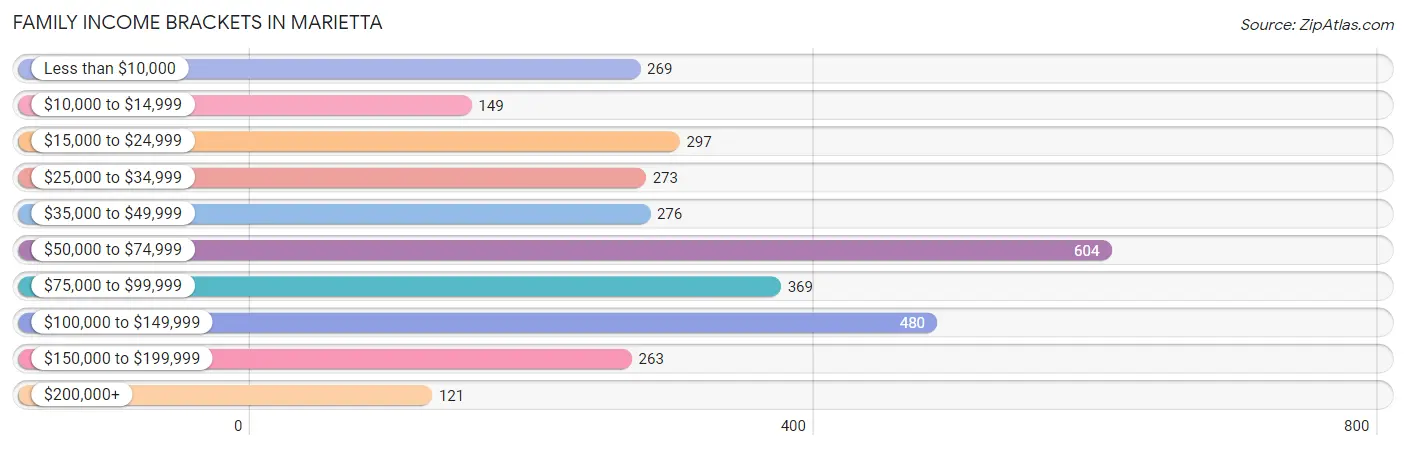
Family Income Brackets in Marietta
According to the Marietta family income data, there are 604 families falling into the $50,000 to $74,999 income range, which is the most common income bracket and makes up 19.5% of all families. Conversely, the $200,000+ income bracket is the least frequent group with only 121 families (3.9%) belonging to this category.
| Income Bracket | # Families | % Families |
| Less than $10,000 | 269 | 8.7% |
| $10,000 to $14,999 | 149 | 4.8% |
| $15,000 to $24,999 | 297 | 9.6% |
| $25,000 to $34,999 | 273 | 8.8% |
| $35,000 to $49,999 | 276 | 8.9% |
| $50,000 to $74,999 | 604 | 19.5% |
| $75,000 to $99,999 | 369 | 11.9% |
| $100,000 to $149,999 | 480 | 15.5% |
| $150,000 to $199,999 | 263 | 8.5% |
| $200,000+ | 121 | 3.9% |
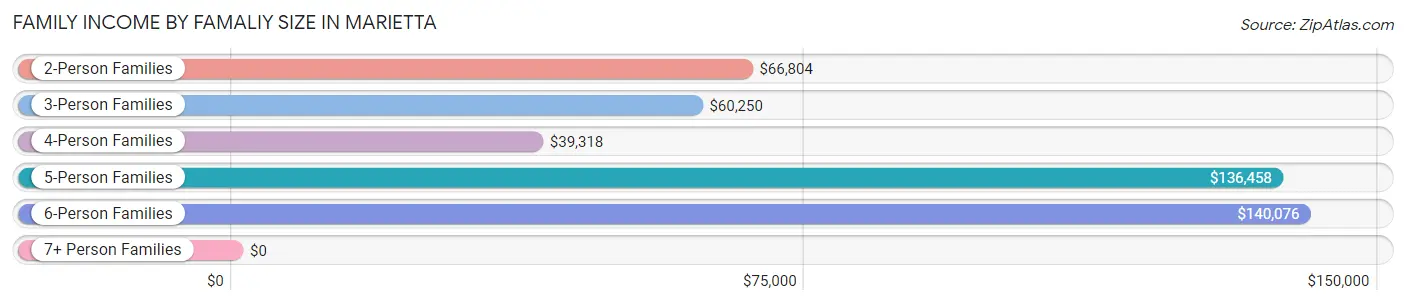
Family Income by Famaliy Size in Marietta
6-person families (80 | 2.6%) account for the highest median family income in Marietta with $140,076 per family, while 2-person families (1,828 | 59.0%) have the highest median income of $33,402 per family member.
| Income Bracket | # Families | Median Income |
| 2-Person Families | 1,828 (59.0%) | $66,804 |
| 3-Person Families | 857 (27.7%) | $60,250 |
| 4-Person Families | 284 (9.2%) | $39,318 |
| 5-Person Families | 41 (1.3%) | $136,458 |
| 6-Person Families | 80 (2.6%) | $140,076 |
| 7+ Person Families | 7 (0.2%) | $0 |
| Total | 3,097 (100.0%) | $65,596 |
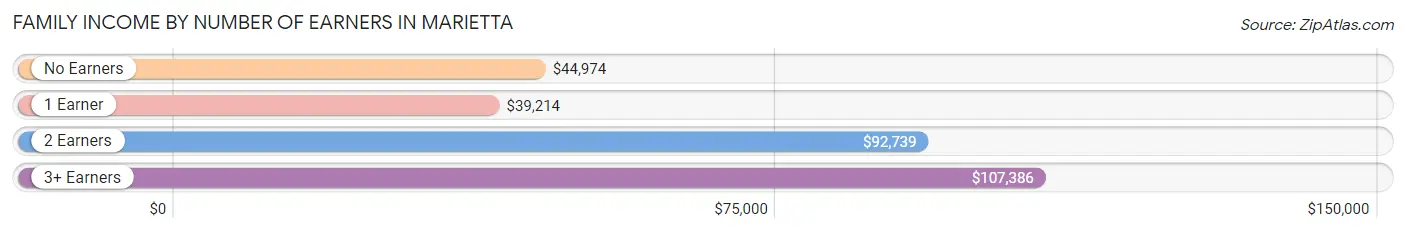
Family Income by Number of Earners in Marietta
The median family income in Marietta is $65,596, with families comprising 3+ earners (161) having the highest median family income of $107,386, while families with 1 earner (1,118) have the lowest median family income of $39,214, accounting for 5.2% and 36.1% of families, respectively.
| Number of Earners | # Families | Median Income |
| No Earners | 713 (23.0%) | $44,974 |
| 1 Earner | 1,118 (36.1%) | $39,214 |
| 2 Earners | 1,105 (35.7%) | $92,739 |
| 3+ Earners | 161 (5.2%) | $107,386 |
| Total | 3,097 (100.0%) | $65,596 |
Household Income in Marietta
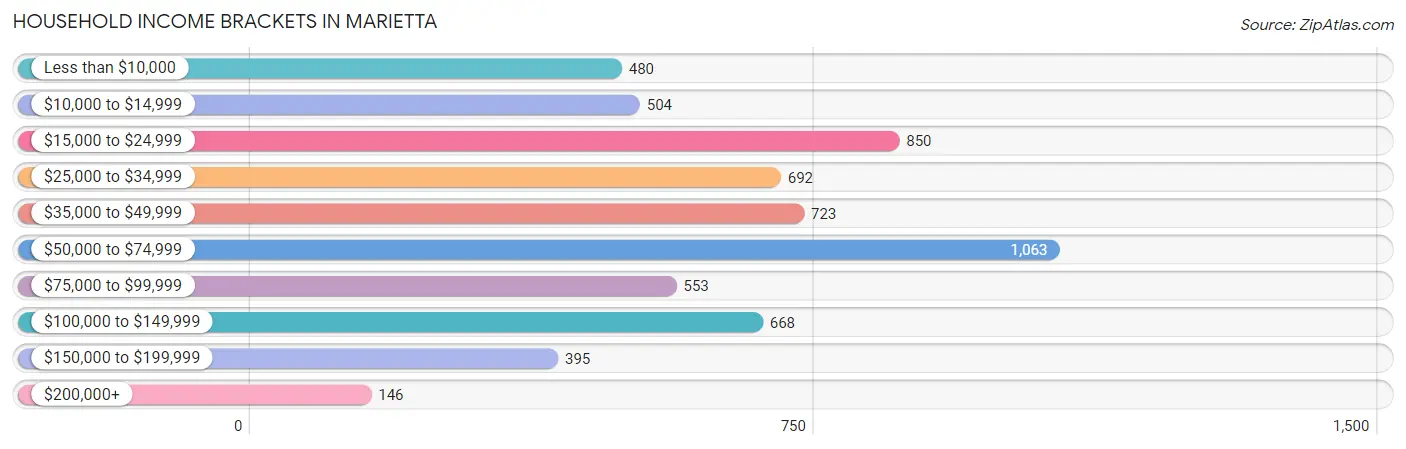
Household Income Brackets in Marietta
With 1,063 households falling in the category, the $50,000 to $74,999 income range is the most frequent in Marietta, accounting for 17.5% of all households. In contrast, only 146 households (2.4%) fall into the $200,000+ income bracket, making it the least populous group.
| Income Bracket | # Households | % Households |
| Less than $10,000 | 480 | 7.9% |
| $10,000 to $14,999 | 504 | 8.3% |
| $15,000 to $24,999 | 850 | 14.0% |
| $25,000 to $34,999 | 692 | 11.4% |
| $35,000 to $49,999 | 723 | 11.9% |
| $50,000 to $74,999 | 1,063 | 17.5% |
| $75,000 to $99,999 | 553 | 9.1% |
| $100,000 to $149,999 | 668 | 11.0% |
| $150,000 to $199,999 | 395 | 6.5% |
| $200,000+ | 146 | 2.4% |
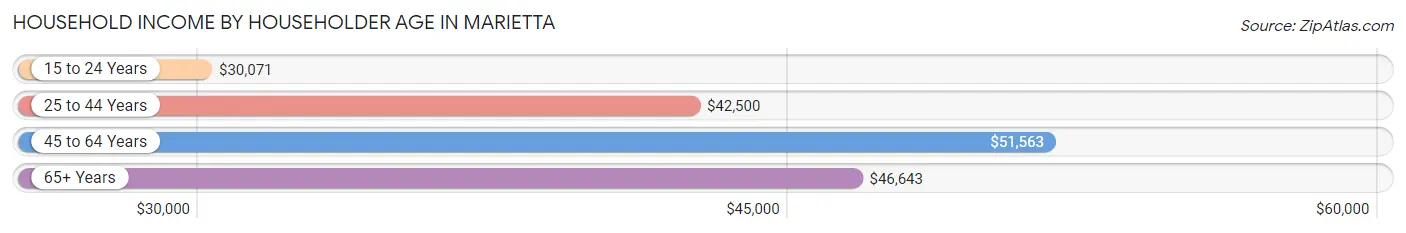
Household Income by Householder Age in Marietta
The median household income in Marietta is $44,401, with the highest median household income of $51,563 found in the 45 to 64 years age bracket for the primary householder. A total of 1,863 households (30.7%) fall into this category. Meanwhile, the 15 to 24 years age bracket for the primary householder has the lowest median household income of $30,071, with 492 households (8.1%) in this group.
| Income Bracket | # Households | Median Income |
| 15 to 24 Years | 492 (8.1%) | $30,071 |
| 25 to 44 Years | 1,722 (28.4%) | $42,500 |
| 45 to 64 Years | 1,863 (30.7%) | $51,563 |
| 65+ Years | 1,996 (32.9%) | $46,643 |
| Total | 6,073 (100.0%) | $44,401 |
Poverty in Marietta
Income Below Poverty by Sex and Age in Marietta
With 20.1% poverty level for males and 23.9% for females among the residents of Marietta, under 5 year old males and 5 year old females are the most vulnerable to poverty, with 162 males (43.7%) and 49 females (68.1%) in their respective age groups living below the poverty level.
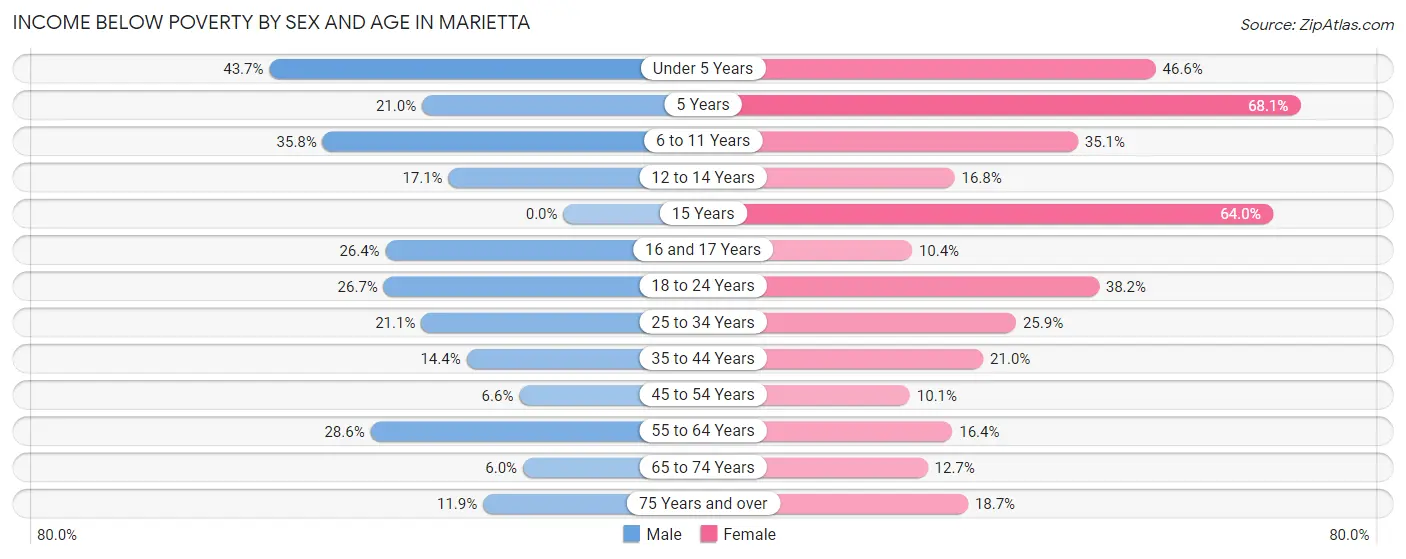
| Age Bracket | Male | Female |
| Under 5 Years | 162 (43.7%) | 178 (46.6%) |
| 5 Years | 17 (21.0%) | 49 (68.1%) |
| 6 to 11 Years | 163 (35.7%) | 109 (35.0%) |
| 12 to 14 Years | 29 (17.1%) | 35 (16.8%) |
| 15 Years | 0 (0.0%) | 55 (63.9%) |
| 16 and 17 Years | 28 (26.4%) | 10 (10.4%) |
| 18 to 24 Years | 151 (26.7%) | 240 (38.2%) |
| 25 to 34 Years | 161 (21.1%) | 239 (25.9%) |
| 35 to 44 Years | 85 (14.4%) | 153 (21.0%) |
| 45 to 54 Years | 47 (6.6%) | 56 (10.1%) |
| 55 to 64 Years | 256 (28.6%) | 127 (16.4%) |
| 65 to 74 Years | 44 (6.0%) | 86 (12.7%) |
| 75 Years and over | 69 (11.9%) | 141 (18.7%) |
| Total | 1,212 (20.1%) | 1,478 (23.9%) |
Income Above Poverty by Sex and Age in Marietta
According to the poverty statistics in Marietta, males aged 15 years and females aged 45 to 54 years are the age groups that are most secure financially, with 100.0% of males and 89.9% of females in these age groups living above the poverty line.
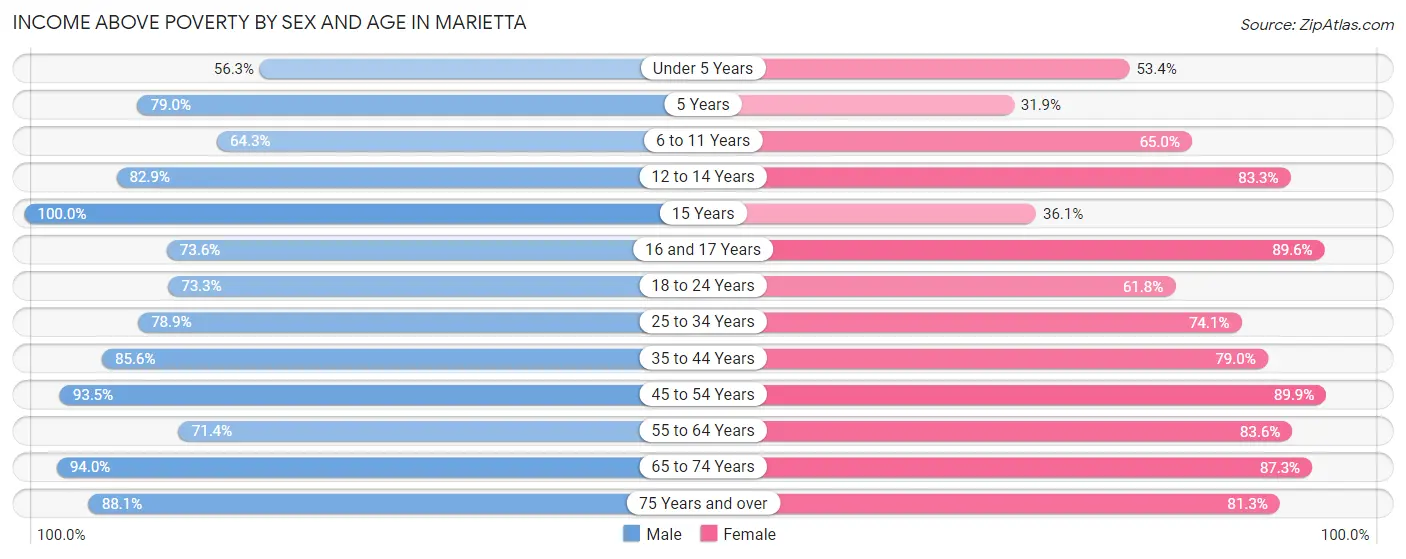
| Age Bracket | Male | Female |
| Under 5 Years | 209 (56.3%) | 204 (53.4%) |
| 5 Years | 64 (79.0%) | 23 (31.9%) |
| 6 to 11 Years | 293 (64.2%) | 202 (64.9%) |
| 12 to 14 Years | 141 (82.9%) | 174 (83.3%) |
| 15 Years | 12 (100.0%) | 31 (36.0%) |
| 16 and 17 Years | 78 (73.6%) | 86 (89.6%) |
| 18 to 24 Years | 415 (73.3%) | 389 (61.8%) |
| 25 to 34 Years | 602 (78.9%) | 685 (74.1%) |
| 35 to 44 Years | 506 (85.6%) | 576 (79.0%) |
| 45 to 54 Years | 671 (93.4%) | 498 (89.9%) |
| 55 to 64 Years | 638 (71.4%) | 647 (83.6%) |
| 65 to 74 Years | 689 (94.0%) | 589 (87.3%) |
| 75 Years and over | 510 (88.1%) | 612 (81.3%) |
| Total | 4,828 (79.9%) | 4,716 (76.1%) |
Income Below Poverty Among Married-Couple Families in Marietta
The poverty statistics for married-couple families in Marietta show that 8.9% or 171 of the total 1,916 families live below the poverty line. Families with 1 or 2 children have the highest poverty rate of 23.9%, comprising of 120 families. On the other hand, families with 5 or more children have the lowest poverty rate of 0.0%, which includes 0 families.
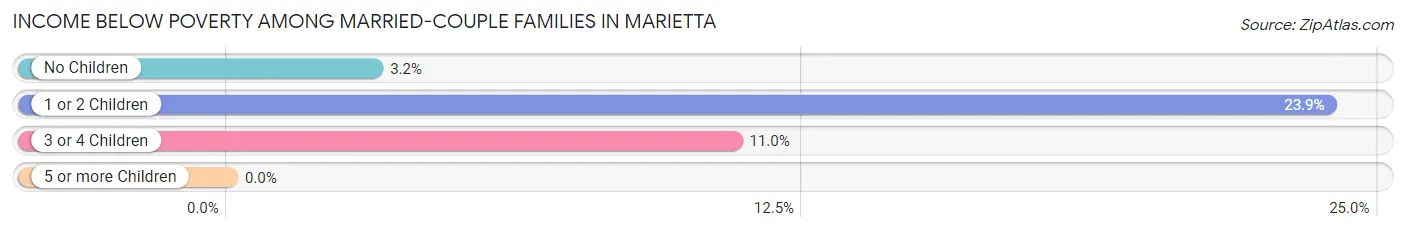
| Children | Above Poverty | Below Poverty |
| No Children | 1,286 (96.8%) | 42 (3.2%) |
| 1 or 2 Children | 382 (76.1%) | 120 (23.9%) |
| 3 or 4 Children | 73 (89.0%) | 9 (11.0%) |
| 5 or more Children | 4 (100.0%) | 0 (0.0%) |
| Total | 1,745 (91.1%) | 171 (8.9%) |
Income Below Poverty Among Single-Parent Households in Marietta
According to the poverty data in Marietta, 33.0% or 87 single-father households and 40.7% or 373 single-mother households are living below the poverty line. Among single-father households, those with 3 or 4 children have the highest poverty rate, with 9 households (100.0%) experiencing poverty. Likewise, among single-mother households, those with 1 or 2 children have the highest poverty rate, with 351 households (51.3%) falling below the poverty line.
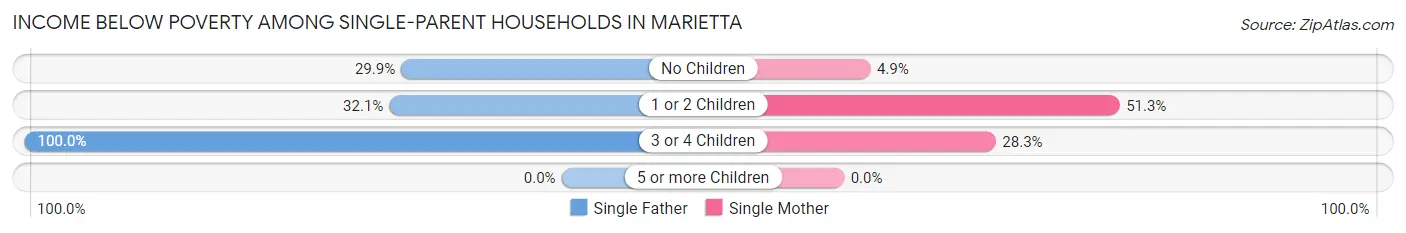
| Children | Single Father | Single Mother |
| No Children | 52 (29.9%) | 9 (4.9%) |
| 1 or 2 Children | 26 (32.1%) | 351 (51.3%) |
| 3 or 4 Children | 9 (100.0%) | 13 (28.3%) |
| 5 or more Children | 0 (0.0%) | 0 (0.0%) |
| Total | 87 (33.0%) | 373 (40.7%) |
Income Below Poverty Among Married-Couple vs Single-Parent Households in Marietta
The poverty data for Marietta shows that 171 of the married-couple family households (8.9%) and 460 of the single-parent households (39.0%) are living below the poverty level. Within the married-couple family households, those with 1 or 2 children have the highest poverty rate, with 120 households (23.9%) falling below the poverty line. Among the single-parent households, those with 1 or 2 children have the highest poverty rate, with 377 household (49.3%) living below poverty.
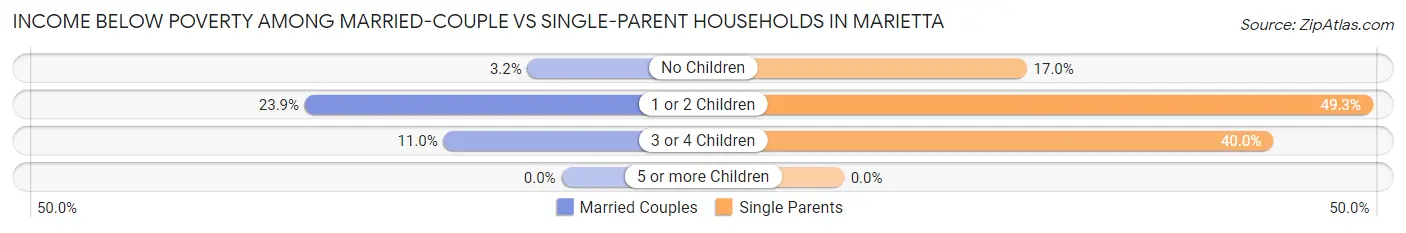
| Children | Married-Couple Families | Single-Parent Households |
| No Children | 42 (3.2%) | 61 (17.0%) |
| 1 or 2 Children | 120 (23.9%) | 377 (49.3%) |
| 3 or 4 Children | 9 (11.0%) | 22 (40.0%) |
| 5 or more Children | 0 (0.0%) | 0 (0.0%) |
| Total | 171 (8.9%) | 460 (39.0%) |
Race in Marietta
The most populous races in Marietta are White / Caucasian (12,454 | 93.2%), Two or more Races (333 | 2.5%), and Black / African American (302 | 2.3%).
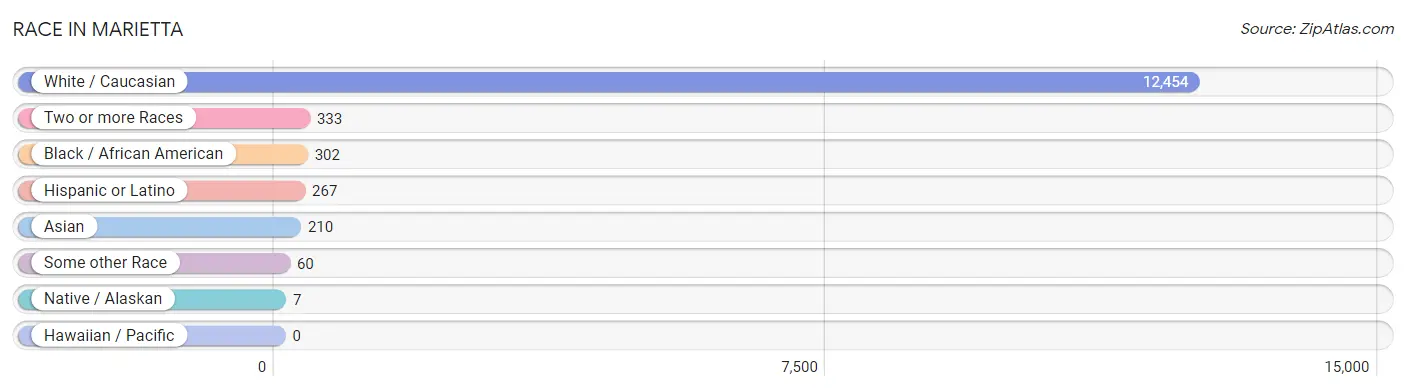
| Race | # Population | % Population |
| Asian | 210 | 1.6% |
| Black / African American | 302 | 2.3% |
| Hawaiian / Pacific | 0 | 0.0% |
| Hispanic or Latino | 267 | 2.0% |
| Native / Alaskan | 7 | 0.1% |
| White / Caucasian | 12,454 | 93.2% |
| Two or more Races | 333 | 2.5% |
| Some other Race | 60 | 0.4% |
| Total | 13,366 | 100.0% |
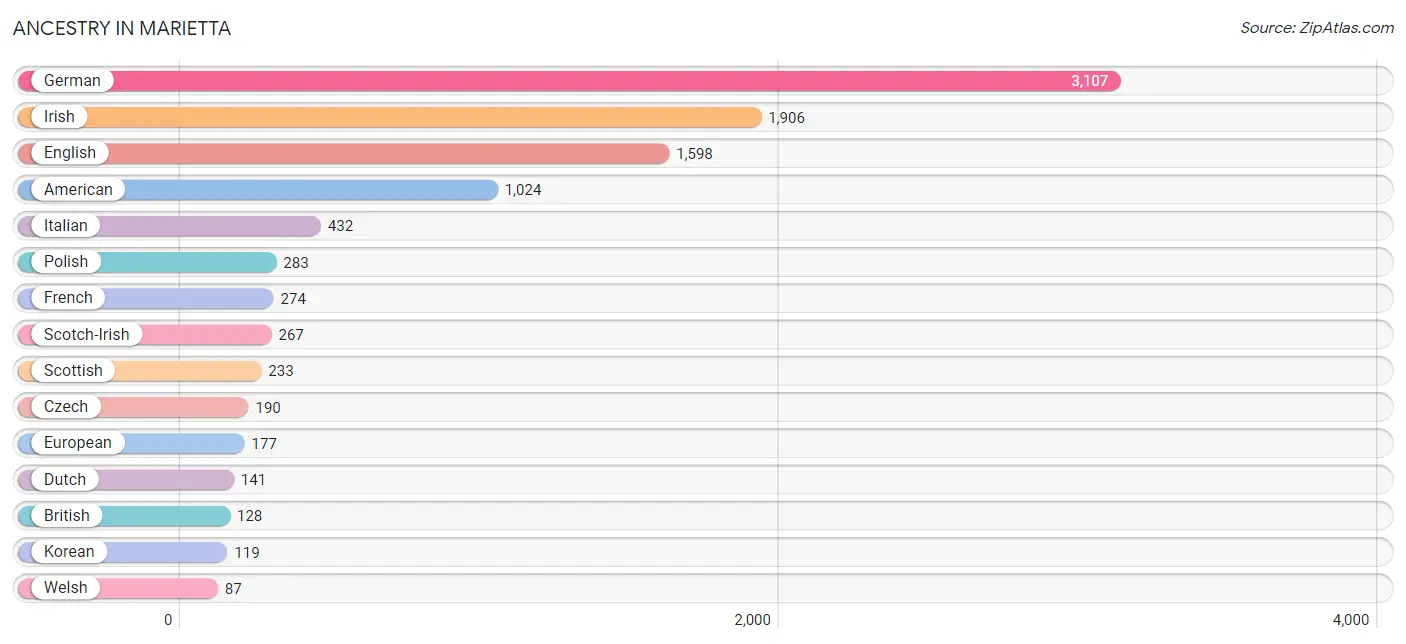
Ancestry in Marietta
The most populous ancestries reported in Marietta are German (3,107 | 23.3%), Irish (1,906 | 14.3%), English (1,598 | 12.0%), American (1,024 | 7.7%), and Italian (432 | 3.2%), together accounting for 60.4% of all Marietta residents.
| Ancestry | # Population | % Population |
| African | 49 | 0.4% |
| American | 1,024 | 7.7% |
| Arab | 19 | 0.1% |
| Australian | 12 | 0.1% |
| Austrian | 7 | 0.1% |
| Bhutanese | 14 | 0.1% |
| British | 128 | 1.0% |
| Canadian | 47 | 0.4% |
| Central American | 43 | 0.3% |
| Cherokee | 14 | 0.1% |
| Chilean | 5 | 0.0% |
| Choctaw | 8 | 0.1% |
| Croatian | 29 | 0.2% |
| Cuban | 77 | 0.6% |
| Czech | 190 | 1.4% |
| Czechoslovakian | 4 | 0.0% |
| Danish | 15 | 0.1% |
| Dutch | 141 | 1.1% |
| Eastern European | 7 | 0.1% |
| English | 1,598 | 12.0% |
| European | 177 | 1.3% |
| French | 274 | 2.1% |
| French Canadian | 20 | 0.2% |
| German | 3,107 | 23.3% |
| Ghanaian | 39 | 0.3% |
| Greek | 71 | 0.5% |
| Hungarian | 59 | 0.4% |
| Indian (Asian) | 80 | 0.6% |
| Irish | 1,906 | 14.3% |
| Israeli | 23 | 0.2% |
| Italian | 432 | 3.2% |
| Korean | 119 | 0.9% |
| Menominee | 6 | 0.0% |
| Mexican | 78 | 0.6% |
| Norwegian | 73 | 0.5% |
| Palestinian | 19 | 0.1% |
| Polish | 283 | 2.1% |
| Puerto Rican | 57 | 0.4% |
| Russian | 11 | 0.1% |
| Salvadoran | 43 | 0.3% |
| Scandinavian | 70 | 0.5% |
| Scotch-Irish | 267 | 2.0% |
| Scottish | 233 | 1.7% |
| Slovak | 23 | 0.2% |
| South American | 5 | 0.0% |
| Spanish | 4 | 0.0% |
| Subsaharan African | 49 | 0.4% |
| Swedish | 28 | 0.2% |
| Swiss | 43 | 0.3% |
| Welsh | 87 | 0.6% |
| Yaqui | 24 | 0.2% |
| Yugoslavian | 18 | 0.1% | View All 52 Rows |
Immigrants in Marietta
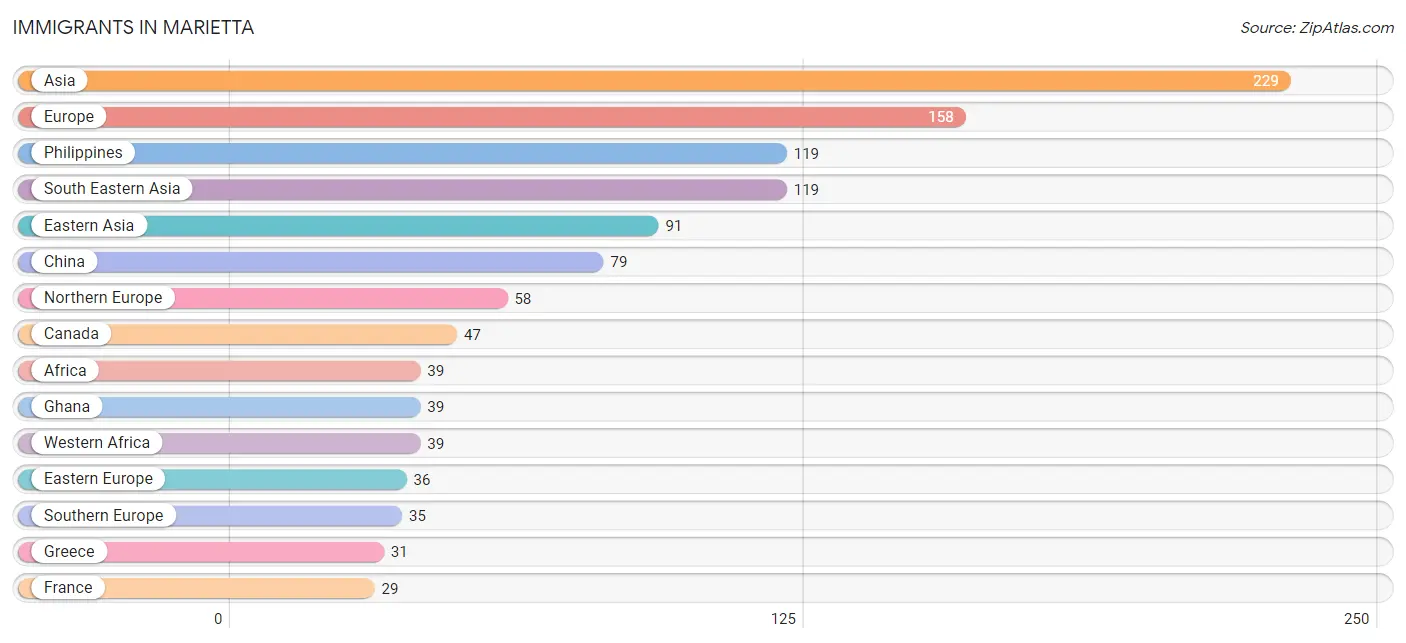
The most numerous immigrant groups reported in Marietta came from Asia (229 | 1.7%), Europe (158 | 1.2%), Philippines (119 | 0.9%), South Eastern Asia (119 | 0.9%), and Eastern Asia (91 | 0.7%), together accounting for 5.3% of all Marietta residents.
| Immigration Origin | # Population | % Population |
| Africa | 39 | 0.3% |
| Asia | 229 | 1.7% |
| Canada | 47 | 0.4% |
| Central America | 1 | 0.0% |
| China | 79 | 0.6% |
| Eastern Asia | 91 | 0.7% |
| Eastern Europe | 36 | 0.3% |
| England | 23 | 0.2% |
| Europe | 158 | 1.2% |
| France | 29 | 0.2% |
| Ghana | 39 | 0.3% |
| Greece | 31 | 0.2% |
| Guatemala | 1 | 0.0% |
| Italy | 4 | 0.0% |
| Japan | 12 | 0.1% |
| Latin America | 1 | 0.0% |
| Lebanon | 5 | 0.0% |
| Moldova | 15 | 0.1% |
| Northern Europe | 58 | 0.4% |
| Oceania | 6 | 0.0% |
| Philippines | 119 | 0.9% |
| Russia | 21 | 0.2% |
| Saudi Arabia | 14 | 0.1% |
| South Eastern Asia | 119 | 0.9% |
| Southern Europe | 35 | 0.3% |
| Western Africa | 39 | 0.3% |
| Western Asia | 19 | 0.1% |
| Western Europe | 29 | 0.2% | View All 28 Rows |
Sex and Age in Marietta
Sex and Age in Marietta
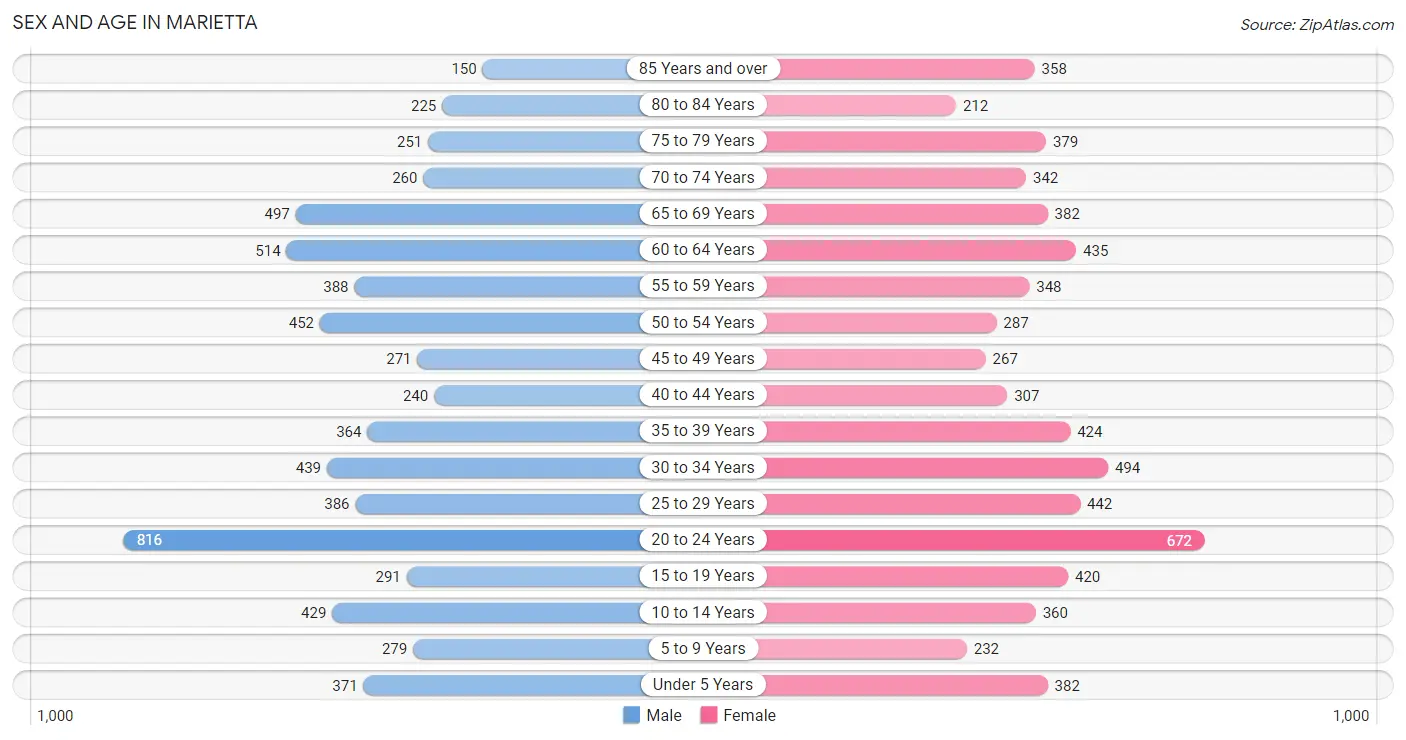
The most populous age groups in Marietta are 20 to 24 Years (816 | 12.3%) for men and 20 to 24 Years (672 | 10.0%) for women.
| Age Bracket | Male | Female |
| Under 5 Years | 371 (5.6%) | 382 (5.7%) |
| 5 to 9 Years | 279 (4.2%) | 232 (3.4%) |
| 10 to 14 Years | 429 (6.5%) | 360 (5.3%) |
| 15 to 19 Years | 291 (4.4%) | 420 (6.2%) |
| 20 to 24 Years | 816 (12.3%) | 672 (10.0%) |
| 25 to 29 Years | 386 (5.8%) | 442 (6.6%) |
| 30 to 34 Years | 439 (6.6%) | 494 (7.3%) |
| 35 to 39 Years | 364 (5.5%) | 424 (6.3%) |
| 40 to 44 Years | 240 (3.6%) | 307 (4.5%) |
| 45 to 49 Years | 271 (4.1%) | 267 (4.0%) |
| 50 to 54 Years | 452 (6.8%) | 287 (4.3%) |
| 55 to 59 Years | 388 (5.9%) | 348 (5.2%) |
| 60 to 64 Years | 514 (7.8%) | 435 (6.5%) |
| 65 to 69 Years | 497 (7.5%) | 382 (5.7%) |
| 70 to 74 Years | 260 (3.9%) | 342 (5.1%) |
| 75 to 79 Years | 251 (3.8%) | 379 (5.6%) |
| 80 to 84 Years | 225 (3.4%) | 212 (3.1%) |
| 85 Years and over | 150 (2.3%) | 358 (5.3%) |
| Total | 6,623 (100.0%) | 6,743 (100.0%) |
Families and Households in Marietta
Median Family Size in Marietta
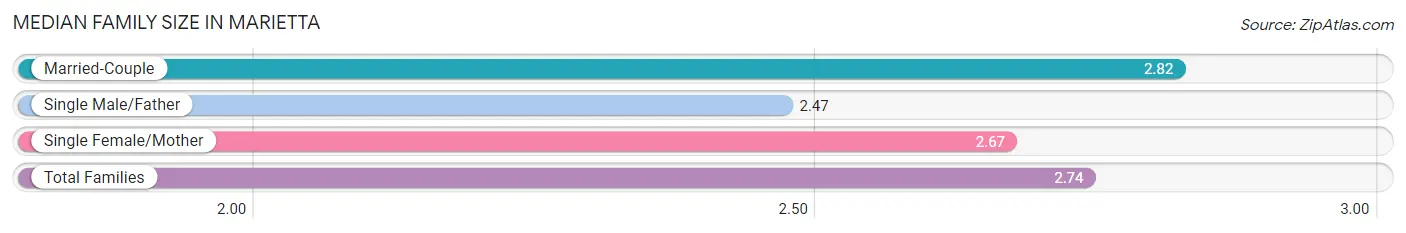
The median family size in Marietta is 2.74 persons per family, with married-couple families (1,916 | 61.9%) accounting for the largest median family size of 2.82 persons per family. On the other hand, single male/father families (264 | 8.5%) represent the smallest median family size with 2.47 persons per family.
| Family Type | # Families | Family Size |
| Married-Couple | 1,916 (61.9%) | 2.82 |
| Single Male/Father | 264 (8.5%) | 2.47 |
| Single Female/Mother | 917 (29.6%) | 2.67 |
| Total Families | 3,097 (100.0%) | 2.74 |
Median Household Size in Marietta
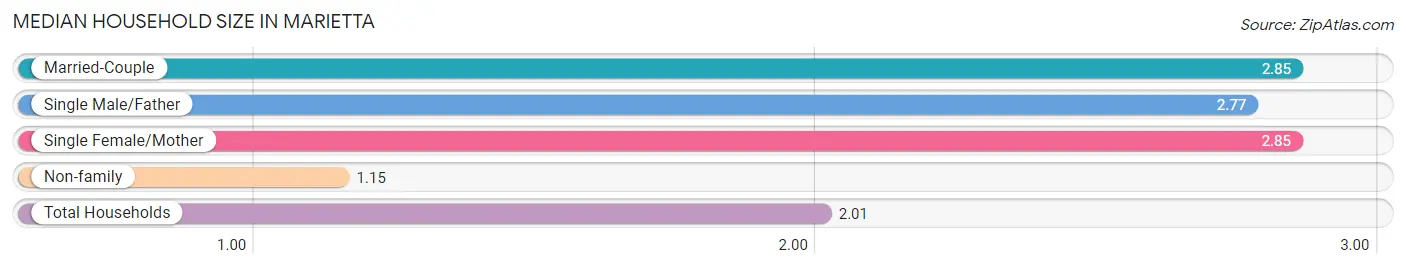
The median household size in Marietta is 2.01 persons per household, with married-couple households (1,916 | 31.6%) accounting for the largest median household size of 2.85 persons per household. non-family households (2,976 | 49.0%) represent the smallest median household size with 1.15 persons per household.
| Household Type | # Households | Household Size |
| Married-Couple | 1,916 (31.6%) | 2.85 |
| Single Male/Father | 264 (4.3%) | 2.77 |
| Single Female/Mother | 917 (15.1%) | 2.85 |
| Non-family | 2,976 (49.0%) | 1.15 |
| Total Households | 6,073 (100.0%) | 2.01 |
Household Size by Marriage Status in Marietta
Out of a total of 6,073 households in Marietta, 3,097 (51.0%) are family households, while 2,976 (49.0%) are nonfamily households. The most numerous type of family households are 2-person households, comprising 1,663, and the most common type of nonfamily households are 1-person households, comprising 2,535.
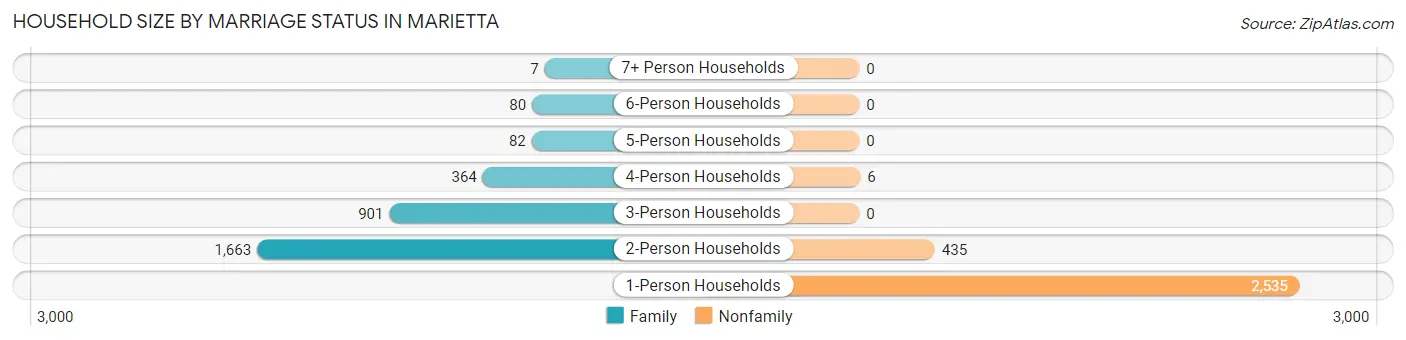
| Household Size | Family Households | Nonfamily Households |
| 1-Person Households | - | 2,535 (41.7%) |
| 2-Person Households | 1,663 (27.4%) | 435 (7.2%) |
| 3-Person Households | 901 (14.8%) | 0 (0.0%) |
| 4-Person Households | 364 (6.0%) | 6 (0.1%) |
| 5-Person Households | 82 (1.3%) | 0 (0.0%) |
| 6-Person Households | 80 (1.3%) | 0 (0.0%) |
| 7+ Person Households | 7 (0.1%) | 0 (0.0%) |
| Total | 3,097 (51.0%) | 2,976 (49.0%) |
Female Fertility in Marietta
Fertility by Age in Marietta
Average fertility rate in Marietta is 75.0 births per 1,000 women. Women in the age bracket of 20 to 34 years have the highest fertility rate with 106.0 births per 1,000 women. Women in the age bracket of 20 to 34 years acount for 74.2% of all women with births.
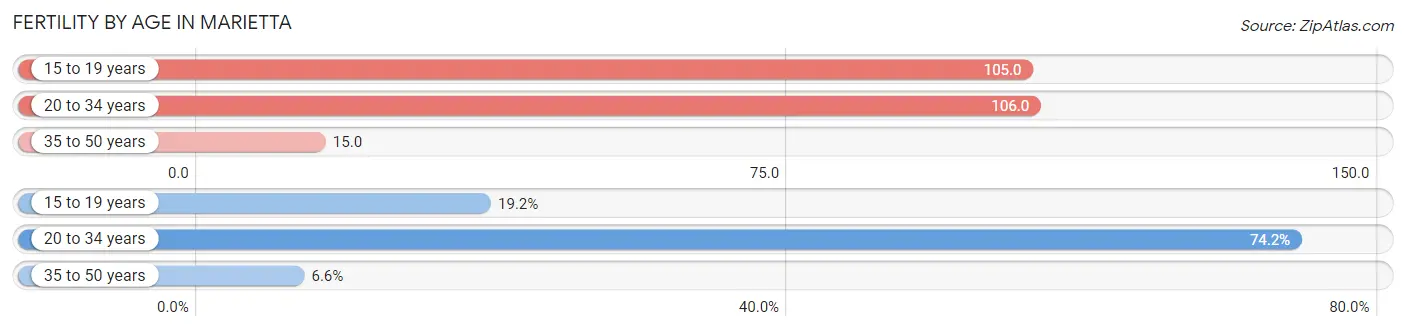
| Age Bracket | Women with Births | Births / 1,000 Women |
| 15 to 19 years | 44 (19.2%) | 105.0 |
| 20 to 34 years | 170 (74.2%) | 106.0 |
| 35 to 50 years | 15 (6.6%) | 15.0 |
| Total | 229 (100.0%) | 75.0 |
Fertility by Age by Marriage Status in Marietta
32.3% of women with births (229) in Marietta are married. The highest percentage of unmarried women with births falls into 15 to 19 years age bracket with 100.0% of them unmarried at the time of birth, while the lowest percentage of unmarried women with births belong to 35 to 50 years age bracket with 0.0% of them unmarried.
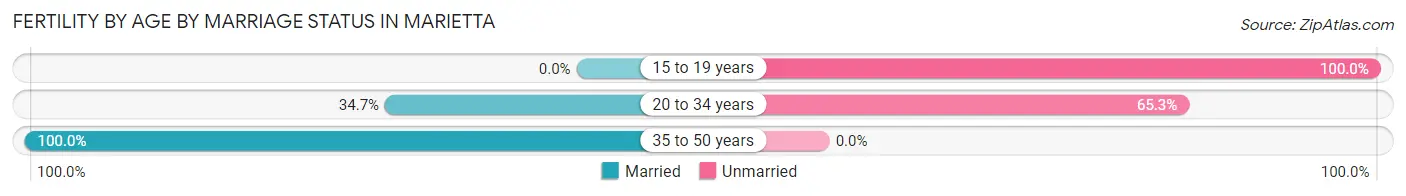
| Age Bracket | Married | Unmarried |
| 15 to 19 years | 0 (0.0%) | 44 (100.0%) |
| 20 to 34 years | 59 (34.7%) | 111 (65.3%) |
| 35 to 50 years | 15 (100.0%) | 0 (0.0%) |
| Total | 74 (32.3%) | 155 (67.7%) |
Fertility by Education in Marietta
Average fertility rate in Marietta is 75.0 births per 1,000 women. Women with the education attainment of graduate degree have the highest fertility rate of 119.0 births per 1,000 women, while women with the education attainment of bachelor's degree have the lowest fertility at 4.0 births per 1,000 women. Women with the education attainment of college or associate's degree represent 45.4% of all women with births.
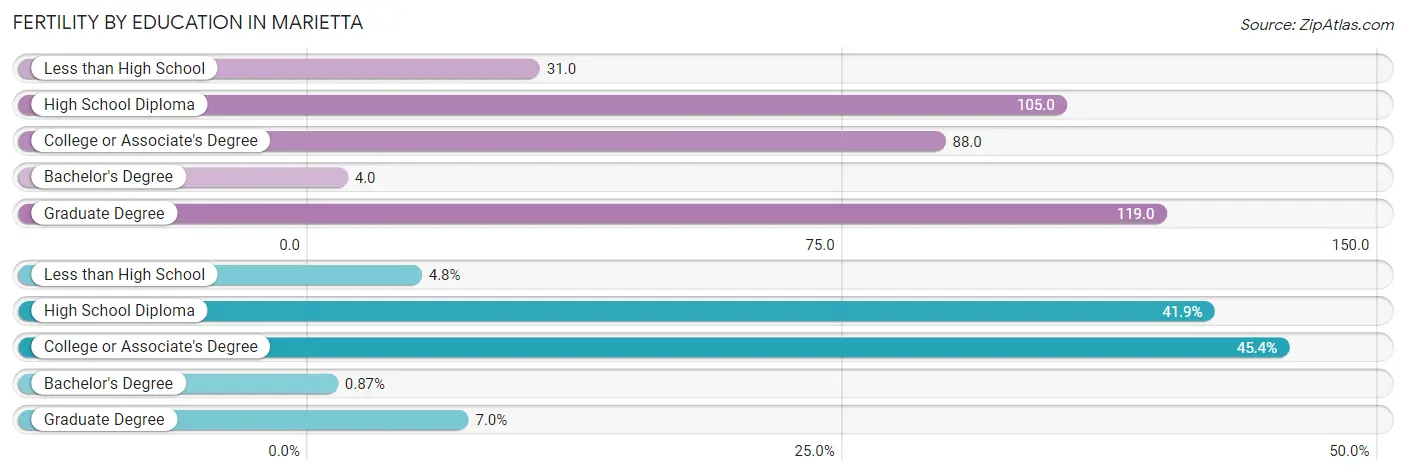
| Educational Attainment | Women with Births | Births / 1,000 Women |
| Less than High School | 11 (4.8%) | 31.0 |
| High School Diploma | 96 (41.9%) | 105.0 |
| College or Associate's Degree | 104 (45.4%) | 88.0 |
| Bachelor's Degree | 2 (0.9%) | 4.0 |
| Graduate Degree | 16 (7.0%) | 119.0 |
| Total | 229 (100.0%) | 75.0 |
Fertility by Education by Marriage Status in Marietta
67.7% of women with births in Marietta are unmarried. Women with the educational attainment of graduate degree are most likely to be married with 100.0% of them married at childbirth, while women with the educational attainment of less than high school are least likely to be married with 100.0% of them unmarried at childbirth.
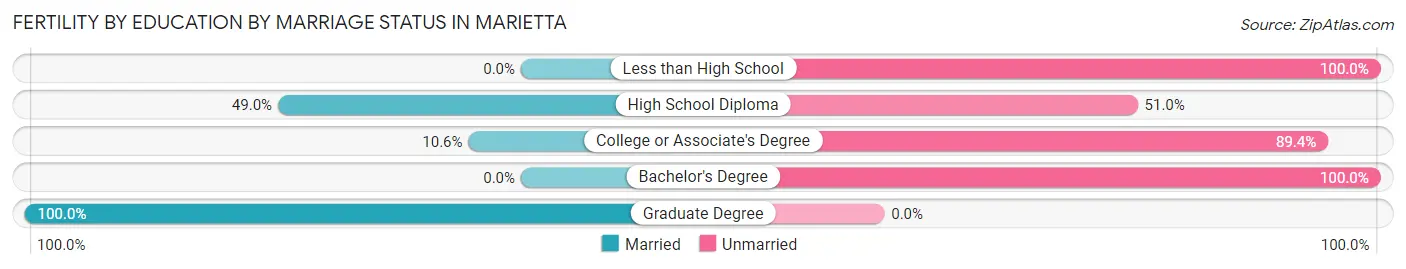
| Educational Attainment | Married | Unmarried |
| Less than High School | 0 (0.0%) | 11 (100.0%) |
| High School Diploma | 47 (49.0%) | 49 (51.0%) |
| College or Associate's Degree | 11 (10.6%) | 93 (89.4%) |
| Bachelor's Degree | 0 (0.0%) | 2 (100.0%) |
| Graduate Degree | 16 (100.0%) | 0 (0.0%) |
| Total | 74 (32.3%) | 155 (67.7%) |
Employment Characteristics in Marietta
Employment by Class of Employer in Marietta
Among the 5,919 employed individuals in Marietta, private company employees (4,130 | 69.8%), not-for-profit organizations (807 | 13.6%), and local government employees (377 | 6.4%) make up the most common classes of employment.
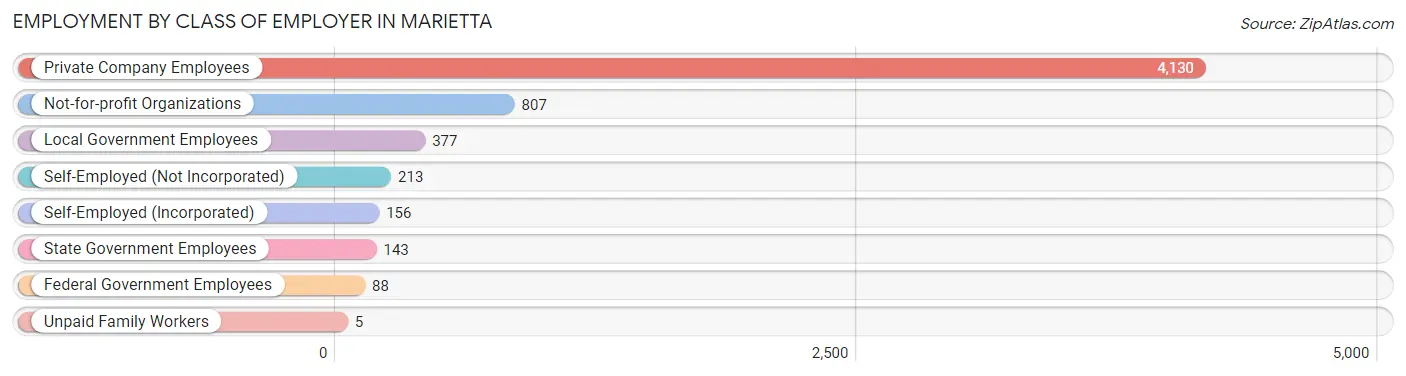
| Employer Class | # Employees | % Employees |
| Private Company Employees | 4,130 | 69.8% |
| Self-Employed (Incorporated) | 156 | 2.6% |
| Self-Employed (Not Incorporated) | 213 | 3.6% |
| Not-for-profit Organizations | 807 | 13.6% |
| Local Government Employees | 377 | 6.4% |
| State Government Employees | 143 | 2.4% |
| Federal Government Employees | 88 | 1.5% |
| Unpaid Family Workers | 5 | 0.1% |
| Total | 5,919 | 100.0% |
Employment Status by Age in Marietta
According to the labor force statistics for Marietta, out of the total population over 16 years of age (11,211), 57.4% or 6,435 individuals are in the labor force, with 5.6% or 360 of them unemployed. The age group with the highest labor force participation rate is 35 to 44 years, with 84.1% or 1,123 individuals in the labor force. Within the labor force, the 20 to 24 years age range has the highest percentage of unemployed individuals, with 11.2% or 126 of them being unemployed.
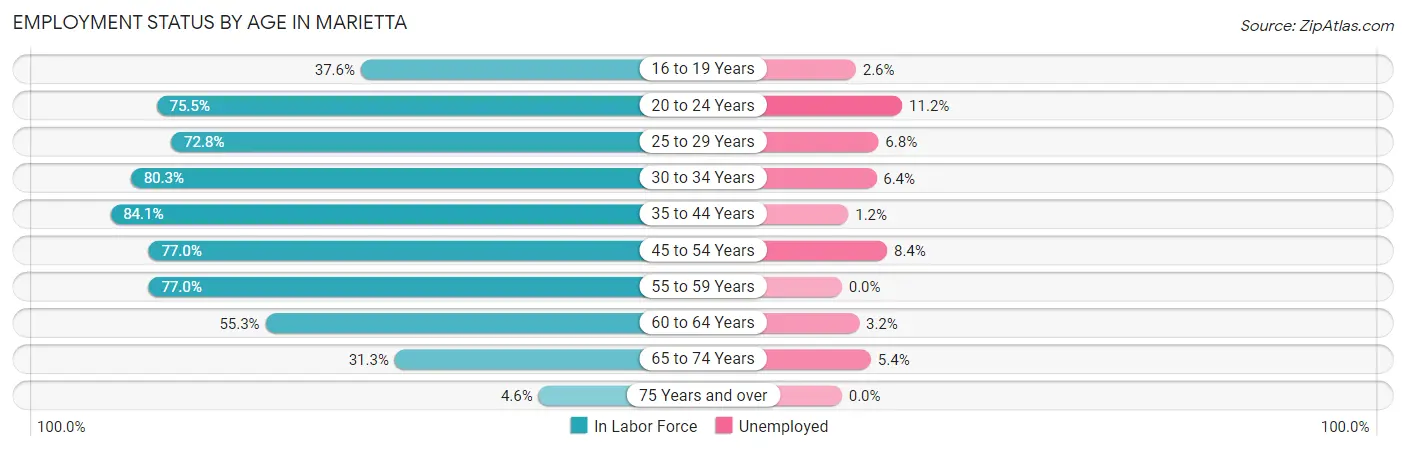
| Age Bracket | In Labor Force | Unemployed |
| 16 to 19 Years | 229 (37.6%) | 6 (2.6%) |
| 20 to 24 Years | 1,123 (75.5%) | 126 (11.2%) |
| 25 to 29 Years | 603 (72.8%) | 41 (6.8%) |
| 30 to 34 Years | 749 (80.3%) | 48 (6.4%) |
| 35 to 44 Years | 1,123 (84.1%) | 13 (1.2%) |
| 45 to 54 Years | 983 (77.0%) | 83 (8.4%) |
| 55 to 59 Years | 567 (77.0%) | 0 (0.0%) |
| 60 to 64 Years | 525 (55.3%) | 17 (3.2%) |
| 65 to 74 Years | 464 (31.3%) | 25 (5.4%) |
| 75 Years and over | 72 (4.6%) | 0 (0.0%) |
| Total | 6,435 (57.4%) | 360 (5.6%) |
Employment Status by Educational Attainment in Marietta
According to labor force statistics for Marietta, 75.1% of individuals (4,550) out of the total population between 25 and 64 years of age (6,058) are in the labor force, with 4.5% or 205 of them being unemployed. The group with the highest labor force participation rate are those with the educational attainment of bachelor's degree or higher, with 85.7% or 1,453 individuals in the labor force. Within the labor force, individuals with less than high school education have the highest percentage of unemployment, with 25.8% or 76 of them being unemployed.
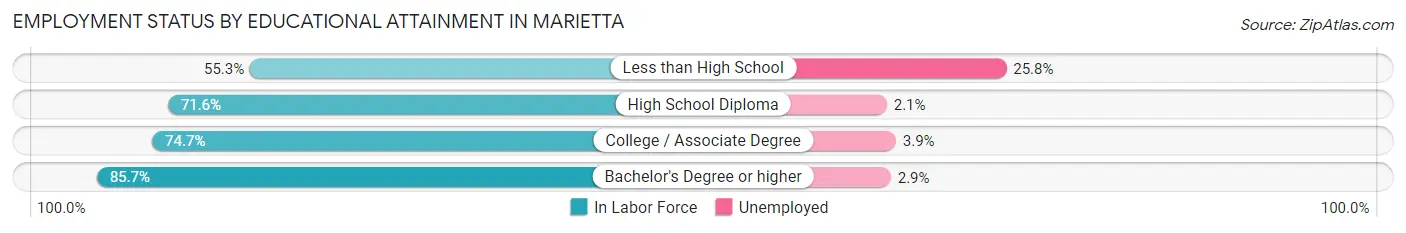
| Educational Attainment | In Labor Force | Unemployed |
| Less than High School | 295 (55.3%) | 138 (25.8%) |
| High School Diploma | 1,355 (71.6%) | 40 (2.1%) |
| College / Associate Degree | 1,448 (74.7%) | 76 (3.9%) |
| Bachelor's Degree or higher | 1,453 (85.7%) | 49 (2.9%) |
| Total | 4,550 (75.1%) | 273 (4.5%) |
Employment Occupations by Sex in Marietta
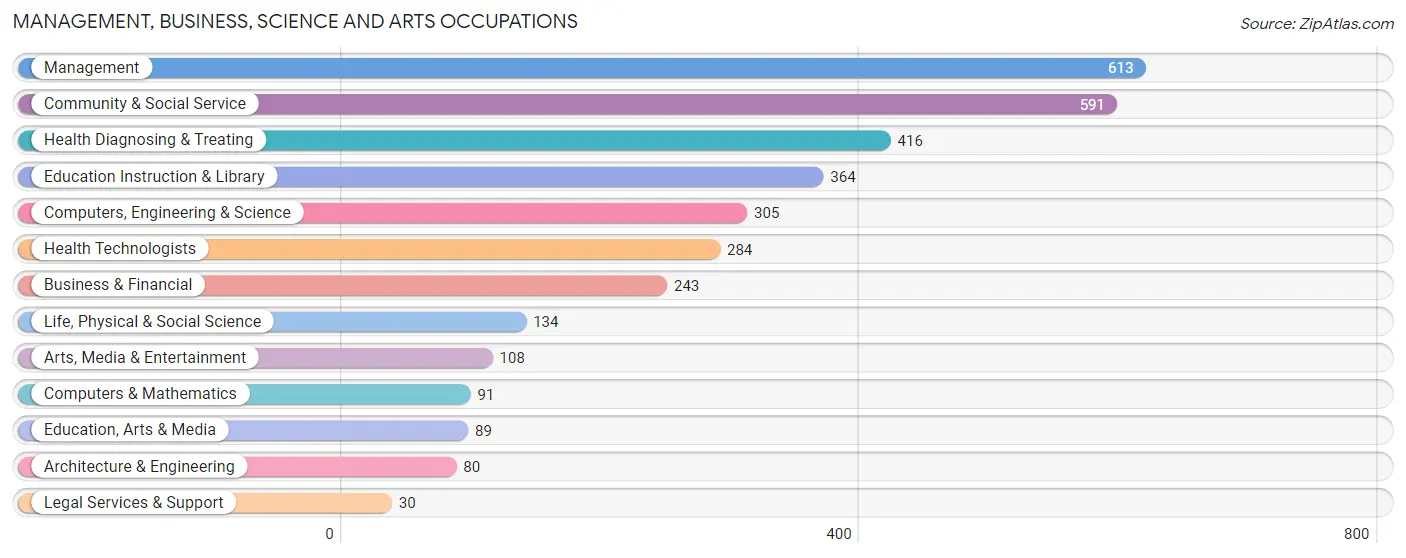
Management, Business, Science and Arts Occupations
The most common Management, Business, Science and Arts occupations in Marietta are Management (613 | 10.1%), Community & Social Service (591 | 9.8%), Health Diagnosing & Treating (416 | 6.9%), Education Instruction & Library (364 | 6.0%), and Computers, Engineering & Science (305 | 5.0%).
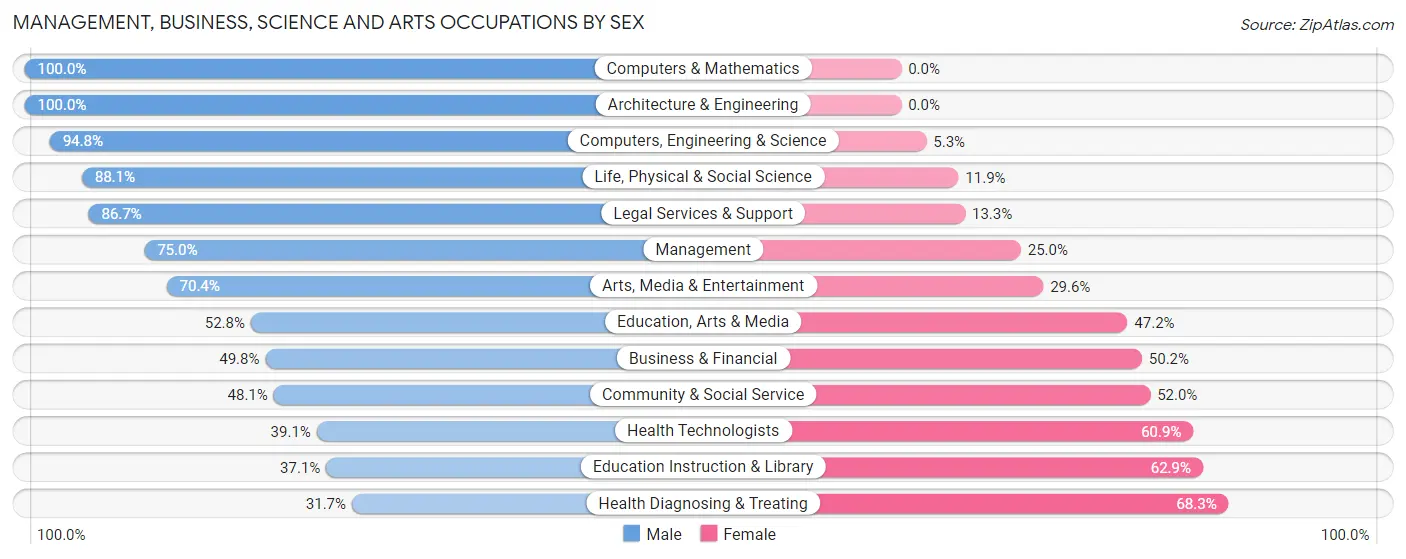
Management, Business, Science and Arts Occupations by Sex
Within the Management, Business, Science and Arts occupations in Marietta, the most male-oriented occupations are Computers & Mathematics (100.0%), Architecture & Engineering (100.0%), and Computers, Engineering & Science (94.8%), while the most female-oriented occupations are Health Diagnosing & Treating (68.3%), Education Instruction & Library (62.9%), and Health Technologists (60.9%).
| Occupation | Male | Female |
| Management | 460 (75.0%) | 153 (25.0%) |
| Business & Financial | 121 (49.8%) | 122 (50.2%) |
| Computers, Engineering & Science | 289 (94.8%) | 16 (5.2%) |
| Computers & Mathematics | 91 (100.0%) | 0 (0.0%) |
| Architecture & Engineering | 80 (100.0%) | 0 (0.0%) |
| Life, Physical & Social Science | 118 (88.1%) | 16 (11.9%) |
| Community & Social Service | 284 (48.0%) | 307 (51.9%) |
| Education, Arts & Media | 47 (52.8%) | 42 (47.2%) |
| Legal Services & Support | 26 (86.7%) | 4 (13.3%) |
| Education Instruction & Library | 135 (37.1%) | 229 (62.9%) |
| Arts, Media & Entertainment | 76 (70.4%) | 32 (29.6%) |
| Health Diagnosing & Treating | 132 (31.7%) | 284 (68.3%) |
| Health Technologists | 111 (39.1%) | 173 (60.9%) |
| Total (Category) | 1,286 (59.3%) | 882 (40.7%) |
| Total (Overall) | 3,356 (55.4%) | 2,705 (44.6%) |
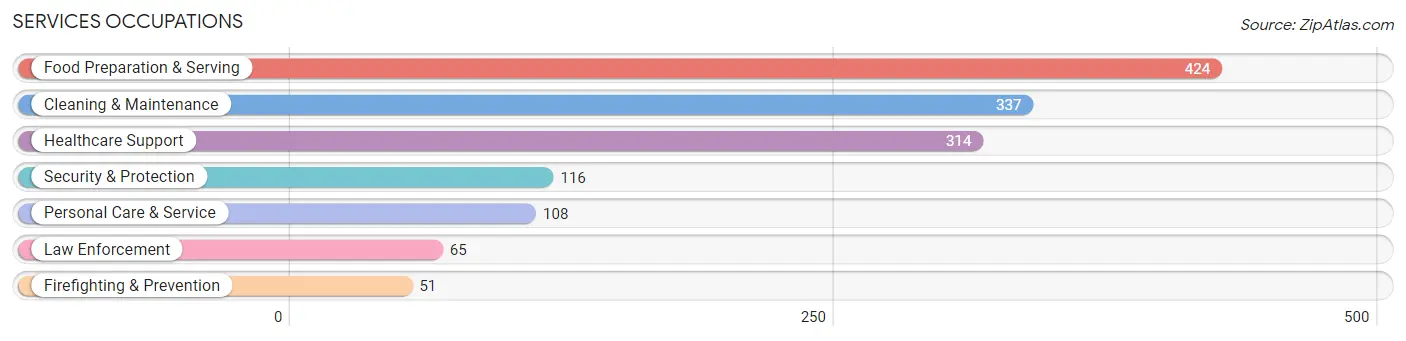
Services Occupations
The most common Services occupations in Marietta are Food Preparation & Serving (424 | 7.0%), Cleaning & Maintenance (337 | 5.6%), Healthcare Support (314 | 5.2%), Security & Protection (116 | 1.9%), and Personal Care & Service (108 | 1.8%).
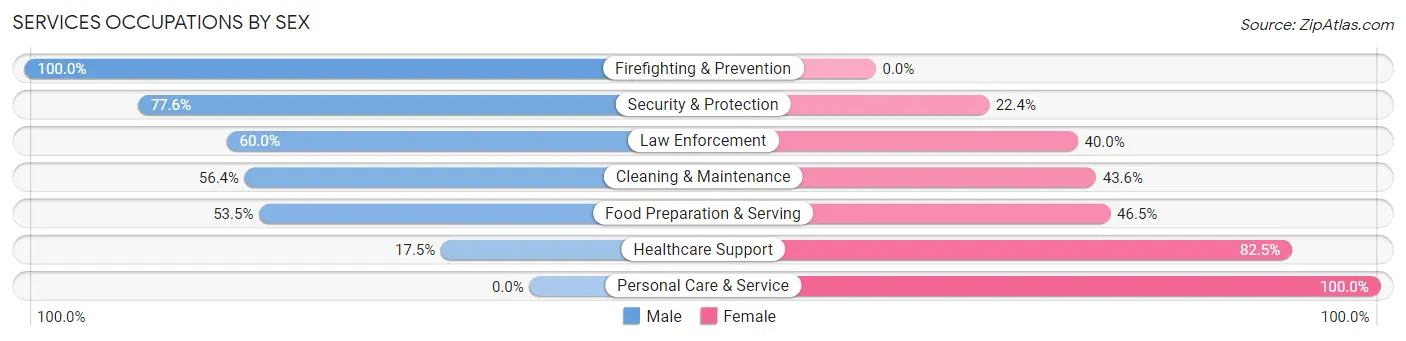
Services Occupations by Sex
Within the Services occupations in Marietta, the most male-oriented occupations are Firefighting & Prevention (100.0%), Security & Protection (77.6%), and Law Enforcement (60.0%), while the most female-oriented occupations are Personal Care & Service (100.0%), Healthcare Support (82.5%), and Food Preparation & Serving (46.5%).
| Occupation | Male | Female |
| Healthcare Support | 55 (17.5%) | 259 (82.5%) |
| Security & Protection | 90 (77.6%) | 26 (22.4%) |
| Firefighting & Prevention | 51 (100.0%) | 0 (0.0%) |
| Law Enforcement | 39 (60.0%) | 26 (40.0%) |
| Food Preparation & Serving | 227 (53.5%) | 197 (46.5%) |
| Cleaning & Maintenance | 190 (56.4%) | 147 (43.6%) |
| Personal Care & Service | 0 (0.0%) | 108 (100.0%) |
| Total (Category) | 562 (43.3%) | 737 (56.7%) |
| Total (Overall) | 3,356 (55.4%) | 2,705 (44.6%) |
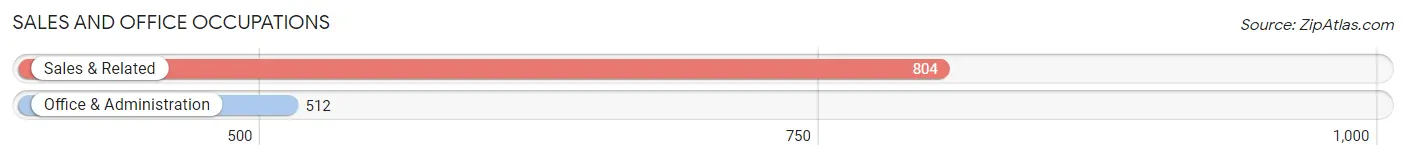
Sales and Office Occupations
The most common Sales and Office occupations in Marietta are Sales & Related (804 | 13.3%), and Office & Administration (512 | 8.5%).
Sales and Office Occupations by Sex
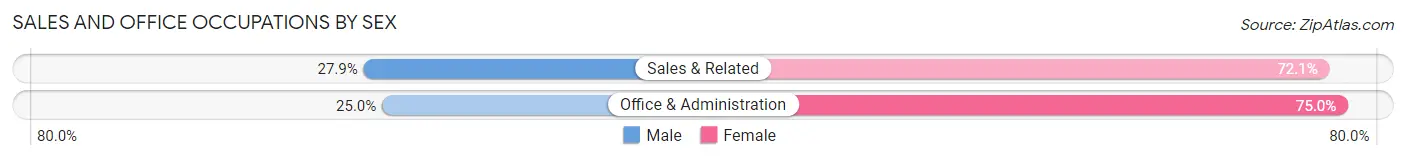
| Occupation | Male | Female |
| Sales & Related | 224 (27.9%) | 580 (72.1%) |
| Office & Administration | 128 (25.0%) | 384 (75.0%) |
| Total (Category) | 352 (26.8%) | 964 (73.3%) |
| Total (Overall) | 3,356 (55.4%) | 2,705 (44.6%) |
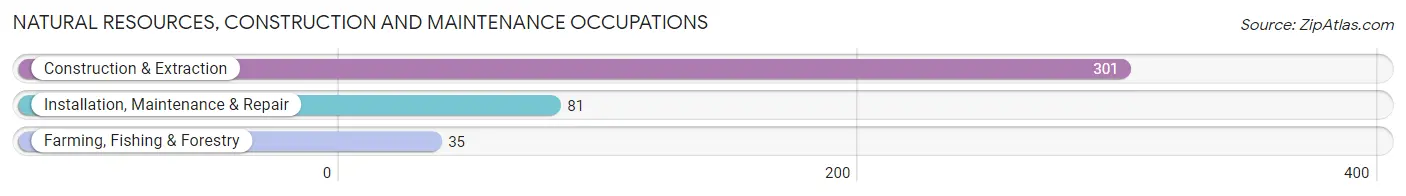
Natural Resources, Construction and Maintenance Occupations
The most common Natural Resources, Construction and Maintenance occupations in Marietta are Construction & Extraction (301 | 5.0%), Installation, Maintenance & Repair (81 | 1.3%), and Farming, Fishing & Forestry (35 | 0.6%).
Natural Resources, Construction and Maintenance Occupations by Sex
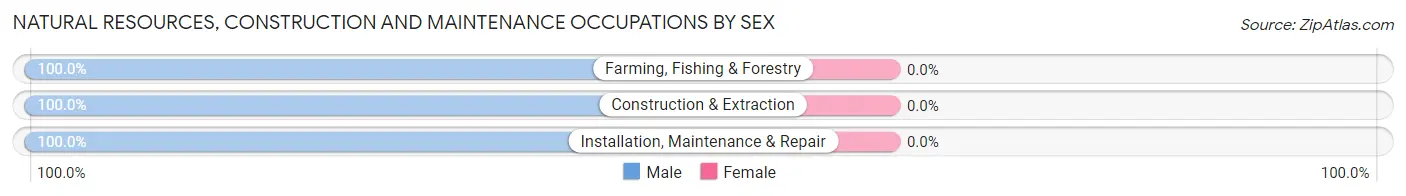
| Occupation | Male | Female |
| Farming, Fishing & Forestry | 35 (100.0%) | 0 (0.0%) |
| Construction & Extraction | 301 (100.0%) | 0 (0.0%) |
| Installation, Maintenance & Repair | 81 (100.0%) | 0 (0.0%) |
| Total (Category) | 417 (100.0%) | 0 (0.0%) |
| Total (Overall) | 3,356 (55.4%) | 2,705 (44.6%) |
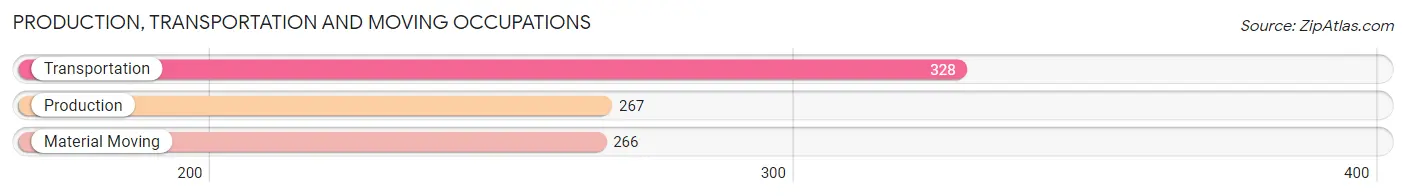
Production, Transportation and Moving Occupations
The most common Production, Transportation and Moving occupations in Marietta are Transportation (328 | 5.4%), Production (267 | 4.4%), and Material Moving (266 | 4.4%).
Production, Transportation and Moving Occupations by Sex
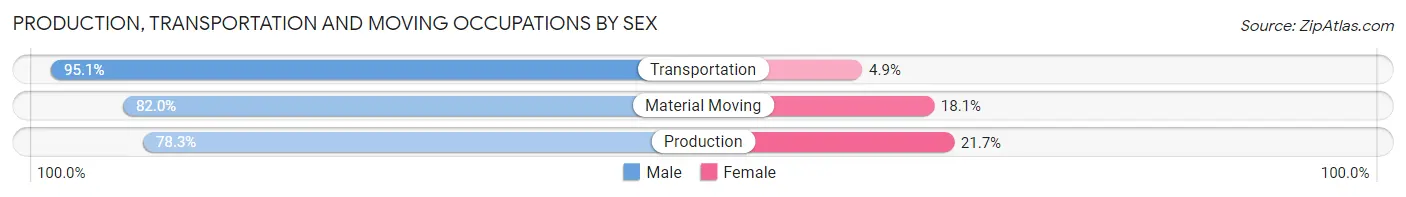
| Occupation | Male | Female |
| Production | 209 (78.3%) | 58 (21.7%) |
| Transportation | 312 (95.1%) | 16 (4.9%) |
| Material Moving | 218 (82.0%) | 48 (18.0%) |
| Total (Category) | 739 (85.8%) | 122 (14.2%) |
| Total (Overall) | 3,356 (55.4%) | 2,705 (44.6%) |
Employment Industries by Sex in Marietta
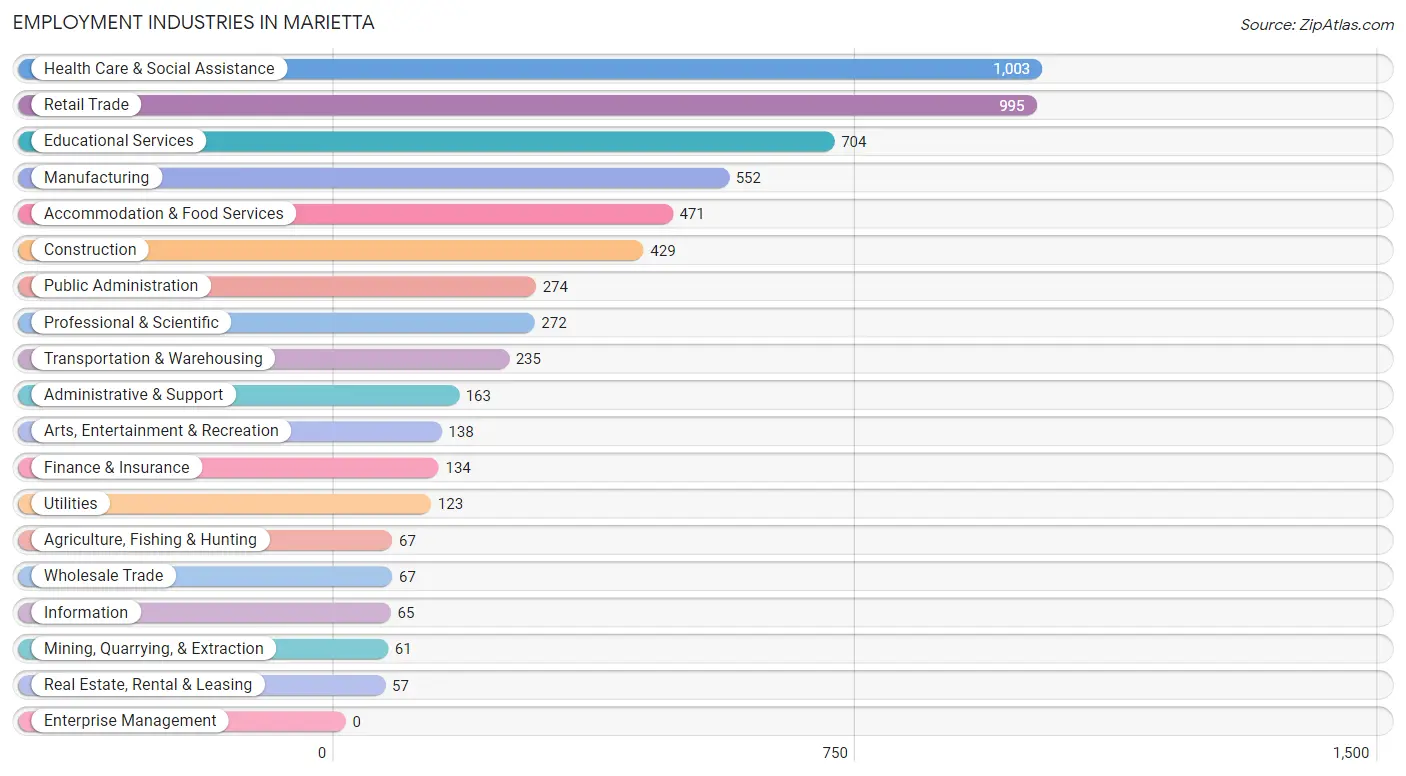
Employment Industries in Marietta
The major employment industries in Marietta include Health Care & Social Assistance (1,003 | 16.6%), Retail Trade (995 | 16.4%), Educational Services (704 | 11.6%), Manufacturing (552 | 9.1%), and Accommodation & Food Services (471 | 7.8%).
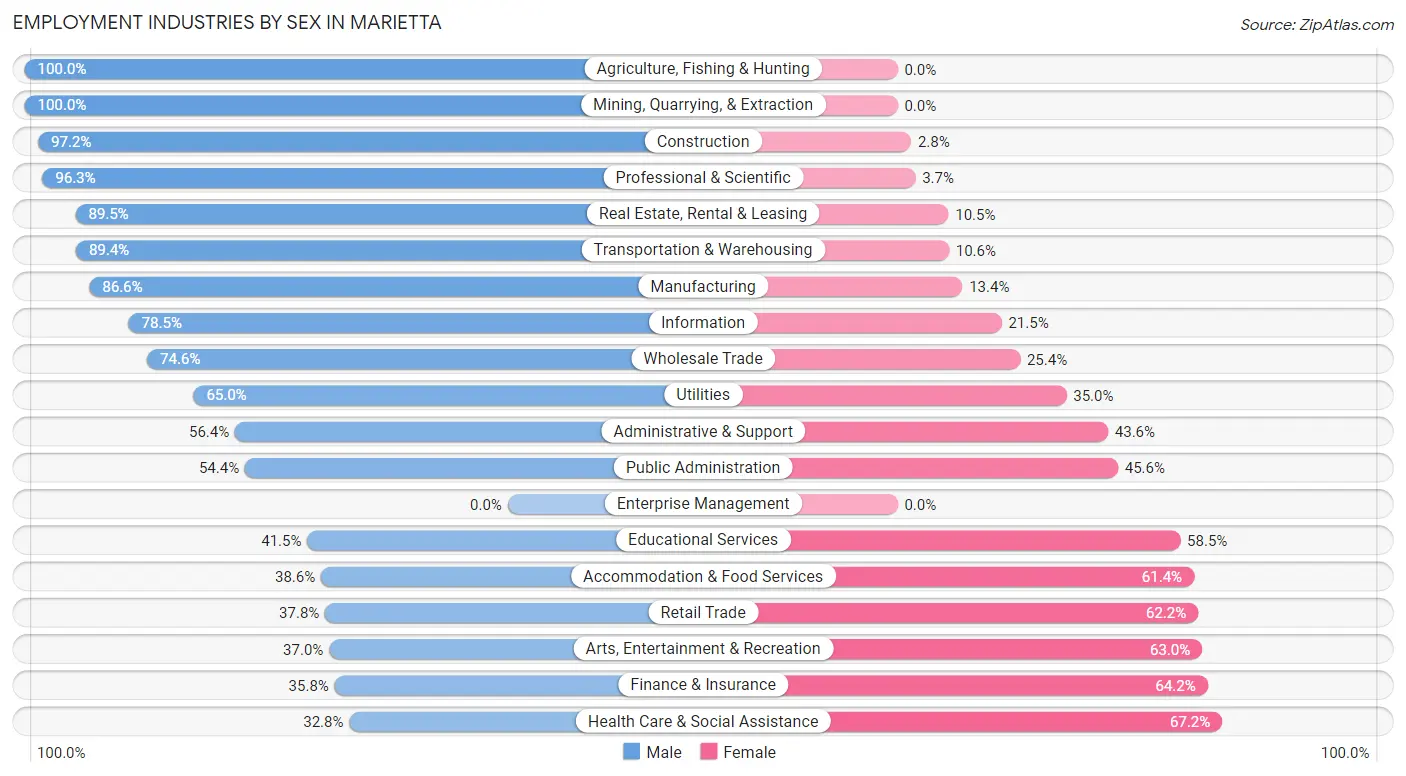
Employment Industries by Sex in Marietta
The Marietta industries that see more men than women are Agriculture, Fishing & Hunting (100.0%), Mining, Quarrying, & Extraction (100.0%), and Construction (97.2%), whereas the industries that tend to have a higher number of women are Health Care & Social Assistance (67.2%), Finance & Insurance (64.2%), and Arts, Entertainment & Recreation (63.0%).
| Industry | Male | Female |
| Agriculture, Fishing & Hunting | 67 (100.0%) | 0 (0.0%) |
| Mining, Quarrying, & Extraction | 61 (100.0%) | 0 (0.0%) |
| Construction | 417 (97.2%) | 12 (2.8%) |
| Manufacturing | 478 (86.6%) | 74 (13.4%) |
| Wholesale Trade | 50 (74.6%) | 17 (25.4%) |
| Retail Trade | 376 (37.8%) | 619 (62.2%) |
| Transportation & Warehousing | 210 (89.4%) | 25 (10.6%) |
| Utilities | 80 (65.0%) | 43 (35.0%) |
| Information | 51 (78.5%) | 14 (21.5%) |
| Finance & Insurance | 48 (35.8%) | 86 (64.2%) |
| Real Estate, Rental & Leasing | 51 (89.5%) | 6 (10.5%) |
| Professional & Scientific | 262 (96.3%) | 10 (3.7%) |
| Enterprise Management | 0 (0.0%) | 0 (0.0%) |
| Administrative & Support | 92 (56.4%) | 71 (43.6%) |
| Educational Services | 292 (41.5%) | 412 (58.5%) |
| Health Care & Social Assistance | 329 (32.8%) | 674 (67.2%) |
| Arts, Entertainment & Recreation | 51 (37.0%) | 87 (63.0%) |
| Accommodation & Food Services | 182 (38.6%) | 289 (61.4%) |
| Public Administration | 149 (54.4%) | 125 (45.6%) |
| Total | 3,356 (55.4%) | 2,705 (44.6%) |
Education in Marietta
School Enrollment in Marietta
The most common levels of schooling among the 2,827 students in Marietta are college / undergraduate (984 | 34.8%), middle school (602 | 21.3%), and high school (389 | 13.8%).
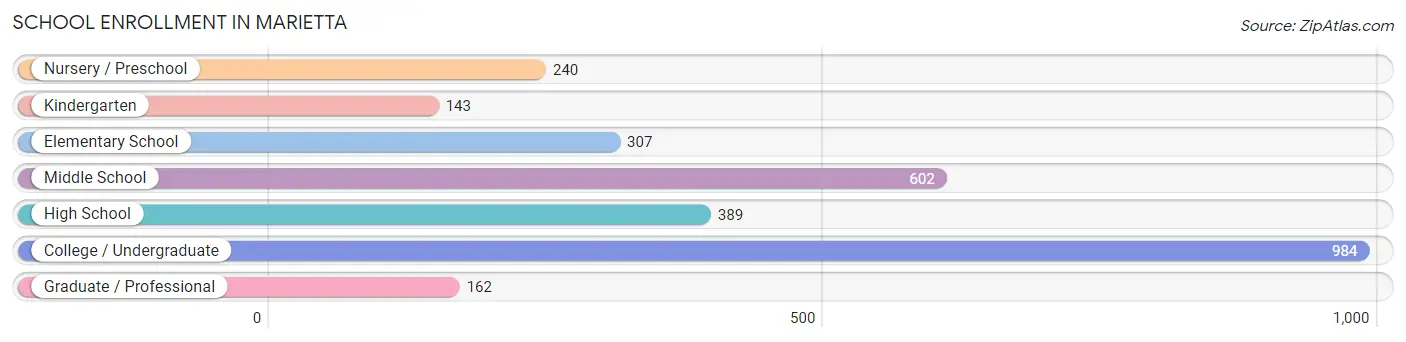
| School Level | # Students | % Students |
| Nursery / Preschool | 240 | 8.5% |
| Kindergarten | 143 | 5.1% |
| Elementary School | 307 | 10.9% |
| Middle School | 602 | 21.3% |
| High School | 389 | 13.8% |
| College / Undergraduate | 984 | 34.8% |
| Graduate / Professional | 162 | 5.7% |
| Total | 2,827 | 100.0% |
School Enrollment by Age by Funding Source in Marietta
Out of a total of 2,827 students who are enrolled in schools in Marietta, 907 (32.1%) attend a private institution, while the remaining 1,920 (67.9%) are enrolled in public schools. The age group of 18 to 19 year olds has the highest likelihood of being enrolled in private schools, with 234 (74.5% in the age bracket) enrolled. Conversely, the age group of 15 to 17 year olds has the lowest likelihood of being enrolled in a private school, with 302 (95.0% in the age bracket) attending a public institution.
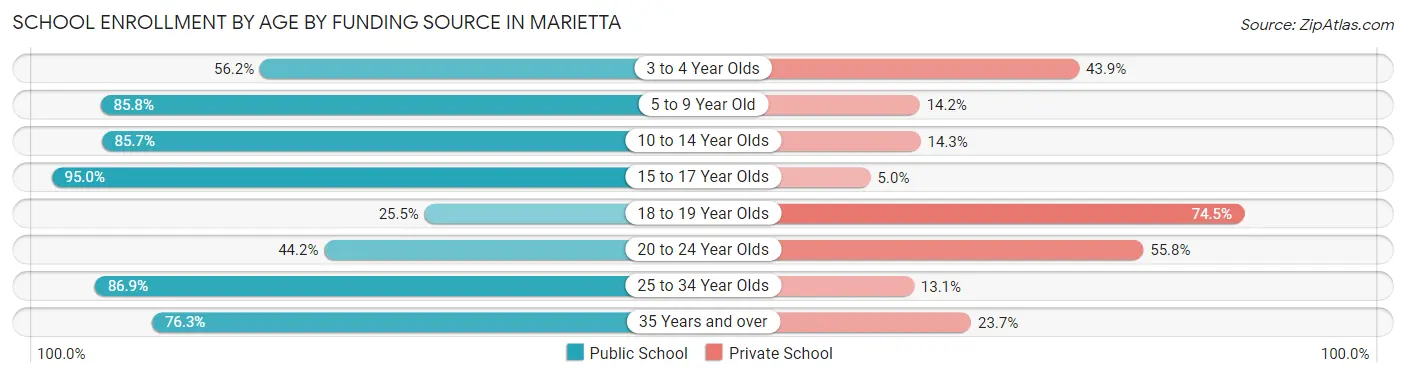
| Age Bracket | Public School | Private School |
| 3 to 4 Year Olds | 105 (56.1%) | 82 (43.9%) |
| 5 to 9 Year Old | 388 (85.8%) | 64 (14.2%) |
| 10 to 14 Year Olds | 562 (85.7%) | 94 (14.3%) |
| 15 to 17 Year Olds | 302 (95.0%) | 16 (5.0%) |
| 18 to 19 Year Olds | 80 (25.5%) | 234 (74.5%) |
| 20 to 24 Year Olds | 304 (44.2%) | 384 (55.8%) |
| 25 to 34 Year Olds | 133 (86.9%) | 20 (13.1%) |
| 35 Years and over | 45 (76.3%) | 14 (23.7%) |
| Total | 1,920 (67.9%) | 907 (32.1%) |
Educational Attainment by Field of Study in Marietta
Business (668 | 22.6%), education (364 | 12.3%), science & technology (293 | 9.9%), engineering (219 | 7.4%), and bio, nature & agricultural (210 | 7.1%) are the most common fields of study among 2,954 individuals in Marietta who have obtained a bachelor's degree or higher.
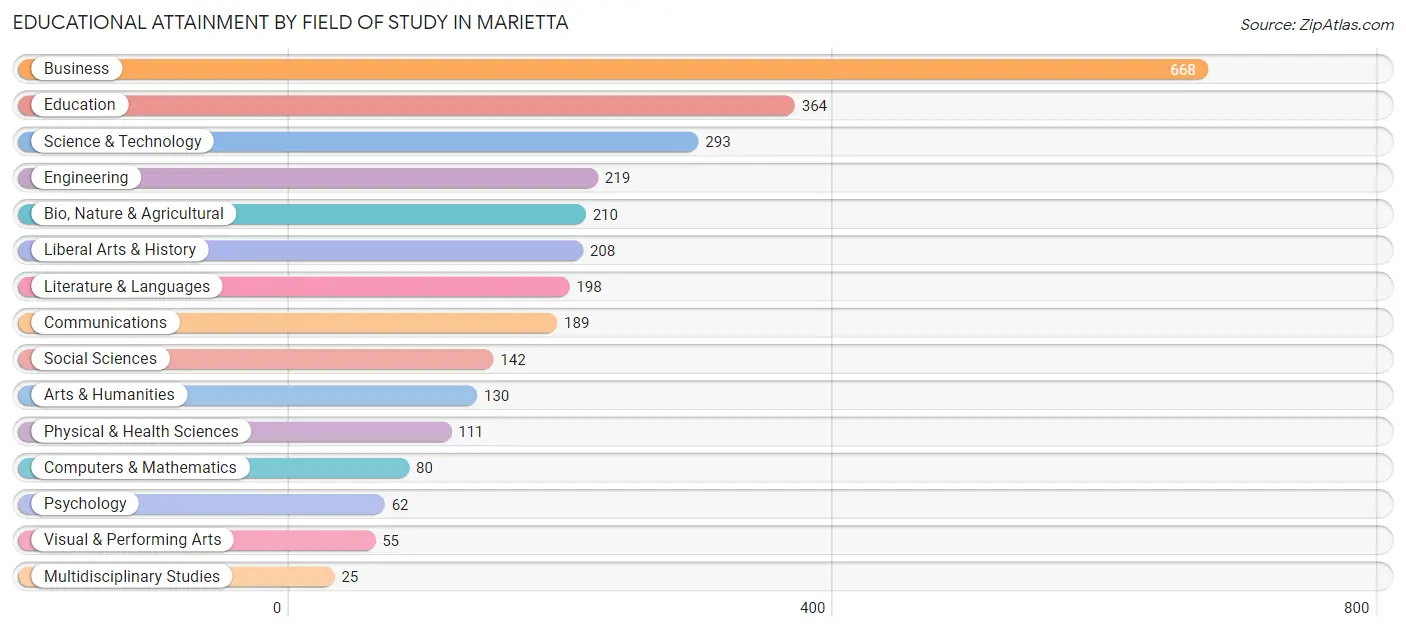
| Field of Study | # Graduates | % Graduates |
| Computers & Mathematics | 80 | 2.7% |
| Bio, Nature & Agricultural | 210 | 7.1% |
| Physical & Health Sciences | 111 | 3.8% |
| Psychology | 62 | 2.1% |
| Social Sciences | 142 | 4.8% |
| Engineering | 219 | 7.4% |
| Multidisciplinary Studies | 25 | 0.9% |
| Science & Technology | 293 | 9.9% |
| Business | 668 | 22.6% |
| Education | 364 | 12.3% |
| Literature & Languages | 198 | 6.7% |
| Liberal Arts & History | 208 | 7.0% |
| Visual & Performing Arts | 55 | 1.9% |
| Communications | 189 | 6.4% |
| Arts & Humanities | 130 | 4.4% |
| Total | 2,954 | 100.0% |
Transportation & Commute in Marietta
Vehicle Availability by Sex in Marietta
The most prevalent vehicle ownership categories in Marietta are males with 2 vehicles (1,332, accounting for 43.0%) and females with 2 vehicles (934, making up 53.7%).
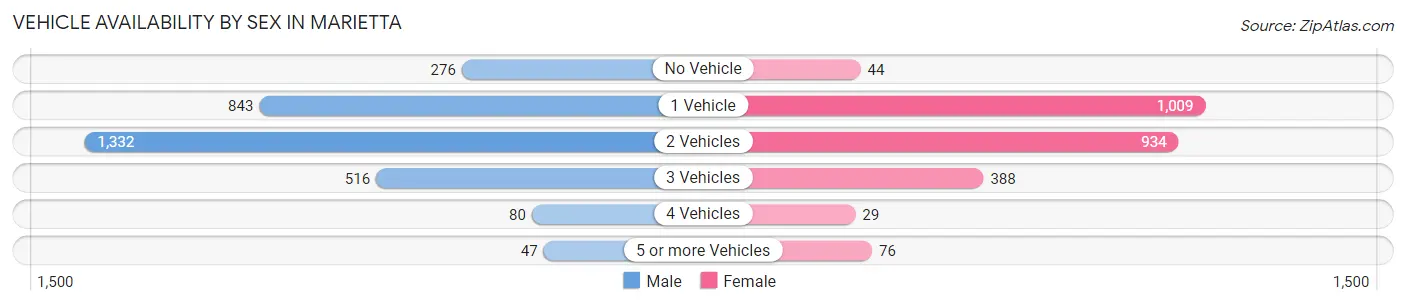
| Vehicles Available | Male | Female |
| No Vehicle | 276 (8.9%) | 44 (1.8%) |
| 1 Vehicle | 843 (27.3%) | 1,009 (40.7%) |
| 2 Vehicles | 1,332 (43.0%) | 934 (37.7%) |
| 3 Vehicles | 516 (16.7%) | 388 (15.7%) |
| 4 Vehicles | 80 (2.6%) | 29 (1.2%) |
| 5 or more Vehicles | 47 (1.5%) | 76 (3.1%) |
| Total | 3,094 (100.0%) | 2,480 (100.0%) |
Commute Time in Marietta
The most frequently occuring commute durations in Marietta are 5 to 9 minutes (1,571 commuters, 28.6%), 10 to 14 minutes (1,009 commuters, 18.4%), and 15 to 19 minutes (841 commuters, 15.3%).
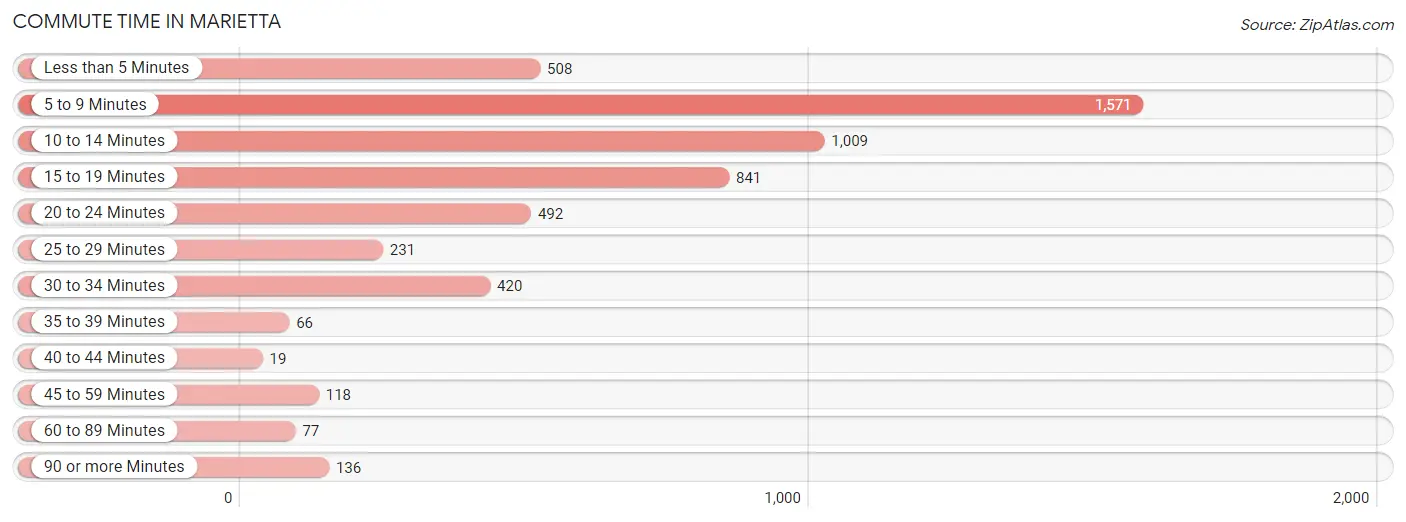
| Commute Time | # Commuters | % Commuters |
| Less than 5 Minutes | 508 | 9.3% |
| 5 to 9 Minutes | 1,571 | 28.6% |
| 10 to 14 Minutes | 1,009 | 18.4% |
| 15 to 19 Minutes | 841 | 15.3% |
| 20 to 24 Minutes | 492 | 9.0% |
| 25 to 29 Minutes | 231 | 4.2% |
| 30 to 34 Minutes | 420 | 7.6% |
| 35 to 39 Minutes | 66 | 1.2% |
| 40 to 44 Minutes | 19 | 0.4% |
| 45 to 59 Minutes | 118 | 2.1% |
| 60 to 89 Minutes | 77 | 1.4% |
| 90 or more Minutes | 136 | 2.5% |
Commute Time by Sex in Marietta
The most common commute times in Marietta are 5 to 9 minutes (731 commuters, 23.6%) for males and 5 to 9 minutes (840 commuters, 35.2%) for females.
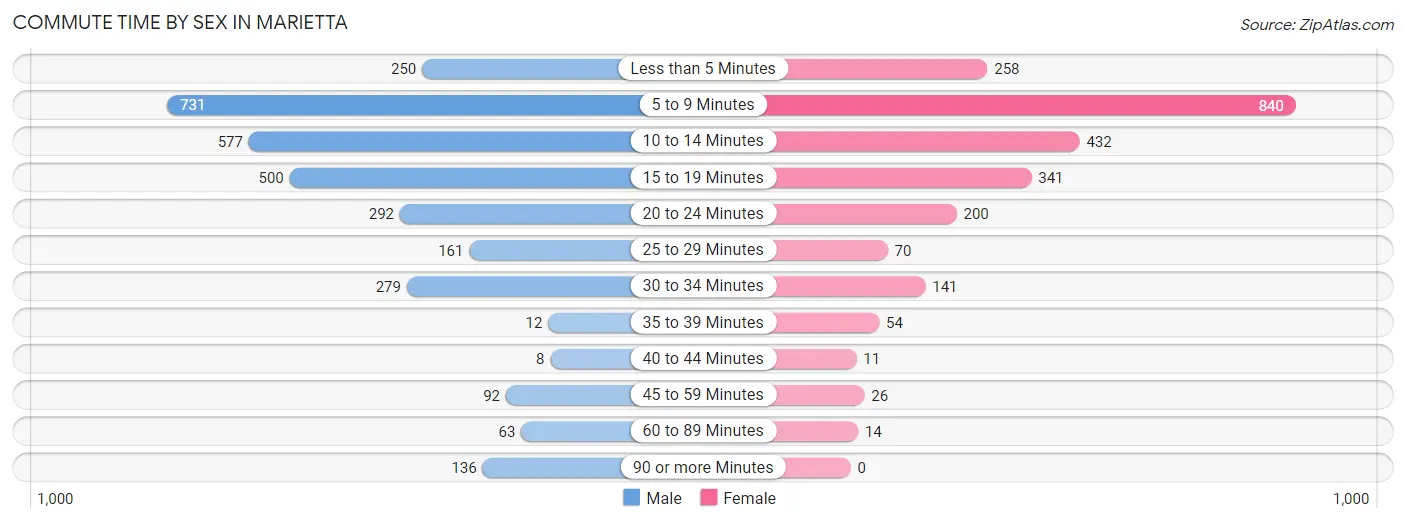
| Commute Time | Male | Female |
| Less than 5 Minutes | 250 (8.1%) | 258 (10.8%) |
| 5 to 9 Minutes | 731 (23.6%) | 840 (35.2%) |
| 10 to 14 Minutes | 577 (18.6%) | 432 (18.1%) |
| 15 to 19 Minutes | 500 (16.1%) | 341 (14.3%) |
| 20 to 24 Minutes | 292 (9.4%) | 200 (8.4%) |
| 25 to 29 Minutes | 161 (5.2%) | 70 (2.9%) |
| 30 to 34 Minutes | 279 (9.0%) | 141 (5.9%) |
| 35 to 39 Minutes | 12 (0.4%) | 54 (2.3%) |
| 40 to 44 Minutes | 8 (0.3%) | 11 (0.5%) |
| 45 to 59 Minutes | 92 (3.0%) | 26 (1.1%) |
| 60 to 89 Minutes | 63 (2.0%) | 14 (0.6%) |
| 90 or more Minutes | 136 (4.4%) | 0 (0.0%) |
Time of Departure to Work by Sex in Marietta
The most frequent times of departure to work in Marietta are 6:30 AM to 6:59 AM (459, 14.8%) for males and 7:30 AM to 7:59 AM (326, 13.7%) for females.
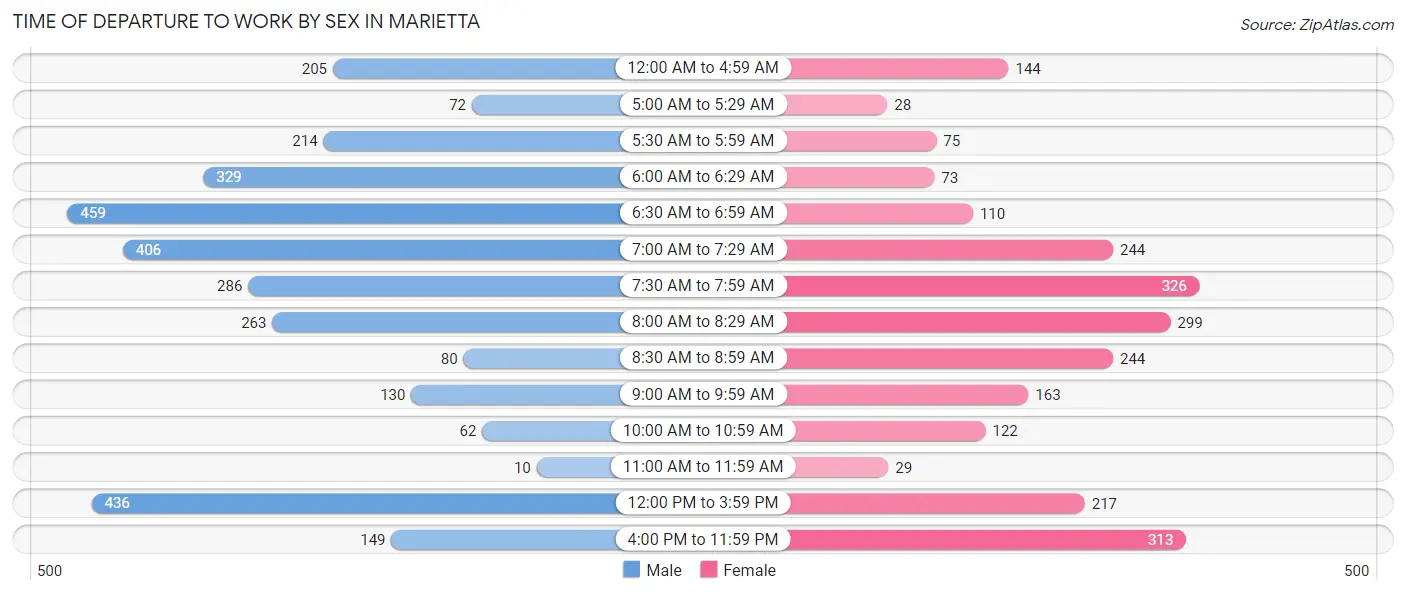
| Time of Departure | Male | Female |
| 12:00 AM to 4:59 AM | 205 (6.6%) | 144 (6.0%) |
| 5:00 AM to 5:29 AM | 72 (2.3%) | 28 (1.2%) |
| 5:30 AM to 5:59 AM | 214 (6.9%) | 75 (3.1%) |
| 6:00 AM to 6:29 AM | 329 (10.6%) | 73 (3.1%) |
| 6:30 AM to 6:59 AM | 459 (14.8%) | 110 (4.6%) |
| 7:00 AM to 7:29 AM | 406 (13.1%) | 244 (10.2%) |
| 7:30 AM to 7:59 AM | 286 (9.2%) | 326 (13.7%) |
| 8:00 AM to 8:29 AM | 263 (8.5%) | 299 (12.5%) |
| 8:30 AM to 8:59 AM | 80 (2.6%) | 244 (10.2%) |
| 9:00 AM to 9:59 AM | 130 (4.2%) | 163 (6.8%) |
| 10:00 AM to 10:59 AM | 62 (2.0%) | 122 (5.1%) |
| 11:00 AM to 11:59 AM | 10 (0.3%) | 29 (1.2%) |
| 12:00 PM to 3:59 PM | 436 (14.1%) | 217 (9.1%) |
| 4:00 PM to 11:59 PM | 149 (4.8%) | 313 (13.1%) |
| Total | 3,101 (100.0%) | 2,387 (100.0%) |
Housing Occupancy in Marietta
Occupancy by Ownership in Marietta
Of the total 6,073 dwellings in Marietta, owner-occupied units account for 3,459 (57.0%), while renter-occupied units make up 2,614 (43.0%).
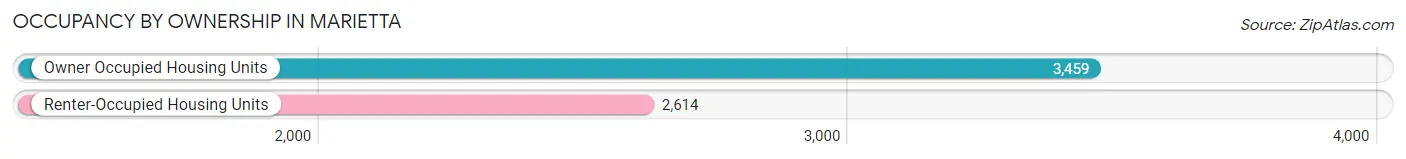
| Occupancy | # Housing Units | % Housing Units |
| Owner Occupied Housing Units | 3,459 | 57.0% |
| Renter-Occupied Housing Units | 2,614 | 43.0% |
| Total Occupied Housing Units | 6,073 | 100.0% |
Occupancy by Household Size in Marietta
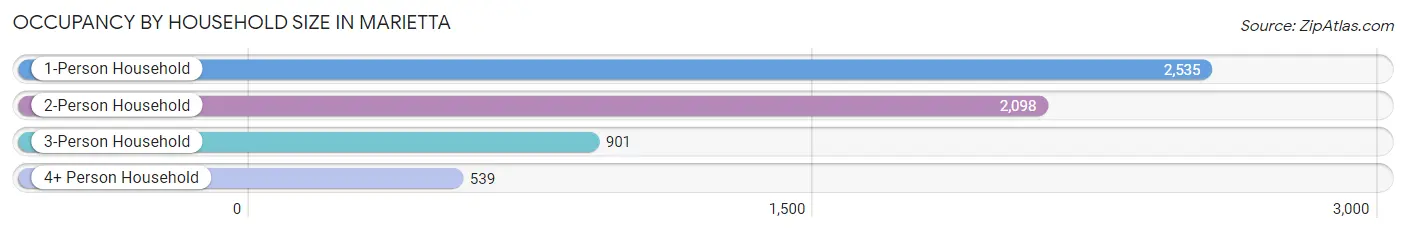
| Household Size | # Housing Units | % Housing Units |
| 1-Person Household | 2,535 | 41.7% |
| 2-Person Household | 2,098 | 34.5% |
| 3-Person Household | 901 | 14.8% |
| 4+ Person Household | 539 | 8.9% |
| Total Housing Units | 6,073 | 100.0% |
Occupancy by Ownership by Household Size in Marietta
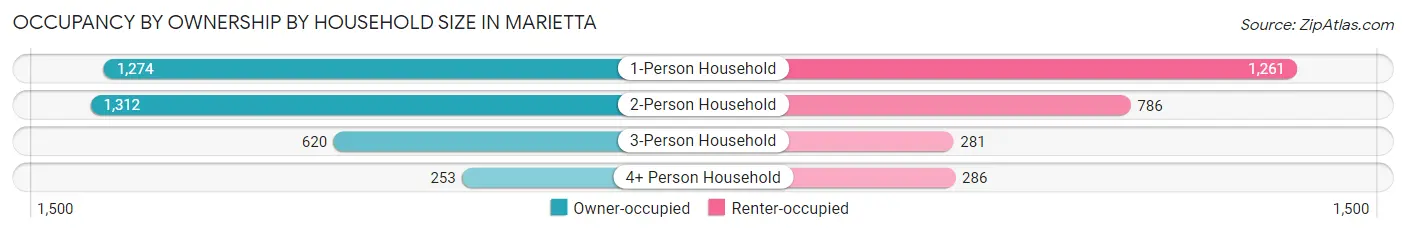
| Household Size | Owner-occupied | Renter-occupied |
| 1-Person Household | 1,274 (50.3%) | 1,261 (49.7%) |
| 2-Person Household | 1,312 (62.5%) | 786 (37.5%) |
| 3-Person Household | 620 (68.8%) | 281 (31.2%) |
| 4+ Person Household | 253 (46.9%) | 286 (53.1%) |
| Total Housing Units | 3,459 (57.0%) | 2,614 (43.0%) |
Occupancy by Educational Attainment in Marietta
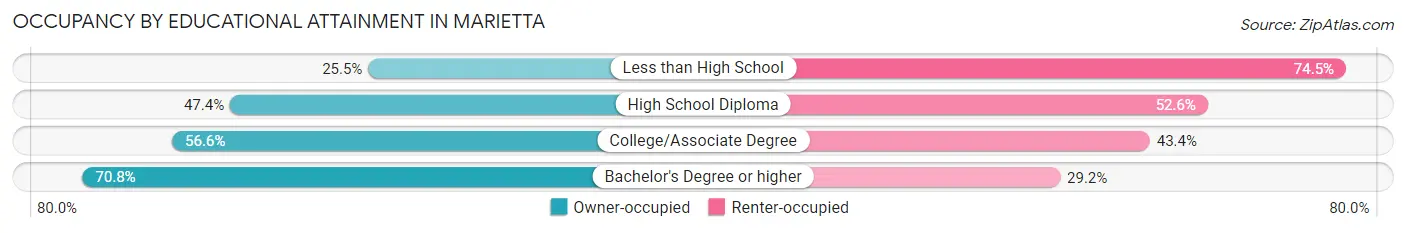
| Household Size | Owner-occupied | Renter-occupied |
| Less than High School | 103 (25.5%) | 301 (74.5%) |
| High School Diploma | 781 (47.4%) | 866 (52.6%) |
| College/Associate Degree | 1,089 (56.6%) | 835 (43.4%) |
| Bachelor's Degree or higher | 1,486 (70.8%) | 612 (29.2%) |
Occupancy by Age of Householder in Marietta
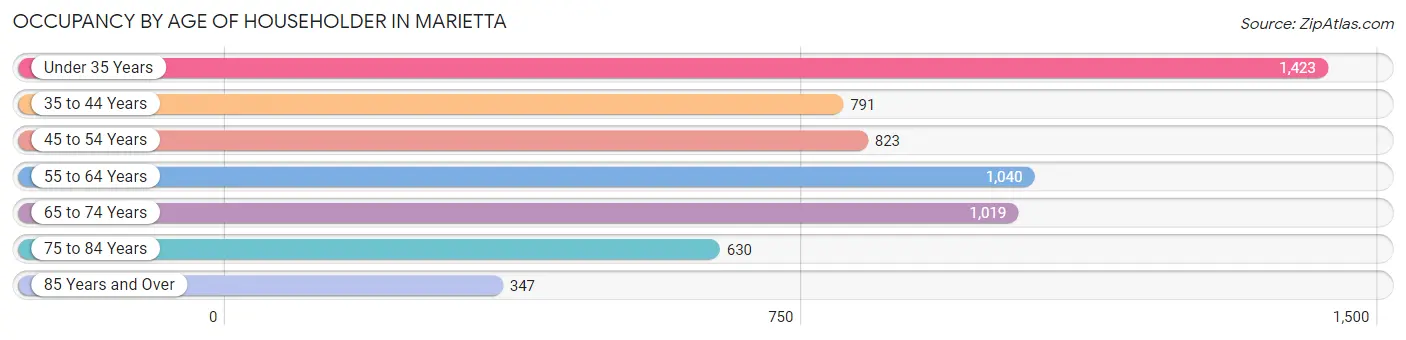
| Age Bracket | # Households | % Households |
| Under 35 Years | 1,423 | 23.4% |
| 35 to 44 Years | 791 | 13.0% |
| 45 to 54 Years | 823 | 13.6% |
| 55 to 64 Years | 1,040 | 17.1% |
| 65 to 74 Years | 1,019 | 16.8% |
| 75 to 84 Years | 630 | 10.4% |
| 85 Years and Over | 347 | 5.7% |
| Total | 6,073 | 100.0% |
Housing Finances in Marietta
Median Income by Occupancy in Marietta
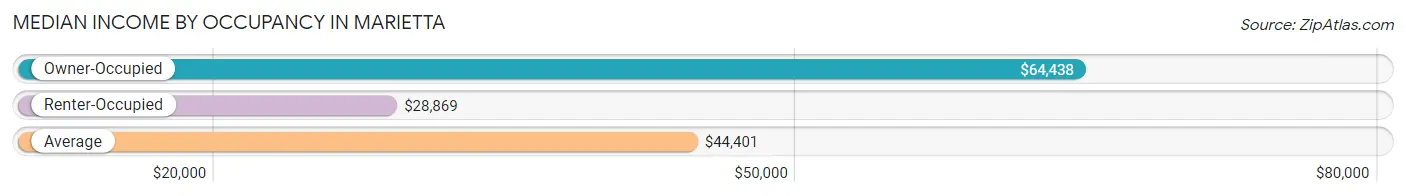
| Occupancy Type | # Households | Median Income |
| Owner-Occupied | 3,459 (57.0%) | $64,438 |
| Renter-Occupied | 2,614 (43.0%) | $28,869 |
| Average | 6,073 (100.0%) | $44,401 |
Occupancy by Householder Income Bracket in Marietta
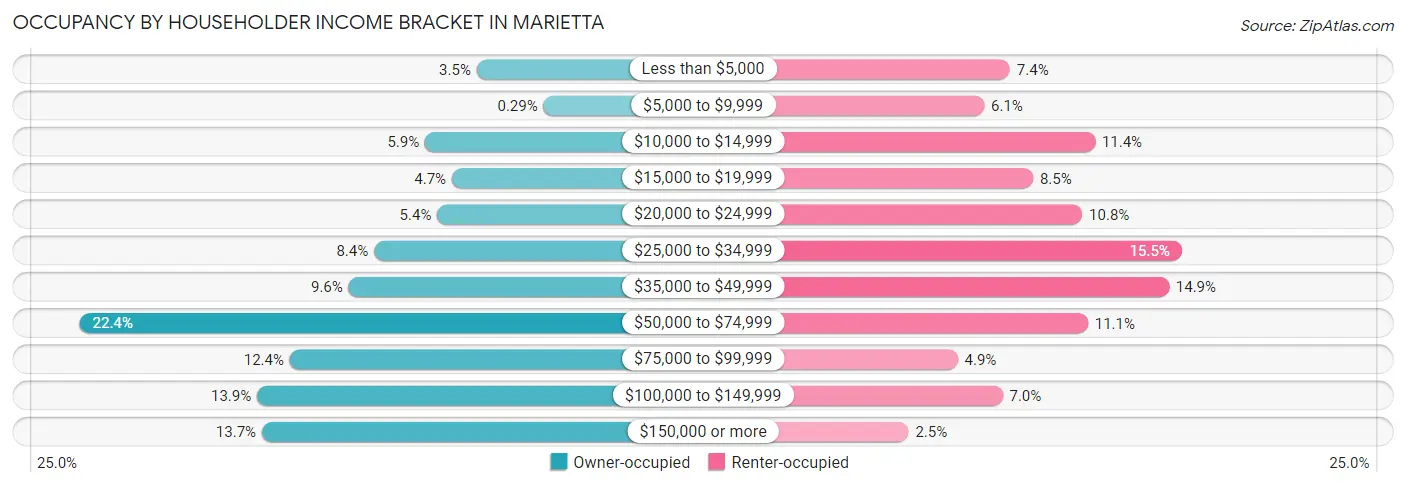
| Income Bracket | Owner-occupied | Renter-occupied |
| Less than $5,000 | 120 (3.5%) | 192 (7.3%) |
| $5,000 to $9,999 | 10 (0.3%) | 160 (6.1%) |
| $10,000 to $14,999 | 205 (5.9%) | 298 (11.4%) |
| $15,000 to $19,999 | 161 (4.6%) | 221 (8.5%) |
| $20,000 to $24,999 | 185 (5.3%) | 282 (10.8%) |
| $25,000 to $34,999 | 289 (8.4%) | 406 (15.5%) |
| $35,000 to $49,999 | 331 (9.6%) | 390 (14.9%) |
| $50,000 to $74,999 | 774 (22.4%) | 289 (11.1%) |
| $75,000 to $99,999 | 428 (12.4%) | 127 (4.9%) |
| $100,000 to $149,999 | 482 (13.9%) | 183 (7.0%) |
| $150,000 or more | 474 (13.7%) | 66 (2.5%) |
| Total | 3,459 (100.0%) | 2,614 (100.0%) |
Monthly Housing Cost Tiers in Marietta
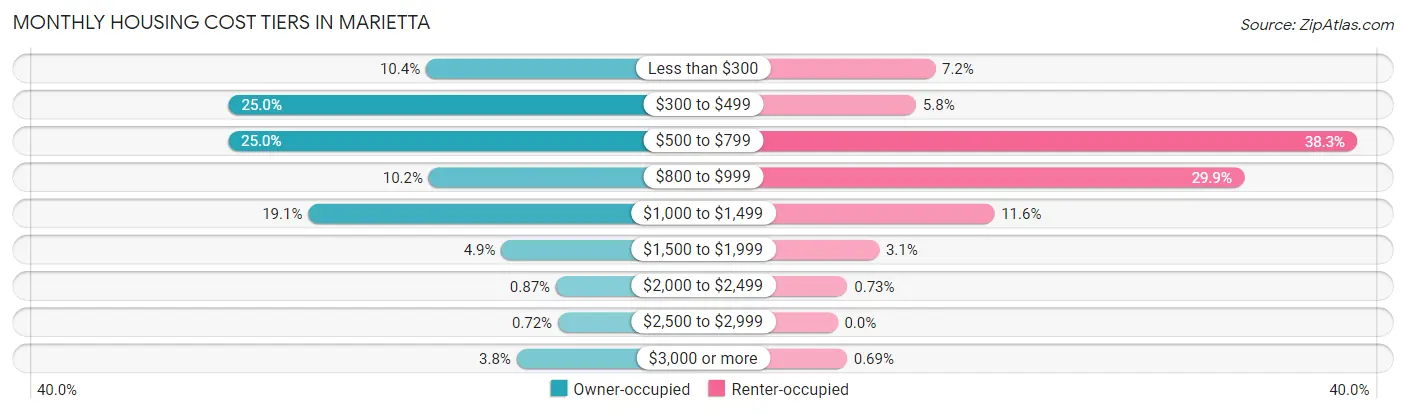
| Monthly Cost | Owner-occupied | Renter-occupied |
| Less than $300 | 361 (10.4%) | 188 (7.2%) |
| $300 to $499 | 864 (25.0%) | 151 (5.8%) |
| $500 to $799 | 865 (25.0%) | 1,000 (38.3%) |
| $800 to $999 | 354 (10.2%) | 782 (29.9%) |
| $1,000 to $1,499 | 661 (19.1%) | 302 (11.6%) |
| $1,500 to $1,999 | 169 (4.9%) | 80 (3.1%) |
| $2,000 to $2,499 | 30 (0.9%) | 19 (0.7%) |
| $2,500 to $2,999 | 25 (0.7%) | 0 (0.0%) |
| $3,000 or more | 130 (3.8%) | 18 (0.7%) |
| Total | 3,459 (100.0%) | 2,614 (100.0%) |
Physical Housing Characteristics in Marietta
Housing Structures in Marietta
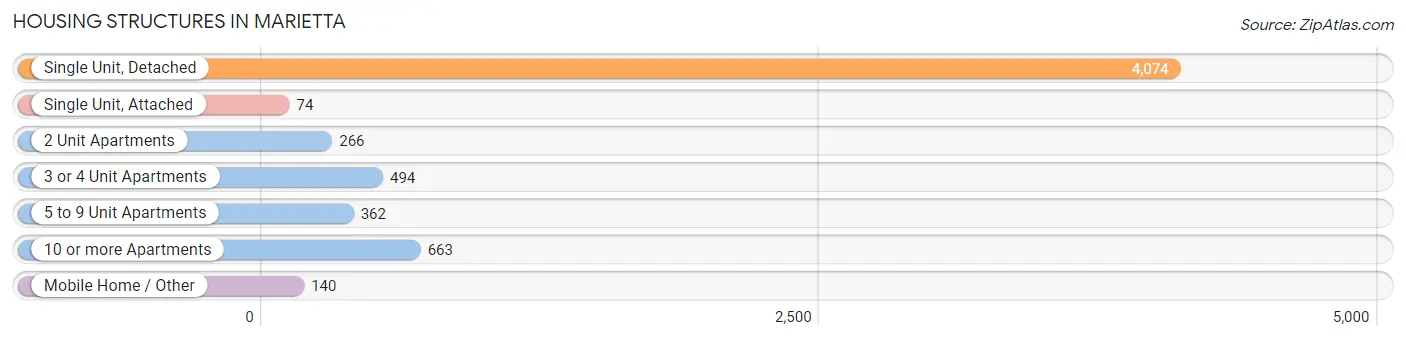
| Structure Type | # Housing Units | % Housing Units |
| Single Unit, Detached | 4,074 | 67.1% |
| Single Unit, Attached | 74 | 1.2% |
| 2 Unit Apartments | 266 | 4.4% |
| 3 or 4 Unit Apartments | 494 | 8.1% |
| 5 to 9 Unit Apartments | 362 | 6.0% |
| 10 or more Apartments | 663 | 10.9% |
| Mobile Home / Other | 140 | 2.3% |
| Total | 6,073 | 100.0% |
Housing Structures by Occupancy in Marietta
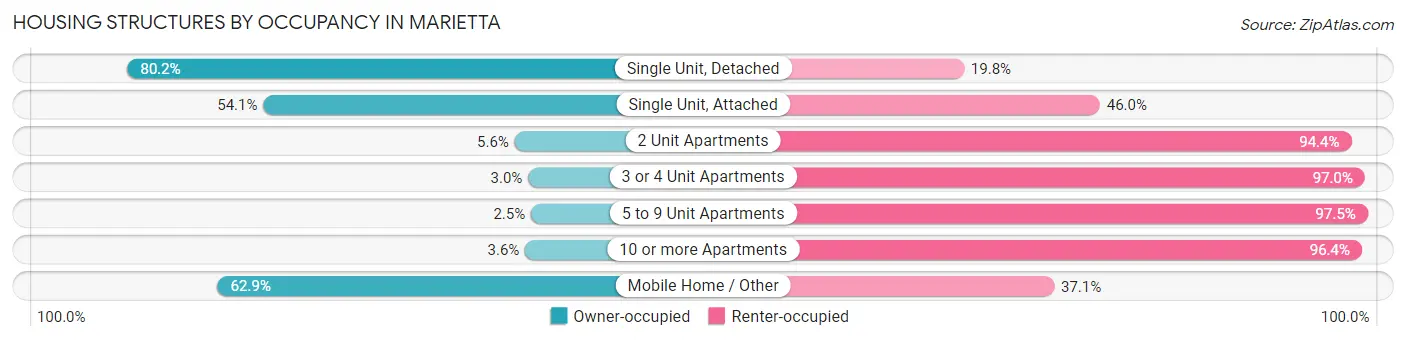
| Structure Type | Owner-occupied | Renter-occupied |
| Single Unit, Detached | 3,268 (80.2%) | 806 (19.8%) |
| Single Unit, Attached | 40 (54.0%) | 34 (46.0%) |
| 2 Unit Apartments | 15 (5.6%) | 251 (94.4%) |
| 3 or 4 Unit Apartments | 15 (3.0%) | 479 (97.0%) |
| 5 to 9 Unit Apartments | 9 (2.5%) | 353 (97.5%) |
| 10 or more Apartments | 24 (3.6%) | 639 (96.4%) |
| Mobile Home / Other | 88 (62.9%) | 52 (37.1%) |
| Total | 3,459 (57.0%) | 2,614 (43.0%) |
Housing Structures by Number of Rooms in Marietta
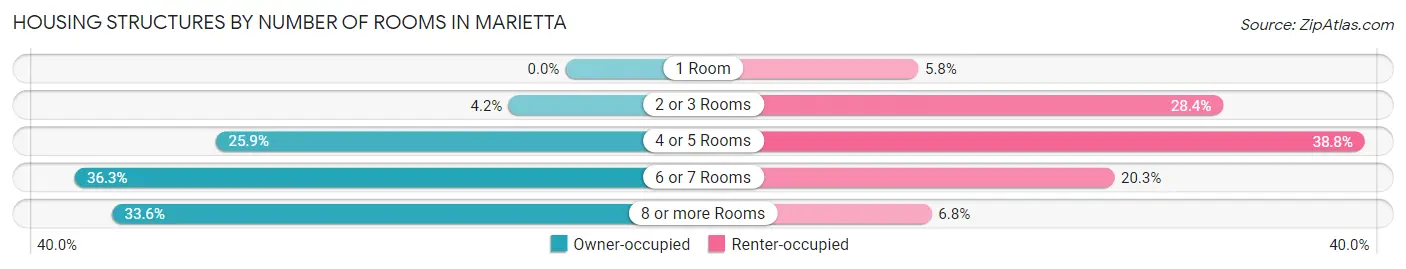
| Number of Rooms | Owner-occupied | Renter-occupied |
| 1 Room | 0 (0.0%) | 151 (5.8%) |
| 2 or 3 Rooms | 146 (4.2%) | 741 (28.3%) |
| 4 or 5 Rooms | 895 (25.9%) | 1,015 (38.8%) |
| 6 or 7 Rooms | 1,257 (36.3%) | 530 (20.3%) |
| 8 or more Rooms | 1,161 (33.6%) | 177 (6.8%) |
| Total | 3,459 (100.0%) | 2,614 (100.0%) |
Housing Structure by Heating Type in Marietta
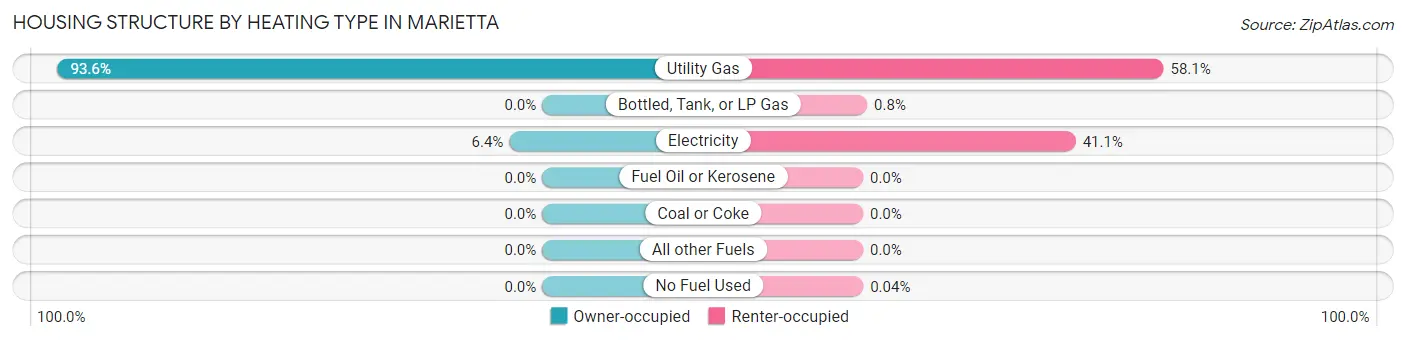
| Heating Type | Owner-occupied | Renter-occupied |
| Utility Gas | 3,239 (93.6%) | 1,518 (58.1%) |
| Bottled, Tank, or LP Gas | 0 (0.0%) | 21 (0.8%) |
| Electricity | 220 (6.4%) | 1,074 (41.1%) |
| Fuel Oil or Kerosene | 0 (0.0%) | 0 (0.0%) |
| Coal or Coke | 0 (0.0%) | 0 (0.0%) |
| All other Fuels | 0 (0.0%) | 0 (0.0%) |
| No Fuel Used | 0 (0.0%) | 1 (0.0%) |
| Total | 3,459 (100.0%) | 2,614 (100.0%) |
Household Vehicle Usage in Marietta
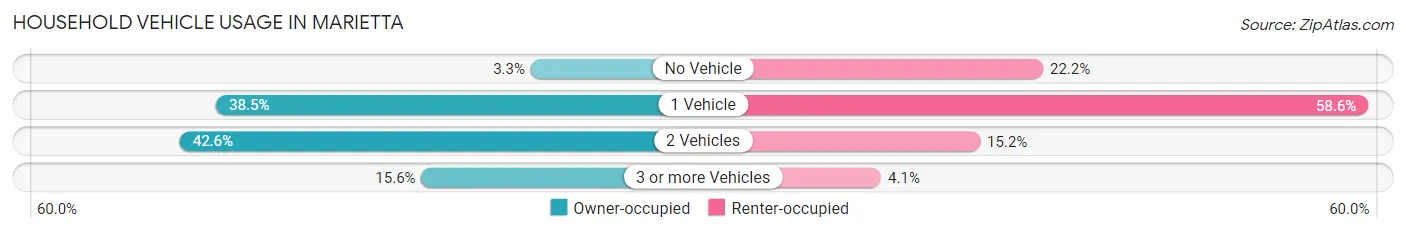
| Vehicles per Household | Owner-occupied | Renter-occupied |
| No Vehicle | 114 (3.3%) | 580 (22.2%) |
| 1 Vehicle | 1,333 (38.5%) | 1,532 (58.6%) |
| 2 Vehicles | 1,474 (42.6%) | 396 (15.1%) |
| 3 or more Vehicles | 538 (15.5%) | 106 (4.1%) |
| Total | 3,459 (100.0%) | 2,614 (100.0%) |
Real Estate & Mortgages in Marietta
Real Estate and Mortgage Overview in Marietta
| Characteristic | Without Mortgage | With Mortgage |
| Housing Units | 1,820 | 1,639 |
| Median Property Value | $123,900 | $161,600 |
| Median Household Income | $51,849 | $208 |
| Monthly Housing Costs | $432 | $130 |
| Real Estate Taxes | $1,282 | $12 |
Property Value by Mortgage Status in Marietta
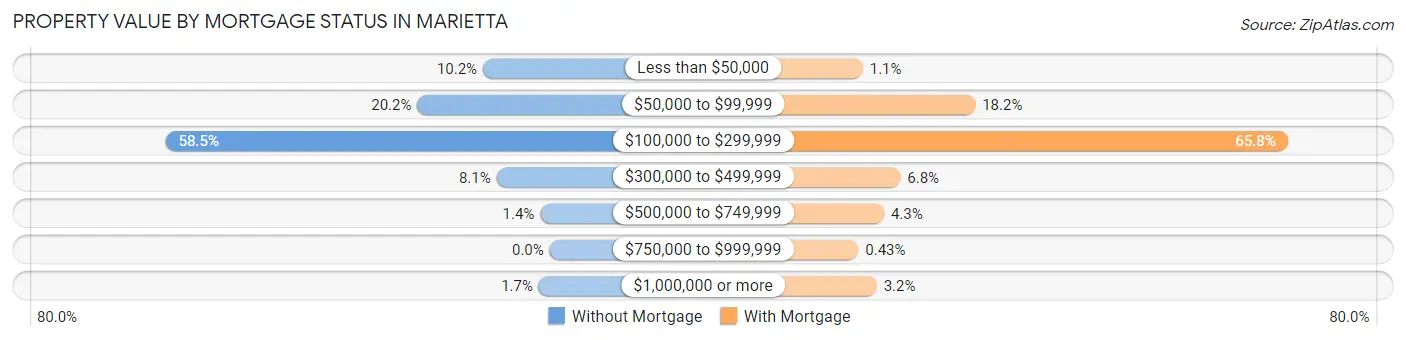
| Property Value | Without Mortgage | With Mortgage |
| Less than $50,000 | 185 (10.2%) | 18 (1.1%) |
| $50,000 to $99,999 | 367 (20.2%) | 299 (18.2%) |
| $100,000 to $299,999 | 1,065 (58.5%) | 1,079 (65.8%) |
| $300,000 to $499,999 | 147 (8.1%) | 112 (6.8%) |
| $500,000 to $749,999 | 26 (1.4%) | 71 (4.3%) |
| $750,000 to $999,999 | 0 (0.0%) | 7 (0.4%) |
| $1,000,000 or more | 30 (1.7%) | 53 (3.2%) |
| Total | 1,820 (100.0%) | 1,639 (100.0%) |
Household Income by Mortgage Status in Marietta
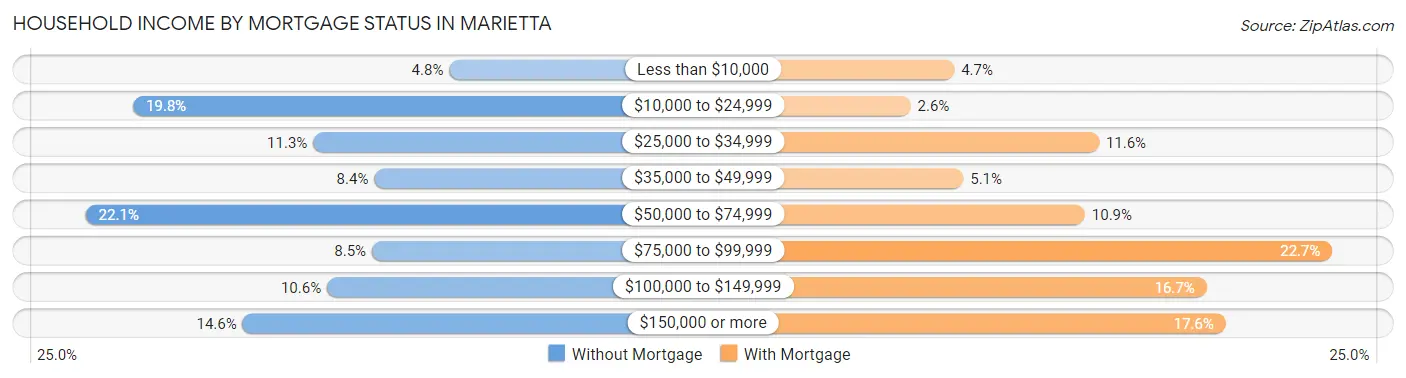
| Household Income | Without Mortgage | With Mortgage |
| Less than $10,000 | 87 (4.8%) | 77 (4.7%) |
| $10,000 to $24,999 | 361 (19.8%) | 43 (2.6%) |
| $25,000 to $34,999 | 205 (11.3%) | 190 (11.6%) |
| $35,000 to $49,999 | 152 (8.4%) | 84 (5.1%) |
| $50,000 to $74,999 | 402 (22.1%) | 179 (10.9%) |
| $75,000 to $99,999 | 154 (8.5%) | 372 (22.7%) |
| $100,000 to $149,999 | 193 (10.6%) | 274 (16.7%) |
| $150,000 or more | 266 (14.6%) | 289 (17.6%) |
| Total | 1,820 (100.0%) | 1,639 (100.0%) |
Property Value to Household Income Ratio in Marietta
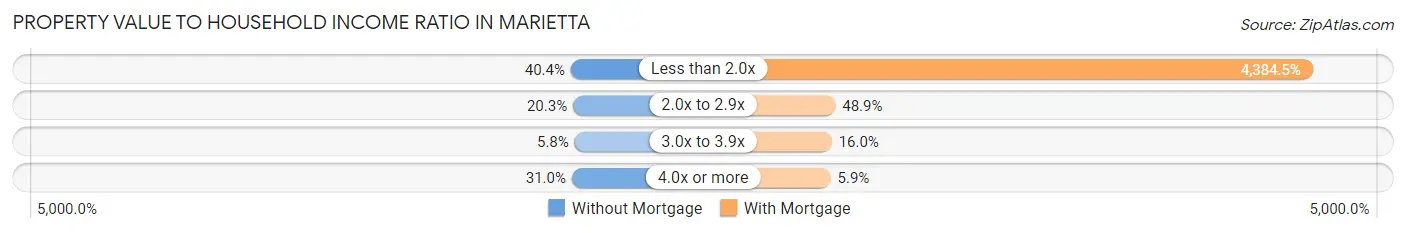
| Value-to-Income Ratio | Without Mortgage | With Mortgage |
| Less than 2.0x | 736 (40.4%) | 71,862 (4,384.5%) |
| 2.0x to 2.9x | 369 (20.3%) | 801 (48.9%) |
| 3.0x to 3.9x | 105 (5.8%) | 262 (16.0%) |
| 4.0x or more | 564 (31.0%) | 96 (5.9%) |
| Total | 1,820 (100.0%) | 1,639 (100.0%) |
Real Estate Taxes by Mortgage Status in Marietta
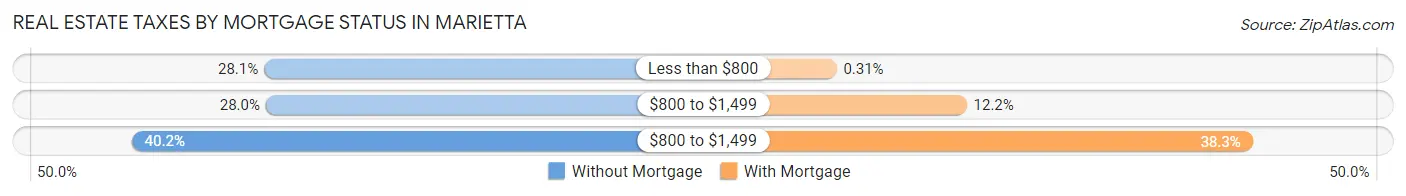
| Property Taxes | Without Mortgage | With Mortgage |
| Less than $800 | 512 (28.1%) | 5 (0.3%) |
| $800 to $1,499 | 509 (28.0%) | 200 (12.2%) |
| $800 to $1,499 | 732 (40.2%) | 628 (38.3%) |
| Total | 1,820 (100.0%) | 1,639 (100.0%) |
Health & Disability in Marietta
Health Insurance Coverage by Age in Marietta
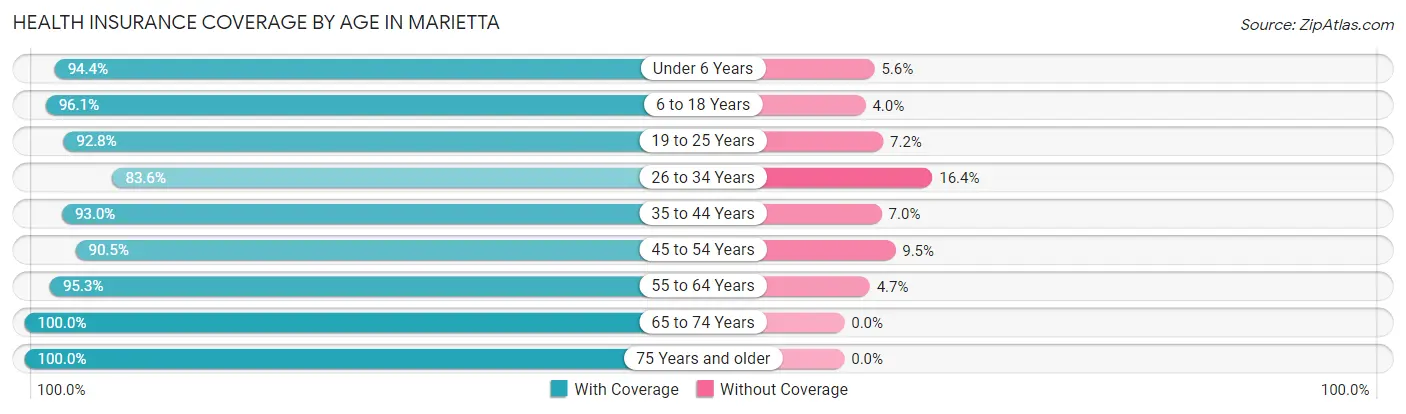
| Age Bracket | With Coverage | Without Coverage |
| Under 6 Years | 855 (94.4%) | 51 (5.6%) |
| 6 to 18 Years | 1,607 (96.1%) | 66 (4.0%) |
| 19 to 25 Years | 1,690 (92.8%) | 132 (7.2%) |
| 26 to 34 Years | 1,263 (83.6%) | 248 (16.4%) |
| 35 to 44 Years | 1,228 (93.0%) | 92 (7.0%) |
| 45 to 54 Years | 1,151 (90.5%) | 121 (9.5%) |
| 55 to 64 Years | 1,589 (95.3%) | 79 (4.7%) |
| 65 to 74 Years | 1,408 (100.0%) | 0 (0.0%) |
| 75 Years and older | 1,332 (100.0%) | 0 (0.0%) |
| Total | 12,123 (93.9%) | 789 (6.1%) |
Health Insurance Coverage by Citizenship Status in Marietta
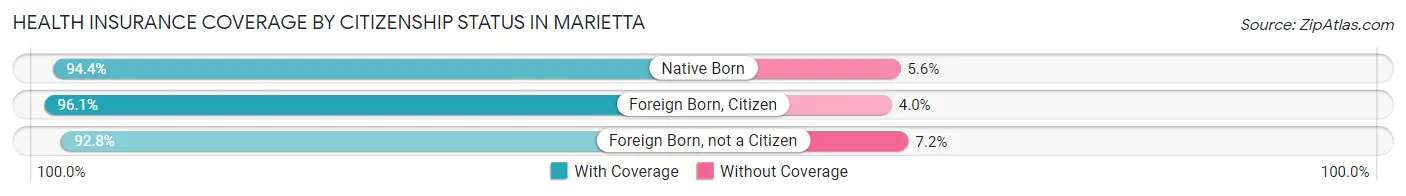
| Citizenship Status | With Coverage | Without Coverage |
| Native Born | 855 (94.4%) | 51 (5.6%) |
| Foreign Born, Citizen | 1,607 (96.1%) | 66 (4.0%) |
| Foreign Born, not a Citizen | 1,690 (92.8%) | 132 (7.2%) |
Health Insurance Coverage by Household Income in Marietta
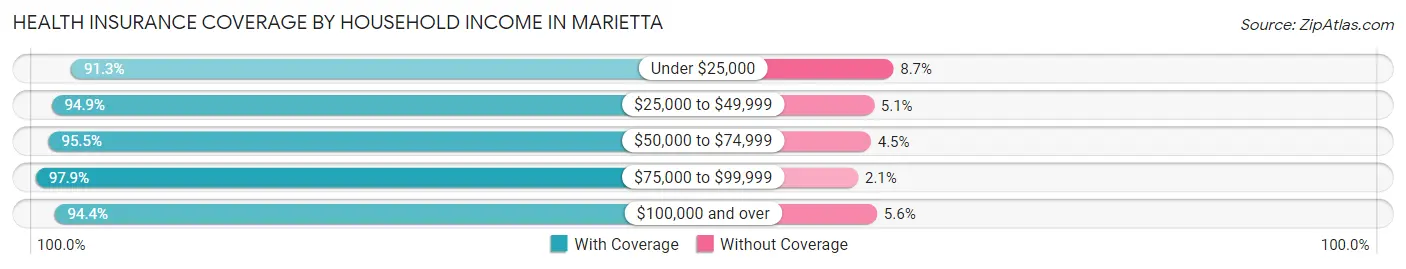
| Household Income | With Coverage | Without Coverage |
| Under $25,000 | 2,758 (91.3%) | 263 (8.7%) |
| $25,000 to $49,999 | 2,511 (94.9%) | 134 (5.1%) |
| $50,000 to $74,999 | 1,935 (95.5%) | 91 (4.5%) |
| $75,000 to $99,999 | 1,345 (97.9%) | 29 (2.1%) |
| $100,000 and over | 2,947 (94.4%) | 176 (5.6%) |
Public vs Private Health Insurance Coverage by Age in Marietta
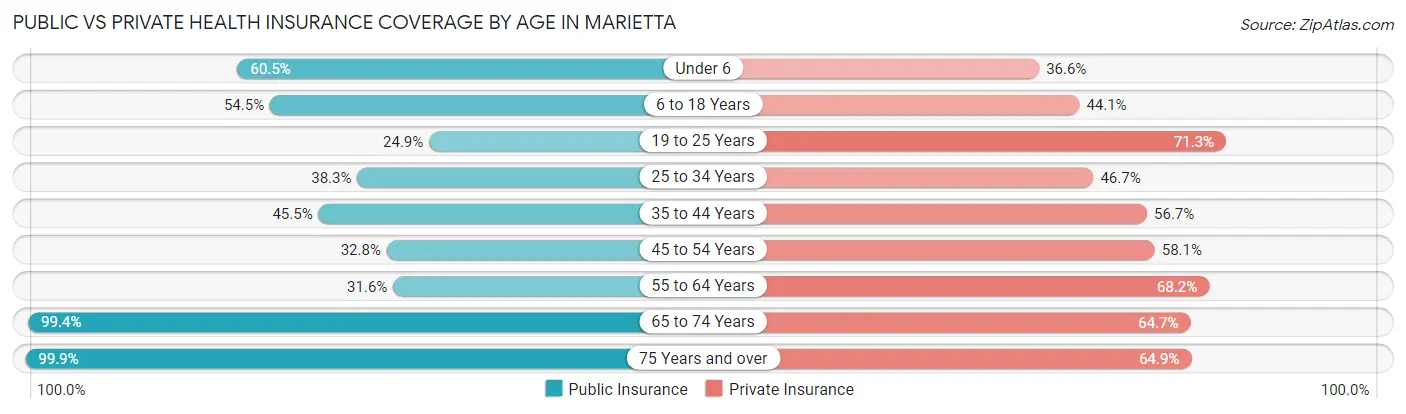
| Age Bracket | Public Insurance | Private Insurance |
| Under 6 | 548 (60.5%) | 332 (36.6%) |
| 6 to 18 Years | 911 (54.4%) | 738 (44.1%) |
| 19 to 25 Years | 454 (24.9%) | 1,299 (71.3%) |
| 25 to 34 Years | 578 (38.3%) | 706 (46.7%) |
| 35 to 44 Years | 600 (45.5%) | 748 (56.7%) |
| 45 to 54 Years | 417 (32.8%) | 739 (58.1%) |
| 55 to 64 Years | 527 (31.6%) | 1,137 (68.2%) |
| 65 to 74 Years | 1,399 (99.4%) | 911 (64.7%) |
| 75 Years and over | 1,330 (99.9%) | 864 (64.9%) |
| Total | 6,764 (52.4%) | 7,474 (57.9%) |
Disability Status by Sex by Age in Marietta
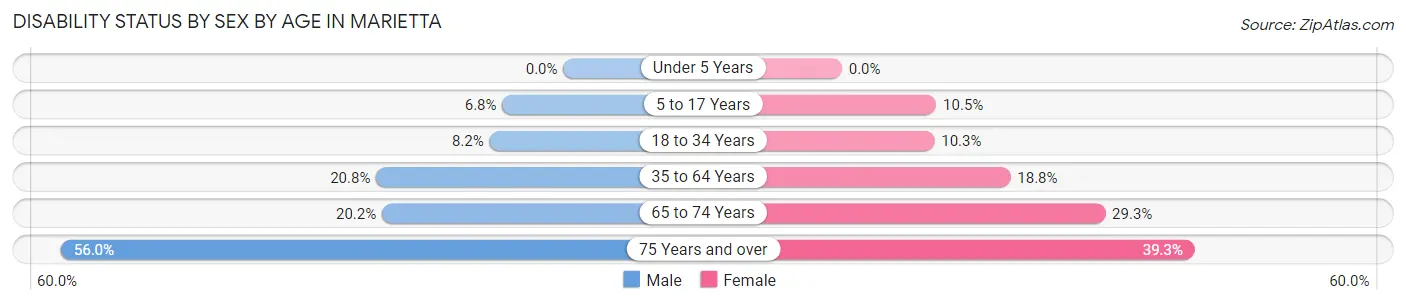
| Age Bracket | Male | Female |
| Under 5 Years | 0 (0.0%) | 0 (0.0%) |
| 5 to 17 Years | 56 (6.8%) | 82 (10.5%) |
| 18 to 34 Years | 142 (8.2%) | 188 (10.3%) |
| 35 to 64 Years | 459 (20.8%) | 386 (18.8%) |
| 65 to 74 Years | 148 (20.2%) | 198 (29.3%) |
| 75 Years and over | 324 (56.0%) | 296 (39.3%) |
Disability Class by Sex by Age in Marietta
Disability Class: Hearing Difficulty
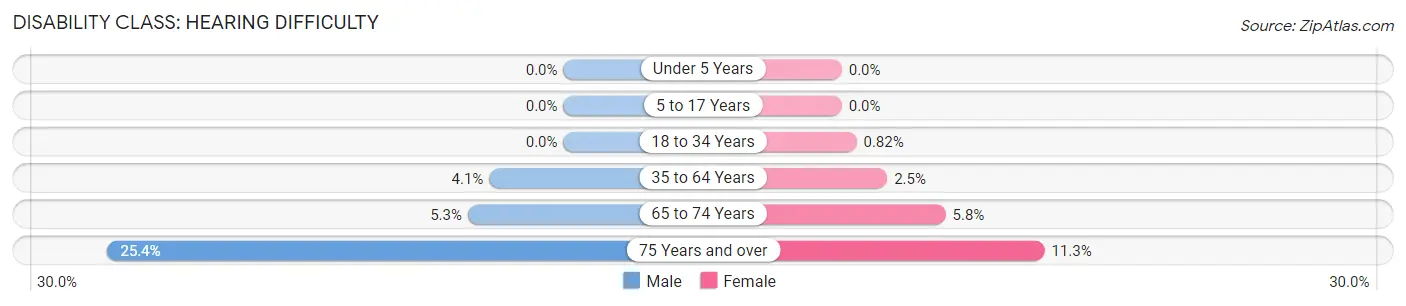
| Age Bracket | Male | Female |
| Under 5 Years | 0 (0.0%) | 0 (0.0%) |
| 5 to 17 Years | 0 (0.0%) | 0 (0.0%) |
| 18 to 34 Years | 0 (0.0%) | 15 (0.8%) |
| 35 to 64 Years | 91 (4.1%) | 52 (2.5%) |
| 65 to 74 Years | 39 (5.3%) | 39 (5.8%) |
| 75 Years and over | 147 (25.4%) | 85 (11.3%) |
Disability Class: Vision Difficulty
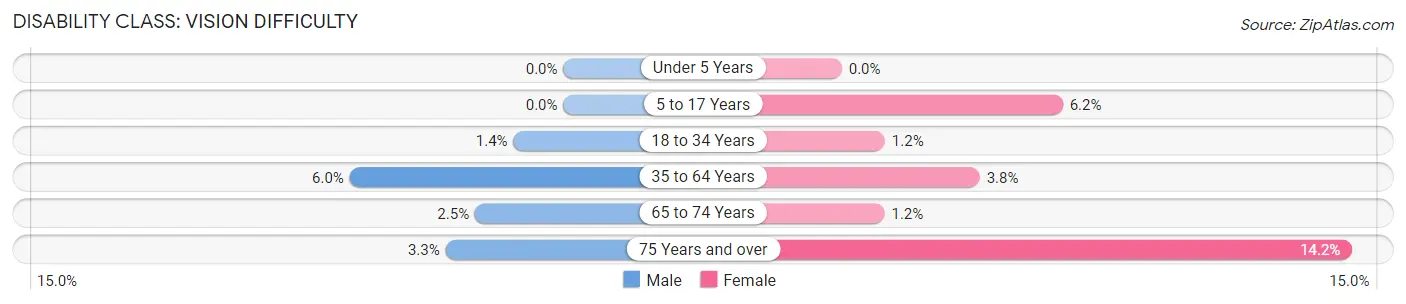
| Age Bracket | Male | Female |
| Under 5 Years | 0 (0.0%) | 0 (0.0%) |
| 5 to 17 Years | 0 (0.0%) | 48 (6.1%) |
| 18 to 34 Years | 24 (1.4%) | 22 (1.2%) |
| 35 to 64 Years | 131 (5.9%) | 79 (3.8%) |
| 65 to 74 Years | 18 (2.5%) | 8 (1.2%) |
| 75 Years and over | 19 (3.3%) | 107 (14.2%) |
Disability Class: Cognitive Difficulty
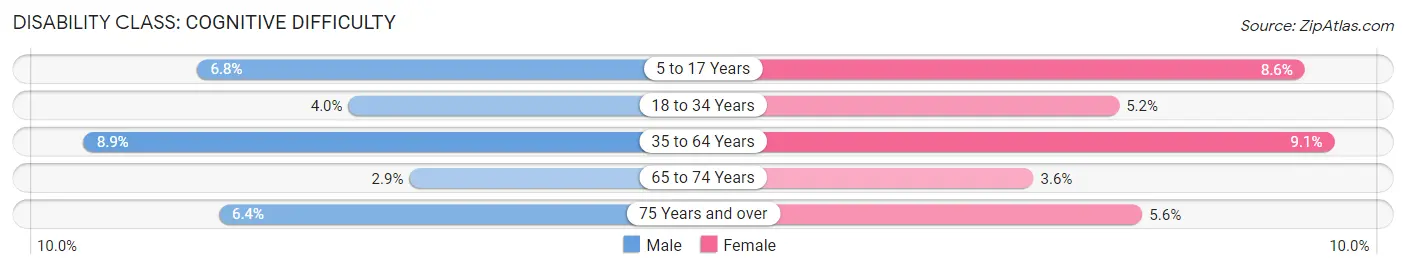
| Age Bracket | Male | Female |
| 5 to 17 Years | 56 (6.8%) | 67 (8.6%) |
| 18 to 34 Years | 69 (4.0%) | 94 (5.1%) |
| 35 to 64 Years | 196 (8.9%) | 188 (9.1%) |
| 65 to 74 Years | 21 (2.9%) | 24 (3.6%) |
| 75 Years and over | 37 (6.4%) | 42 (5.6%) |
Disability Class: Ambulatory Difficulty
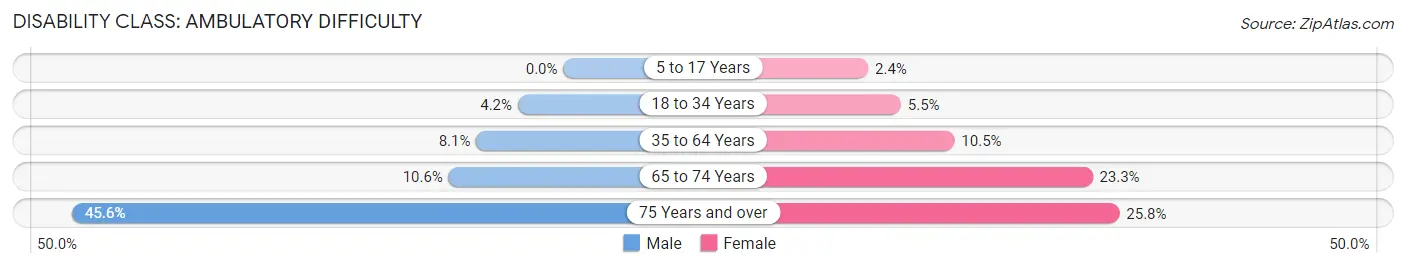
| Age Bracket | Male | Female |
| 5 to 17 Years | 0 (0.0%) | 19 (2.4%) |
| 18 to 34 Years | 73 (4.2%) | 100 (5.5%) |
| 35 to 64 Years | 178 (8.1%) | 215 (10.4%) |
| 65 to 74 Years | 78 (10.6%) | 157 (23.3%) |
| 75 Years and over | 264 (45.6%) | 194 (25.8%) |
Disability Class: Self-Care Difficulty
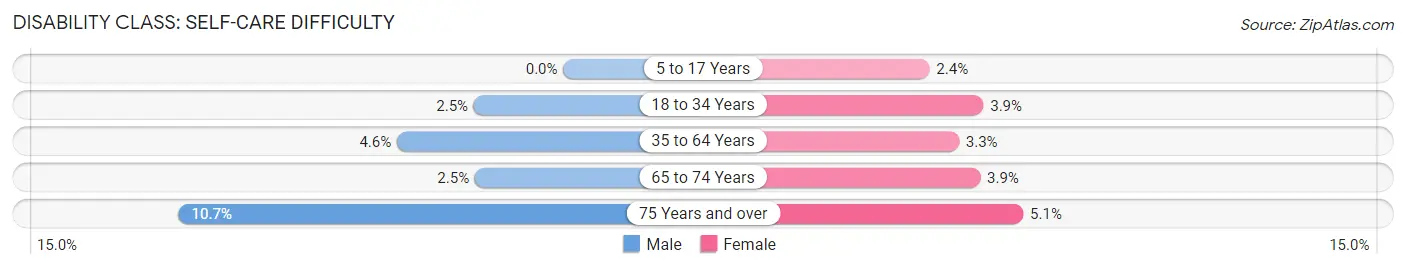
| Age Bracket | Male | Female |
| 5 to 17 Years | 0 (0.0%) | 19 (2.4%) |
| 18 to 34 Years | 43 (2.5%) | 72 (3.9%) |
| 35 to 64 Years | 102 (4.6%) | 67 (3.3%) |
| 65 to 74 Years | 18 (2.5%) | 26 (3.8%) |
| 75 Years and over | 62 (10.7%) | 38 (5.1%) |
Technology Access in Marietta
Computing Device Access in Marietta
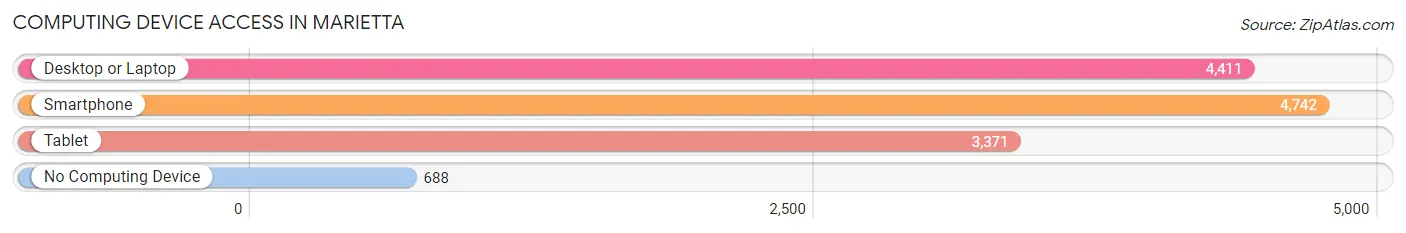
| Device Type | # Households | % Households |
| Desktop or Laptop | 4,411 | 72.6% |
| Smartphone | 4,742 | 78.1% |
| Tablet | 3,371 | 55.5% |
| No Computing Device | 688 | 11.3% |
| Total | 6,073 | 100.0% |
Internet Access in Marietta
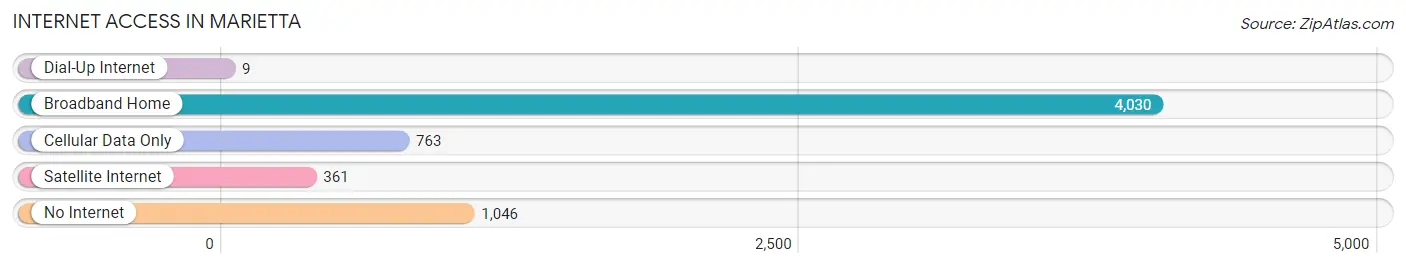
| Internet Type | # Households | % Households |
| Dial-Up Internet | 9 | 0.2% |
| Broadband Home | 4,030 | 66.4% |
| Cellular Data Only | 763 | 12.6% |
| Satellite Internet | 361 | 5.9% |
| No Internet | 1,046 | 17.2% |
| Total | 6,073 | 100.0% |
Marietta Summary
Marietta, Ohio is a city located in Washington County, Ohio, United States. It is situated along the Ohio River and is the county seat of Washington County. The city is located approximately 50 miles southeast of Columbus, Ohio and is part of the Parkersburg-Marietta-Vienna metropolitan area. As of the 2010 census, the city had a population of 14,085.
History
Marietta was founded in 1788 by a group of Revolutionary War veterans led by General Rufus Putnam. The city was named after Marie Antoinette, the Queen of France, in honor of her support of the American Revolution. The city was the first permanent settlement of the Northwest Territory and served as the capital of the territory from 1788 to 1803.
Marietta was an important center of commerce and industry during the 19th century. The city was home to several large manufacturing companies, including the Marietta Manufacturing Company, which produced stoves, and the Marietta Carriage Works, which produced carriages and wagons. The city was also home to several shipbuilding companies, including the Marietta Shipbuilding Company, which built steamboats and barges.
Geography
Marietta is located at 39°25'N 81°27'W (39.4139, -81.4500). The city is situated along the Ohio River and is located approximately 50 miles southeast of Columbus, Ohio. The city has a total area of 8.2 square miles, of which 8.1 square miles is land and 0.1 square miles is water.
Economy
Marietta’s economy is largely based on manufacturing and services. The city is home to several large manufacturing companies, including the Marietta Manufacturing Company, which produces stoves, and the Marietta Carriage Works, which produces carriages and wagons. The city is also home to several shipbuilding companies, including the Marietta Shipbuilding Company, which builds steamboats and barges.
Marietta is also home to several service-based businesses, including healthcare, education, and retail. The city is home to Marietta Memorial Hospital, Marietta College, and several large retail stores.
Demographics
As of the 2010 census, the city had a population of 14,085. The racial makeup of the city was 94.2% White, 2.3% African American, 0.3% Native American, 0.7% Asian, 0.1% Pacific Islander, 0.7% from other races, and 1.7% from two or more races. Hispanic or Latino of any race were 2.2% of the population.
The median income for a household in the city was $37,945, and the median income for a family was $45,945. The per capita income for the city was $20,945. About 11.2% of families and 14.2% of the population were below the poverty line, including 19.2% of those under age 18 and 8.2% of those age 65 or over.
Common Questions
What is Per Capita Income in Marietta?
Per Capita income in Marietta is $36,388.
What is the Median Family Income in Marietta?
Median Family Income in Marietta is $65,596.
What is the Median Household income in Marietta?
Median Household Income in Marietta is $44,401.
What is Income or Wage Gap in Marietta?
Income or Wage Gap in Marietta is 40.8%.
Women in Marietta earn 59.2 cents for every dollar earned by a man.
What is Family Income Deficit in Marietta?
Family Income Deficit in Marietta is $10,793.
Families that are below poverty line in Marietta earn $10,793 less on average than the poverty threshold level.
What is Inequality or Gini Index in Marietta?
Inequality or Gini Index in Marietta is 0.58.
What is the Total Population of Marietta?
Total Population of Marietta is 13,366.
What is the Total Male Population of Marietta?
Total Male Population of Marietta is 6,623.
What is the Total Female Population of Marietta?
Total Female Population of Marietta is 6,743.
What is the Ratio of Males per 100 Females in Marietta?
There are 98.22 Males per 100 Females in Marietta.
What is the Ratio of Females per 100 Males in Marietta?
There are 101.81 Females per 100 Males in Marietta.
What is the Median Population Age in Marietta?
Median Population Age in Marietta is 39.4 Years.
What is the Average Family Size in Marietta
Average Family Size in Marietta is 2.7 People.
What is the Average Household Size in Marietta
Average Household Size in Marietta is 2.0 People.
How Large is the Labor Force in Marietta?
There are 6,435 People in the Labor Forcein in Marietta.
What is the Percentage of People in the Labor Force in Marietta?
57.4% of People are in the Labor Force in Marietta.
What is the Unemployment Rate in Marietta?
Unemployment Rate in Marietta is 5.6%.