Grand Rapids, OH Map & Demographics
Grand Rapids Map
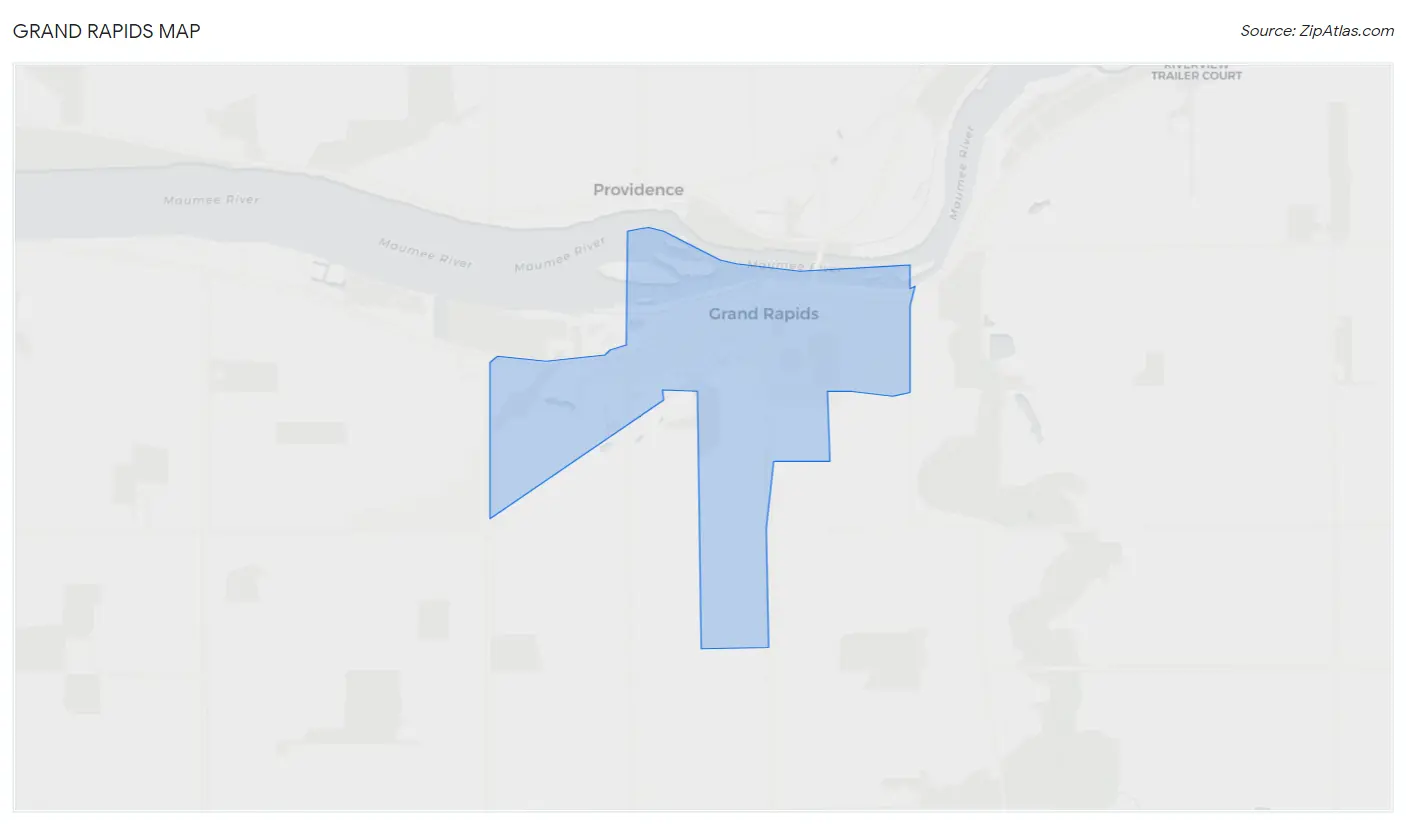
Grand Rapids Overview
$34,782
PER CAPITA INCOME
$85,486
AVG FAMILY INCOME
$71,719
AVG HOUSEHOLD INCOME
48.0%
WAGE / INCOME GAP [ % ]
52.0¢/ $1
WAGE / INCOME GAP [ $ ]
0.37
INEQUALITY / GINI INDEX
1,033
TOTAL POPULATION
499
MALE POPULATION
534
FEMALE POPULATION
93.45
MALES / 100 FEMALES
107.01
FEMALES / 100 MALES
33.3
MEDIAN AGE
3.1
AVG FAMILY SIZE
2.4
AVG HOUSEHOLD SIZE
578
LABOR FORCE [ PEOPLE ]
72.9%
PERCENT IN LABOR FORCE
Grand Rapids Zip Codes
Income in Grand Rapids
Income Overview in Grand Rapids
Per Capita Income in Grand Rapids is $34,782, while median incomes of families and households are $85,486 and $71,719 respectively.
| Characteristic | Number | Measure |
| Per Capita Income | 1,033 | $34,782 |
| Median Family Income | 251 | $85,486 |
| Mean Family Income | 251 | $99,531 |
| Median Household Income | 415 | $71,719 |
| Mean Household Income | 415 | $83,017 |
| Income Deficit | 251 | $0 |
| Wage / Income Gap (%) | 1,033 | 47.98% |
| Wage / Income Gap ($) | 1,033 | 52.02¢ per $1 |
| Gini / Inequality Index | 1,033 | 0.37 |
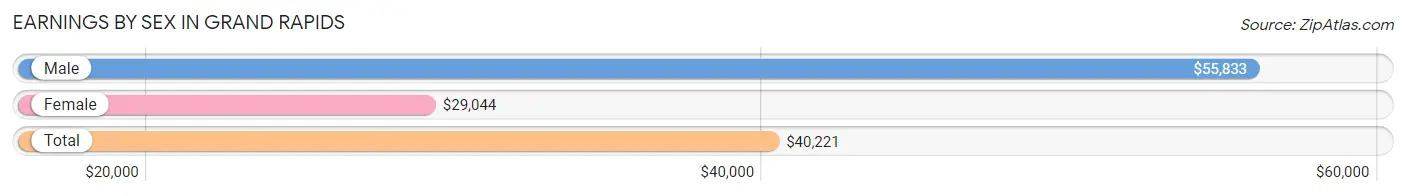
Earnings by Sex in Grand Rapids
Average Earnings in Grand Rapids are $40,221, $55,833 for men and $29,044 for women, a difference of 48.0%.
| Sex | Number | Average Earnings |
| Male | 318 (50.4%) | $55,833 |
| Female | 313 (49.6%) | $29,044 |
| Total | 631 (100.0%) | $40,221 |
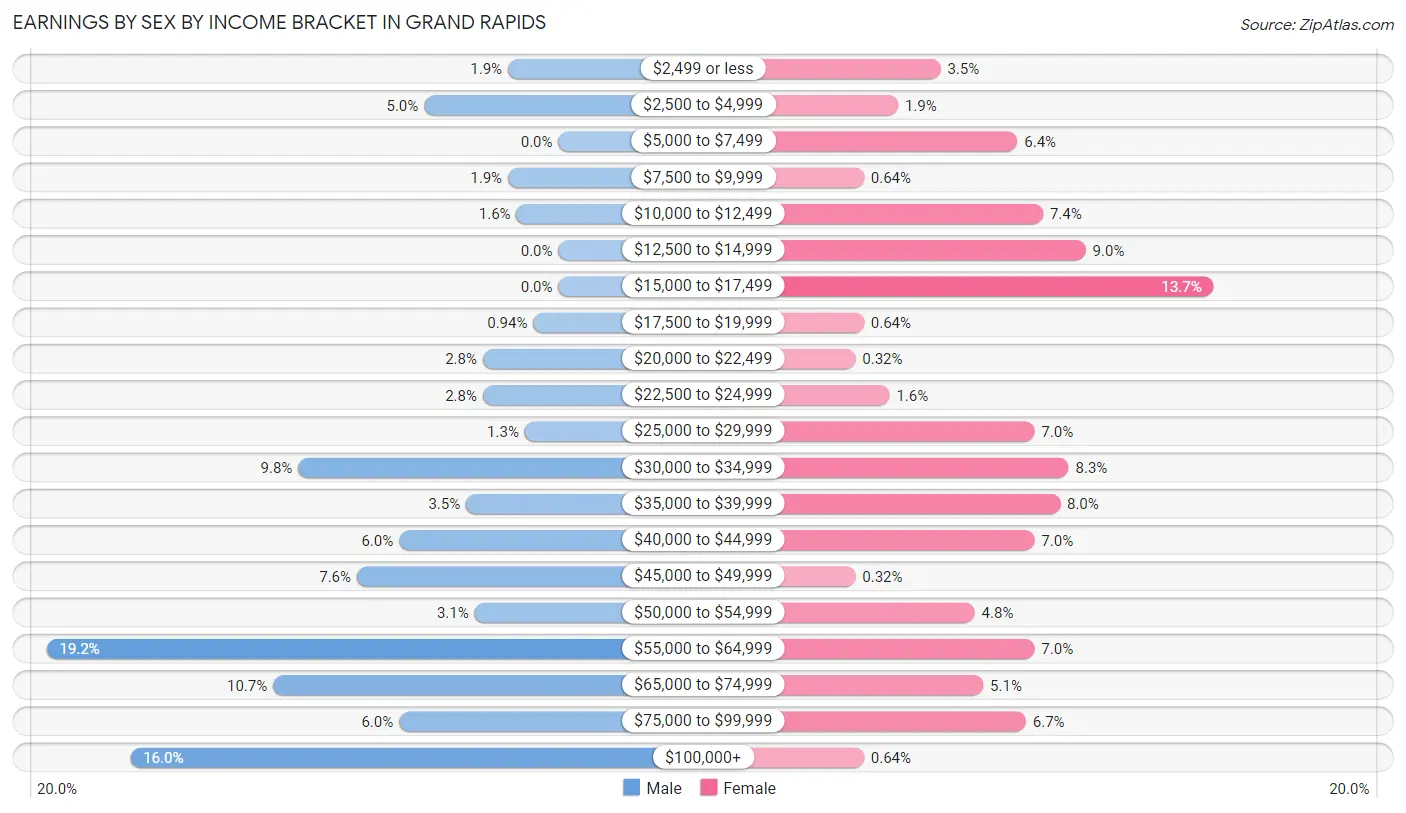
Earnings by Sex by Income Bracket in Grand Rapids
The most common earnings brackets in Grand Rapids are $55,000 to $64,999 for men (61 | 19.2%) and $15,000 to $17,499 for women (43 | 13.7%).
| Income | Male | Female |
| $2,499 or less | 6 (1.9%) | 11 (3.5%) |
| $2,500 to $4,999 | 16 (5.0%) | 6 (1.9%) |
| $5,000 to $7,499 | 0 (0.0%) | 20 (6.4%) |
| $7,500 to $9,999 | 6 (1.9%) | 2 (0.6%) |
| $10,000 to $12,499 | 5 (1.6%) | 23 (7.3%) |
| $12,500 to $14,999 | 0 (0.0%) | 28 (8.9%) |
| $15,000 to $17,499 | 0 (0.0%) | 43 (13.7%) |
| $17,500 to $19,999 | 3 (0.9%) | 2 (0.6%) |
| $20,000 to $22,499 | 9 (2.8%) | 1 (0.3%) |
| $22,500 to $24,999 | 9 (2.8%) | 5 (1.6%) |
| $25,000 to $29,999 | 4 (1.3%) | 22 (7.0%) |
| $30,000 to $34,999 | 31 (9.8%) | 26 (8.3%) |
| $35,000 to $39,999 | 11 (3.5%) | 25 (8.0%) |
| $40,000 to $44,999 | 19 (6.0%) | 22 (7.0%) |
| $45,000 to $49,999 | 24 (7.5%) | 1 (0.3%) |
| $50,000 to $54,999 | 10 (3.1%) | 15 (4.8%) |
| $55,000 to $64,999 | 61 (19.2%) | 22 (7.0%) |
| $65,000 to $74,999 | 34 (10.7%) | 16 (5.1%) |
| $75,000 to $99,999 | 19 (6.0%) | 21 (6.7%) |
| $100,000+ | 51 (16.0%) | 2 (0.6%) |
| Total | 318 (100.0%) | 313 (100.0%) |
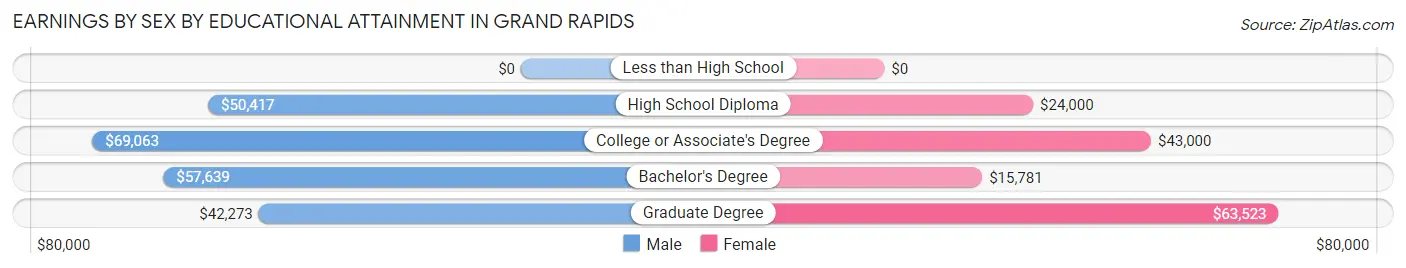
Earnings by Sex by Educational Attainment in Grand Rapids
Average earnings in Grand Rapids are $56,458 for men and $34,188 for women, a difference of 39.5%. Men with an educational attainment of college or associate's degree enjoy the highest average annual earnings of $69,063, while those with graduate degree education earn the least with $42,273. Women with an educational attainment of graduate degree earn the most with the average annual earnings of $63,523, while those with bachelor's degree education have the smallest earnings of $15,781.
| Educational Attainment | Male Income | Female Income |
| Less than High School | - | - |
| High School Diploma | $50,417 | $24,000 |
| College or Associate's Degree | $69,063 | $43,000 |
| Bachelor's Degree | $57,639 | $15,781 |
| Graduate Degree | $42,273 | $63,523 |
| Total | $56,458 | $34,188 |
Family Income in Grand Rapids
Family Income Brackets in Grand Rapids
According to the Grand Rapids family income data, there are 70 families falling into the $50,000 to $74,999 income range, which is the most common income bracket and makes up 27.9% of all families.
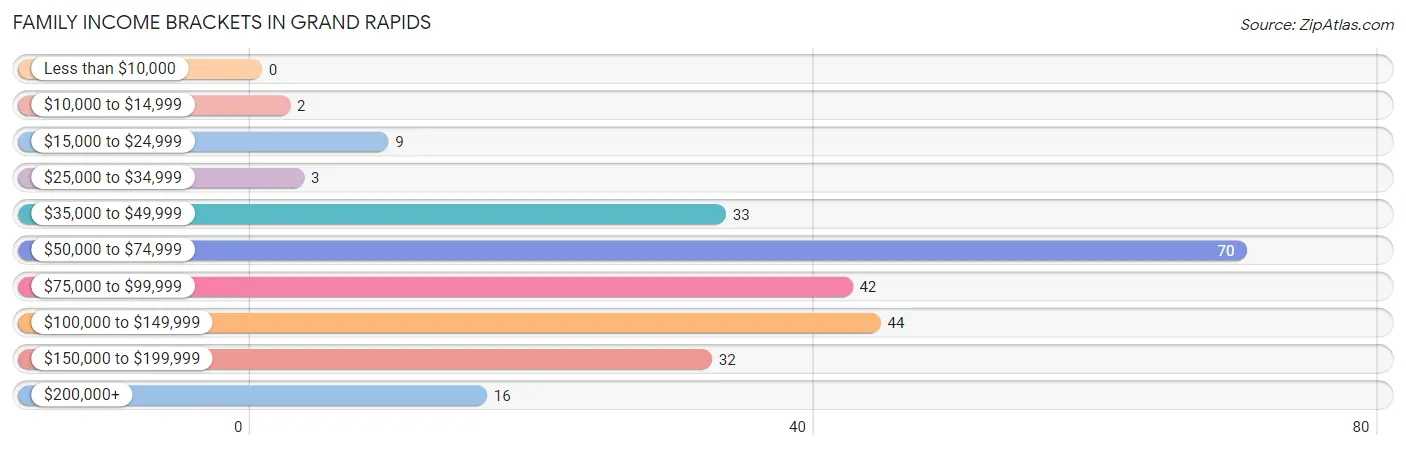
| Income Bracket | # Families | % Families |
| Less than $10,000 | 0 | 0.0% |
| $10,000 to $14,999 | 2 | 0.8% |
| $15,000 to $24,999 | 9 | 3.6% |
| $25,000 to $34,999 | 3 | 1.2% |
| $35,000 to $49,999 | 33 | 13.1% |
| $50,000 to $74,999 | 70 | 27.9% |
| $75,000 to $99,999 | 42 | 16.7% |
| $100,000 to $149,999 | 44 | 17.5% |
| $150,000 to $199,999 | 32 | 12.7% |
| $200,000+ | 16 | 6.4% |
Family Income by Famaliy Size in Grand Rapids
4-person families (39 | 15.5%) account for the highest median family income in Grand Rapids with $151,625 per family, while 3-person families (60 | 23.9%) have the highest median income of $38,750 per family member.
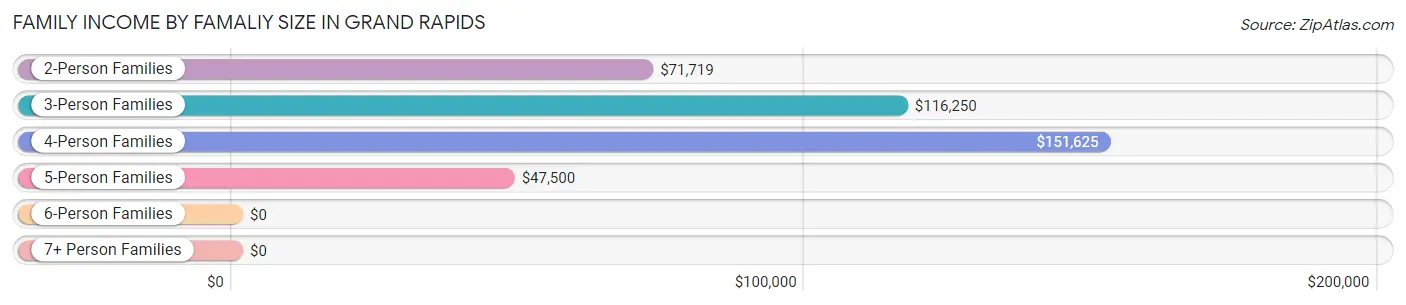
| Income Bracket | # Families | Median Income |
| 2-Person Families | 109 (43.4%) | $71,719 |
| 3-Person Families | 60 (23.9%) | $116,250 |
| 4-Person Families | 39 (15.5%) | $151,625 |
| 5-Person Families | 40 (15.9%) | $47,500 |
| 6-Person Families | 2 (0.8%) | $0 |
| 7+ Person Families | 1 (0.4%) | $0 |
| Total | 251 (100.0%) | $85,486 |
Family Income by Number of Earners in Grand Rapids
The median family income in Grand Rapids is $85,486, with families comprising 3+ earners (26) having the highest median family income of $190,833, while families with no earners (18) have the lowest median family income of $61,250, accounting for 10.4% and 7.2% of families, respectively.
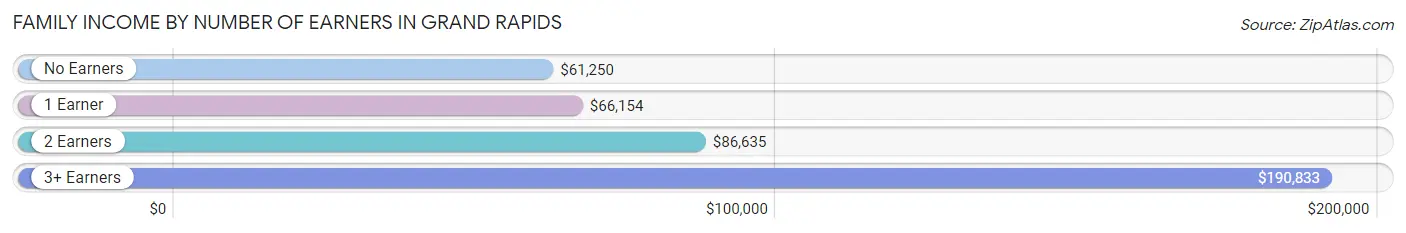
| Number of Earners | # Families | Median Income |
| No Earners | 18 (7.2%) | $61,250 |
| 1 Earner | 78 (31.1%) | $66,154 |
| 2 Earners | 129 (51.4%) | $86,635 |
| 3+ Earners | 26 (10.4%) | $190,833 |
| Total | 251 (100.0%) | $85,486 |
Household Income in Grand Rapids
Household Income Brackets in Grand Rapids
With 73 households falling in the category, the $50,000 to $74,999 income range is the most frequent in Grand Rapids, accounting for 17.6% of all households. In contrast, only 4 households (1.0%) fall into the less than $10,000 income bracket, making it the least populous group.
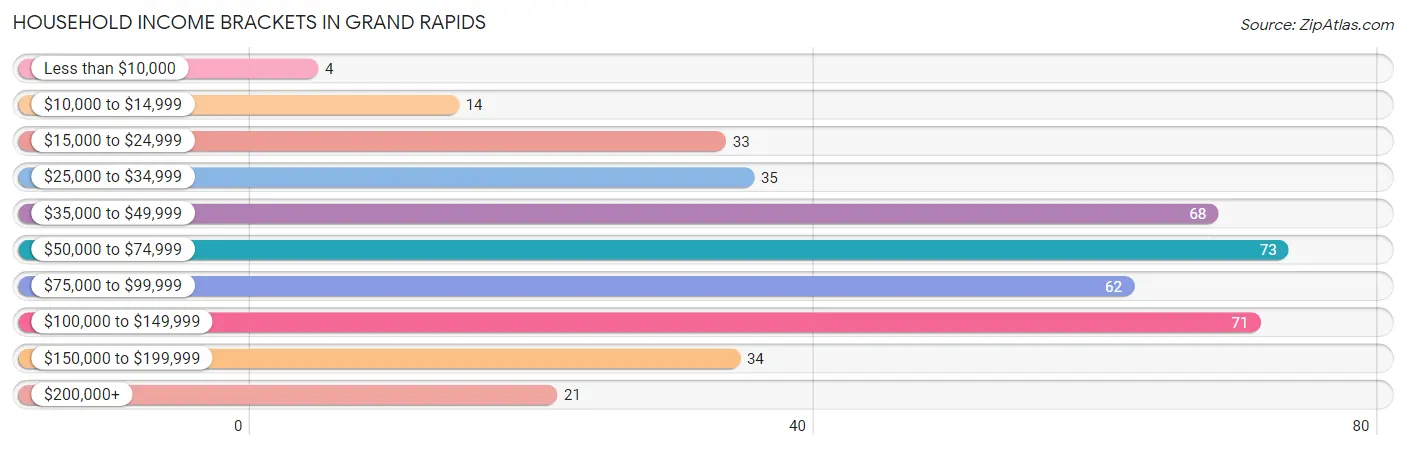
| Income Bracket | # Households | % Households |
| Less than $10,000 | 4 | 1.0% |
| $10,000 to $14,999 | 14 | 3.4% |
| $15,000 to $24,999 | 33 | 8.0% |
| $25,000 to $34,999 | 35 | 8.4% |
| $35,000 to $49,999 | 68 | 16.4% |
| $50,000 to $74,999 | 73 | 17.6% |
| $75,000 to $99,999 | 62 | 14.9% |
| $100,000 to $149,999 | 71 | 17.1% |
| $150,000 to $199,999 | 34 | 8.2% |
| $200,000+ | 21 | 5.1% |
Household Income by Householder Age in Grand Rapids
The median household income in Grand Rapids is $71,719, with the highest median household income of $86,042 found in the 45 to 64 years age bracket for the primary householder. A total of 105 households (25.3%) fall into this category. Meanwhile, the 15 to 24 years age bracket for the primary householder has the lowest median household income of $0, with 17 households (4.1%) in this group.
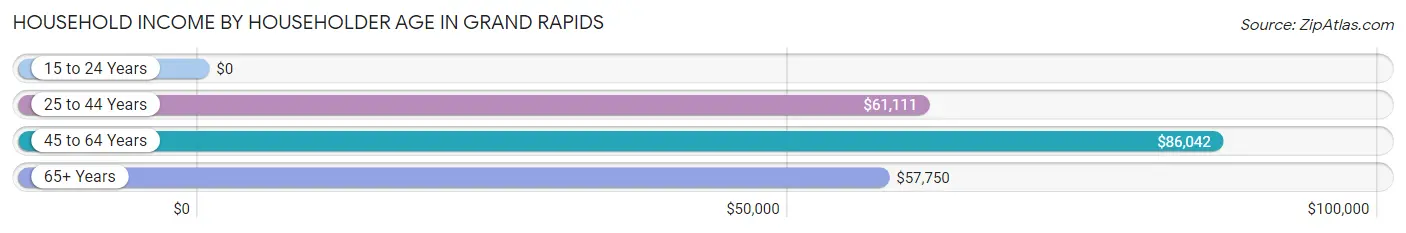
| Income Bracket | # Households | Median Income |
| 15 to 24 Years | 17 (4.1%) | $0 |
| 25 to 44 Years | 196 (47.2%) | $61,111 |
| 45 to 64 Years | 105 (25.3%) | $86,042 |
| 65+ Years | 97 (23.4%) | $57,750 |
| Total | 415 (100.0%) | $71,719 |
Poverty in Grand Rapids
Income Below Poverty by Sex and Age in Grand Rapids
With 12.6% poverty level for males and 7.4% for females among the residents of Grand Rapids, 12 to 14 year old males and 5 year old females are the most vulnerable to poverty, with 10 males (45.5%) and 2 females (50.0%) in their respective age groups living below the poverty level.
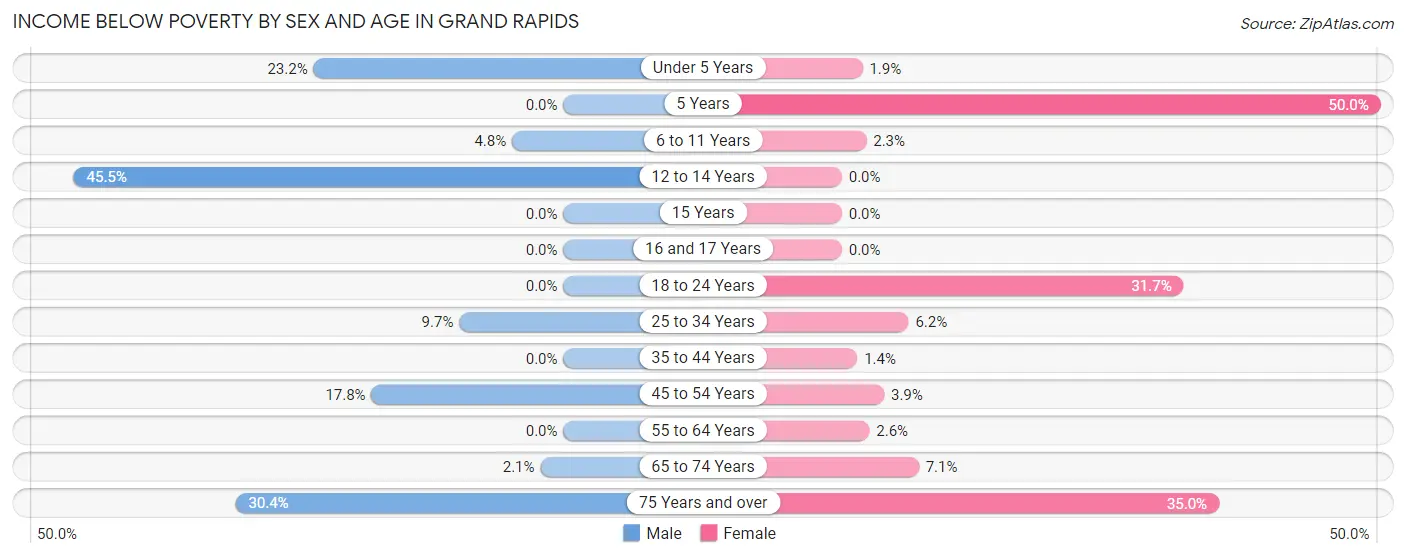
| Age Bracket | Male | Female |
| Under 5 Years | 16 (23.2%) | 1 (1.9%) |
| 5 Years | 0 (0.0%) | 2 (50.0%) |
| 6 to 11 Years | 1 (4.8%) | 1 (2.3%) |
| 12 to 14 Years | 10 (45.5%) | 0 (0.0%) |
| 15 Years | 0 (0.0%) | 0 (0.0%) |
| 16 and 17 Years | 0 (0.0%) | 0 (0.0%) |
| 18 to 24 Years | 0 (0.0%) | 13 (31.7%) |
| 25 to 34 Years | 14 (9.7%) | 7 (6.2%) |
| 35 to 44 Years | 0 (0.0%) | 1 (1.4%) |
| 45 to 54 Years | 13 (17.8%) | 2 (3.9%) |
| 55 to 64 Years | 0 (0.0%) | 1 (2.6%) |
| 65 to 74 Years | 1 (2.1%) | 4 (7.1%) |
| 75 Years and over | 7 (30.4%) | 7 (35.0%) |
| Total | 62 (12.6%) | 39 (7.4%) |
Income Above Poverty by Sex and Age in Grand Rapids
According to the poverty statistics in Grand Rapids, males aged 5 years and females aged 12 to 14 years are the age groups that are most secure financially, with 100.0% of males and 100.0% of females in these age groups living above the poverty line.
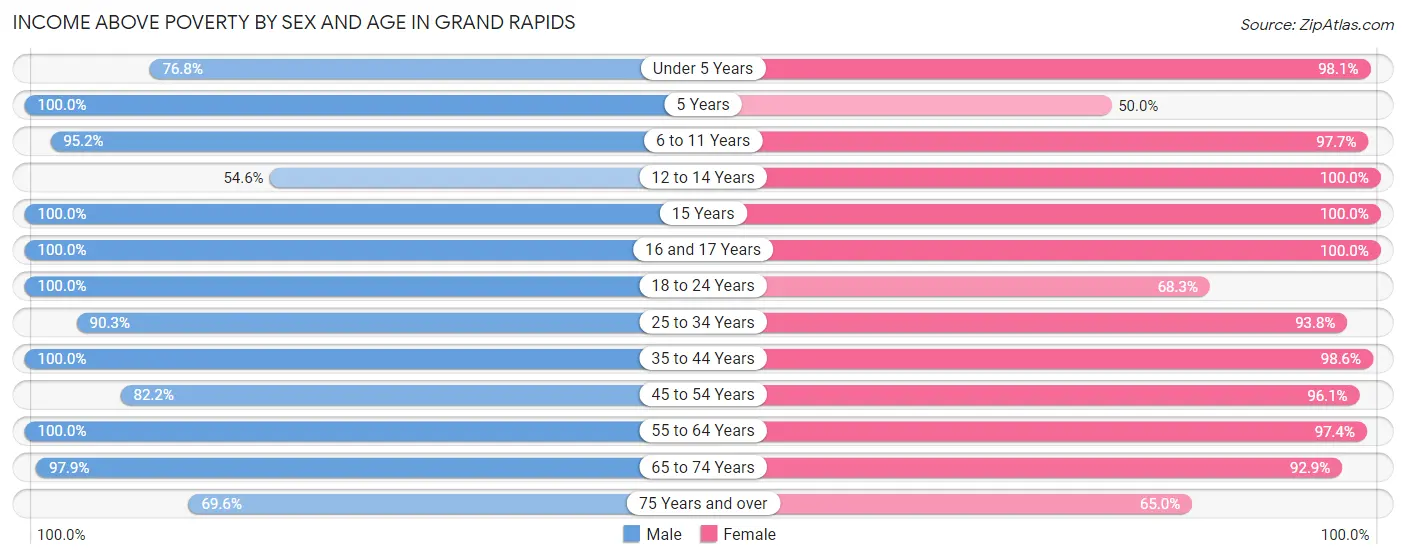
| Age Bracket | Male | Female |
| Under 5 Years | 53 (76.8%) | 51 (98.1%) |
| 5 Years | 7 (100.0%) | 2 (50.0%) |
| 6 to 11 Years | 20 (95.2%) | 43 (97.7%) |
| 12 to 14 Years | 12 (54.5%) | 7 (100.0%) |
| 15 Years | 4 (100.0%) | 10 (100.0%) |
| 16 and 17 Years | 3 (100.0%) | 20 (100.0%) |
| 18 to 24 Years | 9 (100.0%) | 28 (68.3%) |
| 25 to 34 Years | 131 (90.3%) | 106 (93.8%) |
| 35 to 44 Years | 41 (100.0%) | 69 (98.6%) |
| 45 to 54 Years | 60 (82.2%) | 49 (96.1%) |
| 55 to 64 Years | 27 (100.0%) | 38 (97.4%) |
| 65 to 74 Years | 46 (97.9%) | 52 (92.9%) |
| 75 Years and over | 16 (69.6%) | 13 (65.0%) |
| Total | 429 (87.4%) | 488 (92.6%) |
Income Below Poverty Among Married-Couple Families in Grand Rapids
The poverty statistics for married-couple families in Grand Rapids show that 5.0% or 10 of the total 202 families live below the poverty line. Families with 5 or more children have the highest poverty rate of 100.0%, comprising of 1 families. On the other hand, families with no children have the lowest poverty rate of 0.0%, which includes 0 families.
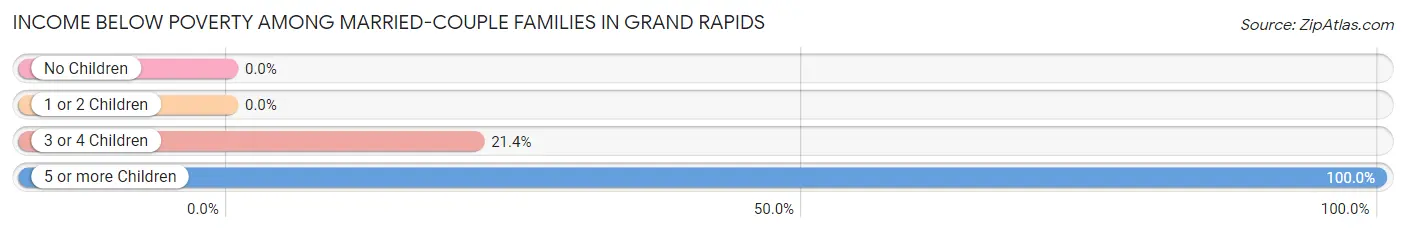
| Children | Above Poverty | Below Poverty |
| No Children | 81 (100.0%) | 0 (0.0%) |
| 1 or 2 Children | 78 (100.0%) | 0 (0.0%) |
| 3 or 4 Children | 33 (78.6%) | 9 (21.4%) |
| 5 or more Children | 0 (0.0%) | 1 (100.0%) |
| Total | 192 (95.1%) | 10 (5.0%) |
Income Below Poverty Among Single-Parent Households in Grand Rapids
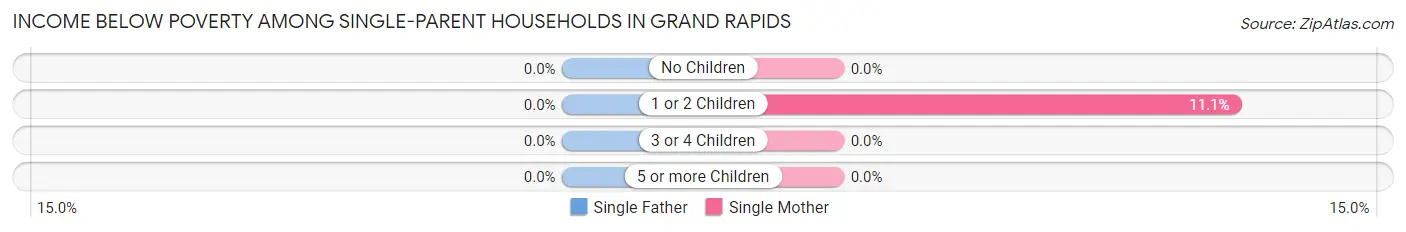
| Children | Single Father | Single Mother |
| No Children | 0 (0.0%) | 0 (0.0%) |
| 1 or 2 Children | 0 (0.0%) | 2 (11.1%) |
| 3 or 4 Children | 0 (0.0%) | 0 (0.0%) |
| 5 or more Children | 0 (0.0%) | 0 (0.0%) |
| Total | 0 (0.0%) | 2 (6.9%) |
Income Below Poverty Among Married-Couple vs Single-Parent Households in Grand Rapids
The poverty data for Grand Rapids shows that 10 of the married-couple family households (5.0%) and 2 of the single-parent households (4.1%) are living below the poverty level. Within the married-couple family households, those with 5 or more children have the highest poverty rate, with 1 households (100.0%) falling below the poverty line. Among the single-parent households, those with 1 or 2 children have the highest poverty rate, with 2 household (5.7%) living below poverty.
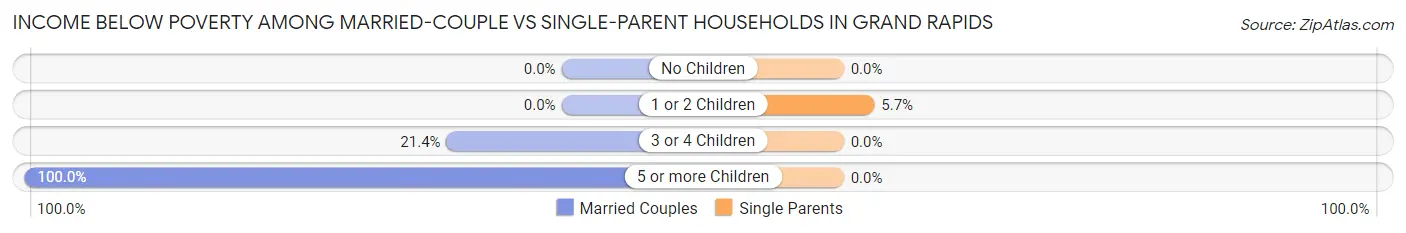
| Children | Married-Couple Families | Single-Parent Households |
| No Children | 0 (0.0%) | 0 (0.0%) |
| 1 or 2 Children | 0 (0.0%) | 2 (5.7%) |
| 3 or 4 Children | 9 (21.4%) | 0 (0.0%) |
| 5 or more Children | 1 (100.0%) | 0 (0.0%) |
| Total | 10 (5.0%) | 2 (4.1%) |
Race in Grand Rapids
The most populous races in Grand Rapids are White / Caucasian (982 | 95.1%), Hispanic or Latino (42 | 4.1%), and Two or more Races (34 | 3.3%).
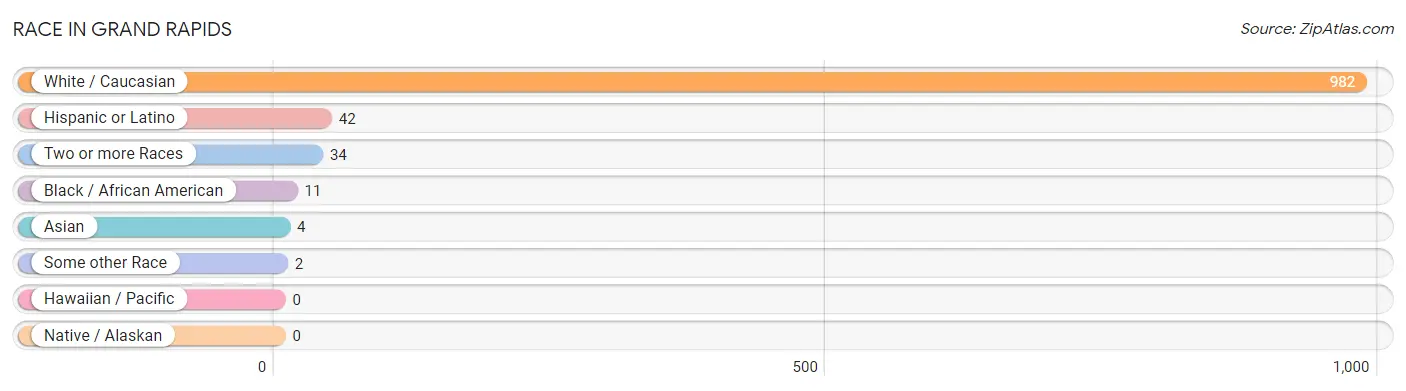
| Race | # Population | % Population |
| Asian | 4 | 0.4% |
| Black / African American | 11 | 1.1% |
| Hawaiian / Pacific | 0 | 0.0% |
| Hispanic or Latino | 42 | 4.1% |
| Native / Alaskan | 0 | 0.0% |
| White / Caucasian | 982 | 95.1% |
| Two or more Races | 34 | 3.3% |
| Some other Race | 2 | 0.2% |
| Total | 1,033 | 100.0% |
Ancestry in Grand Rapids
The most populous ancestries reported in Grand Rapids are German (446 | 43.2%), Irish (126 | 12.2%), French (74 | 7.2%), English (64 | 6.2%), and American (48 | 4.6%), together accounting for 73.4% of all Grand Rapids residents.
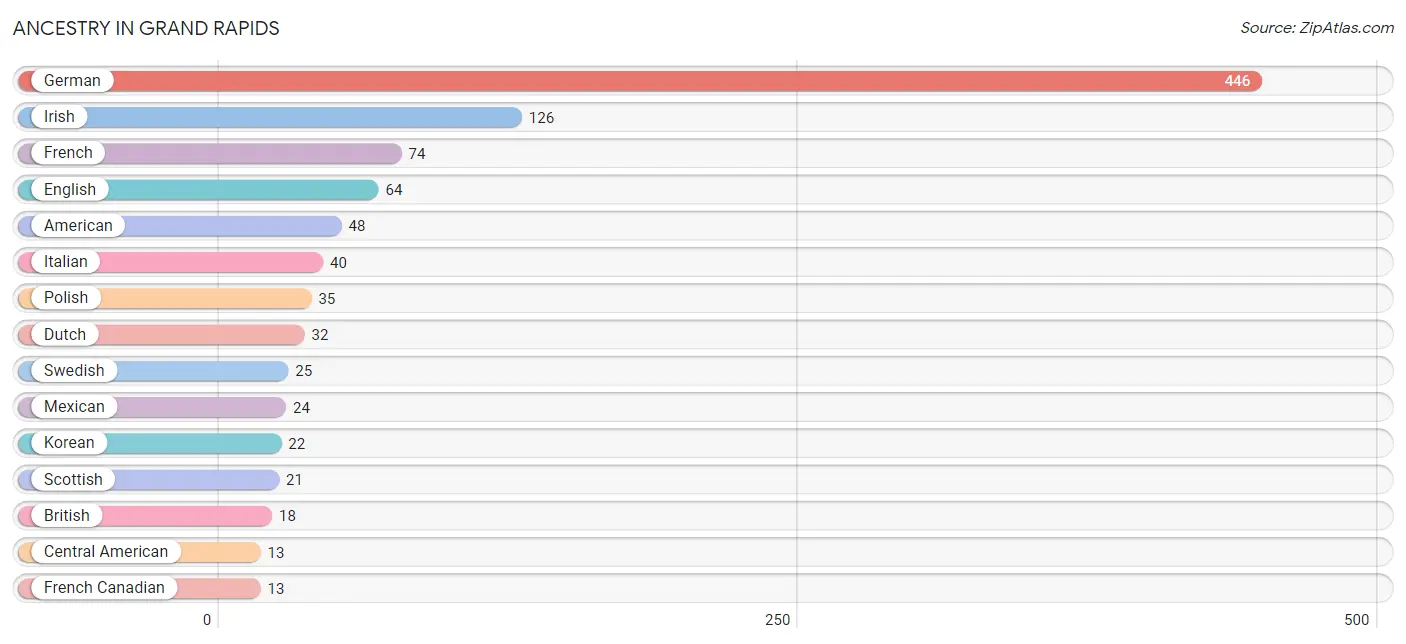
| Ancestry | # Population | % Population |
| American | 48 | 4.6% |
| Arab | 4 | 0.4% |
| British | 18 | 1.7% |
| Canadian | 11 | 1.1% |
| Central American | 13 | 1.3% |
| Central American Indian | 2 | 0.2% |
| Czech | 3 | 0.3% |
| Danish | 2 | 0.2% |
| Dutch | 32 | 3.1% |
| Eastern European | 2 | 0.2% |
| Ecuadorian | 3 | 0.3% |
| English | 64 | 6.2% |
| European | 9 | 0.9% |
| French | 74 | 7.2% |
| French Canadian | 13 | 1.3% |
| German | 446 | 43.2% |
| Guatemalan | 13 | 1.3% |
| Hungarian | 5 | 0.5% |
| Indian (Asian) | 4 | 0.4% |
| Irish | 126 | 12.2% |
| Italian | 40 | 3.9% |
| Korean | 22 | 2.1% |
| Latvian | 8 | 0.8% |
| Lebanese | 4 | 0.4% |
| Mexican | 24 | 2.3% |
| Norwegian | 6 | 0.6% |
| Polish | 35 | 3.4% |
| Puerto Rican | 2 | 0.2% |
| Russian | 4 | 0.4% |
| Scotch-Irish | 6 | 0.6% |
| Scottish | 21 | 2.0% |
| Serbian | 10 | 1.0% |
| Slovak | 7 | 0.7% |
| South American | 3 | 0.3% |
| Swedish | 25 | 2.4% |
| Thai | 4 | 0.4% | View All 36 Rows |
Immigrants in Grand Rapids
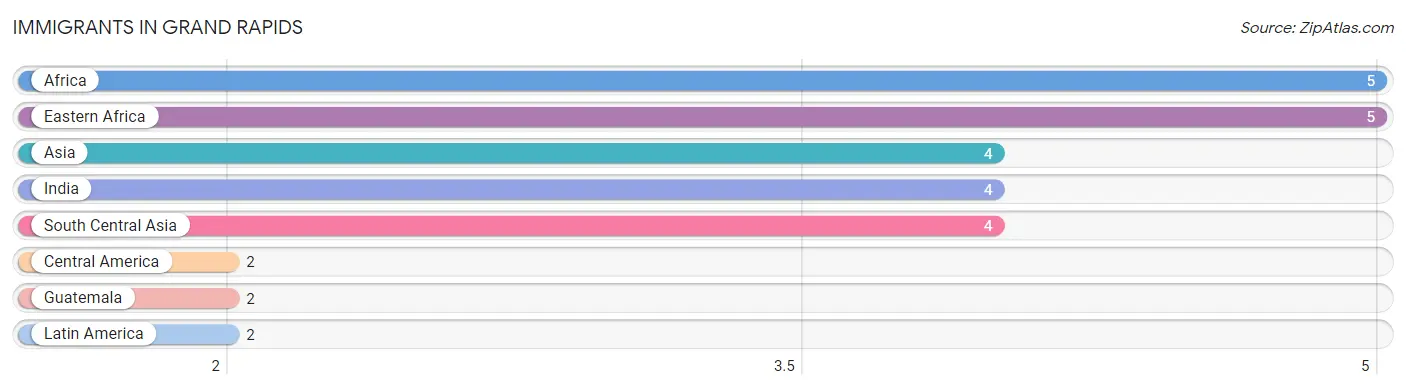
The most numerous immigrant groups reported in Grand Rapids came from Africa (5 | 0.5%), Eastern Africa (5 | 0.5%), Asia (4 | 0.4%), India (4 | 0.4%), and South Central Asia (4 | 0.4%), together accounting for 2.1% of all Grand Rapids residents.
| Immigration Origin | # Population | % Population |
| Africa | 5 | 0.5% |
| Asia | 4 | 0.4% |
| Central America | 2 | 0.2% |
| Eastern Africa | 5 | 0.5% |
| Guatemala | 2 | 0.2% |
| India | 4 | 0.4% |
| Latin America | 2 | 0.2% |
| South Central Asia | 4 | 0.4% | View All 8 Rows |
Sex and Age in Grand Rapids
Sex and Age in Grand Rapids
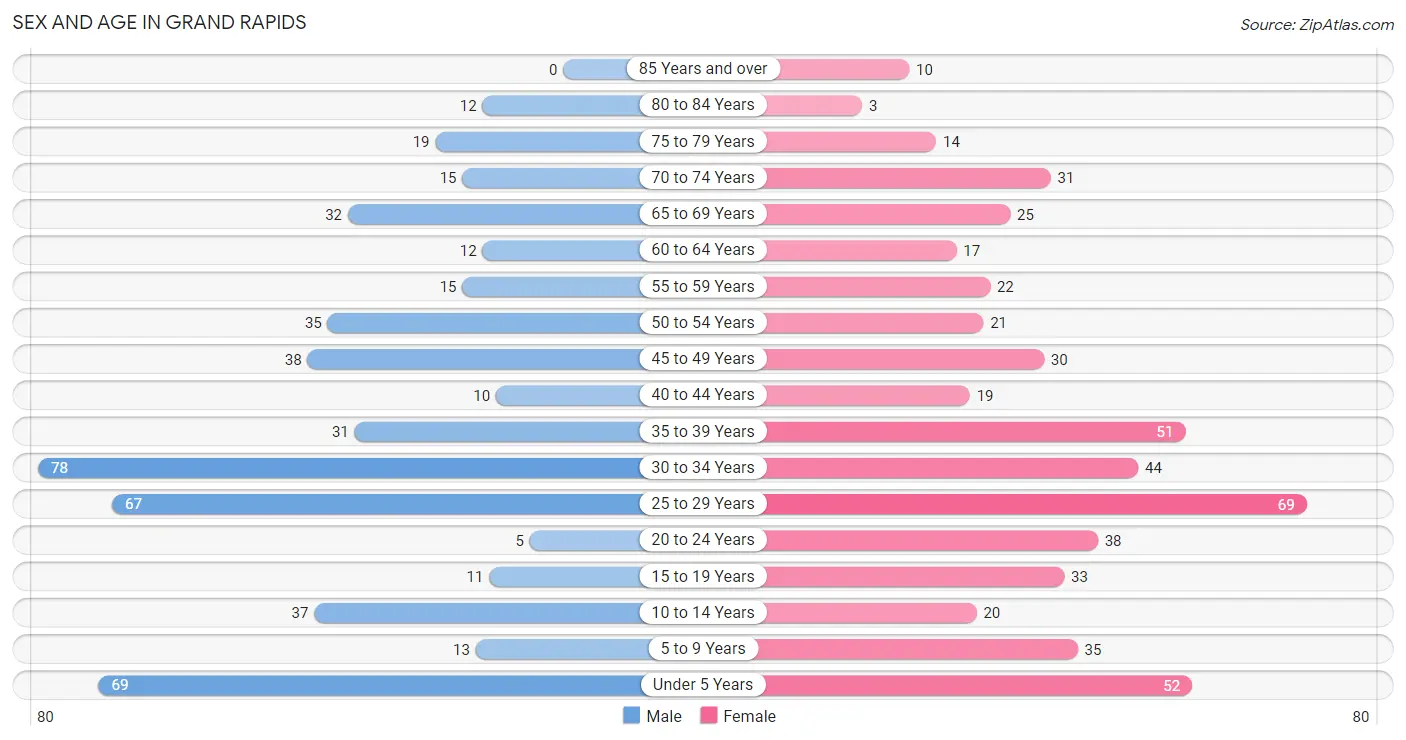
The most populous age groups in Grand Rapids are 30 to 34 Years (78 | 15.6%) for men and 25 to 29 Years (69 | 12.9%) for women.
| Age Bracket | Male | Female |
| Under 5 Years | 69 (13.8%) | 52 (9.7%) |
| 5 to 9 Years | 13 (2.6%) | 35 (6.6%) |
| 10 to 14 Years | 37 (7.4%) | 20 (3.7%) |
| 15 to 19 Years | 11 (2.2%) | 33 (6.2%) |
| 20 to 24 Years | 5 (1.0%) | 38 (7.1%) |
| 25 to 29 Years | 67 (13.4%) | 69 (12.9%) |
| 30 to 34 Years | 78 (15.6%) | 44 (8.2%) |
| 35 to 39 Years | 31 (6.2%) | 51 (9.6%) |
| 40 to 44 Years | 10 (2.0%) | 19 (3.6%) |
| 45 to 49 Years | 38 (7.6%) | 30 (5.6%) |
| 50 to 54 Years | 35 (7.0%) | 21 (3.9%) |
| 55 to 59 Years | 15 (3.0%) | 22 (4.1%) |
| 60 to 64 Years | 12 (2.4%) | 17 (3.2%) |
| 65 to 69 Years | 32 (6.4%) | 25 (4.7%) |
| 70 to 74 Years | 15 (3.0%) | 31 (5.8%) |
| 75 to 79 Years | 19 (3.8%) | 14 (2.6%) |
| 80 to 84 Years | 12 (2.4%) | 3 (0.6%) |
| 85 Years and over | 0 (0.0%) | 10 (1.9%) |
| Total | 499 (100.0%) | 534 (100.0%) |
Families and Households in Grand Rapids
Median Family Size in Grand Rapids
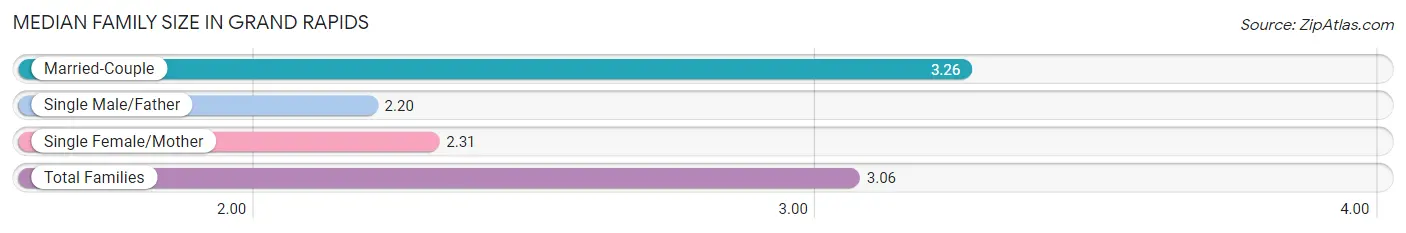
The median family size in Grand Rapids is 3.06 persons per family, with married-couple families (202 | 80.5%) accounting for the largest median family size of 3.26 persons per family. On the other hand, single male/father families (20 | 8.0%) represent the smallest median family size with 2.20 persons per family.
| Family Type | # Families | Family Size |
| Married-Couple | 202 (80.5%) | 3.26 |
| Single Male/Father | 20 (8.0%) | 2.20 |
| Single Female/Mother | 29 (11.6%) | 2.31 |
| Total Families | 251 (100.0%) | 3.06 |
Median Household Size in Grand Rapids
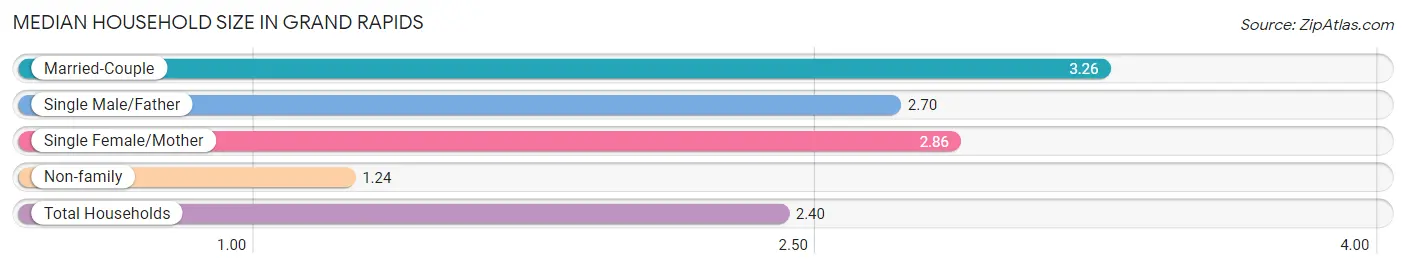
The median household size in Grand Rapids is 2.40 persons per household, with married-couple households (202 | 48.7%) accounting for the largest median household size of 3.26 persons per household. non-family households (164 | 39.5%) represent the smallest median household size with 1.24 persons per household.
| Household Type | # Households | Household Size |
| Married-Couple | 202 (48.7%) | 3.26 |
| Single Male/Father | 20 (4.8%) | 2.70 |
| Single Female/Mother | 29 (7.0%) | 2.86 |
| Non-family | 164 (39.5%) | 1.24 |
| Total Households | 415 (100.0%) | 2.40 |
Household Size by Marriage Status in Grand Rapids
Out of a total of 415 households in Grand Rapids, 251 (60.5%) are family households, while 164 (39.5%) are nonfamily households. The most numerous type of family households are 3-person households, comprising 85, and the most common type of nonfamily households are 1-person households, comprising 135.
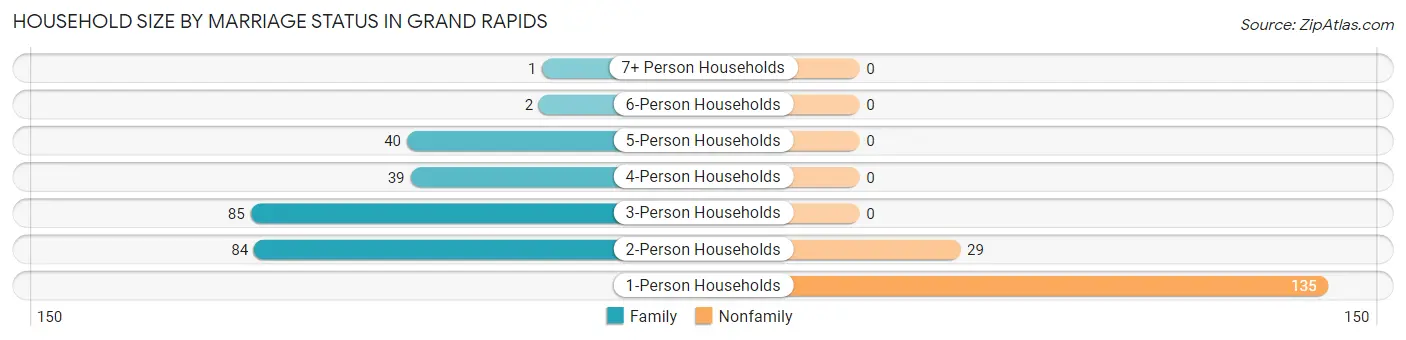
| Household Size | Family Households | Nonfamily Households |
| 1-Person Households | - | 135 (32.5%) |
| 2-Person Households | 84 (20.2%) | 29 (7.0%) |
| 3-Person Households | 85 (20.5%) | 0 (0.0%) |
| 4-Person Households | 39 (9.4%) | 0 (0.0%) |
| 5-Person Households | 40 (9.6%) | 0 (0.0%) |
| 6-Person Households | 2 (0.5%) | 0 (0.0%) |
| 7+ Person Households | 1 (0.2%) | 0 (0.0%) |
| Total | 251 (60.5%) | 164 (39.5%) |
Female Fertility in Grand Rapids
Fertility by Age in Grand Rapids
Average fertility rate in Grand Rapids is 45.0 births per 1,000 women. Women in the age bracket of 20 to 34 years have the highest fertility rate with 86.0 births per 1,000 women. Women in the age bracket of 20 to 34 years acount for 100.0% of all women with births.
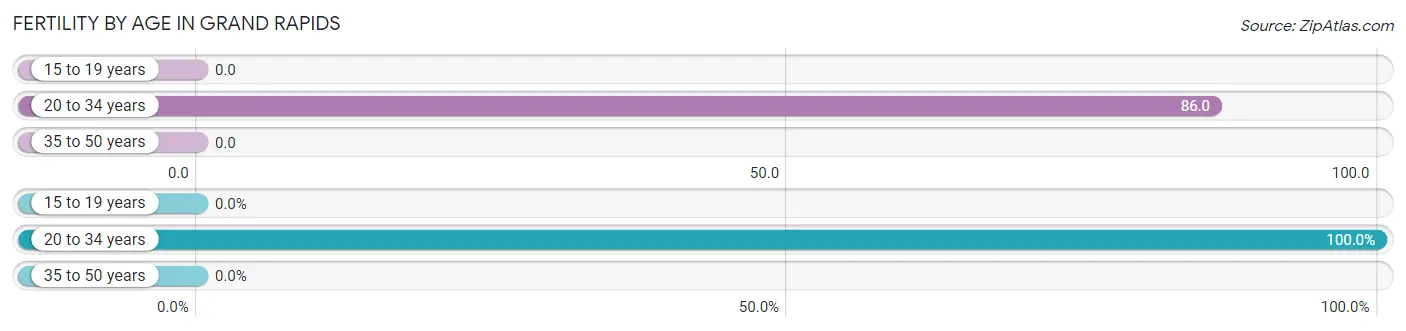
| Age Bracket | Women with Births | Births / 1,000 Women |
| 15 to 19 years | 0 (0.0%) | 0.0 |
| 20 to 34 years | 13 (100.0%) | 86.0 |
| 35 to 50 years | 0 (0.0%) | 0.0 |
| Total | 13 (100.0%) | 45.0 |
Fertility by Age by Marriage Status in Grand Rapids
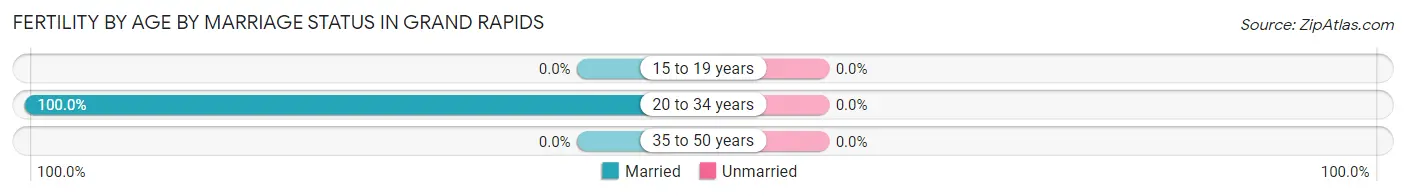
| Age Bracket | Married | Unmarried |
| 15 to 19 years | 0 (0.0%) | 0 (0.0%) |
| 20 to 34 years | 13 (100.0%) | 0 (0.0%) |
| 35 to 50 years | 0 (0.0%) | 0 (0.0%) |
| Total | 13 (100.0%) | 0 (0.0%) |
Fertility by Education in Grand Rapids
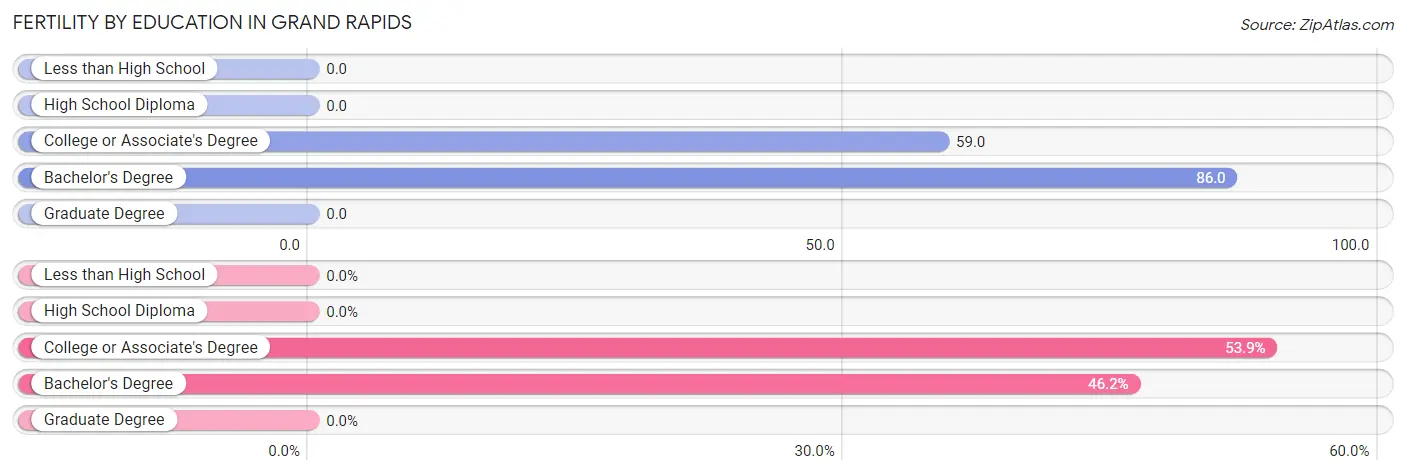
| Educational Attainment | Women with Births | Births / 1,000 Women |
| Less than High School | 0 (0.0%) | 0.0 |
| High School Diploma | 0 (0.0%) | 0.0 |
| College or Associate's Degree | 7 (53.8%) | 59.0 |
| Bachelor's Degree | 6 (46.2%) | 86.0 |
| Graduate Degree | 0 (0.0%) | 0.0 |
| Total | 13 (100.0%) | 45.0 |
Fertility by Education by Marriage Status in Grand Rapids
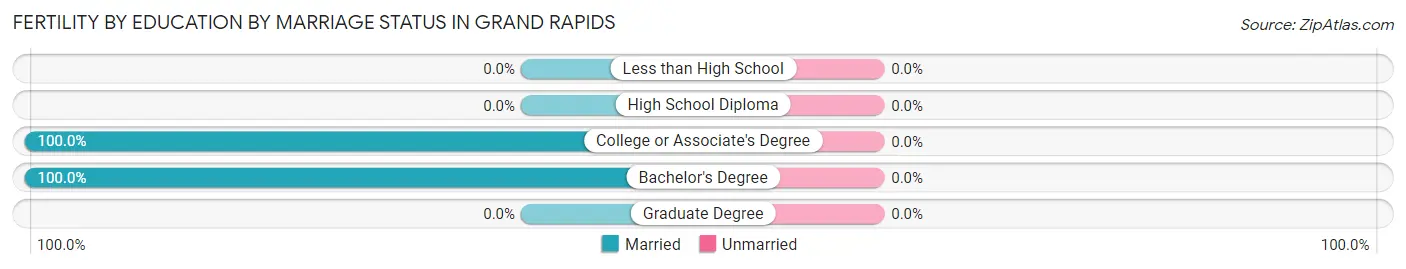
| Educational Attainment | Married | Unmarried |
| Less than High School | 0 (0.0%) | 0 (0.0%) |
| High School Diploma | 0 (0.0%) | 0 (0.0%) |
| College or Associate's Degree | 7 (100.0%) | 0 (0.0%) |
| Bachelor's Degree | 6 (100.0%) | 0 (0.0%) |
| Graduate Degree | 0 (0.0%) | 0 (0.0%) |
| Total | 13 (100.0%) | 0 (0.0%) |
Employment Characteristics in Grand Rapids
Employment by Class of Employer in Grand Rapids
Among the 575 employed individuals in Grand Rapids, private company employees (379 | 65.9%), not-for-profit organizations (88 | 15.3%), and self-employed (not incorporated) (38 | 6.6%) make up the most common classes of employment.
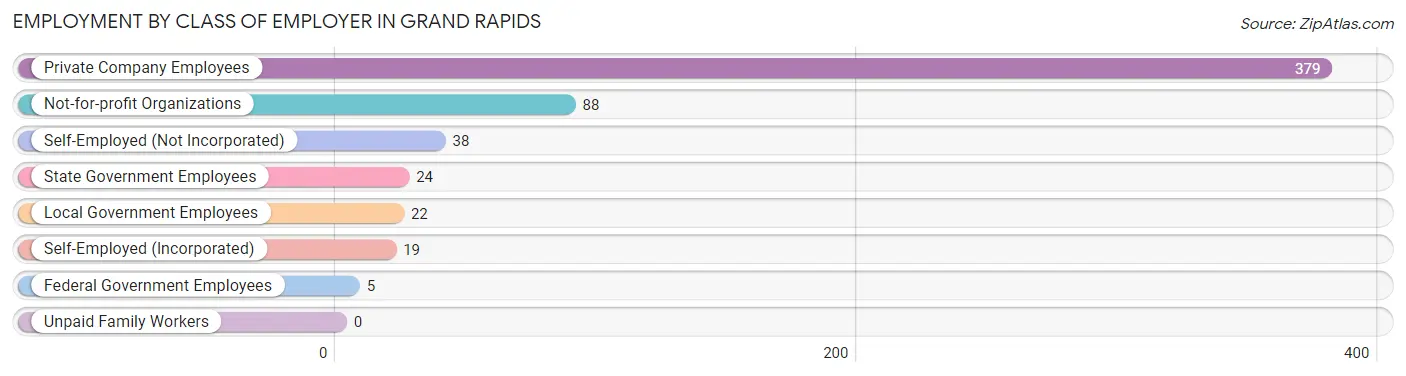
| Employer Class | # Employees | % Employees |
| Private Company Employees | 379 | 65.9% |
| Self-Employed (Incorporated) | 19 | 3.3% |
| Self-Employed (Not Incorporated) | 38 | 6.6% |
| Not-for-profit Organizations | 88 | 15.3% |
| Local Government Employees | 22 | 3.8% |
| State Government Employees | 24 | 4.2% |
| Federal Government Employees | 5 | 0.9% |
| Unpaid Family Workers | 0 | 0.0% |
| Total | 575 | 100.0% |
Employment Status by Age in Grand Rapids
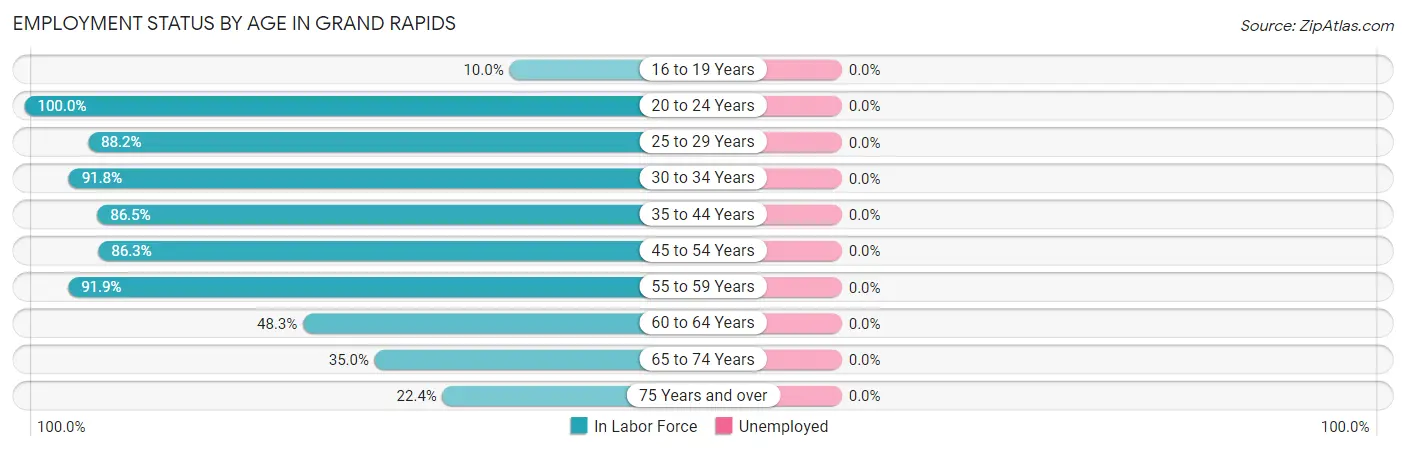
| Age Bracket | In Labor Force | Unemployed |
| 16 to 19 Years | 3 (10.0%) | 0 (0.0%) |
| 20 to 24 Years | 43 (100.0%) | 0 (0.0%) |
| 25 to 29 Years | 120 (88.2%) | 0 (0.0%) |
| 30 to 34 Years | 112 (91.8%) | 0 (0.0%) |
| 35 to 44 Years | 96 (86.5%) | 0 (0.0%) |
| 45 to 54 Years | 107 (86.3%) | 0 (0.0%) |
| 55 to 59 Years | 34 (91.9%) | 0 (0.0%) |
| 60 to 64 Years | 14 (48.3%) | 0 (0.0%) |
| 65 to 74 Years | 36 (35.0%) | 0 (0.0%) |
| 75 Years and over | 13 (22.4%) | 0 (0.0%) |
| Total | 578 (72.9%) | 0 (0.0%) |
Employment Status by Educational Attainment in Grand Rapids
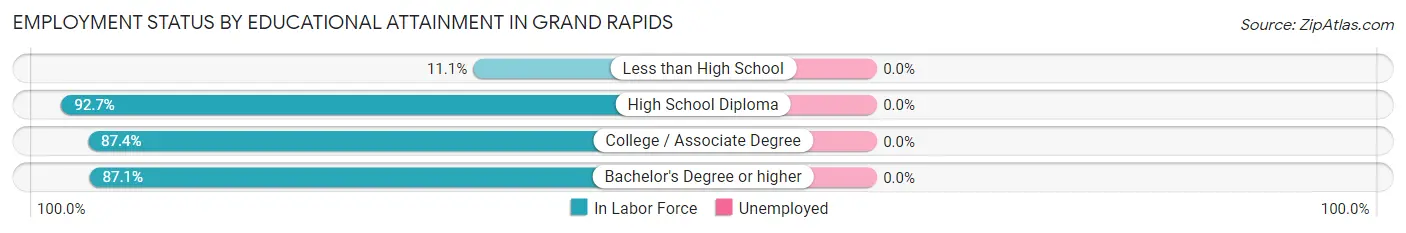
| Educational Attainment | In Labor Force | Unemployed |
| Less than High School | 2 (11.1%) | 0 (0.0%) |
| High School Diploma | 153 (92.7%) | 0 (0.0%) |
| College / Associate Degree | 173 (87.4%) | 0 (0.0%) |
| Bachelor's Degree or higher | 155 (87.1%) | 0 (0.0%) |
| Total | 483 (86.4%) | 0 (0.0%) |
Employment Occupations by Sex in Grand Rapids
Management, Business, Science and Arts Occupations
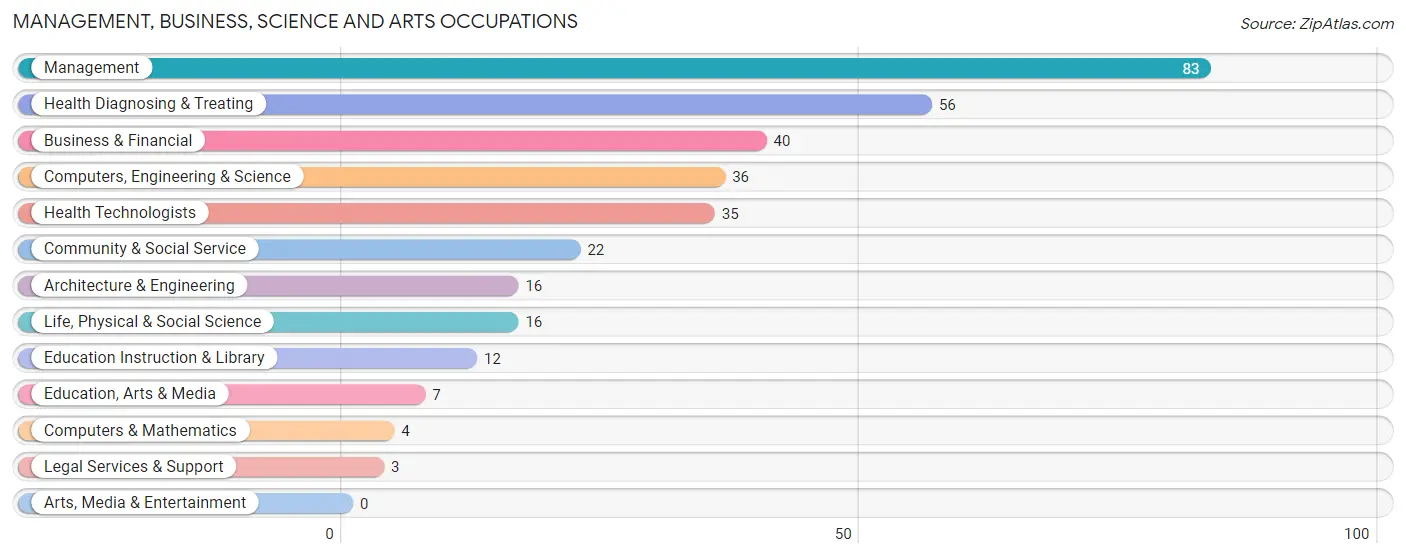
The most common Management, Business, Science and Arts occupations in Grand Rapids are Management (83 | 14.4%), Health Diagnosing & Treating (56 | 9.7%), Business & Financial (40 | 6.9%), Computers, Engineering & Science (36 | 6.2%), and Health Technologists (35 | 6.1%).
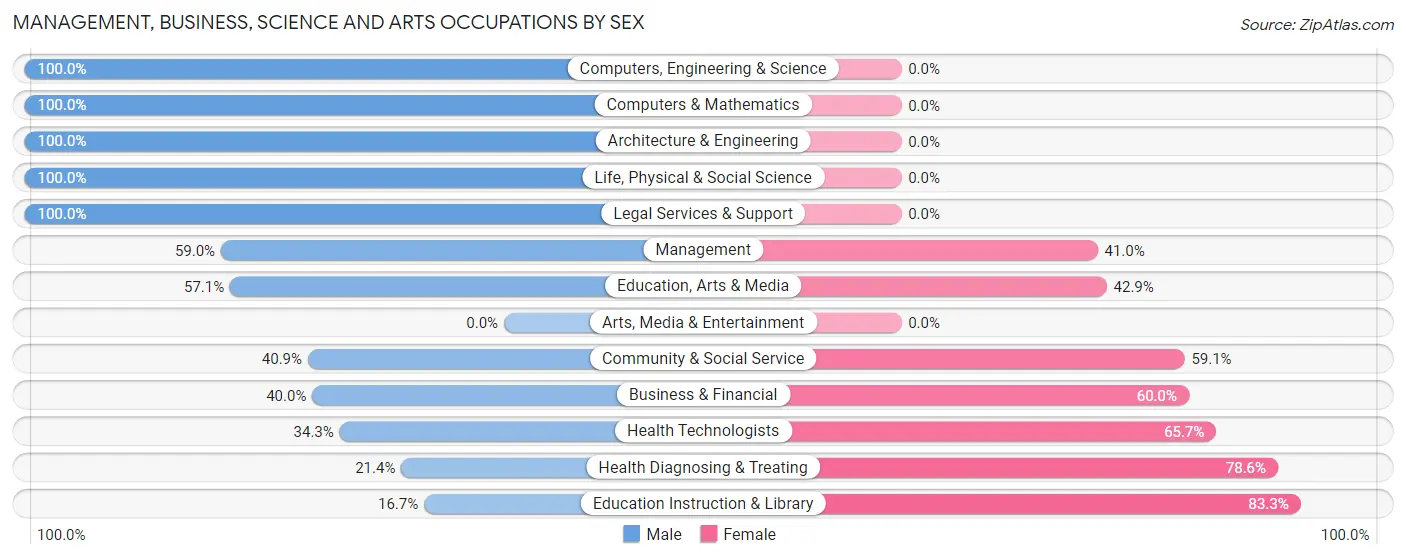
Management, Business, Science and Arts Occupations by Sex
Within the Management, Business, Science and Arts occupations in Grand Rapids, the most male-oriented occupations are Computers, Engineering & Science (100.0%), Computers & Mathematics (100.0%), and Architecture & Engineering (100.0%), while the most female-oriented occupations are Education Instruction & Library (83.3%), Health Diagnosing & Treating (78.6%), and Health Technologists (65.7%).
| Occupation | Male | Female |
| Management | 49 (59.0%) | 34 (41.0%) |
| Business & Financial | 16 (40.0%) | 24 (60.0%) |
| Computers, Engineering & Science | 36 (100.0%) | 0 (0.0%) |
| Computers & Mathematics | 4 (100.0%) | 0 (0.0%) |
| Architecture & Engineering | 16 (100.0%) | 0 (0.0%) |
| Life, Physical & Social Science | 16 (100.0%) | 0 (0.0%) |
| Community & Social Service | 9 (40.9%) | 13 (59.1%) |
| Education, Arts & Media | 4 (57.1%) | 3 (42.9%) |
| Legal Services & Support | 3 (100.0%) | 0 (0.0%) |
| Education Instruction & Library | 2 (16.7%) | 10 (83.3%) |
| Arts, Media & Entertainment | 0 (0.0%) | 0 (0.0%) |
| Health Diagnosing & Treating | 12 (21.4%) | 44 (78.6%) |
| Health Technologists | 12 (34.3%) | 23 (65.7%) |
| Total (Category) | 122 (51.5%) | 115 (48.5%) |
| Total (Overall) | 291 (50.3%) | 287 (49.6%) |
Services Occupations
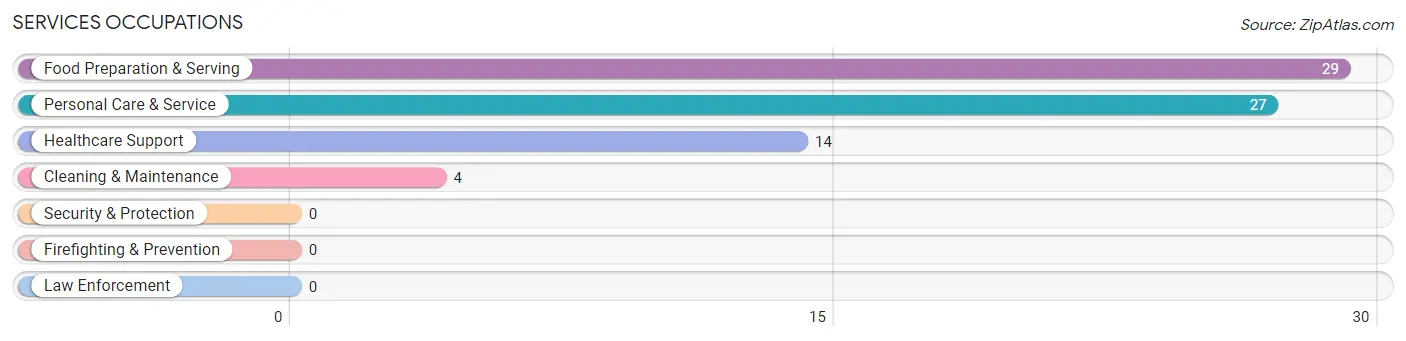
The most common Services occupations in Grand Rapids are Food Preparation & Serving (29 | 5.0%), Personal Care & Service (27 | 4.7%), Healthcare Support (14 | 2.4%), and Cleaning & Maintenance (4 | 0.7%).
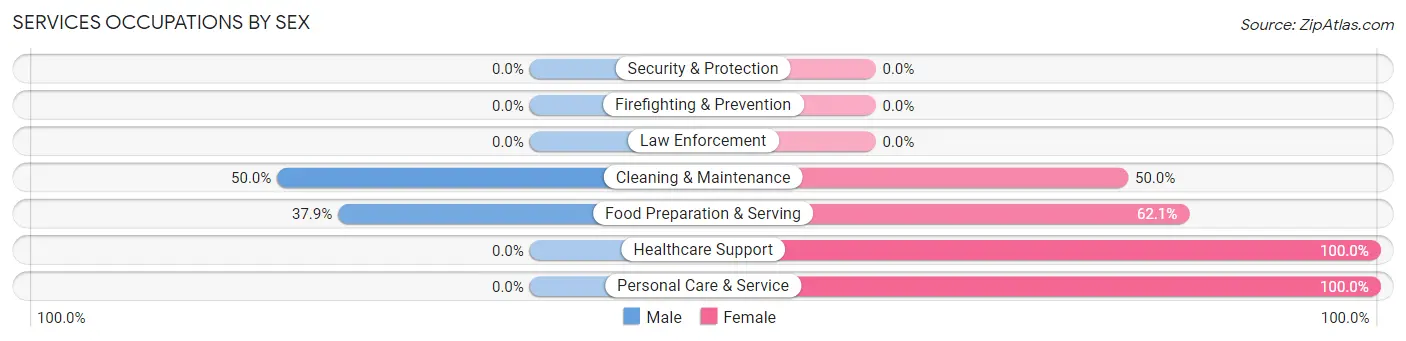
Services Occupations by Sex
Within the Services occupations in Grand Rapids, the most male-oriented occupations are Cleaning & Maintenance (50.0%), and Food Preparation & Serving (37.9%), while the most female-oriented occupations are Healthcare Support (100.0%), Personal Care & Service (100.0%), and Food Preparation & Serving (62.1%).
| Occupation | Male | Female |
| Healthcare Support | 0 (0.0%) | 14 (100.0%) |
| Security & Protection | 0 (0.0%) | 0 (0.0%) |
| Firefighting & Prevention | 0 (0.0%) | 0 (0.0%) |
| Law Enforcement | 0 (0.0%) | 0 (0.0%) |
| Food Preparation & Serving | 11 (37.9%) | 18 (62.1%) |
| Cleaning & Maintenance | 2 (50.0%) | 2 (50.0%) |
| Personal Care & Service | 0 (0.0%) | 27 (100.0%) |
| Total (Category) | 13 (17.6%) | 61 (82.4%) |
| Total (Overall) | 291 (50.3%) | 287 (49.6%) |
Sales and Office Occupations
The most common Sales and Office occupations in Grand Rapids are Office & Administration (57 | 9.9%), and Sales & Related (52 | 9.0%).
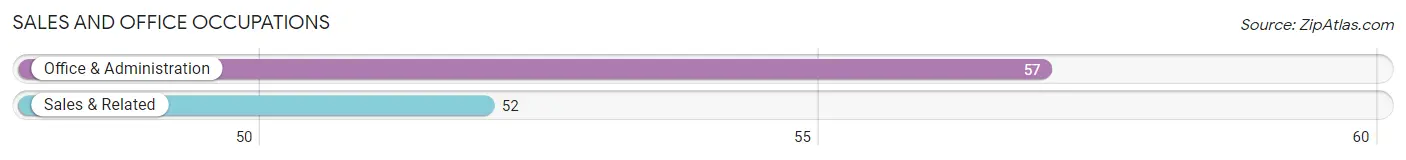
Sales and Office Occupations by Sex
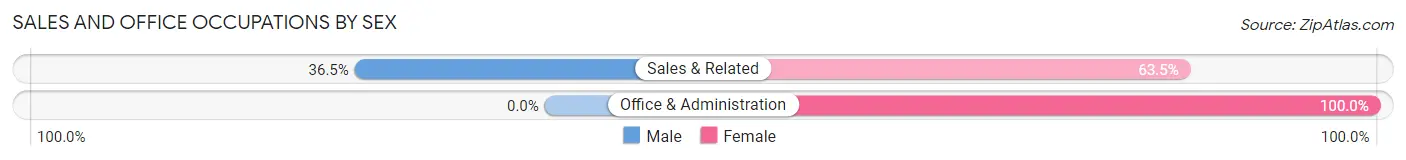
| Occupation | Male | Female |
| Sales & Related | 19 (36.5%) | 33 (63.5%) |
| Office & Administration | 0 (0.0%) | 57 (100.0%) |
| Total (Category) | 19 (17.4%) | 90 (82.6%) |
| Total (Overall) | 291 (50.3%) | 287 (49.6%) |
Natural Resources, Construction and Maintenance Occupations
The most common Natural Resources, Construction and Maintenance occupations in Grand Rapids are Construction & Extraction (71 | 12.3%), and Installation, Maintenance & Repair (10 | 1.7%).
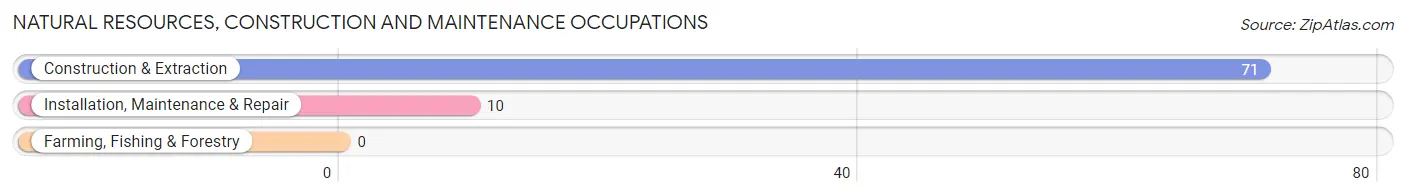
Natural Resources, Construction and Maintenance Occupations by Sex
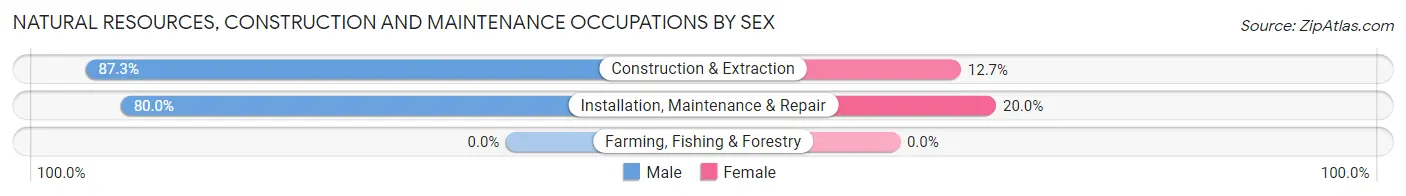
| Occupation | Male | Female |
| Farming, Fishing & Forestry | 0 (0.0%) | 0 (0.0%) |
| Construction & Extraction | 62 (87.3%) | 9 (12.7%) |
| Installation, Maintenance & Repair | 8 (80.0%) | 2 (20.0%) |
| Total (Category) | 70 (86.4%) | 11 (13.6%) |
| Total (Overall) | 291 (50.3%) | 287 (49.6%) |
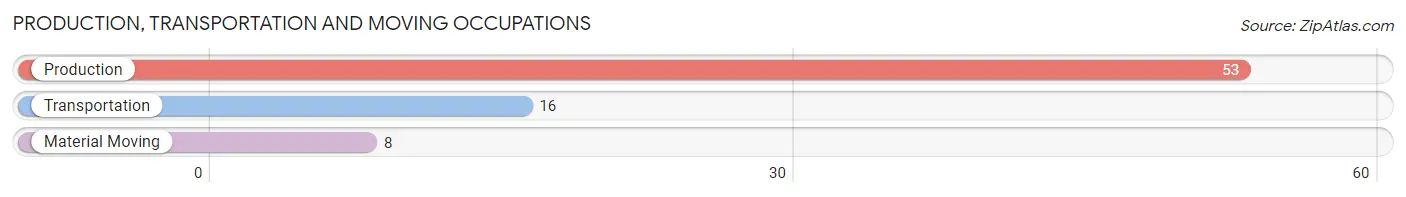
Production, Transportation and Moving Occupations
The most common Production, Transportation and Moving occupations in Grand Rapids are Production (53 | 9.2%), Transportation (16 | 2.8%), and Material Moving (8 | 1.4%).
Production, Transportation and Moving Occupations by Sex
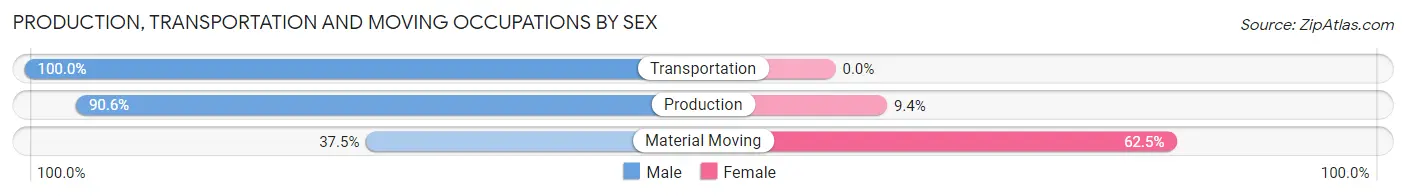
| Occupation | Male | Female |
| Production | 48 (90.6%) | 5 (9.4%) |
| Transportation | 16 (100.0%) | 0 (0.0%) |
| Material Moving | 3 (37.5%) | 5 (62.5%) |
| Total (Category) | 67 (87.0%) | 10 (13.0%) |
| Total (Overall) | 291 (50.3%) | 287 (49.6%) |
Employment Industries by Sex in Grand Rapids
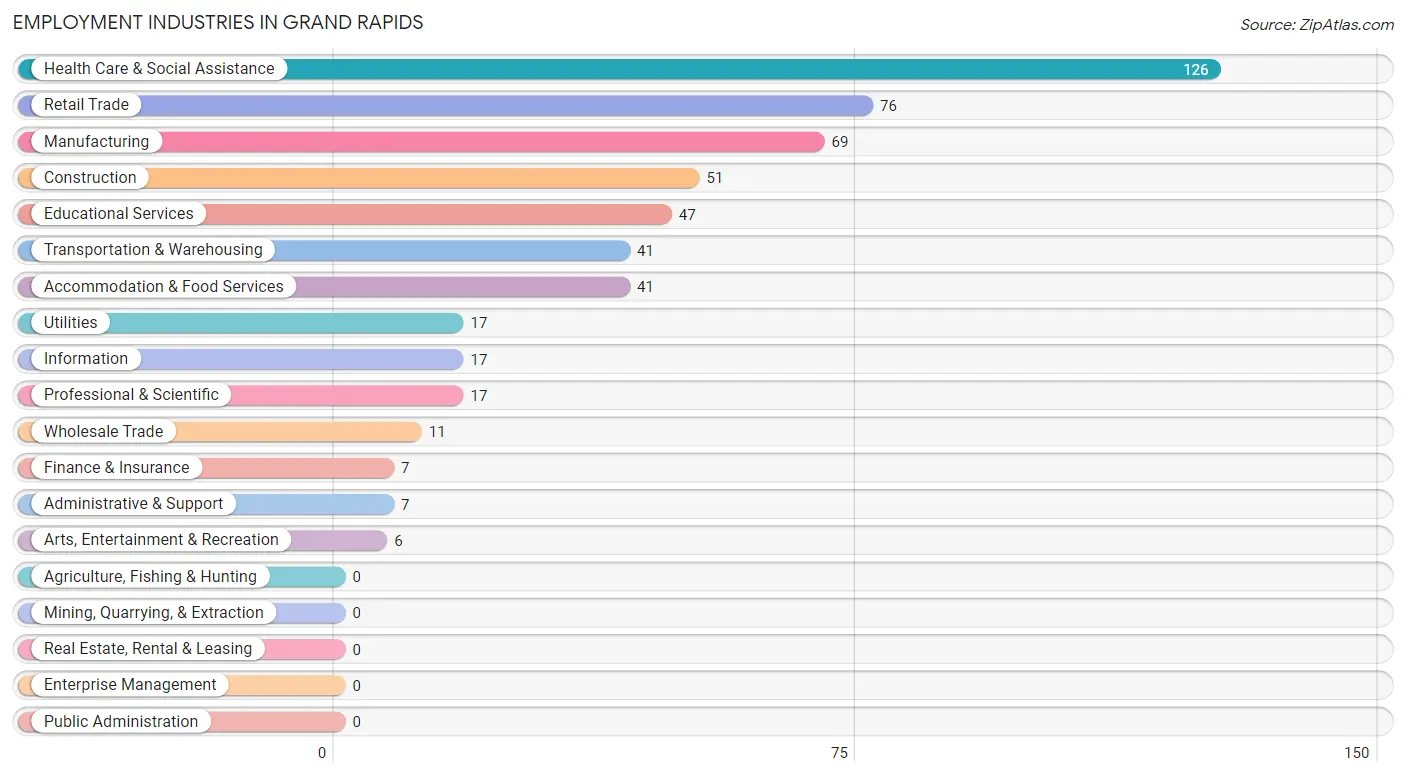
Employment Industries in Grand Rapids
The major employment industries in Grand Rapids include Health Care & Social Assistance (126 | 21.8%), Retail Trade (76 | 13.2%), Manufacturing (69 | 11.9%), Construction (51 | 8.8%), and Educational Services (47 | 8.1%).
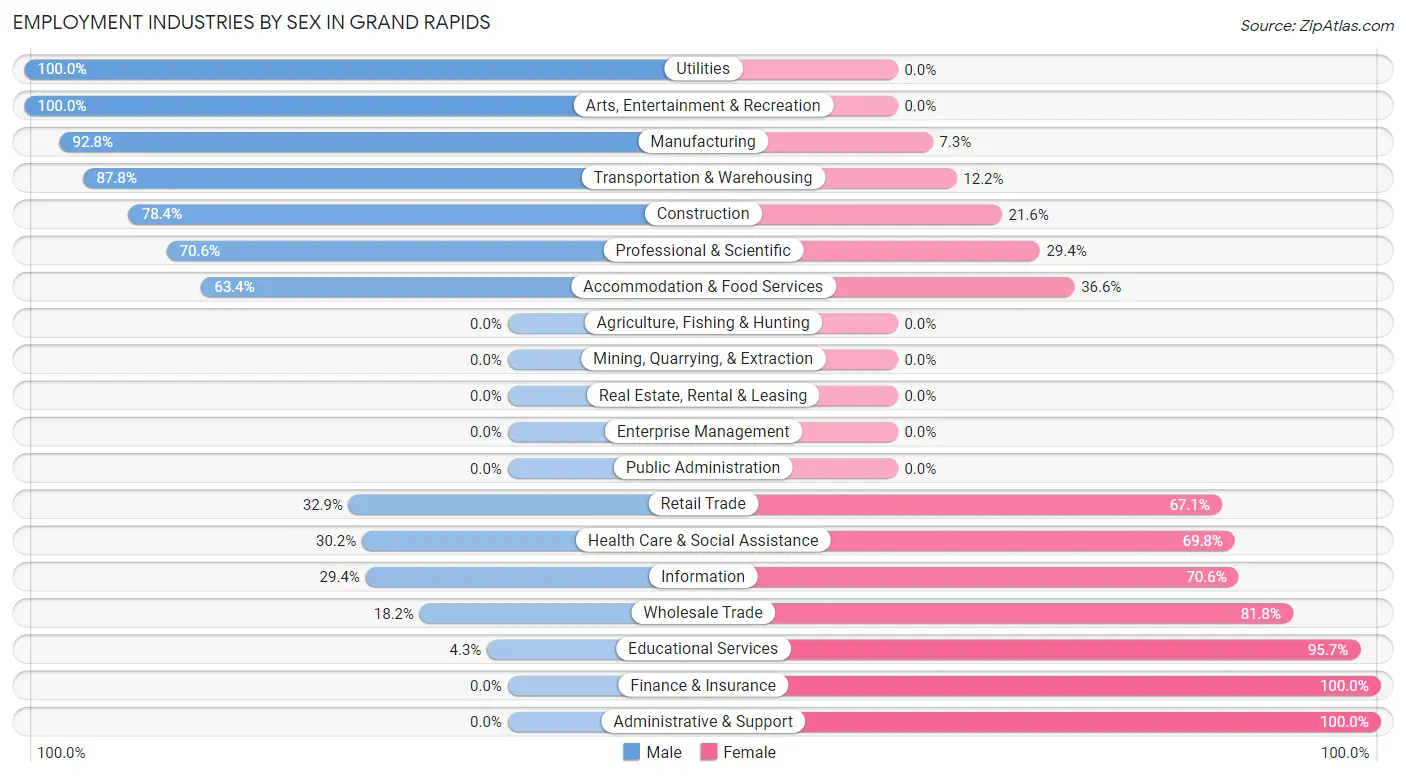
Employment Industries by Sex in Grand Rapids
The Grand Rapids industries that see more men than women are Utilities (100.0%), Arts, Entertainment & Recreation (100.0%), and Manufacturing (92.7%), whereas the industries that tend to have a higher number of women are Finance & Insurance (100.0%), Administrative & Support (100.0%), and Educational Services (95.7%).
| Industry | Male | Female |
| Agriculture, Fishing & Hunting | 0 (0.0%) | 0 (0.0%) |
| Mining, Quarrying, & Extraction | 0 (0.0%) | 0 (0.0%) |
| Construction | 40 (78.4%) | 11 (21.6%) |
| Manufacturing | 64 (92.7%) | 5 (7.2%) |
| Wholesale Trade | 2 (18.2%) | 9 (81.8%) |
| Retail Trade | 25 (32.9%) | 51 (67.1%) |
| Transportation & Warehousing | 36 (87.8%) | 5 (12.2%) |
| Utilities | 17 (100.0%) | 0 (0.0%) |
| Information | 5 (29.4%) | 12 (70.6%) |
| Finance & Insurance | 0 (0.0%) | 7 (100.0%) |
| Real Estate, Rental & Leasing | 0 (0.0%) | 0 (0.0%) |
| Professional & Scientific | 12 (70.6%) | 5 (29.4%) |
| Enterprise Management | 0 (0.0%) | 0 (0.0%) |
| Administrative & Support | 0 (0.0%) | 7 (100.0%) |
| Educational Services | 2 (4.3%) | 45 (95.7%) |
| Health Care & Social Assistance | 38 (30.2%) | 88 (69.8%) |
| Arts, Entertainment & Recreation | 6 (100.0%) | 0 (0.0%) |
| Accommodation & Food Services | 26 (63.4%) | 15 (36.6%) |
| Public Administration | 0 (0.0%) | 0 (0.0%) |
| Total | 291 (50.3%) | 287 (49.6%) |
Education in Grand Rapids
School Enrollment in Grand Rapids
The most common levels of schooling among the 183 students in Grand Rapids are high school (58 | 31.7%), middle school (43 | 23.5%), and nursery / preschool (21 | 11.5%).
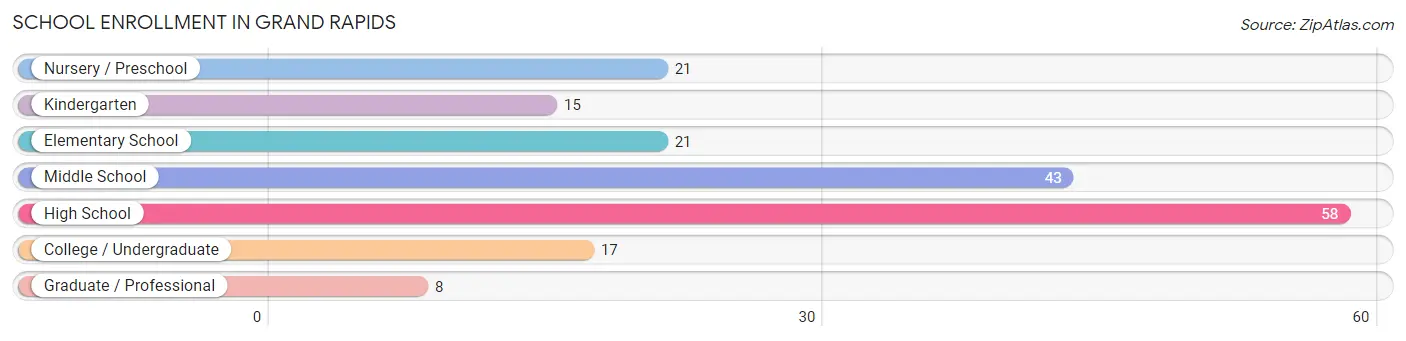
| School Level | # Students | % Students |
| Nursery / Preschool | 21 | 11.5% |
| Kindergarten | 15 | 8.2% |
| Elementary School | 21 | 11.5% |
| Middle School | 43 | 23.5% |
| High School | 58 | 31.7% |
| College / Undergraduate | 17 | 9.3% |
| Graduate / Professional | 8 | 4.4% |
| Total | 183 | 100.0% |
School Enrollment by Age by Funding Source in Grand Rapids
Out of a total of 183 students who are enrolled in schools in Grand Rapids, 32 (17.5%) attend a private institution, while the remaining 151 (82.5%) are enrolled in public schools. The age group of 3 to 4 year olds has the highest likelihood of being enrolled in private schools, with 10 (71.4% in the age bracket) enrolled. Conversely, the age group of 10 to 14 year olds has the lowest likelihood of being enrolled in a private school, with 57 (100.0% in the age bracket) attending a public institution.
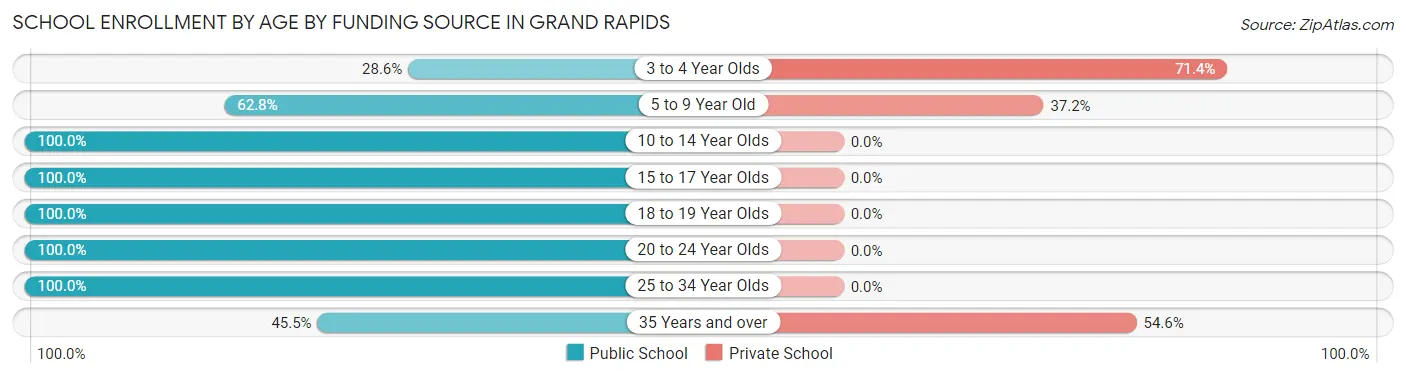
| Age Bracket | Public School | Private School |
| 3 to 4 Year Olds | 4 (28.6%) | 10 (71.4%) |
| 5 to 9 Year Old | 27 (62.8%) | 16 (37.2%) |
| 10 to 14 Year Olds | 57 (100.0%) | 0 (0.0%) |
| 15 to 17 Year Olds | 37 (100.0%) | 0 (0.0%) |
| 18 to 19 Year Olds | 7 (100.0%) | 0 (0.0%) |
| 20 to 24 Year Olds | 10 (100.0%) | 0 (0.0%) |
| 25 to 34 Year Olds | 4 (100.0%) | 0 (0.0%) |
| 35 Years and over | 5 (45.5%) | 6 (54.5%) |
| Total | 151 (82.5%) | 32 (17.5%) |
Educational Attainment by Field of Study in Grand Rapids
Arts & humanities (42 | 17.0%), social sciences (34 | 13.8%), education (29 | 11.7%), bio, nature & agricultural (28 | 11.3%), and psychology (25 | 10.1%) are the most common fields of study among 247 individuals in Grand Rapids who have obtained a bachelor's degree or higher.
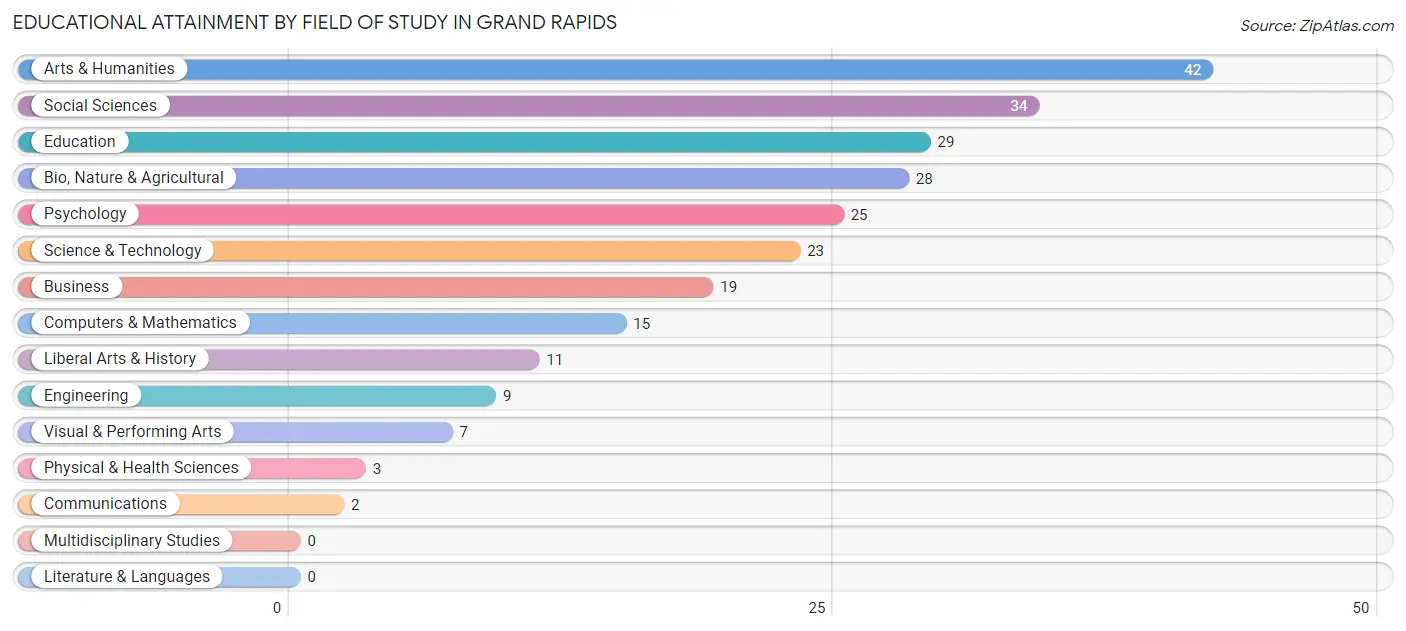
| Field of Study | # Graduates | % Graduates |
| Computers & Mathematics | 15 | 6.1% |
| Bio, Nature & Agricultural | 28 | 11.3% |
| Physical & Health Sciences | 3 | 1.2% |
| Psychology | 25 | 10.1% |
| Social Sciences | 34 | 13.8% |
| Engineering | 9 | 3.6% |
| Multidisciplinary Studies | 0 | 0.0% |
| Science & Technology | 23 | 9.3% |
| Business | 19 | 7.7% |
| Education | 29 | 11.7% |
| Literature & Languages | 0 | 0.0% |
| Liberal Arts & History | 11 | 4.4% |
| Visual & Performing Arts | 7 | 2.8% |
| Communications | 2 | 0.8% |
| Arts & Humanities | 42 | 17.0% |
| Total | 247 | 100.0% |
Transportation & Commute in Grand Rapids
Vehicle Availability by Sex in Grand Rapids
The most prevalent vehicle ownership categories in Grand Rapids are males with 3 vehicles (101, accounting for 36.5%) and females with 3 vehicles (80, making up 35.6%).
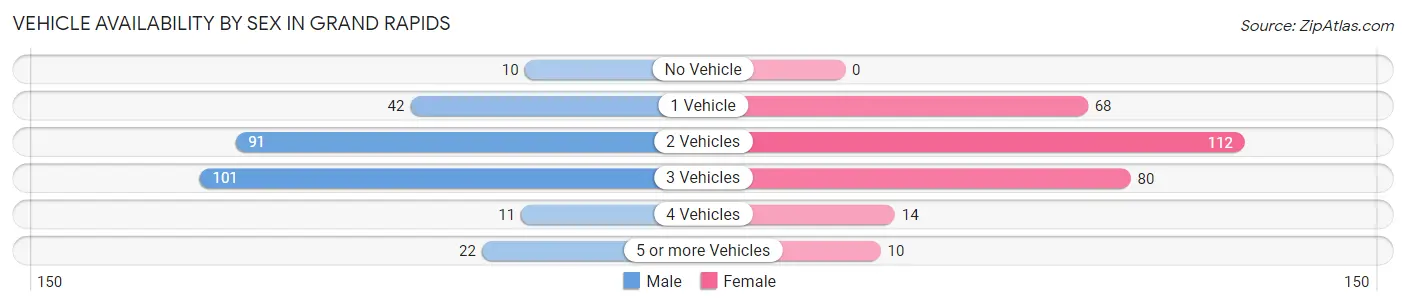
| Vehicles Available | Male | Female |
| No Vehicle | 10 (3.6%) | 0 (0.0%) |
| 1 Vehicle | 42 (15.2%) | 68 (23.9%) |
| 2 Vehicles | 91 (32.9%) | 112 (39.4%) |
| 3 Vehicles | 101 (36.5%) | 80 (28.2%) |
| 4 Vehicles | 11 (4.0%) | 14 (4.9%) |
| 5 or more Vehicles | 22 (7.9%) | 10 (3.5%) |
| Total | 277 (100.0%) | 284 (100.0%) |
Commute Time in Grand Rapids
The most frequently occuring commute durations in Grand Rapids are 20 to 24 minutes (135 commuters, 24.5%), 30 to 34 minutes (102 commuters, 18.5%), and 15 to 19 minutes (78 commuters, 14.2%).
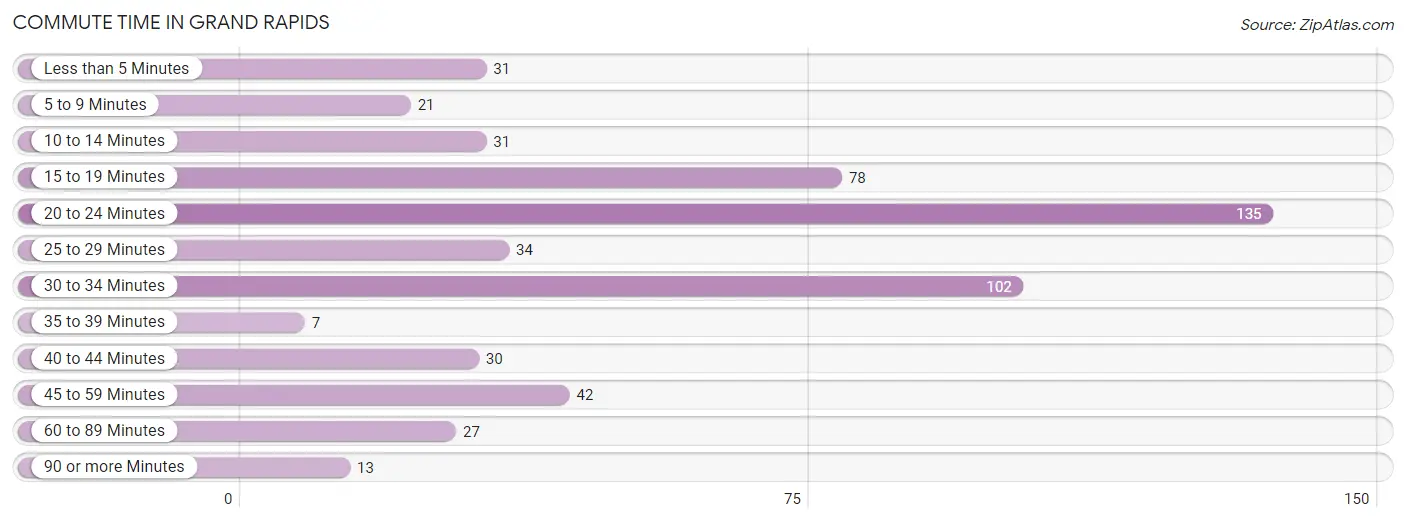
| Commute Time | # Commuters | % Commuters |
| Less than 5 Minutes | 31 | 5.6% |
| 5 to 9 Minutes | 21 | 3.8% |
| 10 to 14 Minutes | 31 | 5.6% |
| 15 to 19 Minutes | 78 | 14.2% |
| 20 to 24 Minutes | 135 | 24.5% |
| 25 to 29 Minutes | 34 | 6.2% |
| 30 to 34 Minutes | 102 | 18.5% |
| 35 to 39 Minutes | 7 | 1.3% |
| 40 to 44 Minutes | 30 | 5.4% |
| 45 to 59 Minutes | 42 | 7.6% |
| 60 to 89 Minutes | 27 | 4.9% |
| 90 or more Minutes | 13 | 2.4% |
Commute Time by Sex in Grand Rapids
The most common commute times in Grand Rapids are 30 to 34 minutes (70 commuters, 25.0%) for males and 20 to 24 minutes (85 commuters, 31.4%) for females.
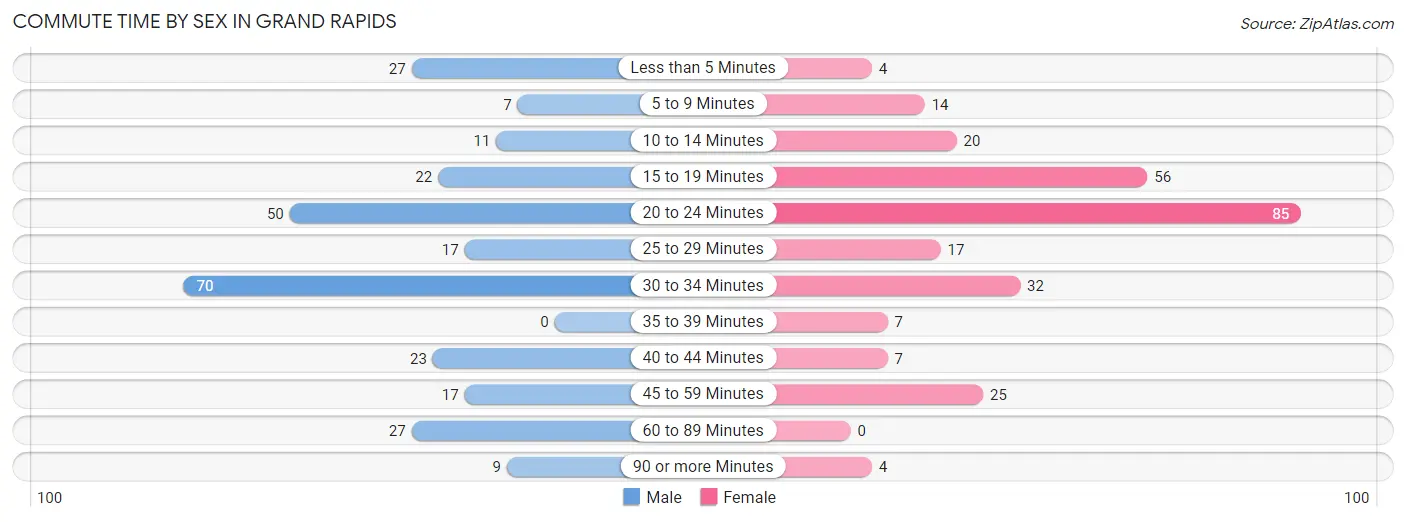
| Commute Time | Male | Female |
| Less than 5 Minutes | 27 (9.6%) | 4 (1.5%) |
| 5 to 9 Minutes | 7 (2.5%) | 14 (5.2%) |
| 10 to 14 Minutes | 11 (3.9%) | 20 (7.4%) |
| 15 to 19 Minutes | 22 (7.9%) | 56 (20.7%) |
| 20 to 24 Minutes | 50 (17.9%) | 85 (31.4%) |
| 25 to 29 Minutes | 17 (6.1%) | 17 (6.3%) |
| 30 to 34 Minutes | 70 (25.0%) | 32 (11.8%) |
| 35 to 39 Minutes | 0 (0.0%) | 7 (2.6%) |
| 40 to 44 Minutes | 23 (8.2%) | 7 (2.6%) |
| 45 to 59 Minutes | 17 (6.1%) | 25 (9.2%) |
| 60 to 89 Minutes | 27 (9.6%) | 0 (0.0%) |
| 90 or more Minutes | 9 (3.2%) | 4 (1.5%) |
Time of Departure to Work by Sex in Grand Rapids
The most frequent times of departure to work in Grand Rapids are 6:00 AM to 6:29 AM (50, 17.9%) for males and 8:00 AM to 8:29 AM (51, 18.8%) for females.
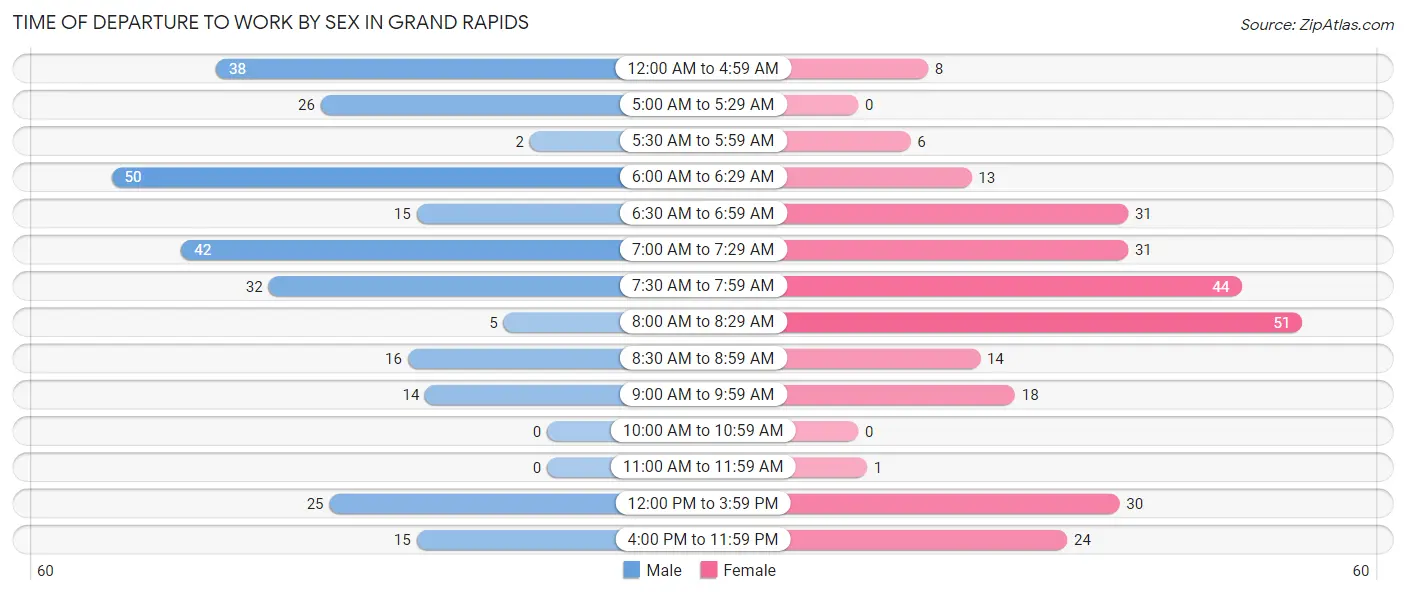
| Time of Departure | Male | Female |
| 12:00 AM to 4:59 AM | 38 (13.6%) | 8 (2.9%) |
| 5:00 AM to 5:29 AM | 26 (9.3%) | 0 (0.0%) |
| 5:30 AM to 5:59 AM | 2 (0.7%) | 6 (2.2%) |
| 6:00 AM to 6:29 AM | 50 (17.9%) | 13 (4.8%) |
| 6:30 AM to 6:59 AM | 15 (5.4%) | 31 (11.4%) |
| 7:00 AM to 7:29 AM | 42 (15.0%) | 31 (11.4%) |
| 7:30 AM to 7:59 AM | 32 (11.4%) | 44 (16.2%) |
| 8:00 AM to 8:29 AM | 5 (1.8%) | 51 (18.8%) |
| 8:30 AM to 8:59 AM | 16 (5.7%) | 14 (5.2%) |
| 9:00 AM to 9:59 AM | 14 (5.0%) | 18 (6.6%) |
| 10:00 AM to 10:59 AM | 0 (0.0%) | 0 (0.0%) |
| 11:00 AM to 11:59 AM | 0 (0.0%) | 1 (0.4%) |
| 12:00 PM to 3:59 PM | 25 (8.9%) | 30 (11.1%) |
| 4:00 PM to 11:59 PM | 15 (5.4%) | 24 (8.9%) |
| Total | 280 (100.0%) | 271 (100.0%) |
Housing Occupancy in Grand Rapids
Occupancy by Ownership in Grand Rapids
Of the total 415 dwellings in Grand Rapids, owner-occupied units account for 269 (64.8%), while renter-occupied units make up 146 (35.2%).
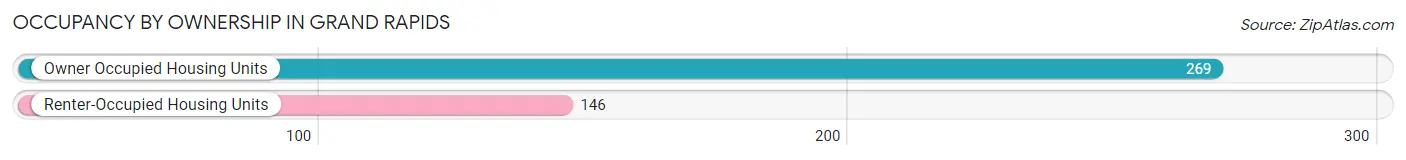
| Occupancy | # Housing Units | % Housing Units |
| Owner Occupied Housing Units | 269 | 64.8% |
| Renter-Occupied Housing Units | 146 | 35.2% |
| Total Occupied Housing Units | 415 | 100.0% |
Occupancy by Household Size in Grand Rapids
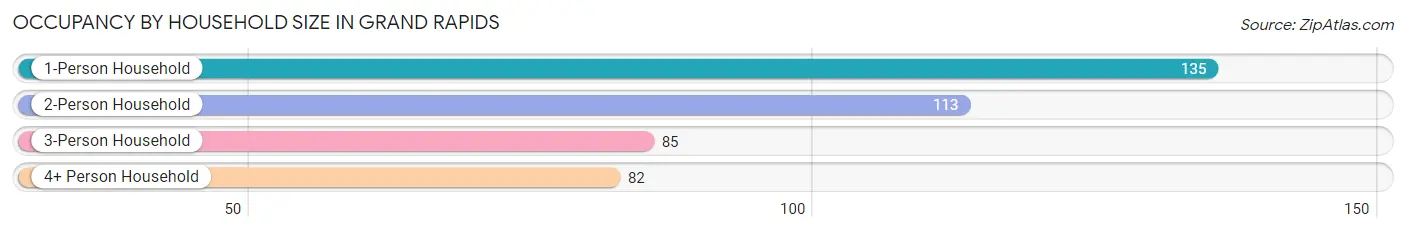
| Household Size | # Housing Units | % Housing Units |
| 1-Person Household | 135 | 32.5% |
| 2-Person Household | 113 | 27.2% |
| 3-Person Household | 85 | 20.5% |
| 4+ Person Household | 82 | 19.8% |
| Total Housing Units | 415 | 100.0% |
Occupancy by Ownership by Household Size in Grand Rapids
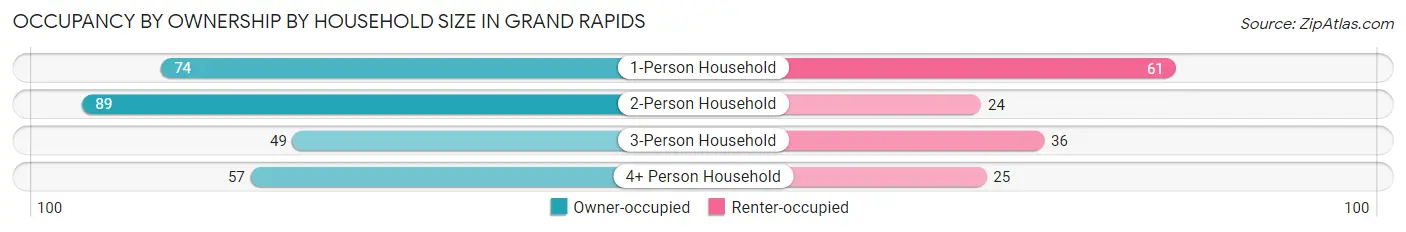
| Household Size | Owner-occupied | Renter-occupied |
| 1-Person Household | 74 (54.8%) | 61 (45.2%) |
| 2-Person Household | 89 (78.8%) | 24 (21.2%) |
| 3-Person Household | 49 (57.7%) | 36 (42.3%) |
| 4+ Person Household | 57 (69.5%) | 25 (30.5%) |
| Total Housing Units | 269 (64.8%) | 146 (35.2%) |
Occupancy by Educational Attainment in Grand Rapids
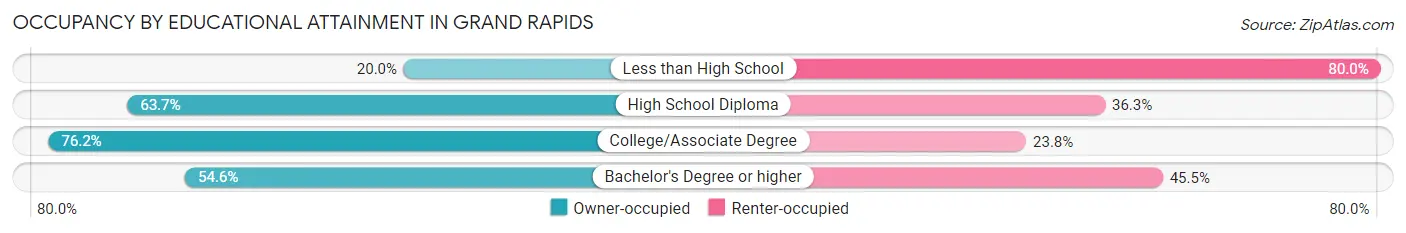
| Household Size | Owner-occupied | Renter-occupied |
| Less than High School | 1 (20.0%) | 4 (80.0%) |
| High School Diploma | 93 (63.7%) | 53 (36.3%) |
| College/Associate Degree | 109 (76.2%) | 34 (23.8%) |
| Bachelor's Degree or higher | 66 (54.5%) | 55 (45.5%) |
Occupancy by Age of Householder in Grand Rapids
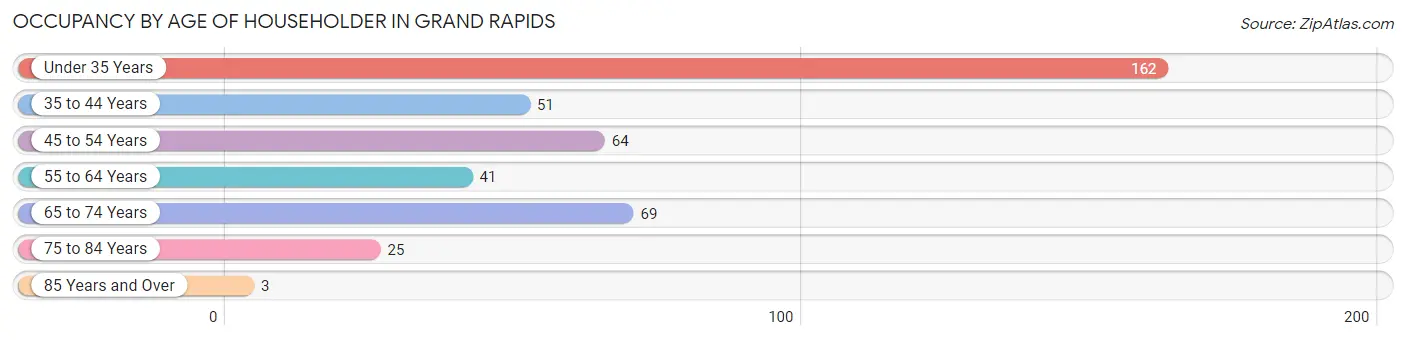
| Age Bracket | # Households | % Households |
| Under 35 Years | 162 | 39.0% |
| 35 to 44 Years | 51 | 12.3% |
| 45 to 54 Years | 64 | 15.4% |
| 55 to 64 Years | 41 | 9.9% |
| 65 to 74 Years | 69 | 16.6% |
| 75 to 84 Years | 25 | 6.0% |
| 85 Years and Over | 3 | 0.7% |
| Total | 415 | 100.0% |
Housing Finances in Grand Rapids
Median Income by Occupancy in Grand Rapids
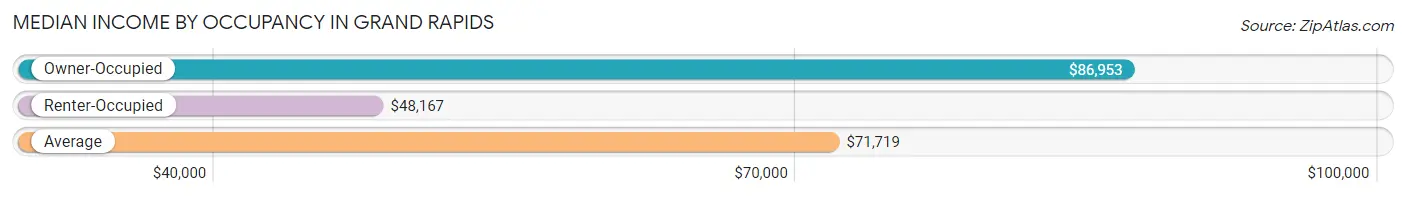
| Occupancy Type | # Households | Median Income |
| Owner-Occupied | 269 (64.8%) | $86,953 |
| Renter-Occupied | 146 (35.2%) | $48,167 |
| Average | 415 (100.0%) | $71,719 |
Occupancy by Householder Income Bracket in Grand Rapids
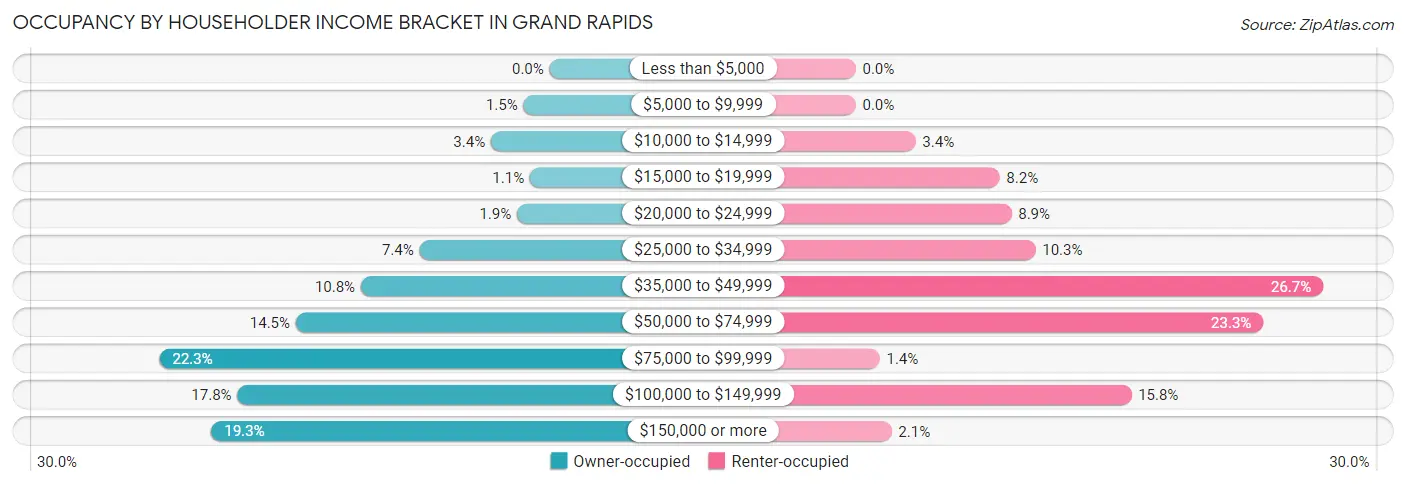
| Income Bracket | Owner-occupied | Renter-occupied |
| Less than $5,000 | 0 (0.0%) | 0 (0.0%) |
| $5,000 to $9,999 | 4 (1.5%) | 0 (0.0%) |
| $10,000 to $14,999 | 9 (3.4%) | 5 (3.4%) |
| $15,000 to $19,999 | 3 (1.1%) | 12 (8.2%) |
| $20,000 to $24,999 | 5 (1.9%) | 13 (8.9%) |
| $25,000 to $34,999 | 20 (7.4%) | 15 (10.3%) |
| $35,000 to $49,999 | 29 (10.8%) | 39 (26.7%) |
| $50,000 to $74,999 | 39 (14.5%) | 34 (23.3%) |
| $75,000 to $99,999 | 60 (22.3%) | 2 (1.4%) |
| $100,000 to $149,999 | 48 (17.8%) | 23 (15.8%) |
| $150,000 or more | 52 (19.3%) | 3 (2.1%) |
| Total | 269 (100.0%) | 146 (100.0%) |
Monthly Housing Cost Tiers in Grand Rapids
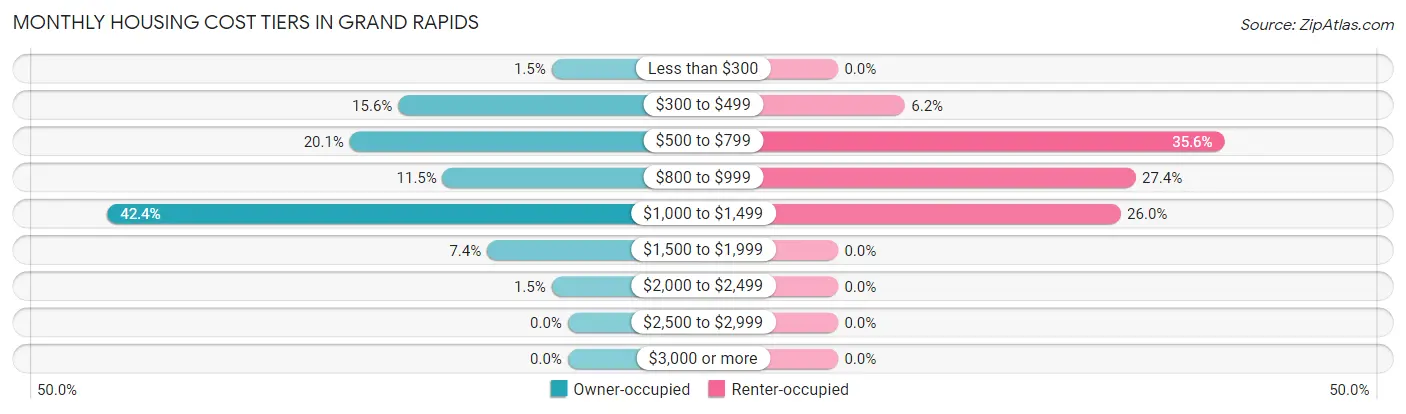
| Monthly Cost | Owner-occupied | Renter-occupied |
| Less than $300 | 4 (1.5%) | 0 (0.0%) |
| $300 to $499 | 42 (15.6%) | 9 (6.2%) |
| $500 to $799 | 54 (20.1%) | 52 (35.6%) |
| $800 to $999 | 31 (11.5%) | 40 (27.4%) |
| $1,000 to $1,499 | 114 (42.4%) | 38 (26.0%) |
| $1,500 to $1,999 | 20 (7.4%) | 0 (0.0%) |
| $2,000 to $2,499 | 4 (1.5%) | 0 (0.0%) |
| $2,500 to $2,999 | 0 (0.0%) | 0 (0.0%) |
| $3,000 or more | 0 (0.0%) | 0 (0.0%) |
| Total | 269 (100.0%) | 146 (100.0%) |
Physical Housing Characteristics in Grand Rapids
Housing Structures in Grand Rapids
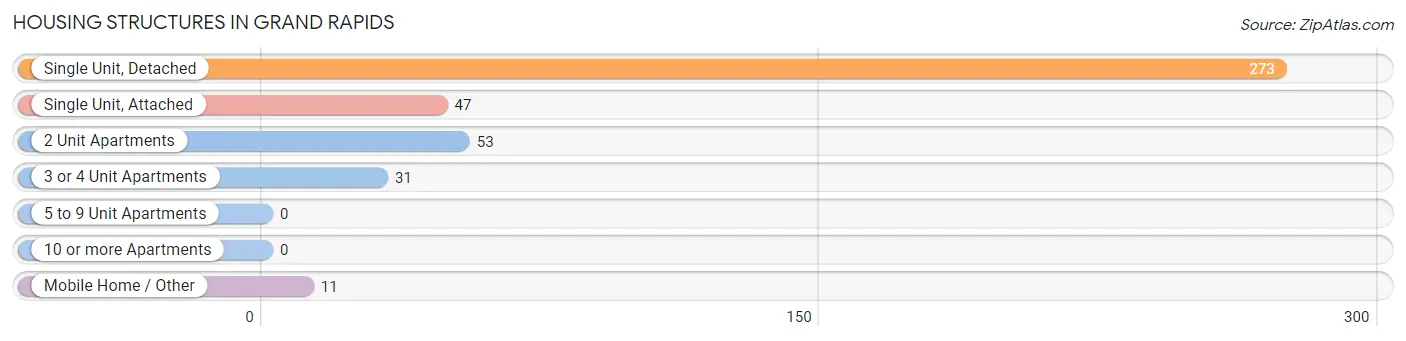
| Structure Type | # Housing Units | % Housing Units |
| Single Unit, Detached | 273 | 65.8% |
| Single Unit, Attached | 47 | 11.3% |
| 2 Unit Apartments | 53 | 12.8% |
| 3 or 4 Unit Apartments | 31 | 7.5% |
| 5 to 9 Unit Apartments | 0 | 0.0% |
| 10 or more Apartments | 0 | 0.0% |
| Mobile Home / Other | 11 | 2.6% |
| Total | 415 | 100.0% |
Housing Structures by Occupancy in Grand Rapids
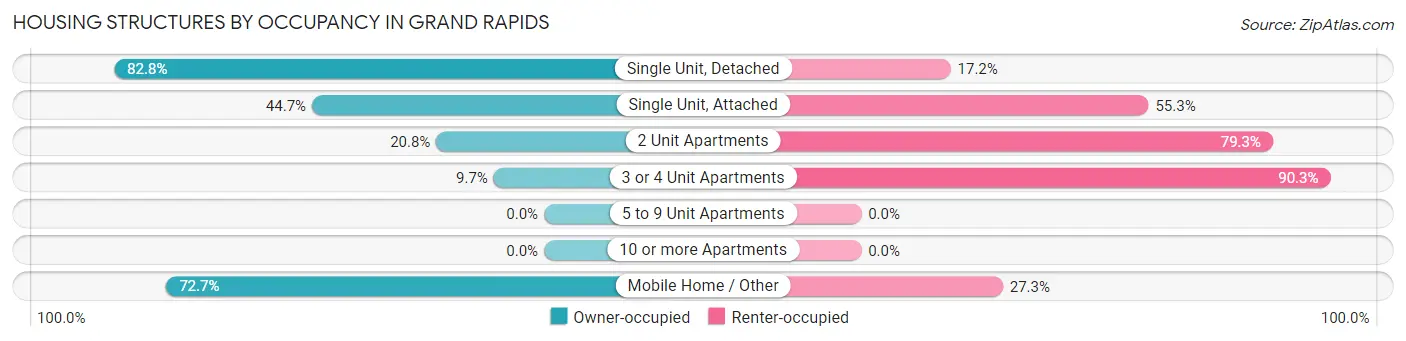
| Structure Type | Owner-occupied | Renter-occupied |
| Single Unit, Detached | 226 (82.8%) | 47 (17.2%) |
| Single Unit, Attached | 21 (44.7%) | 26 (55.3%) |
| 2 Unit Apartments | 11 (20.7%) | 42 (79.2%) |
| 3 or 4 Unit Apartments | 3 (9.7%) | 28 (90.3%) |
| 5 to 9 Unit Apartments | 0 (0.0%) | 0 (0.0%) |
| 10 or more Apartments | 0 (0.0%) | 0 (0.0%) |
| Mobile Home / Other | 8 (72.7%) | 3 (27.3%) |
| Total | 269 (64.8%) | 146 (35.2%) |
Housing Structures by Number of Rooms in Grand Rapids
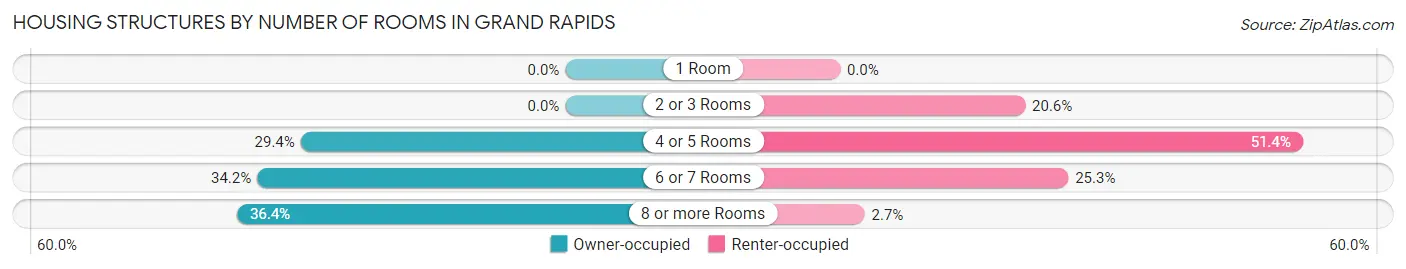
| Number of Rooms | Owner-occupied | Renter-occupied |
| 1 Room | 0 (0.0%) | 0 (0.0%) |
| 2 or 3 Rooms | 0 (0.0%) | 30 (20.5%) |
| 4 or 5 Rooms | 79 (29.4%) | 75 (51.4%) |
| 6 or 7 Rooms | 92 (34.2%) | 37 (25.3%) |
| 8 or more Rooms | 98 (36.4%) | 4 (2.7%) |
| Total | 269 (100.0%) | 146 (100.0%) |
Housing Structure by Heating Type in Grand Rapids
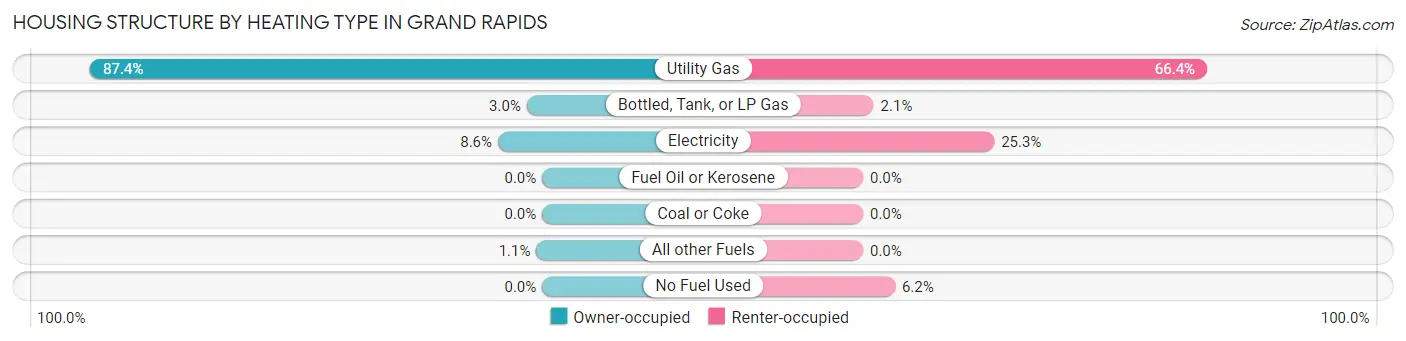
| Heating Type | Owner-occupied | Renter-occupied |
| Utility Gas | 235 (87.4%) | 97 (66.4%) |
| Bottled, Tank, or LP Gas | 8 (3.0%) | 3 (2.1%) |
| Electricity | 23 (8.6%) | 37 (25.3%) |
| Fuel Oil or Kerosene | 0 (0.0%) | 0 (0.0%) |
| Coal or Coke | 0 (0.0%) | 0 (0.0%) |
| All other Fuels | 3 (1.1%) | 0 (0.0%) |
| No Fuel Used | 0 (0.0%) | 9 (6.2%) |
| Total | 269 (100.0%) | 146 (100.0%) |
Household Vehicle Usage in Grand Rapids
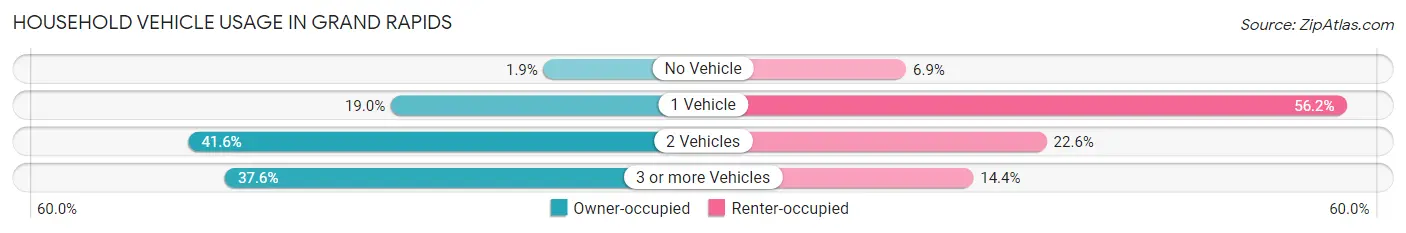
| Vehicles per Household | Owner-occupied | Renter-occupied |
| No Vehicle | 5 (1.9%) | 10 (6.9%) |
| 1 Vehicle | 51 (19.0%) | 82 (56.2%) |
| 2 Vehicles | 112 (41.6%) | 33 (22.6%) |
| 3 or more Vehicles | 101 (37.6%) | 21 (14.4%) |
| Total | 269 (100.0%) | 146 (100.0%) |
Real Estate & Mortgages in Grand Rapids
Real Estate and Mortgage Overview in Grand Rapids
| Characteristic | Without Mortgage | With Mortgage |
| Housing Units | 79 | 190 |
| Median Property Value | $144,000 | $146,600 |
| Median Household Income | $70,156 | $46 |
| Monthly Housing Costs | $524 | $0 |
| Real Estate Taxes | $1,694 | $0 |
Property Value by Mortgage Status in Grand Rapids
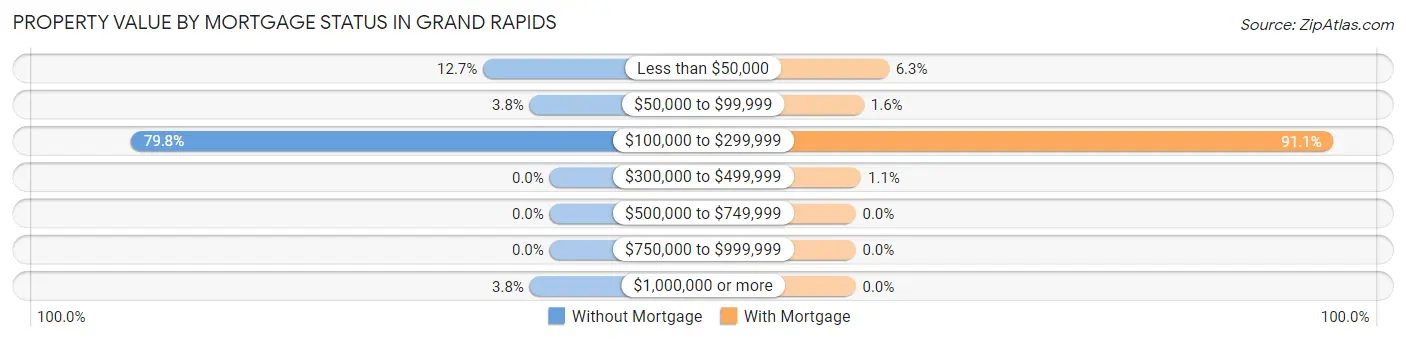
| Property Value | Without Mortgage | With Mortgage |
| Less than $50,000 | 10 (12.7%) | 12 (6.3%) |
| $50,000 to $99,999 | 3 (3.8%) | 3 (1.6%) |
| $100,000 to $299,999 | 63 (79.7%) | 173 (91.0%) |
| $300,000 to $499,999 | 0 (0.0%) | 2 (1.1%) |
| $500,000 to $749,999 | 0 (0.0%) | 0 (0.0%) |
| $750,000 to $999,999 | 0 (0.0%) | 0 (0.0%) |
| $1,000,000 or more | 3 (3.8%) | 0 (0.0%) |
| Total | 79 (100.0%) | 190 (100.0%) |
Household Income by Mortgage Status in Grand Rapids
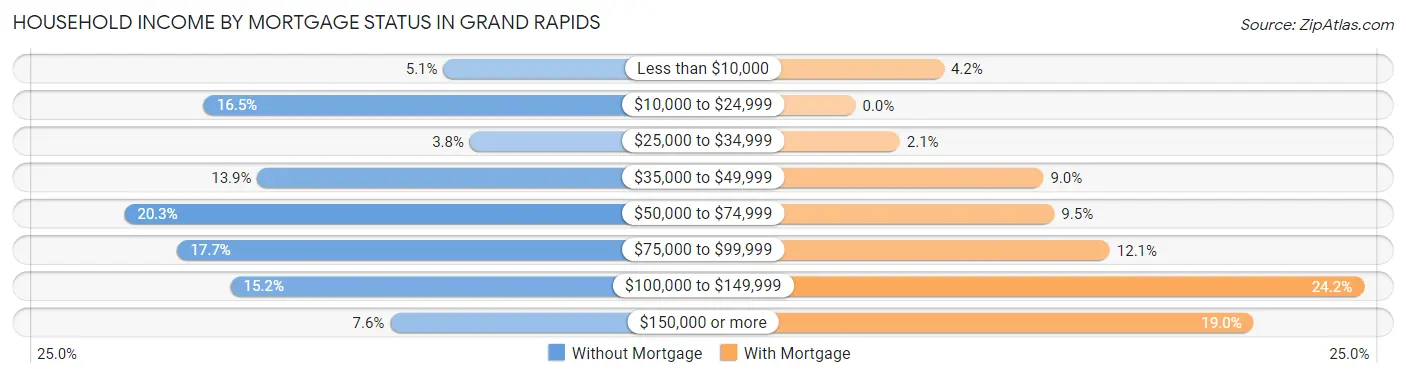
| Household Income | Without Mortgage | With Mortgage |
| Less than $10,000 | 4 (5.1%) | 8 (4.2%) |
| $10,000 to $24,999 | 13 (16.5%) | 0 (0.0%) |
| $25,000 to $34,999 | 3 (3.8%) | 4 (2.1%) |
| $35,000 to $49,999 | 11 (13.9%) | 17 (8.9%) |
| $50,000 to $74,999 | 16 (20.3%) | 18 (9.5%) |
| $75,000 to $99,999 | 14 (17.7%) | 23 (12.1%) |
| $100,000 to $149,999 | 12 (15.2%) | 46 (24.2%) |
| $150,000 or more | 6 (7.6%) | 36 (19.0%) |
| Total | 79 (100.0%) | 190 (100.0%) |
Property Value to Household Income Ratio in Grand Rapids
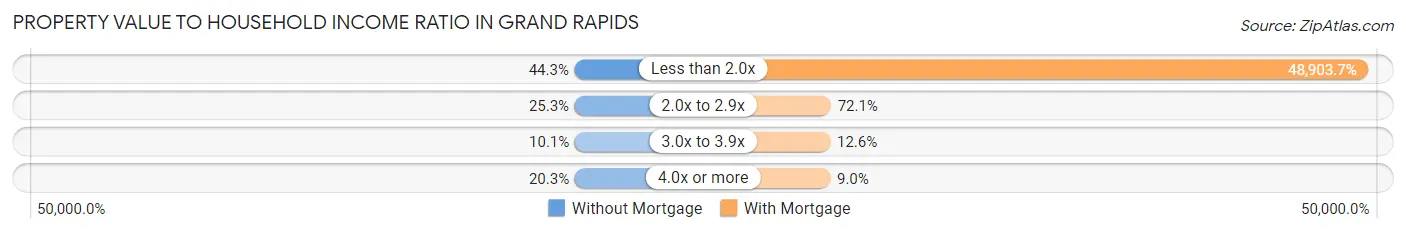
| Value-to-Income Ratio | Without Mortgage | With Mortgage |
| Less than 2.0x | 35 (44.3%) | 92,917 (48,903.7%) |
| 2.0x to 2.9x | 20 (25.3%) | 137 (72.1%) |
| 3.0x to 3.9x | 8 (10.1%) | 24 (12.6%) |
| 4.0x or more | 16 (20.3%) | 17 (8.9%) |
| Total | 79 (100.0%) | 190 (100.0%) |
Real Estate Taxes by Mortgage Status in Grand Rapids
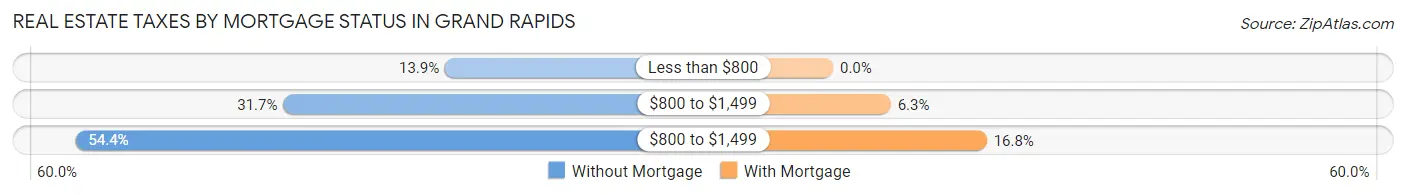
| Property Taxes | Without Mortgage | With Mortgage |
| Less than $800 | 11 (13.9%) | 0 (0.0%) |
| $800 to $1,499 | 25 (31.7%) | 12 (6.3%) |
| $800 to $1,499 | 43 (54.4%) | 32 (16.8%) |
| Total | 79 (100.0%) | 190 (100.0%) |
Health & Disability in Grand Rapids
Health Insurance Coverage by Age in Grand Rapids
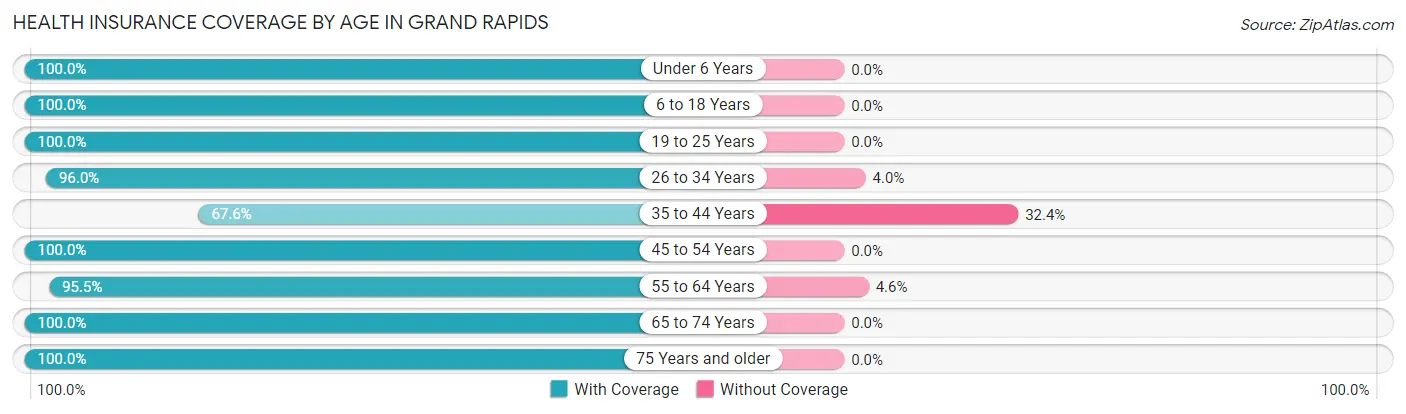
| Age Bracket | With Coverage | Without Coverage |
| Under 6 Years | 132 (100.0%) | 0 (0.0%) |
| 6 to 18 Years | 134 (100.0%) | 0 (0.0%) |
| 19 to 25 Years | 79 (100.0%) | 0 (0.0%) |
| 26 to 34 Years | 217 (96.0%) | 9 (4.0%) |
| 35 to 44 Years | 75 (67.6%) | 36 (32.4%) |
| 45 to 54 Years | 124 (100.0%) | 0 (0.0%) |
| 55 to 64 Years | 63 (95.5%) | 3 (4.5%) |
| 65 to 74 Years | 103 (100.0%) | 0 (0.0%) |
| 75 Years and older | 43 (100.0%) | 0 (0.0%) |
| Total | 970 (95.3%) | 48 (4.7%) |
Health Insurance Coverage by Citizenship Status in Grand Rapids
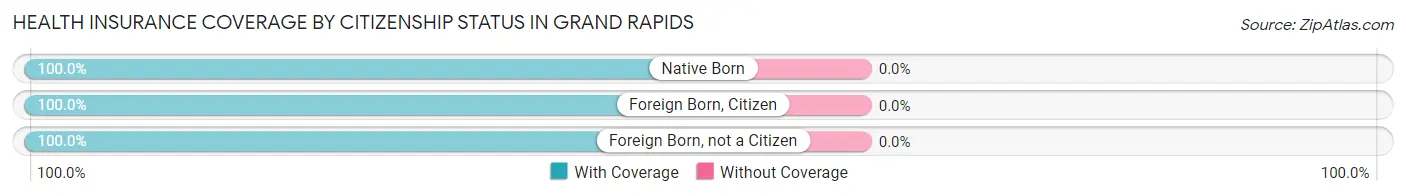
| Citizenship Status | With Coverage | Without Coverage |
| Native Born | 132 (100.0%) | 0 (0.0%) |
| Foreign Born, Citizen | 134 (100.0%) | 0 (0.0%) |
| Foreign Born, not a Citizen | 79 (100.0%) | 0 (0.0%) |
Health Insurance Coverage by Household Income in Grand Rapids
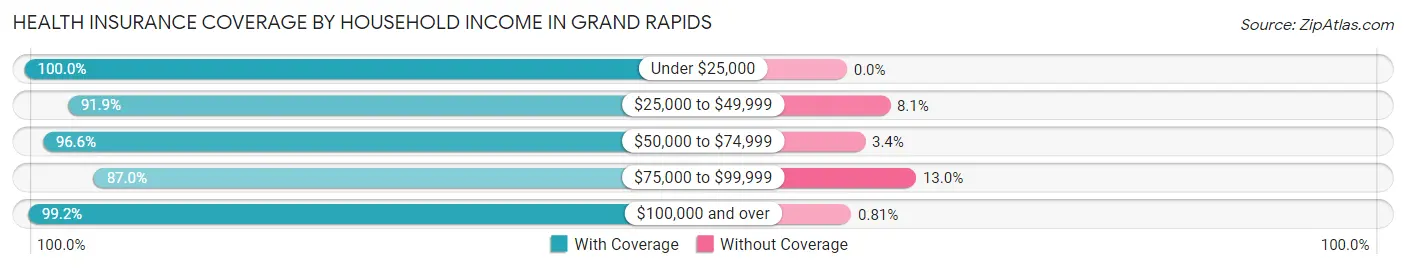
| Household Income | With Coverage | Without Coverage |
| Under $25,000 | 84 (100.0%) | 0 (0.0%) |
| $25,000 to $49,999 | 216 (91.9%) | 19 (8.1%) |
| $50,000 to $74,999 | 141 (96.6%) | 5 (3.4%) |
| $75,000 to $99,999 | 141 (87.0%) | 21 (13.0%) |
| $100,000 and over | 368 (99.2%) | 3 (0.8%) |
Public vs Private Health Insurance Coverage by Age in Grand Rapids
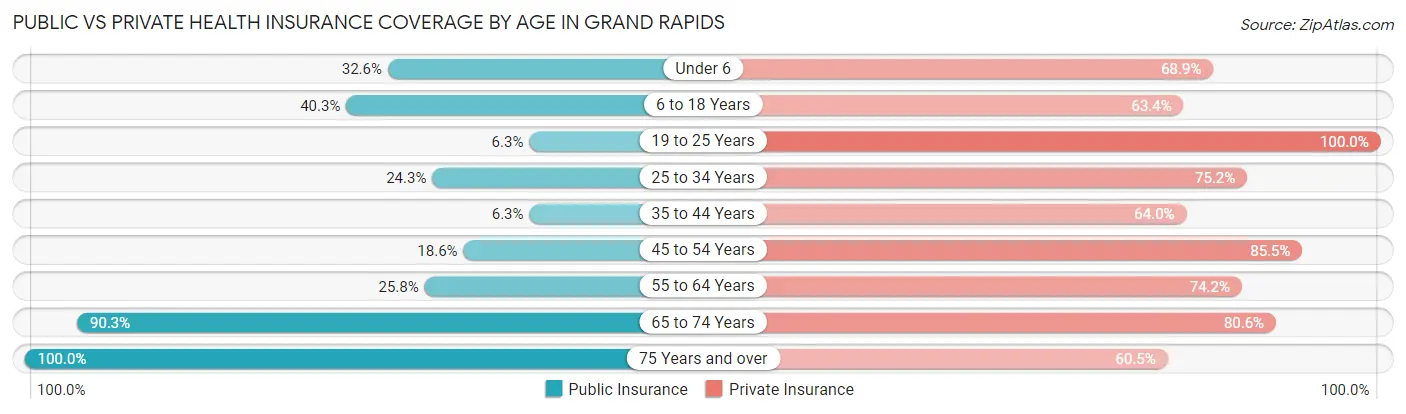
| Age Bracket | Public Insurance | Private Insurance |
| Under 6 | 43 (32.6%) | 91 (68.9%) |
| 6 to 18 Years | 54 (40.3%) | 85 (63.4%) |
| 19 to 25 Years | 5 (6.3%) | 79 (100.0%) |
| 25 to 34 Years | 55 (24.3%) | 170 (75.2%) |
| 35 to 44 Years | 7 (6.3%) | 71 (64.0%) |
| 45 to 54 Years | 23 (18.5%) | 106 (85.5%) |
| 55 to 64 Years | 17 (25.8%) | 49 (74.2%) |
| 65 to 74 Years | 93 (90.3%) | 83 (80.6%) |
| 75 Years and over | 43 (100.0%) | 26 (60.5%) |
| Total | 340 (33.4%) | 760 (74.7%) |
Disability Status by Sex by Age in Grand Rapids
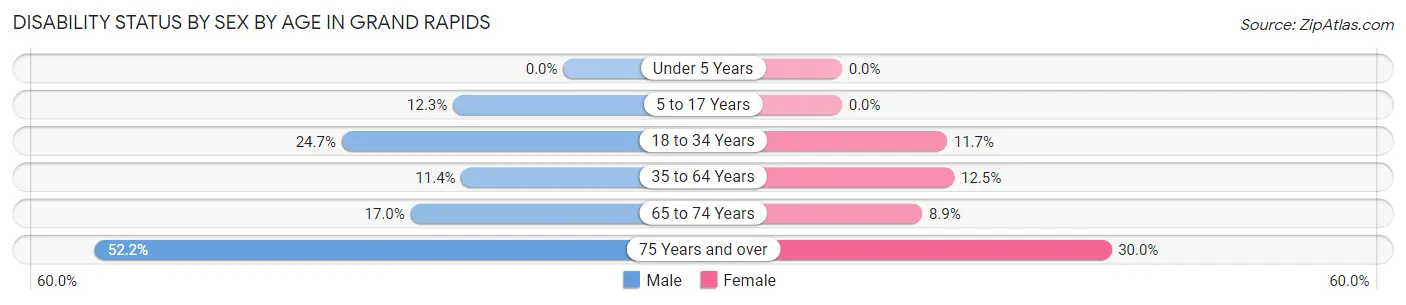
| Age Bracket | Male | Female |
| Under 5 Years | 0 (0.0%) | 0 (0.0%) |
| 5 to 17 Years | 7 (12.3%) | 0 (0.0%) |
| 18 to 34 Years | 38 (24.7%) | 18 (11.7%) |
| 35 to 64 Years | 16 (11.4%) | 20 (12.5%) |
| 65 to 74 Years | 8 (17.0%) | 5 (8.9%) |
| 75 Years and over | 12 (52.2%) | 6 (30.0%) |
Disability Class by Sex by Age in Grand Rapids
Disability Class: Hearing Difficulty
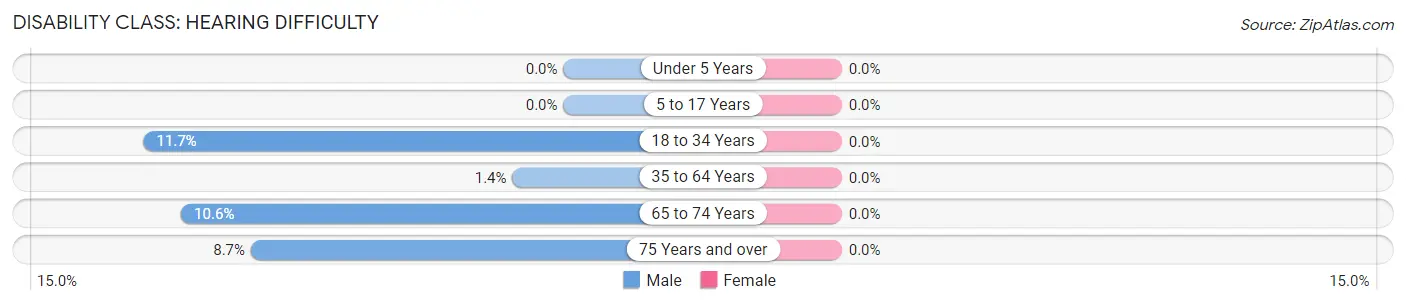
| Age Bracket | Male | Female |
| Under 5 Years | 0 (0.0%) | 0 (0.0%) |
| 5 to 17 Years | 0 (0.0%) | 0 (0.0%) |
| 18 to 34 Years | 18 (11.7%) | 0 (0.0%) |
| 35 to 64 Years | 2 (1.4%) | 0 (0.0%) |
| 65 to 74 Years | 5 (10.6%) | 0 (0.0%) |
| 75 Years and over | 2 (8.7%) | 0 (0.0%) |
Disability Class: Vision Difficulty
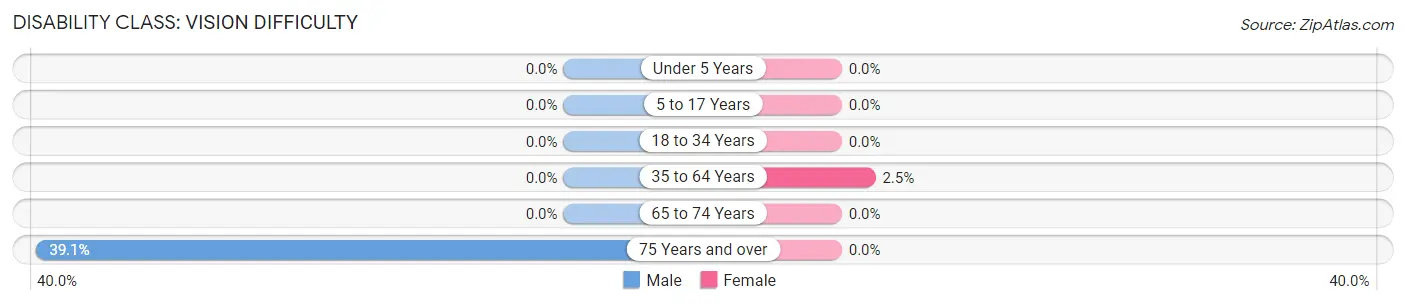
| Age Bracket | Male | Female |
| Under 5 Years | 0 (0.0%) | 0 (0.0%) |
| 5 to 17 Years | 0 (0.0%) | 0 (0.0%) |
| 18 to 34 Years | 0 (0.0%) | 0 (0.0%) |
| 35 to 64 Years | 0 (0.0%) | 4 (2.5%) |
| 65 to 74 Years | 0 (0.0%) | 0 (0.0%) |
| 75 Years and over | 9 (39.1%) | 0 (0.0%) |
Disability Class: Cognitive Difficulty
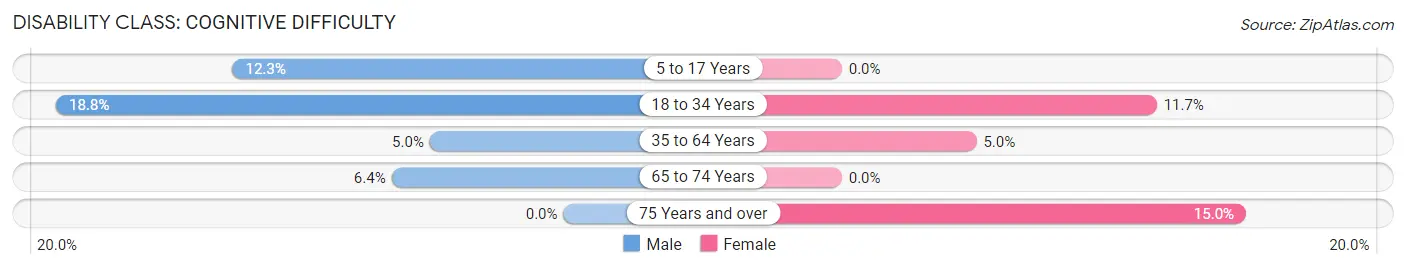
| Age Bracket | Male | Female |
| 5 to 17 Years | 7 (12.3%) | 0 (0.0%) |
| 18 to 34 Years | 29 (18.8%) | 18 (11.7%) |
| 35 to 64 Years | 7 (5.0%) | 8 (5.0%) |
| 65 to 74 Years | 3 (6.4%) | 0 (0.0%) |
| 75 Years and over | 0 (0.0%) | 3 (15.0%) |
Disability Class: Ambulatory Difficulty
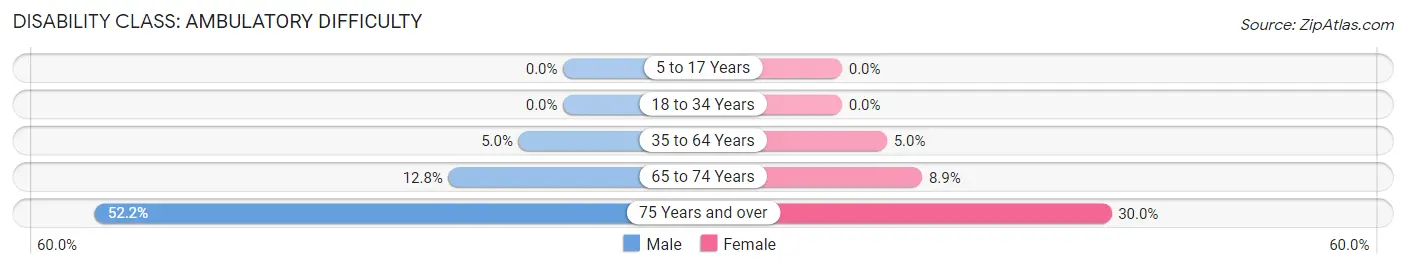
| Age Bracket | Male | Female |
| 5 to 17 Years | 0 (0.0%) | 0 (0.0%) |
| 18 to 34 Years | 0 (0.0%) | 0 (0.0%) |
| 35 to 64 Years | 7 (5.0%) | 8 (5.0%) |
| 65 to 74 Years | 6 (12.8%) | 5 (8.9%) |
| 75 Years and over | 12 (52.2%) | 6 (30.0%) |
Disability Class: Self-Care Difficulty
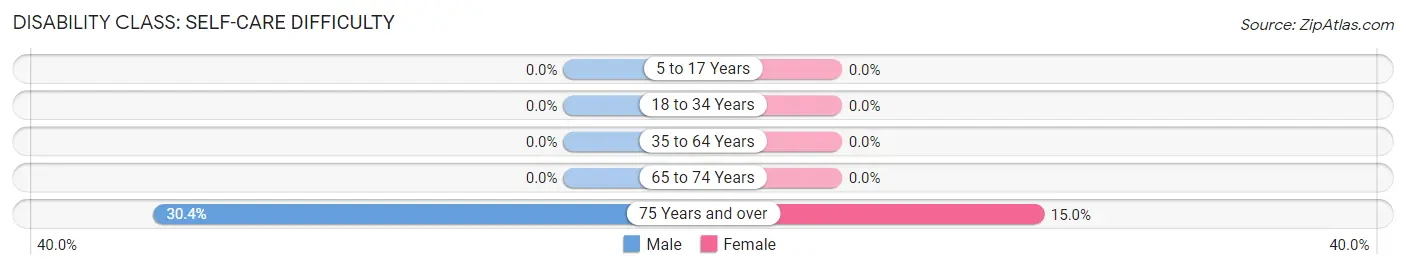
| Age Bracket | Male | Female |
| 5 to 17 Years | 0 (0.0%) | 0 (0.0%) |
| 18 to 34 Years | 0 (0.0%) | 0 (0.0%) |
| 35 to 64 Years | 0 (0.0%) | 0 (0.0%) |
| 65 to 74 Years | 0 (0.0%) | 0 (0.0%) |
| 75 Years and over | 7 (30.4%) | 3 (15.0%) |
Technology Access in Grand Rapids
Computing Device Access in Grand Rapids
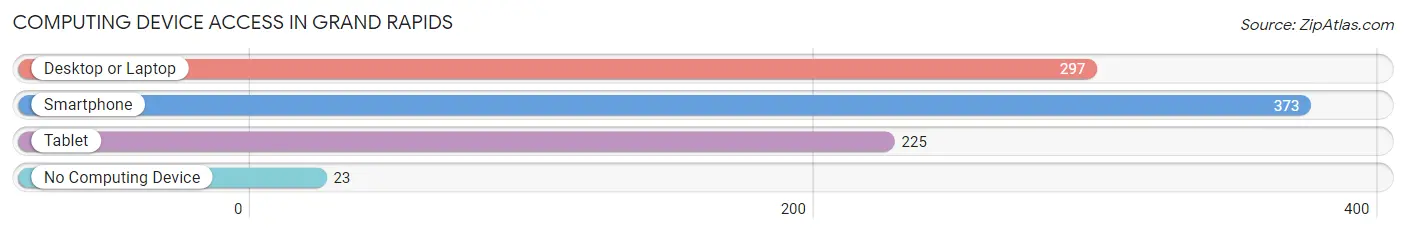
| Device Type | # Households | % Households |
| Desktop or Laptop | 297 | 71.6% |
| Smartphone | 373 | 89.9% |
| Tablet | 225 | 54.2% |
| No Computing Device | 23 | 5.5% |
| Total | 415 | 100.0% |
Internet Access in Grand Rapids
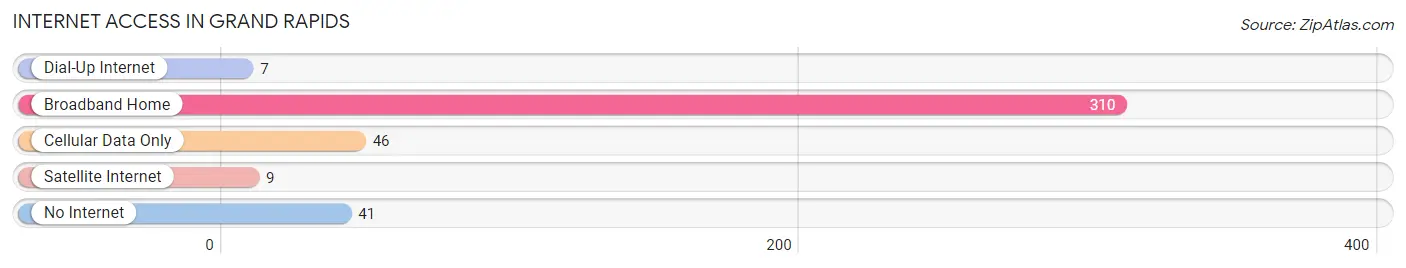
| Internet Type | # Households | % Households |
| Dial-Up Internet | 7 | 1.7% |
| Broadband Home | 310 | 74.7% |
| Cellular Data Only | 46 | 11.1% |
| Satellite Internet | 9 | 2.2% |
| No Internet | 41 | 9.9% |
| Total | 415 | 100.0% |
Grand Rapids Summary
Grand Rapids, Ohio is a small village located in Wood County, Ohio. It is situated on the banks of the Maumee River, approximately 20 miles south of Toledo. The village has a population of approximately 1,000 people and is part of the Toledo Metropolitan Statistical Area.
History
Grand Rapids was founded in 1833 by a group of settlers from New York. The village was named after the rapids in the Maumee River, which were used to power the sawmills and gristmills that were built in the area. The village was incorporated in 1867 and was home to a variety of industries, including a flour mill, a paper mill, a furniture factory, and a boat building business.
In the late 19th century, Grand Rapids was a popular tourist destination, with visitors coming to enjoy the scenic views of the Maumee River and the nearby Oak Openings Preserve. The village was also home to a number of resorts, including the Grand Rapids Hotel, which was built in 1883.
Geography
Grand Rapids is located in Wood County, Ohio, approximately 20 miles south of Toledo. The village is situated on the banks of the Maumee River, which is a major tributary of Lake Erie. The village is surrounded by a variety of natural features, including the Oak Openings Preserve, which is a large area of protected land that is home to a variety of wildlife.
The village has a total area of 1.2 square miles, all of which is land. The village is located in a humid continental climate zone, with hot summers and cold winters. The average annual temperature is around 50 degrees Fahrenheit, with an average annual precipitation of around 40 inches.
Economy
The economy of Grand Rapids is largely based on tourism and agriculture. The village is home to a number of tourist attractions, including the Oak Openings Preserve, which is a popular destination for hikers and nature lovers. The village is also home to a number of wineries and breweries, which attract visitors from all over the region.
Agriculture is also an important part of the local economy. The village is home to a number of farms, which produce a variety of crops, including corn, soybeans, and wheat. The village is also home to a number of livestock farms, which produce beef, pork, and poultry.
Demographics
As of the 2010 census, the population of Grand Rapids was 1,000 people. The racial makeup of the village was 97.2% White, 0.7% African American, 0.2% Native American, 0.2% Asian, 0.2% from other races, and 1.7% from two or more races. The median household income was $41,250, and the median family income was $50,000.
The village is home to a variety of religious denominations, including Catholic, Lutheran, Methodist, and Presbyterian. The village is also home to a number of public and private schools, including Grand Rapids Elementary School, Grand Rapids Middle School, and Grand Rapids High School.
Conclusion
Grand Rapids, Ohio is a small village located in Wood County, Ohio. It is situated on the banks of the Maumee River, approximately 20 miles south of Toledo. The village has a population of approximately 1,000 people and is part of the Toledo Metropolitan Statistical Area. The economy of Grand Rapids is largely based on tourism and agriculture, and the village is home to a variety of religious denominations. The village is also home to a number of public and private schools, making it an ideal place to raise a family.
Common Questions
What is Per Capita Income in Grand Rapids?
Per Capita income in Grand Rapids is $34,782.
What is the Median Family Income in Grand Rapids?
Median Family Income in Grand Rapids is $85,486.
What is the Median Household income in Grand Rapids?
Median Household Income in Grand Rapids is $71,719.
What is Income or Wage Gap in Grand Rapids?
Income or Wage Gap in Grand Rapids is 48.0%.
Women in Grand Rapids earn 52.0 cents for every dollar earned by a man.
What is Inequality or Gini Index in Grand Rapids?
Inequality or Gini Index in Grand Rapids is 0.37.
What is the Total Population of Grand Rapids?
Total Population of Grand Rapids is 1,033.
What is the Total Male Population of Grand Rapids?
Total Male Population of Grand Rapids is 499.
What is the Total Female Population of Grand Rapids?
Total Female Population of Grand Rapids is 534.
What is the Ratio of Males per 100 Females in Grand Rapids?
There are 93.45 Males per 100 Females in Grand Rapids.
What is the Ratio of Females per 100 Males in Grand Rapids?
There are 107.01 Females per 100 Males in Grand Rapids.
What is the Median Population Age in Grand Rapids?
Median Population Age in Grand Rapids is 33.3 Years.
What is the Average Family Size in Grand Rapids
Average Family Size in Grand Rapids is 3.1 People.
What is the Average Household Size in Grand Rapids
Average Household Size in Grand Rapids is 2.4 People.
How Large is the Labor Force in Grand Rapids?
There are 578 People in the Labor Forcein in Grand Rapids.
What is the Percentage of People in the Labor Force in Grand Rapids?
72.9% of People are in the Labor Force in Grand Rapids.