Berea, OH Map & Demographics
Berea Map
Berea Overview
$34,406
PER CAPITA INCOME
$93,135
AVG FAMILY INCOME
$67,493
AVG HOUSEHOLD INCOME
34.7%
WAGE / INCOME GAP [ % ]
65.3¢/ $1
WAGE / INCOME GAP [ $ ]
0.39
INEQUALITY / GINI INDEX
18,550
TOTAL POPULATION
8,630
MALE POPULATION
9,920
FEMALE POPULATION
87.00
MALES / 100 FEMALES
114.95
FEMALES / 100 MALES
36.4
MEDIAN AGE
3.1
AVG FAMILY SIZE
2.3
AVG HOUSEHOLD SIZE
9,590
LABOR FORCE [ PEOPLE ]
61.7%
PERCENT IN LABOR FORCE
4.8%
UNEMPLOYMENT RATE
Berea Zip Codes
Berea Area Codes
Income in Berea
Income Overview in Berea
Per Capita Income in Berea is $34,406, while median incomes of families and households are $93,135 and $67,493 respectively.
| Characteristic | Number | Measure |
| Per Capita Income | 18,550 | $34,406 |
| Median Family Income | 3,913 | $93,135 |
| Mean Family Income | 3,913 | $101,380 |
| Median Household Income | 7,115 | $67,493 |
| Mean Household Income | 7,115 | $84,252 |
| Income Deficit | 3,913 | $0 |
| Wage / Income Gap (%) | 18,550 | 34.72% |
| Wage / Income Gap ($) | 18,550 | 65.28¢ per $1 |
| Gini / Inequality Index | 18,550 | 0.39 |
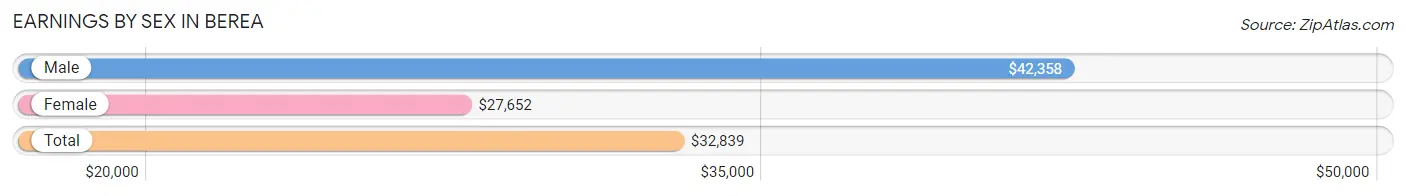
Earnings by Sex in Berea
Average Earnings in Berea are $32,839, $42,358 for men and $27,652 for women, a difference of 34.7%.
| Sex | Number | Average Earnings |
| Male | 5,236 (48.2%) | $42,358 |
| Female | 5,617 (51.8%) | $27,652 |
| Total | 10,853 (100.0%) | $32,839 |
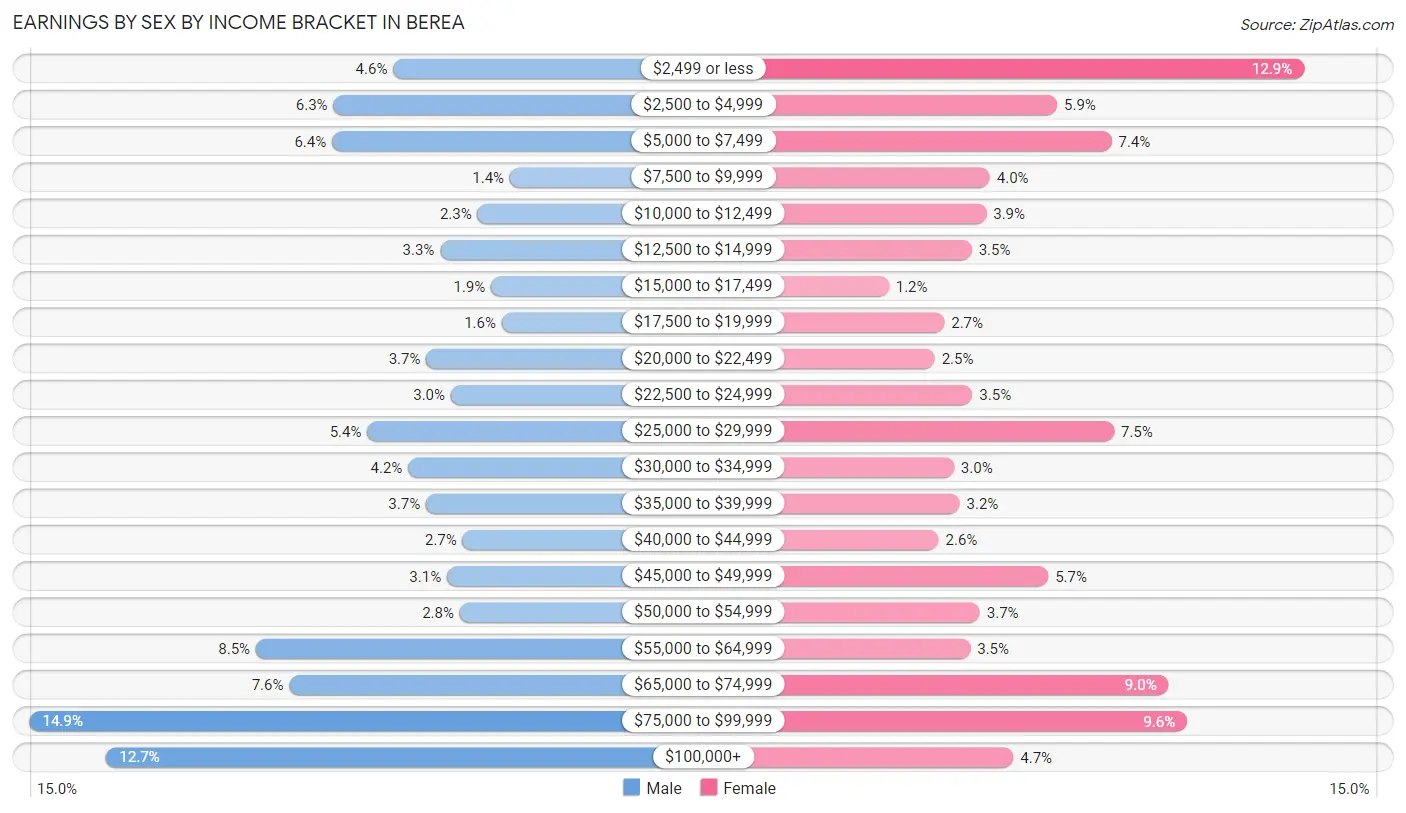
Earnings by Sex by Income Bracket in Berea
The most common earnings brackets in Berea are $75,000 to $99,999 for men (778 | 14.9%) and $2,499 or less for women (722 | 12.9%).
| Income | Male | Female |
| $2,499 or less | 243 (4.6%) | 722 (12.9%) |
| $2,500 to $4,999 | 331 (6.3%) | 332 (5.9%) |
| $5,000 to $7,499 | 333 (6.4%) | 418 (7.4%) |
| $7,500 to $9,999 | 71 (1.4%) | 226 (4.0%) |
| $10,000 to $12,499 | 119 (2.3%) | 220 (3.9%) |
| $12,500 to $14,999 | 174 (3.3%) | 197 (3.5%) |
| $15,000 to $17,499 | 99 (1.9%) | 66 (1.2%) |
| $17,500 to $19,999 | 83 (1.6%) | 154 (2.7%) |
| $20,000 to $22,499 | 194 (3.7%) | 139 (2.5%) |
| $22,500 to $24,999 | 158 (3.0%) | 198 (3.5%) |
| $25,000 to $29,999 | 281 (5.4%) | 422 (7.5%) |
| $30,000 to $34,999 | 221 (4.2%) | 169 (3.0%) |
| $35,000 to $39,999 | 195 (3.7%) | 178 (3.2%) |
| $40,000 to $44,999 | 141 (2.7%) | 145 (2.6%) |
| $45,000 to $49,999 | 164 (3.1%) | 318 (5.7%) |
| $50,000 to $54,999 | 145 (2.8%) | 210 (3.7%) |
| $55,000 to $64,999 | 445 (8.5%) | 195 (3.5%) |
| $65,000 to $74,999 | 396 (7.6%) | 508 (9.0%) |
| $75,000 to $99,999 | 778 (14.9%) | 537 (9.6%) |
| $100,000+ | 665 (12.7%) | 263 (4.7%) |
| Total | 5,236 (100.0%) | 5,617 (100.0%) |
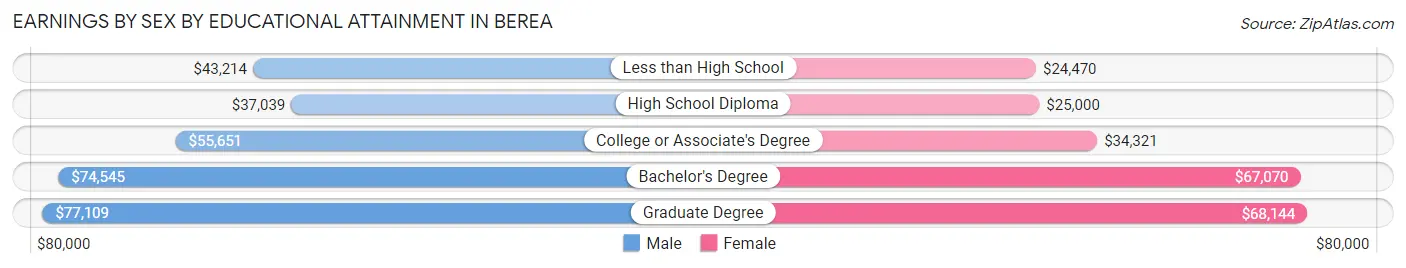
Earnings by Sex by Educational Attainment in Berea
Average earnings in Berea are $58,271 for men and $45,808 for women, a difference of 21.4%. Men with an educational attainment of graduate degree enjoy the highest average annual earnings of $77,109, while those with high school diploma education earn the least with $37,039. Women with an educational attainment of graduate degree earn the most with the average annual earnings of $68,144, while those with less than high school education have the smallest earnings of $24,470.
| Educational Attainment | Male Income | Female Income |
| Less than High School | $43,214 | $24,470 |
| High School Diploma | $37,039 | $25,000 |
| College or Associate's Degree | $55,651 | $34,321 |
| Bachelor's Degree | $74,545 | $67,070 |
| Graduate Degree | $77,109 | $68,144 |
| Total | $58,271 | $45,808 |
Family Income in Berea
Family Income Brackets in Berea
According to the Berea family income data, there are 912 families falling into the $100,000 to $149,999 income range, which is the most common income bracket and makes up 23.3% of all families. Conversely, the $10,000 to $14,999 income bracket is the least frequent group with only 20 families (0.5%) belonging to this category.
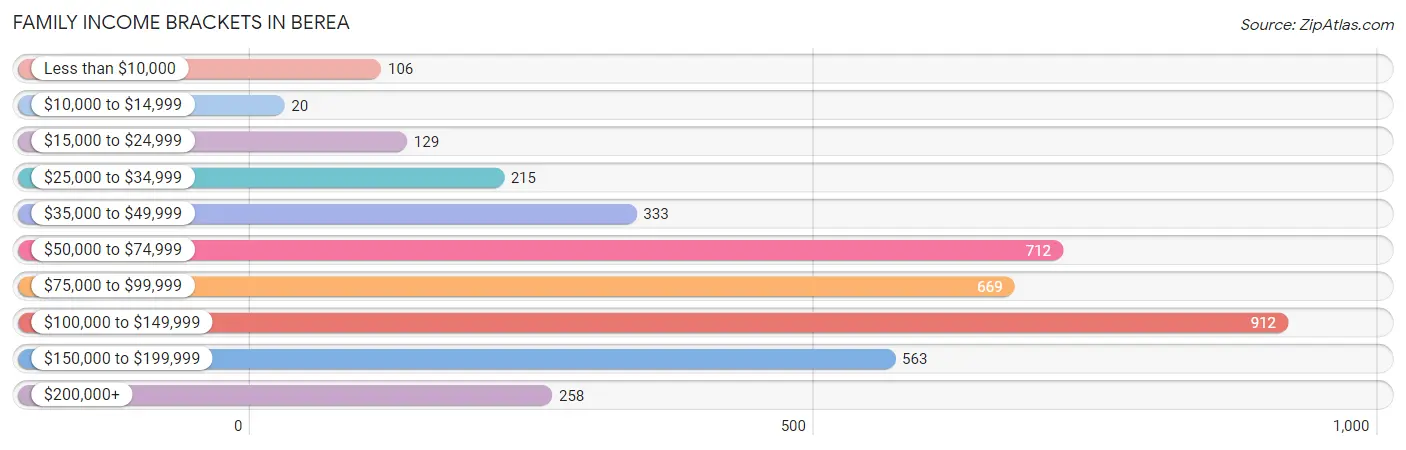
| Income Bracket | # Families | % Families |
| Less than $10,000 | 106 | 2.7% |
| $10,000 to $14,999 | 20 | 0.5% |
| $15,000 to $24,999 | 129 | 3.3% |
| $25,000 to $34,999 | 215 | 5.5% |
| $35,000 to $49,999 | 333 | 8.5% |
| $50,000 to $74,999 | 712 | 18.2% |
| $75,000 to $99,999 | 669 | 17.1% |
| $100,000 to $149,999 | 912 | 23.3% |
| $150,000 to $199,999 | 563 | 14.4% |
| $200,000+ | 258 | 6.6% |
Family Income by Famaliy Size in Berea
7+ person families (32 | 0.8%) account for the highest median family income in Berea with $173,750 per family, while 2-person families (1,885 | 48.2%) have the highest median income of $40,886 per family member.
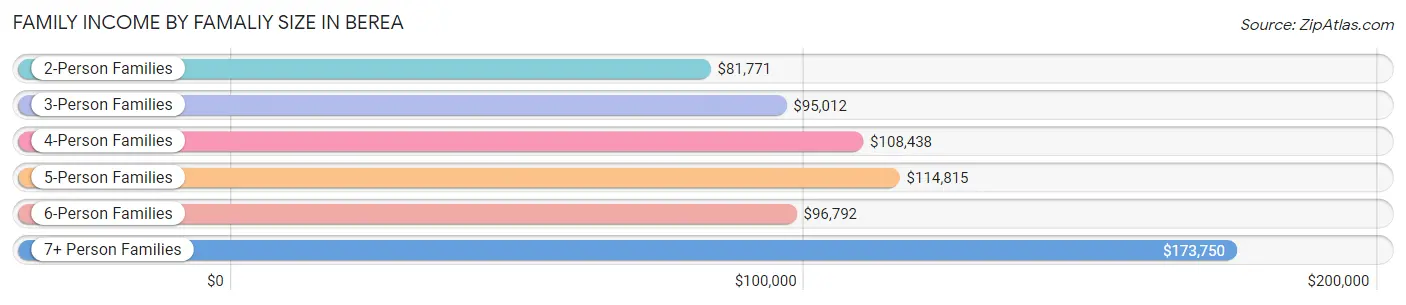
| Income Bracket | # Families | Median Income |
| 2-Person Families | 1,885 (48.2%) | $81,771 |
| 3-Person Families | 919 (23.5%) | $95,012 |
| 4-Person Families | 728 (18.6%) | $108,438 |
| 5-Person Families | 208 (5.3%) | $114,815 |
| 6-Person Families | 141 (3.6%) | $96,792 |
| 7+ Person Families | 32 (0.8%) | $173,750 |
| Total | 3,913 (100.0%) | $93,135 |
Family Income by Number of Earners in Berea
The median family income in Berea is $93,135, with families comprising 3+ earners (477) having the highest median family income of $137,656, while families with no earners (546) have the lowest median family income of $56,339, accounting for 12.2% and 14.0% of families, respectively.
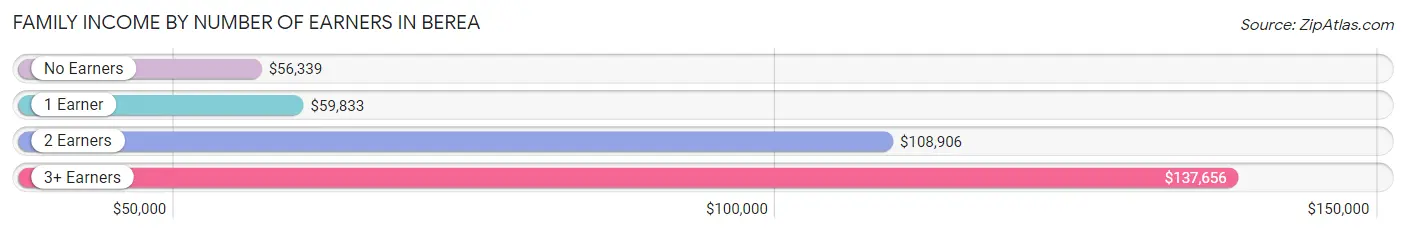
| Number of Earners | # Families | Median Income |
| No Earners | 546 (14.0%) | $56,339 |
| 1 Earner | 1,126 (28.8%) | $59,833 |
| 2 Earners | 1,764 (45.1%) | $108,906 |
| 3+ Earners | 477 (12.2%) | $137,656 |
| Total | 3,913 (100.0%) | $93,135 |
Household Income in Berea
Household Income Brackets in Berea
With 1,245 households falling in the category, the $50,000 to $74,999 income range is the most frequent in Berea, accounting for 17.5% of all households. In contrast, only 164 households (2.3%) fall into the $10,000 to $14,999 income bracket, making it the least populous group.
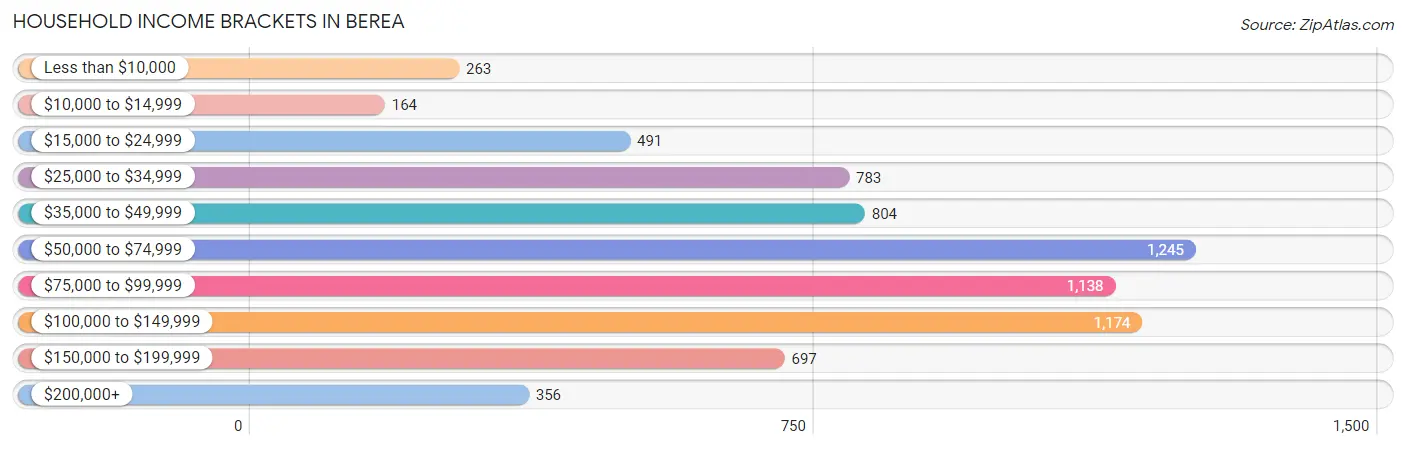
| Income Bracket | # Households | % Households |
| Less than $10,000 | 263 | 3.7% |
| $10,000 to $14,999 | 164 | 2.3% |
| $15,000 to $24,999 | 491 | 6.9% |
| $25,000 to $34,999 | 783 | 11.0% |
| $35,000 to $49,999 | 804 | 11.3% |
| $50,000 to $74,999 | 1,245 | 17.5% |
| $75,000 to $99,999 | 1,138 | 16.0% |
| $100,000 to $149,999 | 1,174 | 16.5% |
| $150,000 to $199,999 | 697 | 9.8% |
| $200,000+ | 356 | 5.0% |
Household Income by Householder Age in Berea
The median household income in Berea is $67,493, with the highest median household income of $89,120 found in the 25 to 44 years age bracket for the primary householder. A total of 2,105 households (29.6%) fall into this category. Meanwhile, the 15 to 24 years age bracket for the primary householder has the lowest median household income of $34,141, with 304 households (4.3%) in this group.
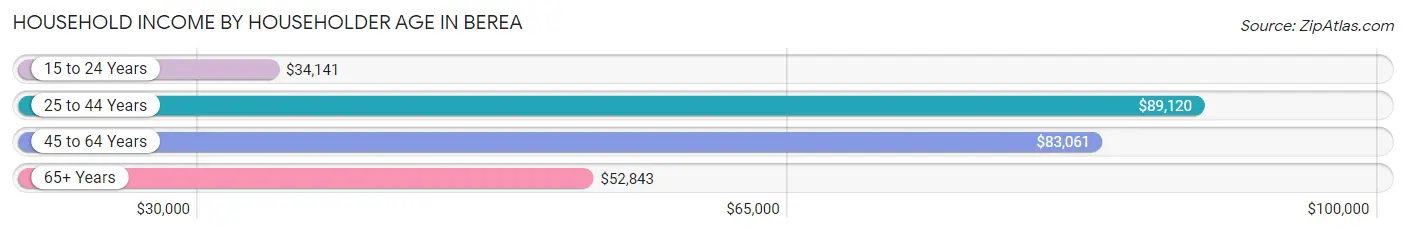
| Income Bracket | # Households | Median Income |
| 15 to 24 Years | 304 (4.3%) | $34,141 |
| 25 to 44 Years | 2,105 (29.6%) | $89,120 |
| 45 to 64 Years | 2,556 (35.9%) | $83,061 |
| 65+ Years | 2,150 (30.2%) | $52,843 |
| Total | 7,115 (100.0%) | $67,493 |
Poverty in Berea
Income Below Poverty by Sex and Age in Berea
With 7.3% poverty level for males and 12.1% for females among the residents of Berea, 18 to 24 year old males and 18 to 24 year old females are the most vulnerable to poverty, with 161 males (24.4%) and 362 females (35.8%) in their respective age groups living below the poverty level.
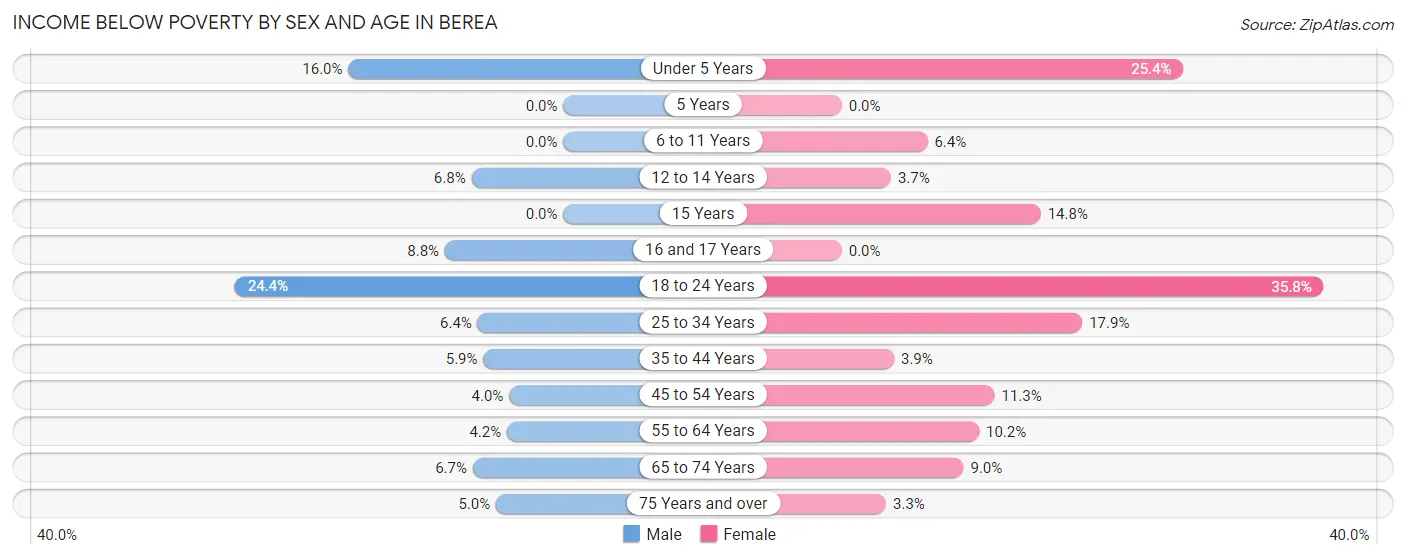
| Age Bracket | Male | Female |
| Under 5 Years | 68 (16.0%) | 71 (25.4%) |
| 5 Years | 0 (0.0%) | 0 (0.0%) |
| 6 to 11 Years | 0 (0.0%) | 55 (6.4%) |
| 12 to 14 Years | 15 (6.8%) | 10 (3.6%) |
| 15 Years | 0 (0.0%) | 13 (14.8%) |
| 16 and 17 Years | 16 (8.8%) | 0 (0.0%) |
| 18 to 24 Years | 161 (24.4%) | 362 (35.8%) |
| 25 to 34 Years | 68 (6.4%) | 189 (17.8%) |
| 35 to 44 Years | 59 (5.9%) | 47 (3.9%) |
| 45 to 54 Years | 39 (4.0%) | 84 (11.3%) |
| 55 to 64 Years | 45 (4.2%) | 127 (10.2%) |
| 65 to 74 Years | 55 (6.7%) | 84 (9.0%) |
| 75 Years and over | 24 (5.0%) | 25 (3.3%) |
| Total | 550 (7.3%) | 1,067 (12.1%) |
Income Above Poverty by Sex and Age in Berea
According to the poverty statistics in Berea, males aged 5 years and females aged 5 years are the age groups that are most secure financially, with 100.0% of males and 100.0% of females in these age groups living above the poverty line.
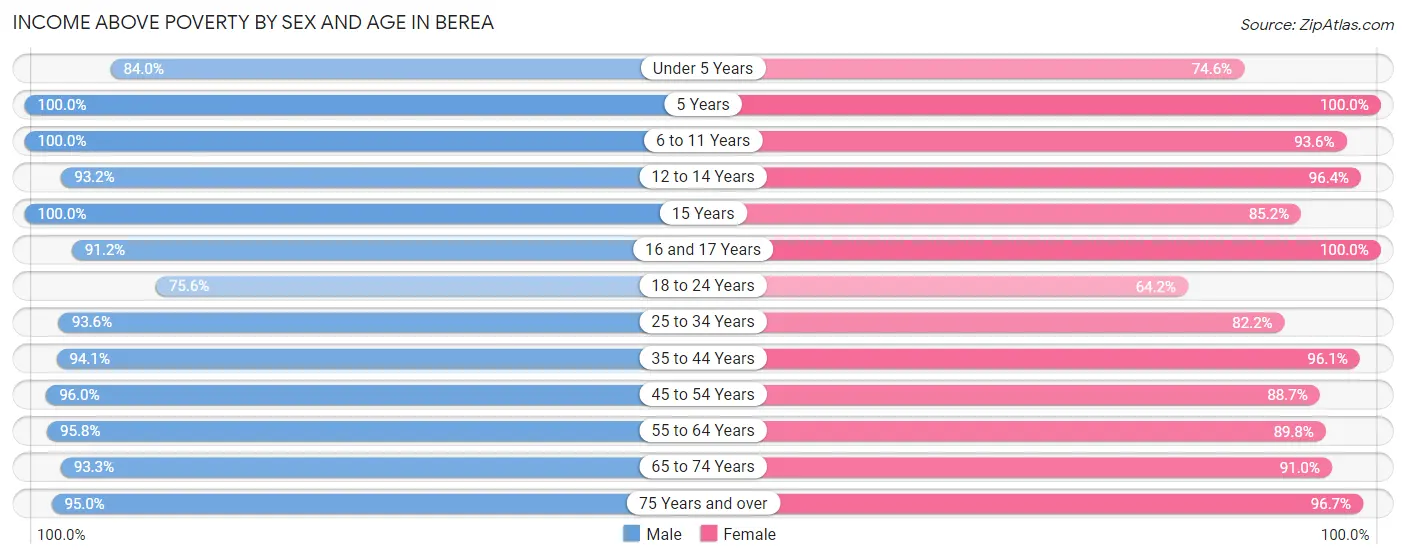
| Age Bracket | Male | Female |
| Under 5 Years | 358 (84.0%) | 209 (74.6%) |
| 5 Years | 71 (100.0%) | 95 (100.0%) |
| 6 to 11 Years | 436 (100.0%) | 810 (93.6%) |
| 12 to 14 Years | 205 (93.2%) | 264 (96.4%) |
| 15 Years | 164 (100.0%) | 75 (85.2%) |
| 16 and 17 Years | 166 (91.2%) | 272 (100.0%) |
| 18 to 24 Years | 499 (75.6%) | 650 (64.2%) |
| 25 to 34 Years | 1,002 (93.6%) | 870 (82.2%) |
| 35 to 44 Years | 934 (94.1%) | 1,163 (96.1%) |
| 45 to 54 Years | 931 (96.0%) | 657 (88.7%) |
| 55 to 64 Years | 1,032 (95.8%) | 1,119 (89.8%) |
| 65 to 74 Years | 763 (93.3%) | 845 (91.0%) |
| 75 Years and over | 457 (95.0%) | 736 (96.7%) |
| Total | 7,018 (92.7%) | 7,765 (87.9%) |
Income Below Poverty Among Married-Couple Families in Berea
The poverty statistics for married-couple families in Berea show that 1.3% or 37 of the total 2,741 families live below the poverty line. Families with 1 or 2 children have the highest poverty rate of 1.7%, comprising of 16 families. On the other hand, families with 3 or 4 children have the lowest poverty rate of 0.0%, which includes 0 families.
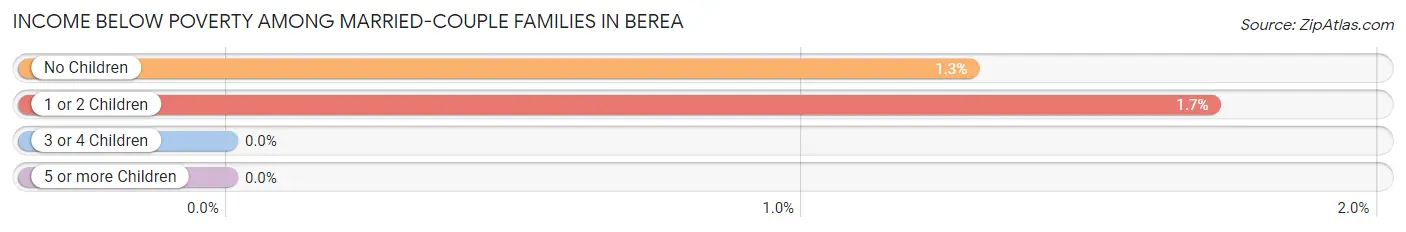
| Children | Above Poverty | Below Poverty |
| No Children | 1,607 (98.7%) | 21 (1.3%) |
| 1 or 2 Children | 920 (98.3%) | 16 (1.7%) |
| 3 or 4 Children | 177 (100.0%) | 0 (0.0%) |
| 5 or more Children | 0 (0.0%) | 0 (0.0%) |
| Total | 2,704 (98.7%) | 37 (1.3%) |
Income Below Poverty Among Single-Parent Households in Berea
According to the poverty data in Berea, 3.9% or 13 single-father households and 18.8% or 158 single-mother households are living below the poverty line. Among single-father households, those with 1 or 2 children have the highest poverty rate, with 13 households (7.9%) experiencing poverty. Likewise, among single-mother households, those with 3 or 4 children have the highest poverty rate, with 23 households (52.3%) falling below the poverty line.
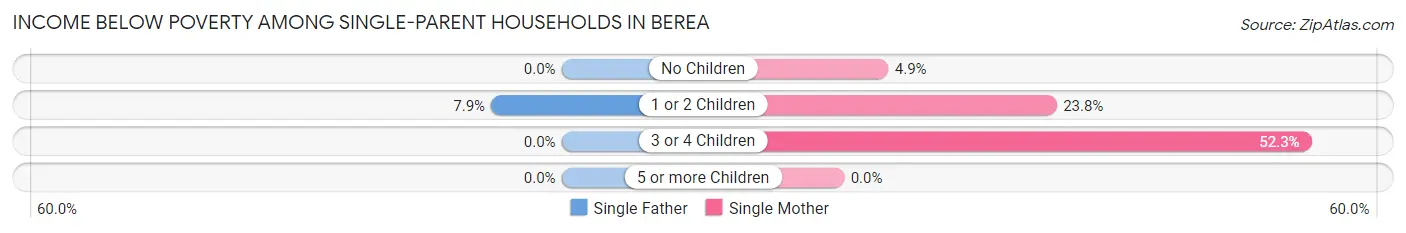
| Children | Single Father | Single Mother |
| No Children | 0 (0.0%) | 12 (4.9%) |
| 1 or 2 Children | 13 (7.9%) | 123 (23.7%) |
| 3 or 4 Children | 0 (0.0%) | 23 (52.3%) |
| 5 or more Children | 0 (0.0%) | 0 (0.0%) |
| Total | 13 (3.9%) | 158 (18.8%) |
Income Below Poverty Among Married-Couple vs Single-Parent Households in Berea
The poverty data for Berea shows that 37 of the married-couple family households (1.3%) and 171 of the single-parent households (14.6%) are living below the poverty level. Within the married-couple family households, those with 1 or 2 children have the highest poverty rate, with 16 households (1.7%) falling below the poverty line. Among the single-parent households, those with 3 or 4 children have the highest poverty rate, with 23 household (43.4%) living below poverty.
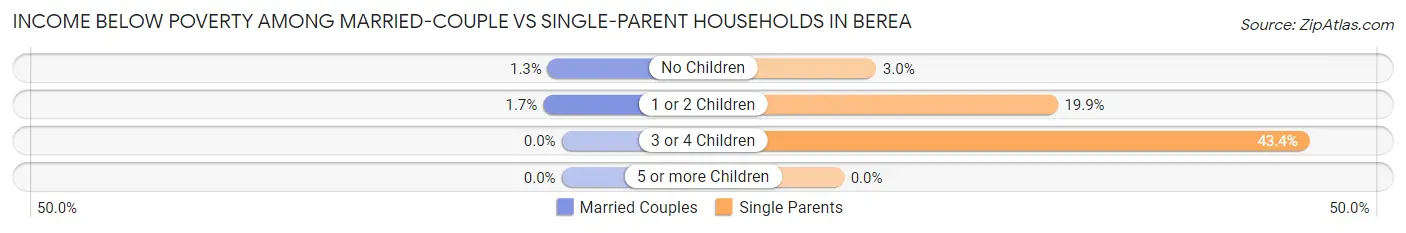
| Children | Married-Couple Families | Single-Parent Households |
| No Children | 21 (1.3%) | 12 (3.0%) |
| 1 or 2 Children | 16 (1.7%) | 136 (19.9%) |
| 3 or 4 Children | 0 (0.0%) | 23 (43.4%) |
| 5 or more Children | 0 (0.0%) | 0 (0.0%) |
| Total | 37 (1.3%) | 171 (14.6%) |
Race in Berea
The most populous races in Berea are White / Caucasian (15,031 | 81.0%), Black / African American (1,615 | 8.7%), and Two or more Races (1,227 | 6.6%).
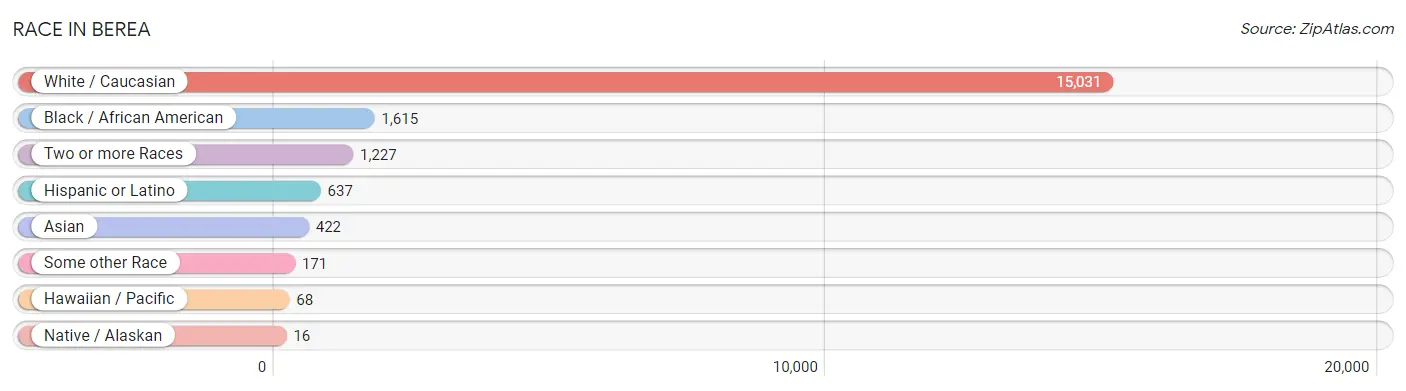
| Race | # Population | % Population |
| Asian | 422 | 2.3% |
| Black / African American | 1,615 | 8.7% |
| Hawaiian / Pacific | 68 | 0.4% |
| Hispanic or Latino | 637 | 3.4% |
| Native / Alaskan | 16 | 0.1% |
| White / Caucasian | 15,031 | 81.0% |
| Two or more Races | 1,227 | 6.6% |
| Some other Race | 171 | 0.9% |
| Total | 18,550 | 100.0% |
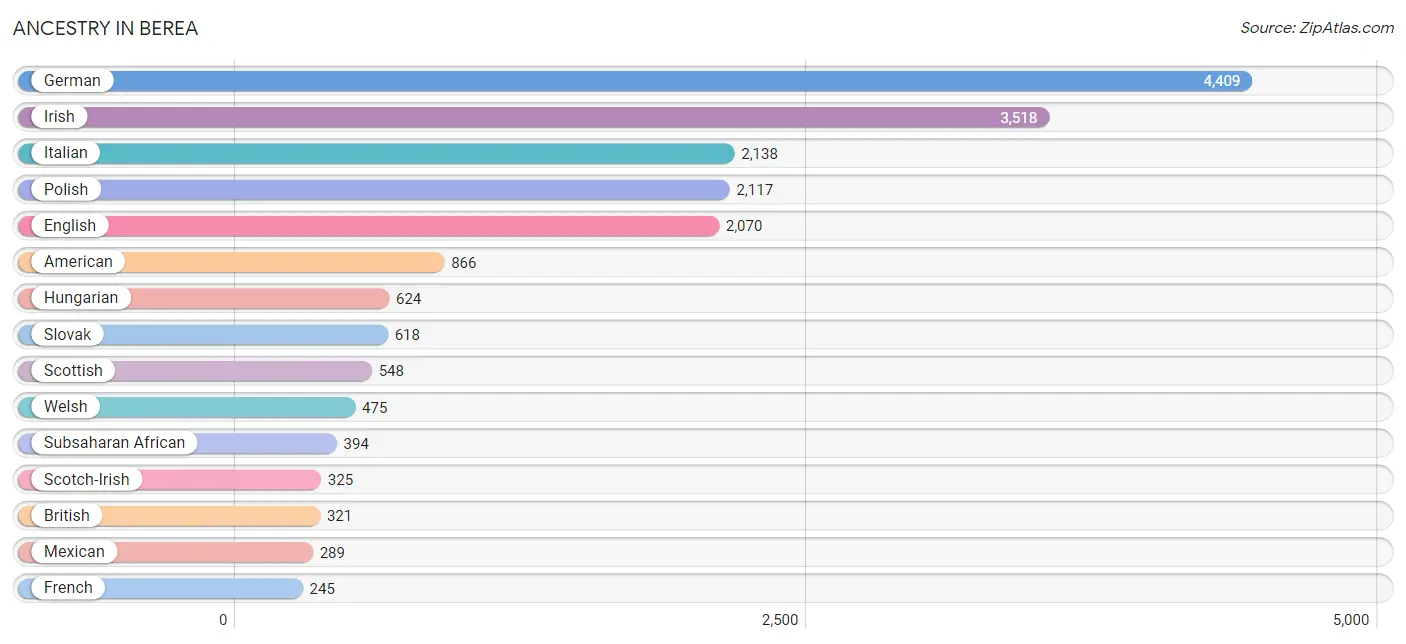
Ancestry in Berea
The most populous ancestries reported in Berea are German (4,409 | 23.8%), Irish (3,518 | 19.0%), Italian (2,138 | 11.5%), Polish (2,117 | 11.4%), and English (2,070 | 11.2%), together accounting for 76.8% of all Berea residents.
| Ancestry | # Population | % Population |
| African | 228 | 1.2% |
| Alsatian | 12 | 0.1% |
| American | 866 | 4.7% |
| Arab | 62 | 0.3% |
| Armenian | 1 | 0.0% |
| Austrian | 113 | 0.6% |
| Belizean | 5 | 0.0% |
| Bhutanese | 7 | 0.0% |
| Blackfeet | 18 | 0.1% |
| Bolivian | 1 | 0.0% |
| British | 321 | 1.7% |
| Bulgarian | 8 | 0.0% |
| Burmese | 28 | 0.2% |
| Canadian | 22 | 0.1% |
| Central American | 26 | 0.1% |
| Central American Indian | 19 | 0.1% |
| Cherokee | 45 | 0.2% |
| Chippewa | 4 | 0.0% |
| Croatian | 35 | 0.2% |
| Cuban | 53 | 0.3% |
| Czech | 142 | 0.8% |
| Czechoslovakian | 46 | 0.3% |
| Danish | 61 | 0.3% |
| Dutch | 94 | 0.5% |
| Eastern European | 132 | 0.7% |
| Egyptian | 9 | 0.1% |
| English | 2,070 | 11.2% |
| European | 212 | 1.1% |
| Filipino | 14 | 0.1% |
| Finnish | 17 | 0.1% |
| French | 245 | 1.3% |
| French Canadian | 64 | 0.4% |
| German | 4,409 | 23.8% |
| Ghanaian | 11 | 0.1% |
| Greek | 114 | 0.6% |
| Haitian | 32 | 0.2% |
| Honduran | 10 | 0.1% |
| Hungarian | 624 | 3.4% |
| Icelander | 11 | 0.1% |
| Indian (Asian) | 100 | 0.5% |
| Irish | 3,518 | 19.0% |
| Israeli | 10 | 0.1% |
| Italian | 2,138 | 11.5% |
| Jamaican | 227 | 1.2% |
| Japanese | 3 | 0.0% |
| Korean | 196 | 1.1% |
| Laotian | 13 | 0.1% |
| Latvian | 7 | 0.0% |
| Lebanese | 46 | 0.3% |
| Lithuanian | 30 | 0.2% |
| Luxembourger | 18 | 0.1% |
| Macedonian | 10 | 0.1% |
| Mexican | 289 | 1.6% |
| Mongolian | 13 | 0.1% |
| Native Hawaiian | 54 | 0.3% |
| Nigerian | 31 | 0.2% |
| Northern European | 30 | 0.2% |
| Norwegian | 219 | 1.2% |
| Pakistani | 8 | 0.0% |
| Palestinian | 4 | 0.0% |
| Pennsylvania German | 12 | 0.1% |
| Polish | 2,117 | 11.4% |
| Portuguese | 7 | 0.0% |
| Puerto Rican | 207 | 1.1% |
| Romanian | 38 | 0.2% |
| Russian | 161 | 0.9% |
| Salvadoran | 16 | 0.1% |
| Samoan | 14 | 0.1% |
| Scandinavian | 25 | 0.1% |
| Scotch-Irish | 325 | 1.8% |
| Scottish | 548 | 2.9% |
| Serbian | 132 | 0.7% |
| Sioux | 20 | 0.1% |
| Slovak | 618 | 3.3% |
| Slovene | 91 | 0.5% |
| South American | 5 | 0.0% |
| Spanish | 12 | 0.1% |
| Sri Lankan | 146 | 0.8% |
| Subsaharan African | 394 | 2.1% |
| Swedish | 159 | 0.9% |
| Swiss | 42 | 0.2% |
| Syrian | 1 | 0.0% |
| Thai | 114 | 0.6% |
| Trinidadian and Tobagonian | 5 | 0.0% |
| Ukrainian | 127 | 0.7% |
| Venezuelan | 4 | 0.0% |
| Welsh | 475 | 2.6% |
| West Indian | 10 | 0.1% |
| Yugoslavian | 8 | 0.0% | View All 89 Rows |
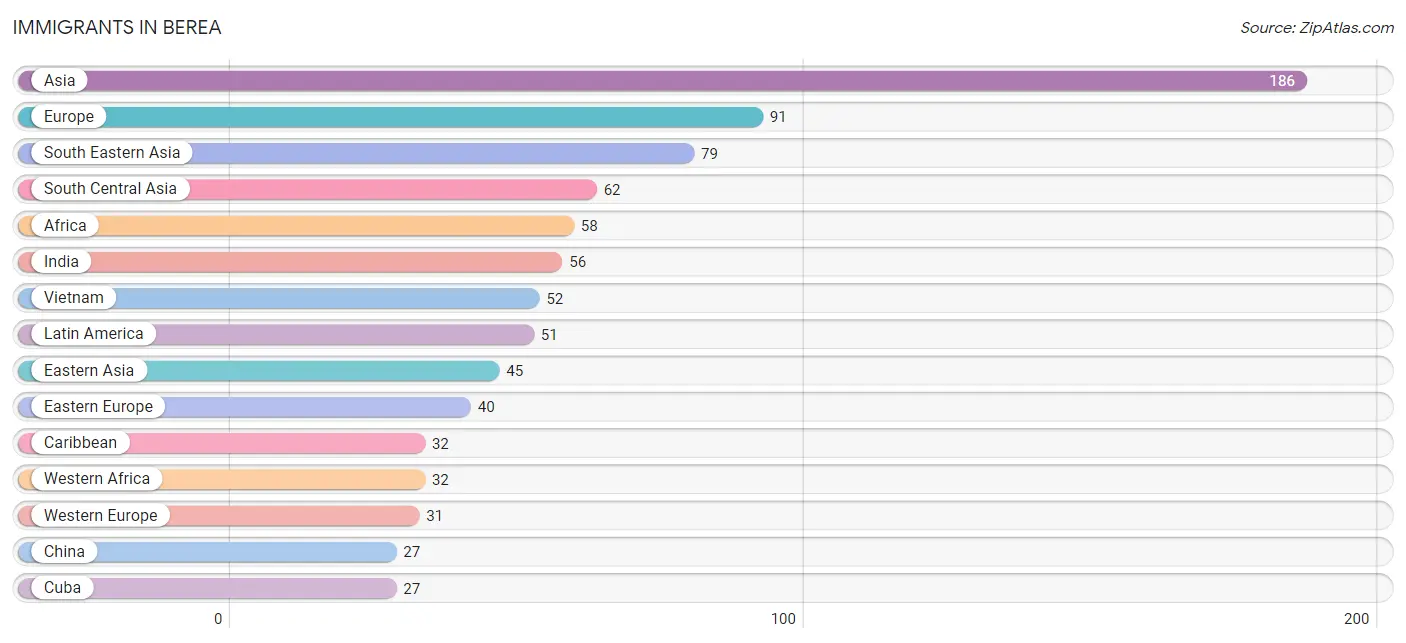
Immigrants in Berea
The most numerous immigrant groups reported in Berea came from Asia (186 | 1.0%), Europe (91 | 0.5%), South Eastern Asia (79 | 0.4%), South Central Asia (62 | 0.3%), and Africa (58 | 0.3%), together accounting for 2.6% of all Berea residents.
| Immigration Origin | # Population | % Population |
| Afghanistan | 2 | 0.0% |
| Africa | 58 | 0.3% |
| Asia | 186 | 1.0% |
| Australia | 6 | 0.0% |
| Austria | 6 | 0.0% |
| Bulgaria | 8 | 0.0% |
| Cambodia | 3 | 0.0% |
| Canada | 21 | 0.1% |
| Caribbean | 32 | 0.2% |
| Central America | 19 | 0.1% |
| China | 27 | 0.2% |
| Cuba | 27 | 0.2% |
| Czechoslovakia | 1 | 0.0% |
| Eastern Africa | 17 | 0.1% |
| Eastern Asia | 45 | 0.2% |
| Eastern Europe | 40 | 0.2% |
| Egypt | 9 | 0.1% |
| El Salvador | 16 | 0.1% |
| England | 17 | 0.1% |
| Europe | 91 | 0.5% |
| France | 14 | 0.1% |
| Germany | 11 | 0.1% |
| Ghana | 11 | 0.1% |
| Hungary | 14 | 0.1% |
| India | 56 | 0.3% |
| Indonesia | 13 | 0.1% |
| Kazakhstan | 4 | 0.0% |
| Korea | 18 | 0.1% |
| Latin America | 51 | 0.3% |
| Mexico | 3 | 0.0% |
| Nigeria | 21 | 0.1% |
| Northern Africa | 9 | 0.1% |
| Northern Europe | 20 | 0.1% |
| Oceania | 6 | 0.0% |
| Philippines | 11 | 0.1% |
| Russia | 7 | 0.0% |
| Scotland | 3 | 0.0% |
| South Central Asia | 62 | 0.3% |
| South Eastern Asia | 79 | 0.4% |
| Trinidad and Tobago | 5 | 0.0% |
| Vietnam | 52 | 0.3% |
| Western Africa | 32 | 0.2% |
| Western Europe | 31 | 0.2% | View All 43 Rows |
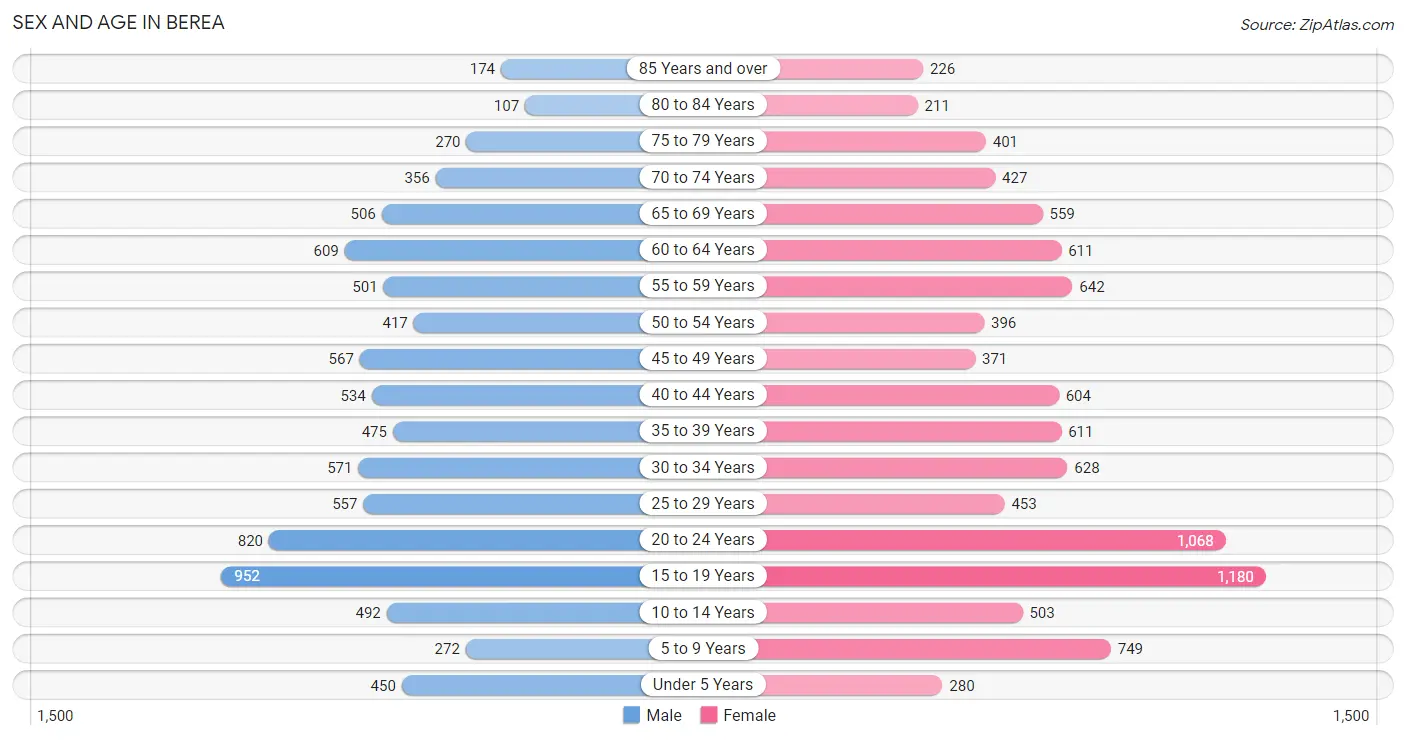
Sex and Age in Berea
Sex and Age in Berea
The most populous age groups in Berea are 15 to 19 Years (952 | 11.0%) for men and 15 to 19 Years (1,180 | 11.9%) for women.
| Age Bracket | Male | Female |
| Under 5 Years | 450 (5.2%) | 280 (2.8%) |
| 5 to 9 Years | 272 (3.2%) | 749 (7.5%) |
| 10 to 14 Years | 492 (5.7%) | 503 (5.1%) |
| 15 to 19 Years | 952 (11.0%) | 1,180 (11.9%) |
| 20 to 24 Years | 820 (9.5%) | 1,068 (10.8%) |
| 25 to 29 Years | 557 (6.5%) | 453 (4.6%) |
| 30 to 34 Years | 571 (6.6%) | 628 (6.3%) |
| 35 to 39 Years | 475 (5.5%) | 611 (6.2%) |
| 40 to 44 Years | 534 (6.2%) | 604 (6.1%) |
| 45 to 49 Years | 567 (6.6%) | 371 (3.7%) |
| 50 to 54 Years | 417 (4.8%) | 396 (4.0%) |
| 55 to 59 Years | 501 (5.8%) | 642 (6.5%) |
| 60 to 64 Years | 609 (7.1%) | 611 (6.2%) |
| 65 to 69 Years | 506 (5.9%) | 559 (5.6%) |
| 70 to 74 Years | 356 (4.1%) | 427 (4.3%) |
| 75 to 79 Years | 270 (3.1%) | 401 (4.0%) |
| 80 to 84 Years | 107 (1.2%) | 211 (2.1%) |
| 85 Years and over | 174 (2.0%) | 226 (2.3%) |
| Total | 8,630 (100.0%) | 9,920 (100.0%) |
Families and Households in Berea
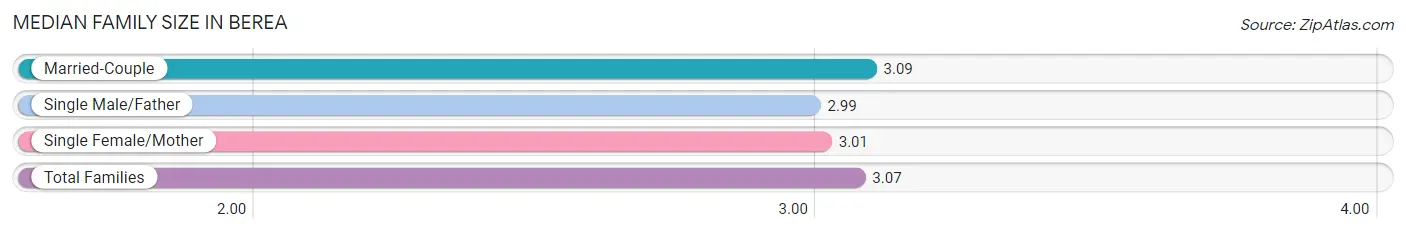
Median Family Size in Berea
The median family size in Berea is 3.07 persons per family, with married-couple families (2,741 | 70.1%) accounting for the largest median family size of 3.09 persons per family. On the other hand, single male/father families (331 | 8.5%) represent the smallest median family size with 2.99 persons per family.
| Family Type | # Families | Family Size |
| Married-Couple | 2,741 (70.1%) | 3.09 |
| Single Male/Father | 331 (8.5%) | 2.99 |
| Single Female/Mother | 841 (21.5%) | 3.01 |
| Total Families | 3,913 (100.0%) | 3.07 |
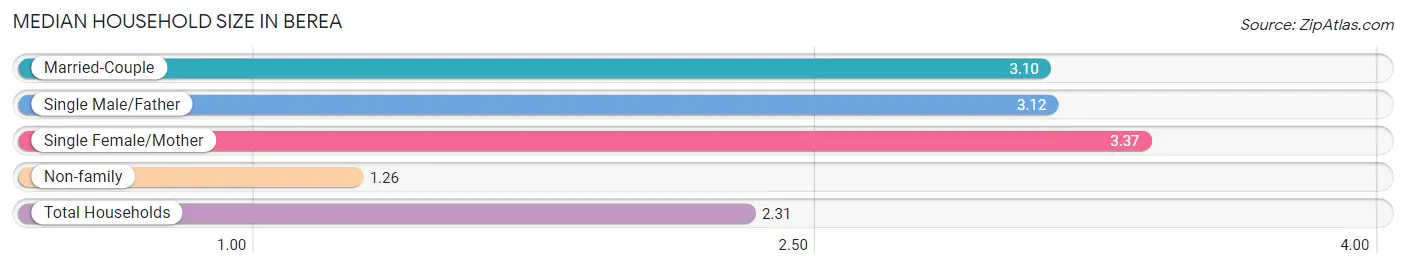
Median Household Size in Berea
The median household size in Berea is 2.31 persons per household, with single female/mother households (841 | 11.8%) accounting for the largest median household size of 3.37 persons per household. non-family households (3,202 | 45.0%) represent the smallest median household size with 1.26 persons per household.
| Household Type | # Households | Household Size |
| Married-Couple | 2,741 (38.5%) | 3.10 |
| Single Male/Father | 331 (4.6%) | 3.12 |
| Single Female/Mother | 841 (11.8%) | 3.37 |
| Non-family | 3,202 (45.0%) | 1.26 |
| Total Households | 7,115 (100.0%) | 2.31 |
Household Size by Marriage Status in Berea
Out of a total of 7,115 households in Berea, 3,913 (55.0%) are family households, while 3,202 (45.0%) are nonfamily households. The most numerous type of family households are 2-person households, comprising 1,756, and the most common type of nonfamily households are 1-person households, comprising 2,673.
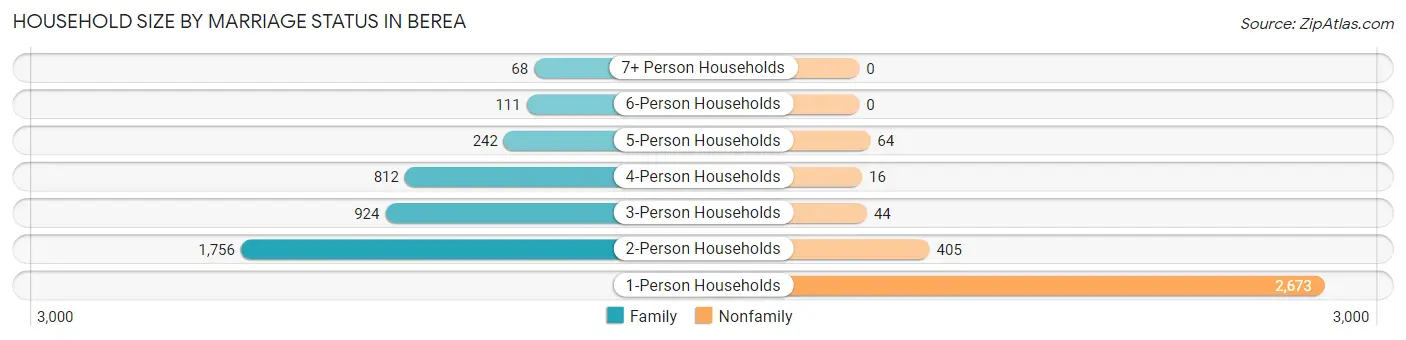
| Household Size | Family Households | Nonfamily Households |
| 1-Person Households | - | 2,673 (37.6%) |
| 2-Person Households | 1,756 (24.7%) | 405 (5.7%) |
| 3-Person Households | 924 (13.0%) | 44 (0.6%) |
| 4-Person Households | 812 (11.4%) | 16 (0.2%) |
| 5-Person Households | 242 (3.4%) | 64 (0.9%) |
| 6-Person Households | 111 (1.6%) | 0 (0.0%) |
| 7+ Person Households | 68 (1.0%) | 0 (0.0%) |
| Total | 3,913 (55.0%) | 3,202 (45.0%) |
Female Fertility in Berea
Fertility by Age in Berea
Average fertility rate in Berea is 37.0 births per 1,000 women. Women in the age bracket of 20 to 34 years have the highest fertility rate with 61.0 births per 1,000 women. Women in the age bracket of 20 to 34 years acount for 71.6% of all women with births.
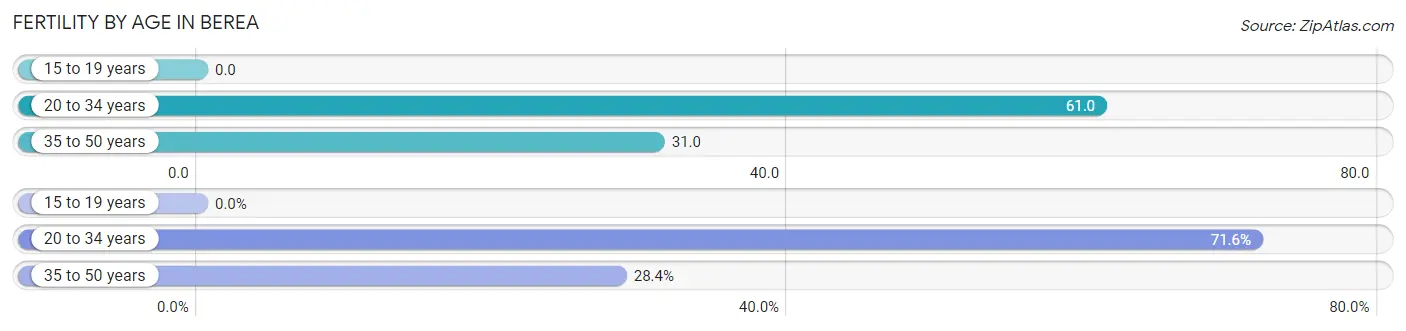
| Age Bracket | Women with Births | Births / 1,000 Women |
| 15 to 19 years | 0 (0.0%) | 0.0 |
| 20 to 34 years | 131 (71.6%) | 61.0 |
| 35 to 50 years | 52 (28.4%) | 31.0 |
| Total | 183 (100.0%) | 37.0 |
Fertility by Age by Marriage Status in Berea
38.8% of women with births (183) in Berea are married. The highest percentage of unmarried women with births falls into 35 to 50 years age bracket with 84.6% of them unmarried at the time of birth, while the lowest percentage of unmarried women with births belong to 20 to 34 years age bracket with 51.9% of them unmarried.
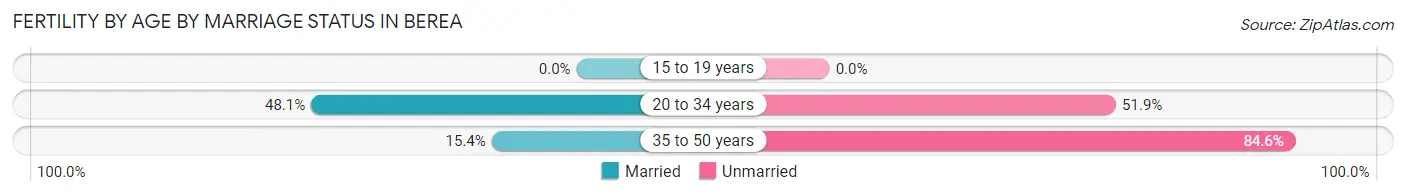
| Age Bracket | Married | Unmarried |
| 15 to 19 years | 0 (0.0%) | 0 (0.0%) |
| 20 to 34 years | 63 (48.1%) | 68 (51.9%) |
| 35 to 50 years | 8 (15.4%) | 44 (84.6%) |
| Total | 71 (38.8%) | 112 (61.2%) |
Fertility by Education in Berea
Average fertility rate in Berea is 37.0 births per 1,000 women. Women with the education attainment of graduate degree have the highest fertility rate of 84.0 births per 1,000 women, while women with the education attainment of bachelor's degree have the lowest fertility at 9.0 births per 1,000 women. Women with the education attainment of college or associate's degree represent 57.9% of all women with births.
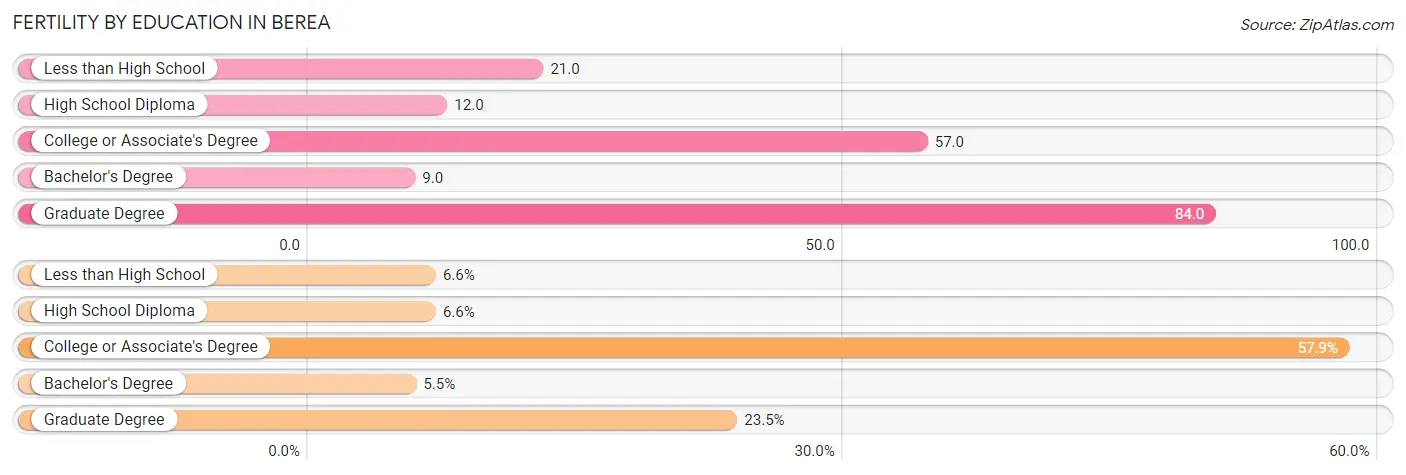
| Educational Attainment | Women with Births | Births / 1,000 Women |
| Less than High School | 12 (6.6%) | 21.0 |
| High School Diploma | 12 (6.6%) | 12.0 |
| College or Associate's Degree | 106 (57.9%) | 57.0 |
| Bachelor's Degree | 10 (5.5%) | 9.0 |
| Graduate Degree | 43 (23.5%) | 84.0 |
| Total | 183 (100.0%) | 37.0 |
Fertility by Education by Marriage Status in Berea
61.2% of women with births in Berea are unmarried. Women with the educational attainment of less than high school are most likely to be married with 100.0% of them married at childbirth, while women with the educational attainment of high school diploma are least likely to be married with 100.0% of them unmarried at childbirth.
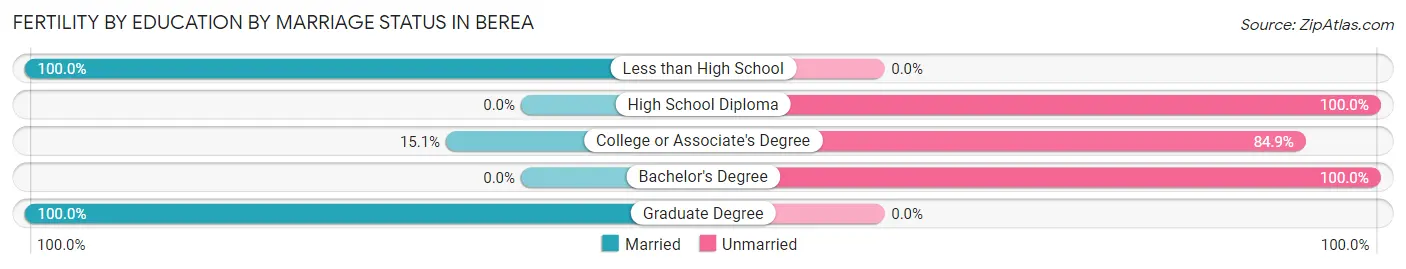
| Educational Attainment | Married | Unmarried |
| Less than High School | 12 (100.0%) | 0 (0.0%) |
| High School Diploma | 0 (0.0%) | 12 (100.0%) |
| College or Associate's Degree | 16 (15.1%) | 90 (84.9%) |
| Bachelor's Degree | 0 (0.0%) | 10 (100.0%) |
| Graduate Degree | 43 (100.0%) | 0 (0.0%) |
| Total | 71 (38.8%) | 112 (61.2%) |
Employment Characteristics in Berea
Employment by Class of Employer in Berea
Among the 8,841 employed individuals in Berea, private company employees (5,900 | 66.7%), not-for-profit organizations (1,308 | 14.8%), and local government employees (757 | 8.6%) make up the most common classes of employment.
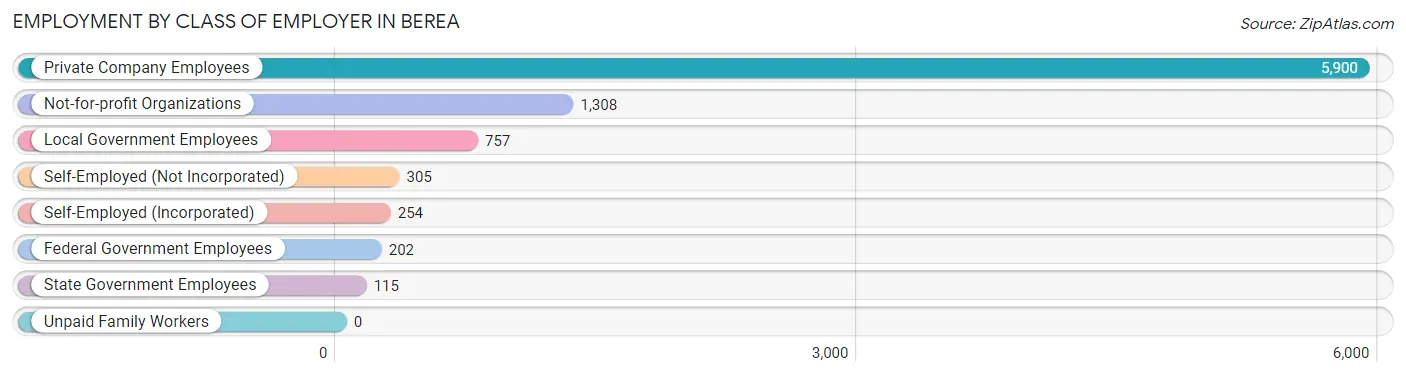
| Employer Class | # Employees | % Employees |
| Private Company Employees | 5,900 | 66.7% |
| Self-Employed (Incorporated) | 254 | 2.9% |
| Self-Employed (Not Incorporated) | 305 | 3.5% |
| Not-for-profit Organizations | 1,308 | 14.8% |
| Local Government Employees | 757 | 8.6% |
| State Government Employees | 115 | 1.3% |
| Federal Government Employees | 202 | 2.3% |
| Unpaid Family Workers | 0 | 0.0% |
| Total | 8,841 | 100.0% |
Employment Status by Age in Berea
According to the labor force statistics for Berea, out of the total population over 16 years of age (15,543), 61.7% or 9,590 individuals are in the labor force, with 4.8% or 460 of them unemployed. The age group with the highest labor force participation rate is 30 to 34 years, with 88.2% or 1,058 individuals in the labor force. Within the labor force, the 20 to 24 years age range has the highest percentage of unemployed individuals, with 14.2% or 180 of them being unemployed.
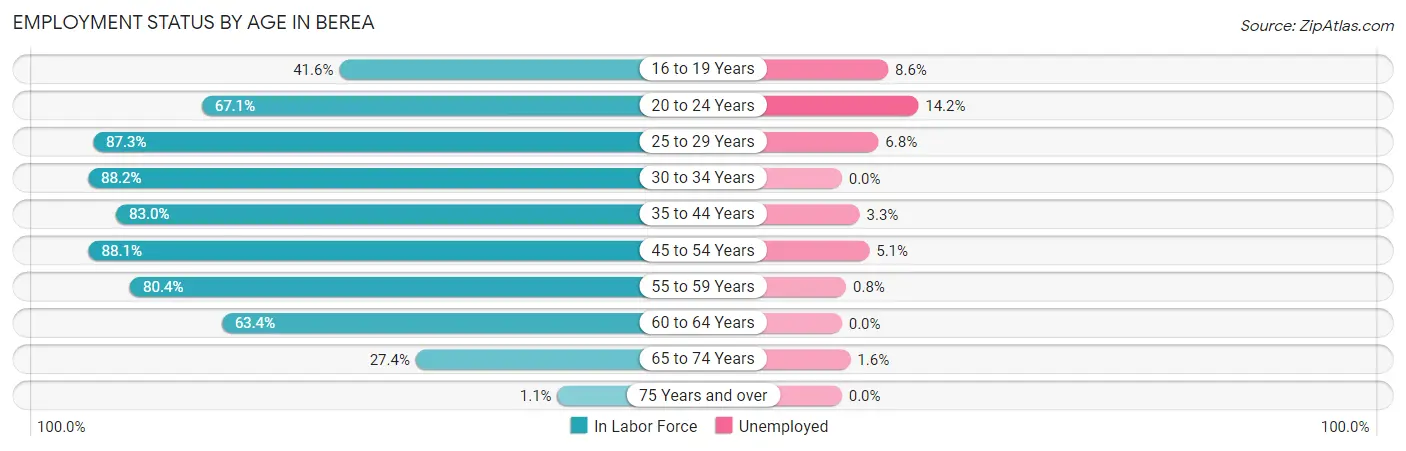
| Age Bracket | In Labor Force | Unemployed |
| 16 to 19 Years | 778 (41.6%) | 67 (8.6%) |
| 20 to 24 Years | 1,267 (67.1%) | 180 (14.2%) |
| 25 to 29 Years | 882 (87.3%) | 60 (6.8%) |
| 30 to 34 Years | 1,058 (88.2%) | 0 (0.0%) |
| 35 to 44 Years | 1,846 (83.0%) | 61 (3.3%) |
| 45 to 54 Years | 1,543 (88.1%) | 79 (5.1%) |
| 55 to 59 Years | 919 (80.4%) | 7 (0.8%) |
| 60 to 64 Years | 773 (63.4%) | 0 (0.0%) |
| 65 to 74 Years | 506 (27.4%) | 8 (1.6%) |
| 75 Years and over | 15 (1.1%) | 0 (0.0%) |
| Total | 9,590 (61.7%) | 460 (4.8%) |
Employment Status by Educational Attainment in Berea
According to labor force statistics for Berea, 82.1% of individuals (7,017) out of the total population between 25 and 64 years of age (8,547) are in the labor force, with 2.9% or 203 of them being unemployed. The group with the highest labor force participation rate are those with the educational attainment of bachelor's degree or higher, with 90.0% or 3,075 individuals in the labor force. Within the labor force, individuals with high school diploma education have the highest percentage of unemployment, with 6.6% or 88 of them being unemployed.
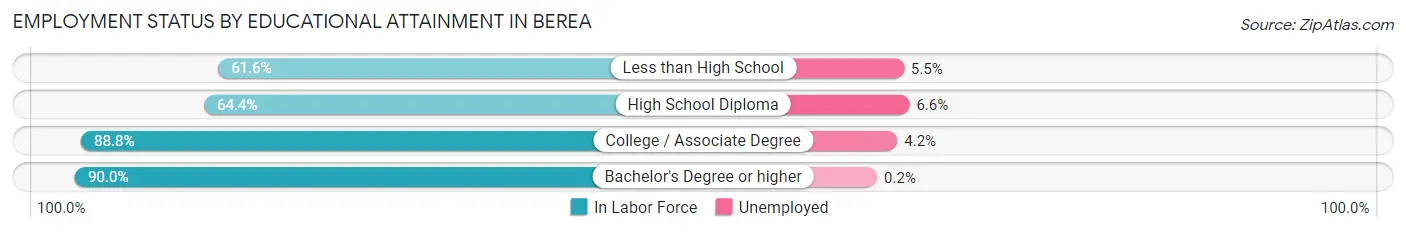
| Educational Attainment | In Labor Force | Unemployed |
| Less than High School | 237 (61.6%) | 21 (5.5%) |
| High School Diploma | 1,332 (64.4%) | 136 (6.6%) |
| College / Associate Degree | 2,377 (88.8%) | 112 (4.2%) |
| Bachelor's Degree or higher | 3,075 (90.0%) | 7 (0.2%) |
| Total | 7,017 (82.1%) | 248 (2.9%) |
Employment Occupations by Sex in Berea
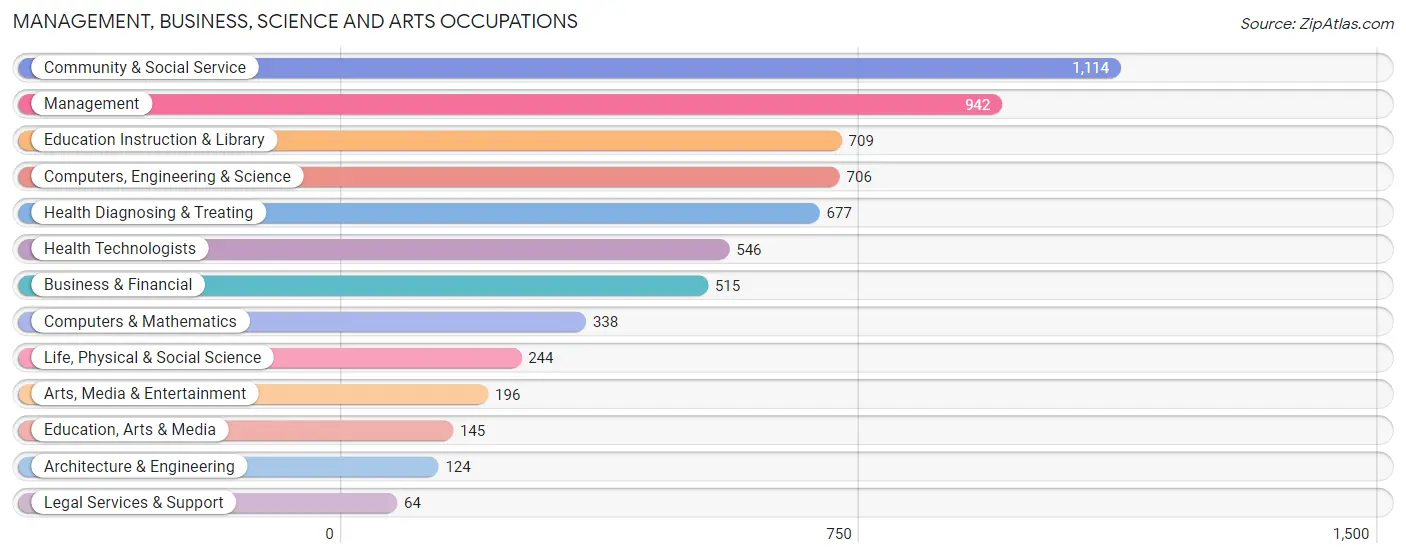
Management, Business, Science and Arts Occupations
The most common Management, Business, Science and Arts occupations in Berea are Community & Social Service (1,114 | 12.2%), Management (942 | 10.3%), Education Instruction & Library (709 | 7.8%), Computers, Engineering & Science (706 | 7.7%), and Health Diagnosing & Treating (677 | 7.4%).
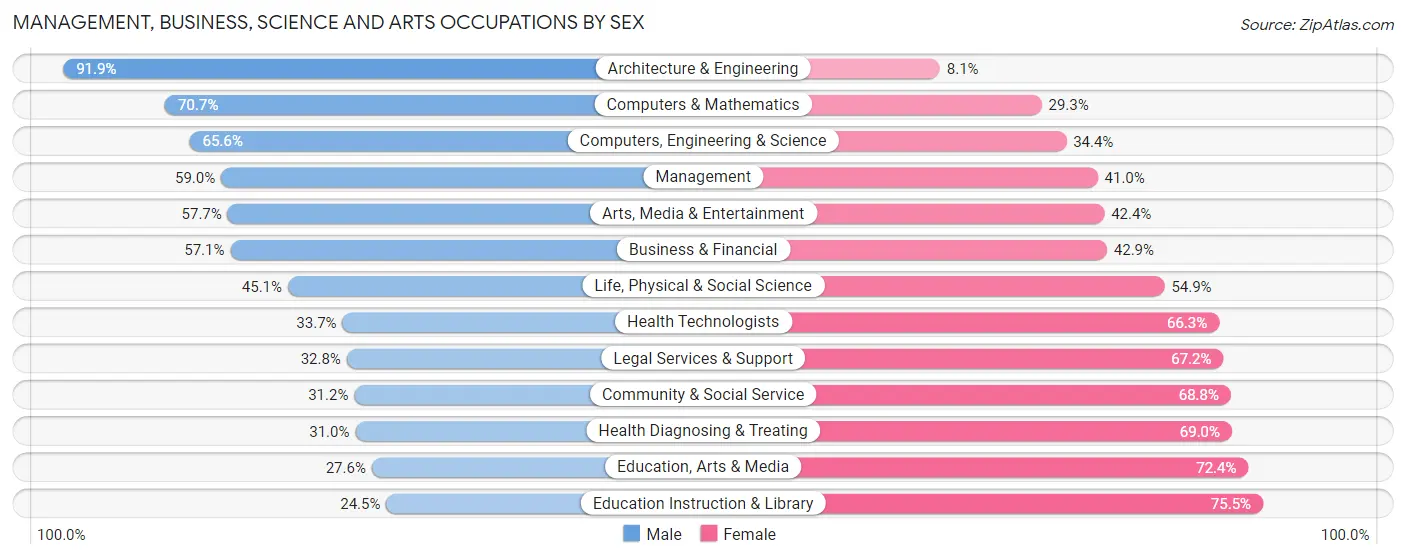
Management, Business, Science and Arts Occupations by Sex
Within the Management, Business, Science and Arts occupations in Berea, the most male-oriented occupations are Architecture & Engineering (91.9%), Computers & Mathematics (70.7%), and Computers, Engineering & Science (65.6%), while the most female-oriented occupations are Education Instruction & Library (75.5%), Education, Arts & Media (72.4%), and Health Diagnosing & Treating (69.0%).
| Occupation | Male | Female |
| Management | 556 (59.0%) | 386 (41.0%) |
| Business & Financial | 294 (57.1%) | 221 (42.9%) |
| Computers, Engineering & Science | 463 (65.6%) | 243 (34.4%) |
| Computers & Mathematics | 239 (70.7%) | 99 (29.3%) |
| Architecture & Engineering | 114 (91.9%) | 10 (8.1%) |
| Life, Physical & Social Science | 110 (45.1%) | 134 (54.9%) |
| Community & Social Service | 348 (31.2%) | 766 (68.8%) |
| Education, Arts & Media | 40 (27.6%) | 105 (72.4%) |
| Legal Services & Support | 21 (32.8%) | 43 (67.2%) |
| Education Instruction & Library | 174 (24.5%) | 535 (75.5%) |
| Arts, Media & Entertainment | 113 (57.7%) | 83 (42.3%) |
| Health Diagnosing & Treating | 210 (31.0%) | 467 (69.0%) |
| Health Technologists | 184 (33.7%) | 362 (66.3%) |
| Total (Category) | 1,871 (47.3%) | 2,083 (52.7%) |
| Total (Overall) | 4,393 (48.2%) | 4,725 (51.8%) |
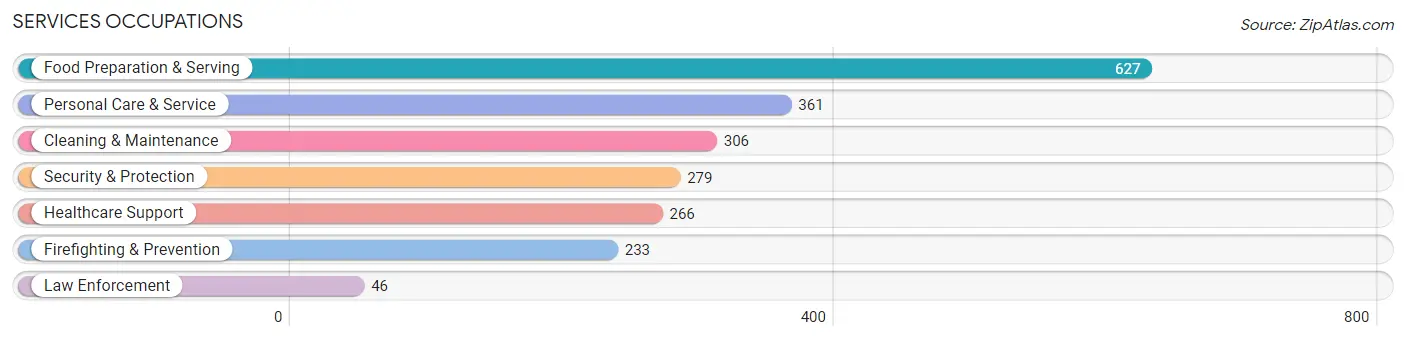
Services Occupations
The most common Services occupations in Berea are Food Preparation & Serving (627 | 6.9%), Personal Care & Service (361 | 4.0%), Cleaning & Maintenance (306 | 3.4%), Security & Protection (279 | 3.1%), and Healthcare Support (266 | 2.9%).
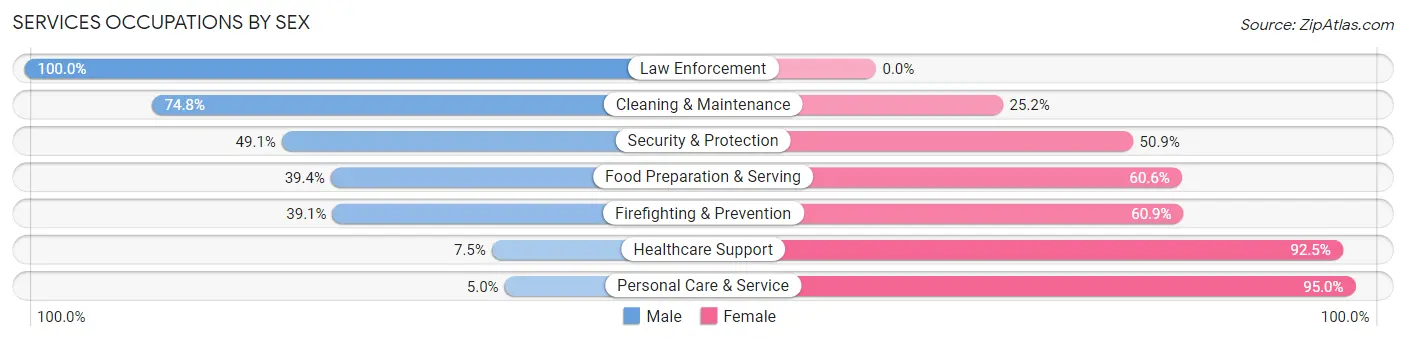
Services Occupations by Sex
Within the Services occupations in Berea, the most male-oriented occupations are Law Enforcement (100.0%), Cleaning & Maintenance (74.8%), and Security & Protection (49.1%), while the most female-oriented occupations are Personal Care & Service (95.0%), Healthcare Support (92.5%), and Firefighting & Prevention (60.9%).
| Occupation | Male | Female |
| Healthcare Support | 20 (7.5%) | 246 (92.5%) |
| Security & Protection | 137 (49.1%) | 142 (50.9%) |
| Firefighting & Prevention | 91 (39.1%) | 142 (60.9%) |
| Law Enforcement | 46 (100.0%) | 0 (0.0%) |
| Food Preparation & Serving | 247 (39.4%) | 380 (60.6%) |
| Cleaning & Maintenance | 229 (74.8%) | 77 (25.2%) |
| Personal Care & Service | 18 (5.0%) | 343 (95.0%) |
| Total (Category) | 651 (35.4%) | 1,188 (64.6%) |
| Total (Overall) | 4,393 (48.2%) | 4,725 (51.8%) |
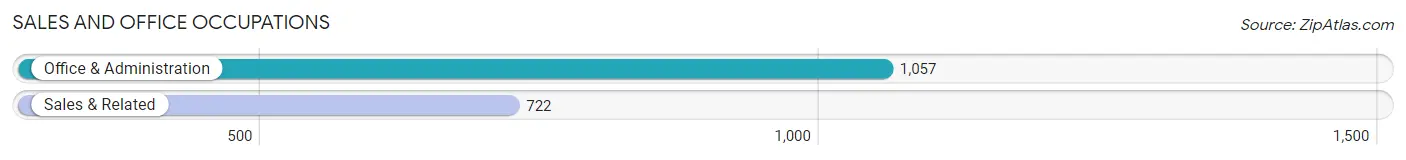
Sales and Office Occupations
The most common Sales and Office occupations in Berea are Office & Administration (1,057 | 11.6%), and Sales & Related (722 | 7.9%).
Sales and Office Occupations by Sex
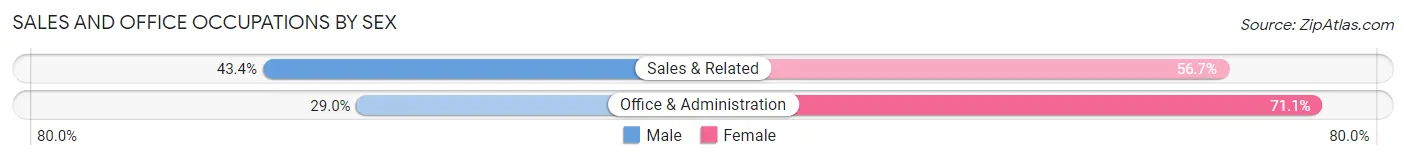
| Occupation | Male | Female |
| Sales & Related | 313 (43.3%) | 409 (56.7%) |
| Office & Administration | 306 (28.9%) | 751 (71.1%) |
| Total (Category) | 619 (34.8%) | 1,160 (65.2%) |
| Total (Overall) | 4,393 (48.2%) | 4,725 (51.8%) |
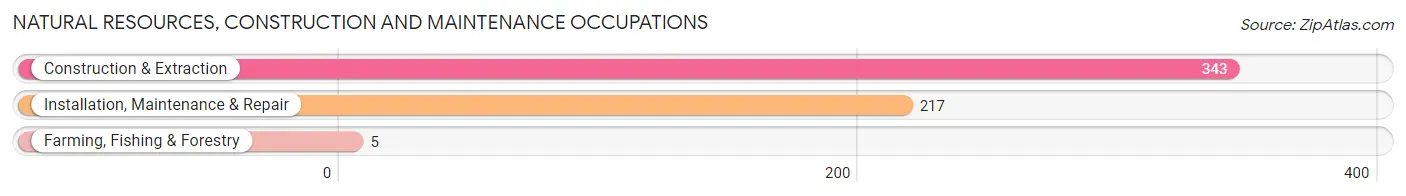
Natural Resources, Construction and Maintenance Occupations
The most common Natural Resources, Construction and Maintenance occupations in Berea are Construction & Extraction (343 | 3.8%), Installation, Maintenance & Repair (217 | 2.4%), and Farming, Fishing & Forestry (5 | 0.1%).
Natural Resources, Construction and Maintenance Occupations by Sex
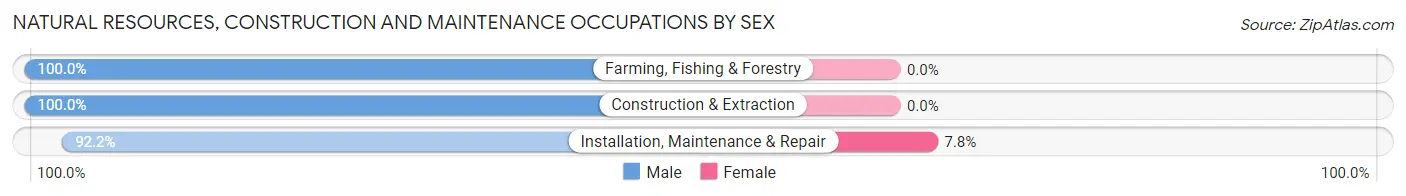
| Occupation | Male | Female |
| Farming, Fishing & Forestry | 5 (100.0%) | 0 (0.0%) |
| Construction & Extraction | 343 (100.0%) | 0 (0.0%) |
| Installation, Maintenance & Repair | 200 (92.2%) | 17 (7.8%) |
| Total (Category) | 548 (97.0%) | 17 (3.0%) |
| Total (Overall) | 4,393 (48.2%) | 4,725 (51.8%) |
Production, Transportation and Moving Occupations
The most common Production, Transportation and Moving occupations in Berea are Production (446 | 4.9%), Transportation (290 | 3.2%), and Material Moving (245 | 2.7%).
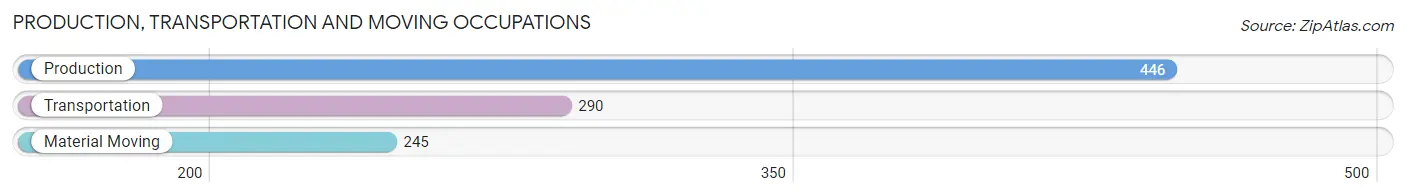
Production, Transportation and Moving Occupations by Sex
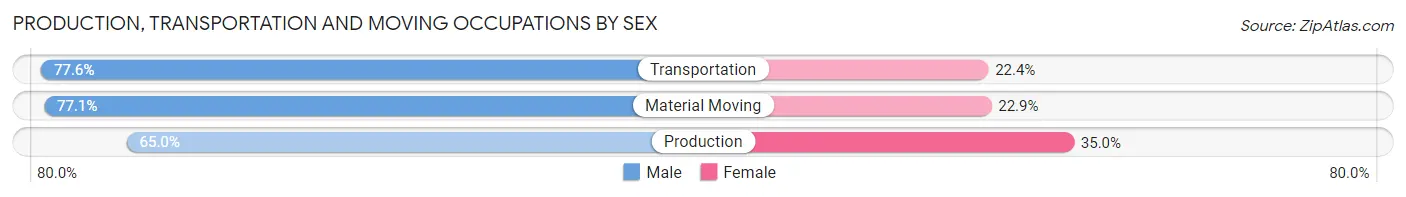
| Occupation | Male | Female |
| Production | 290 (65.0%) | 156 (35.0%) |
| Transportation | 225 (77.6%) | 65 (22.4%) |
| Material Moving | 189 (77.1%) | 56 (22.9%) |
| Total (Category) | 704 (71.8%) | 277 (28.2%) |
| Total (Overall) | 4,393 (48.2%) | 4,725 (51.8%) |
Employment Industries by Sex in Berea
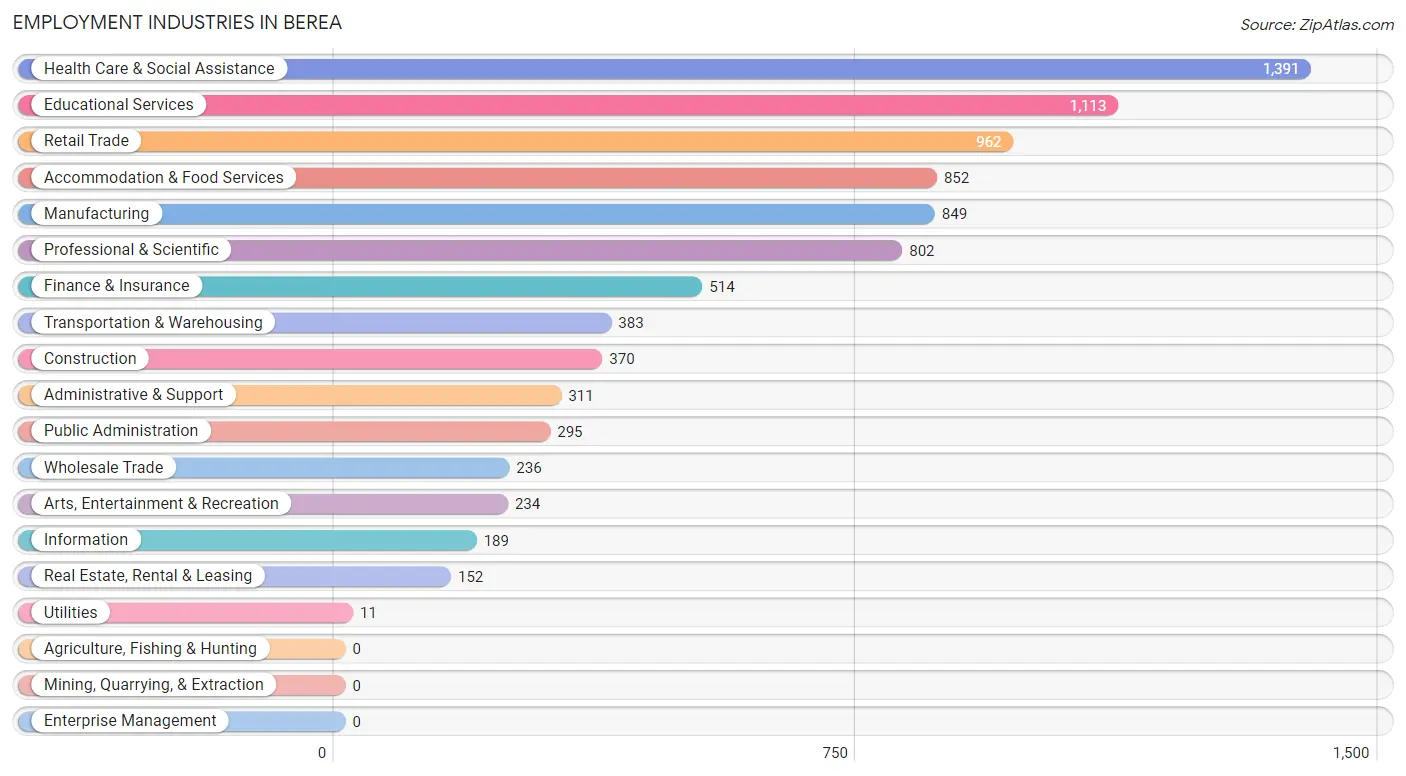
Employment Industries in Berea
The major employment industries in Berea include Health Care & Social Assistance (1,391 | 15.3%), Educational Services (1,113 | 12.2%), Retail Trade (962 | 10.5%), Accommodation & Food Services (852 | 9.3%), and Manufacturing (849 | 9.3%).
Employment Industries by Sex in Berea
The Berea industries that see more men than women are Construction (94.3%), Transportation & Warehousing (78.3%), and Manufacturing (78.2%), whereas the industries that tend to have a higher number of women are Information (73.5%), Finance & Insurance (73.0%), and Health Care & Social Assistance (71.0%).
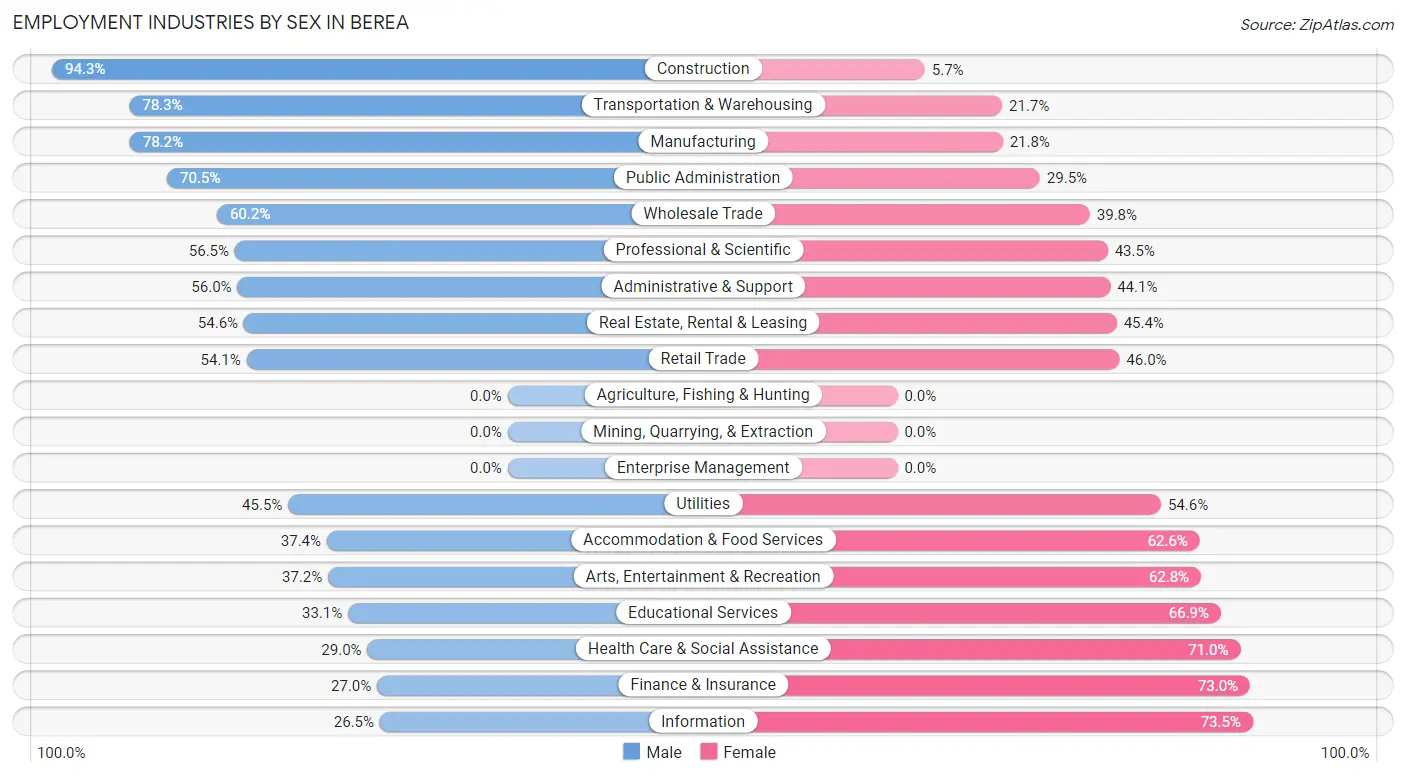
| Industry | Male | Female |
| Agriculture, Fishing & Hunting | 0 (0.0%) | 0 (0.0%) |
| Mining, Quarrying, & Extraction | 0 (0.0%) | 0 (0.0%) |
| Construction | 349 (94.3%) | 21 (5.7%) |
| Manufacturing | 664 (78.2%) | 185 (21.8%) |
| Wholesale Trade | 142 (60.2%) | 94 (39.8%) |
| Retail Trade | 520 (54.0%) | 442 (46.0%) |
| Transportation & Warehousing | 300 (78.3%) | 83 (21.7%) |
| Utilities | 5 (45.5%) | 6 (54.5%) |
| Information | 50 (26.5%) | 139 (73.5%) |
| Finance & Insurance | 139 (27.0%) | 375 (73.0%) |
| Real Estate, Rental & Leasing | 83 (54.6%) | 69 (45.4%) |
| Professional & Scientific | 453 (56.5%) | 349 (43.5%) |
| Enterprise Management | 0 (0.0%) | 0 (0.0%) |
| Administrative & Support | 174 (55.9%) | 137 (44.1%) |
| Educational Services | 368 (33.1%) | 745 (66.9%) |
| Health Care & Social Assistance | 404 (29.0%) | 987 (71.0%) |
| Arts, Entertainment & Recreation | 87 (37.2%) | 147 (62.8%) |
| Accommodation & Food Services | 319 (37.4%) | 533 (62.6%) |
| Public Administration | 208 (70.5%) | 87 (29.5%) |
| Total | 4,393 (48.2%) | 4,725 (51.8%) |
Education in Berea
School Enrollment in Berea
The most common levels of schooling among the 5,657 students in Berea are college / undergraduate (2,591 | 45.8%), high school (896 | 15.8%), and elementary school (842 | 14.9%).
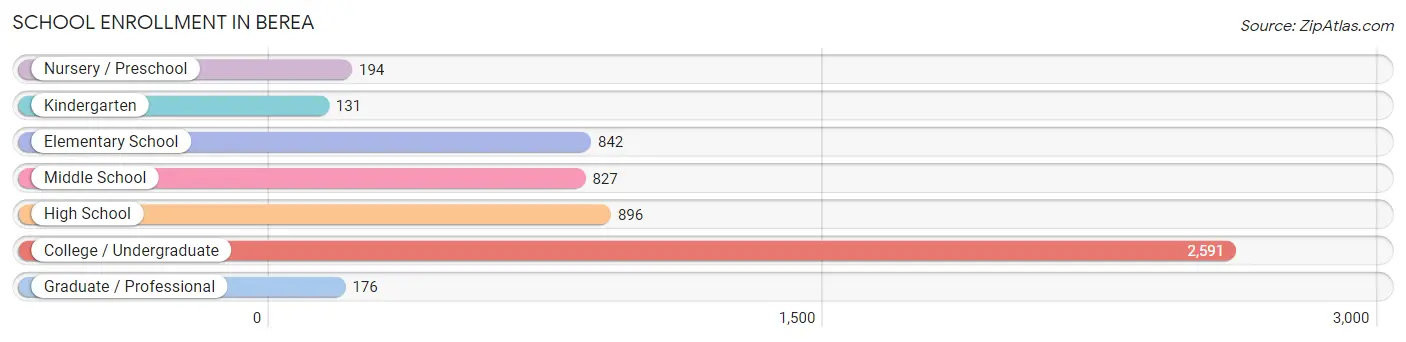
| School Level | # Students | % Students |
| Nursery / Preschool | 194 | 3.4% |
| Kindergarten | 131 | 2.3% |
| Elementary School | 842 | 14.9% |
| Middle School | 827 | 14.6% |
| High School | 896 | 15.8% |
| College / Undergraduate | 2,591 | 45.8% |
| Graduate / Professional | 176 | 3.1% |
| Total | 5,657 | 100.0% |
School Enrollment by Age by Funding Source in Berea
Out of a total of 5,657 students who are enrolled in schools in Berea, 2,421 (42.8%) attend a private institution, while the remaining 3,236 (57.2%) are enrolled in public schools. The age group of 3 to 4 year olds has the highest likelihood of being enrolled in private schools, with 92 (85.2% in the age bracket) enrolled. Conversely, the age group of 5 to 9 year old has the lowest likelihood of being enrolled in a private school, with 874 (92.0% in the age bracket) attending a public institution.
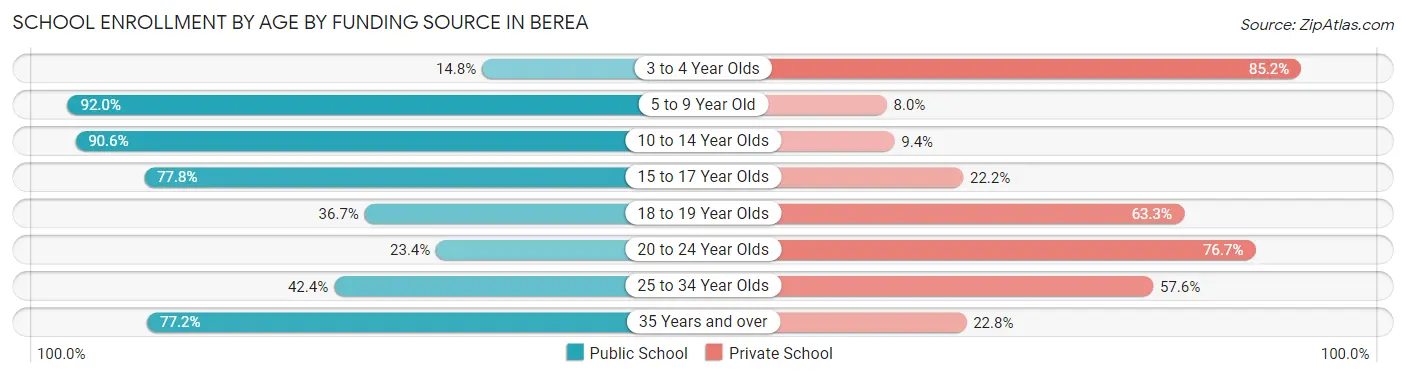
| Age Bracket | Public School | Private School |
| 3 to 4 Year Olds | 16 (14.8%) | 92 (85.2%) |
| 5 to 9 Year Old | 874 (92.0%) | 76 (8.0%) |
| 10 to 14 Year Olds | 873 (90.6%) | 91 (9.4%) |
| 15 to 17 Year Olds | 514 (77.8%) | 147 (22.2%) |
| 18 to 19 Year Olds | 466 (36.7%) | 805 (63.3%) |
| 20 to 24 Year Olds | 321 (23.4%) | 1,054 (76.6%) |
| 25 to 34 Year Olds | 100 (42.4%) | 136 (57.6%) |
| 35 Years and over | 71 (77.2%) | 21 (22.8%) |
| Total | 3,236 (57.2%) | 2,421 (42.8%) |
Educational Attainment by Field of Study in Berea
Business (902 | 18.6%), education (807 | 16.7%), science & technology (516 | 10.7%), arts & humanities (426 | 8.8%), and social sciences (285 | 5.9%) are the most common fields of study among 4,840 individuals in Berea who have obtained a bachelor's degree or higher.
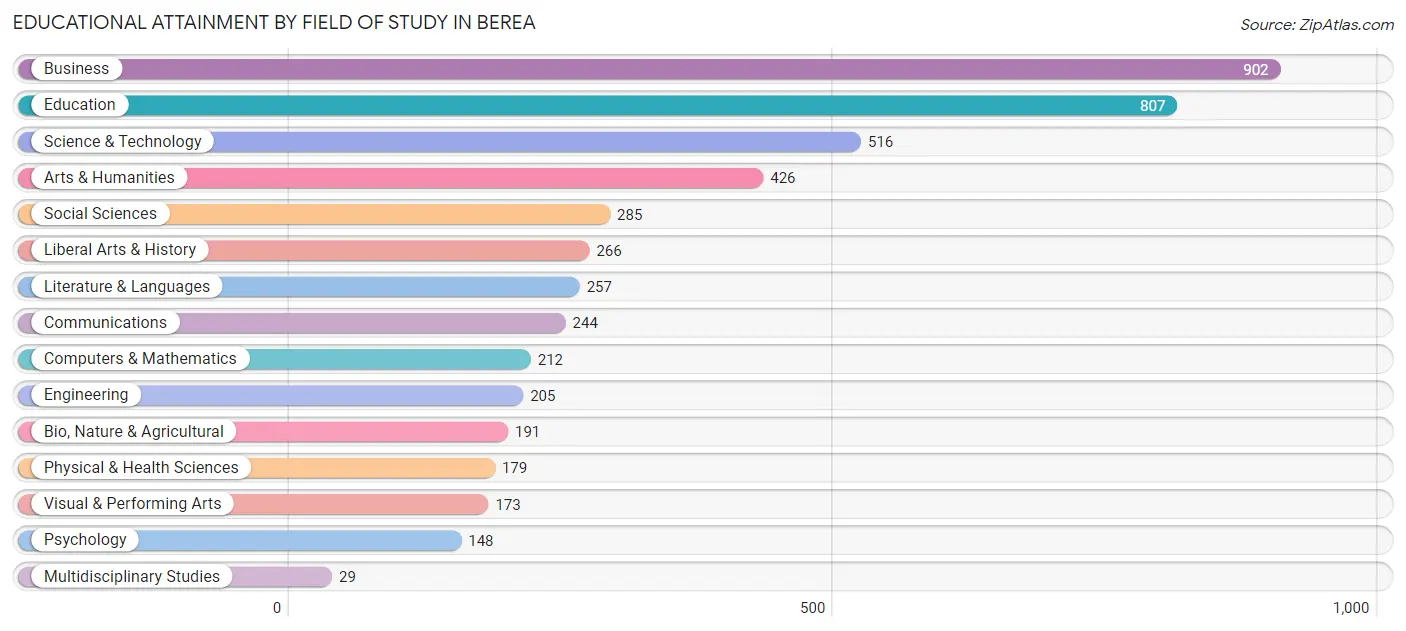
| Field of Study | # Graduates | % Graduates |
| Computers & Mathematics | 212 | 4.4% |
| Bio, Nature & Agricultural | 191 | 4.0% |
| Physical & Health Sciences | 179 | 3.7% |
| Psychology | 148 | 3.1% |
| Social Sciences | 285 | 5.9% |
| Engineering | 205 | 4.2% |
| Multidisciplinary Studies | 29 | 0.6% |
| Science & Technology | 516 | 10.7% |
| Business | 902 | 18.6% |
| Education | 807 | 16.7% |
| Literature & Languages | 257 | 5.3% |
| Liberal Arts & History | 266 | 5.5% |
| Visual & Performing Arts | 173 | 3.6% |
| Communications | 244 | 5.0% |
| Arts & Humanities | 426 | 8.8% |
| Total | 4,840 | 100.0% |
Transportation & Commute in Berea
Vehicle Availability by Sex in Berea
The most prevalent vehicle ownership categories in Berea are males with 2 vehicles (2,147, accounting for 52.8%) and females with 2 vehicles (2,087, making up 51.0%).
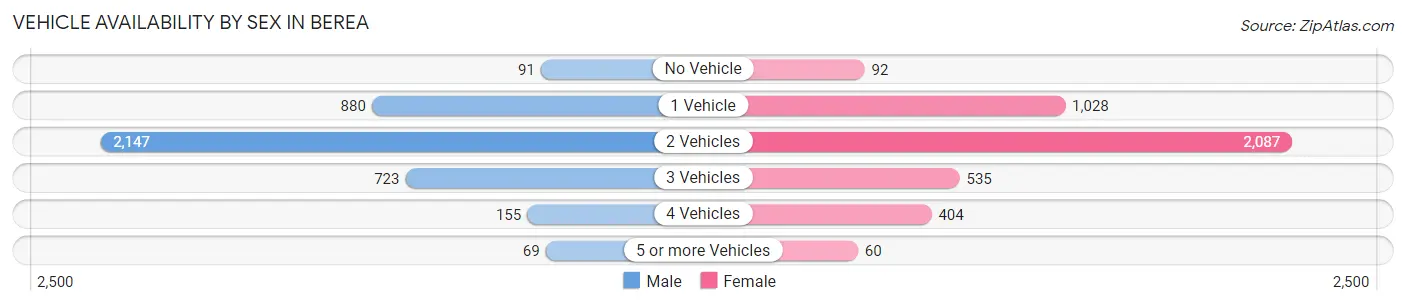
| Vehicles Available | Male | Female |
| No Vehicle | 91 (2.2%) | 92 (2.2%) |
| 1 Vehicle | 880 (21.6%) | 1,028 (24.4%) |
| 2 Vehicles | 2,147 (52.8%) | 2,087 (49.6%) |
| 3 Vehicles | 723 (17.8%) | 535 (12.7%) |
| 4 Vehicles | 155 (3.8%) | 404 (9.6%) |
| 5 or more Vehicles | 69 (1.7%) | 60 (1.4%) |
| Total | 4,065 (100.0%) | 4,206 (100.0%) |
Commute Time in Berea
The most frequently occuring commute durations in Berea are 20 to 24 minutes (1,268 commuters, 16.4%), 30 to 34 minutes (1,089 commuters, 14.1%), and 10 to 14 minutes (1,086 commuters, 14.0%).
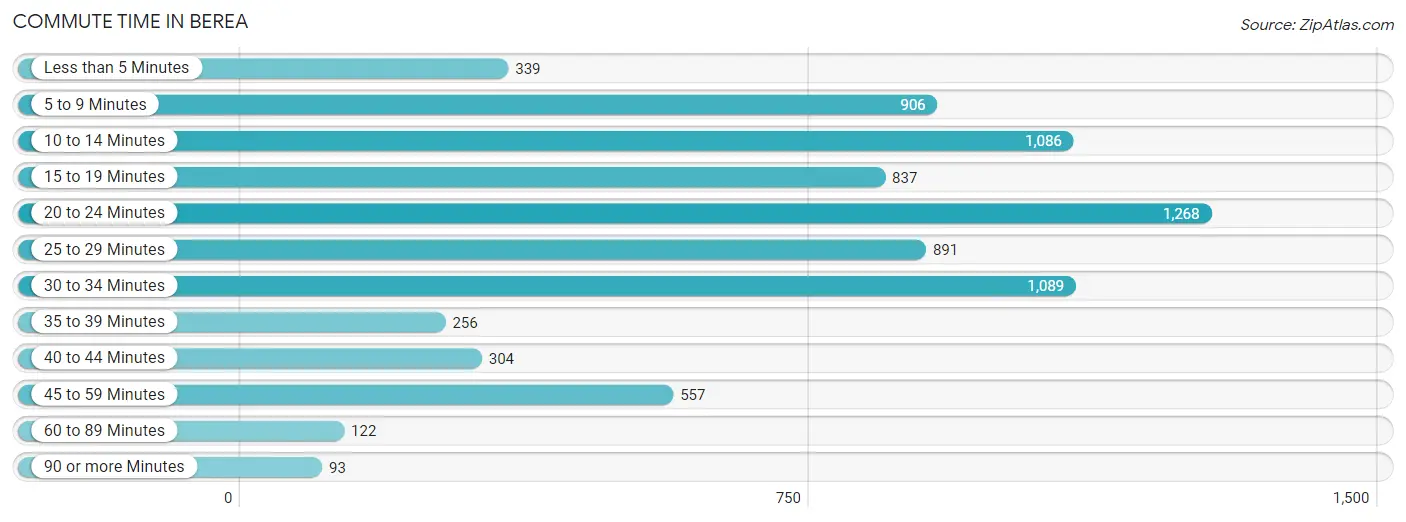
| Commute Time | # Commuters | % Commuters |
| Less than 5 Minutes | 339 | 4.4% |
| 5 to 9 Minutes | 906 | 11.7% |
| 10 to 14 Minutes | 1,086 | 14.0% |
| 15 to 19 Minutes | 837 | 10.8% |
| 20 to 24 Minutes | 1,268 | 16.4% |
| 25 to 29 Minutes | 891 | 11.5% |
| 30 to 34 Minutes | 1,089 | 14.1% |
| 35 to 39 Minutes | 256 | 3.3% |
| 40 to 44 Minutes | 304 | 3.9% |
| 45 to 59 Minutes | 557 | 7.2% |
| 60 to 89 Minutes | 122 | 1.6% |
| 90 or more Minutes | 93 | 1.2% |
Commute Time by Sex in Berea
The most common commute times in Berea are 5 to 9 minutes (529 commuters, 14.1%) for males and 20 to 24 minutes (741 commuters, 18.5%) for females.
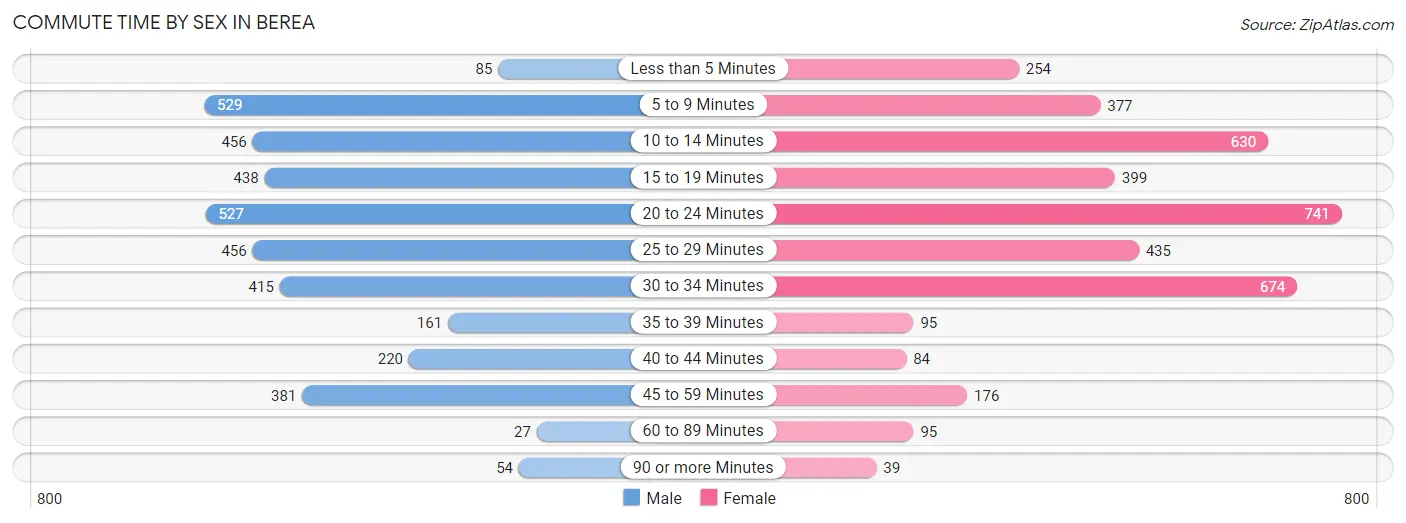
| Commute Time | Male | Female |
| Less than 5 Minutes | 85 (2.3%) | 254 (6.4%) |
| 5 to 9 Minutes | 529 (14.1%) | 377 (9.4%) |
| 10 to 14 Minutes | 456 (12.2%) | 630 (15.8%) |
| 15 to 19 Minutes | 438 (11.7%) | 399 (10.0%) |
| 20 to 24 Minutes | 527 (14.1%) | 741 (18.5%) |
| 25 to 29 Minutes | 456 (12.2%) | 435 (10.9%) |
| 30 to 34 Minutes | 415 (11.1%) | 674 (16.9%) |
| 35 to 39 Minutes | 161 (4.3%) | 95 (2.4%) |
| 40 to 44 Minutes | 220 (5.9%) | 84 (2.1%) |
| 45 to 59 Minutes | 381 (10.2%) | 176 (4.4%) |
| 60 to 89 Minutes | 27 (0.7%) | 95 (2.4%) |
| 90 or more Minutes | 54 (1.4%) | 39 (1.0%) |
Time of Departure to Work by Sex in Berea
The most frequent times of departure to work in Berea are 7:30 AM to 7:59 AM (466, 12.4%) for males and 8:00 AM to 8:29 AM (550, 13.8%) for females.
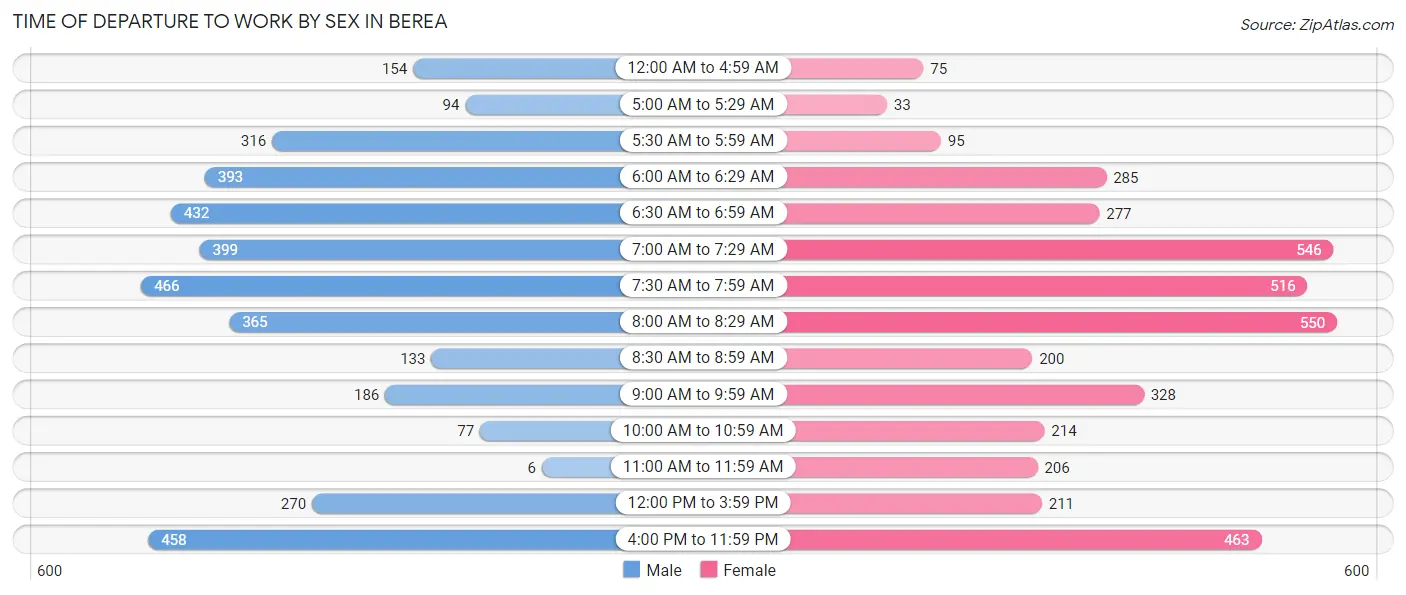
| Time of Departure | Male | Female |
| 12:00 AM to 4:59 AM | 154 (4.1%) | 75 (1.9%) |
| 5:00 AM to 5:29 AM | 94 (2.5%) | 33 (0.8%) |
| 5:30 AM to 5:59 AM | 316 (8.4%) | 95 (2.4%) |
| 6:00 AM to 6:29 AM | 393 (10.5%) | 285 (7.1%) |
| 6:30 AM to 6:59 AM | 432 (11.5%) | 277 (6.9%) |
| 7:00 AM to 7:29 AM | 399 (10.6%) | 546 (13.7%) |
| 7:30 AM to 7:59 AM | 466 (12.4%) | 516 (12.9%) |
| 8:00 AM to 8:29 AM | 365 (9.7%) | 550 (13.8%) |
| 8:30 AM to 8:59 AM | 133 (3.5%) | 200 (5.0%) |
| 9:00 AM to 9:59 AM | 186 (5.0%) | 328 (8.2%) |
| 10:00 AM to 10:59 AM | 77 (2.1%) | 214 (5.3%) |
| 11:00 AM to 11:59 AM | 6 (0.2%) | 206 (5.1%) |
| 12:00 PM to 3:59 PM | 270 (7.2%) | 211 (5.3%) |
| 4:00 PM to 11:59 PM | 458 (12.2%) | 463 (11.6%) |
| Total | 3,749 (100.0%) | 3,999 (100.0%) |
Housing Occupancy in Berea
Occupancy by Ownership in Berea
Of the total 7,115 dwellings in Berea, owner-occupied units account for 5,110 (71.8%), while renter-occupied units make up 2,005 (28.2%).
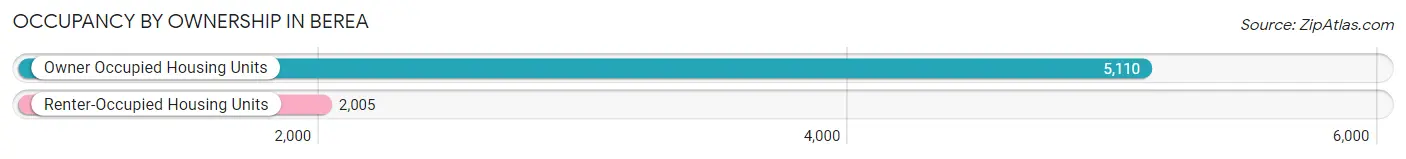
| Occupancy | # Housing Units | % Housing Units |
| Owner Occupied Housing Units | 5,110 | 71.8% |
| Renter-Occupied Housing Units | 2,005 | 28.2% |
| Total Occupied Housing Units | 7,115 | 100.0% |
Occupancy by Household Size in Berea
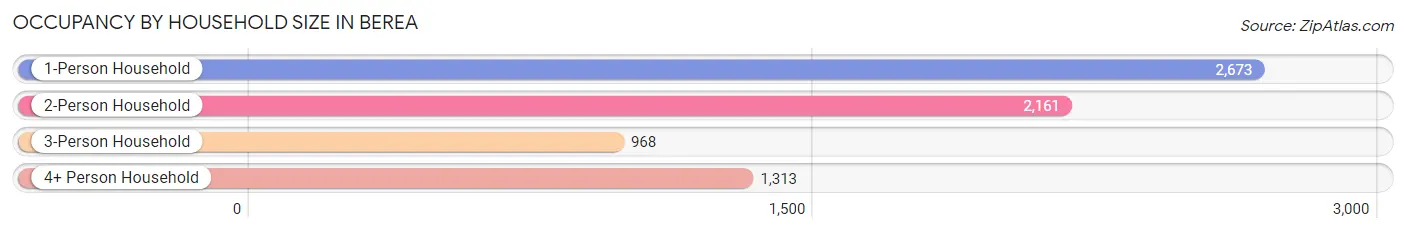
| Household Size | # Housing Units | % Housing Units |
| 1-Person Household | 2,673 | 37.6% |
| 2-Person Household | 2,161 | 30.4% |
| 3-Person Household | 968 | 13.6% |
| 4+ Person Household | 1,313 | 18.4% |
| Total Housing Units | 7,115 | 100.0% |
Occupancy by Ownership by Household Size in Berea
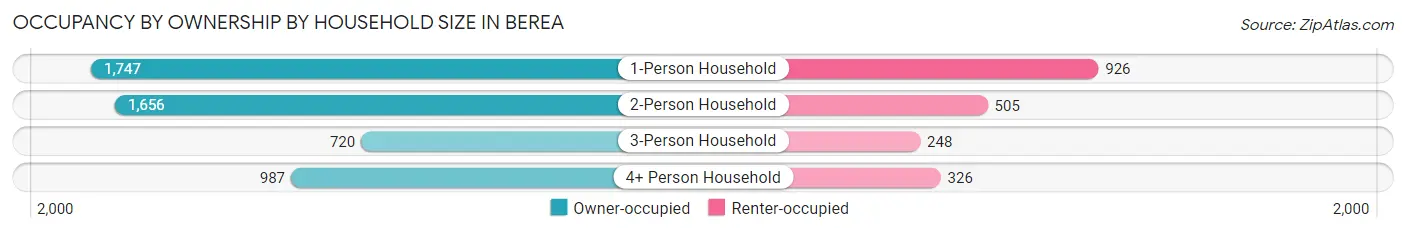
| Household Size | Owner-occupied | Renter-occupied |
| 1-Person Household | 1,747 (65.4%) | 926 (34.6%) |
| 2-Person Household | 1,656 (76.6%) | 505 (23.4%) |
| 3-Person Household | 720 (74.4%) | 248 (25.6%) |
| 4+ Person Household | 987 (75.2%) | 326 (24.8%) |
| Total Housing Units | 5,110 (71.8%) | 2,005 (28.2%) |
Occupancy by Educational Attainment in Berea
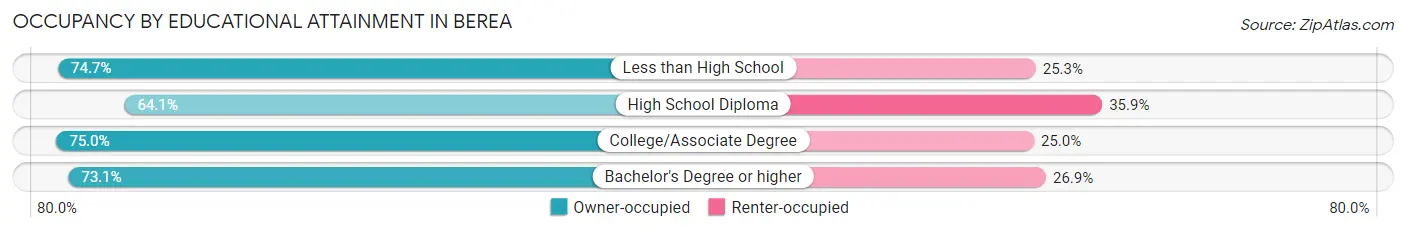
| Household Size | Owner-occupied | Renter-occupied |
| Less than High School | 115 (74.7%) | 39 (25.3%) |
| High School Diploma | 991 (64.1%) | 554 (35.9%) |
| College/Associate Degree | 1,856 (75.0%) | 620 (25.0%) |
| Bachelor's Degree or higher | 2,148 (73.1%) | 792 (26.9%) |
Occupancy by Age of Householder in Berea
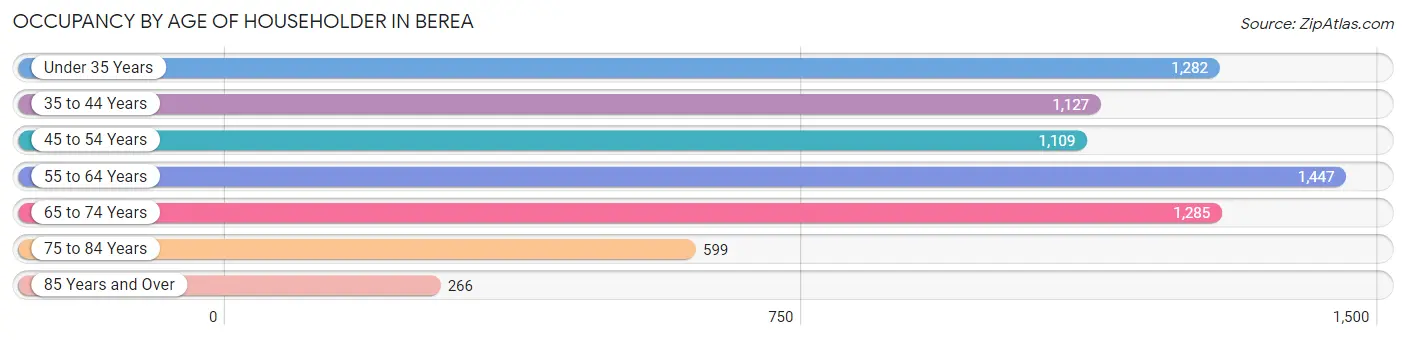
| Age Bracket | # Households | % Households |
| Under 35 Years | 1,282 | 18.0% |
| 35 to 44 Years | 1,127 | 15.8% |
| 45 to 54 Years | 1,109 | 15.6% |
| 55 to 64 Years | 1,447 | 20.3% |
| 65 to 74 Years | 1,285 | 18.1% |
| 75 to 84 Years | 599 | 8.4% |
| 85 Years and Over | 266 | 3.7% |
| Total | 7,115 | 100.0% |
Housing Finances in Berea
Median Income by Occupancy in Berea
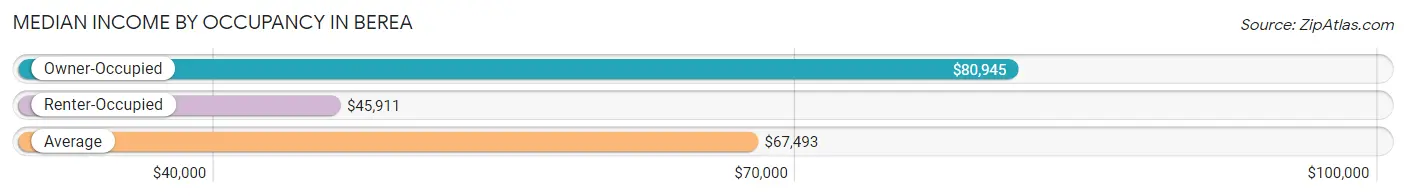
| Occupancy Type | # Households | Median Income |
| Owner-Occupied | 5,110 (71.8%) | $80,945 |
| Renter-Occupied | 2,005 (28.2%) | $45,911 |
| Average | 7,115 (100.0%) | $67,493 |
Occupancy by Householder Income Bracket in Berea
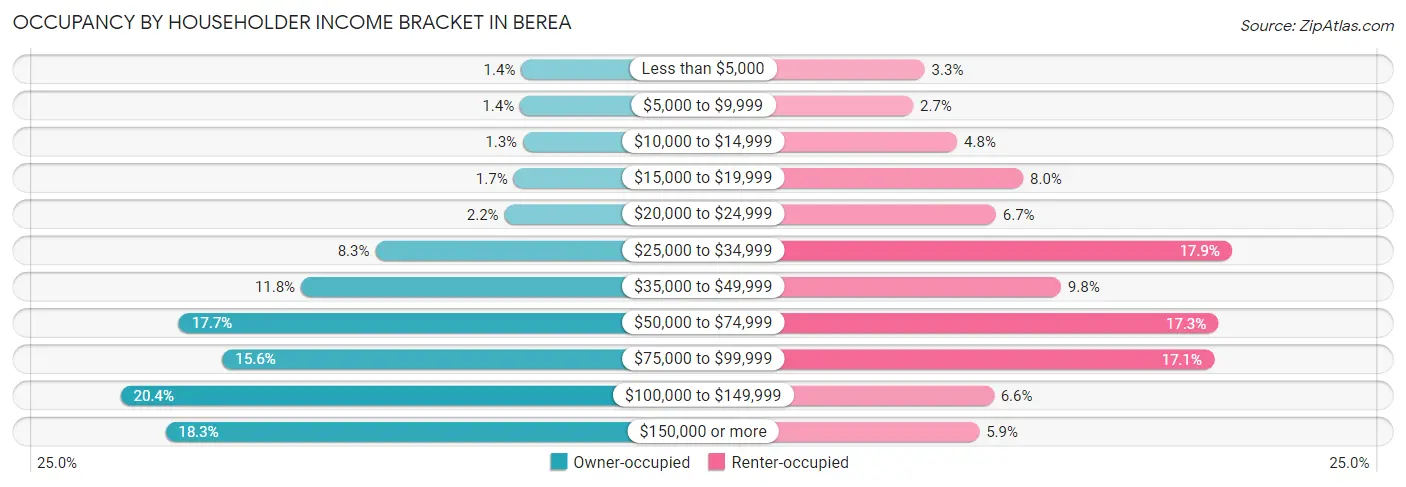
| Income Bracket | Owner-occupied | Renter-occupied |
| Less than $5,000 | 69 (1.3%) | 66 (3.3%) |
| $5,000 to $9,999 | 72 (1.4%) | 55 (2.7%) |
| $10,000 to $14,999 | 65 (1.3%) | 97 (4.8%) |
| $15,000 to $19,999 | 88 (1.7%) | 160 (8.0%) |
| $20,000 to $24,999 | 110 (2.1%) | 134 (6.7%) |
| $25,000 to $34,999 | 424 (8.3%) | 359 (17.9%) |
| $35,000 to $49,999 | 605 (11.8%) | 196 (9.8%) |
| $50,000 to $74,999 | 902 (17.6%) | 346 (17.3%) |
| $75,000 to $99,999 | 796 (15.6%) | 342 (17.1%) |
| $100,000 to $149,999 | 1,044 (20.4%) | 132 (6.6%) |
| $150,000 or more | 935 (18.3%) | 118 (5.9%) |
| Total | 5,110 (100.0%) | 2,005 (100.0%) |
Monthly Housing Cost Tiers in Berea
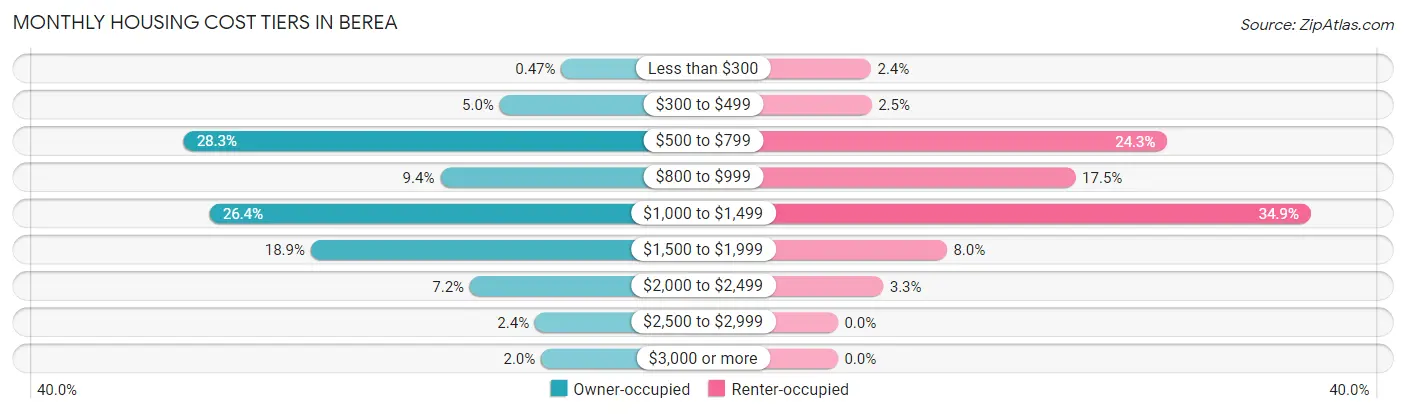
| Monthly Cost | Owner-occupied | Renter-occupied |
| Less than $300 | 24 (0.5%) | 49 (2.4%) |
| $300 to $499 | 256 (5.0%) | 50 (2.5%) |
| $500 to $799 | 1,445 (28.3%) | 487 (24.3%) |
| $800 to $999 | 480 (9.4%) | 351 (17.5%) |
| $1,000 to $1,499 | 1,347 (26.4%) | 699 (34.9%) |
| $1,500 to $1,999 | 967 (18.9%) | 161 (8.0%) |
| $2,000 to $2,499 | 368 (7.2%) | 67 (3.3%) |
| $2,500 to $2,999 | 123 (2.4%) | 0 (0.0%) |
| $3,000 or more | 100 (2.0%) | 0 (0.0%) |
| Total | 5,110 (100.0%) | 2,005 (100.0%) |
Physical Housing Characteristics in Berea
Housing Structures in Berea
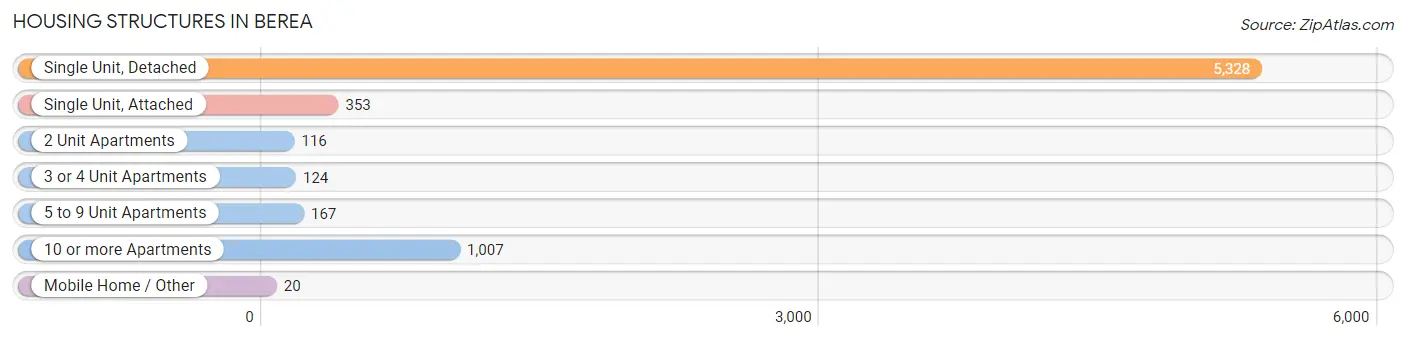
| Structure Type | # Housing Units | % Housing Units |
| Single Unit, Detached | 5,328 | 74.9% |
| Single Unit, Attached | 353 | 5.0% |
| 2 Unit Apartments | 116 | 1.6% |
| 3 or 4 Unit Apartments | 124 | 1.7% |
| 5 to 9 Unit Apartments | 167 | 2.4% |
| 10 or more Apartments | 1,007 | 14.1% |
| Mobile Home / Other | 20 | 0.3% |
| Total | 7,115 | 100.0% |
Housing Structures by Occupancy in Berea
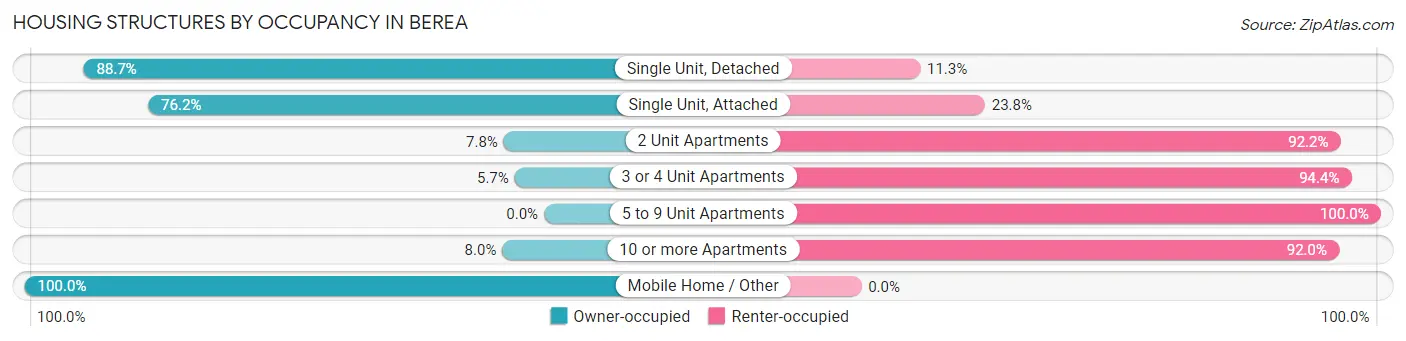
| Structure Type | Owner-occupied | Renter-occupied |
| Single Unit, Detached | 4,724 (88.7%) | 604 (11.3%) |
| Single Unit, Attached | 269 (76.2%) | 84 (23.8%) |
| 2 Unit Apartments | 9 (7.8%) | 107 (92.2%) |
| 3 or 4 Unit Apartments | 7 (5.7%) | 117 (94.4%) |
| 5 to 9 Unit Apartments | 0 (0.0%) | 167 (100.0%) |
| 10 or more Apartments | 81 (8.0%) | 926 (92.0%) |
| Mobile Home / Other | 20 (100.0%) | 0 (0.0%) |
| Total | 5,110 (71.8%) | 2,005 (28.2%) |
Housing Structures by Number of Rooms in Berea
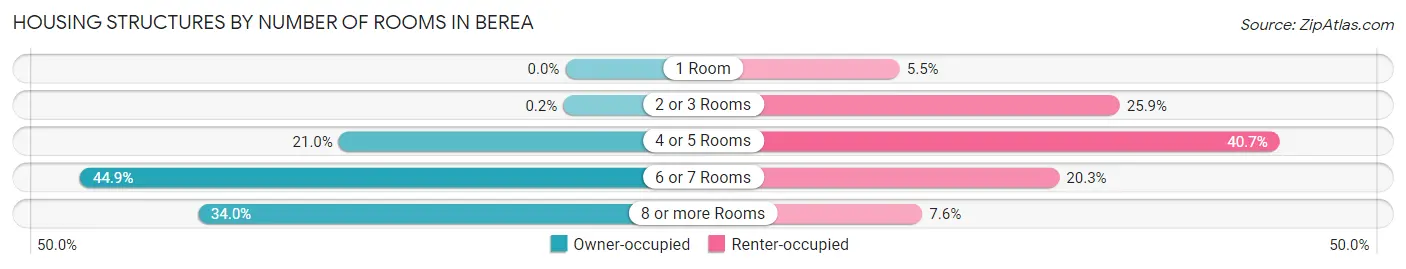
| Number of Rooms | Owner-occupied | Renter-occupied |
| 1 Room | 0 (0.0%) | 111 (5.5%) |
| 2 or 3 Rooms | 10 (0.2%) | 519 (25.9%) |
| 4 or 5 Rooms | 1,071 (21.0%) | 815 (40.6%) |
| 6 or 7 Rooms | 2,293 (44.9%) | 407 (20.3%) |
| 8 or more Rooms | 1,736 (34.0%) | 153 (7.6%) |
| Total | 5,110 (100.0%) | 2,005 (100.0%) |
Housing Structure by Heating Type in Berea
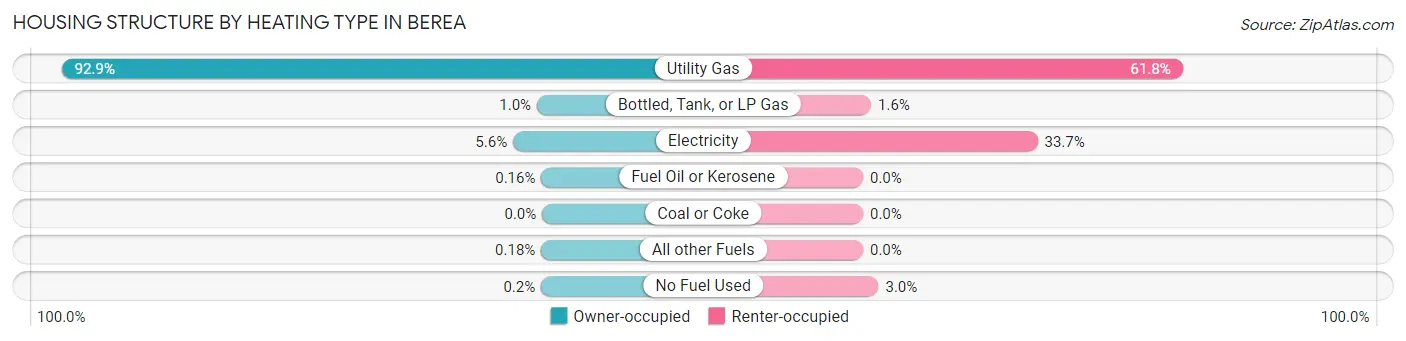
| Heating Type | Owner-occupied | Renter-occupied |
| Utility Gas | 4,745 (92.9%) | 1,238 (61.8%) |
| Bottled, Tank, or LP Gas | 51 (1.0%) | 31 (1.5%) |
| Electricity | 287 (5.6%) | 676 (33.7%) |
| Fuel Oil or Kerosene | 8 (0.2%) | 0 (0.0%) |
| Coal or Coke | 0 (0.0%) | 0 (0.0%) |
| All other Fuels | 9 (0.2%) | 0 (0.0%) |
| No Fuel Used | 10 (0.2%) | 60 (3.0%) |
| Total | 5,110 (100.0%) | 2,005 (100.0%) |
Household Vehicle Usage in Berea
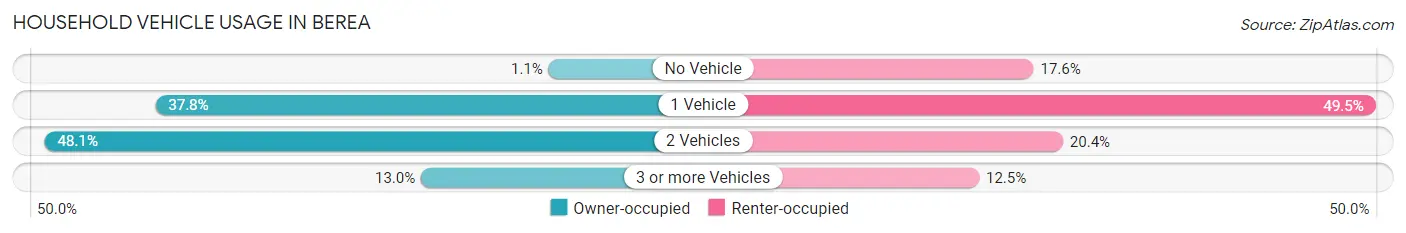
| Vehicles per Household | Owner-occupied | Renter-occupied |
| No Vehicle | 55 (1.1%) | 353 (17.6%) |
| 1 Vehicle | 1,931 (37.8%) | 993 (49.5%) |
| 2 Vehicles | 2,460 (48.1%) | 408 (20.3%) |
| 3 or more Vehicles | 664 (13.0%) | 251 (12.5%) |
| Total | 5,110 (100.0%) | 2,005 (100.0%) |
Real Estate & Mortgages in Berea
Real Estate and Mortgage Overview in Berea
| Characteristic | Without Mortgage | With Mortgage |
| Housing Units | 1,808 | 3,302 |
| Median Property Value | $168,300 | $179,000 |
| Median Household Income | $55,481 | $713 |
| Monthly Housing Costs | $653 | $100 |
| Real Estate Taxes | $3,586 | $19 |
Property Value by Mortgage Status in Berea
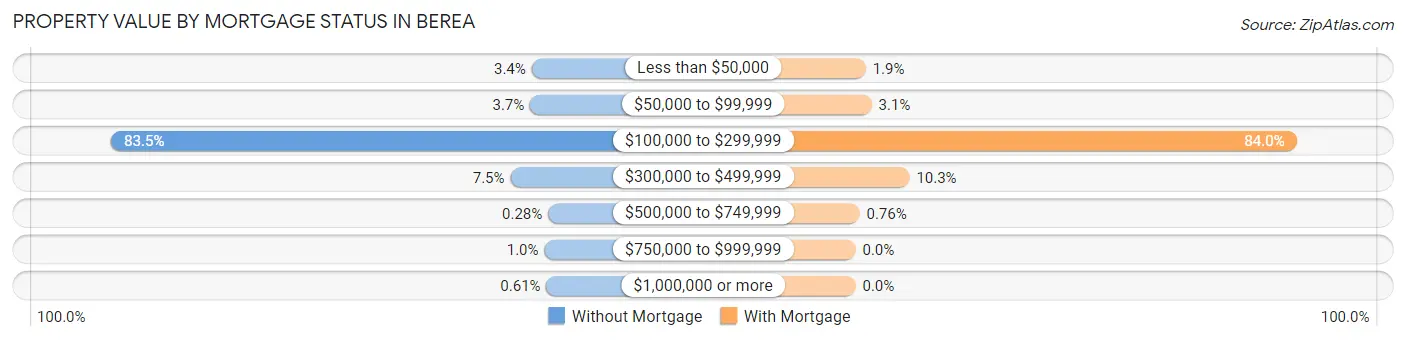
| Property Value | Without Mortgage | With Mortgage |
| Less than $50,000 | 62 (3.4%) | 64 (1.9%) |
| $50,000 to $99,999 | 67 (3.7%) | 101 (3.1%) |
| $100,000 to $299,999 | 1,510 (83.5%) | 2,773 (84.0%) |
| $300,000 to $499,999 | 135 (7.5%) | 339 (10.3%) |
| $500,000 to $749,999 | 5 (0.3%) | 25 (0.8%) |
| $750,000 to $999,999 | 18 (1.0%) | 0 (0.0%) |
| $1,000,000 or more | 11 (0.6%) | 0 (0.0%) |
| Total | 1,808 (100.0%) | 3,302 (100.0%) |
Household Income by Mortgage Status in Berea
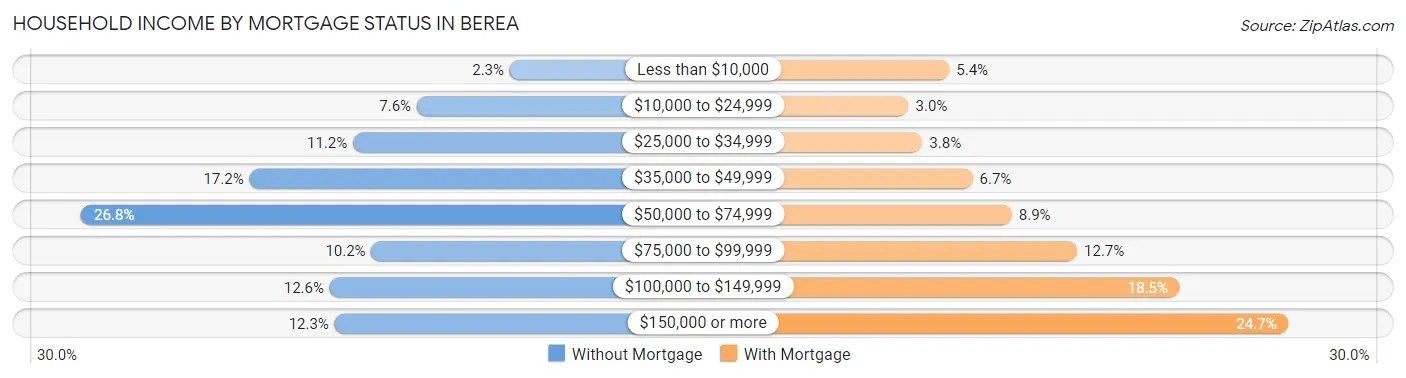
| Household Income | Without Mortgage | With Mortgage |
| Less than $10,000 | 41 (2.3%) | 177 (5.4%) |
| $10,000 to $24,999 | 137 (7.6%) | 100 (3.0%) |
| $25,000 to $34,999 | 203 (11.2%) | 126 (3.8%) |
| $35,000 to $49,999 | 310 (17.2%) | 221 (6.7%) |
| $50,000 to $74,999 | 484 (26.8%) | 295 (8.9%) |
| $75,000 to $99,999 | 184 (10.2%) | 418 (12.7%) |
| $100,000 to $149,999 | 227 (12.6%) | 612 (18.5%) |
| $150,000 or more | 222 (12.3%) | 817 (24.7%) |
| Total | 1,808 (100.0%) | 3,302 (100.0%) |
Property Value to Household Income Ratio in Berea
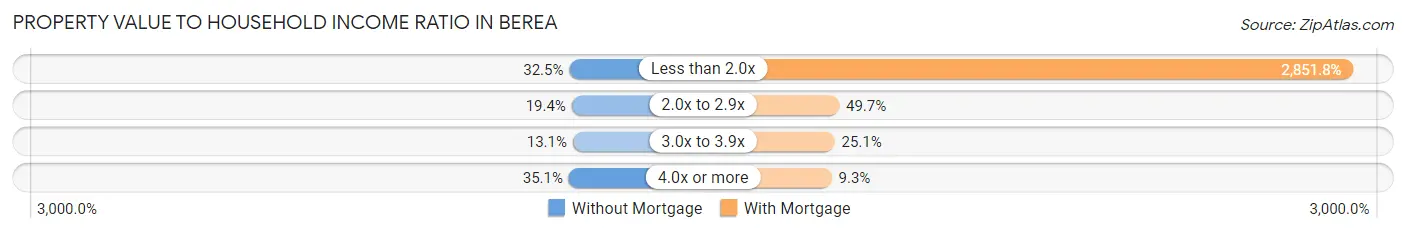
| Value-to-Income Ratio | Without Mortgage | With Mortgage |
| Less than 2.0x | 588 (32.5%) | 94,167 (2,851.8%) |
| 2.0x to 2.9x | 350 (19.4%) | 1,641 (49.7%) |
| 3.0x to 3.9x | 236 (13.1%) | 829 (25.1%) |
| 4.0x or more | 634 (35.1%) | 306 (9.3%) |
| Total | 1,808 (100.0%) | 3,302 (100.0%) |
Real Estate Taxes by Mortgage Status in Berea
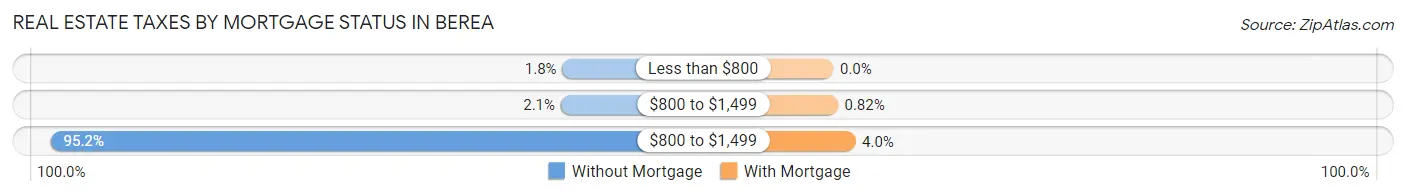
| Property Taxes | Without Mortgage | With Mortgage |
| Less than $800 | 32 (1.8%) | 0 (0.0%) |
| $800 to $1,499 | 37 (2.1%) | 27 (0.8%) |
| $800 to $1,499 | 1,722 (95.2%) | 133 (4.0%) |
| Total | 1,808 (100.0%) | 3,302 (100.0%) |
Health & Disability in Berea
Health Insurance Coverage by Age in Berea
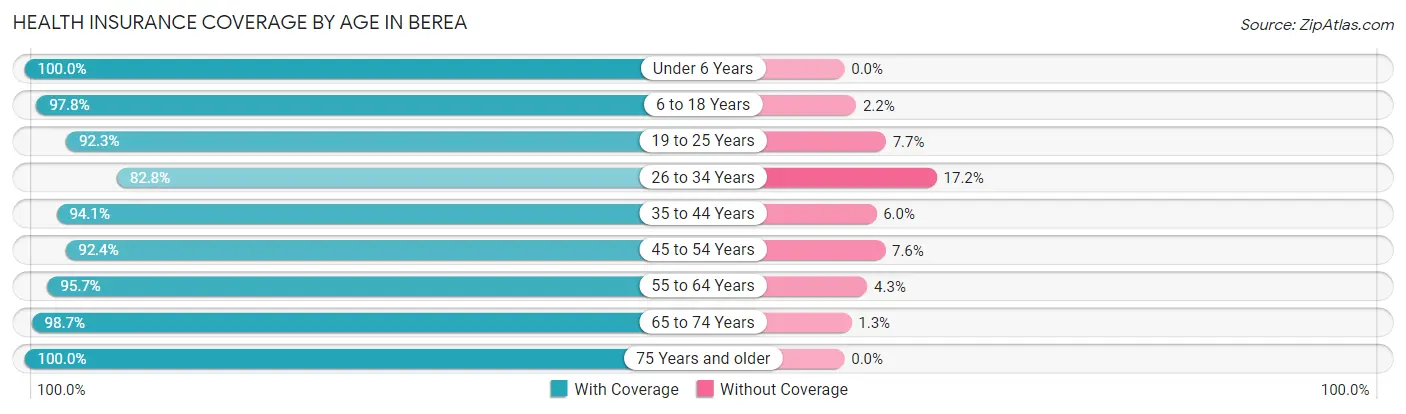
| Age Bracket | With Coverage | Without Coverage |
| Under 6 Years | 896 (100.0%) | 0 (0.0%) |
| 6 to 18 Years | 3,188 (97.8%) | 71 (2.2%) |
| 19 to 25 Years | 2,553 (92.3%) | 214 (7.7%) |
| 26 to 34 Years | 1,616 (82.8%) | 336 (17.2%) |
| 35 to 44 Years | 2,072 (94.1%) | 131 (5.9%) |
| 45 to 54 Years | 1,581 (92.4%) | 130 (7.6%) |
| 55 to 64 Years | 2,224 (95.7%) | 99 (4.3%) |
| 65 to 74 Years | 1,724 (98.7%) | 23 (1.3%) |
| 75 Years and older | 1,242 (100.0%) | 0 (0.0%) |
| Total | 17,096 (94.5%) | 1,004 (5.6%) |
Health Insurance Coverage by Citizenship Status in Berea
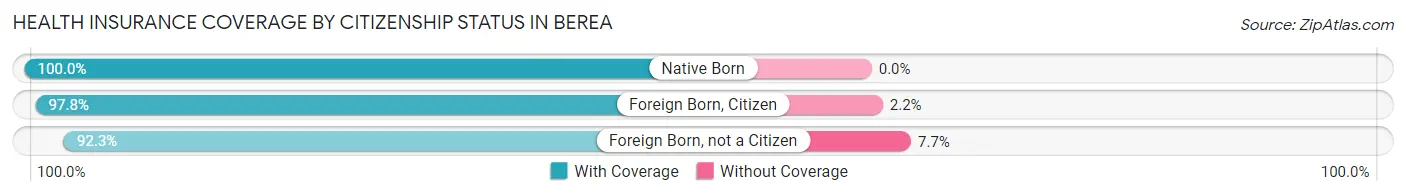
| Citizenship Status | With Coverage | Without Coverage |
| Native Born | 896 (100.0%) | 0 (0.0%) |
| Foreign Born, Citizen | 3,188 (97.8%) | 71 (2.2%) |
| Foreign Born, not a Citizen | 2,553 (92.3%) | 214 (7.7%) |
Health Insurance Coverage by Household Income in Berea
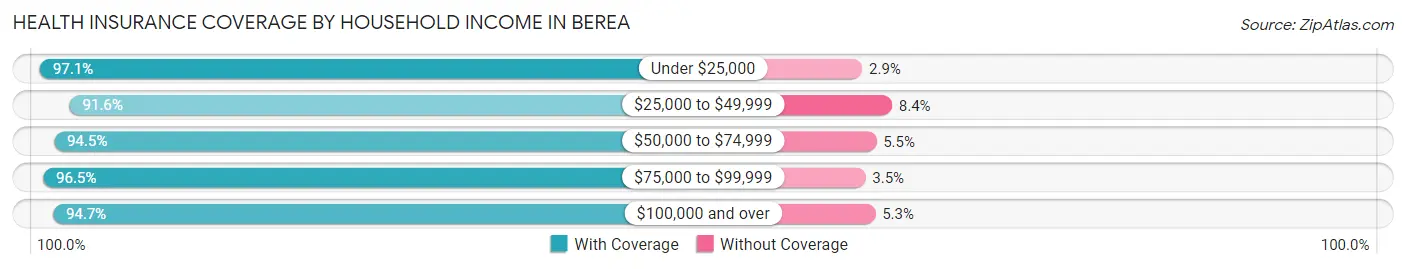
| Household Income | With Coverage | Without Coverage |
| Under $25,000 | 1,319 (97.1%) | 39 (2.9%) |
| $25,000 to $49,999 | 2,767 (91.6%) | 255 (8.4%) |
| $50,000 to $74,999 | 2,435 (94.5%) | 142 (5.5%) |
| $75,000 to $99,999 | 2,672 (96.5%) | 96 (3.5%) |
| $100,000 and over | 6,320 (94.7%) | 355 (5.3%) |
Public vs Private Health Insurance Coverage by Age in Berea
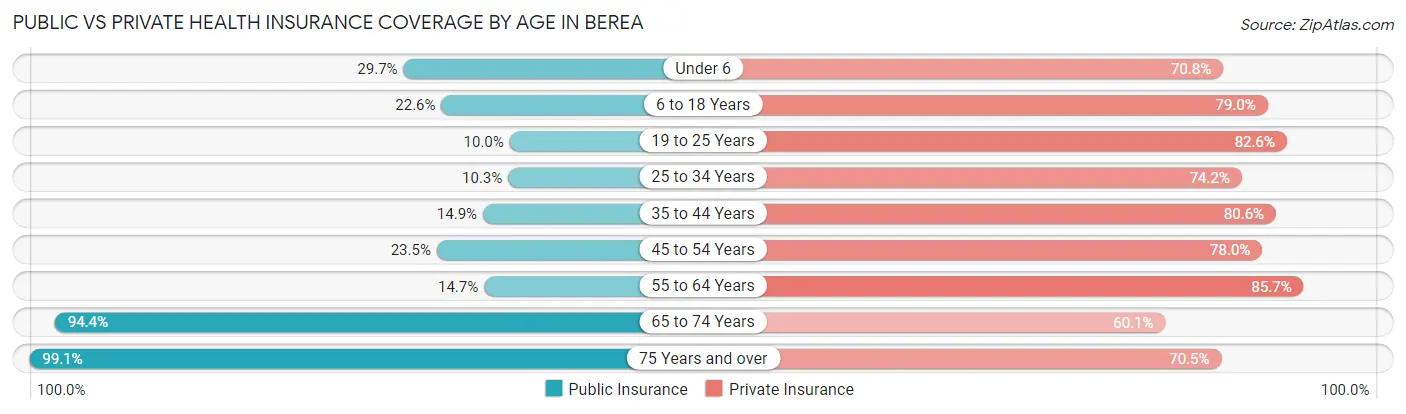
| Age Bracket | Public Insurance | Private Insurance |
| Under 6 | 266 (29.7%) | 634 (70.8%) |
| 6 to 18 Years | 738 (22.6%) | 2,576 (79.0%) |
| 19 to 25 Years | 276 (10.0%) | 2,285 (82.6%) |
| 25 to 34 Years | 200 (10.2%) | 1,449 (74.2%) |
| 35 to 44 Years | 329 (14.9%) | 1,775 (80.6%) |
| 45 to 54 Years | 402 (23.5%) | 1,335 (78.0%) |
| 55 to 64 Years | 342 (14.7%) | 1,991 (85.7%) |
| 65 to 74 Years | 1,649 (94.4%) | 1,049 (60.1%) |
| 75 Years and over | 1,231 (99.1%) | 875 (70.5%) |
| Total | 5,433 (30.0%) | 13,969 (77.2%) |
Disability Status by Sex by Age in Berea
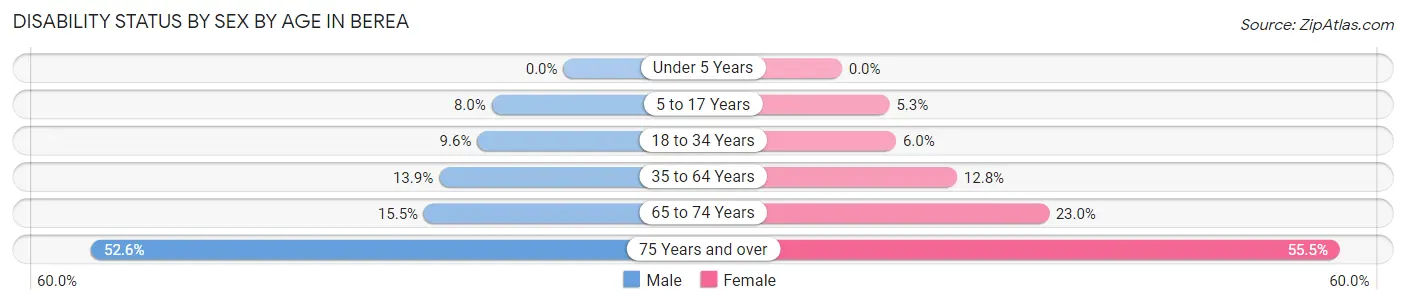
| Age Bracket | Male | Female |
| Under 5 Years | 0 (0.0%) | 0 (0.0%) |
| 5 to 17 Years | 88 (8.0%) | 85 (5.3%) |
| 18 to 34 Years | 239 (9.6%) | 178 (6.0%) |
| 35 to 64 Years | 421 (13.9%) | 410 (12.8%) |
| 65 to 74 Years | 127 (15.5%) | 214 (23.0%) |
| 75 Years and over | 253 (52.6%) | 422 (55.4%) |
Disability Class by Sex by Age in Berea
Disability Class: Hearing Difficulty
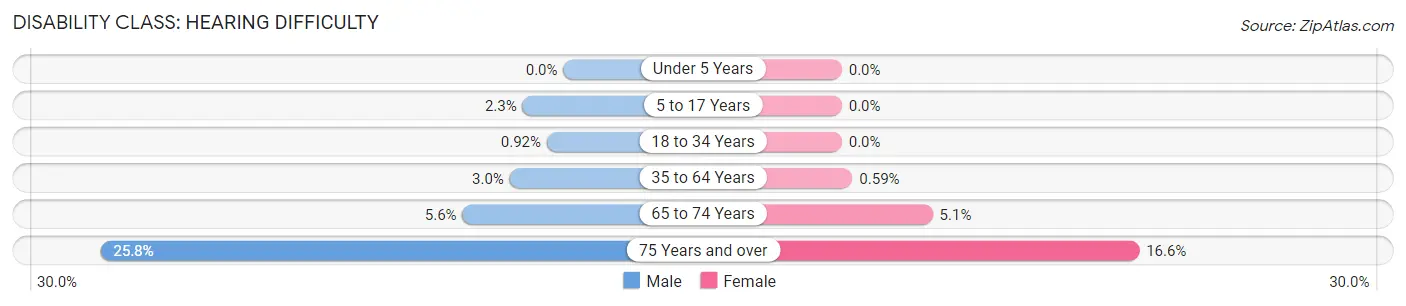
| Age Bracket | Male | Female |
| Under 5 Years | 0 (0.0%) | 0 (0.0%) |
| 5 to 17 Years | 25 (2.3%) | 0 (0.0%) |
| 18 to 34 Years | 23 (0.9%) | 0 (0.0%) |
| 35 to 64 Years | 91 (3.0%) | 19 (0.6%) |
| 65 to 74 Years | 46 (5.6%) | 47 (5.1%) |
| 75 Years and over | 124 (25.8%) | 126 (16.6%) |
Disability Class: Vision Difficulty
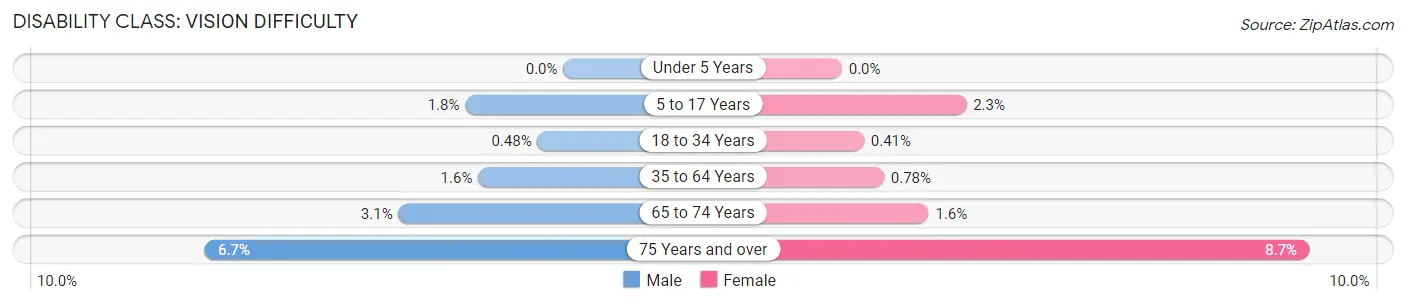
| Age Bracket | Male | Female |
| Under 5 Years | 0 (0.0%) | 0 (0.0%) |
| 5 to 17 Years | 20 (1.8%) | 37 (2.3%) |
| 18 to 34 Years | 12 (0.5%) | 12 (0.4%) |
| 35 to 64 Years | 48 (1.6%) | 25 (0.8%) |
| 65 to 74 Years | 25 (3.1%) | 15 (1.6%) |
| 75 Years and over | 32 (6.7%) | 66 (8.7%) |
Disability Class: Cognitive Difficulty
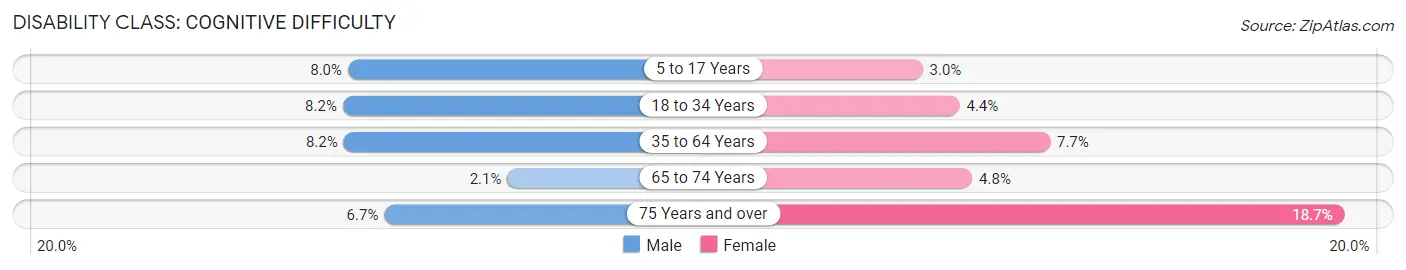
| Age Bracket | Male | Female |
| 5 to 17 Years | 88 (8.0%) | 48 (3.0%) |
| 18 to 34 Years | 204 (8.2%) | 129 (4.4%) |
| 35 to 64 Years | 248 (8.2%) | 247 (7.7%) |
| 65 to 74 Years | 17 (2.1%) | 45 (4.8%) |
| 75 Years and over | 32 (6.7%) | 142 (18.7%) |
Disability Class: Ambulatory Difficulty
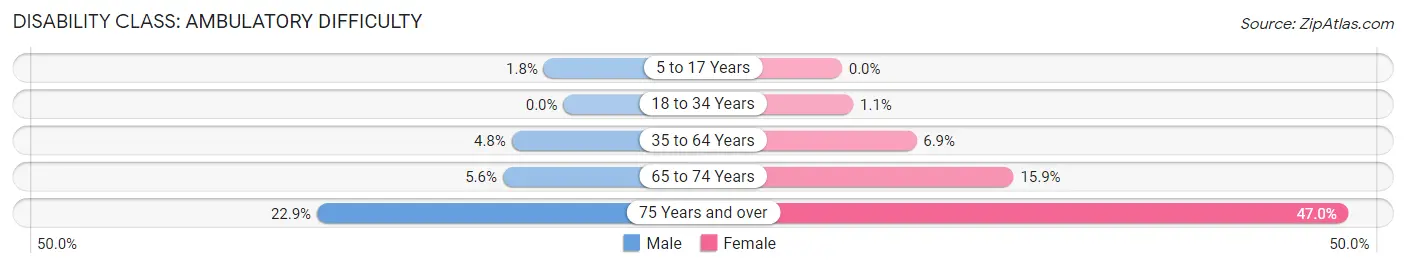
| Age Bracket | Male | Female |
| 5 to 17 Years | 20 (1.8%) | 0 (0.0%) |
| 18 to 34 Years | 0 (0.0%) | 31 (1.1%) |
| 35 to 64 Years | 146 (4.8%) | 221 (6.9%) |
| 65 to 74 Years | 46 (5.6%) | 148 (15.9%) |
| 75 Years and over | 110 (22.9%) | 358 (47.0%) |
Disability Class: Self-Care Difficulty
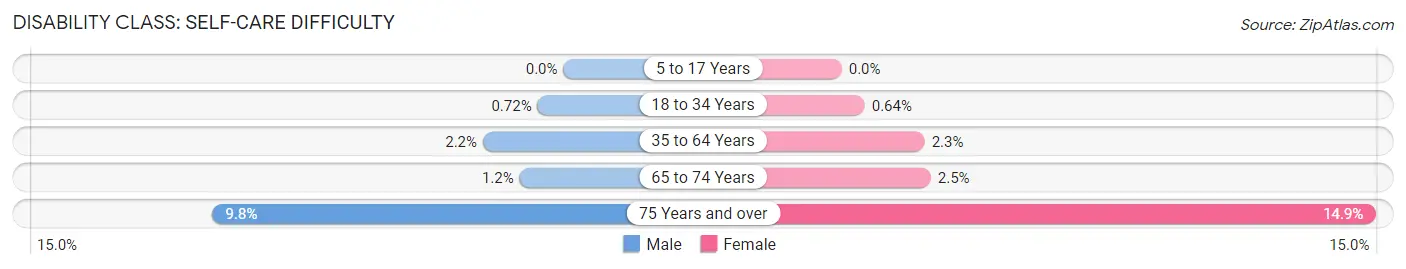
| Age Bracket | Male | Female |
| 5 to 17 Years | 0 (0.0%) | 0 (0.0%) |
| 18 to 34 Years | 18 (0.7%) | 19 (0.6%) |
| 35 to 64 Years | 68 (2.2%) | 74 (2.3%) |
| 65 to 74 Years | 10 (1.2%) | 23 (2.5%) |
| 75 Years and over | 47 (9.8%) | 113 (14.8%) |
Technology Access in Berea
Computing Device Access in Berea
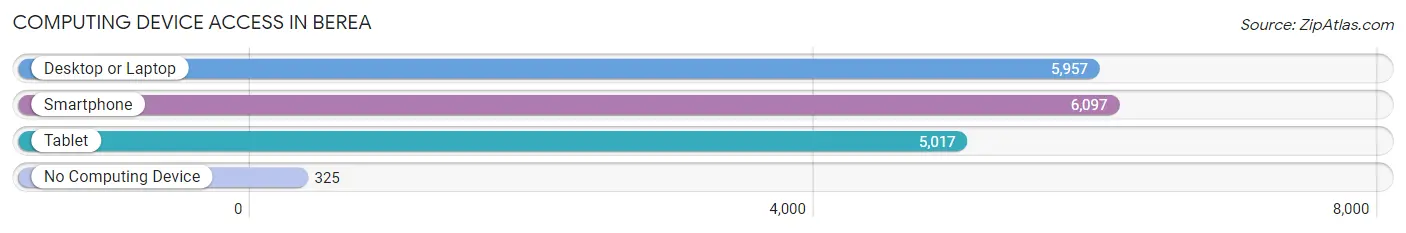
| Device Type | # Households | % Households |
| Desktop or Laptop | 5,957 | 83.7% |
| Smartphone | 6,097 | 85.7% |
| Tablet | 5,017 | 70.5% |
| No Computing Device | 325 | 4.6% |
| Total | 7,115 | 100.0% |
Internet Access in Berea
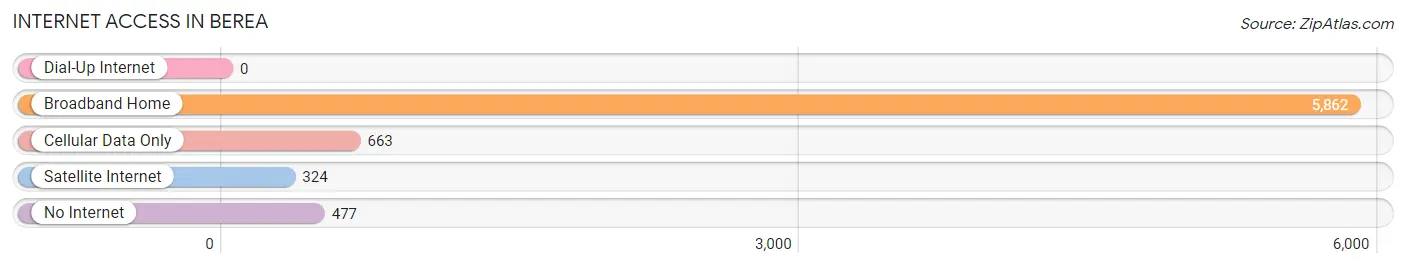
| Internet Type | # Households | % Households |
| Dial-Up Internet | 0 | 0.0% |
| Broadband Home | 5,862 | 82.4% |
| Cellular Data Only | 663 | 9.3% |
| Satellite Internet | 324 | 4.5% |
| No Internet | 477 | 6.7% |
| Total | 7,115 | 100.0% |
Berea Summary
Berea, Ohio is a city located in Cuyahoga County, Ohio, United States. It is situated on the eastern edge of Cleveland, Ohio, and is part of the Greater Cleveland metropolitan area. The population of Berea was 19,093 at the 2010 census.
History
Berea was founded in 1836 by a group of settlers from Connecticut, led by Rev. John Baldwin. The settlers named the town after the biblical Berea, which was a city in ancient Macedonia. The settlers were attracted to the area by the abundance of natural resources, including the Rocky River, which provided a source of water power for mills.
The first industry in Berea was a grist mill, which was built in 1837. This was followed by a sawmill, a tannery, and a woolen mill. The town grew rapidly, and by 1845, it had a population of over 1,000.
In 1852, Berea was incorporated as a village. The village was divided into four wards, and a mayor and council were elected. The first mayor was John Baldwin, the founder of the town.
In 1868, Berea was incorporated as a city. The city was divided into six wards, and a mayor and council were elected. The first mayor was William H. Baldwin, the son of John Baldwin.
Geography
Berea is located at 41°22′N 81°48′W (41.3667, -81.8000). According to the United States Census Bureau, the city has a total area of 5.90 square miles (15.27 km2), of which 5.89 square miles (15.24 km2) is land and 0.01 square miles (0.03 km2) is water.
The city is located on the eastern edge of Cleveland, Ohio, and is part of the Greater Cleveland metropolitan area. The Rocky River runs through the city, providing a source of water power for mills.
Economy
Berea is home to a variety of businesses and industries. The city is home to Baldwin-Wallace University, a private liberal arts college. The university is the largest employer in the city, with over 1,000 employees.
The city is also home to several manufacturing companies, including the Berea Hardwood Company, which produces hardwood flooring, and the Berea Manufacturing Company, which produces automotive parts.
The city is also home to several retail businesses, including the Berea Mall, which is the largest shopping center in the city.
Demographics
As of the 2010 census, there were 19,093 people, 7,845 households, and 4,845 families residing in the city. The population density was 3,241.3 people per square mile (1,250.2/km2). There were 8,541 housing units at an average density of 1,450.2 per square mile (561.2/km2). The racial makeup of the city was 87.2% White, 8.3% African American, 0.2% Native American, 1.2% Asian, 0.1% Pacific Islander, 0.7% from other races, and 2.3% from two or more races. Hispanic or Latino of any race were 2.7% of the population.
There were 7,845 households, out of which 24.2% had children under the age of 18 living with them, 43.2% were married couples living together, 11.7% had a female householder with no husband present, and 40.7% were non-families. 33.2% of all households were made up of individuals, and 11.7% had someone living alone who was 65 years of age or older. The average household size was 2.30 and the average family size was 2.94.
In the city, the population was spread out, with 20.2% under the age of 18, 16.2% from 18 to 24, 25.2% from 25 to 44, 22.2% from 45 to 64, and 16.2% who were 65 years of age or older. The median age was 36 years. For every 100 females, there were 91.2 males. For every 100 females age 18 and over, there were 88.2 males.
The median income for a household in the city was $41,945, and the median income for a family was $54,945. Males had a median income of $41,945 versus $30,945 for females. The per capita income for the city was $21,945. About 6.2% of families and 9.2% of the population were below the poverty line, including 11.2% of those under age 18 and 8.2% of those age 65 or over.
Common Questions
What is Per Capita Income in Berea?
Per Capita income in Berea is $34,406.
What is the Median Family Income in Berea?
Median Family Income in Berea is $93,135.
What is the Median Household income in Berea?
Median Household Income in Berea is $67,493.
What is Income or Wage Gap in Berea?
Income or Wage Gap in Berea is 34.7%.
Women in Berea earn 65.3 cents for every dollar earned by a man.
What is Inequality or Gini Index in Berea?
Inequality or Gini Index in Berea is 0.39.
What is the Total Population of Berea?
Total Population of Berea is 18,550.
What is the Total Male Population of Berea?
Total Male Population of Berea is 8,630.
What is the Total Female Population of Berea?
Total Female Population of Berea is 9,920.
What is the Ratio of Males per 100 Females in Berea?
There are 87.00 Males per 100 Females in Berea.
What is the Ratio of Females per 100 Males in Berea?
There are 114.95 Females per 100 Males in Berea.
What is the Median Population Age in Berea?
Median Population Age in Berea is 36.4 Years.
What is the Average Family Size in Berea
Average Family Size in Berea is 3.1 People.
What is the Average Household Size in Berea
Average Household Size in Berea is 2.3 People.
How Large is the Labor Force in Berea?
There are 9,590 People in the Labor Forcein in Berea.
What is the Percentage of People in the Labor Force in Berea?
61.7% of People are in the Labor Force in Berea.
What is the Unemployment Rate in Berea?
Unemployment Rate in Berea is 4.8%.