Camp Dennison, OH Map & Demographics
Camp Dennison Map
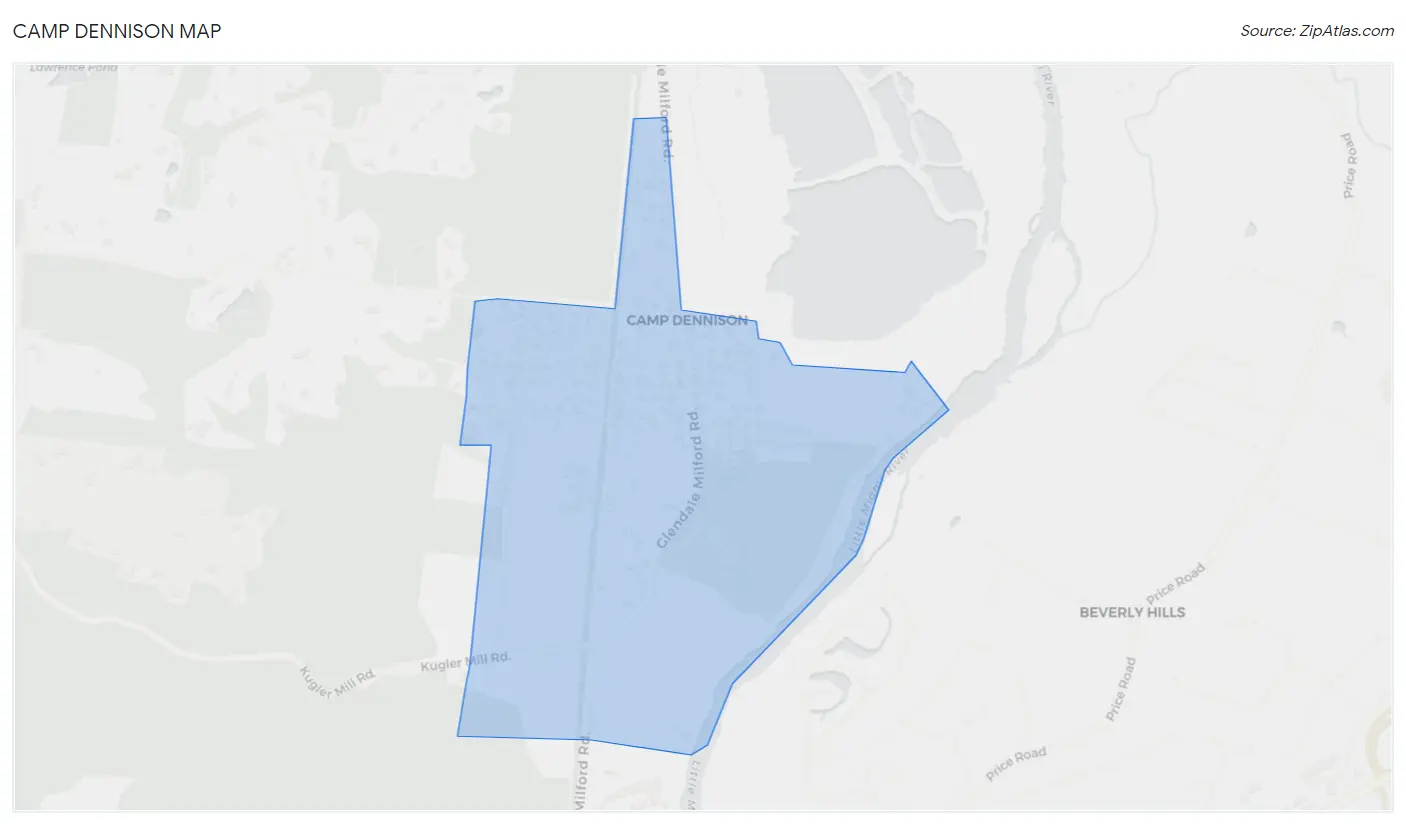
Camp Dennison Overview
$37,838
PER CAPITA INCOME
$92,000
AVG FAMILY INCOME
$88,393
AVG HOUSEHOLD INCOME
28.1%
WAGE / INCOME GAP [ % ]
71.9¢/ $1
WAGE / INCOME GAP [ $ ]
0.37
INEQUALITY / GINI INDEX
363
TOTAL POPULATION
166
MALE POPULATION
197
FEMALE POPULATION
84.26
MALES / 100 FEMALES
118.67
FEMALES / 100 MALES
57.0
MEDIAN AGE
2.7
AVG FAMILY SIZE
2.3
AVG HOUSEHOLD SIZE
181
LABOR FORCE [ PEOPLE ]
55.7%
PERCENT IN LABOR FORCE
Camp Dennison Zip Codes
Camp Dennison Area Codes
Income in Camp Dennison
Income Overview in Camp Dennison
Per Capita Income in Camp Dennison is $37,838, while median incomes of families and households are $92,000 and $88,393 respectively.
| Characteristic | Number | Measure |
| Per Capita Income | 363 | $37,838 |
| Median Family Income | 106 | $92,000 |
| Mean Family Income | 106 | $98,376 |
| Median Household Income | 156 | $88,393 |
| Mean Household Income | 156 | $84,020 |
| Income Deficit | 106 | $0 |
| Wage / Income Gap (%) | 363 | 28.11% |
| Wage / Income Gap ($) | 363 | 71.89¢ per $1 |
| Gini / Inequality Index | 363 | 0.37 |
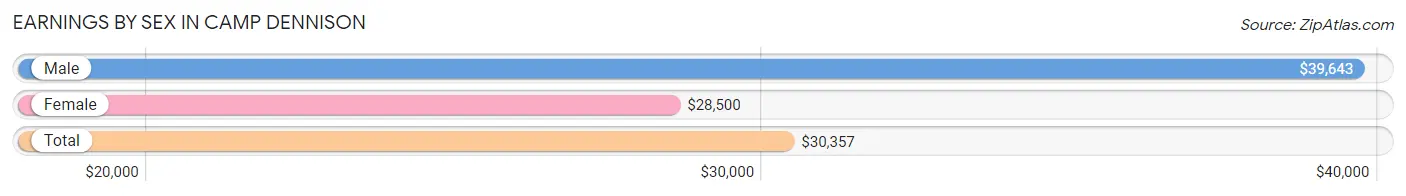
Earnings by Sex in Camp Dennison
Average Earnings in Camp Dennison are $30,357, $39,643 for men and $28,500 for women, a difference of 28.1%.
| Sex | Number | Average Earnings |
| Male | 90 (42.9%) | $39,643 |
| Female | 120 (57.1%) | $28,500 |
| Total | 210 (100.0%) | $30,357 |
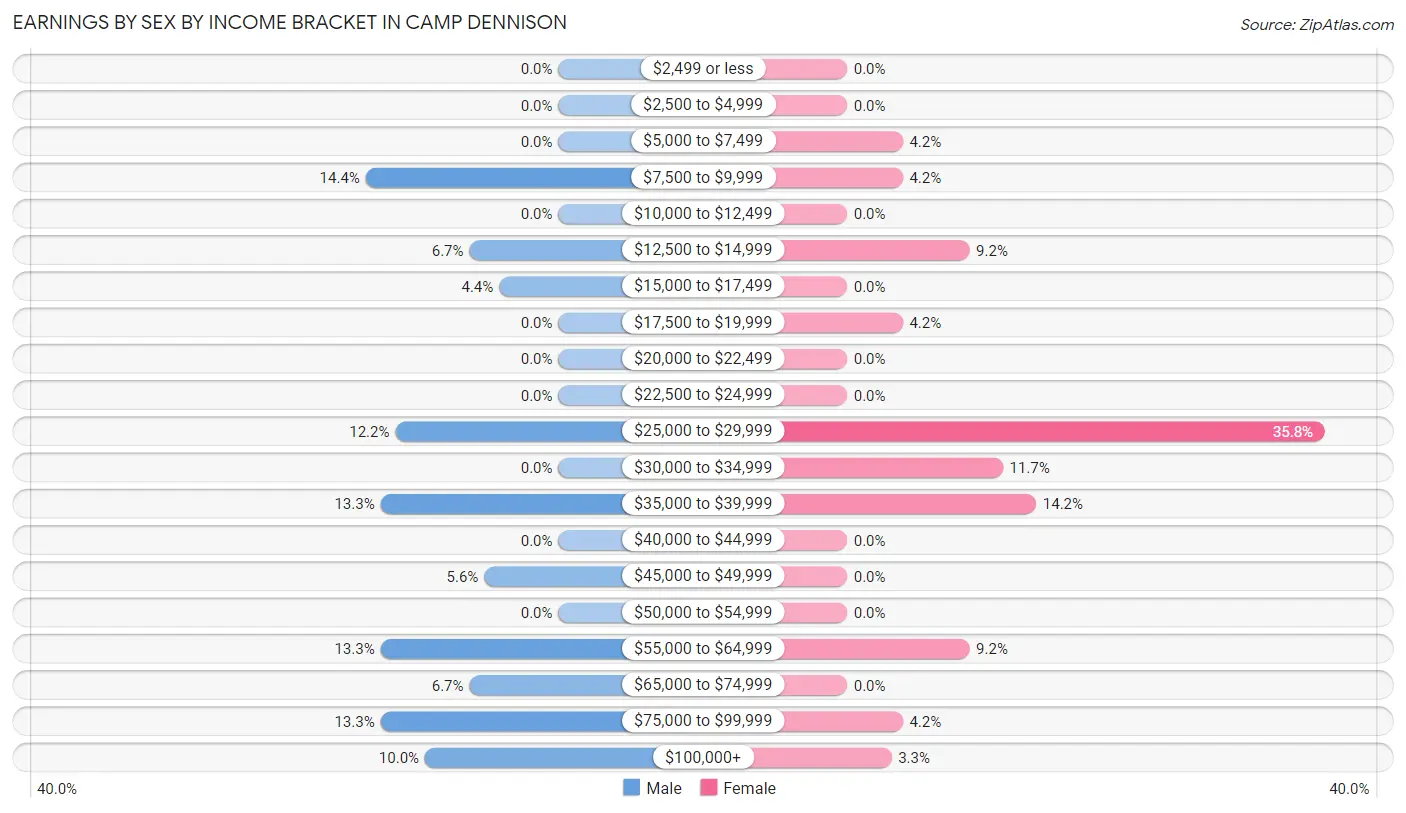
Earnings by Sex by Income Bracket in Camp Dennison
The most common earnings brackets in Camp Dennison are $7,500 to $9,999 for men (13 | 14.4%) and $25,000 to $29,999 for women (43 | 35.8%).
| Income | Male | Female |
| $2,499 or less | 0 (0.0%) | 0 (0.0%) |
| $2,500 to $4,999 | 0 (0.0%) | 0 (0.0%) |
| $5,000 to $7,499 | 0 (0.0%) | 5 (4.2%) |
| $7,500 to $9,999 | 13 (14.4%) | 5 (4.2%) |
| $10,000 to $12,499 | 0 (0.0%) | 0 (0.0%) |
| $12,500 to $14,999 | 6 (6.7%) | 11 (9.2%) |
| $15,000 to $17,499 | 4 (4.4%) | 0 (0.0%) |
| $17,500 to $19,999 | 0 (0.0%) | 5 (4.2%) |
| $20,000 to $22,499 | 0 (0.0%) | 0 (0.0%) |
| $22,500 to $24,999 | 0 (0.0%) | 0 (0.0%) |
| $25,000 to $29,999 | 11 (12.2%) | 43 (35.8%) |
| $30,000 to $34,999 | 0 (0.0%) | 14 (11.7%) |
| $35,000 to $39,999 | 12 (13.3%) | 17 (14.2%) |
| $40,000 to $44,999 | 0 (0.0%) | 0 (0.0%) |
| $45,000 to $49,999 | 5 (5.6%) | 0 (0.0%) |
| $50,000 to $54,999 | 0 (0.0%) | 0 (0.0%) |
| $55,000 to $64,999 | 12 (13.3%) | 11 (9.2%) |
| $65,000 to $74,999 | 6 (6.7%) | 0 (0.0%) |
| $75,000 to $99,999 | 12 (13.3%) | 5 (4.2%) |
| $100,000+ | 9 (10.0%) | 4 (3.3%) |
| Total | 90 (100.0%) | 120 (100.0%) |
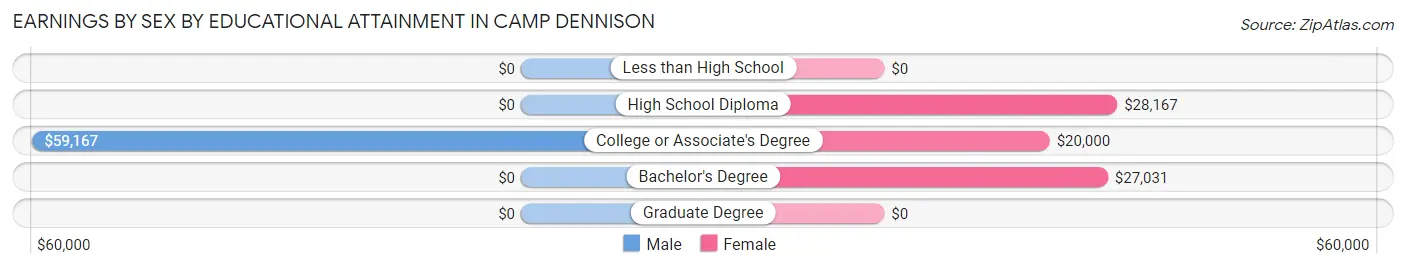
Earnings by Sex by Educational Attainment in Camp Dennison
Average earnings in Camp Dennison are $45,750 for men and $28,500 for women, a difference of 37.7%. Men with an educational attainment of college or associate's degree enjoy the highest average annual earnings of $59,167, while those with college or associate's degree education earn the least with $59,167. Women with an educational attainment of high school diploma earn the most with the average annual earnings of $28,167, while those with college or associate's degree education have the smallest earnings of $20,000.
| Educational Attainment | Male Income | Female Income |
| Less than High School | - | - |
| High School Diploma | - | - |
| College or Associate's Degree | $59,167 | $20,000 |
| Bachelor's Degree | - | - |
| Graduate Degree | - | - |
| Total | $45,750 | $28,500 |
Family Income in Camp Dennison
Family Income Brackets in Camp Dennison
According to the Camp Dennison family income data, there are 43 families falling into the $75,000 to $99,999 income range, which is the most common income bracket and makes up 40.6% of all families.
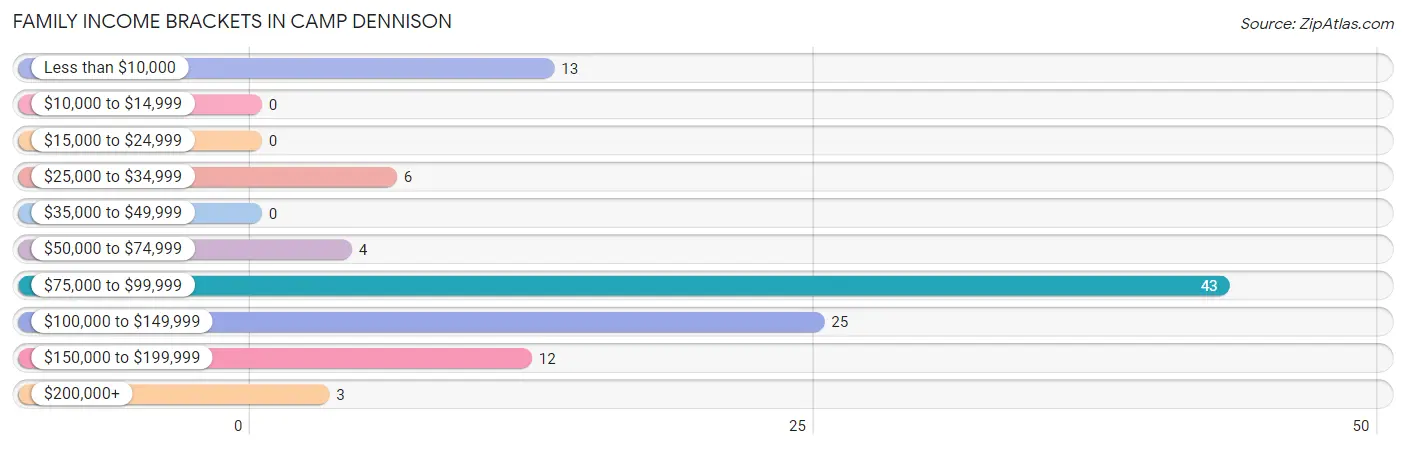
| Income Bracket | # Families | % Families |
| Less than $10,000 | 13 | 12.3% |
| $10,000 to $14,999 | 0 | 0.0% |
| $15,000 to $24,999 | 0 | 0.0% |
| $25,000 to $34,999 | 6 | 5.7% |
| $35,000 to $49,999 | 0 | 0.0% |
| $50,000 to $74,999 | 4 | 3.8% |
| $75,000 to $99,999 | 43 | 40.6% |
| $100,000 to $149,999 | 25 | 23.6% |
| $150,000 to $199,999 | 12 | 11.3% |
| $200,000+ | 3 | 2.8% |
Family Income by Famaliy Size in Camp Dennison
3-person families (46 | 43.4%) account for the highest median family income in Camp Dennison with $98,500 per family, while 2-person families (50 | 47.2%) have the highest median income of $38,750 per family member.
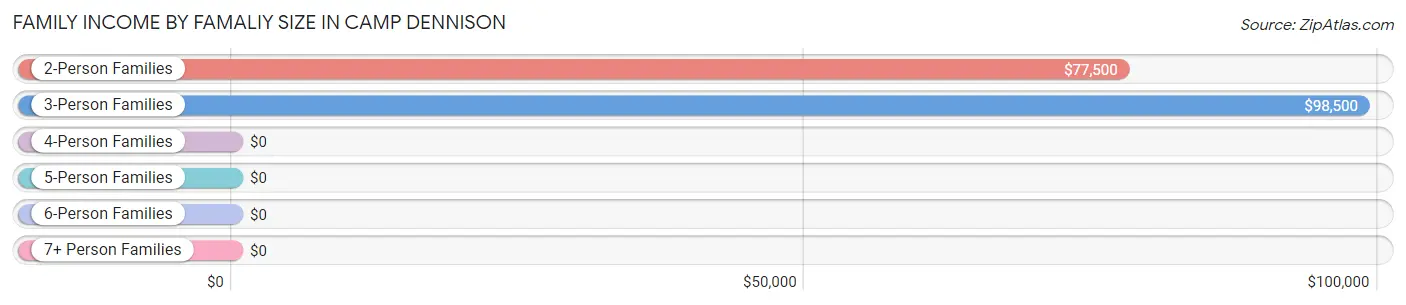
| Income Bracket | # Families | Median Income |
| 2-Person Families | 50 (47.2%) | $77,500 |
| 3-Person Families | 46 (43.4%) | $98,500 |
| 4-Person Families | 6 (5.7%) | $0 |
| 5-Person Families | 4 (3.8%) | $0 |
| 6-Person Families | 0 (0.0%) | $0 |
| 7+ Person Families | 0 (0.0%) | $0 |
| Total | 106 (100.0%) | $92,000 |
Family Income by Number of Earners in Camp Dennison
| Number of Earners | # Families | Median Income |
| No Earners | 28 (26.4%) | $0 |
| 1 Earner | 6 (5.7%) | $0 |
| 2 Earners | 51 (48.1%) | $0 |
| 3+ Earners | 21 (19.8%) | $0 |
| Total | 106 (100.0%) | $92,000 |
Household Income in Camp Dennison
Household Income Brackets in Camp Dennison
With 55 households falling in the category, the $75,000 to $99,999 income range is the most frequent in Camp Dennison, accounting for 35.3% of all households.
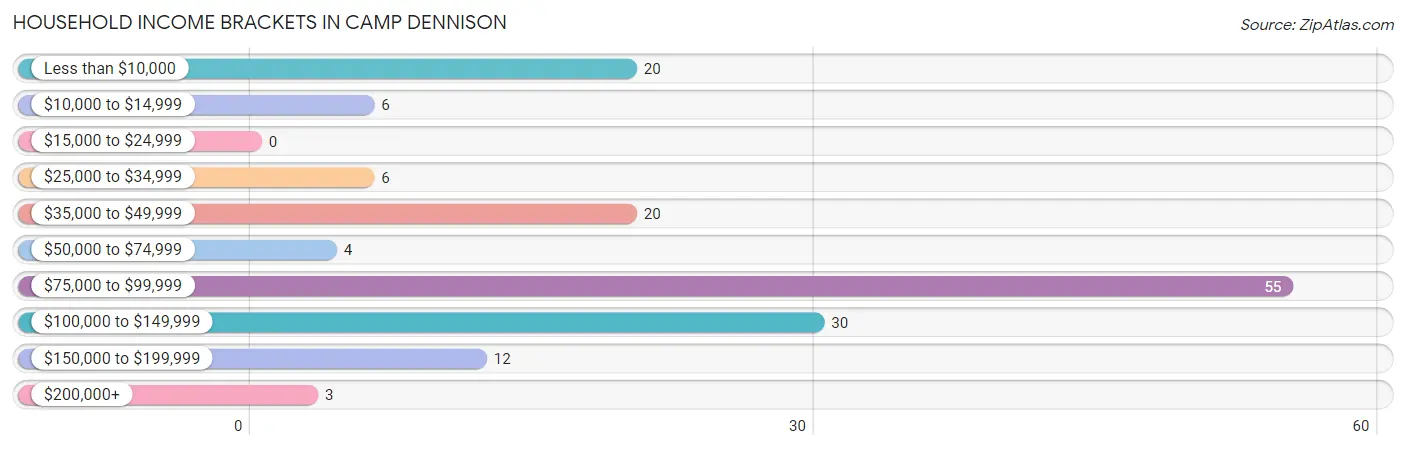
| Income Bracket | # Households | % Households |
| Less than $10,000 | 20 | 12.8% |
| $10,000 to $14,999 | 6 | 3.8% |
| $15,000 to $24,999 | 0 | 0.0% |
| $25,000 to $34,999 | 6 | 3.8% |
| $35,000 to $49,999 | 20 | 12.8% |
| $50,000 to $74,999 | 4 | 2.6% |
| $75,000 to $99,999 | 55 | 35.3% |
| $100,000 to $149,999 | 30 | 19.2% |
| $150,000 to $199,999 | 12 | 7.7% |
| $200,000+ | 3 | 1.9% |
Household Income by Householder Age in Camp Dennison
The median household income in Camp Dennison is $88,393, with the highest median household income of $160,208 found in the 25 to 44 years age bracket for the primary householder. A total of 23 households (14.7%) fall into this category.
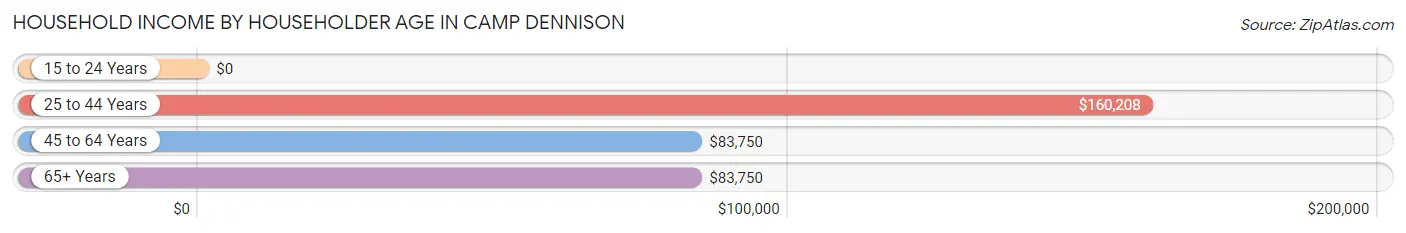
| Income Bracket | # Households | Median Income |
| 15 to 24 Years | 0 (0.0%) | $0 |
| 25 to 44 Years | 23 (14.7%) | $160,208 |
| 45 to 64 Years | 64 (41.0%) | $83,750 |
| 65+ Years | 69 (44.2%) | $83,750 |
| Total | 156 (100.0%) | $88,393 |
Poverty in Camp Dennison
Income Below Poverty by Sex and Age in Camp Dennison
With 15.7% poverty level for males and 7.1% for females among the residents of Camp Dennison, 75 year old and over males and 65 to 74 year old females are the most vulnerable to poverty, with 13 males (72.2%) and 14 females (28.6%) in their respective age groups living below the poverty level.
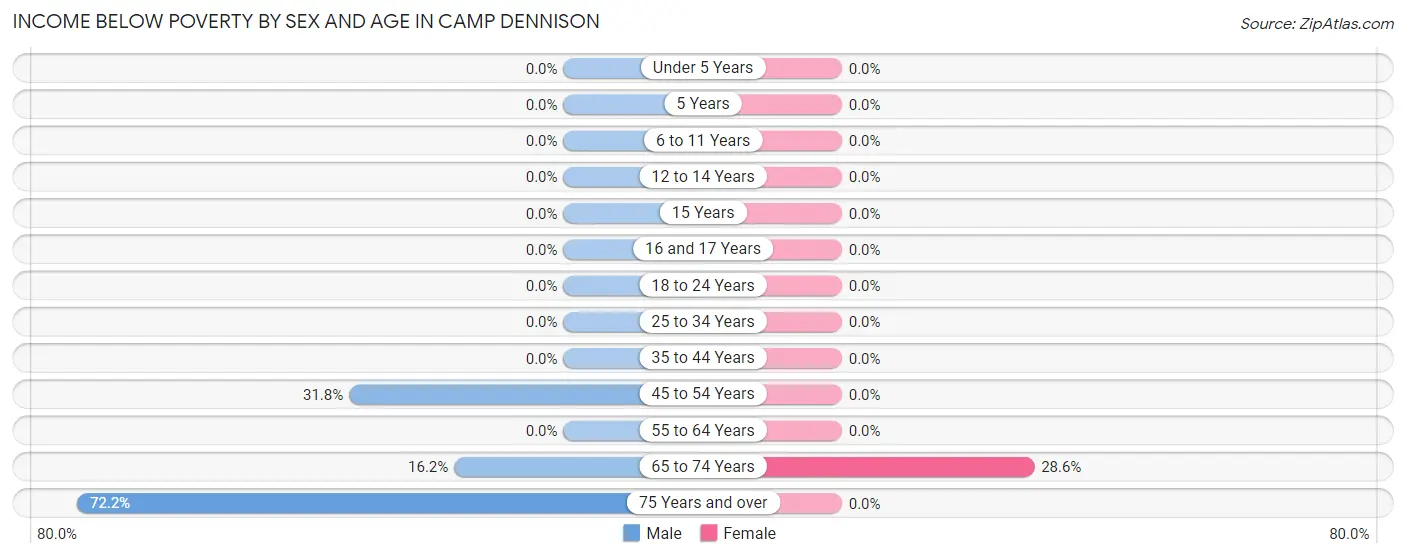
| Age Bracket | Male | Female |
| Under 5 Years | 0 (0.0%) | 0 (0.0%) |
| 5 Years | 0 (0.0%) | 0 (0.0%) |
| 6 to 11 Years | 0 (0.0%) | 0 (0.0%) |
| 12 to 14 Years | 0 (0.0%) | 0 (0.0%) |
| 15 Years | 0 (0.0%) | 0 (0.0%) |
| 16 and 17 Years | 0 (0.0%) | 0 (0.0%) |
| 18 to 24 Years | 0 (0.0%) | 0 (0.0%) |
| 25 to 34 Years | 0 (0.0%) | 0 (0.0%) |
| 35 to 44 Years | 0 (0.0%) | 0 (0.0%) |
| 45 to 54 Years | 7 (31.8%) | 0 (0.0%) |
| 55 to 64 Years | 0 (0.0%) | 0 (0.0%) |
| 65 to 74 Years | 6 (16.2%) | 14 (28.6%) |
| 75 Years and over | 13 (72.2%) | 0 (0.0%) |
| Total | 26 (15.7%) | 14 (7.1%) |
Income Above Poverty by Sex and Age in Camp Dennison
According to the poverty statistics in Camp Dennison, males aged under 5 years and females aged 5 years are the age groups that are most secure financially, with 100.0% of males and 100.0% of females in these age groups living above the poverty line.
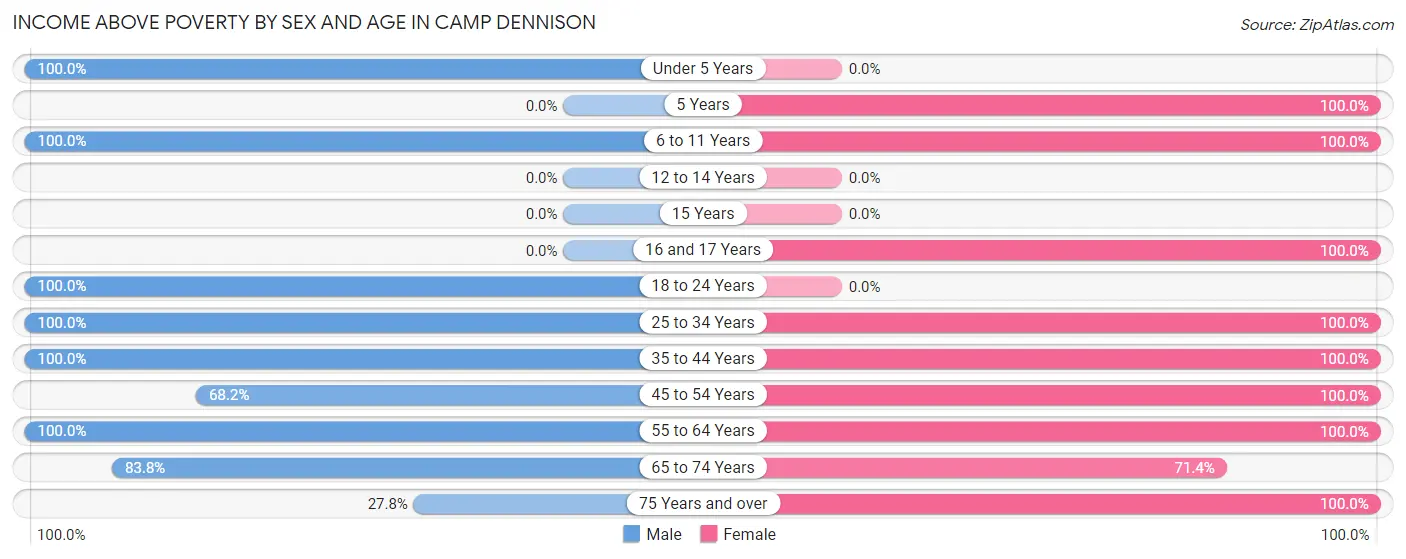
| Age Bracket | Male | Female |
| Under 5 Years | 12 (100.0%) | 0 (0.0%) |
| 5 Years | 0 (0.0%) | 5 (100.0%) |
| 6 to 11 Years | 15 (100.0%) | 6 (100.0%) |
| 12 to 14 Years | 0 (0.0%) | 0 (0.0%) |
| 15 Years | 0 (0.0%) | 0 (0.0%) |
| 16 and 17 Years | 0 (0.0%) | 3 (100.0%) |
| 18 to 24 Years | 5 (100.0%) | 0 (0.0%) |
| 25 to 34 Years | 17 (100.0%) | 48 (100.0%) |
| 35 to 44 Years | 10 (100.0%) | 12 (100.0%) |
| 45 to 54 Years | 15 (68.2%) | 26 (100.0%) |
| 55 to 64 Years | 30 (100.0%) | 35 (100.0%) |
| 65 to 74 Years | 31 (83.8%) | 35 (71.4%) |
| 75 Years and over | 5 (27.8%) | 13 (100.0%) |
| Total | 140 (84.3%) | 183 (92.9%) |
Income Below Poverty Among Married-Couple Families in Camp Dennison
The poverty statistics for married-couple families in Camp Dennison show that 16.1% or 13 of the total 81 families live below the poverty line. Families with no children have the highest poverty rate of 21.0%, comprising of 13 families. On the other hand, families with 1 or 2 children have the lowest poverty rate of 0.0%, which includes 0 families.
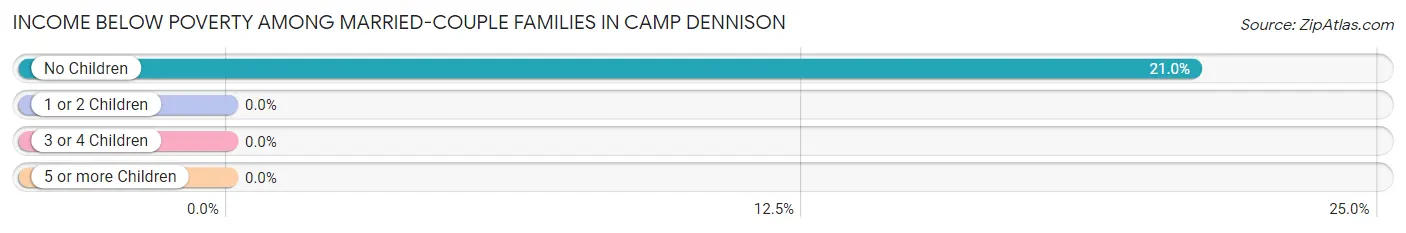
| Children | Above Poverty | Below Poverty |
| No Children | 49 (79.0%) | 13 (21.0%) |
| 1 or 2 Children | 15 (100.0%) | 0 (0.0%) |
| 3 or 4 Children | 4 (100.0%) | 0 (0.0%) |
| 5 or more Children | 0 (0.0%) | 0 (0.0%) |
| Total | 68 (84.0%) | 13 (16.1%) |
Income Below Poverty Among Single-Parent Households in Camp Dennison
| Children | Single Father | Single Mother |
| No Children | 0 (0.0%) | 0 (0.0%) |
| 1 or 2 Children | 0 (0.0%) | 0 (0.0%) |
| 3 or 4 Children | 0 (0.0%) | 0 (0.0%) |
| 5 or more Children | 0 (0.0%) | 0 (0.0%) |
| Total | 0 (0.0%) | 0 (0.0%) |
Income Below Poverty Among Married-Couple vs Single-Parent Households in Camp Dennison
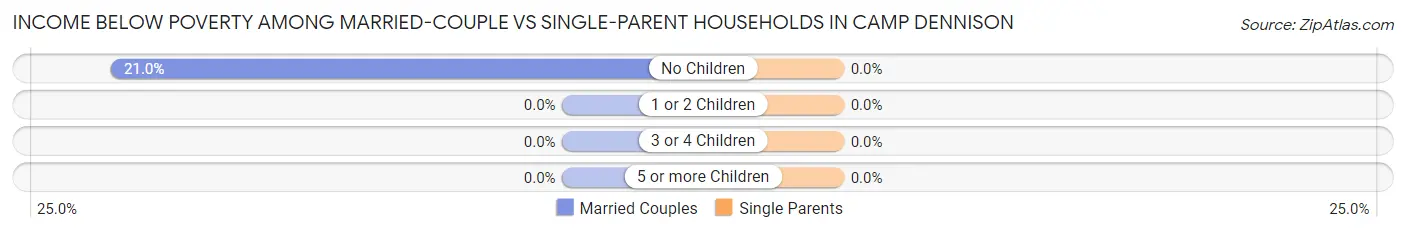
| Children | Married-Couple Families | Single-Parent Households |
| No Children | 13 (21.0%) | 0 (0.0%) |
| 1 or 2 Children | 0 (0.0%) | 0 (0.0%) |
| 3 or 4 Children | 0 (0.0%) | 0 (0.0%) |
| 5 or more Children | 0 (0.0%) | 0 (0.0%) |
| Total | 13 (16.1%) | 0 (0.0%) |
Race in Camp Dennison
The most populous races in Camp Dennison are White / Caucasian (287 | 79.1%), Black / African American (59 | 16.3%), and Hispanic or Latino (17 | 4.7%).
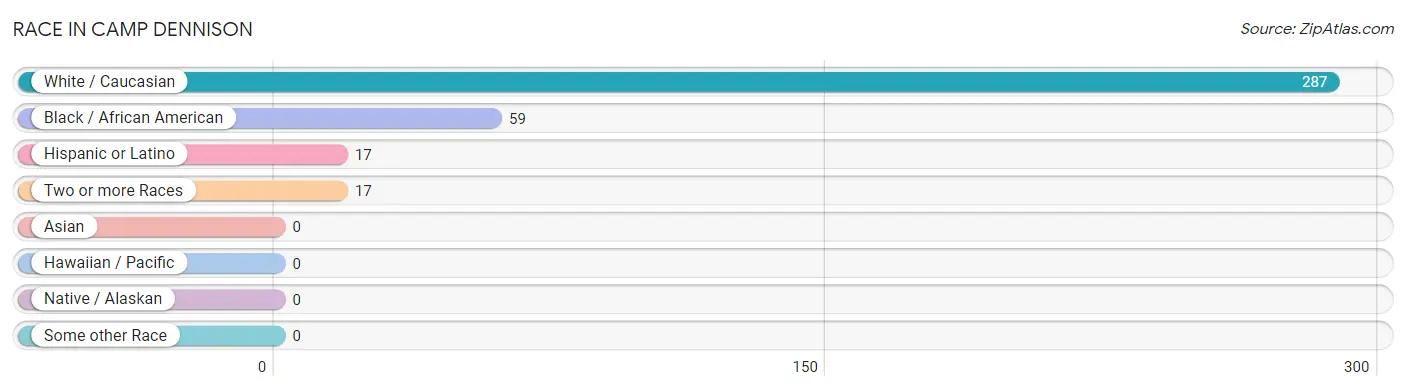
| Race | # Population | % Population |
| Asian | 0 | 0.0% |
| Black / African American | 59 | 16.3% |
| Hawaiian / Pacific | 0 | 0.0% |
| Hispanic or Latino | 17 | 4.7% |
| Native / Alaskan | 0 | 0.0% |
| White / Caucasian | 287 | 79.1% |
| Two or more Races | 17 | 4.7% |
| Some other Race | 0 | 0.0% |
| Total | 363 | 100.0% |
Ancestry in Camp Dennison
The most populous ancestries reported in Camp Dennison are German (67 | 18.5%), Irish (46 | 12.7%), English (45 | 12.4%), American (42 | 11.6%), and Italian (35 | 9.6%), together accounting for 64.7% of all Camp Dennison residents.
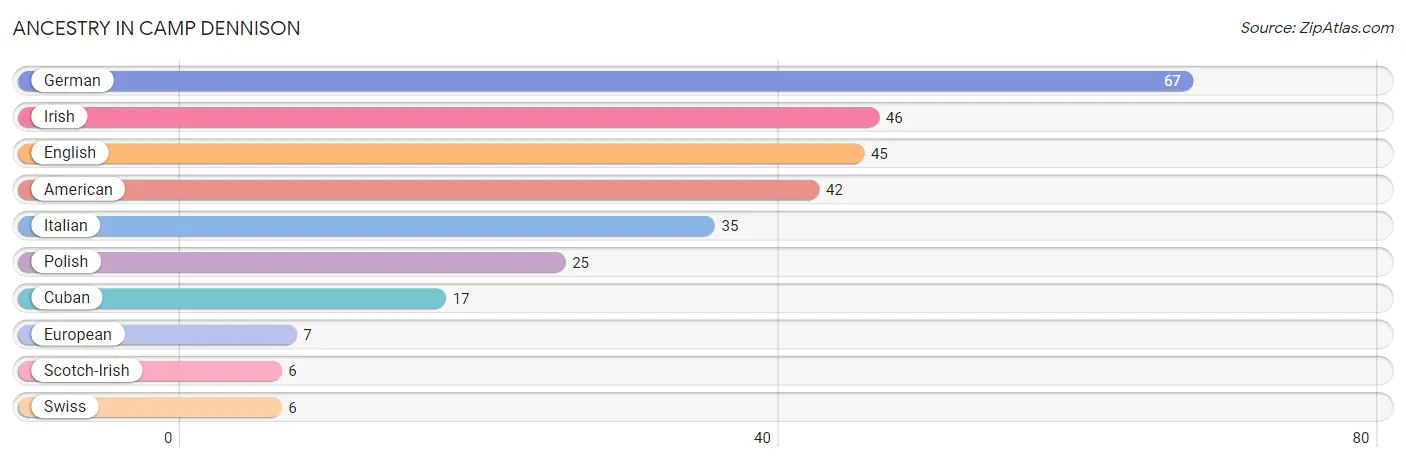
| Ancestry | # Population | % Population |
| American | 42 | 11.6% |
| Cuban | 17 | 4.7% |
| English | 45 | 12.4% |
| European | 7 | 1.9% |
| German | 67 | 18.5% |
| Irish | 46 | 12.7% |
| Italian | 35 | 9.6% |
| Polish | 25 | 6.9% |
| Scotch-Irish | 6 | 1.7% |
| Swiss | 6 | 1.7% | View All 10 Rows |
Immigrants in Camp Dennison

| Immigration Origin | # Population | % Population | View All 0 Rows |
Sex and Age in Camp Dennison
Sex and Age in Camp Dennison
The most populous age groups in Camp Dennison are 60 to 64 Years (30 | 18.1%) for men and 25 to 29 Years (29 | 14.7%) for women.
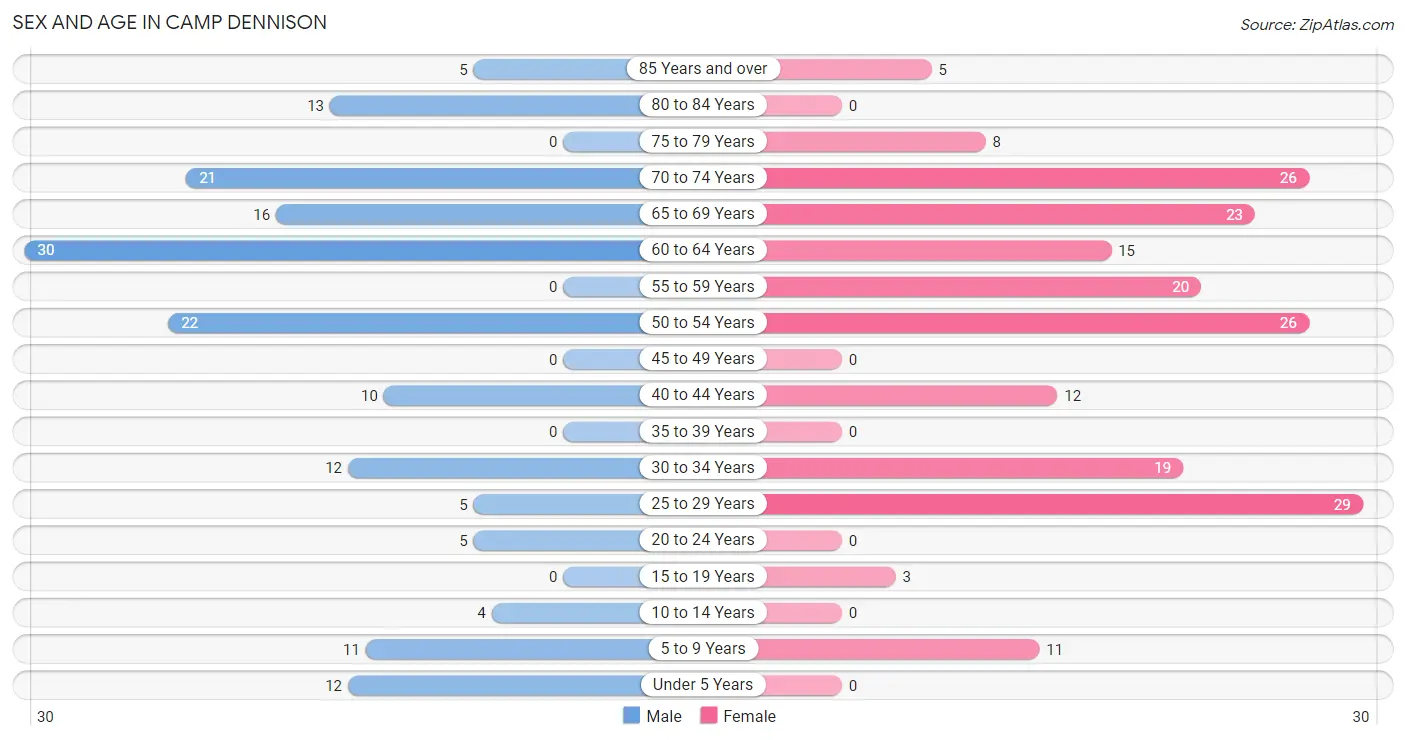
| Age Bracket | Male | Female |
| Under 5 Years | 12 (7.2%) | 0 (0.0%) |
| 5 to 9 Years | 11 (6.6%) | 11 (5.6%) |
| 10 to 14 Years | 4 (2.4%) | 0 (0.0%) |
| 15 to 19 Years | 0 (0.0%) | 3 (1.5%) |
| 20 to 24 Years | 5 (3.0%) | 0 (0.0%) |
| 25 to 29 Years | 5 (3.0%) | 29 (14.7%) |
| 30 to 34 Years | 12 (7.2%) | 19 (9.6%) |
| 35 to 39 Years | 0 (0.0%) | 0 (0.0%) |
| 40 to 44 Years | 10 (6.0%) | 12 (6.1%) |
| 45 to 49 Years | 0 (0.0%) | 0 (0.0%) |
| 50 to 54 Years | 22 (13.3%) | 26 (13.2%) |
| 55 to 59 Years | 0 (0.0%) | 20 (10.2%) |
| 60 to 64 Years | 30 (18.1%) | 15 (7.6%) |
| 65 to 69 Years | 16 (9.6%) | 23 (11.7%) |
| 70 to 74 Years | 21 (12.7%) | 26 (13.2%) |
| 75 to 79 Years | 0 (0.0%) | 8 (4.1%) |
| 80 to 84 Years | 13 (7.8%) | 0 (0.0%) |
| 85 Years and over | 5 (3.0%) | 5 (2.5%) |
| Total | 166 (100.0%) | 197 (100.0%) |
Families and Households in Camp Dennison
Median Family Size in Camp Dennison
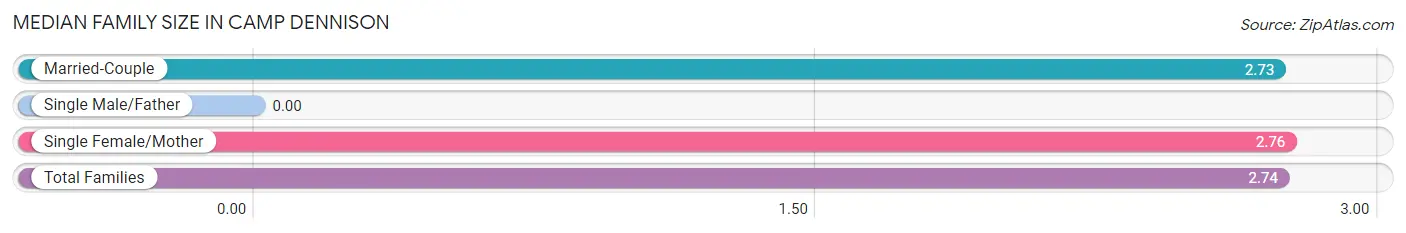
| Family Type | # Families | Family Size |
| Married-Couple | 81 (76.4%) | 2.73 |
| Single Male/Father | 0 (0.0%) | - |
| Single Female/Mother | 25 (23.6%) | 2.76 |
| Total Families | 106 (100.0%) | 2.74 |
Median Household Size in Camp Dennison
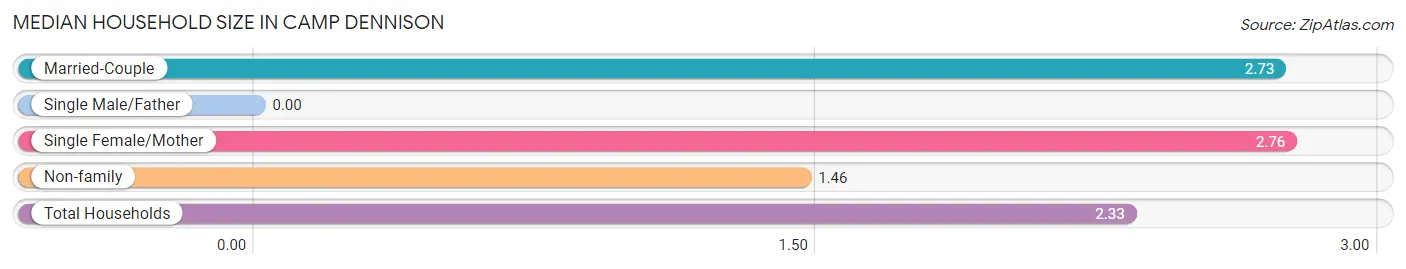
| Household Type | # Households | Household Size |
| Married-Couple | 81 (51.9%) | 2.73 |
| Single Male/Father | 0 (0.0%) | - |
| Single Female/Mother | 25 (16.0%) | 2.76 |
| Non-family | 50 (32.1%) | 1.46 |
| Total Households | 156 (100.0%) | 2.33 |
Household Size by Marriage Status in Camp Dennison
Out of a total of 156 households in Camp Dennison, 106 (67.9%) are family households, while 50 (32.1%) are nonfamily households. The most numerous type of family households are 2-person households, comprising 50, and the most common type of nonfamily households are 1-person households, comprising 38.
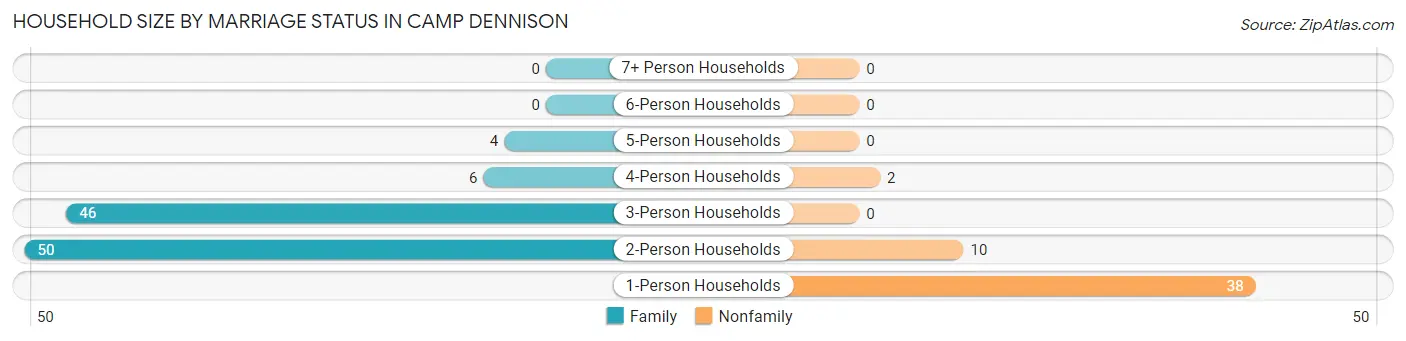
| Household Size | Family Households | Nonfamily Households |
| 1-Person Households | - | 38 (24.4%) |
| 2-Person Households | 50 (32.1%) | 10 (6.4%) |
| 3-Person Households | 46 (29.5%) | 0 (0.0%) |
| 4-Person Households | 6 (3.8%) | 2 (1.3%) |
| 5-Person Households | 4 (2.6%) | 0 (0.0%) |
| 6-Person Households | 0 (0.0%) | 0 (0.0%) |
| 7+ Person Households | 0 (0.0%) | 0 (0.0%) |
| Total | 106 (67.9%) | 50 (32.1%) |
Female Fertility in Camp Dennison
Fertility by Age in Camp Dennison
| Age Bracket | Women with Births | Births / 1,000 Women |
| 15 to 19 years | 0 (0.0%) | 0.0 |
| 20 to 34 years | 0 (0.0%) | 0.0 |
| 35 to 50 years | 0 (0.0%) | 0.0 |
| Total | 0 (0.0%) | 0.0 |
Fertility by Age by Marriage Status in Camp Dennison
| Age Bracket | Married | Unmarried |
| 15 to 19 years | 0 (0.0%) | 0 (0.0%) |
| 20 to 34 years | 0 (0.0%) | 0 (0.0%) |
| 35 to 50 years | 0 (0.0%) | 0 (0.0%) |
| Total | 0 (0.0%) | 0 (0.0%) |
Fertility by Education in Camp Dennison
| Educational Attainment | Women with Births | Births / 1,000 Women |
| Less than High School | 0 (0.0%) | 0.0 |
| High School Diploma | 0 (0.0%) | 0.0 |
| College or Associate's Degree | 0 (0.0%) | 0.0 |
| Bachelor's Degree | 0 (0.0%) | 0.0 |
| Graduate Degree | 0 (0.0%) | 0.0 |
| Total | 0 (0.0%) | 0.0 |
Fertility by Education by Marriage Status in Camp Dennison
| Educational Attainment | Married | Unmarried |
| Less than High School | 0 (0.0%) | 0 (0.0%) |
| High School Diploma | 0 (0.0%) | 0 (0.0%) |
| College or Associate's Degree | 0 (0.0%) | 0 (0.0%) |
| Bachelor's Degree | 0 (0.0%) | 0 (0.0%) |
| Graduate Degree | 0 (0.0%) | 0 (0.0%) |
| Total | 0 (0.0%) | 0 (0.0%) |
Employment Characteristics in Camp Dennison
Employment by Class of Employer in Camp Dennison
Among the 170 employed individuals in Camp Dennison, private company employees (103 | 60.6%), local government employees (24 | 14.1%), and not-for-profit organizations (23 | 13.5%) make up the most common classes of employment.
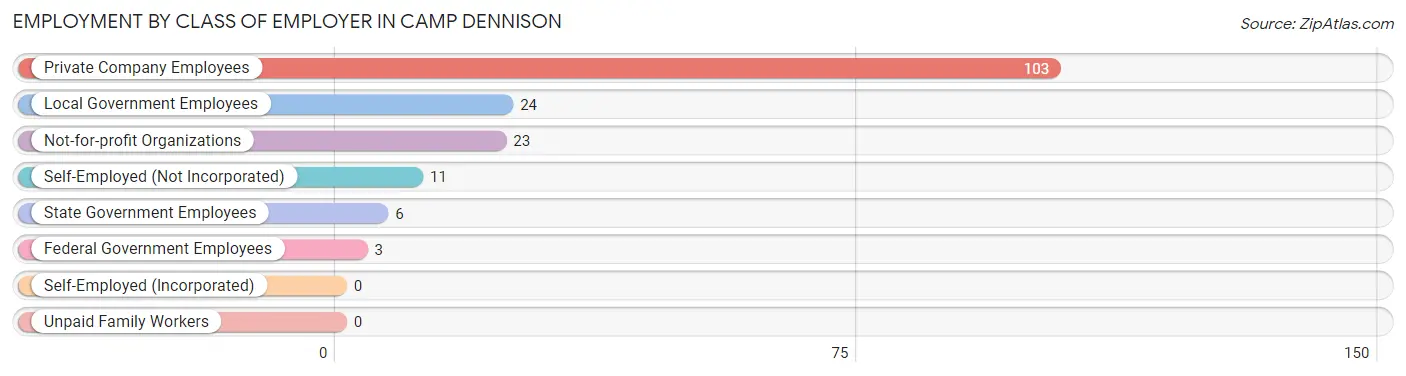
| Employer Class | # Employees | % Employees |
| Private Company Employees | 103 | 60.6% |
| Self-Employed (Incorporated) | 0 | 0.0% |
| Self-Employed (Not Incorporated) | 11 | 6.5% |
| Not-for-profit Organizations | 23 | 13.5% |
| Local Government Employees | 24 | 14.1% |
| State Government Employees | 6 | 3.5% |
| Federal Government Employees | 3 | 1.8% |
| Unpaid Family Workers | 0 | 0.0% |
| Total | 170 | 100.0% |
Employment Status by Age in Camp Dennison
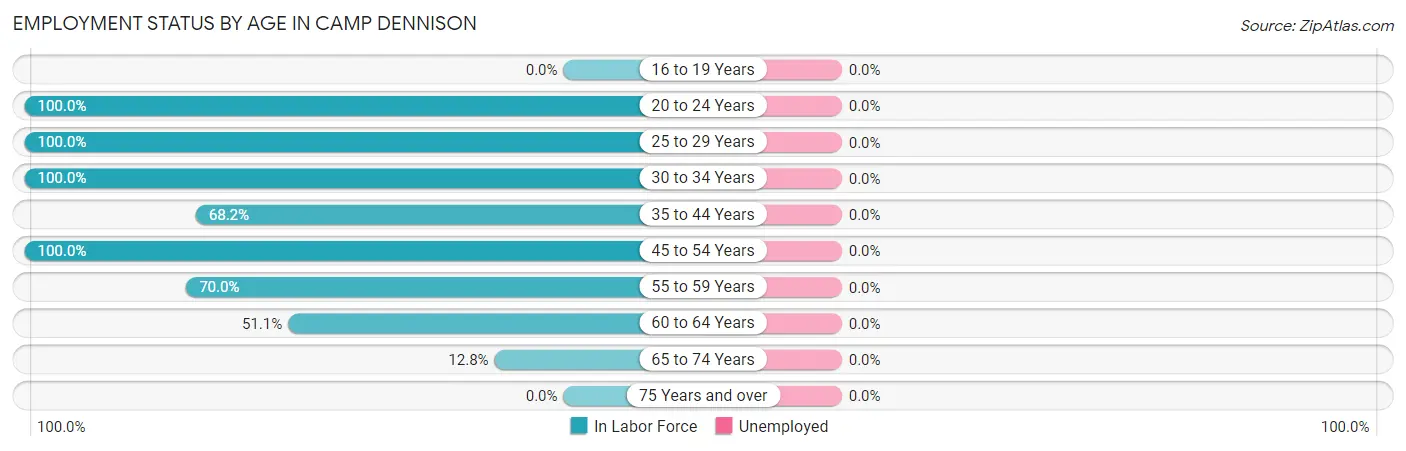
| Age Bracket | In Labor Force | Unemployed |
| 16 to 19 Years | 0 (0.0%) | 0 (0.0%) |
| 20 to 24 Years | 5 (100.0%) | 0 (0.0%) |
| 25 to 29 Years | 34 (100.0%) | 0 (0.0%) |
| 30 to 34 Years | 31 (100.0%) | 0 (0.0%) |
| 35 to 44 Years | 15 (68.2%) | 0 (0.0%) |
| 45 to 54 Years | 48 (100.0%) | 0 (0.0%) |
| 55 to 59 Years | 14 (70.0%) | 0 (0.0%) |
| 60 to 64 Years | 23 (51.1%) | 0 (0.0%) |
| 65 to 74 Years | 11 (12.8%) | 0 (0.0%) |
| 75 Years and over | 0 (0.0%) | 0 (0.0%) |
| Total | 181 (55.7%) | 0 (0.0%) |
Employment Status by Educational Attainment in Camp Dennison
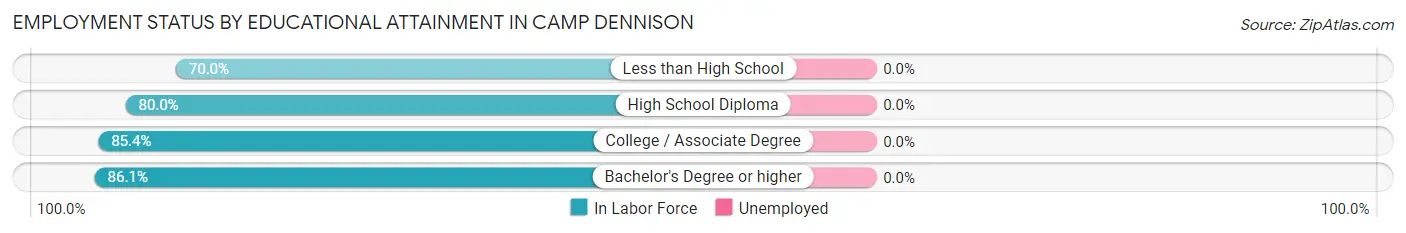
| Educational Attainment | In Labor Force | Unemployed |
| Less than High School | 14 (70.0%) | 0 (0.0%) |
| High School Diploma | 48 (80.0%) | 0 (0.0%) |
| College / Associate Degree | 35 (85.4%) | 0 (0.0%) |
| Bachelor's Degree or higher | 68 (86.1%) | 0 (0.0%) |
| Total | 165 (82.5%) | 0 (0.0%) |
Employment Occupations by Sex in Camp Dennison
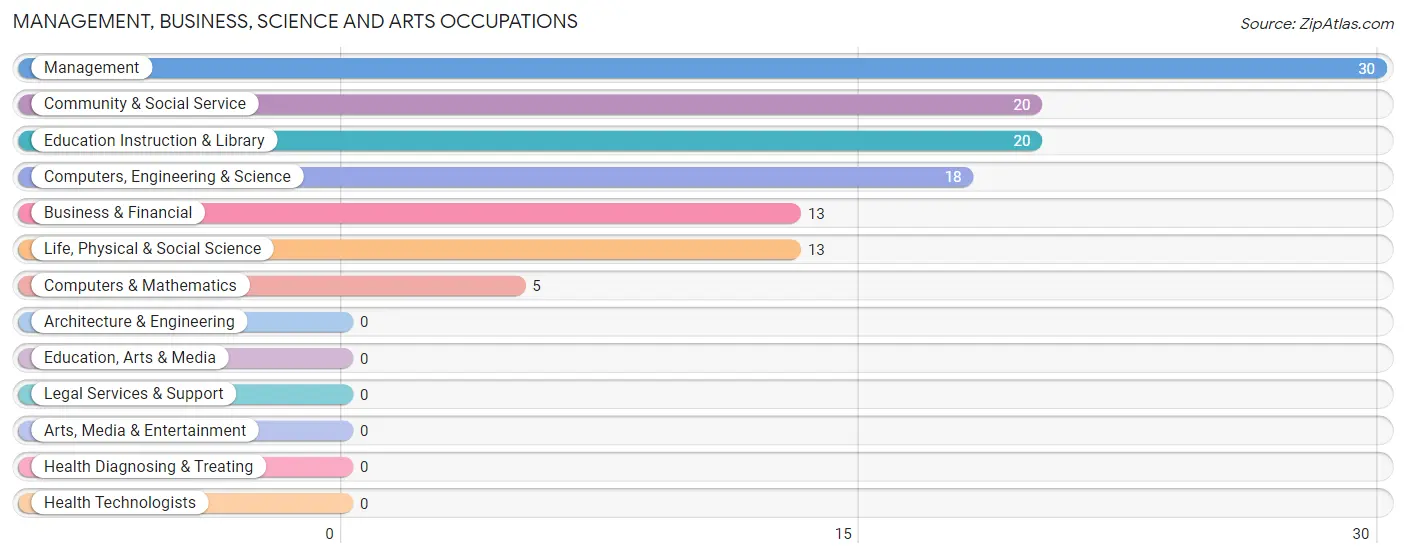
Management, Business, Science and Arts Occupations
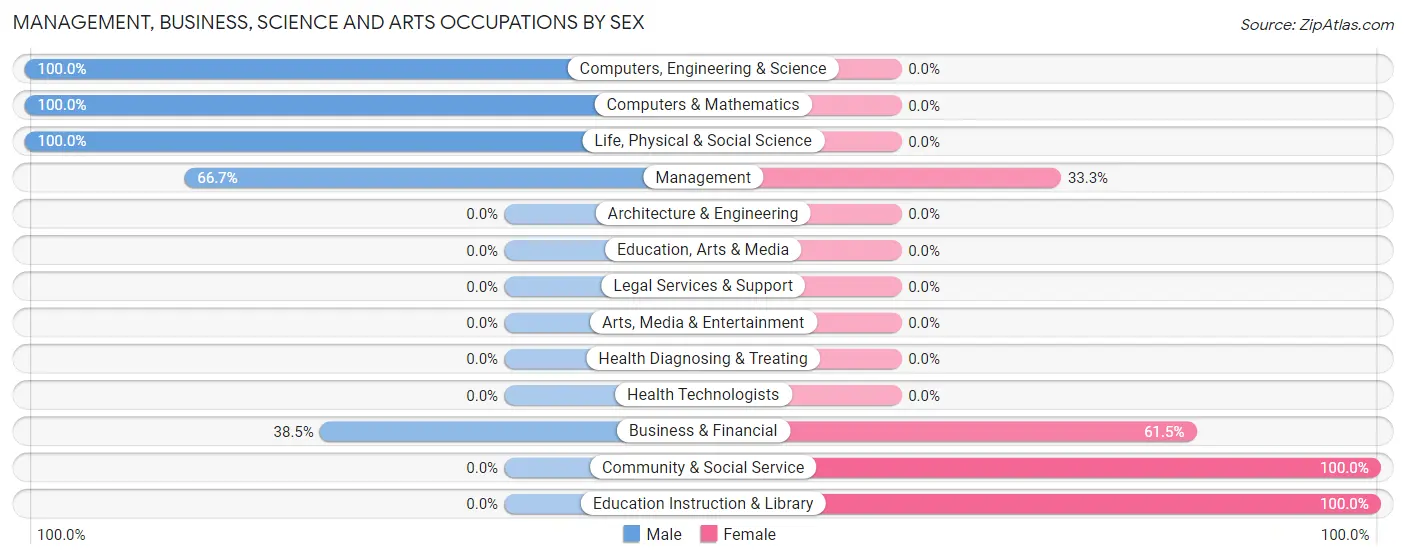
The most common Management, Business, Science and Arts occupations in Camp Dennison are Management (30 | 16.6%), Community & Social Service (20 | 11.1%), Education Instruction & Library (20 | 11.1%), Computers, Engineering & Science (18 | 9.9%), and Business & Financial (13 | 7.2%).
Management, Business, Science and Arts Occupations by Sex
Within the Management, Business, Science and Arts occupations in Camp Dennison, the most male-oriented occupations are Computers, Engineering & Science (100.0%), Computers & Mathematics (100.0%), and Life, Physical & Social Science (100.0%), while the most female-oriented occupations are Community & Social Service (100.0%), Education Instruction & Library (100.0%), and Business & Financial (61.5%).
| Occupation | Male | Female |
| Management | 20 (66.7%) | 10 (33.3%) |
| Business & Financial | 5 (38.5%) | 8 (61.5%) |
| Computers, Engineering & Science | 18 (100.0%) | 0 (0.0%) |
| Computers & Mathematics | 5 (100.0%) | 0 (0.0%) |
| Architecture & Engineering | 0 (0.0%) | 0 (0.0%) |
| Life, Physical & Social Science | 13 (100.0%) | 0 (0.0%) |
| Community & Social Service | 0 (0.0%) | 20 (100.0%) |
| Education, Arts & Media | 0 (0.0%) | 0 (0.0%) |
| Legal Services & Support | 0 (0.0%) | 0 (0.0%) |
| Education Instruction & Library | 0 (0.0%) | 20 (100.0%) |
| Arts, Media & Entertainment | 0 (0.0%) | 0 (0.0%) |
| Health Diagnosing & Treating | 0 (0.0%) | 0 (0.0%) |
| Health Technologists | 0 (0.0%) | 0 (0.0%) |
| Total (Category) | 43 (53.1%) | 38 (46.9%) |
| Total (Overall) | 78 (43.1%) | 103 (56.9%) |
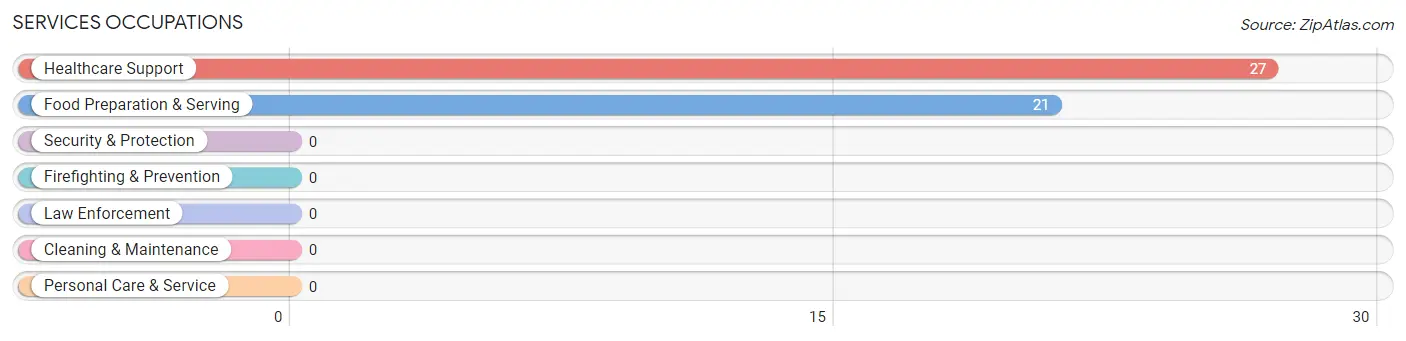
Services Occupations
The most common Services occupations in Camp Dennison are Healthcare Support (27 | 14.9%), and Food Preparation & Serving (21 | 11.6%).
Services Occupations by Sex
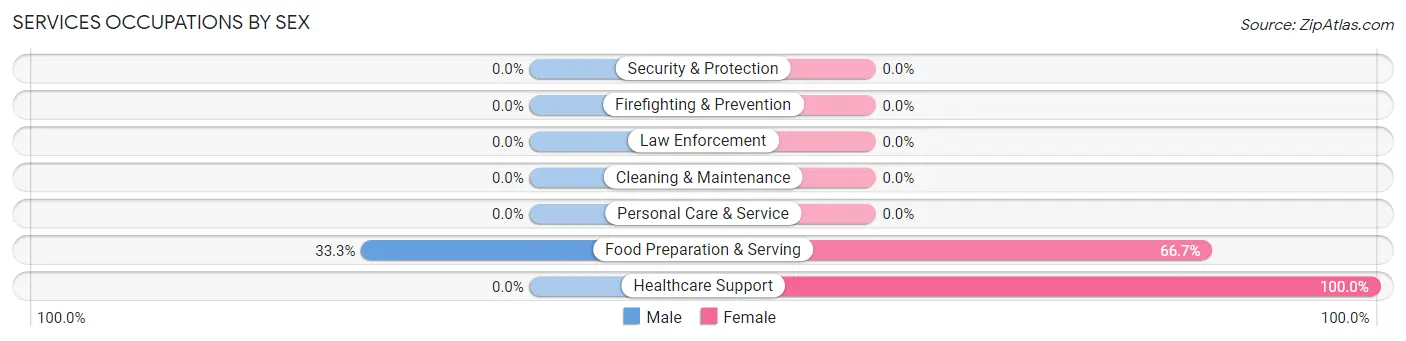
| Occupation | Male | Female |
| Healthcare Support | 0 (0.0%) | 27 (100.0%) |
| Security & Protection | 0 (0.0%) | 0 (0.0%) |
| Firefighting & Prevention | 0 (0.0%) | 0 (0.0%) |
| Law Enforcement | 0 (0.0%) | 0 (0.0%) |
| Food Preparation & Serving | 7 (33.3%) | 14 (66.7%) |
| Cleaning & Maintenance | 0 (0.0%) | 0 (0.0%) |
| Personal Care & Service | 0 (0.0%) | 0 (0.0%) |
| Total (Category) | 7 (14.6%) | 41 (85.4%) |
| Total (Overall) | 78 (43.1%) | 103 (56.9%) |
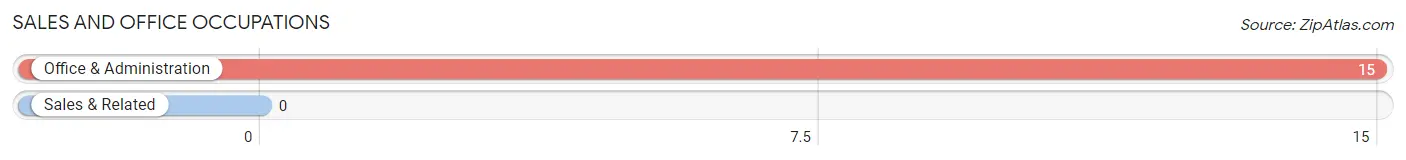
Sales and Office Occupations
The most common Sales and Office occupations in Camp Dennison are , and Office & Administration (15 | 8.3%).
Sales and Office Occupations by Sex
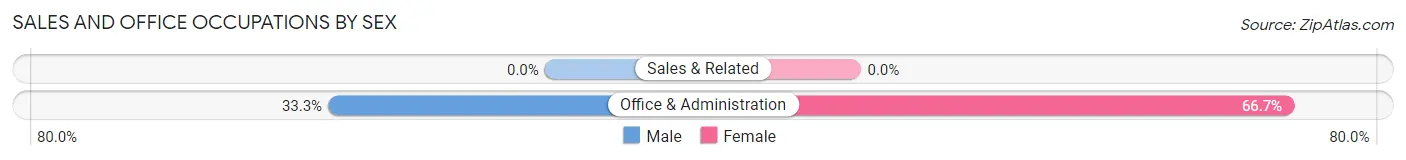
| Occupation | Male | Female |
| Sales & Related | 0 (0.0%) | 0 (0.0%) |
| Office & Administration | 5 (33.3%) | 10 (66.7%) |
| Total (Category) | 5 (33.3%) | 10 (66.7%) |
| Total (Overall) | 78 (43.1%) | 103 (56.9%) |
Natural Resources, Construction and Maintenance Occupations
The most common Natural Resources, Construction and Maintenance occupations in Camp Dennison are Installation, Maintenance & Repair (12 | 6.6%), and Construction & Extraction (6 | 3.3%).
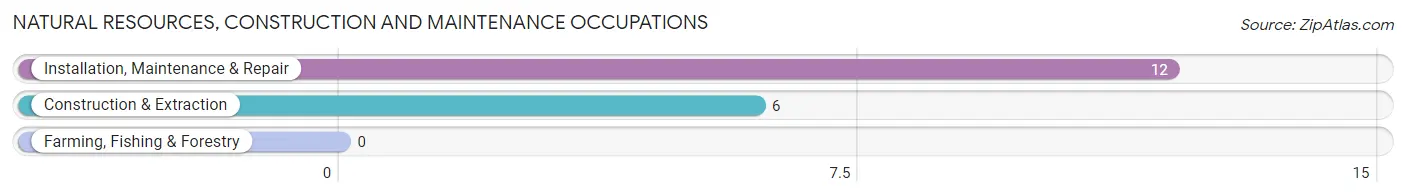
Natural Resources, Construction and Maintenance Occupations by Sex
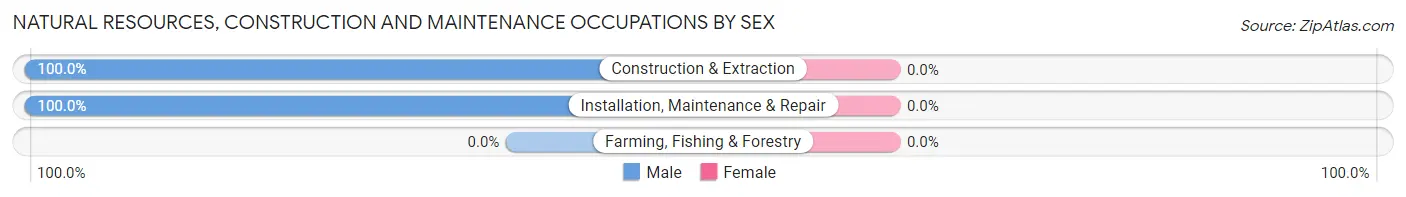
| Occupation | Male | Female |
| Farming, Fishing & Forestry | 0 (0.0%) | 0 (0.0%) |
| Construction & Extraction | 6 (100.0%) | 0 (0.0%) |
| Installation, Maintenance & Repair | 12 (100.0%) | 0 (0.0%) |
| Total (Category) | 18 (100.0%) | 0 (0.0%) |
| Total (Overall) | 78 (43.1%) | 103 (56.9%) |
Production, Transportation and Moving Occupations
The most common Production, Transportation and Moving occupations in Camp Dennison are , and Production (19 | 10.5%).
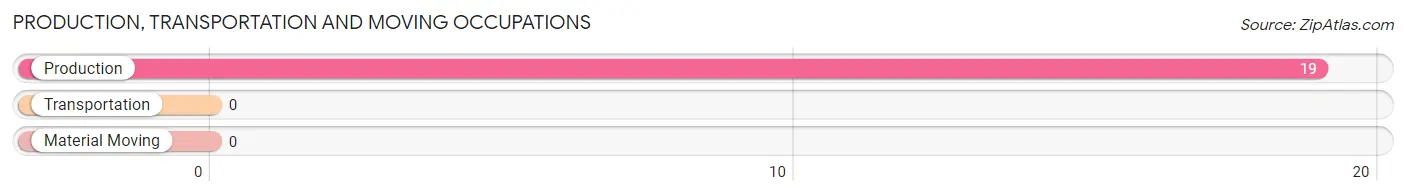
Production, Transportation and Moving Occupations by Sex
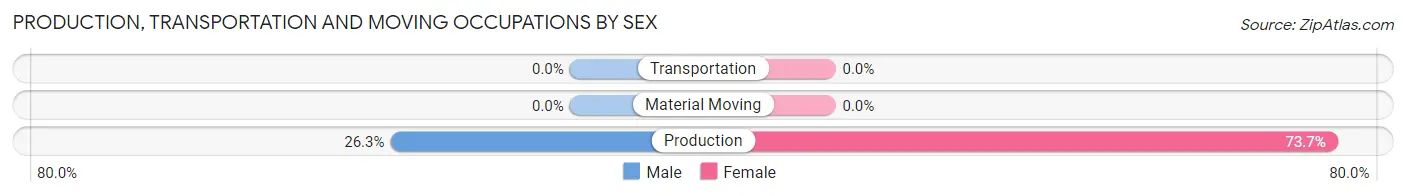
| Occupation | Male | Female |
| Production | 5 (26.3%) | 14 (73.7%) |
| Transportation | 0 (0.0%) | 0 (0.0%) |
| Material Moving | 0 (0.0%) | 0 (0.0%) |
| Total (Category) | 5 (26.3%) | 14 (73.7%) |
| Total (Overall) | 78 (43.1%) | 103 (56.9%) |
Employment Industries by Sex in Camp Dennison
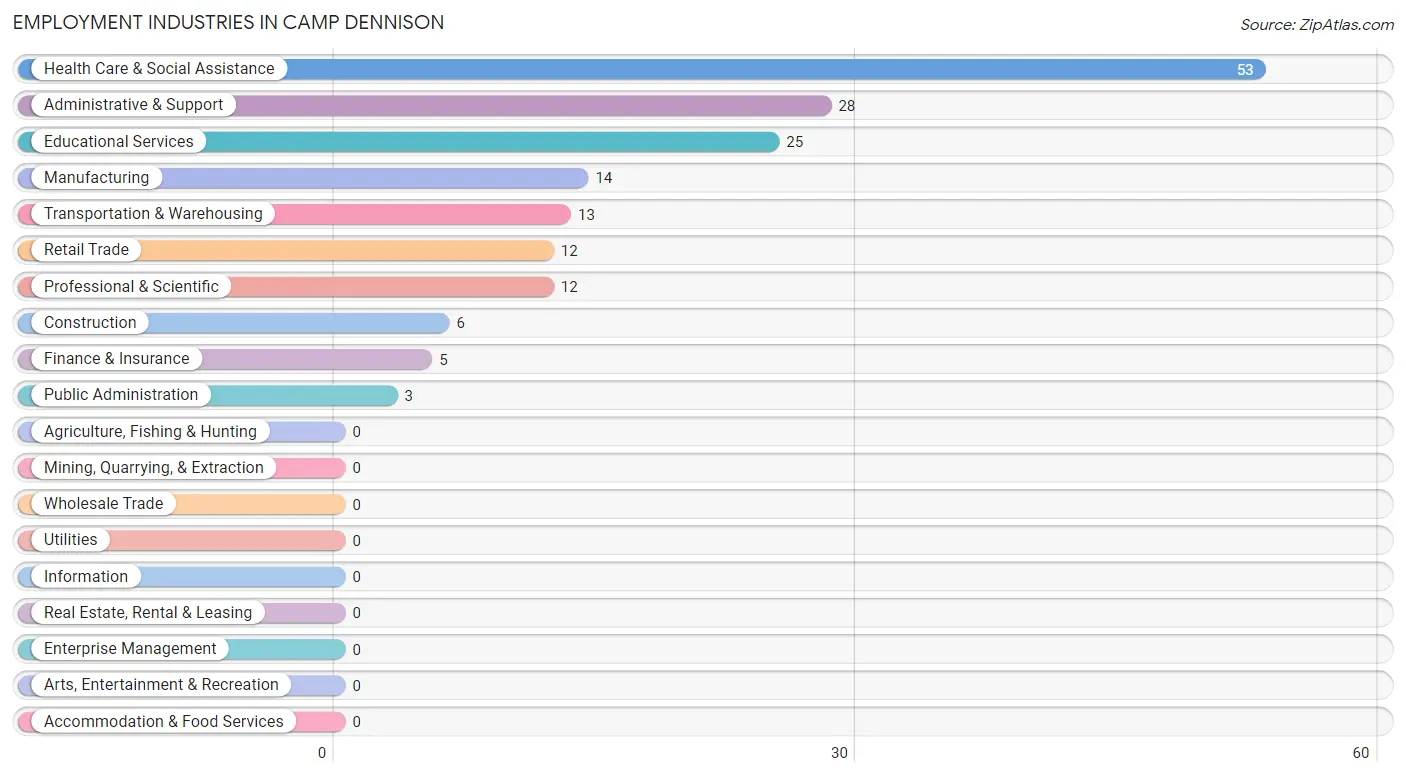
Employment Industries in Camp Dennison
The major employment industries in Camp Dennison include Health Care & Social Assistance (53 | 29.3%), Administrative & Support (28 | 15.5%), Educational Services (25 | 13.8%), Manufacturing (14 | 7.7%), and Transportation & Warehousing (13 | 7.2%).
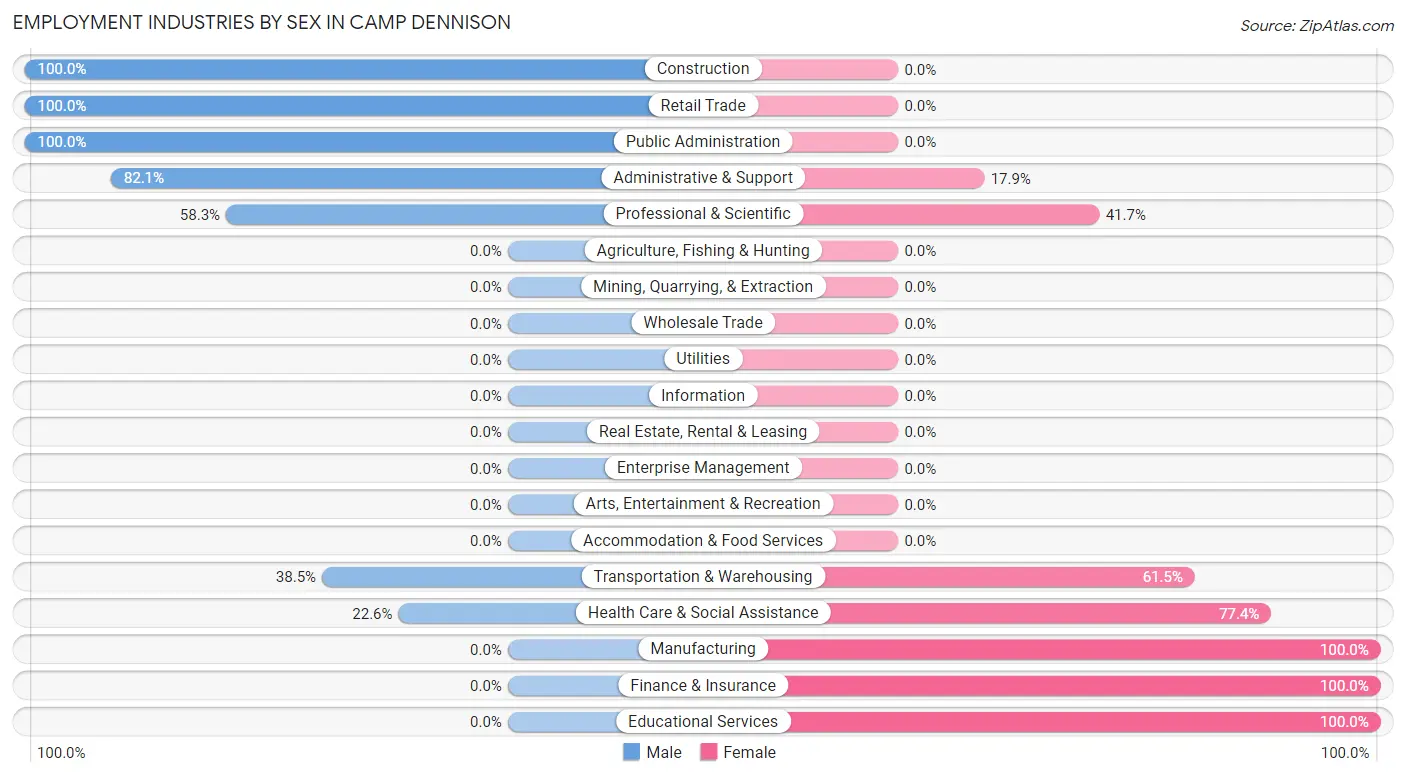
Employment Industries by Sex in Camp Dennison
The Camp Dennison industries that see more men than women are Construction (100.0%), Retail Trade (100.0%), and Public Administration (100.0%), whereas the industries that tend to have a higher number of women are Manufacturing (100.0%), Finance & Insurance (100.0%), and Educational Services (100.0%).
| Industry | Male | Female |
| Agriculture, Fishing & Hunting | 0 (0.0%) | 0 (0.0%) |
| Mining, Quarrying, & Extraction | 0 (0.0%) | 0 (0.0%) |
| Construction | 6 (100.0%) | 0 (0.0%) |
| Manufacturing | 0 (0.0%) | 14 (100.0%) |
| Wholesale Trade | 0 (0.0%) | 0 (0.0%) |
| Retail Trade | 12 (100.0%) | 0 (0.0%) |
| Transportation & Warehousing | 5 (38.5%) | 8 (61.5%) |
| Utilities | 0 (0.0%) | 0 (0.0%) |
| Information | 0 (0.0%) | 0 (0.0%) |
| Finance & Insurance | 0 (0.0%) | 5 (100.0%) |
| Real Estate, Rental & Leasing | 0 (0.0%) | 0 (0.0%) |
| Professional & Scientific | 7 (58.3%) | 5 (41.7%) |
| Enterprise Management | 0 (0.0%) | 0 (0.0%) |
| Administrative & Support | 23 (82.1%) | 5 (17.9%) |
| Educational Services | 0 (0.0%) | 25 (100.0%) |
| Health Care & Social Assistance | 12 (22.6%) | 41 (77.4%) |
| Arts, Entertainment & Recreation | 0 (0.0%) | 0 (0.0%) |
| Accommodation & Food Services | 0 (0.0%) | 0 (0.0%) |
| Public Administration | 3 (100.0%) | 0 (0.0%) |
| Total | 78 (43.1%) | 103 (56.9%) |
Education in Camp Dennison
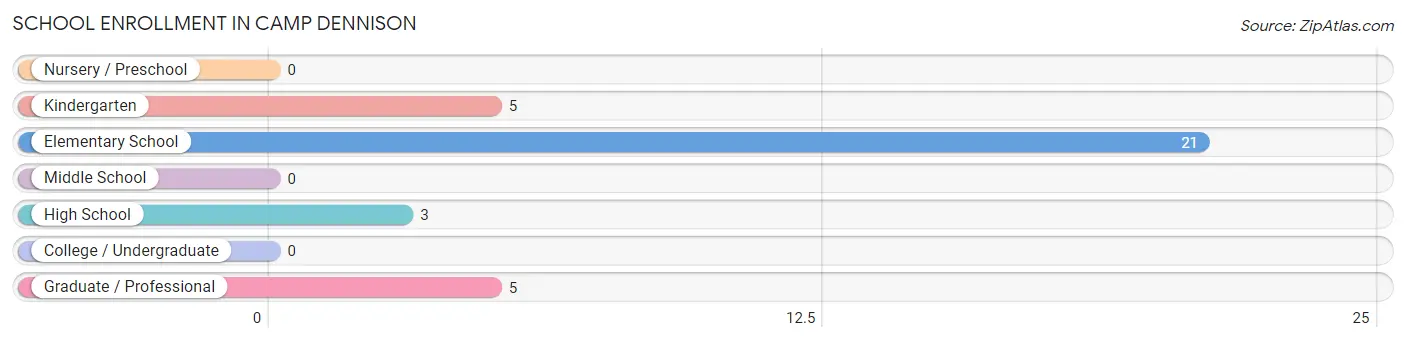
School Enrollment in Camp Dennison
The most common levels of schooling among the 34 students in Camp Dennison are elementary school (21 | 61.8%), kindergarten (5 | 14.7%), and graduate / professional (5 | 14.7%).
| School Level | # Students | % Students |
| Nursery / Preschool | 0 | 0.0% |
| Kindergarten | 5 | 14.7% |
| Elementary School | 21 | 61.8% |
| Middle School | 0 | 0.0% |
| High School | 3 | 8.8% |
| College / Undergraduate | 0 | 0.0% |
| Graduate / Professional | 5 | 14.7% |
| Total | 34 | 100.0% |
School Enrollment by Age by Funding Source in Camp Dennison
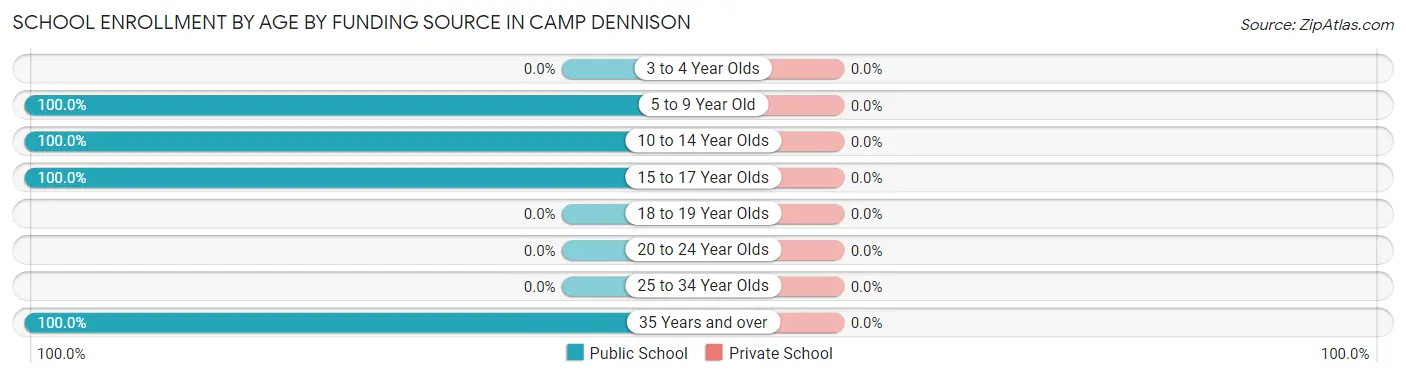
| Age Bracket | Public School | Private School |
| 3 to 4 Year Olds | 0 (0.0%) | 0 (0.0%) |
| 5 to 9 Year Old | 22 (100.0%) | 0 (0.0%) |
| 10 to 14 Year Olds | 4 (100.0%) | 0 (0.0%) |
| 15 to 17 Year Olds | 3 (100.0%) | 0 (0.0%) |
| 18 to 19 Year Olds | 0 (0.0%) | 0 (0.0%) |
| 20 to 24 Year Olds | 0 (0.0%) | 0 (0.0%) |
| 25 to 34 Year Olds | 0 (0.0%) | 0 (0.0%) |
| 35 Years and over | 5 (100.0%) | 0 (0.0%) |
| Total | 34 (100.0%) | 0 (0.0%) |
Educational Attainment by Field of Study in Camp Dennison
Education (31 | 27.0%), business (15 | 13.0%), arts & humanities (13 | 11.3%), psychology (10 | 8.7%), and social sciences (10 | 8.7%) are the most common fields of study among 115 individuals in Camp Dennison who have obtained a bachelor's degree or higher.
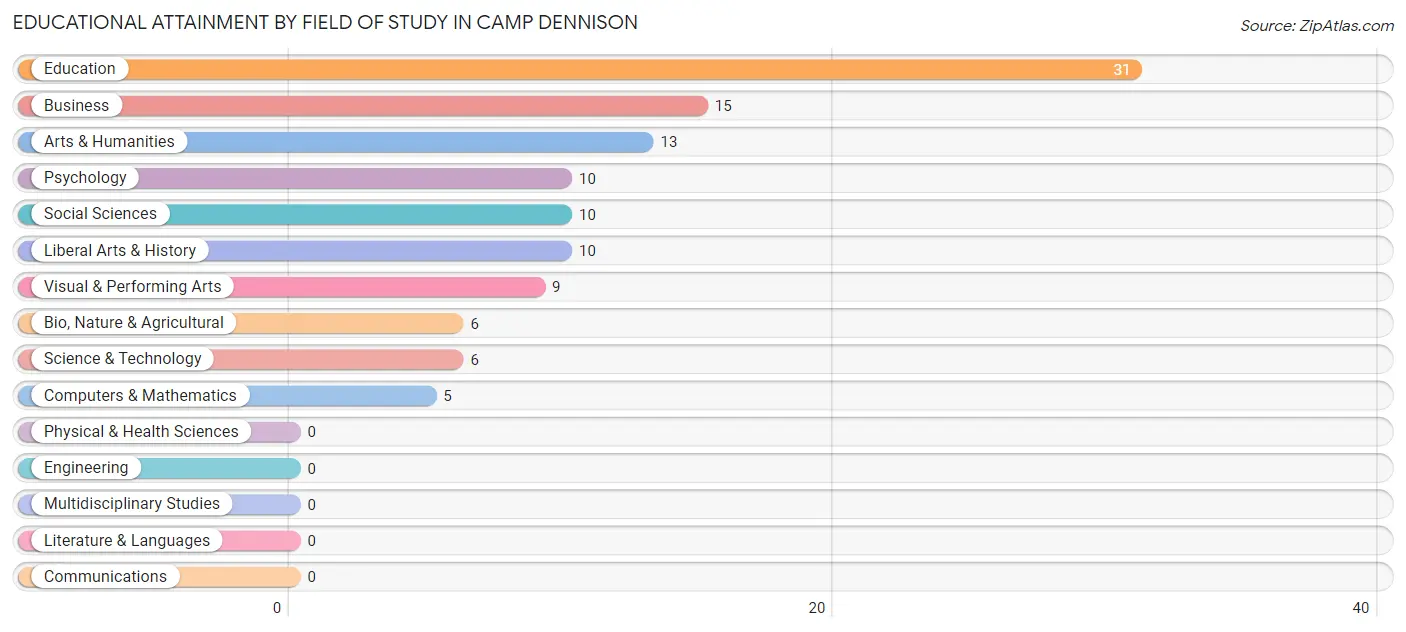
| Field of Study | # Graduates | % Graduates |
| Computers & Mathematics | 5 | 4.3% |
| Bio, Nature & Agricultural | 6 | 5.2% |
| Physical & Health Sciences | 0 | 0.0% |
| Psychology | 10 | 8.7% |
| Social Sciences | 10 | 8.7% |
| Engineering | 0 | 0.0% |
| Multidisciplinary Studies | 0 | 0.0% |
| Science & Technology | 6 | 5.2% |
| Business | 15 | 13.0% |
| Education | 31 | 27.0% |
| Literature & Languages | 0 | 0.0% |
| Liberal Arts & History | 10 | 8.7% |
| Visual & Performing Arts | 9 | 7.8% |
| Communications | 0 | 0.0% |
| Arts & Humanities | 13 | 11.3% |
| Total | 115 | 100.0% |
Transportation & Commute in Camp Dennison
Vehicle Availability by Sex in Camp Dennison
The most prevalent vehicle ownership categories in Camp Dennison are males with 2 vehicles (42, accounting for 58.3%) and females with 2 vehicles (27, making up 42.9%).
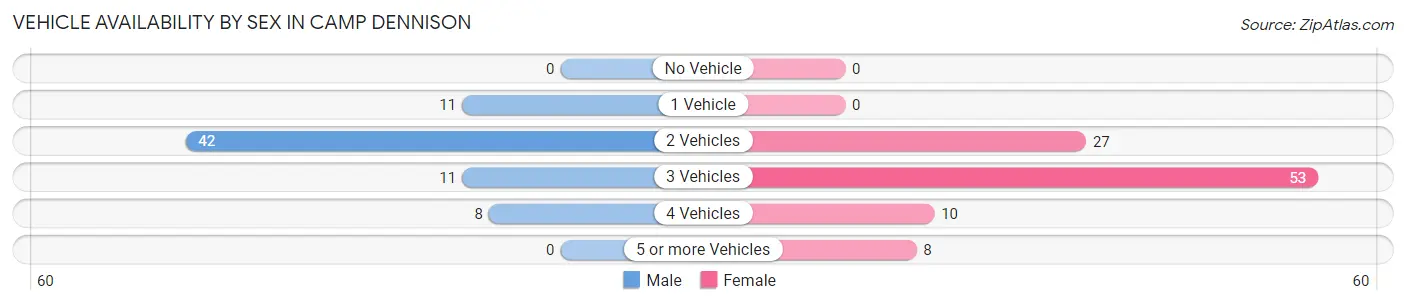
| Vehicles Available | Male | Female |
| No Vehicle | 0 (0.0%) | 0 (0.0%) |
| 1 Vehicle | 11 (15.3%) | 0 (0.0%) |
| 2 Vehicles | 42 (58.3%) | 27 (27.6%) |
| 3 Vehicles | 11 (15.3%) | 53 (54.1%) |
| 4 Vehicles | 8 (11.1%) | 10 (10.2%) |
| 5 or more Vehicles | 0 (0.0%) | 8 (8.2%) |
| Total | 72 (100.0%) | 98 (100.0%) |
Commute Time in Camp Dennison
The most frequently occuring commute durations in Camp Dennison are 25 to 29 minutes (46 commuters, 28.7%), 15 to 19 minutes (32 commuters, 20.0%), and 30 to 34 minutes (29 commuters, 18.1%).
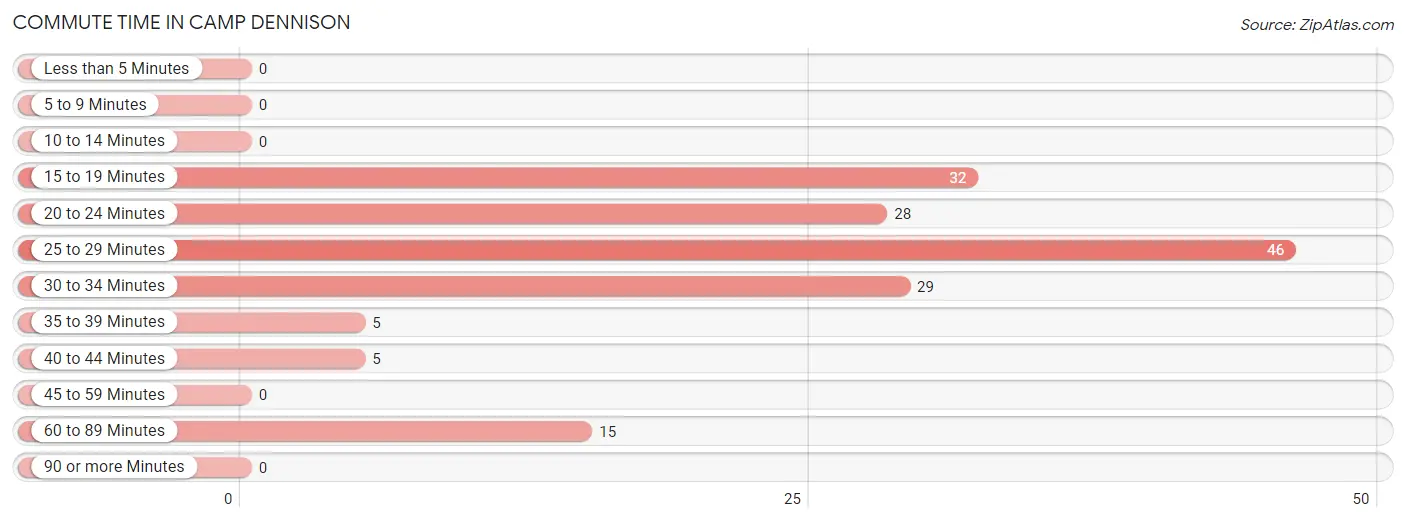
| Commute Time | # Commuters | % Commuters |
| Less than 5 Minutes | 0 | 0.0% |
| 5 to 9 Minutes | 0 | 0.0% |
| 10 to 14 Minutes | 0 | 0.0% |
| 15 to 19 Minutes | 32 | 20.0% |
| 20 to 24 Minutes | 28 | 17.5% |
| 25 to 29 Minutes | 46 | 28.7% |
| 30 to 34 Minutes | 29 | 18.1% |
| 35 to 39 Minutes | 5 | 3.1% |
| 40 to 44 Minutes | 5 | 3.1% |
| 45 to 59 Minutes | 0 | 0.0% |
| 60 to 89 Minutes | 15 | 9.4% |
| 90 or more Minutes | 0 | 0.0% |
Commute Time by Sex in Camp Dennison
The most common commute times in Camp Dennison are 20 to 24 minutes (22 commuters, 32.8%) for males and 25 to 29 minutes (27 commuters, 29.0%) for females.
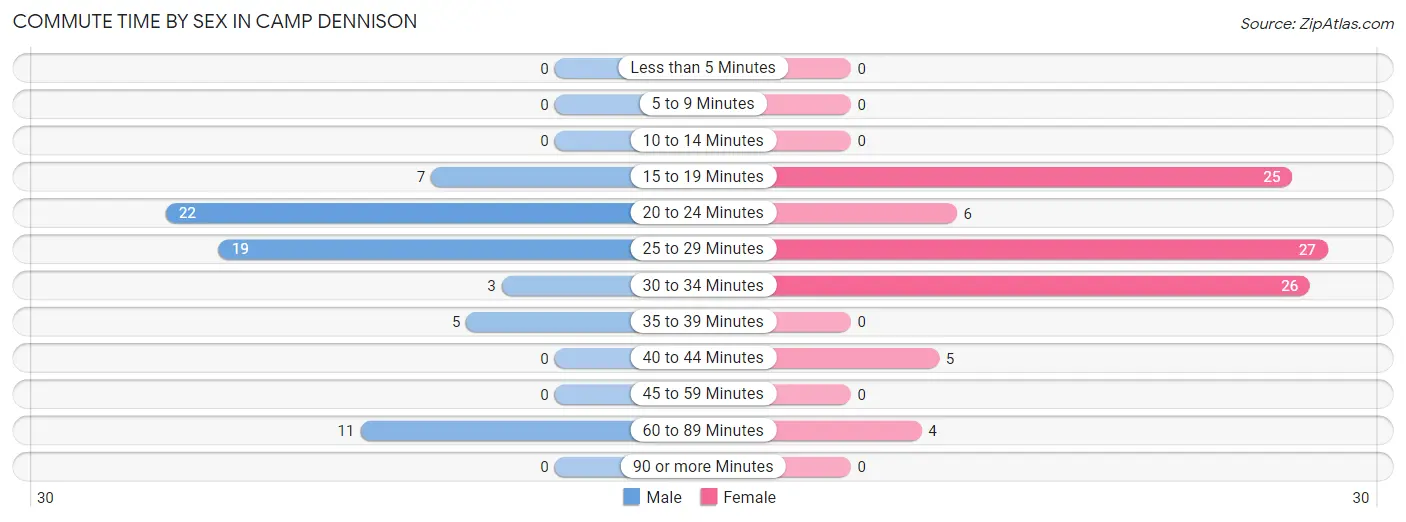
| Commute Time | Male | Female |
| Less than 5 Minutes | 0 (0.0%) | 0 (0.0%) |
| 5 to 9 Minutes | 0 (0.0%) | 0 (0.0%) |
| 10 to 14 Minutes | 0 (0.0%) | 0 (0.0%) |
| 15 to 19 Minutes | 7 (10.4%) | 25 (26.9%) |
| 20 to 24 Minutes | 22 (32.8%) | 6 (6.5%) |
| 25 to 29 Minutes | 19 (28.4%) | 27 (29.0%) |
| 30 to 34 Minutes | 3 (4.5%) | 26 (28.0%) |
| 35 to 39 Minutes | 5 (7.5%) | 0 (0.0%) |
| 40 to 44 Minutes | 0 (0.0%) | 5 (5.4%) |
| 45 to 59 Minutes | 0 (0.0%) | 0 (0.0%) |
| 60 to 89 Minutes | 11 (16.4%) | 4 (4.3%) |
| 90 or more Minutes | 0 (0.0%) | 0 (0.0%) |
Time of Departure to Work by Sex in Camp Dennison
The most frequent times of departure to work in Camp Dennison are 6:30 AM to 6:59 AM (21, 31.3%) for males and 7:30 AM to 7:59 AM (40, 43.0%) for females.
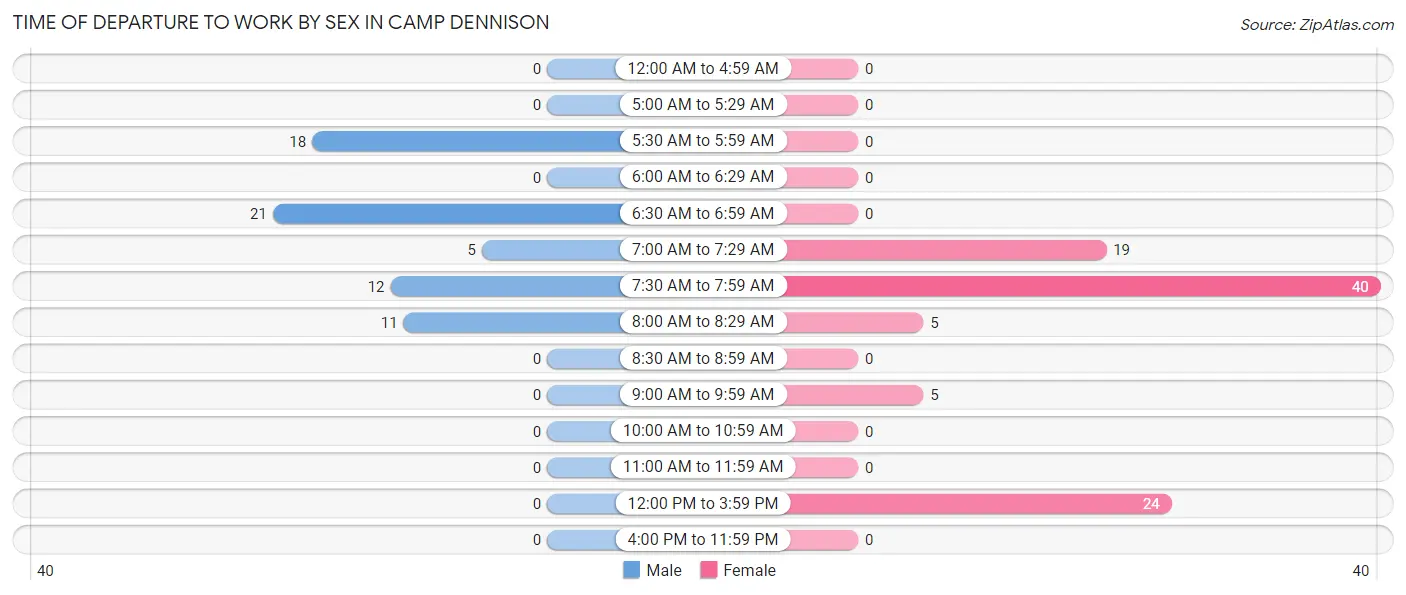
| Time of Departure | Male | Female |
| 12:00 AM to 4:59 AM | 0 (0.0%) | 0 (0.0%) |
| 5:00 AM to 5:29 AM | 0 (0.0%) | 0 (0.0%) |
| 5:30 AM to 5:59 AM | 18 (26.9%) | 0 (0.0%) |
| 6:00 AM to 6:29 AM | 0 (0.0%) | 0 (0.0%) |
| 6:30 AM to 6:59 AM | 21 (31.3%) | 0 (0.0%) |
| 7:00 AM to 7:29 AM | 5 (7.5%) | 19 (20.4%) |
| 7:30 AM to 7:59 AM | 12 (17.9%) | 40 (43.0%) |
| 8:00 AM to 8:29 AM | 11 (16.4%) | 5 (5.4%) |
| 8:30 AM to 8:59 AM | 0 (0.0%) | 0 (0.0%) |
| 9:00 AM to 9:59 AM | 0 (0.0%) | 5 (5.4%) |
| 10:00 AM to 10:59 AM | 0 (0.0%) | 0 (0.0%) |
| 11:00 AM to 11:59 AM | 0 (0.0%) | 0 (0.0%) |
| 12:00 PM to 3:59 PM | 0 (0.0%) | 24 (25.8%) |
| 4:00 PM to 11:59 PM | 0 (0.0%) | 0 (0.0%) |
| Total | 67 (100.0%) | 93 (100.0%) |
Housing Occupancy in Camp Dennison
Occupancy by Ownership in Camp Dennison
Of the total 156 dwellings in Camp Dennison, owner-occupied units account for 144 (92.3%), while renter-occupied units make up 12 (7.7%).
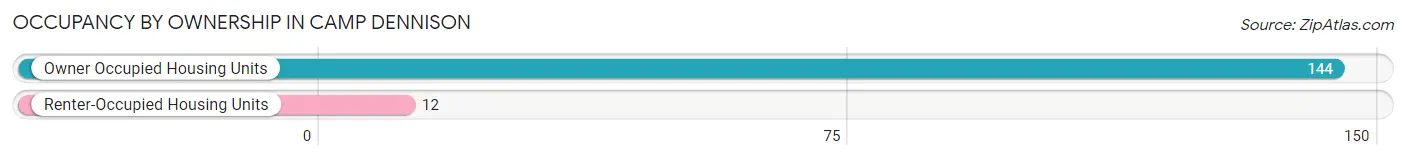
| Occupancy | # Housing Units | % Housing Units |
| Owner Occupied Housing Units | 144 | 92.3% |
| Renter-Occupied Housing Units | 12 | 7.7% |
| Total Occupied Housing Units | 156 | 100.0% |
Occupancy by Household Size in Camp Dennison
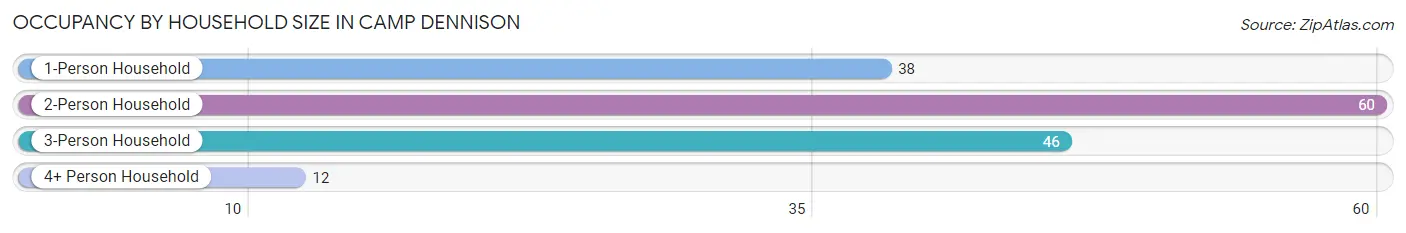
| Household Size | # Housing Units | % Housing Units |
| 1-Person Household | 38 | 24.4% |
| 2-Person Household | 60 | 38.5% |
| 3-Person Household | 46 | 29.5% |
| 4+ Person Household | 12 | 7.7% |
| Total Housing Units | 156 | 100.0% |
Occupancy by Ownership by Household Size in Camp Dennison
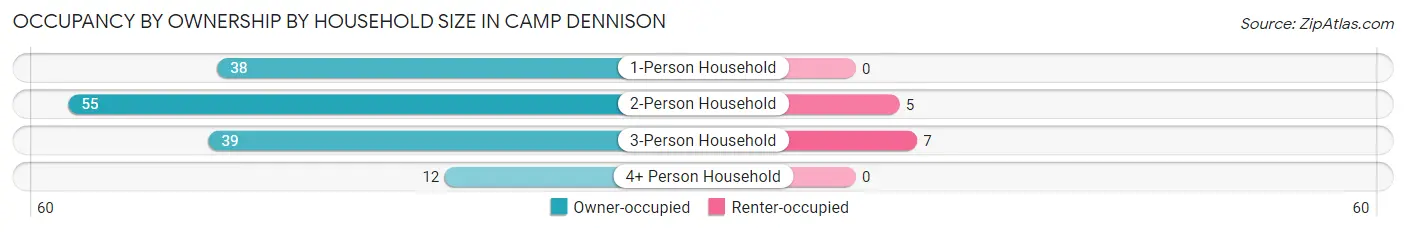
| Household Size | Owner-occupied | Renter-occupied |
| 1-Person Household | 38 (100.0%) | 0 (0.0%) |
| 2-Person Household | 55 (91.7%) | 5 (8.3%) |
| 3-Person Household | 39 (84.8%) | 7 (15.2%) |
| 4+ Person Household | 12 (100.0%) | 0 (0.0%) |
| Total Housing Units | 144 (92.3%) | 12 (7.7%) |
Occupancy by Educational Attainment in Camp Dennison
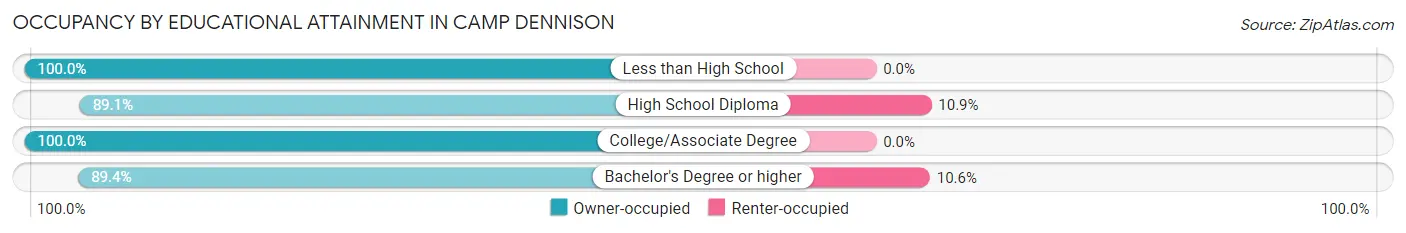
| Household Size | Owner-occupied | Renter-occupied |
| Less than High School | 17 (100.0%) | 0 (0.0%) |
| High School Diploma | 57 (89.1%) | 7 (10.9%) |
| College/Associate Degree | 28 (100.0%) | 0 (0.0%) |
| Bachelor's Degree or higher | 42 (89.4%) | 5 (10.6%) |
Occupancy by Age of Householder in Camp Dennison
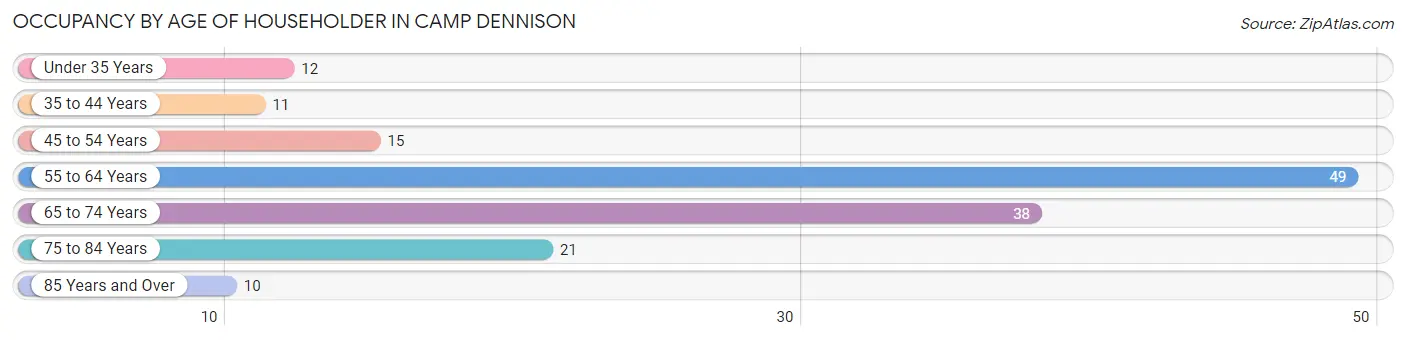
| Age Bracket | # Households | % Households |
| Under 35 Years | 12 | 7.7% |
| 35 to 44 Years | 11 | 7.0% |
| 45 to 54 Years | 15 | 9.6% |
| 55 to 64 Years | 49 | 31.4% |
| 65 to 74 Years | 38 | 24.4% |
| 75 to 84 Years | 21 | 13.5% |
| 85 Years and Over | 10 | 6.4% |
| Total | 156 | 100.0% |
Housing Finances in Camp Dennison
Median Income by Occupancy in Camp Dennison
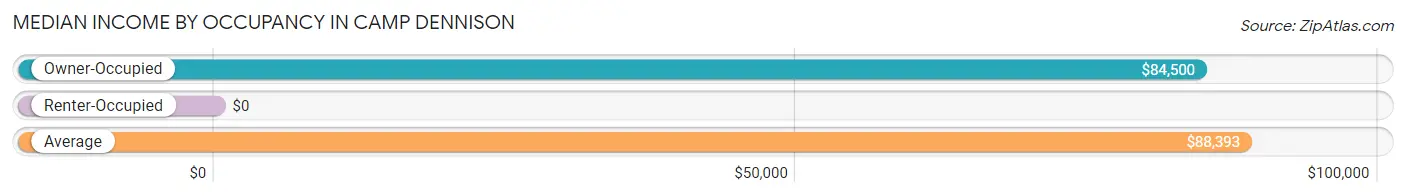
| Occupancy Type | # Households | Median Income |
| Owner-Occupied | 144 (92.3%) | $84,500 |
| Renter-Occupied | 12 (7.7%) | $0 |
| Average | 156 (100.0%) | $88,393 |
Occupancy by Householder Income Bracket in Camp Dennison
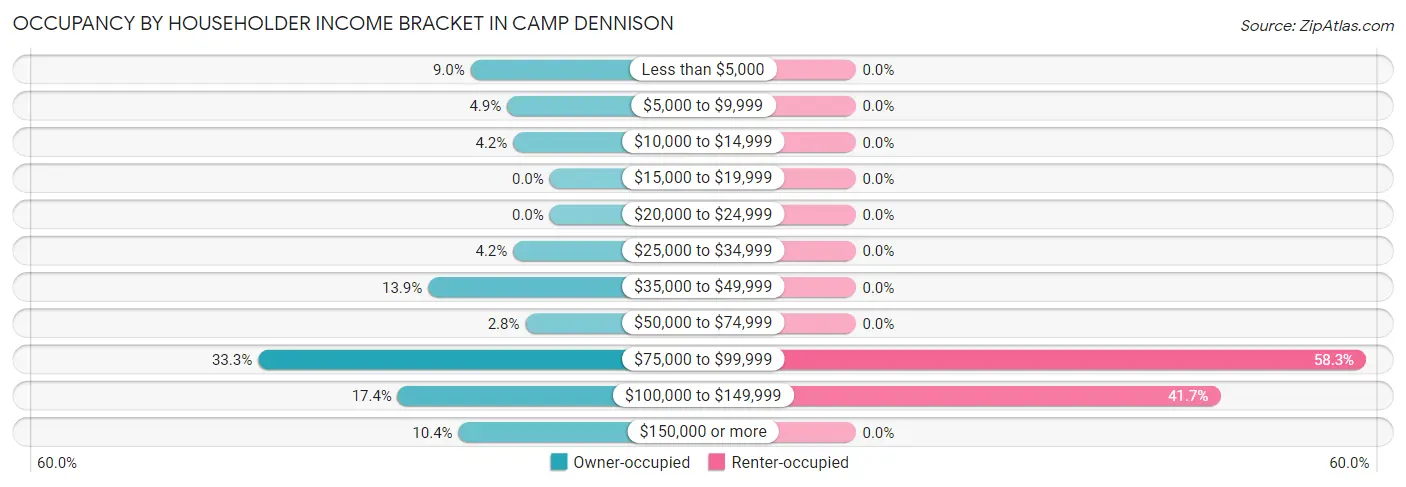
| Income Bracket | Owner-occupied | Renter-occupied |
| Less than $5,000 | 13 (9.0%) | 0 (0.0%) |
| $5,000 to $9,999 | 7 (4.9%) | 0 (0.0%) |
| $10,000 to $14,999 | 6 (4.2%) | 0 (0.0%) |
| $15,000 to $19,999 | 0 (0.0%) | 0 (0.0%) |
| $20,000 to $24,999 | 0 (0.0%) | 0 (0.0%) |
| $25,000 to $34,999 | 6 (4.2%) | 0 (0.0%) |
| $35,000 to $49,999 | 20 (13.9%) | 0 (0.0%) |
| $50,000 to $74,999 | 4 (2.8%) | 0 (0.0%) |
| $75,000 to $99,999 | 48 (33.3%) | 7 (58.3%) |
| $100,000 to $149,999 | 25 (17.4%) | 5 (41.7%) |
| $150,000 or more | 15 (10.4%) | 0 (0.0%) |
| Total | 144 (100.0%) | 12 (100.0%) |
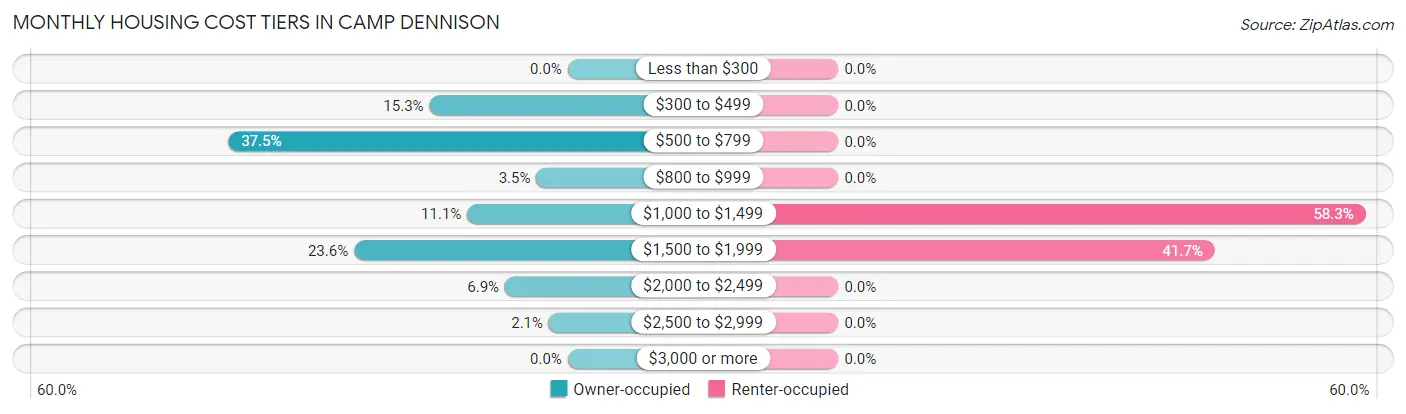
Monthly Housing Cost Tiers in Camp Dennison
| Monthly Cost | Owner-occupied | Renter-occupied |
| Less than $300 | 0 (0.0%) | 0 (0.0%) |
| $300 to $499 | 22 (15.3%) | 0 (0.0%) |
| $500 to $799 | 54 (37.5%) | 0 (0.0%) |
| $800 to $999 | 5 (3.5%) | 0 (0.0%) |
| $1,000 to $1,499 | 16 (11.1%) | 7 (58.3%) |
| $1,500 to $1,999 | 34 (23.6%) | 5 (41.7%) |
| $2,000 to $2,499 | 10 (6.9%) | 0 (0.0%) |
| $2,500 to $2,999 | 3 (2.1%) | 0 (0.0%) |
| $3,000 or more | 0 (0.0%) | 0 (0.0%) |
| Total | 144 (100.0%) | 12 (100.0%) |
Physical Housing Characteristics in Camp Dennison
Housing Structures in Camp Dennison
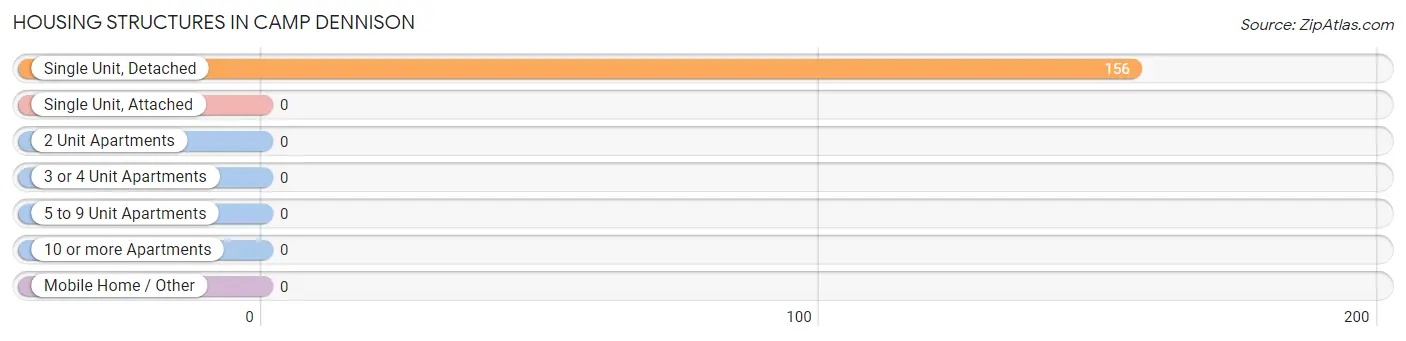
| Structure Type | # Housing Units | % Housing Units |
| Single Unit, Detached | 156 | 100.0% |
| Single Unit, Attached | 0 | 0.0% |
| 2 Unit Apartments | 0 | 0.0% |
| 3 or 4 Unit Apartments | 0 | 0.0% |
| 5 to 9 Unit Apartments | 0 | 0.0% |
| 10 or more Apartments | 0 | 0.0% |
| Mobile Home / Other | 0 | 0.0% |
| Total | 156 | 100.0% |
Housing Structures by Occupancy in Camp Dennison
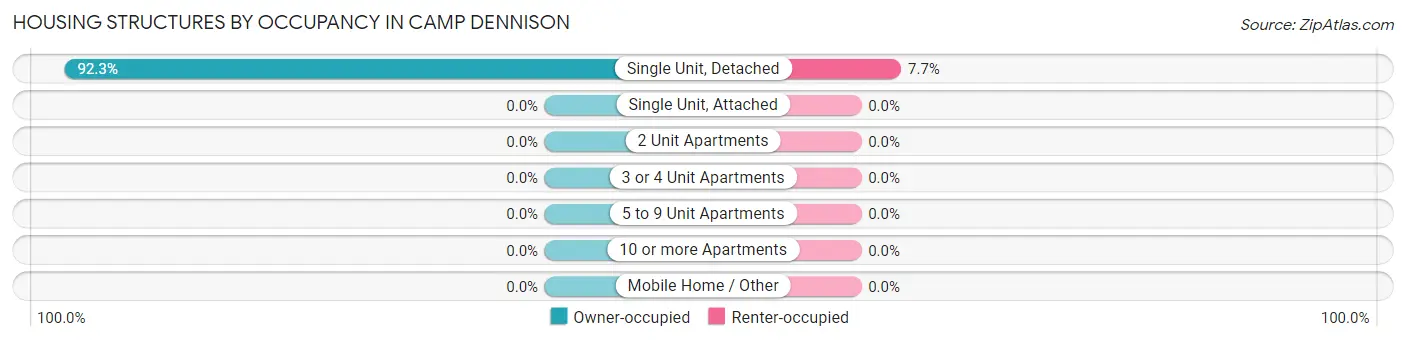
| Structure Type | Owner-occupied | Renter-occupied |
| Single Unit, Detached | 144 (92.3%) | 12 (7.7%) |
| Single Unit, Attached | 0 (0.0%) | 0 (0.0%) |
| 2 Unit Apartments | 0 (0.0%) | 0 (0.0%) |
| 3 or 4 Unit Apartments | 0 (0.0%) | 0 (0.0%) |
| 5 to 9 Unit Apartments | 0 (0.0%) | 0 (0.0%) |
| 10 or more Apartments | 0 (0.0%) | 0 (0.0%) |
| Mobile Home / Other | 0 (0.0%) | 0 (0.0%) |
| Total | 144 (92.3%) | 12 (7.7%) |
Housing Structures by Number of Rooms in Camp Dennison
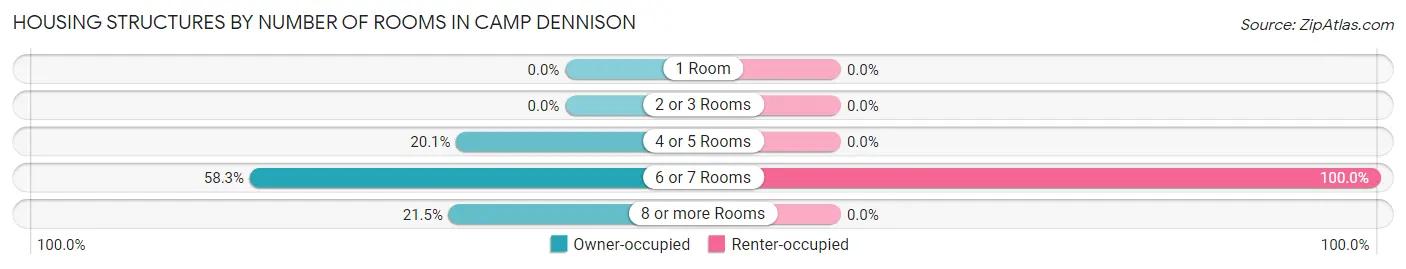
| Number of Rooms | Owner-occupied | Renter-occupied |
| 1 Room | 0 (0.0%) | 0 (0.0%) |
| 2 or 3 Rooms | 0 (0.0%) | 0 (0.0%) |
| 4 or 5 Rooms | 29 (20.1%) | 0 (0.0%) |
| 6 or 7 Rooms | 84 (58.3%) | 12 (100.0%) |
| 8 or more Rooms | 31 (21.5%) | 0 (0.0%) |
| Total | 144 (100.0%) | 12 (100.0%) |
Housing Structure by Heating Type in Camp Dennison
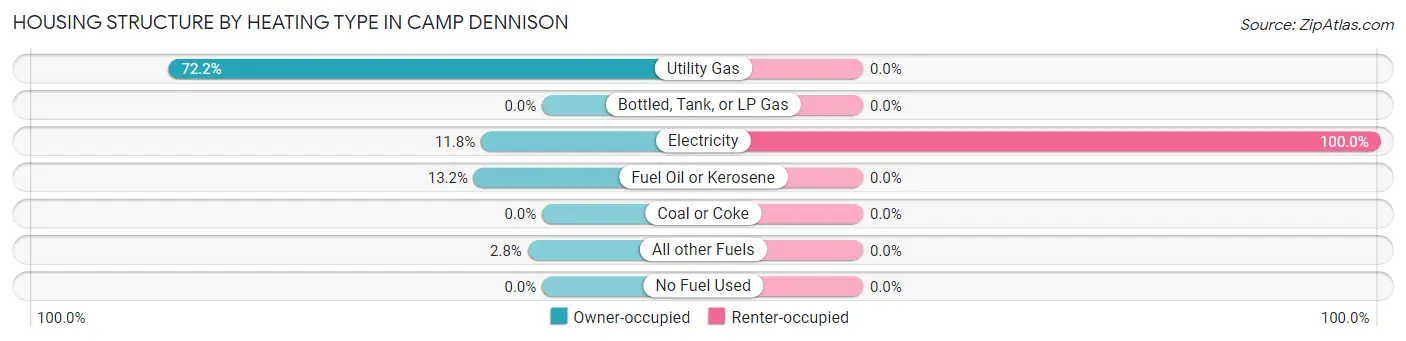
| Heating Type | Owner-occupied | Renter-occupied |
| Utility Gas | 104 (72.2%) | 0 (0.0%) |
| Bottled, Tank, or LP Gas | 0 (0.0%) | 0 (0.0%) |
| Electricity | 17 (11.8%) | 12 (100.0%) |
| Fuel Oil or Kerosene | 19 (13.2%) | 0 (0.0%) |
| Coal or Coke | 0 (0.0%) | 0 (0.0%) |
| All other Fuels | 4 (2.8%) | 0 (0.0%) |
| No Fuel Used | 0 (0.0%) | 0 (0.0%) |
| Total | 144 (100.0%) | 12 (100.0%) |
Household Vehicle Usage in Camp Dennison
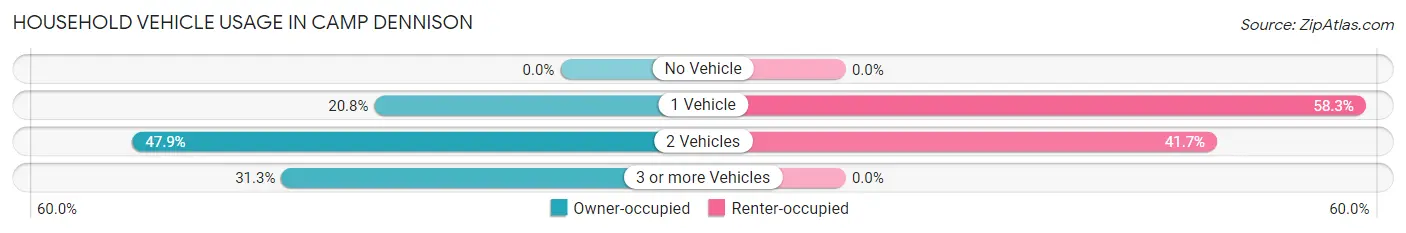
| Vehicles per Household | Owner-occupied | Renter-occupied |
| No Vehicle | 0 (0.0%) | 0 (0.0%) |
| 1 Vehicle | 30 (20.8%) | 7 (58.3%) |
| 2 Vehicles | 69 (47.9%) | 5 (41.7%) |
| 3 or more Vehicles | 45 (31.2%) | 0 (0.0%) |
| Total | 144 (100.0%) | 12 (100.0%) |
Real Estate & Mortgages in Camp Dennison
Real Estate and Mortgage Overview in Camp Dennison
| Characteristic | Without Mortgage | With Mortgage |
| Housing Units | 73 | 71 |
| Median Property Value | $151,100 | $234,400 |
| Median Household Income | $84,250 | $15 |
| Monthly Housing Costs | $569 | $0 |
| Real Estate Taxes | $2,820 | $0 |
Property Value by Mortgage Status in Camp Dennison
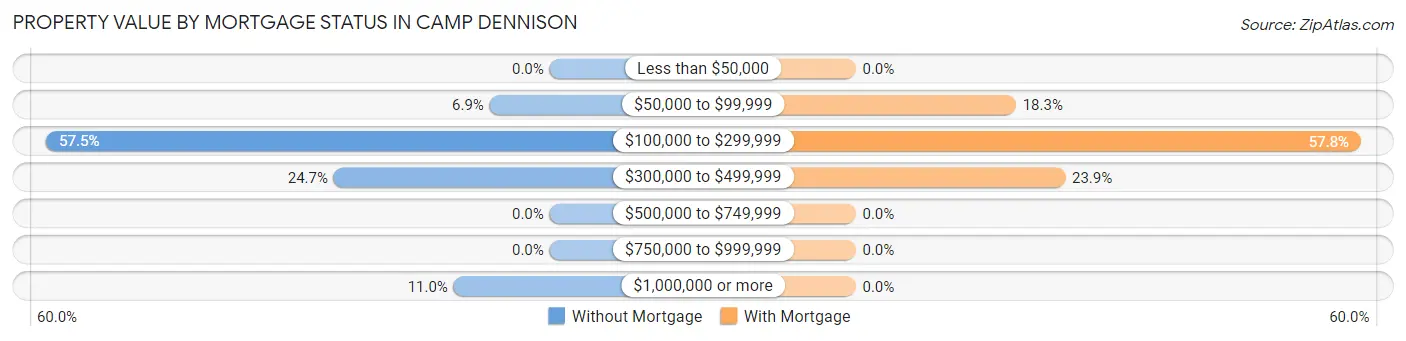
| Property Value | Without Mortgage | With Mortgage |
| Less than $50,000 | 0 (0.0%) | 0 (0.0%) |
| $50,000 to $99,999 | 5 (6.9%) | 13 (18.3%) |
| $100,000 to $299,999 | 42 (57.5%) | 41 (57.8%) |
| $300,000 to $499,999 | 18 (24.7%) | 17 (23.9%) |
| $500,000 to $749,999 | 0 (0.0%) | 0 (0.0%) |
| $750,000 to $999,999 | 0 (0.0%) | 0 (0.0%) |
| $1,000,000 or more | 8 (11.0%) | 0 (0.0%) |
| Total | 73 (100.0%) | 71 (100.0%) |
Household Income by Mortgage Status in Camp Dennison
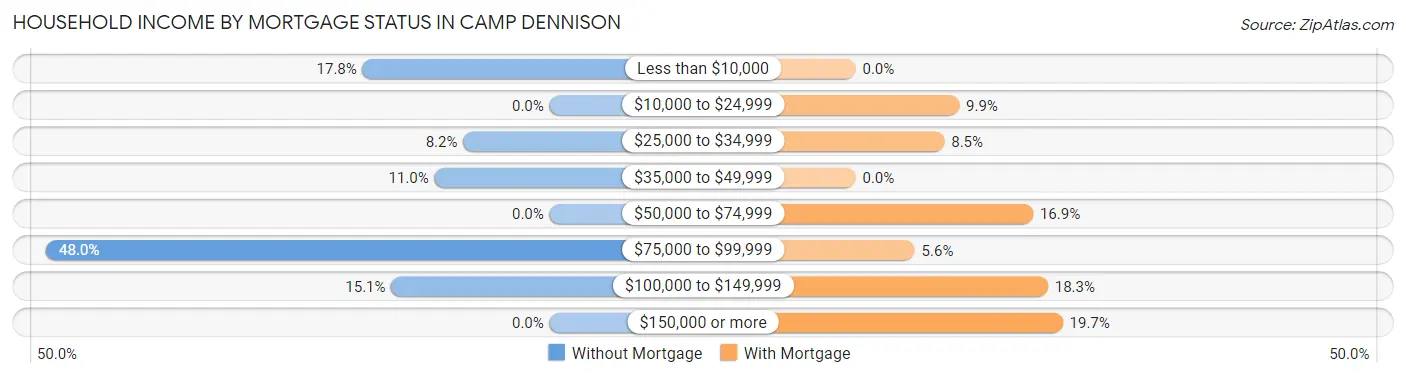
| Household Income | Without Mortgage | With Mortgage |
| Less than $10,000 | 13 (17.8%) | 0 (0.0%) |
| $10,000 to $24,999 | 0 (0.0%) | 7 (9.9%) |
| $25,000 to $34,999 | 6 (8.2%) | 6 (8.5%) |
| $35,000 to $49,999 | 8 (11.0%) | 0 (0.0%) |
| $50,000 to $74,999 | 0 (0.0%) | 12 (16.9%) |
| $75,000 to $99,999 | 35 (47.9%) | 4 (5.6%) |
| $100,000 to $149,999 | 11 (15.1%) | 13 (18.3%) |
| $150,000 or more | 0 (0.0%) | 14 (19.7%) |
| Total | 73 (100.0%) | 71 (100.0%) |
Property Value to Household Income Ratio in Camp Dennison
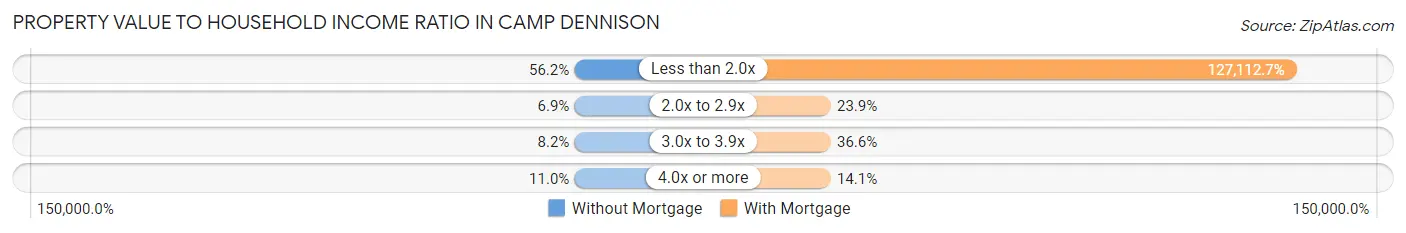
| Value-to-Income Ratio | Without Mortgage | With Mortgage |
| Less than 2.0x | 41 (56.2%) | 90,250 (127,112.7%) |
| 2.0x to 2.9x | 5 (6.9%) | 17 (23.9%) |
| 3.0x to 3.9x | 6 (8.2%) | 26 (36.6%) |
| 4.0x or more | 8 (11.0%) | 10 (14.1%) |
| Total | 73 (100.0%) | 71 (100.0%) |
Real Estate Taxes by Mortgage Status in Camp Dennison
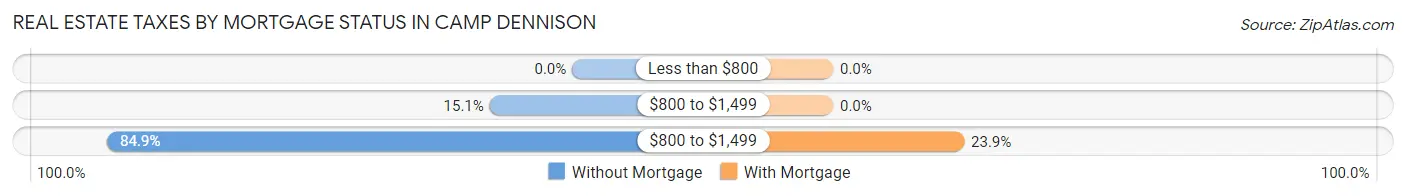
| Property Taxes | Without Mortgage | With Mortgage |
| Less than $800 | 0 (0.0%) | 0 (0.0%) |
| $800 to $1,499 | 11 (15.1%) | 0 (0.0%) |
| $800 to $1,499 | 62 (84.9%) | 17 (23.9%) |
| Total | 73 (100.0%) | 71 (100.0%) |
Health & Disability in Camp Dennison
Health Insurance Coverage by Age in Camp Dennison
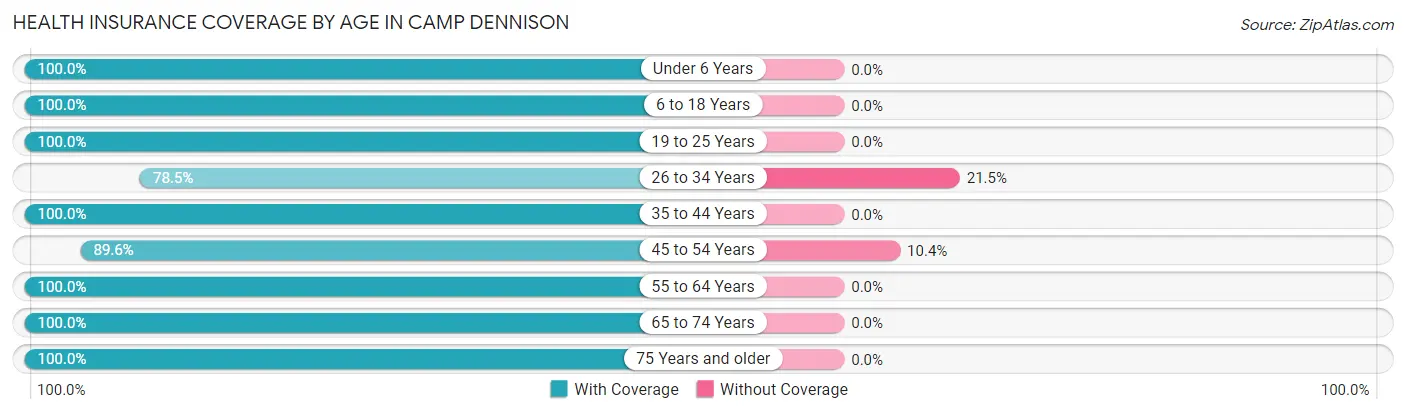
| Age Bracket | With Coverage | Without Coverage |
| Under 6 Years | 17 (100.0%) | 0 (0.0%) |
| 6 to 18 Years | 24 (100.0%) | 0 (0.0%) |
| 19 to 25 Years | 5 (100.0%) | 0 (0.0%) |
| 26 to 34 Years | 51 (78.5%) | 14 (21.5%) |
| 35 to 44 Years | 22 (100.0%) | 0 (0.0%) |
| 45 to 54 Years | 43 (89.6%) | 5 (10.4%) |
| 55 to 64 Years | 65 (100.0%) | 0 (0.0%) |
| 65 to 74 Years | 86 (100.0%) | 0 (0.0%) |
| 75 Years and older | 31 (100.0%) | 0 (0.0%) |
| Total | 344 (94.8%) | 19 (5.2%) |
Health Insurance Coverage by Citizenship Status in Camp Dennison
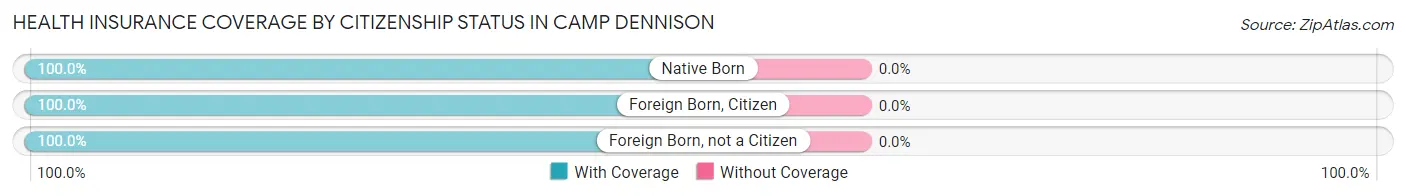
| Citizenship Status | With Coverage | Without Coverage |
| Native Born | 17 (100.0%) | 0 (0.0%) |
| Foreign Born, Citizen | 24 (100.0%) | 0 (0.0%) |
| Foreign Born, not a Citizen | 5 (100.0%) | 0 (0.0%) |
Health Insurance Coverage by Household Income in Camp Dennison
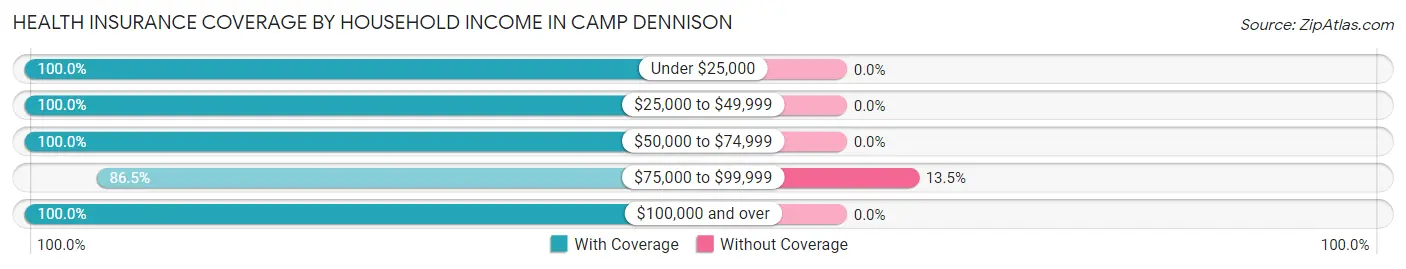
| Household Income | With Coverage | Without Coverage |
| Under $25,000 | 40 (100.0%) | 0 (0.0%) |
| $25,000 to $49,999 | 31 (100.0%) | 0 (0.0%) |
| $50,000 to $74,999 | 23 (100.0%) | 0 (0.0%) |
| $75,000 to $99,999 | 122 (86.5%) | 19 (13.5%) |
| $100,000 and over | 128 (100.0%) | 0 (0.0%) |
Public vs Private Health Insurance Coverage by Age in Camp Dennison
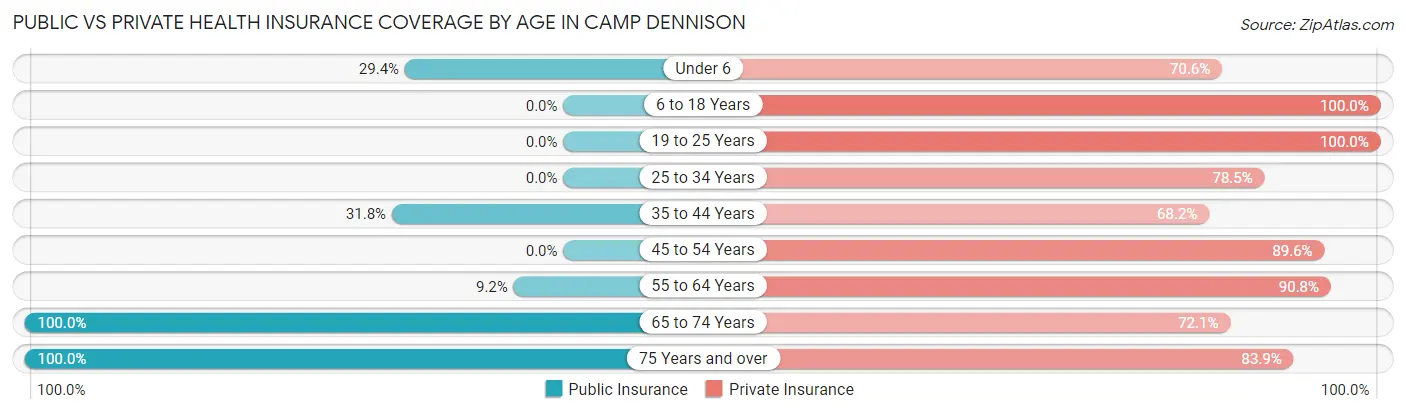
| Age Bracket | Public Insurance | Private Insurance |
| Under 6 | 5 (29.4%) | 12 (70.6%) |
| 6 to 18 Years | 0 (0.0%) | 24 (100.0%) |
| 19 to 25 Years | 0 (0.0%) | 5 (100.0%) |
| 25 to 34 Years | 0 (0.0%) | 51 (78.5%) |
| 35 to 44 Years | 7 (31.8%) | 15 (68.2%) |
| 45 to 54 Years | 0 (0.0%) | 43 (89.6%) |
| 55 to 64 Years | 6 (9.2%) | 59 (90.8%) |
| 65 to 74 Years | 86 (100.0%) | 62 (72.1%) |
| 75 Years and over | 31 (100.0%) | 26 (83.9%) |
| Total | 135 (37.2%) | 297 (81.8%) |
Disability Status by Sex by Age in Camp Dennison
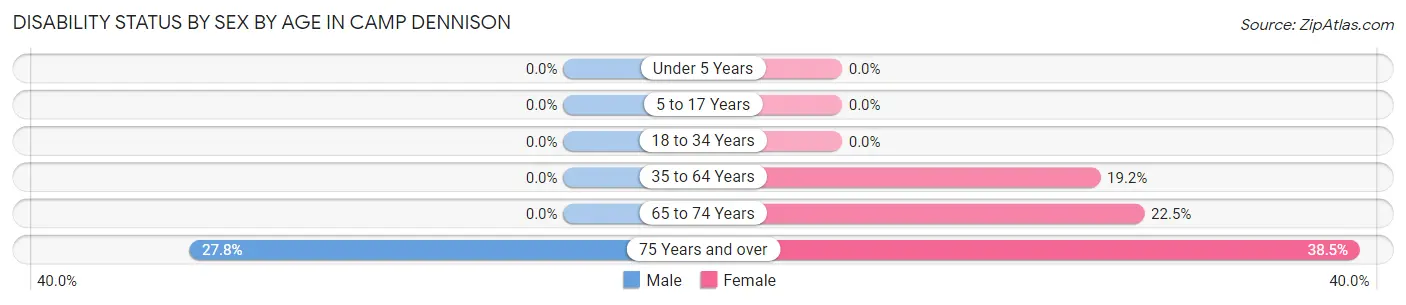
| Age Bracket | Male | Female |
| Under 5 Years | 0 (0.0%) | 0 (0.0%) |
| 5 to 17 Years | 0 (0.0%) | 0 (0.0%) |
| 18 to 34 Years | 0 (0.0%) | 0 (0.0%) |
| 35 to 64 Years | 0 (0.0%) | 14 (19.2%) |
| 65 to 74 Years | 0 (0.0%) | 11 (22.5%) |
| 75 Years and over | 5 (27.8%) | 5 (38.5%) |
Disability Class by Sex by Age in Camp Dennison
Disability Class: Hearing Difficulty
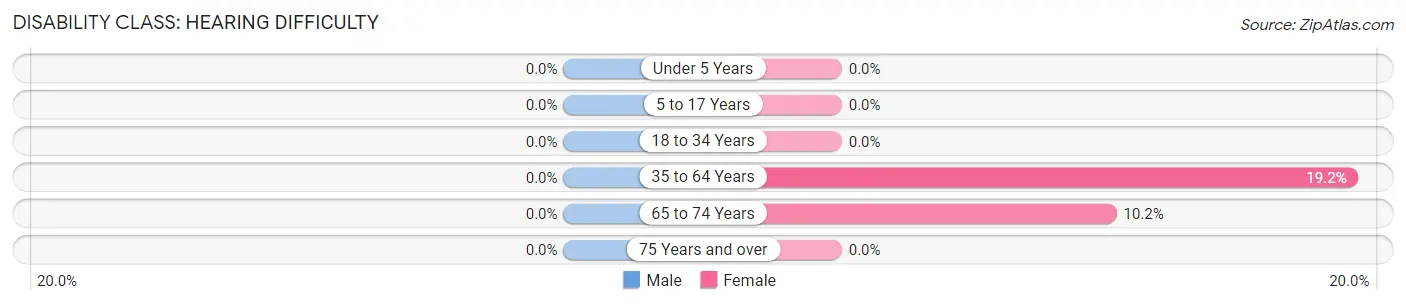
| Age Bracket | Male | Female |
| Under 5 Years | 0 (0.0%) | 0 (0.0%) |
| 5 to 17 Years | 0 (0.0%) | 0 (0.0%) |
| 18 to 34 Years | 0 (0.0%) | 0 (0.0%) |
| 35 to 64 Years | 0 (0.0%) | 14 (19.2%) |
| 65 to 74 Years | 0 (0.0%) | 5 (10.2%) |
| 75 Years and over | 0 (0.0%) | 0 (0.0%) |
Disability Class: Vision Difficulty
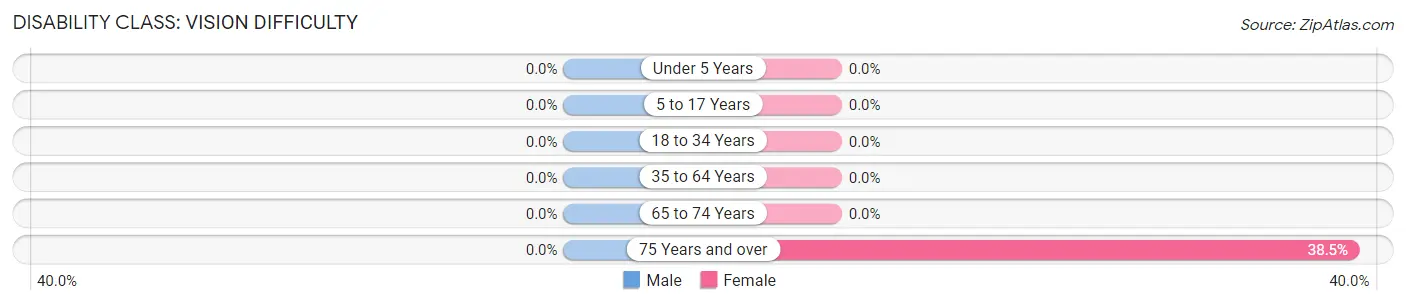
| Age Bracket | Male | Female |
| Under 5 Years | 0 (0.0%) | 0 (0.0%) |
| 5 to 17 Years | 0 (0.0%) | 0 (0.0%) |
| 18 to 34 Years | 0 (0.0%) | 0 (0.0%) |
| 35 to 64 Years | 0 (0.0%) | 0 (0.0%) |
| 65 to 74 Years | 0 (0.0%) | 0 (0.0%) |
| 75 Years and over | 0 (0.0%) | 5 (38.5%) |
Disability Class: Cognitive Difficulty
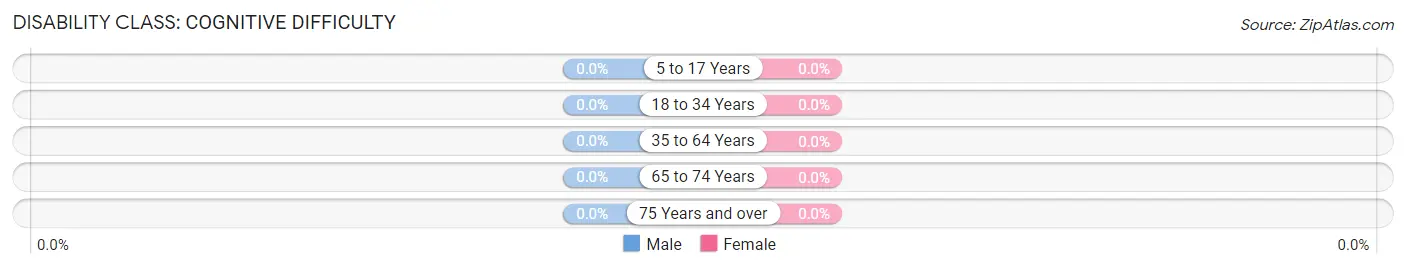
| Age Bracket | Male | Female |
| 5 to 17 Years | 0 (0.0%) | 0 (0.0%) |
| 18 to 34 Years | 0 (0.0%) | 0 (0.0%) |
| 35 to 64 Years | 0 (0.0%) | 0 (0.0%) |
| 65 to 74 Years | 0 (0.0%) | 0 (0.0%) |
| 75 Years and over | 0 (0.0%) | 0 (0.0%) |
Disability Class: Ambulatory Difficulty
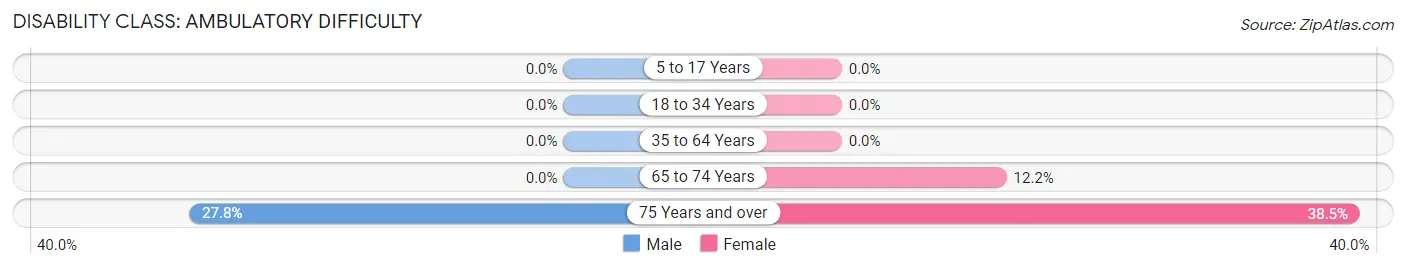
| Age Bracket | Male | Female |
| 5 to 17 Years | 0 (0.0%) | 0 (0.0%) |
| 18 to 34 Years | 0 (0.0%) | 0 (0.0%) |
| 35 to 64 Years | 0 (0.0%) | 0 (0.0%) |
| 65 to 74 Years | 0 (0.0%) | 6 (12.2%) |
| 75 Years and over | 5 (27.8%) | 5 (38.5%) |
Disability Class: Self-Care Difficulty
| Age Bracket | Male | Female |
| 5 to 17 Years | 0 (0.0%) | 0 (0.0%) |
| 18 to 34 Years | 0 (0.0%) | 0 (0.0%) |
| 35 to 64 Years | 0 (0.0%) | 0 (0.0%) |
| 65 to 74 Years | 0 (0.0%) | 0 (0.0%) |
| 75 Years and over | 0 (0.0%) | 0 (0.0%) |
Technology Access in Camp Dennison
Computing Device Access in Camp Dennison
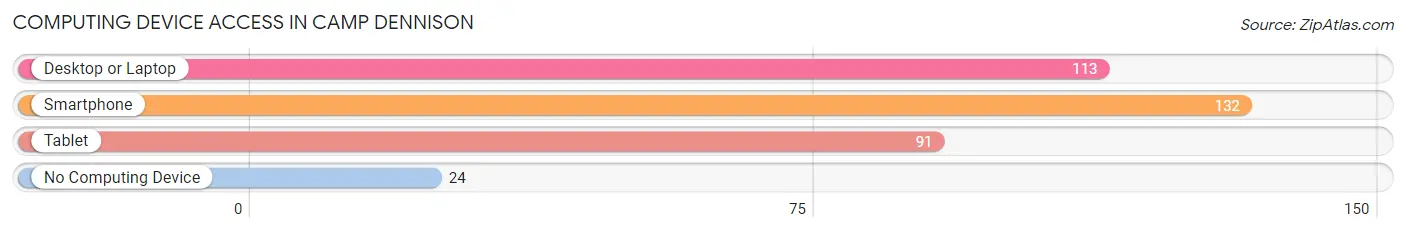
| Device Type | # Households | % Households |
| Desktop or Laptop | 113 | 72.4% |
| Smartphone | 132 | 84.6% |
| Tablet | 91 | 58.3% |
| No Computing Device | 24 | 15.4% |
| Total | 156 | 100.0% |
Internet Access in Camp Dennison
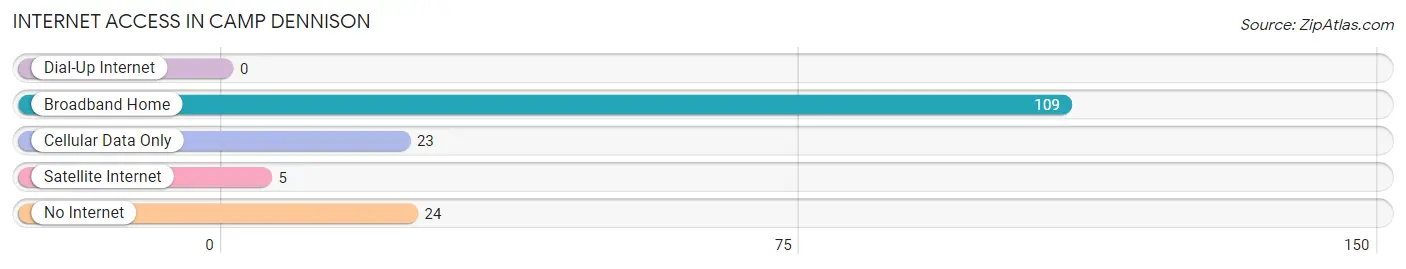
| Internet Type | # Households | % Households |
| Dial-Up Internet | 0 | 0.0% |
| Broadband Home | 109 | 69.9% |
| Cellular Data Only | 23 | 14.7% |
| Satellite Internet | 5 | 3.2% |
| No Internet | 24 | 15.4% |
| Total | 156 | 100.0% |
Camp Dennison Summary
Camp Dennison is a small unincorporated community located in Hamilton County, Ohio, United States. It is situated along the Little Miami River, approximately 15 miles northeast of Cincinnati. The community was founded in 1815 and named after William Dennison, the Governor of Ohio at the time.
History
Camp Dennison was founded in 1815 by General William H. Harrison, who was the Governor of the Northwest Territory at the time. The community was named after William Dennison, the Governor of Ohio. The community was originally established as a military camp during the War of 1812. The camp was used to train and house troops for the war effort. After the war, the camp was abandoned and the land was sold to settlers.
The first settlers in the area were mostly farmers and tradesmen. The community grew slowly over the years and by the mid-1800s, it had become a thriving agricultural community. The community was also home to several mills, including a grist mill, a saw mill, and a woolen mill.
In the late 1800s, Camp Dennison became a popular summer resort destination. The community was home to several hotels and resorts, as well as a golf course. The community also had a train station, which allowed visitors to easily travel to and from the area.
Geography
Camp Dennison is located in Hamilton County, Ohio, approximately 15 miles northeast of Cincinnati. The community is situated along the Little Miami River. The terrain in the area is mostly flat, with some rolling hills. The climate in the area is humid continental, with hot summers and cold winters.
Economy
The economy of Camp Dennison is largely based on agriculture and tourism. The community is home to several farms, which produce a variety of crops, including corn, soybeans, and wheat. The community is also home to several wineries, which produce a variety of wines.
The community is also home to several small businesses, including restaurants, shops, and other services. The community is also home to several bed and breakfasts, which attract visitors from all over the country.
Demographics
As of the 2010 census, the population of Camp Dennison was 1,845. The racial makeup of the community was 97.3% White, 0.7% African American, 0.2% Native American, 0.3% Asian, and 1.5% from other races. The median household income in the community was $50,938.
Conclusion
Camp Dennison is a small unincorporated community located in Hamilton County, Ohio. The community was founded in 1815 and named after William Dennison, the Governor of Ohio at the time. The economy of Camp Dennison is largely based on agriculture and tourism. As of the 2010 census, the population of Camp Dennison was 1,845. The racial makeup of the community was 97.3% White, 0.7% African American, 0.2% Native American, 0.3% Asian, and 1.5% from other races. The median household income in the community was $50,938.
Common Questions
What is Per Capita Income in Camp Dennison?
Per Capita income in Camp Dennison is $37,838.
What is the Median Family Income in Camp Dennison?
Median Family Income in Camp Dennison is $92,000.
What is the Median Household income in Camp Dennison?
Median Household Income in Camp Dennison is $88,393.
What is Income or Wage Gap in Camp Dennison?
Income or Wage Gap in Camp Dennison is 28.1%.
Women in Camp Dennison earn 71.9 cents for every dollar earned by a man.
What is Inequality or Gini Index in Camp Dennison?
Inequality or Gini Index in Camp Dennison is 0.37.
What is the Total Population of Camp Dennison?
Total Population of Camp Dennison is 363.
What is the Total Male Population of Camp Dennison?
Total Male Population of Camp Dennison is 166.
What is the Total Female Population of Camp Dennison?
Total Female Population of Camp Dennison is 197.
What is the Ratio of Males per 100 Females in Camp Dennison?
There are 84.26 Males per 100 Females in Camp Dennison.
What is the Ratio of Females per 100 Males in Camp Dennison?
There are 118.67 Females per 100 Males in Camp Dennison.
What is the Median Population Age in Camp Dennison?
Median Population Age in Camp Dennison is 57.0 Years.
What is the Average Family Size in Camp Dennison
Average Family Size in Camp Dennison is 2.7 People.
What is the Average Household Size in Camp Dennison
Average Household Size in Camp Dennison is 2.3 People.
How Large is the Labor Force in Camp Dennison?
There are 181 People in the Labor Forcein in Camp Dennison.
What is the Percentage of People in the Labor Force in Camp Dennison?
55.7% of People are in the Labor Force in Camp Dennison.