Lansing, OH Map & Demographics
Lansing Map
Lansing Overview
$26,959
PER CAPITA INCOME
0.4%
WAGE / INCOME GAP [ % ]
99.6¢/ $1
WAGE / INCOME GAP [ $ ]
0.34
INEQUALITY / GINI INDEX
285
TOTAL POPULATION
144
MALE POPULATION
141
FEMALE POPULATION
102.13
MALES / 100 FEMALES
97.92
FEMALES / 100 MALES
56.7
MEDIAN AGE
2.8
AVG FAMILY SIZE
2.0
AVG HOUSEHOLD SIZE
106
LABOR FORCE [ PEOPLE ]
44.9%
PERCENT IN LABOR FORCE
Lansing Zip Codes
Lansing Area Codes
Income in Lansing
Income Overview in Lansing
| Characteristic | Number | Measure |
| Per Capita Income | 285 | $26,959 |
| Median Family Income | 78 | $0 |
| Mean Family Income | 78 | $57,432 |
| Median Household Income | 139 | $0 |
| Mean Household Income | 139 | $54,896 |
| Income Deficit | 78 | $0 |
| Wage / Income Gap (%) | 285 | 0.36% |
| Wage / Income Gap ($) | 285 | 99.64¢ per $1 |
| Gini / Inequality Index | 285 | 0.34 |
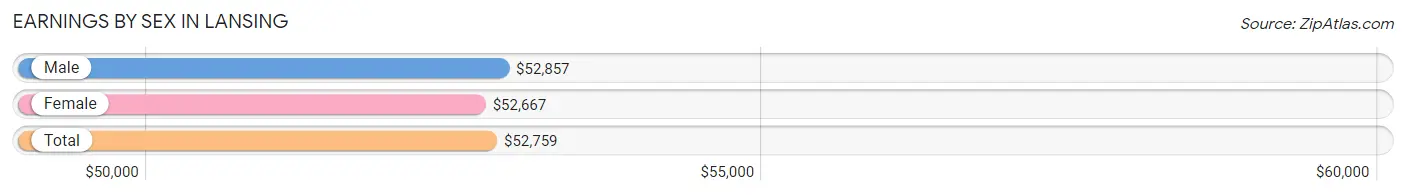
Earnings by Sex in Lansing
Average Earnings in Lansing are $52,759, $52,857 for men and $52,667 for women, a difference of 0.4%.
| Sex | Number | Average Earnings |
| Male | 58 (54.7%) | $52,857 |
| Female | 48 (45.3%) | $52,667 |
| Total | 106 (100.0%) | $52,759 |
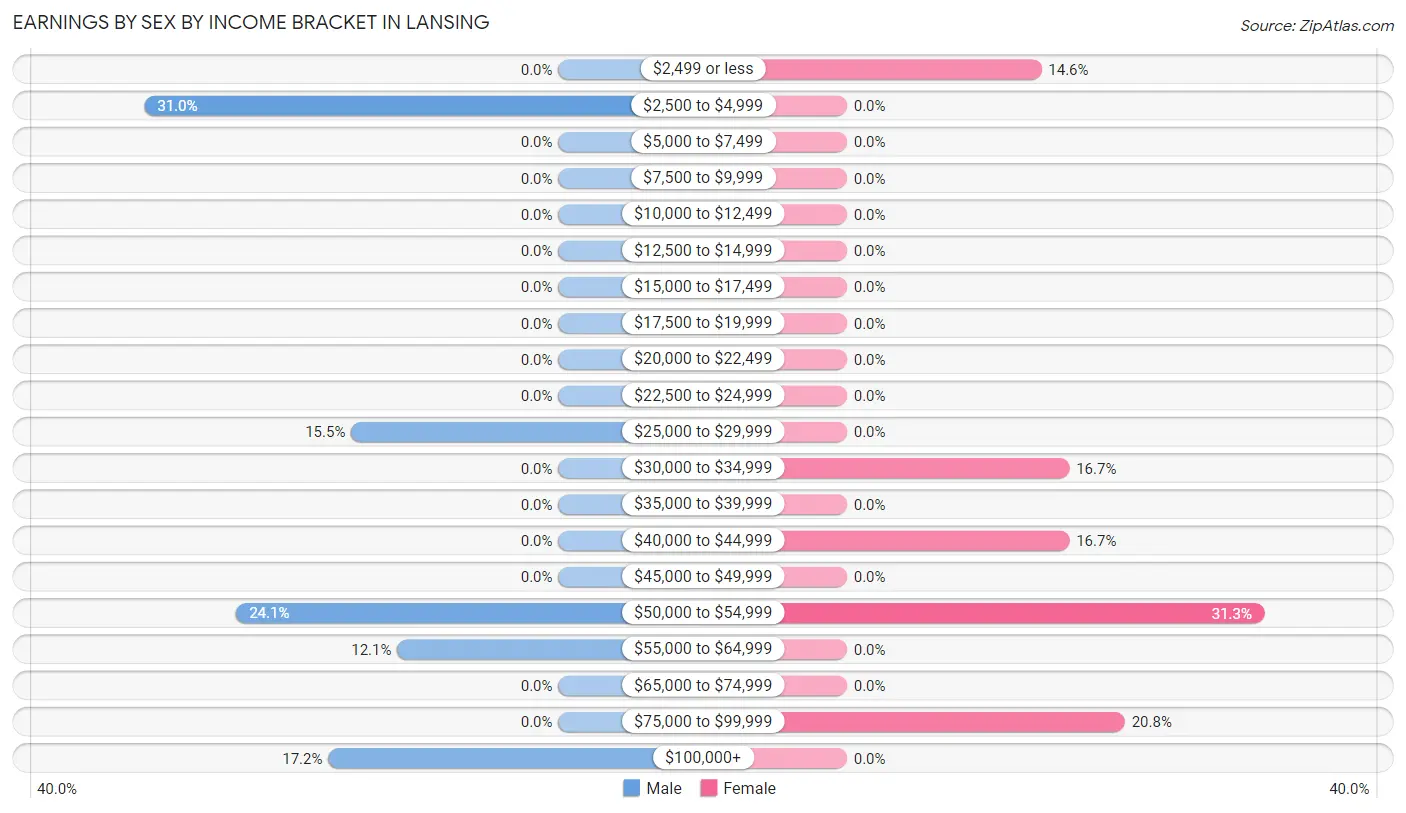
Earnings by Sex by Income Bracket in Lansing
The most common earnings brackets in Lansing are $2,500 to $4,999 for men (18 | 31.0%) and $50,000 to $54,999 for women (15 | 31.2%).
| Income | Male | Female |
| $2,499 or less | 0 (0.0%) | 7 (14.6%) |
| $2,500 to $4,999 | 18 (31.0%) | 0 (0.0%) |
| $5,000 to $7,499 | 0 (0.0%) | 0 (0.0%) |
| $7,500 to $9,999 | 0 (0.0%) | 0 (0.0%) |
| $10,000 to $12,499 | 0 (0.0%) | 0 (0.0%) |
| $12,500 to $14,999 | 0 (0.0%) | 0 (0.0%) |
| $15,000 to $17,499 | 0 (0.0%) | 0 (0.0%) |
| $17,500 to $19,999 | 0 (0.0%) | 0 (0.0%) |
| $20,000 to $22,499 | 0 (0.0%) | 0 (0.0%) |
| $22,500 to $24,999 | 0 (0.0%) | 0 (0.0%) |
| $25,000 to $29,999 | 9 (15.5%) | 0 (0.0%) |
| $30,000 to $34,999 | 0 (0.0%) | 8 (16.7%) |
| $35,000 to $39,999 | 0 (0.0%) | 0 (0.0%) |
| $40,000 to $44,999 | 0 (0.0%) | 8 (16.7%) |
| $45,000 to $49,999 | 0 (0.0%) | 0 (0.0%) |
| $50,000 to $54,999 | 14 (24.1%) | 15 (31.2%) |
| $55,000 to $64,999 | 7 (12.1%) | 0 (0.0%) |
| $65,000 to $74,999 | 0 (0.0%) | 0 (0.0%) |
| $75,000 to $99,999 | 0 (0.0%) | 10 (20.8%) |
| $100,000+ | 10 (17.2%) | 0 (0.0%) |
| Total | 58 (100.0%) | 48 (100.0%) |
Earnings by Sex by Educational Attainment in Lansing
| Educational Attainment | Male Income | Female Income |
| Less than High School | - | - |
| High School Diploma | - | - |
| College or Associate's Degree | - | - |
| Bachelor's Degree | - | - |
| Graduate Degree | - | - |
| Total | $53,839 | $52,667 |
Family Income in Lansing
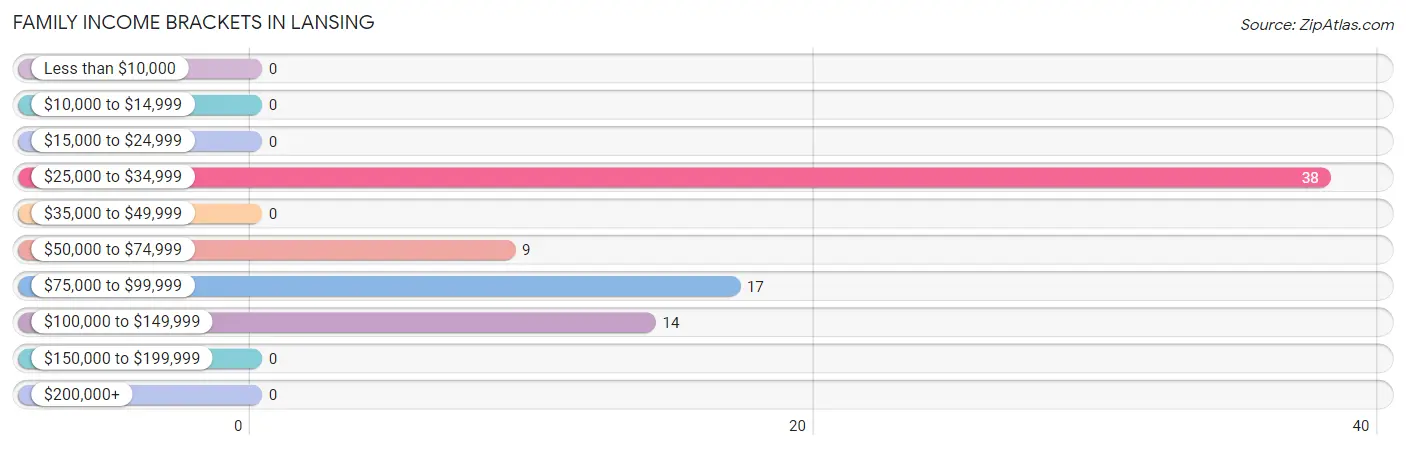
Family Income Brackets in Lansing
According to the Lansing family income data, there are 38 families falling into the $25,000 to $34,999 income range, which is the most common income bracket and makes up 48.7% of all families.
| Income Bracket | # Families | % Families |
| Less than $10,000 | 0 | 0.0% |
| $10,000 to $14,999 | 0 | 0.0% |
| $15,000 to $24,999 | 0 | 0.0% |
| $25,000 to $34,999 | 38 | 48.7% |
| $35,000 to $49,999 | 0 | 0.0% |
| $50,000 to $74,999 | 9 | 11.5% |
| $75,000 to $99,999 | 17 | 21.8% |
| $100,000 to $149,999 | 14 | 17.9% |
| $150,000 to $199,999 | 0 | 0.0% |
| $200,000+ | 0 | 0.0% |
Family Income by Famaliy Size in Lansing
| Income Bracket | # Families | Median Income |
| 2-Person Families | 57 (73.1%) | $0 |
| 3-Person Families | 7 (9.0%) | $0 |
| 4-Person Families | 0 (0.0%) | $0 |
| 5-Person Families | 14 (17.9%) | $0 |
| 6-Person Families | 0 (0.0%) | $0 |
| 7+ Person Families | 0 (0.0%) | $0 |
| Total | 78 (100.0%) | $0 |
Family Income by Number of Earners in Lansing
| Number of Earners | # Families | Median Income |
| No Earners | 57 (73.1%) | $0 |
| 1 Earner | 0 (0.0%) | $0 |
| 2 Earners | 14 (17.9%) | $0 |
| 3+ Earners | 7 (9.0%) | $0 |
| Total | 78 (100.0%) | $0 |
Household Income in Lansing
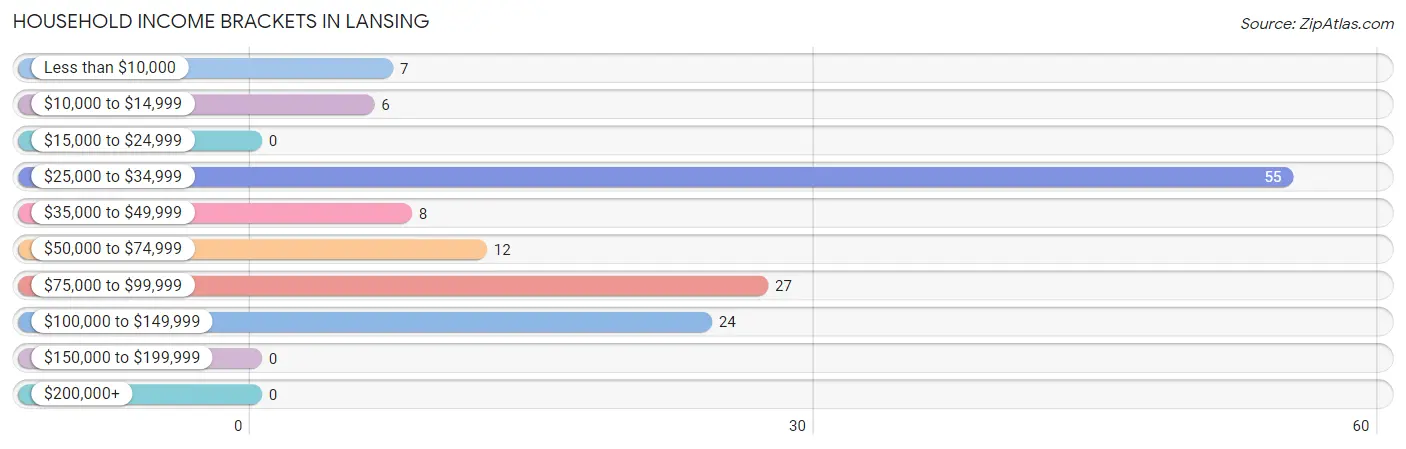
Household Income Brackets in Lansing
With 55 households falling in the category, the $25,000 to $34,999 income range is the most frequent in Lansing, accounting for 39.6% of all households.
| Income Bracket | # Households | % Households |
| Less than $10,000 | 7 | 5.0% |
| $10,000 to $14,999 | 6 | 4.3% |
| $15,000 to $24,999 | 0 | 0.0% |
| $25,000 to $34,999 | 55 | 39.6% |
| $35,000 to $49,999 | 8 | 5.8% |
| $50,000 to $74,999 | 12 | 8.6% |
| $75,000 to $99,999 | 27 | 19.4% |
| $100,000 to $149,999 | 24 | 17.3% |
| $150,000 to $199,999 | 0 | 0.0% |
| $200,000+ | 0 | 0.0% |
Household Income by Householder Age in Lansing
The median household income in Lansing is $0, with the highest median household income of $75,179 found in the 45 to 64 years age bracket for the primary householder. A total of 33 households (23.7%) fall into this category.
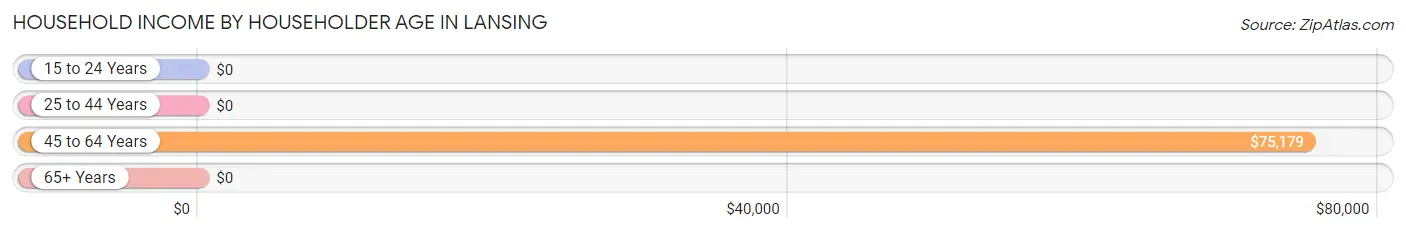
| Income Bracket | # Households | Median Income |
| 15 to 24 Years | 0 (0.0%) | $0 |
| 25 to 44 Years | 40 (28.8%) | $0 |
| 45 to 64 Years | 33 (23.7%) | $75,179 |
| 65+ Years | 66 (47.5%) | $0 |
| Total | 139 (100.0%) | $0 |
Poverty in Lansing
Income Below Poverty by Sex and Age in Lansing
With 4.9% poverty level for males and 4.3% for females among the residents of Lansing, 35 to 44 year old males and 75 year old and over females are the most vulnerable to poverty, with 7 males (33.3%) and 6 females (24.0%) in their respective age groups living below the poverty level.
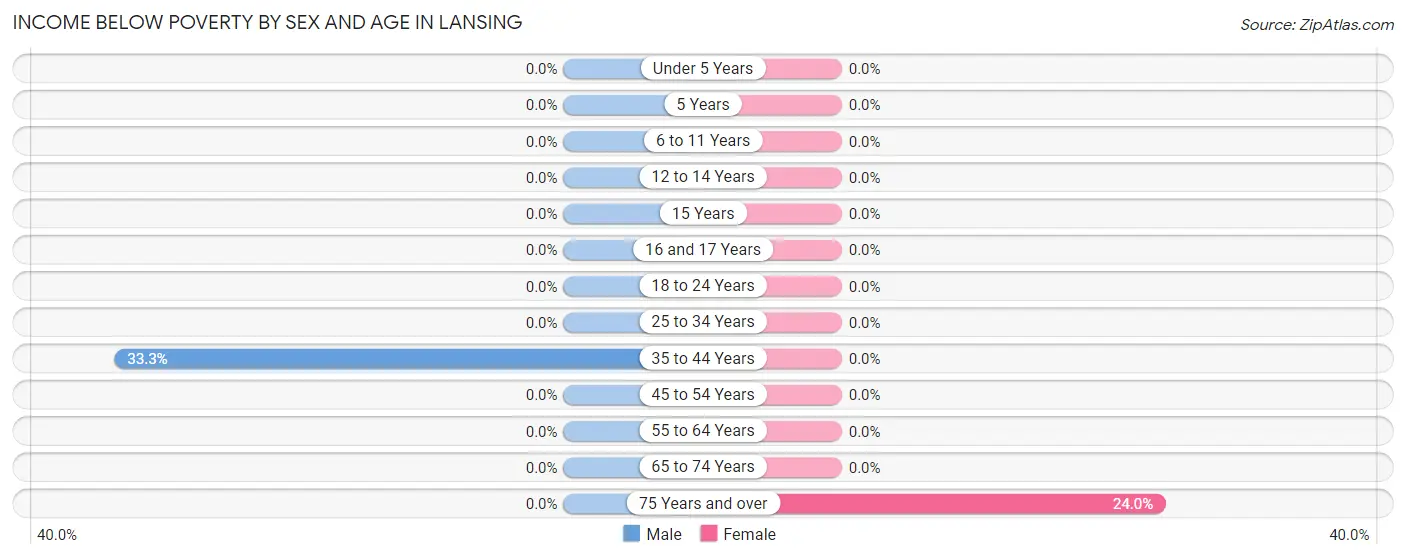
| Age Bracket | Male | Female |
| Under 5 Years | 0 (0.0%) | 0 (0.0%) |
| 5 Years | 0 (0.0%) | 0 (0.0%) |
| 6 to 11 Years | 0 (0.0%) | 0 (0.0%) |
| 12 to 14 Years | 0 (0.0%) | 0 (0.0%) |
| 15 Years | 0 (0.0%) | 0 (0.0%) |
| 16 and 17 Years | 0 (0.0%) | 0 (0.0%) |
| 18 to 24 Years | 0 (0.0%) | 0 (0.0%) |
| 25 to 34 Years | 0 (0.0%) | 0 (0.0%) |
| 35 to 44 Years | 7 (33.3%) | 0 (0.0%) |
| 45 to 54 Years | 0 (0.0%) | 0 (0.0%) |
| 55 to 64 Years | 0 (0.0%) | 0 (0.0%) |
| 65 to 74 Years | 0 (0.0%) | 0 (0.0%) |
| 75 Years and over | 0 (0.0%) | 6 (24.0%) |
| Total | 7 (4.9%) | 6 (4.3%) |
Income Above Poverty by Sex and Age in Lansing
According to the poverty statistics in Lansing, males aged 6 to 11 years and females aged under 5 years are the age groups that are most secure financially, with 100.0% of males and 100.0% of females in these age groups living above the poverty line.
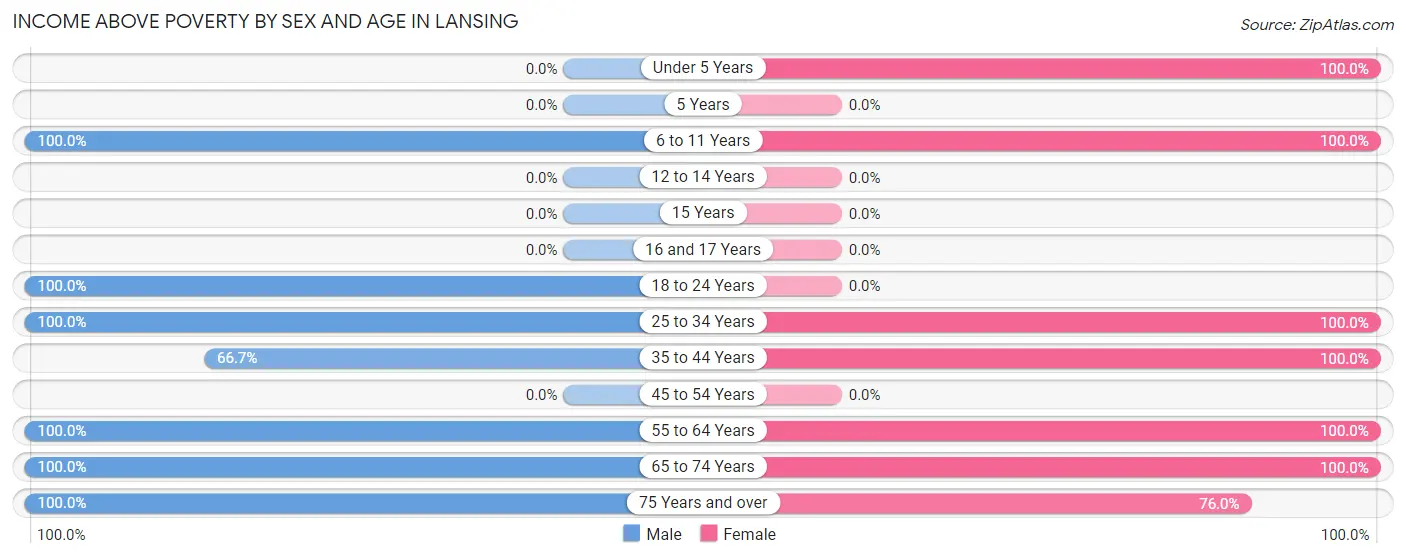
| Age Bracket | Male | Female |
| Under 5 Years | 0 (0.0%) | 17 (100.0%) |
| 5 Years | 0 (0.0%) | 0 (0.0%) |
| 6 to 11 Years | 16 (100.0%) | 16 (100.0%) |
| 12 to 14 Years | 0 (0.0%) | 0 (0.0%) |
| 15 Years | 0 (0.0%) | 0 (0.0%) |
| 16 and 17 Years | 0 (0.0%) | 0 (0.0%) |
| 18 to 24 Years | 11 (100.0%) | 0 (0.0%) |
| 25 to 34 Years | 9 (100.0%) | 10 (100.0%) |
| 35 to 44 Years | 14 (66.7%) | 15 (100.0%) |
| 45 to 54 Years | 0 (0.0%) | 0 (0.0%) |
| 55 to 64 Years | 26 (100.0%) | 23 (100.0%) |
| 65 to 74 Years | 38 (100.0%) | 35 (100.0%) |
| 75 Years and over | 23 (100.0%) | 19 (76.0%) |
| Total | 137 (95.1%) | 135 (95.7%) |
Income Below Poverty Among Married-Couple Families in Lansing
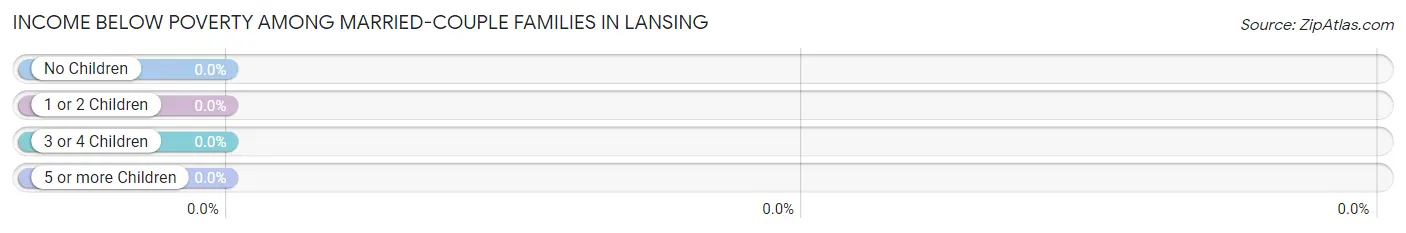
| Children | Above Poverty | Below Poverty |
| No Children | 64 (100.0%) | 0 (0.0%) |
| 1 or 2 Children | 0 (0.0%) | 0 (0.0%) |
| 3 or 4 Children | 14 (100.0%) | 0 (0.0%) |
| 5 or more Children | 0 (0.0%) | 0 (0.0%) |
| Total | 78 (100.0%) | 0 (0.0%) |
Income Below Poverty Among Single-Parent Households in Lansing
| Children | Single Father | Single Mother |
| No Children | 0 (0.0%) | 0 (0.0%) |
| 1 or 2 Children | 0 (0.0%) | 0 (0.0%) |
| 3 or 4 Children | 0 (0.0%) | 0 (0.0%) |
| 5 or more Children | 0 (0.0%) | 0 (0.0%) |
| Total | 0 (0.0%) | 0 (0.0%) |
Income Below Poverty Among Married-Couple vs Single-Parent Households in Lansing
| Children | Married-Couple Families | Single-Parent Households |
| No Children | 0 (0.0%) | 0 (0.0%) |
| 1 or 2 Children | 0 (0.0%) | 0 (0.0%) |
| 3 or 4 Children | 0 (0.0%) | 0 (0.0%) |
| 5 or more Children | 0 (0.0%) | 0 (0.0%) |
| Total | 0 (0.0%) | 0 (0.0%) |
Race in Lansing
The most populous races in Lansing are , and White / Caucasian (285 | 100.0%).
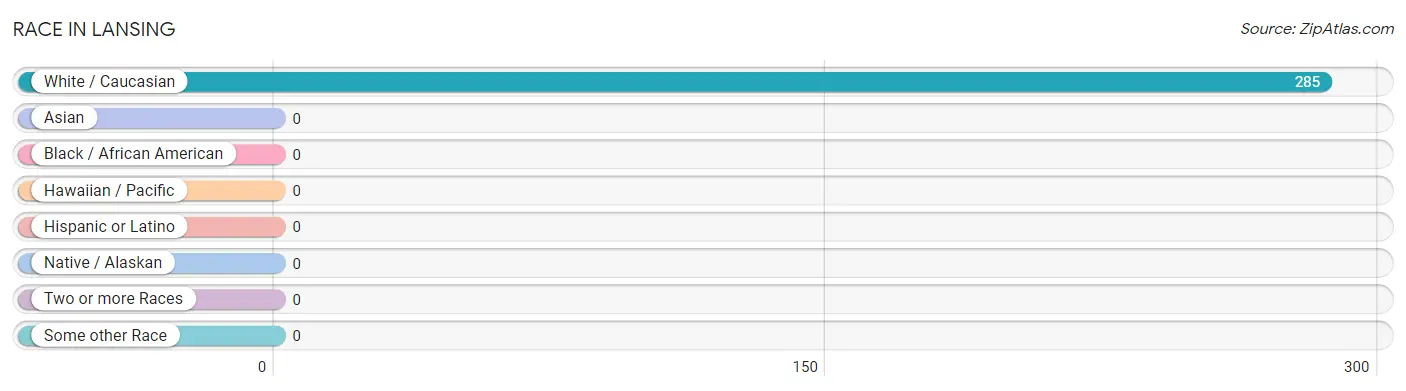
| Race | # Population | % Population |
| Asian | 0 | 0.0% |
| Black / African American | 0 | 0.0% |
| Hawaiian / Pacific | 0 | 0.0% |
| Hispanic or Latino | 0 | 0.0% |
| Native / Alaskan | 0 | 0.0% |
| White / Caucasian | 285 | 100.0% |
| Two or more Races | 0 | 0.0% |
| Some other Race | 0 | 0.0% |
| Total | 285 | 100.0% |
Ancestry in Lansing
The most populous ancestries reported in Lansing are German (101 | 35.4%), Polish (73 | 25.6%), Irish (54 | 19.0%), Czech (38 | 13.3%), and Italian (17 | 6.0%), together accounting for 99.3% of all Lansing residents.
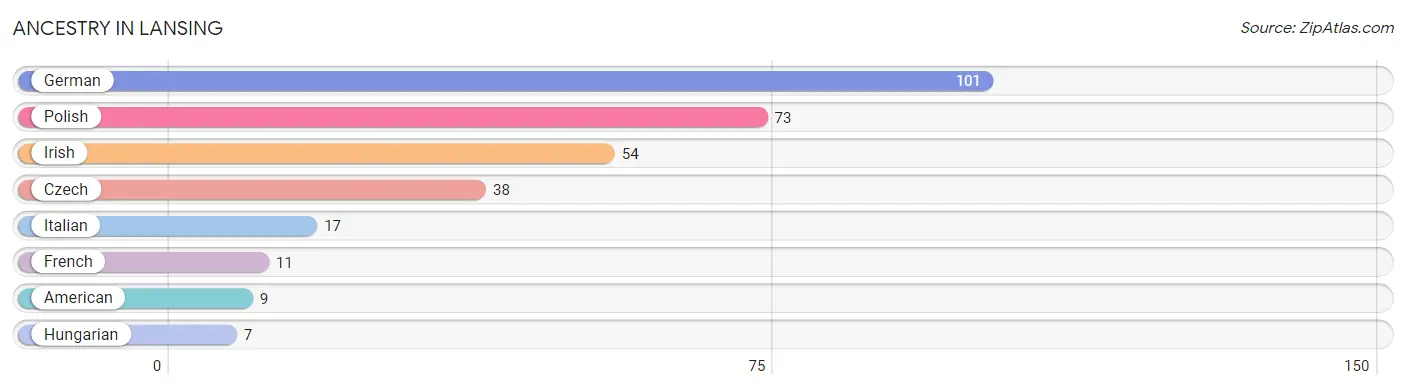
| Ancestry | # Population | % Population |
| American | 9 | 3.2% |
| Czech | 38 | 13.3% |
| French | 11 | 3.9% |
| German | 101 | 35.4% |
| Hungarian | 7 | 2.5% |
| Irish | 54 | 19.0% |
| Italian | 17 | 6.0% |
| Polish | 73 | 25.6% | View All 8 Rows |
Immigrants in Lansing

| Immigration Origin | # Population | % Population | View All 0 Rows |
Sex and Age in Lansing
Sex and Age in Lansing
The most populous age groups in Lansing are 70 to 74 Years (38 | 26.4%) for men and 70 to 74 Years (35 | 24.8%) for women.
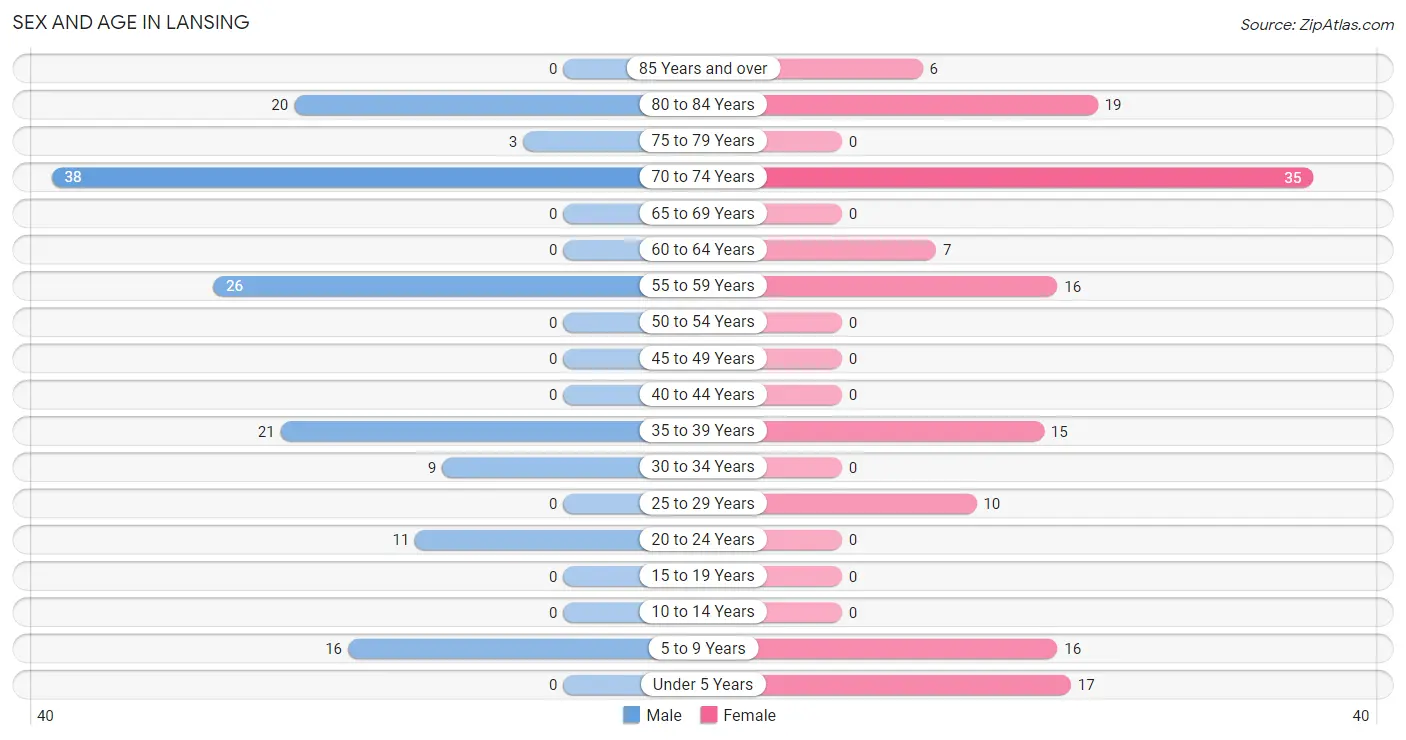
| Age Bracket | Male | Female |
| Under 5 Years | 0 (0.0%) | 17 (12.1%) |
| 5 to 9 Years | 16 (11.1%) | 16 (11.4%) |
| 10 to 14 Years | 0 (0.0%) | 0 (0.0%) |
| 15 to 19 Years | 0 (0.0%) | 0 (0.0%) |
| 20 to 24 Years | 11 (7.6%) | 0 (0.0%) |
| 25 to 29 Years | 0 (0.0%) | 10 (7.1%) |
| 30 to 34 Years | 9 (6.2%) | 0 (0.0%) |
| 35 to 39 Years | 21 (14.6%) | 15 (10.6%) |
| 40 to 44 Years | 0 (0.0%) | 0 (0.0%) |
| 45 to 49 Years | 0 (0.0%) | 0 (0.0%) |
| 50 to 54 Years | 0 (0.0%) | 0 (0.0%) |
| 55 to 59 Years | 26 (18.1%) | 16 (11.4%) |
| 60 to 64 Years | 0 (0.0%) | 7 (5.0%) |
| 65 to 69 Years | 0 (0.0%) | 0 (0.0%) |
| 70 to 74 Years | 38 (26.4%) | 35 (24.8%) |
| 75 to 79 Years | 3 (2.1%) | 0 (0.0%) |
| 80 to 84 Years | 20 (13.9%) | 19 (13.5%) |
| 85 Years and over | 0 (0.0%) | 6 (4.3%) |
| Total | 144 (100.0%) | 141 (100.0%) |
Families and Households in Lansing
Median Family Size in Lansing
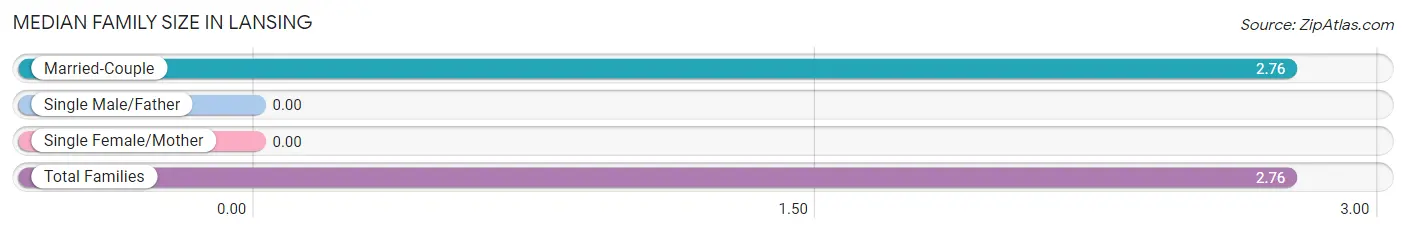
| Family Type | # Families | Family Size |
| Married-Couple | 78 (100.0%) | 2.76 |
| Single Male/Father | 0 (0.0%) | - |
| Single Female/Mother | 0 (0.0%) | - |
| Total Families | 78 (100.0%) | 2.76 |
Median Household Size in Lansing
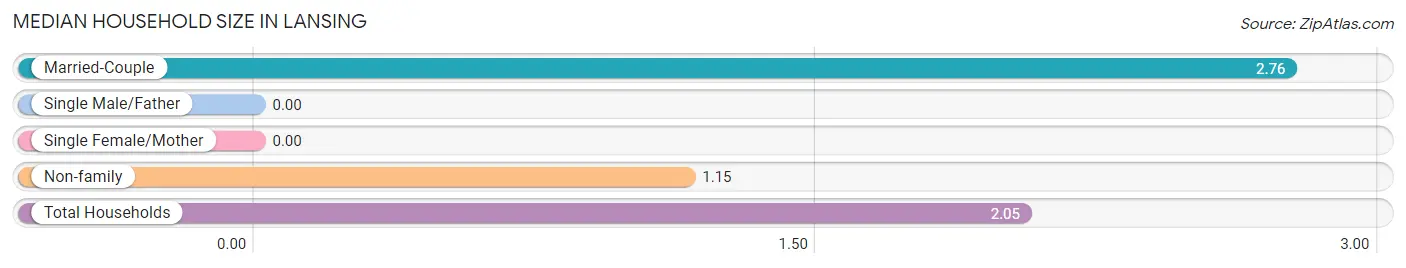
| Household Type | # Households | Household Size |
| Married-Couple | 78 (56.1%) | 2.76 |
| Single Male/Father | 0 (0.0%) | - |
| Single Female/Mother | 0 (0.0%) | - |
| Non-family | 61 (43.9%) | 1.15 |
| Total Households | 139 (100.0%) | 2.05 |
Household Size by Marriage Status in Lansing
Out of a total of 139 households in Lansing, 78 (56.1%) are family households, while 61 (43.9%) are nonfamily households. The most numerous type of family households are 2-person households, comprising 57, and the most common type of nonfamily households are 1-person households, comprising 51.
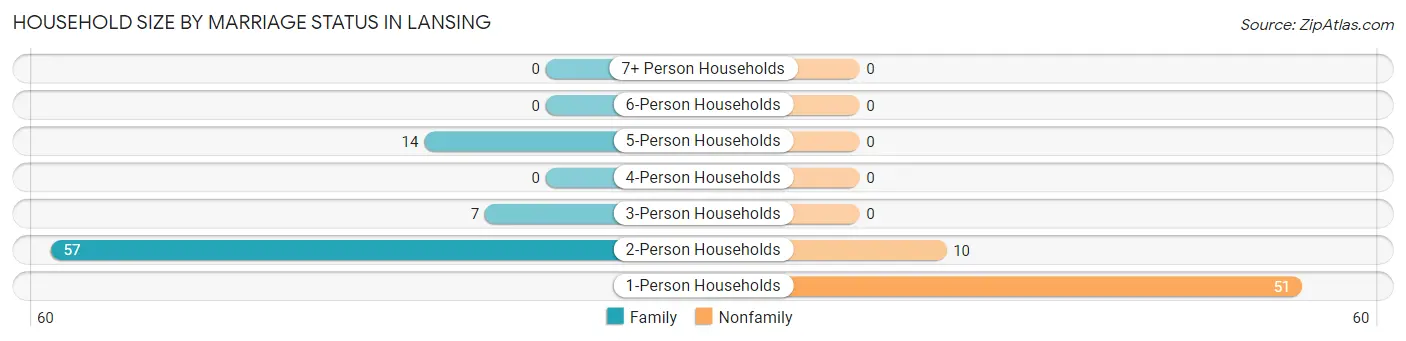
| Household Size | Family Households | Nonfamily Households |
| 1-Person Households | - | 51 (36.7%) |
| 2-Person Households | 57 (41.0%) | 10 (7.2%) |
| 3-Person Households | 7 (5.0%) | 0 (0.0%) |
| 4-Person Households | 0 (0.0%) | 0 (0.0%) |
| 5-Person Households | 14 (10.1%) | 0 (0.0%) |
| 6-Person Households | 0 (0.0%) | 0 (0.0%) |
| 7+ Person Households | 0 (0.0%) | 0 (0.0%) |
| Total | 78 (56.1%) | 61 (43.9%) |
Female Fertility in Lansing
Fertility by Age in Lansing
| Age Bracket | Women with Births | Births / 1,000 Women |
| 15 to 19 years | 0 (0.0%) | 0.0 |
| 20 to 34 years | 0 (0.0%) | 0.0 |
| 35 to 50 years | 0 (0.0%) | 0.0 |
| Total | 0 (0.0%) | 0.0 |
Fertility by Age by Marriage Status in Lansing
| Age Bracket | Married | Unmarried |
| 15 to 19 years | 0 (0.0%) | 0 (0.0%) |
| 20 to 34 years | 0 (0.0%) | 0 (0.0%) |
| 35 to 50 years | 0 (0.0%) | 0 (0.0%) |
| Total | 0 (0.0%) | 0 (0.0%) |
Fertility by Education in Lansing
| Educational Attainment | Women with Births | Births / 1,000 Women |
| Less than High School | 0 (0.0%) | 0.0 |
| High School Diploma | 0 (0.0%) | 0.0 |
| College or Associate's Degree | 0 (0.0%) | 0.0 |
| Bachelor's Degree | 0 (0.0%) | 0.0 |
| Graduate Degree | 0 (0.0%) | 0.0 |
| Total | 0 (0.0%) | 0.0 |
Fertility by Education by Marriage Status in Lansing
| Educational Attainment | Married | Unmarried |
| Less than High School | 0 (0.0%) | 0 (0.0%) |
| High School Diploma | 0 (0.0%) | 0 (0.0%) |
| College or Associate's Degree | 0 (0.0%) | 0 (0.0%) |
| Bachelor's Degree | 0 (0.0%) | 0 (0.0%) |
| Graduate Degree | 0 (0.0%) | 0 (0.0%) |
| Total | 0 (0.0%) | 0 (0.0%) |
Employment Characteristics in Lansing
Employment by Class of Employer in Lansing
Among the 106 employed individuals in Lansing, private company employees (82 | 77.4%), federal government employees (9 | 8.5%), and local government employees (8 | 7.5%) make up the most common classes of employment.
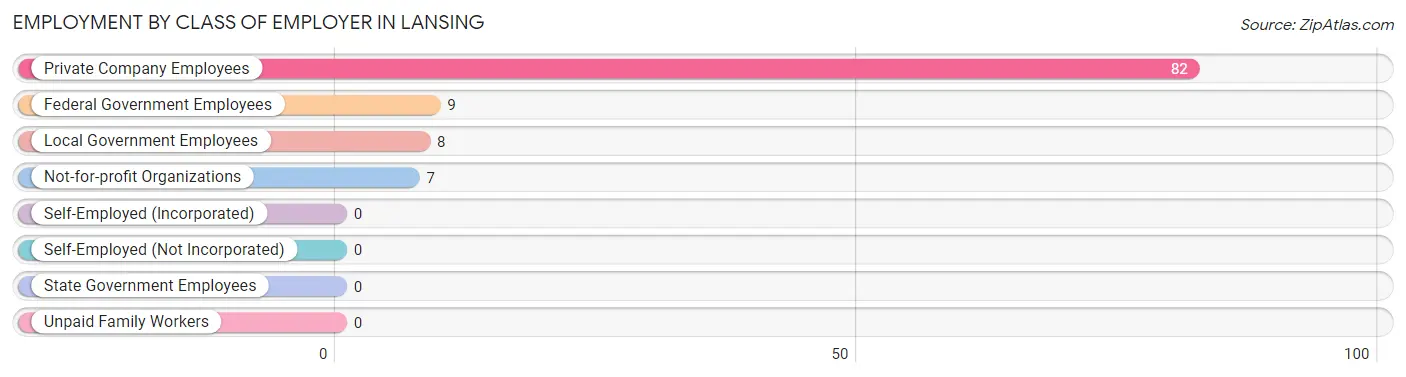
| Employer Class | # Employees | % Employees |
| Private Company Employees | 82 | 77.4% |
| Self-Employed (Incorporated) | 0 | 0.0% |
| Self-Employed (Not Incorporated) | 0 | 0.0% |
| Not-for-profit Organizations | 7 | 6.6% |
| Local Government Employees | 8 | 7.5% |
| State Government Employees | 0 | 0.0% |
| Federal Government Employees | 9 | 8.5% |
| Unpaid Family Workers | 0 | 0.0% |
| Total | 106 | 100.0% |
Employment Status by Age in Lansing
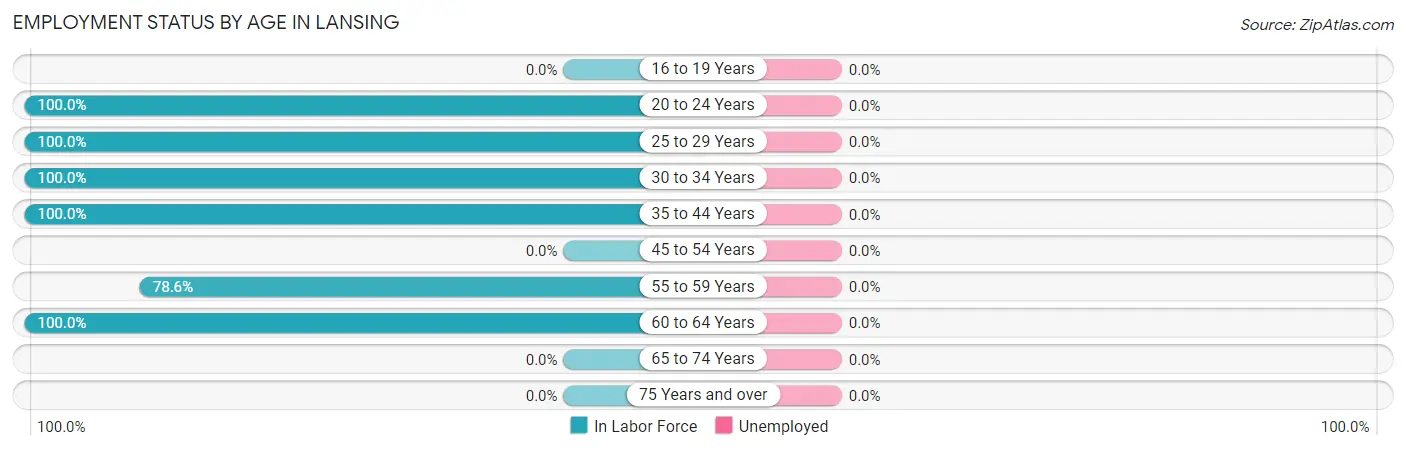
| Age Bracket | In Labor Force | Unemployed |
| 16 to 19 Years | 0 (0.0%) | 0 (0.0%) |
| 20 to 24 Years | 11 (100.0%) | 0 (0.0%) |
| 25 to 29 Years | 10 (100.0%) | 0 (0.0%) |
| 30 to 34 Years | 9 (100.0%) | 0 (0.0%) |
| 35 to 44 Years | 36 (100.0%) | 0 (0.0%) |
| 45 to 54 Years | 0 (0.0%) | 0 (0.0%) |
| 55 to 59 Years | 33 (78.6%) | 0 (0.0%) |
| 60 to 64 Years | 7 (100.0%) | 0 (0.0%) |
| 65 to 74 Years | 0 (0.0%) | 0 (0.0%) |
| 75 Years and over | 0 (0.0%) | 0 (0.0%) |
| Total | 106 (44.9%) | 0 (0.0%) |
Employment Status by Educational Attainment in Lansing
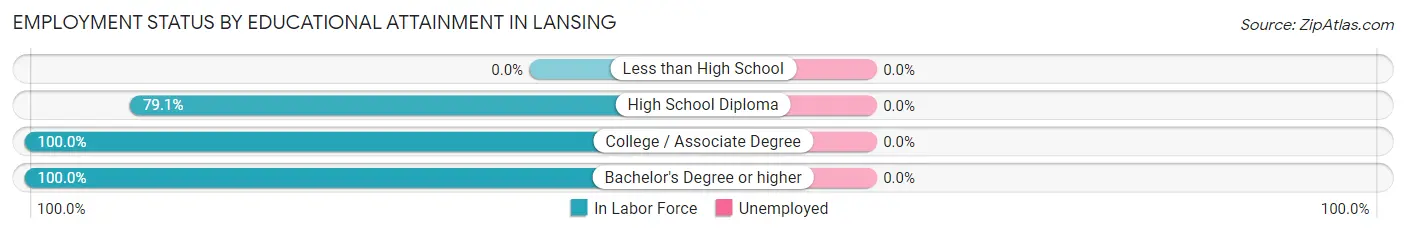
| Educational Attainment | In Labor Force | Unemployed |
| Less than High School | 0 (0.0%) | 0 (0.0%) |
| High School Diploma | 34 (79.1%) | 0 (0.0%) |
| College / Associate Degree | 15 (100.0%) | 0 (0.0%) |
| Bachelor's Degree or higher | 46 (100.0%) | 0 (0.0%) |
| Total | 95 (91.3%) | 0 (0.0%) |
Employment Occupations by Sex in Lansing
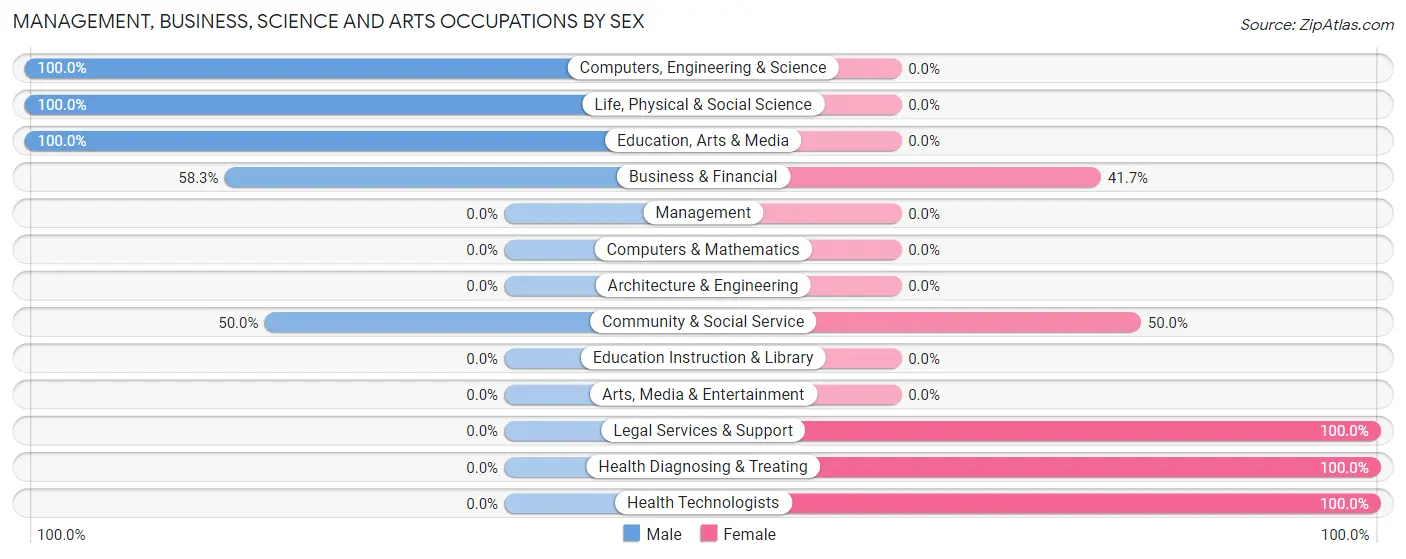
Management, Business, Science and Arts Occupations
The most common Management, Business, Science and Arts occupations in Lansing are Business & Financial (24 | 22.6%), Health Diagnosing & Treating (23 | 21.7%), Health Technologists (23 | 21.7%), Community & Social Service (14 | 13.2%), and Computers, Engineering & Science (10 | 9.4%).
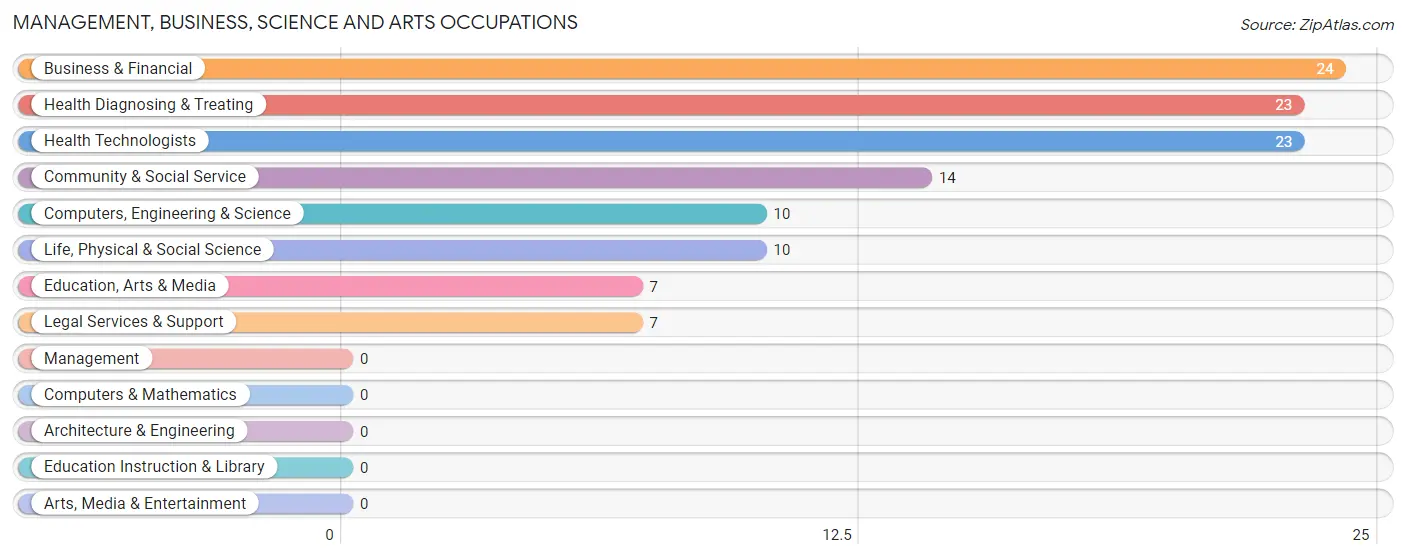
Management, Business, Science and Arts Occupations by Sex
Within the Management, Business, Science and Arts occupations in Lansing, the most male-oriented occupations are Computers, Engineering & Science (100.0%), Life, Physical & Social Science (100.0%), and Education, Arts & Media (100.0%), while the most female-oriented occupations are Legal Services & Support (100.0%), Health Diagnosing & Treating (100.0%), and Health Technologists (100.0%).
| Occupation | Male | Female |
| Management | 0 (0.0%) | 0 (0.0%) |
| Business & Financial | 14 (58.3%) | 10 (41.7%) |
| Computers, Engineering & Science | 10 (100.0%) | 0 (0.0%) |
| Computers & Mathematics | 0 (0.0%) | 0 (0.0%) |
| Architecture & Engineering | 0 (0.0%) | 0 (0.0%) |
| Life, Physical & Social Science | 10 (100.0%) | 0 (0.0%) |
| Community & Social Service | 7 (50.0%) | 7 (50.0%) |
| Education, Arts & Media | 7 (100.0%) | 0 (0.0%) |
| Legal Services & Support | 0 (0.0%) | 7 (100.0%) |
| Education Instruction & Library | 0 (0.0%) | 0 (0.0%) |
| Arts, Media & Entertainment | 0 (0.0%) | 0 (0.0%) |
| Health Diagnosing & Treating | 0 (0.0%) | 23 (100.0%) |
| Health Technologists | 0 (0.0%) | 23 (100.0%) |
| Total (Category) | 31 (43.7%) | 40 (56.3%) |
| Total (Overall) | 58 (54.7%) | 48 (45.3%) |
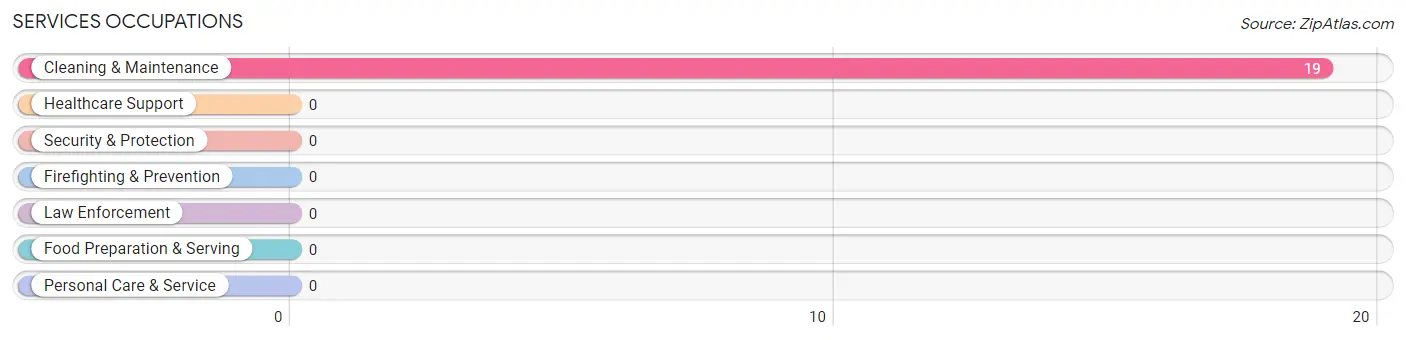
Services Occupations
The most common Services occupations in Lansing are , and Cleaning & Maintenance (19 | 17.9%).
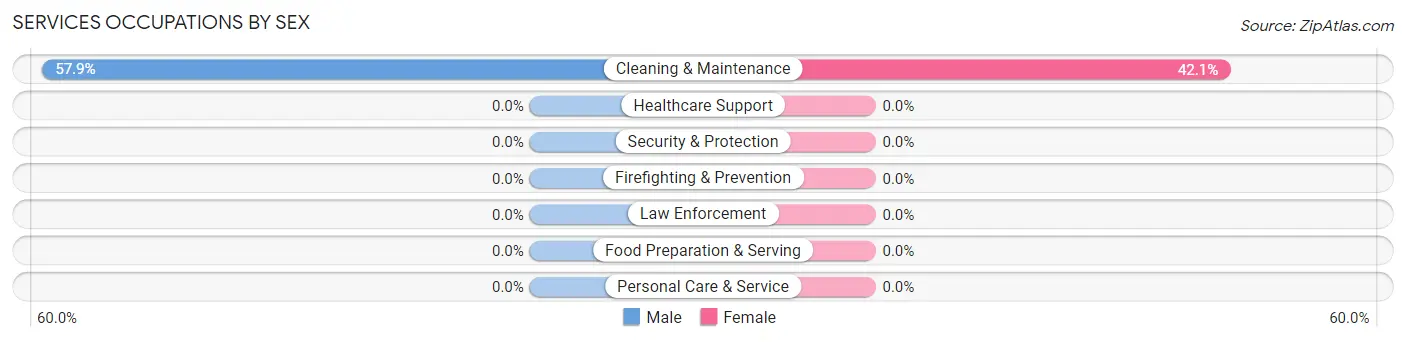
Services Occupations by Sex
| Occupation | Male | Female |
| Healthcare Support | 0 (0.0%) | 0 (0.0%) |
| Security & Protection | 0 (0.0%) | 0 (0.0%) |
| Firefighting & Prevention | 0 (0.0%) | 0 (0.0%) |
| Law Enforcement | 0 (0.0%) | 0 (0.0%) |
| Food Preparation & Serving | 0 (0.0%) | 0 (0.0%) |
| Cleaning & Maintenance | 11 (57.9%) | 8 (42.1%) |
| Personal Care & Service | 0 (0.0%) | 0 (0.0%) |
| Total (Category) | 11 (57.9%) | 8 (42.1%) |
| Total (Overall) | 58 (54.7%) | 48 (45.3%) |
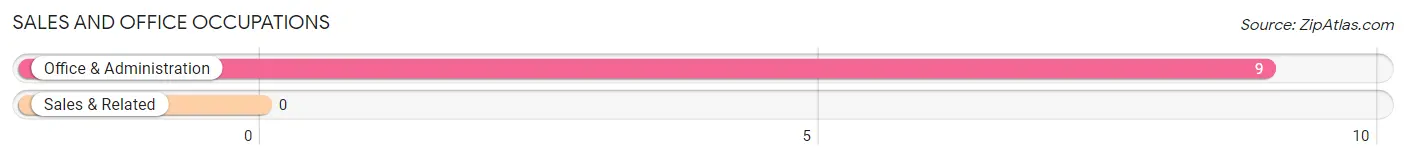
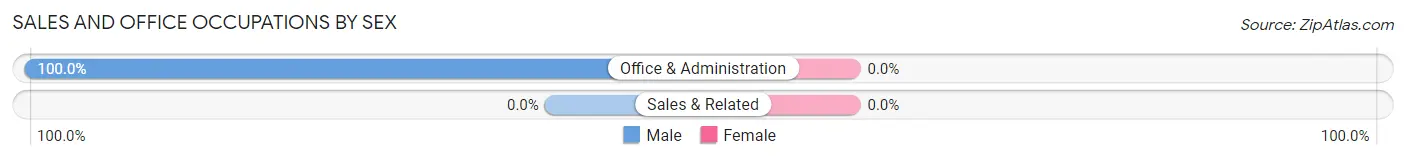
Sales and Office Occupations
The most common Sales and Office occupations in Lansing are , and Office & Administration (9 | 8.5%).
Sales and Office Occupations by Sex
| Occupation | Male | Female |
| Sales & Related | 0 (0.0%) | 0 (0.0%) |
| Office & Administration | 9 (100.0%) | 0 (0.0%) |
| Total (Category) | 9 (100.0%) | 0 (0.0%) |
| Total (Overall) | 58 (54.7%) | 48 (45.3%) |
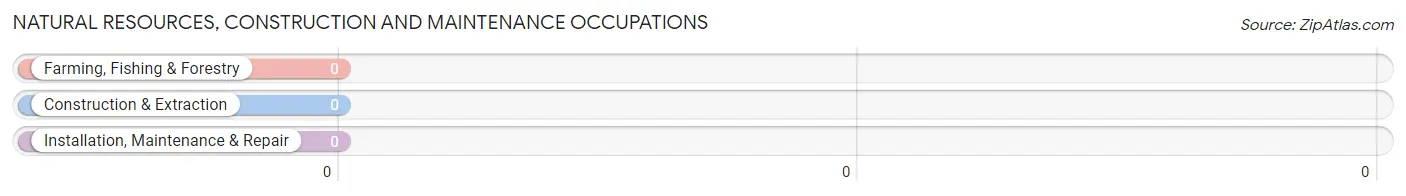
Natural Resources, Construction and Maintenance Occupations
Natural Resources, Construction and Maintenance Occupations by Sex
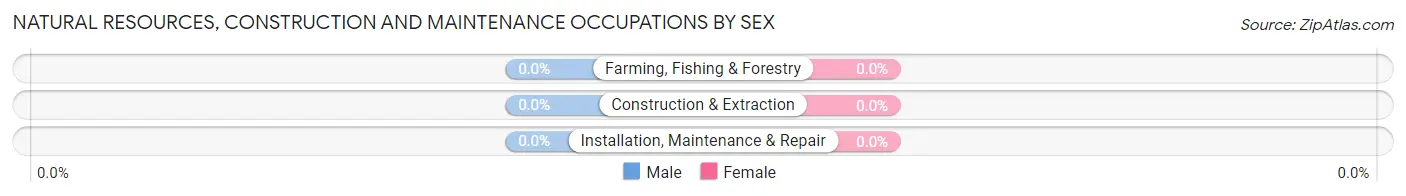
| Occupation | Male | Female |
| Farming, Fishing & Forestry | 0 (0.0%) | 0 (0.0%) |
| Construction & Extraction | 0 (0.0%) | 0 (0.0%) |
| Installation, Maintenance & Repair | 0 (0.0%) | 0 (0.0%) |
| Total (Category) | 0 (0.0%) | 0 (0.0%) |
| Total (Overall) | 58 (54.7%) | 48 (45.3%) |
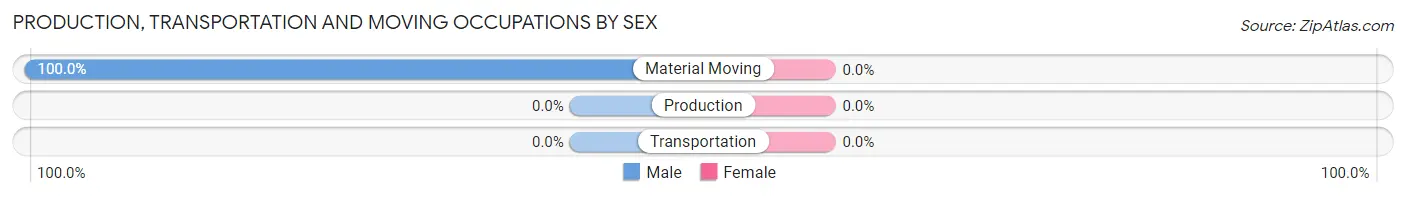
Production, Transportation and Moving Occupations
The most common Production, Transportation and Moving occupations in Lansing are , and Material Moving (7 | 6.6%).
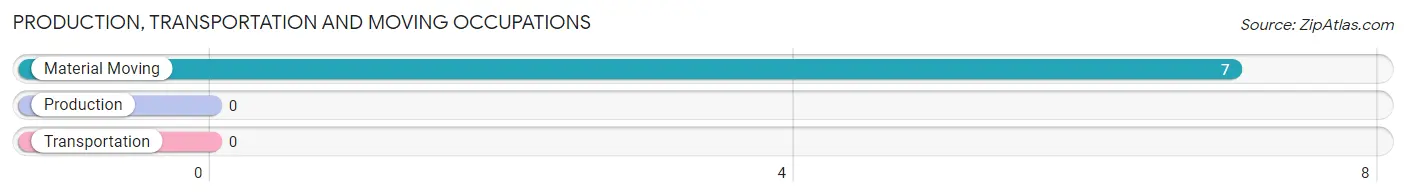
Production, Transportation and Moving Occupations by Sex
| Occupation | Male | Female |
| Production | 0 (0.0%) | 0 (0.0%) |
| Transportation | 0 (0.0%) | 0 (0.0%) |
| Material Moving | 7 (100.0%) | 0 (0.0%) |
| Total (Category) | 7 (100.0%) | 0 (0.0%) |
| Total (Overall) | 58 (54.7%) | 48 (45.3%) |
Employment Industries by Sex in Lansing
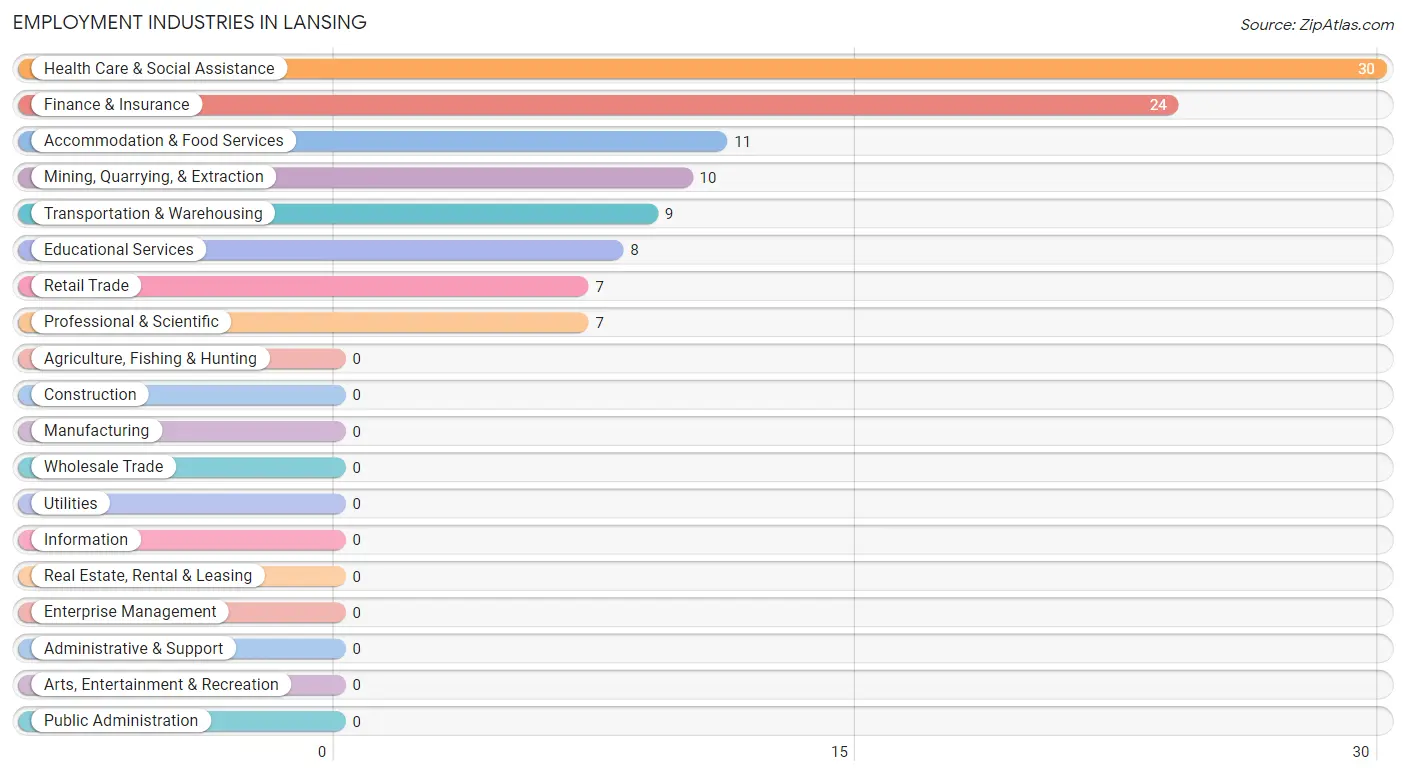
Employment Industries in Lansing
The major employment industries in Lansing include Health Care & Social Assistance (30 | 28.3%), Finance & Insurance (24 | 22.6%), Accommodation & Food Services (11 | 10.4%), Mining, Quarrying, & Extraction (10 | 9.4%), and Transportation & Warehousing (9 | 8.5%).
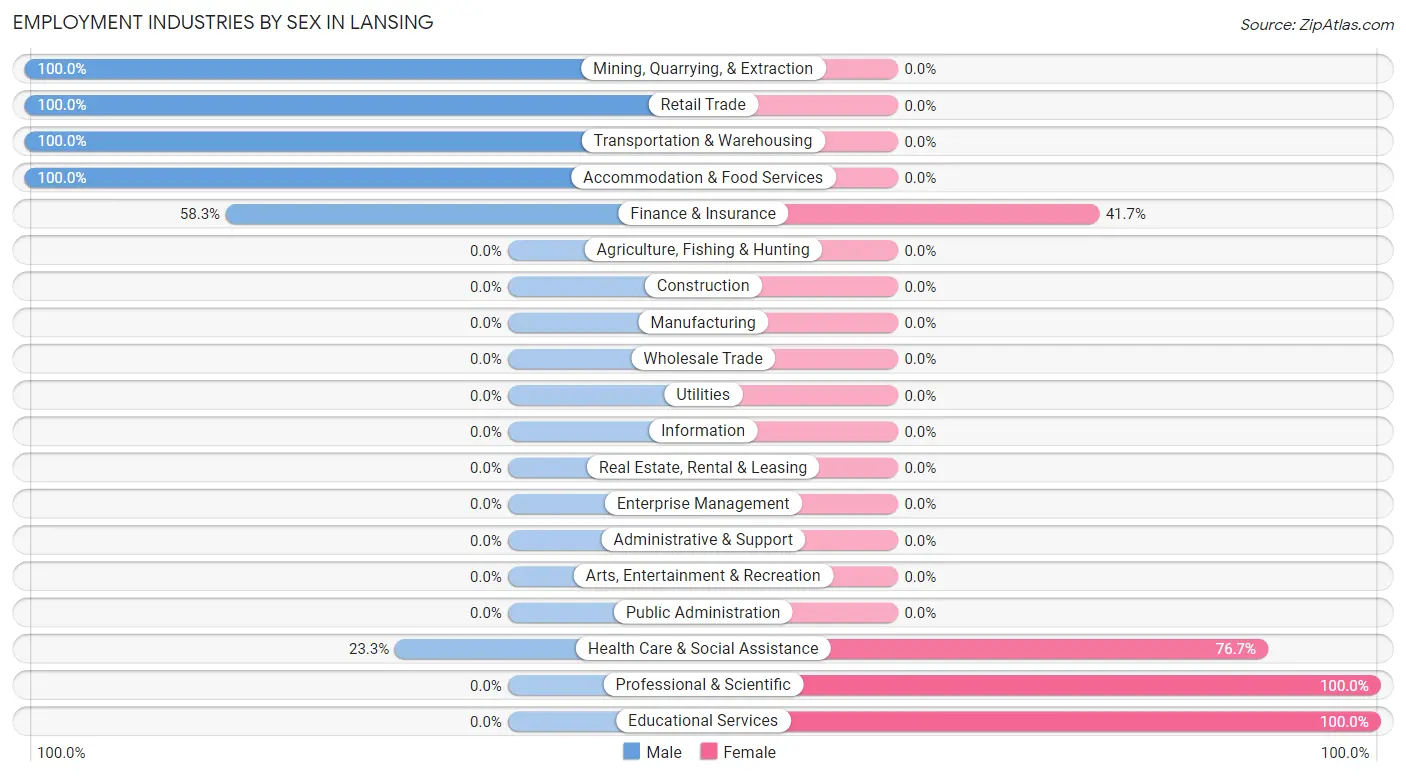
Employment Industries by Sex in Lansing
The Lansing industries that see more men than women are Mining, Quarrying, & Extraction (100.0%), Retail Trade (100.0%), and Transportation & Warehousing (100.0%), whereas the industries that tend to have a higher number of women are Professional & Scientific (100.0%), Educational Services (100.0%), and Health Care & Social Assistance (76.7%).
| Industry | Male | Female |
| Agriculture, Fishing & Hunting | 0 (0.0%) | 0 (0.0%) |
| Mining, Quarrying, & Extraction | 10 (100.0%) | 0 (0.0%) |
| Construction | 0 (0.0%) | 0 (0.0%) |
| Manufacturing | 0 (0.0%) | 0 (0.0%) |
| Wholesale Trade | 0 (0.0%) | 0 (0.0%) |
| Retail Trade | 7 (100.0%) | 0 (0.0%) |
| Transportation & Warehousing | 9 (100.0%) | 0 (0.0%) |
| Utilities | 0 (0.0%) | 0 (0.0%) |
| Information | 0 (0.0%) | 0 (0.0%) |
| Finance & Insurance | 14 (58.3%) | 10 (41.7%) |
| Real Estate, Rental & Leasing | 0 (0.0%) | 0 (0.0%) |
| Professional & Scientific | 0 (0.0%) | 7 (100.0%) |
| Enterprise Management | 0 (0.0%) | 0 (0.0%) |
| Administrative & Support | 0 (0.0%) | 0 (0.0%) |
| Educational Services | 0 (0.0%) | 8 (100.0%) |
| Health Care & Social Assistance | 7 (23.3%) | 23 (76.7%) |
| Arts, Entertainment & Recreation | 0 (0.0%) | 0 (0.0%) |
| Accommodation & Food Services | 11 (100.0%) | 0 (0.0%) |
| Public Administration | 0 (0.0%) | 0 (0.0%) |
| Total | 58 (54.7%) | 48 (45.3%) |
Education in Lansing
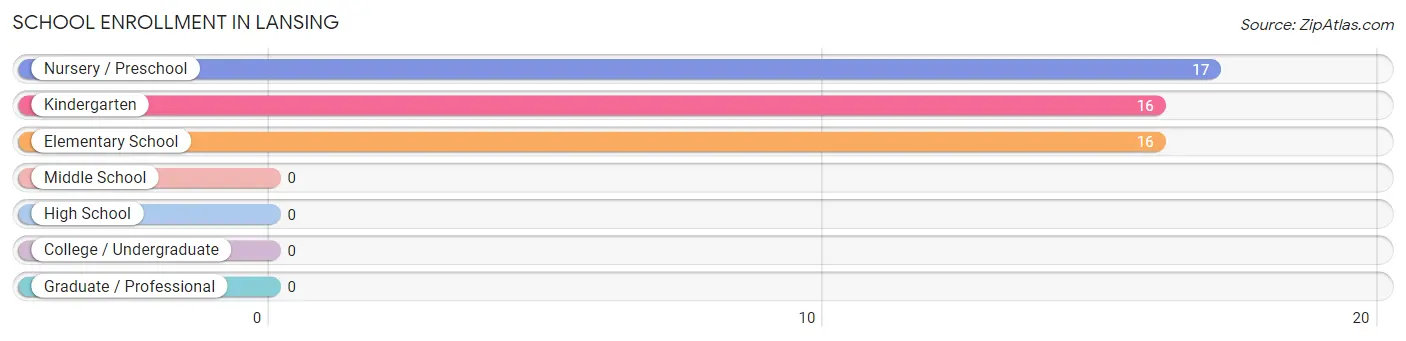
School Enrollment in Lansing
The most common levels of schooling among the 49 students in Lansing are nursery / preschool (17 | 34.7%), kindergarten (16 | 32.7%), and elementary school (16 | 32.7%).
| School Level | # Students | % Students |
| Nursery / Preschool | 17 | 34.7% |
| Kindergarten | 16 | 32.7% |
| Elementary School | 16 | 32.7% |
| Middle School | 0 | 0.0% |
| High School | 0 | 0.0% |
| College / Undergraduate | 0 | 0.0% |
| Graduate / Professional | 0 | 0.0% |
| Total | 49 | 100.0% |
School Enrollment by Age by Funding Source in Lansing
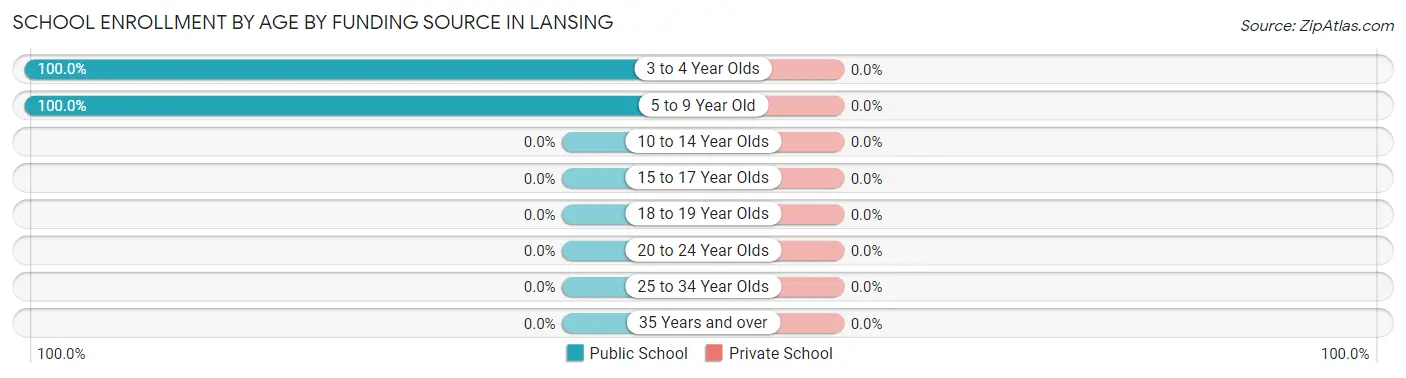
| Age Bracket | Public School | Private School |
| 3 to 4 Year Olds | 17 (100.0%) | 0 (0.0%) |
| 5 to 9 Year Old | 32 (100.0%) | 0 (0.0%) |
| 10 to 14 Year Olds | 0 (0.0%) | 0 (0.0%) |
| 15 to 17 Year Olds | 0 (0.0%) | 0 (0.0%) |
| 18 to 19 Year Olds | 0 (0.0%) | 0 (0.0%) |
| 20 to 24 Year Olds | 0 (0.0%) | 0 (0.0%) |
| 25 to 34 Year Olds | 0 (0.0%) | 0 (0.0%) |
| 35 Years and over | 0 (0.0%) | 0 (0.0%) |
| Total | 49 (100.0%) | 0 (0.0%) |
Educational Attainment by Field of Study in Lansing
Education (48 | 51.1%), science & technology (39 | 41.5%), and business (7 | 7.4%) are the most common fields of study among 94 individuals in Lansing who have obtained a bachelor's degree or higher.
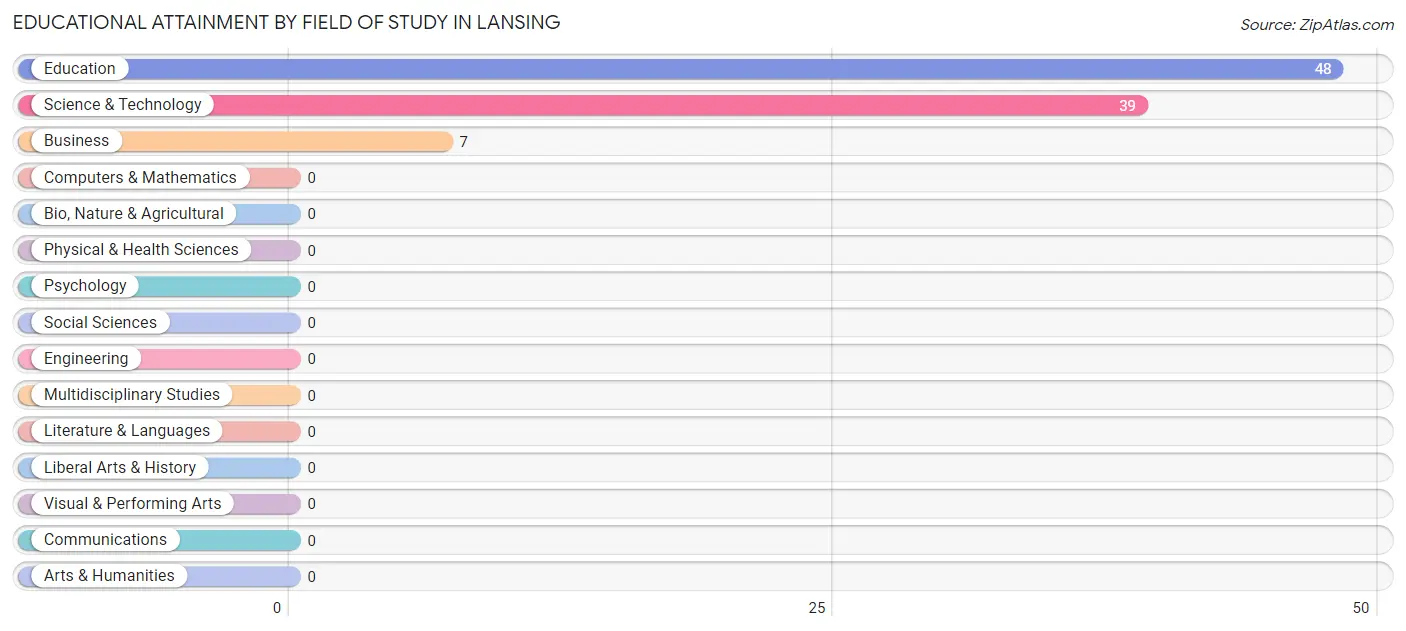
| Field of Study | # Graduates | % Graduates |
| Computers & Mathematics | 0 | 0.0% |
| Bio, Nature & Agricultural | 0 | 0.0% |
| Physical & Health Sciences | 0 | 0.0% |
| Psychology | 0 | 0.0% |
| Social Sciences | 0 | 0.0% |
| Engineering | 0 | 0.0% |
| Multidisciplinary Studies | 0 | 0.0% |
| Science & Technology | 39 | 41.5% |
| Business | 7 | 7.4% |
| Education | 48 | 51.1% |
| Literature & Languages | 0 | 0.0% |
| Liberal Arts & History | 0 | 0.0% |
| Visual & Performing Arts | 0 | 0.0% |
| Communications | 0 | 0.0% |
| Arts & Humanities | 0 | 0.0% |
| Total | 94 | 100.0% |
Transportation & Commute in Lansing
Vehicle Availability by Sex in Lansing
The most prevalent vehicle ownership categories in Lansing are males with 2 vehicles (51, accounting for 87.9%) and females with 2 vehicles (30, making up 106.2%).
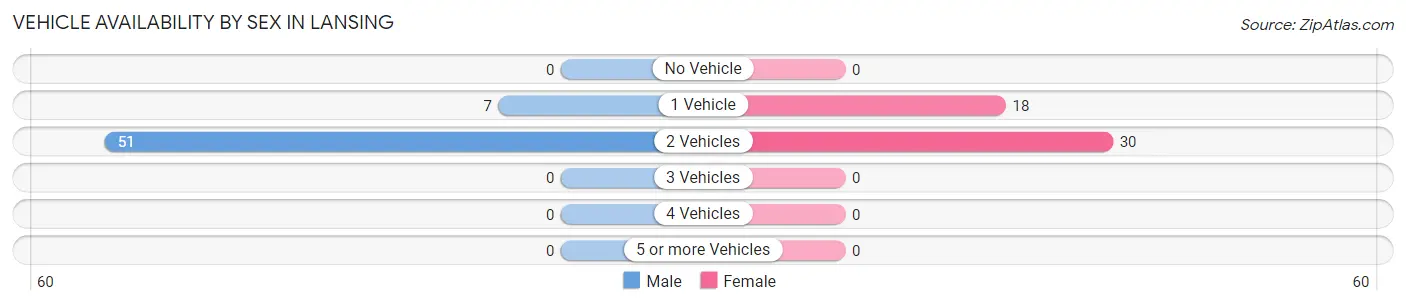
| Vehicles Available | Male | Female |
| No Vehicle | 0 (0.0%) | 0 (0.0%) |
| 1 Vehicle | 7 (12.1%) | 18 (37.5%) |
| 2 Vehicles | 51 (87.9%) | 30 (62.5%) |
| 3 Vehicles | 0 (0.0%) | 0 (0.0%) |
| 4 Vehicles | 0 (0.0%) | 0 (0.0%) |
| 5 or more Vehicles | 0 (0.0%) | 0 (0.0%) |
| Total | 58 (100.0%) | 48 (100.0%) |
Commute Time in Lansing
The most frequently occuring commute durations in Lansing are 10 to 14 minutes (32 commuters, 30.2%), 5 to 9 minutes (27 commuters, 25.5%), and 20 to 24 minutes (15 commuters, 14.1%).
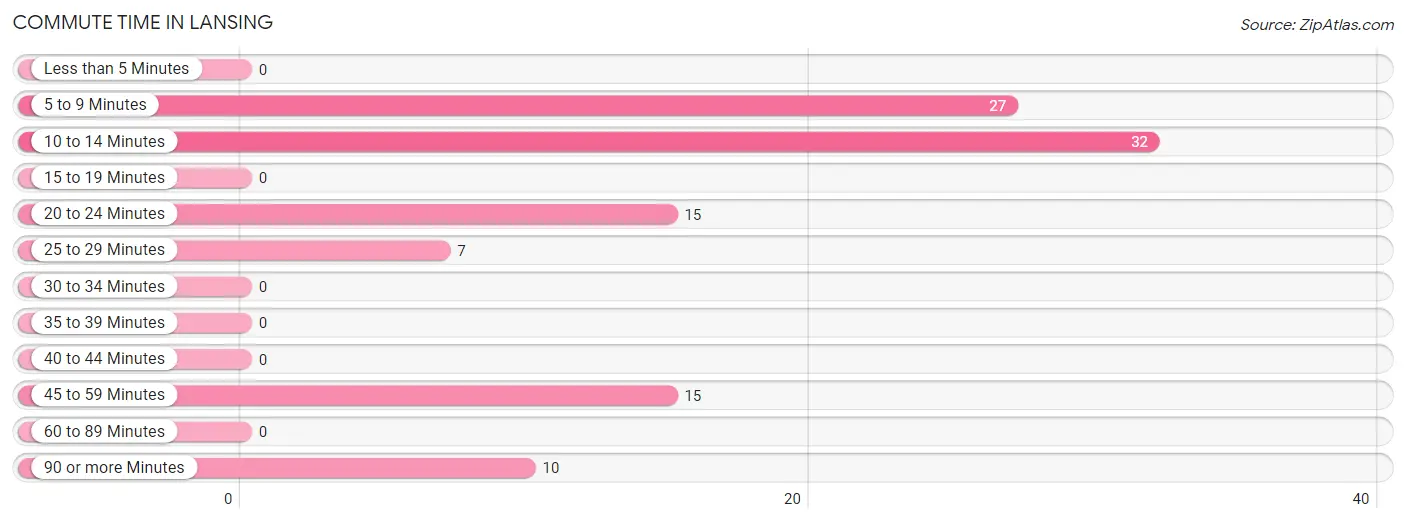
| Commute Time | # Commuters | % Commuters |
| Less than 5 Minutes | 0 | 0.0% |
| 5 to 9 Minutes | 27 | 25.5% |
| 10 to 14 Minutes | 32 | 30.2% |
| 15 to 19 Minutes | 0 | 0.0% |
| 20 to 24 Minutes | 15 | 14.1% |
| 25 to 29 Minutes | 7 | 6.6% |
| 30 to 34 Minutes | 0 | 0.0% |
| 35 to 39 Minutes | 0 | 0.0% |
| 40 to 44 Minutes | 0 | 0.0% |
| 45 to 59 Minutes | 15 | 14.1% |
| 60 to 89 Minutes | 0 | 0.0% |
| 90 or more Minutes | 10 | 9.4% |
Commute Time by Sex in Lansing
The most common commute times in Lansing are 10 to 14 minutes (32 commuters, 55.2%) for males and 5 to 9 minutes (18 commuters, 37.5%) for females.
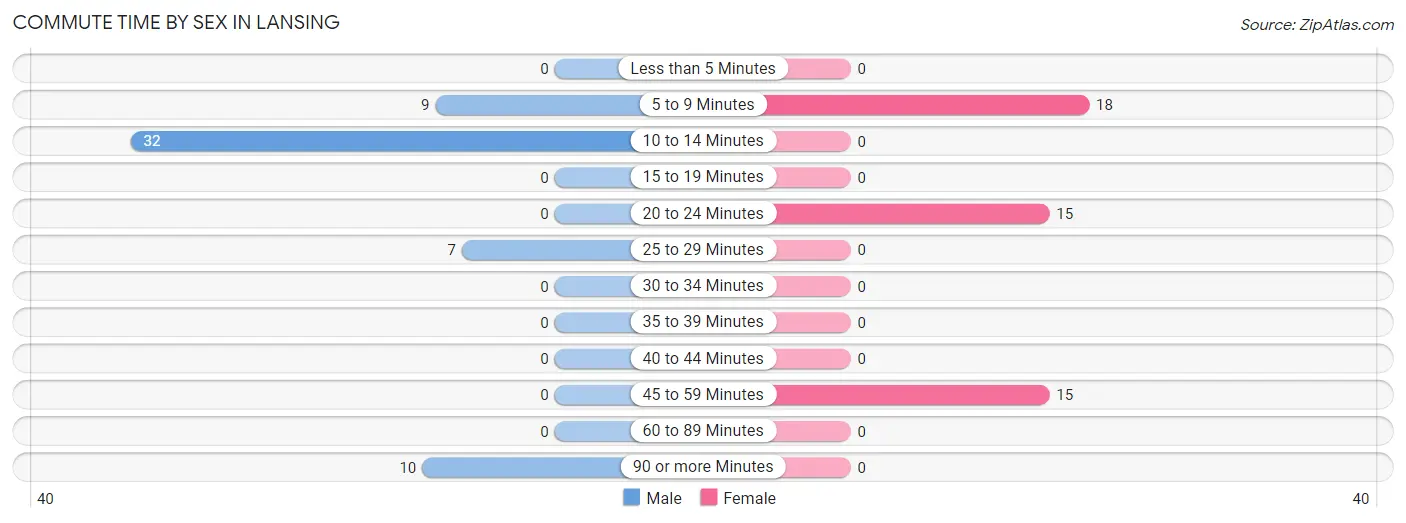
| Commute Time | Male | Female |
| Less than 5 Minutes | 0 (0.0%) | 0 (0.0%) |
| 5 to 9 Minutes | 9 (15.5%) | 18 (37.5%) |
| 10 to 14 Minutes | 32 (55.2%) | 0 (0.0%) |
| 15 to 19 Minutes | 0 (0.0%) | 0 (0.0%) |
| 20 to 24 Minutes | 0 (0.0%) | 15 (31.2%) |
| 25 to 29 Minutes | 7 (12.1%) | 0 (0.0%) |
| 30 to 34 Minutes | 0 (0.0%) | 0 (0.0%) |
| 35 to 39 Minutes | 0 (0.0%) | 0 (0.0%) |
| 40 to 44 Minutes | 0 (0.0%) | 0 (0.0%) |
| 45 to 59 Minutes | 0 (0.0%) | 15 (31.2%) |
| 60 to 89 Minutes | 0 (0.0%) | 0 (0.0%) |
| 90 or more Minutes | 10 (17.2%) | 0 (0.0%) |
Time of Departure to Work by Sex in Lansing
The most frequent times of departure to work in Lansing are 8:00 AM to 8:29 AM (14, 24.1%) for males and 8:00 AM to 8:29 AM (15, 31.2%) for females.
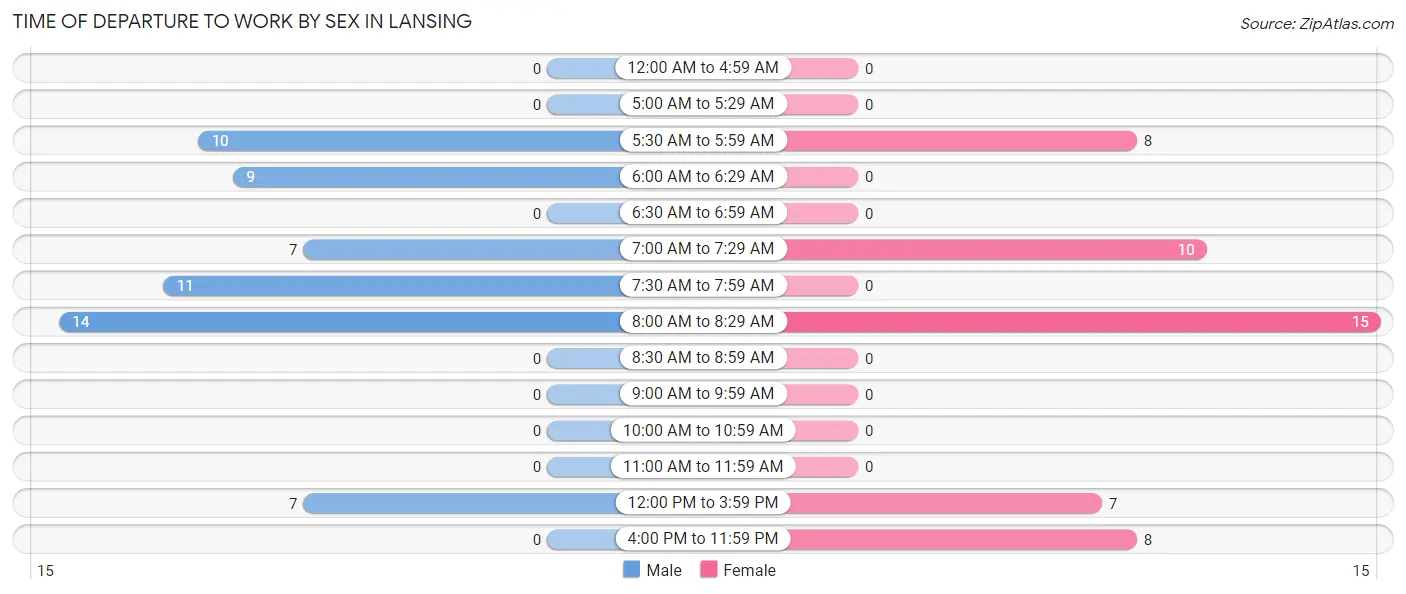
| Time of Departure | Male | Female |
| 12:00 AM to 4:59 AM | 0 (0.0%) | 0 (0.0%) |
| 5:00 AM to 5:29 AM | 0 (0.0%) | 0 (0.0%) |
| 5:30 AM to 5:59 AM | 10 (17.2%) | 8 (16.7%) |
| 6:00 AM to 6:29 AM | 9 (15.5%) | 0 (0.0%) |
| 6:30 AM to 6:59 AM | 0 (0.0%) | 0 (0.0%) |
| 7:00 AM to 7:29 AM | 7 (12.1%) | 10 (20.8%) |
| 7:30 AM to 7:59 AM | 11 (19.0%) | 0 (0.0%) |
| 8:00 AM to 8:29 AM | 14 (24.1%) | 15 (31.2%) |
| 8:30 AM to 8:59 AM | 0 (0.0%) | 0 (0.0%) |
| 9:00 AM to 9:59 AM | 0 (0.0%) | 0 (0.0%) |
| 10:00 AM to 10:59 AM | 0 (0.0%) | 0 (0.0%) |
| 11:00 AM to 11:59 AM | 0 (0.0%) | 0 (0.0%) |
| 12:00 PM to 3:59 PM | 7 (12.1%) | 7 (14.6%) |
| 4:00 PM to 11:59 PM | 0 (0.0%) | 8 (16.7%) |
| Total | 58 (100.0%) | 48 (100.0%) |
Housing Occupancy in Lansing
Occupancy by Ownership in Lansing
Of the total 139 dwellings in Lansing, owner-occupied units account for 115 (82.7%), while renter-occupied units make up 24 (17.3%).
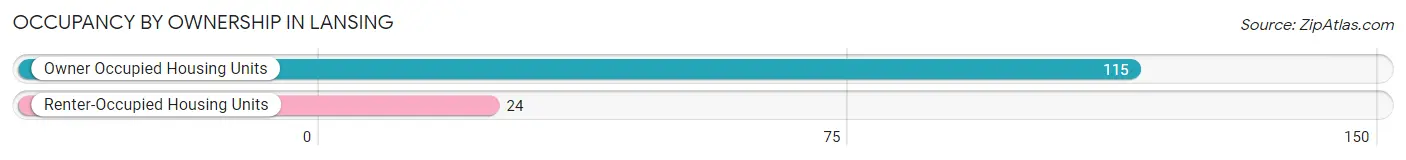
| Occupancy | # Housing Units | % Housing Units |
| Owner Occupied Housing Units | 115 | 82.7% |
| Renter-Occupied Housing Units | 24 | 17.3% |
| Total Occupied Housing Units | 139 | 100.0% |
Occupancy by Household Size in Lansing
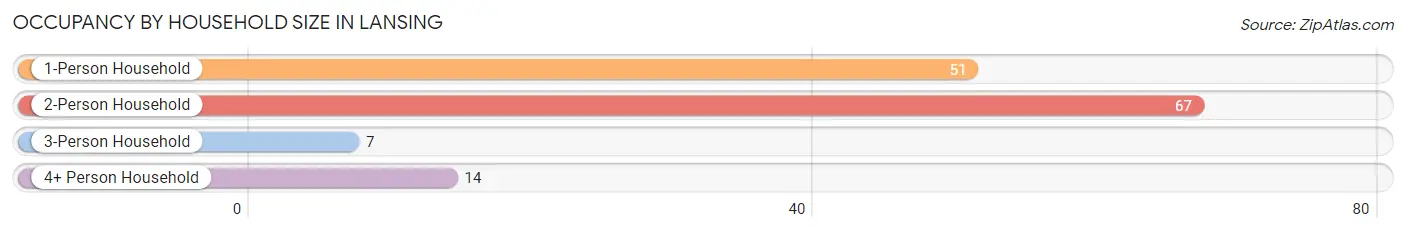
| Household Size | # Housing Units | % Housing Units |
| 1-Person Household | 51 | 36.7% |
| 2-Person Household | 67 | 48.2% |
| 3-Person Household | 7 | 5.0% |
| 4+ Person Household | 14 | 10.1% |
| Total Housing Units | 139 | 100.0% |
Occupancy by Ownership by Household Size in Lansing
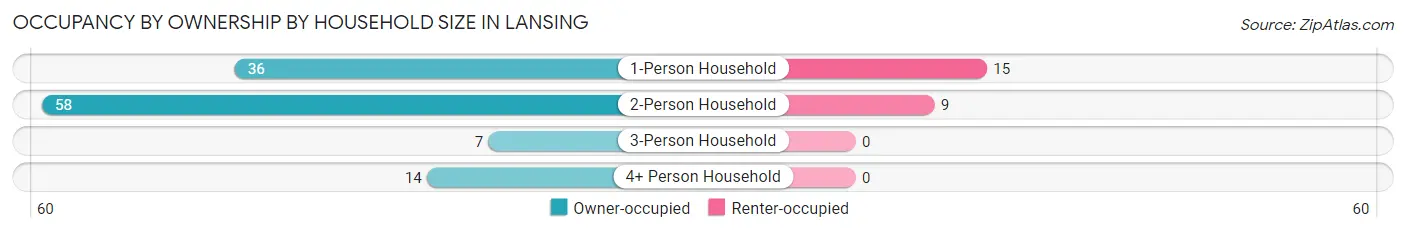
| Household Size | Owner-occupied | Renter-occupied |
| 1-Person Household | 36 (70.6%) | 15 (29.4%) |
| 2-Person Household | 58 (86.6%) | 9 (13.4%) |
| 3-Person Household | 7 (100.0%) | 0 (0.0%) |
| 4+ Person Household | 14 (100.0%) | 0 (0.0%) |
| Total Housing Units | 115 (82.7%) | 24 (17.3%) |
Occupancy by Educational Attainment in Lansing
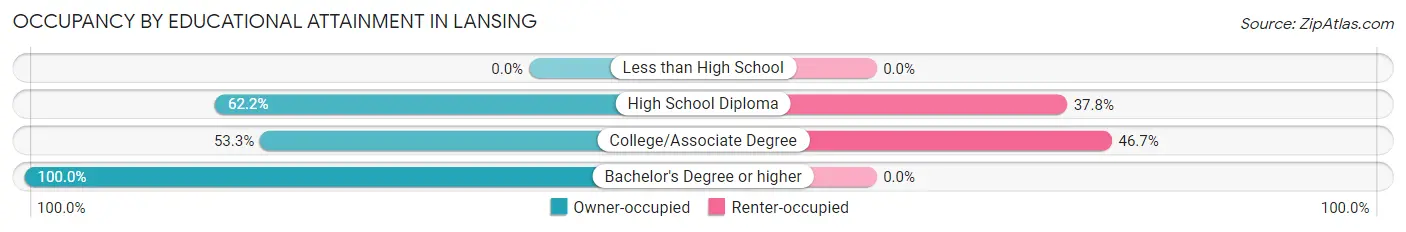
| Household Size | Owner-occupied | Renter-occupied |
| Less than High School | 0 (0.0%) | 0 (0.0%) |
| High School Diploma | 28 (62.2%) | 17 (37.8%) |
| College/Associate Degree | 8 (53.3%) | 7 (46.7%) |
| Bachelor's Degree or higher | 79 (100.0%) | 0 (0.0%) |
Occupancy by Age of Householder in Lansing
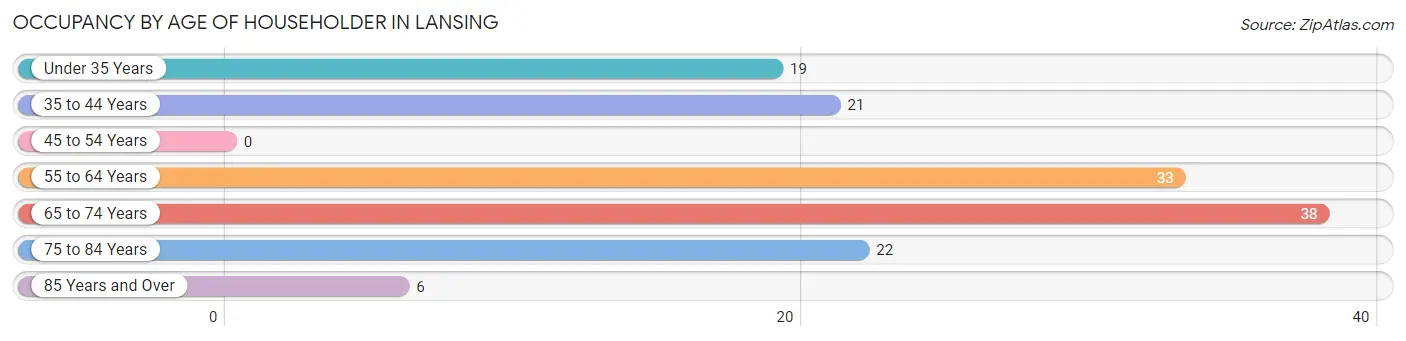
| Age Bracket | # Households | % Households |
| Under 35 Years | 19 | 13.7% |
| 35 to 44 Years | 21 | 15.1% |
| 45 to 54 Years | 0 | 0.0% |
| 55 to 64 Years | 33 | 23.7% |
| 65 to 74 Years | 38 | 27.3% |
| 75 to 84 Years | 22 | 15.8% |
| 85 Years and Over | 6 | 4.3% |
| Total | 139 | 100.0% |
Housing Finances in Lansing
Median Income by Occupancy in Lansing
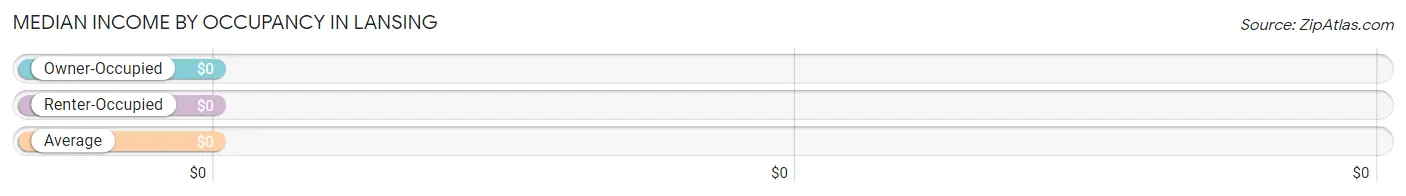
| Occupancy Type | # Households | Median Income |
| Owner-Occupied | 115 (82.7%) | $0 |
| Renter-Occupied | 24 (17.3%) | $0 |
| Average | 139 (100.0%) | $0 |
Occupancy by Householder Income Bracket in Lansing
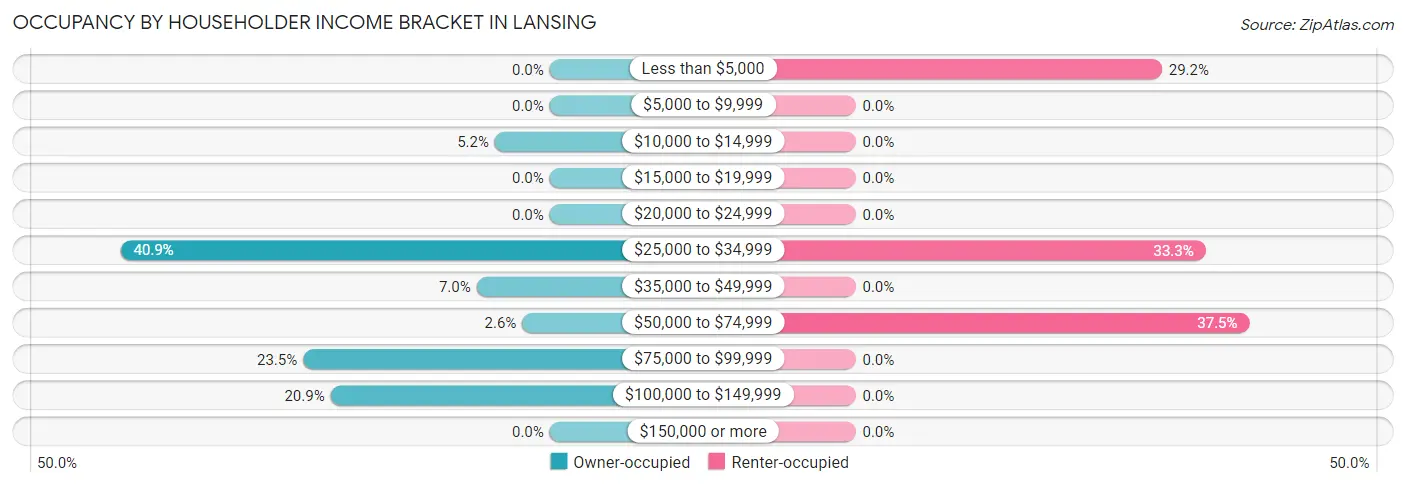
| Income Bracket | Owner-occupied | Renter-occupied |
| Less than $5,000 | 0 (0.0%) | 7 (29.2%) |
| $5,000 to $9,999 | 0 (0.0%) | 0 (0.0%) |
| $10,000 to $14,999 | 6 (5.2%) | 0 (0.0%) |
| $15,000 to $19,999 | 0 (0.0%) | 0 (0.0%) |
| $20,000 to $24,999 | 0 (0.0%) | 0 (0.0%) |
| $25,000 to $34,999 | 47 (40.9%) | 8 (33.3%) |
| $35,000 to $49,999 | 8 (7.0%) | 0 (0.0%) |
| $50,000 to $74,999 | 3 (2.6%) | 9 (37.5%) |
| $75,000 to $99,999 | 27 (23.5%) | 0 (0.0%) |
| $100,000 to $149,999 | 24 (20.9%) | 0 (0.0%) |
| $150,000 or more | 0 (0.0%) | 0 (0.0%) |
| Total | 115 (100.0%) | 24 (100.0%) |
Monthly Housing Cost Tiers in Lansing
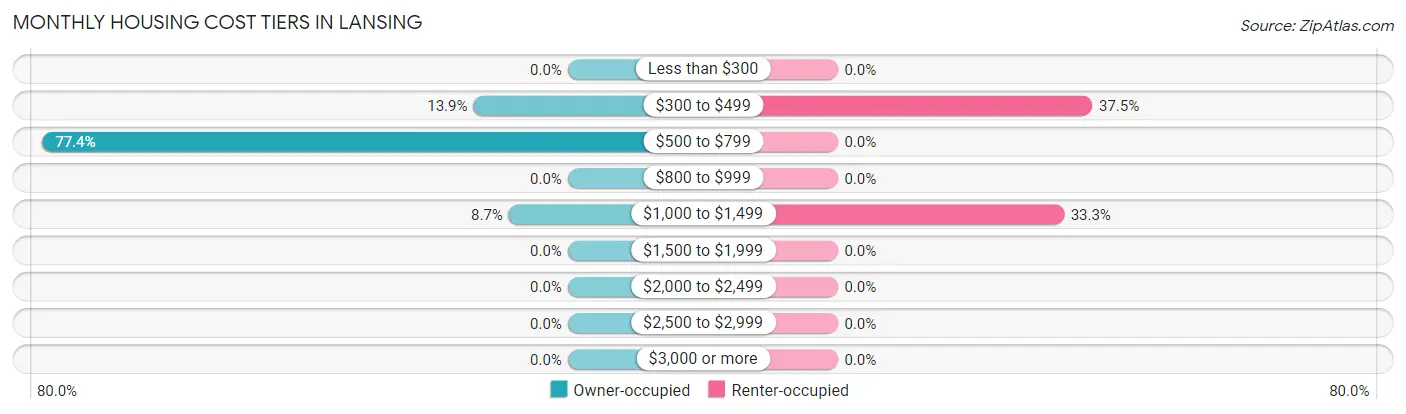
| Monthly Cost | Owner-occupied | Renter-occupied |
| Less than $300 | 0 (0.0%) | 0 (0.0%) |
| $300 to $499 | 16 (13.9%) | 9 (37.5%) |
| $500 to $799 | 89 (77.4%) | 0 (0.0%) |
| $800 to $999 | 0 (0.0%) | 0 (0.0%) |
| $1,000 to $1,499 | 10 (8.7%) | 8 (33.3%) |
| $1,500 to $1,999 | 0 (0.0%) | 0 (0.0%) |
| $2,000 to $2,499 | 0 (0.0%) | 0 (0.0%) |
| $2,500 to $2,999 | 0 (0.0%) | 0 (0.0%) |
| $3,000 or more | 0 (0.0%) | 0 (0.0%) |
| Total | 115 (100.0%) | 24 (100.0%) |
Physical Housing Characteristics in Lansing
Housing Structures in Lansing
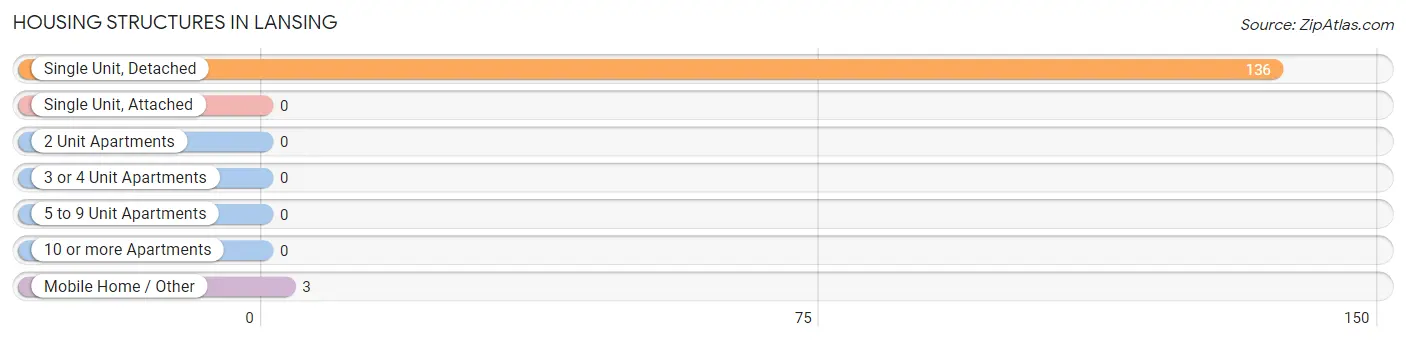
| Structure Type | # Housing Units | % Housing Units |
| Single Unit, Detached | 136 | 97.8% |
| Single Unit, Attached | 0 | 0.0% |
| 2 Unit Apartments | 0 | 0.0% |
| 3 or 4 Unit Apartments | 0 | 0.0% |
| 5 to 9 Unit Apartments | 0 | 0.0% |
| 10 or more Apartments | 0 | 0.0% |
| Mobile Home / Other | 3 | 2.2% |
| Total | 139 | 100.0% |
Housing Structures by Occupancy in Lansing
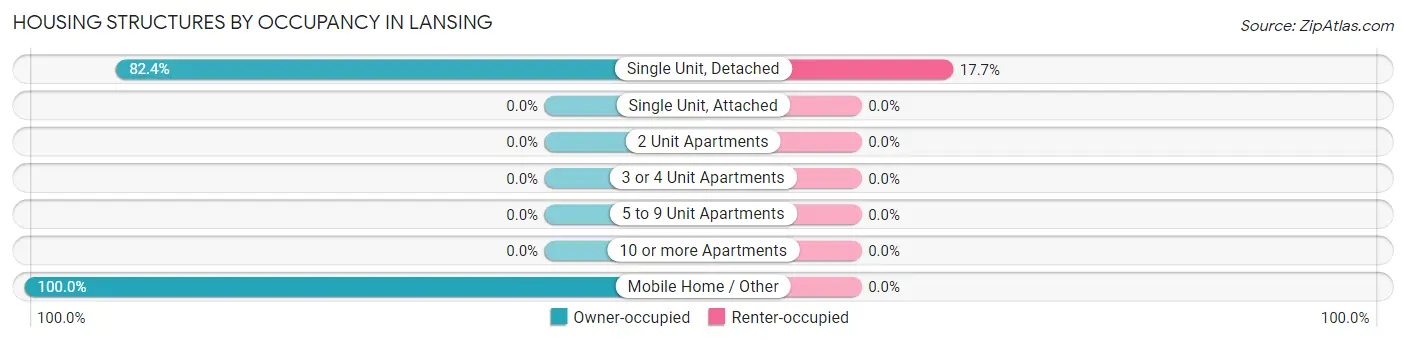
| Structure Type | Owner-occupied | Renter-occupied |
| Single Unit, Detached | 112 (82.4%) | 24 (17.6%) |
| Single Unit, Attached | 0 (0.0%) | 0 (0.0%) |
| 2 Unit Apartments | 0 (0.0%) | 0 (0.0%) |
| 3 or 4 Unit Apartments | 0 (0.0%) | 0 (0.0%) |
| 5 to 9 Unit Apartments | 0 (0.0%) | 0 (0.0%) |
| 10 or more Apartments | 0 (0.0%) | 0 (0.0%) |
| Mobile Home / Other | 3 (100.0%) | 0 (0.0%) |
| Total | 115 (82.7%) | 24 (17.3%) |
Housing Structures by Number of Rooms in Lansing
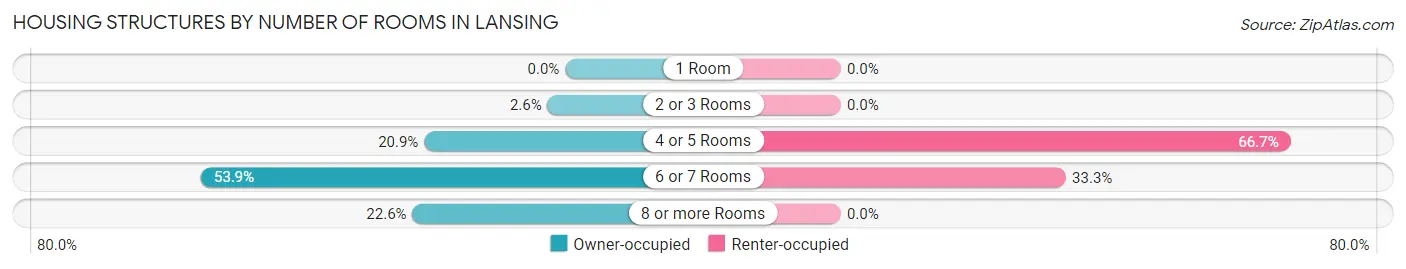
| Number of Rooms | Owner-occupied | Renter-occupied |
| 1 Room | 0 (0.0%) | 0 (0.0%) |
| 2 or 3 Rooms | 3 (2.6%) | 0 (0.0%) |
| 4 or 5 Rooms | 24 (20.9%) | 16 (66.7%) |
| 6 or 7 Rooms | 62 (53.9%) | 8 (33.3%) |
| 8 or more Rooms | 26 (22.6%) | 0 (0.0%) |
| Total | 115 (100.0%) | 24 (100.0%) |
Housing Structure by Heating Type in Lansing
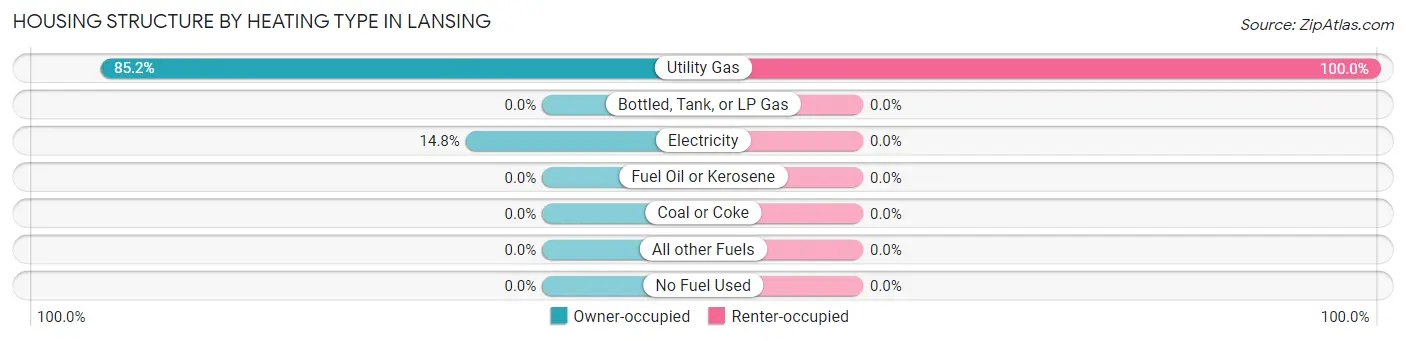
| Heating Type | Owner-occupied | Renter-occupied |
| Utility Gas | 98 (85.2%) | 24 (100.0%) |
| Bottled, Tank, or LP Gas | 0 (0.0%) | 0 (0.0%) |
| Electricity | 17 (14.8%) | 0 (0.0%) |
| Fuel Oil or Kerosene | 0 (0.0%) | 0 (0.0%) |
| Coal or Coke | 0 (0.0%) | 0 (0.0%) |
| All other Fuels | 0 (0.0%) | 0 (0.0%) |
| No Fuel Used | 0 (0.0%) | 0 (0.0%) |
| Total | 115 (100.0%) | 24 (100.0%) |
Household Vehicle Usage in Lansing
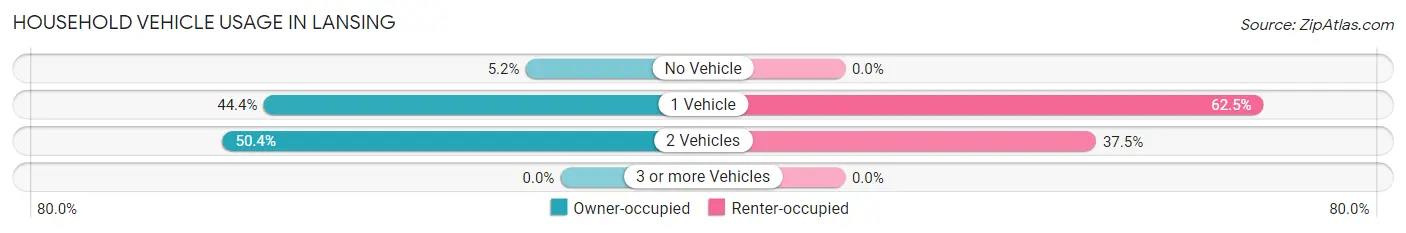
| Vehicles per Household | Owner-occupied | Renter-occupied |
| No Vehicle | 6 (5.2%) | 0 (0.0%) |
| 1 Vehicle | 51 (44.4%) | 15 (62.5%) |
| 2 Vehicles | 58 (50.4%) | 9 (37.5%) |
| 3 or more Vehicles | 0 (0.0%) | 0 (0.0%) |
| Total | 115 (100.0%) | 24 (100.0%) |
Real Estate & Mortgages in Lansing
Real Estate and Mortgage Overview in Lansing
| Characteristic | Without Mortgage | With Mortgage |
| Housing Units | 78 | 37 |
| Median Property Value | $115,100 | $89,500 |
| Median Household Income | - | - |
| Monthly Housing Costs | $737 | $0 |
| Real Estate Taxes | $3,250 | $0 |
Property Value by Mortgage Status in Lansing
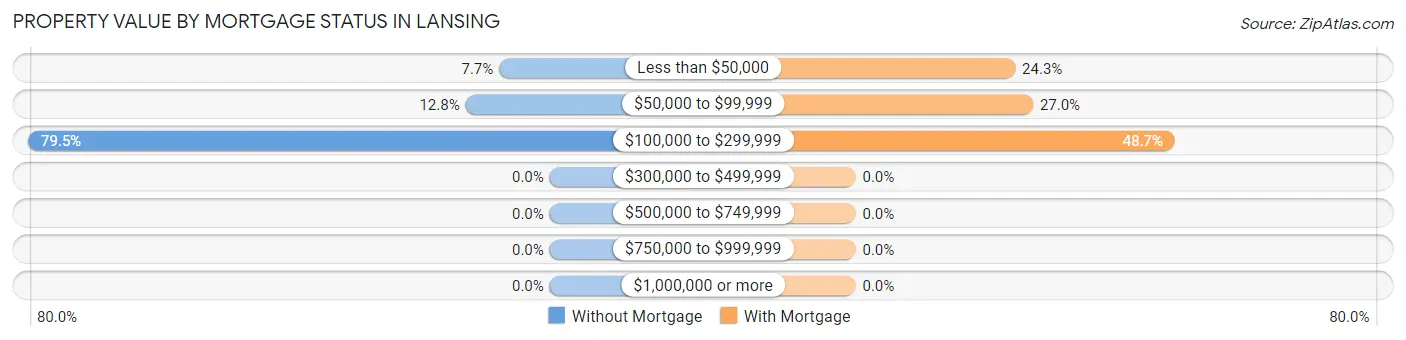
| Property Value | Without Mortgage | With Mortgage |
| Less than $50,000 | 6 (7.7%) | 9 (24.3%) |
| $50,000 to $99,999 | 10 (12.8%) | 10 (27.0%) |
| $100,000 to $299,999 | 62 (79.5%) | 18 (48.6%) |
| $300,000 to $499,999 | 0 (0.0%) | 0 (0.0%) |
| $500,000 to $749,999 | 0 (0.0%) | 0 (0.0%) |
| $750,000 to $999,999 | 0 (0.0%) | 0 (0.0%) |
| $1,000,000 or more | 0 (0.0%) | 0 (0.0%) |
| Total | 78 (100.0%) | 37 (100.0%) |
Household Income by Mortgage Status in Lansing
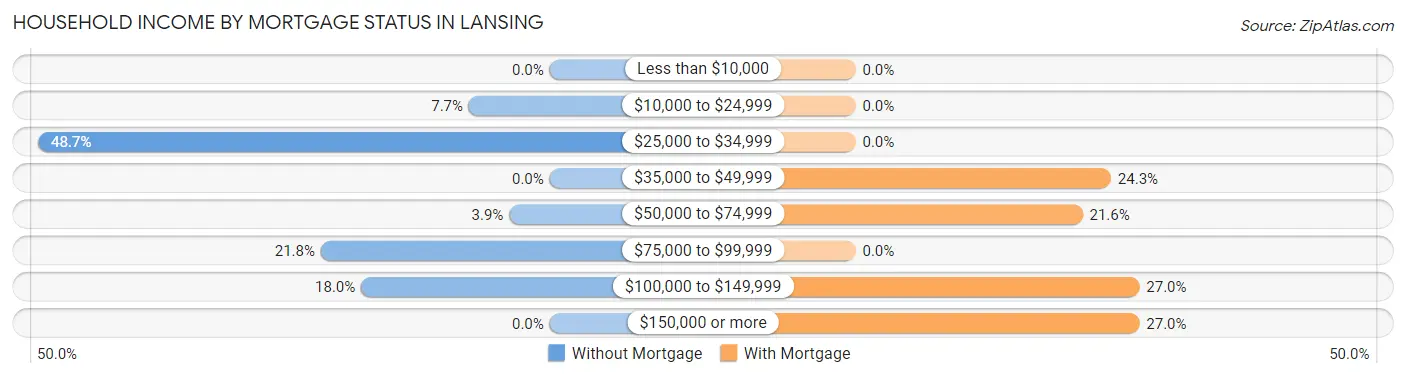
| Household Income | Without Mortgage | With Mortgage |
| Less than $10,000 | 0 (0.0%) | 0 (0.0%) |
| $10,000 to $24,999 | 6 (7.7%) | 0 (0.0%) |
| $25,000 to $34,999 | 38 (48.7%) | 0 (0.0%) |
| $35,000 to $49,999 | 0 (0.0%) | 9 (24.3%) |
| $50,000 to $74,999 | 3 (3.8%) | 8 (21.6%) |
| $75,000 to $99,999 | 17 (21.8%) | 0 (0.0%) |
| $100,000 to $149,999 | 14 (17.9%) | 10 (27.0%) |
| $150,000 or more | 0 (0.0%) | 10 (27.0%) |
| Total | 78 (100.0%) | 37 (100.0%) |
Property Value to Household Income Ratio in Lansing
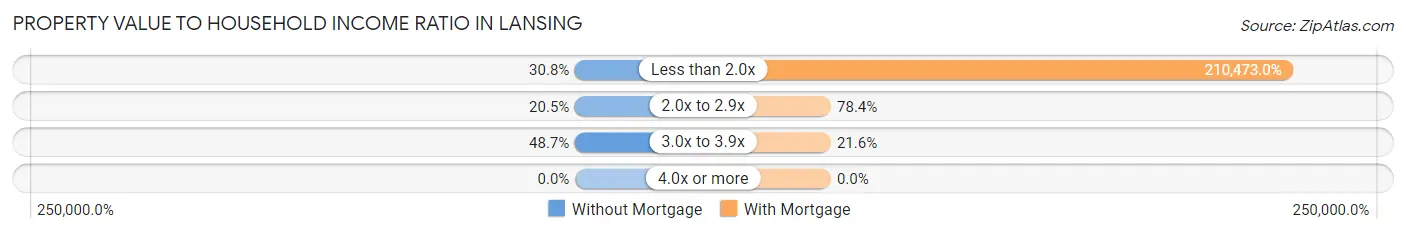
| Value-to-Income Ratio | Without Mortgage | With Mortgage |
| Less than 2.0x | 24 (30.8%) | 77,875 (210,473.0%) |
| 2.0x to 2.9x | 16 (20.5%) | 29 (78.4%) |
| 3.0x to 3.9x | 38 (48.7%) | 8 (21.6%) |
| 4.0x or more | 0 (0.0%) | 0 (0.0%) |
| Total | 78 (100.0%) | 37 (100.0%) |
Real Estate Taxes by Mortgage Status in Lansing
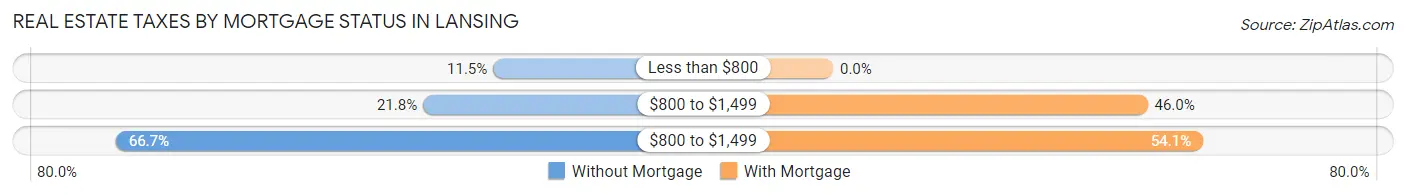
| Property Taxes | Without Mortgage | With Mortgage |
| Less than $800 | 9 (11.5%) | 0 (0.0%) |
| $800 to $1,499 | 17 (21.8%) | 17 (46.0%) |
| $800 to $1,499 | 52 (66.7%) | 20 (54.0%) |
| Total | 78 (100.0%) | 37 (100.0%) |
Health & Disability in Lansing
Health Insurance Coverage by Age in Lansing
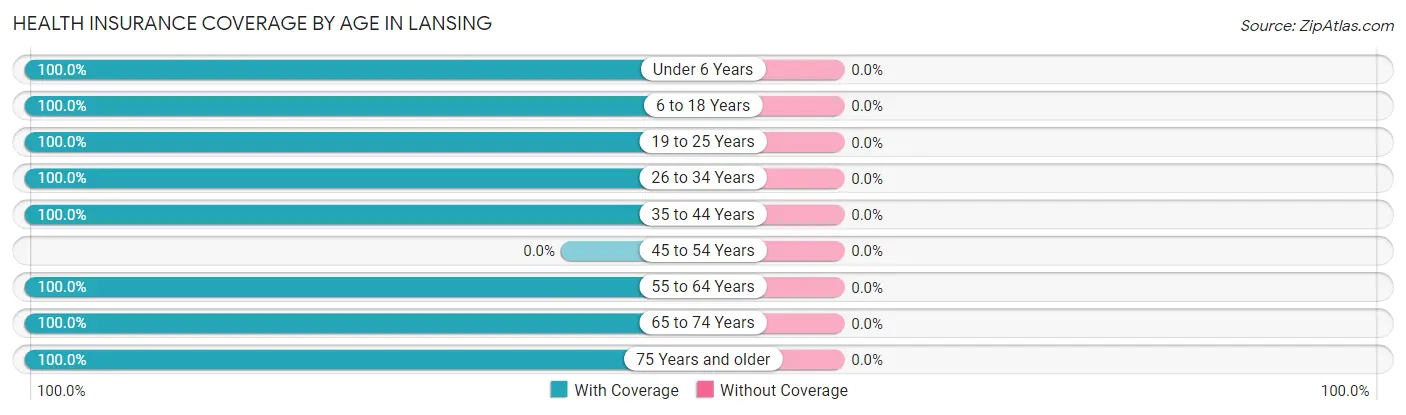
| Age Bracket | With Coverage | Without Coverage |
| Under 6 Years | 17 (100.0%) | 0 (0.0%) |
| 6 to 18 Years | 32 (100.0%) | 0 (0.0%) |
| 19 to 25 Years | 21 (100.0%) | 0 (0.0%) |
| 26 to 34 Years | 9 (100.0%) | 0 (0.0%) |
| 35 to 44 Years | 36 (100.0%) | 0 (0.0%) |
| 45 to 54 Years | 0 (0.0%) | 0 (0.0%) |
| 55 to 64 Years | 49 (100.0%) | 0 (0.0%) |
| 65 to 74 Years | 73 (100.0%) | 0 (0.0%) |
| 75 Years and older | 48 (100.0%) | 0 (0.0%) |
| Total | 285 (100.0%) | 0 (0.0%) |
Health Insurance Coverage by Citizenship Status in Lansing
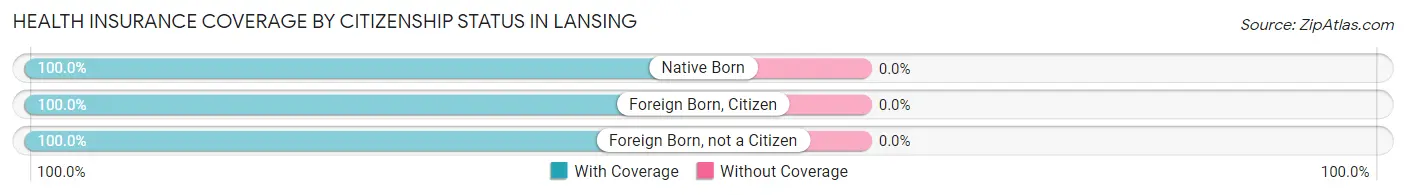
| Citizenship Status | With Coverage | Without Coverage |
| Native Born | 17 (100.0%) | 0 (0.0%) |
| Foreign Born, Citizen | 32 (100.0%) | 0 (0.0%) |
| Foreign Born, not a Citizen | 21 (100.0%) | 0 (0.0%) |
Health Insurance Coverage by Household Income in Lansing
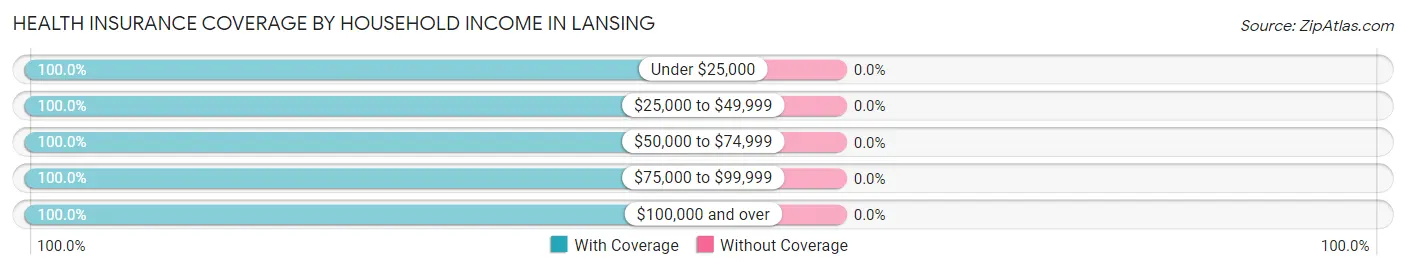
| Household Income | With Coverage | Without Coverage |
| Under $25,000 | 13 (100.0%) | 0 (0.0%) |
| $25,000 to $49,999 | 98 (100.0%) | 0 (0.0%) |
| $50,000 to $74,999 | 21 (100.0%) | 0 (0.0%) |
| $75,000 to $99,999 | 56 (100.0%) | 0 (0.0%) |
| $100,000 and over | 97 (100.0%) | 0 (0.0%) |
Public vs Private Health Insurance Coverage by Age in Lansing
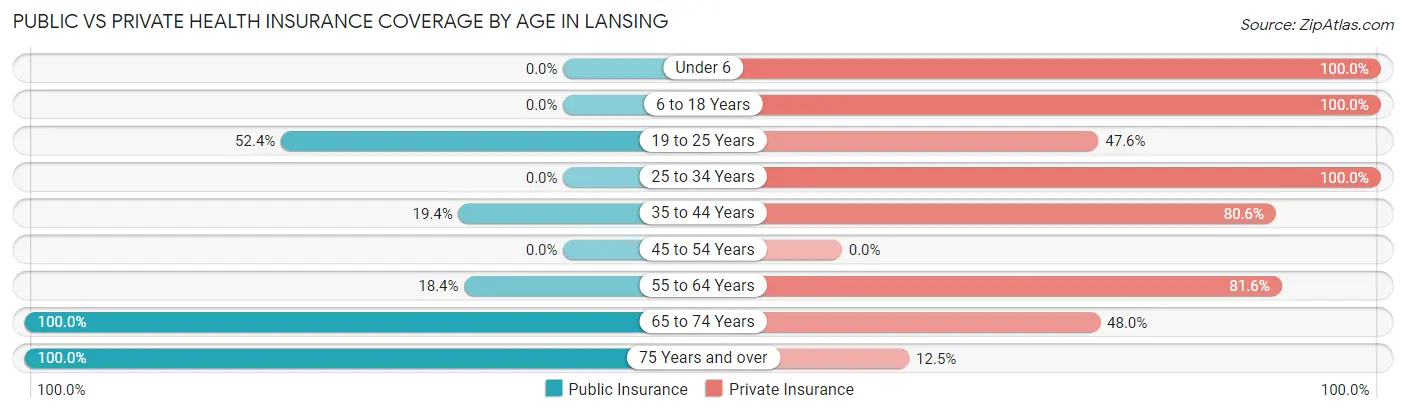
| Age Bracket | Public Insurance | Private Insurance |
| Under 6 | 0 (0.0%) | 17 (100.0%) |
| 6 to 18 Years | 0 (0.0%) | 32 (100.0%) |
| 19 to 25 Years | 11 (52.4%) | 10 (47.6%) |
| 25 to 34 Years | 0 (0.0%) | 9 (100.0%) |
| 35 to 44 Years | 7 (19.4%) | 29 (80.6%) |
| 45 to 54 Years | 0 (0.0%) | 0 (0.0%) |
| 55 to 64 Years | 9 (18.4%) | 40 (81.6%) |
| 65 to 74 Years | 73 (100.0%) | 35 (47.9%) |
| 75 Years and over | 48 (100.0%) | 6 (12.5%) |
| Total | 148 (51.9%) | 178 (62.5%) |
Disability Status by Sex by Age in Lansing
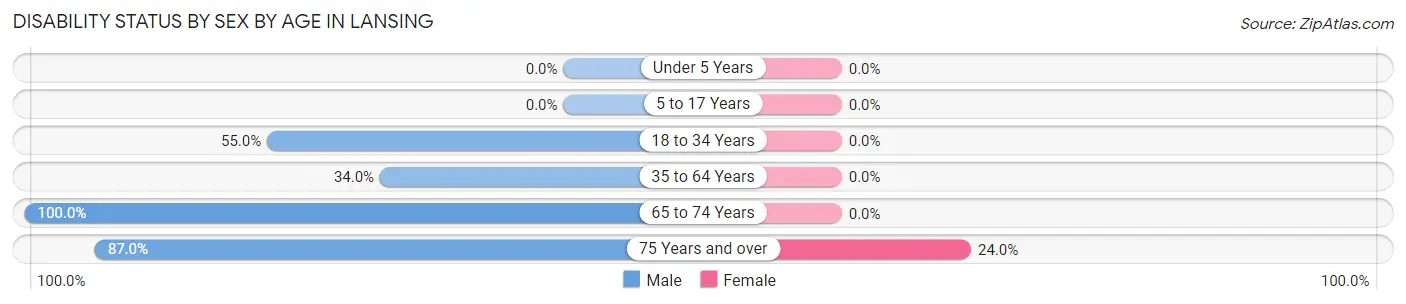
| Age Bracket | Male | Female |
| Under 5 Years | 0 (0.0%) | 0 (0.0%) |
| 5 to 17 Years | 0 (0.0%) | 0 (0.0%) |
| 18 to 34 Years | 11 (55.0%) | 0 (0.0%) |
| 35 to 64 Years | 16 (34.0%) | 0 (0.0%) |
| 65 to 74 Years | 38 (100.0%) | 0 (0.0%) |
| 75 Years and over | 20 (87.0%) | 6 (24.0%) |
Disability Class by Sex by Age in Lansing
Disability Class: Hearing Difficulty
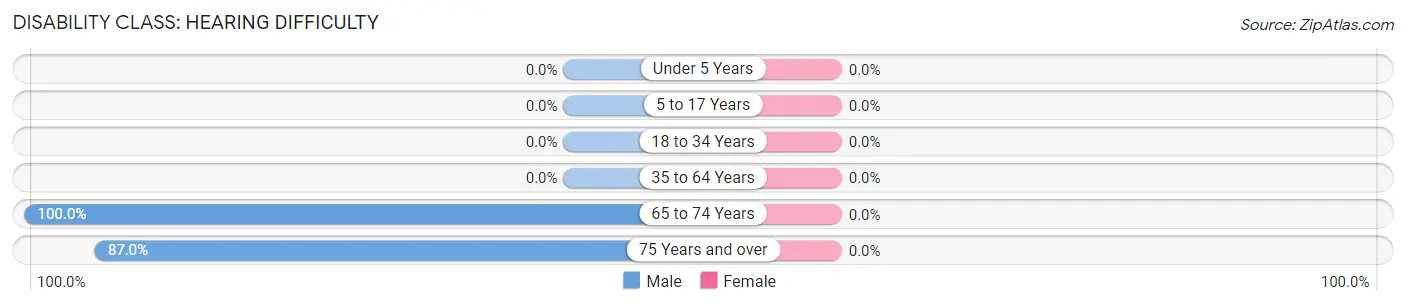
| Age Bracket | Male | Female |
| Under 5 Years | 0 (0.0%) | 0 (0.0%) |
| 5 to 17 Years | 0 (0.0%) | 0 (0.0%) |
| 18 to 34 Years | 0 (0.0%) | 0 (0.0%) |
| 35 to 64 Years | 0 (0.0%) | 0 (0.0%) |
| 65 to 74 Years | 38 (100.0%) | 0 (0.0%) |
| 75 Years and over | 20 (87.0%) | 0 (0.0%) |
Disability Class: Vision Difficulty
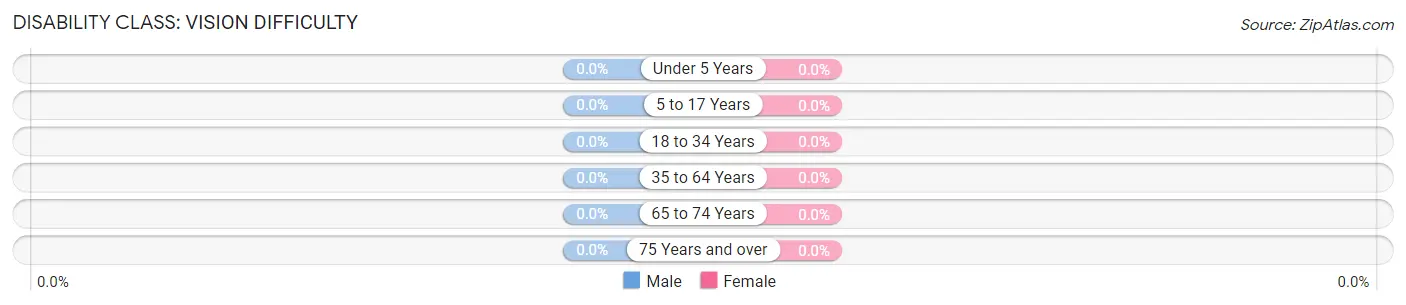
| Age Bracket | Male | Female |
| Under 5 Years | 0 (0.0%) | 0 (0.0%) |
| 5 to 17 Years | 0 (0.0%) | 0 (0.0%) |
| 18 to 34 Years | 0 (0.0%) | 0 (0.0%) |
| 35 to 64 Years | 0 (0.0%) | 0 (0.0%) |
| 65 to 74 Years | 0 (0.0%) | 0 (0.0%) |
| 75 Years and over | 0 (0.0%) | 0 (0.0%) |
Disability Class: Cognitive Difficulty
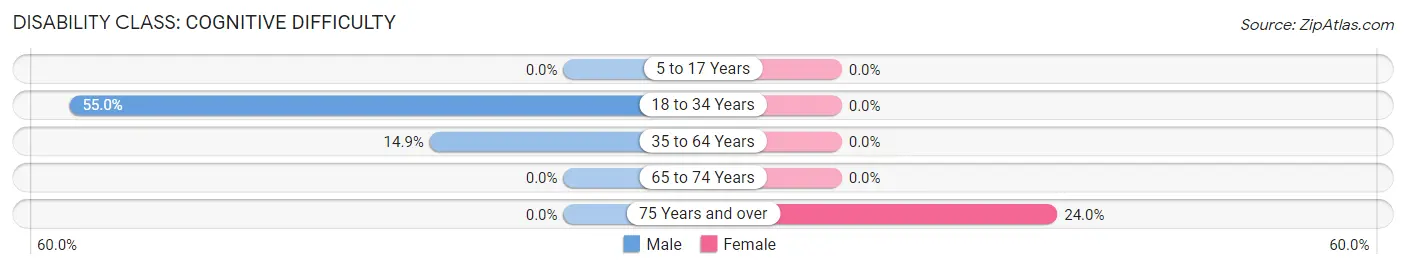
| Age Bracket | Male | Female |
| 5 to 17 Years | 0 (0.0%) | 0 (0.0%) |
| 18 to 34 Years | 11 (55.0%) | 0 (0.0%) |
| 35 to 64 Years | 7 (14.9%) | 0 (0.0%) |
| 65 to 74 Years | 0 (0.0%) | 0 (0.0%) |
| 75 Years and over | 0 (0.0%) | 6 (24.0%) |
Disability Class: Ambulatory Difficulty
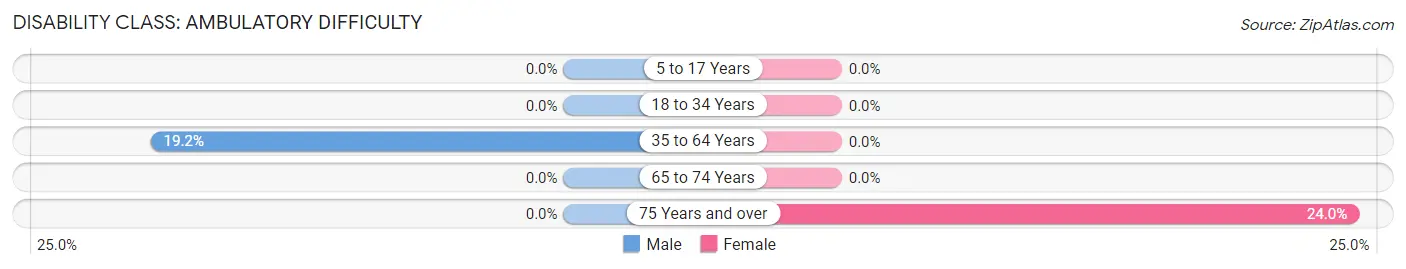
| Age Bracket | Male | Female |
| 5 to 17 Years | 0 (0.0%) | 0 (0.0%) |
| 18 to 34 Years | 0 (0.0%) | 0 (0.0%) |
| 35 to 64 Years | 9 (19.2%) | 0 (0.0%) |
| 65 to 74 Years | 0 (0.0%) | 0 (0.0%) |
| 75 Years and over | 0 (0.0%) | 6 (24.0%) |
Disability Class: Self-Care Difficulty
| Age Bracket | Male | Female |
| 5 to 17 Years | 0 (0.0%) | 0 (0.0%) |
| 18 to 34 Years | 0 (0.0%) | 0 (0.0%) |
| 35 to 64 Years | 0 (0.0%) | 0 (0.0%) |
| 65 to 74 Years | 0 (0.0%) | 0 (0.0%) |
| 75 Years and over | 0 (0.0%) | 0 (0.0%) |
Technology Access in Lansing
Computing Device Access in Lansing
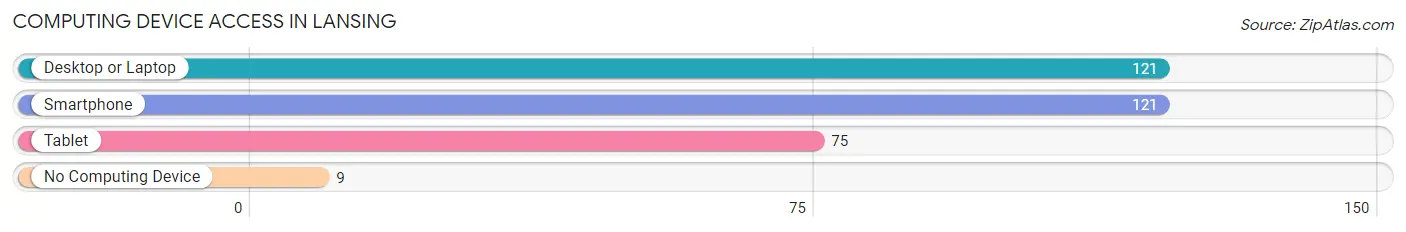
| Device Type | # Households | % Households |
| Desktop or Laptop | 121 | 87.1% |
| Smartphone | 121 | 87.1% |
| Tablet | 75 | 54.0% |
| No Computing Device | 9 | 6.5% |
| Total | 139 | 100.0% |
Internet Access in Lansing
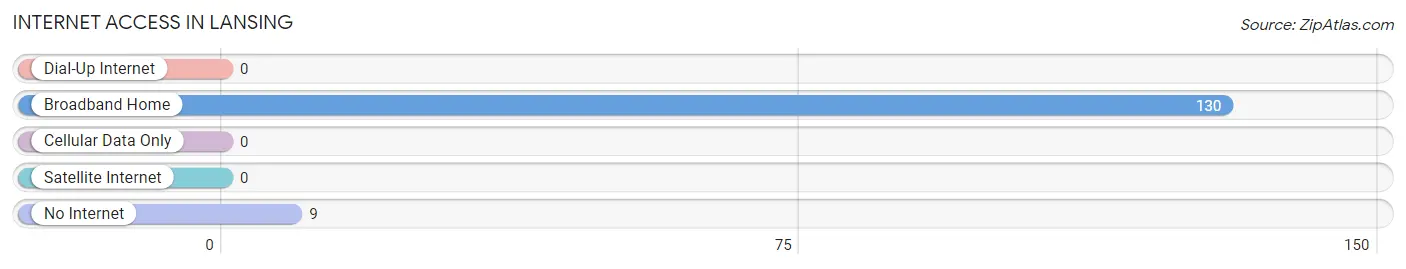
| Internet Type | # Households | % Households |
| Dial-Up Internet | 0 | 0.0% |
| Broadband Home | 130 | 93.5% |
| Cellular Data Only | 0 | 0.0% |
| Satellite Internet | 0 | 0.0% |
| No Internet | 9 | 6.5% |
| Total | 139 | 100.0% |
Lansing Summary
Lansing, Ohio is a small village located in the southeastern corner of Athens County, Ohio. It is situated on the banks of the Hocking River, approximately 10 miles south of Athens, the county seat. The village is part of the Athens Metropolitan Statistical Area and is home to a population of approximately 1,000 people.
History
Lansing was founded in 1817 by a group of settlers from Pennsylvania. The village was named after the town of Lansing, New York, which was the hometown of one of the settlers. The village was incorporated in 1832 and was the first village in Athens County to be incorporated.
The village was an important stop on the Ohio and Erie Canal, which was built in the early 19th century. The canal provided a transportation route for goods and people between the Ohio River and Lake Erie. The canal was an important factor in the growth of the village and the surrounding area.
The village was also an important stop on the Underground Railroad, which was used by escaped slaves to travel to freedom in the northern states. The village was home to several prominent abolitionists, including John Rankin and Levi Coffin.
Geography
Lansing is located in the southeastern corner of Athens County, Ohio. It is situated on the banks of the Hocking River, approximately 10 miles south of Athens, the county seat. The village is part of the Athens Metropolitan Statistical Area and is home to a population of approximately 1,000 people.
The village is located in a rural area and is surrounded by rolling hills and farmland. The village is located in the Appalachian Plateau region of Ohio and is part of the Hocking Valley. The village is located in a temperate climate zone and experiences four distinct seasons.
Economy
The economy of Lansing is largely based on agriculture and tourism. The village is home to several small businesses, including a grocery store, a hardware store, and a few restaurants. The village is also home to several small manufacturing companies, including a furniture manufacturer and a plastics manufacturer.
The village is also home to several tourist attractions, including the Hocking Valley Scenic Railway, the Athens County Historical Society Museum, and the Athens County Fairgrounds. The village is also home to several wineries and breweries, which attract visitors from all over the region.
Demographics
As of the 2010 census, the population of Lansing was 1,000 people. The racial makeup of the village was 97.2% White, 0.7% African American, 0.2% Native American, 0.2% Asian, 0.2% from other races, and 1.7% from two or more races. Hispanic or Latino of any race were 0.7% of the population.
The median household income in Lansing was $37,500, and the median family income was $45,000. The per capita income in the village was $18,000. About 11.2% of families and 14.2% of the population were below the poverty line, including 18.2% of those under age 18 and 8.2% of those age 65 or over.
Common Questions
What is Per Capita Income in Lansing?
Per Capita income in Lansing is $26,959.
What is Income or Wage Gap in Lansing?
Income or Wage Gap in Lansing is 0.4%.
Women in Lansing earn 99.6 cents for every dollar earned by a man.
What is Inequality or Gini Index in Lansing?
Inequality or Gini Index in Lansing is 0.34.
What is the Total Population of Lansing?
Total Population of Lansing is 285.
What is the Total Male Population of Lansing?
Total Male Population of Lansing is 144.
What is the Total Female Population of Lansing?
Total Female Population of Lansing is 141.
What is the Ratio of Males per 100 Females in Lansing?
There are 102.13 Males per 100 Females in Lansing.
What is the Ratio of Females per 100 Males in Lansing?
There are 97.92 Females per 100 Males in Lansing.
What is the Median Population Age in Lansing?
Median Population Age in Lansing is 56.7 Years.
What is the Average Family Size in Lansing
Average Family Size in Lansing is 2.8 People.
What is the Average Household Size in Lansing
Average Household Size in Lansing is 2.0 People.
How Large is the Labor Force in Lansing?
There are 106 People in the Labor Forcein in Lansing.
What is the Percentage of People in the Labor Force in Lansing?
44.9% of People are in the Labor Force in Lansing.