Fairborn, OH Map & Demographics
Fairborn Map
Fairborn Overview
$33,110
PER CAPITA INCOME
$73,492
AVG FAMILY INCOME
$53,783
AVG HOUSEHOLD INCOME
27.1%
WAGE / INCOME GAP [ % ]
72.9¢/ $1
WAGE / INCOME GAP [ $ ]
$8,204
FAMILY INCOME DEFICIT
0.44
INEQUALITY / GINI INDEX
34,494
TOTAL POPULATION
17,314
MALE POPULATION
17,180
FEMALE POPULATION
100.78
MALES / 100 FEMALES
99.23
FEMALES / 100 MALES
35.1
MEDIAN AGE
2.8
AVG FAMILY SIZE
2.1
AVG HOUSEHOLD SIZE
18,409
LABOR FORCE [ PEOPLE ]
64.7%
PERCENT IN LABOR FORCE
4.9%
UNEMPLOYMENT RATE
Fairborn Zip Codes
Fairborn Area Codes
Income in Fairborn
Income Overview in Fairborn
Per Capita Income in Fairborn is $33,110, while median incomes of families and households are $73,492 and $53,783 respectively.
| Characteristic | Number | Measure |
| Per Capita Income | 34,494 | $33,110 |
| Median Family Income | 8,186 | $73,492 |
| Mean Family Income | 8,186 | $87,324 |
| Median Household Income | 15,875 | $53,783 |
| Mean Household Income | 15,875 | $70,877 |
| Income Deficit | 8,186 | $8,204 |
| Wage / Income Gap (%) | 34,494 | 27.08% |
| Wage / Income Gap ($) | 34,494 | 72.92¢ per $1 |
| Gini / Inequality Index | 34,494 | 0.44 |
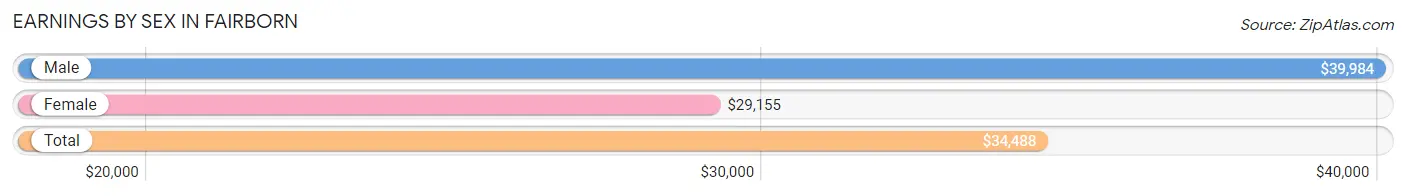
Earnings by Sex in Fairborn
Average Earnings in Fairborn are $34,488, $39,984 for men and $29,155 for women, a difference of 27.1%.
| Sex | Number | Average Earnings |
| Male | 10,312 (51.7%) | $39,984 |
| Female | 9,618 (48.3%) | $29,155 |
| Total | 19,930 (100.0%) | $34,488 |
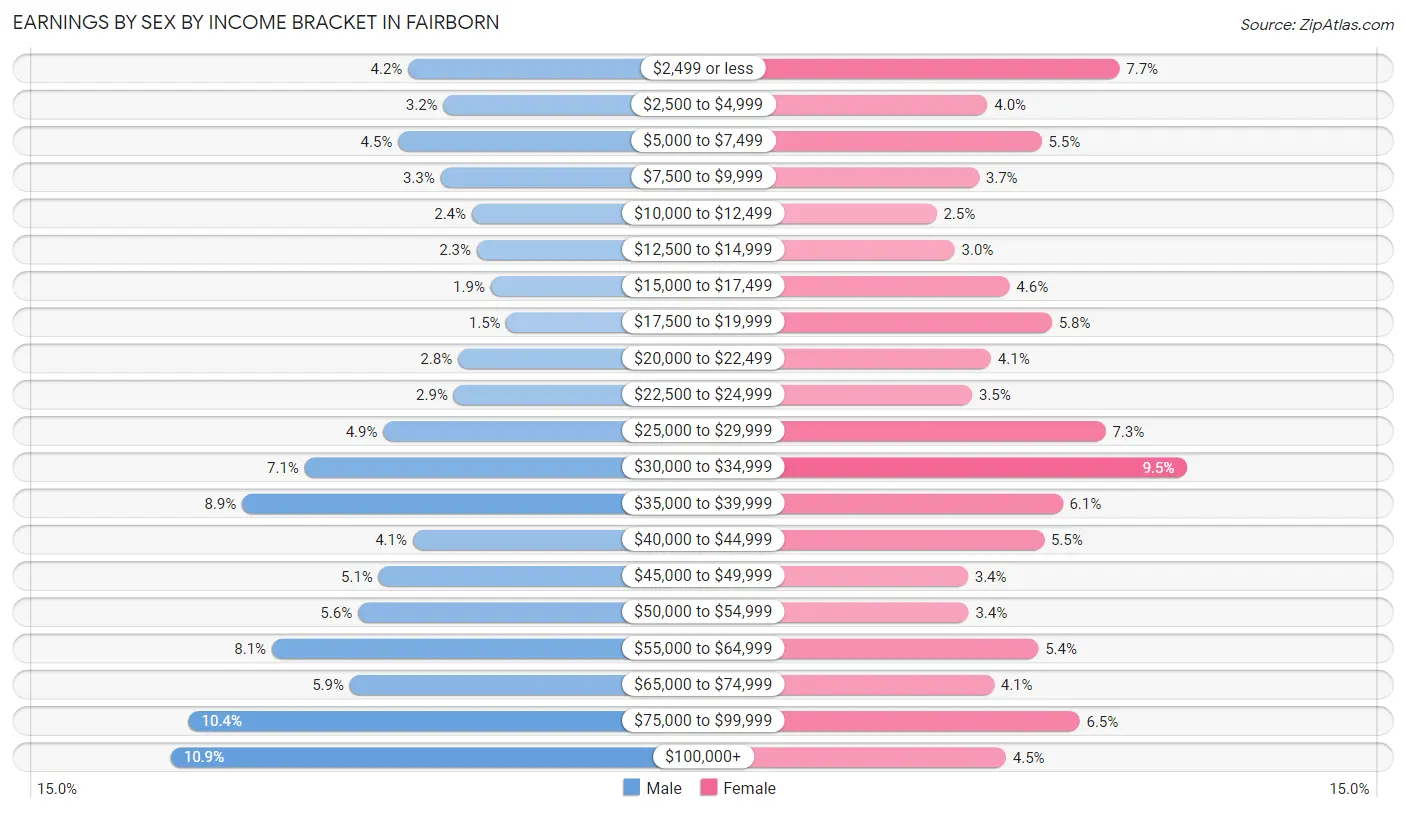
Earnings by Sex by Income Bracket in Fairborn
The most common earnings brackets in Fairborn are $100,000+ for men (1,123 | 10.9%) and $30,000 to $34,999 for women (918 | 9.5%).
| Income | Male | Female |
| $2,499 or less | 435 (4.2%) | 737 (7.7%) |
| $2,500 to $4,999 | 333 (3.2%) | 380 (4.0%) |
| $5,000 to $7,499 | 464 (4.5%) | 526 (5.5%) |
| $7,500 to $9,999 | 341 (3.3%) | 357 (3.7%) |
| $10,000 to $12,499 | 251 (2.4%) | 242 (2.5%) |
| $12,500 to $14,999 | 236 (2.3%) | 291 (3.0%) |
| $15,000 to $17,499 | 196 (1.9%) | 440 (4.6%) |
| $17,500 to $19,999 | 151 (1.5%) | 554 (5.8%) |
| $20,000 to $22,499 | 291 (2.8%) | 390 (4.1%) |
| $22,500 to $24,999 | 303 (2.9%) | 339 (3.5%) |
| $25,000 to $29,999 | 507 (4.9%) | 699 (7.3%) |
| $30,000 to $34,999 | 735 (7.1%) | 918 (9.5%) |
| $35,000 to $39,999 | 917 (8.9%) | 583 (6.1%) |
| $40,000 to $44,999 | 422 (4.1%) | 533 (5.5%) |
| $45,000 to $49,999 | 521 (5.1%) | 327 (3.4%) |
| $50,000 to $54,999 | 581 (5.6%) | 329 (3.4%) |
| $55,000 to $64,999 | 830 (8.1%) | 517 (5.4%) |
| $65,000 to $74,999 | 604 (5.9%) | 397 (4.1%) |
| $75,000 to $99,999 | 1,071 (10.4%) | 629 (6.5%) |
| $100,000+ | 1,123 (10.9%) | 430 (4.5%) |
| Total | 10,312 (100.0%) | 9,618 (100.0%) |
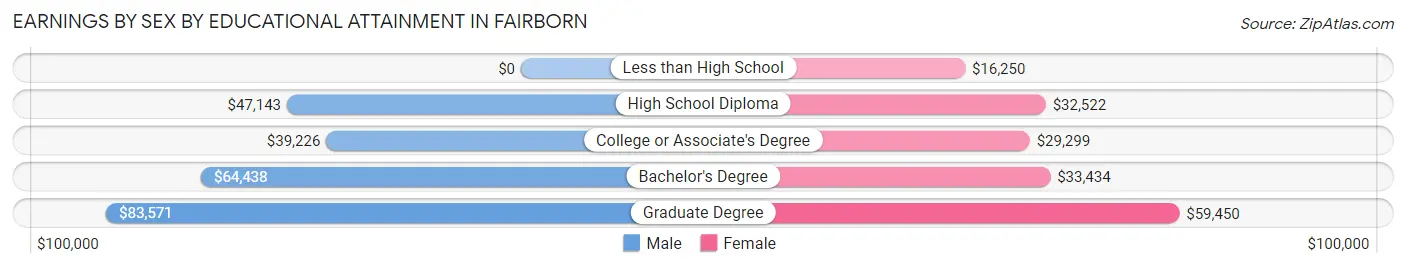
Earnings by Sex by Educational Attainment in Fairborn
Average earnings in Fairborn are $50,385 for men and $33,393 for women, a difference of 33.7%. Men with an educational attainment of graduate degree enjoy the highest average annual earnings of $83,571, while those with college or associate's degree education earn the least with $39,226. Women with an educational attainment of graduate degree earn the most with the average annual earnings of $59,450, while those with less than high school education have the smallest earnings of $16,250.
| Educational Attainment | Male Income | Female Income |
| Less than High School | - | - |
| High School Diploma | $47,143 | $32,522 |
| College or Associate's Degree | $39,226 | $29,299 |
| Bachelor's Degree | $64,438 | $33,434 |
| Graduate Degree | $83,571 | $59,450 |
| Total | $50,385 | $33,393 |
Family Income in Fairborn
Family Income Brackets in Fairborn
According to the Fairborn family income data, there are 1,580 families falling into the $100,000 to $149,999 income range, which is the most common income bracket and makes up 19.3% of all families. Conversely, the less than $10,000 income bracket is the least frequent group with only 213 families (2.6%) belonging to this category.
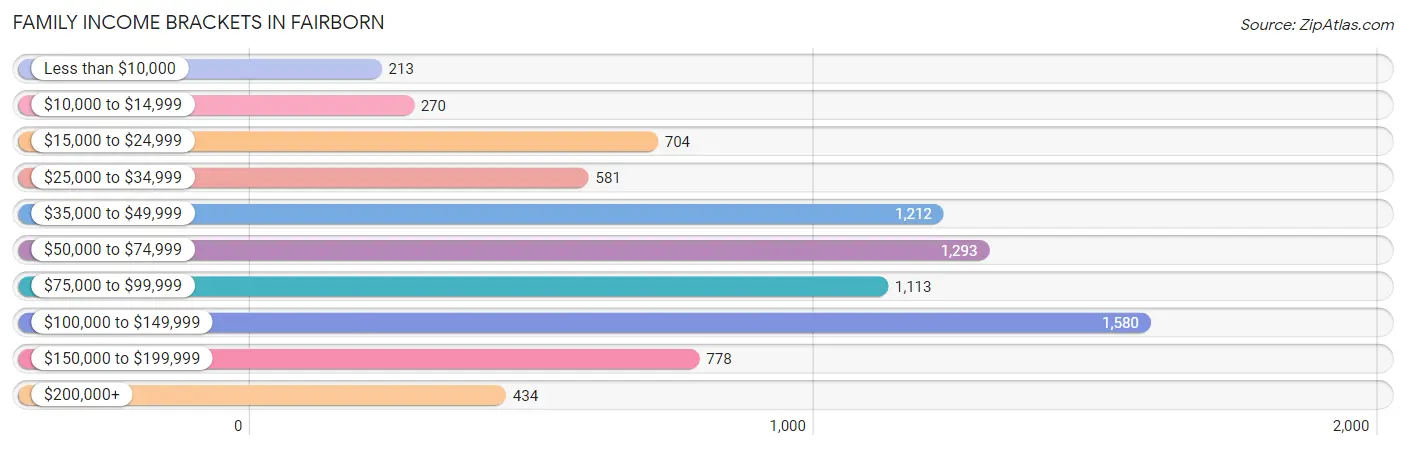
| Income Bracket | # Families | % Families |
| Less than $10,000 | 213 | 2.6% |
| $10,000 to $14,999 | 270 | 3.3% |
| $15,000 to $24,999 | 704 | 8.6% |
| $25,000 to $34,999 | 581 | 7.1% |
| $35,000 to $49,999 | 1,212 | 14.8% |
| $50,000 to $74,999 | 1,293 | 15.8% |
| $75,000 to $99,999 | 1,113 | 13.6% |
| $100,000 to $149,999 | 1,580 | 19.3% |
| $150,000 to $199,999 | 778 | 9.5% |
| $200,000+ | 434 | 5.3% |
Family Income by Famaliy Size in Fairborn
6-person families (184 | 2.2%) account for the highest median family income in Fairborn with $145,000 per family, while 2-person families (4,387 | 53.6%) have the highest median income of $31,273 per family member.
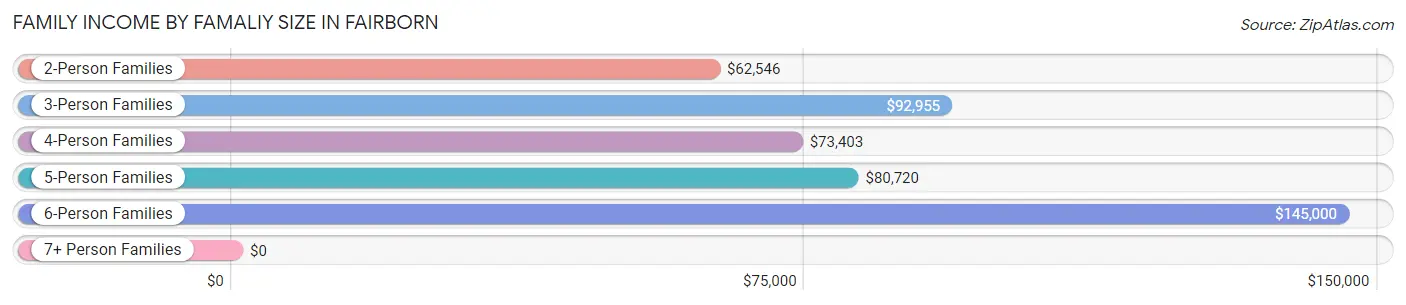
| Income Bracket | # Families | Median Income |
| 2-Person Families | 4,387 (53.6%) | $62,546 |
| 3-Person Families | 1,956 (23.9%) | $92,955 |
| 4-Person Families | 1,114 (13.6%) | $73,403 |
| 5-Person Families | 535 (6.5%) | $80,720 |
| 6-Person Families | 184 (2.2%) | $145,000 |
| 7+ Person Families | 10 (0.1%) | $0 |
| Total | 8,186 (100.0%) | $73,492 |
Family Income by Number of Earners in Fairborn
The median family income in Fairborn is $73,492, with families comprising 3+ earners (686) having the highest median family income of $138,636, while families with no earners (1,215) have the lowest median family income of $40,368, accounting for 8.4% and 14.8% of families, respectively.
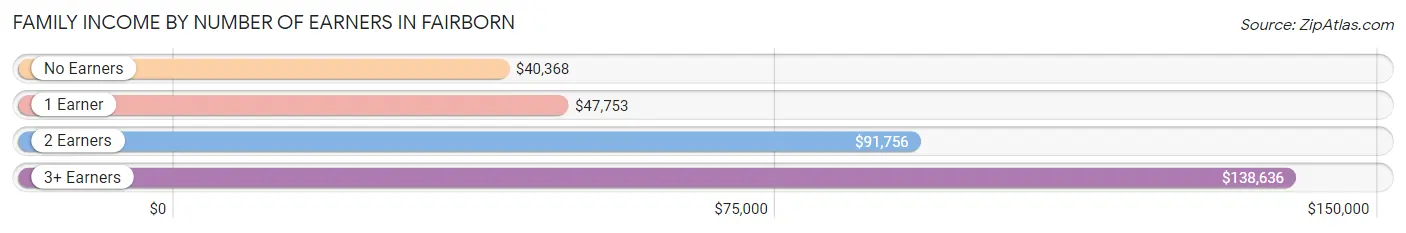
| Number of Earners | # Families | Median Income |
| No Earners | 1,215 (14.8%) | $40,368 |
| 1 Earner | 3,058 (37.4%) | $47,753 |
| 2 Earners | 3,227 (39.4%) | $91,756 |
| 3+ Earners | 686 (8.4%) | $138,636 |
| Total | 8,186 (100.0%) | $73,492 |
Household Income in Fairborn
Household Income Brackets in Fairborn
With 2,889 households falling in the category, the $50,000 to $74,999 income range is the most frequent in Fairborn, accounting for 18.2% of all households. In contrast, only 540 households (3.4%) fall into the $200,000+ income bracket, making it the least populous group.
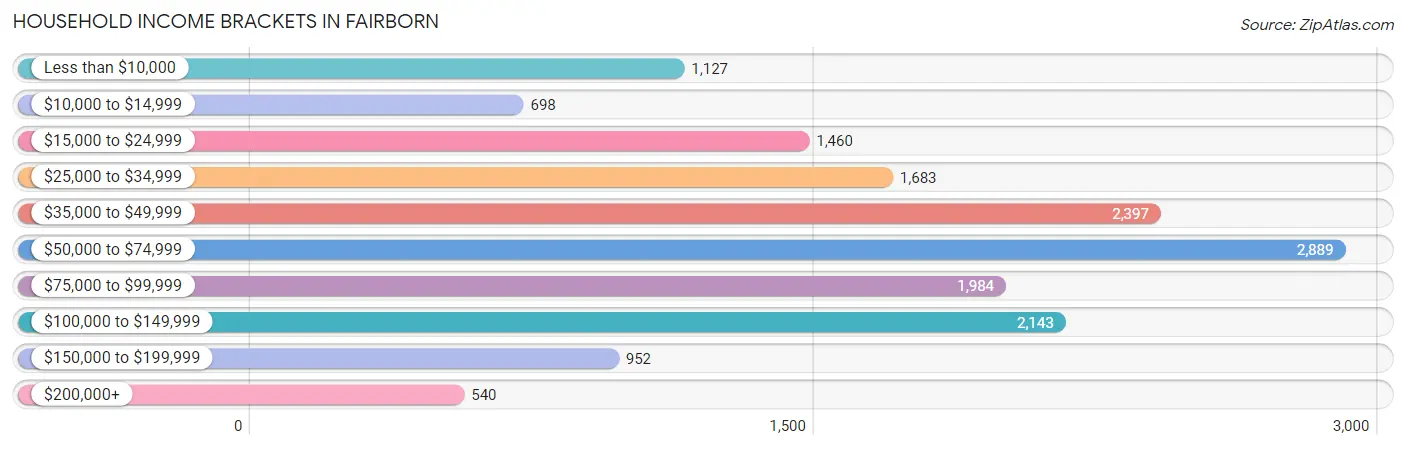
| Income Bracket | # Households | % Households |
| Less than $10,000 | 1,127 | 7.1% |
| $10,000 to $14,999 | 698 | 4.4% |
| $15,000 to $24,999 | 1,460 | 9.2% |
| $25,000 to $34,999 | 1,683 | 10.6% |
| $35,000 to $49,999 | 2,397 | 15.1% |
| $50,000 to $74,999 | 2,889 | 18.2% |
| $75,000 to $99,999 | 1,984 | 12.5% |
| $100,000 to $149,999 | 2,143 | 13.5% |
| $150,000 to $199,999 | 952 | 6.0% |
| $200,000+ | 540 | 3.4% |
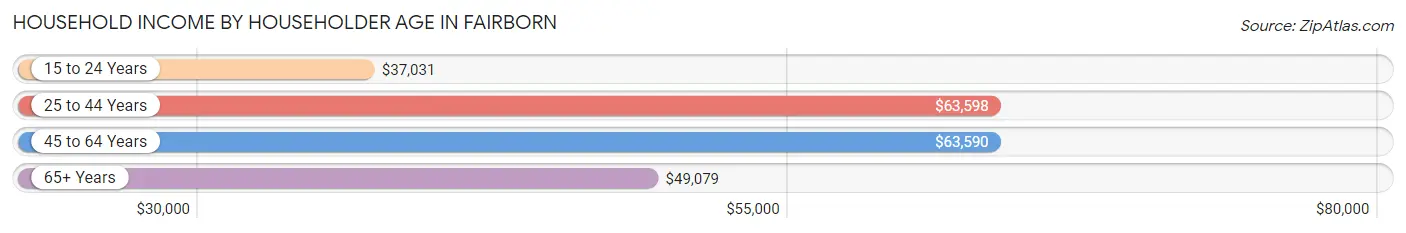
Household Income by Householder Age in Fairborn
The median household income in Fairborn is $53,783, with the highest median household income of $63,598 found in the 25 to 44 years age bracket for the primary householder. A total of 5,903 households (37.2%) fall into this category. Meanwhile, the 15 to 24 years age bracket for the primary householder has the lowest median household income of $37,031, with 1,891 households (11.9%) in this group.
| Income Bracket | # Households | Median Income |
| 15 to 24 Years | 1,891 (11.9%) | $37,031 |
| 25 to 44 Years | 5,903 (37.2%) | $63,598 |
| 45 to 64 Years | 4,529 (28.5%) | $63,590 |
| 65+ Years | 3,552 (22.4%) | $49,079 |
| Total | 15,875 (100.0%) | $53,783 |
Poverty in Fairborn
Income Below Poverty by Sex and Age in Fairborn
With 19.0% poverty level for males and 17.2% for females among the residents of Fairborn, 5 year old males and 5 year old females are the most vulnerable to poverty, with 111 males (36.7%) and 59 females (38.8%) in their respective age groups living below the poverty level.
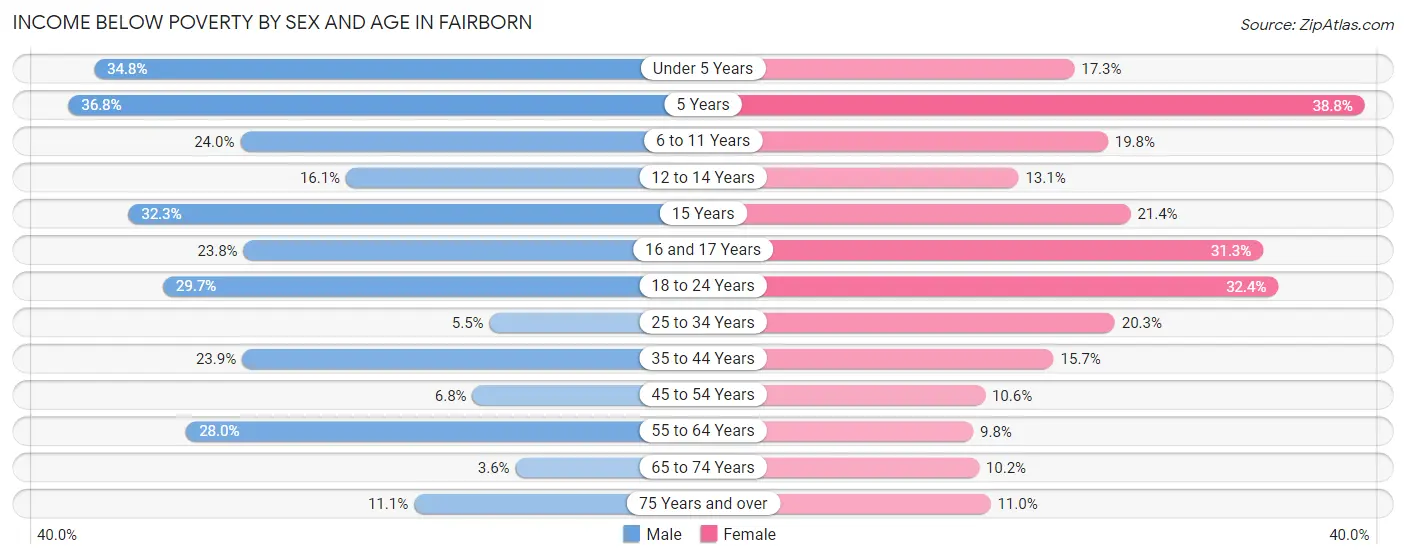
| Age Bracket | Male | Female |
| Under 5 Years | 433 (34.8%) | 188 (17.3%) |
| 5 Years | 111 (36.7%) | 59 (38.8%) |
| 6 to 11 Years | 255 (24.0%) | 189 (19.8%) |
| 12 to 14 Years | 51 (16.1%) | 61 (13.1%) |
| 15 Years | 52 (32.3%) | 42 (21.4%) |
| 16 and 17 Years | 76 (23.7%) | 71 (31.3%) |
| 18 to 24 Years | 647 (29.7%) | 634 (32.4%) |
| 25 to 34 Years | 160 (5.5%) | 636 (20.3%) |
| 35 to 44 Years | 549 (23.9%) | 348 (15.7%) |
| 45 to 54 Years | 113 (6.8%) | 173 (10.6%) |
| 55 to 64 Years | 619 (28.0%) | 194 (9.8%) |
| 65 to 74 Years | 46 (3.6%) | 131 (10.2%) |
| 75 Years and over | 114 (11.1%) | 167 (11.0%) |
| Total | 3,226 (19.0%) | 2,893 (17.2%) |
Income Above Poverty by Sex and Age in Fairborn
According to the poverty statistics in Fairborn, males aged 65 to 74 years and females aged 55 to 64 years are the age groups that are most secure financially, with 96.4% of males and 90.2% of females in these age groups living above the poverty line.
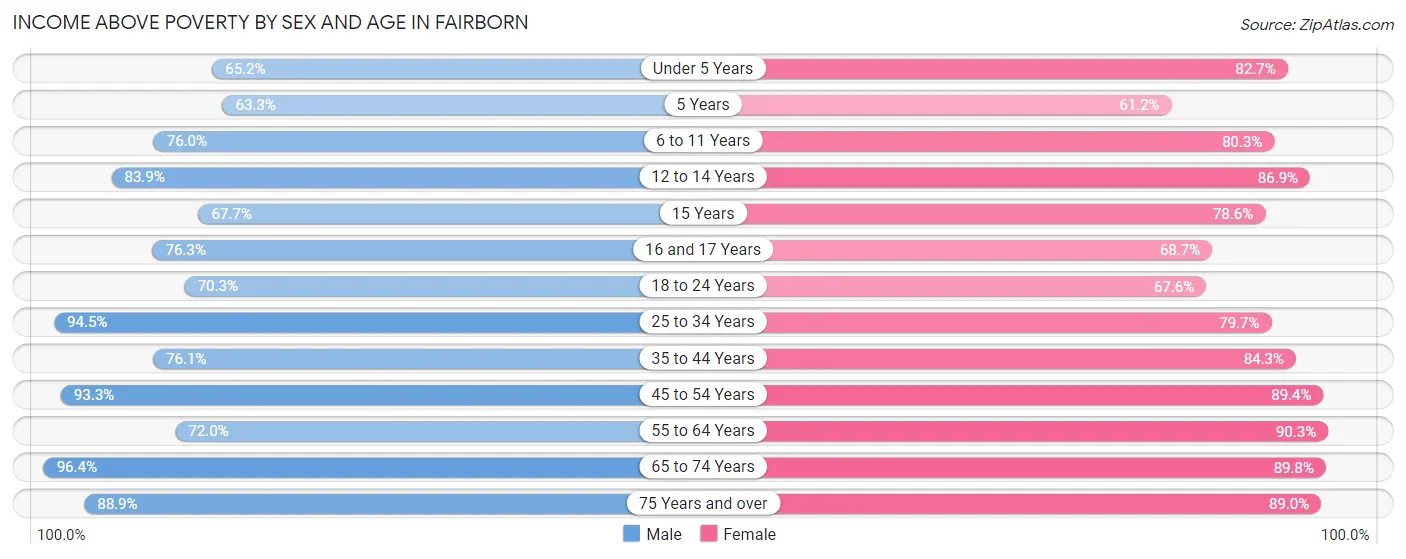
| Age Bracket | Male | Female |
| Under 5 Years | 810 (65.2%) | 901 (82.7%) |
| 5 Years | 191 (63.2%) | 93 (61.2%) |
| 6 to 11 Years | 808 (76.0%) | 768 (80.2%) |
| 12 to 14 Years | 265 (83.9%) | 404 (86.9%) |
| 15 Years | 109 (67.7%) | 154 (78.6%) |
| 16 and 17 Years | 244 (76.2%) | 156 (68.7%) |
| 18 to 24 Years | 1,529 (70.3%) | 1,323 (67.6%) |
| 25 to 34 Years | 2,757 (94.5%) | 2,502 (79.7%) |
| 35 to 44 Years | 1,752 (76.1%) | 1,864 (84.3%) |
| 45 to 54 Years | 1,562 (93.2%) | 1,454 (89.4%) |
| 55 to 64 Years | 1,592 (72.0%) | 1,796 (90.2%) |
| 65 to 74 Years | 1,246 (96.4%) | 1,156 (89.8%) |
| 75 Years and over | 914 (88.9%) | 1,346 (89.0%) |
| Total | 13,779 (81.0%) | 13,917 (82.8%) |
Income Below Poverty Among Married-Couple Families in Fairborn
The poverty statistics for married-couple families in Fairborn show that 4.3% or 233 of the total 5,448 families live below the poverty line. Families with 1 or 2 children have the highest poverty rate of 5.1%, comprising of 82 families. On the other hand, families with 3 or 4 children have the lowest poverty rate of 0.0%, which includes 0 families.
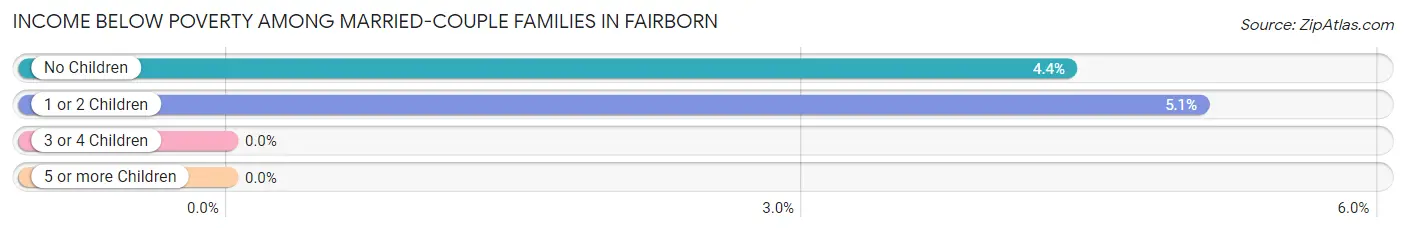
| Children | Above Poverty | Below Poverty |
| No Children | 3,294 (95.6%) | 151 (4.4%) |
| 1 or 2 Children | 1,536 (94.9%) | 82 (5.1%) |
| 3 or 4 Children | 385 (100.0%) | 0 (0.0%) |
| 5 or more Children | 0 (0.0%) | 0 (0.0%) |
| Total | 5,215 (95.7%) | 233 (4.3%) |
Income Below Poverty Among Single-Parent Households in Fairborn
According to the poverty data in Fairborn, 16.2% or 116 single-father households and 34.2% or 691 single-mother households are living below the poverty line. Among single-father households, those with 1 or 2 children have the highest poverty rate, with 78 households (26.0%) experiencing poverty. Likewise, among single-mother households, those with 5 or more children have the highest poverty rate, with 9 households (100.0%) falling below the poverty line.
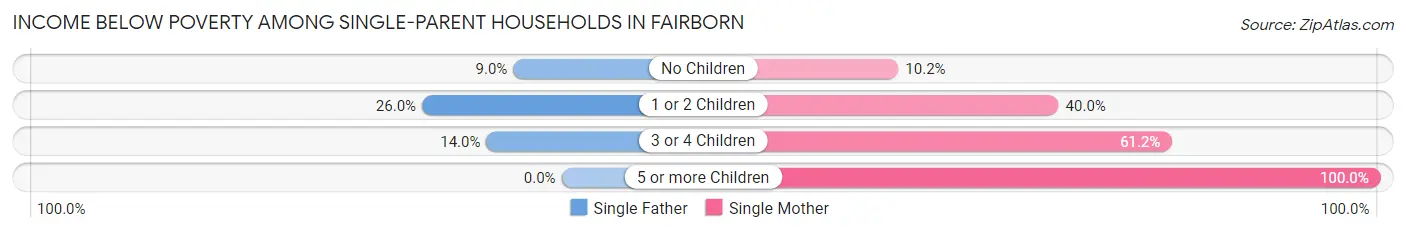
| Children | Single Father | Single Mother |
| No Children | 31 (9.0%) | 63 (10.2%) |
| 1 or 2 Children | 78 (26.0%) | 444 (40.0%) |
| 3 or 4 Children | 7 (14.0%) | 175 (61.2%) |
| 5 or more Children | 0 (0.0%) | 9 (100.0%) |
| Total | 116 (16.2%) | 691 (34.2%) |
Income Below Poverty Among Married-Couple vs Single-Parent Households in Fairborn
The poverty data for Fairborn shows that 233 of the married-couple family households (4.3%) and 807 of the single-parent households (29.5%) are living below the poverty level. Within the married-couple family households, those with 1 or 2 children have the highest poverty rate, with 82 households (5.1%) falling below the poverty line. Among the single-parent households, those with 3 or 4 children have the highest poverty rate, with 182 household (54.2%) living below poverty.
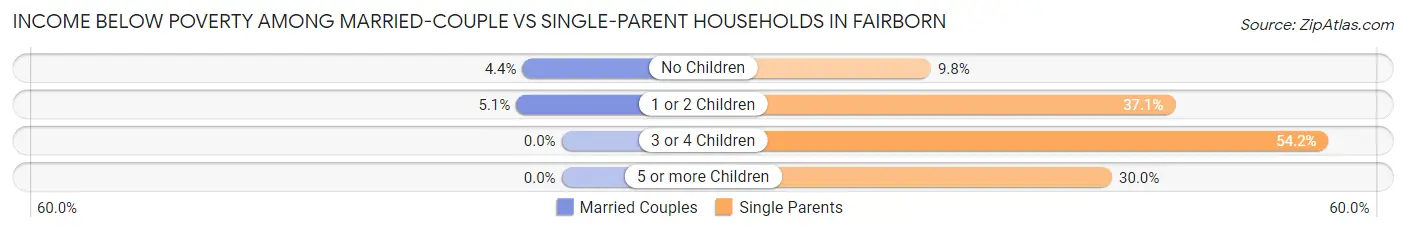
| Children | Married-Couple Families | Single-Parent Households |
| No Children | 151 (4.4%) | 94 (9.8%) |
| 1 or 2 Children | 82 (5.1%) | 522 (37.0%) |
| 3 or 4 Children | 0 (0.0%) | 182 (54.2%) |
| 5 or more Children | 0 (0.0%) | 9 (30.0%) |
| Total | 233 (4.3%) | 807 (29.5%) |
Race in Fairborn
The most populous races in Fairborn are White / Caucasian (27,770 | 80.5%), Black / African American (3,178 | 9.2%), and Two or more Races (2,792 | 8.1%).
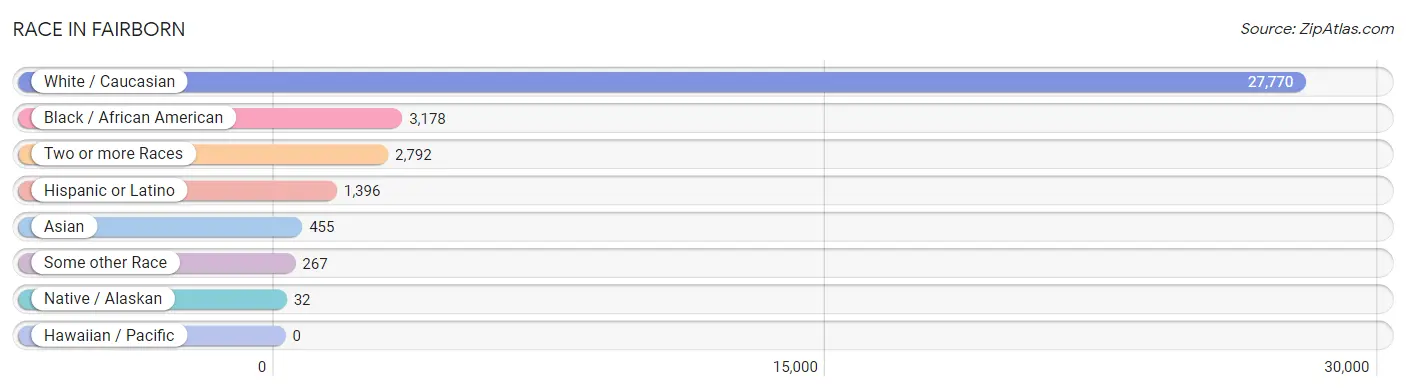
| Race | # Population | % Population |
| Asian | 455 | 1.3% |
| Black / African American | 3,178 | 9.2% |
| Hawaiian / Pacific | 0 | 0.0% |
| Hispanic or Latino | 1,396 | 4.1% |
| Native / Alaskan | 32 | 0.1% |
| White / Caucasian | 27,770 | 80.5% |
| Two or more Races | 2,792 | 8.1% |
| Some other Race | 267 | 0.8% |
| Total | 34,494 | 100.0% |
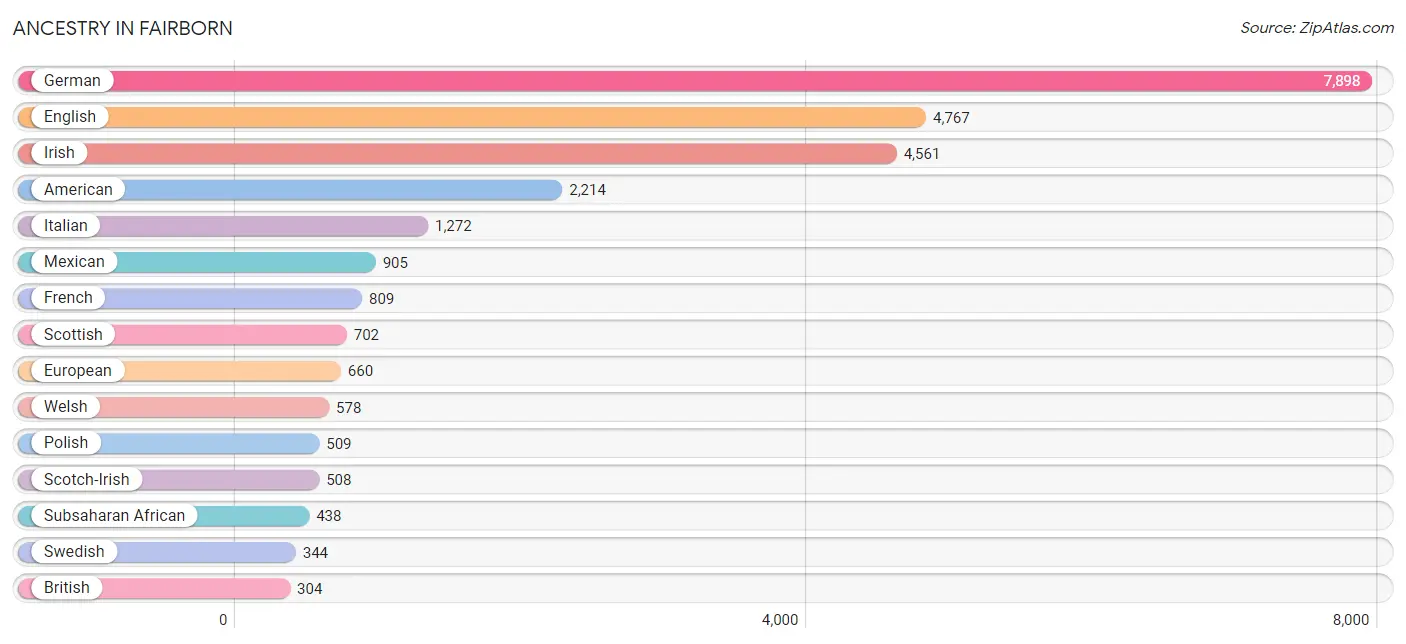
Ancestry in Fairborn
The most populous ancestries reported in Fairborn are German (7,898 | 22.9%), English (4,767 | 13.8%), Irish (4,561 | 13.2%), American (2,214 | 6.4%), and Italian (1,272 | 3.7%), together accounting for 60.1% of all Fairborn residents.
| Ancestry | # Population | % Population |
| African | 268 | 0.8% |
| American | 2,214 | 6.4% |
| Arab | 133 | 0.4% |
| Argentinean | 5 | 0.0% |
| Australian | 24 | 0.1% |
| Austrian | 89 | 0.3% |
| Belgian | 19 | 0.1% |
| Belizean | 40 | 0.1% |
| Bhutanese | 156 | 0.4% |
| British | 304 | 0.9% |
| Bulgarian | 2 | 0.0% |
| Burmese | 228 | 0.7% |
| Canadian | 6 | 0.0% |
| Central American | 76 | 0.2% |
| Cherokee | 58 | 0.2% |
| Chickasaw | 36 | 0.1% |
| Chippewa | 23 | 0.1% |
| Colombian | 38 | 0.1% |
| Costa Rican | 19 | 0.1% |
| Cuban | 43 | 0.1% |
| Czech | 168 | 0.5% |
| Danish | 58 | 0.2% |
| Delaware | 61 | 0.2% |
| Dominican | 7 | 0.0% |
| Dutch | 229 | 0.7% |
| Eastern European | 33 | 0.1% |
| Ecuadorian | 2 | 0.0% |
| English | 4,767 | 13.8% |
| European | 660 | 1.9% |
| Filipino | 56 | 0.2% |
| Finnish | 110 | 0.3% |
| French | 809 | 2.4% |
| French Canadian | 94 | 0.3% |
| German | 7,898 | 22.9% |
| Ghanaian | 97 | 0.3% |
| Greek | 242 | 0.7% |
| Guatemalan | 9 | 0.0% |
| Haitian | 15 | 0.0% |
| Honduran | 9 | 0.0% |
| Hungarian | 122 | 0.4% |
| Indian (Asian) | 138 | 0.4% |
| Iranian | 34 | 0.1% |
| Irish | 4,561 | 13.2% |
| Iroquois | 28 | 0.1% |
| Italian | 1,272 | 3.7% |
| Jamaican | 21 | 0.1% |
| Kenyan | 17 | 0.1% |
| Korean | 112 | 0.3% |
| Lithuanian | 91 | 0.3% |
| Mexican | 905 | 2.6% |
| Mexican American Indian | 20 | 0.1% |
| Mongolian | 12 | 0.0% |
| Native Hawaiian | 27 | 0.1% |
| Navajo | 2 | 0.0% |
| Nicaraguan | 39 | 0.1% |
| Nigerian | 56 | 0.2% |
| Northern European | 54 | 0.2% |
| Norwegian | 283 | 0.8% |
| Pakistani | 49 | 0.1% |
| Pennsylvania German | 10 | 0.0% |
| Peruvian | 15 | 0.0% |
| Polish | 509 | 1.5% |
| Portuguese | 33 | 0.1% |
| Potawatomi | 43 | 0.1% |
| Puerto Rican | 142 | 0.4% |
| Romanian | 23 | 0.1% |
| Russian | 207 | 0.6% |
| Samoan | 4 | 0.0% |
| Scandinavian | 102 | 0.3% |
| Scotch-Irish | 508 | 1.5% |
| Scottish | 702 | 2.0% |
| Sioux | 40 | 0.1% |
| Slavic | 19 | 0.1% |
| Slovak | 139 | 0.4% |
| Slovene | 19 | 0.1% |
| South American | 60 | 0.2% |
| Spaniard | 97 | 0.3% |
| Spanish | 20 | 0.1% |
| Sri Lankan | 17 | 0.1% |
| Subsaharan African | 438 | 1.3% |
| Swedish | 344 | 1.0% |
| Swiss | 99 | 0.3% |
| Syrian | 22 | 0.1% |
| Thai | 75 | 0.2% |
| Ukrainian | 6 | 0.0% |
| Welsh | 578 | 1.7% |
| West Indian | 42 | 0.1% | View All 87 Rows |
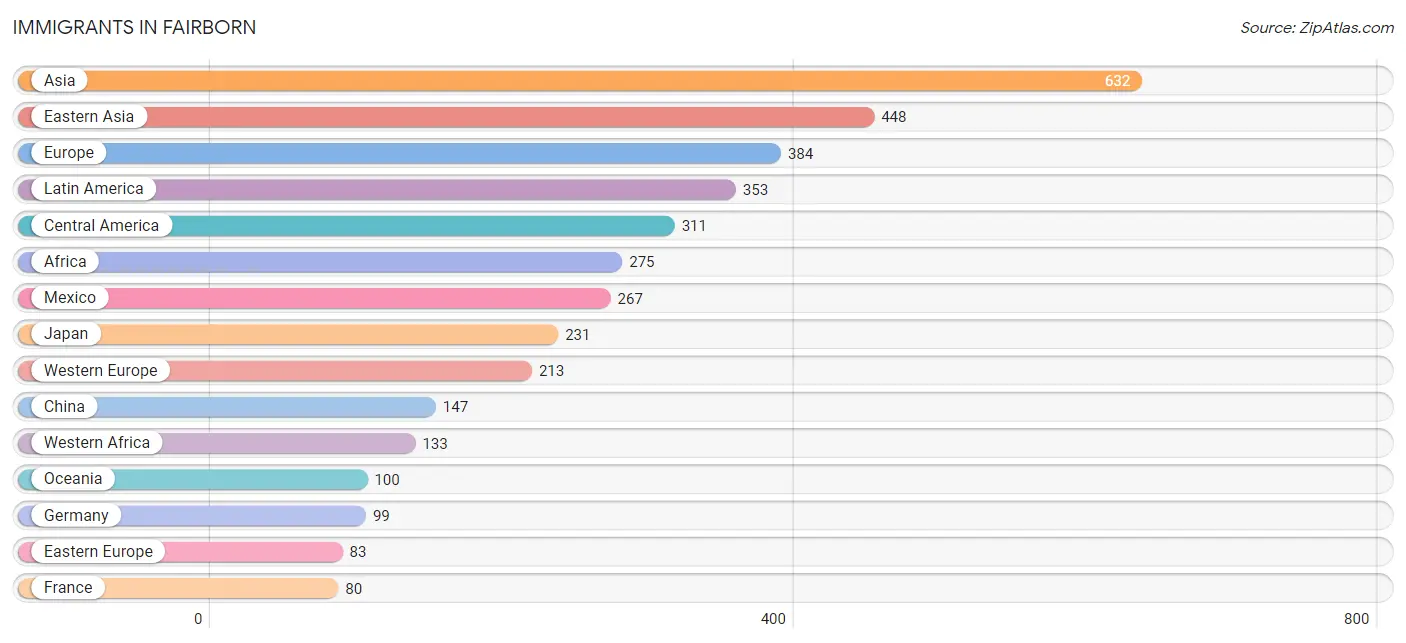
Immigrants in Fairborn
The most numerous immigrant groups reported in Fairborn came from Asia (632 | 1.8%), Eastern Asia (448 | 1.3%), Europe (384 | 1.1%), Latin America (353 | 1.0%), and Central America (311 | 0.9%), together accounting for 6.2% of all Fairborn residents.
| Immigration Origin | # Population | % Population |
| Africa | 275 | 0.8% |
| Asia | 632 | 1.8% |
| Australia | 54 | 0.2% |
| Austria | 34 | 0.1% |
| Bulgaria | 2 | 0.0% |
| Canada | 23 | 0.1% |
| Caribbean | 30 | 0.1% |
| Central America | 311 | 0.9% |
| China | 147 | 0.4% |
| Colombia | 12 | 0.0% |
| Costa Rica | 10 | 0.0% |
| Dominican Republic | 7 | 0.0% |
| Eastern Africa | 69 | 0.2% |
| Eastern Asia | 448 | 1.3% |
| Eastern Europe | 83 | 0.2% |
| England | 45 | 0.1% |
| Europe | 384 | 1.1% |
| France | 80 | 0.2% |
| Germany | 99 | 0.3% |
| Ghana | 77 | 0.2% |
| Guatemala | 9 | 0.0% |
| Haiti | 15 | 0.0% |
| Honduras | 9 | 0.0% |
| India | 53 | 0.2% |
| Jamaica | 7 | 0.0% |
| Japan | 231 | 0.7% |
| Kenya | 36 | 0.1% |
| Korea | 70 | 0.2% |
| Latin America | 353 | 1.0% |
| Malaysia | 26 | 0.1% |
| Mexico | 267 | 0.8% |
| Nepal | 2 | 0.0% |
| Nigeria | 56 | 0.2% |
| Northern Africa | 73 | 0.2% |
| Northern Europe | 69 | 0.2% |
| Oceania | 100 | 0.3% |
| Pakistan | 7 | 0.0% |
| Philippines | 28 | 0.1% |
| Russia | 71 | 0.2% |
| Saudi Arabia | 44 | 0.1% |
| Scotland | 12 | 0.0% |
| South America | 12 | 0.0% |
| South Central Asia | 69 | 0.2% |
| South Eastern Asia | 71 | 0.2% |
| Southern Europe | 19 | 0.1% |
| Spain | 19 | 0.1% |
| Taiwan | 43 | 0.1% |
| Trinidad and Tobago | 1 | 0.0% |
| Ukraine | 10 | 0.0% |
| Vietnam | 17 | 0.1% |
| Western Africa | 133 | 0.4% |
| Western Asia | 44 | 0.1% |
| Western Europe | 213 | 0.6% | View All 53 Rows |
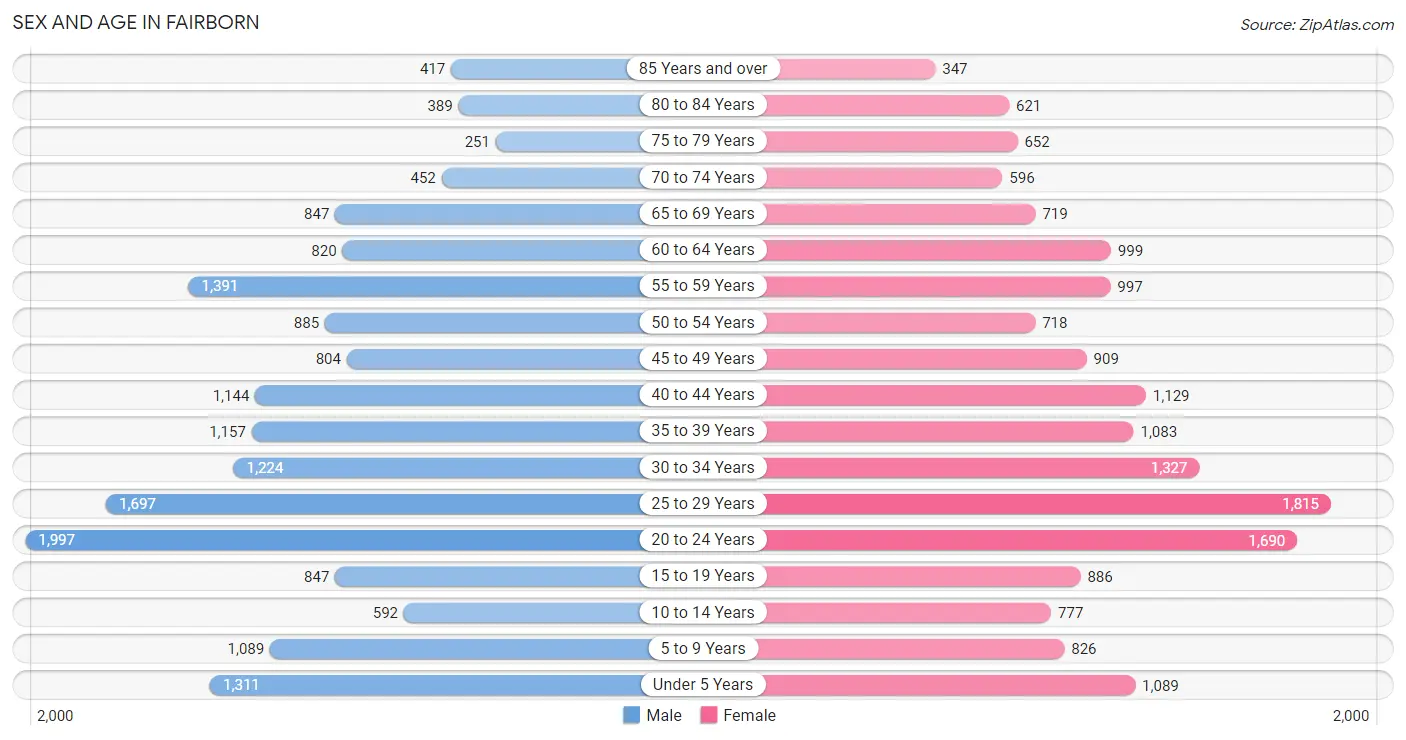
Sex and Age in Fairborn
Sex and Age in Fairborn
The most populous age groups in Fairborn are 20 to 24 Years (1,997 | 11.5%) for men and 25 to 29 Years (1,815 | 10.6%) for women.
| Age Bracket | Male | Female |
| Under 5 Years | 1,311 (7.6%) | 1,089 (6.3%) |
| 5 to 9 Years | 1,089 (6.3%) | 826 (4.8%) |
| 10 to 14 Years | 592 (3.4%) | 777 (4.5%) |
| 15 to 19 Years | 847 (4.9%) | 886 (5.2%) |
| 20 to 24 Years | 1,997 (11.5%) | 1,690 (9.8%) |
| 25 to 29 Years | 1,697 (9.8%) | 1,815 (10.6%) |
| 30 to 34 Years | 1,224 (7.1%) | 1,327 (7.7%) |
| 35 to 39 Years | 1,157 (6.7%) | 1,083 (6.3%) |
| 40 to 44 Years | 1,144 (6.6%) | 1,129 (6.6%) |
| 45 to 49 Years | 804 (4.6%) | 909 (5.3%) |
| 50 to 54 Years | 885 (5.1%) | 718 (4.2%) |
| 55 to 59 Years | 1,391 (8.0%) | 997 (5.8%) |
| 60 to 64 Years | 820 (4.7%) | 999 (5.8%) |
| 65 to 69 Years | 847 (4.9%) | 719 (4.2%) |
| 70 to 74 Years | 452 (2.6%) | 596 (3.5%) |
| 75 to 79 Years | 251 (1.5%) | 652 (3.8%) |
| 80 to 84 Years | 389 (2.2%) | 621 (3.6%) |
| 85 Years and over | 417 (2.4%) | 347 (2.0%) |
| Total | 17,314 (100.0%) | 17,180 (100.0%) |
Families and Households in Fairborn
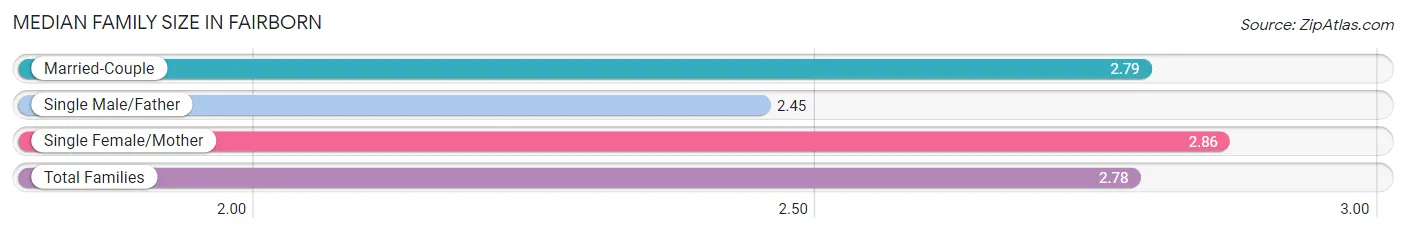
Median Family Size in Fairborn
The median family size in Fairborn is 2.78 persons per family, with single female/mother families (2,022 | 24.7%) accounting for the largest median family size of 2.86 persons per family. On the other hand, single male/father families (716 | 8.7%) represent the smallest median family size with 2.45 persons per family.
| Family Type | # Families | Family Size |
| Married-Couple | 5,448 (66.5%) | 2.79 |
| Single Male/Father | 716 (8.7%) | 2.45 |
| Single Female/Mother | 2,022 (24.7%) | 2.86 |
| Total Families | 8,186 (100.0%) | 2.78 |
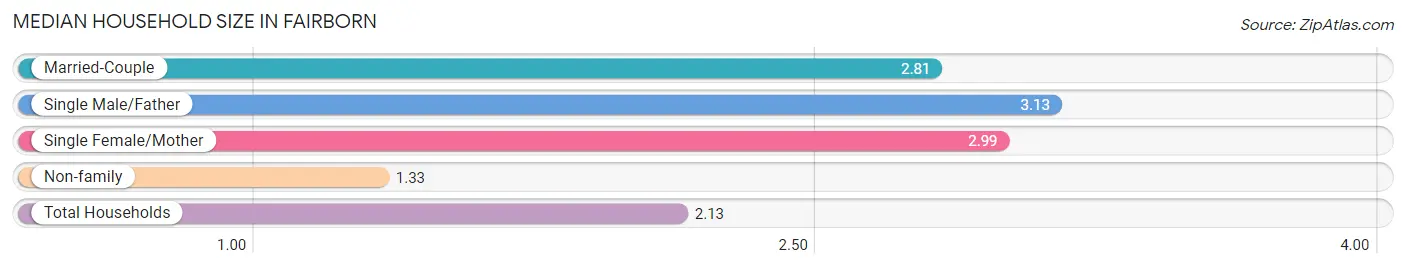
Median Household Size in Fairborn
The median household size in Fairborn is 2.13 persons per household, with single male/father households (716 | 4.5%) accounting for the largest median household size of 3.13 persons per household. non-family households (7,689 | 48.4%) represent the smallest median household size with 1.33 persons per household.
| Household Type | # Households | Household Size |
| Married-Couple | 5,448 (34.3%) | 2.81 |
| Single Male/Father | 716 (4.5%) | 3.13 |
| Single Female/Mother | 2,022 (12.7%) | 2.99 |
| Non-family | 7,689 (48.4%) | 1.33 |
| Total Households | 15,875 (100.0%) | 2.13 |
Household Size by Marriage Status in Fairborn
Out of a total of 15,875 households in Fairborn, 8,186 (51.6%) are family households, while 7,689 (48.4%) are nonfamily households. The most numerous type of family households are 2-person households, comprising 3,974, and the most common type of nonfamily households are 1-person households, comprising 5,552.
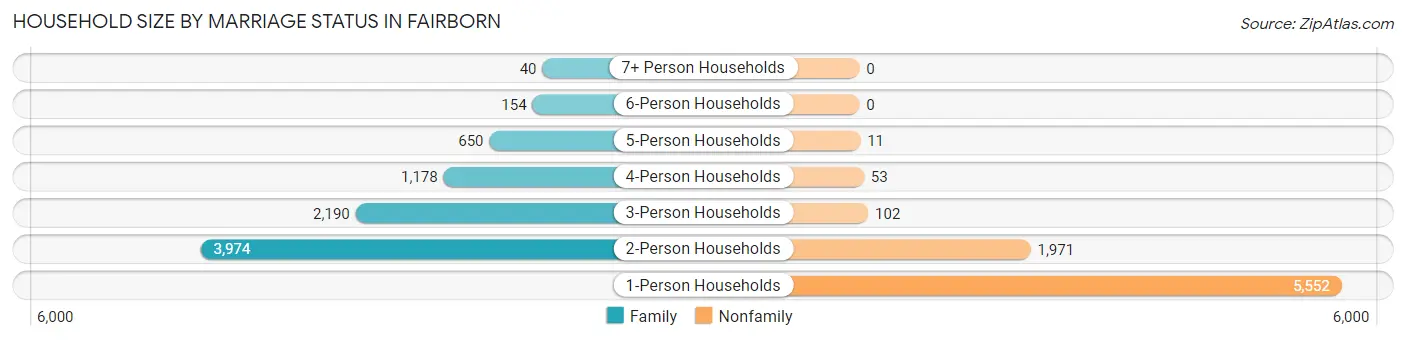
| Household Size | Family Households | Nonfamily Households |
| 1-Person Households | - | 5,552 (35.0%) |
| 2-Person Households | 3,974 (25.0%) | 1,971 (12.4%) |
| 3-Person Households | 2,190 (13.8%) | 102 (0.6%) |
| 4-Person Households | 1,178 (7.4%) | 53 (0.3%) |
| 5-Person Households | 650 (4.1%) | 11 (0.1%) |
| 6-Person Households | 154 (1.0%) | 0 (0.0%) |
| 7+ Person Households | 40 (0.3%) | 0 (0.0%) |
| Total | 8,186 (51.6%) | 7,689 (48.4%) |
Female Fertility in Fairborn
Fertility by Age in Fairborn
Average fertility rate in Fairborn is 73.0 births per 1,000 women. Women in the age bracket of 20 to 34 years have the highest fertility rate with 95.0 births per 1,000 women. Women in the age bracket of 20 to 34 years acount for 70.6% of all women with births.
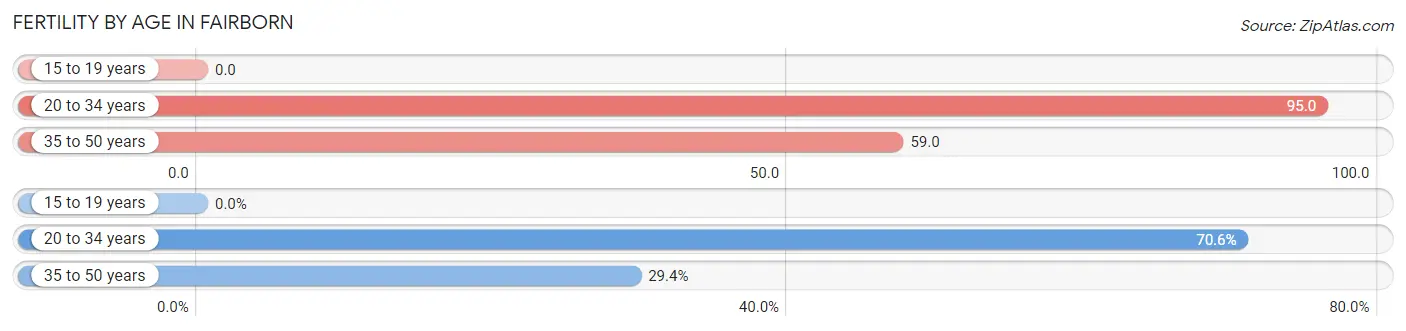
| Age Bracket | Women with Births | Births / 1,000 Women |
| 15 to 19 years | 0 (0.0%) | 0.0 |
| 20 to 34 years | 461 (70.6%) | 95.0 |
| 35 to 50 years | 192 (29.4%) | 59.0 |
| Total | 653 (100.0%) | 73.0 |
Fertility by Age by Marriage Status in Fairborn
58.5% of women with births (653) in Fairborn are married. The highest percentage of unmarried women with births falls into 20 to 34 years age bracket with 52.7% of them unmarried at the time of birth, while the lowest percentage of unmarried women with births belong to 35 to 50 years age bracket with 14.6% of them unmarried.
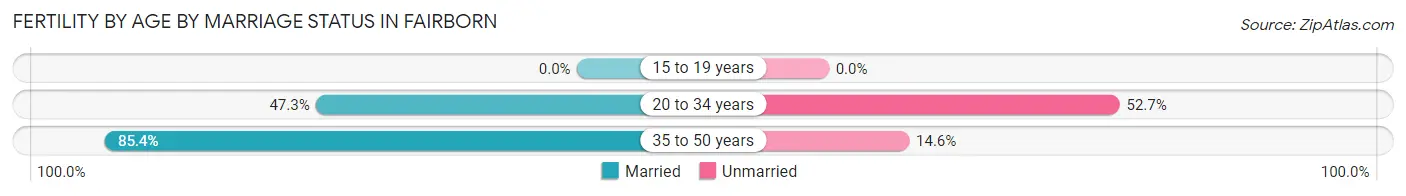
| Age Bracket | Married | Unmarried |
| 15 to 19 years | 0 (0.0%) | 0 (0.0%) |
| 20 to 34 years | 218 (47.3%) | 243 (52.7%) |
| 35 to 50 years | 164 (85.4%) | 28 (14.6%) |
| Total | 382 (58.5%) | 271 (41.5%) |
Fertility by Education in Fairborn
Average fertility rate in Fairborn is 73.0 births per 1,000 women. Women with the education attainment of high school diploma have the highest fertility rate of 138.0 births per 1,000 women, while women with the education attainment of bachelor's degree have the lowest fertility at 44.0 births per 1,000 women. Women with the education attainment of high school diploma represent 33.5% of all women with births.
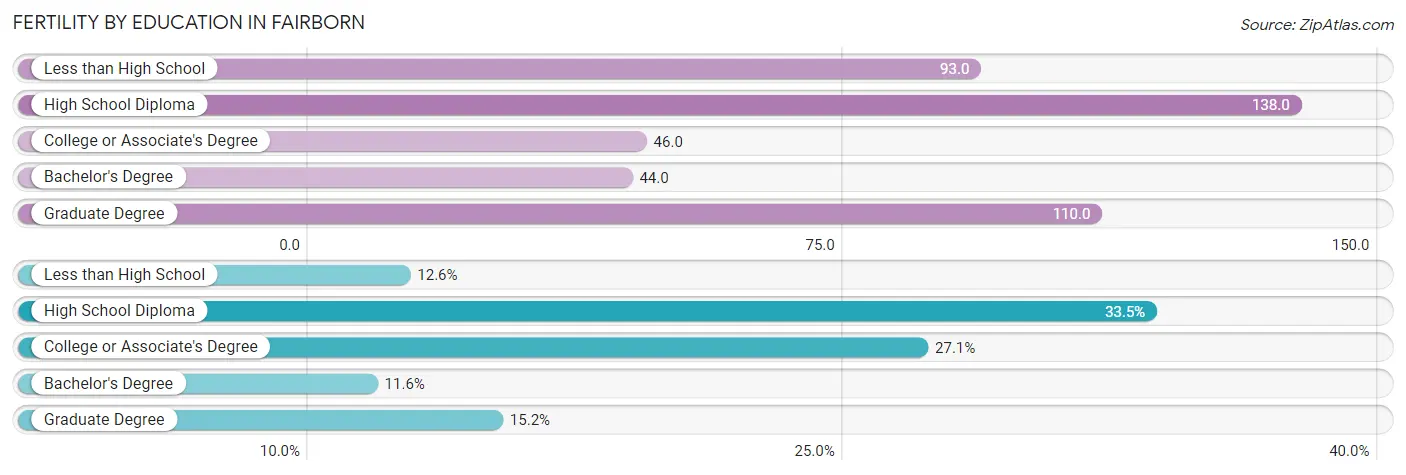
| Educational Attainment | Women with Births | Births / 1,000 Women |
| Less than High School | 82 (12.6%) | 93.0 |
| High School Diploma | 219 (33.5%) | 138.0 |
| College or Associate's Degree | 177 (27.1%) | 46.0 |
| Bachelor's Degree | 76 (11.6%) | 44.0 |
| Graduate Degree | 99 (15.2%) | 110.0 |
| Total | 653 (100.0%) | 73.0 |
Fertility by Education by Marriage Status in Fairborn
41.5% of women with births in Fairborn are unmarried. Women with the educational attainment of bachelor's degree are most likely to be married with 100.0% of them married at childbirth, while women with the educational attainment of less than high school are least likely to be married with 100.0% of them unmarried at childbirth.
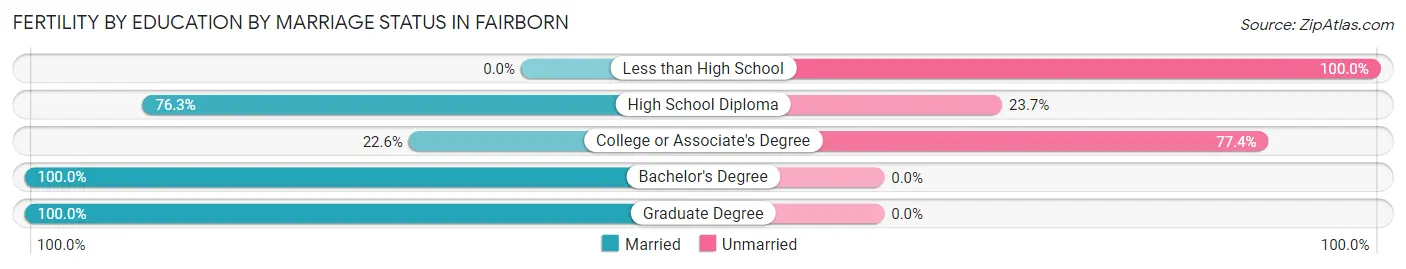
| Educational Attainment | Married | Unmarried |
| Less than High School | 0 (0.0%) | 82 (100.0%) |
| High School Diploma | 167 (76.3%) | 52 (23.7%) |
| College or Associate's Degree | 40 (22.6%) | 137 (77.4%) |
| Bachelor's Degree | 76 (100.0%) | 0 (0.0%) |
| Graduate Degree | 99 (100.0%) | 0 (0.0%) |
| Total | 382 (58.5%) | 271 (41.5%) |
Employment Characteristics in Fairborn
Employment by Class of Employer in Fairborn
Among the 17,353 employed individuals in Fairborn, private company employees (10,777 | 62.1%), federal government employees (2,390 | 13.8%), and not-for-profit organizations (1,599 | 9.2%) make up the most common classes of employment.
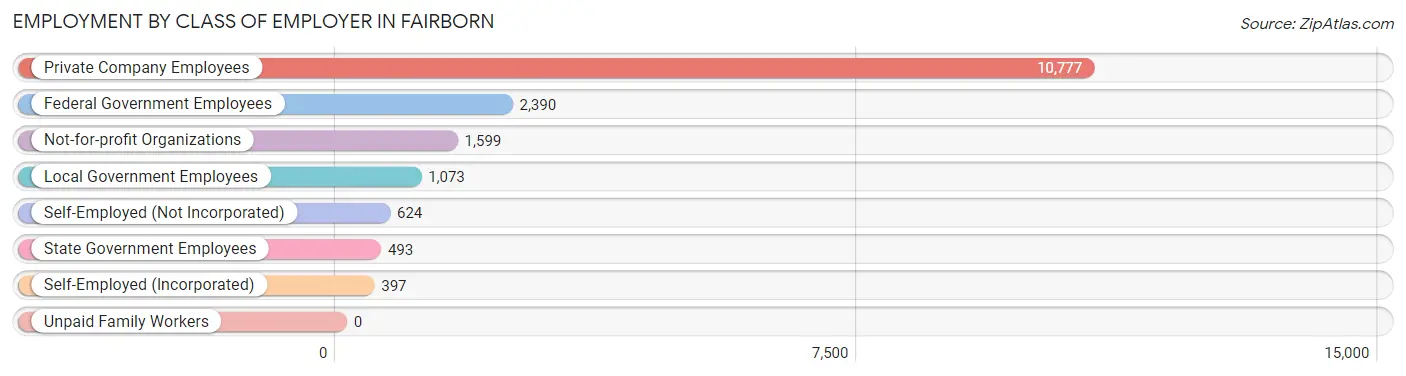
| Employer Class | # Employees | % Employees |
| Private Company Employees | 10,777 | 62.1% |
| Self-Employed (Incorporated) | 397 | 2.3% |
| Self-Employed (Not Incorporated) | 624 | 3.6% |
| Not-for-profit Organizations | 1,599 | 9.2% |
| Local Government Employees | 1,073 | 6.2% |
| State Government Employees | 493 | 2.8% |
| Federal Government Employees | 2,390 | 13.8% |
| Unpaid Family Workers | 0 | 0.0% |
| Total | 17,353 | 100.0% |
Employment Status by Age in Fairborn
According to the labor force statistics for Fairborn, out of the total population over 16 years of age (28,453), 64.7% or 18,409 individuals are in the labor force, with 4.9% or 902 of them unemployed. The age group with the highest labor force participation rate is 25 to 29 years, with 90.4% or 3,175 individuals in the labor force. Within the labor force, the 75 years and over age range has the highest percentage of unemployed individuals, with 14.0% or 7 of them being unemployed.
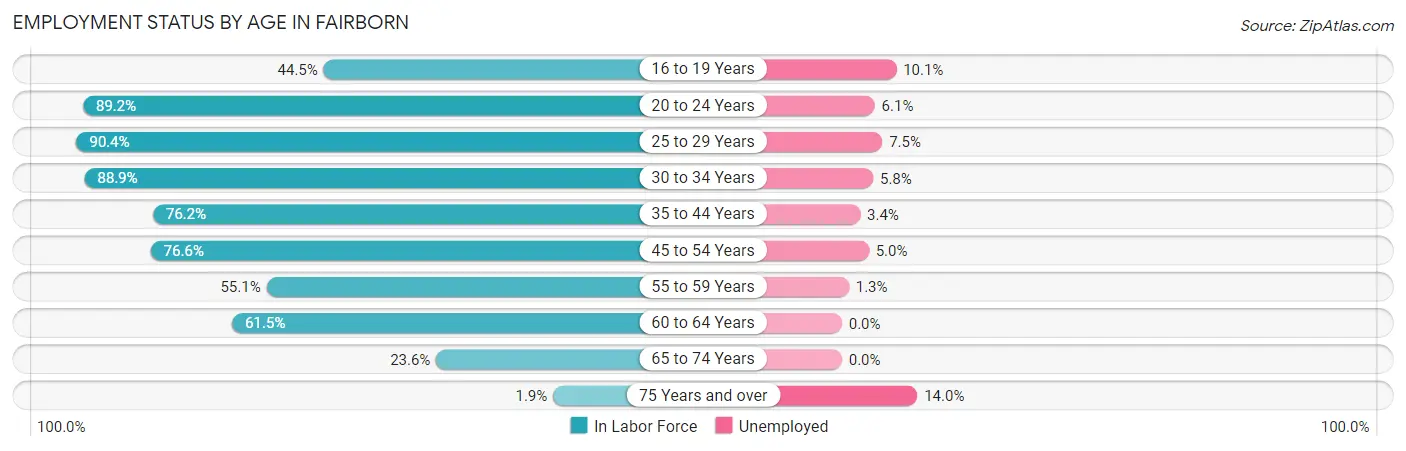
| Age Bracket | In Labor Force | Unemployed |
| 16 to 19 Years | 612 (44.5%) | 62 (10.1%) |
| 20 to 24 Years | 3,289 (89.2%) | 201 (6.1%) |
| 25 to 29 Years | 3,175 (90.4%) | 238 (7.5%) |
| 30 to 34 Years | 2,268 (88.9%) | 132 (5.8%) |
| 35 to 44 Years | 3,439 (76.2%) | 117 (3.4%) |
| 45 to 54 Years | 2,540 (76.6%) | 127 (5.0%) |
| 55 to 59 Years | 1,316 (55.1%) | 17 (1.3%) |
| 60 to 64 Years | 1,119 (61.5%) | 0 (0.0%) |
| 65 to 74 Years | 617 (23.6%) | 0 (0.0%) |
| 75 Years and over | 51 (1.9%) | 7 (14.0%) |
| Total | 18,409 (64.7%) | 902 (4.9%) |
Employment Status by Educational Attainment in Fairborn
According to labor force statistics for Fairborn, 76.6% of individuals (13,864) out of the total population between 25 and 64 years of age (18,099) are in the labor force, with 4.5% or 624 of them being unemployed. The group with the highest labor force participation rate are those with the educational attainment of bachelor's degree or higher, with 86.7% or 4,847 individuals in the labor force. Within the labor force, individuals with less than high school education have the highest percentage of unemployment, with 9.9% or 70 of them being unemployed.
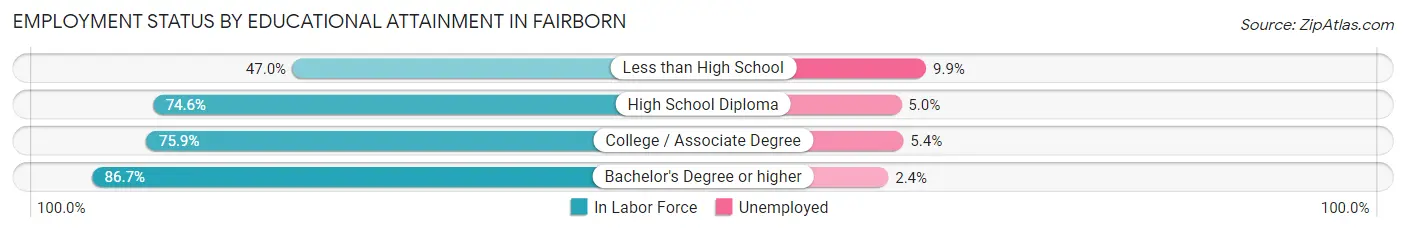
| Educational Attainment | In Labor Force | Unemployed |
| Less than High School | 708 (47.0%) | 149 (9.9%) |
| High School Diploma | 2,956 (74.6%) | 198 (5.0%) |
| College / Associate Degree | 5,344 (75.9%) | 380 (5.4%) |
| Bachelor's Degree or higher | 4,847 (86.7%) | 134 (2.4%) |
| Total | 13,864 (76.6%) | 814 (4.5%) |
Employment Occupations by Sex in Fairborn
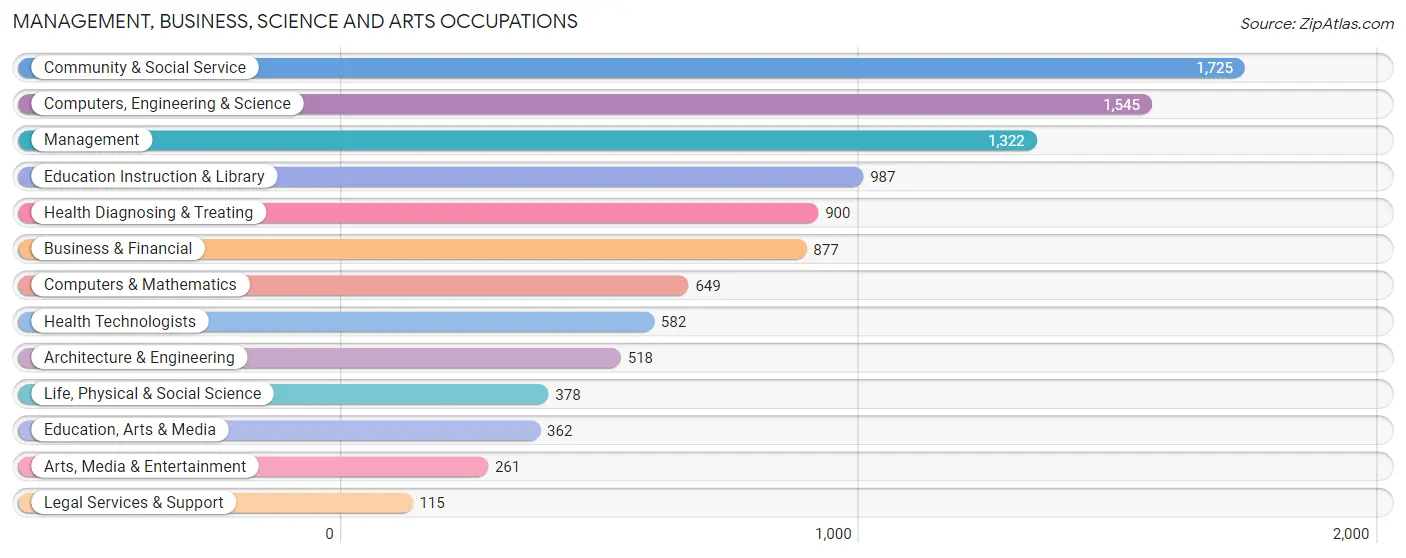
Management, Business, Science and Arts Occupations
The most common Management, Business, Science and Arts occupations in Fairborn are Community & Social Service (1,725 | 10.2%), Computers, Engineering & Science (1,545 | 9.2%), Management (1,322 | 7.8%), Education Instruction & Library (987 | 5.9%), and Health Diagnosing & Treating (900 | 5.3%).
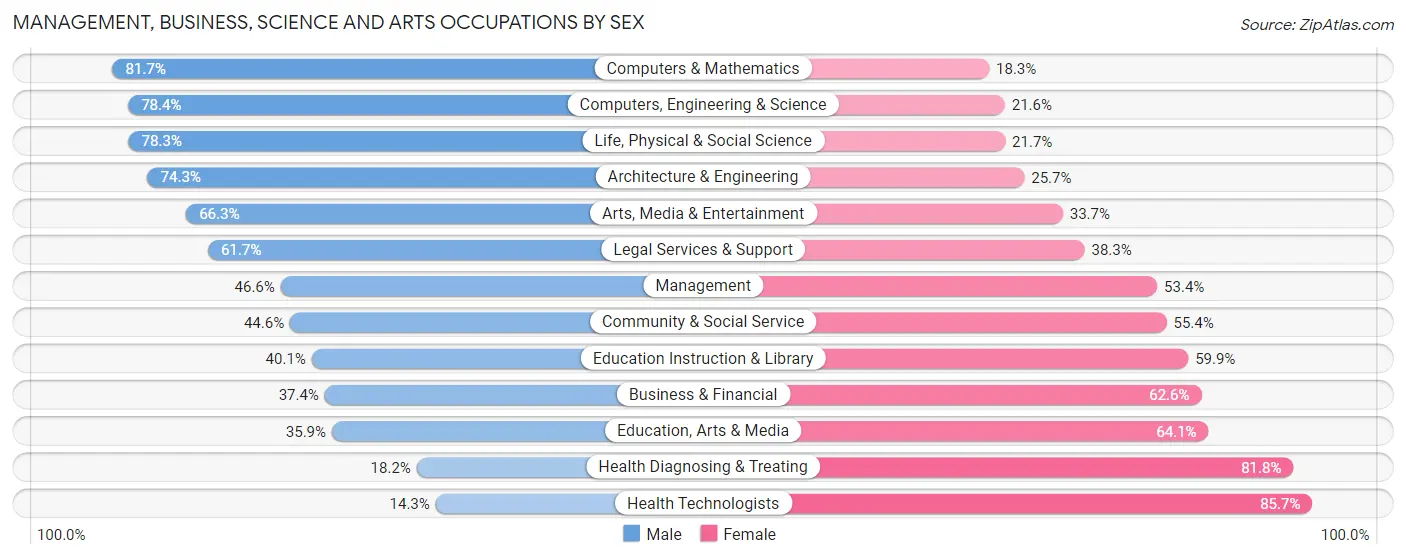
Management, Business, Science and Arts Occupations by Sex
Within the Management, Business, Science and Arts occupations in Fairborn, the most male-oriented occupations are Computers & Mathematics (81.7%), Computers, Engineering & Science (78.4%), and Life, Physical & Social Science (78.3%), while the most female-oriented occupations are Health Technologists (85.7%), Health Diagnosing & Treating (81.8%), and Education, Arts & Media (64.1%).
| Occupation | Male | Female |
| Management | 616 (46.6%) | 706 (53.4%) |
| Business & Financial | 328 (37.4%) | 549 (62.6%) |
| Computers, Engineering & Science | 1,211 (78.4%) | 334 (21.6%) |
| Computers & Mathematics | 530 (81.7%) | 119 (18.3%) |
| Architecture & Engineering | 385 (74.3%) | 133 (25.7%) |
| Life, Physical & Social Science | 296 (78.3%) | 82 (21.7%) |
| Community & Social Service | 770 (44.6%) | 955 (55.4%) |
| Education, Arts & Media | 130 (35.9%) | 232 (64.1%) |
| Legal Services & Support | 71 (61.7%) | 44 (38.3%) |
| Education Instruction & Library | 396 (40.1%) | 591 (59.9%) |
| Arts, Media & Entertainment | 173 (66.3%) | 88 (33.7%) |
| Health Diagnosing & Treating | 164 (18.2%) | 736 (81.8%) |
| Health Technologists | 83 (14.3%) | 499 (85.7%) |
| Total (Category) | 3,089 (48.5%) | 3,280 (51.5%) |
| Total (Overall) | 8,580 (50.8%) | 8,296 (49.2%) |
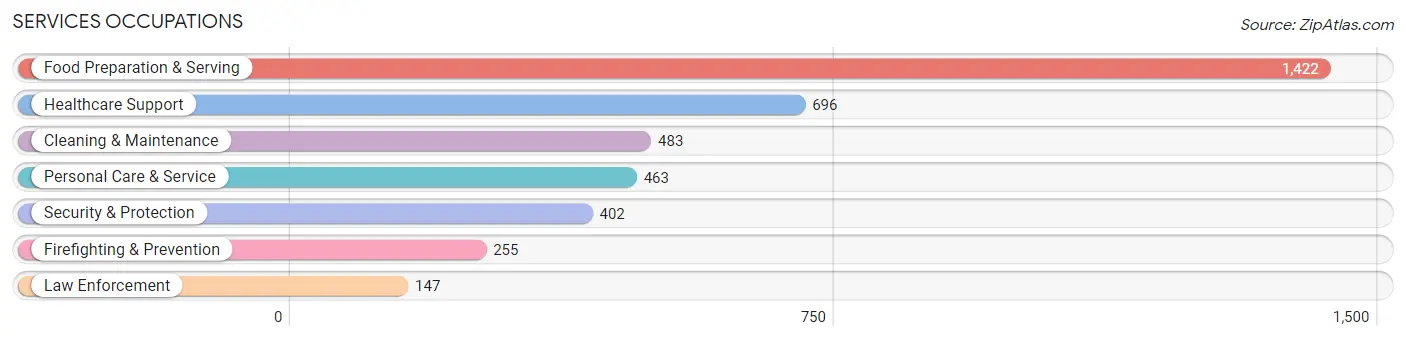
Services Occupations
The most common Services occupations in Fairborn are Food Preparation & Serving (1,422 | 8.4%), Healthcare Support (696 | 4.1%), Cleaning & Maintenance (483 | 2.9%), Personal Care & Service (463 | 2.7%), and Security & Protection (402 | 2.4%).
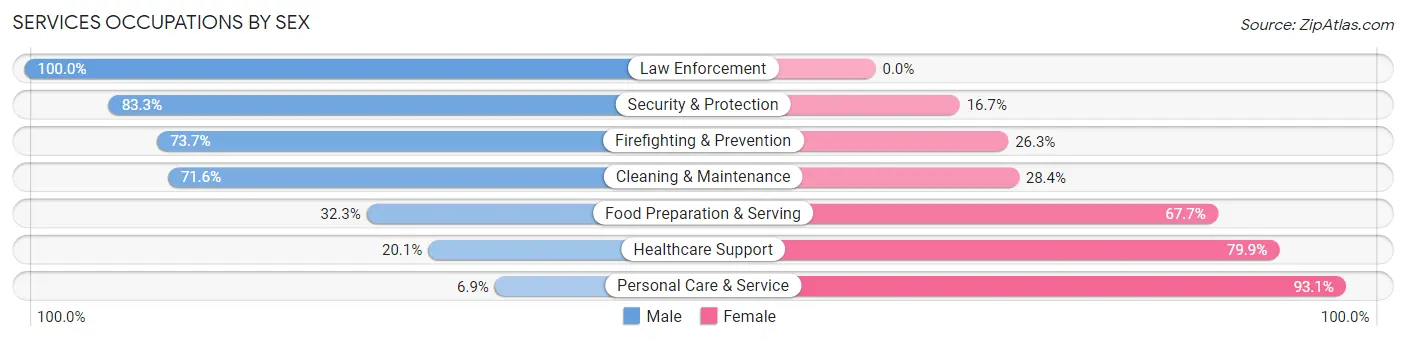
Services Occupations by Sex
Within the Services occupations in Fairborn, the most male-oriented occupations are Law Enforcement (100.0%), Security & Protection (83.3%), and Firefighting & Prevention (73.7%), while the most female-oriented occupations are Personal Care & Service (93.1%), Healthcare Support (79.9%), and Food Preparation & Serving (67.7%).
| Occupation | Male | Female |
| Healthcare Support | 140 (20.1%) | 556 (79.9%) |
| Security & Protection | 335 (83.3%) | 67 (16.7%) |
| Firefighting & Prevention | 188 (73.7%) | 67 (26.3%) |
| Law Enforcement | 147 (100.0%) | 0 (0.0%) |
| Food Preparation & Serving | 459 (32.3%) | 963 (67.7%) |
| Cleaning & Maintenance | 346 (71.6%) | 137 (28.4%) |
| Personal Care & Service | 32 (6.9%) | 431 (93.1%) |
| Total (Category) | 1,312 (37.9%) | 2,154 (62.2%) |
| Total (Overall) | 8,580 (50.8%) | 8,296 (49.2%) |
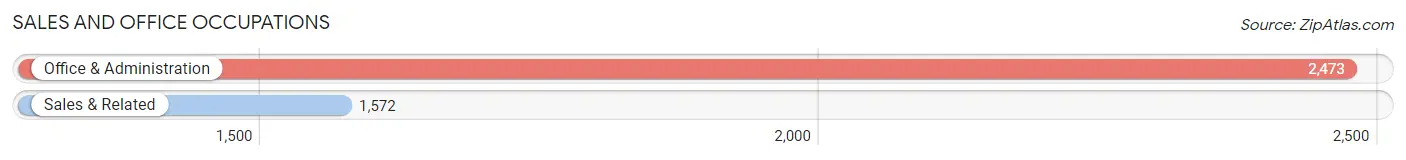
Sales and Office Occupations
The most common Sales and Office occupations in Fairborn are Office & Administration (2,473 | 14.6%), and Sales & Related (1,572 | 9.3%).
Sales and Office Occupations by Sex
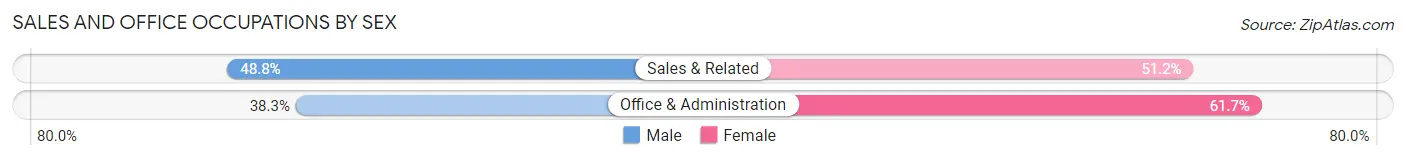
| Occupation | Male | Female |
| Sales & Related | 767 (48.8%) | 805 (51.2%) |
| Office & Administration | 947 (38.3%) | 1,526 (61.7%) |
| Total (Category) | 1,714 (42.4%) | 2,331 (57.6%) |
| Total (Overall) | 8,580 (50.8%) | 8,296 (49.2%) |
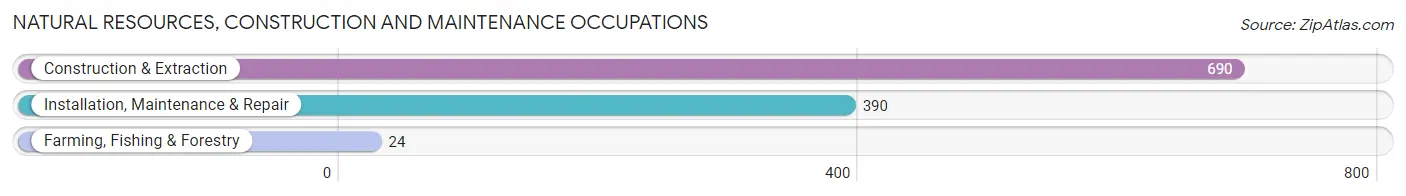
Natural Resources, Construction and Maintenance Occupations
The most common Natural Resources, Construction and Maintenance occupations in Fairborn are Construction & Extraction (690 | 4.1%), Installation, Maintenance & Repair (390 | 2.3%), and Farming, Fishing & Forestry (24 | 0.1%).
Natural Resources, Construction and Maintenance Occupations by Sex
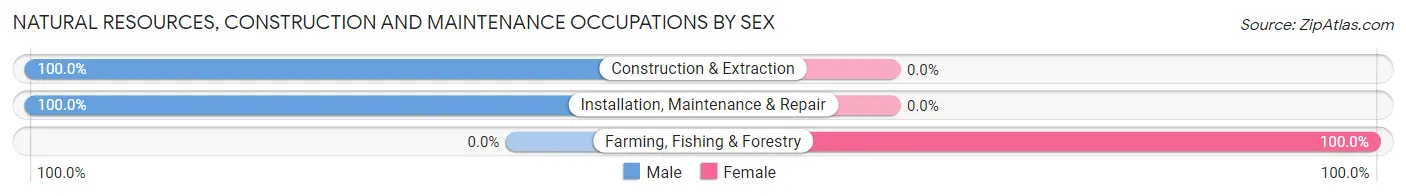
| Occupation | Male | Female |
| Farming, Fishing & Forestry | 0 (0.0%) | 24 (100.0%) |
| Construction & Extraction | 690 (100.0%) | 0 (0.0%) |
| Installation, Maintenance & Repair | 390 (100.0%) | 0 (0.0%) |
| Total (Category) | 1,080 (97.8%) | 24 (2.2%) |
| Total (Overall) | 8,580 (50.8%) | 8,296 (49.2%) |
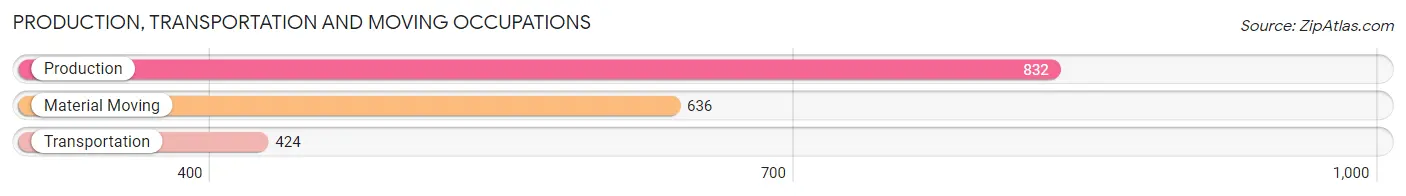
Production, Transportation and Moving Occupations
The most common Production, Transportation and Moving occupations in Fairborn are Production (832 | 4.9%), Material Moving (636 | 3.8%), and Transportation (424 | 2.5%).
Production, Transportation and Moving Occupations by Sex
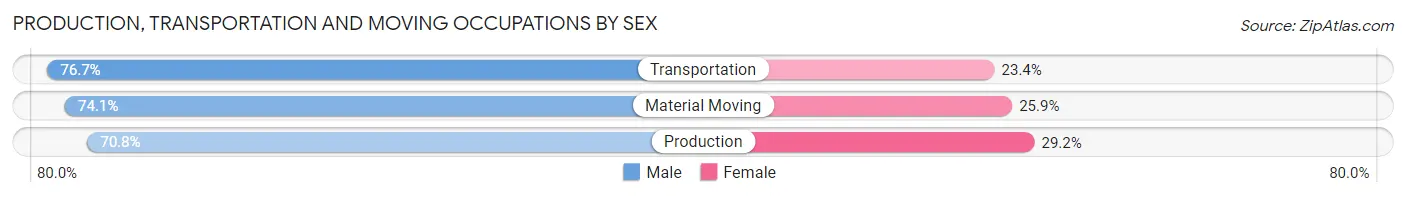
| Occupation | Male | Female |
| Production | 589 (70.8%) | 243 (29.2%) |
| Transportation | 325 (76.6%) | 99 (23.4%) |
| Material Moving | 471 (74.1%) | 165 (25.9%) |
| Total (Category) | 1,385 (73.2%) | 507 (26.8%) |
| Total (Overall) | 8,580 (50.8%) | 8,296 (49.2%) |
Employment Industries by Sex in Fairborn
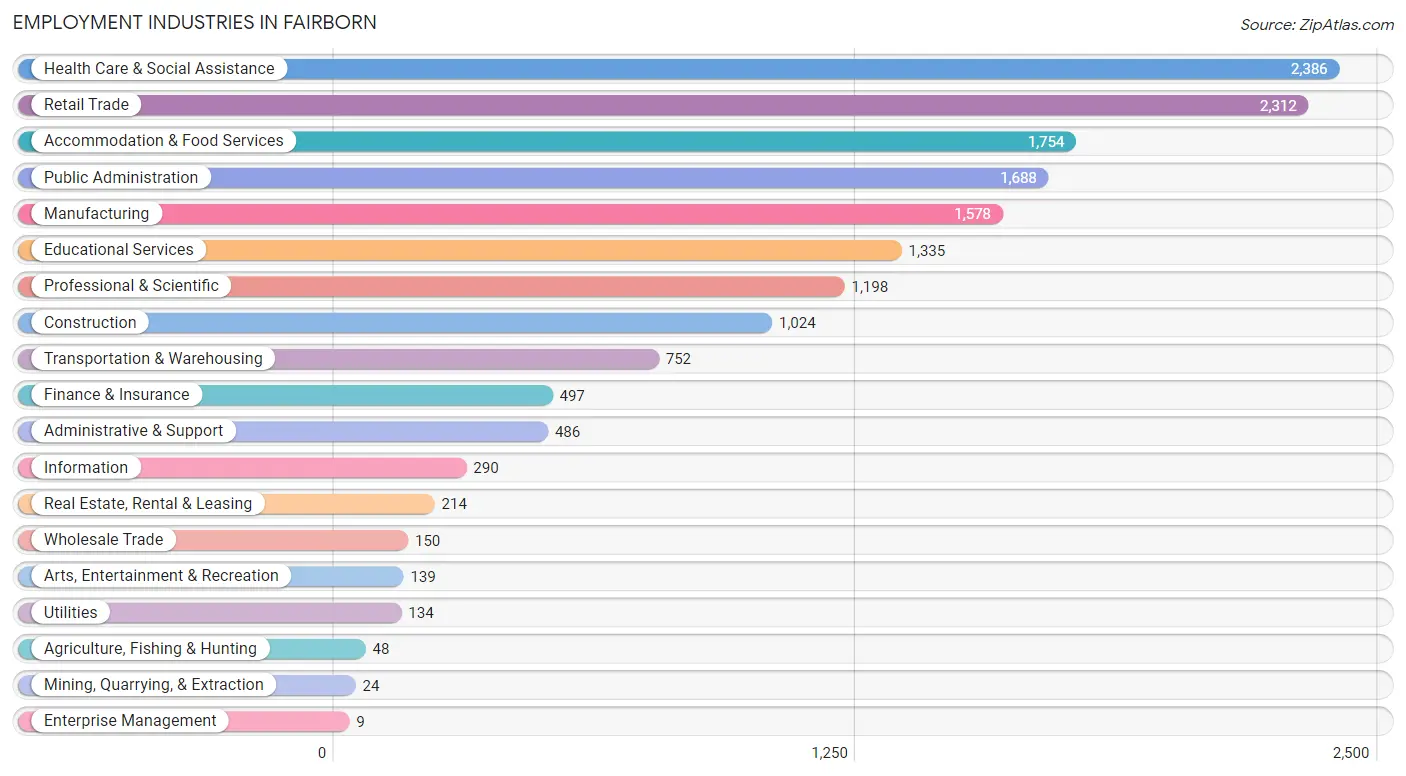
Employment Industries in Fairborn
The major employment industries in Fairborn include Health Care & Social Assistance (2,386 | 14.1%), Retail Trade (2,312 | 13.7%), Accommodation & Food Services (1,754 | 10.4%), Public Administration (1,688 | 10.0%), and Manufacturing (1,578 | 9.3%).
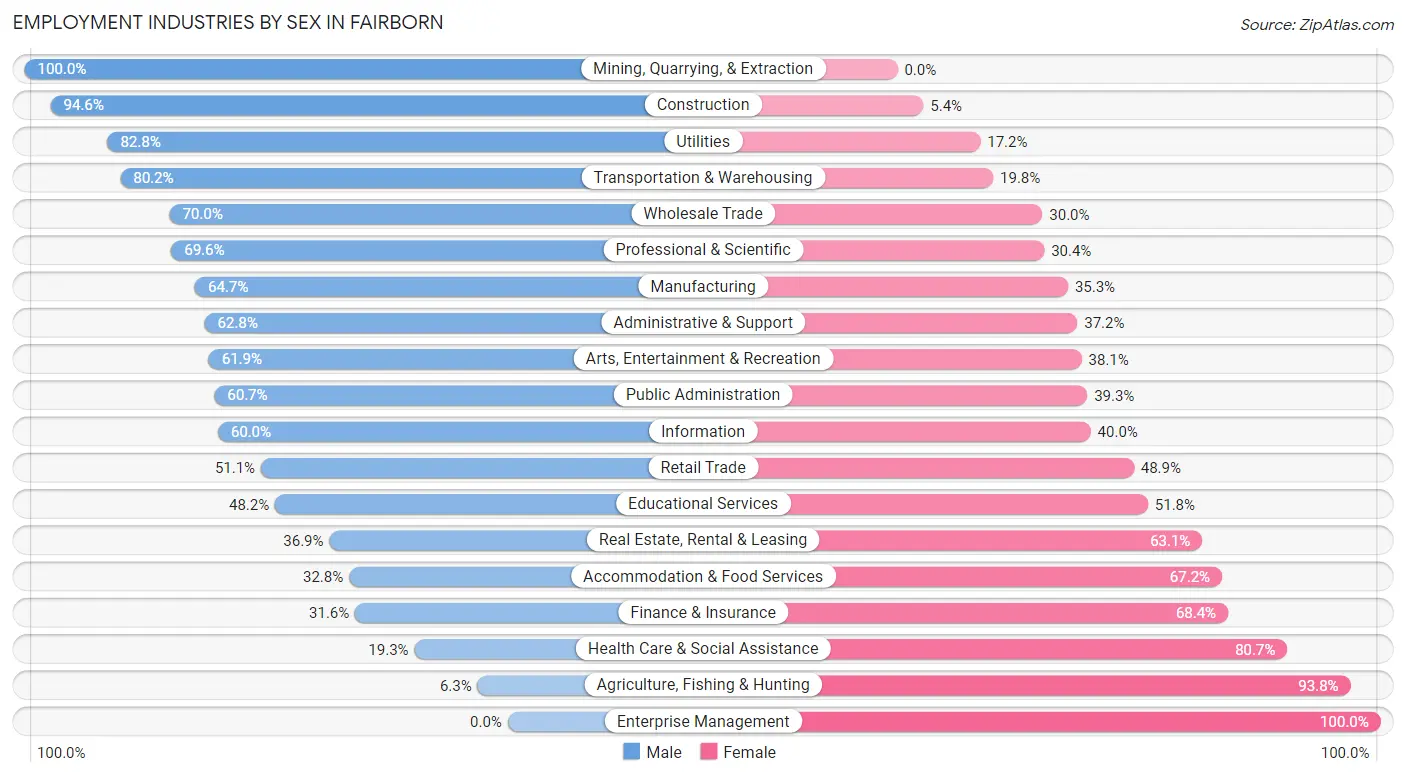
Employment Industries by Sex in Fairborn
The Fairborn industries that see more men than women are Mining, Quarrying, & Extraction (100.0%), Construction (94.6%), and Utilities (82.8%), whereas the industries that tend to have a higher number of women are Enterprise Management (100.0%), Agriculture, Fishing & Hunting (93.8%), and Health Care & Social Assistance (80.7%).
| Industry | Male | Female |
| Agriculture, Fishing & Hunting | 3 (6.2%) | 45 (93.8%) |
| Mining, Quarrying, & Extraction | 24 (100.0%) | 0 (0.0%) |
| Construction | 969 (94.6%) | 55 (5.4%) |
| Manufacturing | 1,021 (64.7%) | 557 (35.3%) |
| Wholesale Trade | 105 (70.0%) | 45 (30.0%) |
| Retail Trade | 1,181 (51.1%) | 1,131 (48.9%) |
| Transportation & Warehousing | 603 (80.2%) | 149 (19.8%) |
| Utilities | 111 (82.8%) | 23 (17.2%) |
| Information | 174 (60.0%) | 116 (40.0%) |
| Finance & Insurance | 157 (31.6%) | 340 (68.4%) |
| Real Estate, Rental & Leasing | 79 (36.9%) | 135 (63.1%) |
| Professional & Scientific | 834 (69.6%) | 364 (30.4%) |
| Enterprise Management | 0 (0.0%) | 9 (100.0%) |
| Administrative & Support | 305 (62.8%) | 181 (37.2%) |
| Educational Services | 643 (48.2%) | 692 (51.8%) |
| Health Care & Social Assistance | 461 (19.3%) | 1,925 (80.7%) |
| Arts, Entertainment & Recreation | 86 (61.9%) | 53 (38.1%) |
| Accommodation & Food Services | 576 (32.8%) | 1,178 (67.2%) |
| Public Administration | 1,025 (60.7%) | 663 (39.3%) |
| Total | 8,580 (50.8%) | 8,296 (49.2%) |
Education in Fairborn
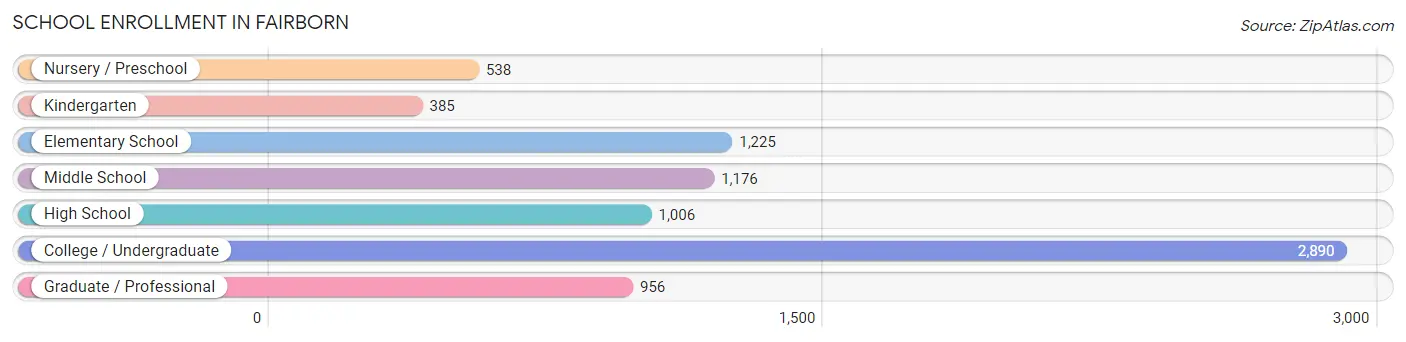
School Enrollment in Fairborn
The most common levels of schooling among the 8,176 students in Fairborn are college / undergraduate (2,890 | 35.3%), elementary school (1,225 | 15.0%), and middle school (1,176 | 14.4%).
| School Level | # Students | % Students |
| Nursery / Preschool | 538 | 6.6% |
| Kindergarten | 385 | 4.7% |
| Elementary School | 1,225 | 15.0% |
| Middle School | 1,176 | 14.4% |
| High School | 1,006 | 12.3% |
| College / Undergraduate | 2,890 | 35.3% |
| Graduate / Professional | 956 | 11.7% |
| Total | 8,176 | 100.0% |
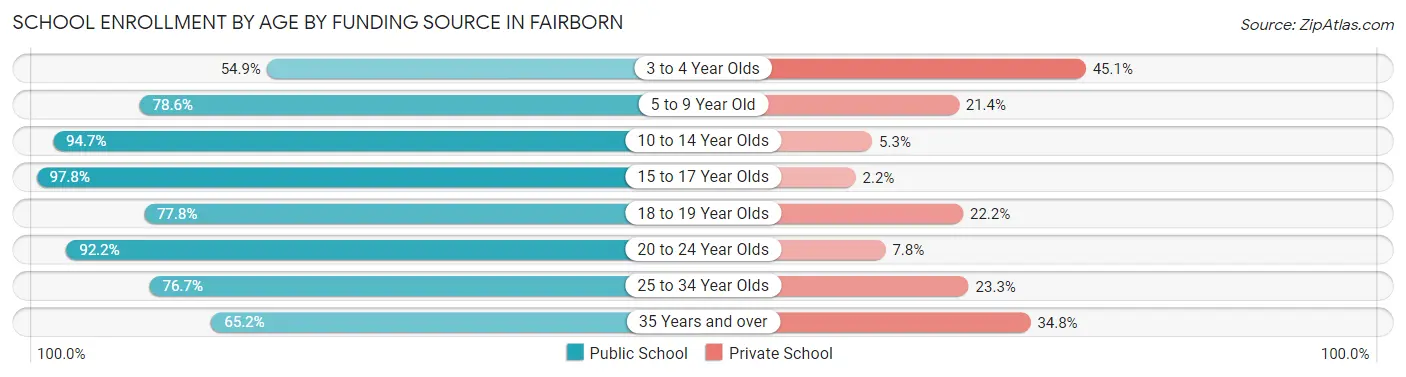
School Enrollment by Age by Funding Source in Fairborn
Out of a total of 8,176 students who are enrolled in schools in Fairborn, 1,325 (16.2%) attend a private institution, while the remaining 6,851 (83.8%) are enrolled in public schools. The age group of 3 to 4 year olds has the highest likelihood of being enrolled in private schools, with 156 (45.1% in the age bracket) enrolled. Conversely, the age group of 15 to 17 year olds has the lowest likelihood of being enrolled in a private school, with 833 (97.8% in the age bracket) attending a public institution.
| Age Bracket | Public School | Private School |
| 3 to 4 Year Olds | 190 (54.9%) | 156 (45.1%) |
| 5 to 9 Year Old | 1,301 (78.6%) | 355 (21.4%) |
| 10 to 14 Year Olds | 1,266 (94.7%) | 71 (5.3%) |
| 15 to 17 Year Olds | 833 (97.8%) | 19 (2.2%) |
| 18 to 19 Year Olds | 486 (77.8%) | 139 (22.2%) |
| 20 to 24 Year Olds | 1,553 (92.2%) | 131 (7.8%) |
| 25 to 34 Year Olds | 847 (76.7%) | 257 (23.3%) |
| 35 Years and over | 373 (65.2%) | 199 (34.8%) |
| Total | 6,851 (83.8%) | 1,325 (16.2%) |
Educational Attainment by Field of Study in Fairborn
Business (1,219 | 17.1%), education (1,079 | 15.1%), engineering (955 | 13.4%), science & technology (773 | 10.8%), and psychology (476 | 6.7%) are the most common fields of study among 7,129 individuals in Fairborn who have obtained a bachelor's degree or higher.
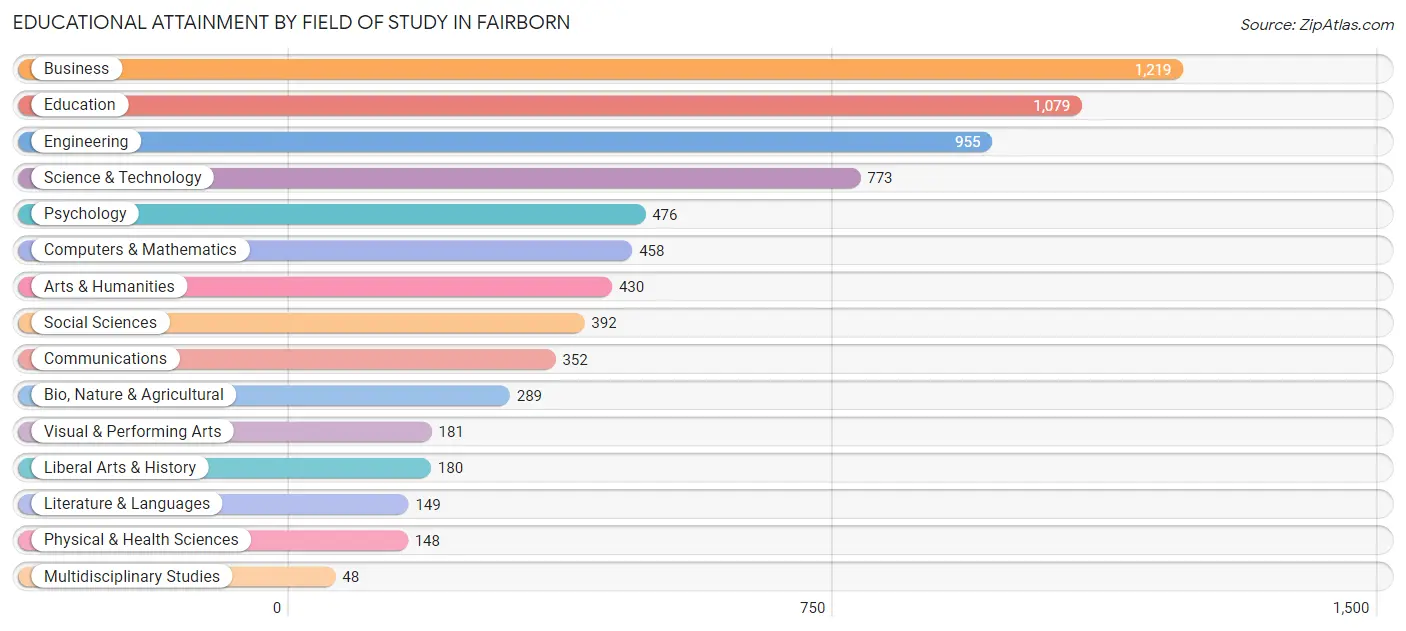
| Field of Study | # Graduates | % Graduates |
| Computers & Mathematics | 458 | 6.4% |
| Bio, Nature & Agricultural | 289 | 4.1% |
| Physical & Health Sciences | 148 | 2.1% |
| Psychology | 476 | 6.7% |
| Social Sciences | 392 | 5.5% |
| Engineering | 955 | 13.4% |
| Multidisciplinary Studies | 48 | 0.7% |
| Science & Technology | 773 | 10.8% |
| Business | 1,219 | 17.1% |
| Education | 1,079 | 15.1% |
| Literature & Languages | 149 | 2.1% |
| Liberal Arts & History | 180 | 2.5% |
| Visual & Performing Arts | 181 | 2.5% |
| Communications | 352 | 4.9% |
| Arts & Humanities | 430 | 6.0% |
| Total | 7,129 | 100.0% |
Transportation & Commute in Fairborn
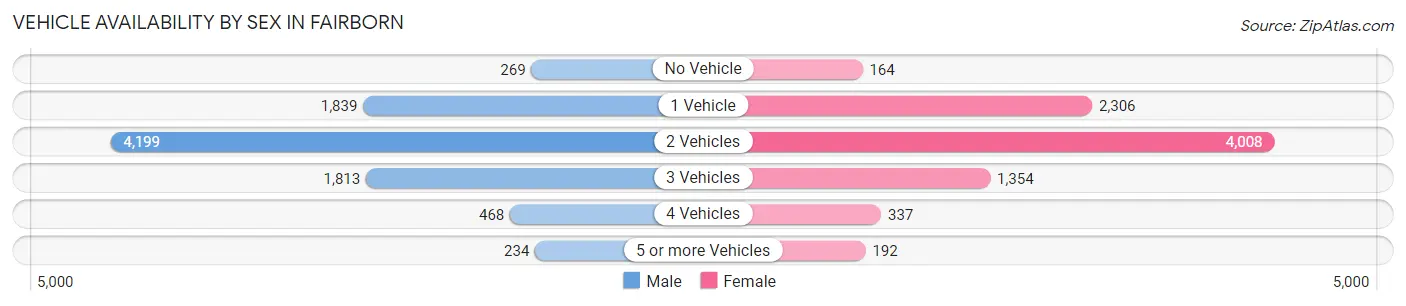
Vehicle Availability by Sex in Fairborn
The most prevalent vehicle ownership categories in Fairborn are males with 2 vehicles (4,199, accounting for 47.6%) and females with 2 vehicles (4,008, making up 50.2%).
| Vehicles Available | Male | Female |
| No Vehicle | 269 (3.0%) | 164 (2.0%) |
| 1 Vehicle | 1,839 (20.8%) | 2,306 (27.6%) |
| 2 Vehicles | 4,199 (47.6%) | 4,008 (47.9%) |
| 3 Vehicles | 1,813 (20.5%) | 1,354 (16.2%) |
| 4 Vehicles | 468 (5.3%) | 337 (4.0%) |
| 5 or more Vehicles | 234 (2.6%) | 192 (2.3%) |
| Total | 8,822 (100.0%) | 8,361 (100.0%) |
Commute Time in Fairborn
The most frequently occuring commute durations in Fairborn are 20 to 24 minutes (3,200 commuters, 19.6%), 15 to 19 minutes (2,739 commuters, 16.8%), and 10 to 14 minutes (2,668 commuters, 16.3%).
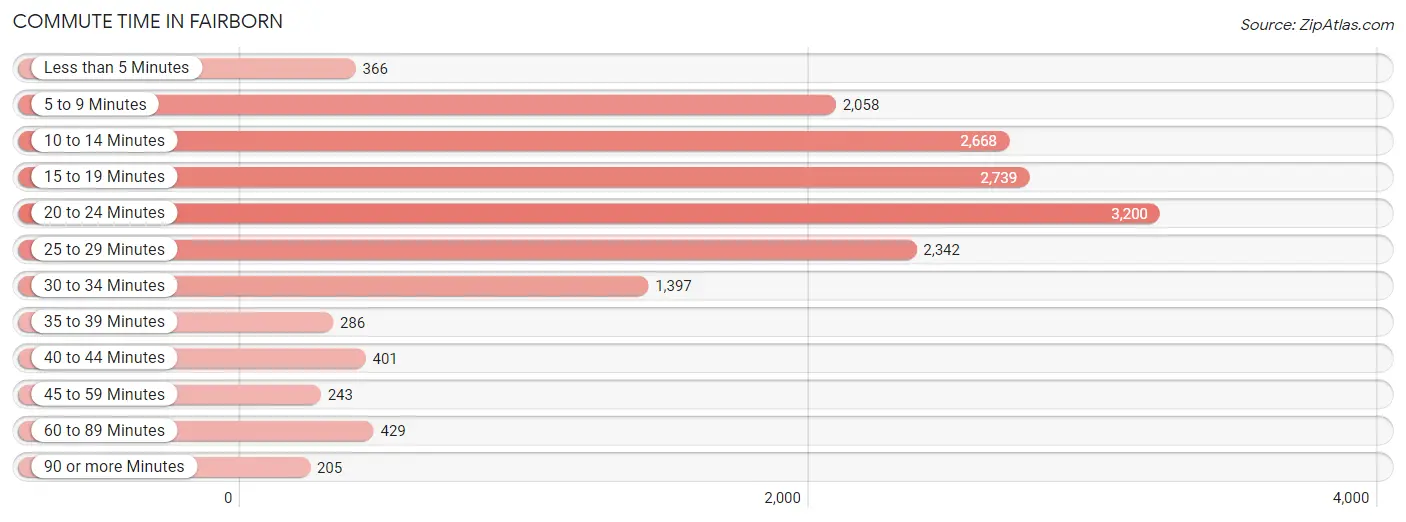
| Commute Time | # Commuters | % Commuters |
| Less than 5 Minutes | 366 | 2.2% |
| 5 to 9 Minutes | 2,058 | 12.6% |
| 10 to 14 Minutes | 2,668 | 16.3% |
| 15 to 19 Minutes | 2,739 | 16.8% |
| 20 to 24 Minutes | 3,200 | 19.6% |
| 25 to 29 Minutes | 2,342 | 14.3% |
| 30 to 34 Minutes | 1,397 | 8.6% |
| 35 to 39 Minutes | 286 | 1.8% |
| 40 to 44 Minutes | 401 | 2.5% |
| 45 to 59 Minutes | 243 | 1.5% |
| 60 to 89 Minutes | 429 | 2.6% |
| 90 or more Minutes | 205 | 1.3% |
Commute Time by Sex in Fairborn
The most common commute times in Fairborn are 20 to 24 minutes (1,553 commuters, 18.4%) for males and 20 to 24 minutes (1,647 commuters, 20.8%) for females.
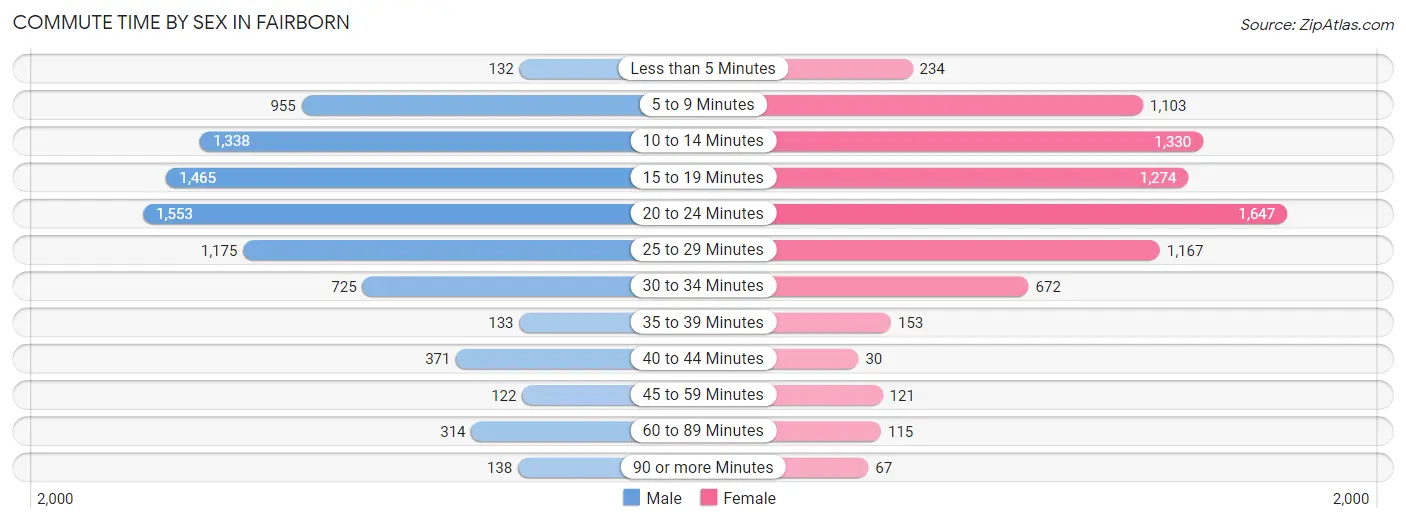
| Commute Time | Male | Female |
| Less than 5 Minutes | 132 (1.6%) | 234 (3.0%) |
| 5 to 9 Minutes | 955 (11.3%) | 1,103 (13.9%) |
| 10 to 14 Minutes | 1,338 (15.9%) | 1,330 (16.8%) |
| 15 to 19 Minutes | 1,465 (17.4%) | 1,274 (16.1%) |
| 20 to 24 Minutes | 1,553 (18.4%) | 1,647 (20.8%) |
| 25 to 29 Minutes | 1,175 (14.0%) | 1,167 (14.7%) |
| 30 to 34 Minutes | 725 (8.6%) | 672 (8.5%) |
| 35 to 39 Minutes | 133 (1.6%) | 153 (1.9%) |
| 40 to 44 Minutes | 371 (4.4%) | 30 (0.4%) |
| 45 to 59 Minutes | 122 (1.5%) | 121 (1.5%) |
| 60 to 89 Minutes | 314 (3.7%) | 115 (1.5%) |
| 90 or more Minutes | 138 (1.6%) | 67 (0.9%) |
Time of Departure to Work by Sex in Fairborn
The most frequent times of departure to work in Fairborn are 7:00 AM to 7:29 AM (1,166, 13.9%) for males and 7:00 AM to 7:29 AM (1,483, 18.7%) for females.
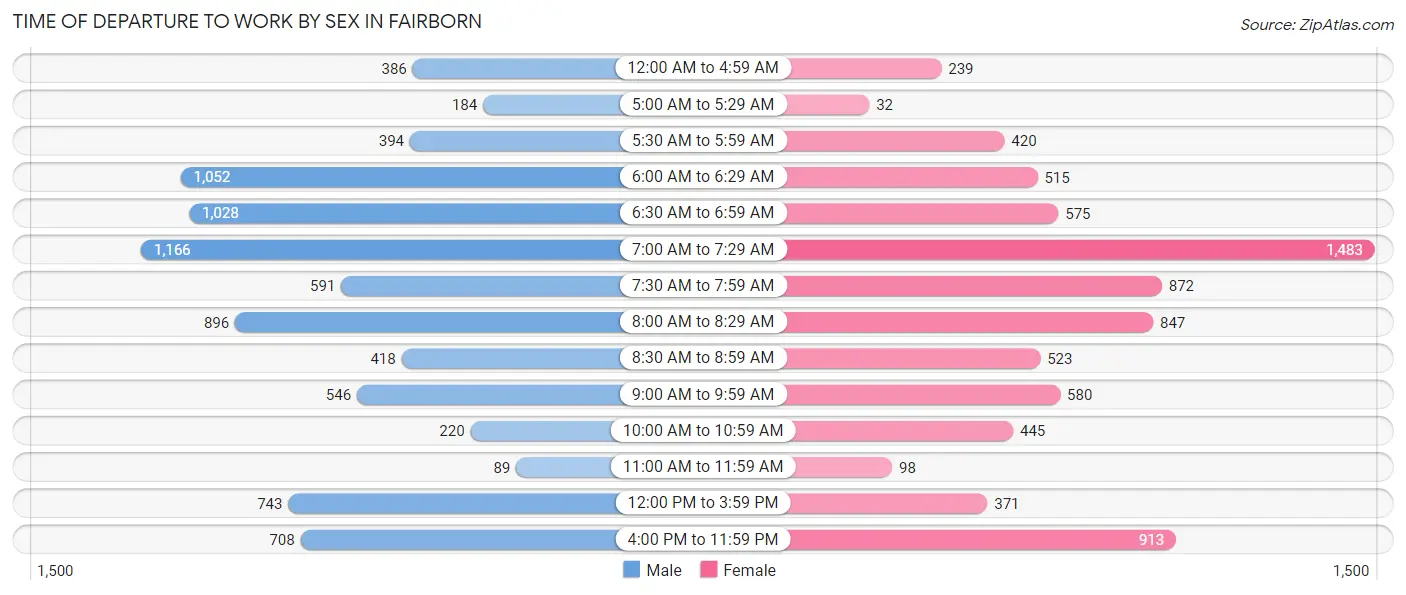
| Time of Departure | Male | Female |
| 12:00 AM to 4:59 AM | 386 (4.6%) | 239 (3.0%) |
| 5:00 AM to 5:29 AM | 184 (2.2%) | 32 (0.4%) |
| 5:30 AM to 5:59 AM | 394 (4.7%) | 420 (5.3%) |
| 6:00 AM to 6:29 AM | 1,052 (12.5%) | 515 (6.5%) |
| 6:30 AM to 6:59 AM | 1,028 (12.2%) | 575 (7.3%) |
| 7:00 AM to 7:29 AM | 1,166 (13.9%) | 1,483 (18.7%) |
| 7:30 AM to 7:59 AM | 591 (7.0%) | 872 (11.0%) |
| 8:00 AM to 8:29 AM | 896 (10.6%) | 847 (10.7%) |
| 8:30 AM to 8:59 AM | 418 (5.0%) | 523 (6.6%) |
| 9:00 AM to 9:59 AM | 546 (6.5%) | 580 (7.3%) |
| 10:00 AM to 10:59 AM | 220 (2.6%) | 445 (5.6%) |
| 11:00 AM to 11:59 AM | 89 (1.1%) | 98 (1.2%) |
| 12:00 PM to 3:59 PM | 743 (8.8%) | 371 (4.7%) |
| 4:00 PM to 11:59 PM | 708 (8.4%) | 913 (11.5%) |
| Total | 8,421 (100.0%) | 7,913 (100.0%) |
Housing Occupancy in Fairborn
Occupancy by Ownership in Fairborn
Of the total 15,875 dwellings in Fairborn, owner-occupied units account for 7,708 (48.5%), while renter-occupied units make up 8,167 (51.4%).
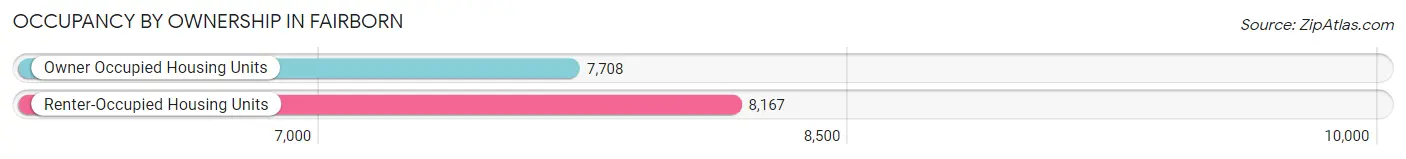
| Occupancy | # Housing Units | % Housing Units |
| Owner Occupied Housing Units | 7,708 | 48.5% |
| Renter-Occupied Housing Units | 8,167 | 51.4% |
| Total Occupied Housing Units | 15,875 | 100.0% |
Occupancy by Household Size in Fairborn
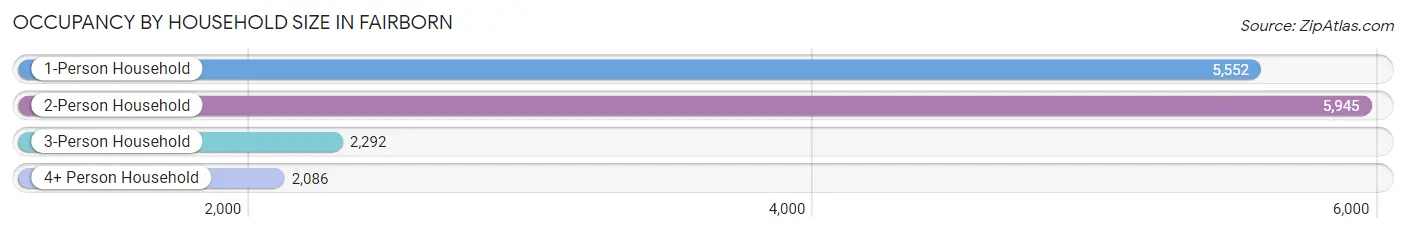
| Household Size | # Housing Units | % Housing Units |
| 1-Person Household | 5,552 | 35.0% |
| 2-Person Household | 5,945 | 37.4% |
| 3-Person Household | 2,292 | 14.4% |
| 4+ Person Household | 2,086 | 13.1% |
| Total Housing Units | 15,875 | 100.0% |
Occupancy by Ownership by Household Size in Fairborn
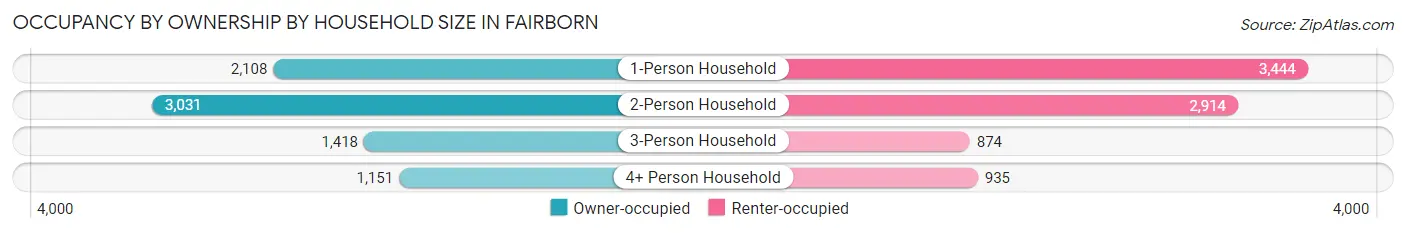
| Household Size | Owner-occupied | Renter-occupied |
| 1-Person Household | 2,108 (38.0%) | 3,444 (62.0%) |
| 2-Person Household | 3,031 (51.0%) | 2,914 (49.0%) |
| 3-Person Household | 1,418 (61.9%) | 874 (38.1%) |
| 4+ Person Household | 1,151 (55.2%) | 935 (44.8%) |
| Total Housing Units | 7,708 (48.5%) | 8,167 (51.4%) |
Occupancy by Educational Attainment in Fairborn
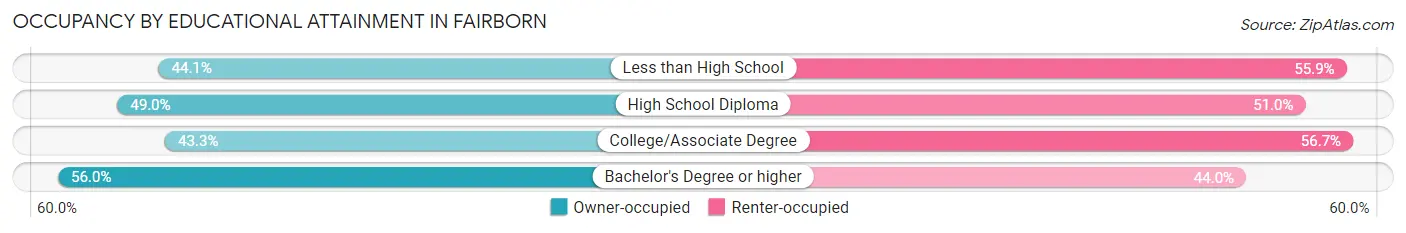
| Household Size | Owner-occupied | Renter-occupied |
| Less than High School | 541 (44.1%) | 687 (55.9%) |
| High School Diploma | 1,922 (49.0%) | 2,004 (51.0%) |
| College/Associate Degree | 2,588 (43.3%) | 3,390 (56.7%) |
| Bachelor's Degree or higher | 2,657 (56.0%) | 2,086 (44.0%) |
Occupancy by Age of Householder in Fairborn
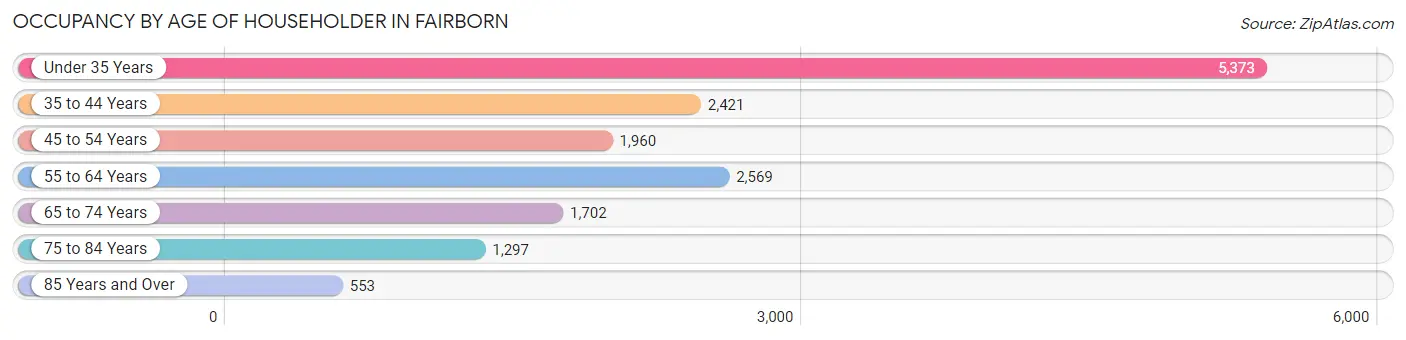
| Age Bracket | # Households | % Households |
| Under 35 Years | 5,373 | 33.9% |
| 35 to 44 Years | 2,421 | 15.2% |
| 45 to 54 Years | 1,960 | 12.3% |
| 55 to 64 Years | 2,569 | 16.2% |
| 65 to 74 Years | 1,702 | 10.7% |
| 75 to 84 Years | 1,297 | 8.2% |
| 85 Years and Over | 553 | 3.5% |
| Total | 15,875 | 100.0% |
Housing Finances in Fairborn
Median Income by Occupancy in Fairborn
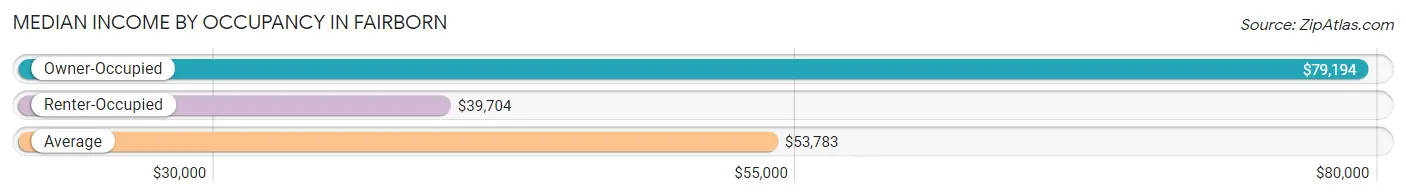
| Occupancy Type | # Households | Median Income |
| Owner-Occupied | 7,708 (48.5%) | $79,194 |
| Renter-Occupied | 8,167 (51.4%) | $39,704 |
| Average | 15,875 (100.0%) | $53,783 |
Occupancy by Householder Income Bracket in Fairborn
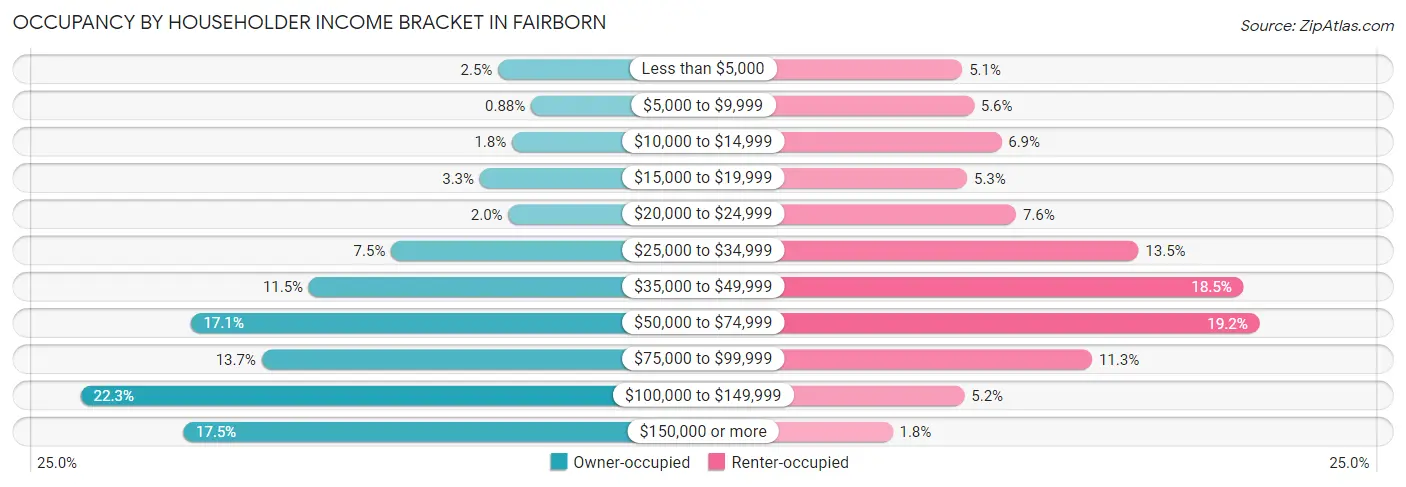
| Income Bracket | Owner-occupied | Renter-occupied |
| Less than $5,000 | 189 (2.5%) | 415 (5.1%) |
| $5,000 to $9,999 | 68 (0.9%) | 460 (5.6%) |
| $10,000 to $14,999 | 138 (1.8%) | 567 (6.9%) |
| $15,000 to $19,999 | 256 (3.3%) | 434 (5.3%) |
| $20,000 to $24,999 | 151 (2.0%) | 624 (7.6%) |
| $25,000 to $34,999 | 581 (7.5%) | 1,100 (13.5%) |
| $35,000 to $49,999 | 883 (11.5%) | 1,509 (18.5%) |
| $50,000 to $74,999 | 1,318 (17.1%) | 1,571 (19.2%) |
| $75,000 to $99,999 | 1,057 (13.7%) | 920 (11.3%) |
| $100,000 to $149,999 | 1,721 (22.3%) | 423 (5.2%) |
| $150,000 or more | 1,346 (17.5%) | 144 (1.8%) |
| Total | 7,708 (100.0%) | 8,167 (100.0%) |
Monthly Housing Cost Tiers in Fairborn
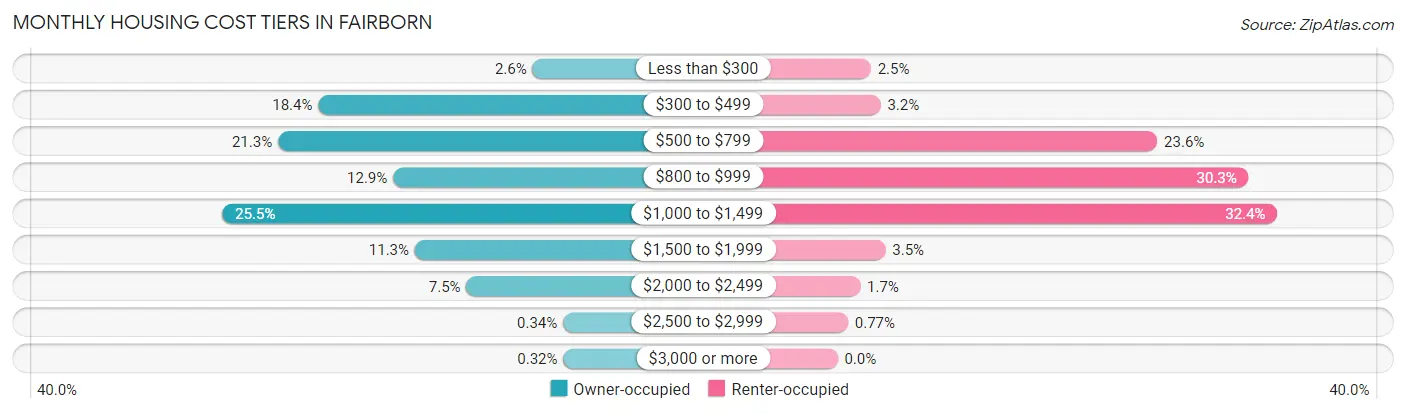
| Monthly Cost | Owner-occupied | Renter-occupied |
| Less than $300 | 200 (2.6%) | 200 (2.5%) |
| $300 to $499 | 1,416 (18.4%) | 259 (3.2%) |
| $500 to $799 | 1,645 (21.3%) | 1,923 (23.5%) |
| $800 to $999 | 991 (12.9%) | 2,473 (30.3%) |
| $1,000 to $1,499 | 1,962 (25.5%) | 2,646 (32.4%) |
| $1,500 to $1,999 | 868 (11.3%) | 288 (3.5%) |
| $2,000 to $2,499 | 575 (7.5%) | 136 (1.7%) |
| $2,500 to $2,999 | 26 (0.3%) | 63 (0.8%) |
| $3,000 or more | 25 (0.3%) | 0 (0.0%) |
| Total | 7,708 (100.0%) | 8,167 (100.0%) |
Physical Housing Characteristics in Fairborn
Housing Structures in Fairborn
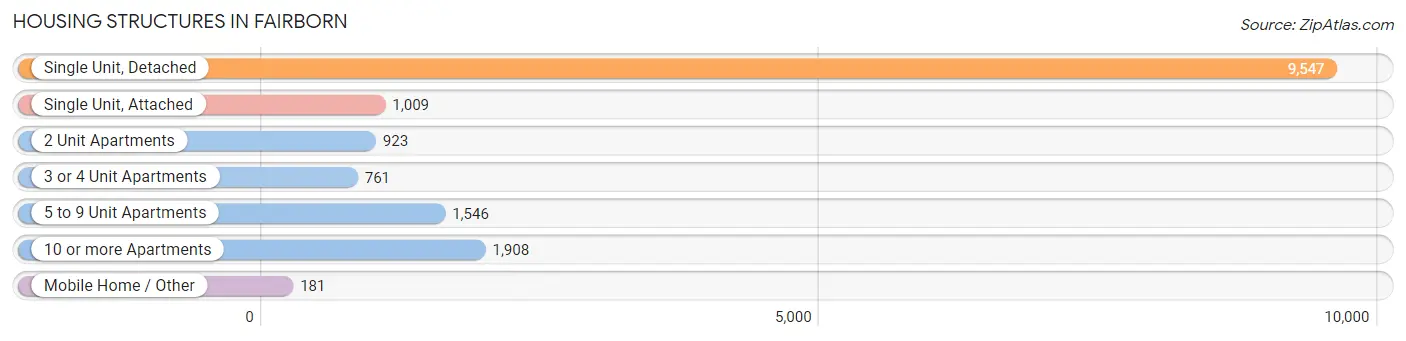
| Structure Type | # Housing Units | % Housing Units |
| Single Unit, Detached | 9,547 | 60.1% |
| Single Unit, Attached | 1,009 | 6.4% |
| 2 Unit Apartments | 923 | 5.8% |
| 3 or 4 Unit Apartments | 761 | 4.8% |
| 5 to 9 Unit Apartments | 1,546 | 9.7% |
| 10 or more Apartments | 1,908 | 12.0% |
| Mobile Home / Other | 181 | 1.1% |
| Total | 15,875 | 100.0% |
Housing Structures by Occupancy in Fairborn
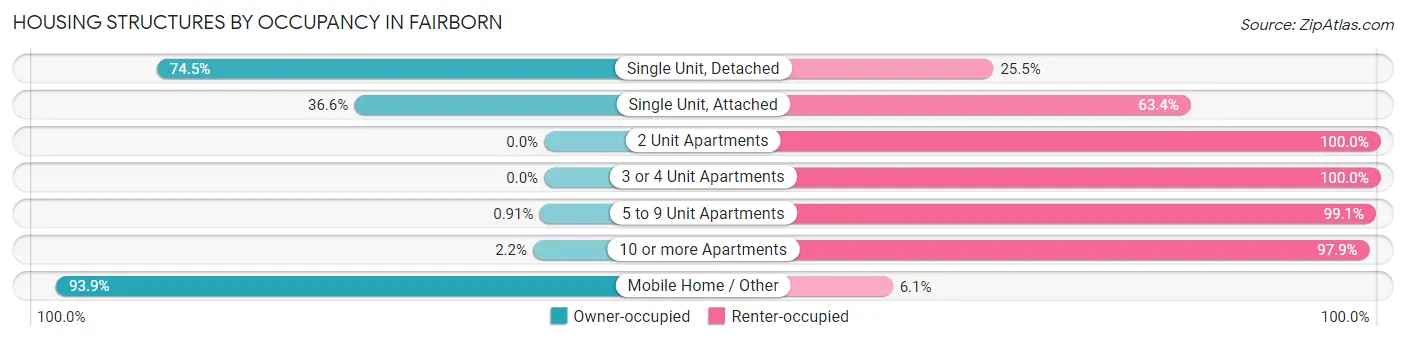
| Structure Type | Owner-occupied | Renter-occupied |
| Single Unit, Detached | 7,114 (74.5%) | 2,433 (25.5%) |
| Single Unit, Attached | 369 (36.6%) | 640 (63.4%) |
| 2 Unit Apartments | 0 (0.0%) | 923 (100.0%) |
| 3 or 4 Unit Apartments | 0 (0.0%) | 761 (100.0%) |
| 5 to 9 Unit Apartments | 14 (0.9%) | 1,532 (99.1%) |
| 10 or more Apartments | 41 (2.1%) | 1,867 (97.9%) |
| Mobile Home / Other | 170 (93.9%) | 11 (6.1%) |
| Total | 7,708 (48.5%) | 8,167 (51.4%) |
Housing Structures by Number of Rooms in Fairborn
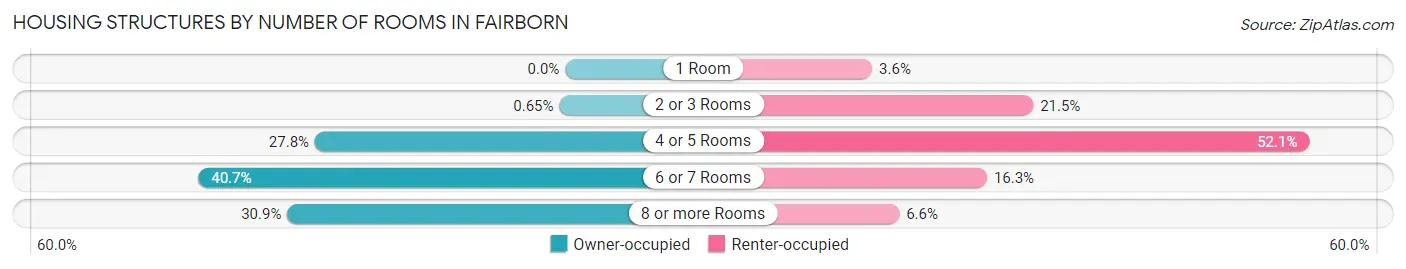
| Number of Rooms | Owner-occupied | Renter-occupied |
| 1 Room | 0 (0.0%) | 292 (3.6%) |
| 2 or 3 Rooms | 50 (0.6%) | 1,752 (21.4%) |
| 4 or 5 Rooms | 2,141 (27.8%) | 4,253 (52.1%) |
| 6 or 7 Rooms | 3,139 (40.7%) | 1,333 (16.3%) |
| 8 or more Rooms | 2,378 (30.8%) | 537 (6.6%) |
| Total | 7,708 (100.0%) | 8,167 (100.0%) |
Housing Structure by Heating Type in Fairborn
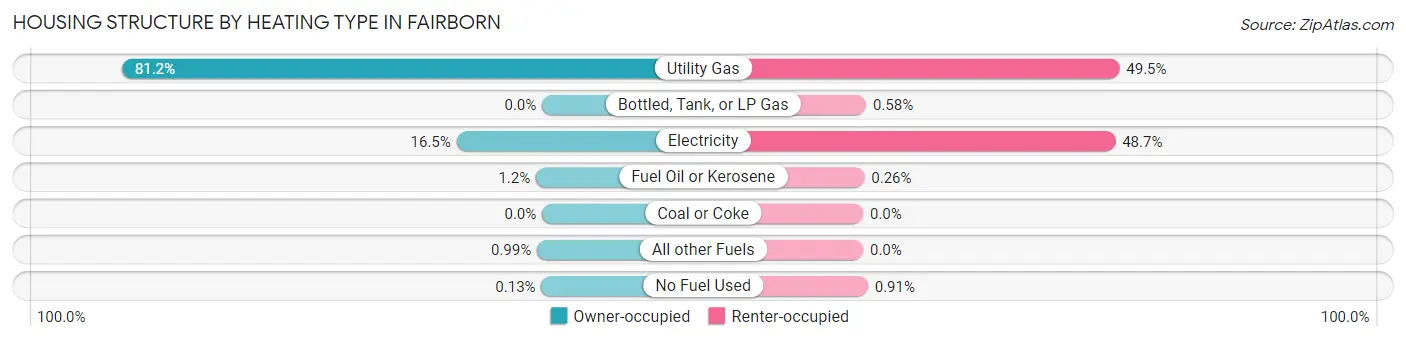
| Heating Type | Owner-occupied | Renter-occupied |
| Utility Gas | 6,259 (81.2%) | 4,045 (49.5%) |
| Bottled, Tank, or LP Gas | 0 (0.0%) | 47 (0.6%) |
| Electricity | 1,273 (16.5%) | 3,980 (48.7%) |
| Fuel Oil or Kerosene | 90 (1.2%) | 21 (0.3%) |
| Coal or Coke | 0 (0.0%) | 0 (0.0%) |
| All other Fuels | 76 (1.0%) | 0 (0.0%) |
| No Fuel Used | 10 (0.1%) | 74 (0.9%) |
| Total | 7,708 (100.0%) | 8,167 (100.0%) |
Household Vehicle Usage in Fairborn
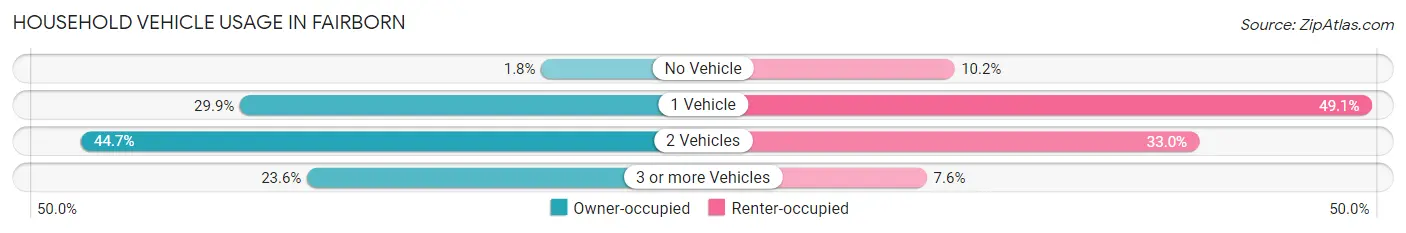
| Vehicles per Household | Owner-occupied | Renter-occupied |
| No Vehicle | 136 (1.8%) | 833 (10.2%) |
| 1 Vehicle | 2,303 (29.9%) | 4,013 (49.1%) |
| 2 Vehicles | 3,448 (44.7%) | 2,698 (33.0%) |
| 3 or more Vehicles | 1,821 (23.6%) | 623 (7.6%) |
| Total | 7,708 (100.0%) | 8,167 (100.0%) |
Real Estate & Mortgages in Fairborn
Real Estate and Mortgage Overview in Fairborn
| Characteristic | Without Mortgage | With Mortgage |
| Housing Units | 3,199 | 4,509 |
| Median Property Value | $140,100 | $163,500 |
| Median Household Income | $61,268 | $931 |
| Monthly Housing Costs | $499 | $25 |
| Real Estate Taxes | $1,902 | $116 |
Property Value by Mortgage Status in Fairborn
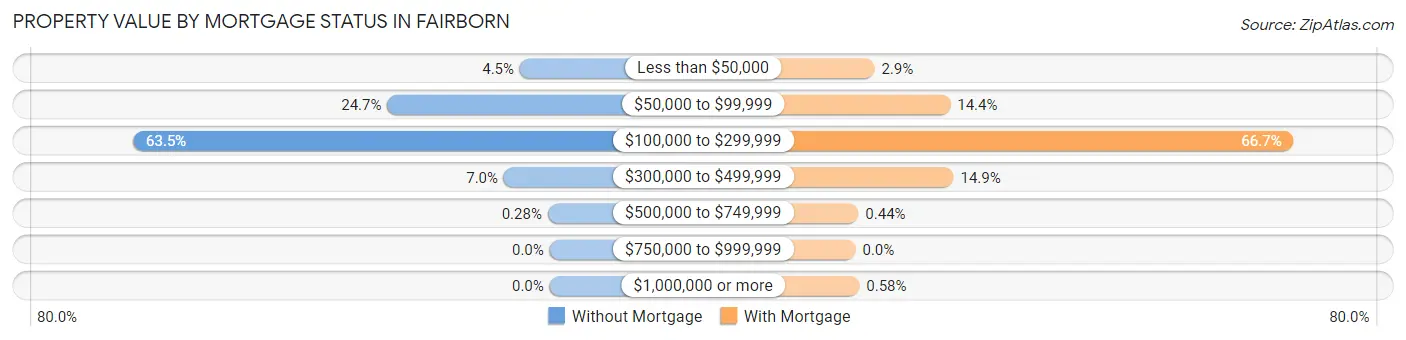
| Property Value | Without Mortgage | With Mortgage |
| Less than $50,000 | 145 (4.5%) | 130 (2.9%) |
| $50,000 to $99,999 | 791 (24.7%) | 651 (14.4%) |
| $100,000 to $299,999 | 2,031 (63.5%) | 3,009 (66.7%) |
| $300,000 to $499,999 | 223 (7.0%) | 673 (14.9%) |
| $500,000 to $749,999 | 9 (0.3%) | 20 (0.4%) |
| $750,000 to $999,999 | 0 (0.0%) | 0 (0.0%) |
| $1,000,000 or more | 0 (0.0%) | 26 (0.6%) |
| Total | 3,199 (100.0%) | 4,509 (100.0%) |
Household Income by Mortgage Status in Fairborn
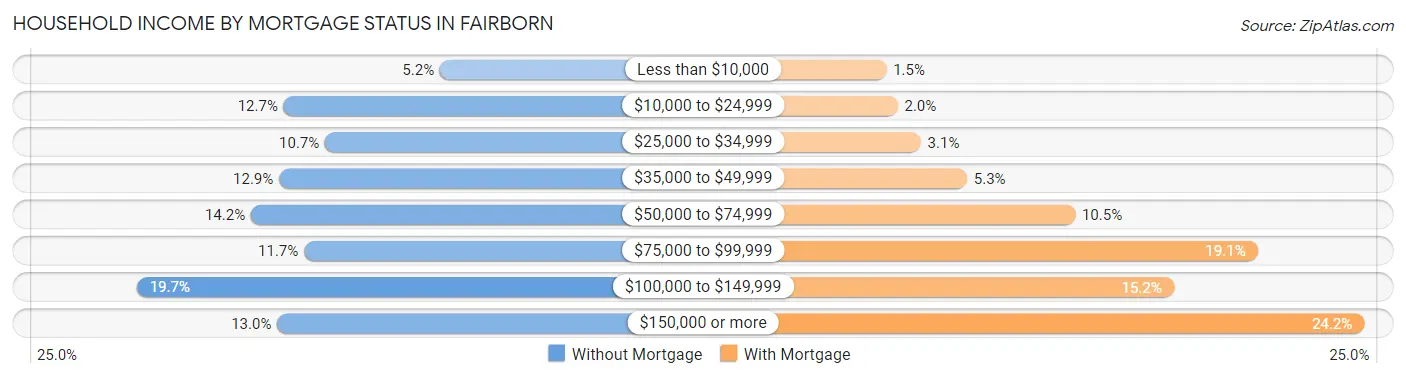
| Household Income | Without Mortgage | With Mortgage |
| Less than $10,000 | 167 (5.2%) | 66 (1.5%) |
| $10,000 to $24,999 | 405 (12.7%) | 90 (2.0%) |
| $25,000 to $34,999 | 342 (10.7%) | 140 (3.1%) |
| $35,000 to $49,999 | 412 (12.9%) | 239 (5.3%) |
| $50,000 to $74,999 | 455 (14.2%) | 471 (10.4%) |
| $75,000 to $99,999 | 374 (11.7%) | 863 (19.1%) |
| $100,000 to $149,999 | 629 (19.7%) | 683 (15.1%) |
| $150,000 or more | 415 (13.0%) | 1,092 (24.2%) |
| Total | 3,199 (100.0%) | 4,509 (100.0%) |
Property Value to Household Income Ratio in Fairborn
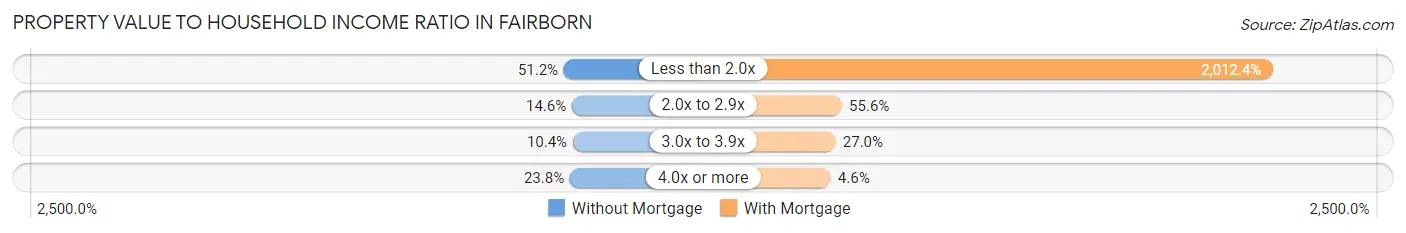
| Value-to-Income Ratio | Without Mortgage | With Mortgage |
| Less than 2.0x | 1,638 (51.2%) | 90,739 (2,012.4%) |
| 2.0x to 2.9x | 467 (14.6%) | 2,507 (55.6%) |
| 3.0x to 3.9x | 332 (10.4%) | 1,215 (27.0%) |
| 4.0x or more | 762 (23.8%) | 205 (4.5%) |
| Total | 3,199 (100.0%) | 4,509 (100.0%) |
Real Estate Taxes by Mortgage Status in Fairborn
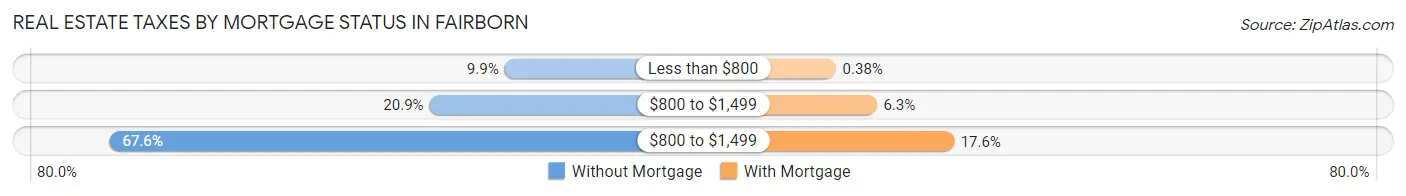
| Property Taxes | Without Mortgage | With Mortgage |
| Less than $800 | 316 (9.9%) | 17 (0.4%) |
| $800 to $1,499 | 667 (20.8%) | 286 (6.3%) |
| $800 to $1,499 | 2,162 (67.6%) | 795 (17.6%) |
| Total | 3,199 (100.0%) | 4,509 (100.0%) |
Health & Disability in Fairborn
Health Insurance Coverage by Age in Fairborn
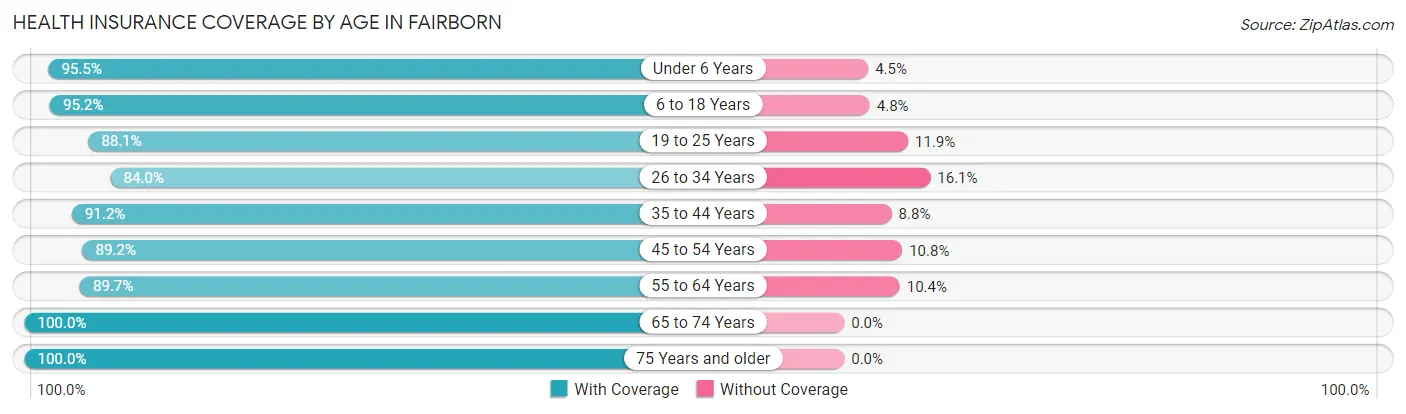
| Age Bracket | With Coverage | Without Coverage |
| Under 6 Years | 2,744 (95.5%) | 128 (4.5%) |
| 6 to 18 Years | 3,861 (95.2%) | 193 (4.8%) |
| 19 to 25 Years | 4,026 (88.1%) | 544 (11.9%) |
| 26 to 34 Years | 4,320 (84.0%) | 826 (16.1%) |
| 35 to 44 Years | 3,963 (91.2%) | 384 (8.8%) |
| 45 to 54 Years | 2,945 (89.2%) | 357 (10.8%) |
| 55 to 64 Years | 3,766 (89.6%) | 435 (10.3%) |
| 65 to 74 Years | 2,579 (100.0%) | 0 (0.0%) |
| 75 Years and older | 2,541 (100.0%) | 0 (0.0%) |
| Total | 30,745 (91.5%) | 2,867 (8.5%) |
Health Insurance Coverage by Citizenship Status in Fairborn
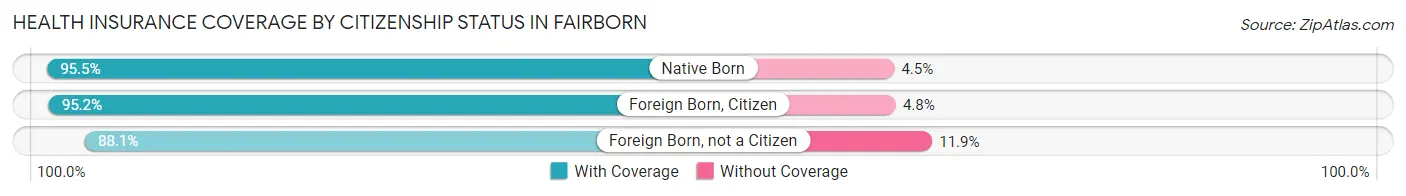
| Citizenship Status | With Coverage | Without Coverage |
| Native Born | 2,744 (95.5%) | 128 (4.5%) |
| Foreign Born, Citizen | 3,861 (95.2%) | 193 (4.8%) |
| Foreign Born, not a Citizen | 4,026 (88.1%) | 544 (11.9%) |
Health Insurance Coverage by Household Income in Fairborn
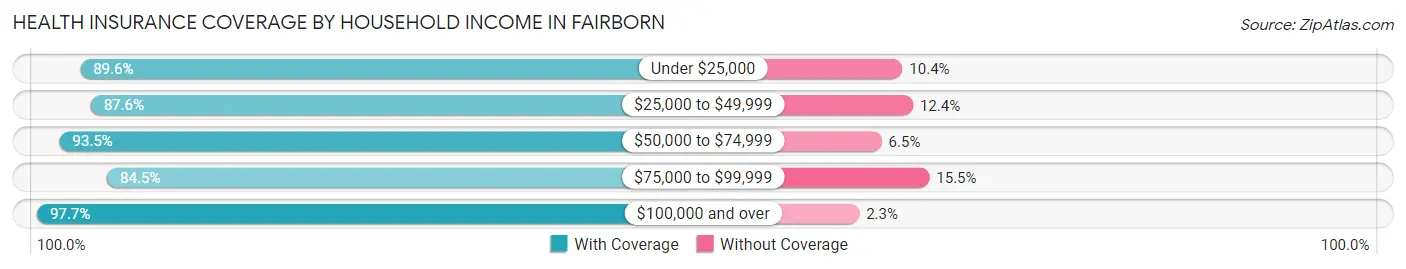
| Household Income | With Coverage | Without Coverage |
| Under $25,000 | 5,139 (89.6%) | 598 (10.4%) |
| $25,000 to $49,999 | 6,424 (87.6%) | 909 (12.4%) |
| $50,000 to $74,999 | 5,567 (93.5%) | 389 (6.5%) |
| $75,000 to $99,999 | 4,076 (84.5%) | 746 (15.5%) |
| $100,000 and over | 9,134 (97.7%) | 218 (2.3%) |
Public vs Private Health Insurance Coverage by Age in Fairborn
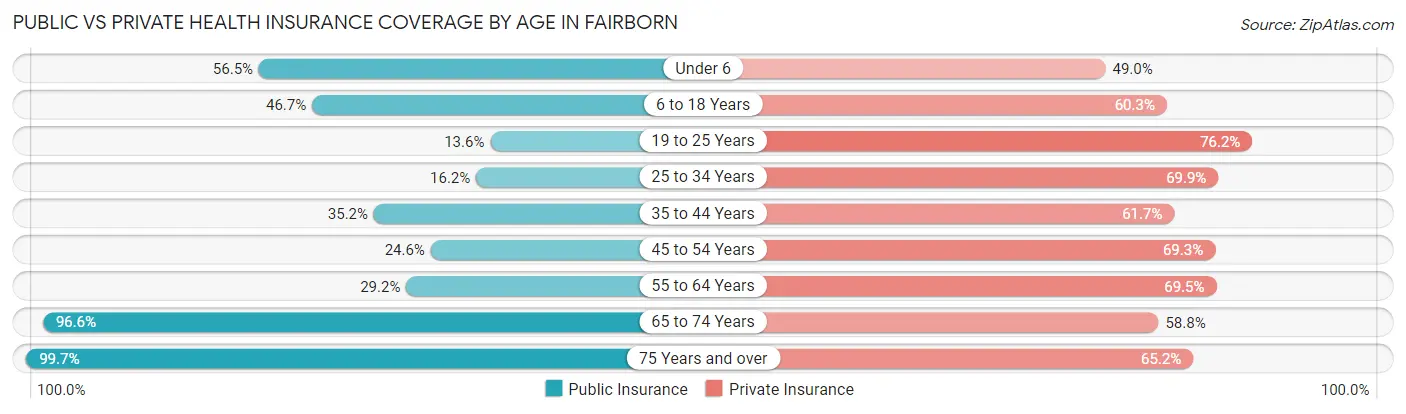
| Age Bracket | Public Insurance | Private Insurance |
| Under 6 | 1,623 (56.5%) | 1,406 (49.0%) |
| 6 to 18 Years | 1,891 (46.7%) | 2,445 (60.3%) |
| 19 to 25 Years | 620 (13.6%) | 3,481 (76.2%) |
| 25 to 34 Years | 833 (16.2%) | 3,595 (69.9%) |
| 35 to 44 Years | 1,529 (35.2%) | 2,682 (61.7%) |
| 45 to 54 Years | 813 (24.6%) | 2,287 (69.3%) |
| 55 to 64 Years | 1,225 (29.2%) | 2,920 (69.5%) |
| 65 to 74 Years | 2,492 (96.6%) | 1,516 (58.8%) |
| 75 Years and over | 2,533 (99.7%) | 1,657 (65.2%) |
| Total | 13,559 (40.3%) | 21,989 (65.4%) |
Disability Status by Sex by Age in Fairborn
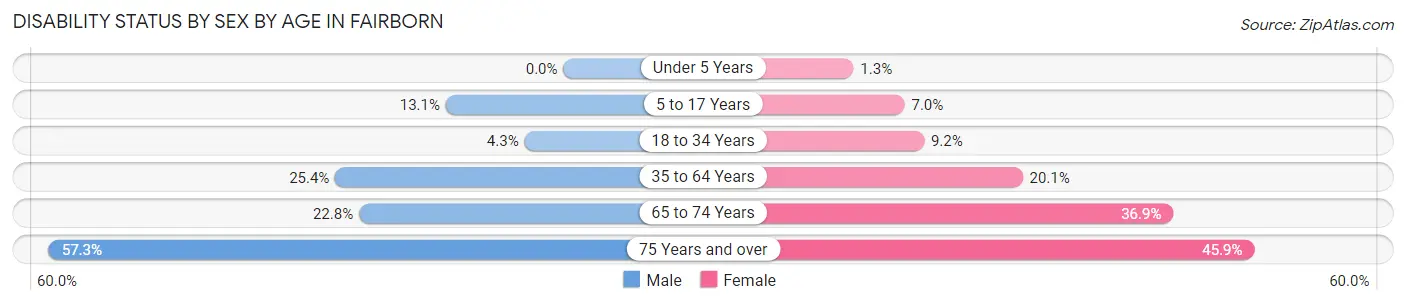
| Age Bracket | Male | Female |
| Under 5 Years | 0 (0.0%) | 14 (1.3%) |
| 5 to 17 Years | 283 (13.1%) | 142 (7.0%) |
| 18 to 34 Years | 219 (4.3%) | 457 (9.1%) |
| 35 to 64 Years | 1,534 (25.4%) | 1,170 (20.1%) |
| 65 to 74 Years | 294 (22.8%) | 475 (36.9%) |
| 75 Years and over | 589 (57.3%) | 695 (45.9%) |
Disability Class by Sex by Age in Fairborn
Disability Class: Hearing Difficulty
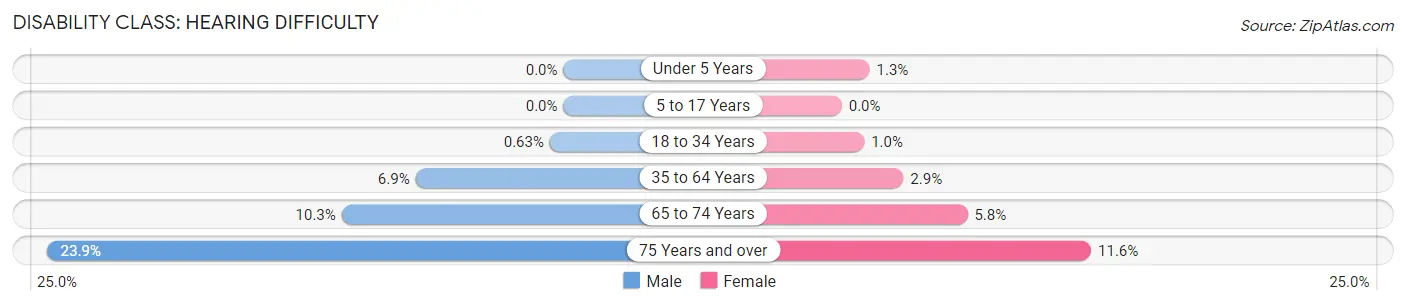
| Age Bracket | Male | Female |
| Under 5 Years | 0 (0.0%) | 14 (1.3%) |
| 5 to 17 Years | 0 (0.0%) | 0 (0.0%) |
| 18 to 34 Years | 32 (0.6%) | 52 (1.0%) |
| 35 to 64 Years | 414 (6.9%) | 166 (2.9%) |
| 65 to 74 Years | 133 (10.3%) | 75 (5.8%) |
| 75 Years and over | 246 (23.9%) | 175 (11.6%) |
Disability Class: Vision Difficulty
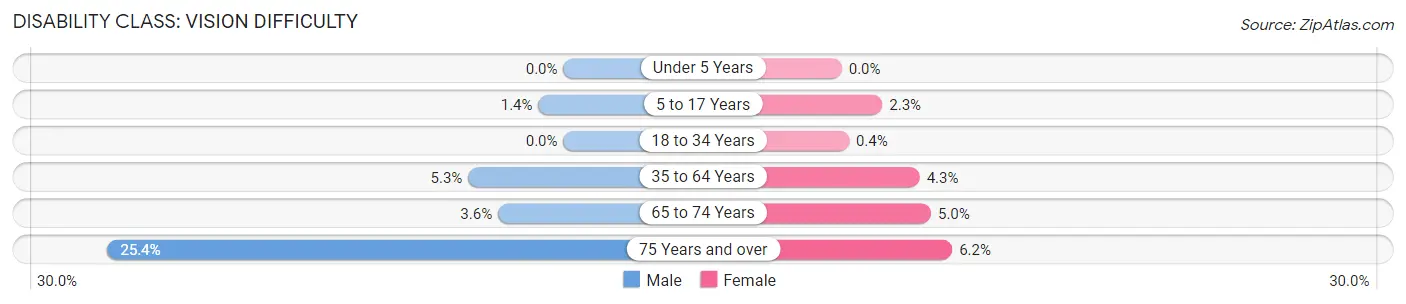
| Age Bracket | Male | Female |
| Under 5 Years | 0 (0.0%) | 0 (0.0%) |
| 5 to 17 Years | 30 (1.4%) | 46 (2.3%) |
| 18 to 34 Years | 0 (0.0%) | 20 (0.4%) |
| 35 to 64 Years | 320 (5.3%) | 252 (4.3%) |
| 65 to 74 Years | 47 (3.6%) | 64 (5.0%) |
| 75 Years and over | 261 (25.4%) | 93 (6.1%) |
Disability Class: Cognitive Difficulty
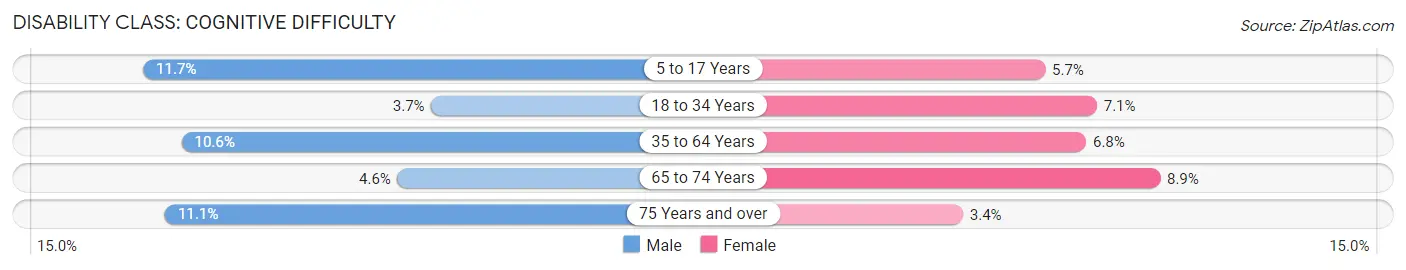
| Age Bracket | Male | Female |
| 5 to 17 Years | 253 (11.7%) | 115 (5.7%) |
| 18 to 34 Years | 187 (3.7%) | 355 (7.1%) |
| 35 to 64 Years | 642 (10.6%) | 395 (6.8%) |
| 65 to 74 Years | 60 (4.6%) | 114 (8.9%) |
| 75 Years and over | 114 (11.1%) | 51 (3.4%) |
Disability Class: Ambulatory Difficulty
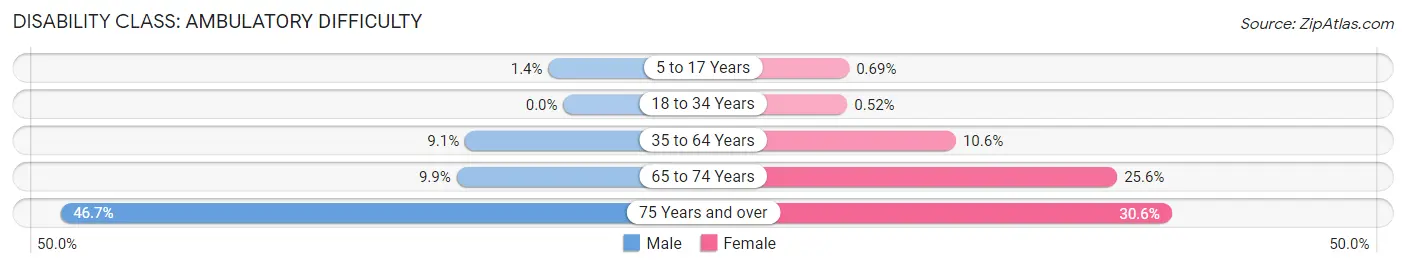
| Age Bracket | Male | Female |
| 5 to 17 Years | 30 (1.4%) | 14 (0.7%) |
| 18 to 34 Years | 0 (0.0%) | 26 (0.5%) |
| 35 to 64 Years | 551 (9.1%) | 616 (10.6%) |
| 65 to 74 Years | 128 (9.9%) | 329 (25.6%) |
| 75 Years and over | 480 (46.7%) | 463 (30.6%) |
Disability Class: Self-Care Difficulty
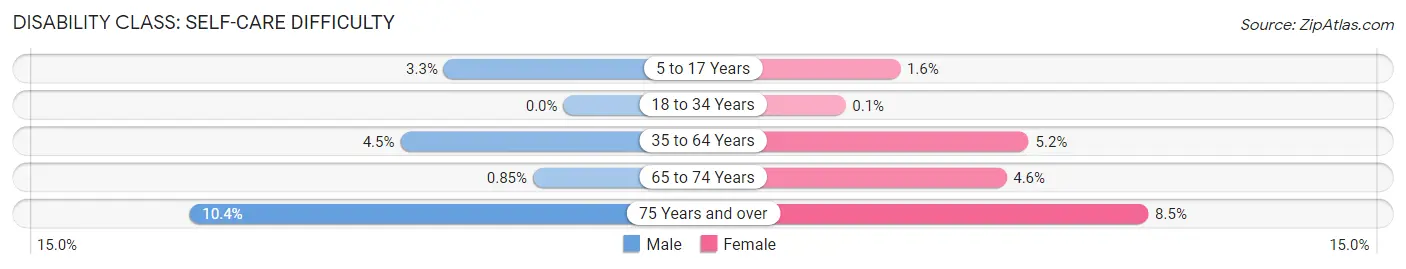
| Age Bracket | Male | Female |
| 5 to 17 Years | 72 (3.3%) | 33 (1.6%) |
| 18 to 34 Years | 0 (0.0%) | 5 (0.1%) |
| 35 to 64 Years | 274 (4.5%) | 302 (5.2%) |
| 65 to 74 Years | 11 (0.9%) | 59 (4.6%) |
| 75 Years and over | 107 (10.4%) | 129 (8.5%) |
Technology Access in Fairborn
Computing Device Access in Fairborn
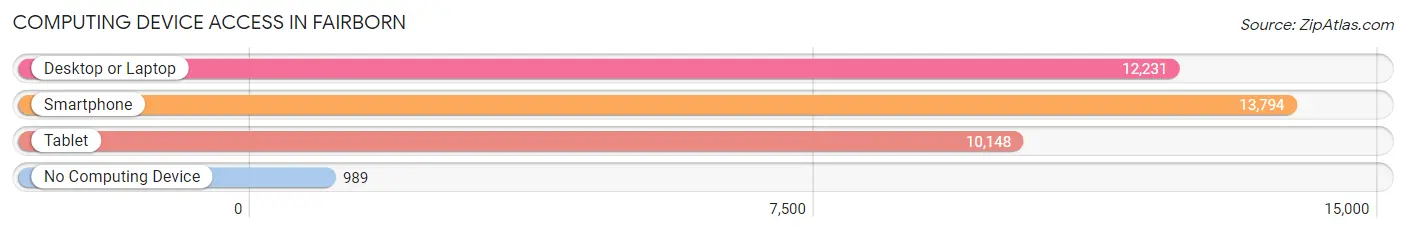
| Device Type | # Households | % Households |
| Desktop or Laptop | 12,231 | 77.0% |
| Smartphone | 13,794 | 86.9% |
| Tablet | 10,148 | 63.9% |
| No Computing Device | 989 | 6.2% |
| Total | 15,875 | 100.0% |
Internet Access in Fairborn

| Internet Type | # Households | % Households |
| Dial-Up Internet | 11 | 0.1% |
| Broadband Home | 12,629 | 79.5% |
| Cellular Data Only | 1,286 | 8.1% |
| Satellite Internet | 1,018 | 6.4% |
| No Internet | 1,527 | 9.6% |
| Total | 15,875 | 100.0% |
Fairborn Summary
History
The city of Fairborn, Ohio is located in Greene County, approximately 10 miles northeast of Dayton. The city was founded in 1950 when the villages of Fairfield and Osborn merged. The two villages had been in existence since the early 1800s, and the merger was a result of the growth of the Wright-Patterson Air Force Base, which is located just outside of the city.
The area was originally inhabited by the Shawnee Indians, who were driven out by white settlers in the late 1700s. The first settlers in the area were Quakers, who established a settlement in the area in 1803. The settlement was named Fairfield, and the village of Osborn was established nearby in 1817.
The area was largely agricultural until the Wright-Patterson Air Force Base was established in 1948. The base brought an influx of new residents to the area, and the two villages of Fairfield and Osborn merged in 1950 to form the city of Fairborn.
Geography
Fairborn is located in Greene County, Ohio, approximately 10 miles northeast of Dayton. The city is situated in the Miami Valley region of Ohio, and is bordered by the cities of Beavercreek, Xenia, and Yellow Springs. The city covers an area of 8.7 square miles, and has a population of 32,000.
The terrain of Fairborn is mostly flat, with some rolling hills in the northern part of the city. The city is located in the Mad River Valley, and is bisected by the Mad River. The city is also home to several parks, including Fairfield Park, Osborn Park, and Wright-Patterson Air Force Base.
Economy
The economy of Fairborn is largely driven by the Wright-Patterson Air Force Base, which is located just outside of the city. The base is the largest single-site employer in Ohio, and employs over 27,000 people. The base is also home to the National Museum of the United States Air Force, which is a major tourist attraction.
In addition to the base, Fairborn is home to several large employers, including the Fairborn City Schools, the Fairborn City Government, and the Fairborn Medical Center. The city is also home to several small businesses, including restaurants, retail stores, and service providers.
Demographics
As of the 2010 census, the population of Fairborn was 32,000. The city has a diverse population, with the largest racial group being white (77.3%), followed by African American (14.2%), Hispanic (4.2%), and Asian (2.3%). The median household income in Fairborn is $50,000, and the median age is 37.
The city is home to several educational institutions, including Wright State University, Central State University, and Sinclair Community College. The city is also home to several churches, including the Fairborn United Methodist Church, the Fairborn Church of the Nazarene, and the Fairborn Church of Christ.
Common Questions
What is Per Capita Income in Fairborn?
Per Capita income in Fairborn is $33,110.
What is the Median Family Income in Fairborn?
Median Family Income in Fairborn is $73,492.
What is the Median Household income in Fairborn?
Median Household Income in Fairborn is $53,783.
What is Income or Wage Gap in Fairborn?
Income or Wage Gap in Fairborn is 27.1%.
Women in Fairborn earn 72.9 cents for every dollar earned by a man.
What is Family Income Deficit in Fairborn?
Family Income Deficit in Fairborn is $8,204.
Families that are below poverty line in Fairborn earn $8,204 less on average than the poverty threshold level.
What is Inequality or Gini Index in Fairborn?
Inequality or Gini Index in Fairborn is 0.44.
What is the Total Population of Fairborn?
Total Population of Fairborn is 34,494.
What is the Total Male Population of Fairborn?
Total Male Population of Fairborn is 17,314.
What is the Total Female Population of Fairborn?
Total Female Population of Fairborn is 17,180.
What is the Ratio of Males per 100 Females in Fairborn?
There are 100.78 Males per 100 Females in Fairborn.
What is the Ratio of Females per 100 Males in Fairborn?
There are 99.23 Females per 100 Males in Fairborn.
What is the Median Population Age in Fairborn?
Median Population Age in Fairborn is 35.1 Years.
What is the Average Family Size in Fairborn
Average Family Size in Fairborn is 2.8 People.
What is the Average Household Size in Fairborn
Average Household Size in Fairborn is 2.1 People.
How Large is the Labor Force in Fairborn?
There are 18,409 People in the Labor Forcein in Fairborn.
What is the Percentage of People in the Labor Force in Fairborn?
64.7% of People are in the Labor Force in Fairborn.
What is the Unemployment Rate in Fairborn?
Unemployment Rate in Fairborn is 4.9%.