Minerva, OH Map & Demographics
Minerva Map
Minerva Overview
$32,797
PER CAPITA INCOME
$69,797
AVG FAMILY INCOME
$48,511
AVG HOUSEHOLD INCOME
19.4%
WAGE / INCOME GAP [ % ]
80.6¢/ $1
WAGE / INCOME GAP [ $ ]
$8,776
FAMILY INCOME DEFICIT
0.43
INEQUALITY / GINI INDEX
3,246
TOTAL POPULATION
1,464
MALE POPULATION
1,782
FEMALE POPULATION
82.15
MALES / 100 FEMALES
121.72
FEMALES / 100 MALES
41.7
MEDIAN AGE
2.8
AVG FAMILY SIZE
2.0
AVG HOUSEHOLD SIZE
1,831
LABOR FORCE [ PEOPLE ]
65.5%
PERCENT IN LABOR FORCE
3.0%
UNEMPLOYMENT RATE
Minerva Zip Codes
Minerva Area Codes
Income in Minerva
Income Overview in Minerva
Per Capita Income in Minerva is $32,797, while median incomes of families and households are $69,797 and $48,511 respectively.
| Characteristic | Number | Measure |
| Per Capita Income | 3,246 | $32,797 |
| Median Family Income | 740 | $69,797 |
| Mean Family Income | 740 | $76,941 |
| Median Household Income | 1,580 | $48,511 |
| Mean Household Income | 1,580 | $66,749 |
| Income Deficit | 740 | $8,776 |
| Wage / Income Gap (%) | 3,246 | 19.35% |
| Wage / Income Gap ($) | 3,246 | 80.65¢ per $1 |
| Gini / Inequality Index | 3,246 | 0.43 |
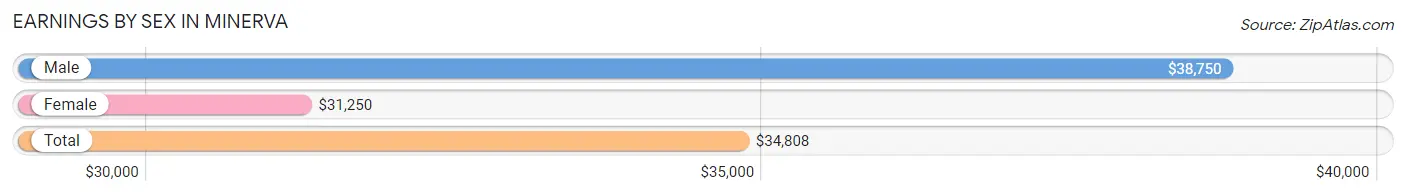
Earnings by Sex in Minerva
Average Earnings in Minerva are $34,808, $38,750 for men and $31,250 for women, a difference of 19.4%.
| Sex | Number | Average Earnings |
| Male | 935 (50.2%) | $38,750 |
| Female | 927 (49.8%) | $31,250 |
| Total | 1,862 (100.0%) | $34,808 |
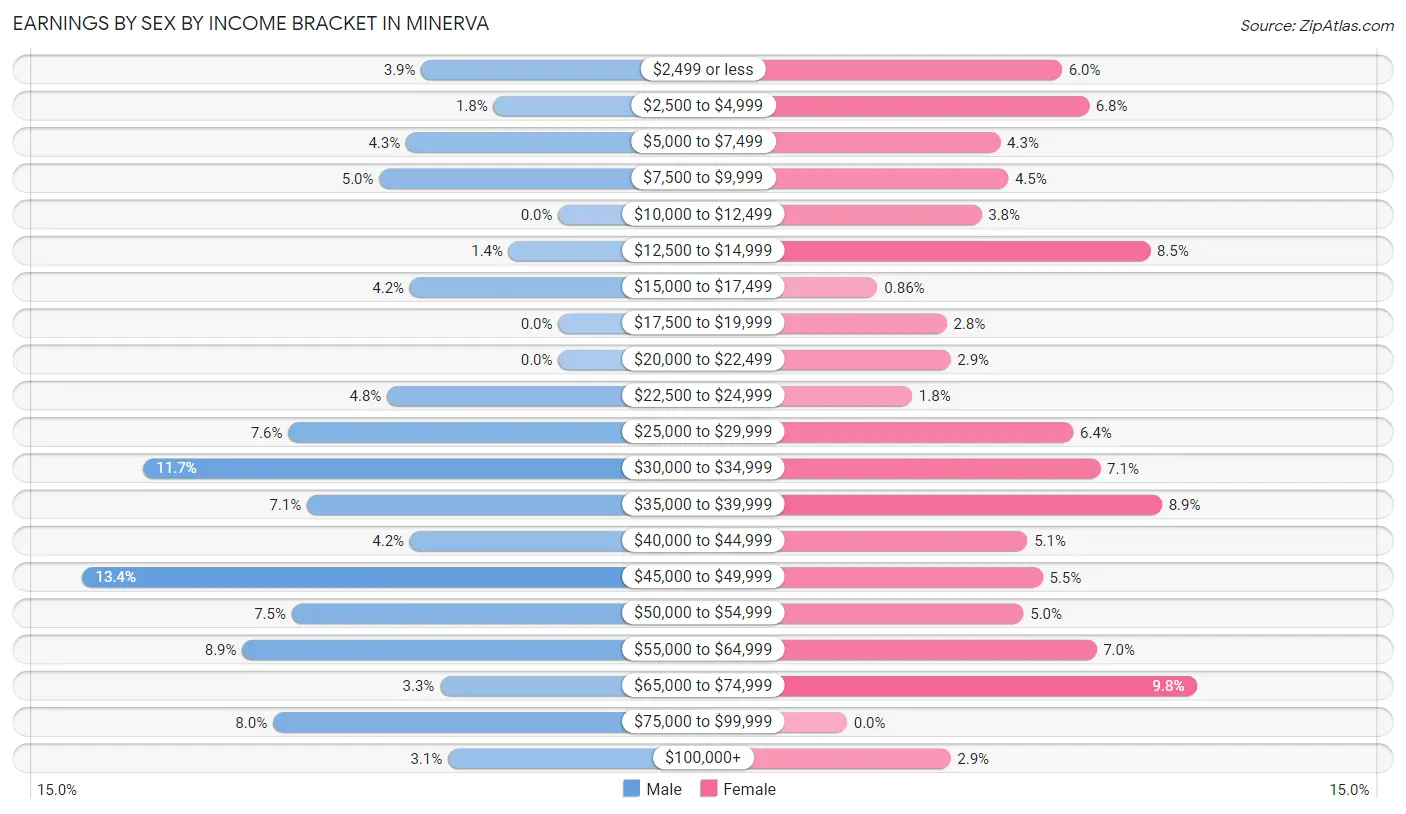
Earnings by Sex by Income Bracket in Minerva
The most common earnings brackets in Minerva are $45,000 to $49,999 for men (125 | 13.4%) and $65,000 to $74,999 for women (91 | 9.8%).
| Income | Male | Female |
| $2,499 or less | 36 (3.8%) | 56 (6.0%) |
| $2,500 to $4,999 | 17 (1.8%) | 63 (6.8%) |
| $5,000 to $7,499 | 40 (4.3%) | 40 (4.3%) |
| $7,500 to $9,999 | 47 (5.0%) | 42 (4.5%) |
| $10,000 to $12,499 | 0 (0.0%) | 35 (3.8%) |
| $12,500 to $14,999 | 13 (1.4%) | 79 (8.5%) |
| $15,000 to $17,499 | 39 (4.2%) | 8 (0.9%) |
| $17,500 to $19,999 | 0 (0.0%) | 26 (2.8%) |
| $20,000 to $22,499 | 0 (0.0%) | 27 (2.9%) |
| $22,500 to $24,999 | 45 (4.8%) | 17 (1.8%) |
| $25,000 to $29,999 | 71 (7.6%) | 59 (6.4%) |
| $30,000 to $34,999 | 109 (11.7%) | 66 (7.1%) |
| $35,000 to $39,999 | 66 (7.1%) | 82 (8.8%) |
| $40,000 to $44,999 | 39 (4.2%) | 47 (5.1%) |
| $45,000 to $49,999 | 125 (13.4%) | 51 (5.5%) |
| $50,000 to $54,999 | 70 (7.5%) | 46 (5.0%) |
| $55,000 to $64,999 | 83 (8.9%) | 65 (7.0%) |
| $65,000 to $74,999 | 31 (3.3%) | 91 (9.8%) |
| $75,000 to $99,999 | 75 (8.0%) | 0 (0.0%) |
| $100,000+ | 29 (3.1%) | 27 (2.9%) |
| Total | 935 (100.0%) | 927 (100.0%) |
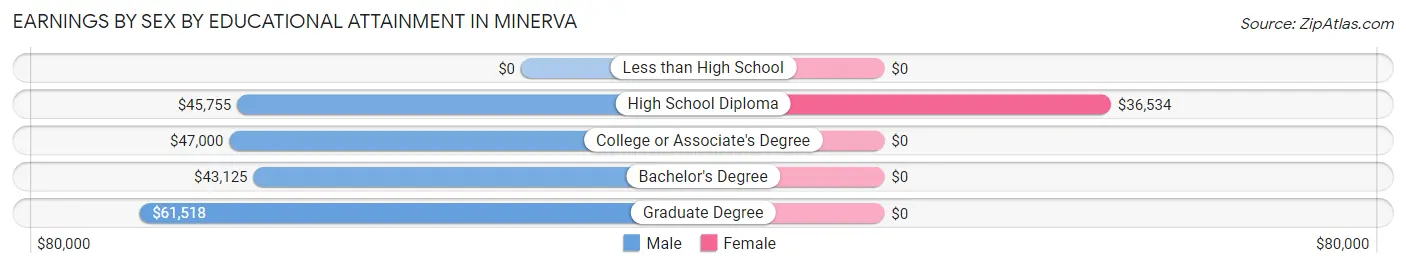
Earnings by Sex by Educational Attainment in Minerva
Average earnings in Minerva are $46,342 for men and $35,767 for women, a difference of 22.8%. Men with an educational attainment of graduate degree enjoy the highest average annual earnings of $61,518, while those with bachelor's degree education earn the least with $43,125. Women with an educational attainment of high school diploma earn the most with the average annual earnings of $36,534, while those with high school diploma education have the smallest earnings of $36,534.
| Educational Attainment | Male Income | Female Income |
| Less than High School | - | - |
| High School Diploma | $45,755 | $36,534 |
| College or Associate's Degree | $47,000 | $0 |
| Bachelor's Degree | $43,125 | $0 |
| Graduate Degree | $61,518 | $0 |
| Total | $46,342 | $35,767 |
Family Income in Minerva
Family Income Brackets in Minerva
According to the Minerva family income data, there are 188 families falling into the $100,000 to $149,999 income range, which is the most common income bracket and makes up 25.4% of all families.
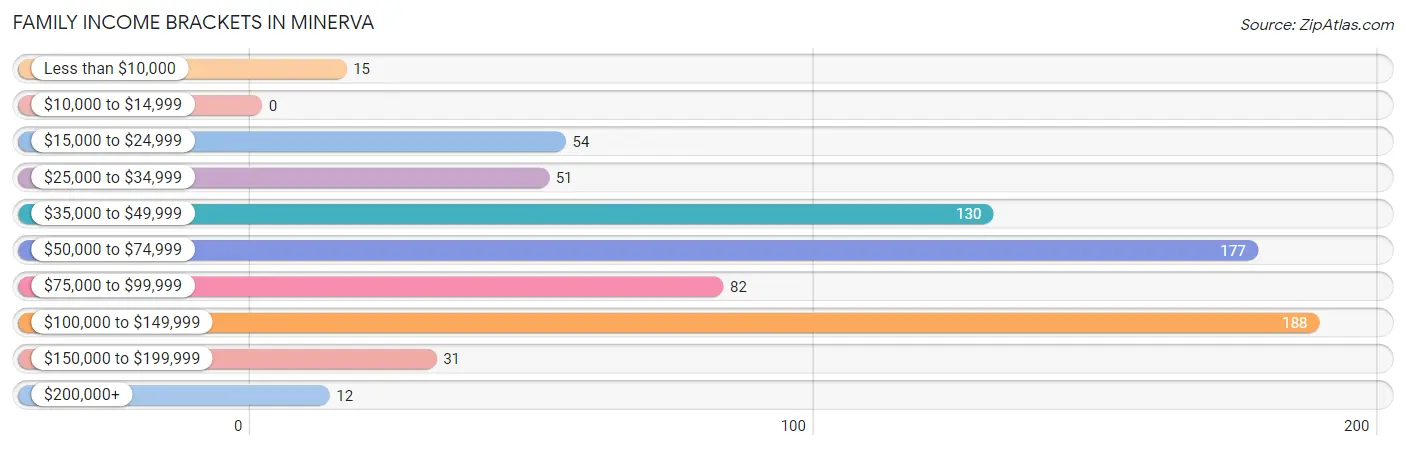
| Income Bracket | # Families | % Families |
| Less than $10,000 | 15 | 2.0% |
| $10,000 to $14,999 | 0 | 0.0% |
| $15,000 to $24,999 | 54 | 7.3% |
| $25,000 to $34,999 | 51 | 6.9% |
| $35,000 to $49,999 | 130 | 17.6% |
| $50,000 to $74,999 | 177 | 23.9% |
| $75,000 to $99,999 | 82 | 11.1% |
| $100,000 to $149,999 | 188 | 25.4% |
| $150,000 to $199,999 | 31 | 4.2% |
| $200,000+ | 12 | 1.6% |
Family Income by Famaliy Size in Minerva
3-person families (144 | 19.5%) account for the highest median family income in Minerva with $98,333 per family, while 3-person families (144 | 19.5%) have the highest median income of $32,778 per family member.
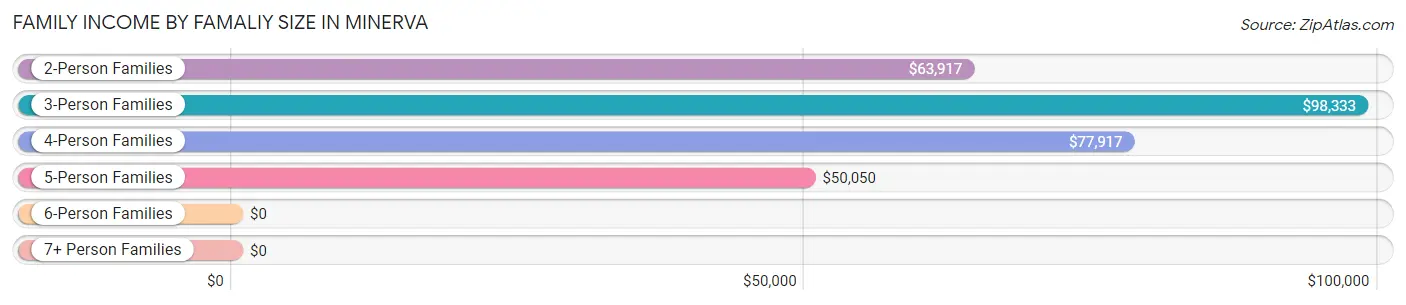
| Income Bracket | # Families | Median Income |
| 2-Person Families | 375 (50.7%) | $63,917 |
| 3-Person Families | 144 (19.5%) | $98,333 |
| 4-Person Families | 155 (20.9%) | $77,917 |
| 5-Person Families | 49 (6.6%) | $50,050 |
| 6-Person Families | 17 (2.3%) | $0 |
| 7+ Person Families | 0 (0.0%) | $0 |
| Total | 740 (100.0%) | $69,797 |
Family Income by Number of Earners in Minerva
The median family income in Minerva is $69,797, with families comprising 3+ earners (58) having the highest median family income of $141,912, while families with 1 earner (266) have the lowest median family income of $47,813, accounting for 7.8% and 35.9% of families, respectively.
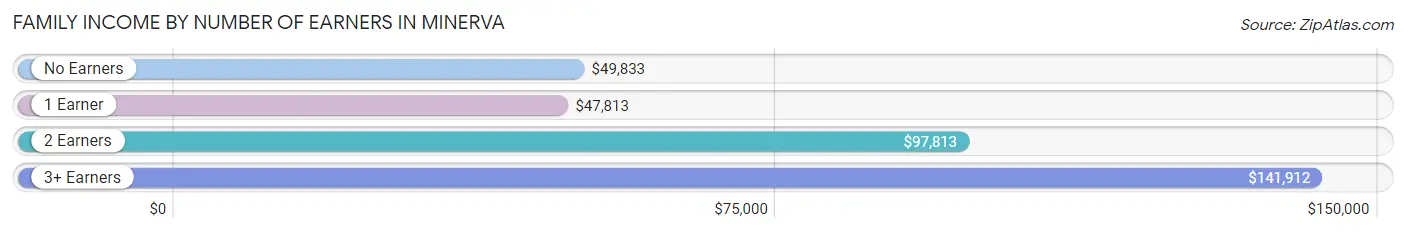
| Number of Earners | # Families | Median Income |
| No Earners | 116 (15.7%) | $49,833 |
| 1 Earner | 266 (35.9%) | $47,813 |
| 2 Earners | 300 (40.5%) | $97,813 |
| 3+ Earners | 58 (7.8%) | $141,912 |
| Total | 740 (100.0%) | $69,797 |
Household Income in Minerva
Household Income Brackets in Minerva
With 371 households falling in the category, the $50,000 to $74,999 income range is the most frequent in Minerva, accounting for 23.5% of all households. In contrast, only 21 households (1.3%) fall into the $200,000+ income bracket, making it the least populous group.
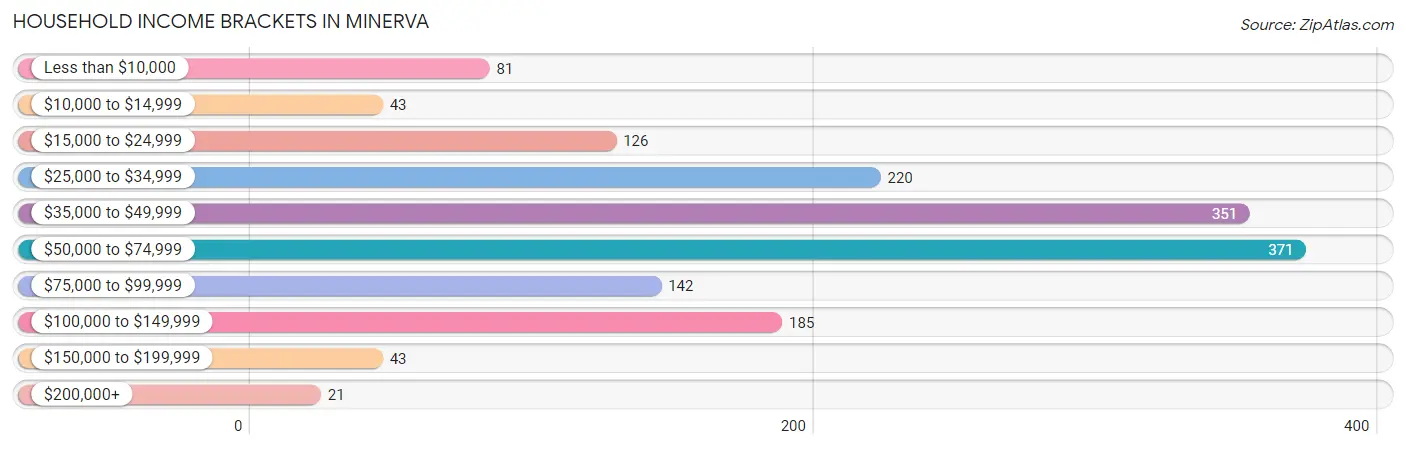
| Income Bracket | # Households | % Households |
| Less than $10,000 | 81 | 5.1% |
| $10,000 to $14,999 | 43 | 2.7% |
| $15,000 to $24,999 | 126 | 8.0% |
| $25,000 to $34,999 | 220 | 13.9% |
| $35,000 to $49,999 | 351 | 22.2% |
| $50,000 to $74,999 | 371 | 23.5% |
| $75,000 to $99,999 | 142 | 9.0% |
| $100,000 to $149,999 | 185 | 11.7% |
| $150,000 to $199,999 | 43 | 2.7% |
| $200,000+ | 21 | 1.3% |
Household Income by Householder Age in Minerva
The median household income in Minerva is $48,511, with the highest median household income of $67,708 found in the 25 to 44 years age bracket for the primary householder. A total of 376 households (23.8%) fall into this category. Meanwhile, the 65+ years age bracket for the primary householder has the lowest median household income of $39,063, with 474 households (30.0%) in this group.
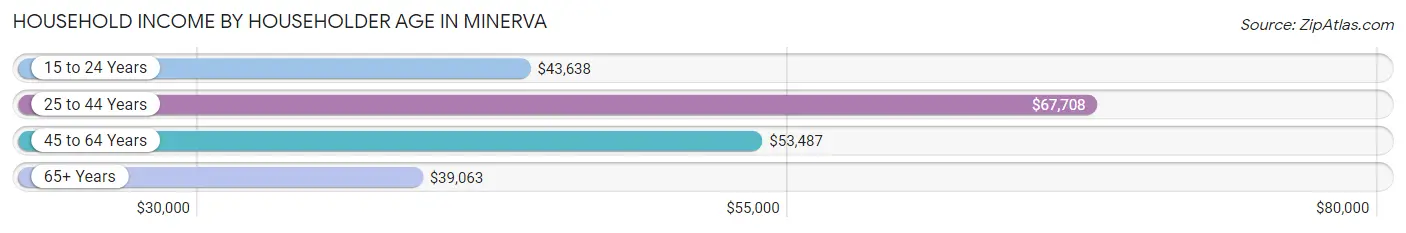
| Income Bracket | # Households | Median Income |
| 15 to 24 Years | 181 (11.5%) | $43,638 |
| 25 to 44 Years | 376 (23.8%) | $67,708 |
| 45 to 64 Years | 549 (34.7%) | $53,487 |
| 65+ Years | 474 (30.0%) | $39,063 |
| Total | 1,580 (100.0%) | $48,511 |
Poverty in Minerva
Income Below Poverty by Sex and Age in Minerva
With 7.6% poverty level for males and 24.4% for females among the residents of Minerva, 55 to 64 year old males and 18 to 24 year old females are the most vulnerable to poverty, with 39 males (25.3%) and 111 females (54.7%) in their respective age groups living below the poverty level.
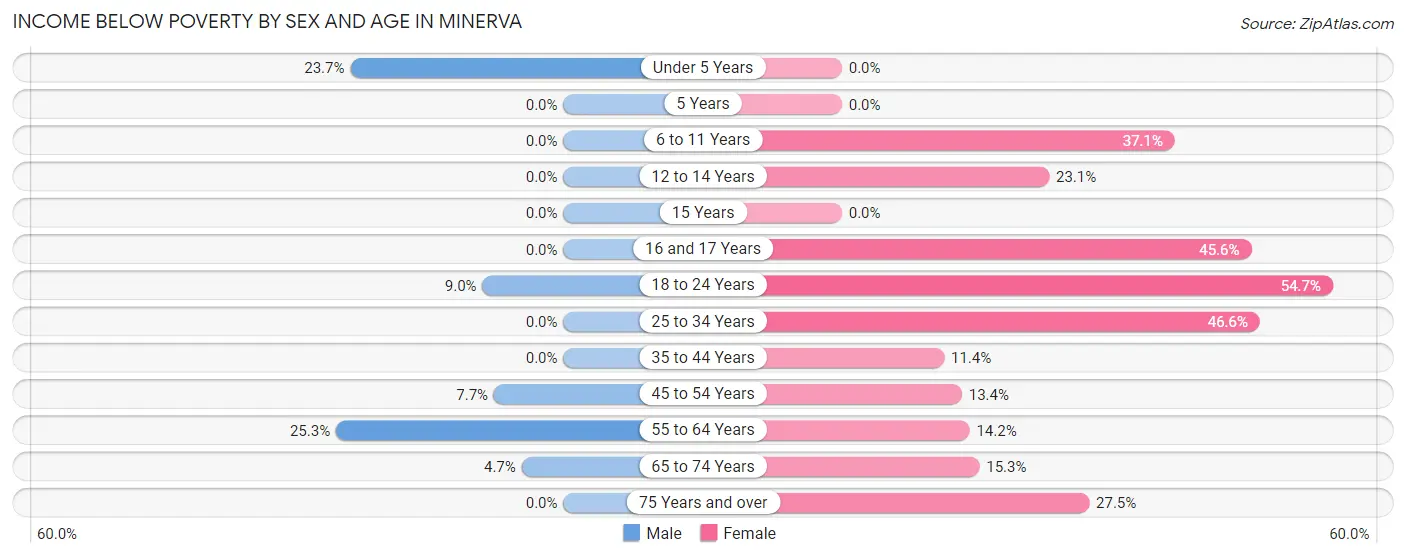
| Age Bracket | Male | Female |
| Under 5 Years | 28 (23.7%) | 0 (0.0%) |
| 5 Years | 0 (0.0%) | 0 (0.0%) |
| 6 to 11 Years | 0 (0.0%) | 33 (37.1%) |
| 12 to 14 Years | 0 (0.0%) | 12 (23.1%) |
| 15 Years | 0 (0.0%) | 0 (0.0%) |
| 16 and 17 Years | 0 (0.0%) | 26 (45.6%) |
| 18 to 24 Years | 21 (9.0%) | 111 (54.7%) |
| 25 to 34 Years | 0 (0.0%) | 81 (46.6%) |
| 35 to 44 Years | 0 (0.0%) | 23 (11.4%) |
| 45 to 54 Years | 14 (7.7%) | 35 (13.4%) |
| 55 to 64 Years | 39 (25.3%) | 33 (14.2%) |
| 65 to 74 Years | 8 (4.6%) | 32 (15.3%) |
| 75 Years and over | 0 (0.0%) | 46 (27.5%) |
| Total | 110 (7.6%) | 432 (24.4%) |
Income Above Poverty by Sex and Age in Minerva
According to the poverty statistics in Minerva, males aged 6 to 11 years and females aged under 5 years are the age groups that are most secure financially, with 100.0% of males and 100.0% of females in these age groups living above the poverty line.
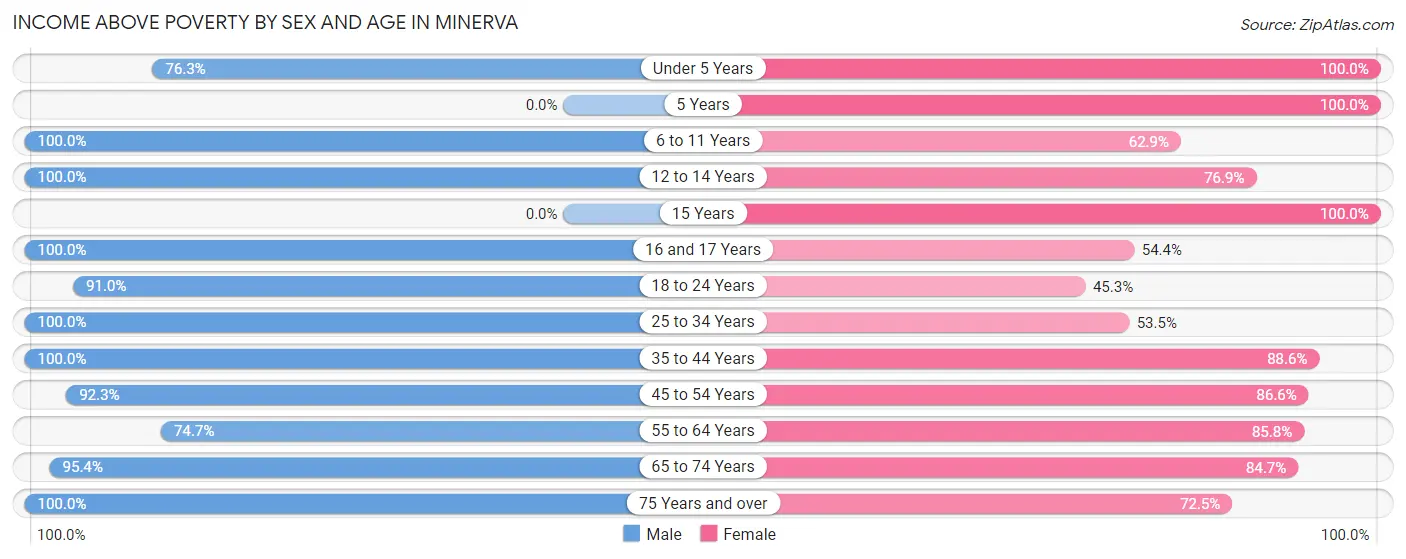
| Age Bracket | Male | Female |
| Under 5 Years | 90 (76.3%) | 99 (100.0%) |
| 5 Years | 0 (0.0%) | 18 (100.0%) |
| 6 to 11 Years | 36 (100.0%) | 56 (62.9%) |
| 12 to 14 Years | 32 (100.0%) | 40 (76.9%) |
| 15 Years | 0 (0.0%) | 7 (100.0%) |
| 16 and 17 Years | 26 (100.0%) | 31 (54.4%) |
| 18 to 24 Years | 212 (91.0%) | 92 (45.3%) |
| 25 to 34 Years | 140 (100.0%) | 93 (53.4%) |
| 35 to 44 Years | 256 (100.0%) | 179 (88.6%) |
| 45 to 54 Years | 167 (92.3%) | 227 (86.6%) |
| 55 to 64 Years | 115 (74.7%) | 199 (85.8%) |
| 65 to 74 Years | 164 (95.4%) | 177 (84.7%) |
| 75 Years and over | 93 (100.0%) | 121 (72.5%) |
| Total | 1,331 (92.4%) | 1,339 (75.6%) |
Income Below Poverty Among Married-Couple Families in Minerva
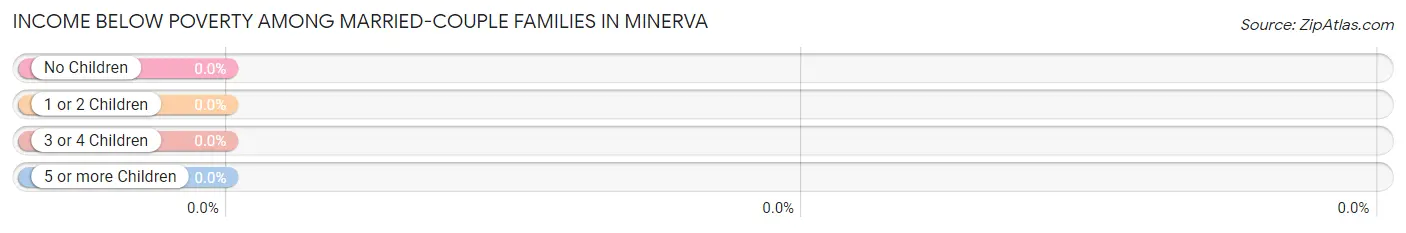
| Children | Above Poverty | Below Poverty |
| No Children | 349 (100.0%) | 0 (0.0%) |
| 1 or 2 Children | 145 (100.0%) | 0 (0.0%) |
| 3 or 4 Children | 17 (100.0%) | 0 (0.0%) |
| 5 or more Children | 0 (0.0%) | 0 (0.0%) |
| Total | 511 (100.0%) | 0 (0.0%) |
Income Below Poverty Among Single-Parent Households in Minerva
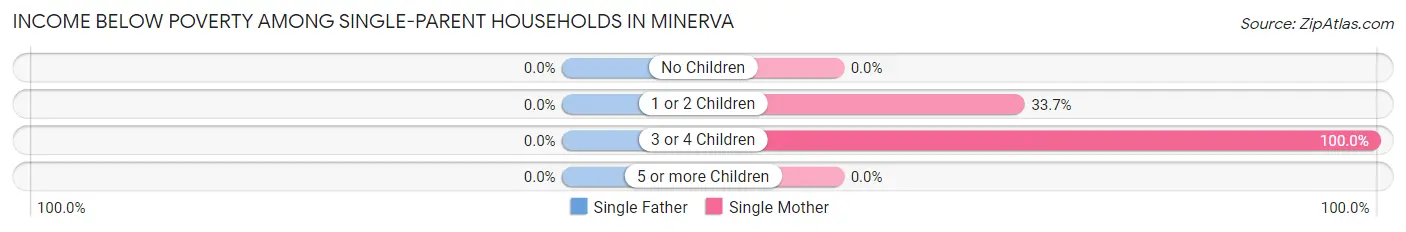
| Children | Single Father | Single Mother |
| No Children | 0 (0.0%) | 0 (0.0%) |
| 1 or 2 Children | 0 (0.0%) | 33 (33.7%) |
| 3 or 4 Children | 0 (0.0%) | 16 (100.0%) |
| 5 or more Children | 0 (0.0%) | 0 (0.0%) |
| Total | 0 (0.0%) | 49 (34.3%) |
Income Below Poverty Among Married-Couple vs Single-Parent Households in Minerva
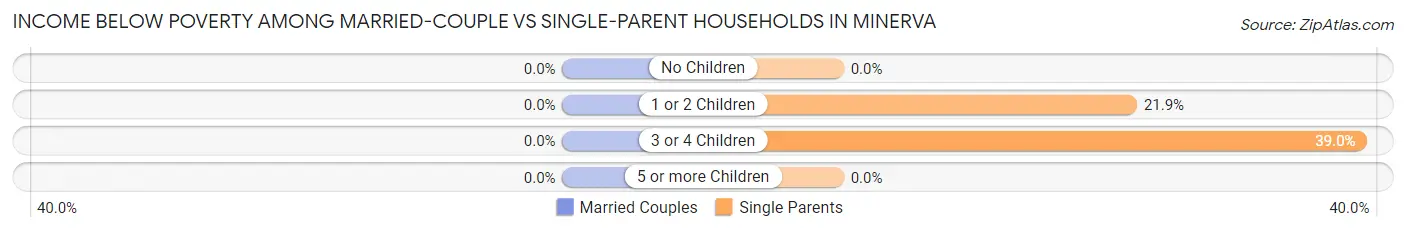
| Children | Married-Couple Families | Single-Parent Households |
| No Children | 0 (0.0%) | 0 (0.0%) |
| 1 or 2 Children | 0 (0.0%) | 33 (21.8%) |
| 3 or 4 Children | 0 (0.0%) | 16 (39.0%) |
| 5 or more Children | 0 (0.0%) | 0 (0.0%) |
| Total | 0 (0.0%) | 49 (21.4%) |
Race in Minerva
The most populous races in Minerva are White / Caucasian (2,990 | 92.1%), Two or more Races (177 | 5.4%), and Black / African American (55 | 1.7%).
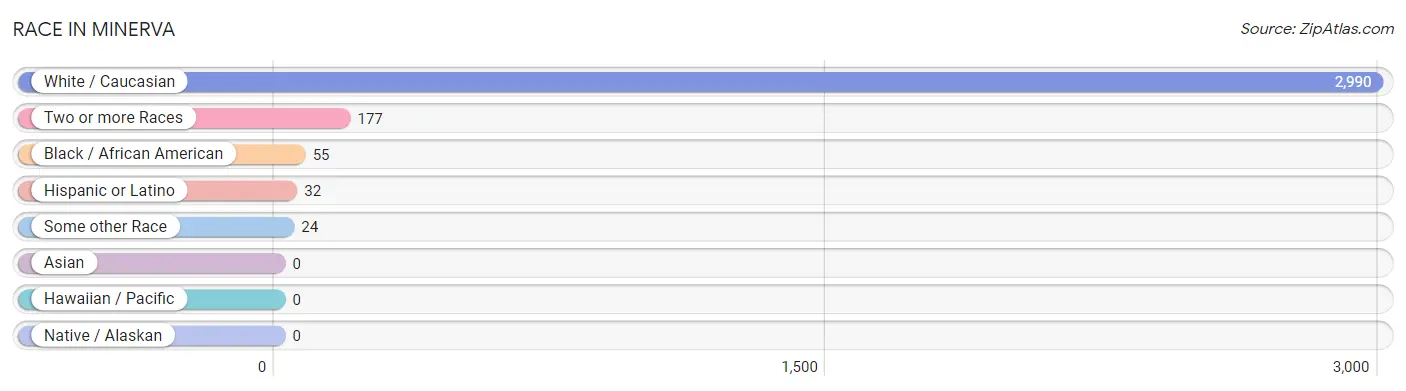
| Race | # Population | % Population |
| Asian | 0 | 0.0% |
| Black / African American | 55 | 1.7% |
| Hawaiian / Pacific | 0 | 0.0% |
| Hispanic or Latino | 32 | 1.0% |
| Native / Alaskan | 0 | 0.0% |
| White / Caucasian | 2,990 | 92.1% |
| Two or more Races | 177 | 5.4% |
| Some other Race | 24 | 0.7% |
| Total | 3,246 | 100.0% |
Ancestry in Minerva
The most populous ancestries reported in Minerva are German (758 | 23.4%), Irish (558 | 17.2%), English (442 | 13.6%), Italian (232 | 7.1%), and European (202 | 6.2%), together accounting for 67.5% of all Minerva residents.
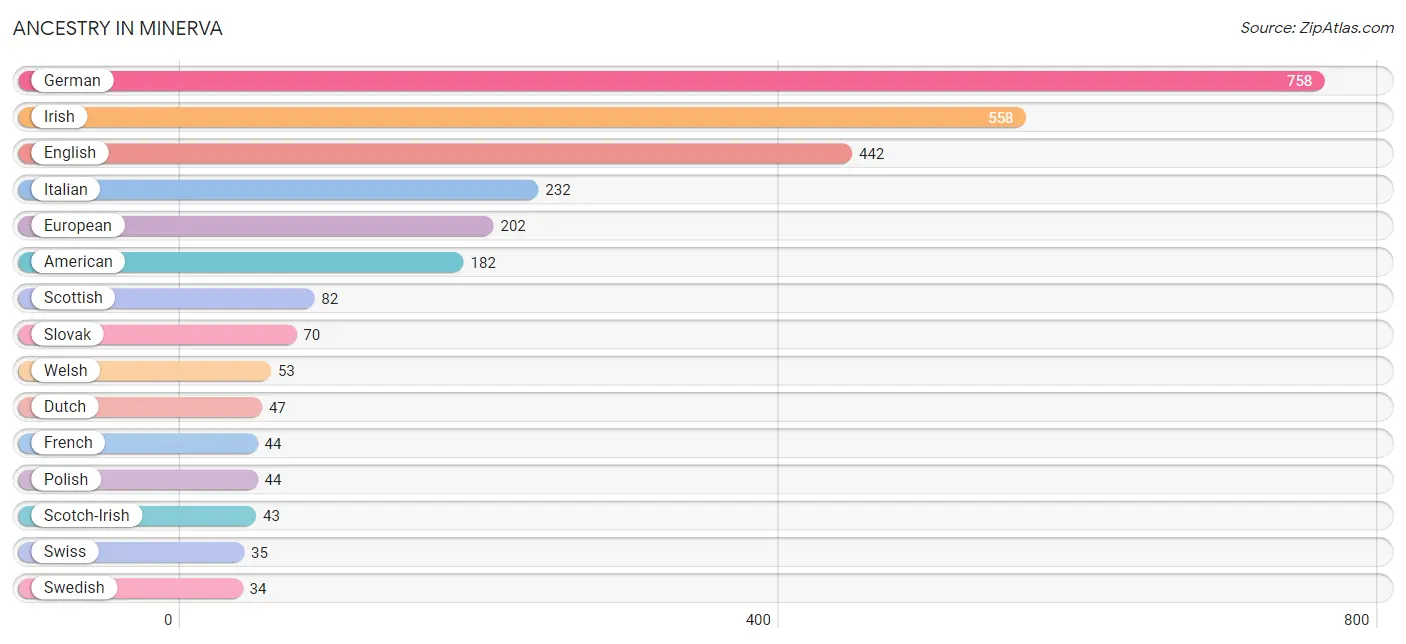
| Ancestry | # Population | % Population |
| American | 182 | 5.6% |
| Blackfeet | 7 | 0.2% |
| British | 7 | 0.2% |
| Central American | 16 | 0.5% |
| Cherokee | 8 | 0.3% |
| Dutch | 47 | 1.5% |
| English | 442 | 13.6% |
| European | 202 | 6.2% |
| French | 44 | 1.4% |
| German | 758 | 23.4% |
| Greek | 19 | 0.6% |
| Haitian | 8 | 0.3% |
| Honduran | 8 | 0.3% |
| Irish | 558 | 17.2% |
| Italian | 232 | 7.1% |
| Jamaican | 25 | 0.8% |
| Lithuanian | 6 | 0.2% |
| Mexican | 16 | 0.5% |
| Pennsylvania German | 17 | 0.5% |
| Polish | 44 | 1.4% |
| Romanian | 8 | 0.3% |
| Salvadoran | 8 | 0.3% |
| Scandinavian | 17 | 0.5% |
| Scotch-Irish | 43 | 1.3% |
| Scottish | 82 | 2.5% |
| Slovak | 70 | 2.2% |
| Swedish | 34 | 1.1% |
| Swiss | 35 | 1.1% |
| Welsh | 53 | 1.6% | View All 29 Rows |
Immigrants in Minerva
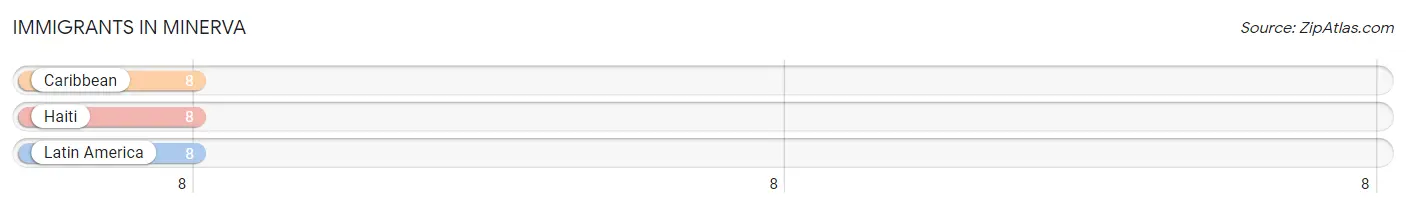
The most numerous immigrant groups reported in Minerva came from Caribbean (8 | 0.3%), Haiti (8 | 0.3%), and Latin America (8 | 0.3%), together accounting for 0.7% of all Minerva residents.
| Immigration Origin | # Population | % Population |
| Caribbean | 8 | 0.3% |
| Haiti | 8 | 0.3% |
| Latin America | 8 | 0.3% | View All 3 Rows |
Sex and Age in Minerva
Sex and Age in Minerva
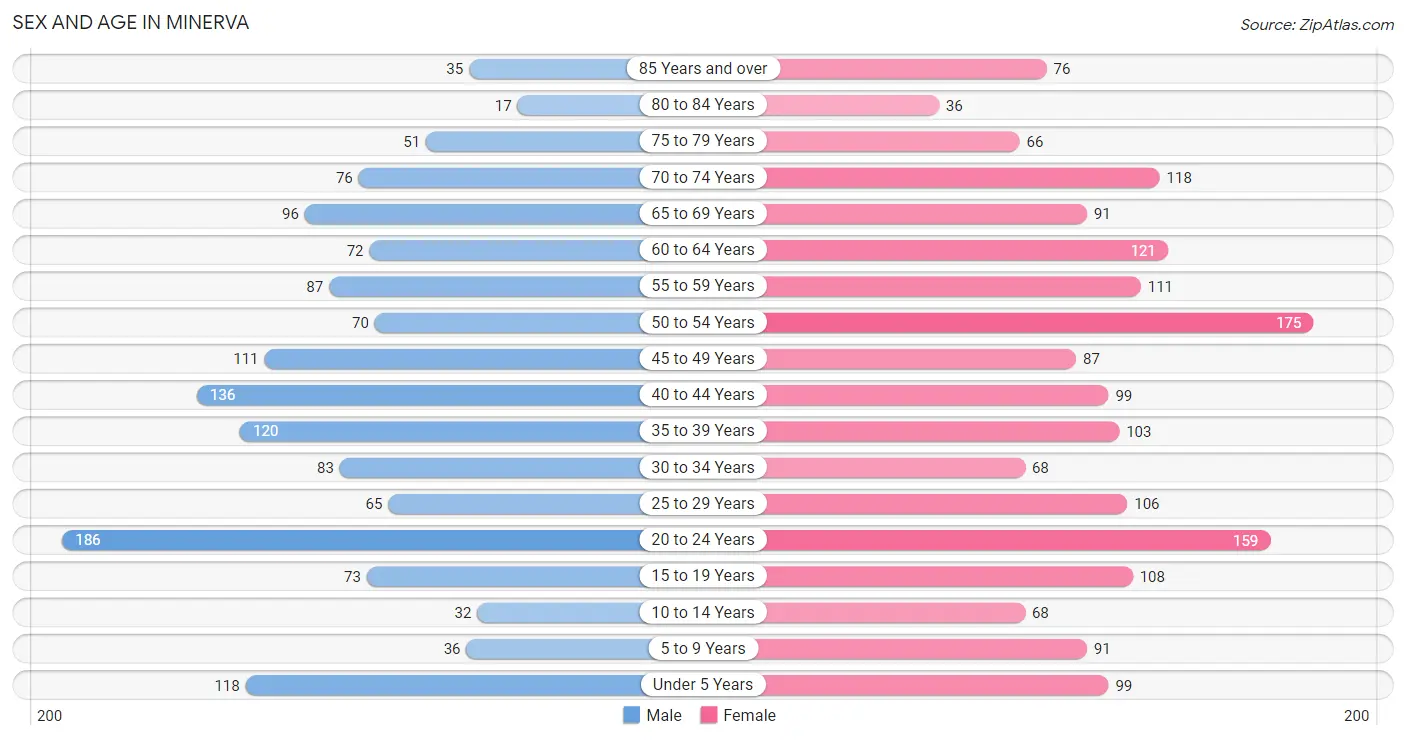
The most populous age groups in Minerva are 20 to 24 Years (186 | 12.7%) for men and 50 to 54 Years (175 | 9.8%) for women.
| Age Bracket | Male | Female |
| Under 5 Years | 118 (8.1%) | 99 (5.6%) |
| 5 to 9 Years | 36 (2.5%) | 91 (5.1%) |
| 10 to 14 Years | 32 (2.2%) | 68 (3.8%) |
| 15 to 19 Years | 73 (5.0%) | 108 (6.1%) |
| 20 to 24 Years | 186 (12.7%) | 159 (8.9%) |
| 25 to 29 Years | 65 (4.4%) | 106 (5.9%) |
| 30 to 34 Years | 83 (5.7%) | 68 (3.8%) |
| 35 to 39 Years | 120 (8.2%) | 103 (5.8%) |
| 40 to 44 Years | 136 (9.3%) | 99 (5.6%) |
| 45 to 49 Years | 111 (7.6%) | 87 (4.9%) |
| 50 to 54 Years | 70 (4.8%) | 175 (9.8%) |
| 55 to 59 Years | 87 (5.9%) | 111 (6.2%) |
| 60 to 64 Years | 72 (4.9%) | 121 (6.8%) |
| 65 to 69 Years | 96 (6.6%) | 91 (5.1%) |
| 70 to 74 Years | 76 (5.2%) | 118 (6.6%) |
| 75 to 79 Years | 51 (3.5%) | 66 (3.7%) |
| 80 to 84 Years | 17 (1.2%) | 36 (2.0%) |
| 85 Years and over | 35 (2.4%) | 76 (4.3%) |
| Total | 1,464 (100.0%) | 1,782 (100.0%) |
Families and Households in Minerva
Median Family Size in Minerva
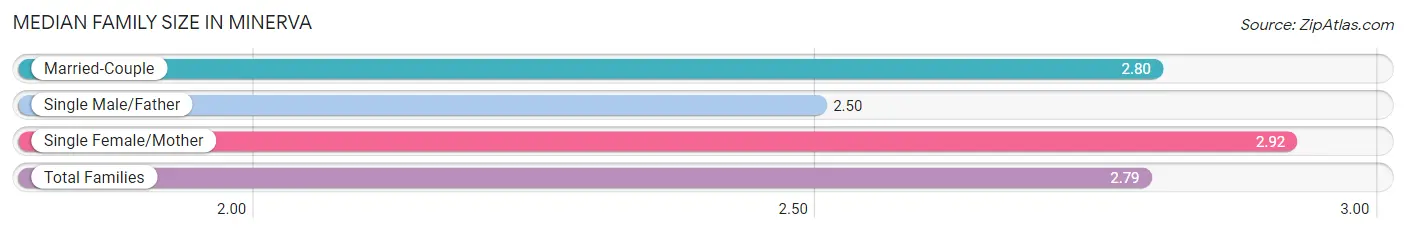
The median family size in Minerva is 2.79 persons per family, with single female/mother families (143 | 19.3%) accounting for the largest median family size of 2.92 persons per family. On the other hand, single male/father families (86 | 11.6%) represent the smallest median family size with 2.50 persons per family.
| Family Type | # Families | Family Size |
| Married-Couple | 511 (69.1%) | 2.80 |
| Single Male/Father | 86 (11.6%) | 2.50 |
| Single Female/Mother | 143 (19.3%) | 2.92 |
| Total Families | 740 (100.0%) | 2.79 |
Median Household Size in Minerva
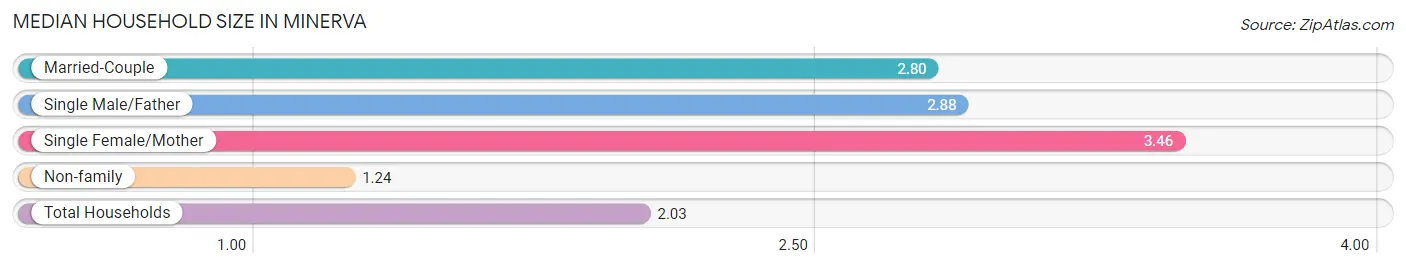
The median household size in Minerva is 2.03 persons per household, with single female/mother households (143 | 9.0%) accounting for the largest median household size of 3.46 persons per household. non-family households (840 | 53.2%) represent the smallest median household size with 1.24 persons per household.
| Household Type | # Households | Household Size |
| Married-Couple | 511 (32.3%) | 2.80 |
| Single Male/Father | 86 (5.4%) | 2.88 |
| Single Female/Mother | 143 (9.0%) | 3.46 |
| Non-family | 840 (53.2%) | 1.24 |
| Total Households | 1,580 (100.0%) | 2.03 |
Household Size by Marriage Status in Minerva
Out of a total of 1,580 households in Minerva, 740 (46.8%) are family households, while 840 (53.2%) are nonfamily households. The most numerous type of family households are 2-person households, comprising 316, and the most common type of nonfamily households are 1-person households, comprising 644.
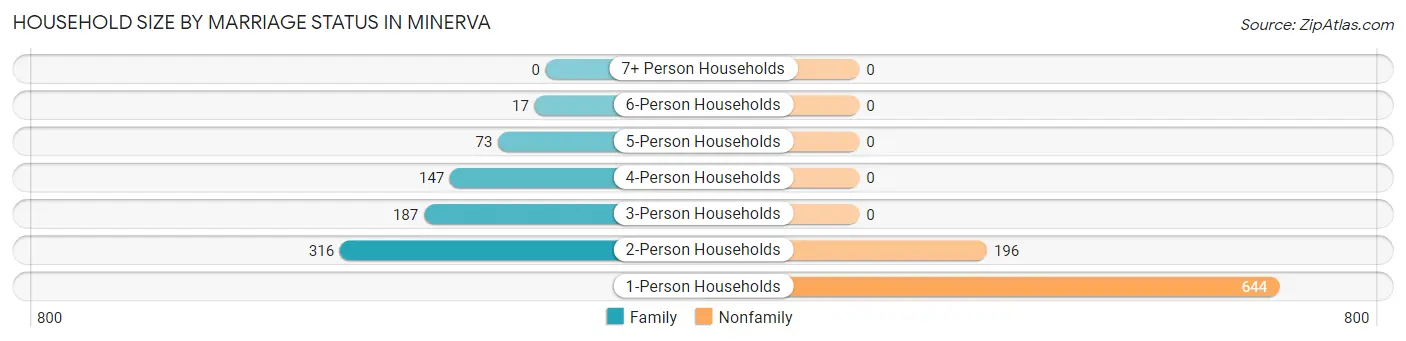
| Household Size | Family Households | Nonfamily Households |
| 1-Person Households | - | 644 (40.8%) |
| 2-Person Households | 316 (20.0%) | 196 (12.4%) |
| 3-Person Households | 187 (11.8%) | 0 (0.0%) |
| 4-Person Households | 147 (9.3%) | 0 (0.0%) |
| 5-Person Households | 73 (4.6%) | 0 (0.0%) |
| 6-Person Households | 17 (1.1%) | 0 (0.0%) |
| 7+ Person Households | 0 (0.0%) | 0 (0.0%) |
| Total | 740 (46.8%) | 840 (53.2%) |
Female Fertility in Minerva
Fertility by Age in Minerva
Average fertility rate in Minerva is 57.0 births per 1,000 women. Women in the age bracket of 20 to 34 years have the highest fertility rate with 129.0 births per 1,000 women. Women in the age bracket of 20 to 34 years acount for 100.0% of all women with births.
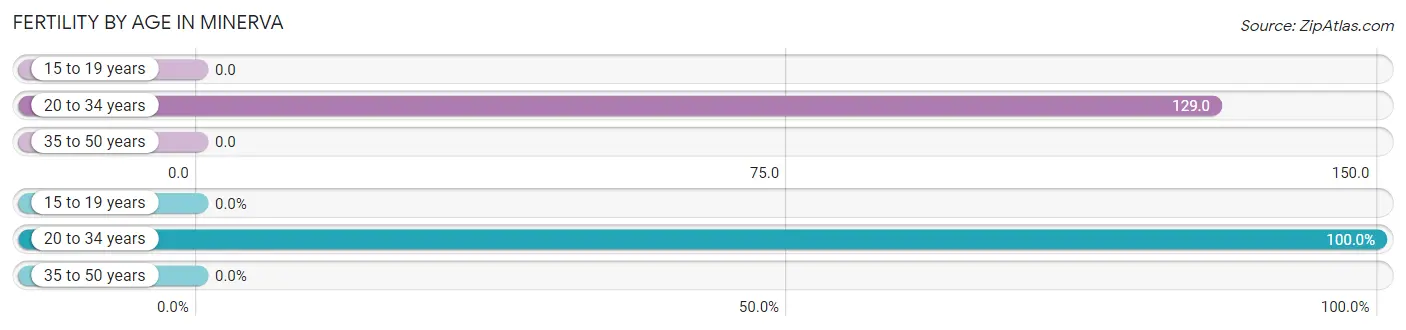
| Age Bracket | Women with Births | Births / 1,000 Women |
| 15 to 19 years | 0 (0.0%) | 0.0 |
| 20 to 34 years | 43 (100.0%) | 129.0 |
| 35 to 50 years | 0 (0.0%) | 0.0 |
| Total | 43 (100.0%) | 57.0 |
Fertility by Age by Marriage Status in Minerva
62.8% of women with births (43) in Minerva are married. The highest percentage of unmarried women with births falls into 20 to 34 years age bracket with 37.2% of them unmarried at the time of birth, while the lowest percentage of unmarried women with births belong to 20 to 34 years age bracket with 37.2% of them unmarried.
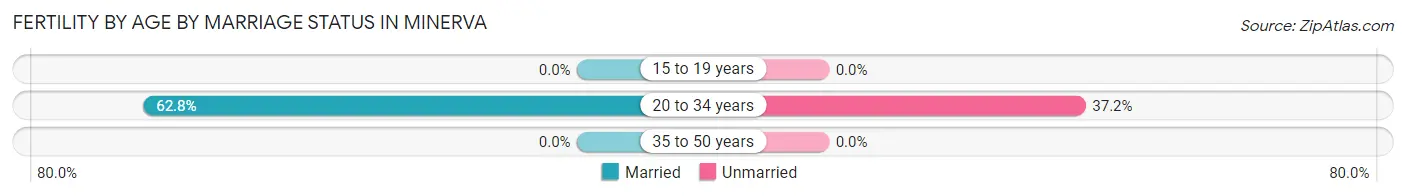
| Age Bracket | Married | Unmarried |
| 15 to 19 years | 0 (0.0%) | 0 (0.0%) |
| 20 to 34 years | 27 (62.8%) | 16 (37.2%) |
| 35 to 50 years | 0 (0.0%) | 0 (0.0%) |
| Total | 27 (62.8%) | 16 (37.2%) |
Fertility by Education in Minerva
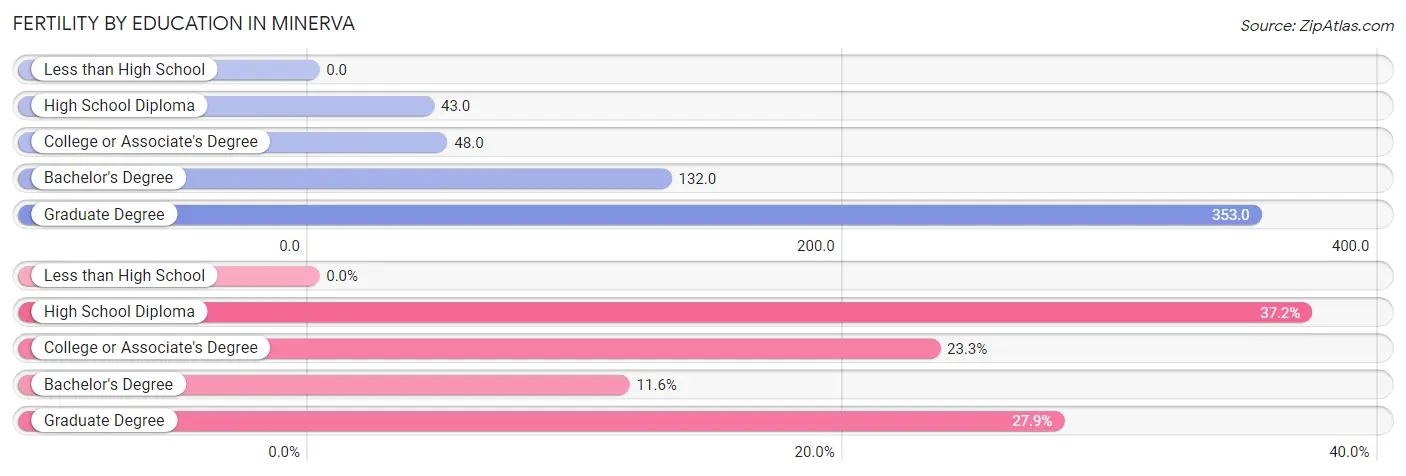
| Educational Attainment | Women with Births | Births / 1,000 Women |
| Less than High School | 0 (0.0%) | 0.0 |
| High School Diploma | 16 (37.2%) | 43.0 |
| College or Associate's Degree | 10 (23.3%) | 48.0 |
| Bachelor's Degree | 5 (11.6%) | 132.0 |
| Graduate Degree | 12 (27.9%) | 353.0 |
| Total | 43 (100.0%) | 57.0 |
Fertility by Education by Marriage Status in Minerva
37.2% of women with births in Minerva are unmarried. Women with the educational attainment of college or associate's degree are most likely to be married with 100.0% of them married at childbirth, while women with the educational attainment of high school diploma are least likely to be married with 100.0% of them unmarried at childbirth.
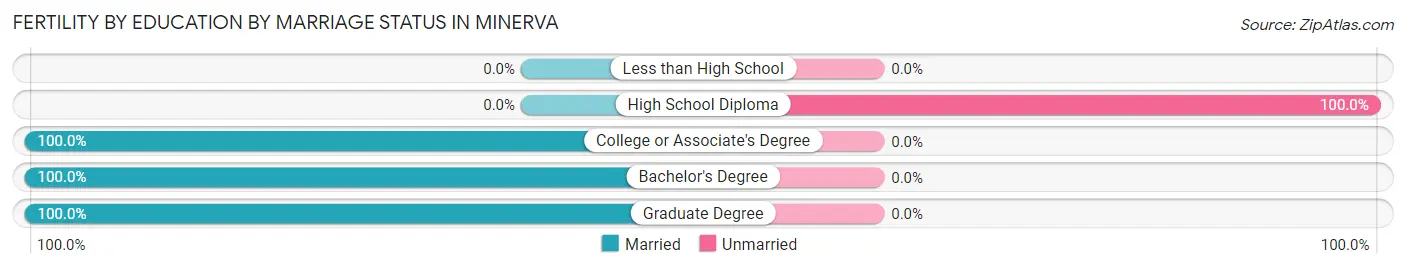
| Educational Attainment | Married | Unmarried |
| Less than High School | 0 (0.0%) | 0 (0.0%) |
| High School Diploma | 0 (0.0%) | 16 (100.0%) |
| College or Associate's Degree | 10 (100.0%) | 0 (0.0%) |
| Bachelor's Degree | 5 (100.0%) | 0 (0.0%) |
| Graduate Degree | 12 (100.0%) | 0 (0.0%) |
| Total | 27 (62.8%) | 16 (37.2%) |
Employment Characteristics in Minerva
Employment by Class of Employer in Minerva
Among the 1,738 employed individuals in Minerva, private company employees (1,308 | 75.3%), local government employees (130 | 7.5%), and not-for-profit organizations (119 | 6.9%) make up the most common classes of employment.
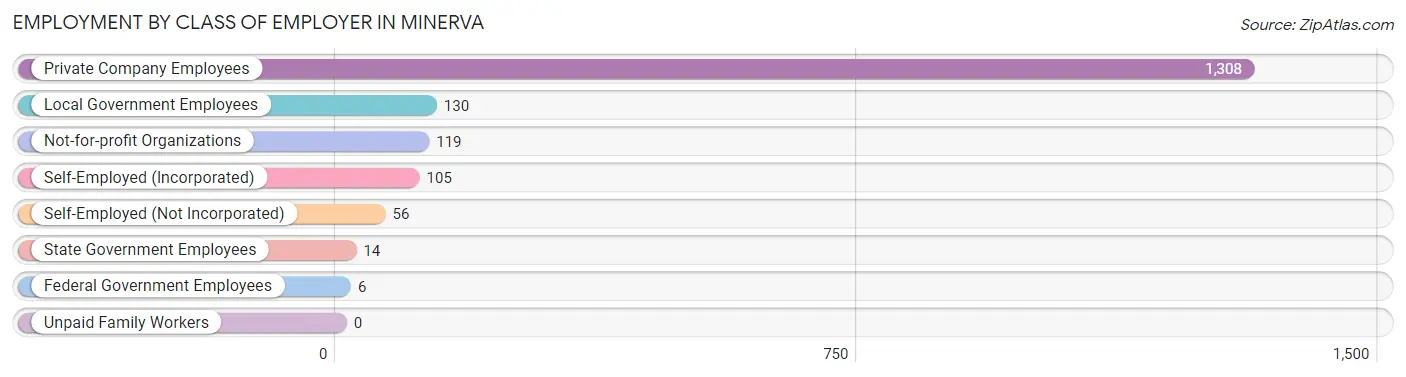
| Employer Class | # Employees | % Employees |
| Private Company Employees | 1,308 | 75.3% |
| Self-Employed (Incorporated) | 105 | 6.0% |
| Self-Employed (Not Incorporated) | 56 | 3.2% |
| Not-for-profit Organizations | 119 | 6.9% |
| Local Government Employees | 130 | 7.5% |
| State Government Employees | 14 | 0.8% |
| Federal Government Employees | 6 | 0.4% |
| Unpaid Family Workers | 0 | 0.0% |
| Total | 1,738 | 100.0% |
Employment Status by Age in Minerva
According to the labor force statistics for Minerva, out of the total population over 16 years of age (2,795), 65.5% or 1,831 individuals are in the labor force, with 3.0% or 55 of them unemployed. The age group with the highest labor force participation rate is 20 to 24 years, with 91.3% or 315 individuals in the labor force. Within the labor force, the 16 to 19 years age range has the highest percentage of unemployed individuals, with 17.4% or 23 of them being unemployed.
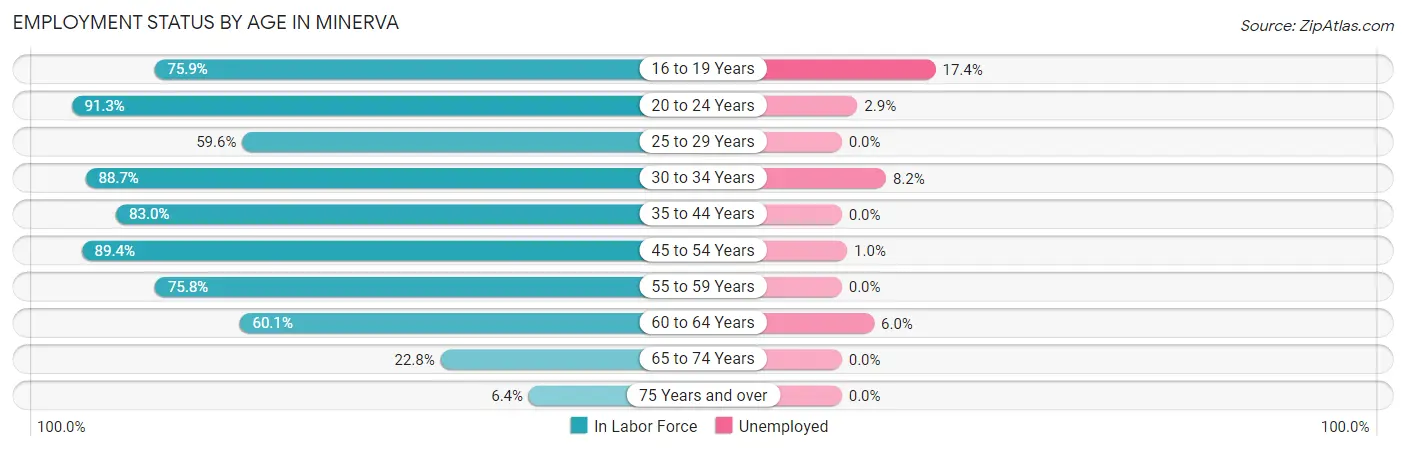
| Age Bracket | In Labor Force | Unemployed |
| 16 to 19 Years | 132 (75.9%) | 23 (17.4%) |
| 20 to 24 Years | 315 (91.3%) | 9 (2.9%) |
| 25 to 29 Years | 102 (59.6%) | 0 (0.0%) |
| 30 to 34 Years | 134 (88.7%) | 11 (8.2%) |
| 35 to 44 Years | 380 (83.0%) | 0 (0.0%) |
| 45 to 54 Years | 396 (89.4%) | 4 (1.0%) |
| 55 to 59 Years | 150 (75.8%) | 0 (0.0%) |
| 60 to 64 Years | 116 (60.1%) | 7 (6.0%) |
| 65 to 74 Years | 87 (22.8%) | 0 (0.0%) |
| 75 Years and over | 18 (6.4%) | 0 (0.0%) |
| Total | 1,831 (65.5%) | 55 (3.0%) |
Employment Status by Educational Attainment in Minerva
According to labor force statistics for Minerva, 79.2% of individuals (1,278) out of the total population between 25 and 64 years of age (1,614) are in the labor force, with 1.7% or 22 of them being unemployed. The group with the highest labor force participation rate are those with the educational attainment of bachelor's degree or higher, with 91.6% or 141 individuals in the labor force. Within the labor force, individuals with high school diploma education have the highest percentage of unemployment, with 2.5% or 18 of them being unemployed.
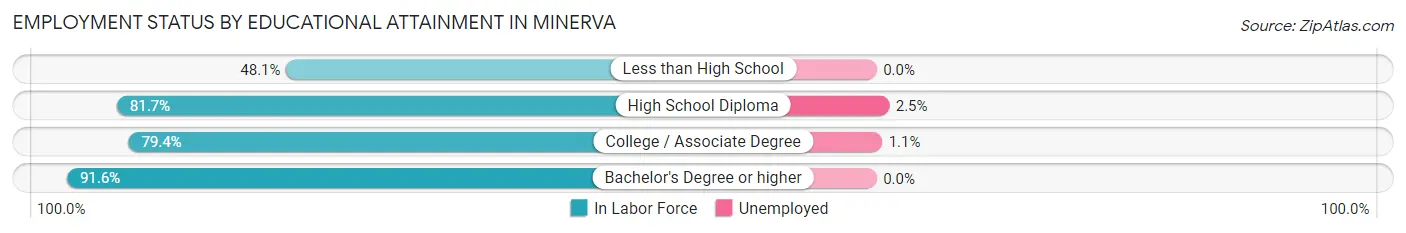
| Educational Attainment | In Labor Force | Unemployed |
| Less than High School | 65 (48.1%) | 0 (0.0%) |
| High School Diploma | 717 (81.7%) | 22 (2.5%) |
| College / Associate Degree | 355 (79.4%) | 5 (1.1%) |
| Bachelor's Degree or higher | 141 (91.6%) | 0 (0.0%) |
| Total | 1,278 (79.2%) | 27 (1.7%) |
Employment Occupations by Sex in Minerva
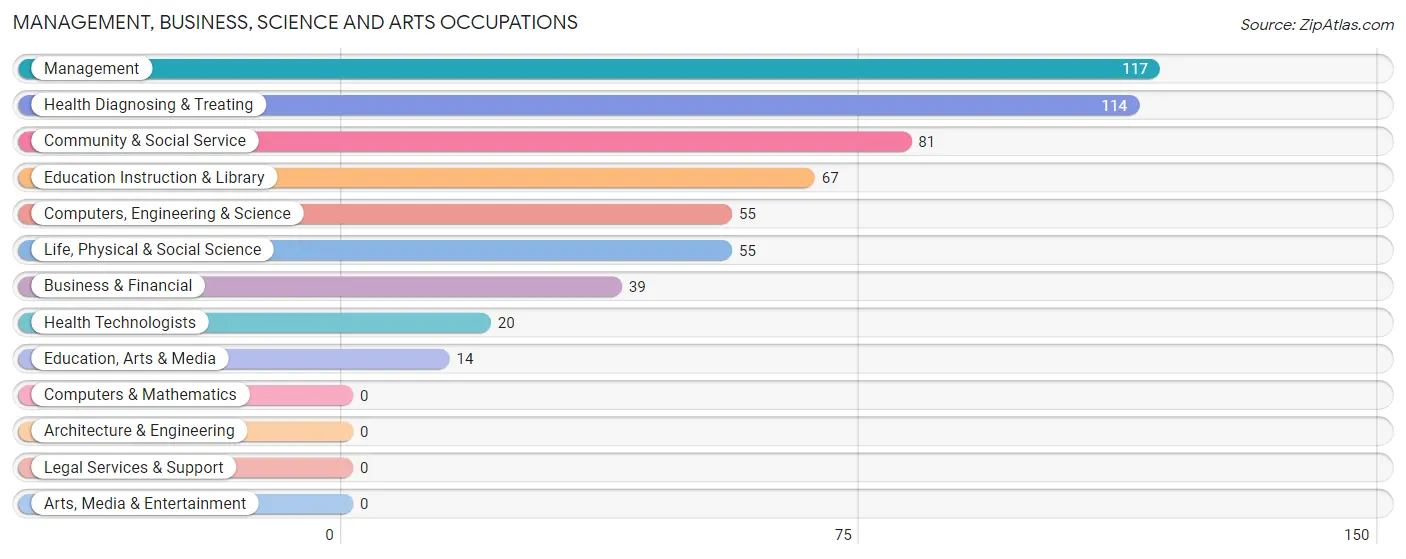
Management, Business, Science and Arts Occupations
The most common Management, Business, Science and Arts occupations in Minerva are Management (117 | 6.6%), Health Diagnosing & Treating (114 | 6.4%), Community & Social Service (81 | 4.6%), Education Instruction & Library (67 | 3.8%), and Computers, Engineering & Science (55 | 3.1%).
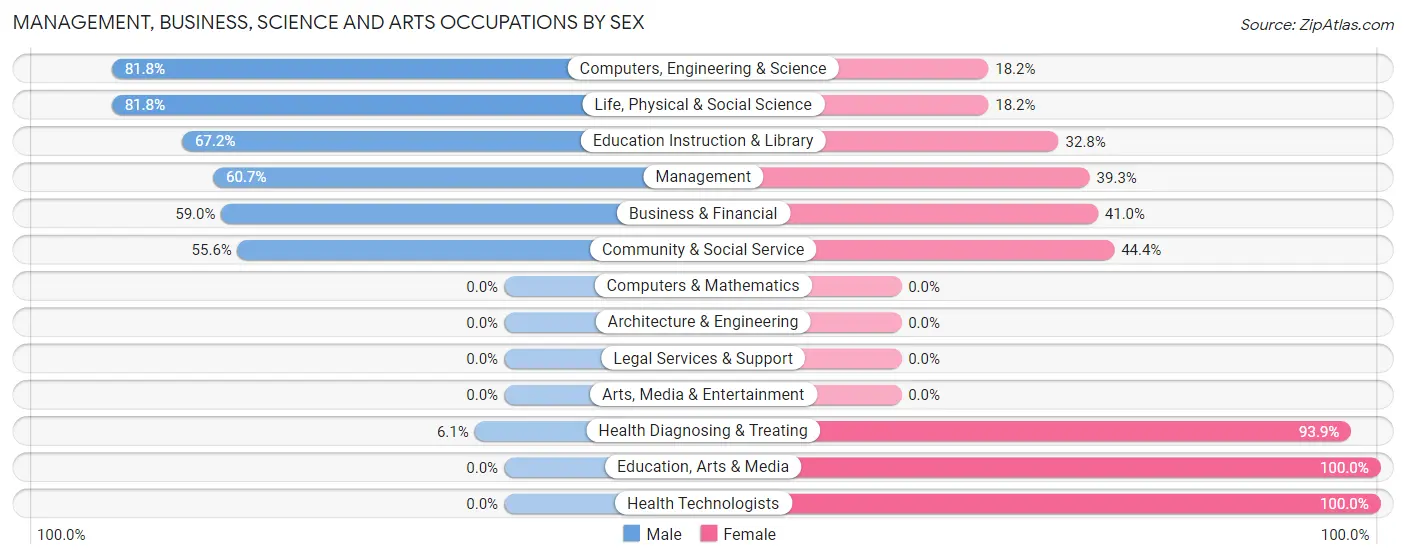
Management, Business, Science and Arts Occupations by Sex
Within the Management, Business, Science and Arts occupations in Minerva, the most male-oriented occupations are Computers, Engineering & Science (81.8%), Life, Physical & Social Science (81.8%), and Education Instruction & Library (67.2%), while the most female-oriented occupations are Education, Arts & Media (100.0%), Health Technologists (100.0%), and Health Diagnosing & Treating (93.9%).
| Occupation | Male | Female |
| Management | 71 (60.7%) | 46 (39.3%) |
| Business & Financial | 23 (59.0%) | 16 (41.0%) |
| Computers, Engineering & Science | 45 (81.8%) | 10 (18.2%) |
| Computers & Mathematics | 0 (0.0%) | 0 (0.0%) |
| Architecture & Engineering | 0 (0.0%) | 0 (0.0%) |
| Life, Physical & Social Science | 45 (81.8%) | 10 (18.2%) |
| Community & Social Service | 45 (55.6%) | 36 (44.4%) |
| Education, Arts & Media | 0 (0.0%) | 14 (100.0%) |
| Legal Services & Support | 0 (0.0%) | 0 (0.0%) |
| Education Instruction & Library | 45 (67.2%) | 22 (32.8%) |
| Arts, Media & Entertainment | 0 (0.0%) | 0 (0.0%) |
| Health Diagnosing & Treating | 7 (6.1%) | 107 (93.9%) |
| Health Technologists | 0 (0.0%) | 20 (100.0%) |
| Total (Category) | 191 (47.0%) | 215 (53.0%) |
| Total (Overall) | 899 (50.6%) | 877 (49.4%) |
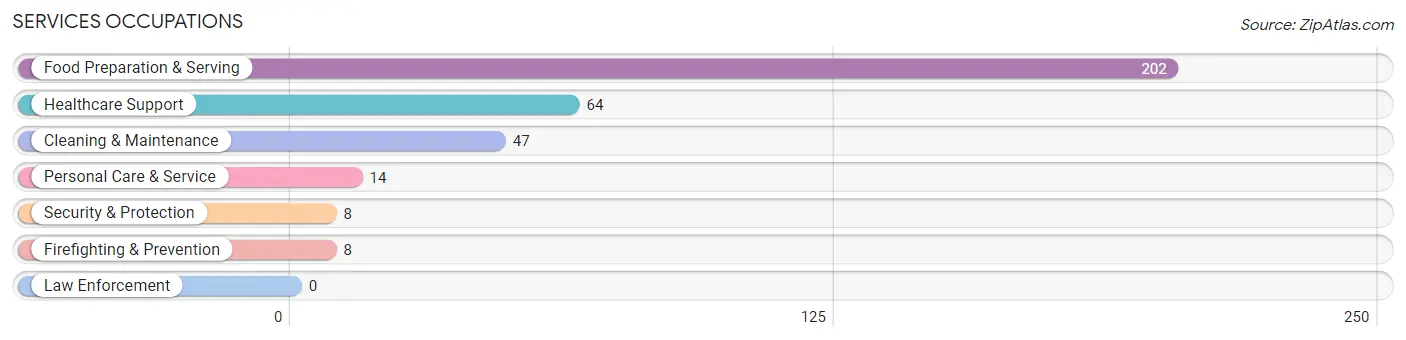
Services Occupations
The most common Services occupations in Minerva are Food Preparation & Serving (202 | 11.4%), Healthcare Support (64 | 3.6%), Cleaning & Maintenance (47 | 2.6%), Personal Care & Service (14 | 0.8%), and Security & Protection (8 | 0.4%).
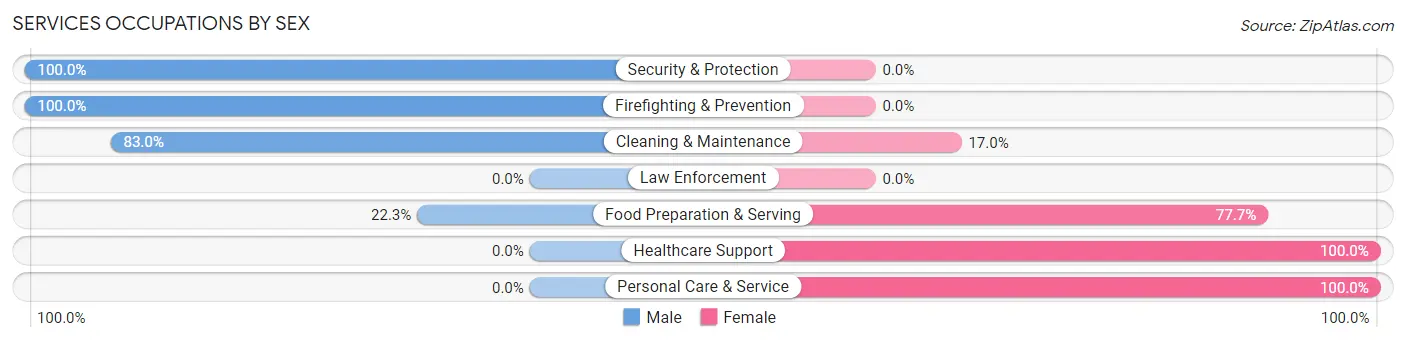
Services Occupations by Sex
Within the Services occupations in Minerva, the most male-oriented occupations are Security & Protection (100.0%), Firefighting & Prevention (100.0%), and Cleaning & Maintenance (83.0%), while the most female-oriented occupations are Healthcare Support (100.0%), Personal Care & Service (100.0%), and Food Preparation & Serving (77.7%).
| Occupation | Male | Female |
| Healthcare Support | 0 (0.0%) | 64 (100.0%) |
| Security & Protection | 8 (100.0%) | 0 (0.0%) |
| Firefighting & Prevention | 8 (100.0%) | 0 (0.0%) |
| Law Enforcement | 0 (0.0%) | 0 (0.0%) |
| Food Preparation & Serving | 45 (22.3%) | 157 (77.7%) |
| Cleaning & Maintenance | 39 (83.0%) | 8 (17.0%) |
| Personal Care & Service | 0 (0.0%) | 14 (100.0%) |
| Total (Category) | 92 (27.5%) | 243 (72.5%) |
| Total (Overall) | 899 (50.6%) | 877 (49.4%) |
Sales and Office Occupations
The most common Sales and Office occupations in Minerva are Office & Administration (103 | 5.8%), and Sales & Related (77 | 4.3%).
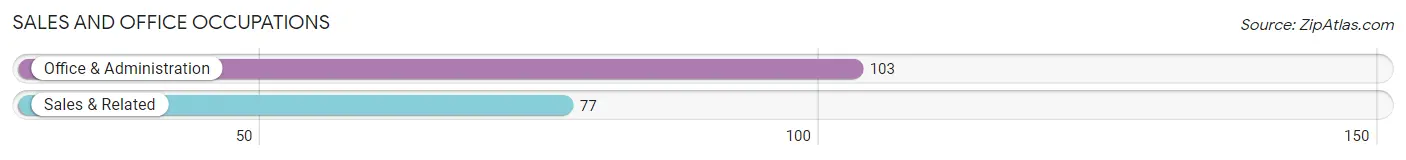
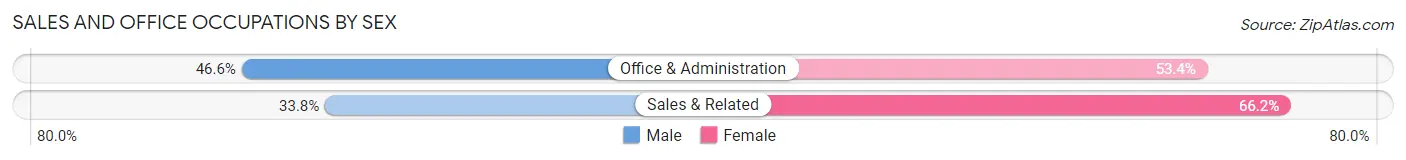
Sales and Office Occupations by Sex
| Occupation | Male | Female |
| Sales & Related | 26 (33.8%) | 51 (66.2%) |
| Office & Administration | 48 (46.6%) | 55 (53.4%) |
| Total (Category) | 74 (41.1%) | 106 (58.9%) |
| Total (Overall) | 899 (50.6%) | 877 (49.4%) |
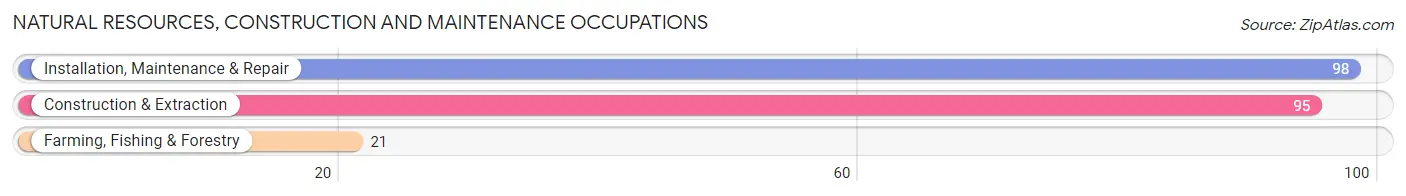
Natural Resources, Construction and Maintenance Occupations
The most common Natural Resources, Construction and Maintenance occupations in Minerva are Installation, Maintenance & Repair (98 | 5.5%), Construction & Extraction (95 | 5.3%), and Farming, Fishing & Forestry (21 | 1.2%).
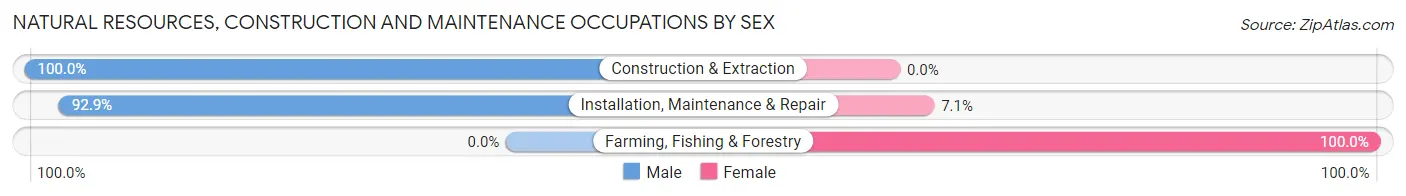
Natural Resources, Construction and Maintenance Occupations by Sex
| Occupation | Male | Female |
| Farming, Fishing & Forestry | 0 (0.0%) | 21 (100.0%) |
| Construction & Extraction | 95 (100.0%) | 0 (0.0%) |
| Installation, Maintenance & Repair | 91 (92.9%) | 7 (7.1%) |
| Total (Category) | 186 (86.9%) | 28 (13.1%) |
| Total (Overall) | 899 (50.6%) | 877 (49.4%) |
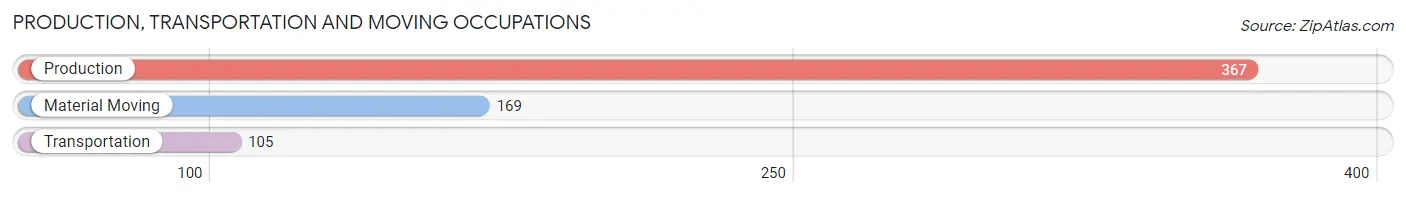
Production, Transportation and Moving Occupations
The most common Production, Transportation and Moving occupations in Minerva are Production (367 | 20.7%), Material Moving (169 | 9.5%), and Transportation (105 | 5.9%).
Production, Transportation and Moving Occupations by Sex
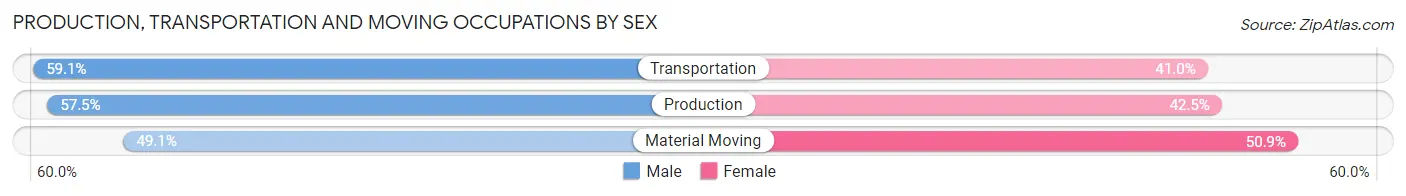
| Occupation | Male | Female |
| Production | 211 (57.5%) | 156 (42.5%) |
| Transportation | 62 (59.1%) | 43 (40.9%) |
| Material Moving | 83 (49.1%) | 86 (50.9%) |
| Total (Category) | 356 (55.5%) | 285 (44.5%) |
| Total (Overall) | 899 (50.6%) | 877 (49.4%) |
Employment Industries by Sex in Minerva
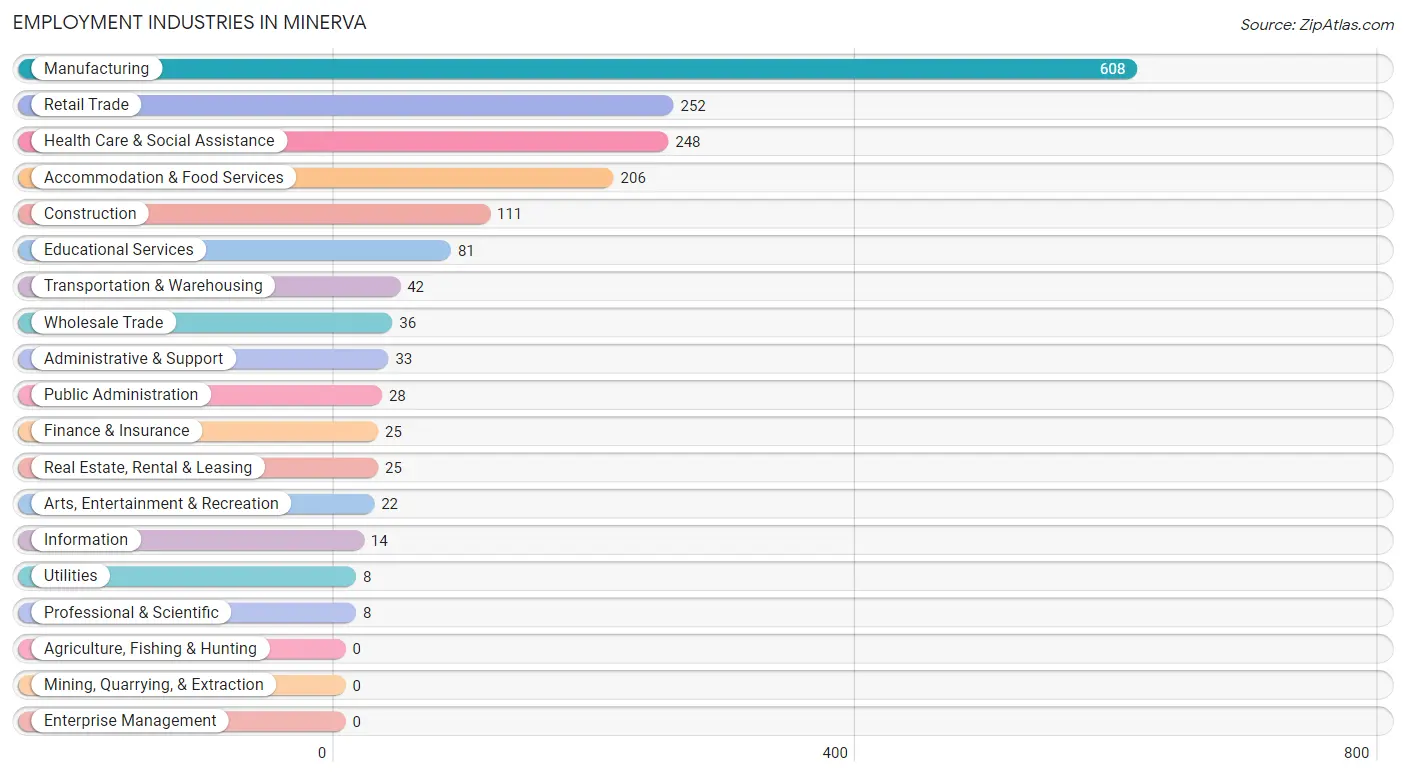
Employment Industries in Minerva
The major employment industries in Minerva include Manufacturing (608 | 34.2%), Retail Trade (252 | 14.2%), Health Care & Social Assistance (248 | 14.0%), Accommodation & Food Services (206 | 11.6%), and Construction (111 | 6.2%).
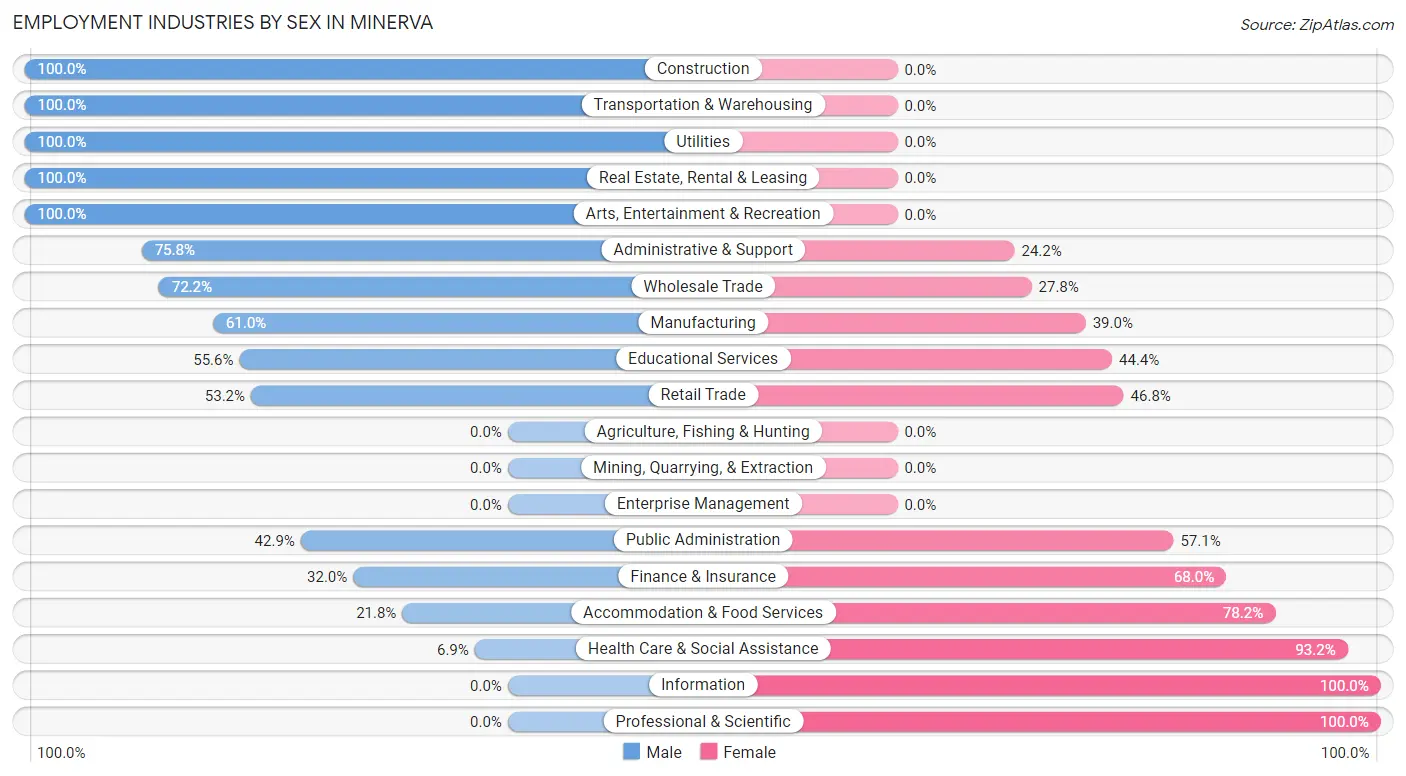
Employment Industries by Sex in Minerva
The Minerva industries that see more men than women are Construction (100.0%), Transportation & Warehousing (100.0%), and Utilities (100.0%), whereas the industries that tend to have a higher number of women are Information (100.0%), Professional & Scientific (100.0%), and Health Care & Social Assistance (93.1%).
| Industry | Male | Female |
| Agriculture, Fishing & Hunting | 0 (0.0%) | 0 (0.0%) |
| Mining, Quarrying, & Extraction | 0 (0.0%) | 0 (0.0%) |
| Construction | 111 (100.0%) | 0 (0.0%) |
| Manufacturing | 371 (61.0%) | 237 (39.0%) |
| Wholesale Trade | 26 (72.2%) | 10 (27.8%) |
| Retail Trade | 134 (53.2%) | 118 (46.8%) |
| Transportation & Warehousing | 42 (100.0%) | 0 (0.0%) |
| Utilities | 8 (100.0%) | 0 (0.0%) |
| Information | 0 (0.0%) | 14 (100.0%) |
| Finance & Insurance | 8 (32.0%) | 17 (68.0%) |
| Real Estate, Rental & Leasing | 25 (100.0%) | 0 (0.0%) |
| Professional & Scientific | 0 (0.0%) | 8 (100.0%) |
| Enterprise Management | 0 (0.0%) | 0 (0.0%) |
| Administrative & Support | 25 (75.8%) | 8 (24.2%) |
| Educational Services | 45 (55.6%) | 36 (44.4%) |
| Health Care & Social Assistance | 17 (6.9%) | 231 (93.1%) |
| Arts, Entertainment & Recreation | 22 (100.0%) | 0 (0.0%) |
| Accommodation & Food Services | 45 (21.8%) | 161 (78.2%) |
| Public Administration | 12 (42.9%) | 16 (57.1%) |
| Total | 899 (50.6%) | 877 (49.4%) |
Education in Minerva
School Enrollment in Minerva
The most common levels of schooling among the 475 students in Minerva are college / undergraduate (134 | 28.2%), elementary school (103 | 21.7%), and high school (102 | 21.5%).
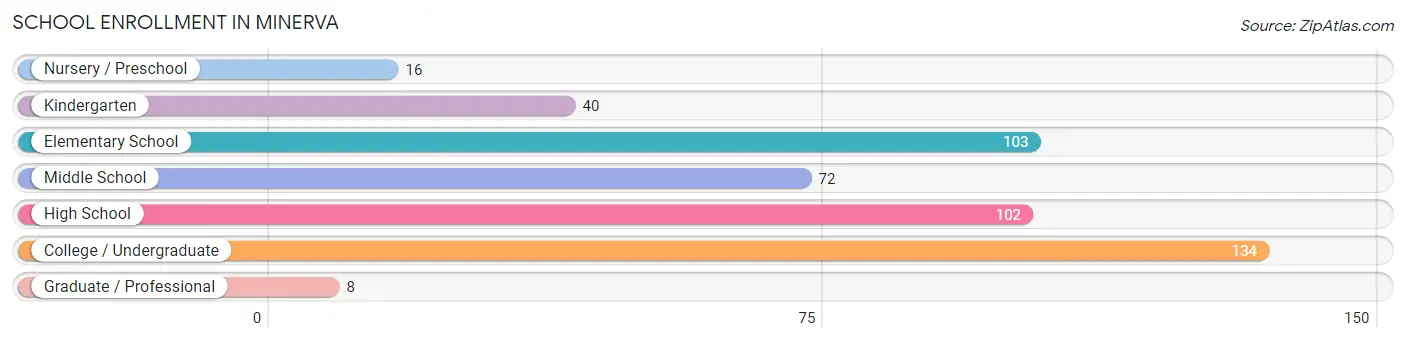
| School Level | # Students | % Students |
| Nursery / Preschool | 16 | 3.4% |
| Kindergarten | 40 | 8.4% |
| Elementary School | 103 | 21.7% |
| Middle School | 72 | 15.2% |
| High School | 102 | 21.5% |
| College / Undergraduate | 134 | 28.2% |
| Graduate / Professional | 8 | 1.7% |
| Total | 475 | 100.0% |
School Enrollment by Age by Funding Source in Minerva
Out of a total of 475 students who are enrolled in schools in Minerva, 111 (23.4%) attend a private institution, while the remaining 364 (76.6%) are enrolled in public schools. The age group of 25 to 34 year olds has the highest likelihood of being enrolled in private schools, with 8 (100.0% in the age bracket) enrolled. Conversely, the age group of 3 to 4 year olds has the lowest likelihood of being enrolled in a private school, with 16 (100.0% in the age bracket) attending a public institution.
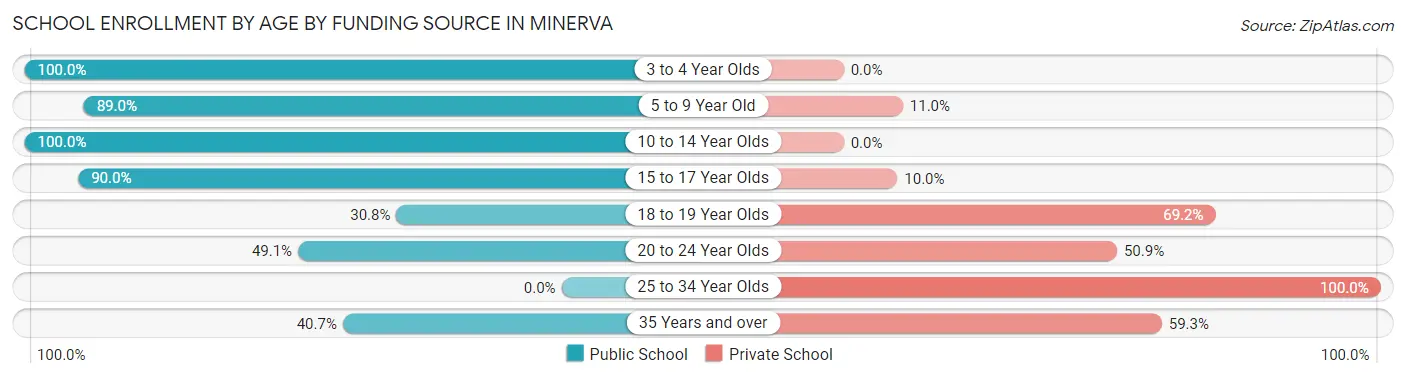
| Age Bracket | Public School | Private School |
| 3 to 4 Year Olds | 16 (100.0%) | 0 (0.0%) |
| 5 to 9 Year Old | 113 (89.0%) | 14 (11.0%) |
| 10 to 14 Year Olds | 100 (100.0%) | 0 (0.0%) |
| 15 to 17 Year Olds | 81 (90.0%) | 9 (10.0%) |
| 18 to 19 Year Olds | 16 (30.8%) | 36 (69.2%) |
| 20 to 24 Year Olds | 27 (49.1%) | 28 (50.9%) |
| 25 to 34 Year Olds | 0 (0.0%) | 8 (100.0%) |
| 35 Years and over | 11 (40.7%) | 16 (59.3%) |
| Total | 364 (76.6%) | 111 (23.4%) |
Educational Attainment by Field of Study in Minerva
Education (78 | 33.6%), business (40 | 17.2%), bio, nature & agricultural (27 | 11.6%), social sciences (26 | 11.2%), and science & technology (21 | 9.0%) are the most common fields of study among 232 individuals in Minerva who have obtained a bachelor's degree or higher.
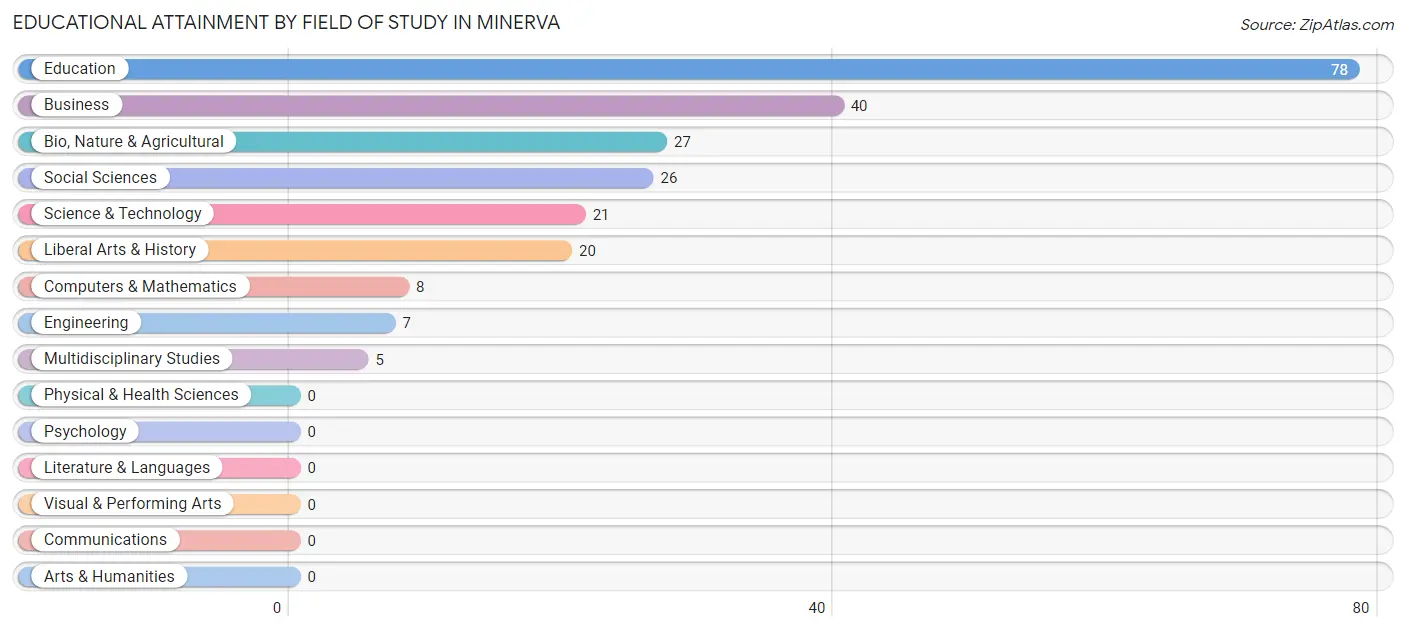
| Field of Study | # Graduates | % Graduates |
| Computers & Mathematics | 8 | 3.5% |
| Bio, Nature & Agricultural | 27 | 11.6% |
| Physical & Health Sciences | 0 | 0.0% |
| Psychology | 0 | 0.0% |
| Social Sciences | 26 | 11.2% |
| Engineering | 7 | 3.0% |
| Multidisciplinary Studies | 5 | 2.2% |
| Science & Technology | 21 | 9.0% |
| Business | 40 | 17.2% |
| Education | 78 | 33.6% |
| Literature & Languages | 0 | 0.0% |
| Liberal Arts & History | 20 | 8.6% |
| Visual & Performing Arts | 0 | 0.0% |
| Communications | 0 | 0.0% |
| Arts & Humanities | 0 | 0.0% |
| Total | 232 | 100.0% |
Transportation & Commute in Minerva
Vehicle Availability by Sex in Minerva
The most prevalent vehicle ownership categories in Minerva are males with 2 vehicles (400, accounting for 46.0%) and females with 2 vehicles (389, making up 46.0%).
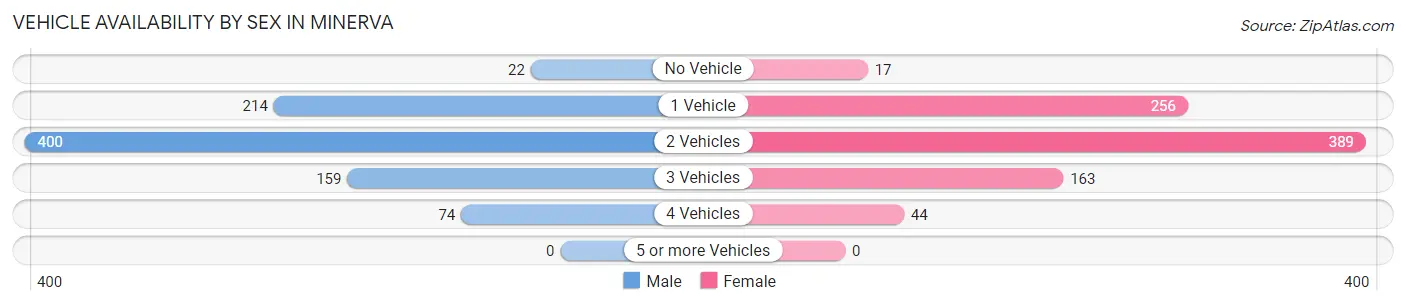
| Vehicles Available | Male | Female |
| No Vehicle | 22 (2.5%) | 17 (2.0%) |
| 1 Vehicle | 214 (24.6%) | 256 (29.5%) |
| 2 Vehicles | 400 (46.0%) | 389 (44.8%) |
| 3 Vehicles | 159 (18.3%) | 163 (18.8%) |
| 4 Vehicles | 74 (8.5%) | 44 (5.1%) |
| 5 or more Vehicles | 0 (0.0%) | 0 (0.0%) |
| Total | 869 (100.0%) | 869 (100.0%) |
Commute Time in Minerva
The most frequently occuring commute durations in Minerva are 5 to 9 minutes (465 commuters, 27.1%), less than 5 minutes (350 commuters, 20.4%), and 25 to 29 minutes (203 commuters, 11.8%).
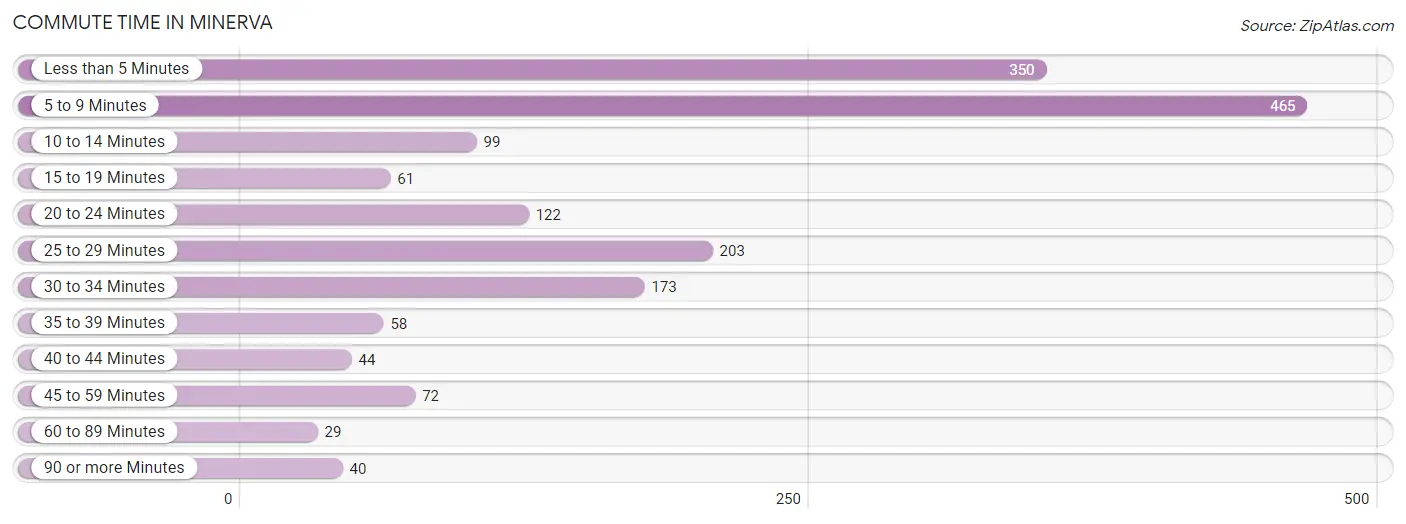
| Commute Time | # Commuters | % Commuters |
| Less than 5 Minutes | 350 | 20.4% |
| 5 to 9 Minutes | 465 | 27.1% |
| 10 to 14 Minutes | 99 | 5.8% |
| 15 to 19 Minutes | 61 | 3.5% |
| 20 to 24 Minutes | 122 | 7.1% |
| 25 to 29 Minutes | 203 | 11.8% |
| 30 to 34 Minutes | 173 | 10.1% |
| 35 to 39 Minutes | 58 | 3.4% |
| 40 to 44 Minutes | 44 | 2.6% |
| 45 to 59 Minutes | 72 | 4.2% |
| 60 to 89 Minutes | 29 | 1.7% |
| 90 or more Minutes | 40 | 2.3% |
Commute Time by Sex in Minerva
The most common commute times in Minerva are 5 to 9 minutes (206 commuters, 23.7%) for males and 5 to 9 minutes (259 commuters, 30.6%) for females.
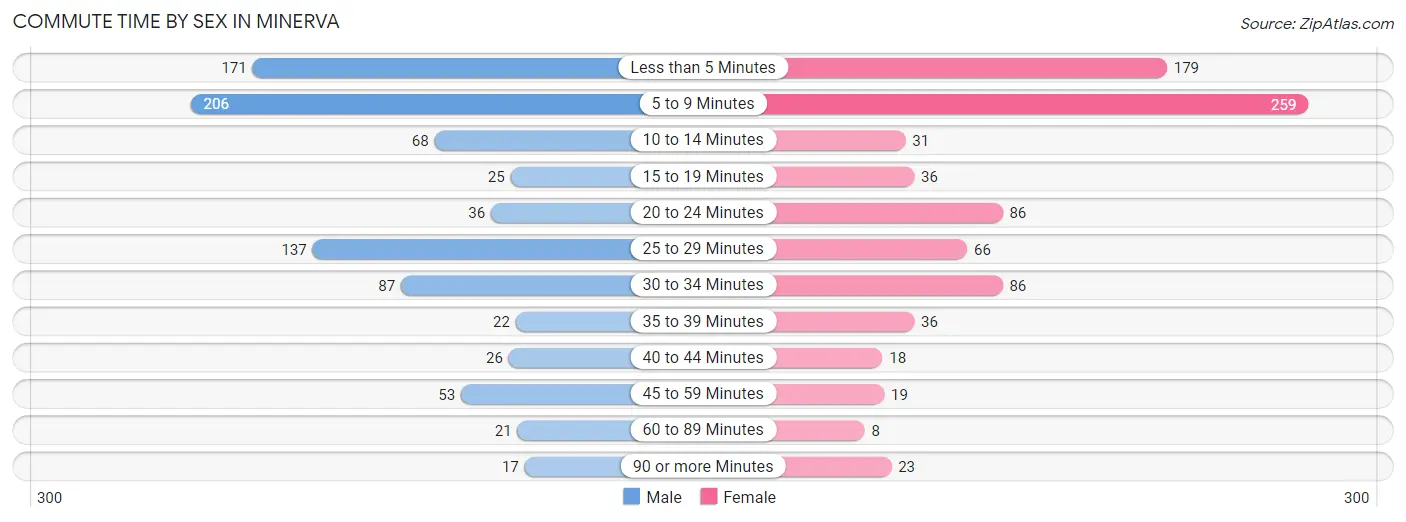
| Commute Time | Male | Female |
| Less than 5 Minutes | 171 (19.7%) | 179 (21.1%) |
| 5 to 9 Minutes | 206 (23.7%) | 259 (30.6%) |
| 10 to 14 Minutes | 68 (7.8%) | 31 (3.7%) |
| 15 to 19 Minutes | 25 (2.9%) | 36 (4.3%) |
| 20 to 24 Minutes | 36 (4.1%) | 86 (10.2%) |
| 25 to 29 Minutes | 137 (15.8%) | 66 (7.8%) |
| 30 to 34 Minutes | 87 (10.0%) | 86 (10.2%) |
| 35 to 39 Minutes | 22 (2.5%) | 36 (4.3%) |
| 40 to 44 Minutes | 26 (3.0%) | 18 (2.1%) |
| 45 to 59 Minutes | 53 (6.1%) | 19 (2.2%) |
| 60 to 89 Minutes | 21 (2.4%) | 8 (0.9%) |
| 90 or more Minutes | 17 (2.0%) | 23 (2.7%) |
Time of Departure to Work by Sex in Minerva
The most frequent times of departure to work in Minerva are 12:00 AM to 4:59 AM (150, 17.3%) for males and 7:30 AM to 7:59 AM (182, 21.5%) for females.
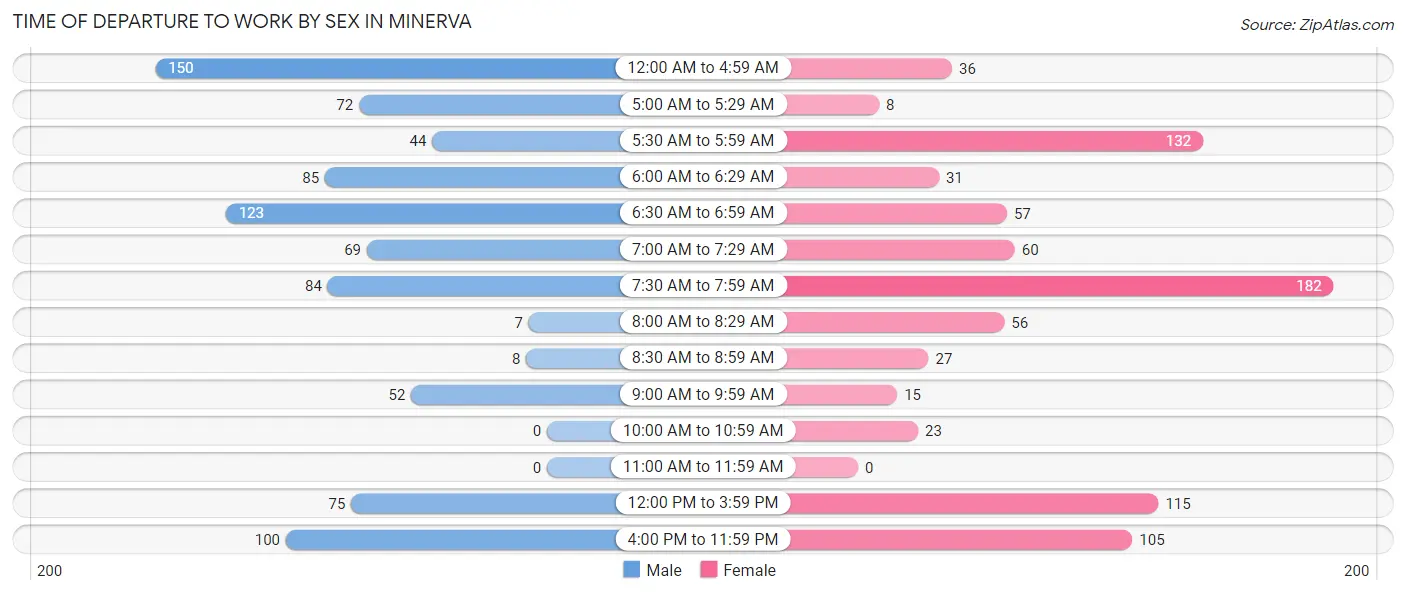
| Time of Departure | Male | Female |
| 12:00 AM to 4:59 AM | 150 (17.3%) | 36 (4.3%) |
| 5:00 AM to 5:29 AM | 72 (8.3%) | 8 (0.9%) |
| 5:30 AM to 5:59 AM | 44 (5.1%) | 132 (15.6%) |
| 6:00 AM to 6:29 AM | 85 (9.8%) | 31 (3.7%) |
| 6:30 AM to 6:59 AM | 123 (14.1%) | 57 (6.7%) |
| 7:00 AM to 7:29 AM | 69 (7.9%) | 60 (7.1%) |
| 7:30 AM to 7:59 AM | 84 (9.7%) | 182 (21.5%) |
| 8:00 AM to 8:29 AM | 7 (0.8%) | 56 (6.6%) |
| 8:30 AM to 8:59 AM | 8 (0.9%) | 27 (3.2%) |
| 9:00 AM to 9:59 AM | 52 (6.0%) | 15 (1.8%) |
| 10:00 AM to 10:59 AM | 0 (0.0%) | 23 (2.7%) |
| 11:00 AM to 11:59 AM | 0 (0.0%) | 0 (0.0%) |
| 12:00 PM to 3:59 PM | 75 (8.6%) | 115 (13.6%) |
| 4:00 PM to 11:59 PM | 100 (11.5%) | 105 (12.4%) |
| Total | 869 (100.0%) | 847 (100.0%) |
Housing Occupancy in Minerva
Occupancy by Ownership in Minerva
Of the total 1,580 dwellings in Minerva, owner-occupied units account for 815 (51.6%), while renter-occupied units make up 765 (48.4%).
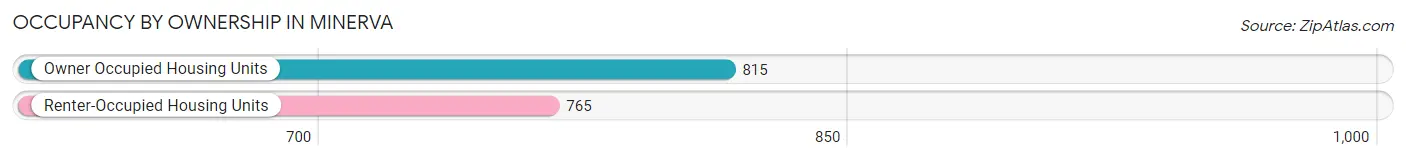
| Occupancy | # Housing Units | % Housing Units |
| Owner Occupied Housing Units | 815 | 51.6% |
| Renter-Occupied Housing Units | 765 | 48.4% |
| Total Occupied Housing Units | 1,580 | 100.0% |
Occupancy by Household Size in Minerva
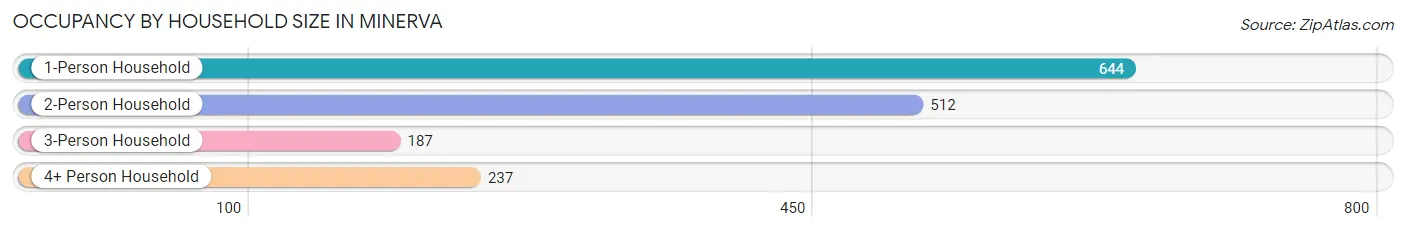
| Household Size | # Housing Units | % Housing Units |
| 1-Person Household | 644 | 40.8% |
| 2-Person Household | 512 | 32.4% |
| 3-Person Household | 187 | 11.8% |
| 4+ Person Household | 237 | 15.0% |
| Total Housing Units | 1,580 | 100.0% |
Occupancy by Ownership by Household Size in Minerva
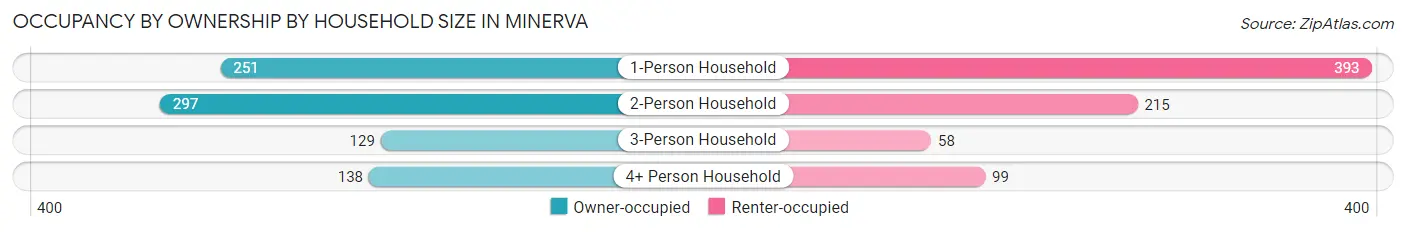
| Household Size | Owner-occupied | Renter-occupied |
| 1-Person Household | 251 (39.0%) | 393 (61.0%) |
| 2-Person Household | 297 (58.0%) | 215 (42.0%) |
| 3-Person Household | 129 (69.0%) | 58 (31.0%) |
| 4+ Person Household | 138 (58.2%) | 99 (41.8%) |
| Total Housing Units | 815 (51.6%) | 765 (48.4%) |
Occupancy by Educational Attainment in Minerva
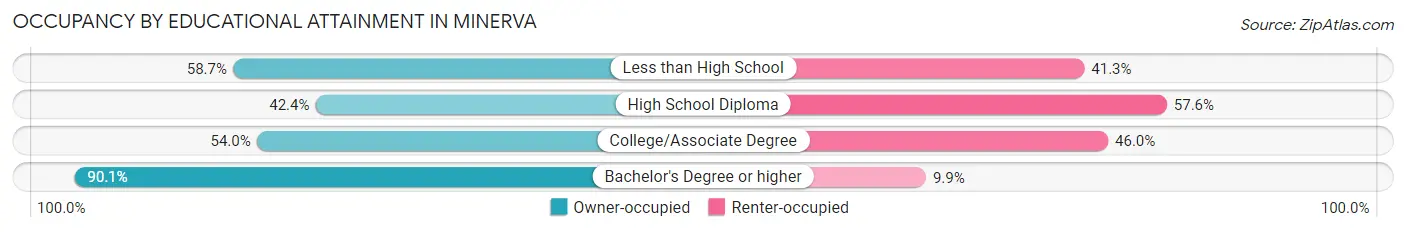
| Household Size | Owner-occupied | Renter-occupied |
| Less than High School | 64 (58.7%) | 45 (41.3%) |
| High School Diploma | 358 (42.4%) | 487 (57.6%) |
| College/Associate Degree | 256 (54.0%) | 218 (46.0%) |
| Bachelor's Degree or higher | 137 (90.1%) | 15 (9.9%) |
Occupancy by Age of Householder in Minerva
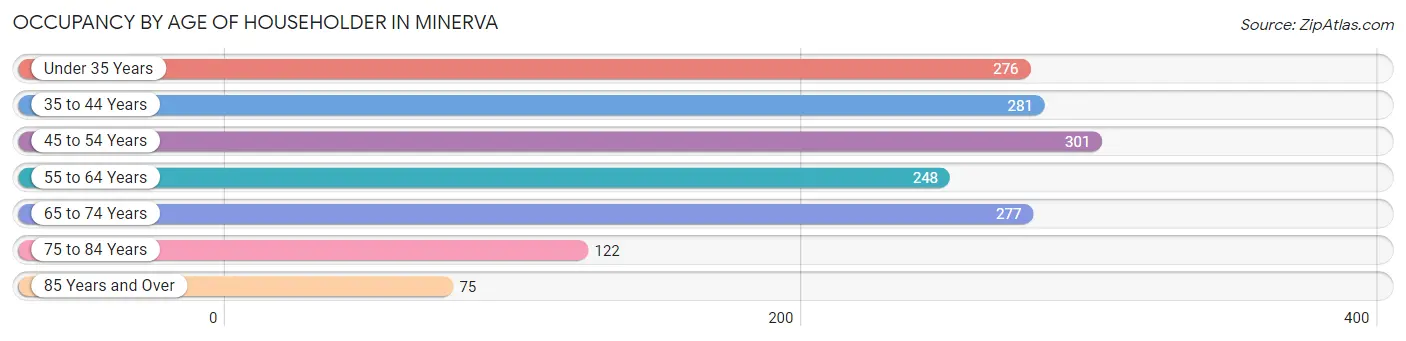
| Age Bracket | # Households | % Households |
| Under 35 Years | 276 | 17.5% |
| 35 to 44 Years | 281 | 17.8% |
| 45 to 54 Years | 301 | 19.1% |
| 55 to 64 Years | 248 | 15.7% |
| 65 to 74 Years | 277 | 17.5% |
| 75 to 84 Years | 122 | 7.7% |
| 85 Years and Over | 75 | 4.8% |
| Total | 1,580 | 100.0% |
Housing Finances in Minerva
Median Income by Occupancy in Minerva
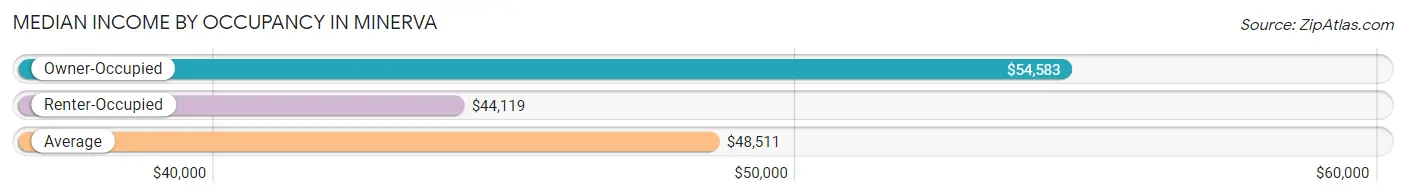
| Occupancy Type | # Households | Median Income |
| Owner-Occupied | 815 (51.6%) | $54,583 |
| Renter-Occupied | 765 (48.4%) | $44,119 |
| Average | 1,580 (100.0%) | $48,511 |
Occupancy by Householder Income Bracket in Minerva
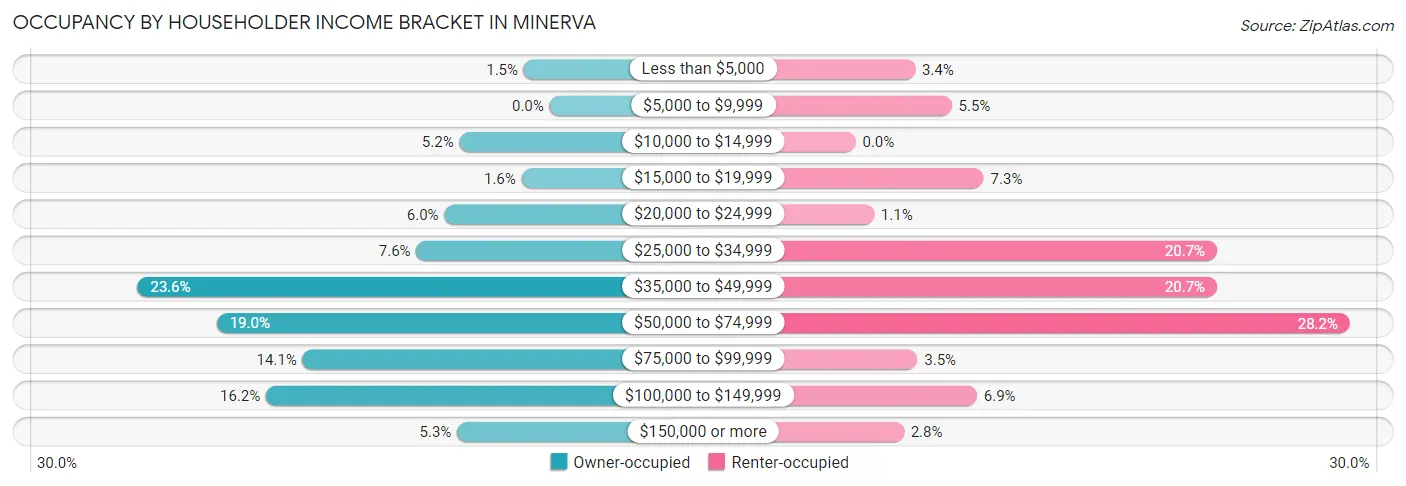
| Income Bracket | Owner-occupied | Renter-occupied |
| Less than $5,000 | 12 (1.5%) | 26 (3.4%) |
| $5,000 to $9,999 | 0 (0.0%) | 42 (5.5%) |
| $10,000 to $14,999 | 42 (5.1%) | 0 (0.0%) |
| $15,000 to $19,999 | 13 (1.6%) | 56 (7.3%) |
| $20,000 to $24,999 | 49 (6.0%) | 8 (1.1%) |
| $25,000 to $34,999 | 62 (7.6%) | 158 (20.6%) |
| $35,000 to $49,999 | 192 (23.6%) | 158 (20.6%) |
| $50,000 to $74,999 | 155 (19.0%) | 216 (28.2%) |
| $75,000 to $99,999 | 115 (14.1%) | 27 (3.5%) |
| $100,000 to $149,999 | 132 (16.2%) | 53 (6.9%) |
| $150,000 or more | 43 (5.3%) | 21 (2.8%) |
| Total | 815 (100.0%) | 765 (100.0%) |
Monthly Housing Cost Tiers in Minerva
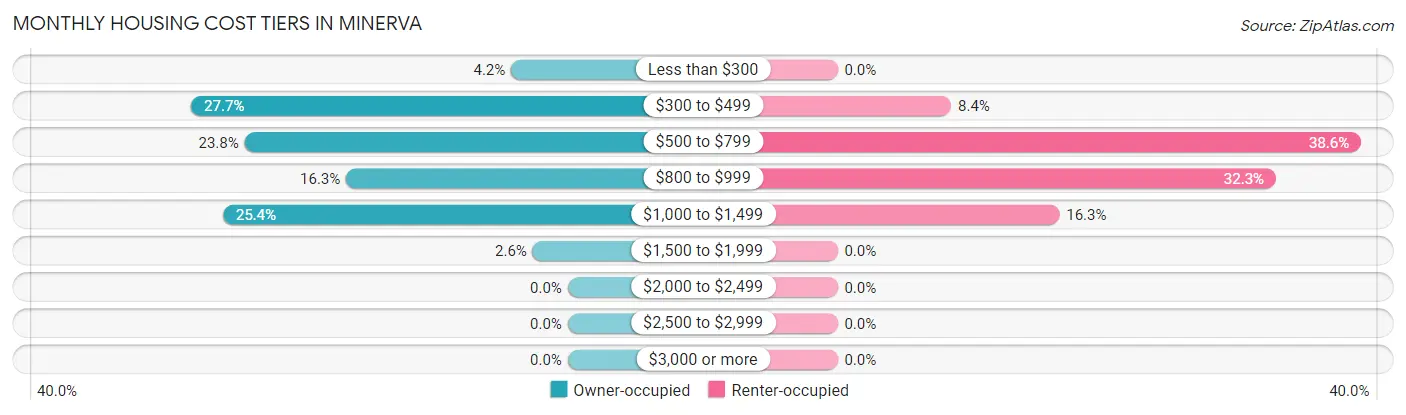
| Monthly Cost | Owner-occupied | Renter-occupied |
| Less than $300 | 34 (4.2%) | 0 (0.0%) |
| $300 to $499 | 226 (27.7%) | 64 (8.4%) |
| $500 to $799 | 194 (23.8%) | 295 (38.6%) |
| $800 to $999 | 133 (16.3%) | 247 (32.3%) |
| $1,000 to $1,499 | 207 (25.4%) | 125 (16.3%) |
| $1,500 to $1,999 | 21 (2.6%) | 0 (0.0%) |
| $2,000 to $2,499 | 0 (0.0%) | 0 (0.0%) |
| $2,500 to $2,999 | 0 (0.0%) | 0 (0.0%) |
| $3,000 or more | 0 (0.0%) | 0 (0.0%) |
| Total | 815 (100.0%) | 765 (100.0%) |
Physical Housing Characteristics in Minerva
Housing Structures in Minerva
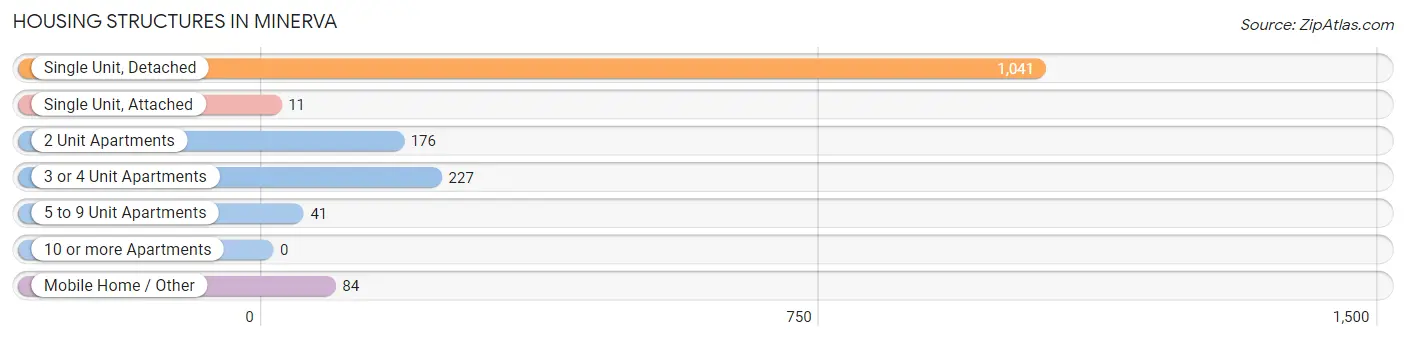
| Structure Type | # Housing Units | % Housing Units |
| Single Unit, Detached | 1,041 | 65.9% |
| Single Unit, Attached | 11 | 0.7% |
| 2 Unit Apartments | 176 | 11.1% |
| 3 or 4 Unit Apartments | 227 | 14.4% |
| 5 to 9 Unit Apartments | 41 | 2.6% |
| 10 or more Apartments | 0 | 0.0% |
| Mobile Home / Other | 84 | 5.3% |
| Total | 1,580 | 100.0% |
Housing Structures by Occupancy in Minerva
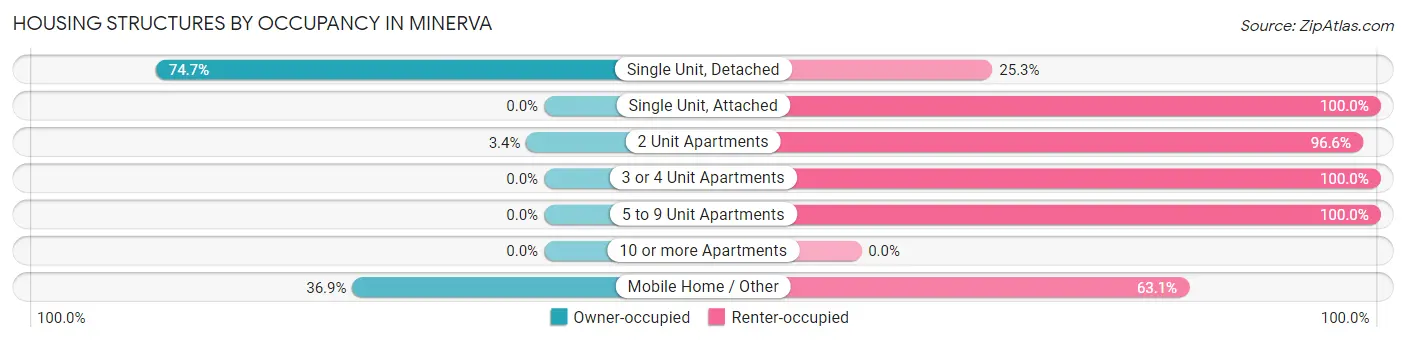
| Structure Type | Owner-occupied | Renter-occupied |
| Single Unit, Detached | 778 (74.7%) | 263 (25.3%) |
| Single Unit, Attached | 0 (0.0%) | 11 (100.0%) |
| 2 Unit Apartments | 6 (3.4%) | 170 (96.6%) |
| 3 or 4 Unit Apartments | 0 (0.0%) | 227 (100.0%) |
| 5 to 9 Unit Apartments | 0 (0.0%) | 41 (100.0%) |
| 10 or more Apartments | 0 (0.0%) | 0 (0.0%) |
| Mobile Home / Other | 31 (36.9%) | 53 (63.1%) |
| Total | 815 (51.6%) | 765 (48.4%) |
Housing Structures by Number of Rooms in Minerva
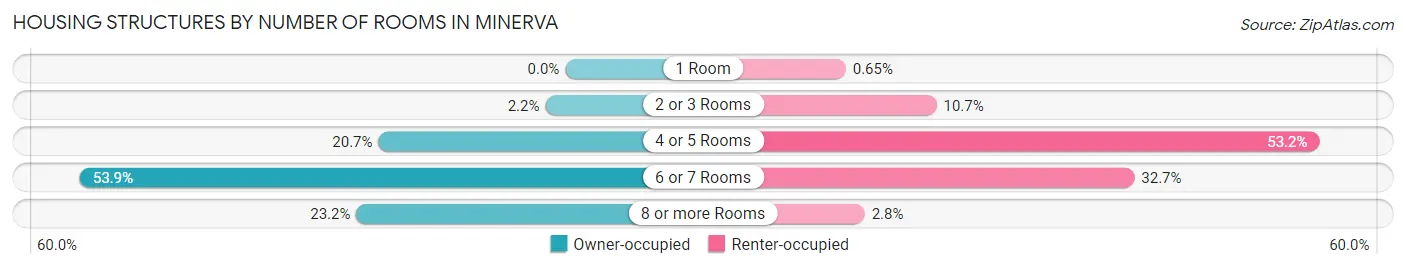
| Number of Rooms | Owner-occupied | Renter-occupied |
| 1 Room | 0 (0.0%) | 5 (0.6%) |
| 2 or 3 Rooms | 18 (2.2%) | 82 (10.7%) |
| 4 or 5 Rooms | 169 (20.7%) | 407 (53.2%) |
| 6 or 7 Rooms | 439 (53.9%) | 250 (32.7%) |
| 8 or more Rooms | 189 (23.2%) | 21 (2.8%) |
| Total | 815 (100.0%) | 765 (100.0%) |
Housing Structure by Heating Type in Minerva
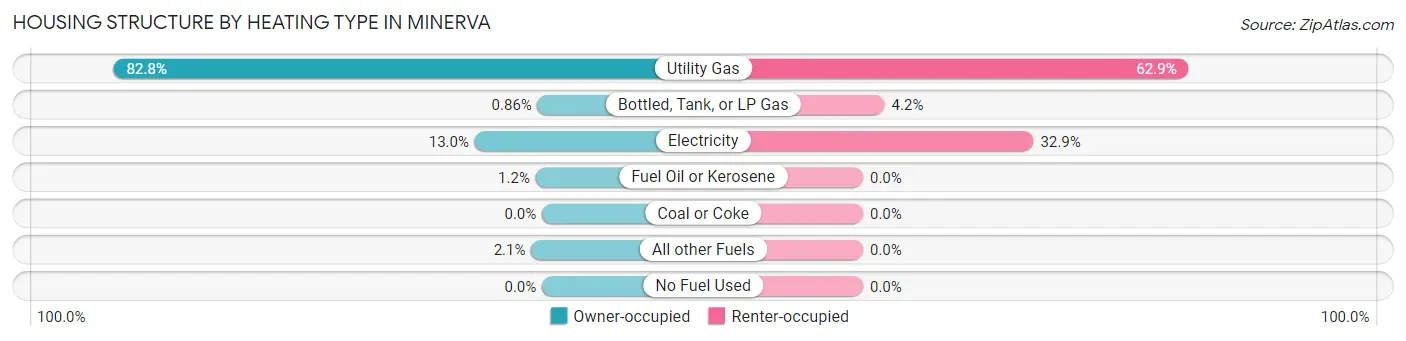
| Heating Type | Owner-occupied | Renter-occupied |
| Utility Gas | 675 (82.8%) | 481 (62.9%) |
| Bottled, Tank, or LP Gas | 7 (0.9%) | 32 (4.2%) |
| Electricity | 106 (13.0%) | 252 (32.9%) |
| Fuel Oil or Kerosene | 10 (1.2%) | 0 (0.0%) |
| Coal or Coke | 0 (0.0%) | 0 (0.0%) |
| All other Fuels | 17 (2.1%) | 0 (0.0%) |
| No Fuel Used | 0 (0.0%) | 0 (0.0%) |
| Total | 815 (100.0%) | 765 (100.0%) |
Household Vehicle Usage in Minerva
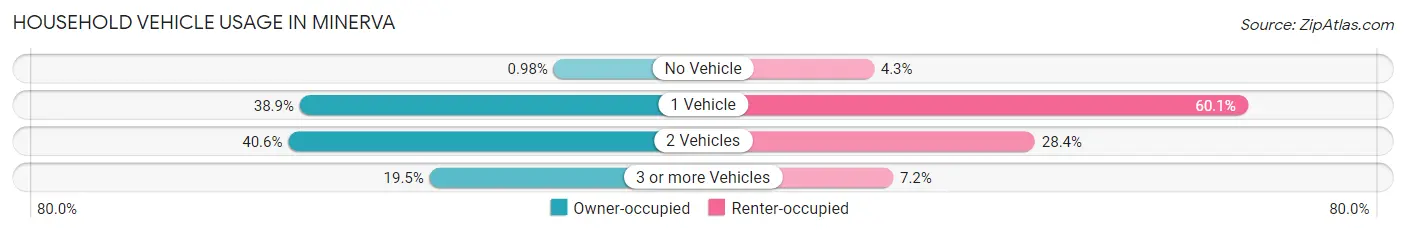
| Vehicles per Household | Owner-occupied | Renter-occupied |
| No Vehicle | 8 (1.0%) | 33 (4.3%) |
| 1 Vehicle | 317 (38.9%) | 460 (60.1%) |
| 2 Vehicles | 331 (40.6%) | 217 (28.4%) |
| 3 or more Vehicles | 159 (19.5%) | 55 (7.2%) |
| Total | 815 (100.0%) | 765 (100.0%) |
Real Estate & Mortgages in Minerva
Real Estate and Mortgage Overview in Minerva
| Characteristic | Without Mortgage | With Mortgage |
| Housing Units | 316 | 499 |
| Median Property Value | $104,000 | $108,900 |
| Median Household Income | $46,607 | $31 |
| Monthly Housing Costs | $427 | $0 |
| Real Estate Taxes | $1,282 | $0 |
Property Value by Mortgage Status in Minerva
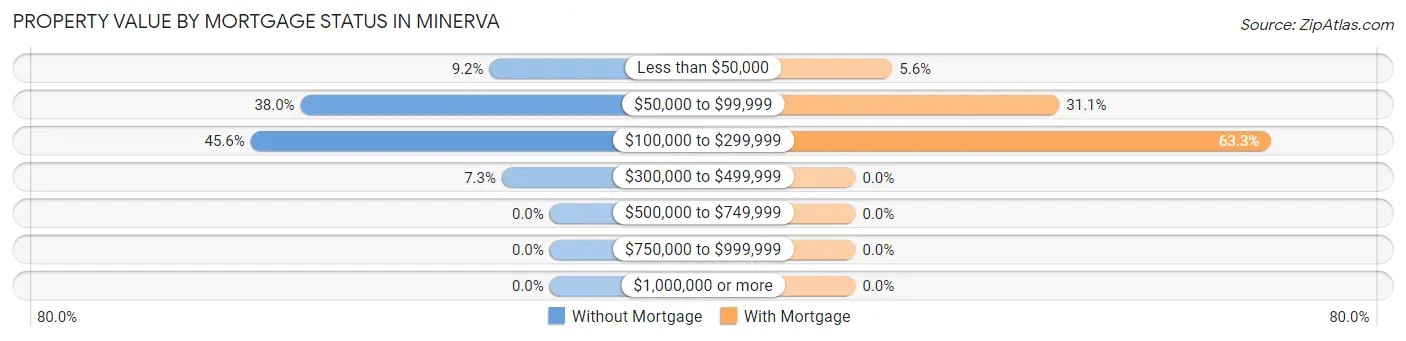
| Property Value | Without Mortgage | With Mortgage |
| Less than $50,000 | 29 (9.2%) | 28 (5.6%) |
| $50,000 to $99,999 | 120 (38.0%) | 155 (31.1%) |
| $100,000 to $299,999 | 144 (45.6%) | 316 (63.3%) |
| $300,000 to $499,999 | 23 (7.3%) | 0 (0.0%) |
| $500,000 to $749,999 | 0 (0.0%) | 0 (0.0%) |
| $750,000 to $999,999 | 0 (0.0%) | 0 (0.0%) |
| $1,000,000 or more | 0 (0.0%) | 0 (0.0%) |
| Total | 316 (100.0%) | 499 (100.0%) |
Household Income by Mortgage Status in Minerva
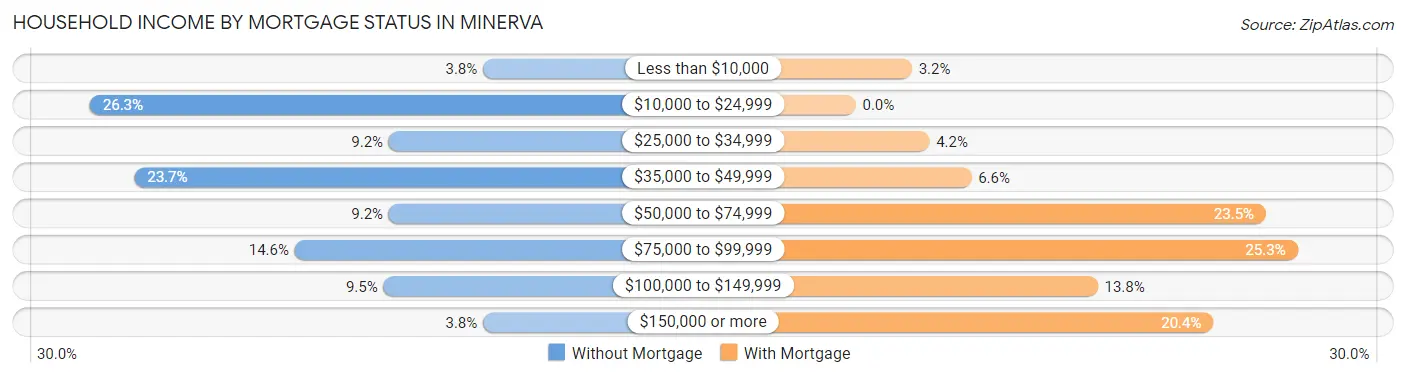
| Household Income | Without Mortgage | With Mortgage |
| Less than $10,000 | 12 (3.8%) | 16 (3.2%) |
| $10,000 to $24,999 | 83 (26.3%) | 0 (0.0%) |
| $25,000 to $34,999 | 29 (9.2%) | 21 (4.2%) |
| $35,000 to $49,999 | 75 (23.7%) | 33 (6.6%) |
| $50,000 to $74,999 | 29 (9.2%) | 117 (23.4%) |
| $75,000 to $99,999 | 46 (14.6%) | 126 (25.3%) |
| $100,000 to $149,999 | 30 (9.5%) | 69 (13.8%) |
| $150,000 or more | 12 (3.8%) | 102 (20.4%) |
| Total | 316 (100.0%) | 499 (100.0%) |
Property Value to Household Income Ratio in Minerva
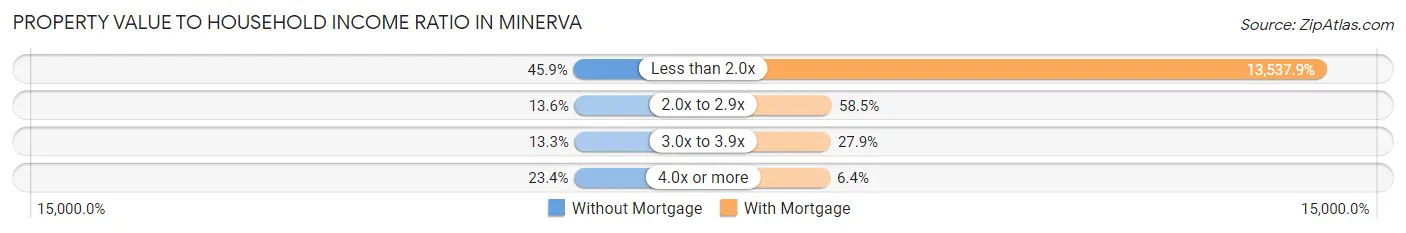
| Value-to-Income Ratio | Without Mortgage | With Mortgage |
| Less than 2.0x | 145 (45.9%) | 67,554 (13,537.9%) |
| 2.0x to 2.9x | 43 (13.6%) | 292 (58.5%) |
| 3.0x to 3.9x | 42 (13.3%) | 139 (27.9%) |
| 4.0x or more | 74 (23.4%) | 32 (6.4%) |
| Total | 316 (100.0%) | 499 (100.0%) |
Real Estate Taxes by Mortgage Status in Minerva
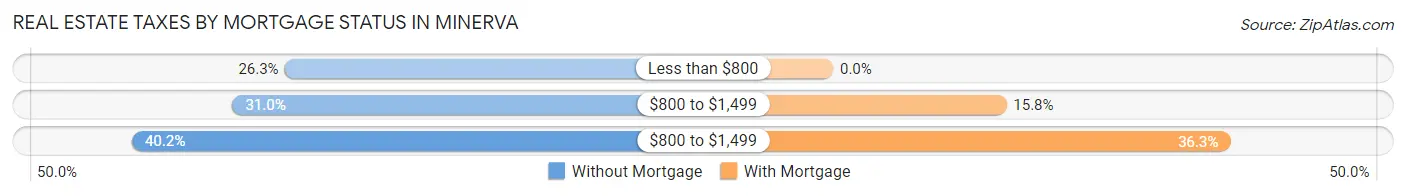
| Property Taxes | Without Mortgage | With Mortgage |
| Less than $800 | 83 (26.3%) | 0 (0.0%) |
| $800 to $1,499 | 98 (31.0%) | 79 (15.8%) |
| $800 to $1,499 | 127 (40.2%) | 181 (36.3%) |
| Total | 316 (100.0%) | 499 (100.0%) |
Health & Disability in Minerva
Health Insurance Coverage by Age in Minerva
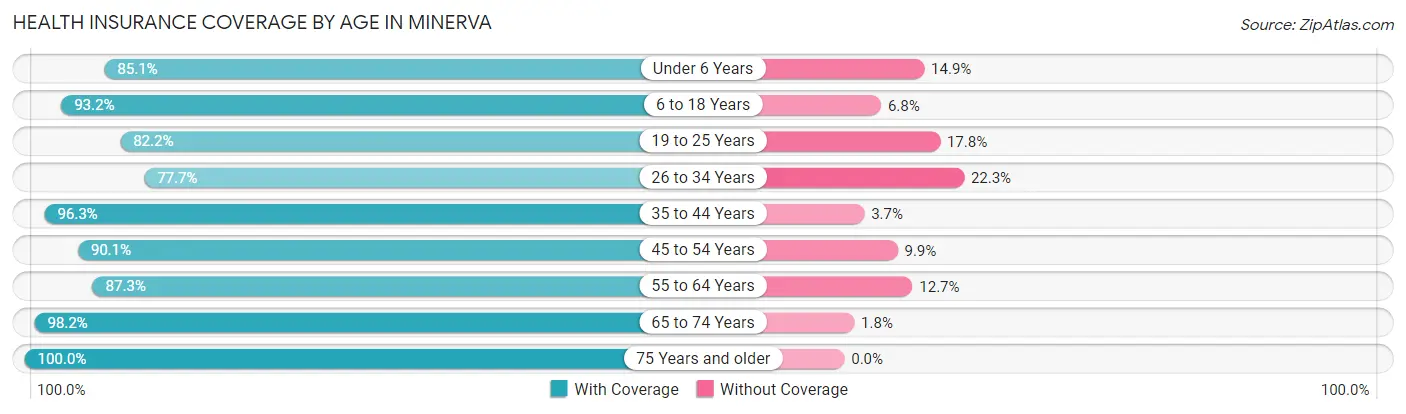
| Age Bracket | With Coverage | Without Coverage |
| Under 6 Years | 200 (85.1%) | 35 (14.9%) |
| 6 to 18 Years | 286 (93.2%) | 21 (6.8%) |
| 19 to 25 Years | 396 (82.2%) | 86 (17.8%) |
| 26 to 34 Years | 202 (77.7%) | 58 (22.3%) |
| 35 to 44 Years | 441 (96.3%) | 17 (3.7%) |
| 45 to 54 Years | 399 (90.1%) | 44 (9.9%) |
| 55 to 64 Years | 337 (87.3%) | 49 (12.7%) |
| 65 to 74 Years | 374 (98.2%) | 7 (1.8%) |
| 75 Years and older | 260 (100.0%) | 0 (0.0%) |
| Total | 2,895 (90.1%) | 317 (9.9%) |
Health Insurance Coverage by Citizenship Status in Minerva
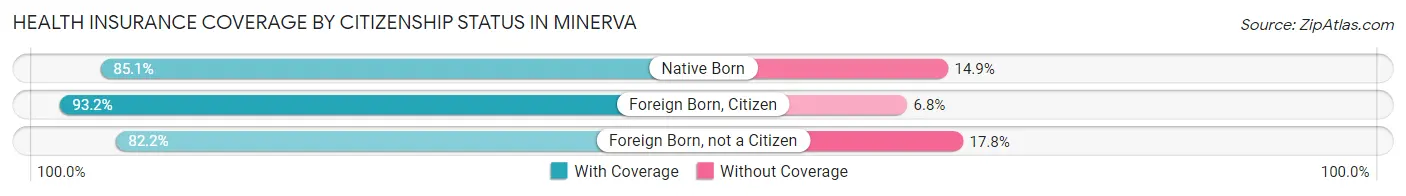
| Citizenship Status | With Coverage | Without Coverage |
| Native Born | 200 (85.1%) | 35 (14.9%) |
| Foreign Born, Citizen | 286 (93.2%) | 21 (6.8%) |
| Foreign Born, not a Citizen | 396 (82.2%) | 86 (17.8%) |
Health Insurance Coverage by Household Income in Minerva
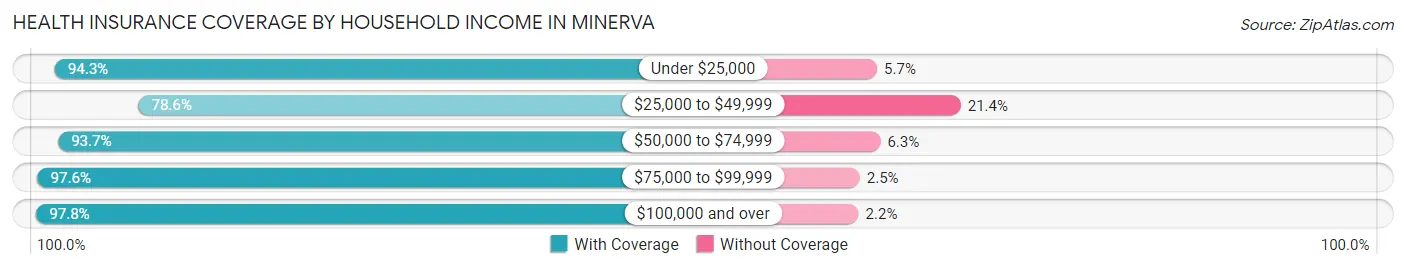
| Household Income | With Coverage | Without Coverage |
| Under $25,000 | 315 (94.3%) | 19 (5.7%) |
| $25,000 to $49,999 | 847 (78.6%) | 230 (21.4%) |
| $50,000 to $74,999 | 624 (93.7%) | 42 (6.3%) |
| $75,000 to $99,999 | 359 (97.6%) | 9 (2.5%) |
| $100,000 and over | 750 (97.8%) | 17 (2.2%) |
Public vs Private Health Insurance Coverage by Age in Minerva
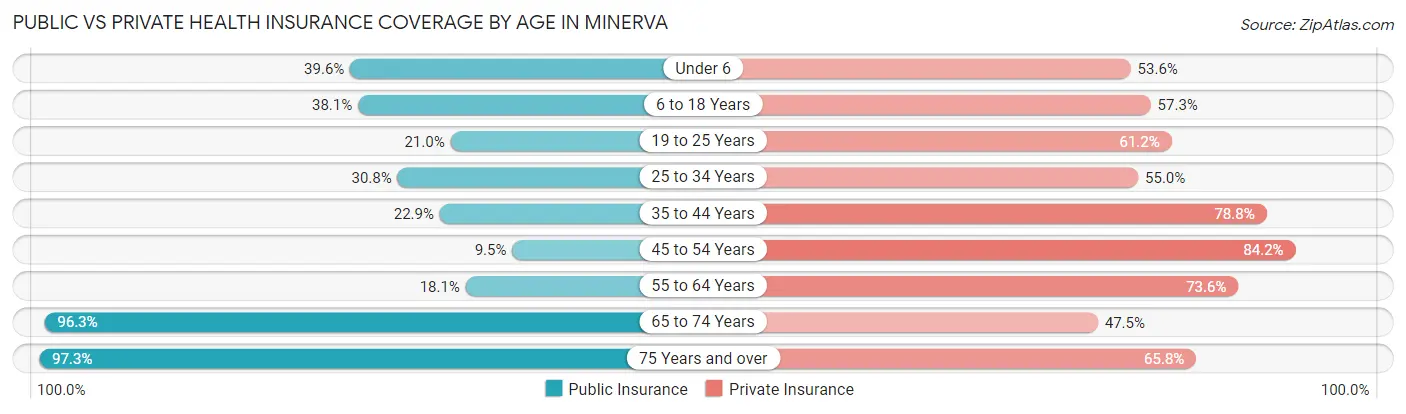
| Age Bracket | Public Insurance | Private Insurance |
| Under 6 | 93 (39.6%) | 126 (53.6%) |
| 6 to 18 Years | 117 (38.1%) | 176 (57.3%) |
| 19 to 25 Years | 101 (20.9%) | 295 (61.2%) |
| 25 to 34 Years | 80 (30.8%) | 143 (55.0%) |
| 35 to 44 Years | 105 (22.9%) | 361 (78.8%) |
| 45 to 54 Years | 42 (9.5%) | 373 (84.2%) |
| 55 to 64 Years | 70 (18.1%) | 284 (73.6%) |
| 65 to 74 Years | 367 (96.3%) | 181 (47.5%) |
| 75 Years and over | 253 (97.3%) | 171 (65.8%) |
| Total | 1,228 (38.2%) | 2,110 (65.7%) |
Disability Status by Sex by Age in Minerva
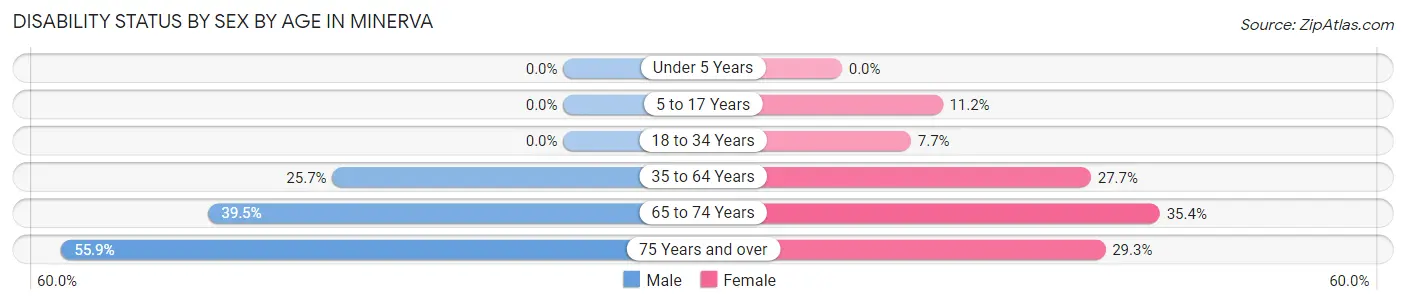
| Age Bracket | Male | Female |
| Under 5 Years | 0 (0.0%) | 0 (0.0%) |
| 5 to 17 Years | 0 (0.0%) | 25 (11.2%) |
| 18 to 34 Years | 0 (0.0%) | 29 (7.7%) |
| 35 to 64 Years | 152 (25.7%) | 193 (27.7%) |
| 65 to 74 Years | 68 (39.5%) | 74 (35.4%) |
| 75 Years and over | 52 (55.9%) | 49 (29.3%) |
Disability Class by Sex by Age in Minerva
Disability Class: Hearing Difficulty
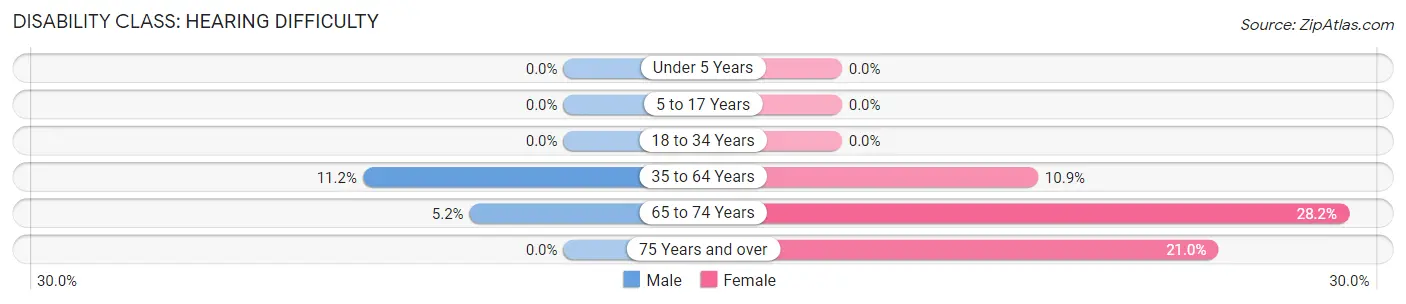
| Age Bracket | Male | Female |
| Under 5 Years | 0 (0.0%) | 0 (0.0%) |
| 5 to 17 Years | 0 (0.0%) | 0 (0.0%) |
| 18 to 34 Years | 0 (0.0%) | 0 (0.0%) |
| 35 to 64 Years | 66 (11.2%) | 76 (10.9%) |
| 65 to 74 Years | 9 (5.2%) | 59 (28.2%) |
| 75 Years and over | 0 (0.0%) | 35 (21.0%) |
Disability Class: Vision Difficulty
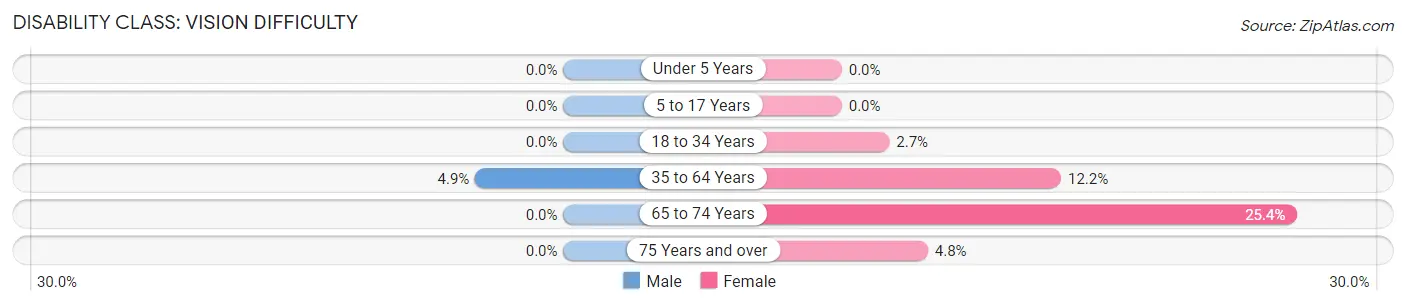
| Age Bracket | Male | Female |
| Under 5 Years | 0 (0.0%) | 0 (0.0%) |
| 5 to 17 Years | 0 (0.0%) | 0 (0.0%) |
| 18 to 34 Years | 0 (0.0%) | 10 (2.6%) |
| 35 to 64 Years | 29 (4.9%) | 85 (12.2%) |
| 65 to 74 Years | 0 (0.0%) | 53 (25.4%) |
| 75 Years and over | 0 (0.0%) | 8 (4.8%) |
Disability Class: Cognitive Difficulty
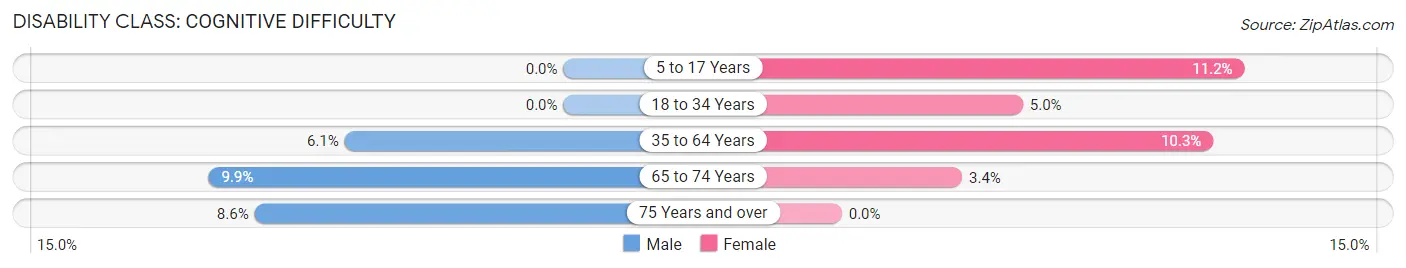
| Age Bracket | Male | Female |
| 5 to 17 Years | 0 (0.0%) | 25 (11.2%) |
| 18 to 34 Years | 0 (0.0%) | 19 (5.0%) |
| 35 to 64 Years | 36 (6.1%) | 72 (10.3%) |
| 65 to 74 Years | 17 (9.9%) | 7 (3.4%) |
| 75 Years and over | 8 (8.6%) | 0 (0.0%) |
Disability Class: Ambulatory Difficulty
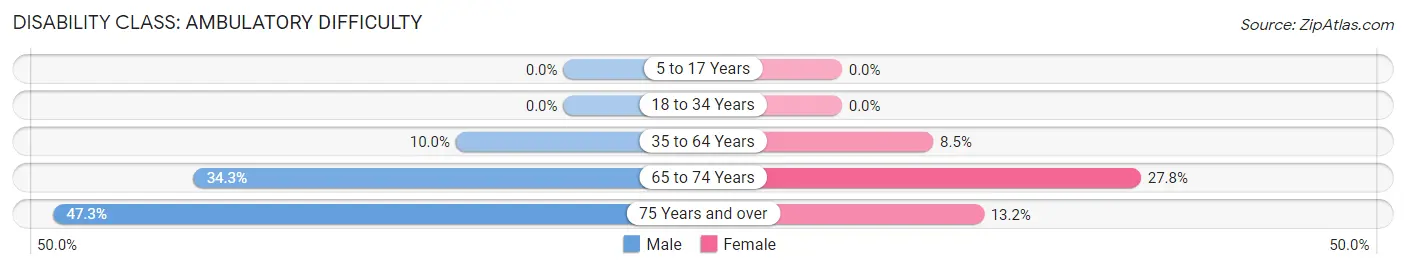
| Age Bracket | Male | Female |
| 5 to 17 Years | 0 (0.0%) | 0 (0.0%) |
| 18 to 34 Years | 0 (0.0%) | 0 (0.0%) |
| 35 to 64 Years | 59 (10.0%) | 59 (8.5%) |
| 65 to 74 Years | 59 (34.3%) | 58 (27.8%) |
| 75 Years and over | 44 (47.3%) | 22 (13.2%) |
Disability Class: Self-Care Difficulty
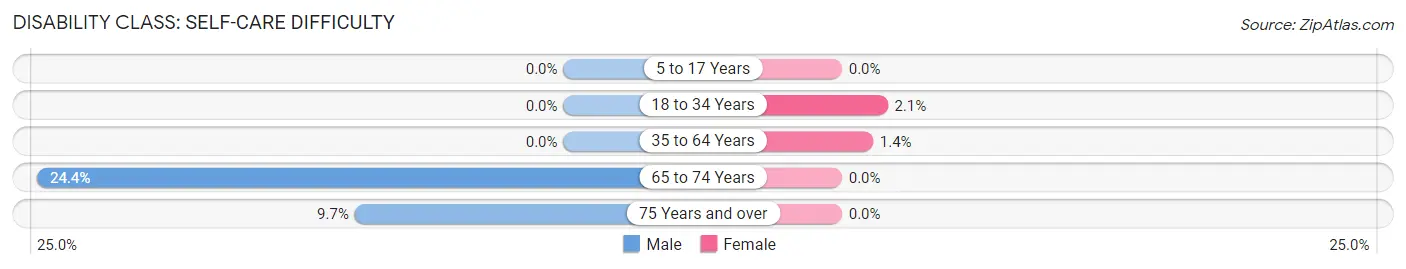
| Age Bracket | Male | Female |
| 5 to 17 Years | 0 (0.0%) | 0 (0.0%) |
| 18 to 34 Years | 0 (0.0%) | 8 (2.1%) |
| 35 to 64 Years | 0 (0.0%) | 10 (1.4%) |
| 65 to 74 Years | 42 (24.4%) | 0 (0.0%) |
| 75 Years and over | 9 (9.7%) | 0 (0.0%) |
Technology Access in Minerva
Computing Device Access in Minerva
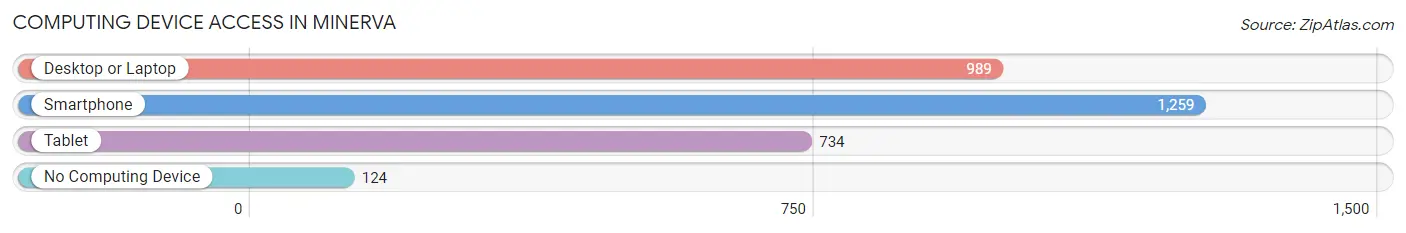
| Device Type | # Households | % Households |
| Desktop or Laptop | 989 | 62.6% |
| Smartphone | 1,259 | 79.7% |
| Tablet | 734 | 46.5% |
| No Computing Device | 124 | 7.9% |
| Total | 1,580 | 100.0% |
Internet Access in Minerva
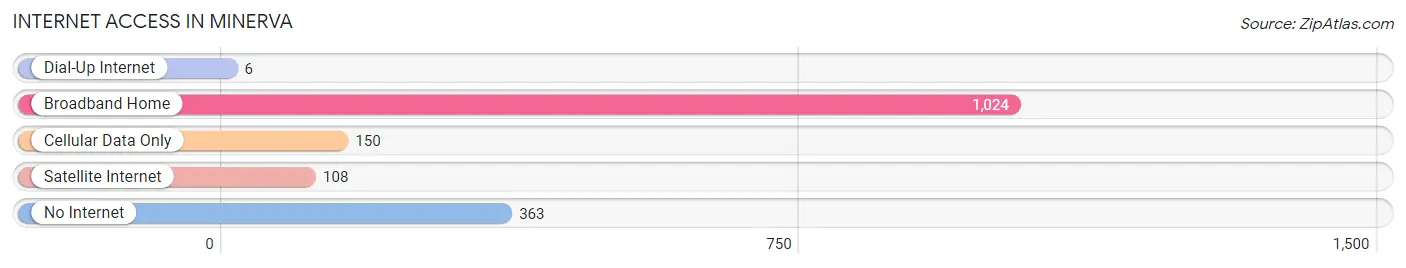
| Internet Type | # Households | % Households |
| Dial-Up Internet | 6 | 0.4% |
| Broadband Home | 1,024 | 64.8% |
| Cellular Data Only | 150 | 9.5% |
| Satellite Internet | 108 | 6.8% |
| No Internet | 363 | 23.0% |
| Total | 1,580 | 100.0% |
Minerva Summary
Minerva, Ohio is a small village located in Stark County, Ohio. It is situated in the northeastern part of the state, approximately 40 miles south of Cleveland and 30 miles north of Canton. The village is bordered by the townships of Osnaburg, Pike, and Sandy. The population of Minerva was 3,717 at the 2010 census.
History
Minerva was founded in 1805 by a group of settlers from Pennsylvania. The village was named after the Roman goddess of wisdom, Minerva. The first settlers were mostly of German and English descent. The village was incorporated in 1837.
In the early 19th century, Minerva was a small farming community. The village was home to several mills, including a sawmill, a gristmill, and a woolen mill. The village also had a blacksmith shop, a tannery, and a brickyard.
In the late 19th century, Minerva began to grow and develop. The village was home to several factories, including a furniture factory, a canning factory, and a cigar factory. The village also had a bank, a newspaper, and a hotel.
Geography
Minerva is located at 40°45'N 81°20'W (40.75, -81.33). The village is situated in the northeastern part of Stark County, approximately 40 miles south of Cleveland and 30 miles north of Canton. The village is bordered by the townships of Osnaburg, Pike, and Sandy.
The village is located in the Appalachian Plateau region of Ohio. The terrain is mostly flat, with some rolling hills. The village is located in the watershed of the Tuscarawas River.
Economy
Minerva’s economy is largely based on agriculture and manufacturing. The village is home to several factories, including a furniture factory, a canning factory, and a cigar factory. The village also has several retail stores, restaurants, and other businesses.
The village is also home to several educational institutions, including Minerva Local Schools, Stark State College, and the University of Mount Union.
Demographics
As of the 2010 census, the population of Minerva was 3,717. The racial makeup of the village was 97.2% White, 0.7% African American, 0.2% Native American, 0.3% Asian, 0.2% from other races, and 1.6% from two or more races. Hispanic or Latino of any race were 0.7% of the population.
The median household income in Minerva was $41,944, and the median family income was $50,938. The per capita income for the village was $20,845. About 11.2% of families and 14.2% of the population were below the poverty line, including 19.2% of those under age 18 and 8.2% of those age 65 or over.
Common Questions
What is Per Capita Income in Minerva?
Per Capita income in Minerva is $32,797.
What is the Median Family Income in Minerva?
Median Family Income in Minerva is $69,797.
What is the Median Household income in Minerva?
Median Household Income in Minerva is $48,511.
What is Income or Wage Gap in Minerva?
Income or Wage Gap in Minerva is 19.4%.
Women in Minerva earn 80.6 cents for every dollar earned by a man.
What is Family Income Deficit in Minerva?
Family Income Deficit in Minerva is $8,776.
Families that are below poverty line in Minerva earn $8,776 less on average than the poverty threshold level.
What is Inequality or Gini Index in Minerva?
Inequality or Gini Index in Minerva is 0.43.
What is the Total Population of Minerva?
Total Population of Minerva is 3,246.
What is the Total Male Population of Minerva?
Total Male Population of Minerva is 1,464.
What is the Total Female Population of Minerva?
Total Female Population of Minerva is 1,782.
What is the Ratio of Males per 100 Females in Minerva?
There are 82.15 Males per 100 Females in Minerva.
What is the Ratio of Females per 100 Males in Minerva?
There are 121.72 Females per 100 Males in Minerva.
What is the Median Population Age in Minerva?
Median Population Age in Minerva is 41.7 Years.
What is the Average Family Size in Minerva
Average Family Size in Minerva is 2.8 People.
What is the Average Household Size in Minerva
Average Household Size in Minerva is 2.0 People.
How Large is the Labor Force in Minerva?
There are 1,831 People in the Labor Forcein in Minerva.
What is the Percentage of People in the Labor Force in Minerva?
65.5% of People are in the Labor Force in Minerva.
What is the Unemployment Rate in Minerva?
Unemployment Rate in Minerva is 3.0%.