Oakwood, OH Map & Demographics
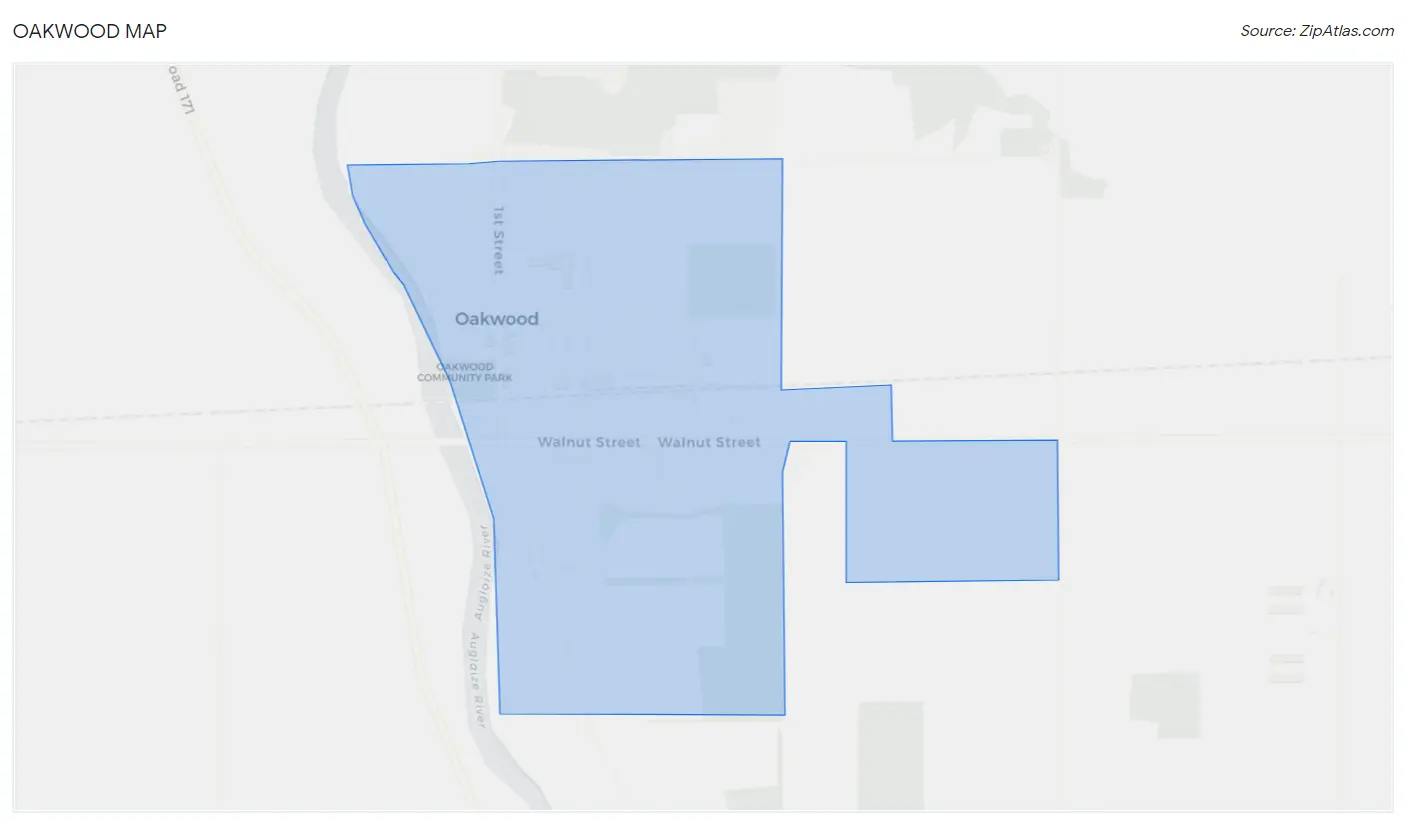
Oakwood Map
Oakwood Overview
$67,721
PER CAPITA INCOME
$176,638
AVG FAMILY INCOME
$132,722
AVG HOUSEHOLD INCOME
51.9%
WAGE / INCOME GAP [ % ]
48.1¢/ $1
WAGE / INCOME GAP [ $ ]
0.45
INEQUALITY / GINI INDEX
9,496
TOTAL POPULATION
4,364
MALE POPULATION
5,132
FEMALE POPULATION
85.04
MALES / 100 FEMALES
117.60
FEMALES / 100 MALES
40.3
MEDIAN AGE
3.0
AVG FAMILY SIZE
2.6
AVG HOUSEHOLD SIZE
5,175
LABOR FORCE [ PEOPLE ]
73.9%
PERCENT IN LABOR FORCE
2.2%
UNEMPLOYMENT RATE
Oakwood Zip Codes
Income in Oakwood
Income Overview in Oakwood
Per Capita Income in Oakwood is $67,721, while median incomes of families and households are $176,638 and $132,722 respectively.
| Characteristic | Number | Measure |
| Per Capita Income | 9,496 | $67,721 |
| Median Family Income | 2,670 | $176,638 |
| Mean Family Income | 2,670 | $216,299 |
| Median Household Income | 3,610 | $132,722 |
| Mean Household Income | 3,610 | $179,717 |
| Income Deficit | 2,670 | $0 |
| Wage / Income Gap (%) | 9,496 | 51.94% |
| Wage / Income Gap ($) | 9,496 | 48.06¢ per $1 |
| Gini / Inequality Index | 9,496 | 0.45 |
Earnings by Sex in Oakwood
Average Earnings in Oakwood are $69,676, $104,393 for men and $50,176 for women, a difference of 51.9%.
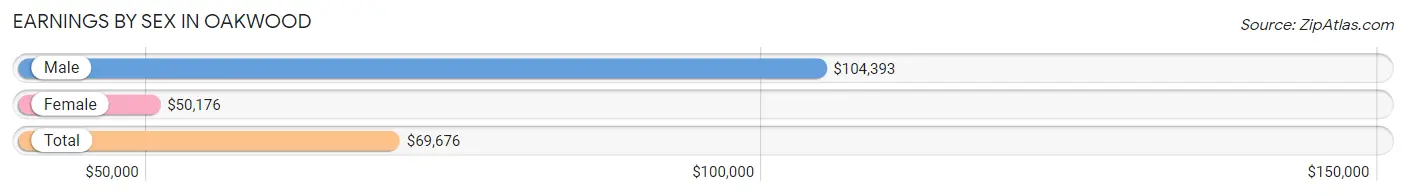
| Sex | Number | Average Earnings |
| Male | 2,715 (49.2%) | $104,393 |
| Female | 2,807 (50.8%) | $50,176 |
| Total | 5,522 (100.0%) | $69,676 |
Earnings by Sex by Income Bracket in Oakwood
The most common earnings brackets in Oakwood are $100,000+ for men (1,420 | 52.3%) and $100,000+ for women (639 | 22.8%).
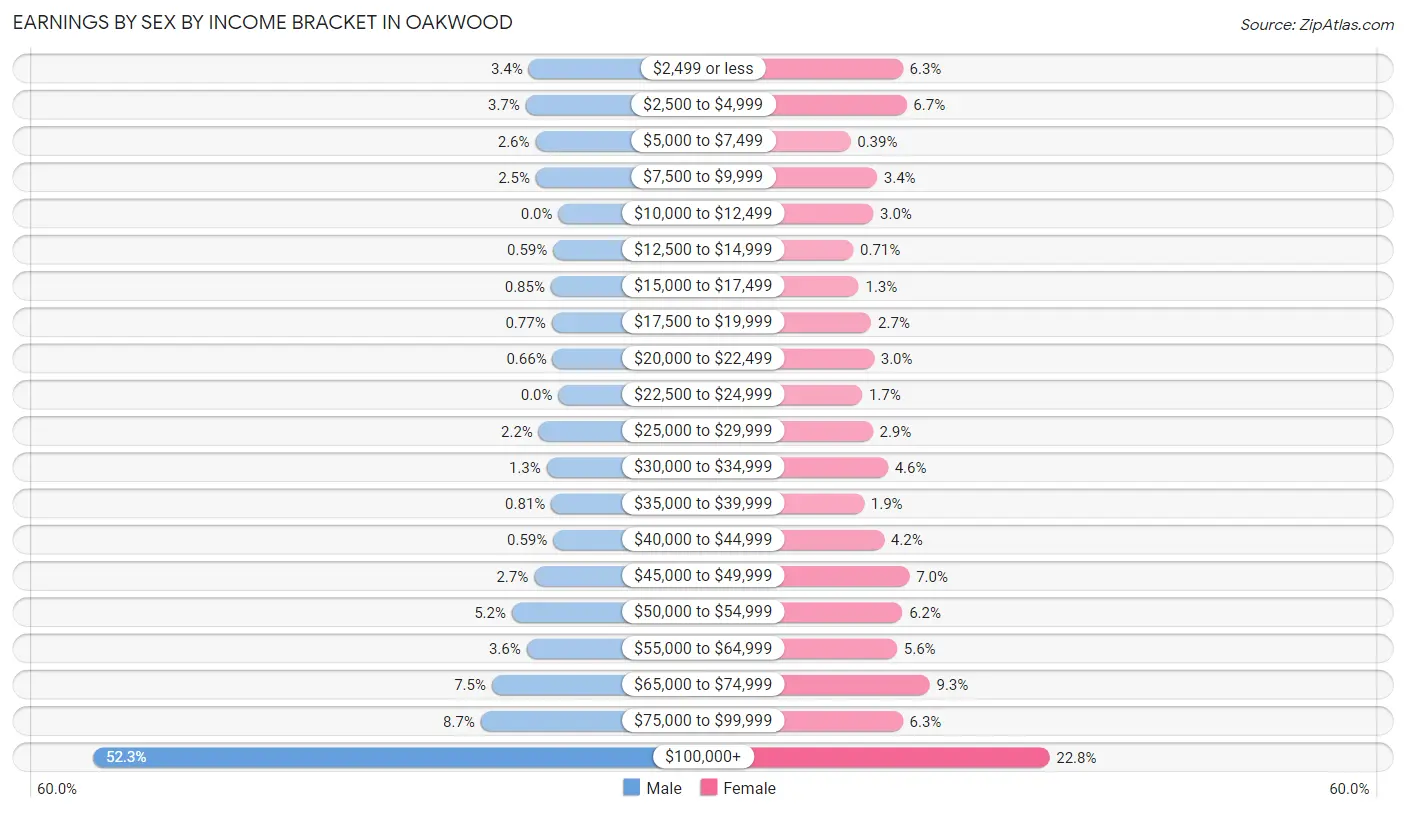
| Income | Male | Female |
| $2,499 or less | 91 (3.4%) | 176 (6.3%) |
| $2,500 to $4,999 | 100 (3.7%) | 188 (6.7%) |
| $5,000 to $7,499 | 70 (2.6%) | 11 (0.4%) |
| $7,500 to $9,999 | 69 (2.5%) | 95 (3.4%) |
| $10,000 to $12,499 | 0 (0.0%) | 83 (3.0%) |
| $12,500 to $14,999 | 16 (0.6%) | 20 (0.7%) |
| $15,000 to $17,499 | 23 (0.9%) | 37 (1.3%) |
| $17,500 to $19,999 | 21 (0.8%) | 77 (2.7%) |
| $20,000 to $22,499 | 18 (0.7%) | 85 (3.0%) |
| $22,500 to $24,999 | 0 (0.0%) | 48 (1.7%) |
| $25,000 to $29,999 | 60 (2.2%) | 81 (2.9%) |
| $30,000 to $34,999 | 36 (1.3%) | 129 (4.6%) |
| $35,000 to $39,999 | 22 (0.8%) | 54 (1.9%) |
| $40,000 to $44,999 | 16 (0.6%) | 117 (4.2%) |
| $45,000 to $49,999 | 74 (2.7%) | 197 (7.0%) |
| $50,000 to $54,999 | 142 (5.2%) | 175 (6.2%) |
| $55,000 to $64,999 | 97 (3.6%) | 158 (5.6%) |
| $65,000 to $74,999 | 203 (7.5%) | 261 (9.3%) |
| $75,000 to $99,999 | 237 (8.7%) | 176 (6.3%) |
| $100,000+ | 1,420 (52.3%) | 639 (22.8%) |
| Total | 2,715 (100.0%) | 2,807 (100.0%) |
Earnings by Sex by Educational Attainment in Oakwood
Average earnings in Oakwood are $109,555 for men and $54,936 for women, a difference of 49.9%. Men with an educational attainment of high school diploma enjoy the highest average annual earnings of $124,500, while those with college or associate's degree education earn the least with $68,997. Women with an educational attainment of graduate degree earn the most with the average annual earnings of $74,656, while those with high school diploma education have the smallest earnings of $34,034.
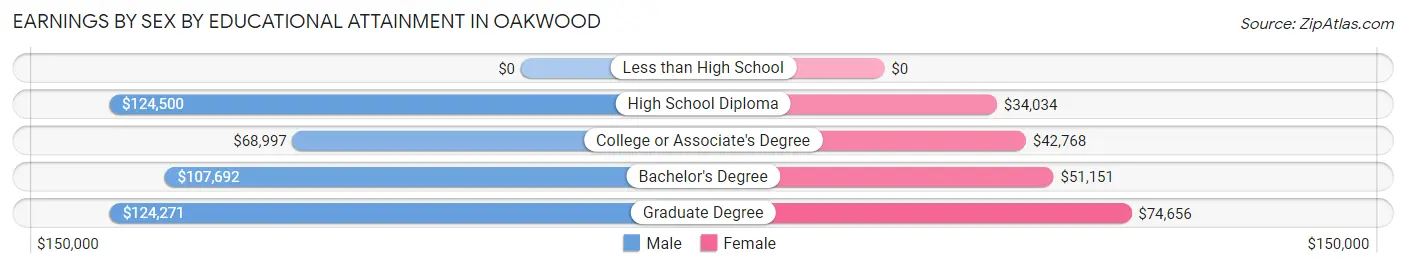
| Educational Attainment | Male Income | Female Income |
| Less than High School | - | - |
| High School Diploma | $124,500 | $34,034 |
| College or Associate's Degree | $68,997 | $42,768 |
| Bachelor's Degree | $107,692 | $51,151 |
| Graduate Degree | $124,271 | $74,656 |
| Total | $109,555 | $54,936 |
Family Income in Oakwood
Family Income Brackets in Oakwood
According to the Oakwood family income data, there are 1,025 families falling into the $200,000+ income range, which is the most common income bracket and makes up 38.4% of all families. Conversely, the less than $10,000 income bracket is the least frequent group with only 19 families (0.7%) belonging to this category.
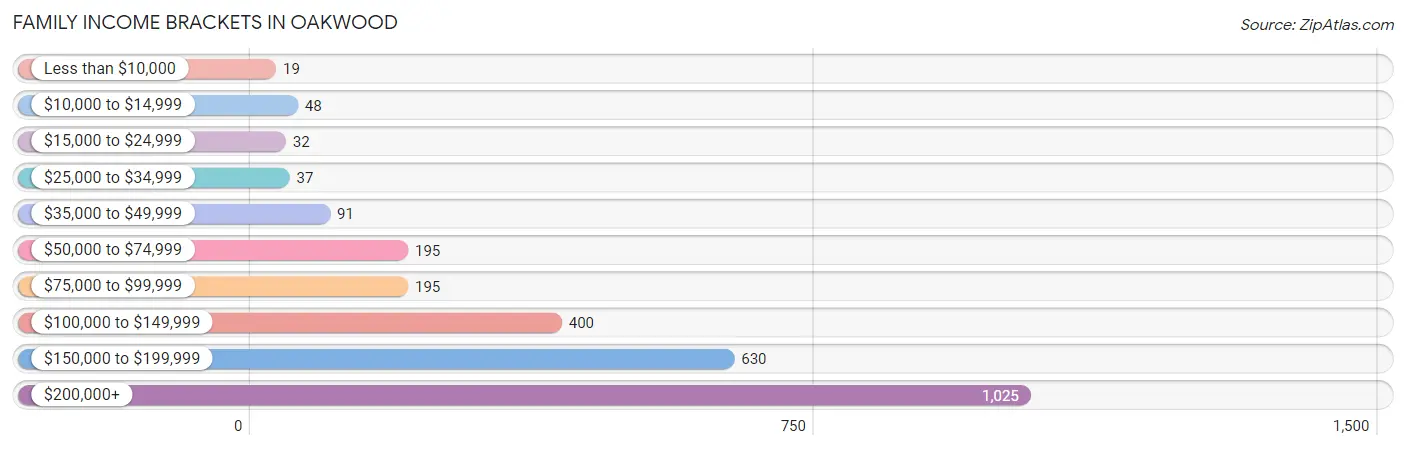
| Income Bracket | # Families | % Families |
| Less than $10,000 | 19 | 0.7% |
| $10,000 to $14,999 | 48 | 1.8% |
| $15,000 to $24,999 | 32 | 1.2% |
| $25,000 to $34,999 | 37 | 1.4% |
| $35,000 to $49,999 | 91 | 3.4% |
| $50,000 to $74,999 | 195 | 7.3% |
| $75,000 to $99,999 | 195 | 7.3% |
| $100,000 to $149,999 | 400 | 15.0% |
| $150,000 to $199,999 | 630 | 23.6% |
| $200,000+ | 1,025 | 38.4% |
Family Income by Famaliy Size in Oakwood
6-person families (40 | 1.5%) account for the highest median family income in Oakwood with $250,001 per family, while 2-person families (1,186 | 44.4%) have the highest median income of $66,848 per family member.
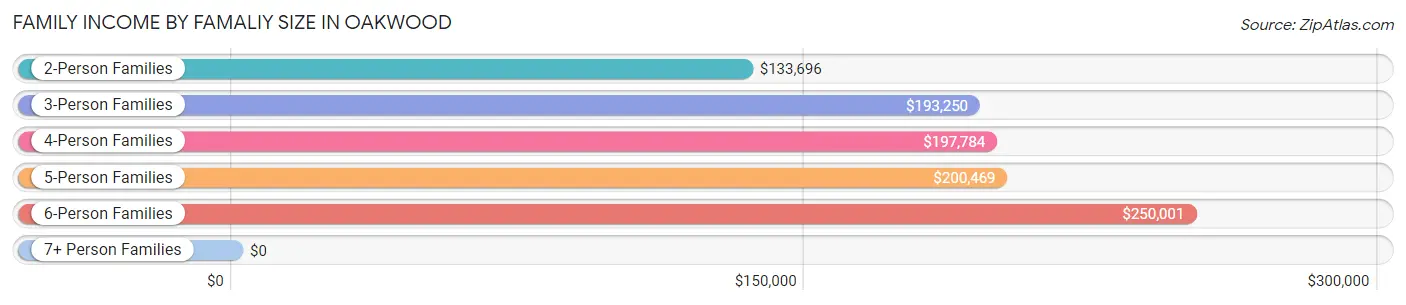
| Income Bracket | # Families | Median Income |
| 2-Person Families | 1,186 (44.4%) | $133,696 |
| 3-Person Families | 616 (23.1%) | $193,250 |
| 4-Person Families | 663 (24.8%) | $197,784 |
| 5-Person Families | 156 (5.8%) | $200,469 |
| 6-Person Families | 40 (1.5%) | $250,001 |
| 7+ Person Families | 9 (0.3%) | $0 |
| Total | 2,670 (100.0%) | $176,638 |
Family Income by Number of Earners in Oakwood
The median family income in Oakwood is $176,638, with families comprising 3+ earners (401) having the highest median family income of $213,988, while families with no earners (200) have the lowest median family income of $81,071, accounting for 15.0% and 7.5% of families, respectively.
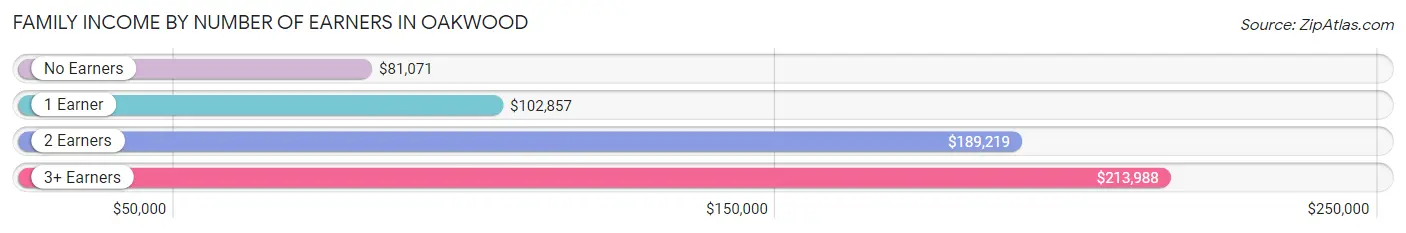
| Number of Earners | # Families | Median Income |
| No Earners | 200 (7.5%) | $81,071 |
| 1 Earner | 654 (24.5%) | $102,857 |
| 2 Earners | 1,415 (53.0%) | $189,219 |
| 3+ Earners | 401 (15.0%) | $213,988 |
| Total | 2,670 (100.0%) | $176,638 |
Household Income in Oakwood
Household Income Brackets in Oakwood
With 1,051 households falling in the category, the $200,000+ income range is the most frequent in Oakwood, accounting for 29.1% of all households. In contrast, only 47 households (1.3%) fall into the less than $10,000 income bracket, making it the least populous group.
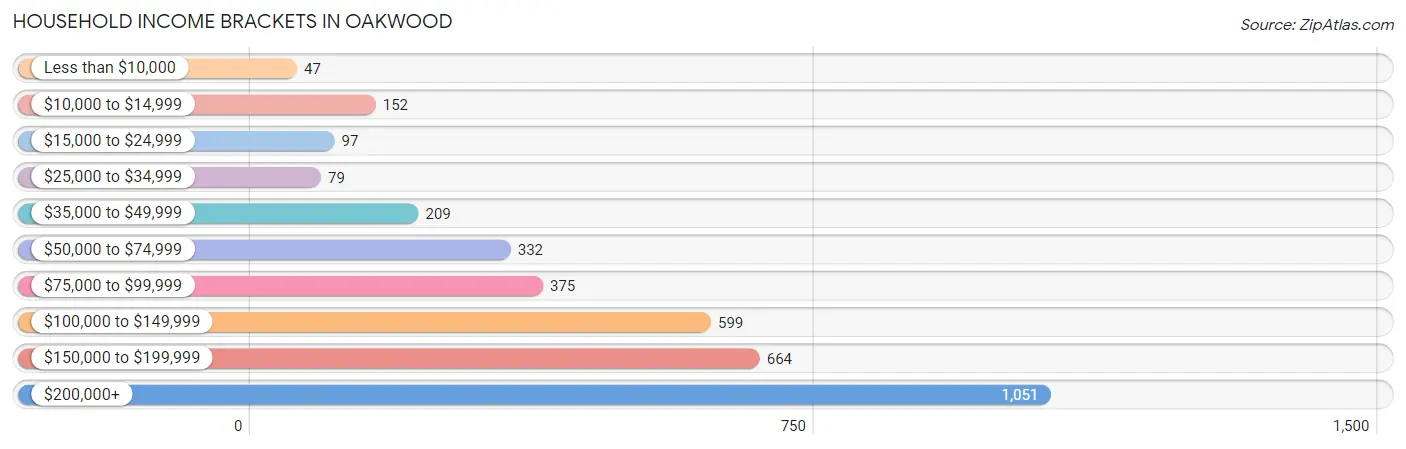
| Income Bracket | # Households | % Households |
| Less than $10,000 | 47 | 1.3% |
| $10,000 to $14,999 | 152 | 4.2% |
| $15,000 to $24,999 | 97 | 2.7% |
| $25,000 to $34,999 | 79 | 2.2% |
| $35,000 to $49,999 | 209 | 5.8% |
| $50,000 to $74,999 | 332 | 9.2% |
| $75,000 to $99,999 | 375 | 10.4% |
| $100,000 to $149,999 | 599 | 16.6% |
| $150,000 to $199,999 | 664 | 18.4% |
| $200,000+ | 1,051 | 29.1% |
Household Income by Householder Age in Oakwood
The median household income in Oakwood is $132,722, with the highest median household income of $181,458 found in the 45 to 64 years age bracket for the primary householder. A total of 1,613 households (44.7%) fall into this category. Meanwhile, the 15 to 24 years age bracket for the primary householder has the lowest median household income of $0, with 51 households (1.4%) in this group.
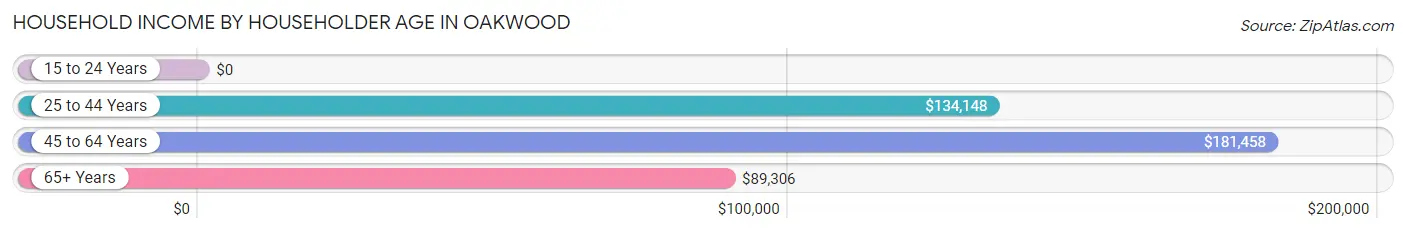
| Income Bracket | # Households | Median Income |
| 15 to 24 Years | 51 (1.4%) | $0 |
| 25 to 44 Years | 1,153 (31.9%) | $134,148 |
| 45 to 64 Years | 1,613 (44.7%) | $181,458 |
| 65+ Years | 793 (22.0%) | $89,306 |
| Total | 3,610 (100.0%) | $132,722 |
Poverty in Oakwood
Income Below Poverty by Sex and Age in Oakwood
With 2.1% poverty level for males and 6.5% for females among the residents of Oakwood, 12 to 14 year old males and 15 year old females are the most vulnerable to poverty, with 65 males (15.0%) and 69 females (42.9%) in their respective age groups living below the poverty level.
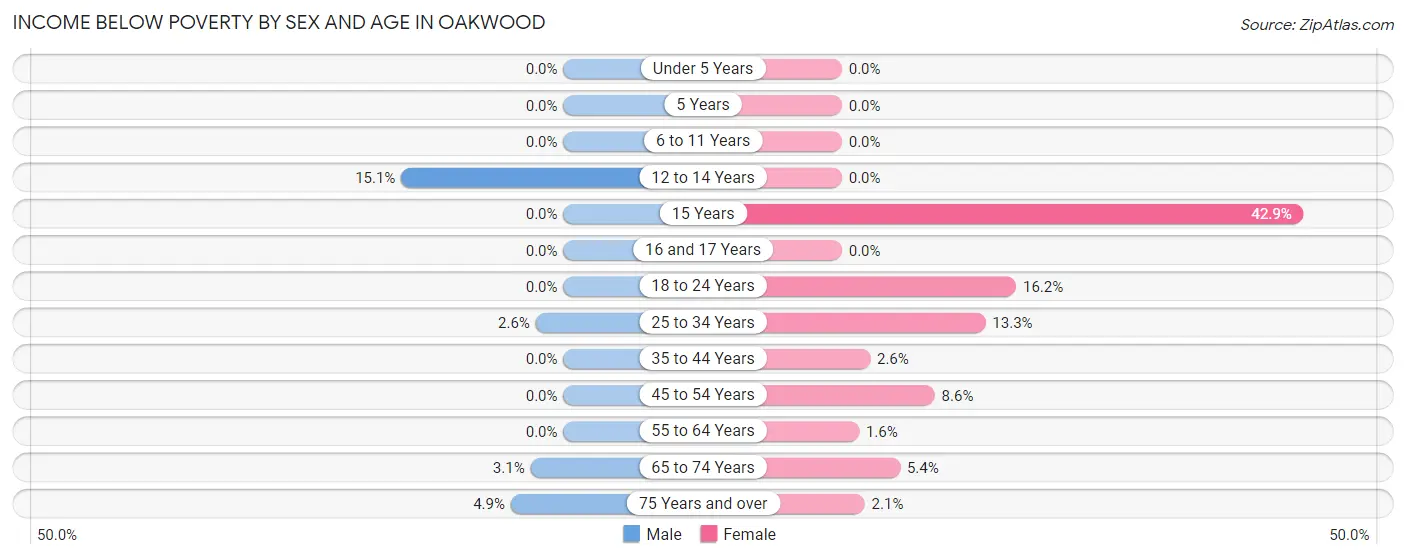
| Age Bracket | Male | Female |
| Under 5 Years | 0 (0.0%) | 0 (0.0%) |
| 5 Years | 0 (0.0%) | 0 (0.0%) |
| 6 to 11 Years | 0 (0.0%) | 0 (0.0%) |
| 12 to 14 Years | 65 (15.0%) | 0 (0.0%) |
| 15 Years | 0 (0.0%) | 69 (42.9%) |
| 16 and 17 Years | 0 (0.0%) | 0 (0.0%) |
| 18 to 24 Years | 0 (0.0%) | 38 (16.2%) |
| 25 to 34 Years | 11 (2.6%) | 76 (13.3%) |
| 35 to 44 Years | 0 (0.0%) | 16 (2.6%) |
| 45 to 54 Years | 0 (0.0%) | 89 (8.6%) |
| 55 to 64 Years | 0 (0.0%) | 8 (1.6%) |
| 65 to 74 Years | 9 (3.0%) | 23 (5.4%) |
| 75 Years and over | 6 (4.9%) | 6 (2.1%) |
| Total | 91 (2.1%) | 325 (6.5%) |
Income Above Poverty by Sex and Age in Oakwood
According to the poverty statistics in Oakwood, males aged under 5 years and females aged under 5 years are the age groups that are most secure financially, with 100.0% of males and 100.0% of females in these age groups living above the poverty line.
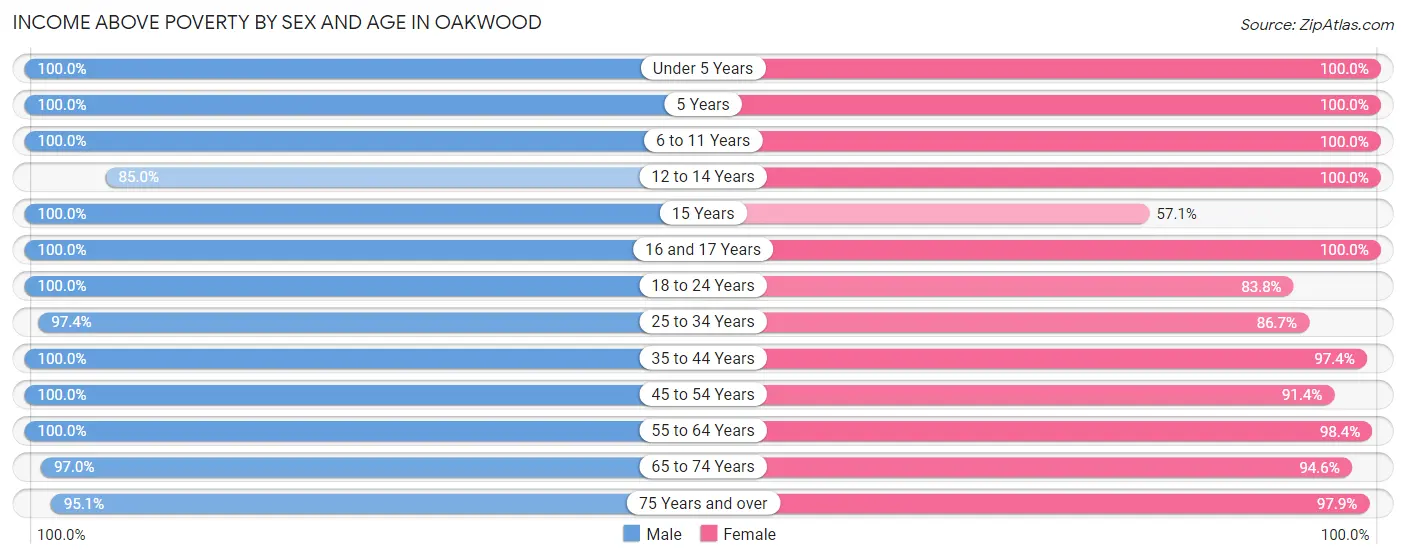
| Age Bracket | Male | Female |
| Under 5 Years | 191 (100.0%) | 241 (100.0%) |
| 5 Years | 37 (100.0%) | 40 (100.0%) |
| 6 to 11 Years | 447 (100.0%) | 455 (100.0%) |
| 12 to 14 Years | 367 (85.0%) | 261 (100.0%) |
| 15 Years | 106 (100.0%) | 92 (57.1%) |
| 16 and 17 Years | 151 (100.0%) | 201 (100.0%) |
| 18 to 24 Years | 187 (100.0%) | 197 (83.8%) |
| 25 to 34 Years | 417 (97.4%) | 494 (86.7%) |
| 35 to 44 Years | 587 (100.0%) | 595 (97.4%) |
| 45 to 54 Years | 862 (100.0%) | 944 (91.4%) |
| 55 to 64 Years | 509 (100.0%) | 494 (98.4%) |
| 65 to 74 Years | 286 (97.0%) | 403 (94.6%) |
| 75 Years and over | 117 (95.1%) | 277 (97.9%) |
| Total | 4,264 (97.9%) | 4,694 (93.5%) |
Income Below Poverty Among Married-Couple Families in Oakwood
The poverty statistics for married-couple families in Oakwood show that 0.4% or 9 of the total 2,145 families live below the poverty line. Families with no children have the highest poverty rate of 0.8%, comprising of 9 families. On the other hand, families with 1 or 2 children have the lowest poverty rate of 0.0%, which includes 0 families.
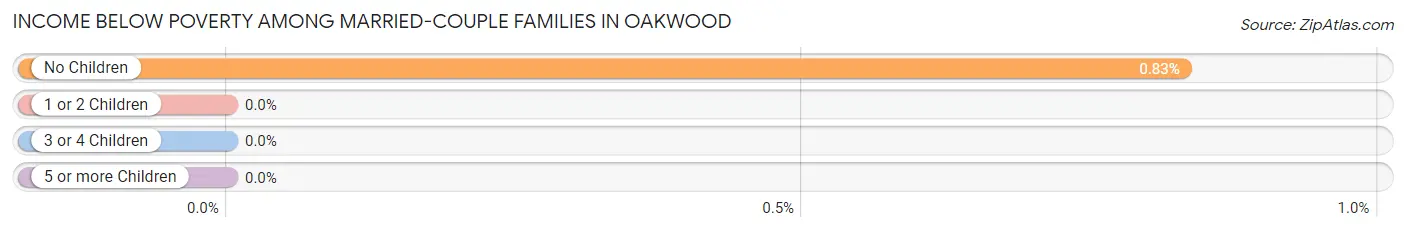
| Children | Above Poverty | Below Poverty |
| No Children | 1,074 (99.2%) | 9 (0.8%) |
| 1 or 2 Children | 882 (100.0%) | 0 (0.0%) |
| 3 or 4 Children | 174 (100.0%) | 0 (0.0%) |
| 5 or more Children | 6 (100.0%) | 0 (0.0%) |
| Total | 2,136 (99.6%) | 9 (0.4%) |
Income Below Poverty Among Single-Parent Households in Oakwood
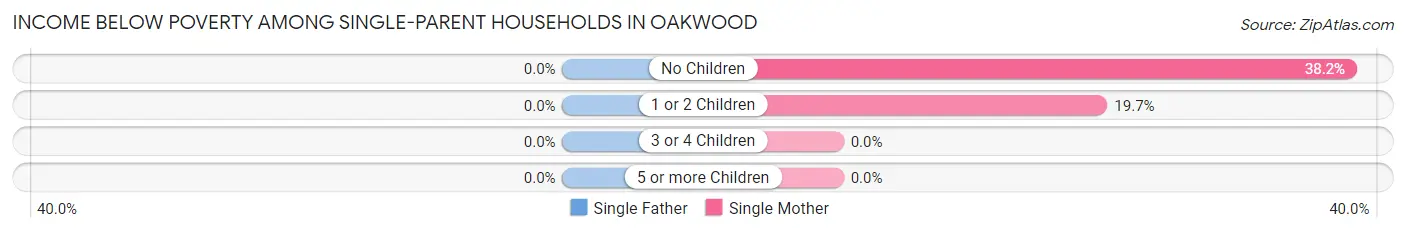
| Children | Single Father | Single Mother |
| No Children | 0 (0.0%) | 39 (38.2%) |
| 1 or 2 Children | 0 (0.0%) | 34 (19.7%) |
| 3 or 4 Children | 0 (0.0%) | 0 (0.0%) |
| 5 or more Children | 0 (0.0%) | 0 (0.0%) |
| Total | 0 (0.0%) | 73 (24.6%) |
Income Below Poverty Among Married-Couple vs Single-Parent Households in Oakwood
The poverty data for Oakwood shows that 9 of the married-couple family households (0.4%) and 73 of the single-parent households (13.9%) are living below the poverty level. Within the married-couple family households, those with no children have the highest poverty rate, with 9 households (0.8%) falling below the poverty line. Among the single-parent households, those with no children have the highest poverty rate, with 39 household (31.5%) living below poverty.
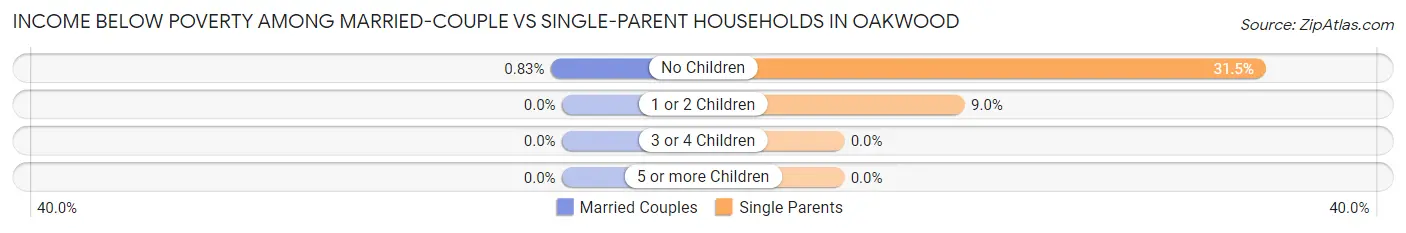
| Children | Married-Couple Families | Single-Parent Households |
| No Children | 9 (0.8%) | 39 (31.5%) |
| 1 or 2 Children | 0 (0.0%) | 34 (9.0%) |
| 3 or 4 Children | 0 (0.0%) | 0 (0.0%) |
| 5 or more Children | 0 (0.0%) | 0 (0.0%) |
| Total | 9 (0.4%) | 73 (13.9%) |
Race in Oakwood
The most populous races in Oakwood are White / Caucasian (8,809 | 92.8%), Two or more Races (355 | 3.7%), and Asian (291 | 3.1%).
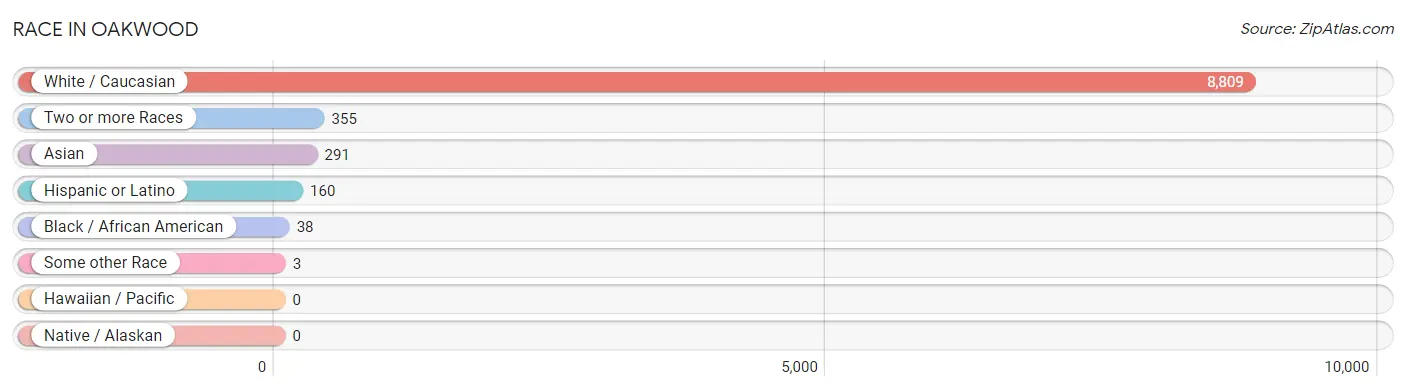
| Race | # Population | % Population |
| Asian | 291 | 3.1% |
| Black / African American | 38 | 0.4% |
| Hawaiian / Pacific | 0 | 0.0% |
| Hispanic or Latino | 160 | 1.7% |
| Native / Alaskan | 0 | 0.0% |
| White / Caucasian | 8,809 | 92.8% |
| Two or more Races | 355 | 3.7% |
| Some other Race | 3 | 0.0% |
| Total | 9,496 | 100.0% |
Ancestry in Oakwood
The most populous ancestries reported in Oakwood are German (3,226 | 34.0%), Irish (1,908 | 20.1%), English (1,906 | 20.1%), Italian (602 | 6.3%), and Scottish (583 | 6.1%), together accounting for 86.6% of all Oakwood residents.
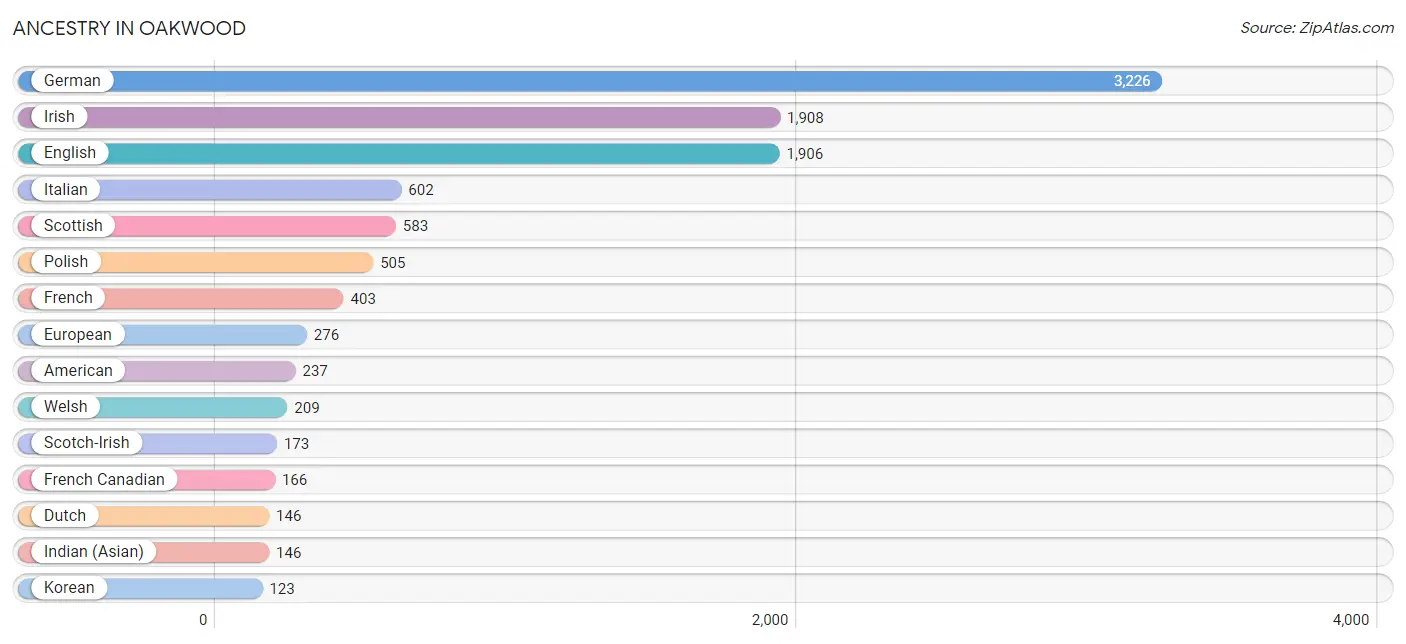
| Ancestry | # Population | % Population |
| African | 9 | 0.1% |
| Albanian | 22 | 0.2% |
| American | 237 | 2.5% |
| Arab | 41 | 0.4% |
| Armenian | 45 | 0.5% |
| Australian | 31 | 0.3% |
| Austrian | 18 | 0.2% |
| Belgian | 5 | 0.1% |
| Bhutanese | 85 | 0.9% |
| British | 83 | 0.9% |
| Bulgarian | 19 | 0.2% |
| Burmese | 25 | 0.3% |
| Canadian | 22 | 0.2% |
| Celtic | 18 | 0.2% |
| Colombian | 52 | 0.5% |
| Cuban | 29 | 0.3% |
| Czech | 3 | 0.0% |
| Czechoslovakian | 17 | 0.2% |
| Danish | 110 | 1.2% |
| Dutch | 146 | 1.5% |
| Eastern European | 31 | 0.3% |
| English | 1,906 | 20.1% |
| European | 276 | 2.9% |
| Finnish | 10 | 0.1% |
| French | 403 | 4.2% |
| French Canadian | 166 | 1.8% |
| German | 3,226 | 34.0% |
| Greek | 60 | 0.6% |
| Hungarian | 92 | 1.0% |
| Indian (Asian) | 146 | 1.5% |
| Irish | 1,908 | 20.1% |
| Italian | 602 | 6.3% |
| Korean | 123 | 1.3% |
| Lebanese | 1 | 0.0% |
| Lithuanian | 18 | 0.2% |
| Mexican | 31 | 0.3% |
| Northern European | 28 | 0.3% |
| Norwegian | 98 | 1.0% |
| Palestinian | 41 | 0.4% |
| Polish | 505 | 5.3% |
| Portuguese | 40 | 0.4% |
| Russian | 44 | 0.5% |
| Scandinavian | 29 | 0.3% |
| Scotch-Irish | 173 | 1.8% |
| Scottish | 583 | 6.1% |
| Slovak | 29 | 0.3% |
| South American | 52 | 0.5% |
| Spanish | 40 | 0.4% |
| Sri Lankan | 14 | 0.2% |
| Subsaharan African | 9 | 0.1% |
| Swedish | 118 | 1.2% |
| Swiss | 40 | 0.4% |
| Ukrainian | 16 | 0.2% |
| Welsh | 209 | 2.2% | View All 54 Rows |
Immigrants in Oakwood
The most numerous immigrant groups reported in Oakwood came from Asia (254 | 2.7%), Eastern Asia (178 | 1.9%), China (149 | 1.6%), Europe (104 | 1.1%), and Canada (83 | 0.9%), together accounting for 8.1% of all Oakwood residents.
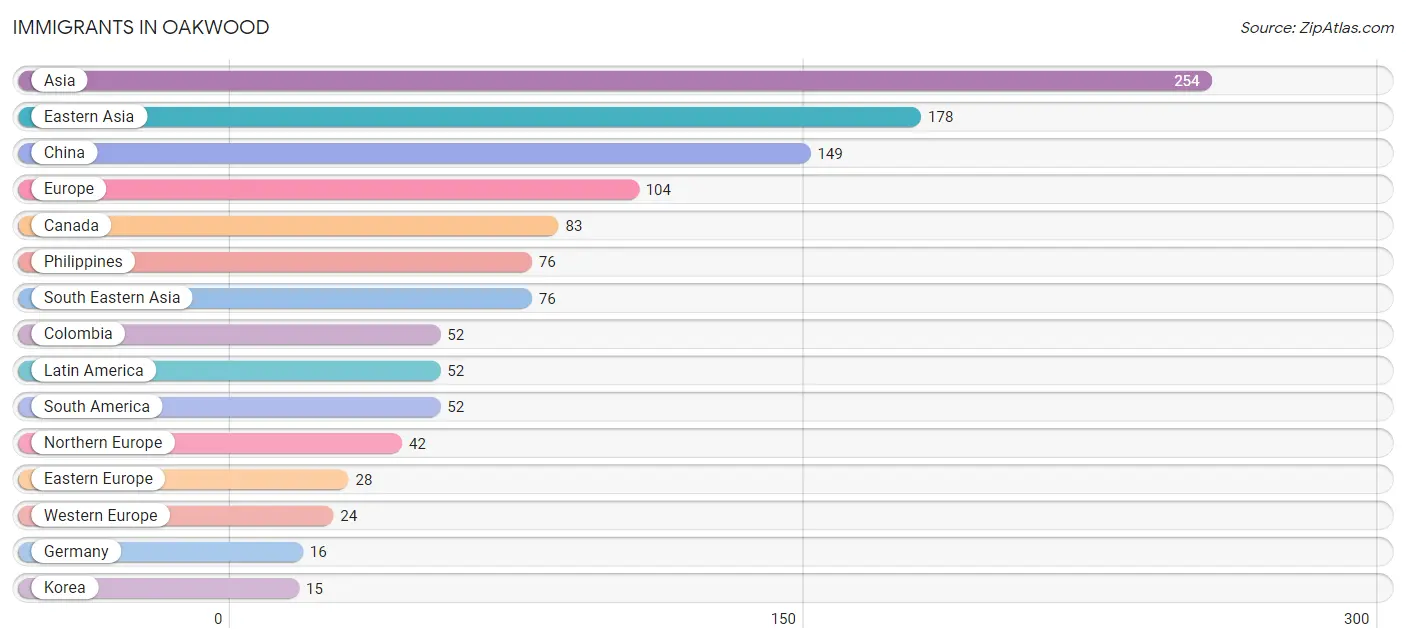
| Immigration Origin | # Population | % Population |
| Africa | 9 | 0.1% |
| Asia | 254 | 2.7% |
| Belarus | 6 | 0.1% |
| Canada | 83 | 0.9% |
| China | 149 | 1.6% |
| Colombia | 52 | 0.5% |
| Eastern Asia | 178 | 1.9% |
| Eastern Europe | 28 | 0.3% |
| Europe | 104 | 1.1% |
| France | 8 | 0.1% |
| Germany | 16 | 0.2% |
| Italy | 10 | 0.1% |
| Japan | 14 | 0.2% |
| Korea | 15 | 0.2% |
| Latin America | 52 | 0.5% |
| Middle Africa | 9 | 0.1% |
| Northern Europe | 42 | 0.4% |
| Philippines | 76 | 0.8% |
| South America | 52 | 0.5% |
| South Eastern Asia | 76 | 0.8% |
| Southern Europe | 10 | 0.1% |
| Western Europe | 24 | 0.3% |
| Zaire | 9 | 0.1% | View All 23 Rows |
Sex and Age in Oakwood
Sex and Age in Oakwood
The most populous age groups in Oakwood are 10 to 14 Years (728 | 16.7%) for men and 50 to 54 Years (563 | 11.0%) for women.
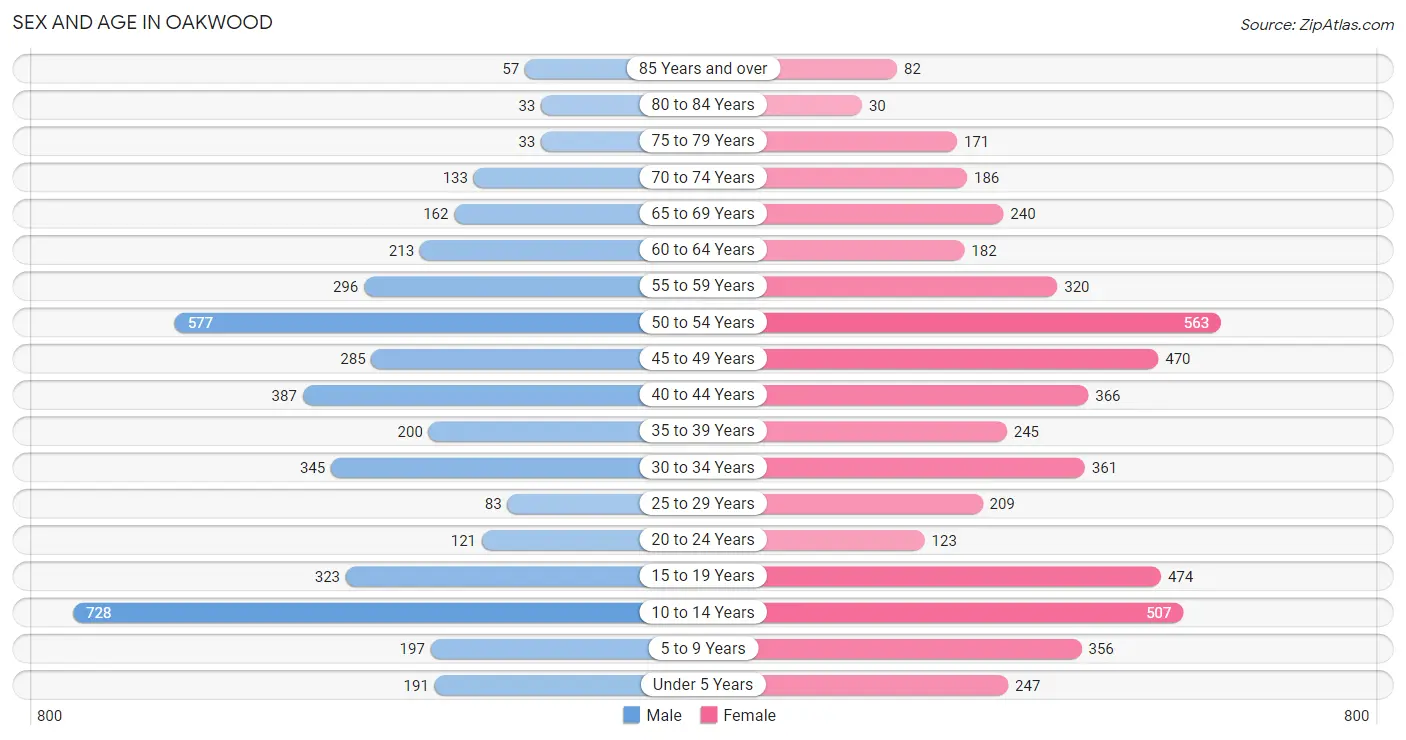
| Age Bracket | Male | Female |
| Under 5 Years | 191 (4.4%) | 247 (4.8%) |
| 5 to 9 Years | 197 (4.5%) | 356 (6.9%) |
| 10 to 14 Years | 728 (16.7%) | 507 (9.9%) |
| 15 to 19 Years | 323 (7.4%) | 474 (9.2%) |
| 20 to 24 Years | 121 (2.8%) | 123 (2.4%) |
| 25 to 29 Years | 83 (1.9%) | 209 (4.1%) |
| 30 to 34 Years | 345 (7.9%) | 361 (7.0%) |
| 35 to 39 Years | 200 (4.6%) | 245 (4.8%) |
| 40 to 44 Years | 387 (8.9%) | 366 (7.1%) |
| 45 to 49 Years | 285 (6.5%) | 470 (9.2%) |
| 50 to 54 Years | 577 (13.2%) | 563 (11.0%) |
| 55 to 59 Years | 296 (6.8%) | 320 (6.2%) |
| 60 to 64 Years | 213 (4.9%) | 182 (3.5%) |
| 65 to 69 Years | 162 (3.7%) | 240 (4.7%) |
| 70 to 74 Years | 133 (3.0%) | 186 (3.6%) |
| 75 to 79 Years | 33 (0.8%) | 171 (3.3%) |
| 80 to 84 Years | 33 (0.8%) | 30 (0.6%) |
| 85 Years and over | 57 (1.3%) | 82 (1.6%) |
| Total | 4,364 (100.0%) | 5,132 (100.0%) |
Families and Households in Oakwood
Median Family Size in Oakwood
The median family size in Oakwood is 3.03 persons per family, with married-couple families (2,145 | 80.3%) accounting for the largest median family size of 3.19 persons per family. On the other hand, single male/father families (228 | 8.5%) represent the smallest median family size with 2.09 persons per family.
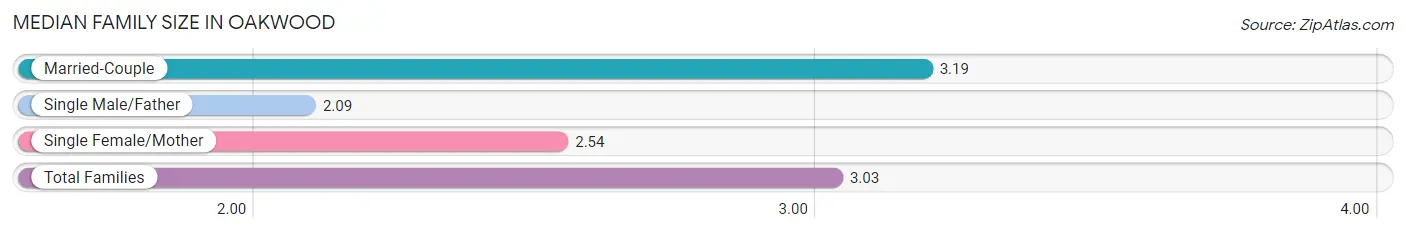
| Family Type | # Families | Family Size |
| Married-Couple | 2,145 (80.3%) | 3.19 |
| Single Male/Father | 228 (8.5%) | 2.09 |
| Single Female/Mother | 297 (11.1%) | 2.54 |
| Total Families | 2,670 (100.0%) | 3.03 |
Median Household Size in Oakwood
The median household size in Oakwood is 2.63 persons per household, with single male/father households (228 | 6.3%) accounting for the largest median household size of 3.47 persons per household. non-family households (940 | 26.0%) represent the smallest median household size with 1.12 persons per household.
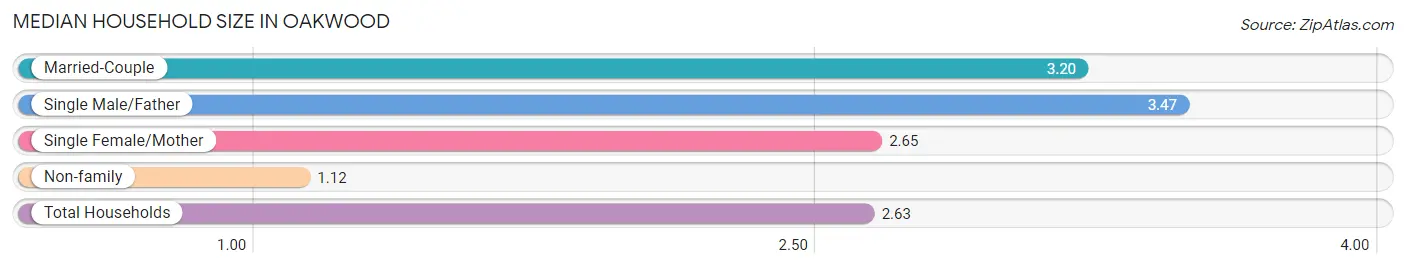
| Household Type | # Households | Household Size |
| Married-Couple | 2,145 (59.4%) | 3.20 |
| Single Male/Father | 228 (6.3%) | 3.47 |
| Single Female/Mother | 297 (8.2%) | 2.65 |
| Non-family | 940 (26.0%) | 1.12 |
| Total Households | 3,610 (100.0%) | 2.63 |
Household Size by Marriage Status in Oakwood
Out of a total of 3,610 households in Oakwood, 2,670 (74.0%) are family households, while 940 (26.0%) are nonfamily households. The most numerous type of family households are 2-person households, comprising 1,066, and the most common type of nonfamily households are 1-person households, comprising 848.
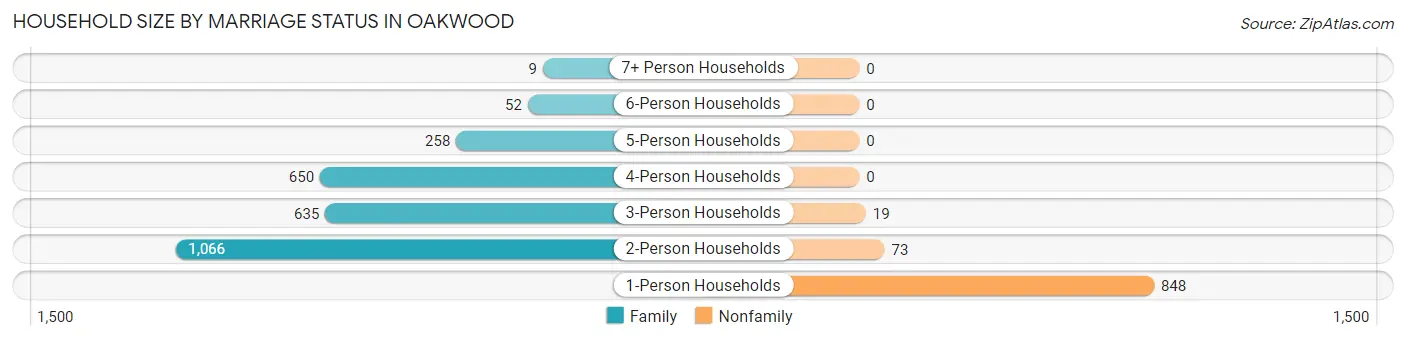
| Household Size | Family Households | Nonfamily Households |
| 1-Person Households | - | 848 (23.5%) |
| 2-Person Households | 1,066 (29.5%) | 73 (2.0%) |
| 3-Person Households | 635 (17.6%) | 19 (0.5%) |
| 4-Person Households | 650 (18.0%) | 0 (0.0%) |
| 5-Person Households | 258 (7.1%) | 0 (0.0%) |
| 6-Person Households | 52 (1.4%) | 0 (0.0%) |
| 7+ Person Households | 9 (0.3%) | 0 (0.0%) |
| Total | 2,670 (74.0%) | 940 (26.0%) |
Female Fertility in Oakwood
Fertility by Age in Oakwood
Average fertility rate in Oakwood is 20.0 births per 1,000 women. Women in the age bracket of 20 to 34 years have the highest fertility rate with 45.0 births per 1,000 women. Women in the age bracket of 20 to 34 years acount for 64.6% of all women with births.
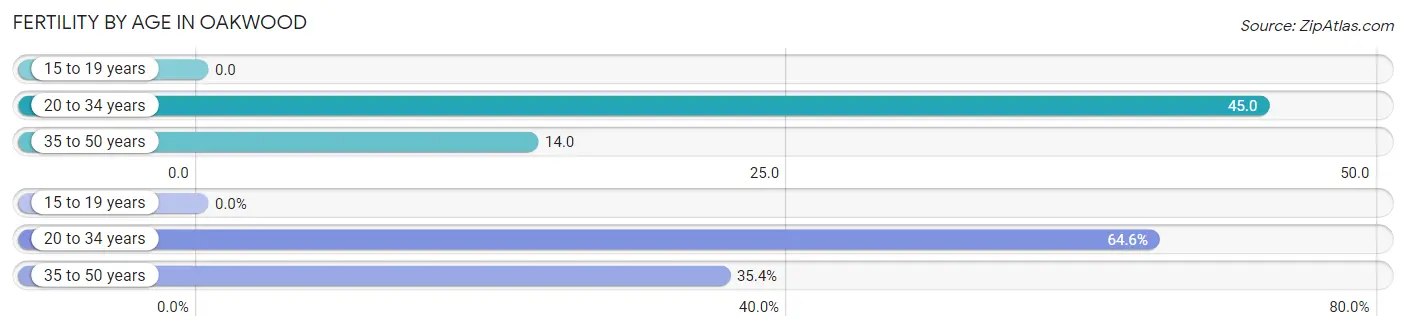
| Age Bracket | Women with Births | Births / 1,000 Women |
| 15 to 19 years | 0 (0.0%) | 0.0 |
| 20 to 34 years | 31 (64.6%) | 45.0 |
| 35 to 50 years | 17 (35.4%) | 14.0 |
| Total | 48 (100.0%) | 20.0 |
Fertility by Age by Marriage Status in Oakwood
81.2% of women with births (48) in Oakwood are married. The highest percentage of unmarried women with births falls into 20 to 34 years age bracket with 29.0% of them unmarried at the time of birth, while the lowest percentage of unmarried women with births belong to 35 to 50 years age bracket with 0.0% of them unmarried.
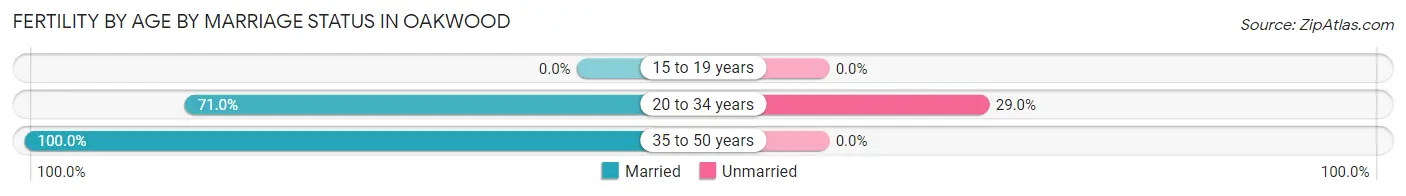
| Age Bracket | Married | Unmarried |
| 15 to 19 years | 0 (0.0%) | 0 (0.0%) |
| 20 to 34 years | 22 (71.0%) | 9 (29.0%) |
| 35 to 50 years | 17 (100.0%) | 0 (0.0%) |
| Total | 39 (81.2%) | 9 (18.8%) |
Fertility by Education in Oakwood
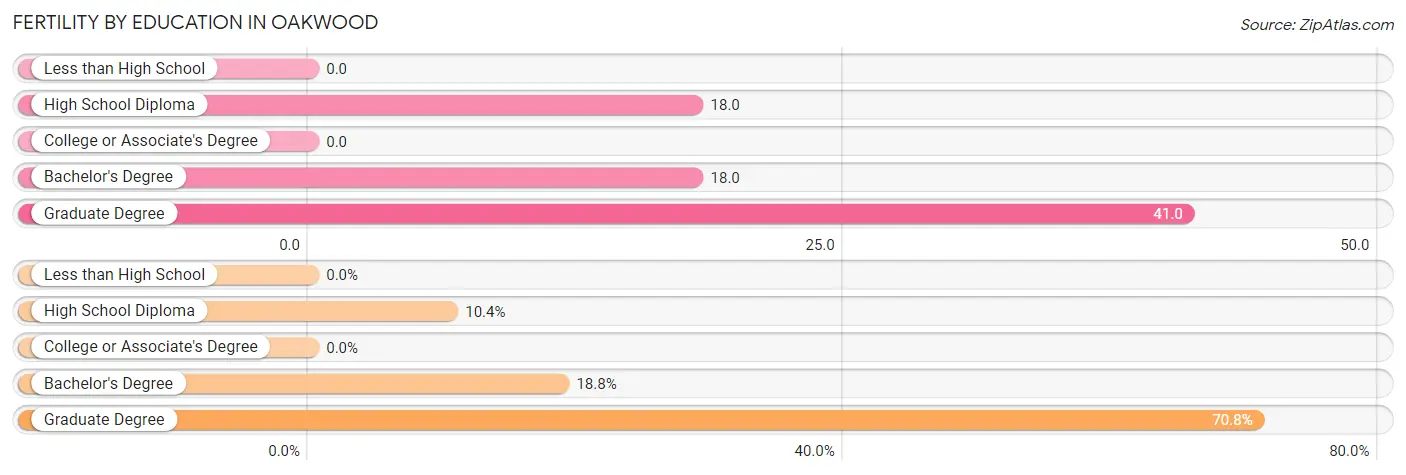
| Educational Attainment | Women with Births | Births / 1,000 Women |
| Less than High School | 0 (0.0%) | 0.0 |
| High School Diploma | 5 (10.4%) | 18.0 |
| College or Associate's Degree | 0 (0.0%) | 0.0 |
| Bachelor's Degree | 9 (18.8%) | 18.0 |
| Graduate Degree | 34 (70.8%) | 41.0 |
| Total | 48 (100.0%) | 20.0 |
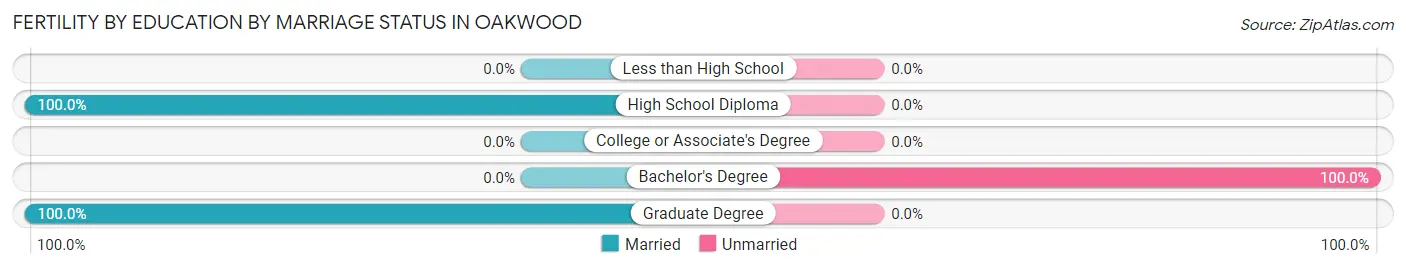
Fertility by Education by Marriage Status in Oakwood
18.8% of women with births in Oakwood are unmarried. Women with the educational attainment of high school diploma are most likely to be married with 100.0% of them married at childbirth, while women with the educational attainment of bachelor's degree are least likely to be married with 100.0% of them unmarried at childbirth.
| Educational Attainment | Married | Unmarried |
| Less than High School | 0 (0.0%) | 0 (0.0%) |
| High School Diploma | 5 (100.0%) | 0 (0.0%) |
| College or Associate's Degree | 0 (0.0%) | 0 (0.0%) |
| Bachelor's Degree | 0 (0.0%) | 9 (100.0%) |
| Graduate Degree | 34 (100.0%) | 0 (0.0%) |
| Total | 39 (81.2%) | 9 (18.8%) |
Employment Characteristics in Oakwood
Employment by Class of Employer in Oakwood
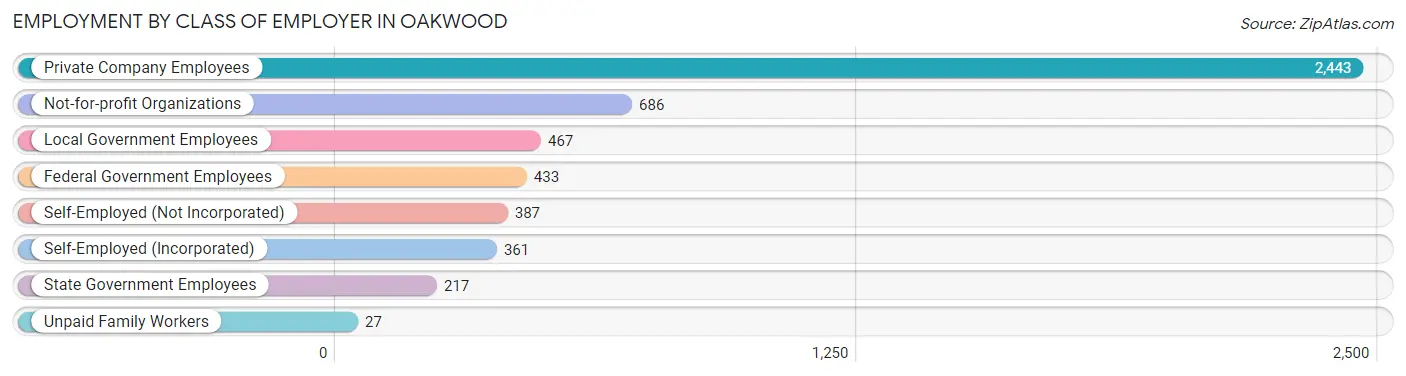
Among the 5,021 employed individuals in Oakwood, private company employees (2,443 | 48.7%), not-for-profit organizations (686 | 13.7%), and local government employees (467 | 9.3%) make up the most common classes of employment.
| Employer Class | # Employees | % Employees |
| Private Company Employees | 2,443 | 48.7% |
| Self-Employed (Incorporated) | 361 | 7.2% |
| Self-Employed (Not Incorporated) | 387 | 7.7% |
| Not-for-profit Organizations | 686 | 13.7% |
| Local Government Employees | 467 | 9.3% |
| State Government Employees | 217 | 4.3% |
| Federal Government Employees | 433 | 8.6% |
| Unpaid Family Workers | 27 | 0.5% |
| Total | 5,021 | 100.0% |
Employment Status by Age in Oakwood
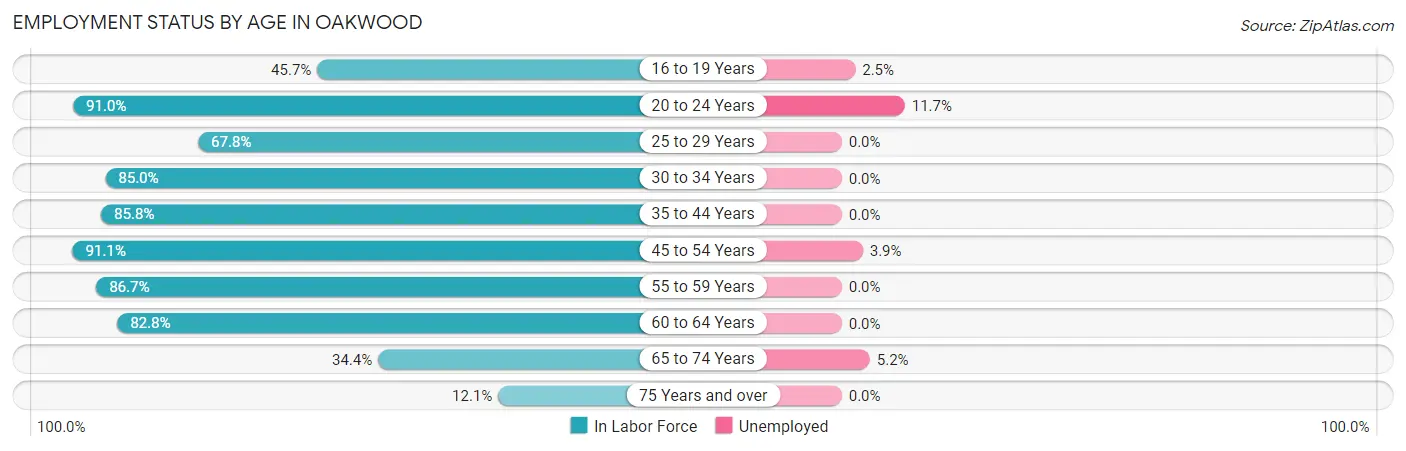
According to the labor force statistics for Oakwood, out of the total population over 16 years of age (7,003), 73.9% or 5,175 individuals are in the labor force, with 2.2% or 114 of them unemployed. The age group with the highest labor force participation rate is 45 to 54 years, with 91.1% or 1,726 individuals in the labor force. Within the labor force, the 20 to 24 years age range has the highest percentage of unemployed individuals, with 11.7% or 26 of them being unemployed.
| Age Bracket | In Labor Force | Unemployed |
| 16 to 19 Years | 242 (45.7%) | 6 (2.5%) |
| 20 to 24 Years | 222 (91.0%) | 26 (11.7%) |
| 25 to 29 Years | 198 (67.8%) | 0 (0.0%) |
| 30 to 34 Years | 600 (85.0%) | 0 (0.0%) |
| 35 to 44 Years | 1,028 (85.8%) | 0 (0.0%) |
| 45 to 54 Years | 1,726 (91.1%) | 67 (3.9%) |
| 55 to 59 Years | 534 (86.7%) | 0 (0.0%) |
| 60 to 64 Years | 327 (82.8%) | 0 (0.0%) |
| 65 to 74 Years | 248 (34.4%) | 13 (5.2%) |
| 75 Years and over | 49 (12.1%) | 0 (0.0%) |
| Total | 5,175 (73.9%) | 114 (2.2%) |
Employment Status by Educational Attainment in Oakwood
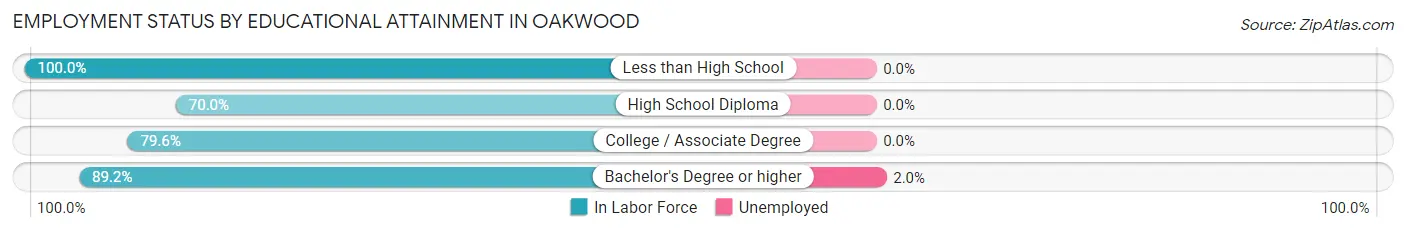
According to labor force statistics for Oakwood, 86.5% of individuals (4,413) out of the total population between 25 and 64 years of age (5,102) are in the labor force, with 1.5% or 66 of them being unemployed. The group with the highest labor force participation rate are those with the educational attainment of less than high school, with 100.0% or 60 individuals in the labor force. Within the labor force, individuals with bachelor's degree or higher education have the highest percentage of unemployment, with 2.0% or 68 of them being unemployed.
| Educational Attainment | In Labor Force | Unemployed |
| Less than High School | 60 (100.0%) | 0 (0.0%) |
| High School Diploma | 175 (70.0%) | 0 (0.0%) |
| College / Associate Degree | 784 (79.6%) | 0 (0.0%) |
| Bachelor's Degree or higher | 3,396 (89.2%) | 76 (2.0%) |
| Total | 4,413 (86.5%) | 77 (1.5%) |
Employment Occupations by Sex in Oakwood
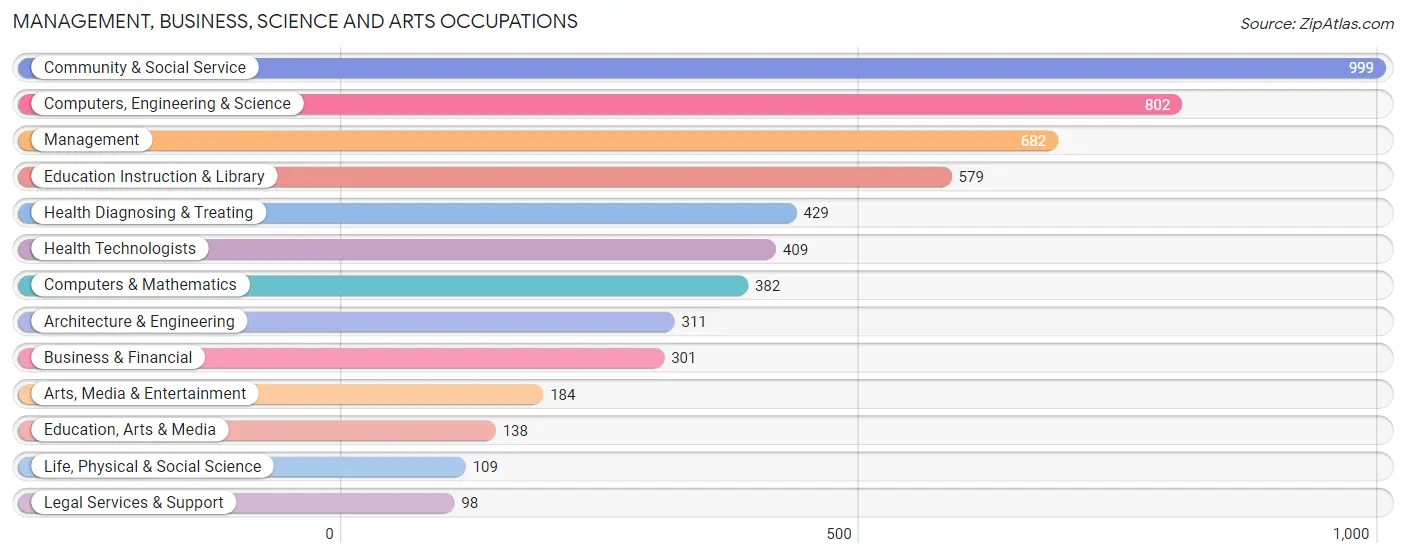
Management, Business, Science and Arts Occupations
The most common Management, Business, Science and Arts occupations in Oakwood are Community & Social Service (999 | 19.9%), Computers, Engineering & Science (802 | 16.0%), Management (682 | 13.6%), Education Instruction & Library (579 | 11.6%), and Health Diagnosing & Treating (429 | 8.6%).
Management, Business, Science and Arts Occupations by Sex
Within the Management, Business, Science and Arts occupations in Oakwood, the most male-oriented occupations are Architecture & Engineering (98.1%), Computers, Engineering & Science (91.4%), and Life, Physical & Social Science (89.0%), while the most female-oriented occupations are Arts, Media & Entertainment (91.3%), Education, Arts & Media (76.1%), and Health Diagnosing & Treating (74.8%).
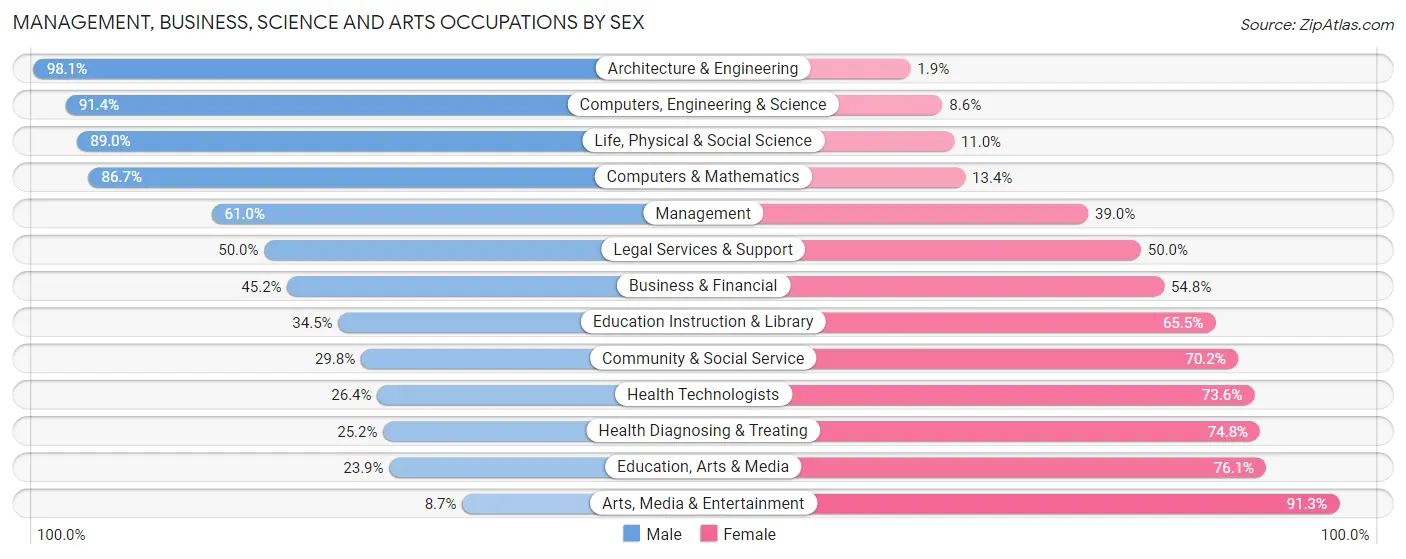
| Occupation | Male | Female |
| Management | 416 (61.0%) | 266 (39.0%) |
| Business & Financial | 136 (45.2%) | 165 (54.8%) |
| Computers, Engineering & Science | 733 (91.4%) | 69 (8.6%) |
| Computers & Mathematics | 331 (86.7%) | 51 (13.4%) |
| Architecture & Engineering | 305 (98.1%) | 6 (1.9%) |
| Life, Physical & Social Science | 97 (89.0%) | 12 (11.0%) |
| Community & Social Service | 298 (29.8%) | 701 (70.2%) |
| Education, Arts & Media | 33 (23.9%) | 105 (76.1%) |
| Legal Services & Support | 49 (50.0%) | 49 (50.0%) |
| Education Instruction & Library | 200 (34.5%) | 379 (65.5%) |
| Arts, Media & Entertainment | 16 (8.7%) | 168 (91.3%) |
| Health Diagnosing & Treating | 108 (25.2%) | 321 (74.8%) |
| Health Technologists | 108 (26.4%) | 301 (73.6%) |
| Total (Category) | 1,691 (52.6%) | 1,522 (47.4%) |
| Total (Overall) | 2,508 (50.1%) | 2,501 (49.9%) |
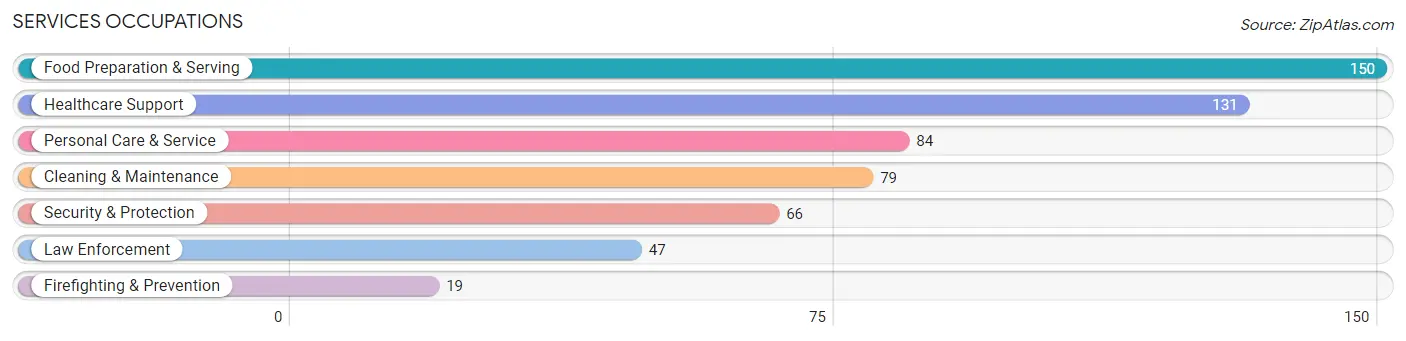
Services Occupations
The most common Services occupations in Oakwood are Food Preparation & Serving (150 | 3.0%), Healthcare Support (131 | 2.6%), Personal Care & Service (84 | 1.7%), Cleaning & Maintenance (79 | 1.6%), and Security & Protection (66 | 1.3%).
Services Occupations by Sex
Within the Services occupations in Oakwood, the most male-oriented occupations are Security & Protection (100.0%), Firefighting & Prevention (100.0%), and Law Enforcement (100.0%), while the most female-oriented occupations are Healthcare Support (100.0%), Personal Care & Service (100.0%), and Food Preparation & Serving (48.0%).
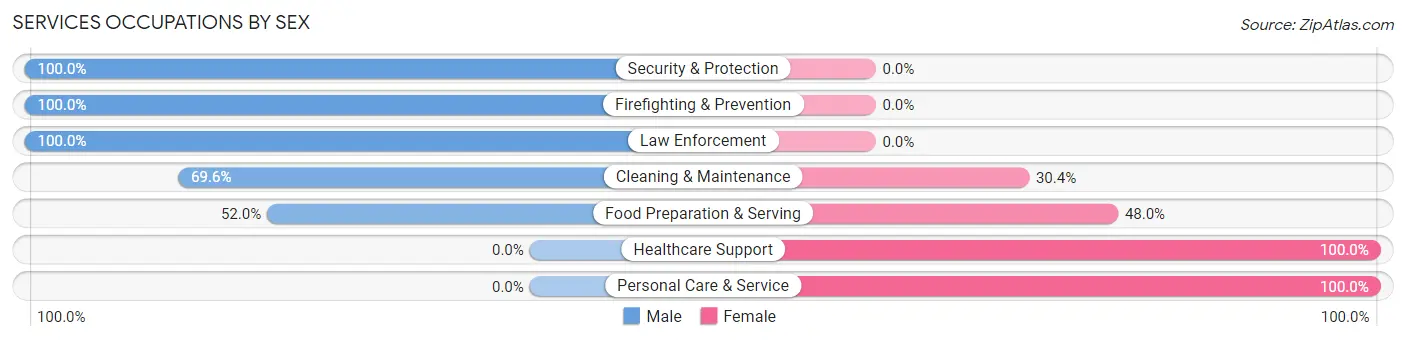
| Occupation | Male | Female |
| Healthcare Support | 0 (0.0%) | 131 (100.0%) |
| Security & Protection | 66 (100.0%) | 0 (0.0%) |
| Firefighting & Prevention | 19 (100.0%) | 0 (0.0%) |
| Law Enforcement | 47 (100.0%) | 0 (0.0%) |
| Food Preparation & Serving | 78 (52.0%) | 72 (48.0%) |
| Cleaning & Maintenance | 55 (69.6%) | 24 (30.4%) |
| Personal Care & Service | 0 (0.0%) | 84 (100.0%) |
| Total (Category) | 199 (39.0%) | 311 (61.0%) |
| Total (Overall) | 2,508 (50.1%) | 2,501 (49.9%) |
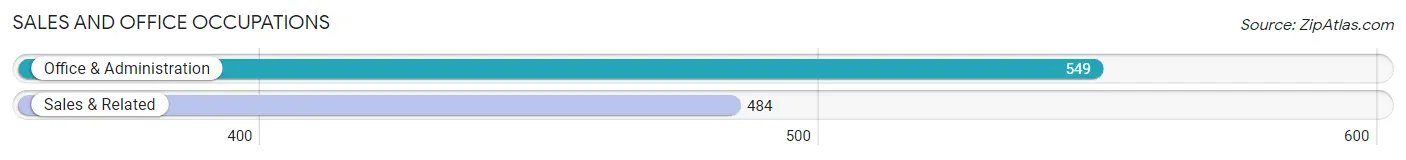
Sales and Office Occupations
The most common Sales and Office occupations in Oakwood are Office & Administration (549 | 11.0%), and Sales & Related (484 | 9.7%).
Sales and Office Occupations by Sex
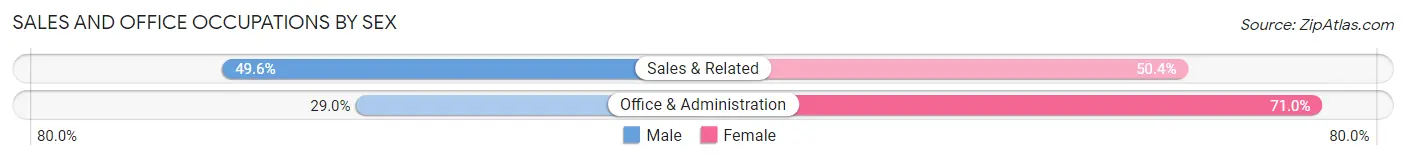
| Occupation | Male | Female |
| Sales & Related | 240 (49.6%) | 244 (50.4%) |
| Office & Administration | 159 (29.0%) | 390 (71.0%) |
| Total (Category) | 399 (38.6%) | 634 (61.4%) |
| Total (Overall) | 2,508 (50.1%) | 2,501 (49.9%) |
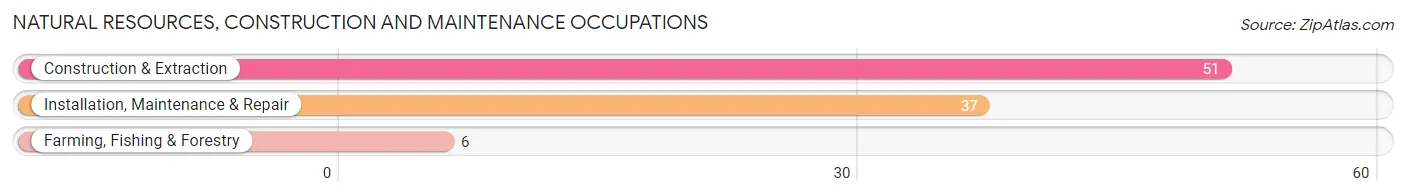
Natural Resources, Construction and Maintenance Occupations
The most common Natural Resources, Construction and Maintenance occupations in Oakwood are Construction & Extraction (51 | 1.0%), Installation, Maintenance & Repair (37 | 0.7%), and Farming, Fishing & Forestry (6 | 0.1%).
Natural Resources, Construction and Maintenance Occupations by Sex
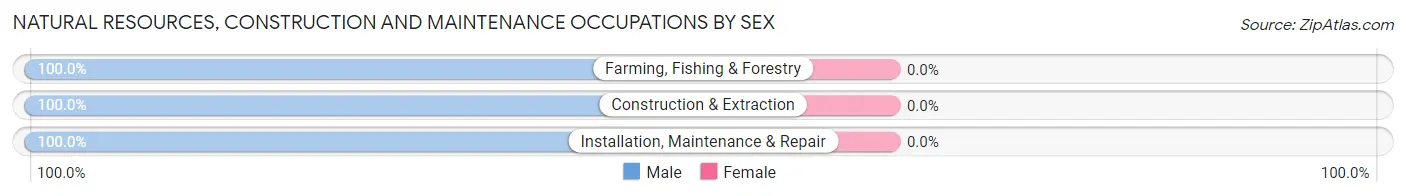
| Occupation | Male | Female |
| Farming, Fishing & Forestry | 6 (100.0%) | 0 (0.0%) |
| Construction & Extraction | 51 (100.0%) | 0 (0.0%) |
| Installation, Maintenance & Repair | 37 (100.0%) | 0 (0.0%) |
| Total (Category) | 94 (100.0%) | 0 (0.0%) |
| Total (Overall) | 2,508 (50.1%) | 2,501 (49.9%) |
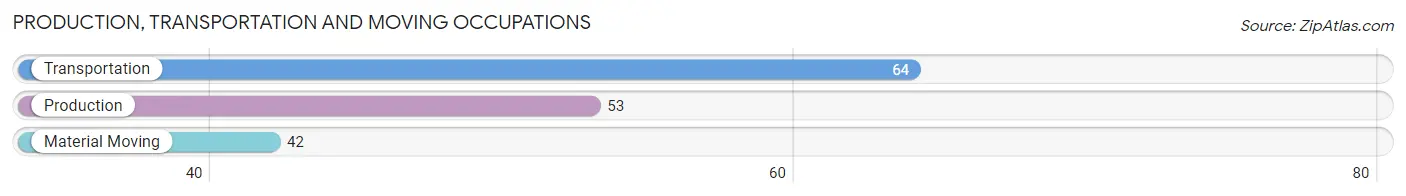
Production, Transportation and Moving Occupations
The most common Production, Transportation and Moving occupations in Oakwood are Transportation (64 | 1.3%), Production (53 | 1.1%), and Material Moving (42 | 0.8%).
Production, Transportation and Moving Occupations by Sex
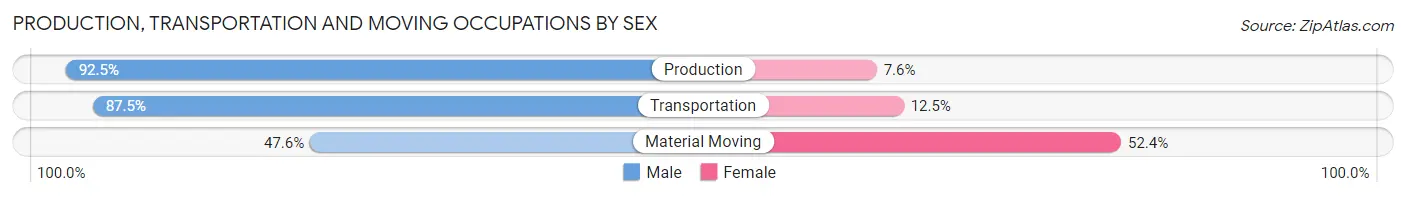
| Occupation | Male | Female |
| Production | 49 (92.4%) | 4 (7.5%) |
| Transportation | 56 (87.5%) | 8 (12.5%) |
| Material Moving | 20 (47.6%) | 22 (52.4%) |
| Total (Category) | 125 (78.6%) | 34 (21.4%) |
| Total (Overall) | 2,508 (50.1%) | 2,501 (49.9%) |
Employment Industries by Sex in Oakwood
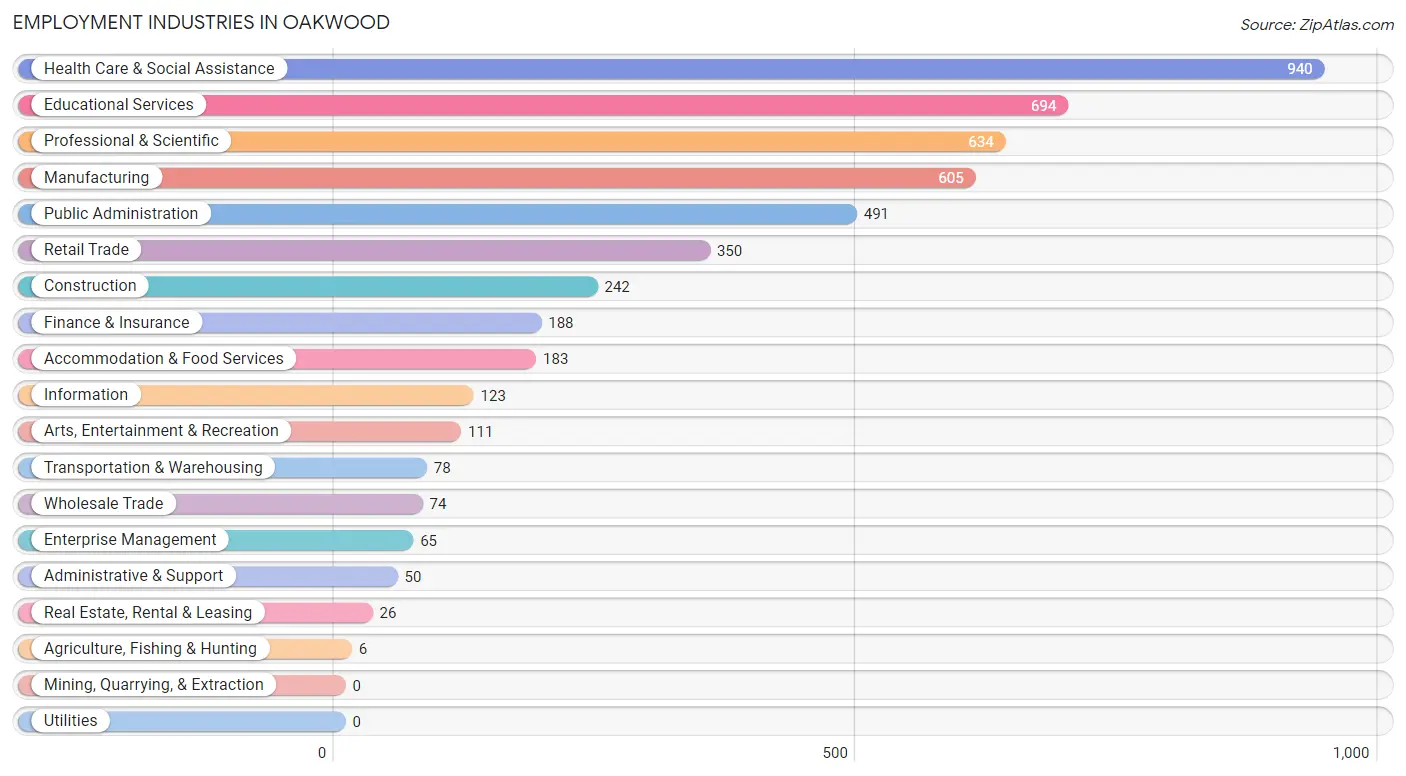
Employment Industries in Oakwood
The major employment industries in Oakwood include Health Care & Social Assistance (940 | 18.8%), Educational Services (694 | 13.9%), Professional & Scientific (634 | 12.7%), Manufacturing (605 | 12.1%), and Public Administration (491 | 9.8%).
Employment Industries by Sex in Oakwood
The Oakwood industries that see more men than women are Agriculture, Fishing & Hunting (100.0%), Real Estate, Rental & Leasing (100.0%), and Construction (97.5%), whereas the industries that tend to have a higher number of women are Enterprise Management (90.8%), Administrative & Support (86.0%), and Health Care & Social Assistance (83.8%).
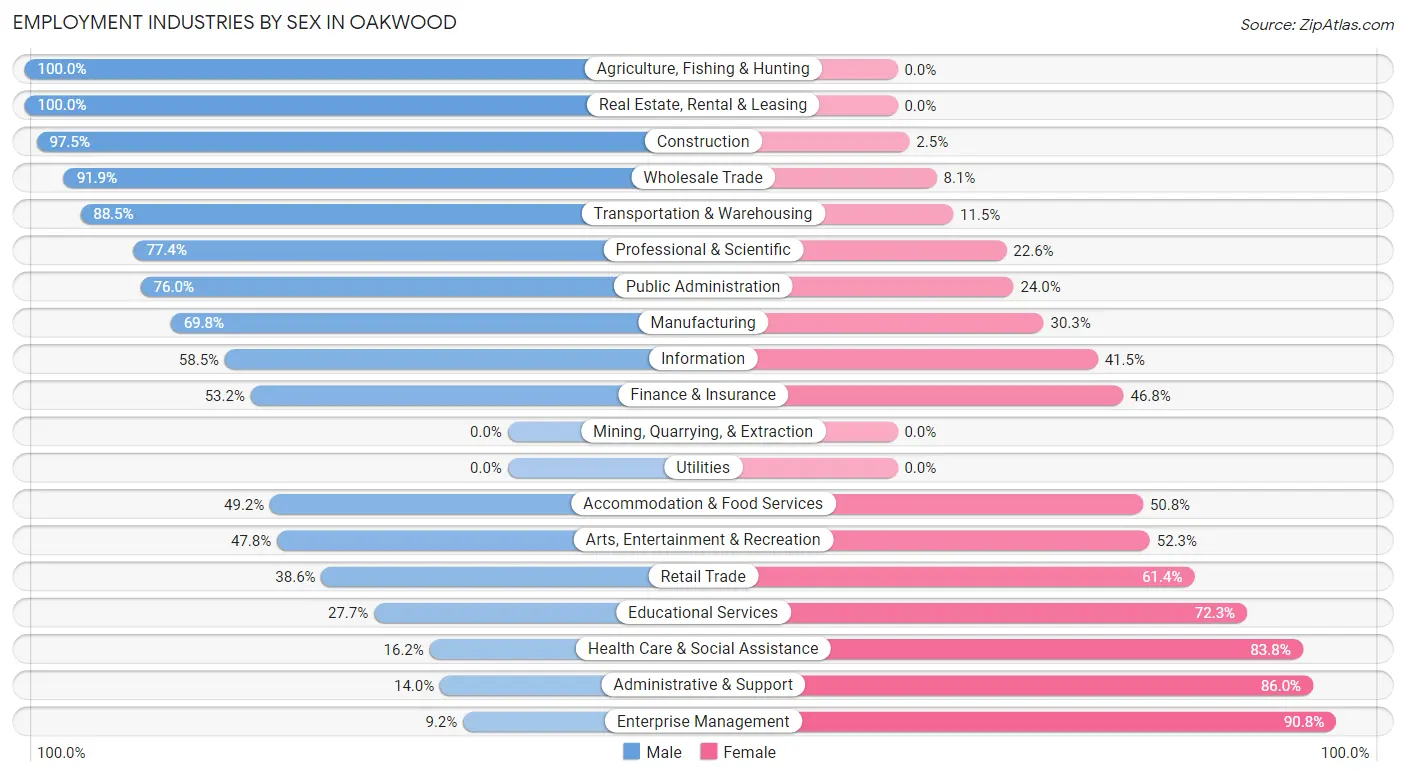
| Industry | Male | Female |
| Agriculture, Fishing & Hunting | 6 (100.0%) | 0 (0.0%) |
| Mining, Quarrying, & Extraction | 0 (0.0%) | 0 (0.0%) |
| Construction | 236 (97.5%) | 6 (2.5%) |
| Manufacturing | 422 (69.8%) | 183 (30.2%) |
| Wholesale Trade | 68 (91.9%) | 6 (8.1%) |
| Retail Trade | 135 (38.6%) | 215 (61.4%) |
| Transportation & Warehousing | 69 (88.5%) | 9 (11.5%) |
| Utilities | 0 (0.0%) | 0 (0.0%) |
| Information | 72 (58.5%) | 51 (41.5%) |
| Finance & Insurance | 100 (53.2%) | 88 (46.8%) |
| Real Estate, Rental & Leasing | 26 (100.0%) | 0 (0.0%) |
| Professional & Scientific | 491 (77.4%) | 143 (22.6%) |
| Enterprise Management | 6 (9.2%) | 59 (90.8%) |
| Administrative & Support | 7 (14.0%) | 43 (86.0%) |
| Educational Services | 192 (27.7%) | 502 (72.3%) |
| Health Care & Social Assistance | 152 (16.2%) | 788 (83.8%) |
| Arts, Entertainment & Recreation | 53 (47.7%) | 58 (52.2%) |
| Accommodation & Food Services | 90 (49.2%) | 93 (50.8%) |
| Public Administration | 373 (76.0%) | 118 (24.0%) |
| Total | 2,508 (50.1%) | 2,501 (49.9%) |
Education in Oakwood
School Enrollment in Oakwood
The most common levels of schooling among the 3,369 students in Oakwood are middle school (1,042 | 30.9%), high school (766 | 22.7%), and elementary school (475 | 14.1%).
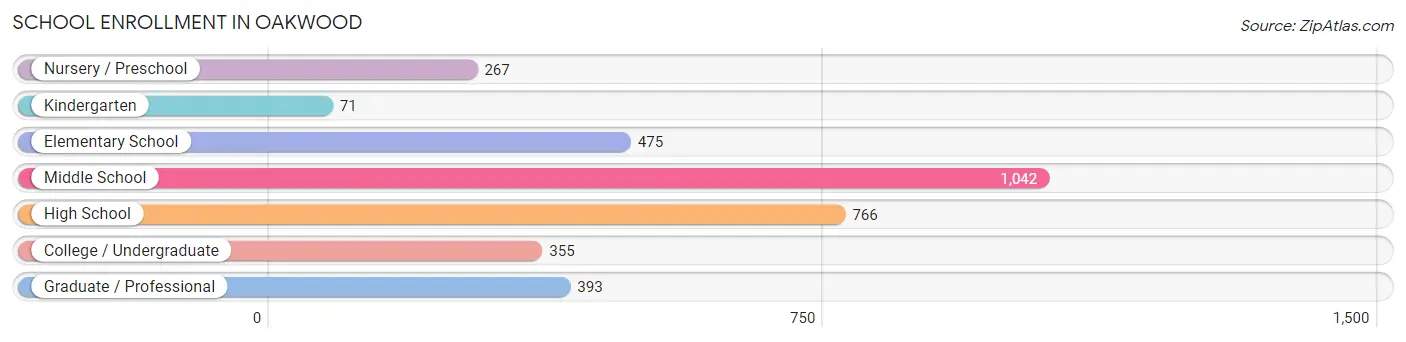
| School Level | # Students | % Students |
| Nursery / Preschool | 267 | 7.9% |
| Kindergarten | 71 | 2.1% |
| Elementary School | 475 | 14.1% |
| Middle School | 1,042 | 30.9% |
| High School | 766 | 22.7% |
| College / Undergraduate | 355 | 10.5% |
| Graduate / Professional | 393 | 11.7% |
| Total | 3,369 | 100.0% |
School Enrollment by Age by Funding Source in Oakwood
Out of a total of 3,369 students who are enrolled in schools in Oakwood, 617 (18.3%) attend a private institution, while the remaining 2,752 (81.7%) are enrolled in public schools. The age group of 3 to 4 year olds has the highest likelihood of being enrolled in private schools, with 171 (87.2% in the age bracket) enrolled. Conversely, the age group of 15 to 17 year olds has the lowest likelihood of being enrolled in a private school, with 588 (95.0% in the age bracket) attending a public institution.
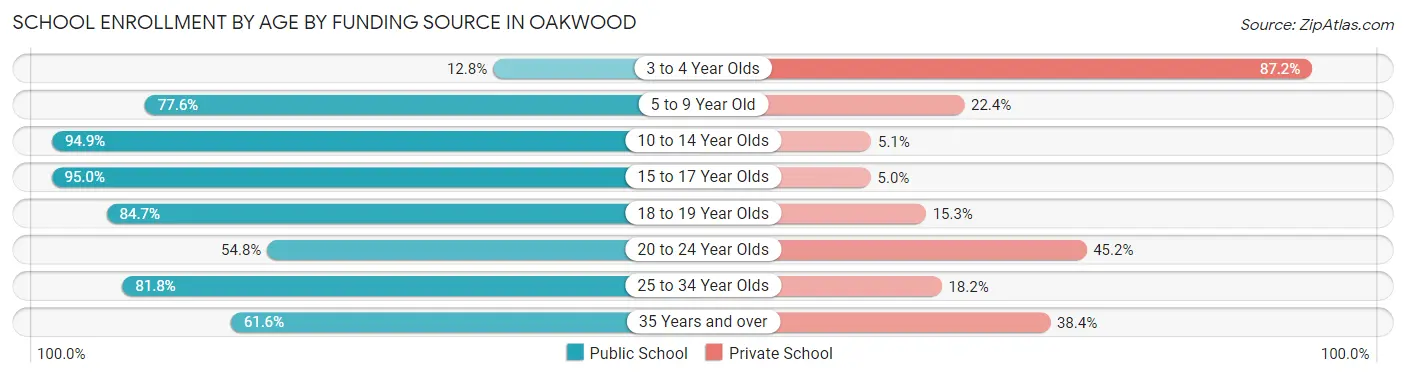
| Age Bracket | Public School | Private School |
| 3 to 4 Year Olds | 25 (12.8%) | 171 (87.2%) |
| 5 to 9 Year Old | 429 (77.6%) | 124 (22.4%) |
| 10 to 14 Year Olds | 1,172 (94.9%) | 63 (5.1%) |
| 15 to 17 Year Olds | 588 (95.0%) | 31 (5.0%) |
| 18 to 19 Year Olds | 122 (84.7%) | 22 (15.3%) |
| 20 to 24 Year Olds | 91 (54.8%) | 75 (45.2%) |
| 25 to 34 Year Olds | 175 (81.8%) | 39 (18.2%) |
| 35 Years and over | 149 (61.6%) | 93 (38.4%) |
| Total | 2,752 (81.7%) | 617 (18.3%) |
Educational Attainment by Field of Study in Oakwood
Business (918 | 18.2%), education (515 | 10.2%), engineering (484 | 9.6%), science & technology (467 | 9.3%), and social sciences (402 | 8.0%) are the most common fields of study among 5,034 individuals in Oakwood who have obtained a bachelor's degree or higher.
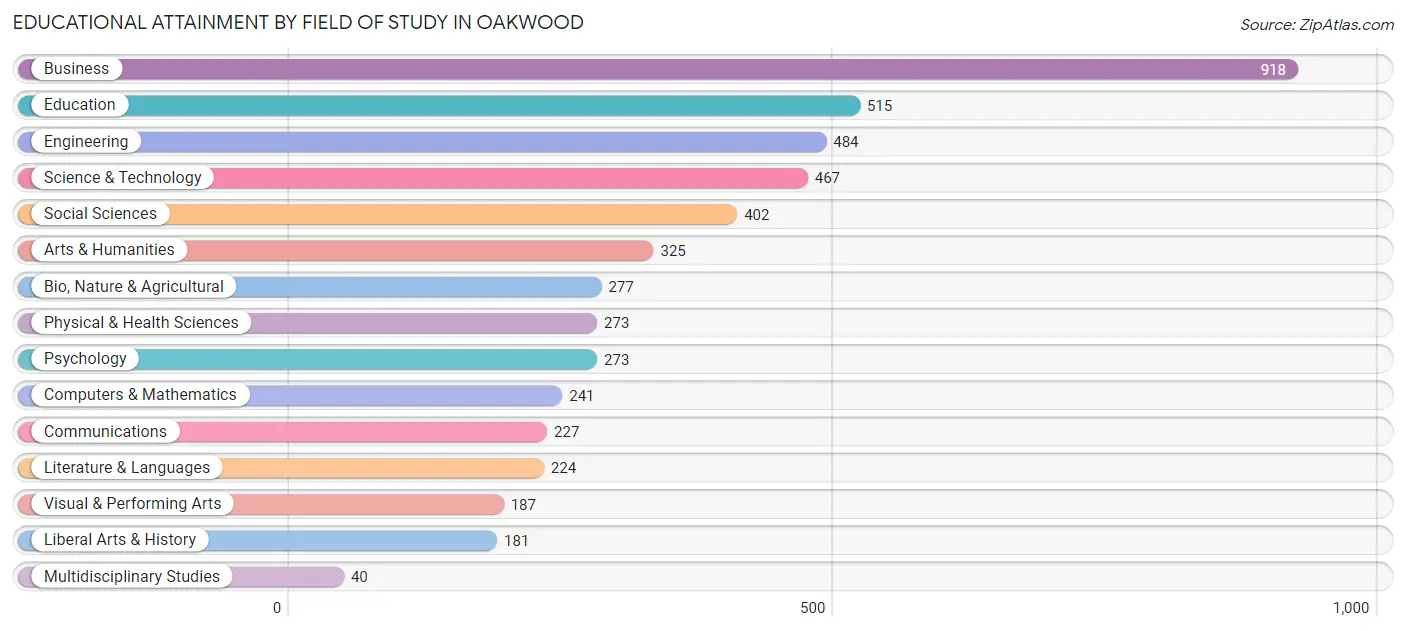
| Field of Study | # Graduates | % Graduates |
| Computers & Mathematics | 241 | 4.8% |
| Bio, Nature & Agricultural | 277 | 5.5% |
| Physical & Health Sciences | 273 | 5.4% |
| Psychology | 273 | 5.4% |
| Social Sciences | 402 | 8.0% |
| Engineering | 484 | 9.6% |
| Multidisciplinary Studies | 40 | 0.8% |
| Science & Technology | 467 | 9.3% |
| Business | 918 | 18.2% |
| Education | 515 | 10.2% |
| Literature & Languages | 224 | 4.4% |
| Liberal Arts & History | 181 | 3.6% |
| Visual & Performing Arts | 187 | 3.7% |
| Communications | 227 | 4.5% |
| Arts & Humanities | 325 | 6.5% |
| Total | 5,034 | 100.0% |
Transportation & Commute in Oakwood
Vehicle Availability by Sex in Oakwood
The most prevalent vehicle ownership categories in Oakwood are males with 2 vehicles (1,380, accounting for 54.5%) and females with 2 vehicles (1,190, making up 55.5%).
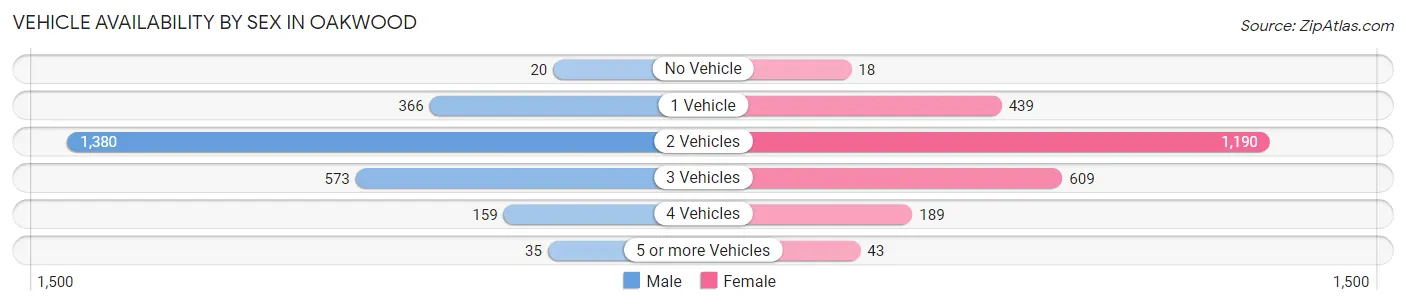
| Vehicles Available | Male | Female |
| No Vehicle | 20 (0.8%) | 18 (0.7%) |
| 1 Vehicle | 366 (14.4%) | 439 (17.6%) |
| 2 Vehicles | 1,380 (54.5%) | 1,190 (47.8%) |
| 3 Vehicles | 573 (22.6%) | 609 (24.5%) |
| 4 Vehicles | 159 (6.3%) | 189 (7.6%) |
| 5 or more Vehicles | 35 (1.4%) | 43 (1.7%) |
| Total | 2,533 (100.0%) | 2,488 (100.0%) |
Commute Time in Oakwood
The most frequently occuring commute durations in Oakwood are 20 to 24 minutes (1,020 commuters, 23.0%), 15 to 19 minutes (938 commuters, 21.1%), and 10 to 14 minutes (739 commuters, 16.7%).
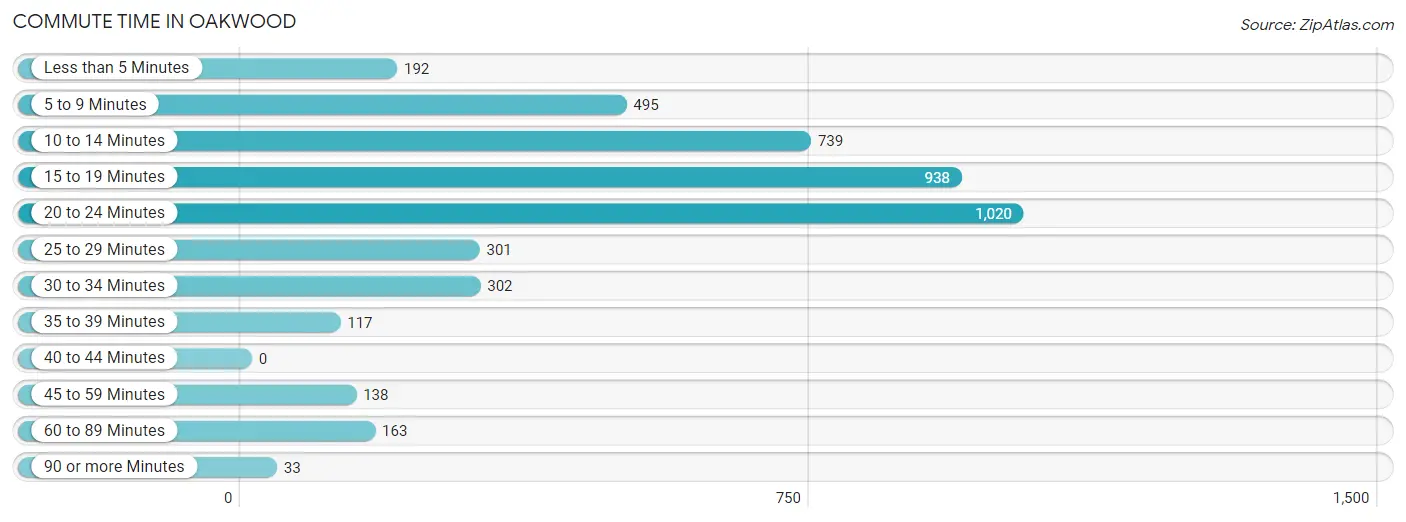
| Commute Time | # Commuters | % Commuters |
| Less than 5 Minutes | 192 | 4.3% |
| 5 to 9 Minutes | 495 | 11.2% |
| 10 to 14 Minutes | 739 | 16.7% |
| 15 to 19 Minutes | 938 | 21.1% |
| 20 to 24 Minutes | 1,020 | 23.0% |
| 25 to 29 Minutes | 301 | 6.8% |
| 30 to 34 Minutes | 302 | 6.8% |
| 35 to 39 Minutes | 117 | 2.6% |
| 40 to 44 Minutes | 0 | 0.0% |
| 45 to 59 Minutes | 138 | 3.1% |
| 60 to 89 Minutes | 163 | 3.7% |
| 90 or more Minutes | 33 | 0.7% |
Commute Time by Sex in Oakwood
The most common commute times in Oakwood are 20 to 24 minutes (553 commuters, 24.3%) for males and 15 to 19 minutes (471 commuters, 21.8%) for females.
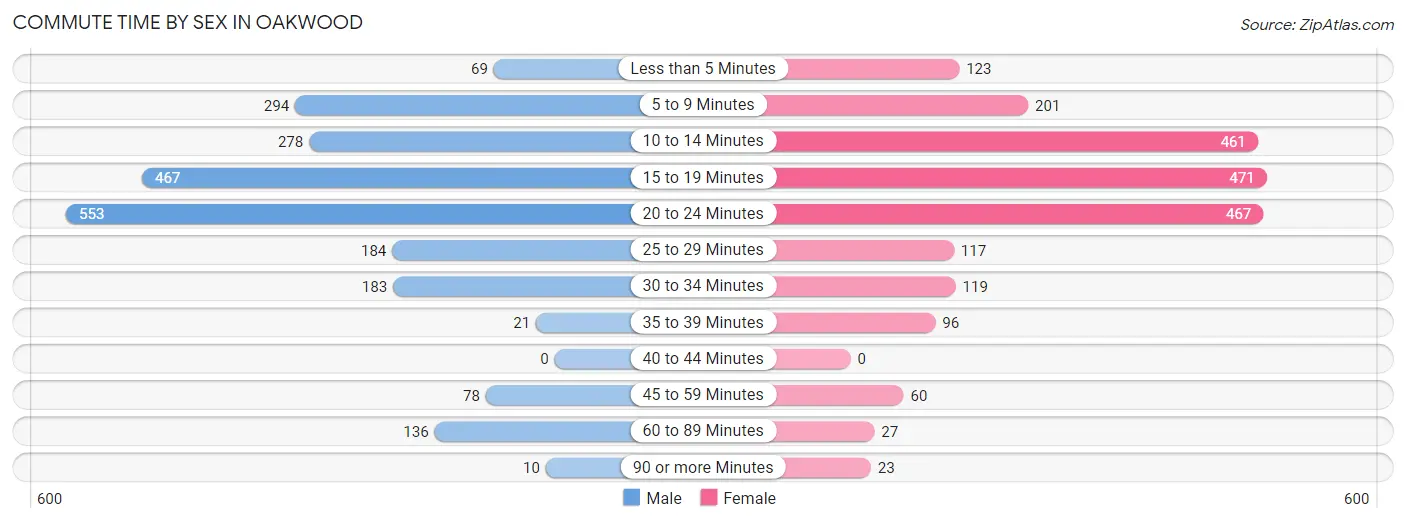
| Commute Time | Male | Female |
| Less than 5 Minutes | 69 (3.0%) | 123 (5.7%) |
| 5 to 9 Minutes | 294 (12.9%) | 201 (9.3%) |
| 10 to 14 Minutes | 278 (12.2%) | 461 (21.3%) |
| 15 to 19 Minutes | 467 (20.5%) | 471 (21.8%) |
| 20 to 24 Minutes | 553 (24.3%) | 467 (21.6%) |
| 25 to 29 Minutes | 184 (8.1%) | 117 (5.4%) |
| 30 to 34 Minutes | 183 (8.1%) | 119 (5.5%) |
| 35 to 39 Minutes | 21 (0.9%) | 96 (4.4%) |
| 40 to 44 Minutes | 0 (0.0%) | 0 (0.0%) |
| 45 to 59 Minutes | 78 (3.4%) | 60 (2.8%) |
| 60 to 89 Minutes | 136 (6.0%) | 27 (1.3%) |
| 90 or more Minutes | 10 (0.4%) | 23 (1.1%) |
Time of Departure to Work by Sex in Oakwood
The most frequent times of departure to work in Oakwood are 7:00 AM to 7:29 AM (455, 20.0%) for males and 8:30 AM to 8:59 AM (368, 17.0%) for females.
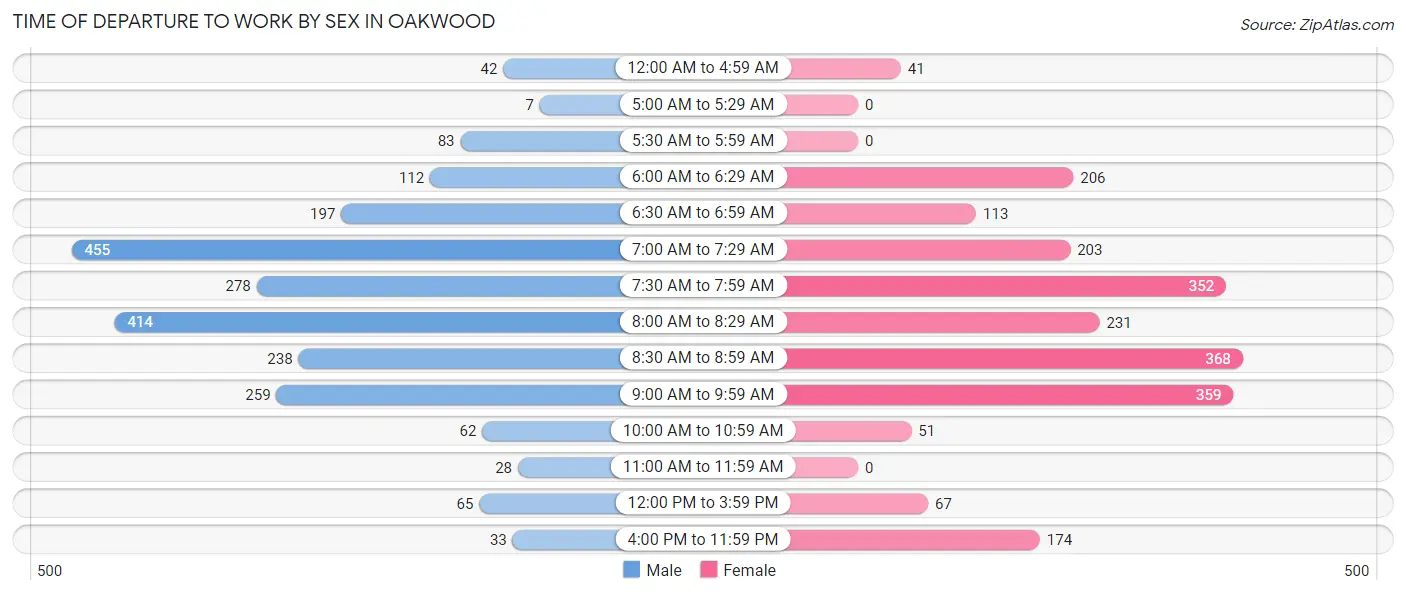
| Time of Departure | Male | Female |
| 12:00 AM to 4:59 AM | 42 (1.8%) | 41 (1.9%) |
| 5:00 AM to 5:29 AM | 7 (0.3%) | 0 (0.0%) |
| 5:30 AM to 5:59 AM | 83 (3.6%) | 0 (0.0%) |
| 6:00 AM to 6:29 AM | 112 (4.9%) | 206 (9.5%) |
| 6:30 AM to 6:59 AM | 197 (8.7%) | 113 (5.2%) |
| 7:00 AM to 7:29 AM | 455 (20.0%) | 203 (9.4%) |
| 7:30 AM to 7:59 AM | 278 (12.2%) | 352 (16.3%) |
| 8:00 AM to 8:29 AM | 414 (18.2%) | 231 (10.7%) |
| 8:30 AM to 8:59 AM | 238 (10.5%) | 368 (17.0%) |
| 9:00 AM to 9:59 AM | 259 (11.4%) | 359 (16.6%) |
| 10:00 AM to 10:59 AM | 62 (2.7%) | 51 (2.4%) |
| 11:00 AM to 11:59 AM | 28 (1.2%) | 0 (0.0%) |
| 12:00 PM to 3:59 PM | 65 (2.9%) | 67 (3.1%) |
| 4:00 PM to 11:59 PM | 33 (1.5%) | 174 (8.0%) |
| Total | 2,273 (100.0%) | 2,165 (100.0%) |
Housing Occupancy in Oakwood
Occupancy by Ownership in Oakwood
Of the total 3,610 dwellings in Oakwood, owner-occupied units account for 2,933 (81.2%), while renter-occupied units make up 677 (18.8%).
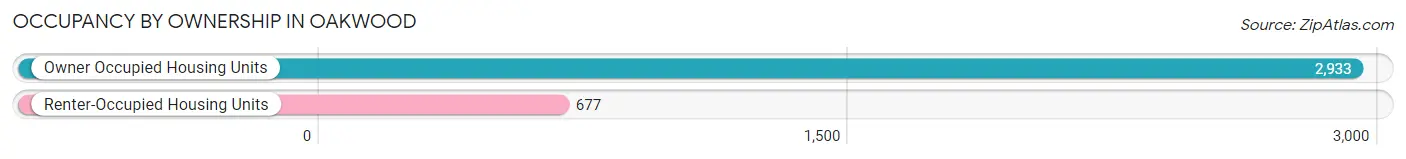
| Occupancy | # Housing Units | % Housing Units |
| Owner Occupied Housing Units | 2,933 | 81.2% |
| Renter-Occupied Housing Units | 677 | 18.8% |
| Total Occupied Housing Units | 3,610 | 100.0% |
Occupancy by Household Size in Oakwood
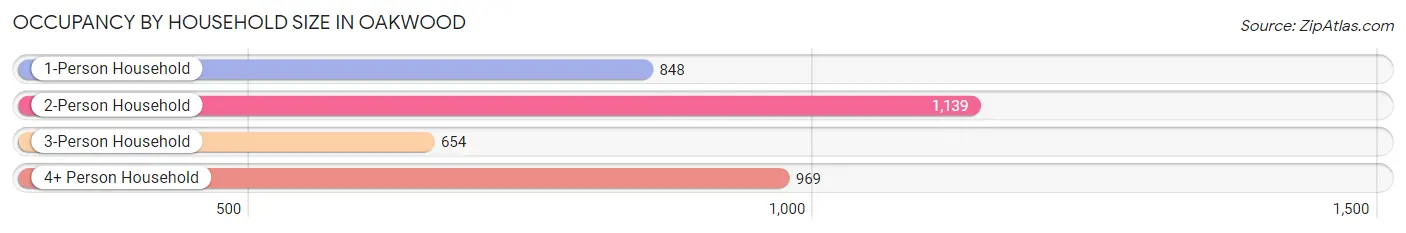
| Household Size | # Housing Units | % Housing Units |
| 1-Person Household | 848 | 23.5% |
| 2-Person Household | 1,139 | 31.6% |
| 3-Person Household | 654 | 18.1% |
| 4+ Person Household | 969 | 26.8% |
| Total Housing Units | 3,610 | 100.0% |
Occupancy by Ownership by Household Size in Oakwood
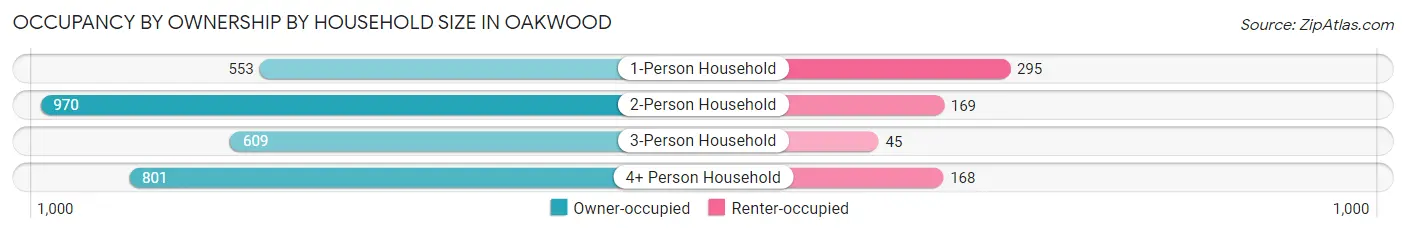
| Household Size | Owner-occupied | Renter-occupied |
| 1-Person Household | 553 (65.2%) | 295 (34.8%) |
| 2-Person Household | 970 (85.2%) | 169 (14.8%) |
| 3-Person Household | 609 (93.1%) | 45 (6.9%) |
| 4+ Person Household | 801 (82.7%) | 168 (17.3%) |
| Total Housing Units | 2,933 (81.2%) | 677 (18.8%) |
Occupancy by Educational Attainment in Oakwood
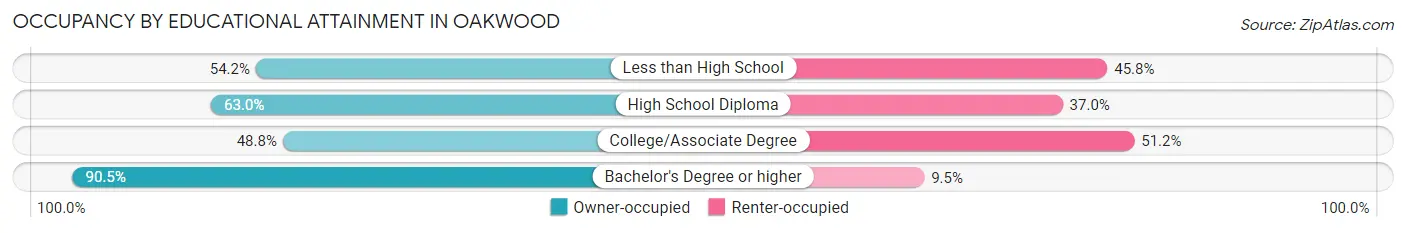
| Household Size | Owner-occupied | Renter-occupied |
| Less than High School | 26 (54.2%) | 22 (45.8%) |
| High School Diploma | 75 (63.0%) | 44 (37.0%) |
| College/Associate Degree | 332 (48.8%) | 348 (51.2%) |
| Bachelor's Degree or higher | 2,500 (90.5%) | 263 (9.5%) |
Occupancy by Age of Householder in Oakwood
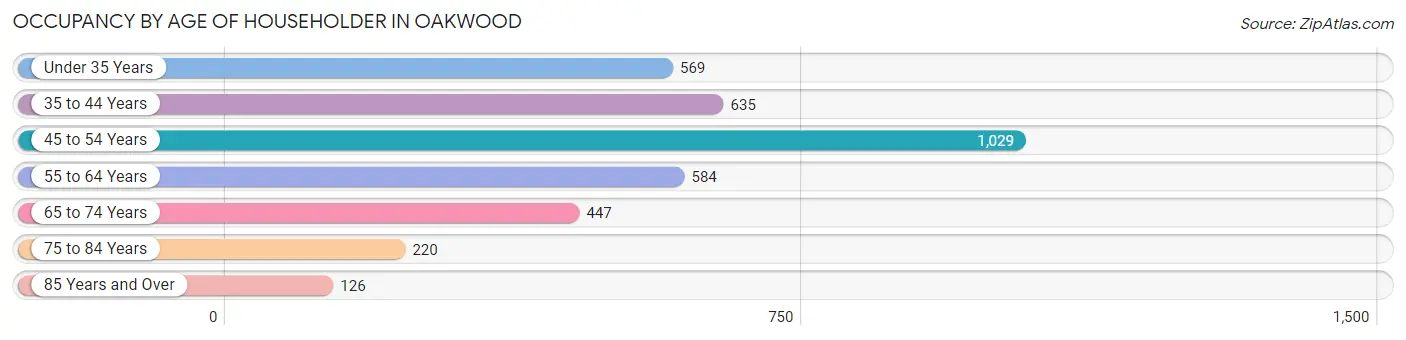
| Age Bracket | # Households | % Households |
| Under 35 Years | 569 | 15.8% |
| 35 to 44 Years | 635 | 17.6% |
| 45 to 54 Years | 1,029 | 28.5% |
| 55 to 64 Years | 584 | 16.2% |
| 65 to 74 Years | 447 | 12.4% |
| 75 to 84 Years | 220 | 6.1% |
| 85 Years and Over | 126 | 3.5% |
| Total | 3,610 | 100.0% |
Housing Finances in Oakwood
Median Income by Occupancy in Oakwood
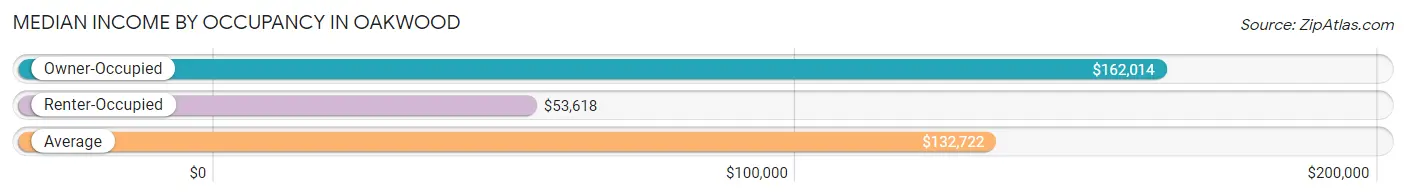
| Occupancy Type | # Households | Median Income |
| Owner-Occupied | 2,933 (81.2%) | $162,014 |
| Renter-Occupied | 677 (18.8%) | $53,618 |
| Average | 3,610 (100.0%) | $132,722 |
Occupancy by Householder Income Bracket in Oakwood
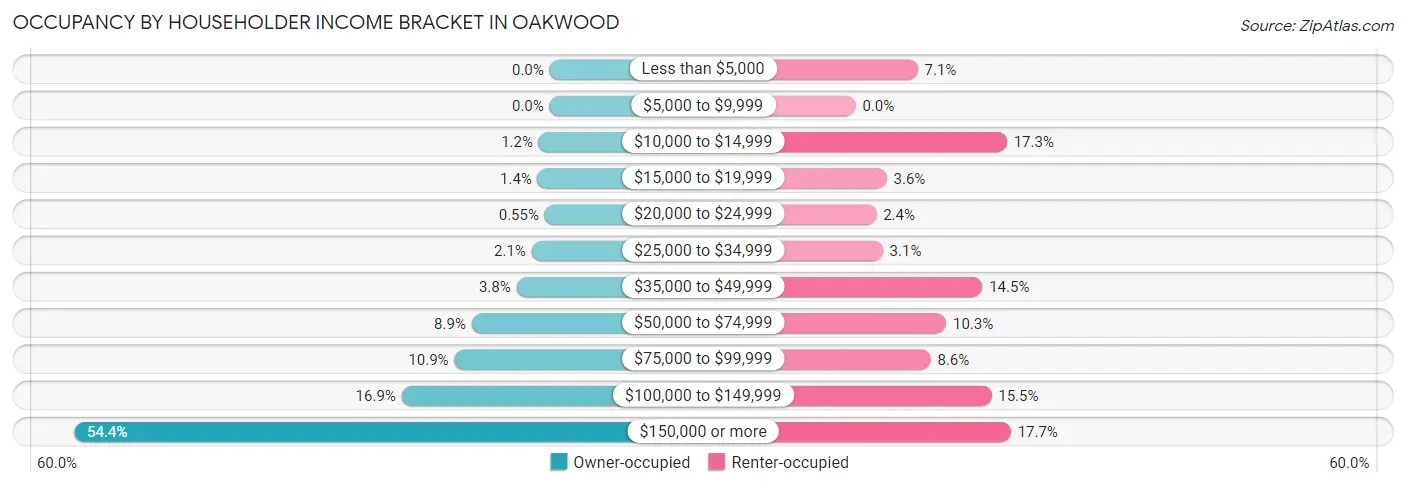
| Income Bracket | Owner-occupied | Renter-occupied |
| Less than $5,000 | 0 (0.0%) | 48 (7.1%) |
| $5,000 to $9,999 | 0 (0.0%) | 0 (0.0%) |
| $10,000 to $14,999 | 36 (1.2%) | 117 (17.3%) |
| $15,000 to $19,999 | 40 (1.4%) | 24 (3.5%) |
| $20,000 to $24,999 | 16 (0.5%) | 16 (2.4%) |
| $25,000 to $34,999 | 60 (2.1%) | 21 (3.1%) |
| $35,000 to $49,999 | 111 (3.8%) | 98 (14.5%) |
| $50,000 to $74,999 | 261 (8.9%) | 70 (10.3%) |
| $75,000 to $99,999 | 319 (10.9%) | 58 (8.6%) |
| $100,000 to $149,999 | 496 (16.9%) | 105 (15.5%) |
| $150,000 or more | 1,594 (54.3%) | 120 (17.7%) |
| Total | 2,933 (100.0%) | 677 (100.0%) |
Monthly Housing Cost Tiers in Oakwood
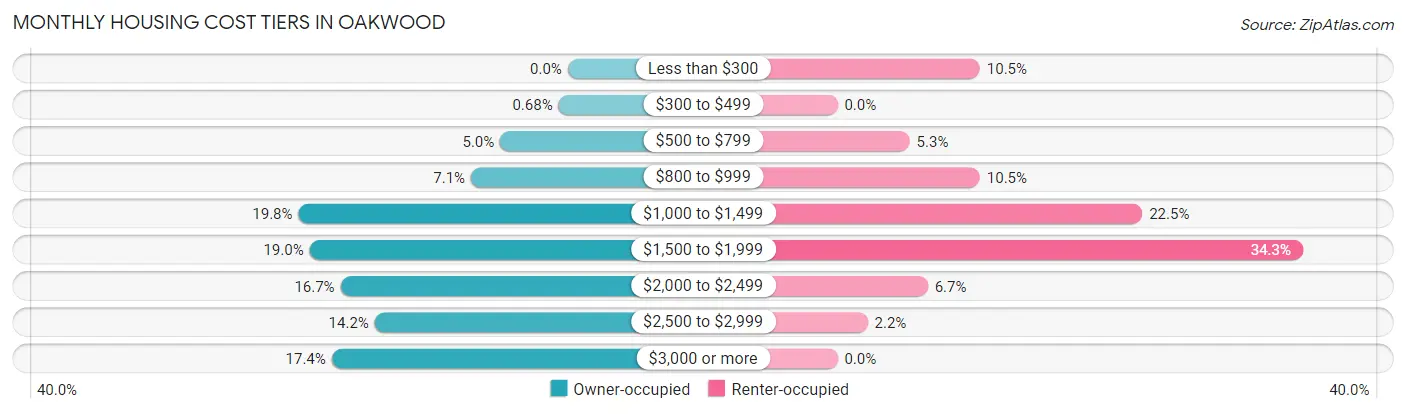
| Monthly Cost | Owner-occupied | Renter-occupied |
| Less than $300 | 0 (0.0%) | 71 (10.5%) |
| $300 to $499 | 20 (0.7%) | 0 (0.0%) |
| $500 to $799 | 146 (5.0%) | 36 (5.3%) |
| $800 to $999 | 209 (7.1%) | 71 (10.5%) |
| $1,000 to $1,499 | 582 (19.8%) | 152 (22.5%) |
| $1,500 to $1,999 | 558 (19.0%) | 232 (34.3%) |
| $2,000 to $2,499 | 491 (16.7%) | 45 (6.7%) |
| $2,500 to $2,999 | 417 (14.2%) | 15 (2.2%) |
| $3,000 or more | 510 (17.4%) | 0 (0.0%) |
| Total | 2,933 (100.0%) | 677 (100.0%) |
Physical Housing Characteristics in Oakwood
Housing Structures in Oakwood
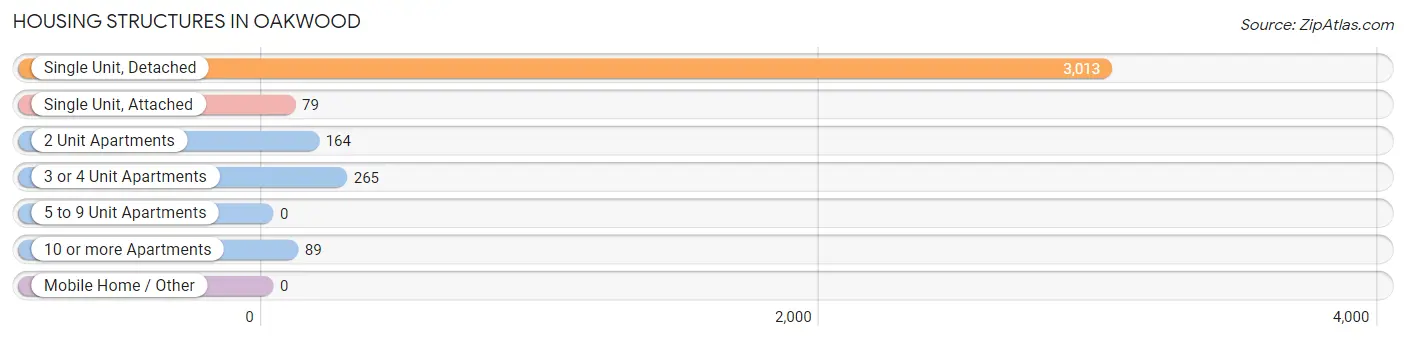
| Structure Type | # Housing Units | % Housing Units |
| Single Unit, Detached | 3,013 | 83.5% |
| Single Unit, Attached | 79 | 2.2% |
| 2 Unit Apartments | 164 | 4.5% |
| 3 or 4 Unit Apartments | 265 | 7.3% |
| 5 to 9 Unit Apartments | 0 | 0.0% |
| 10 or more Apartments | 89 | 2.5% |
| Mobile Home / Other | 0 | 0.0% |
| Total | 3,610 | 100.0% |
Housing Structures by Occupancy in Oakwood
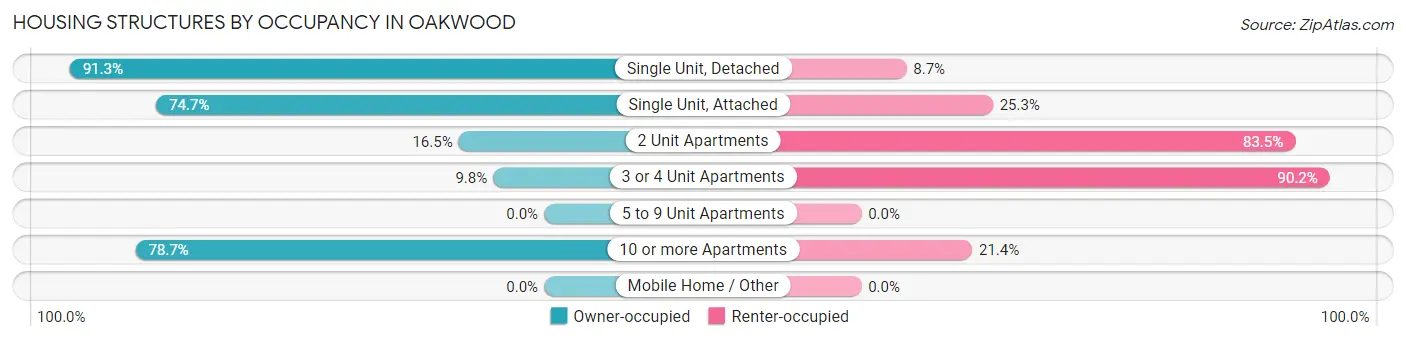
| Structure Type | Owner-occupied | Renter-occupied |
| Single Unit, Detached | 2,751 (91.3%) | 262 (8.7%) |
| Single Unit, Attached | 59 (74.7%) | 20 (25.3%) |
| 2 Unit Apartments | 27 (16.5%) | 137 (83.5%) |
| 3 or 4 Unit Apartments | 26 (9.8%) | 239 (90.2%) |
| 5 to 9 Unit Apartments | 0 (0.0%) | 0 (0.0%) |
| 10 or more Apartments | 70 (78.6%) | 19 (21.3%) |
| Mobile Home / Other | 0 (0.0%) | 0 (0.0%) |
| Total | 2,933 (81.2%) | 677 (18.8%) |
Housing Structures by Number of Rooms in Oakwood
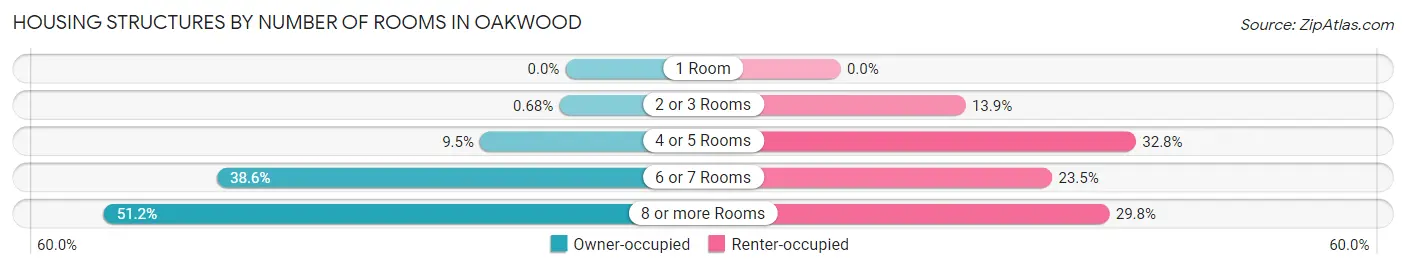
| Number of Rooms | Owner-occupied | Renter-occupied |
| 1 Room | 0 (0.0%) | 0 (0.0%) |
| 2 or 3 Rooms | 20 (0.7%) | 94 (13.9%) |
| 4 or 5 Rooms | 278 (9.5%) | 222 (32.8%) |
| 6 or 7 Rooms | 1,133 (38.6%) | 159 (23.5%) |
| 8 or more Rooms | 1,502 (51.2%) | 202 (29.8%) |
| Total | 2,933 (100.0%) | 677 (100.0%) |
Housing Structure by Heating Type in Oakwood
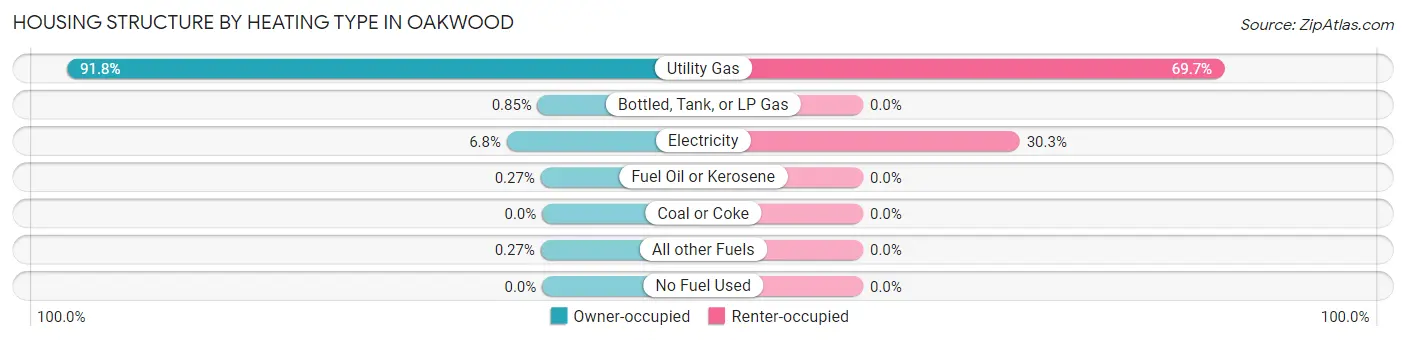
| Heating Type | Owner-occupied | Renter-occupied |
| Utility Gas | 2,692 (91.8%) | 472 (69.7%) |
| Bottled, Tank, or LP Gas | 25 (0.9%) | 0 (0.0%) |
| Electricity | 200 (6.8%) | 205 (30.3%) |
| Fuel Oil or Kerosene | 8 (0.3%) | 0 (0.0%) |
| Coal or Coke | 0 (0.0%) | 0 (0.0%) |
| All other Fuels | 8 (0.3%) | 0 (0.0%) |
| No Fuel Used | 0 (0.0%) | 0 (0.0%) |
| Total | 2,933 (100.0%) | 677 (100.0%) |
Household Vehicle Usage in Oakwood
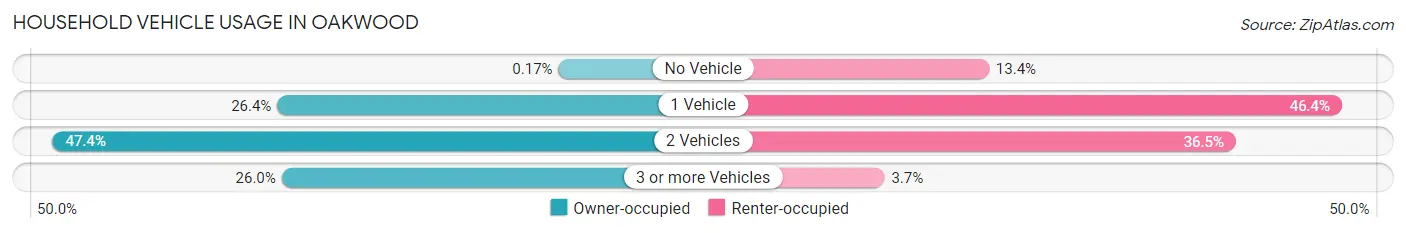
| Vehicles per Household | Owner-occupied | Renter-occupied |
| No Vehicle | 5 (0.2%) | 91 (13.4%) |
| 1 Vehicle | 775 (26.4%) | 314 (46.4%) |
| 2 Vehicles | 1,390 (47.4%) | 247 (36.5%) |
| 3 or more Vehicles | 763 (26.0%) | 25 (3.7%) |
| Total | 2,933 (100.0%) | 677 (100.0%) |
Real Estate & Mortgages in Oakwood
Real Estate and Mortgage Overview in Oakwood
| Characteristic | Without Mortgage | With Mortgage |
| Housing Units | 789 | 2,144 |
| Median Property Value | $296,400 | $319,700 |
| Median Household Income | $119,375 | $1,262 |
| Monthly Housing Costs | $1,028 | $441 |
| Real Estate Taxes | $7,813 | $0 |
Property Value by Mortgage Status in Oakwood
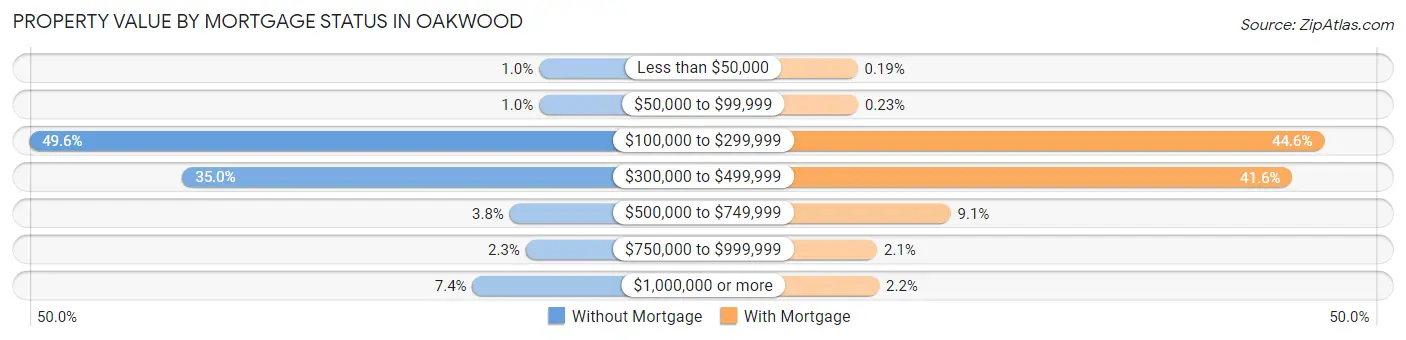
| Property Value | Without Mortgage | With Mortgage |
| Less than $50,000 | 8 (1.0%) | 4 (0.2%) |
| $50,000 to $99,999 | 8 (1.0%) | 5 (0.2%) |
| $100,000 to $299,999 | 391 (49.6%) | 957 (44.6%) |
| $300,000 to $499,999 | 276 (35.0%) | 892 (41.6%) |
| $500,000 to $749,999 | 30 (3.8%) | 194 (9.0%) |
| $750,000 to $999,999 | 18 (2.3%) | 44 (2.1%) |
| $1,000,000 or more | 58 (7.3%) | 48 (2.2%) |
| Total | 789 (100.0%) | 2,144 (100.0%) |
Household Income by Mortgage Status in Oakwood
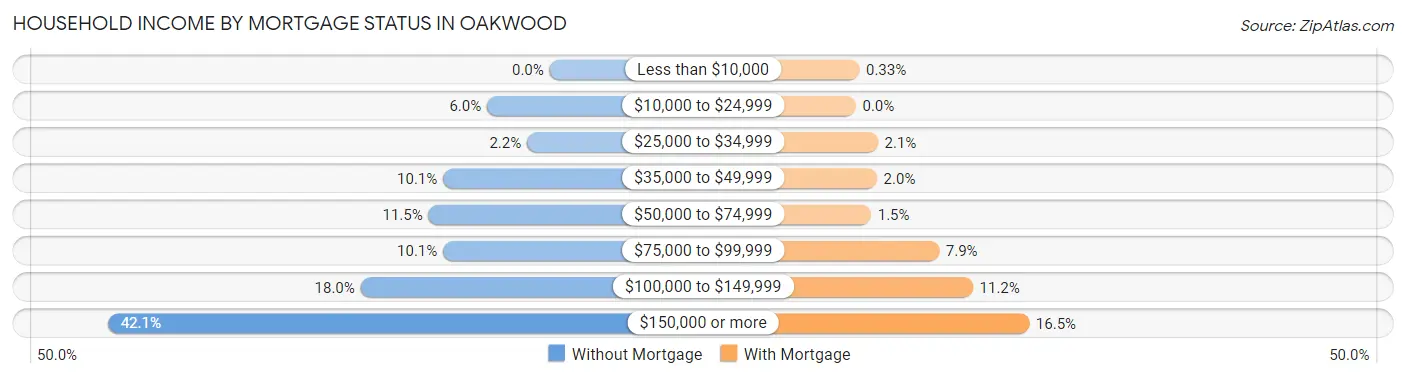
| Household Income | Without Mortgage | With Mortgage |
| Less than $10,000 | 0 (0.0%) | 7 (0.3%) |
| $10,000 to $24,999 | 47 (6.0%) | 0 (0.0%) |
| $25,000 to $34,999 | 17 (2.1%) | 45 (2.1%) |
| $35,000 to $49,999 | 80 (10.1%) | 43 (2.0%) |
| $50,000 to $74,999 | 91 (11.5%) | 31 (1.5%) |
| $75,000 to $99,999 | 80 (10.1%) | 170 (7.9%) |
| $100,000 to $149,999 | 142 (18.0%) | 239 (11.2%) |
| $150,000 or more | 332 (42.1%) | 354 (16.5%) |
| Total | 789 (100.0%) | 2,144 (100.0%) |
Property Value to Household Income Ratio in Oakwood
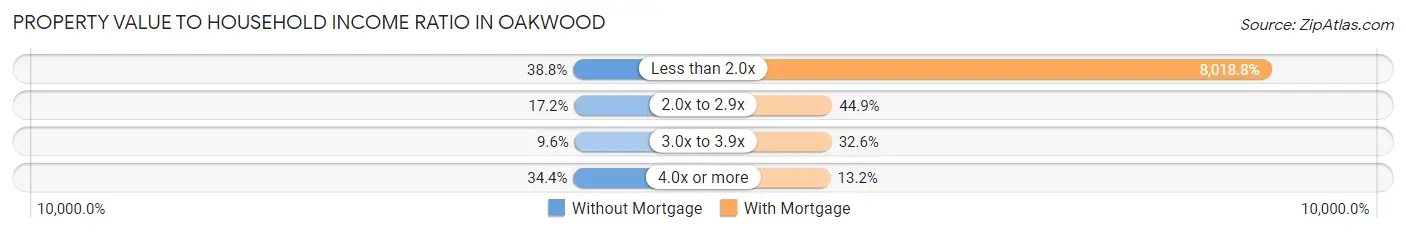
| Value-to-Income Ratio | Without Mortgage | With Mortgage |
| Less than 2.0x | 306 (38.8%) | 171,923 (8,018.8%) |
| 2.0x to 2.9x | 136 (17.2%) | 962 (44.9%) |
| 3.0x to 3.9x | 76 (9.6%) | 698 (32.6%) |
| 4.0x or more | 271 (34.4%) | 282 (13.2%) |
| Total | 789 (100.0%) | 2,144 (100.0%) |
Real Estate Taxes by Mortgage Status in Oakwood
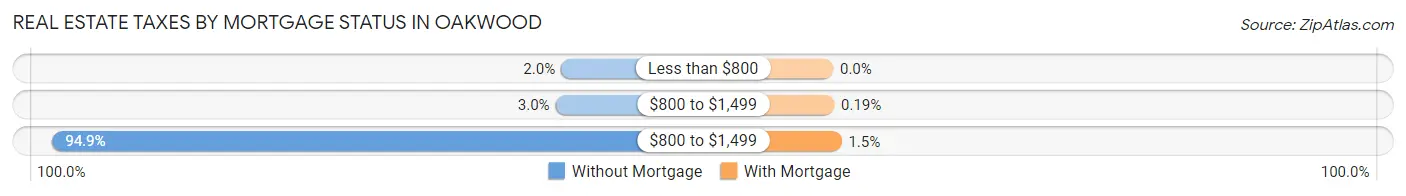
| Property Taxes | Without Mortgage | With Mortgage |
| Less than $800 | 16 (2.0%) | 0 (0.0%) |
| $800 to $1,499 | 24 (3.0%) | 4 (0.2%) |
| $800 to $1,499 | 749 (94.9%) | 33 (1.5%) |
| Total | 789 (100.0%) | 2,144 (100.0%) |
Health & Disability in Oakwood
Health Insurance Coverage by Age in Oakwood
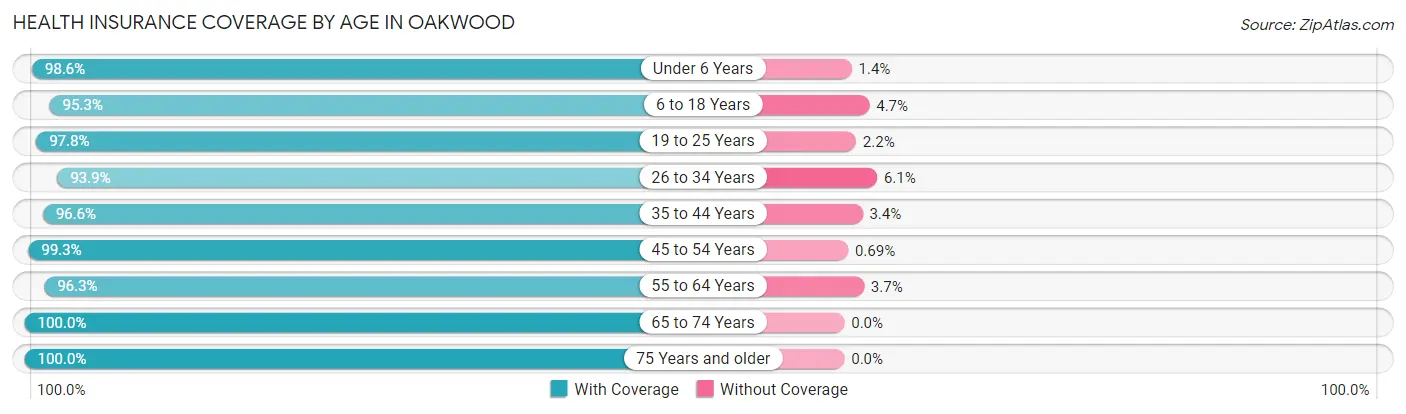
| Age Bracket | With Coverage | Without Coverage |
| Under 6 Years | 508 (98.6%) | 7 (1.4%) |
| 6 to 18 Years | 2,252 (95.3%) | 110 (4.7%) |
| 19 to 25 Years | 450 (97.8%) | 10 (2.2%) |
| 26 to 34 Years | 833 (93.9%) | 54 (6.1%) |
| 35 to 44 Years | 1,145 (96.6%) | 40 (3.4%) |
| 45 to 54 Years | 1,882 (99.3%) | 13 (0.7%) |
| 55 to 64 Years | 974 (96.3%) | 37 (3.7%) |
| 65 to 74 Years | 721 (100.0%) | 0 (0.0%) |
| 75 Years and older | 406 (100.0%) | 0 (0.0%) |
| Total | 9,171 (97.1%) | 271 (2.9%) |
Health Insurance Coverage by Citizenship Status in Oakwood
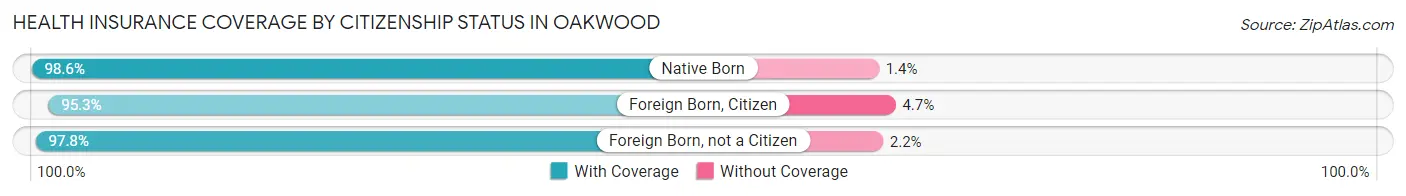
| Citizenship Status | With Coverage | Without Coverage |
| Native Born | 508 (98.6%) | 7 (1.4%) |
| Foreign Born, Citizen | 2,252 (95.3%) | 110 (4.7%) |
| Foreign Born, not a Citizen | 450 (97.8%) | 10 (2.2%) |
Health Insurance Coverage by Household Income in Oakwood
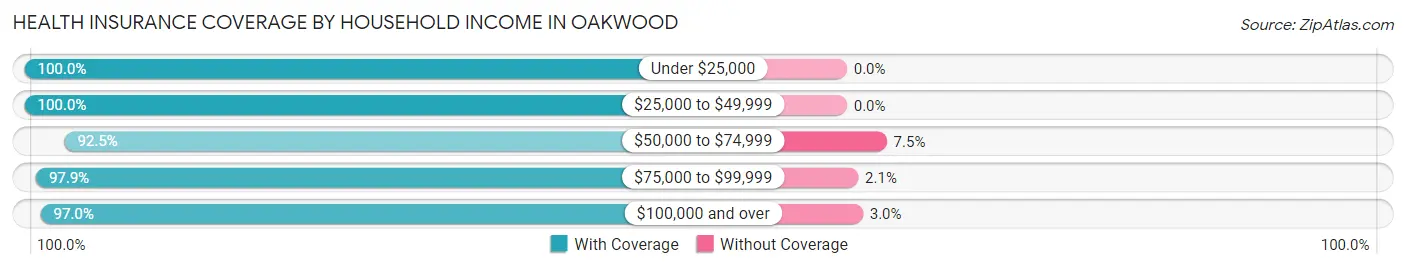
| Household Income | With Coverage | Without Coverage |
| Under $25,000 | 456 (100.0%) | 0 (0.0%) |
| $25,000 to $49,999 | 420 (100.0%) | 0 (0.0%) |
| $50,000 to $74,999 | 458 (92.5%) | 37 (7.5%) |
| $75,000 to $99,999 | 871 (97.9%) | 19 (2.1%) |
| $100,000 and over | 6,966 (97.0%) | 215 (3.0%) |
Public vs Private Health Insurance Coverage by Age in Oakwood
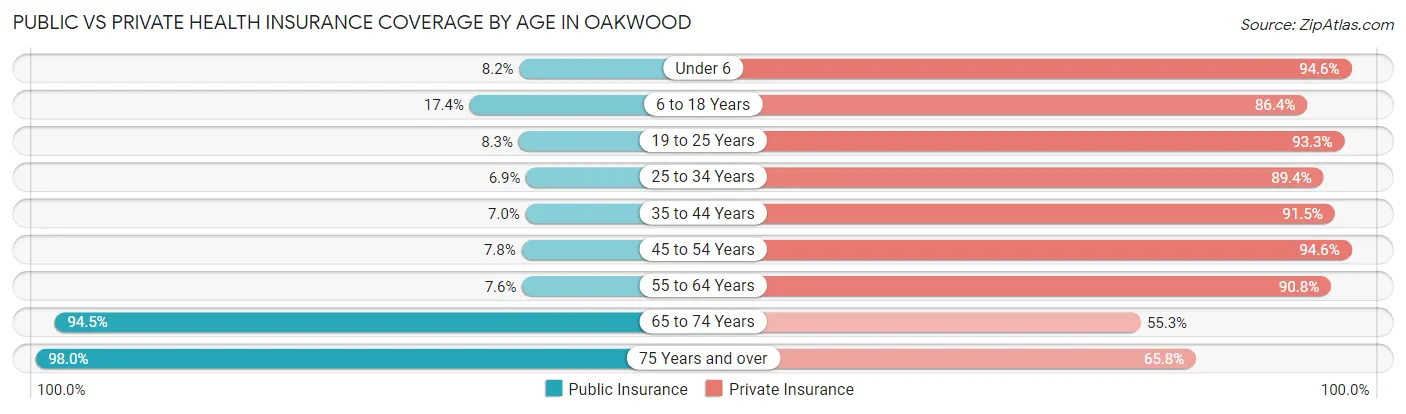
| Age Bracket | Public Insurance | Private Insurance |
| Under 6 | 42 (8.2%) | 487 (94.6%) |
| 6 to 18 Years | 410 (17.4%) | 2,040 (86.4%) |
| 19 to 25 Years | 38 (8.3%) | 429 (93.3%) |
| 25 to 34 Years | 61 (6.9%) | 793 (89.4%) |
| 35 to 44 Years | 83 (7.0%) | 1,084 (91.5%) |
| 45 to 54 Years | 147 (7.8%) | 1,793 (94.6%) |
| 55 to 64 Years | 77 (7.6%) | 918 (90.8%) |
| 65 to 74 Years | 681 (94.5%) | 399 (55.3%) |
| 75 Years and over | 398 (98.0%) | 267 (65.8%) |
| Total | 1,937 (20.5%) | 8,210 (87.0%) |
Disability Status by Sex by Age in Oakwood
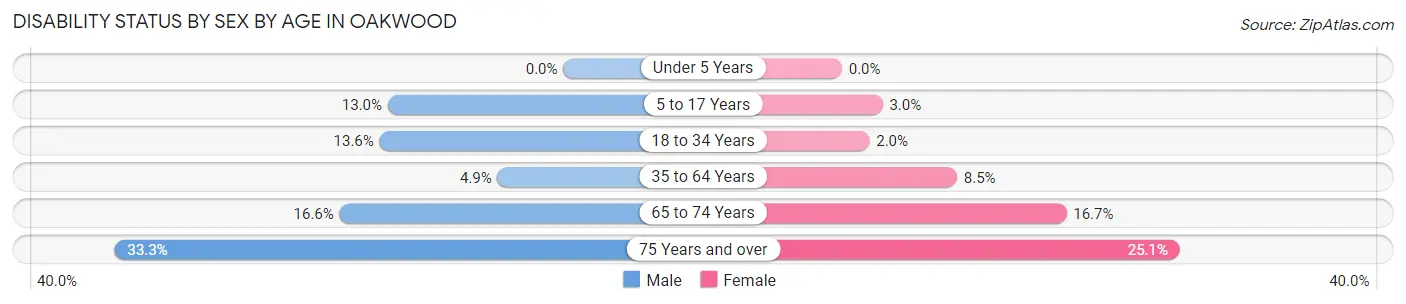
| Age Bracket | Male | Female |
| Under 5 Years | 0 (0.0%) | 0 (0.0%) |
| 5 to 17 Years | 154 (13.0%) | 37 (3.0%) |
| 18 to 34 Years | 81 (13.6%) | 16 (2.0%) |
| 35 to 64 Years | 95 (4.9%) | 183 (8.5%) |
| 65 to 74 Years | 49 (16.6%) | 71 (16.7%) |
| 75 Years and over | 41 (33.3%) | 71 (25.1%) |
Disability Class by Sex by Age in Oakwood
Disability Class: Hearing Difficulty
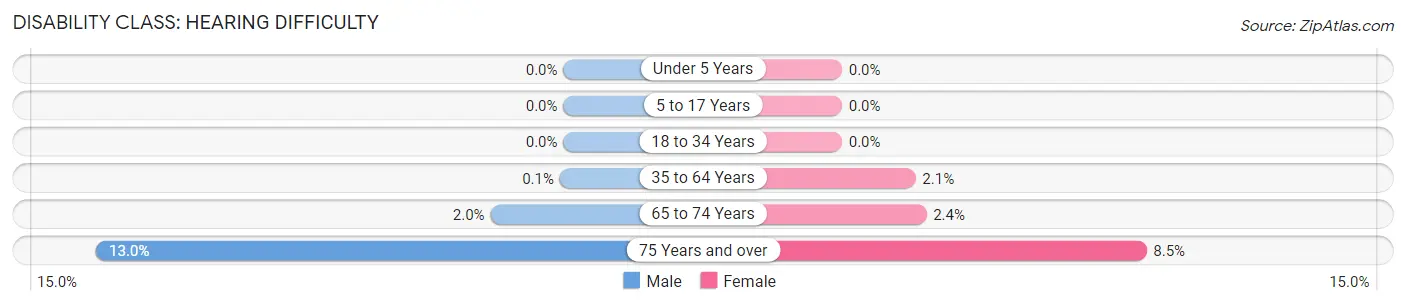
| Age Bracket | Male | Female |
| Under 5 Years | 0 (0.0%) | 0 (0.0%) |
| 5 to 17 Years | 0 (0.0%) | 0 (0.0%) |
| 18 to 34 Years | 0 (0.0%) | 0 (0.0%) |
| 35 to 64 Years | 2 (0.1%) | 44 (2.1%) |
| 65 to 74 Years | 6 (2.0%) | 10 (2.4%) |
| 75 Years and over | 16 (13.0%) | 24 (8.5%) |
Disability Class: Vision Difficulty
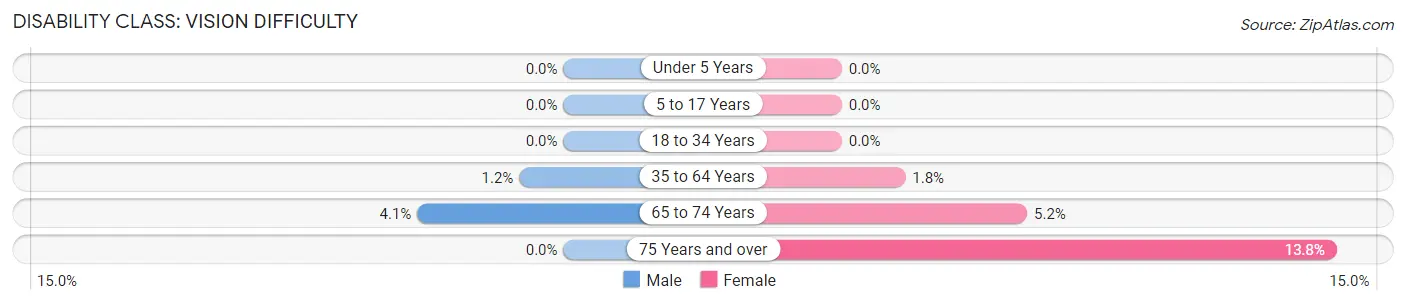
| Age Bracket | Male | Female |
| Under 5 Years | 0 (0.0%) | 0 (0.0%) |
| 5 to 17 Years | 0 (0.0%) | 0 (0.0%) |
| 18 to 34 Years | 0 (0.0%) | 0 (0.0%) |
| 35 to 64 Years | 24 (1.2%) | 38 (1.8%) |
| 65 to 74 Years | 12 (4.1%) | 22 (5.2%) |
| 75 Years and over | 0 (0.0%) | 39 (13.8%) |
Disability Class: Cognitive Difficulty
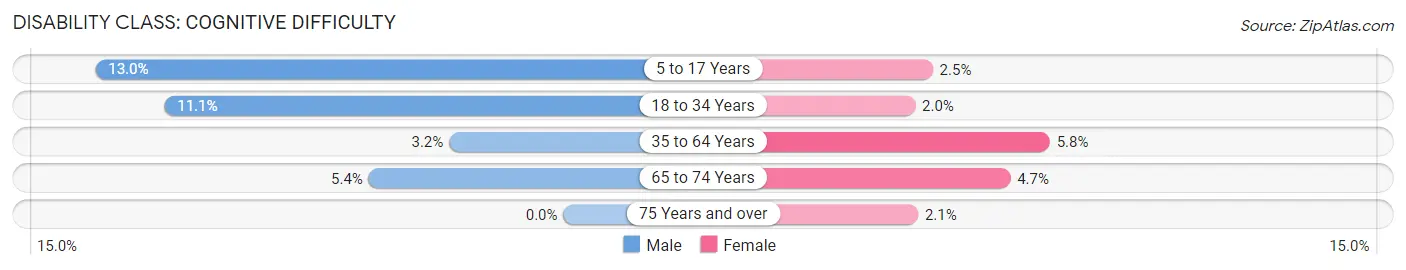
| Age Bracket | Male | Female |
| 5 to 17 Years | 154 (13.0%) | 31 (2.5%) |
| 18 to 34 Years | 66 (11.1%) | 16 (2.0%) |
| 35 to 64 Years | 62 (3.2%) | 124 (5.8%) |
| 65 to 74 Years | 16 (5.4%) | 20 (4.7%) |
| 75 Years and over | 0 (0.0%) | 6 (2.1%) |
Disability Class: Ambulatory Difficulty
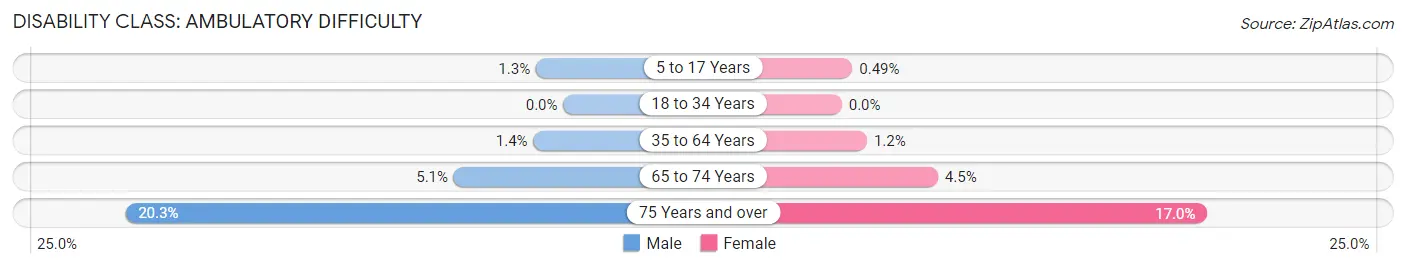
| Age Bracket | Male | Female |
| 5 to 17 Years | 15 (1.3%) | 6 (0.5%) |
| 18 to 34 Years | 0 (0.0%) | 0 (0.0%) |
| 35 to 64 Years | 27 (1.4%) | 25 (1.2%) |
| 65 to 74 Years | 15 (5.1%) | 19 (4.5%) |
| 75 Years and over | 25 (20.3%) | 48 (17.0%) |
Disability Class: Self-Care Difficulty
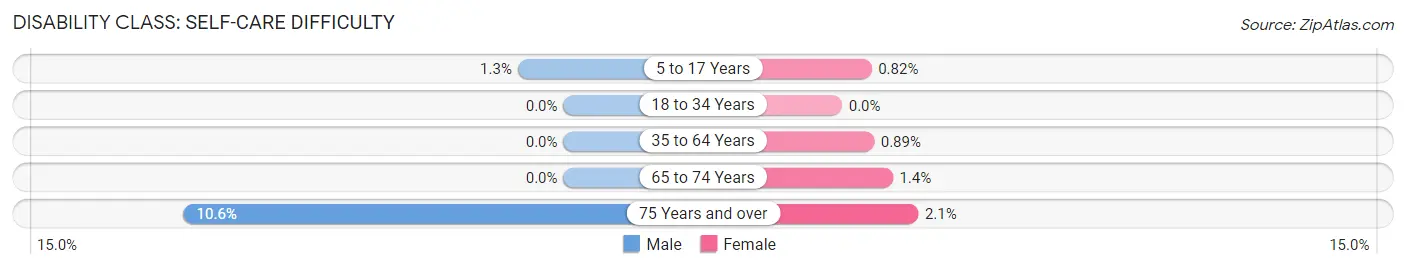
| Age Bracket | Male | Female |
| 5 to 17 Years | 15 (1.3%) | 10 (0.8%) |
| 18 to 34 Years | 0 (0.0%) | 0 (0.0%) |
| 35 to 64 Years | 0 (0.0%) | 19 (0.9%) |
| 65 to 74 Years | 0 (0.0%) | 6 (1.4%) |
| 75 Years and over | 13 (10.6%) | 6 (2.1%) |
Technology Access in Oakwood
Computing Device Access in Oakwood
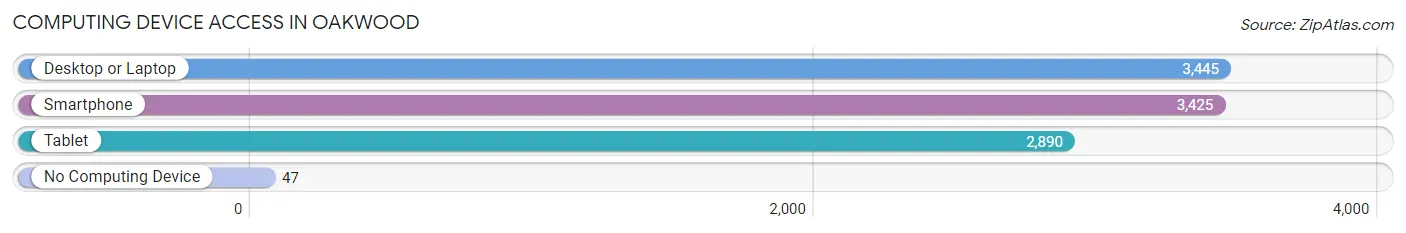
| Device Type | # Households | % Households |
| Desktop or Laptop | 3,445 | 95.4% |
| Smartphone | 3,425 | 94.9% |
| Tablet | 2,890 | 80.1% |
| No Computing Device | 47 | 1.3% |
| Total | 3,610 | 100.0% |
Internet Access in Oakwood
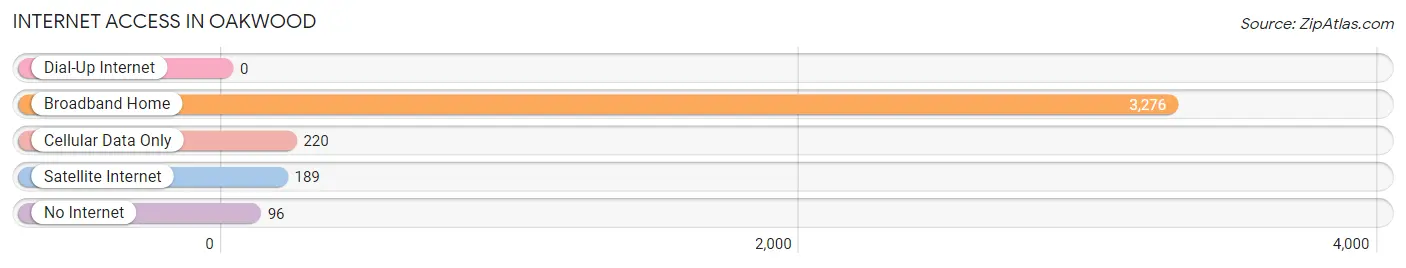
| Internet Type | # Households | % Households |
| Dial-Up Internet | 0 | 0.0% |
| Broadband Home | 3,276 | 90.7% |
| Cellular Data Only | 220 | 6.1% |
| Satellite Internet | 189 | 5.2% |
| No Internet | 96 | 2.7% |
| Total | 3,610 | 100.0% |
Oakwood Summary
Oakwood, Ohio is a small city located in Montgomery County, Ohio. It is situated just north of Dayton and is part of the Dayton Metropolitan Statistical Area. The city has a population of 8,902 as of the 2010 census.
History
Oakwood was founded in 1841 by a group of settlers from New England. The settlers were attracted to the area due to its proximity to the Miami and Erie Canal. The canal provided a means of transportation for goods and people, and the settlers were able to take advantage of the fertile soil in the area to grow crops. The city was originally known as “Oakwood Station” due to the large number of oak trees in the area. The name was changed to Oakwood in 1891.
In the late 19th century, Oakwood became a popular summer resort for wealthy Daytonians. The city was home to several large estates, including the Oakwood Country Club, which was founded in 1895. The club was a popular destination for golfers and socialites.
In the early 20th century, Oakwood became a popular residential area for Dayton’s middle and upper classes. The city was home to several large homes, many of which are still standing today.
Geography
Oakwood is located at 39°45'N 84°14'W (39.75, -84.23). The city has a total area of 4.2 square miles, all of which is land. The city is situated on a plateau, with an elevation of 890 feet above sea level.
The city is bordered by the cities of Dayton, Kettering, and Riverside. The city is also bordered by the Mad River, which flows through the city.
Economy
Oakwood’s economy is largely based on the service industry. The city is home to several large employers, including the Dayton International Airport, the University of Dayton, and the Dayton VA Medical Center.
The city is also home to several small businesses, including restaurants, retail stores, and professional services.
Demographics
As of the 2010 census, Oakwood had a population of 8,902. The racial makeup of the city was 92.2% White, 4.2% African American, 0.3% Native American, 1.2% Asian, 0.1% Pacific Islander, 0.7% from other races, and 1.4% from two or more races. Hispanic or Latino of any race were 2.2% of the population.
The median income for a household in the city was $76,945, and the median income for a family was $90,945. The per capita income for the city was $37,945. About 3.2% of families and 4.3% of the population were below the poverty line, including 5.2% of those under age 18 and 4.2% of those age 65 or over.
Oakwood is a small city with a rich history and a vibrant economy. The city is home to several large employers, as well as small businesses and professional services. The city has a diverse population, with a median income that is higher than the national average.
Common Questions
What is Per Capita Income in Oakwood?
Per Capita income in Oakwood is $67,721.
What is the Median Family Income in Oakwood?
Median Family Income in Oakwood is $176,638.
What is the Median Household income in Oakwood?
Median Household Income in Oakwood is $132,722.
What is Income or Wage Gap in Oakwood?
Income or Wage Gap in Oakwood is 51.9%.
Women in Oakwood earn 48.1 cents for every dollar earned by a man.
What is Inequality or Gini Index in Oakwood?
Inequality or Gini Index in Oakwood is 0.45.
What is the Total Population of Oakwood?
Total Population of Oakwood is 9,496.
What is the Total Male Population of Oakwood?
Total Male Population of Oakwood is 4,364.
What is the Total Female Population of Oakwood?
Total Female Population of Oakwood is 5,132.
What is the Ratio of Males per 100 Females in Oakwood?
There are 85.04 Males per 100 Females in Oakwood.
What is the Ratio of Females per 100 Males in Oakwood?
There are 117.60 Females per 100 Males in Oakwood.
What is the Median Population Age in Oakwood?
Median Population Age in Oakwood is 40.3 Years.
What is the Average Family Size in Oakwood
Average Family Size in Oakwood is 3.0 People.
What is the Average Household Size in Oakwood
Average Household Size in Oakwood is 2.6 People.
How Large is the Labor Force in Oakwood?
There are 5,175 People in the Labor Forcein in Oakwood.
What is the Percentage of People in the Labor Force in Oakwood?
73.9% of People are in the Labor Force in Oakwood.
What is the Unemployment Rate in Oakwood?
Unemployment Rate in Oakwood is 2.2%.