Mineral City, OH Map & Demographics
Mineral City Map
Mineral City Overview
$29,483
PER CAPITA INCOME
$58,750
AVG FAMILY INCOME
$53,295
AVG HOUSEHOLD INCOME
30.8%
WAGE / INCOME GAP [ % ]
69.2¢/ $1
WAGE / INCOME GAP [ $ ]
0.43
INEQUALITY / GINI INDEX
571
TOTAL POPULATION
247
MALE POPULATION
324
FEMALE POPULATION
76.23
MALES / 100 FEMALES
131.17
FEMALES / 100 MALES
33.5
MEDIAN AGE
3.0
AVG FAMILY SIZE
2.3
AVG HOUSEHOLD SIZE
322
LABOR FORCE [ PEOPLE ]
65.2%
PERCENT IN LABOR FORCE
3.4%
UNEMPLOYMENT RATE
Mineral City Zip Codes
Mineral City Area Codes
Income in Mineral City
Income Overview in Mineral City
Per Capita Income in Mineral City is $29,483, while median incomes of families and households are $58,750 and $53,295 respectively.
| Characteristic | Number | Measure |
| Per Capita Income | 571 | $29,483 |
| Median Family Income | 138 | $58,750 |
| Mean Family Income | 138 | $82,964 |
| Median Household Income | 249 | $53,295 |
| Mean Household Income | 249 | $64,298 |
| Income Deficit | 138 | $0 |
| Wage / Income Gap (%) | 571 | 30.78% |
| Wage / Income Gap ($) | 571 | 69.22¢ per $1 |
| Gini / Inequality Index | 571 | 0.43 |
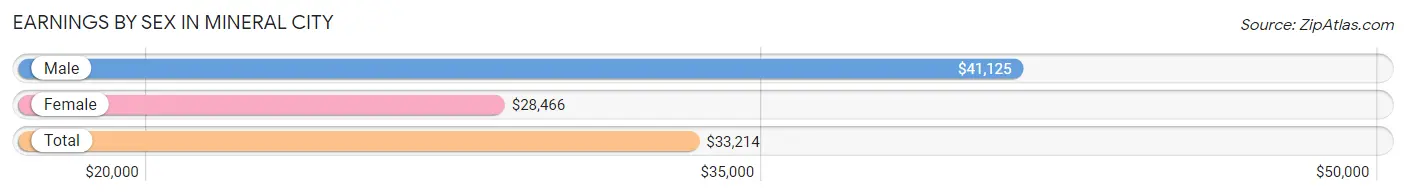
Earnings by Sex in Mineral City
Average Earnings in Mineral City are $33,214, $41,125 for men and $28,466 for women, a difference of 30.8%.
| Sex | Number | Average Earnings |
| Male | 147 (44.8%) | $41,125 |
| Female | 181 (55.2%) | $28,466 |
| Total | 328 (100.0%) | $33,214 |
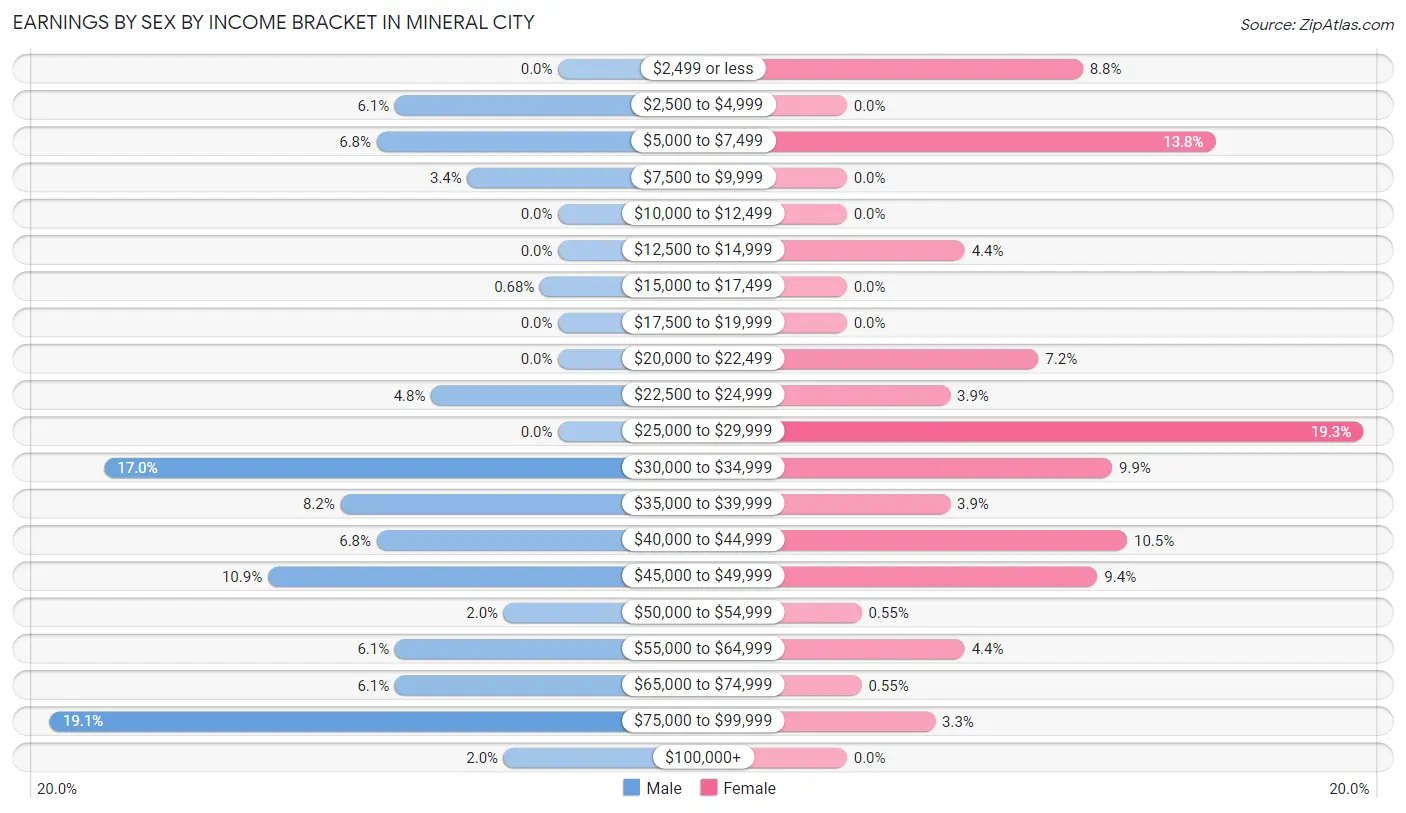
Earnings by Sex by Income Bracket in Mineral City
The most common earnings brackets in Mineral City are $75,000 to $99,999 for men (28 | 19.1%) and $25,000 to $29,999 for women (35 | 19.3%).
| Income | Male | Female |
| $2,499 or less | 0 (0.0%) | 16 (8.8%) |
| $2,500 to $4,999 | 9 (6.1%) | 0 (0.0%) |
| $5,000 to $7,499 | 10 (6.8%) | 25 (13.8%) |
| $7,500 to $9,999 | 5 (3.4%) | 0 (0.0%) |
| $10,000 to $12,499 | 0 (0.0%) | 0 (0.0%) |
| $12,500 to $14,999 | 0 (0.0%) | 8 (4.4%) |
| $15,000 to $17,499 | 1 (0.7%) | 0 (0.0%) |
| $17,500 to $19,999 | 0 (0.0%) | 0 (0.0%) |
| $20,000 to $22,499 | 0 (0.0%) | 13 (7.2%) |
| $22,500 to $24,999 | 7 (4.8%) | 7 (3.9%) |
| $25,000 to $29,999 | 0 (0.0%) | 35 (19.3%) |
| $30,000 to $34,999 | 25 (17.0%) | 18 (9.9%) |
| $35,000 to $39,999 | 12 (8.2%) | 7 (3.9%) |
| $40,000 to $44,999 | 10 (6.8%) | 19 (10.5%) |
| $45,000 to $49,999 | 16 (10.9%) | 17 (9.4%) |
| $50,000 to $54,999 | 3 (2.0%) | 1 (0.5%) |
| $55,000 to $64,999 | 9 (6.1%) | 8 (4.4%) |
| $65,000 to $74,999 | 9 (6.1%) | 1 (0.5%) |
| $75,000 to $99,999 | 28 (19.1%) | 6 (3.3%) |
| $100,000+ | 3 (2.0%) | 0 (0.0%) |
| Total | 147 (100.0%) | 181 (100.0%) |
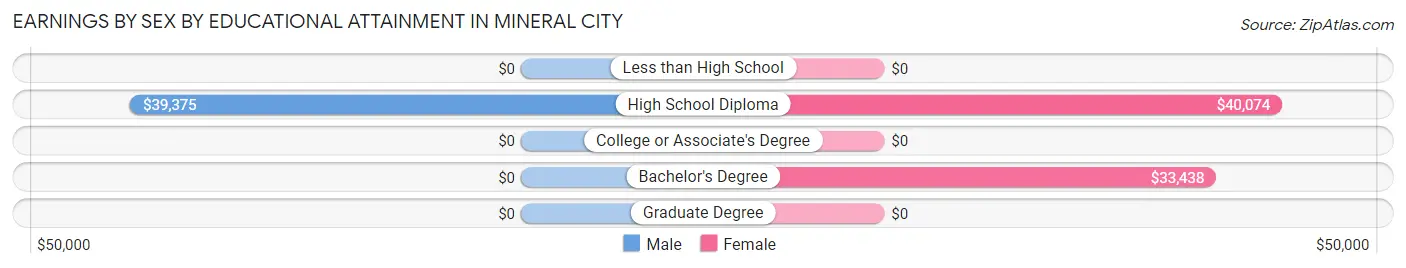
Earnings by Sex by Educational Attainment in Mineral City
Average earnings in Mineral City are $38,438 for men and $33,958 for women, a difference of 11.7%. Men with an educational attainment of high school diploma enjoy the highest average annual earnings of $39,375, while those with high school diploma education earn the least with $39,375. Women with an educational attainment of high school diploma earn the most with the average annual earnings of $40,074, while those with bachelor's degree education have the smallest earnings of $33,438.
| Educational Attainment | Male Income | Female Income |
| Less than High School | - | - |
| High School Diploma | $39,375 | $40,074 |
| College or Associate's Degree | - | - |
| Bachelor's Degree | - | - |
| Graduate Degree | - | - |
| Total | $38,438 | $33,958 |
Family Income in Mineral City
Family Income Brackets in Mineral City
According to the Mineral City family income data, there are 36 families falling into the $35,000 to $49,999 income range, which is the most common income bracket and makes up 26.1% of all families.
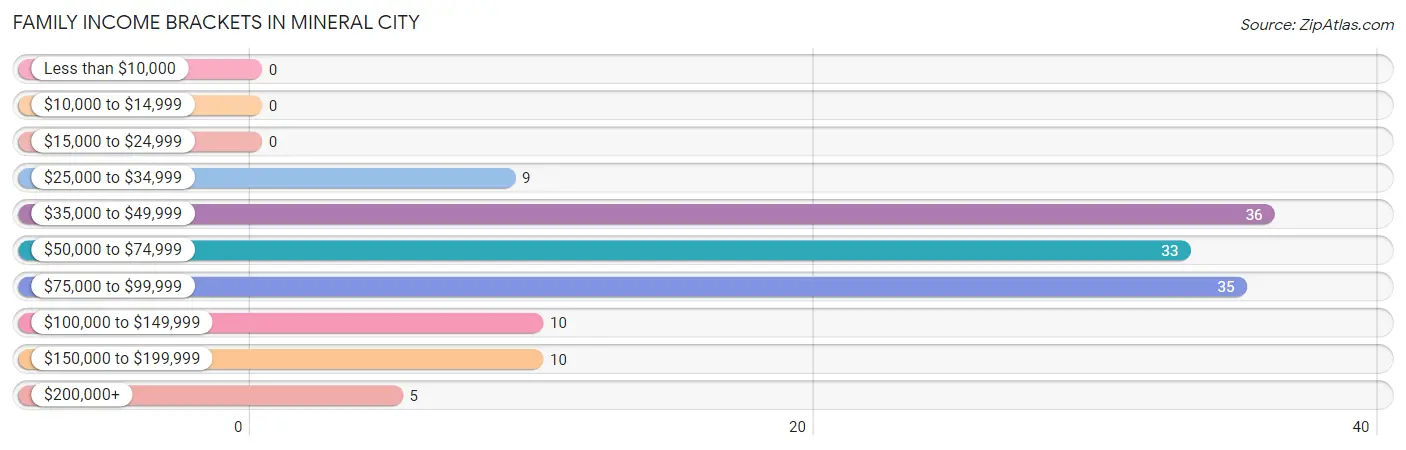
| Income Bracket | # Families | % Families |
| Less than $10,000 | 0 | 0.0% |
| $10,000 to $14,999 | 0 | 0.0% |
| $15,000 to $24,999 | 0 | 0.0% |
| $25,000 to $34,999 | 9 | 6.5% |
| $35,000 to $49,999 | 36 | 26.1% |
| $50,000 to $74,999 | 33 | 23.9% |
| $75,000 to $99,999 | 35 | 25.4% |
| $100,000 to $149,999 | 10 | 7.2% |
| $150,000 to $199,999 | 10 | 7.2% |
| $200,000+ | 5 | 3.6% |
Family Income by Famaliy Size in Mineral City
3-person families (35 | 25.4%) account for the highest median family income in Mineral City with $86,705 per family, while 3-person families (35 | 25.4%) have the highest median income of $28,902 per family member.
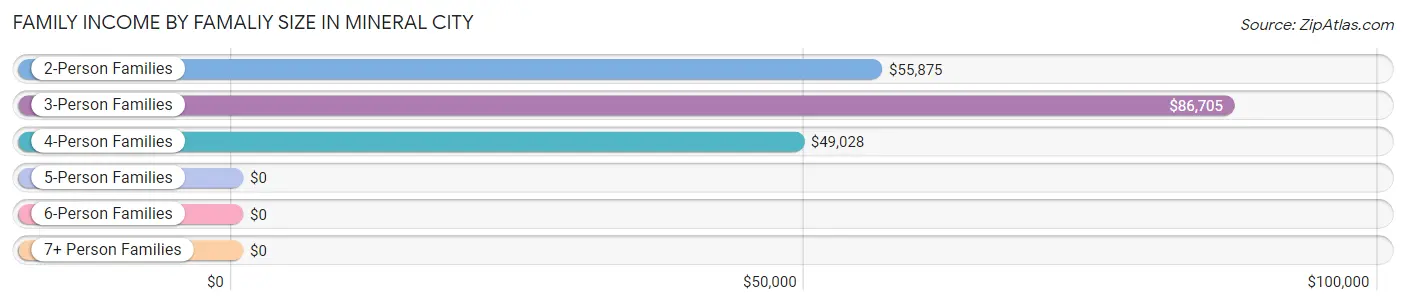
| Income Bracket | # Families | Median Income |
| 2-Person Families | 63 (45.7%) | $55,875 |
| 3-Person Families | 35 (25.4%) | $86,705 |
| 4-Person Families | 31 (22.5%) | $49,028 |
| 5-Person Families | 9 (6.5%) | $0 |
| 6-Person Families | 0 (0.0%) | $0 |
| 7+ Person Families | 0 (0.0%) | $0 |
| Total | 138 (100.0%) | $58,750 |
Family Income by Number of Earners in Mineral City
The median family income in Mineral City is $58,750, with families comprising 3+ earners (20) having the highest median family income of $173,750, while families with 1 earner (43) have the lowest median family income of $53,977, accounting for 14.5% and 31.2% of families, respectively.
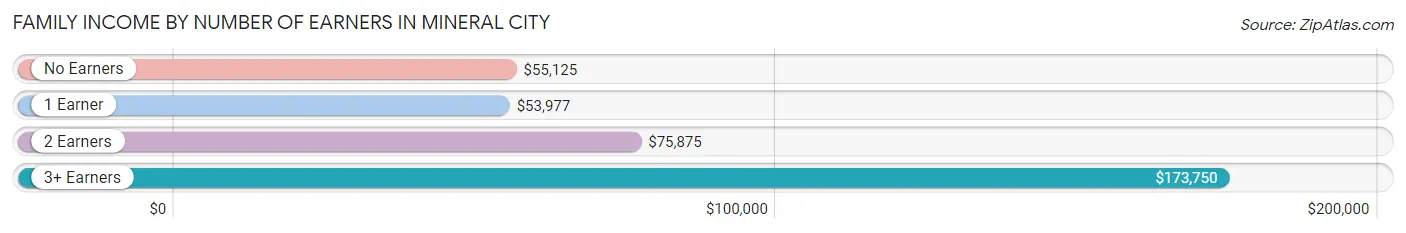
| Number of Earners | # Families | Median Income |
| No Earners | 23 (16.7%) | $55,125 |
| 1 Earner | 43 (31.2%) | $53,977 |
| 2 Earners | 52 (37.7%) | $75,875 |
| 3+ Earners | 20 (14.5%) | $173,750 |
| Total | 138 (100.0%) | $58,750 |
Household Income in Mineral City
Household Income Brackets in Mineral City
With 49 households falling in the category, the $50,000 to $74,999 income range is the most frequent in Mineral City, accounting for 19.7% of all households. In contrast, only 5 households (2.0%) fall into the $200,000+ income bracket, making it the least populous group.
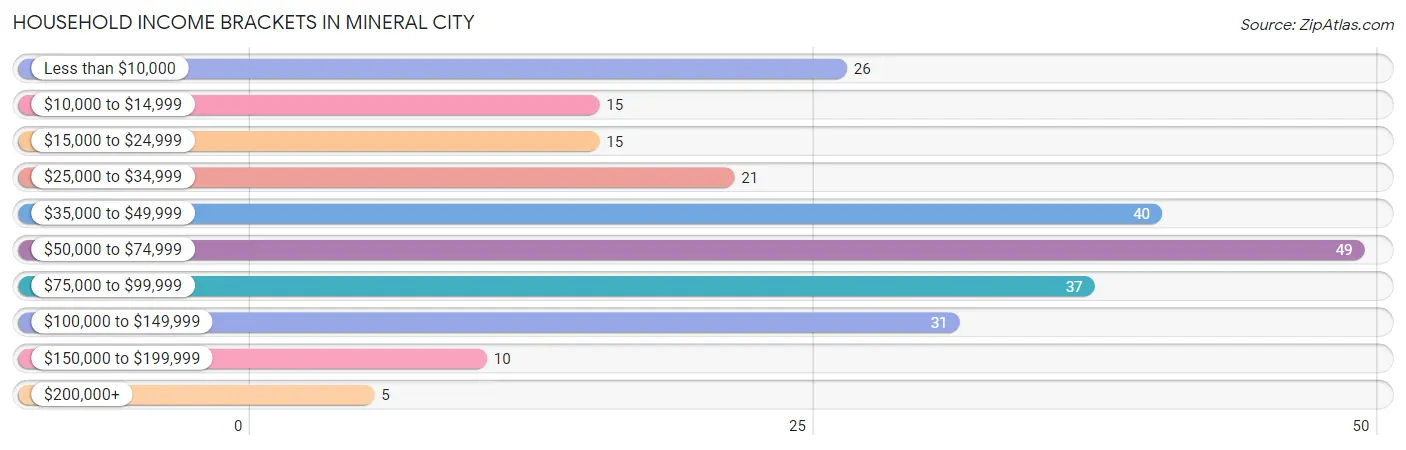
| Income Bracket | # Households | % Households |
| Less than $10,000 | 26 | 10.4% |
| $10,000 to $14,999 | 15 | 6.0% |
| $15,000 to $24,999 | 15 | 6.0% |
| $25,000 to $34,999 | 21 | 8.4% |
| $35,000 to $49,999 | 40 | 16.1% |
| $50,000 to $74,999 | 49 | 19.7% |
| $75,000 to $99,999 | 37 | 14.9% |
| $100,000 to $149,999 | 31 | 12.4% |
| $150,000 to $199,999 | 10 | 4.0% |
| $200,000+ | 5 | 2.0% |
Household Income by Householder Age in Mineral City
The median household income in Mineral City is $53,295, with the highest median household income of $77,143 found in the 45 to 64 years age bracket for the primary householder. A total of 84 households (33.7%) fall into this category. Meanwhile, the 15 to 24 years age bracket for the primary householder has the lowest median household income of $0, with 42 households (16.9%) in this group.
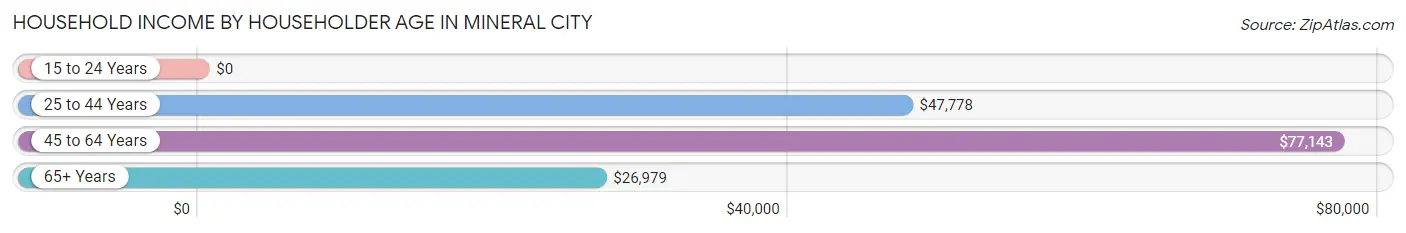
| Income Bracket | # Households | Median Income |
| 15 to 24 Years | 42 (16.9%) | $0 |
| 25 to 44 Years | 70 (28.1%) | $47,778 |
| 45 to 64 Years | 84 (33.7%) | $77,143 |
| 65+ Years | 53 (21.3%) | $26,979 |
| Total | 249 (100.0%) | $53,295 |
Poverty in Mineral City
Income Below Poverty by Sex and Age in Mineral City
With 20.2% poverty level for males and 13.6% for females among the residents of Mineral City, 6 to 11 year old males and 16 and 17 year old females are the most vulnerable to poverty, with 8 males (72.7%) and 6 females (54.5%) in their respective age groups living below the poverty level.
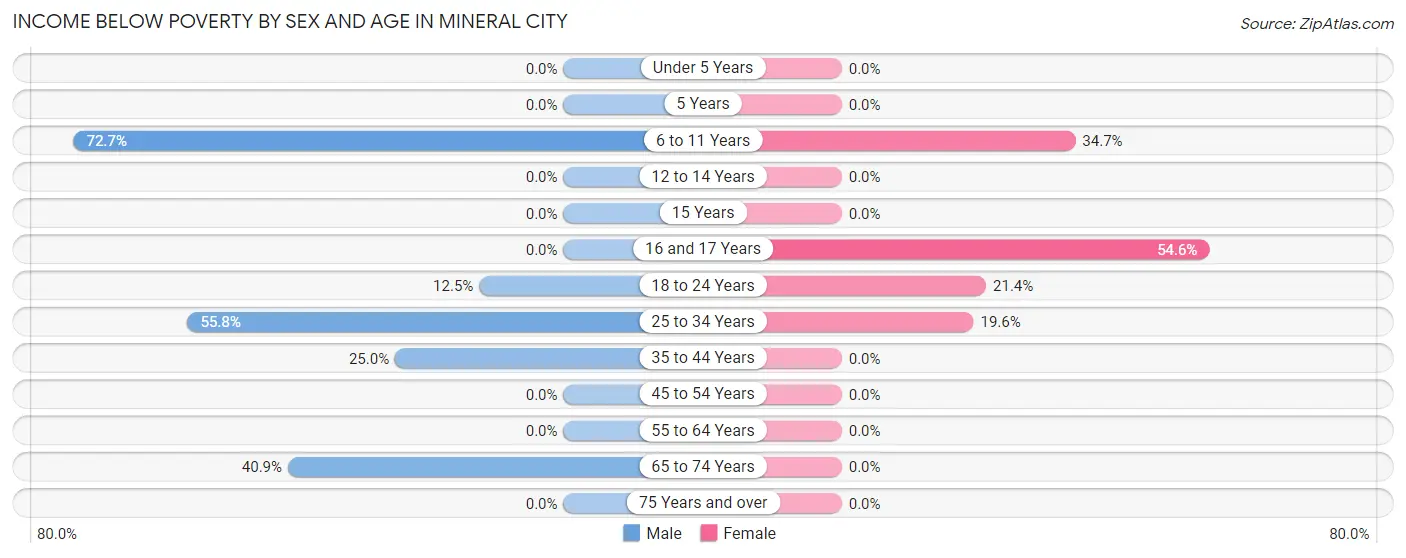
| Age Bracket | Male | Female |
| Under 5 Years | 0 (0.0%) | 0 (0.0%) |
| 5 Years | 0 (0.0%) | 0 (0.0%) |
| 6 to 11 Years | 8 (72.7%) | 17 (34.7%) |
| 12 to 14 Years | 0 (0.0%) | 0 (0.0%) |
| 15 Years | 0 (0.0%) | 0 (0.0%) |
| 16 and 17 Years | 0 (0.0%) | 6 (54.5%) |
| 18 to 24 Years | 5 (12.5%) | 12 (21.4%) |
| 25 to 34 Years | 24 (55.8%) | 9 (19.6%) |
| 35 to 44 Years | 4 (25.0%) | 0 (0.0%) |
| 45 to 54 Years | 0 (0.0%) | 0 (0.0%) |
| 55 to 64 Years | 0 (0.0%) | 0 (0.0%) |
| 65 to 74 Years | 9 (40.9%) | 0 (0.0%) |
| 75 Years and over | 0 (0.0%) | 0 (0.0%) |
| Total | 50 (20.2%) | 44 (13.6%) |
Income Above Poverty by Sex and Age in Mineral City
According to the poverty statistics in Mineral City, males aged under 5 years and females aged 12 to 14 years are the age groups that are most secure financially, with 100.0% of males and 100.0% of females in these age groups living above the poverty line.
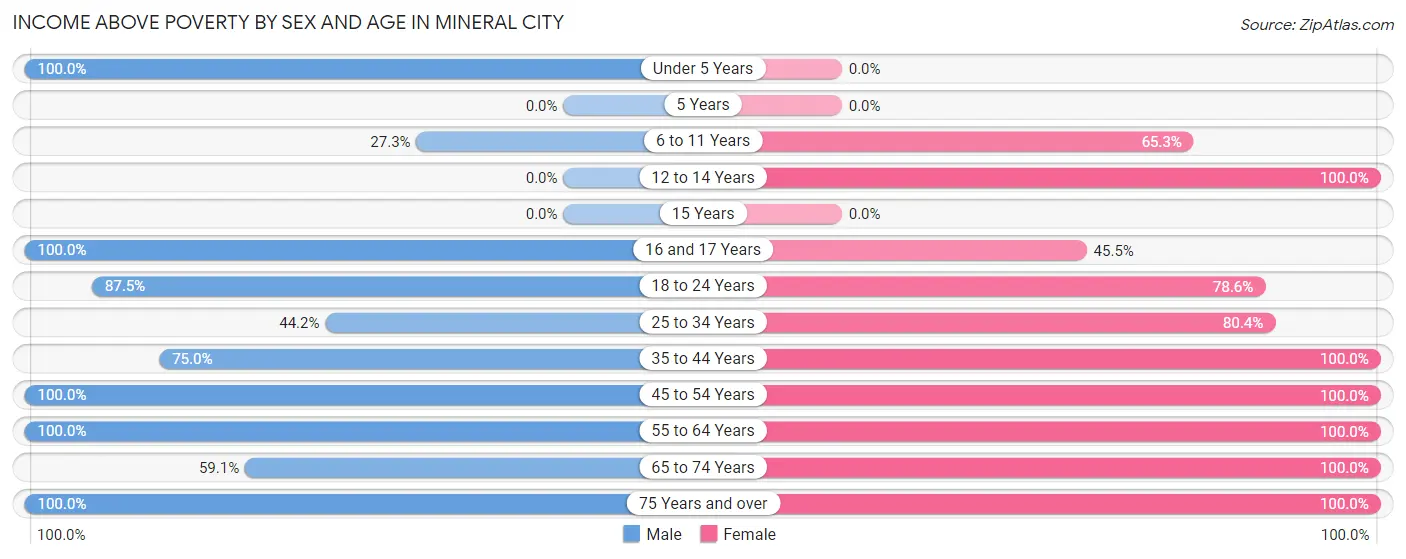
| Age Bracket | Male | Female |
| Under 5 Years | 9 (100.0%) | 0 (0.0%) |
| 5 Years | 0 (0.0%) | 0 (0.0%) |
| 6 to 11 Years | 3 (27.3%) | 32 (65.3%) |
| 12 to 14 Years | 0 (0.0%) | 8 (100.0%) |
| 15 Years | 0 (0.0%) | 0 (0.0%) |
| 16 and 17 Years | 25 (100.0%) | 5 (45.5%) |
| 18 to 24 Years | 35 (87.5%) | 44 (78.6%) |
| 25 to 34 Years | 19 (44.2%) | 37 (80.4%) |
| 35 to 44 Years | 12 (75.0%) | 22 (100.0%) |
| 45 to 54 Years | 13 (100.0%) | 49 (100.0%) |
| 55 to 64 Years | 50 (100.0%) | 31 (100.0%) |
| 65 to 74 Years | 13 (59.1%) | 10 (100.0%) |
| 75 Years and over | 18 (100.0%) | 42 (100.0%) |
| Total | 197 (79.8%) | 280 (86.4%) |
Income Below Poverty Among Married-Couple Families in Mineral City
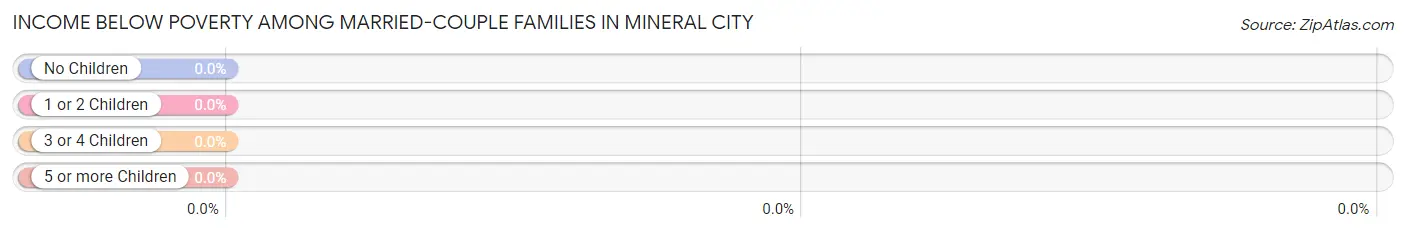
| Children | Above Poverty | Below Poverty |
| No Children | 70 (100.0%) | 0 (0.0%) |
| 1 or 2 Children | 20 (100.0%) | 0 (0.0%) |
| 3 or 4 Children | 0 (0.0%) | 0 (0.0%) |
| 5 or more Children | 0 (0.0%) | 0 (0.0%) |
| Total | 90 (100.0%) | 0 (0.0%) |
Income Below Poverty Among Single-Parent Households in Mineral City
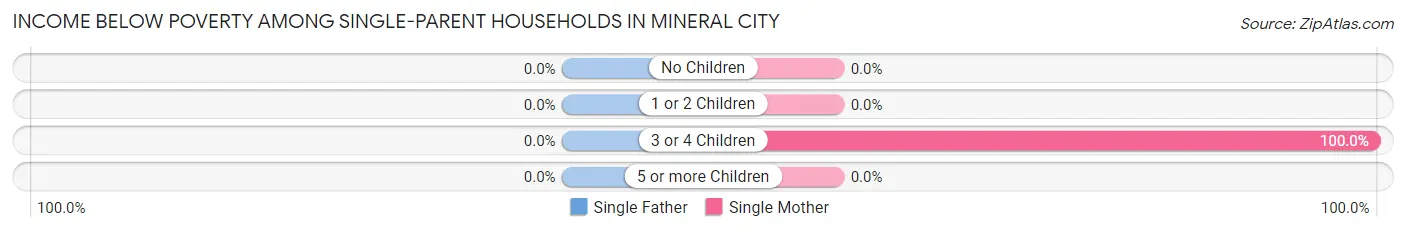
| Children | Single Father | Single Mother |
| No Children | 0 (0.0%) | 0 (0.0%) |
| 1 or 2 Children | 0 (0.0%) | 0 (0.0%) |
| 3 or 4 Children | 0 (0.0%) | 9 (100.0%) |
| 5 or more Children | 0 (0.0%) | 0 (0.0%) |
| Total | 0 (0.0%) | 9 (24.3%) |
Income Below Poverty Among Married-Couple vs Single-Parent Households in Mineral City
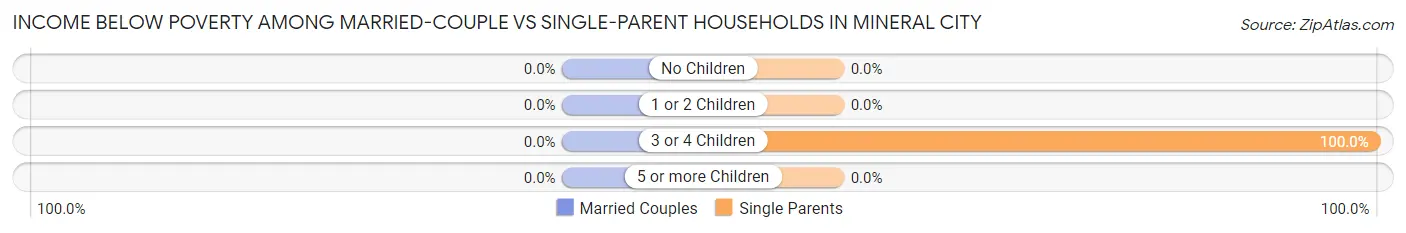
| Children | Married-Couple Families | Single-Parent Households |
| No Children | 0 (0.0%) | 0 (0.0%) |
| 1 or 2 Children | 0 (0.0%) | 0 (0.0%) |
| 3 or 4 Children | 0 (0.0%) | 9 (100.0%) |
| 5 or more Children | 0 (0.0%) | 0 (0.0%) |
| Total | 0 (0.0%) | 9 (18.8%) |
Race in Mineral City
The most populous races in Mineral City are White / Caucasian (555 | 97.2%), Two or more Races (8 | 1.4%), and Some other Race (8 | 1.4%).
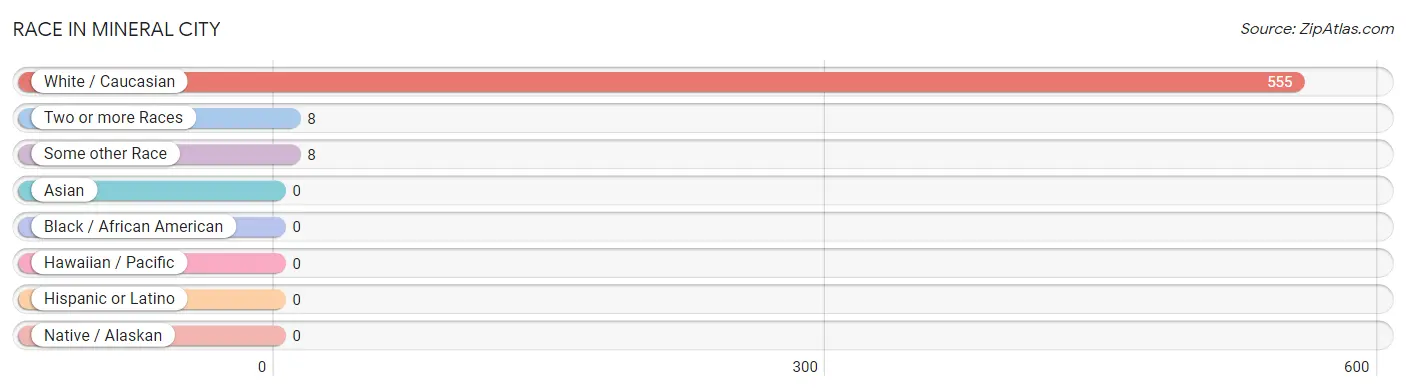
| Race | # Population | % Population |
| Asian | 0 | 0.0% |
| Black / African American | 0 | 0.0% |
| Hawaiian / Pacific | 0 | 0.0% |
| Hispanic or Latino | 0 | 0.0% |
| Native / Alaskan | 0 | 0.0% |
| White / Caucasian | 555 | 97.2% |
| Two or more Races | 8 | 1.4% |
| Some other Race | 8 | 1.4% |
| Total | 571 | 100.0% |
Ancestry in Mineral City
The most populous ancestries reported in Mineral City are German (171 | 29.9%), Italian (103 | 18.0%), Irish (65 | 11.4%), French (28 | 4.9%), and English (25 | 4.4%), together accounting for 68.6% of all Mineral City residents.
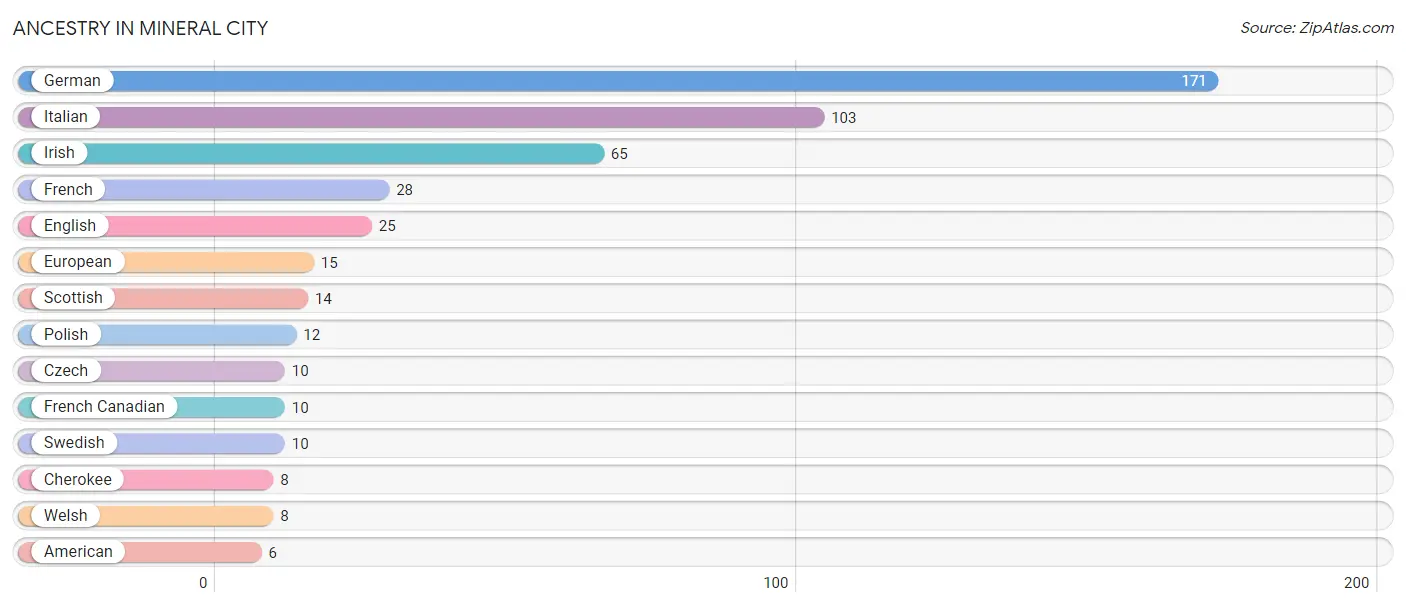
| Ancestry | # Population | % Population |
| American | 6 | 1.1% |
| Cherokee | 8 | 1.4% |
| Czech | 10 | 1.8% |
| English | 25 | 4.4% |
| European | 15 | 2.6% |
| French | 28 | 4.9% |
| French Canadian | 10 | 1.8% |
| German | 171 | 29.9% |
| Irish | 65 | 11.4% |
| Italian | 103 | 18.0% |
| Polish | 12 | 2.1% |
| Scottish | 14 | 2.5% |
| Swedish | 10 | 1.8% |
| Welsh | 8 | 1.4% | View All 14 Rows |
Immigrants in Mineral City

| Immigration Origin | # Population | % Population | View All 0 Rows |
Sex and Age in Mineral City
Sex and Age in Mineral City
The most populous age groups in Mineral City are 20 to 24 Years (40 | 16.2%) for men and 20 to 24 Years (44 | 13.6%) for women.
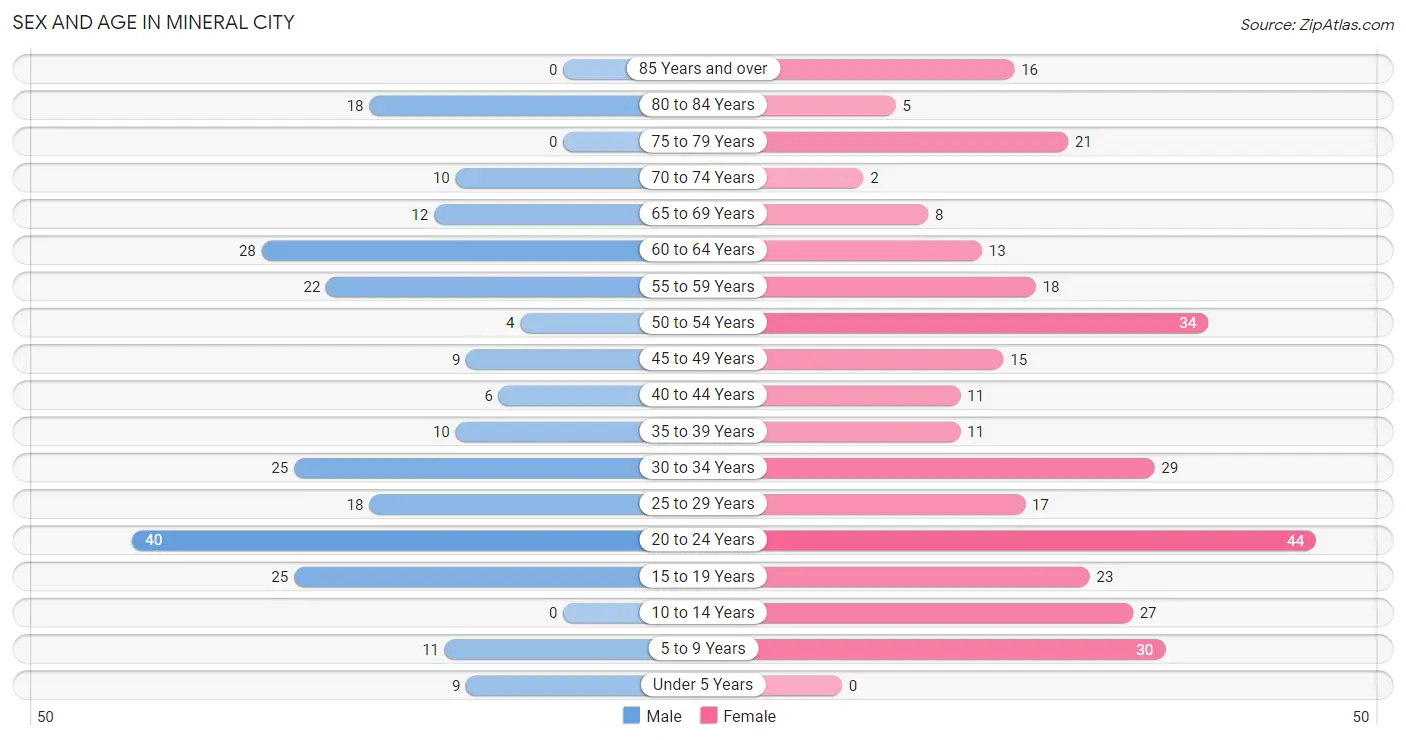
| Age Bracket | Male | Female |
| Under 5 Years | 9 (3.6%) | 0 (0.0%) |
| 5 to 9 Years | 11 (4.4%) | 30 (9.3%) |
| 10 to 14 Years | 0 (0.0%) | 27 (8.3%) |
| 15 to 19 Years | 25 (10.1%) | 23 (7.1%) |
| 20 to 24 Years | 40 (16.2%) | 44 (13.6%) |
| 25 to 29 Years | 18 (7.3%) | 17 (5.2%) |
| 30 to 34 Years | 25 (10.1%) | 29 (8.9%) |
| 35 to 39 Years | 10 (4.1%) | 11 (3.4%) |
| 40 to 44 Years | 6 (2.4%) | 11 (3.4%) |
| 45 to 49 Years | 9 (3.6%) | 15 (4.6%) |
| 50 to 54 Years | 4 (1.6%) | 34 (10.5%) |
| 55 to 59 Years | 22 (8.9%) | 18 (5.6%) |
| 60 to 64 Years | 28 (11.3%) | 13 (4.0%) |
| 65 to 69 Years | 12 (4.9%) | 8 (2.5%) |
| 70 to 74 Years | 10 (4.1%) | 2 (0.6%) |
| 75 to 79 Years | 0 (0.0%) | 21 (6.5%) |
| 80 to 84 Years | 18 (7.3%) | 5 (1.5%) |
| 85 Years and over | 0 (0.0%) | 16 (4.9%) |
| Total | 247 (100.0%) | 324 (100.0%) |
Families and Households in Mineral City
Median Family Size in Mineral City
The median family size in Mineral City is 3.01 persons per family, with single male/father families (11 | 8.0%) accounting for the largest median family size of 3.73 persons per family. On the other hand, married-couple families (90 | 65.2%) represent the smallest median family size with 2.79 persons per family.
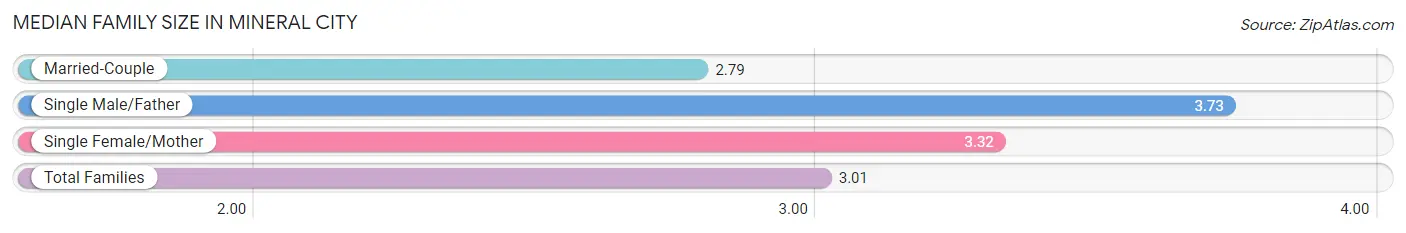
| Family Type | # Families | Family Size |
| Married-Couple | 90 (65.2%) | 2.79 |
| Single Male/Father | 11 (8.0%) | 3.73 |
| Single Female/Mother | 37 (26.8%) | 3.32 |
| Total Families | 138 (100.0%) | 3.01 |
Median Household Size in Mineral City
The median household size in Mineral City is 2.29 persons per household, with single female/mother households (37 | 14.9%) accounting for the largest median household size of 3.78 persons per household. non-family households (111 | 44.6%) represent the smallest median household size with 1.25 persons per household.
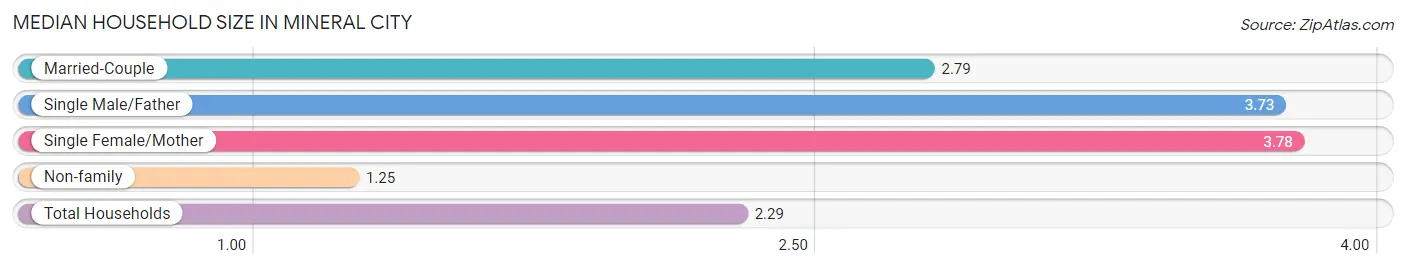
| Household Type | # Households | Household Size |
| Married-Couple | 90 (36.1%) | 2.79 |
| Single Male/Father | 11 (4.4%) | 3.73 |
| Single Female/Mother | 37 (14.9%) | 3.78 |
| Non-family | 111 (44.6%) | 1.25 |
| Total Households | 249 (100.0%) | 2.29 |
Household Size by Marriage Status in Mineral City
Out of a total of 249 households in Mineral City, 138 (55.4%) are family households, while 111 (44.6%) are nonfamily households. The most numerous type of family households are 2-person households, comprising 57, and the most common type of nonfamily households are 1-person households, comprising 81.
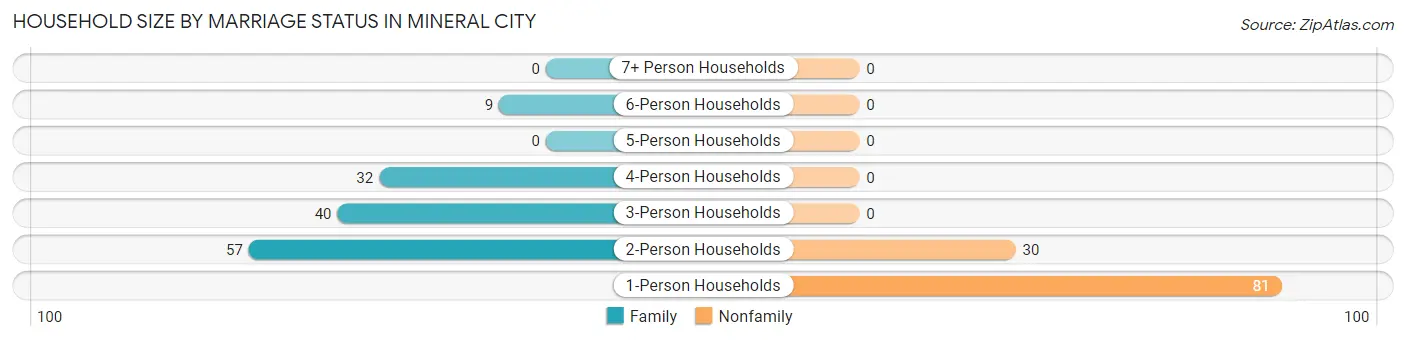
| Household Size | Family Households | Nonfamily Households |
| 1-Person Households | - | 81 (32.5%) |
| 2-Person Households | 57 (22.9%) | 30 (12.0%) |
| 3-Person Households | 40 (16.1%) | 0 (0.0%) |
| 4-Person Households | 32 (12.9%) | 0 (0.0%) |
| 5-Person Households | 0 (0.0%) | 0 (0.0%) |
| 6-Person Households | 9 (3.6%) | 0 (0.0%) |
| 7+ Person Households | 0 (0.0%) | 0 (0.0%) |
| Total | 138 (55.4%) | 111 (44.6%) |
Female Fertility in Mineral City
Fertility by Age in Mineral City
| Age Bracket | Women with Births | Births / 1,000 Women |
| 15 to 19 years | 0 (0.0%) | 0.0 |
| 20 to 34 years | 0 (0.0%) | 0.0 |
| 35 to 50 years | 0 (0.0%) | 0.0 |
| Total | 0 (0.0%) | 0.0 |
Fertility by Age by Marriage Status in Mineral City
| Age Bracket | Married | Unmarried |
| 15 to 19 years | 0 (0.0%) | 0 (0.0%) |
| 20 to 34 years | 0 (0.0%) | 0 (0.0%) |
| 35 to 50 years | 0 (0.0%) | 0 (0.0%) |
| Total | 0 (0.0%) | 0 (0.0%) |
Fertility by Education in Mineral City
| Educational Attainment | Women with Births | Births / 1,000 Women |
| Less than High School | 0 (0.0%) | 0.0 |
| High School Diploma | 0 (0.0%) | 0.0 |
| College or Associate's Degree | 0 (0.0%) | 0.0 |
| Bachelor's Degree | 0 (0.0%) | 0.0 |
| Graduate Degree | 0 (0.0%) | 0.0 |
| Total | 0 (0.0%) | 0.0 |
Fertility by Education by Marriage Status in Mineral City
| Educational Attainment | Married | Unmarried |
| Less than High School | 0 (0.0%) | 0 (0.0%) |
| High School Diploma | 0 (0.0%) | 0 (0.0%) |
| College or Associate's Degree | 0 (0.0%) | 0 (0.0%) |
| Bachelor's Degree | 0 (0.0%) | 0 (0.0%) |
| Graduate Degree | 0 (0.0%) | 0 (0.0%) |
| Total | 0 (0.0%) | 0 (0.0%) |
Employment Characteristics in Mineral City
Employment by Class of Employer in Mineral City
Among the 309 employed individuals in Mineral City, private company employees (235 | 76.0%), self-employed (not incorporated) (31 | 10.0%), and not-for-profit organizations (30 | 9.7%) make up the most common classes of employment.
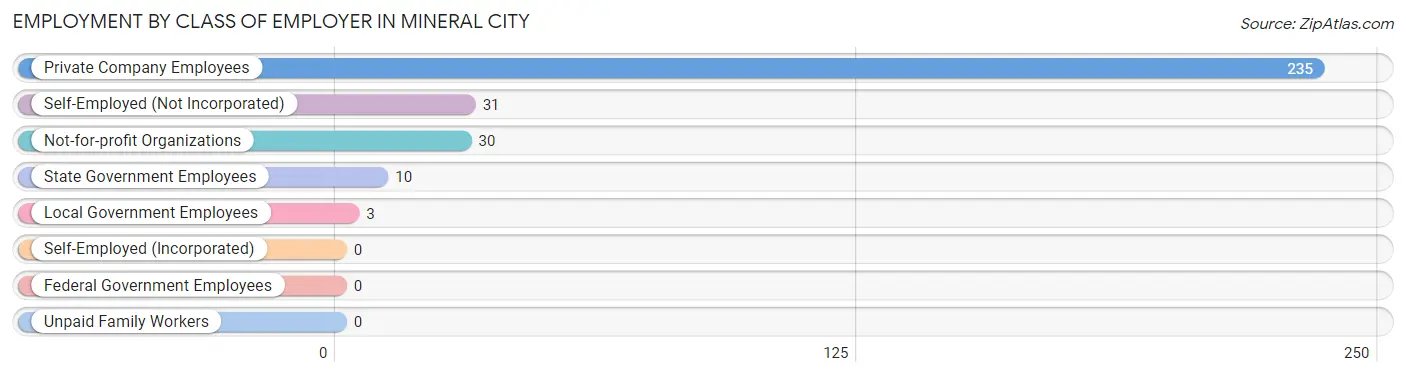
| Employer Class | # Employees | % Employees |
| Private Company Employees | 235 | 76.0% |
| Self-Employed (Incorporated) | 0 | 0.0% |
| Self-Employed (Not Incorporated) | 31 | 10.0% |
| Not-for-profit Organizations | 30 | 9.7% |
| Local Government Employees | 3 | 1.0% |
| State Government Employees | 10 | 3.2% |
| Federal Government Employees | 0 | 0.0% |
| Unpaid Family Workers | 0 | 0.0% |
| Total | 309 | 100.0% |
Employment Status by Age in Mineral City
According to the labor force statistics for Mineral City, out of the total population over 16 years of age (494), 65.2% or 322 individuals are in the labor force, with 3.4% or 11 of them unemployed. The age group with the highest labor force participation rate is 25 to 29 years, with 100.0% or 35 individuals in the labor force. Within the labor force, the 16 to 19 years age range has the highest percentage of unemployed individuals, with 53.8% or 7 of them being unemployed.
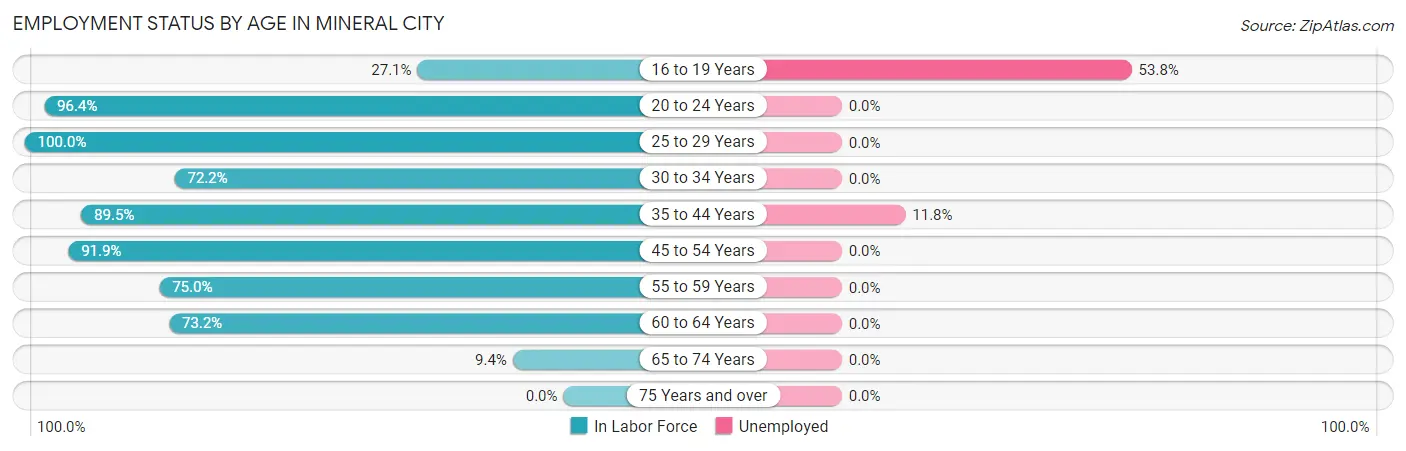
| Age Bracket | In Labor Force | Unemployed |
| 16 to 19 Years | 13 (27.1%) | 7 (53.8%) |
| 20 to 24 Years | 81 (96.4%) | 0 (0.0%) |
| 25 to 29 Years | 35 (100.0%) | 0 (0.0%) |
| 30 to 34 Years | 39 (72.2%) | 0 (0.0%) |
| 35 to 44 Years | 34 (89.5%) | 4 (11.8%) |
| 45 to 54 Years | 57 (91.9%) | 0 (0.0%) |
| 55 to 59 Years | 30 (75.0%) | 0 (0.0%) |
| 60 to 64 Years | 30 (73.2%) | 0 (0.0%) |
| 65 to 74 Years | 3 (9.4%) | 0 (0.0%) |
| 75 Years and over | 0 (0.0%) | 0 (0.0%) |
| Total | 322 (65.2%) | 11 (3.4%) |
Employment Status by Educational Attainment in Mineral City
According to labor force statistics for Mineral City, 83.3% of individuals (225) out of the total population between 25 and 64 years of age (270) are in the labor force, with 1.8% or 4 of them being unemployed. The group with the highest labor force participation rate are those with the educational attainment of less than high school, with 100.0% or 34 individuals in the labor force. Within the labor force, individuals with less than high school education have the highest percentage of unemployment, with 11.8% or 4 of them being unemployed.
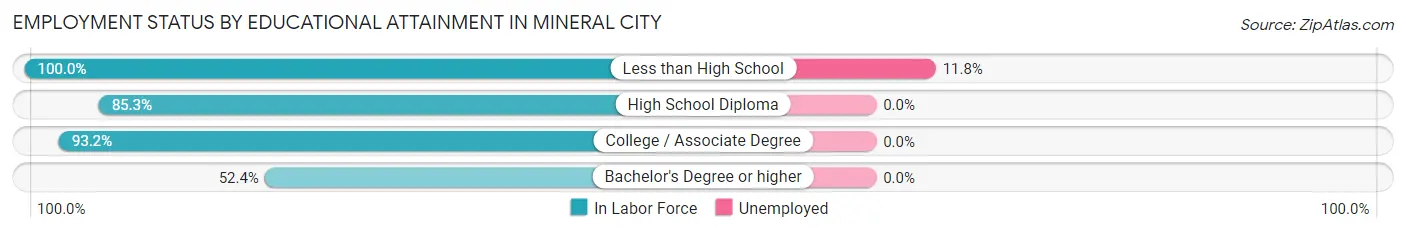
| Educational Attainment | In Labor Force | Unemployed |
| Less than High School | 34 (100.0%) | 4 (11.8%) |
| High School Diploma | 128 (85.3%) | 0 (0.0%) |
| College / Associate Degree | 41 (93.2%) | 0 (0.0%) |
| Bachelor's Degree or higher | 22 (52.4%) | 0 (0.0%) |
| Total | 225 (83.3%) | 5 (1.8%) |
Employment Occupations by Sex in Mineral City
Management, Business, Science and Arts Occupations
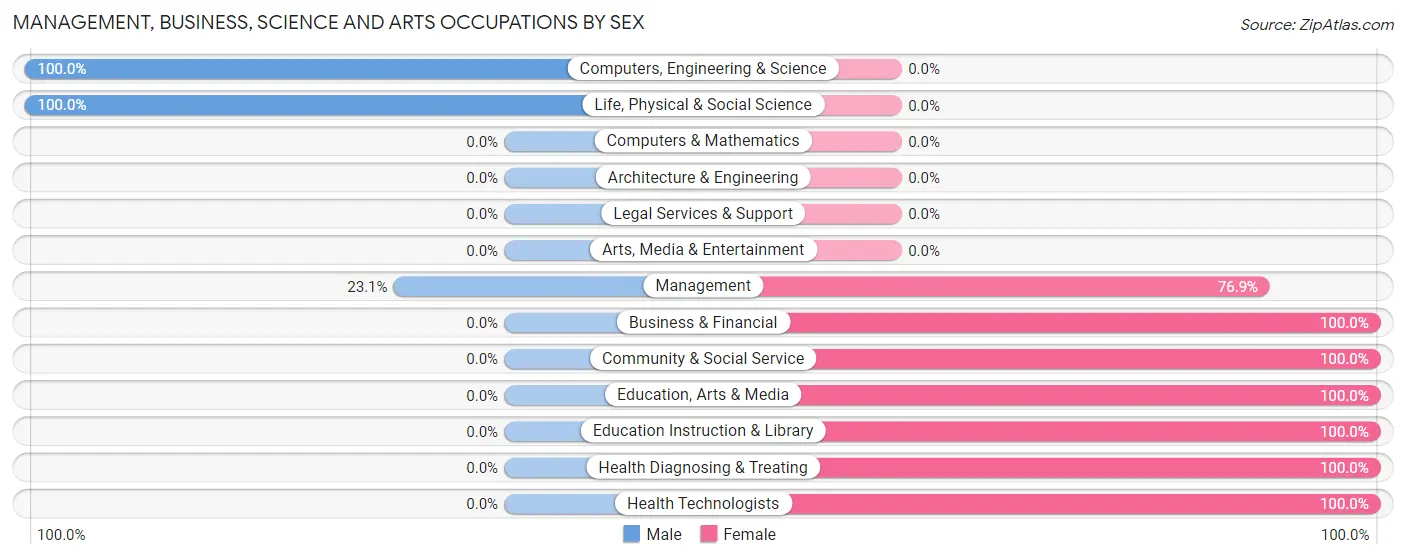
The most common Management, Business, Science and Arts occupations in Mineral City are Management (26 | 8.4%), Health Diagnosing & Treating (16 | 5.1%), Health Technologists (8 | 2.6%), Computers, Engineering & Science (7 | 2.2%), and Life, Physical & Social Science (7 | 2.2%).
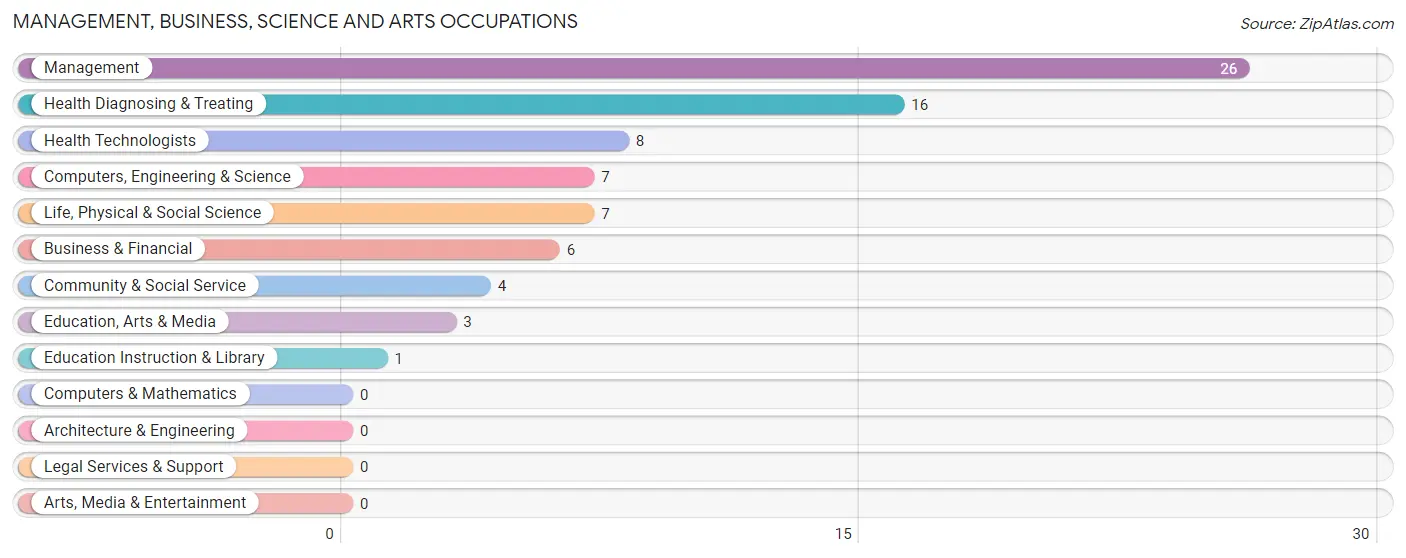
Management, Business, Science and Arts Occupations by Sex
Within the Management, Business, Science and Arts occupations in Mineral City, the most male-oriented occupations are Computers, Engineering & Science (100.0%), Life, Physical & Social Science (100.0%), and Management (23.1%), while the most female-oriented occupations are Business & Financial (100.0%), Community & Social Service (100.0%), and Education, Arts & Media (100.0%).
| Occupation | Male | Female |
| Management | 6 (23.1%) | 20 (76.9%) |
| Business & Financial | 0 (0.0%) | 6 (100.0%) |
| Computers, Engineering & Science | 7 (100.0%) | 0 (0.0%) |
| Computers & Mathematics | 0 (0.0%) | 0 (0.0%) |
| Architecture & Engineering | 0 (0.0%) | 0 (0.0%) |
| Life, Physical & Social Science | 7 (100.0%) | 0 (0.0%) |
| Community & Social Service | 0 (0.0%) | 4 (100.0%) |
| Education, Arts & Media | 0 (0.0%) | 3 (100.0%) |
| Legal Services & Support | 0 (0.0%) | 0 (0.0%) |
| Education Instruction & Library | 0 (0.0%) | 1 (100.0%) |
| Arts, Media & Entertainment | 0 (0.0%) | 0 (0.0%) |
| Health Diagnosing & Treating | 0 (0.0%) | 16 (100.0%) |
| Health Technologists | 0 (0.0%) | 8 (100.0%) |
| Total (Category) | 13 (22.0%) | 46 (78.0%) |
| Total (Overall) | 143 (46.0%) | 168 (54.0%) |
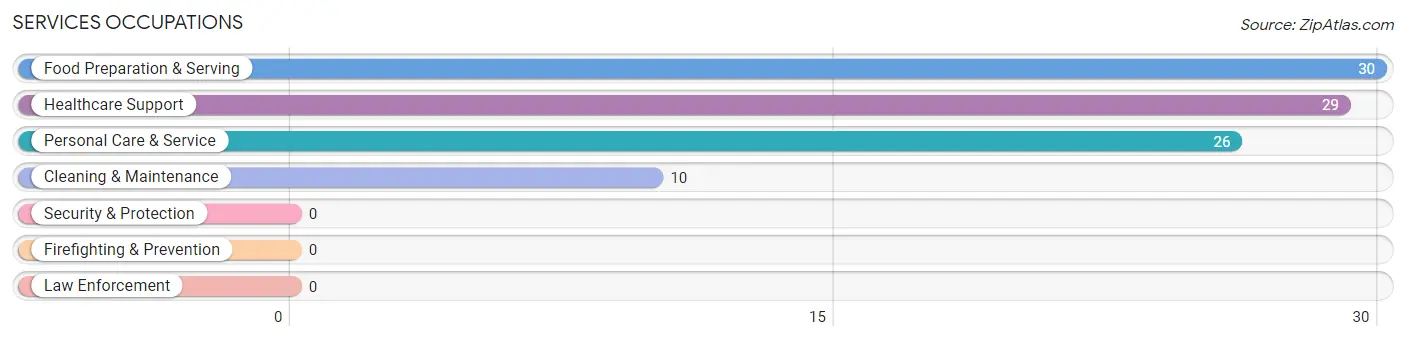
Services Occupations
The most common Services occupations in Mineral City are Food Preparation & Serving (30 | 9.7%), Healthcare Support (29 | 9.3%), Personal Care & Service (26 | 8.4%), and Cleaning & Maintenance (10 | 3.2%).
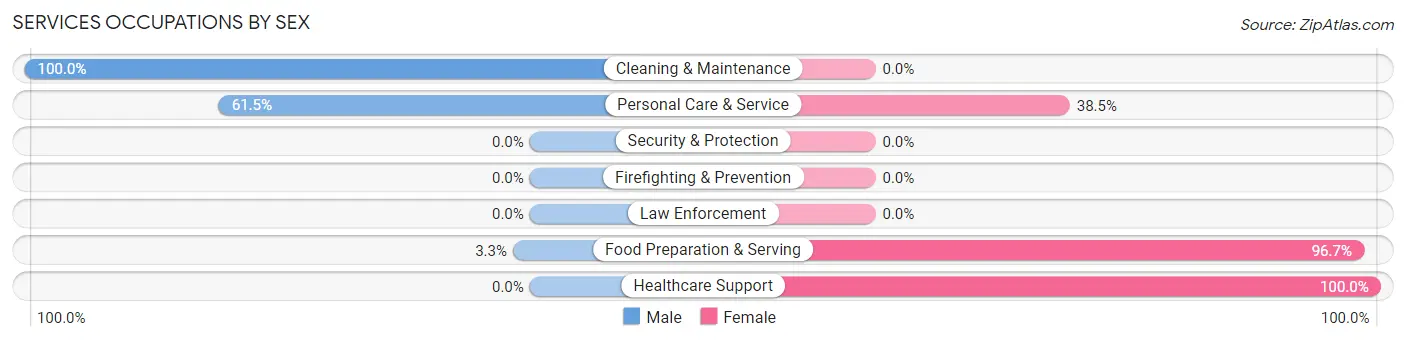
Services Occupations by Sex
Within the Services occupations in Mineral City, the most male-oriented occupations are Cleaning & Maintenance (100.0%), Personal Care & Service (61.5%), and Food Preparation & Serving (3.3%), while the most female-oriented occupations are Healthcare Support (100.0%), Food Preparation & Serving (96.7%), and Personal Care & Service (38.5%).
| Occupation | Male | Female |
| Healthcare Support | 0 (0.0%) | 29 (100.0%) |
| Security & Protection | 0 (0.0%) | 0 (0.0%) |
| Firefighting & Prevention | 0 (0.0%) | 0 (0.0%) |
| Law Enforcement | 0 (0.0%) | 0 (0.0%) |
| Food Preparation & Serving | 1 (3.3%) | 29 (96.7%) |
| Cleaning & Maintenance | 10 (100.0%) | 0 (0.0%) |
| Personal Care & Service | 16 (61.5%) | 10 (38.5%) |
| Total (Category) | 27 (28.4%) | 68 (71.6%) |
| Total (Overall) | 143 (46.0%) | 168 (54.0%) |
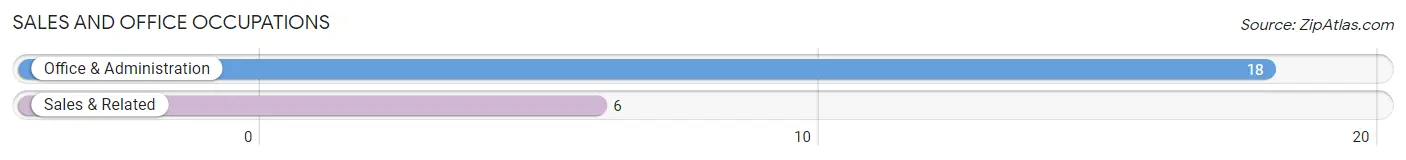
Sales and Office Occupations
The most common Sales and Office occupations in Mineral City are Office & Administration (18 | 5.8%), and Sales & Related (6 | 1.9%).
Sales and Office Occupations by Sex
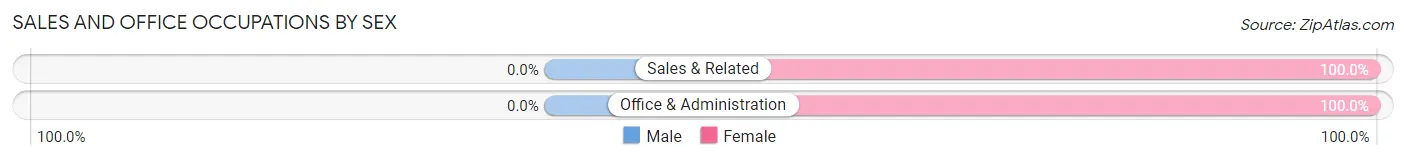
| Occupation | Male | Female |
| Sales & Related | 0 (0.0%) | 6 (100.0%) |
| Office & Administration | 0 (0.0%) | 18 (100.0%) |
| Total (Category) | 0 (0.0%) | 24 (100.0%) |
| Total (Overall) | 143 (46.0%) | 168 (54.0%) |
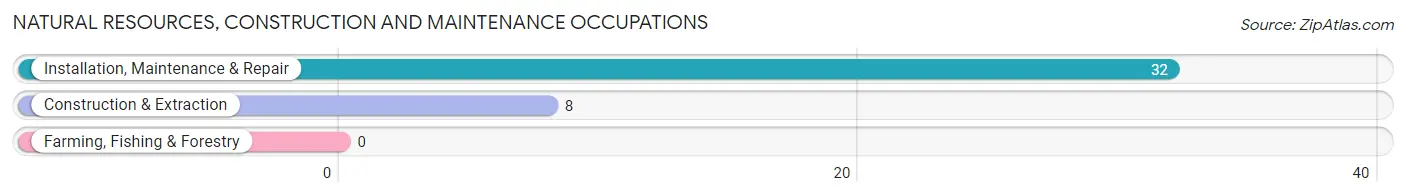
Natural Resources, Construction and Maintenance Occupations
The most common Natural Resources, Construction and Maintenance occupations in Mineral City are Installation, Maintenance & Repair (32 | 10.3%), and Construction & Extraction (8 | 2.6%).
Natural Resources, Construction and Maintenance Occupations by Sex
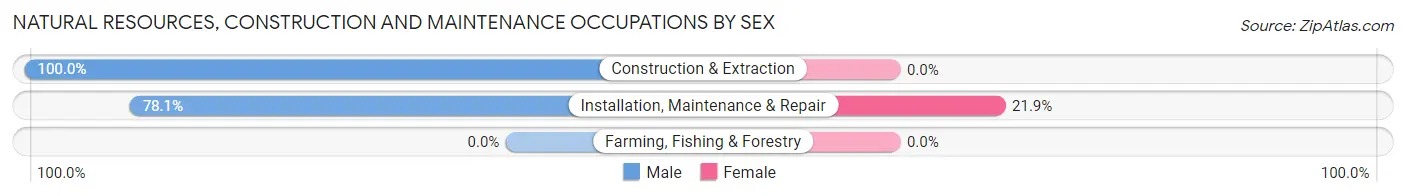
| Occupation | Male | Female |
| Farming, Fishing & Forestry | 0 (0.0%) | 0 (0.0%) |
| Construction & Extraction | 8 (100.0%) | 0 (0.0%) |
| Installation, Maintenance & Repair | 25 (78.1%) | 7 (21.9%) |
| Total (Category) | 33 (82.5%) | 7 (17.5%) |
| Total (Overall) | 143 (46.0%) | 168 (54.0%) |
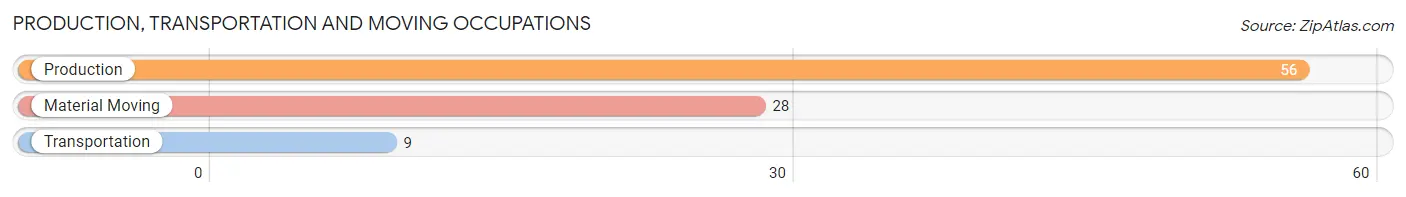
Production, Transportation and Moving Occupations
The most common Production, Transportation and Moving occupations in Mineral City are Production (56 | 18.0%), Material Moving (28 | 9.0%), and Transportation (9 | 2.9%).
Production, Transportation and Moving Occupations by Sex
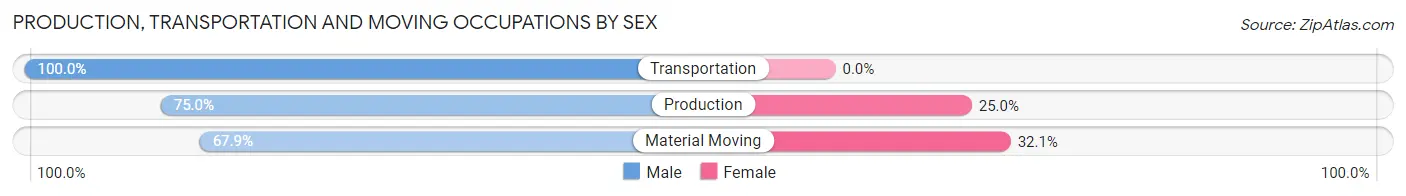
| Occupation | Male | Female |
| Production | 42 (75.0%) | 14 (25.0%) |
| Transportation | 9 (100.0%) | 0 (0.0%) |
| Material Moving | 19 (67.9%) | 9 (32.1%) |
| Total (Category) | 70 (75.3%) | 23 (24.7%) |
| Total (Overall) | 143 (46.0%) | 168 (54.0%) |
Employment Industries by Sex in Mineral City
Employment Industries in Mineral City
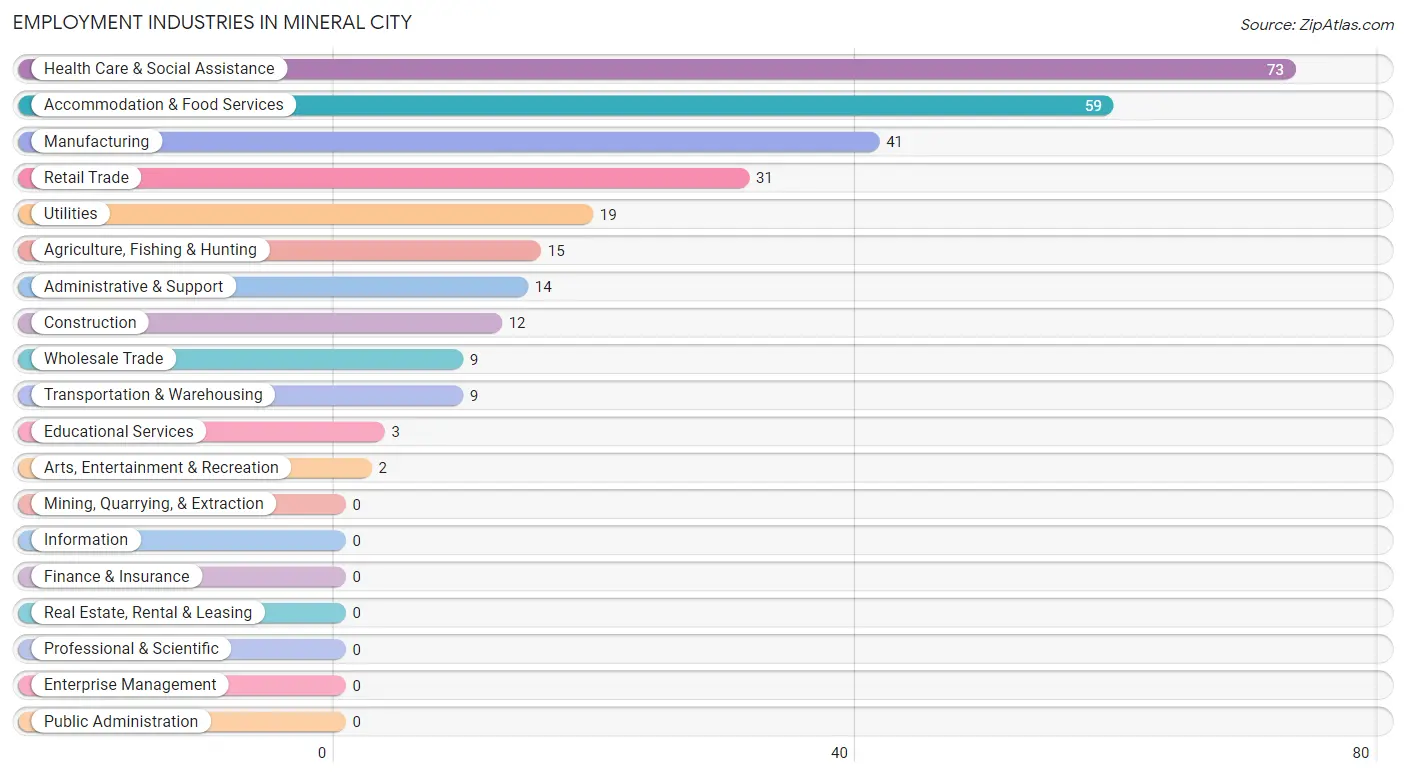
The major employment industries in Mineral City include Health Care & Social Assistance (73 | 23.5%), Accommodation & Food Services (59 | 19.0%), Manufacturing (41 | 13.2%), Retail Trade (31 | 10.0%), and Utilities (19 | 6.1%).
Employment Industries by Sex in Mineral City
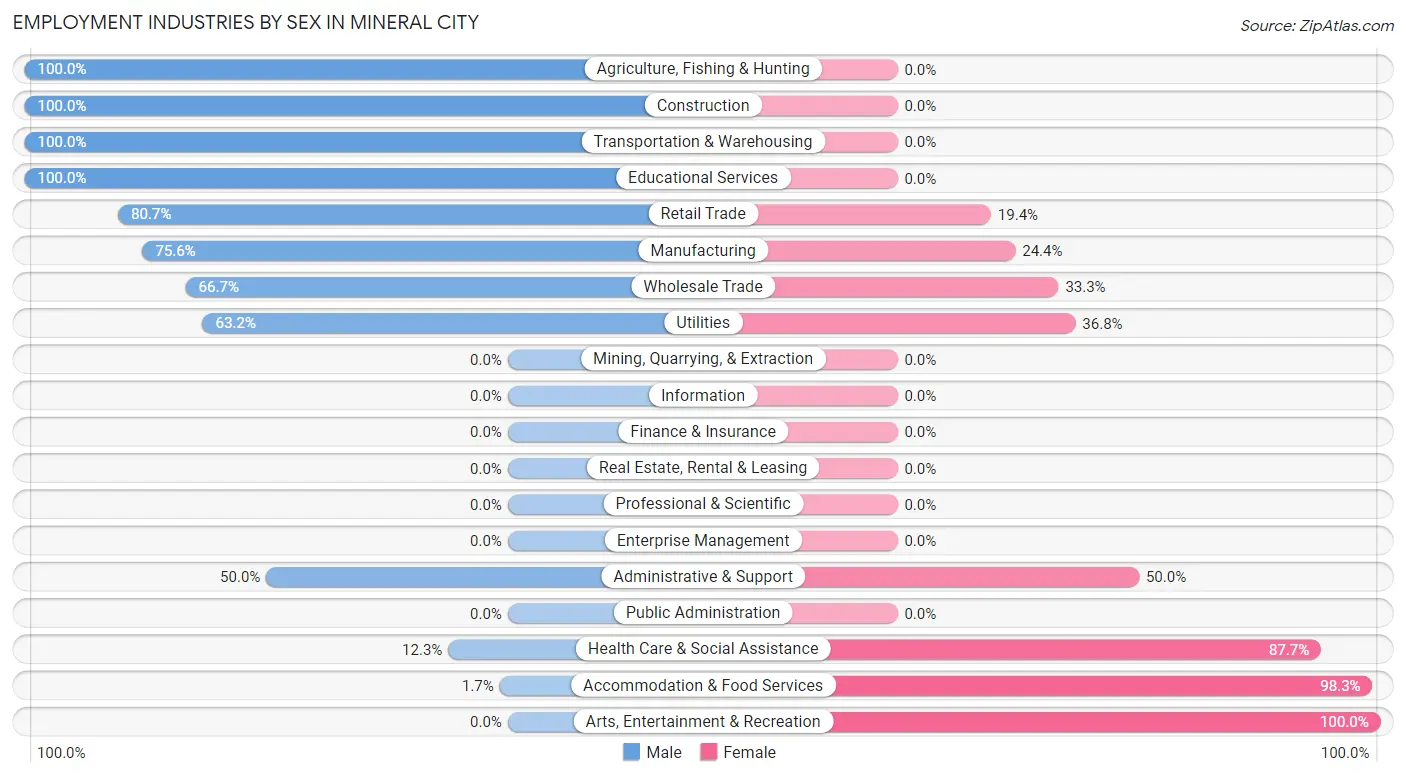
The Mineral City industries that see more men than women are Agriculture, Fishing & Hunting (100.0%), Construction (100.0%), and Transportation & Warehousing (100.0%), whereas the industries that tend to have a higher number of women are Arts, Entertainment & Recreation (100.0%), Accommodation & Food Services (98.3%), and Health Care & Social Assistance (87.7%).
| Industry | Male | Female |
| Agriculture, Fishing & Hunting | 15 (100.0%) | 0 (0.0%) |
| Mining, Quarrying, & Extraction | 0 (0.0%) | 0 (0.0%) |
| Construction | 12 (100.0%) | 0 (0.0%) |
| Manufacturing | 31 (75.6%) | 10 (24.4%) |
| Wholesale Trade | 6 (66.7%) | 3 (33.3%) |
| Retail Trade | 25 (80.6%) | 6 (19.4%) |
| Transportation & Warehousing | 9 (100.0%) | 0 (0.0%) |
| Utilities | 12 (63.2%) | 7 (36.8%) |
| Information | 0 (0.0%) | 0 (0.0%) |
| Finance & Insurance | 0 (0.0%) | 0 (0.0%) |
| Real Estate, Rental & Leasing | 0 (0.0%) | 0 (0.0%) |
| Professional & Scientific | 0 (0.0%) | 0 (0.0%) |
| Enterprise Management | 0 (0.0%) | 0 (0.0%) |
| Administrative & Support | 7 (50.0%) | 7 (50.0%) |
| Educational Services | 3 (100.0%) | 0 (0.0%) |
| Health Care & Social Assistance | 9 (12.3%) | 64 (87.7%) |
| Arts, Entertainment & Recreation | 0 (0.0%) | 2 (100.0%) |
| Accommodation & Food Services | 1 (1.7%) | 58 (98.3%) |
| Public Administration | 0 (0.0%) | 0 (0.0%) |
| Total | 143 (46.0%) | 168 (54.0%) |
Education in Mineral City
School Enrollment in Mineral City
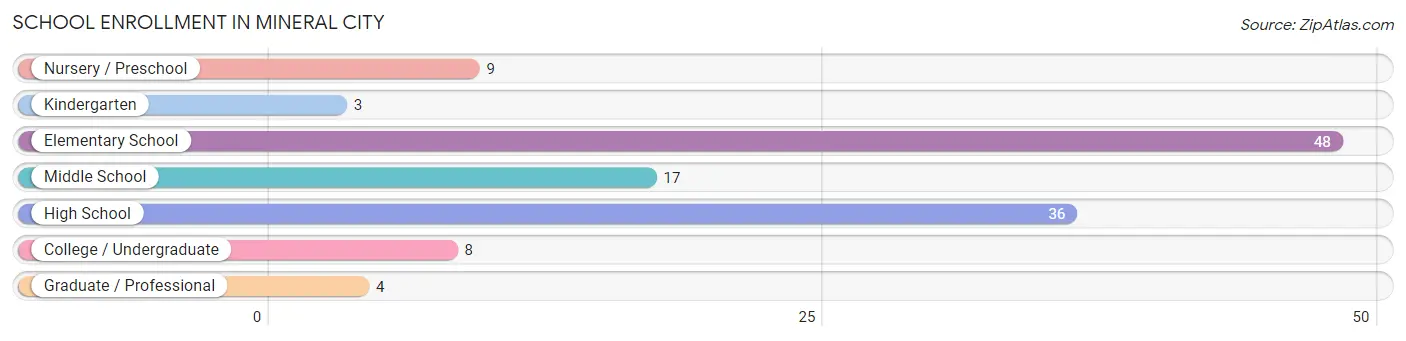
The most common levels of schooling among the 125 students in Mineral City are elementary school (48 | 38.4%), high school (36 | 28.8%), and middle school (17 | 13.6%).
| School Level | # Students | % Students |
| Nursery / Preschool | 9 | 7.2% |
| Kindergarten | 3 | 2.4% |
| Elementary School | 48 | 38.4% |
| Middle School | 17 | 13.6% |
| High School | 36 | 28.8% |
| College / Undergraduate | 8 | 6.4% |
| Graduate / Professional | 4 | 3.2% |
| Total | 125 | 100.0% |
School Enrollment by Age by Funding Source in Mineral City
Out of a total of 125 students who are enrolled in schools in Mineral City, 10 (8.0%) attend a private institution, while the remaining 115 (92.0%) are enrolled in public schools. The age group of 3 to 4 year olds has the highest likelihood of being enrolled in private schools, with 9 (100.0% in the age bracket) enrolled. Conversely, the age group of 5 to 9 year old has the lowest likelihood of being enrolled in a private school, with 41 (100.0% in the age bracket) attending a public institution.
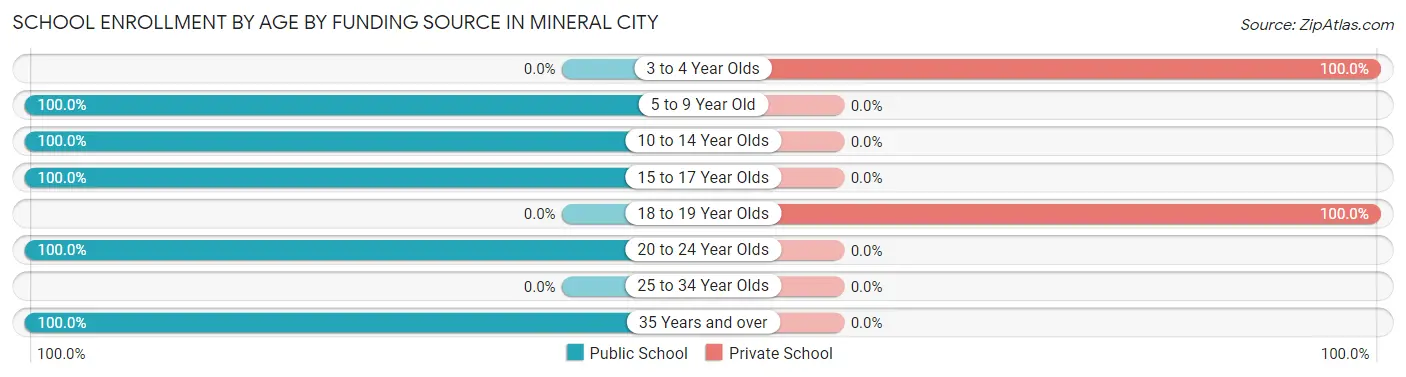
| Age Bracket | Public School | Private School |
| 3 to 4 Year Olds | 0 (0.0%) | 9 (100.0%) |
| 5 to 9 Year Old | 41 (100.0%) | 0 (0.0%) |
| 10 to 14 Year Olds | 27 (100.0%) | 0 (0.0%) |
| 15 to 17 Year Olds | 36 (100.0%) | 0 (0.0%) |
| 18 to 19 Year Olds | 0 (0.0%) | 1 (100.0%) |
| 20 to 24 Year Olds | 4 (100.0%) | 0 (0.0%) |
| 25 to 34 Year Olds | 0 (0.0%) | 0 (0.0%) |
| 35 Years and over | 7 (100.0%) | 0 (0.0%) |
| Total | 115 (92.0%) | 10 (8.0%) |
Educational Attainment by Field of Study in Mineral City
Business (24 | 53.3%), science & technology (13 | 28.9%), psychology (7 | 15.6%), and literature & languages (1 | 2.2%) are the most common fields of study among 45 individuals in Mineral City who have obtained a bachelor's degree or higher.
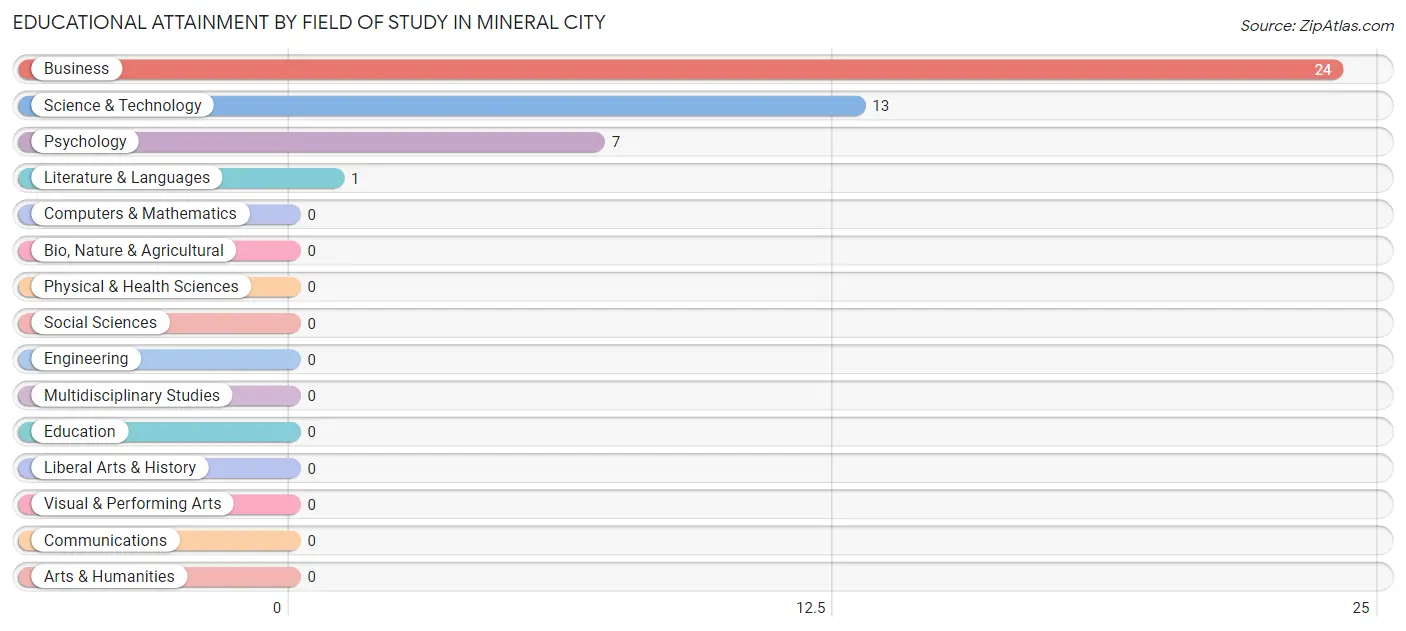
| Field of Study | # Graduates | % Graduates |
| Computers & Mathematics | 0 | 0.0% |
| Bio, Nature & Agricultural | 0 | 0.0% |
| Physical & Health Sciences | 0 | 0.0% |
| Psychology | 7 | 15.6% |
| Social Sciences | 0 | 0.0% |
| Engineering | 0 | 0.0% |
| Multidisciplinary Studies | 0 | 0.0% |
| Science & Technology | 13 | 28.9% |
| Business | 24 | 53.3% |
| Education | 0 | 0.0% |
| Literature & Languages | 1 | 2.2% |
| Liberal Arts & History | 0 | 0.0% |
| Visual & Performing Arts | 0 | 0.0% |
| Communications | 0 | 0.0% |
| Arts & Humanities | 0 | 0.0% |
| Total | 45 | 100.0% |
Transportation & Commute in Mineral City
Vehicle Availability by Sex in Mineral City
The most prevalent vehicle ownership categories in Mineral City are males with 2 vehicles (96, accounting for 67.1%) and females with 2 vehicles (89, making up 57.8%).
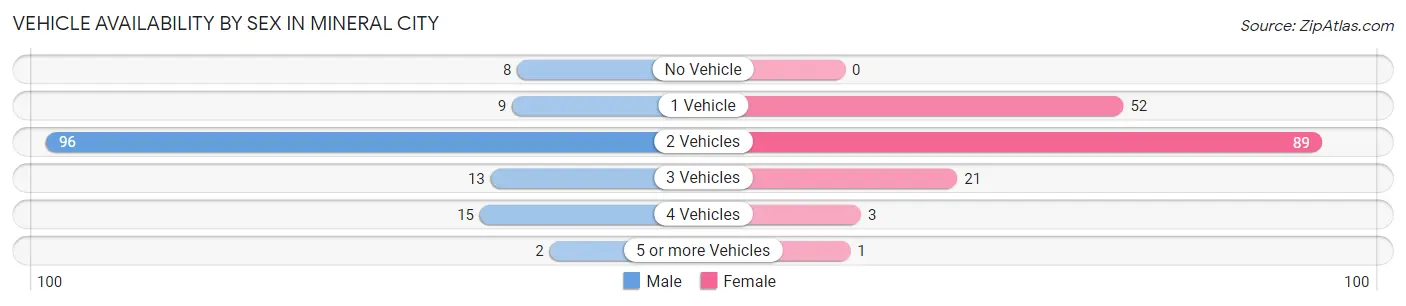
| Vehicles Available | Male | Female |
| No Vehicle | 8 (5.6%) | 0 (0.0%) |
| 1 Vehicle | 9 (6.3%) | 52 (31.3%) |
| 2 Vehicles | 96 (67.1%) | 89 (53.6%) |
| 3 Vehicles | 13 (9.1%) | 21 (12.7%) |
| 4 Vehicles | 15 (10.5%) | 3 (1.8%) |
| 5 or more Vehicles | 2 (1.4%) | 1 (0.6%) |
| Total | 143 (100.0%) | 166 (100.0%) |
Commute Time in Mineral City
The most frequently occuring commute durations in Mineral City are 25 to 29 minutes (73 commuters, 24.2%), 30 to 34 minutes (57 commuters, 18.9%), and 15 to 19 minutes (51 commuters, 16.9%).
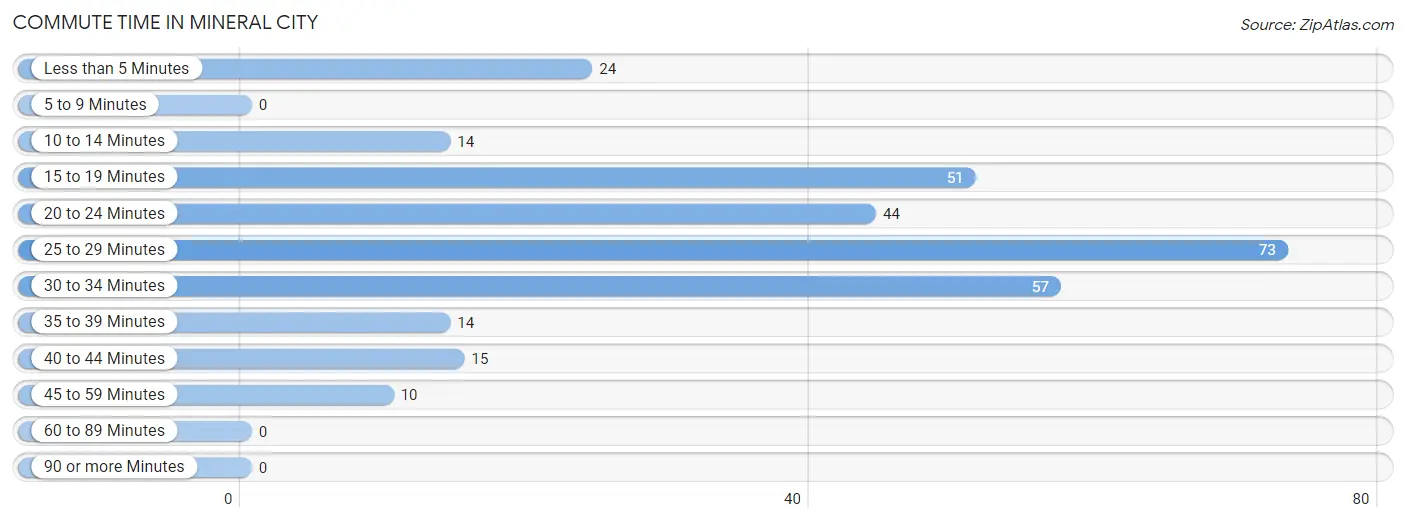
| Commute Time | # Commuters | % Commuters |
| Less than 5 Minutes | 24 | 8.0% |
| 5 to 9 Minutes | 0 | 0.0% |
| 10 to 14 Minutes | 14 | 4.6% |
| 15 to 19 Minutes | 51 | 16.9% |
| 20 to 24 Minutes | 44 | 14.6% |
| 25 to 29 Minutes | 73 | 24.2% |
| 30 to 34 Minutes | 57 | 18.9% |
| 35 to 39 Minutes | 14 | 4.6% |
| 40 to 44 Minutes | 15 | 5.0% |
| 45 to 59 Minutes | 10 | 3.3% |
| 60 to 89 Minutes | 0 | 0.0% |
| 90 or more Minutes | 0 | 0.0% |
Commute Time by Sex in Mineral City
The most common commute times in Mineral City are 30 to 34 minutes (50 commuters, 35.0%) for males and 25 to 29 minutes (52 commuters, 32.7%) for females.
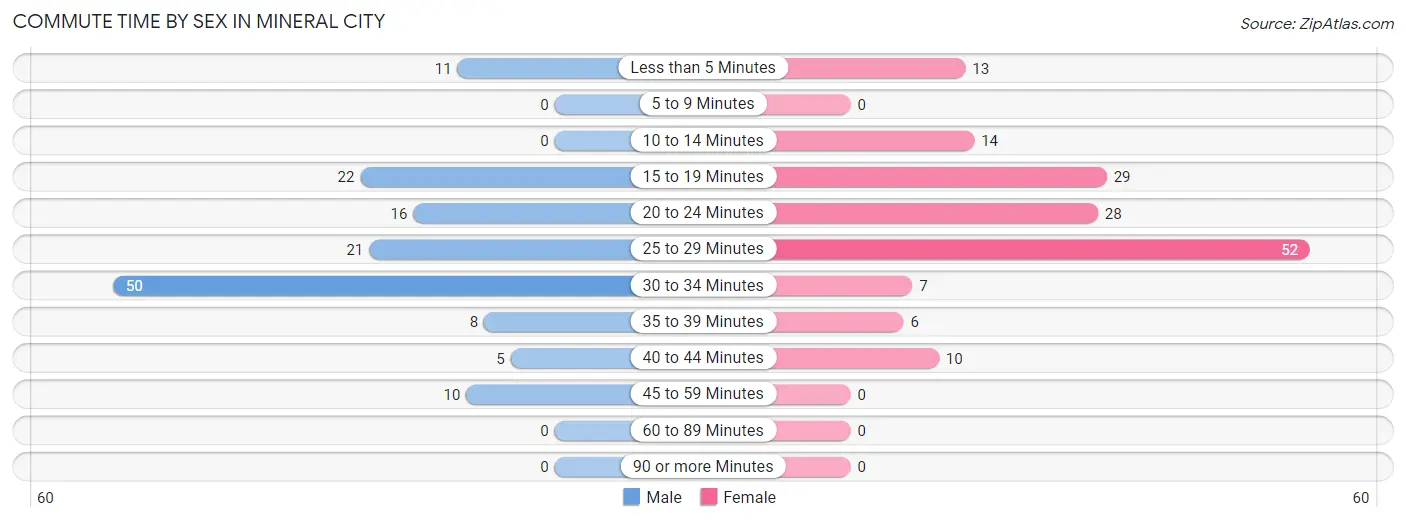
| Commute Time | Male | Female |
| Less than 5 Minutes | 11 (7.7%) | 13 (8.2%) |
| 5 to 9 Minutes | 0 (0.0%) | 0 (0.0%) |
| 10 to 14 Minutes | 0 (0.0%) | 14 (8.8%) |
| 15 to 19 Minutes | 22 (15.4%) | 29 (18.2%) |
| 20 to 24 Minutes | 16 (11.2%) | 28 (17.6%) |
| 25 to 29 Minutes | 21 (14.7%) | 52 (32.7%) |
| 30 to 34 Minutes | 50 (35.0%) | 7 (4.4%) |
| 35 to 39 Minutes | 8 (5.6%) | 6 (3.8%) |
| 40 to 44 Minutes | 5 (3.5%) | 10 (6.3%) |
| 45 to 59 Minutes | 10 (7.0%) | 0 (0.0%) |
| 60 to 89 Minutes | 0 (0.0%) | 0 (0.0%) |
| 90 or more Minutes | 0 (0.0%) | 0 (0.0%) |
Time of Departure to Work by Sex in Mineral City
The most frequent times of departure to work in Mineral City are 12:00 AM to 4:59 AM (27, 18.9%) for males and 12:00 PM to 3:59 PM (20, 12.6%) for females.
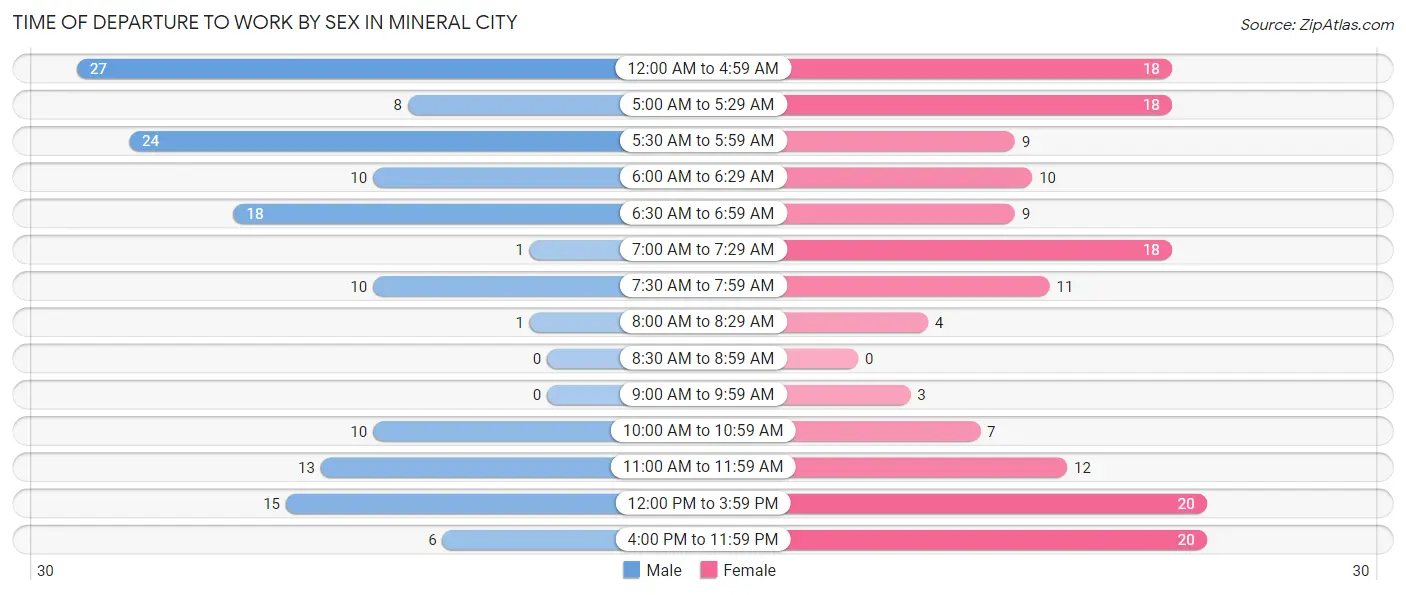
| Time of Departure | Male | Female |
| 12:00 AM to 4:59 AM | 27 (18.9%) | 18 (11.3%) |
| 5:00 AM to 5:29 AM | 8 (5.6%) | 18 (11.3%) |
| 5:30 AM to 5:59 AM | 24 (16.8%) | 9 (5.7%) |
| 6:00 AM to 6:29 AM | 10 (7.0%) | 10 (6.3%) |
| 6:30 AM to 6:59 AM | 18 (12.6%) | 9 (5.7%) |
| 7:00 AM to 7:29 AM | 1 (0.7%) | 18 (11.3%) |
| 7:30 AM to 7:59 AM | 10 (7.0%) | 11 (6.9%) |
| 8:00 AM to 8:29 AM | 1 (0.7%) | 4 (2.5%) |
| 8:30 AM to 8:59 AM | 0 (0.0%) | 0 (0.0%) |
| 9:00 AM to 9:59 AM | 0 (0.0%) | 3 (1.9%) |
| 10:00 AM to 10:59 AM | 10 (7.0%) | 7 (4.4%) |
| 11:00 AM to 11:59 AM | 13 (9.1%) | 12 (7.5%) |
| 12:00 PM to 3:59 PM | 15 (10.5%) | 20 (12.6%) |
| 4:00 PM to 11:59 PM | 6 (4.2%) | 20 (12.6%) |
| Total | 143 (100.0%) | 159 (100.0%) |
Housing Occupancy in Mineral City
Occupancy by Ownership in Mineral City
Of the total 249 dwellings in Mineral City, owner-occupied units account for 156 (62.6%), while renter-occupied units make up 93 (37.3%).
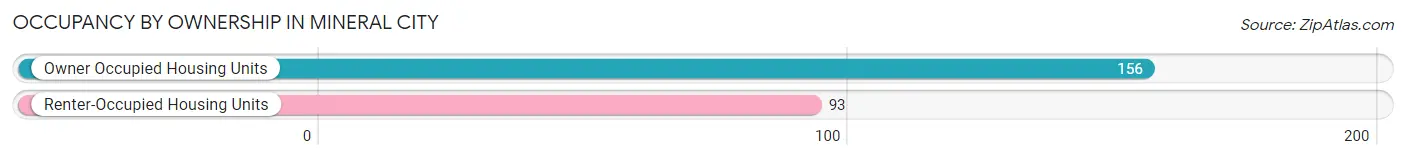
| Occupancy | # Housing Units | % Housing Units |
| Owner Occupied Housing Units | 156 | 62.6% |
| Renter-Occupied Housing Units | 93 | 37.3% |
| Total Occupied Housing Units | 249 | 100.0% |
Occupancy by Household Size in Mineral City
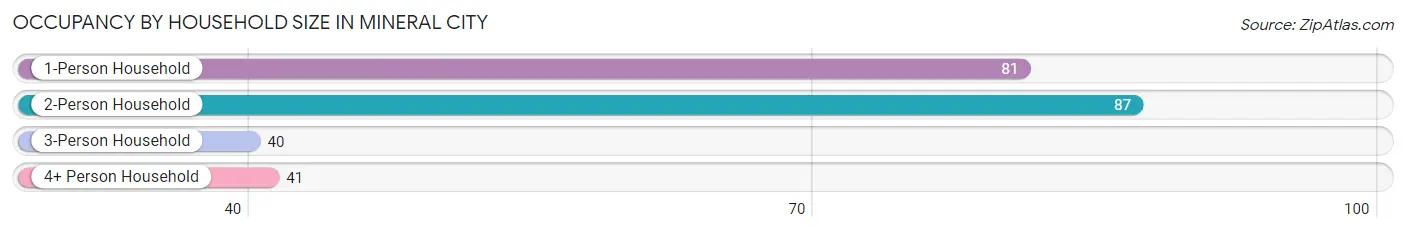
| Household Size | # Housing Units | % Housing Units |
| 1-Person Household | 81 | 32.5% |
| 2-Person Household | 87 | 34.9% |
| 3-Person Household | 40 | 16.1% |
| 4+ Person Household | 41 | 16.5% |
| Total Housing Units | 249 | 100.0% |
Occupancy by Ownership by Household Size in Mineral City
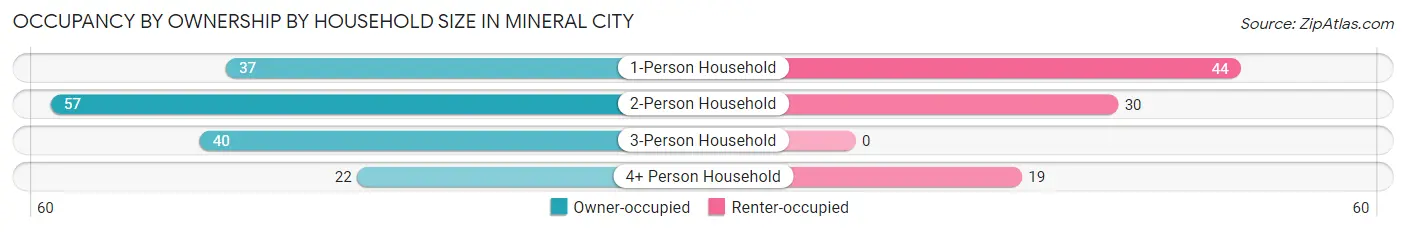
| Household Size | Owner-occupied | Renter-occupied |
| 1-Person Household | 37 (45.7%) | 44 (54.3%) |
| 2-Person Household | 57 (65.5%) | 30 (34.5%) |
| 3-Person Household | 40 (100.0%) | 0 (0.0%) |
| 4+ Person Household | 22 (53.7%) | 19 (46.3%) |
| Total Housing Units | 156 (62.6%) | 93 (37.3%) |
Occupancy by Educational Attainment in Mineral City
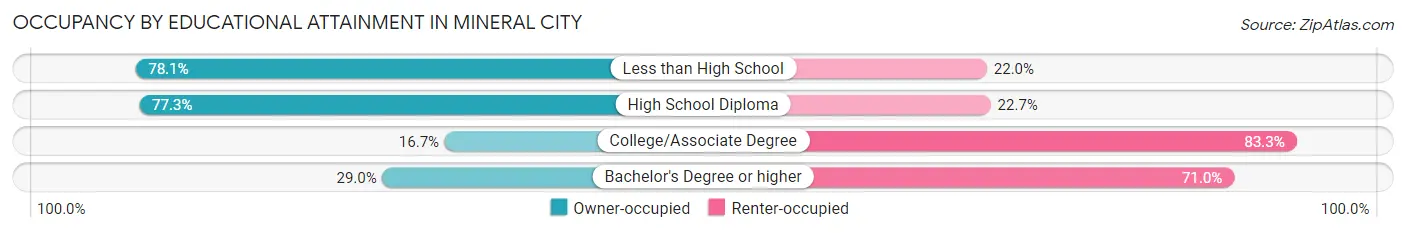
| Household Size | Owner-occupied | Renter-occupied |
| Less than High School | 32 (78.0%) | 9 (22.0%) |
| High School Diploma | 109 (77.3%) | 32 (22.7%) |
| College/Associate Degree | 6 (16.7%) | 30 (83.3%) |
| Bachelor's Degree or higher | 9 (29.0%) | 22 (71.0%) |
Occupancy by Age of Householder in Mineral City
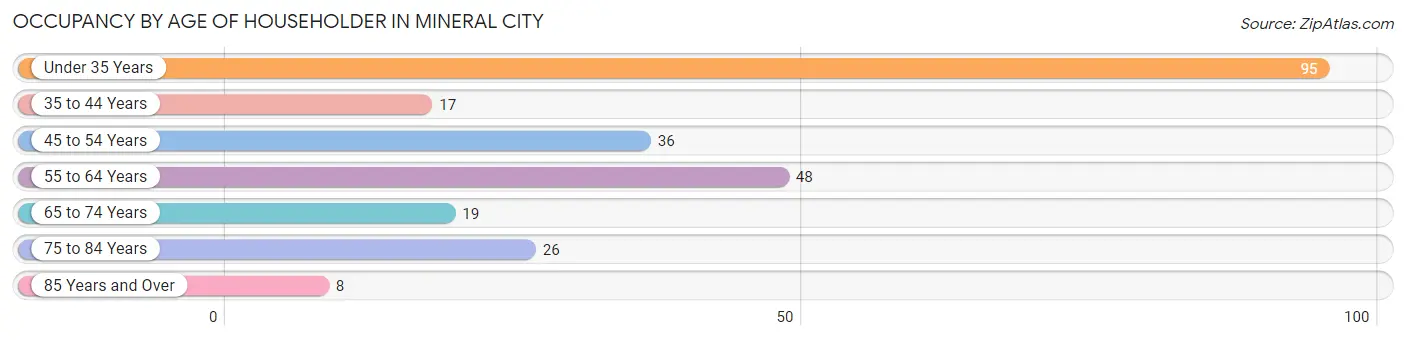
| Age Bracket | # Households | % Households |
| Under 35 Years | 95 | 38.2% |
| 35 to 44 Years | 17 | 6.8% |
| 45 to 54 Years | 36 | 14.5% |
| 55 to 64 Years | 48 | 19.3% |
| 65 to 74 Years | 19 | 7.6% |
| 75 to 84 Years | 26 | 10.4% |
| 85 Years and Over | 8 | 3.2% |
| Total | 249 | 100.0% |
Housing Finances in Mineral City
Median Income by Occupancy in Mineral City
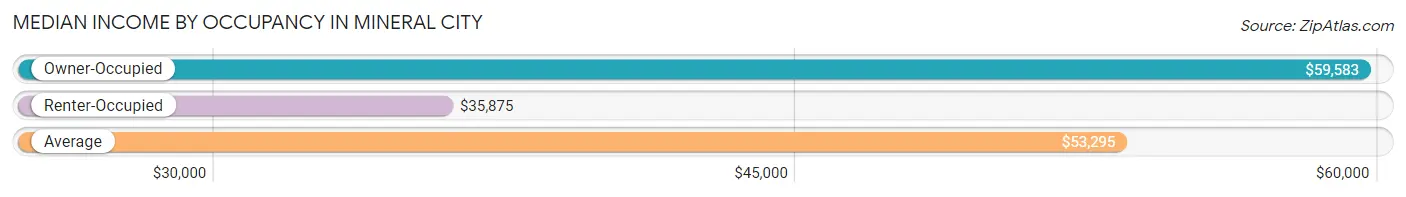
| Occupancy Type | # Households | Median Income |
| Owner-Occupied | 156 (62.6%) | $59,583 |
| Renter-Occupied | 93 (37.3%) | $35,875 |
| Average | 249 (100.0%) | $53,295 |
Occupancy by Householder Income Bracket in Mineral City
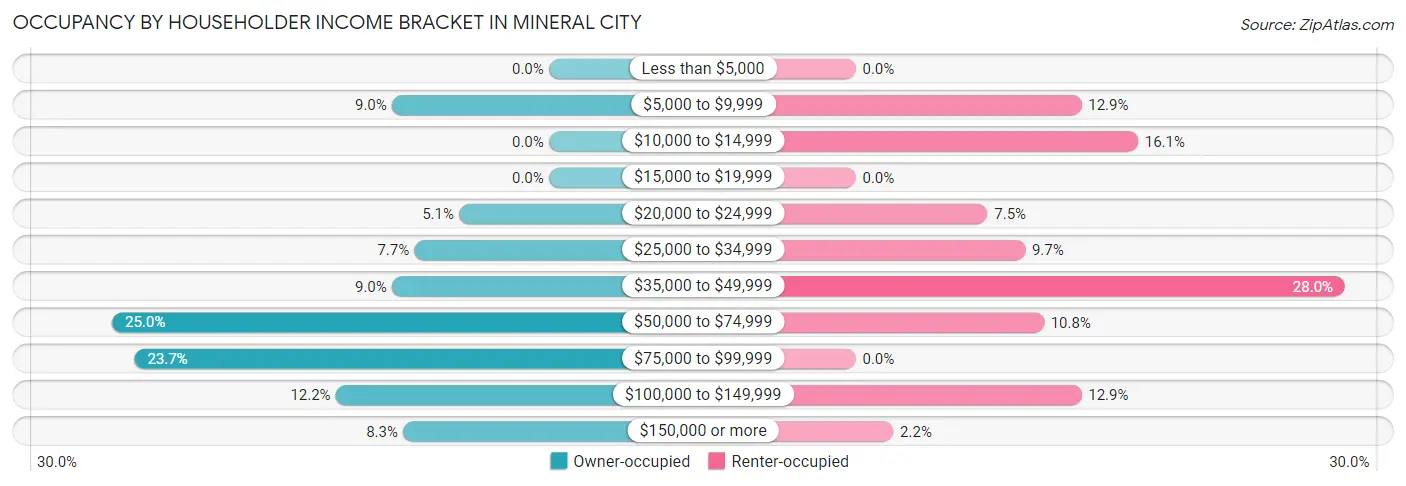
| Income Bracket | Owner-occupied | Renter-occupied |
| Less than $5,000 | 0 (0.0%) | 0 (0.0%) |
| $5,000 to $9,999 | 14 (9.0%) | 12 (12.9%) |
| $10,000 to $14,999 | 0 (0.0%) | 15 (16.1%) |
| $15,000 to $19,999 | 0 (0.0%) | 0 (0.0%) |
| $20,000 to $24,999 | 8 (5.1%) | 7 (7.5%) |
| $25,000 to $34,999 | 12 (7.7%) | 9 (9.7%) |
| $35,000 to $49,999 | 14 (9.0%) | 26 (28.0%) |
| $50,000 to $74,999 | 39 (25.0%) | 10 (10.7%) |
| $75,000 to $99,999 | 37 (23.7%) | 0 (0.0%) |
| $100,000 to $149,999 | 19 (12.2%) | 12 (12.9%) |
| $150,000 or more | 13 (8.3%) | 2 (2.1%) |
| Total | 156 (100.0%) | 93 (100.0%) |
Monthly Housing Cost Tiers in Mineral City
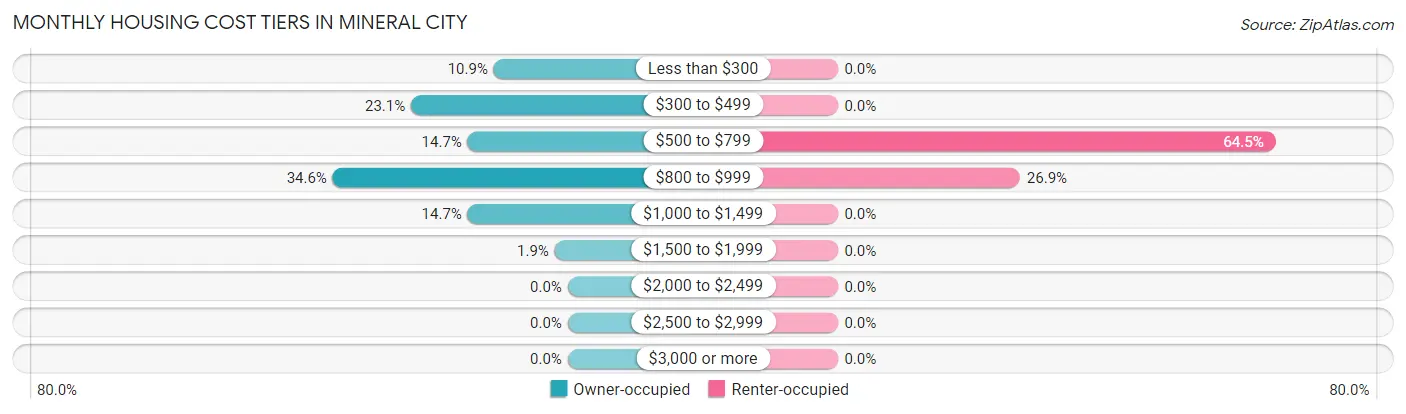
| Monthly Cost | Owner-occupied | Renter-occupied |
| Less than $300 | 17 (10.9%) | 0 (0.0%) |
| $300 to $499 | 36 (23.1%) | 0 (0.0%) |
| $500 to $799 | 23 (14.7%) | 60 (64.5%) |
| $800 to $999 | 54 (34.6%) | 25 (26.9%) |
| $1,000 to $1,499 | 23 (14.7%) | 0 (0.0%) |
| $1,500 to $1,999 | 3 (1.9%) | 0 (0.0%) |
| $2,000 to $2,499 | 0 (0.0%) | 0 (0.0%) |
| $2,500 to $2,999 | 0 (0.0%) | 0 (0.0%) |
| $3,000 or more | 0 (0.0%) | 0 (0.0%) |
| Total | 156 (100.0%) | 93 (100.0%) |
Physical Housing Characteristics in Mineral City
Housing Structures in Mineral City
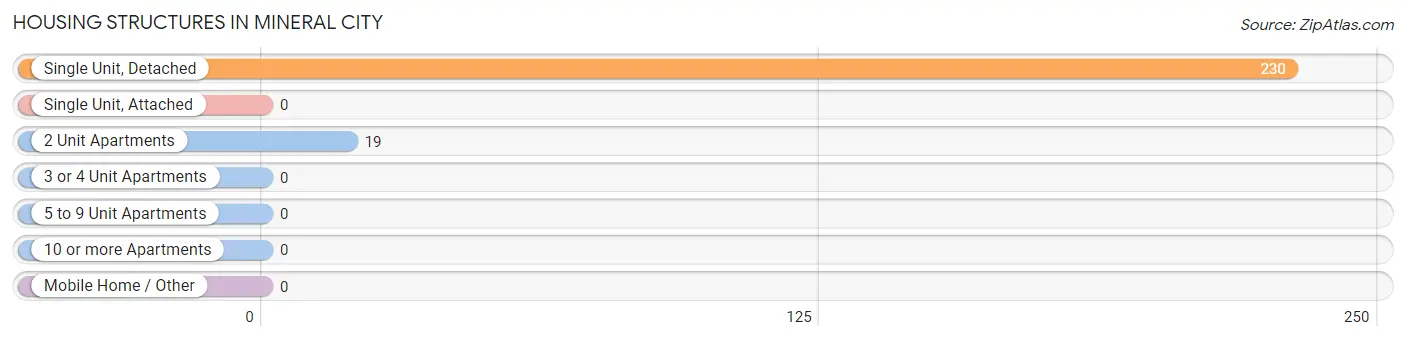
| Structure Type | # Housing Units | % Housing Units |
| Single Unit, Detached | 230 | 92.4% |
| Single Unit, Attached | 0 | 0.0% |
| 2 Unit Apartments | 19 | 7.6% |
| 3 or 4 Unit Apartments | 0 | 0.0% |
| 5 to 9 Unit Apartments | 0 | 0.0% |
| 10 or more Apartments | 0 | 0.0% |
| Mobile Home / Other | 0 | 0.0% |
| Total | 249 | 100.0% |
Housing Structures by Occupancy in Mineral City
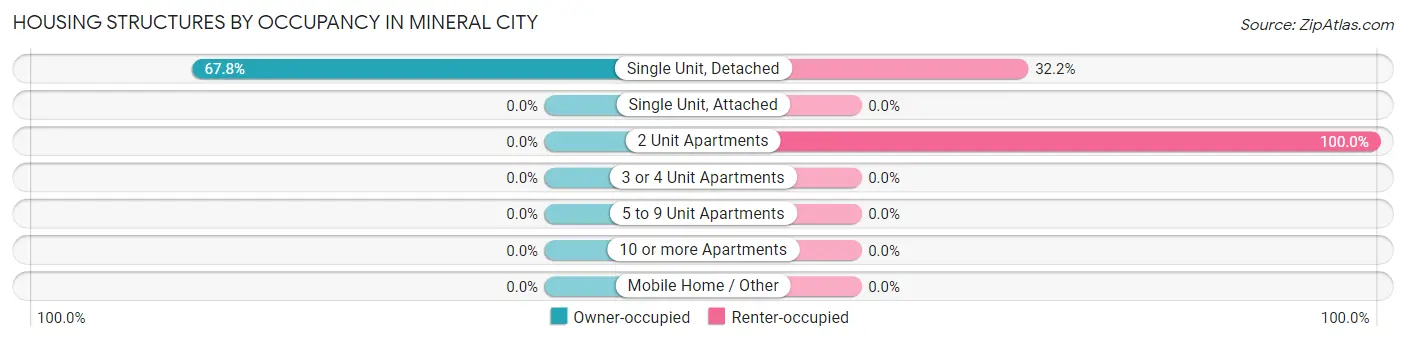
| Structure Type | Owner-occupied | Renter-occupied |
| Single Unit, Detached | 156 (67.8%) | 74 (32.2%) |
| Single Unit, Attached | 0 (0.0%) | 0 (0.0%) |
| 2 Unit Apartments | 0 (0.0%) | 19 (100.0%) |
| 3 or 4 Unit Apartments | 0 (0.0%) | 0 (0.0%) |
| 5 to 9 Unit Apartments | 0 (0.0%) | 0 (0.0%) |
| 10 or more Apartments | 0 (0.0%) | 0 (0.0%) |
| Mobile Home / Other | 0 (0.0%) | 0 (0.0%) |
| Total | 156 (62.6%) | 93 (37.3%) |
Housing Structures by Number of Rooms in Mineral City
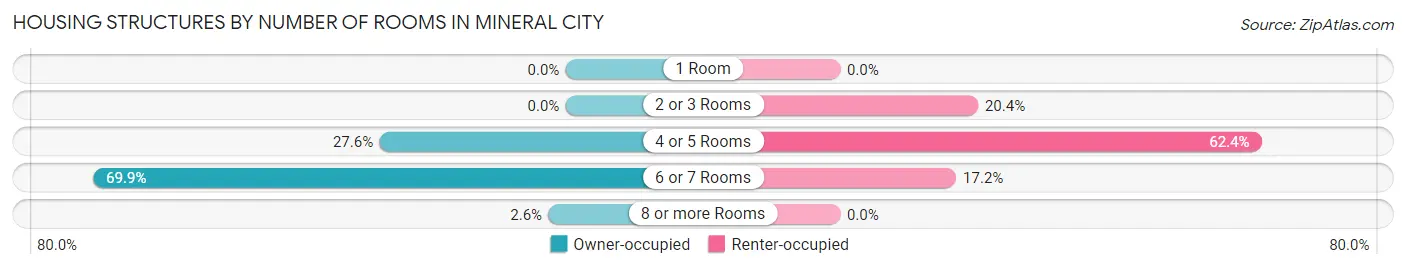
| Number of Rooms | Owner-occupied | Renter-occupied |
| 1 Room | 0 (0.0%) | 0 (0.0%) |
| 2 or 3 Rooms | 0 (0.0%) | 19 (20.4%) |
| 4 or 5 Rooms | 43 (27.6%) | 58 (62.4%) |
| 6 or 7 Rooms | 109 (69.9%) | 16 (17.2%) |
| 8 or more Rooms | 4 (2.6%) | 0 (0.0%) |
| Total | 156 (100.0%) | 93 (100.0%) |
Housing Structure by Heating Type in Mineral City
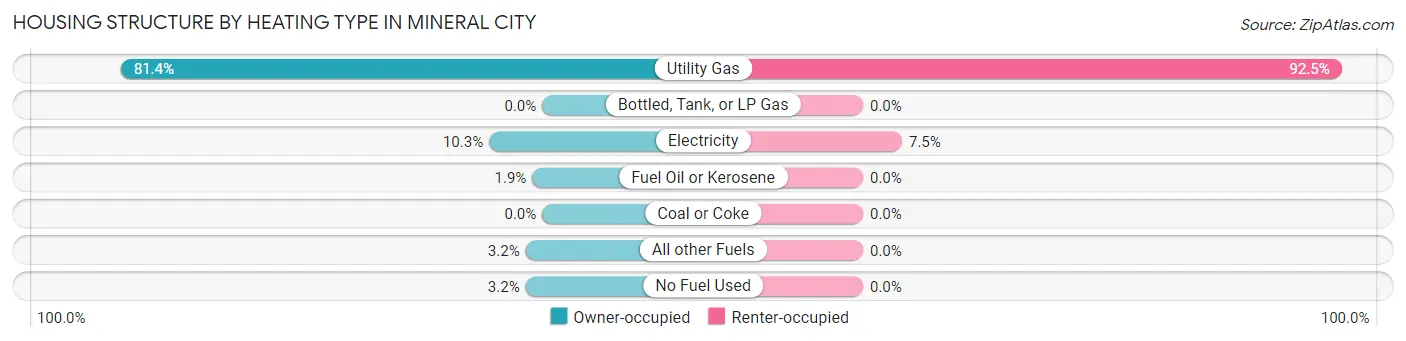
| Heating Type | Owner-occupied | Renter-occupied |
| Utility Gas | 127 (81.4%) | 86 (92.5%) |
| Bottled, Tank, or LP Gas | 0 (0.0%) | 0 (0.0%) |
| Electricity | 16 (10.3%) | 7 (7.5%) |
| Fuel Oil or Kerosene | 3 (1.9%) | 0 (0.0%) |
| Coal or Coke | 0 (0.0%) | 0 (0.0%) |
| All other Fuels | 5 (3.2%) | 0 (0.0%) |
| No Fuel Used | 5 (3.2%) | 0 (0.0%) |
| Total | 156 (100.0%) | 93 (100.0%) |
Household Vehicle Usage in Mineral City
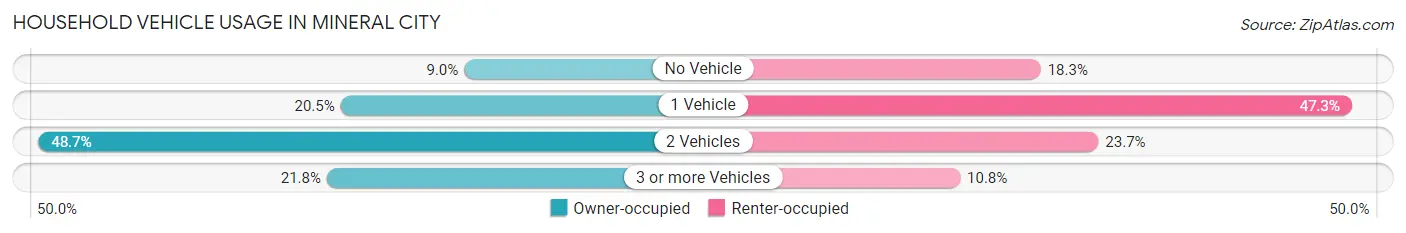
| Vehicles per Household | Owner-occupied | Renter-occupied |
| No Vehicle | 14 (9.0%) | 17 (18.3%) |
| 1 Vehicle | 32 (20.5%) | 44 (47.3%) |
| 2 Vehicles | 76 (48.7%) | 22 (23.7%) |
| 3 or more Vehicles | 34 (21.8%) | 10 (10.7%) |
| Total | 156 (100.0%) | 93 (100.0%) |
Real Estate & Mortgages in Mineral City
Real Estate and Mortgage Overview in Mineral City
| Characteristic | Without Mortgage | With Mortgage |
| Housing Units | 62 | 94 |
| Median Property Value | $82,200 | $97,700 |
| Median Household Income | - | - |
| Monthly Housing Costs | $355 | $0 |
| Real Estate Taxes | $1,000 | $0 |
Property Value by Mortgage Status in Mineral City
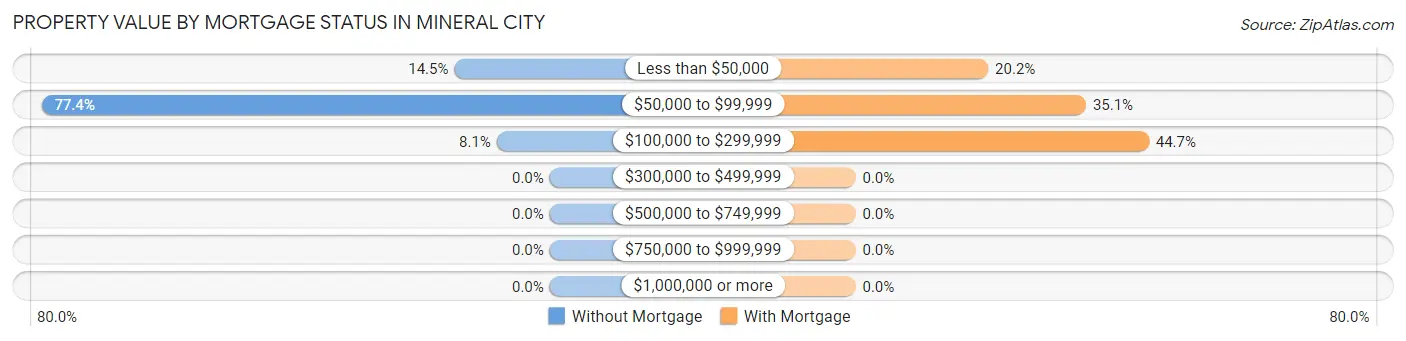
| Property Value | Without Mortgage | With Mortgage |
| Less than $50,000 | 9 (14.5%) | 19 (20.2%) |
| $50,000 to $99,999 | 48 (77.4%) | 33 (35.1%) |
| $100,000 to $299,999 | 5 (8.1%) | 42 (44.7%) |
| $300,000 to $499,999 | 0 (0.0%) | 0 (0.0%) |
| $500,000 to $749,999 | 0 (0.0%) | 0 (0.0%) |
| $750,000 to $999,999 | 0 (0.0%) | 0 (0.0%) |
| $1,000,000 or more | 0 (0.0%) | 0 (0.0%) |
| Total | 62 (100.0%) | 94 (100.0%) |
Household Income by Mortgage Status in Mineral City
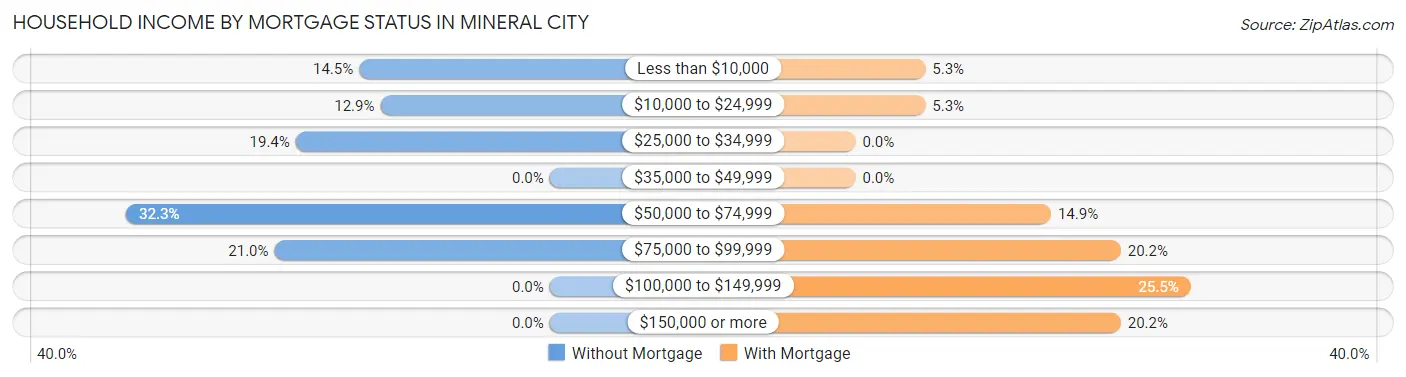
| Household Income | Without Mortgage | With Mortgage |
| Less than $10,000 | 9 (14.5%) | 5 (5.3%) |
| $10,000 to $24,999 | 8 (12.9%) | 5 (5.3%) |
| $25,000 to $34,999 | 12 (19.4%) | 0 (0.0%) |
| $35,000 to $49,999 | 0 (0.0%) | 0 (0.0%) |
| $50,000 to $74,999 | 20 (32.3%) | 14 (14.9%) |
| $75,000 to $99,999 | 13 (21.0%) | 19 (20.2%) |
| $100,000 to $149,999 | 0 (0.0%) | 24 (25.5%) |
| $150,000 or more | 0 (0.0%) | 19 (20.2%) |
| Total | 62 (100.0%) | 94 (100.0%) |
Property Value to Household Income Ratio in Mineral City
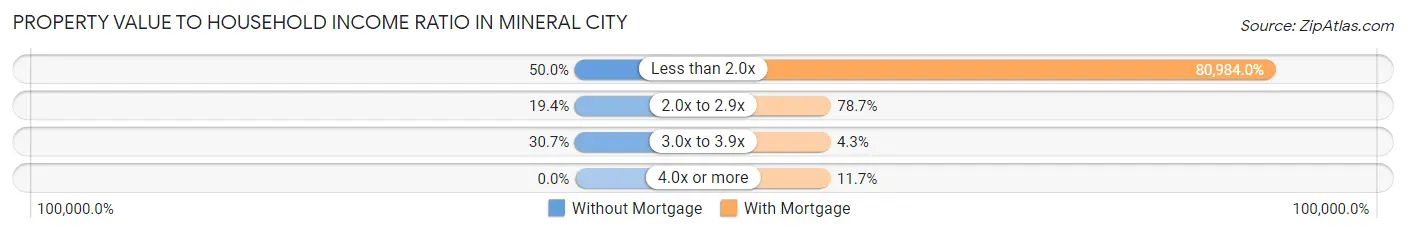
| Value-to-Income Ratio | Without Mortgage | With Mortgage |
| Less than 2.0x | 31 (50.0%) | 76,125 (80,984.0%) |
| 2.0x to 2.9x | 12 (19.4%) | 74 (78.7%) |
| 3.0x to 3.9x | 19 (30.6%) | 4 (4.3%) |
| 4.0x or more | 0 (0.0%) | 11 (11.7%) |
| Total | 62 (100.0%) | 94 (100.0%) |
Real Estate Taxes by Mortgage Status in Mineral City
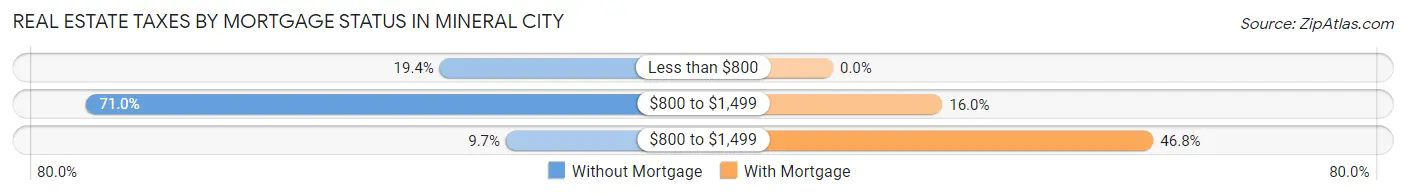
| Property Taxes | Without Mortgage | With Mortgage |
| Less than $800 | 12 (19.4%) | 0 (0.0%) |
| $800 to $1,499 | 44 (71.0%) | 15 (16.0%) |
| $800 to $1,499 | 6 (9.7%) | 44 (46.8%) |
| Total | 62 (100.0%) | 94 (100.0%) |
Health & Disability in Mineral City
Health Insurance Coverage by Age in Mineral City
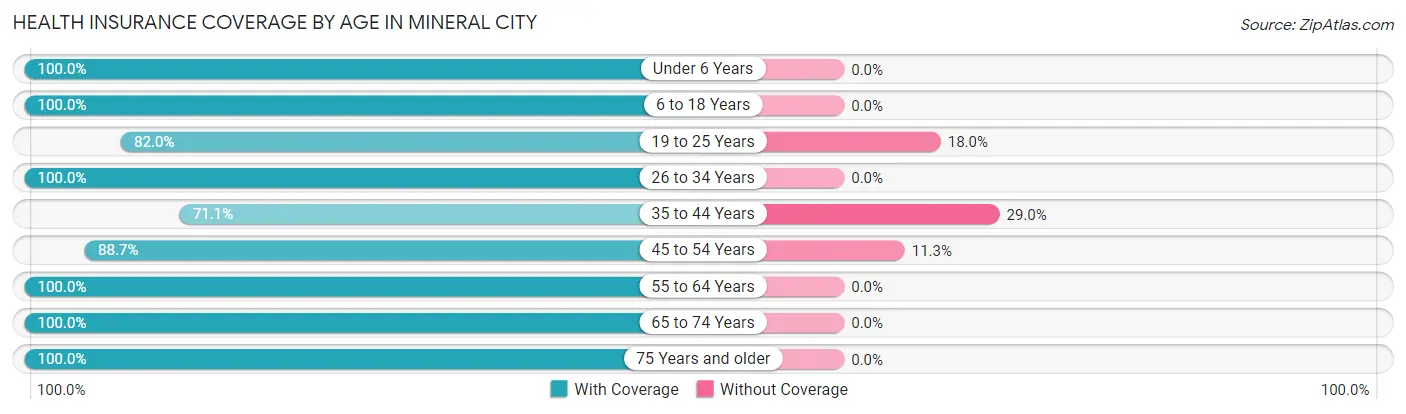
| Age Bracket | With Coverage | Without Coverage |
| Under 6 Years | 9 (100.0%) | 0 (0.0%) |
| 6 to 18 Years | 108 (100.0%) | 0 (0.0%) |
| 19 to 25 Years | 82 (82.0%) | 18 (18.0%) |
| 26 to 34 Years | 81 (100.0%) | 0 (0.0%) |
| 35 to 44 Years | 27 (71.1%) | 11 (28.9%) |
| 45 to 54 Years | 55 (88.7%) | 7 (11.3%) |
| 55 to 64 Years | 81 (100.0%) | 0 (0.0%) |
| 65 to 74 Years | 32 (100.0%) | 0 (0.0%) |
| 75 Years and older | 60 (100.0%) | 0 (0.0%) |
| Total | 535 (93.7%) | 36 (6.3%) |
Health Insurance Coverage by Citizenship Status in Mineral City
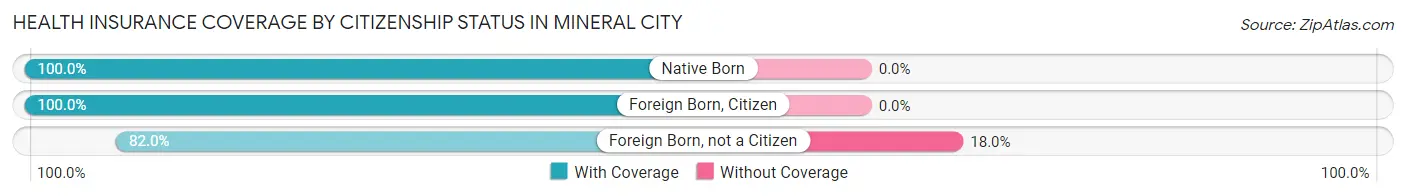
| Citizenship Status | With Coverage | Without Coverage |
| Native Born | 9 (100.0%) | 0 (0.0%) |
| Foreign Born, Citizen | 108 (100.0%) | 0 (0.0%) |
| Foreign Born, not a Citizen | 82 (82.0%) | 18 (18.0%) |
Health Insurance Coverage by Household Income in Mineral City
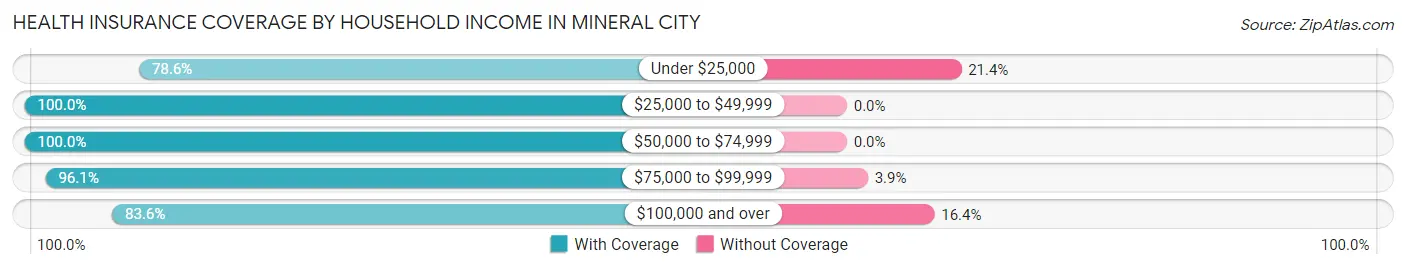
| Household Income | With Coverage | Without Coverage |
| Under $25,000 | 44 (78.6%) | 12 (21.4%) |
| $25,000 to $49,999 | 167 (100.0%) | 0 (0.0%) |
| $50,000 to $74,999 | 124 (100.0%) | 0 (0.0%) |
| $75,000 to $99,999 | 98 (96.1%) | 4 (3.9%) |
| $100,000 and over | 102 (83.6%) | 20 (16.4%) |
Public vs Private Health Insurance Coverage by Age in Mineral City
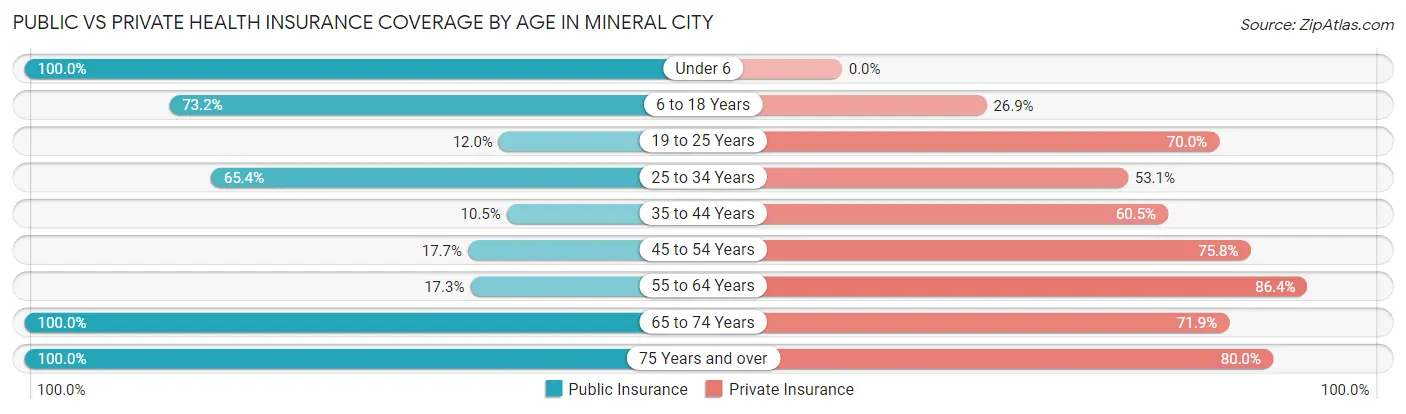
| Age Bracket | Public Insurance | Private Insurance |
| Under 6 | 9 (100.0%) | 0 (0.0%) |
| 6 to 18 Years | 79 (73.2%) | 29 (26.9%) |
| 19 to 25 Years | 12 (12.0%) | 70 (70.0%) |
| 25 to 34 Years | 53 (65.4%) | 43 (53.1%) |
| 35 to 44 Years | 4 (10.5%) | 23 (60.5%) |
| 45 to 54 Years | 11 (17.7%) | 47 (75.8%) |
| 55 to 64 Years | 14 (17.3%) | 70 (86.4%) |
| 65 to 74 Years | 32 (100.0%) | 23 (71.9%) |
| 75 Years and over | 60 (100.0%) | 48 (80.0%) |
| Total | 274 (48.0%) | 353 (61.8%) |
Disability Status by Sex by Age in Mineral City
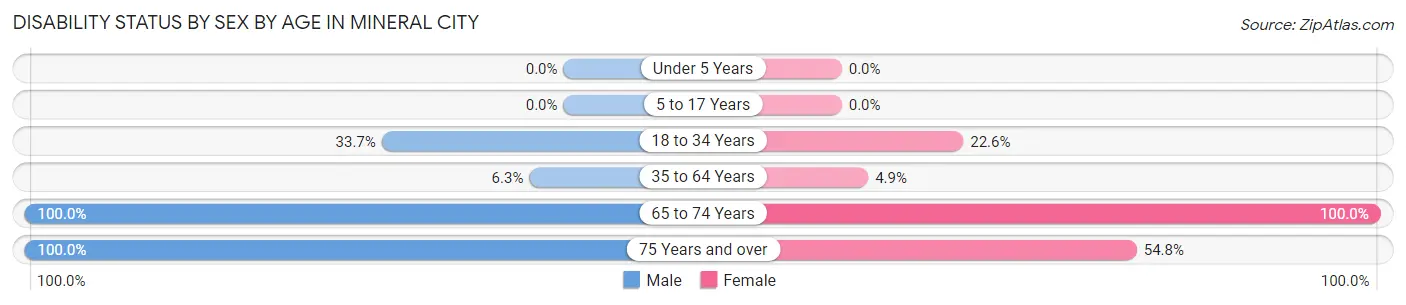
| Age Bracket | Male | Female |
| Under 5 Years | 0 (0.0%) | 0 (0.0%) |
| 5 to 17 Years | 0 (0.0%) | 0 (0.0%) |
| 18 to 34 Years | 28 (33.7%) | 23 (22.6%) |
| 35 to 64 Years | 5 (6.3%) | 5 (4.9%) |
| 65 to 74 Years | 22 (100.0%) | 10 (100.0%) |
| 75 Years and over | 18 (100.0%) | 23 (54.8%) |
Disability Class by Sex by Age in Mineral City
Disability Class: Hearing Difficulty
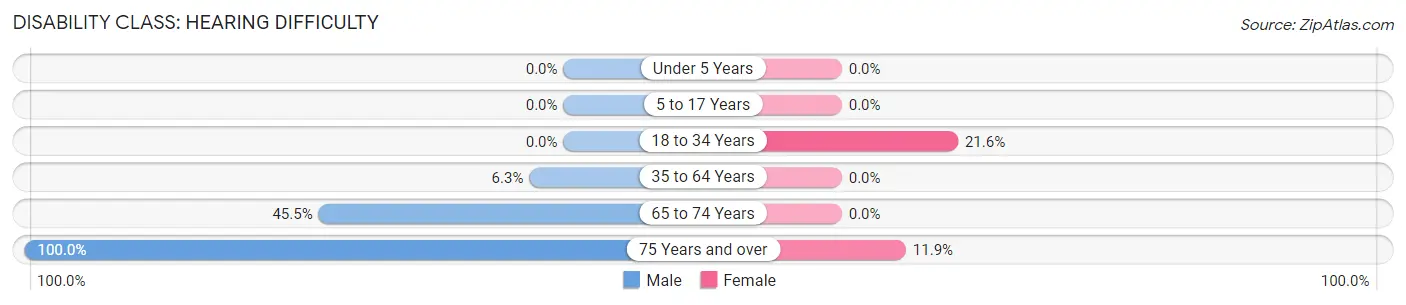
| Age Bracket | Male | Female |
| Under 5 Years | 0 (0.0%) | 0 (0.0%) |
| 5 to 17 Years | 0 (0.0%) | 0 (0.0%) |
| 18 to 34 Years | 0 (0.0%) | 22 (21.6%) |
| 35 to 64 Years | 5 (6.3%) | 0 (0.0%) |
| 65 to 74 Years | 10 (45.5%) | 0 (0.0%) |
| 75 Years and over | 18 (100.0%) | 5 (11.9%) |
Disability Class: Vision Difficulty
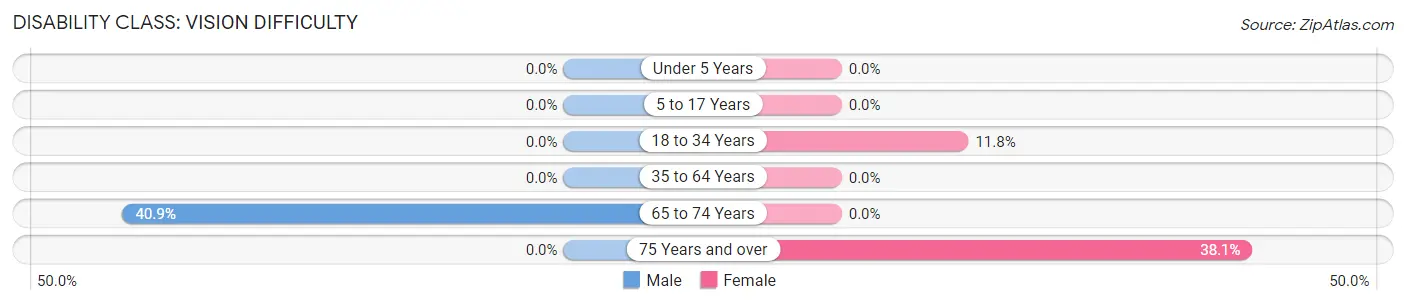
| Age Bracket | Male | Female |
| Under 5 Years | 0 (0.0%) | 0 (0.0%) |
| 5 to 17 Years | 0 (0.0%) | 0 (0.0%) |
| 18 to 34 Years | 0 (0.0%) | 12 (11.8%) |
| 35 to 64 Years | 0 (0.0%) | 0 (0.0%) |
| 65 to 74 Years | 9 (40.9%) | 0 (0.0%) |
| 75 Years and over | 0 (0.0%) | 16 (38.1%) |
Disability Class: Cognitive Difficulty
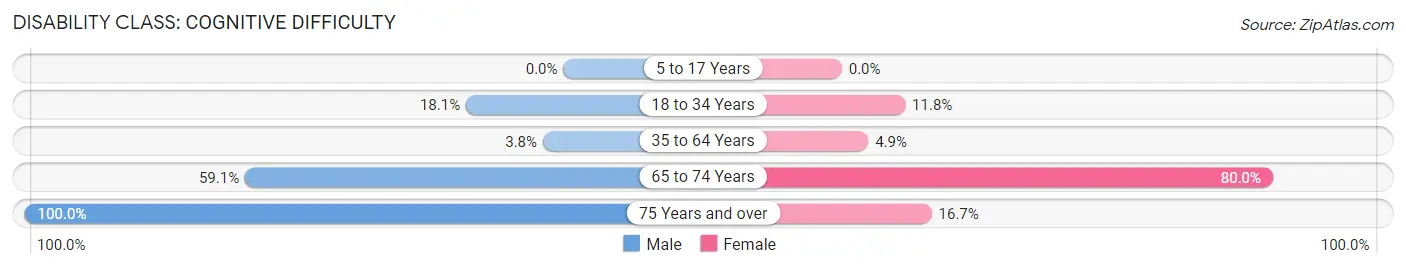
| Age Bracket | Male | Female |
| 5 to 17 Years | 0 (0.0%) | 0 (0.0%) |
| 18 to 34 Years | 15 (18.1%) | 12 (11.8%) |
| 35 to 64 Years | 3 (3.8%) | 5 (4.9%) |
| 65 to 74 Years | 13 (59.1%) | 8 (80.0%) |
| 75 Years and over | 18 (100.0%) | 7 (16.7%) |
Disability Class: Ambulatory Difficulty
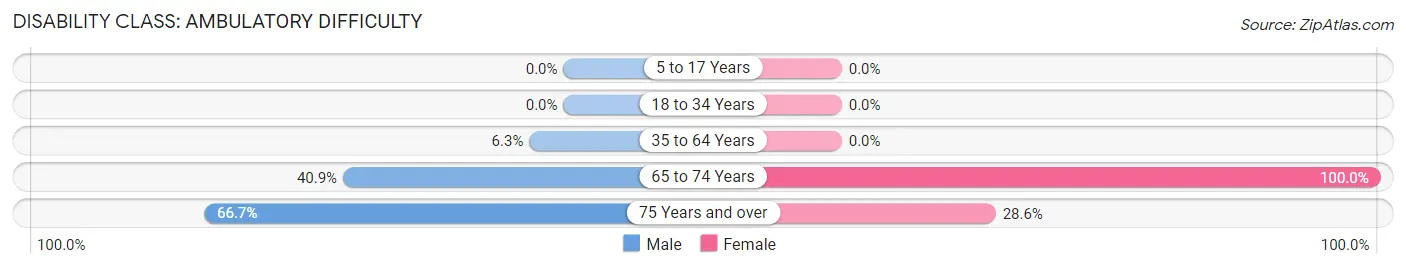
| Age Bracket | Male | Female |
| 5 to 17 Years | 0 (0.0%) | 0 (0.0%) |
| 18 to 34 Years | 0 (0.0%) | 0 (0.0%) |
| 35 to 64 Years | 5 (6.3%) | 0 (0.0%) |
| 65 to 74 Years | 9 (40.9%) | 10 (100.0%) |
| 75 Years and over | 12 (66.7%) | 12 (28.6%) |
Disability Class: Self-Care Difficulty
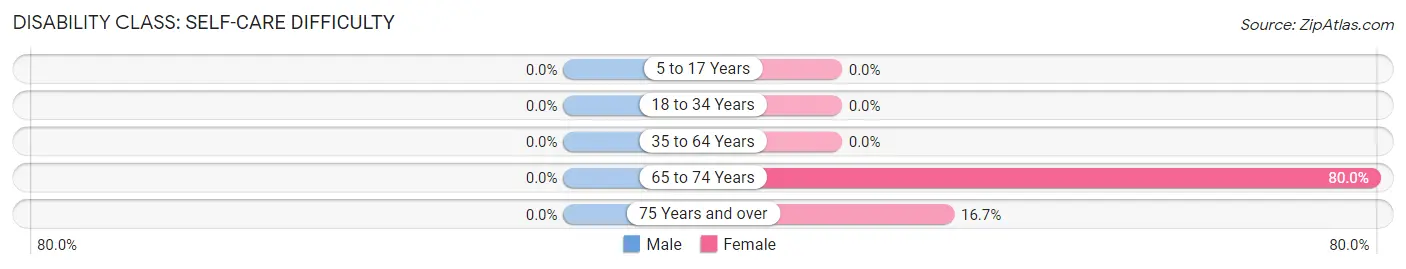
| Age Bracket | Male | Female |
| 5 to 17 Years | 0 (0.0%) | 0 (0.0%) |
| 18 to 34 Years | 0 (0.0%) | 0 (0.0%) |
| 35 to 64 Years | 0 (0.0%) | 0 (0.0%) |
| 65 to 74 Years | 0 (0.0%) | 8 (80.0%) |
| 75 Years and over | 0 (0.0%) | 7 (16.7%) |
Technology Access in Mineral City
Computing Device Access in Mineral City
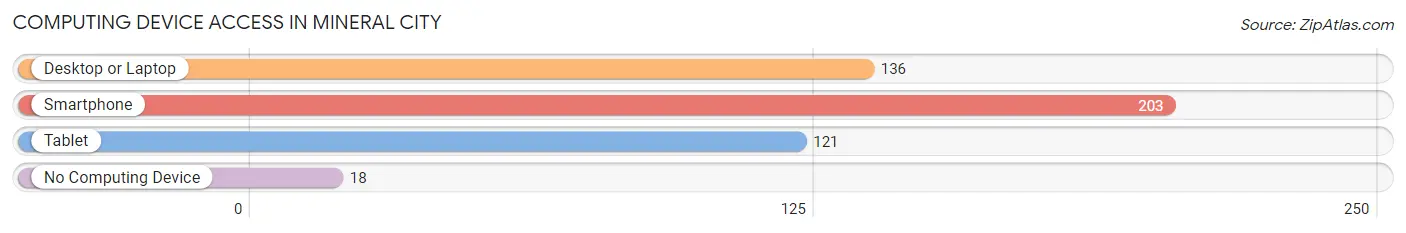
| Device Type | # Households | % Households |
| Desktop or Laptop | 136 | 54.6% |
| Smartphone | 203 | 81.5% |
| Tablet | 121 | 48.6% |
| No Computing Device | 18 | 7.2% |
| Total | 249 | 100.0% |
Internet Access in Mineral City
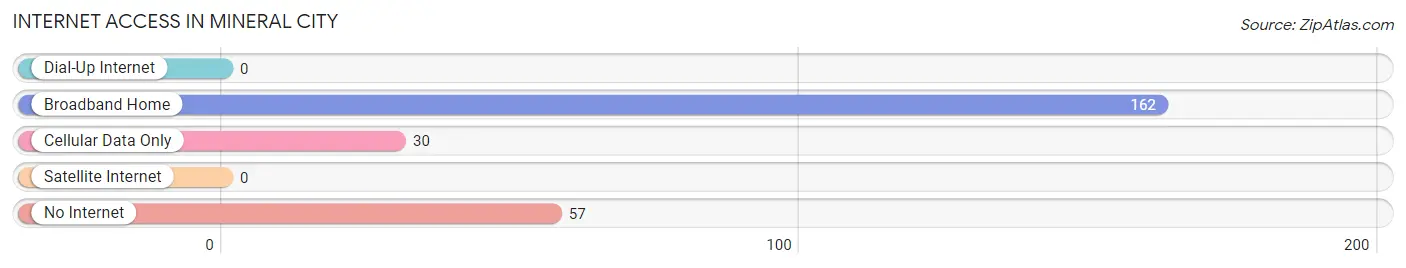
| Internet Type | # Households | % Households |
| Dial-Up Internet | 0 | 0.0% |
| Broadband Home | 162 | 65.1% |
| Cellular Data Only | 30 | 12.0% |
| Satellite Internet | 0 | 0.0% |
| No Internet | 57 | 22.9% |
| Total | 249 | 100.0% |
Mineral City Summary
Mineral City, Ohio is a small village located in Tuscarawas County, Ohio. It is situated on the Tuscarawas River, approximately 25 miles south of Canton and 40 miles northeast of Akron. The village has a population of approximately 1,000 people and is part of the Dover, Ohio Micropolitan Statistical Area.
History
Mineral City was founded in 1832 by a group of settlers from Pennsylvania. The village was originally known as “Mineral” and was named after the abundance of minerals found in the area. The village was incorporated in 1845 and the name was changed to Mineral City.
The village was an important stop on the Ohio and Erie Canal, which was completed in 1832. The canal provided a transportation route for goods and people between Cleveland and Portsmouth. The canal was an important factor in the growth of Mineral City and the surrounding area.
The village was also an important stop on the Underground Railroad. The village was a safe haven for escaped slaves and was a major stop on the route to freedom.
Geography
Mineral City is located in Tuscarawas County, Ohio. The village is situated on the Tuscarawas River, approximately 25 miles south of Canton and 40 miles northeast of Akron. The village has a total area of 0.6 square miles, all of which is land.
The village is located in the Appalachian Plateau region of Ohio. The terrain is mostly flat with some rolling hills. The climate is humid continental, with hot summers and cold winters.
Economy
The economy of Mineral City is largely based on agriculture and tourism. The village is home to several small businesses, including a grocery store, a hardware store, and a few restaurants.
The village is also home to several tourist attractions, including the Ohio and Erie Canal, the Mineral City Museum, and the Mineral City Opera House. The village also hosts several festivals throughout the year, including the Mineral City Music Festival and the Mineral City Arts Festival.
Demographics
As of the 2010 census, the population of Mineral City was 1,000 people. The racial makeup of the village was 97.2% White, 0.7% African American, 0.2% Native American, 0.2% Asian, 0.2% from other races, and 1.7% from two or more races. Hispanic or Latino of any race were 0.7% of the population.
The median income for a household in the village was $37,500, and the median income for a family was $45,000. The per capita income for the village was $18,000. About 10.2% of families and 12.2% of the population were below the poverty line, including 16.7% of those under age 18 and 8.3% of those age 65 or over.
Mineral City is a small village with a rich history and a vibrant economy. The village is home to several tourist attractions and hosts several festivals throughout the year. The village has a diverse population and a median income that is slightly above the national average.
Common Questions
What is Per Capita Income in Mineral City?
Per Capita income in Mineral City is $29,483.
What is the Median Family Income in Mineral City?
Median Family Income in Mineral City is $58,750.
What is the Median Household income in Mineral City?
Median Household Income in Mineral City is $53,295.
What is Income or Wage Gap in Mineral City?
Income or Wage Gap in Mineral City is 30.8%.
Women in Mineral City earn 69.2 cents for every dollar earned by a man.
What is Inequality or Gini Index in Mineral City?
Inequality or Gini Index in Mineral City is 0.43.
What is the Total Population of Mineral City?
Total Population of Mineral City is 571.
What is the Total Male Population of Mineral City?
Total Male Population of Mineral City is 247.
What is the Total Female Population of Mineral City?
Total Female Population of Mineral City is 324.
What is the Ratio of Males per 100 Females in Mineral City?
There are 76.23 Males per 100 Females in Mineral City.
What is the Ratio of Females per 100 Males in Mineral City?
There are 131.17 Females per 100 Males in Mineral City.
What is the Median Population Age in Mineral City?
Median Population Age in Mineral City is 33.5 Years.
What is the Average Family Size in Mineral City
Average Family Size in Mineral City is 3.0 People.
What is the Average Household Size in Mineral City
Average Household Size in Mineral City is 2.3 People.
How Large is the Labor Force in Mineral City?
There are 322 People in the Labor Forcein in Mineral City.
What is the Percentage of People in the Labor Force in Mineral City?
65.2% of People are in the Labor Force in Mineral City.
What is the Unemployment Rate in Mineral City?
Unemployment Rate in Mineral City is 3.4%.