Greenwood Lake, NY Map & Demographics
Greenwood Lake Map
Greenwood Lake Overview
$36,794
PER CAPITA INCOME
$100,399
AVG FAMILY INCOME
$79,261
AVG HOUSEHOLD INCOME
39.6%
WAGE / INCOME GAP [ % ]
60.4¢/ $1
WAGE / INCOME GAP [ $ ]
0.39
INEQUALITY / GINI INDEX
3,027
TOTAL POPULATION
1,532
MALE POPULATION
1,495
FEMALE POPULATION
102.47
MALES / 100 FEMALES
97.58
FEMALES / 100 MALES
37.9
MEDIAN AGE
3.4
AVG FAMILY SIZE
2.7
AVG HOUSEHOLD SIZE
1,396
LABOR FORCE [ PEOPLE ]
56.6%
PERCENT IN LABOR FORCE
4.7%
UNEMPLOYMENT RATE
Greenwood Lake Zip Codes
Greenwood Lake Area Codes
Income in Greenwood Lake
Income Overview in Greenwood Lake
Per Capita Income in Greenwood Lake is $36,794, while median incomes of families and households are $100,399 and $79,261 respectively.
| Characteristic | Number | Measure |
| Per Capita Income | 3,027 | $36,794 |
| Median Family Income | 775 | $100,399 |
| Mean Family Income | 775 | $110,397 |
| Median Household Income | 1,114 | $79,261 |
| Mean Household Income | 1,114 | $96,054 |
| Income Deficit | 775 | $0 |
| Wage / Income Gap (%) | 3,027 | 39.57% |
| Wage / Income Gap ($) | 3,027 | 60.43¢ per $1 |
| Gini / Inequality Index | 3,027 | 0.39 |
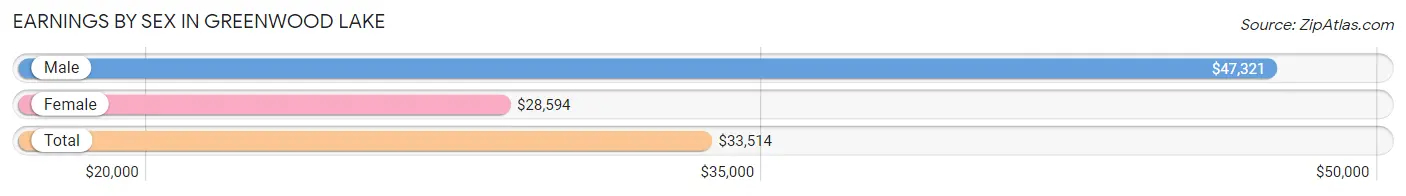
Earnings by Sex in Greenwood Lake
Average Earnings in Greenwood Lake are $33,514, $47,321 for men and $28,594 for women, a difference of 39.6%.
| Sex | Number | Average Earnings |
| Male | 697 (46.1%) | $47,321 |
| Female | 816 (53.9%) | $28,594 |
| Total | 1,513 (100.0%) | $33,514 |
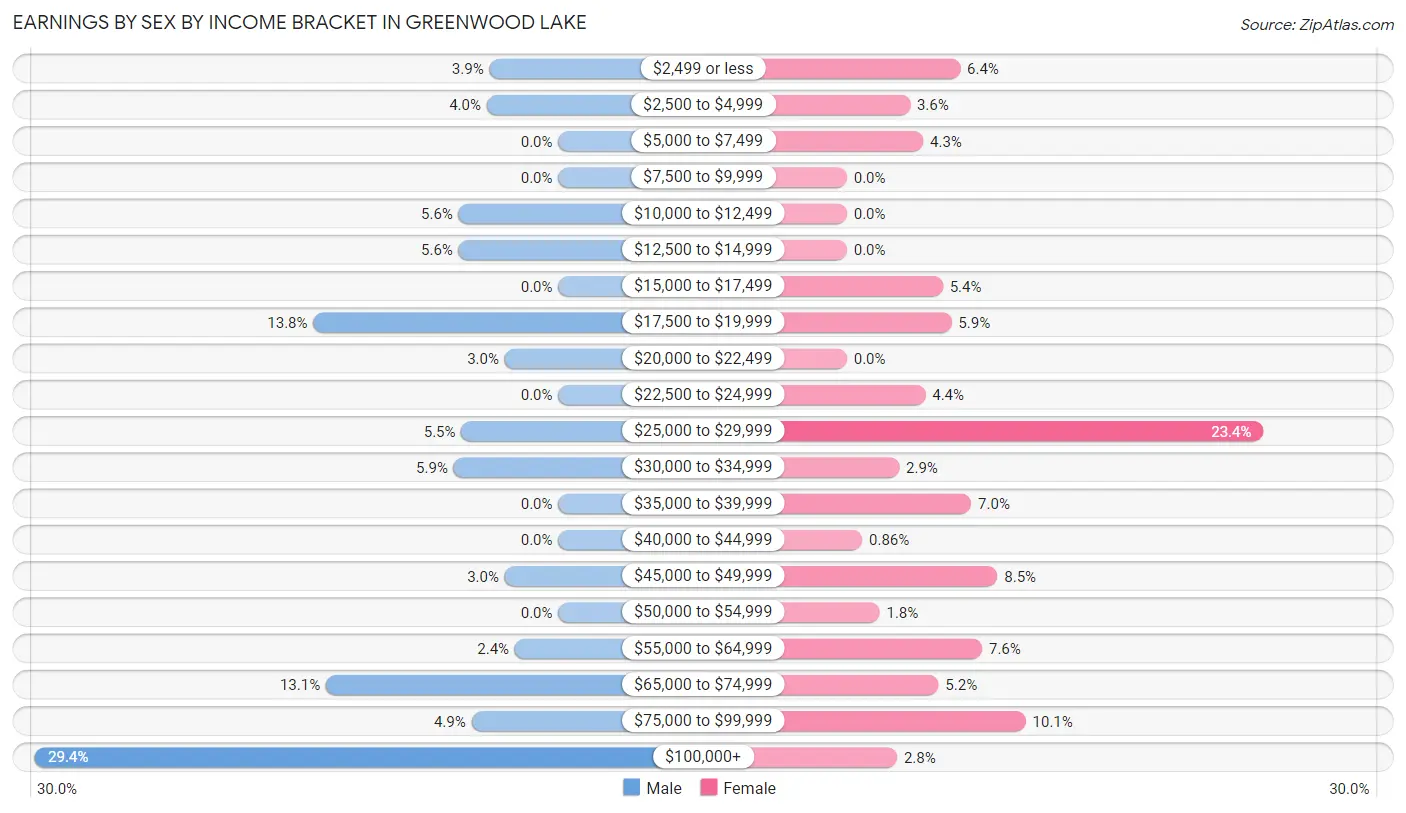
Earnings by Sex by Income Bracket in Greenwood Lake
The most common earnings brackets in Greenwood Lake are $100,000+ for men (205 | 29.4%) and $25,000 to $29,999 for women (191 | 23.4%).
| Income | Male | Female |
| $2,499 or less | 27 (3.9%) | 52 (6.4%) |
| $2,500 to $4,999 | 28 (4.0%) | 29 (3.5%) |
| $5,000 to $7,499 | 0 (0.0%) | 35 (4.3%) |
| $7,500 to $9,999 | 0 (0.0%) | 0 (0.0%) |
| $10,000 to $12,499 | 39 (5.6%) | 0 (0.0%) |
| $12,500 to $14,999 | 39 (5.6%) | 0 (0.0%) |
| $15,000 to $17,499 | 0 (0.0%) | 44 (5.4%) |
| $17,500 to $19,999 | 96 (13.8%) | 48 (5.9%) |
| $20,000 to $22,499 | 21 (3.0%) | 0 (0.0%) |
| $22,500 to $24,999 | 0 (0.0%) | 36 (4.4%) |
| $25,000 to $29,999 | 38 (5.4%) | 191 (23.4%) |
| $30,000 to $34,999 | 41 (5.9%) | 24 (2.9%) |
| $35,000 to $39,999 | 0 (0.0%) | 57 (7.0%) |
| $40,000 to $44,999 | 0 (0.0%) | 7 (0.9%) |
| $45,000 to $49,999 | 21 (3.0%) | 69 (8.5%) |
| $50,000 to $54,999 | 0 (0.0%) | 15 (1.8%) |
| $55,000 to $64,999 | 17 (2.4%) | 62 (7.6%) |
| $65,000 to $74,999 | 91 (13.1%) | 42 (5.1%) |
| $75,000 to $99,999 | 34 (4.9%) | 82 (10.1%) |
| $100,000+ | 205 (29.4%) | 23 (2.8%) |
| Total | 697 (100.0%) | 816 (100.0%) |
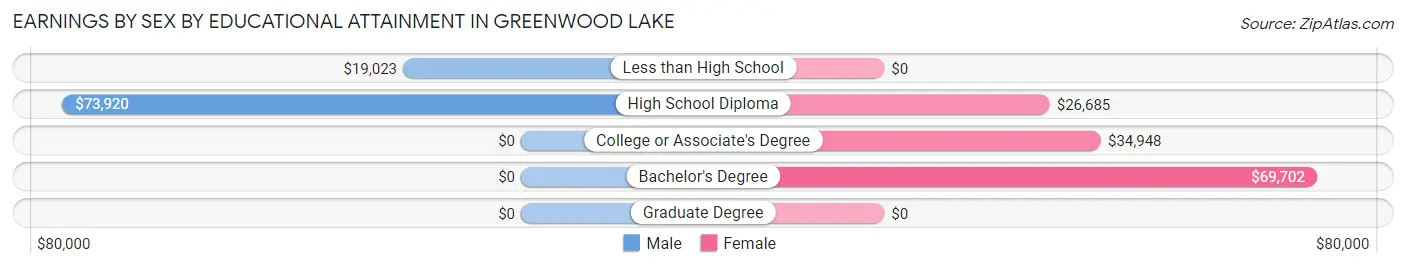
Earnings by Sex by Educational Attainment in Greenwood Lake
Average earnings in Greenwood Lake are $67,344 for men and $29,948 for women, a difference of 55.5%. Men with an educational attainment of high school diploma enjoy the highest average annual earnings of $73,920, while those with less than high school education earn the least with $19,023. Women with an educational attainment of bachelor's degree earn the most with the average annual earnings of $69,702, while those with high school diploma education have the smallest earnings of $26,685.
| Educational Attainment | Male Income | Female Income |
| Less than High School | $19,023 | $0 |
| High School Diploma | $73,920 | $26,685 |
| College or Associate's Degree | - | - |
| Bachelor's Degree | - | - |
| Graduate Degree | - | - |
| Total | $67,344 | $29,948 |
Family Income in Greenwood Lake
Family Income Brackets in Greenwood Lake
According to the Greenwood Lake family income data, there are 235 families falling into the $100,000 to $149,999 income range, which is the most common income bracket and makes up 30.3% of all families.
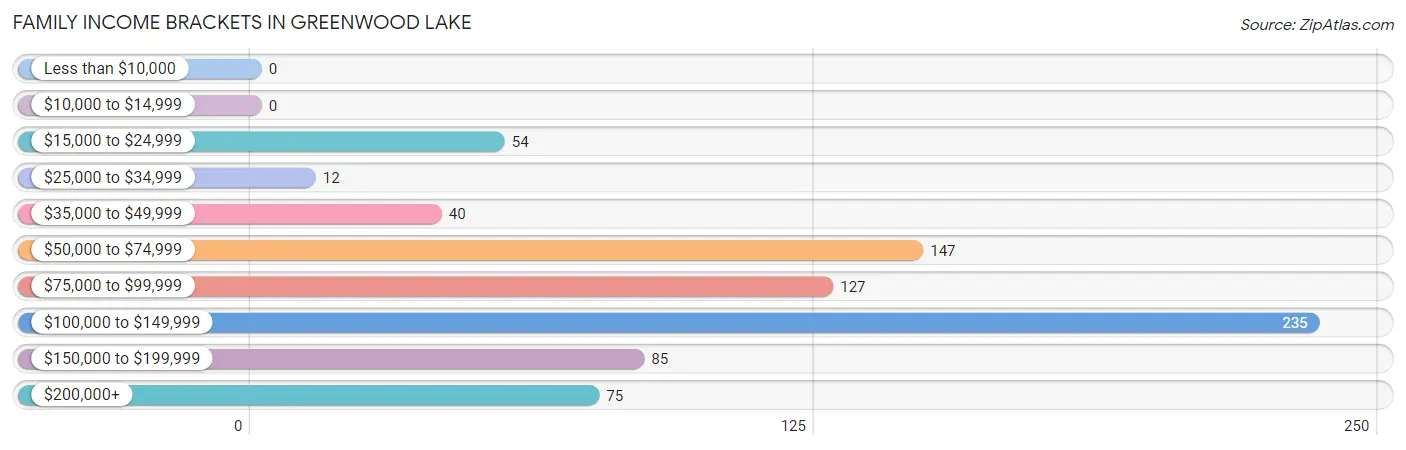
| Income Bracket | # Families | % Families |
| Less than $10,000 | 0 | 0.0% |
| $10,000 to $14,999 | 0 | 0.0% |
| $15,000 to $24,999 | 54 | 7.0% |
| $25,000 to $34,999 | 12 | 1.5% |
| $35,000 to $49,999 | 40 | 5.2% |
| $50,000 to $74,999 | 147 | 19.0% |
| $75,000 to $99,999 | 127 | 16.4% |
| $100,000 to $149,999 | 235 | 30.3% |
| $150,000 to $199,999 | 85 | 11.0% |
| $200,000+ | 75 | 9.7% |
Family Income by Famaliy Size in Greenwood Lake
4-person families (111 | 14.3%) account for the highest median family income in Greenwood Lake with $170,030 per family, while 2-person families (274 | 35.3%) have the highest median income of $54,134 per family member.
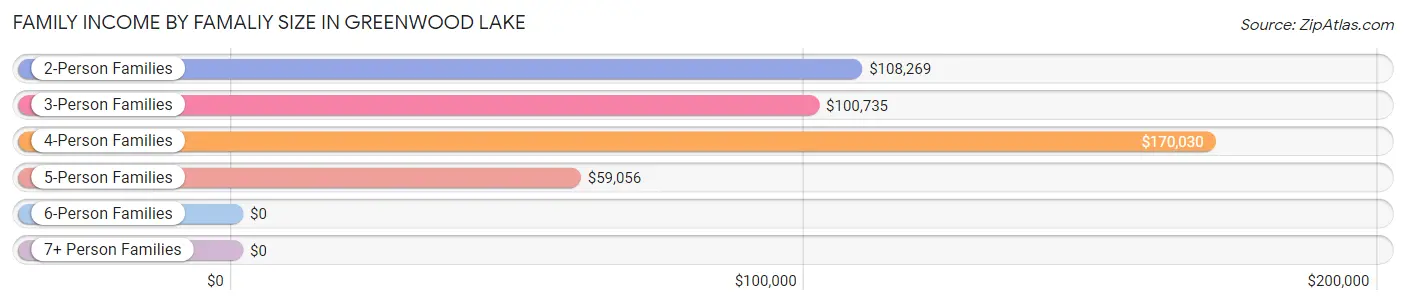
| Income Bracket | # Families | Median Income |
| 2-Person Families | 274 (35.3%) | $108,269 |
| 3-Person Families | 226 (29.2%) | $100,735 |
| 4-Person Families | 111 (14.3%) | $170,030 |
| 5-Person Families | 164 (21.2%) | $59,056 |
| 6-Person Families | 0 (0.0%) | $0 |
| 7+ Person Families | 0 (0.0%) | $0 |
| Total | 775 (100.0%) | $100,399 |
Family Income by Number of Earners in Greenwood Lake
The median family income in Greenwood Lake is $100,399, with families comprising 3+ earners (102) having the highest median family income of $118,750, while families with no earners (31) have the lowest median family income of $49,653, accounting for 13.2% and 4.0% of families, respectively.
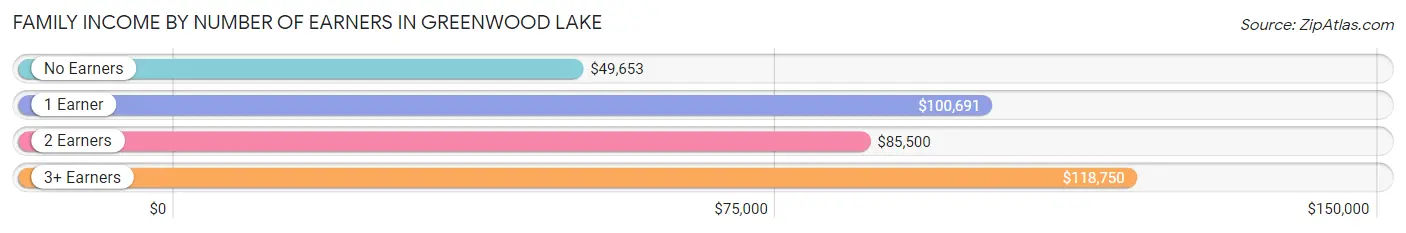
| Number of Earners | # Families | Median Income |
| No Earners | 31 (4.0%) | $49,653 |
| 1 Earner | 462 (59.6%) | $100,691 |
| 2 Earners | 180 (23.2%) | $85,500 |
| 3+ Earners | 102 (13.2%) | $118,750 |
| Total | 775 (100.0%) | $100,399 |
Household Income in Greenwood Lake
Household Income Brackets in Greenwood Lake
With 267 households falling in the category, the $100,000 to $149,999 income range is the most frequent in Greenwood Lake, accounting for 24.0% of all households.
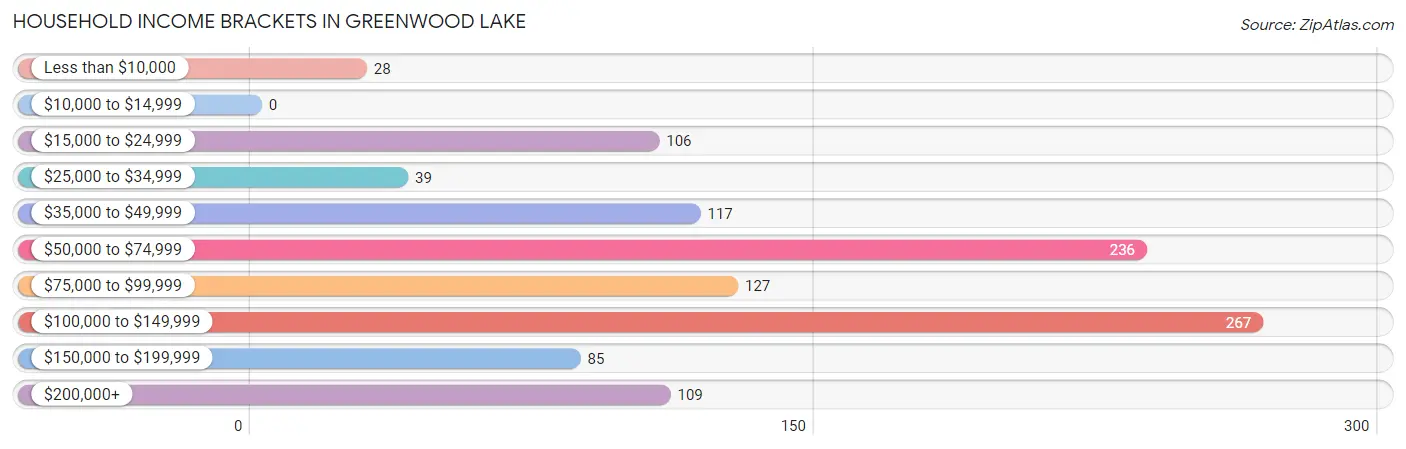
| Income Bracket | # Households | % Households |
| Less than $10,000 | 28 | 2.5% |
| $10,000 to $14,999 | 0 | 0.0% |
| $15,000 to $24,999 | 106 | 9.5% |
| $25,000 to $34,999 | 39 | 3.5% |
| $35,000 to $49,999 | 117 | 10.5% |
| $50,000 to $74,999 | 236 | 21.2% |
| $75,000 to $99,999 | 127 | 11.4% |
| $100,000 to $149,999 | 267 | 24.0% |
| $150,000 to $199,999 | 85 | 7.6% |
| $200,000+ | 109 | 9.8% |
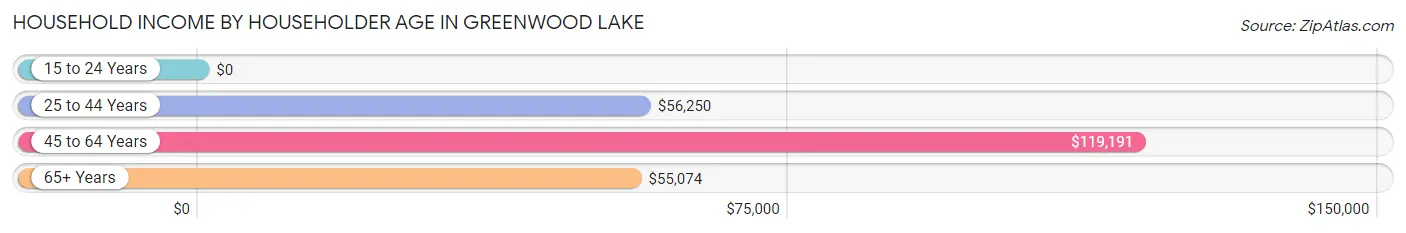
Household Income by Householder Age in Greenwood Lake
The median household income in Greenwood Lake is $79,261, with the highest median household income of $119,191 found in the 45 to 64 years age bracket for the primary householder. A total of 450 households (40.4%) fall into this category.
| Income Bracket | # Households | Median Income |
| 15 to 24 Years | 0 (0.0%) | $0 |
| 25 to 44 Years | 342 (30.7%) | $56,250 |
| 45 to 64 Years | 450 (40.4%) | $119,191 |
| 65+ Years | 322 (28.9%) | $55,074 |
| Total | 1,114 (100.0%) | $79,261 |
Poverty in Greenwood Lake
Income Below Poverty by Sex and Age in Greenwood Lake
With 17.4% poverty level for males and 3.6% for females among the residents of Greenwood Lake, under 5 year old males and 35 to 44 year old females are the most vulnerable to poverty, with 61 males (58.7%) and 54 females (38.6%) in their respective age groups living below the poverty level.
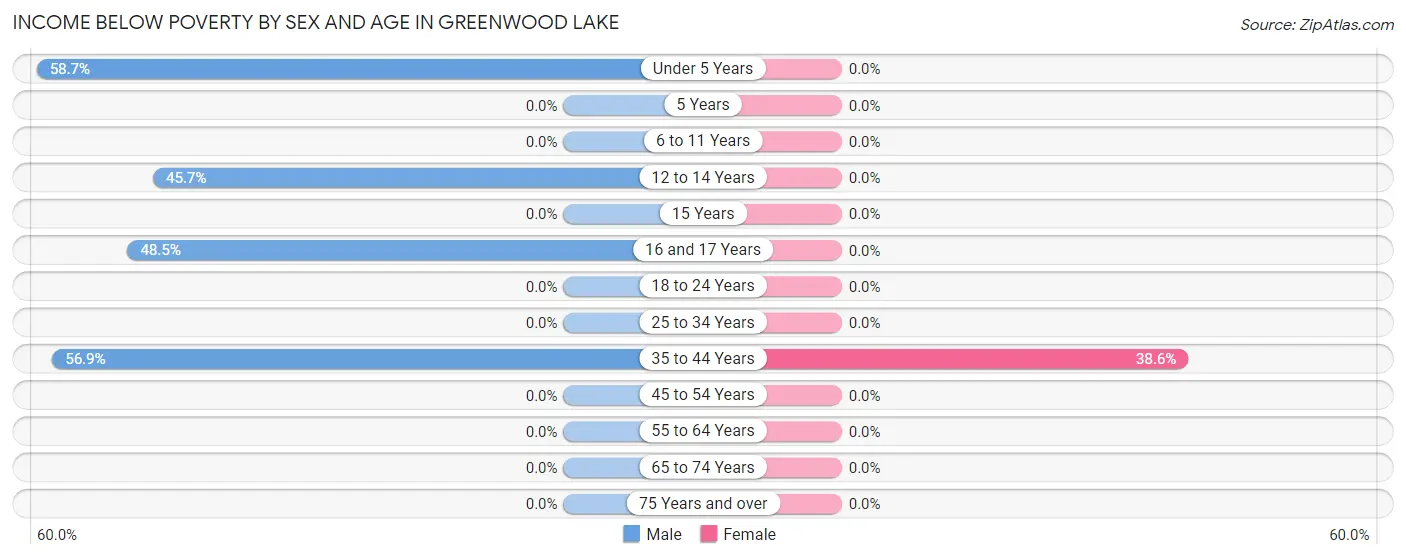
| Age Bracket | Male | Female |
| Under 5 Years | 61 (58.7%) | 0 (0.0%) |
| 5 Years | 0 (0.0%) | 0 (0.0%) |
| 6 to 11 Years | 0 (0.0%) | 0 (0.0%) |
| 12 to 14 Years | 53 (45.7%) | 0 (0.0%) |
| 15 Years | 0 (0.0%) | 0 (0.0%) |
| 16 and 17 Years | 50 (48.5%) | 0 (0.0%) |
| 18 to 24 Years | 0 (0.0%) | 0 (0.0%) |
| 25 to 34 Years | 0 (0.0%) | 0 (0.0%) |
| 35 to 44 Years | 103 (56.9%) | 54 (38.6%) |
| 45 to 54 Years | 0 (0.0%) | 0 (0.0%) |
| 55 to 64 Years | 0 (0.0%) | 0 (0.0%) |
| 65 to 74 Years | 0 (0.0%) | 0 (0.0%) |
| 75 Years and over | 0 (0.0%) | 0 (0.0%) |
| Total | 267 (17.4%) | 54 (3.6%) |
Income Above Poverty by Sex and Age in Greenwood Lake
According to the poverty statistics in Greenwood Lake, males aged 6 to 11 years and females aged under 5 years are the age groups that are most secure financially, with 100.0% of males and 100.0% of females in these age groups living above the poverty line.
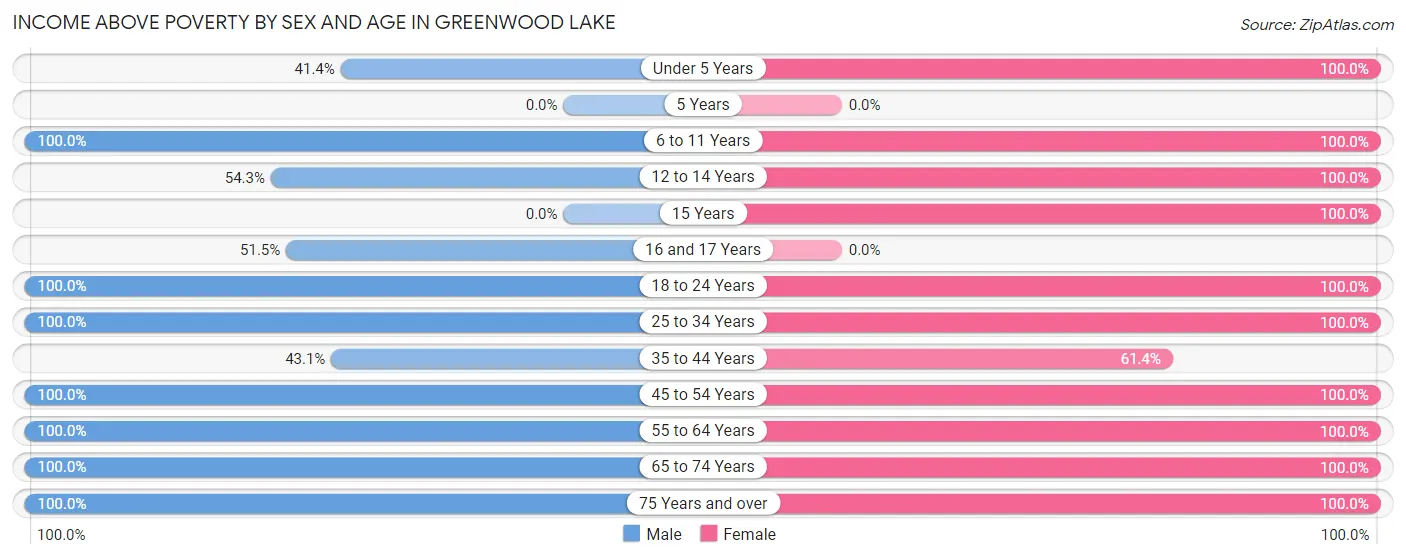
| Age Bracket | Male | Female |
| Under 5 Years | 43 (41.3%) | 28 (100.0%) |
| 5 Years | 0 (0.0%) | 0 (0.0%) |
| 6 to 11 Years | 79 (100.0%) | 72 (100.0%) |
| 12 to 14 Years | 63 (54.3%) | 139 (100.0%) |
| 15 Years | 0 (0.0%) | 22 (100.0%) |
| 16 and 17 Years | 53 (51.5%) | 0 (0.0%) |
| 18 to 24 Years | 29 (100.0%) | 52 (100.0%) |
| 25 to 34 Years | 173 (100.0%) | 455 (100.0%) |
| 35 to 44 Years | 78 (43.1%) | 86 (61.4%) |
| 45 to 54 Years | 198 (100.0%) | 194 (100.0%) |
| 55 to 64 Years | 236 (100.0%) | 183 (100.0%) |
| 65 to 74 Years | 234 (100.0%) | 170 (100.0%) |
| 75 Years and over | 79 (100.0%) | 40 (100.0%) |
| Total | 1,265 (82.6%) | 1,441 (96.4%) |
Income Below Poverty Among Married-Couple Families in Greenwood Lake
The poverty statistics for married-couple families in Greenwood Lake show that 9.2% or 54 of the total 585 families live below the poverty line. Families with 3 or 4 children have the highest poverty rate of 45.4%, comprising of 54 families. On the other hand, families with no children have the lowest poverty rate of 0.0%, which includes 0 families.
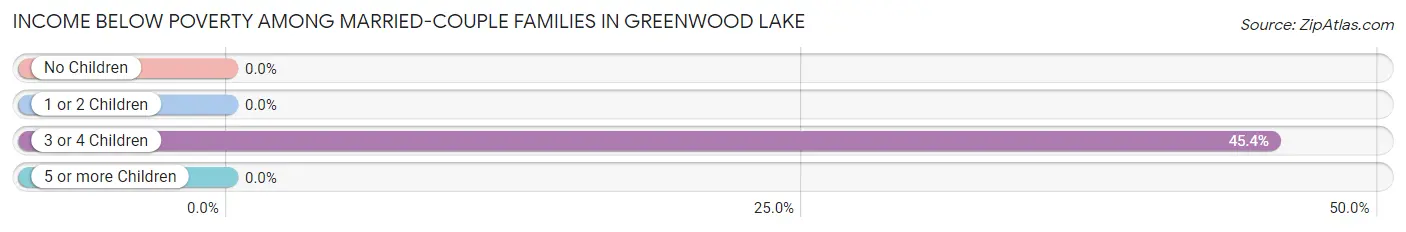
| Children | Above Poverty | Below Poverty |
| No Children | 331 (100.0%) | 0 (0.0%) |
| 1 or 2 Children | 135 (100.0%) | 0 (0.0%) |
| 3 or 4 Children | 65 (54.6%) | 54 (45.4%) |
| 5 or more Children | 0 (0.0%) | 0 (0.0%) |
| Total | 531 (90.8%) | 54 (9.2%) |
Income Below Poverty Among Single-Parent Households in Greenwood Lake
| Children | Single Father | Single Mother |
| No Children | 0 (0.0%) | 0 (0.0%) |
| 1 or 2 Children | 0 (0.0%) | 0 (0.0%) |
| 3 or 4 Children | 0 (0.0%) | 0 (0.0%) |
| 5 or more Children | 0 (0.0%) | 0 (0.0%) |
| Total | 0 (0.0%) | 0 (0.0%) |
Income Below Poverty Among Married-Couple vs Single-Parent Households in Greenwood Lake
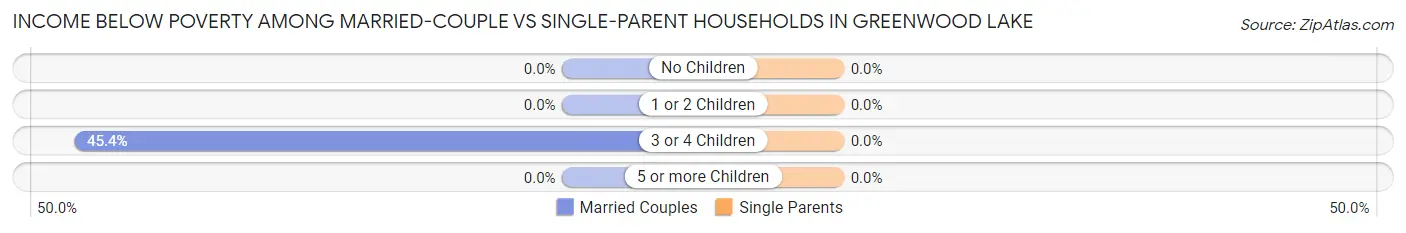
| Children | Married-Couple Families | Single-Parent Households |
| No Children | 0 (0.0%) | 0 (0.0%) |
| 1 or 2 Children | 0 (0.0%) | 0 (0.0%) |
| 3 or 4 Children | 54 (45.4%) | 0 (0.0%) |
| 5 or more Children | 0 (0.0%) | 0 (0.0%) |
| Total | 54 (9.2%) | 0 (0.0%) |
Race in Greenwood Lake
The most populous races in Greenwood Lake are White / Caucasian (2,421 | 80.0%), Hispanic or Latino (377 | 12.4%), and Two or more Races (339 | 11.2%).
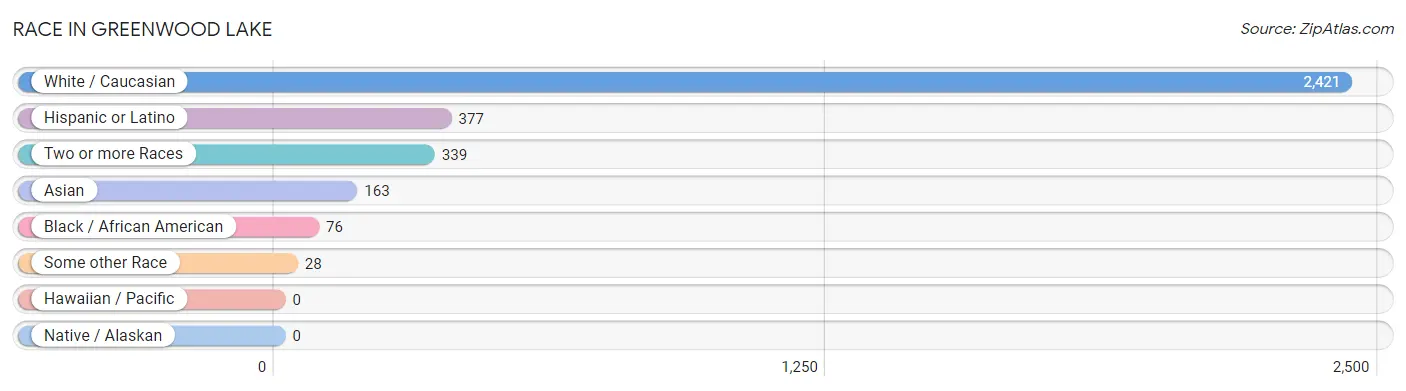
| Race | # Population | % Population |
| Asian | 163 | 5.4% |
| Black / African American | 76 | 2.5% |
| Hawaiian / Pacific | 0 | 0.0% |
| Hispanic or Latino | 377 | 12.4% |
| Native / Alaskan | 0 | 0.0% |
| White / Caucasian | 2,421 | 80.0% |
| Two or more Races | 339 | 11.2% |
| Some other Race | 28 | 0.9% |
| Total | 3,027 | 100.0% |
Ancestry in Greenwood Lake
The most populous ancestries reported in Greenwood Lake are Irish (786 | 26.0%), Italian (301 | 9.9%), Dominican (293 | 9.7%), German (239 | 7.9%), and Polish (189 | 6.2%), together accounting for 59.7% of all Greenwood Lake residents.
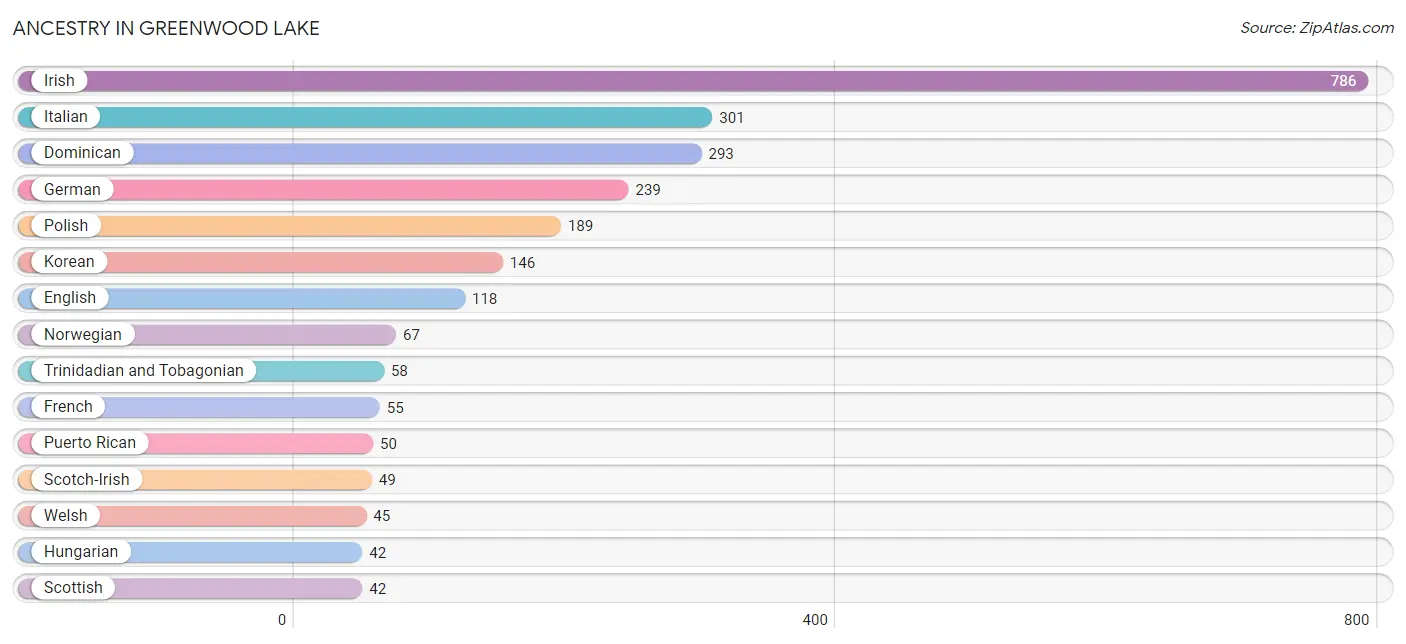
| Ancestry | # Population | % Population |
| Bhutanese | 41 | 1.3% |
| Central American | 25 | 0.8% |
| Colombian | 9 | 0.3% |
| Dominican | 293 | 9.7% |
| Dutch | 38 | 1.3% |
| English | 118 | 3.9% |
| French | 55 | 1.8% |
| German | 239 | 7.9% |
| Greek | 13 | 0.4% |
| Guatemalan | 25 | 0.8% |
| Guyanese | 22 | 0.7% |
| Hungarian | 42 | 1.4% |
| Irish | 786 | 26.0% |
| Italian | 301 | 9.9% |
| Korean | 146 | 4.8% |
| Lithuanian | 22 | 0.7% |
| Norwegian | 67 | 2.2% |
| Polish | 189 | 6.2% |
| Puerto Rican | 50 | 1.7% |
| Romanian | 33 | 1.1% |
| Russian | 35 | 1.2% |
| Scotch-Irish | 49 | 1.6% |
| Scottish | 42 | 1.4% |
| South American | 9 | 0.3% |
| Swiss | 30 | 1.0% |
| Trinidadian and Tobagonian | 58 | 1.9% |
| Ukrainian | 38 | 1.3% |
| Welsh | 45 | 1.5% | View All 28 Rows |
Immigrants in Greenwood Lake
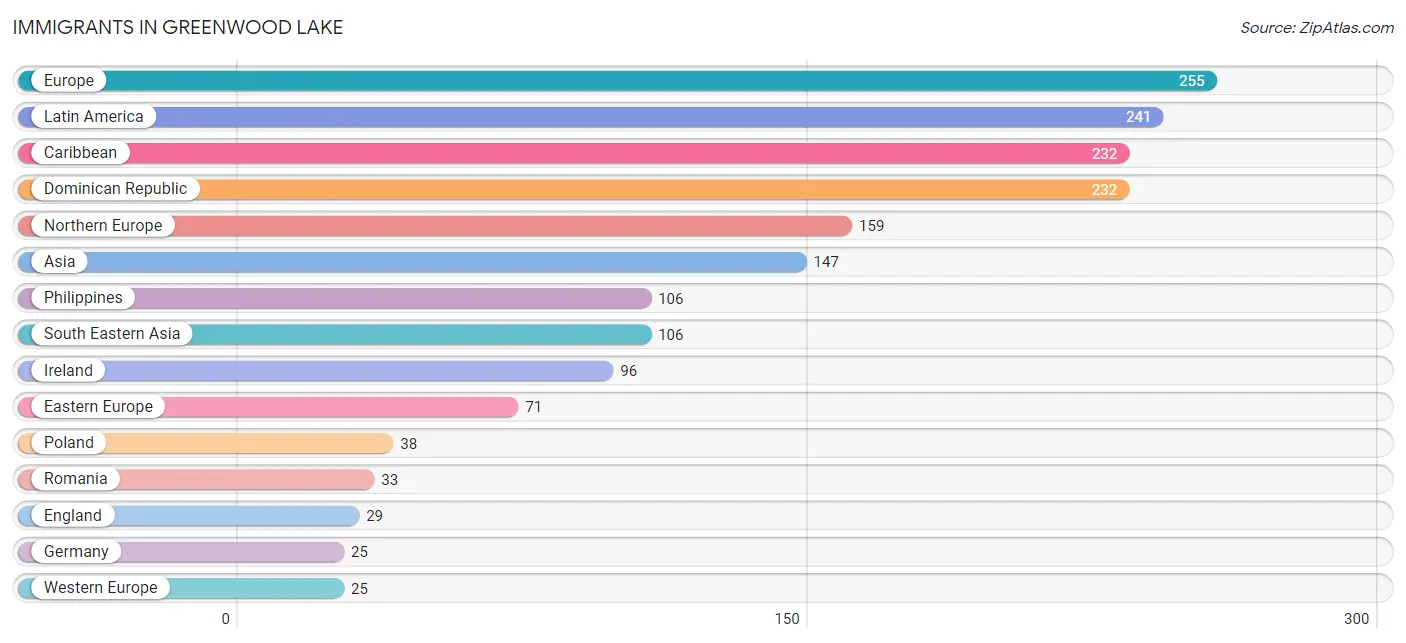
The most numerous immigrant groups reported in Greenwood Lake came from Europe (255 | 8.4%), Latin America (241 | 8.0%), Caribbean (232 | 7.7%), Dominican Republic (232 | 7.7%), and Northern Europe (159 | 5.2%), together accounting for 36.9% of all Greenwood Lake residents.
| Immigration Origin | # Population | % Population |
| Asia | 147 | 4.9% |
| Caribbean | 232 | 7.7% |
| Colombia | 9 | 0.3% |
| Dominican Republic | 232 | 7.7% |
| Eastern Asia | 17 | 0.6% |
| Eastern Europe | 71 | 2.4% |
| England | 29 | 1.0% |
| Europe | 255 | 8.4% |
| Germany | 25 | 0.8% |
| Ireland | 96 | 3.2% |
| Israel | 24 | 0.8% |
| Japan | 17 | 0.6% |
| Latin America | 241 | 8.0% |
| Northern Europe | 159 | 5.2% |
| Philippines | 106 | 3.5% |
| Poland | 38 | 1.3% |
| Romania | 33 | 1.1% |
| South America | 9 | 0.3% |
| South Eastern Asia | 106 | 3.5% |
| Western Asia | 24 | 0.8% |
| Western Europe | 25 | 0.8% | View All 21 Rows |
Sex and Age in Greenwood Lake
Sex and Age in Greenwood Lake
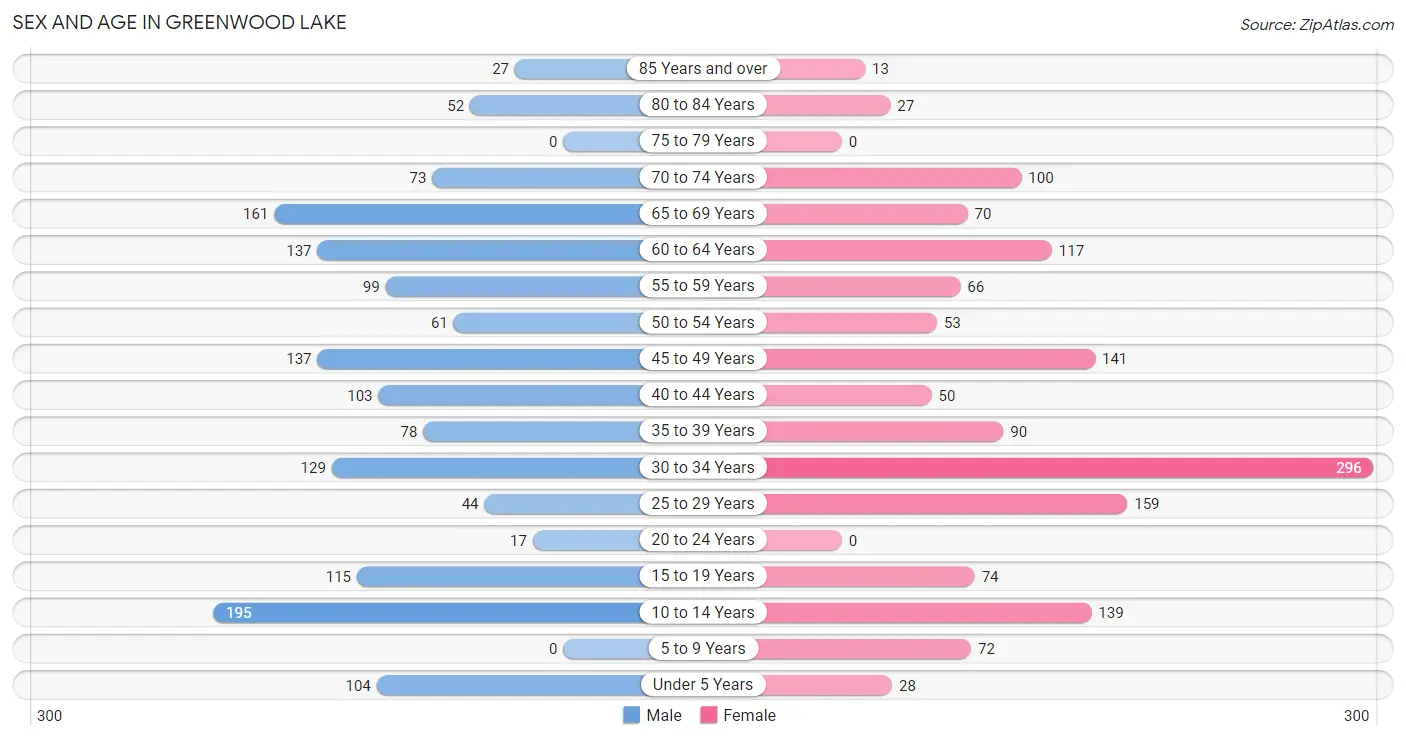
The most populous age groups in Greenwood Lake are 10 to 14 Years (195 | 12.7%) for men and 30 to 34 Years (296 | 19.8%) for women.
| Age Bracket | Male | Female |
| Under 5 Years | 104 (6.8%) | 28 (1.9%) |
| 5 to 9 Years | 0 (0.0%) | 72 (4.8%) |
| 10 to 14 Years | 195 (12.7%) | 139 (9.3%) |
| 15 to 19 Years | 115 (7.5%) | 74 (5.0%) |
| 20 to 24 Years | 17 (1.1%) | 0 (0.0%) |
| 25 to 29 Years | 44 (2.9%) | 159 (10.6%) |
| 30 to 34 Years | 129 (8.4%) | 296 (19.8%) |
| 35 to 39 Years | 78 (5.1%) | 90 (6.0%) |
| 40 to 44 Years | 103 (6.7%) | 50 (3.3%) |
| 45 to 49 Years | 137 (8.9%) | 141 (9.4%) |
| 50 to 54 Years | 61 (4.0%) | 53 (3.5%) |
| 55 to 59 Years | 99 (6.5%) | 66 (4.4%) |
| 60 to 64 Years | 137 (8.9%) | 117 (7.8%) |
| 65 to 69 Years | 161 (10.5%) | 70 (4.7%) |
| 70 to 74 Years | 73 (4.8%) | 100 (6.7%) |
| 75 to 79 Years | 0 (0.0%) | 0 (0.0%) |
| 80 to 84 Years | 52 (3.4%) | 27 (1.8%) |
| 85 Years and over | 27 (1.8%) | 13 (0.9%) |
| Total | 1,532 (100.0%) | 1,495 (100.0%) |
Families and Households in Greenwood Lake
Median Family Size in Greenwood Lake
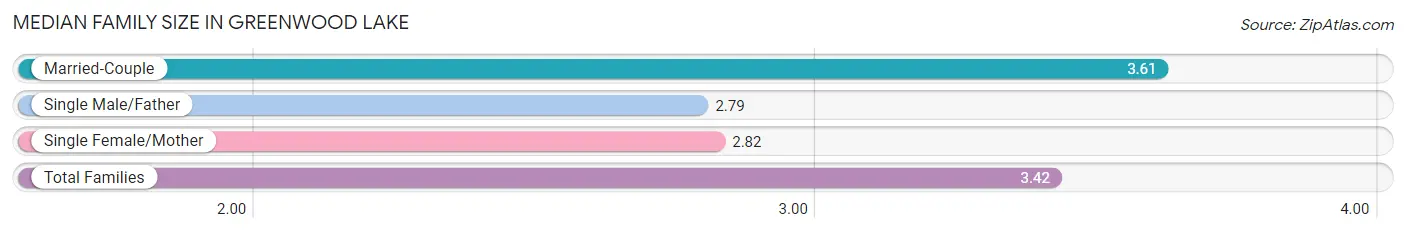
The median family size in Greenwood Lake is 3.42 persons per family, with married-couple families (585 | 75.5%) accounting for the largest median family size of 3.61 persons per family. On the other hand, single male/father families (53 | 6.8%) represent the smallest median family size with 2.79 persons per family.
| Family Type | # Families | Family Size |
| Married-Couple | 585 (75.5%) | 3.61 |
| Single Male/Father | 53 (6.8%) | 2.79 |
| Single Female/Mother | 137 (17.7%) | 2.82 |
| Total Families | 775 (100.0%) | 3.42 |
Median Household Size in Greenwood Lake
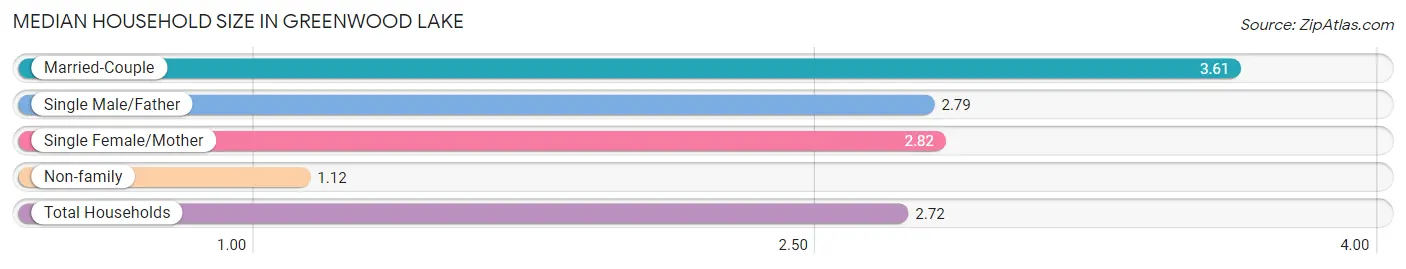
The median household size in Greenwood Lake is 2.72 persons per household, with married-couple households (585 | 52.5%) accounting for the largest median household size of 3.61 persons per household. non-family households (339 | 30.4%) represent the smallest median household size with 1.12 persons per household.
| Household Type | # Households | Household Size |
| Married-Couple | 585 (52.5%) | 3.61 |
| Single Male/Father | 53 (4.8%) | 2.79 |
| Single Female/Mother | 137 (12.3%) | 2.82 |
| Non-family | 339 (30.4%) | 1.12 |
| Total Households | 1,114 (100.0%) | 2.72 |
Household Size by Marriage Status in Greenwood Lake
Out of a total of 1,114 households in Greenwood Lake, 775 (69.6%) are family households, while 339 (30.4%) are nonfamily households. The most numerous type of family households are 2-person households, comprising 274, and the most common type of nonfamily households are 1-person households, comprising 304.
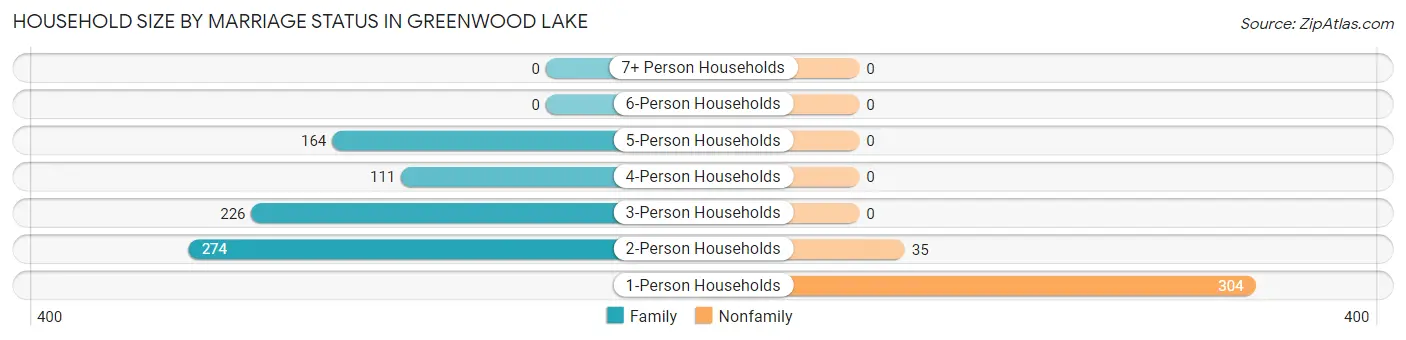
| Household Size | Family Households | Nonfamily Households |
| 1-Person Households | - | 304 (27.3%) |
| 2-Person Households | 274 (24.6%) | 35 (3.1%) |
| 3-Person Households | 226 (20.3%) | 0 (0.0%) |
| 4-Person Households | 111 (10.0%) | 0 (0.0%) |
| 5-Person Households | 164 (14.7%) | 0 (0.0%) |
| 6-Person Households | 0 (0.0%) | 0 (0.0%) |
| 7+ Person Households | 0 (0.0%) | 0 (0.0%) |
| Total | 775 (69.6%) | 339 (30.4%) |
Female Fertility in Greenwood Lake
Fertility by Age in Greenwood Lake
Average fertility rate in Greenwood Lake is 31.0 births per 1,000 women. Women in the age bracket of 20 to 34 years have the highest fertility rate with 55.0 births per 1,000 women. Women in the age bracket of 20 to 34 years acount for 100.0% of all women with births.
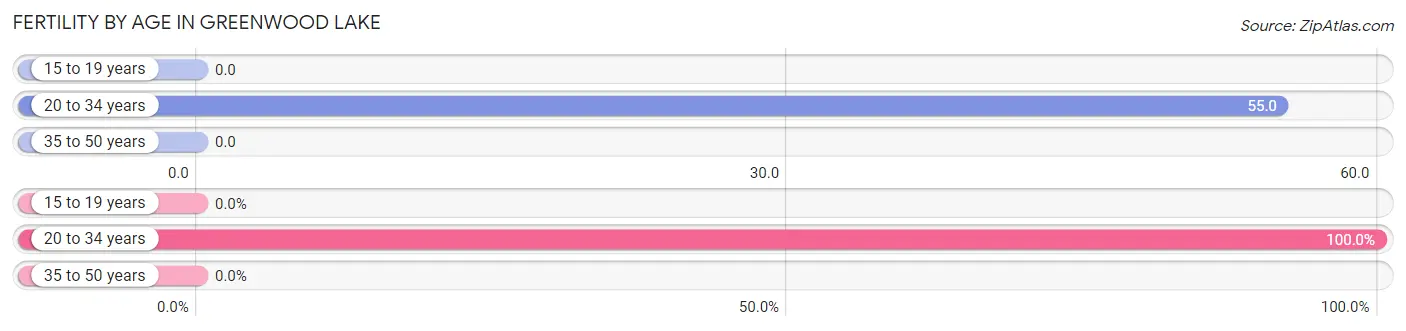
| Age Bracket | Women with Births | Births / 1,000 Women |
| 15 to 19 years | 0 (0.0%) | 0.0 |
| 20 to 34 years | 25 (100.0%) | 55.0 |
| 35 to 50 years | 0 (0.0%) | 0.0 |
| Total | 25 (100.0%) | 31.0 |
Fertility by Age by Marriage Status in Greenwood Lake
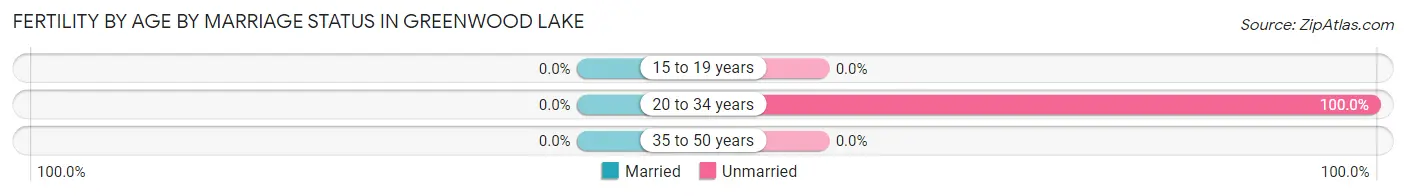
| Age Bracket | Married | Unmarried |
| 15 to 19 years | 0 (0.0%) | 0 (0.0%) |
| 20 to 34 years | 0 (0.0%) | 25 (100.0%) |
| 35 to 50 years | 0 (0.0%) | 0 (0.0%) |
| Total | 0 (0.0%) | 25 (100.0%) |
Fertility by Education in Greenwood Lake
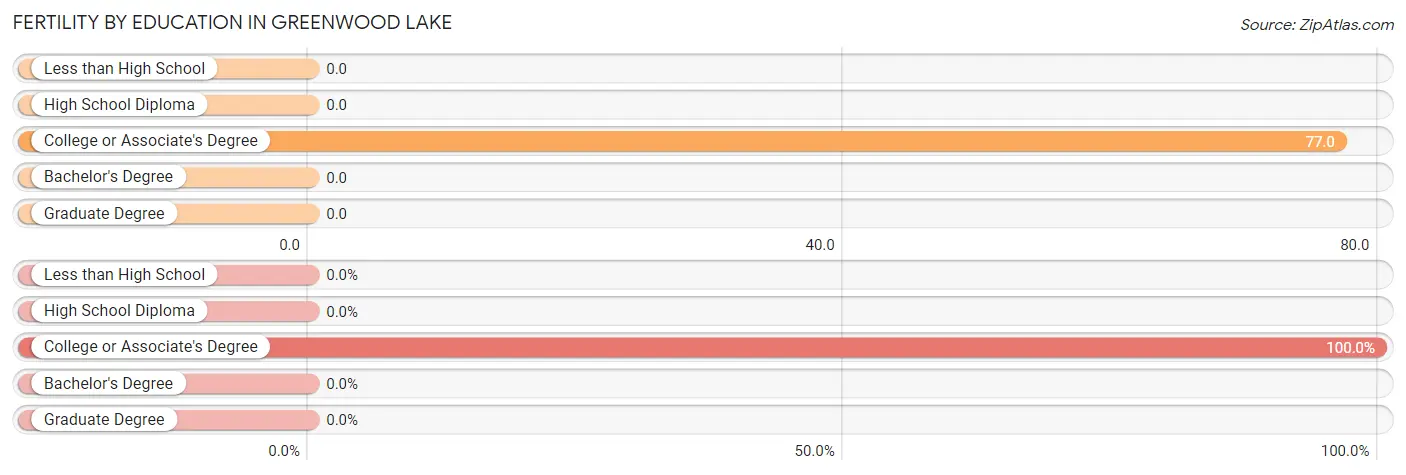
| Educational Attainment | Women with Births | Births / 1,000 Women |
| Less than High School | 0 (0.0%) | 0.0 |
| High School Diploma | 0 (0.0%) | 0.0 |
| College or Associate's Degree | 25 (100.0%) | 77.0 |
| Bachelor's Degree | 0 (0.0%) | 0.0 |
| Graduate Degree | 0 (0.0%) | 0.0 |
| Total | 25 (100.0%) | 31.0 |
Fertility by Education by Marriage Status in Greenwood Lake
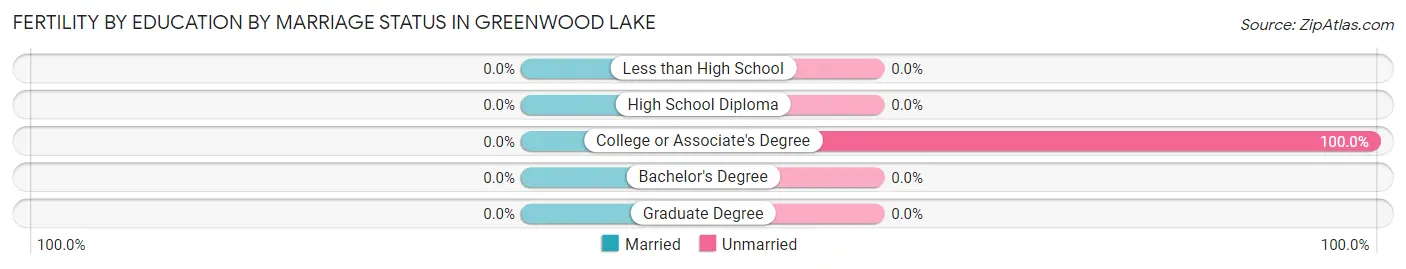
| Educational Attainment | Married | Unmarried |
| Less than High School | 0 (0.0%) | 0 (0.0%) |
| High School Diploma | 0 (0.0%) | 0 (0.0%) |
| College or Associate's Degree | 0 (0.0%) | 25 (100.0%) |
| Bachelor's Degree | 0 (0.0%) | 0 (0.0%) |
| Graduate Degree | 0 (0.0%) | 0 (0.0%) |
| Total | 0 (0.0%) | 25 (100.0%) |
Employment Characteristics in Greenwood Lake
Employment by Class of Employer in Greenwood Lake
Among the 1,330 employed individuals in Greenwood Lake, private company employees (889 | 66.8%), local government employees (120 | 9.0%), and self-employed (not incorporated) (118 | 8.9%) make up the most common classes of employment.
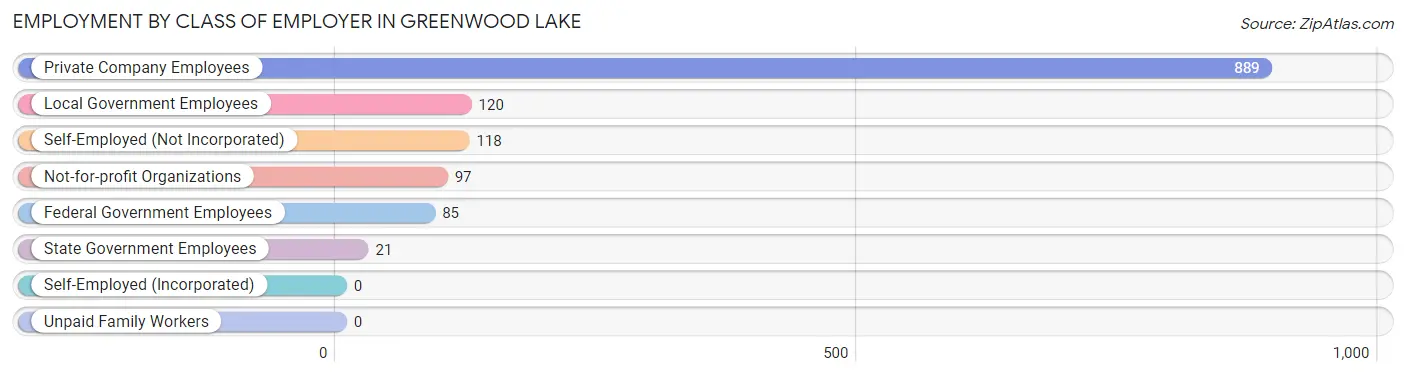
| Employer Class | # Employees | % Employees |
| Private Company Employees | 889 | 66.8% |
| Self-Employed (Incorporated) | 0 | 0.0% |
| Self-Employed (Not Incorporated) | 118 | 8.9% |
| Not-for-profit Organizations | 97 | 7.3% |
| Local Government Employees | 120 | 9.0% |
| State Government Employees | 21 | 1.6% |
| Federal Government Employees | 85 | 6.4% |
| Unpaid Family Workers | 0 | 0.0% |
| Total | 1,330 | 100.0% |
Employment Status by Age in Greenwood Lake
According to the labor force statistics for Greenwood Lake, out of the total population over 16 years of age (2,467), 56.6% or 1,396 individuals are in the labor force, with 4.7% or 66 of them unemployed. The age group with the highest labor force participation rate is 20 to 24 years, with 100.0% or 17 individuals in the labor force. Within the labor force, the 16 to 19 years age range has the highest percentage of unemployed individuals, with 29.7% or 27 of them being unemployed.
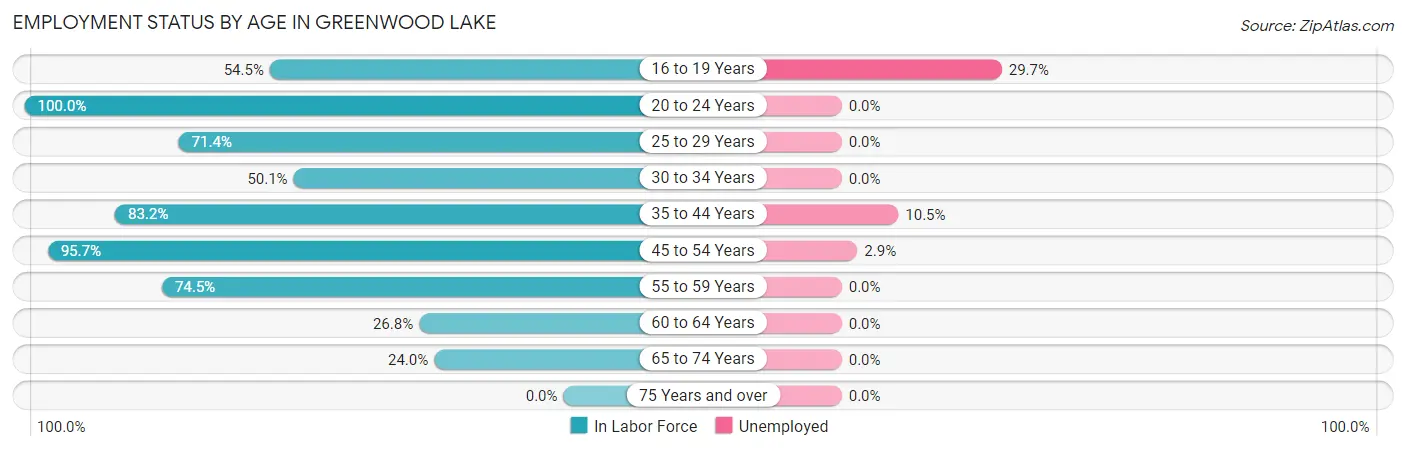
| Age Bracket | In Labor Force | Unemployed |
| 16 to 19 Years | 91 (54.5%) | 27 (29.7%) |
| 20 to 24 Years | 17 (100.0%) | 0 (0.0%) |
| 25 to 29 Years | 145 (71.4%) | 0 (0.0%) |
| 30 to 34 Years | 213 (50.1%) | 0 (0.0%) |
| 35 to 44 Years | 267 (83.2%) | 28 (10.5%) |
| 45 to 54 Years | 375 (95.7%) | 11 (2.9%) |
| 55 to 59 Years | 123 (74.5%) | 0 (0.0%) |
| 60 to 64 Years | 68 (26.8%) | 0 (0.0%) |
| 65 to 74 Years | 97 (24.0%) | 0 (0.0%) |
| 75 Years and over | 0 (0.0%) | 0 (0.0%) |
| Total | 1,396 (56.6%) | 66 (4.7%) |
Employment Status by Educational Attainment in Greenwood Lake
According to labor force statistics for Greenwood Lake, 67.7% of individuals (1,192) out of the total population between 25 and 64 years of age (1,760) are in the labor force, with 3.3% or 39 of them being unemployed. The group with the highest labor force participation rate are those with the educational attainment of college / associate degree, with 76.6% or 452 individuals in the labor force. Within the labor force, individuals with bachelor's degree or higher education have the highest percentage of unemployment, with 8.3% or 28 of them being unemployed.
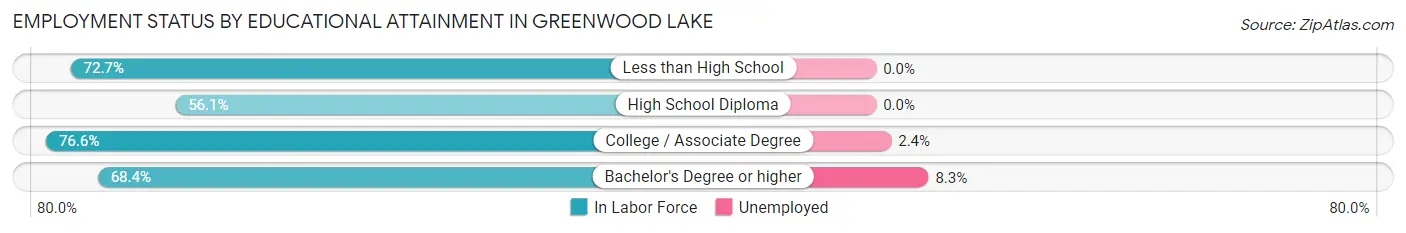
| Educational Attainment | In Labor Force | Unemployed |
| Less than High School | 96 (72.7%) | 0 (0.0%) |
| High School Diploma | 307 (56.1%) | 0 (0.0%) |
| College / Associate Degree | 452 (76.6%) | 14 (2.4%) |
| Bachelor's Degree or higher | 336 (68.4%) | 41 (8.3%) |
| Total | 1,192 (67.7%) | 58 (3.3%) |
Employment Occupations by Sex in Greenwood Lake
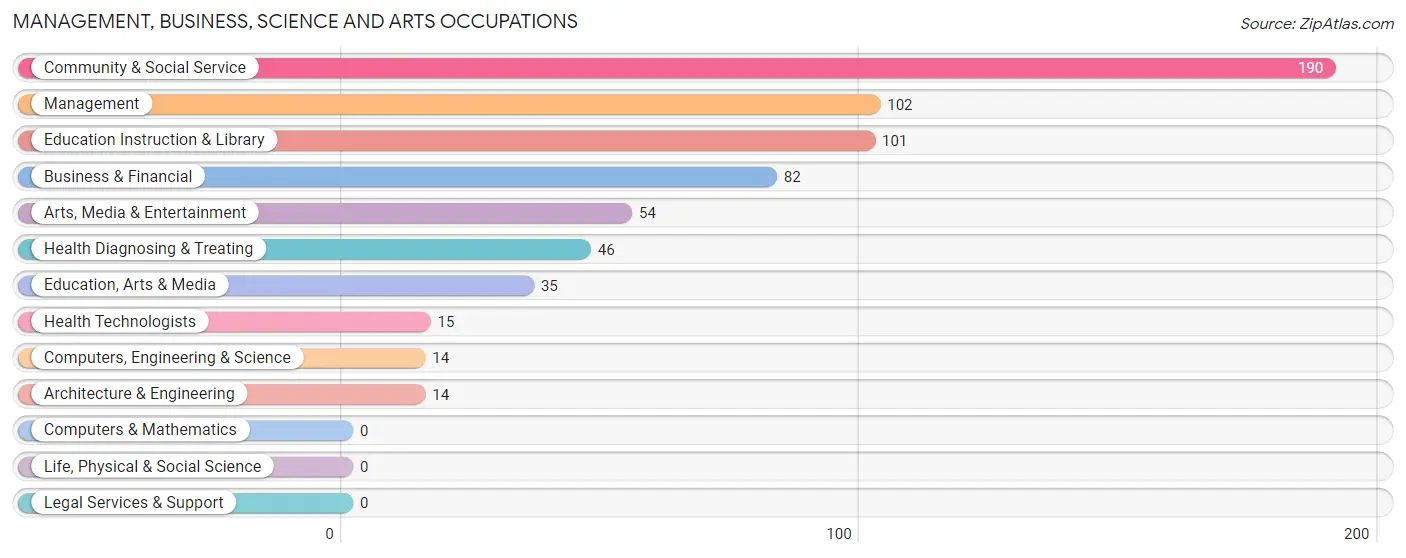
Management, Business, Science and Arts Occupations
The most common Management, Business, Science and Arts occupations in Greenwood Lake are Community & Social Service (190 | 14.3%), Management (102 | 7.7%), Education Instruction & Library (101 | 7.6%), Business & Financial (82 | 6.2%), and Arts, Media & Entertainment (54 | 4.1%).
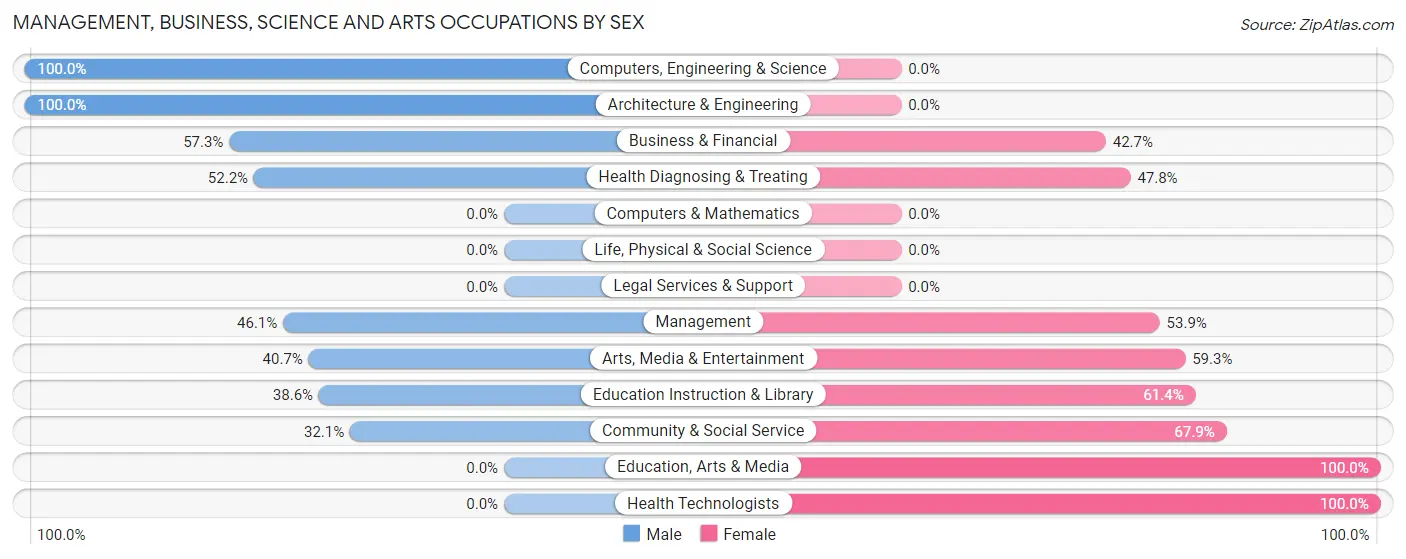
Management, Business, Science and Arts Occupations by Sex
Within the Management, Business, Science and Arts occupations in Greenwood Lake, the most male-oriented occupations are Computers, Engineering & Science (100.0%), Architecture & Engineering (100.0%), and Business & Financial (57.3%), while the most female-oriented occupations are Education, Arts & Media (100.0%), Health Technologists (100.0%), and Community & Social Service (67.9%).
| Occupation | Male | Female |
| Management | 47 (46.1%) | 55 (53.9%) |
| Business & Financial | 47 (57.3%) | 35 (42.7%) |
| Computers, Engineering & Science | 14 (100.0%) | 0 (0.0%) |
| Computers & Mathematics | 0 (0.0%) | 0 (0.0%) |
| Architecture & Engineering | 14 (100.0%) | 0 (0.0%) |
| Life, Physical & Social Science | 0 (0.0%) | 0 (0.0%) |
| Community & Social Service | 61 (32.1%) | 129 (67.9%) |
| Education, Arts & Media | 0 (0.0%) | 35 (100.0%) |
| Legal Services & Support | 0 (0.0%) | 0 (0.0%) |
| Education Instruction & Library | 39 (38.6%) | 62 (61.4%) |
| Arts, Media & Entertainment | 22 (40.7%) | 32 (59.3%) |
| Health Diagnosing & Treating | 24 (52.2%) | 22 (47.8%) |
| Health Technologists | 0 (0.0%) | 15 (100.0%) |
| Total (Category) | 193 (44.5%) | 241 (55.5%) |
| Total (Overall) | 583 (43.8%) | 747 (56.2%) |
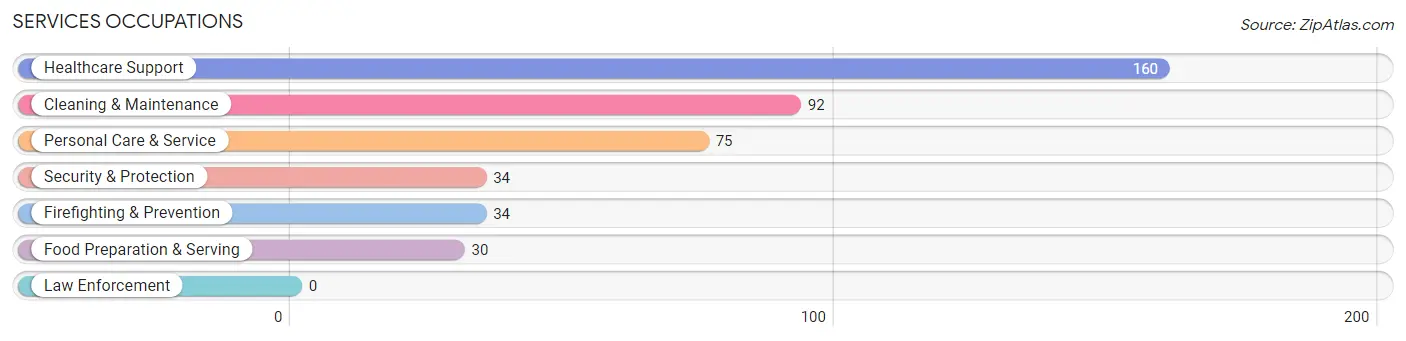
Services Occupations
The most common Services occupations in Greenwood Lake are Healthcare Support (160 | 12.0%), Cleaning & Maintenance (92 | 6.9%), Personal Care & Service (75 | 5.6%), Security & Protection (34 | 2.6%), and Firefighting & Prevention (34 | 2.6%).
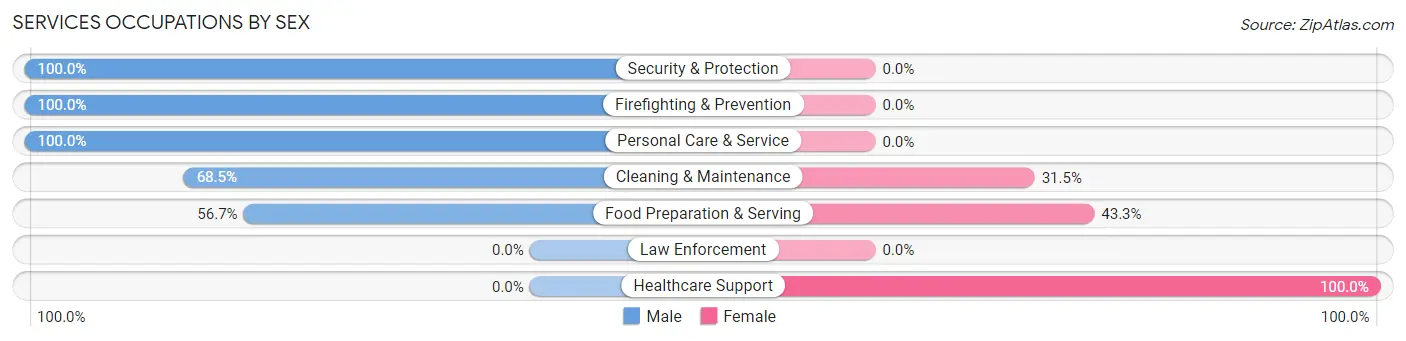
Services Occupations by Sex
Within the Services occupations in Greenwood Lake, the most male-oriented occupations are Security & Protection (100.0%), Firefighting & Prevention (100.0%), and Personal Care & Service (100.0%), while the most female-oriented occupations are Healthcare Support (100.0%), Food Preparation & Serving (43.3%), and Cleaning & Maintenance (31.5%).
| Occupation | Male | Female |
| Healthcare Support | 0 (0.0%) | 160 (100.0%) |
| Security & Protection | 34 (100.0%) | 0 (0.0%) |
| Firefighting & Prevention | 34 (100.0%) | 0 (0.0%) |
| Law Enforcement | 0 (0.0%) | 0 (0.0%) |
| Food Preparation & Serving | 17 (56.7%) | 13 (43.3%) |
| Cleaning & Maintenance | 63 (68.5%) | 29 (31.5%) |
| Personal Care & Service | 75 (100.0%) | 0 (0.0%) |
| Total (Category) | 189 (48.3%) | 202 (51.7%) |
| Total (Overall) | 583 (43.8%) | 747 (56.2%) |
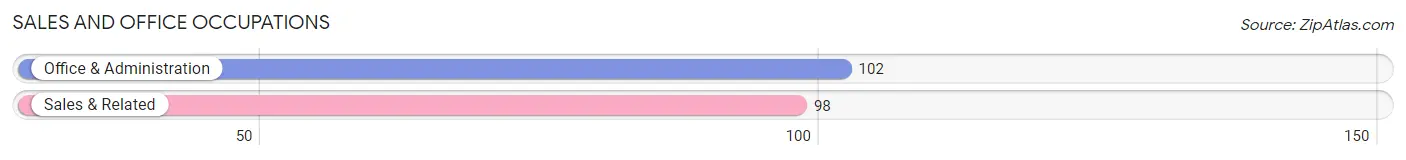
Sales and Office Occupations
The most common Sales and Office occupations in Greenwood Lake are Office & Administration (102 | 7.7%), and Sales & Related (98 | 7.4%).
Sales and Office Occupations by Sex
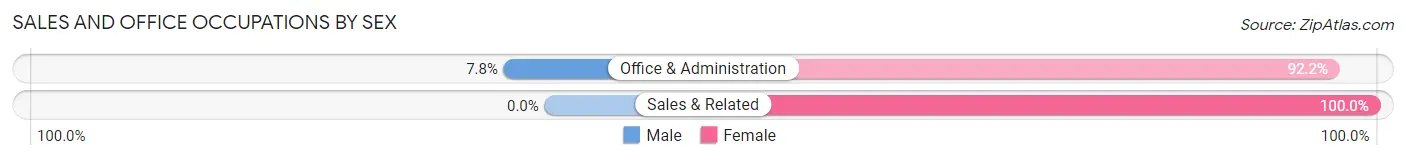
| Occupation | Male | Female |
| Sales & Related | 0 (0.0%) | 98 (100.0%) |
| Office & Administration | 8 (7.8%) | 94 (92.2%) |
| Total (Category) | 8 (4.0%) | 192 (96.0%) |
| Total (Overall) | 583 (43.8%) | 747 (56.2%) |
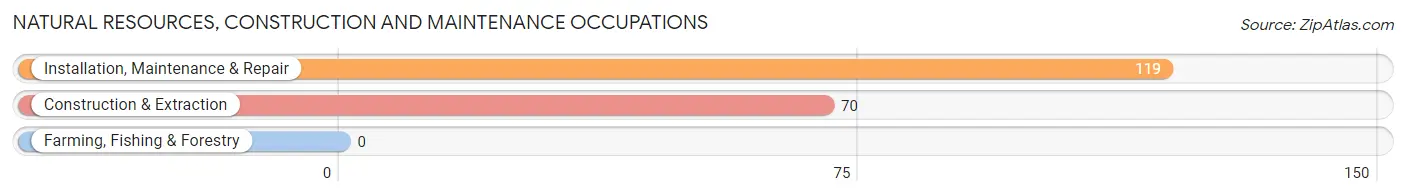
Natural Resources, Construction and Maintenance Occupations
The most common Natural Resources, Construction and Maintenance occupations in Greenwood Lake are Installation, Maintenance & Repair (119 | 8.9%), and Construction & Extraction (70 | 5.3%).
Natural Resources, Construction and Maintenance Occupations by Sex
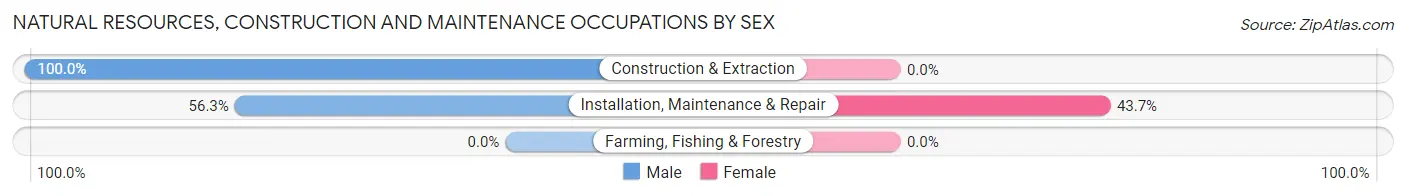
| Occupation | Male | Female |
| Farming, Fishing & Forestry | 0 (0.0%) | 0 (0.0%) |
| Construction & Extraction | 70 (100.0%) | 0 (0.0%) |
| Installation, Maintenance & Repair | 67 (56.3%) | 52 (43.7%) |
| Total (Category) | 137 (72.5%) | 52 (27.5%) |
| Total (Overall) | 583 (43.8%) | 747 (56.2%) |
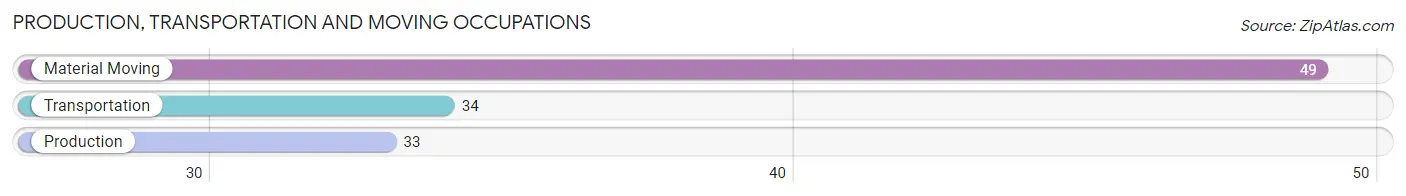
Production, Transportation and Moving Occupations
The most common Production, Transportation and Moving occupations in Greenwood Lake are Material Moving (49 | 3.7%), Transportation (34 | 2.6%), and Production (33 | 2.5%).
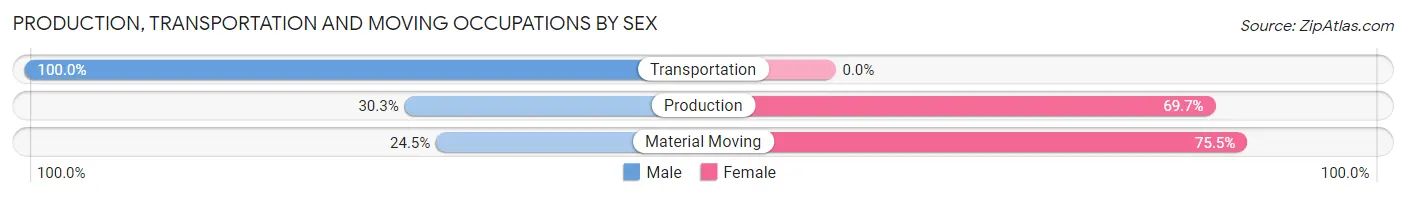
Production, Transportation and Moving Occupations by Sex
| Occupation | Male | Female |
| Production | 10 (30.3%) | 23 (69.7%) |
| Transportation | 34 (100.0%) | 0 (0.0%) |
| Material Moving | 12 (24.5%) | 37 (75.5%) |
| Total (Category) | 56 (48.3%) | 60 (51.7%) |
| Total (Overall) | 583 (43.8%) | 747 (56.2%) |
Employment Industries by Sex in Greenwood Lake
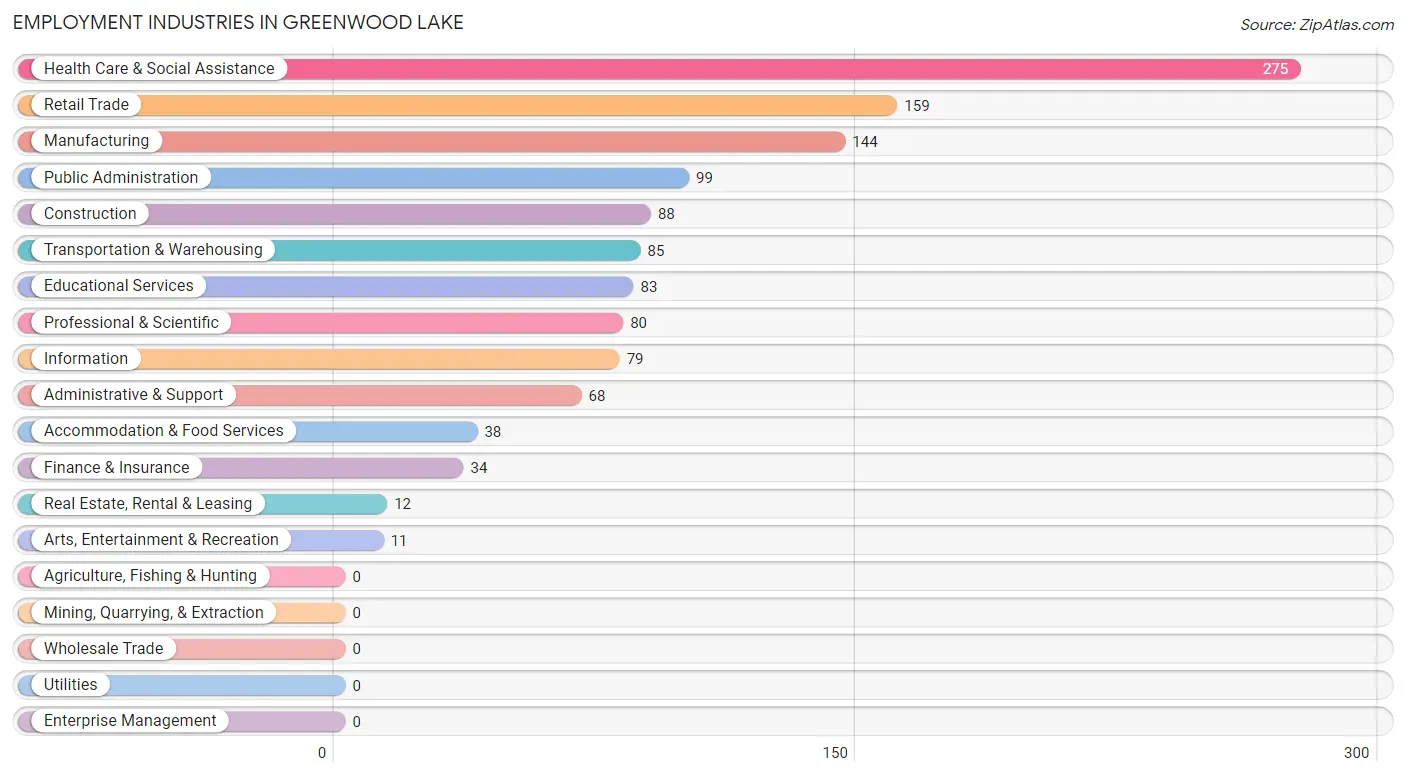
Employment Industries in Greenwood Lake
The major employment industries in Greenwood Lake include Health Care & Social Assistance (275 | 20.7%), Retail Trade (159 | 11.9%), Manufacturing (144 | 10.8%), Public Administration (99 | 7.4%), and Construction (88 | 6.6%).
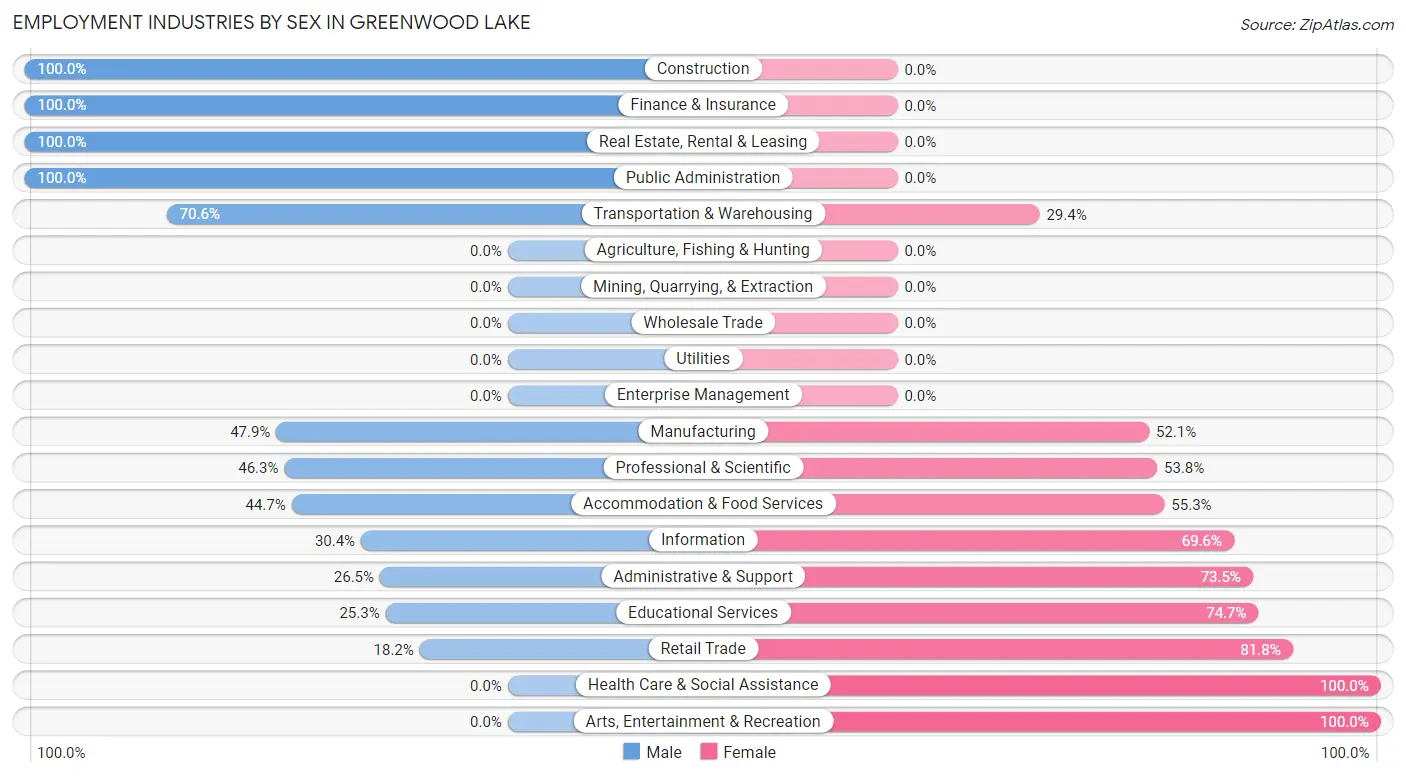
Employment Industries by Sex in Greenwood Lake
The Greenwood Lake industries that see more men than women are Construction (100.0%), Finance & Insurance (100.0%), and Real Estate, Rental & Leasing (100.0%), whereas the industries that tend to have a higher number of women are Health Care & Social Assistance (100.0%), Arts, Entertainment & Recreation (100.0%), and Retail Trade (81.8%).
| Industry | Male | Female |
| Agriculture, Fishing & Hunting | 0 (0.0%) | 0 (0.0%) |
| Mining, Quarrying, & Extraction | 0 (0.0%) | 0 (0.0%) |
| Construction | 88 (100.0%) | 0 (0.0%) |
| Manufacturing | 69 (47.9%) | 75 (52.1%) |
| Wholesale Trade | 0 (0.0%) | 0 (0.0%) |
| Retail Trade | 29 (18.2%) | 130 (81.8%) |
| Transportation & Warehousing | 60 (70.6%) | 25 (29.4%) |
| Utilities | 0 (0.0%) | 0 (0.0%) |
| Information | 24 (30.4%) | 55 (69.6%) |
| Finance & Insurance | 34 (100.0%) | 0 (0.0%) |
| Real Estate, Rental & Leasing | 12 (100.0%) | 0 (0.0%) |
| Professional & Scientific | 37 (46.3%) | 43 (53.7%) |
| Enterprise Management | 0 (0.0%) | 0 (0.0%) |
| Administrative & Support | 18 (26.5%) | 50 (73.5%) |
| Educational Services | 21 (25.3%) | 62 (74.7%) |
| Health Care & Social Assistance | 0 (0.0%) | 275 (100.0%) |
| Arts, Entertainment & Recreation | 0 (0.0%) | 11 (100.0%) |
| Accommodation & Food Services | 17 (44.7%) | 21 (55.3%) |
| Public Administration | 99 (100.0%) | 0 (0.0%) |
| Total | 583 (43.8%) | 747 (56.2%) |
Education in Greenwood Lake
School Enrollment in Greenwood Lake
The most common levels of schooling among the 558 students in Greenwood Lake are middle school (211 | 37.8%), high school (196 | 35.1%), and college / undergraduate (119 | 21.3%).
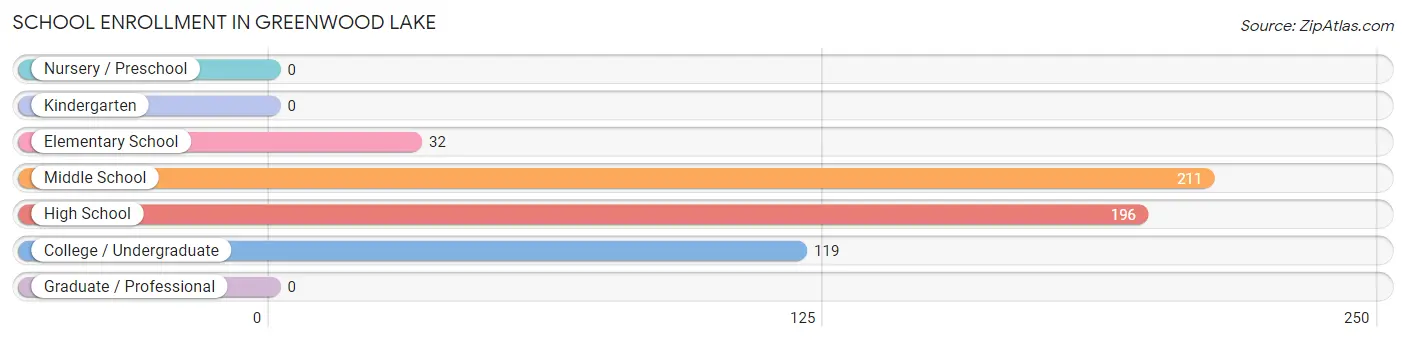
| School Level | # Students | % Students |
| Nursery / Preschool | 0 | 0.0% |
| Kindergarten | 0 | 0.0% |
| Elementary School | 32 | 5.7% |
| Middle School | 211 | 37.8% |
| High School | 196 | 35.1% |
| College / Undergraduate | 119 | 21.3% |
| Graduate / Professional | 0 | 0.0% |
| Total | 558 | 100.0% |
School Enrollment by Age by Funding Source in Greenwood Lake
Out of a total of 558 students who are enrolled in schools in Greenwood Lake, 145 (26.0%) attend a private institution, while the remaining 413 (74.0%) are enrolled in public schools. The age group of 5 to 9 year old has the highest likelihood of being enrolled in private schools, with 32 (100.0% in the age bracket) enrolled. Conversely, the age group of 15 to 17 year olds has the lowest likelihood of being enrolled in a private school, with 125 (100.0% in the age bracket) attending a public institution.
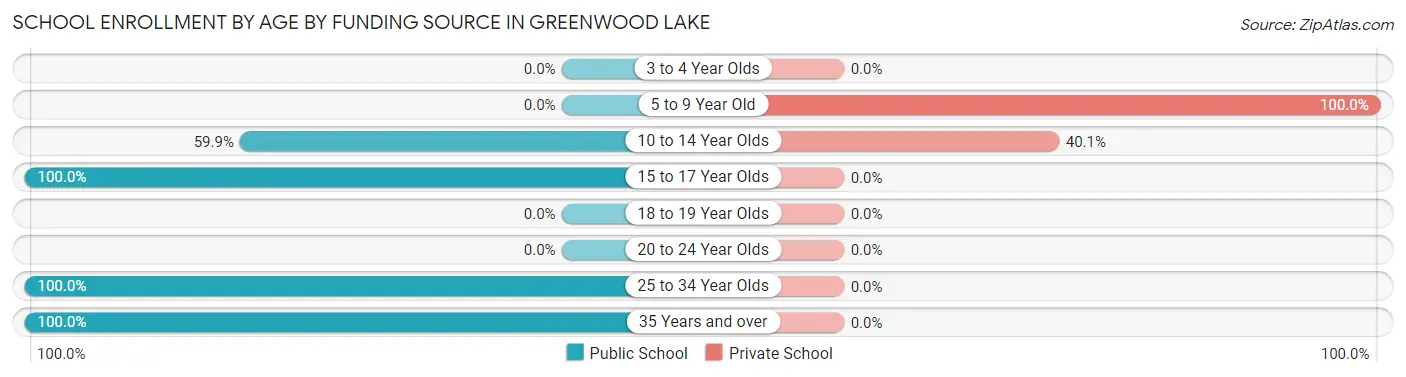
| Age Bracket | Public School | Private School |
| 3 to 4 Year Olds | 0 (0.0%) | 0 (0.0%) |
| 5 to 9 Year Old | 0 (0.0%) | 32 (100.0%) |
| 10 to 14 Year Olds | 169 (59.9%) | 113 (40.1%) |
| 15 to 17 Year Olds | 125 (100.0%) | 0 (0.0%) |
| 18 to 19 Year Olds | 0 (0.0%) | 0 (0.0%) |
| 20 to 24 Year Olds | 0 (0.0%) | 0 (0.0%) |
| 25 to 34 Year Olds | 101 (100.0%) | 0 (0.0%) |
| 35 Years and over | 18 (100.0%) | 0 (0.0%) |
| Total | 413 (74.0%) | 145 (26.0%) |
Educational Attainment by Field of Study in Greenwood Lake
Business (180 | 28.4%), psychology (89 | 14.1%), visual & performing arts (80 | 12.6%), social sciences (62 | 9.8%), and science & technology (50 | 7.9%) are the most common fields of study among 633 individuals in Greenwood Lake who have obtained a bachelor's degree or higher.
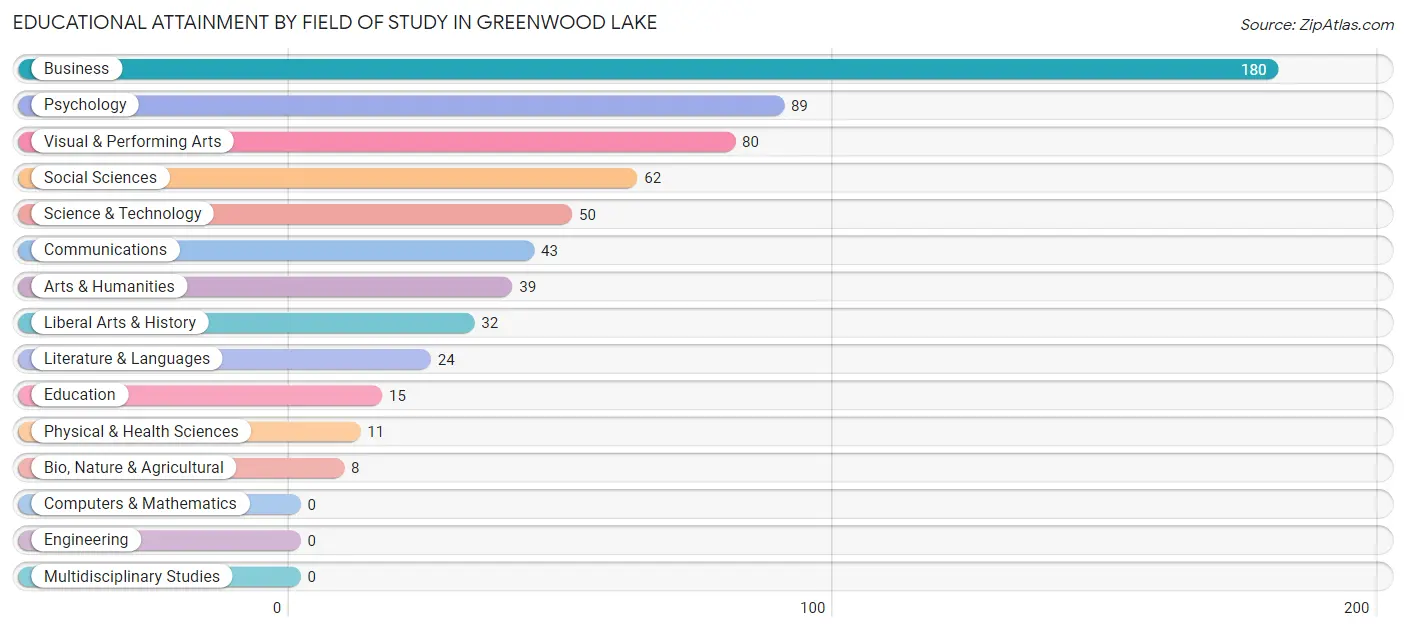
| Field of Study | # Graduates | % Graduates |
| Computers & Mathematics | 0 | 0.0% |
| Bio, Nature & Agricultural | 8 | 1.3% |
| Physical & Health Sciences | 11 | 1.7% |
| Psychology | 89 | 14.1% |
| Social Sciences | 62 | 9.8% |
| Engineering | 0 | 0.0% |
| Multidisciplinary Studies | 0 | 0.0% |
| Science & Technology | 50 | 7.9% |
| Business | 180 | 28.4% |
| Education | 15 | 2.4% |
| Literature & Languages | 24 | 3.8% |
| Liberal Arts & History | 32 | 5.1% |
| Visual & Performing Arts | 80 | 12.6% |
| Communications | 43 | 6.8% |
| Arts & Humanities | 39 | 6.2% |
| Total | 633 | 100.0% |
Transportation & Commute in Greenwood Lake
Vehicle Availability by Sex in Greenwood Lake
The most prevalent vehicle ownership categories in Greenwood Lake are males with 2 vehicles (364, accounting for 62.4%) and females with 2 vehicles (470, making up 48.7%).
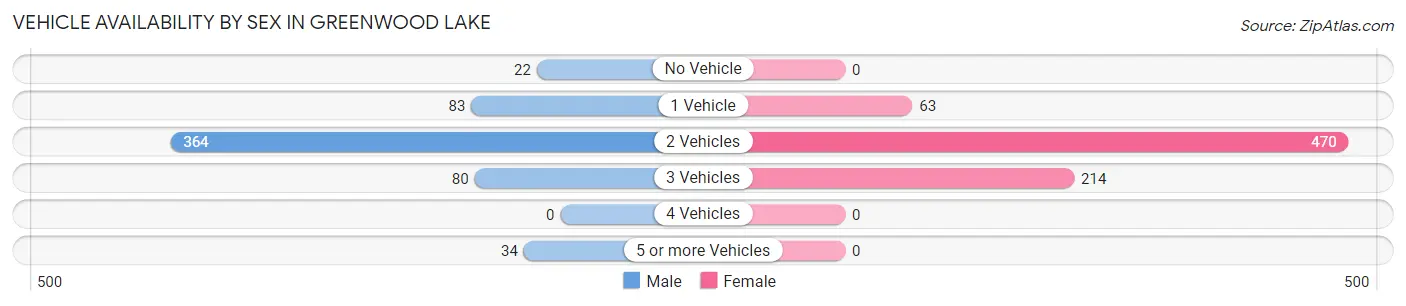
| Vehicles Available | Male | Female |
| No Vehicle | 22 (3.8%) | 0 (0.0%) |
| 1 Vehicle | 83 (14.2%) | 63 (8.4%) |
| 2 Vehicles | 364 (62.4%) | 470 (62.9%) |
| 3 Vehicles | 80 (13.7%) | 214 (28.6%) |
| 4 Vehicles | 0 (0.0%) | 0 (0.0%) |
| 5 or more Vehicles | 34 (5.8%) | 0 (0.0%) |
| Total | 583 (100.0%) | 747 (100.0%) |
Commute Time in Greenwood Lake
The most frequently occuring commute durations in Greenwood Lake are 40 to 44 minutes (148 commuters, 14.3%), 20 to 24 minutes (140 commuters, 13.6%), and 30 to 34 minutes (131 commuters, 12.7%).
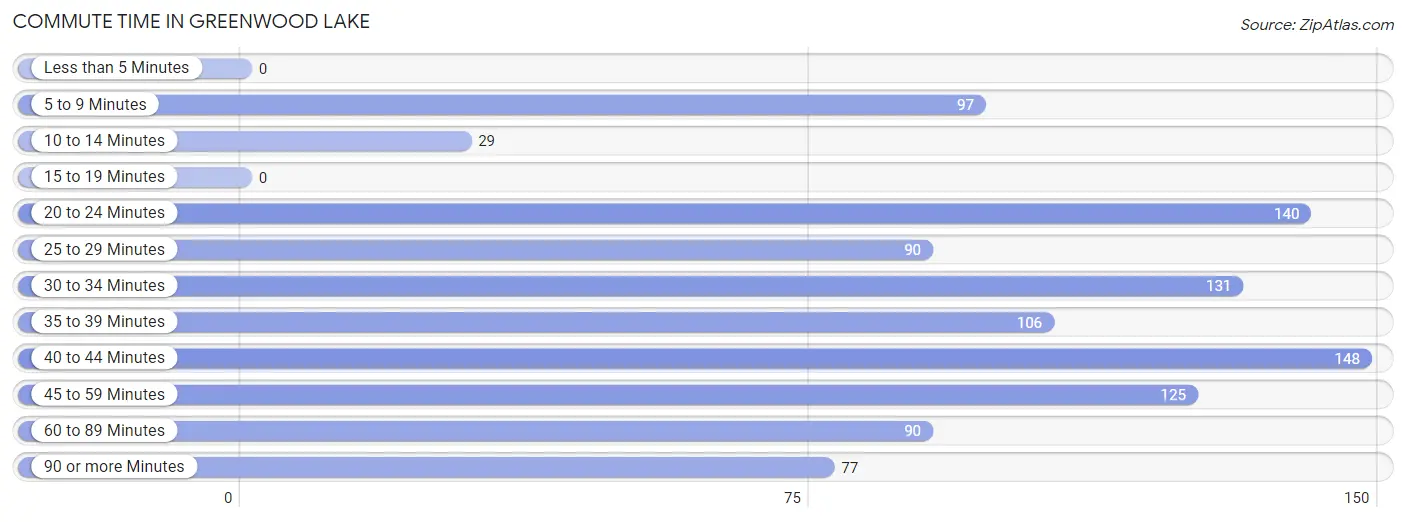
| Commute Time | # Commuters | % Commuters |
| Less than 5 Minutes | 0 | 0.0% |
| 5 to 9 Minutes | 97 | 9.4% |
| 10 to 14 Minutes | 29 | 2.8% |
| 15 to 19 Minutes | 0 | 0.0% |
| 20 to 24 Minutes | 140 | 13.6% |
| 25 to 29 Minutes | 90 | 8.7% |
| 30 to 34 Minutes | 131 | 12.7% |
| 35 to 39 Minutes | 106 | 10.3% |
| 40 to 44 Minutes | 148 | 14.3% |
| 45 to 59 Minutes | 125 | 12.1% |
| 60 to 89 Minutes | 90 | 8.7% |
| 90 or more Minutes | 77 | 7.4% |
Commute Time by Sex in Greenwood Lake
The most common commute times in Greenwood Lake are 40 to 44 minutes (127 commuters, 28.5%) for males and 20 to 24 minutes (140 commuters, 23.8%) for females.
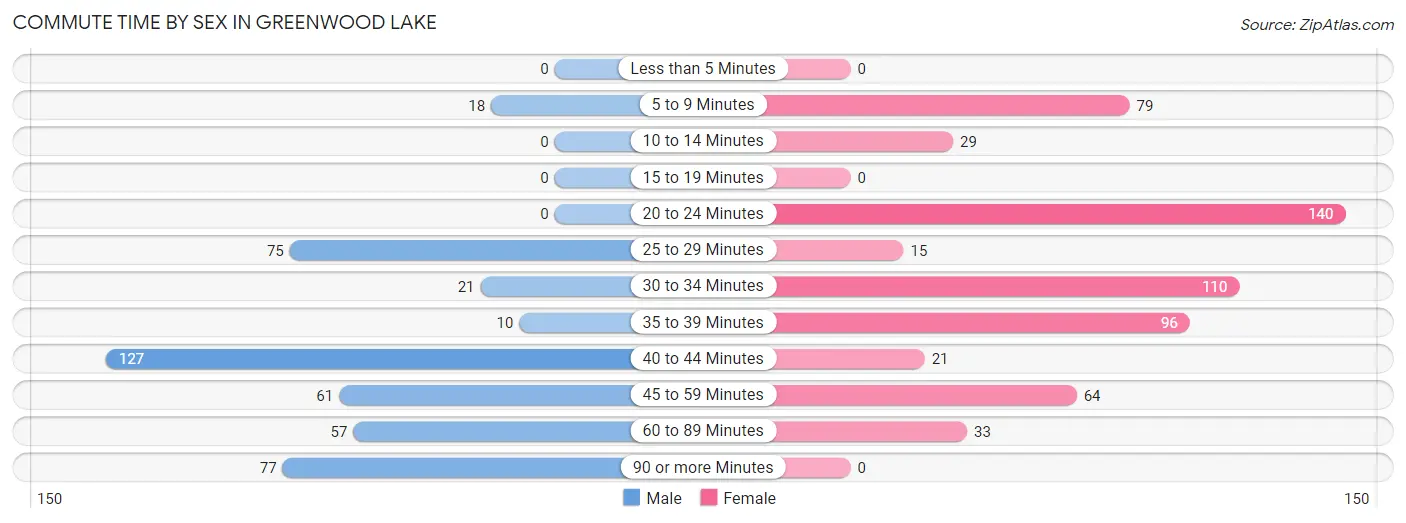
| Commute Time | Male | Female |
| Less than 5 Minutes | 0 (0.0%) | 0 (0.0%) |
| 5 to 9 Minutes | 18 (4.0%) | 79 (13.5%) |
| 10 to 14 Minutes | 0 (0.0%) | 29 (4.9%) |
| 15 to 19 Minutes | 0 (0.0%) | 0 (0.0%) |
| 20 to 24 Minutes | 0 (0.0%) | 140 (23.8%) |
| 25 to 29 Minutes | 75 (16.8%) | 15 (2.6%) |
| 30 to 34 Minutes | 21 (4.7%) | 110 (18.7%) |
| 35 to 39 Minutes | 10 (2.2%) | 96 (16.4%) |
| 40 to 44 Minutes | 127 (28.5%) | 21 (3.6%) |
| 45 to 59 Minutes | 61 (13.7%) | 64 (10.9%) |
| 60 to 89 Minutes | 57 (12.8%) | 33 (5.6%) |
| 90 or more Minutes | 77 (17.3%) | 0 (0.0%) |
Time of Departure to Work by Sex in Greenwood Lake
The most frequent times of departure to work in Greenwood Lake are 6:00 AM to 6:29 AM (82, 18.4%) for males and 8:00 AM to 8:29 AM (87, 14.8%) for females.
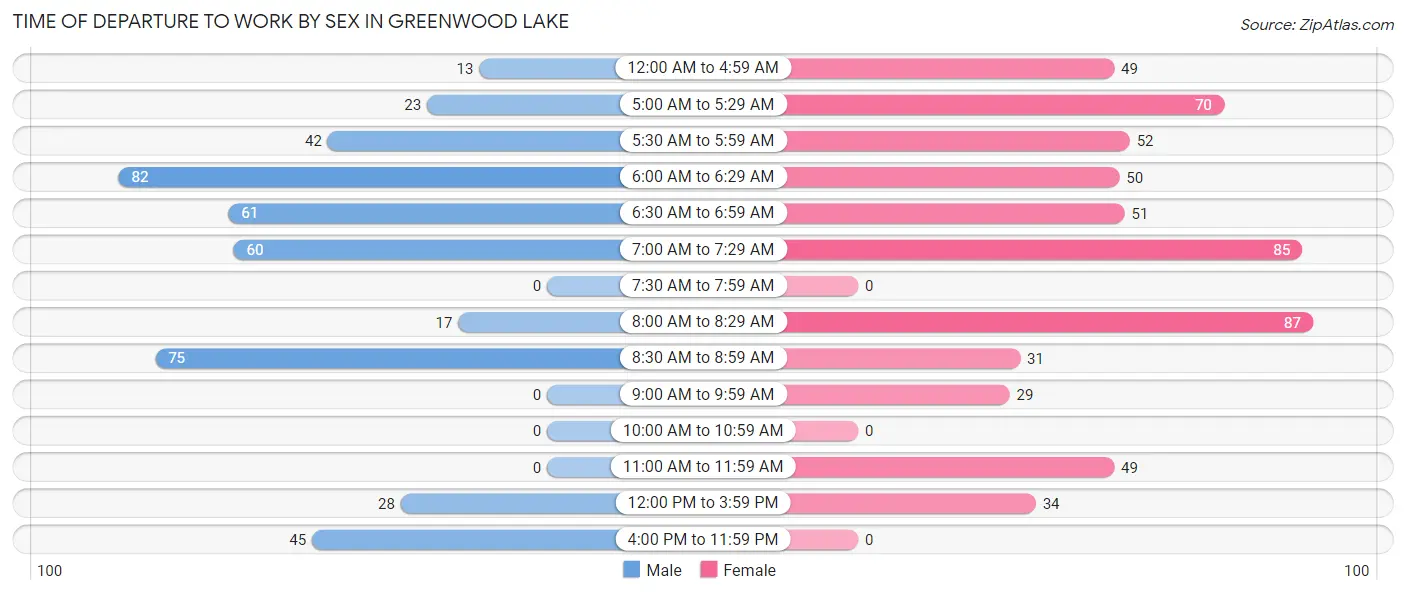
| Time of Departure | Male | Female |
| 12:00 AM to 4:59 AM | 13 (2.9%) | 49 (8.4%) |
| 5:00 AM to 5:29 AM | 23 (5.2%) | 70 (11.9%) |
| 5:30 AM to 5:59 AM | 42 (9.4%) | 52 (8.9%) |
| 6:00 AM to 6:29 AM | 82 (18.4%) | 50 (8.5%) |
| 6:30 AM to 6:59 AM | 61 (13.7%) | 51 (8.7%) |
| 7:00 AM to 7:29 AM | 60 (13.5%) | 85 (14.5%) |
| 7:30 AM to 7:59 AM | 0 (0.0%) | 0 (0.0%) |
| 8:00 AM to 8:29 AM | 17 (3.8%) | 87 (14.8%) |
| 8:30 AM to 8:59 AM | 75 (16.8%) | 31 (5.3%) |
| 9:00 AM to 9:59 AM | 0 (0.0%) | 29 (4.9%) |
| 10:00 AM to 10:59 AM | 0 (0.0%) | 0 (0.0%) |
| 11:00 AM to 11:59 AM | 0 (0.0%) | 49 (8.4%) |
| 12:00 PM to 3:59 PM | 28 (6.3%) | 34 (5.8%) |
| 4:00 PM to 11:59 PM | 45 (10.1%) | 0 (0.0%) |
| Total | 446 (100.0%) | 587 (100.0%) |
Housing Occupancy in Greenwood Lake
Occupancy by Ownership in Greenwood Lake
Of the total 1,114 dwellings in Greenwood Lake, owner-occupied units account for 824 (74.0%), while renter-occupied units make up 290 (26.0%).
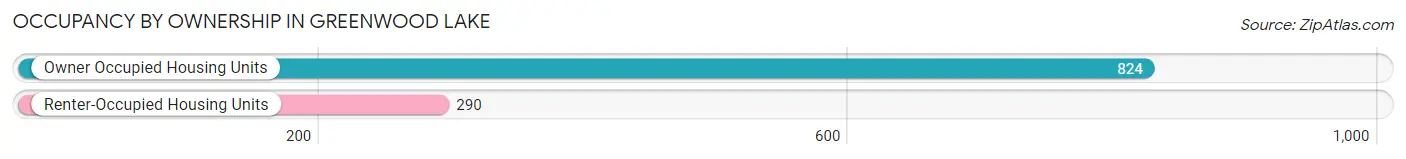
| Occupancy | # Housing Units | % Housing Units |
| Owner Occupied Housing Units | 824 | 74.0% |
| Renter-Occupied Housing Units | 290 | 26.0% |
| Total Occupied Housing Units | 1,114 | 100.0% |
Occupancy by Household Size in Greenwood Lake
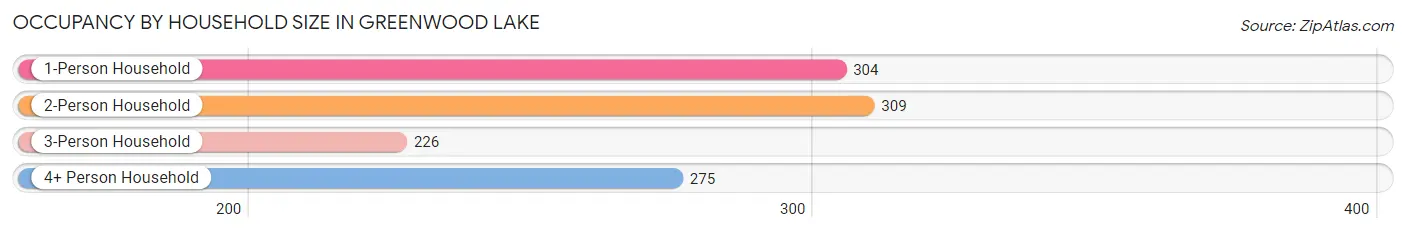
| Household Size | # Housing Units | % Housing Units |
| 1-Person Household | 304 | 27.3% |
| 2-Person Household | 309 | 27.7% |
| 3-Person Household | 226 | 20.3% |
| 4+ Person Household | 275 | 24.7% |
| Total Housing Units | 1,114 | 100.0% |
Occupancy by Ownership by Household Size in Greenwood Lake
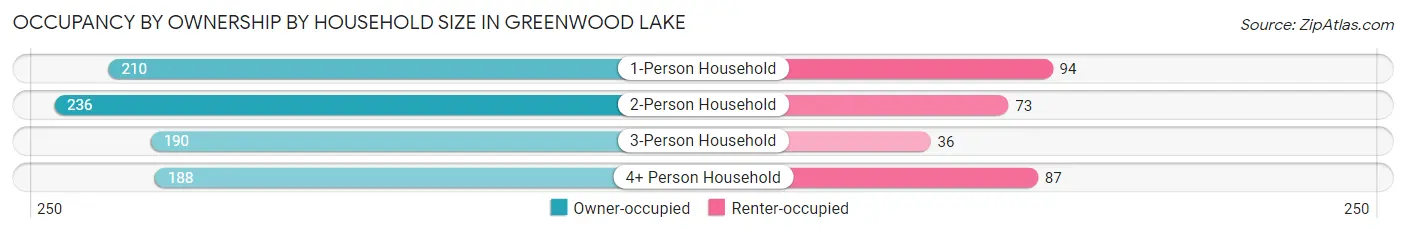
| Household Size | Owner-occupied | Renter-occupied |
| 1-Person Household | 210 (69.1%) | 94 (30.9%) |
| 2-Person Household | 236 (76.4%) | 73 (23.6%) |
| 3-Person Household | 190 (84.1%) | 36 (15.9%) |
| 4+ Person Household | 188 (68.4%) | 87 (31.6%) |
| Total Housing Units | 824 (74.0%) | 290 (26.0%) |
Occupancy by Educational Attainment in Greenwood Lake
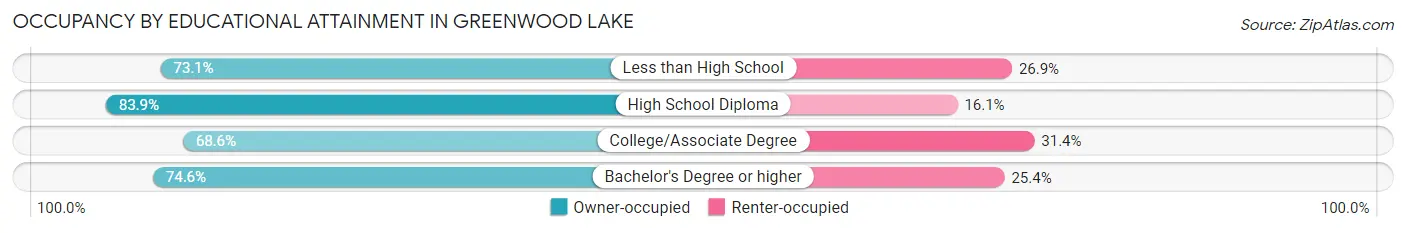
| Household Size | Owner-occupied | Renter-occupied |
| Less than High School | 57 (73.1%) | 21 (26.9%) |
| High School Diploma | 177 (83.9%) | 34 (16.1%) |
| College/Associate Degree | 291 (68.6%) | 133 (31.4%) |
| Bachelor's Degree or higher | 299 (74.6%) | 102 (25.4%) |
Occupancy by Age of Householder in Greenwood Lake
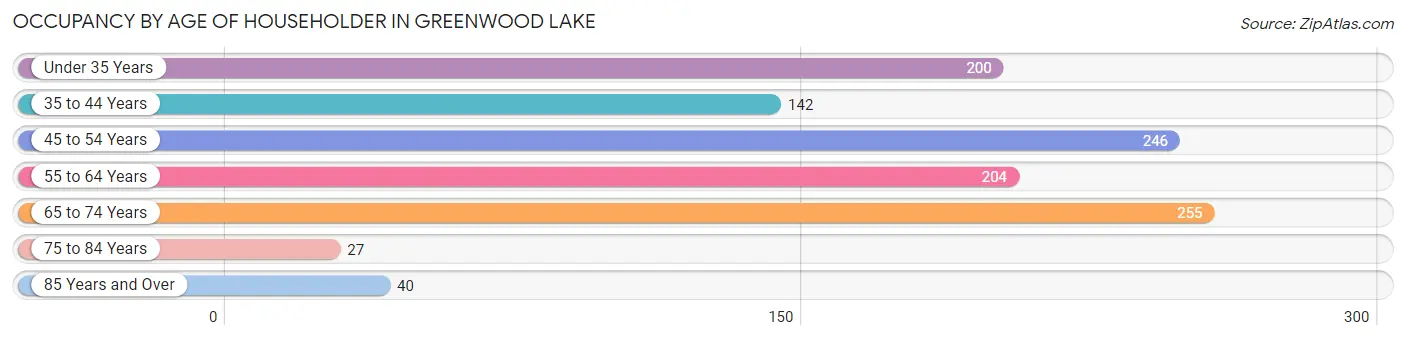
| Age Bracket | # Households | % Households |
| Under 35 Years | 200 | 17.9% |
| 35 to 44 Years | 142 | 12.8% |
| 45 to 54 Years | 246 | 22.1% |
| 55 to 64 Years | 204 | 18.3% |
| 65 to 74 Years | 255 | 22.9% |
| 75 to 84 Years | 27 | 2.4% |
| 85 Years and Over | 40 | 3.6% |
| Total | 1,114 | 100.0% |
Housing Finances in Greenwood Lake
Median Income by Occupancy in Greenwood Lake
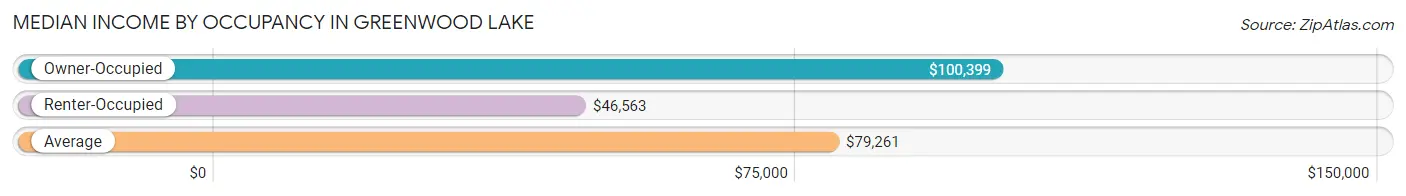
| Occupancy Type | # Households | Median Income |
| Owner-Occupied | 824 (74.0%) | $100,399 |
| Renter-Occupied | 290 (26.0%) | $46,563 |
| Average | 1,114 (100.0%) | $79,261 |
Occupancy by Householder Income Bracket in Greenwood Lake
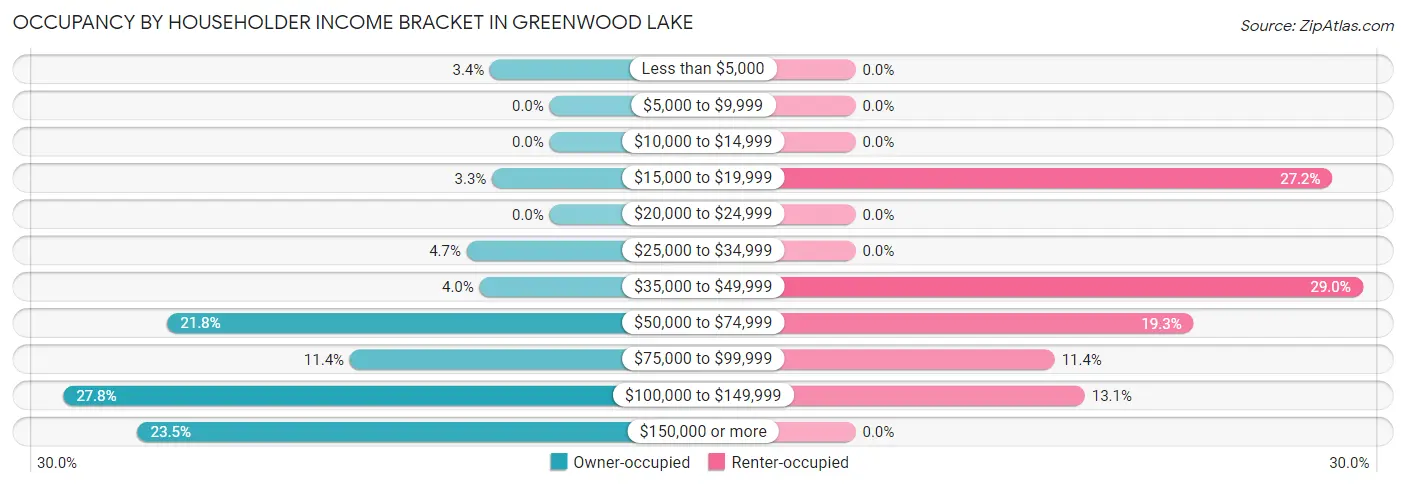
| Income Bracket | Owner-occupied | Renter-occupied |
| Less than $5,000 | 28 (3.4%) | 0 (0.0%) |
| $5,000 to $9,999 | 0 (0.0%) | 0 (0.0%) |
| $10,000 to $14,999 | 0 (0.0%) | 0 (0.0%) |
| $15,000 to $19,999 | 27 (3.3%) | 79 (27.2%) |
| $20,000 to $24,999 | 0 (0.0%) | 0 (0.0%) |
| $25,000 to $34,999 | 39 (4.7%) | 0 (0.0%) |
| $35,000 to $49,999 | 33 (4.0%) | 84 (29.0%) |
| $50,000 to $74,999 | 180 (21.8%) | 56 (19.3%) |
| $75,000 to $99,999 | 94 (11.4%) | 33 (11.4%) |
| $100,000 to $149,999 | 229 (27.8%) | 38 (13.1%) |
| $150,000 or more | 194 (23.5%) | 0 (0.0%) |
| Total | 824 (100.0%) | 290 (100.0%) |
Monthly Housing Cost Tiers in Greenwood Lake
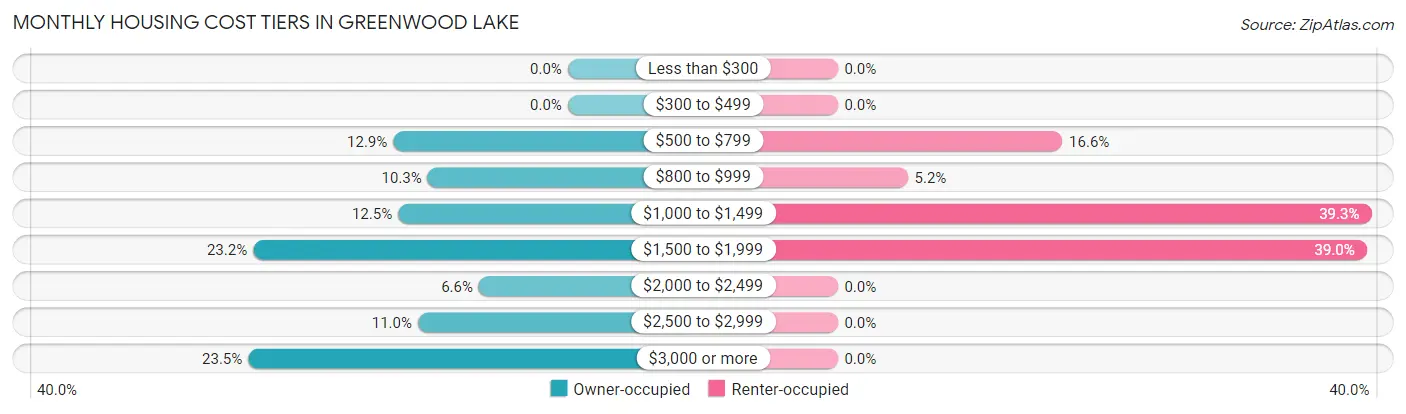
| Monthly Cost | Owner-occupied | Renter-occupied |
| Less than $300 | 0 (0.0%) | 0 (0.0%) |
| $300 to $499 | 0 (0.0%) | 0 (0.0%) |
| $500 to $799 | 106 (12.9%) | 48 (16.6%) |
| $800 to $999 | 85 (10.3%) | 15 (5.2%) |
| $1,000 to $1,499 | 103 (12.5%) | 114 (39.3%) |
| $1,500 to $1,999 | 191 (23.2%) | 113 (39.0%) |
| $2,000 to $2,499 | 54 (6.6%) | 0 (0.0%) |
| $2,500 to $2,999 | 91 (11.0%) | 0 (0.0%) |
| $3,000 or more | 194 (23.5%) | 0 (0.0%) |
| Total | 824 (100.0%) | 290 (100.0%) |
Physical Housing Characteristics in Greenwood Lake
Housing Structures in Greenwood Lake
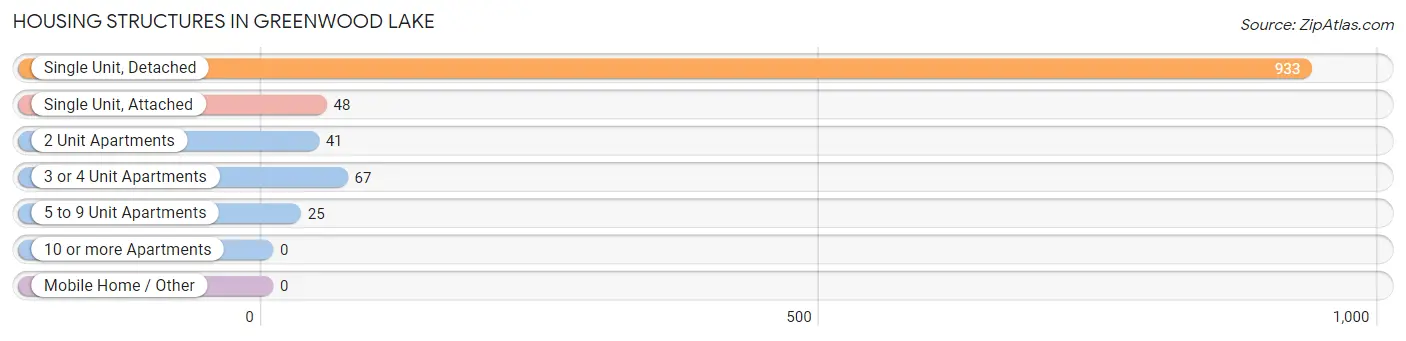
| Structure Type | # Housing Units | % Housing Units |
| Single Unit, Detached | 933 | 83.8% |
| Single Unit, Attached | 48 | 4.3% |
| 2 Unit Apartments | 41 | 3.7% |
| 3 or 4 Unit Apartments | 67 | 6.0% |
| 5 to 9 Unit Apartments | 25 | 2.2% |
| 10 or more Apartments | 0 | 0.0% |
| Mobile Home / Other | 0 | 0.0% |
| Total | 1,114 | 100.0% |
Housing Structures by Occupancy in Greenwood Lake
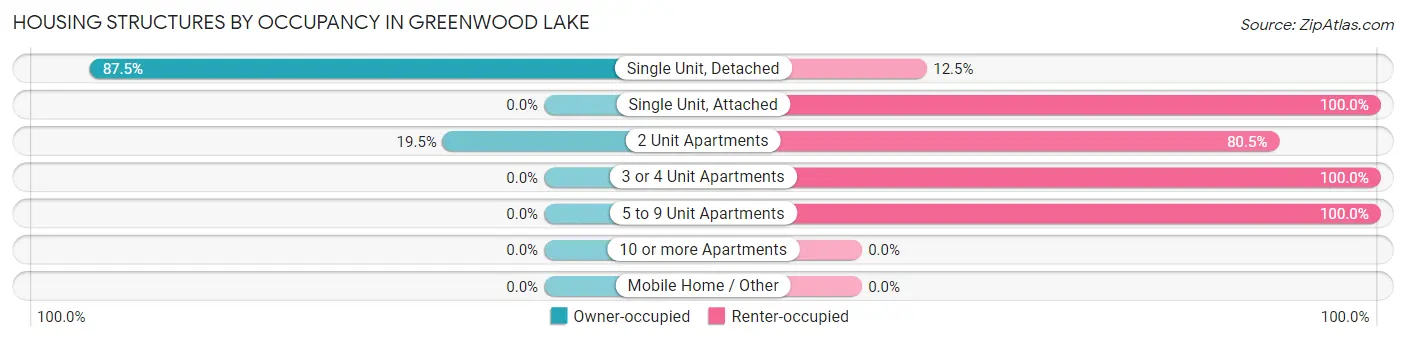
| Structure Type | Owner-occupied | Renter-occupied |
| Single Unit, Detached | 816 (87.5%) | 117 (12.5%) |
| Single Unit, Attached | 0 (0.0%) | 48 (100.0%) |
| 2 Unit Apartments | 8 (19.5%) | 33 (80.5%) |
| 3 or 4 Unit Apartments | 0 (0.0%) | 67 (100.0%) |
| 5 to 9 Unit Apartments | 0 (0.0%) | 25 (100.0%) |
| 10 or more Apartments | 0 (0.0%) | 0 (0.0%) |
| Mobile Home / Other | 0 (0.0%) | 0 (0.0%) |
| Total | 824 (74.0%) | 290 (26.0%) |
Housing Structures by Number of Rooms in Greenwood Lake
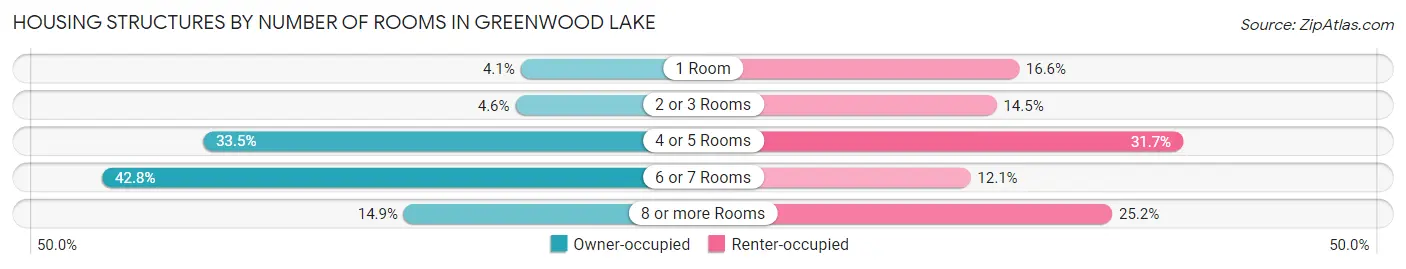
| Number of Rooms | Owner-occupied | Renter-occupied |
| 1 Room | 34 (4.1%) | 48 (16.6%) |
| 2 or 3 Rooms | 38 (4.6%) | 42 (14.5%) |
| 4 or 5 Rooms | 276 (33.5%) | 92 (31.7%) |
| 6 or 7 Rooms | 353 (42.8%) | 35 (12.1%) |
| 8 or more Rooms | 123 (14.9%) | 73 (25.2%) |
| Total | 824 (100.0%) | 290 (100.0%) |
Housing Structure by Heating Type in Greenwood Lake
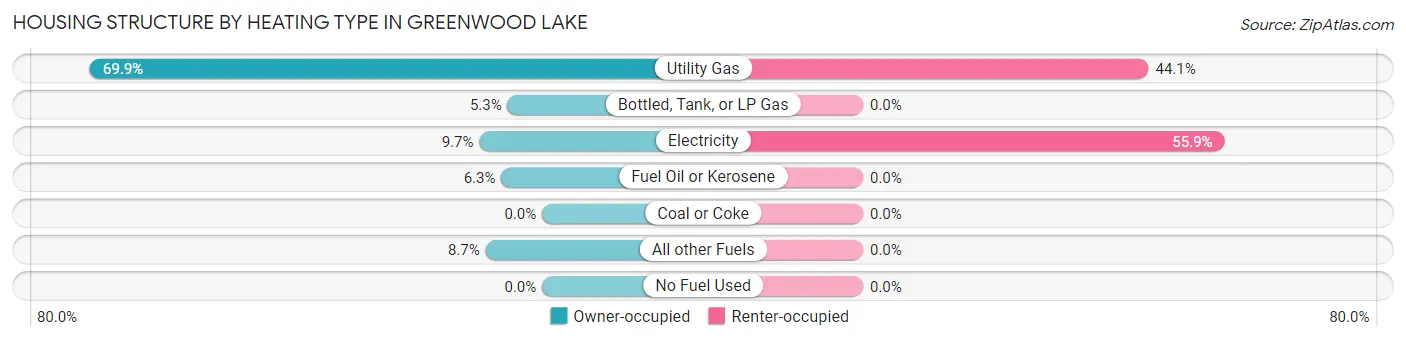
| Heating Type | Owner-occupied | Renter-occupied |
| Utility Gas | 576 (69.9%) | 128 (44.1%) |
| Bottled, Tank, or LP Gas | 44 (5.3%) | 0 (0.0%) |
| Electricity | 80 (9.7%) | 162 (55.9%) |
| Fuel Oil or Kerosene | 52 (6.3%) | 0 (0.0%) |
| Coal or Coke | 0 (0.0%) | 0 (0.0%) |
| All other Fuels | 72 (8.7%) | 0 (0.0%) |
| No Fuel Used | 0 (0.0%) | 0 (0.0%) |
| Total | 824 (100.0%) | 290 (100.0%) |
Household Vehicle Usage in Greenwood Lake
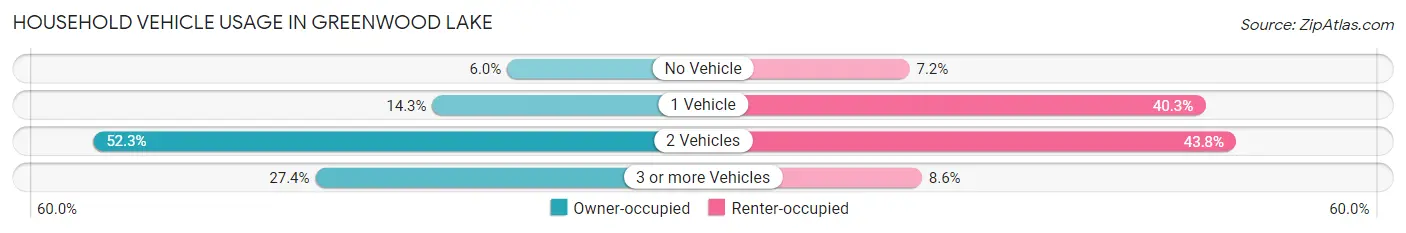
| Vehicles per Household | Owner-occupied | Renter-occupied |
| No Vehicle | 49 (5.9%) | 21 (7.2%) |
| 1 Vehicle | 118 (14.3%) | 117 (40.3%) |
| 2 Vehicles | 431 (52.3%) | 127 (43.8%) |
| 3 or more Vehicles | 226 (27.4%) | 25 (8.6%) |
| Total | 824 (100.0%) | 290 (100.0%) |
Real Estate & Mortgages in Greenwood Lake
Real Estate and Mortgage Overview in Greenwood Lake
| Characteristic | Without Mortgage | With Mortgage |
| Housing Units | 284 | 540 |
| Median Property Value | $330,200 | $275,500 |
| Median Household Income | $58,500 | $180 |
| Monthly Housing Costs | $900 | $194 |
| Real Estate Taxes | $6,462 | $22 |
Property Value by Mortgage Status in Greenwood Lake
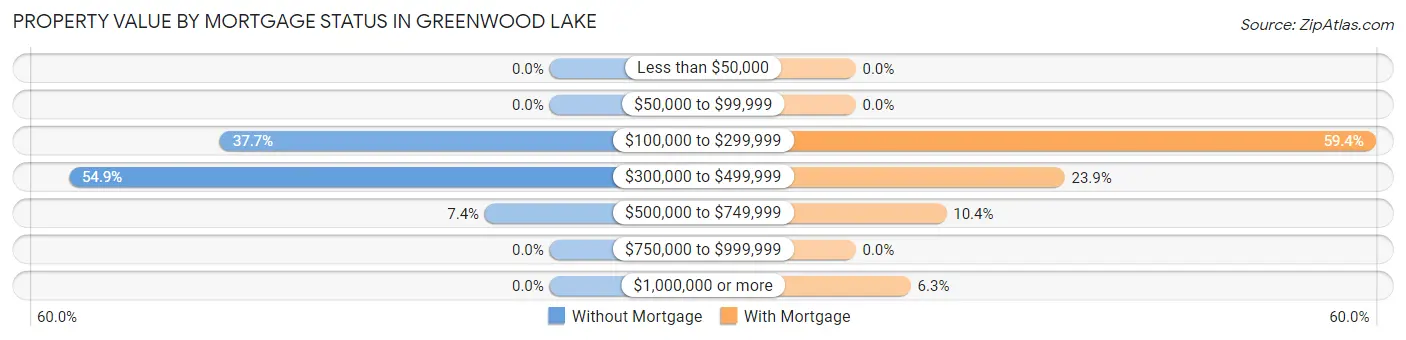
| Property Value | Without Mortgage | With Mortgage |
| Less than $50,000 | 0 (0.0%) | 0 (0.0%) |
| $50,000 to $99,999 | 0 (0.0%) | 0 (0.0%) |
| $100,000 to $299,999 | 107 (37.7%) | 321 (59.4%) |
| $300,000 to $499,999 | 156 (54.9%) | 129 (23.9%) |
| $500,000 to $749,999 | 21 (7.4%) | 56 (10.4%) |
| $750,000 to $999,999 | 0 (0.0%) | 0 (0.0%) |
| $1,000,000 or more | 0 (0.0%) | 34 (6.3%) |
| Total | 284 (100.0%) | 540 (100.0%) |
Household Income by Mortgage Status in Greenwood Lake
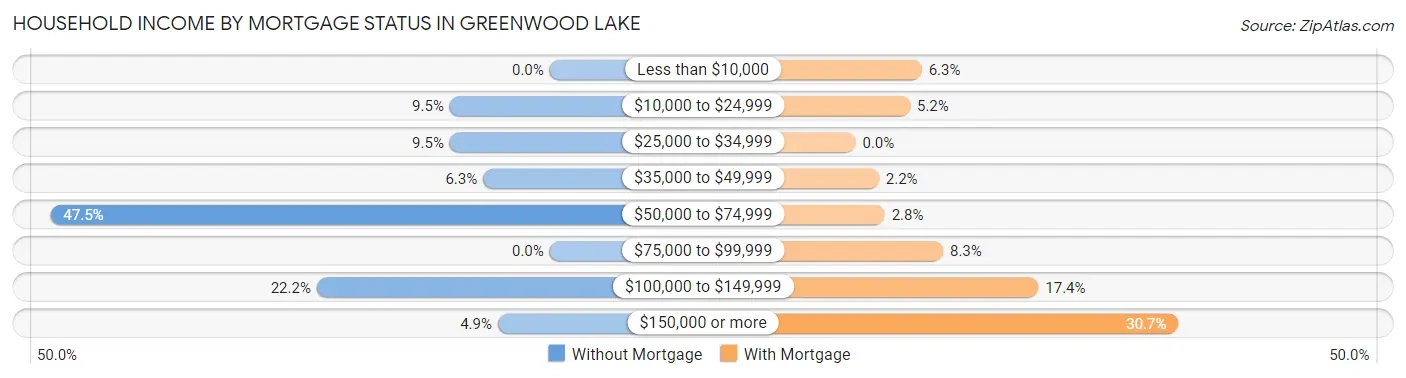
| Household Income | Without Mortgage | With Mortgage |
| Less than $10,000 | 0 (0.0%) | 34 (6.3%) |
| $10,000 to $24,999 | 27 (9.5%) | 28 (5.2%) |
| $25,000 to $34,999 | 27 (9.5%) | 0 (0.0%) |
| $35,000 to $49,999 | 18 (6.3%) | 12 (2.2%) |
| $50,000 to $74,999 | 135 (47.5%) | 15 (2.8%) |
| $75,000 to $99,999 | 0 (0.0%) | 45 (8.3%) |
| $100,000 to $149,999 | 63 (22.2%) | 94 (17.4%) |
| $150,000 or more | 14 (4.9%) | 166 (30.7%) |
| Total | 284 (100.0%) | 540 (100.0%) |
Property Value to Household Income Ratio in Greenwood Lake
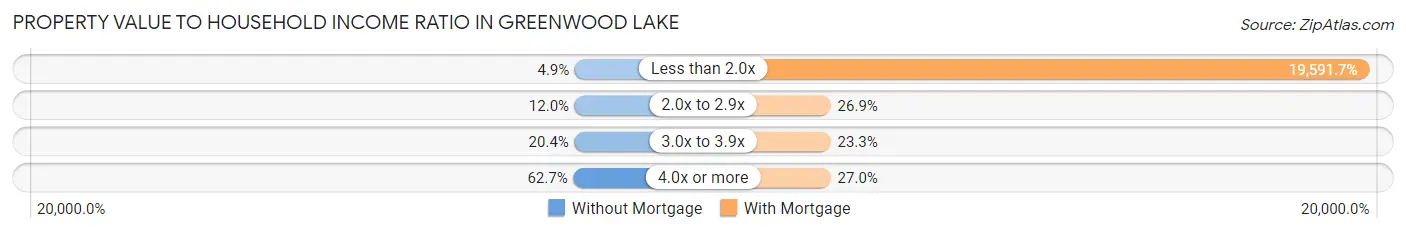
| Value-to-Income Ratio | Without Mortgage | With Mortgage |
| Less than 2.0x | 14 (4.9%) | 105,795 (19,591.7%) |
| 2.0x to 2.9x | 34 (12.0%) | 145 (26.9%) |
| 3.0x to 3.9x | 58 (20.4%) | 126 (23.3%) |
| 4.0x or more | 178 (62.7%) | 146 (27.0%) |
| Total | 284 (100.0%) | 540 (100.0%) |
Real Estate Taxes by Mortgage Status in Greenwood Lake
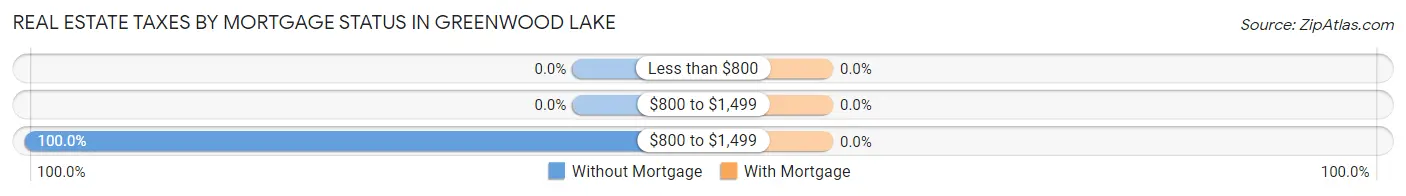
| Property Taxes | Without Mortgage | With Mortgage |
| Less than $800 | 0 (0.0%) | 0 (0.0%) |
| $800 to $1,499 | 0 (0.0%) | 0 (0.0%) |
| $800 to $1,499 | 284 (100.0%) | 0 (0.0%) |
| Total | 284 (100.0%) | 540 (100.0%) |
Health & Disability in Greenwood Lake
Health Insurance Coverage by Age in Greenwood Lake
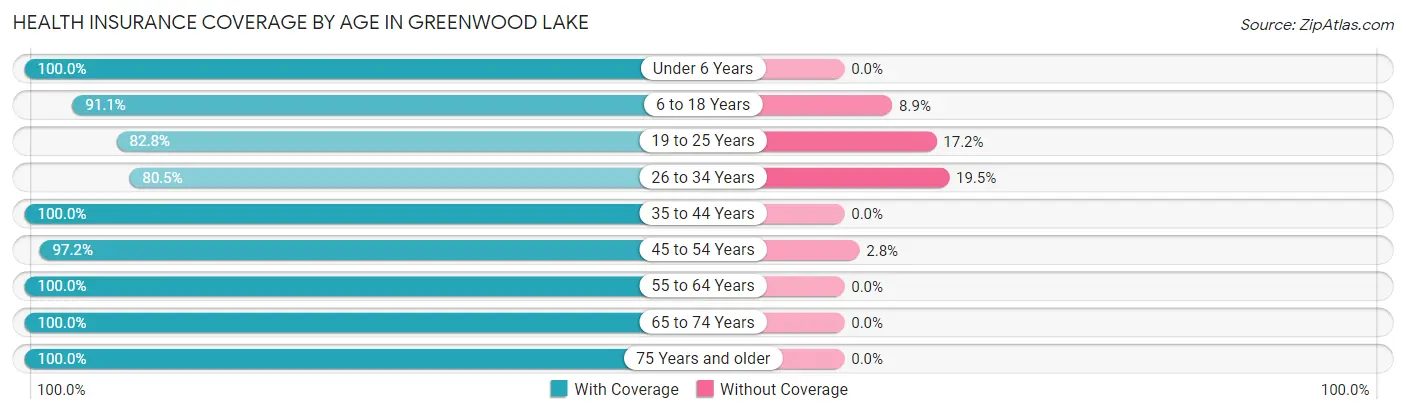
| Age Bracket | With Coverage | Without Coverage |
| Under 6 Years | 132 (100.0%) | 0 (0.0%) |
| 6 to 18 Years | 531 (91.1%) | 52 (8.9%) |
| 19 to 25 Years | 82 (82.8%) | 17 (17.2%) |
| 26 to 34 Years | 449 (80.5%) | 109 (19.5%) |
| 35 to 44 Years | 321 (100.0%) | 0 (0.0%) |
| 45 to 54 Years | 381 (97.2%) | 11 (2.8%) |
| 55 to 64 Years | 419 (100.0%) | 0 (0.0%) |
| 65 to 74 Years | 404 (100.0%) | 0 (0.0%) |
| 75 Years and older | 119 (100.0%) | 0 (0.0%) |
| Total | 2,838 (93.8%) | 189 (6.2%) |
Health Insurance Coverage by Citizenship Status in Greenwood Lake
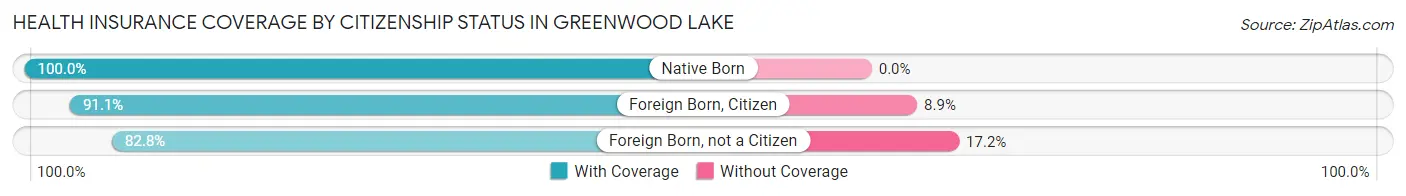
| Citizenship Status | With Coverage | Without Coverage |
| Native Born | 132 (100.0%) | 0 (0.0%) |
| Foreign Born, Citizen | 531 (91.1%) | 52 (8.9%) |
| Foreign Born, not a Citizen | 82 (82.8%) | 17 (17.2%) |
Health Insurance Coverage by Household Income in Greenwood Lake
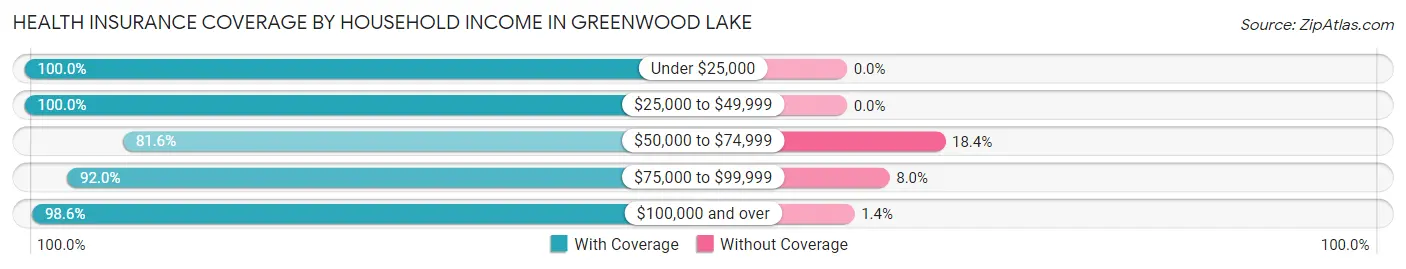
| Household Income | With Coverage | Without Coverage |
| Under $25,000 | 373 (100.0%) | 0 (0.0%) |
| $25,000 to $49,999 | 237 (100.0%) | 0 (0.0%) |
| $50,000 to $74,999 | 603 (81.6%) | 136 (18.4%) |
| $75,000 to $99,999 | 416 (92.0%) | 36 (8.0%) |
| $100,000 and over | 1,209 (98.6%) | 17 (1.4%) |
Public vs Private Health Insurance Coverage by Age in Greenwood Lake
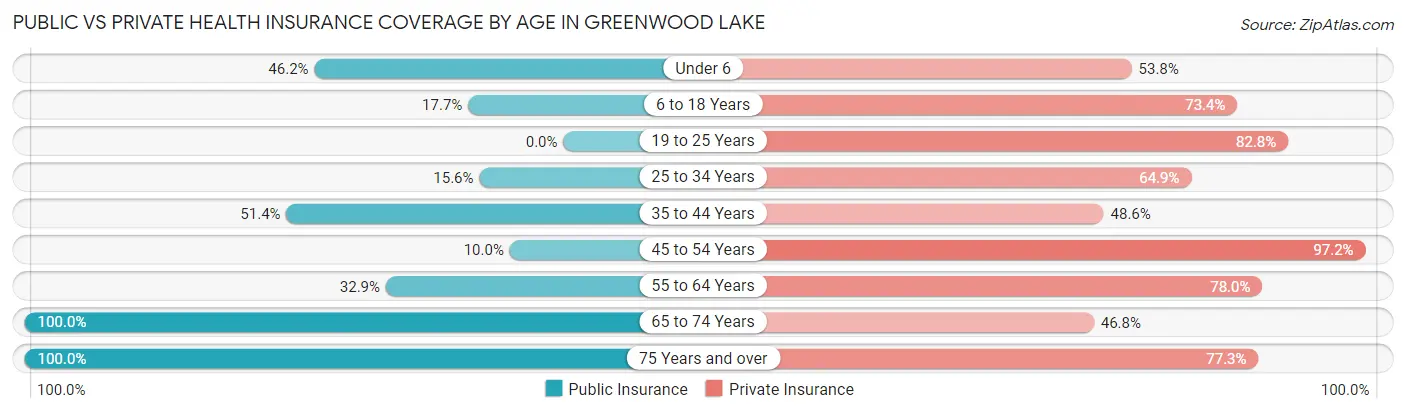
| Age Bracket | Public Insurance | Private Insurance |
| Under 6 | 61 (46.2%) | 71 (53.8%) |
| 6 to 18 Years | 103 (17.7%) | 428 (73.4%) |
| 19 to 25 Years | 0 (0.0%) | 82 (82.8%) |
| 25 to 34 Years | 87 (15.6%) | 362 (64.9%) |
| 35 to 44 Years | 165 (51.4%) | 156 (48.6%) |
| 45 to 54 Years | 39 (10.0%) | 381 (97.2%) |
| 55 to 64 Years | 138 (32.9%) | 327 (78.0%) |
| 65 to 74 Years | 404 (100.0%) | 189 (46.8%) |
| 75 Years and over | 119 (100.0%) | 92 (77.3%) |
| Total | 1,116 (36.9%) | 2,088 (69.0%) |
Disability Status by Sex by Age in Greenwood Lake
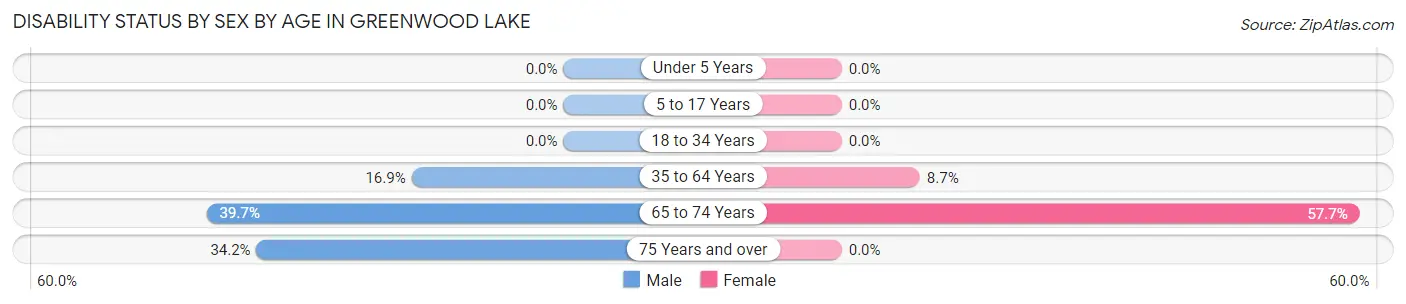
| Age Bracket | Male | Female |
| Under 5 Years | 0 (0.0%) | 0 (0.0%) |
| 5 to 17 Years | 0 (0.0%) | 0 (0.0%) |
| 18 to 34 Years | 0 (0.0%) | 0 (0.0%) |
| 35 to 64 Years | 104 (16.9%) | 45 (8.7%) |
| 65 to 74 Years | 93 (39.7%) | 98 (57.7%) |
| 75 Years and over | 27 (34.2%) | 0 (0.0%) |
Disability Class by Sex by Age in Greenwood Lake
Disability Class: Hearing Difficulty
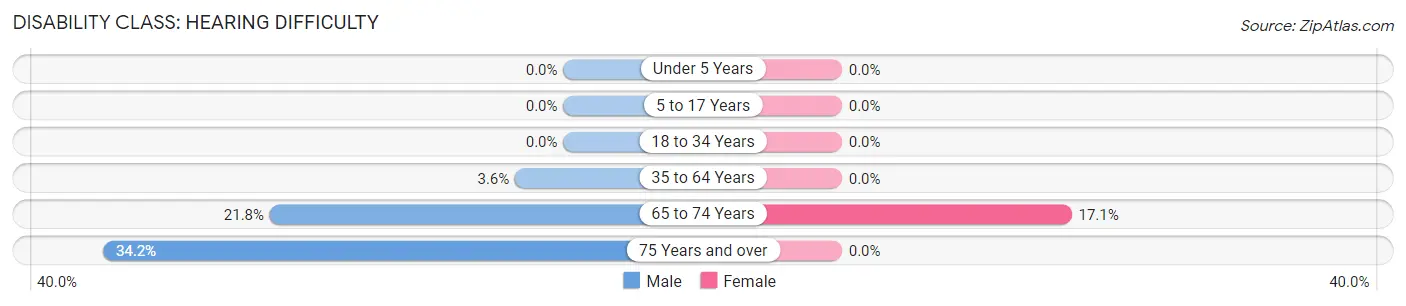
| Age Bracket | Male | Female |
| Under 5 Years | 0 (0.0%) | 0 (0.0%) |
| 5 to 17 Years | 0 (0.0%) | 0 (0.0%) |
| 18 to 34 Years | 0 (0.0%) | 0 (0.0%) |
| 35 to 64 Years | 22 (3.6%) | 0 (0.0%) |
| 65 to 74 Years | 51 (21.8%) | 29 (17.1%) |
| 75 Years and over | 27 (34.2%) | 0 (0.0%) |
Disability Class: Vision Difficulty
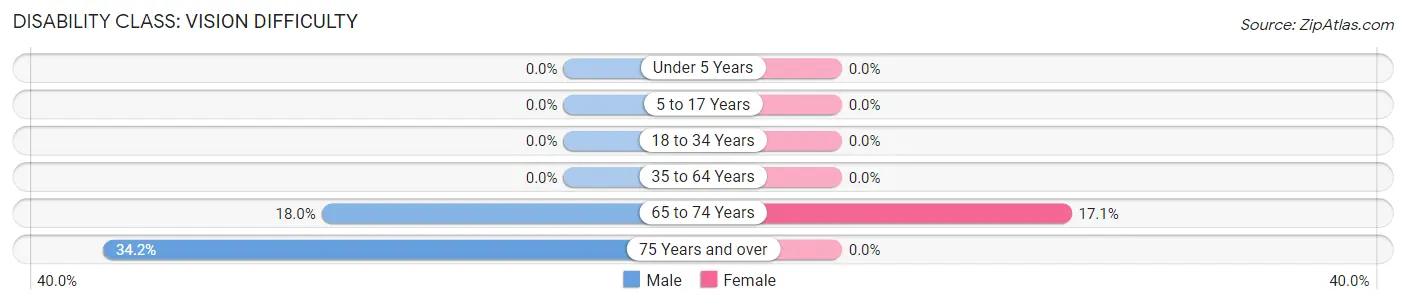
| Age Bracket | Male | Female |
| Under 5 Years | 0 (0.0%) | 0 (0.0%) |
| 5 to 17 Years | 0 (0.0%) | 0 (0.0%) |
| 18 to 34 Years | 0 (0.0%) | 0 (0.0%) |
| 35 to 64 Years | 0 (0.0%) | 0 (0.0%) |
| 65 to 74 Years | 42 (17.9%) | 29 (17.1%) |
| 75 Years and over | 27 (34.2%) | 0 (0.0%) |
Disability Class: Cognitive Difficulty
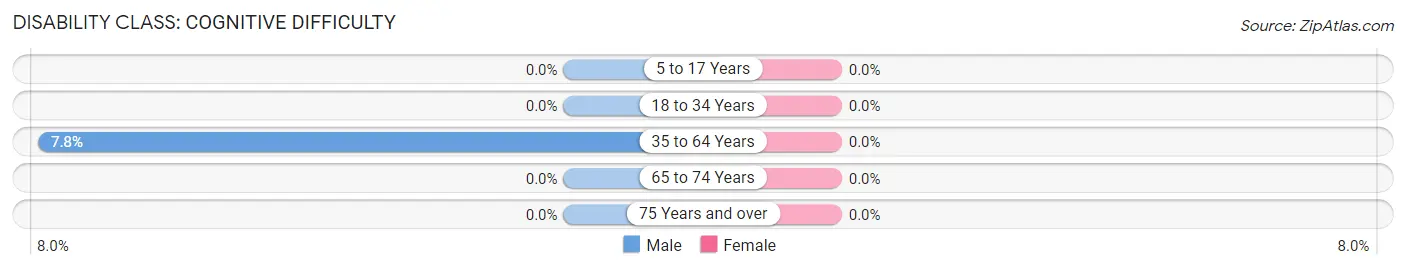
| Age Bracket | Male | Female |
| 5 to 17 Years | 0 (0.0%) | 0 (0.0%) |
| 18 to 34 Years | 0 (0.0%) | 0 (0.0%) |
| 35 to 64 Years | 48 (7.8%) | 0 (0.0%) |
| 65 to 74 Years | 0 (0.0%) | 0 (0.0%) |
| 75 Years and over | 0 (0.0%) | 0 (0.0%) |
Disability Class: Ambulatory Difficulty
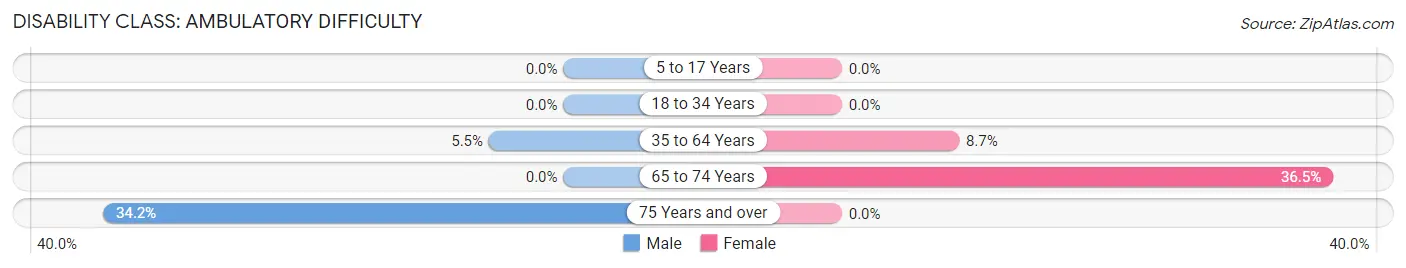
| Age Bracket | Male | Female |
| 5 to 17 Years | 0 (0.0%) | 0 (0.0%) |
| 18 to 34 Years | 0 (0.0%) | 0 (0.0%) |
| 35 to 64 Years | 34 (5.5%) | 45 (8.7%) |
| 65 to 74 Years | 0 (0.0%) | 62 (36.5%) |
| 75 Years and over | 27 (34.2%) | 0 (0.0%) |
Disability Class: Self-Care Difficulty
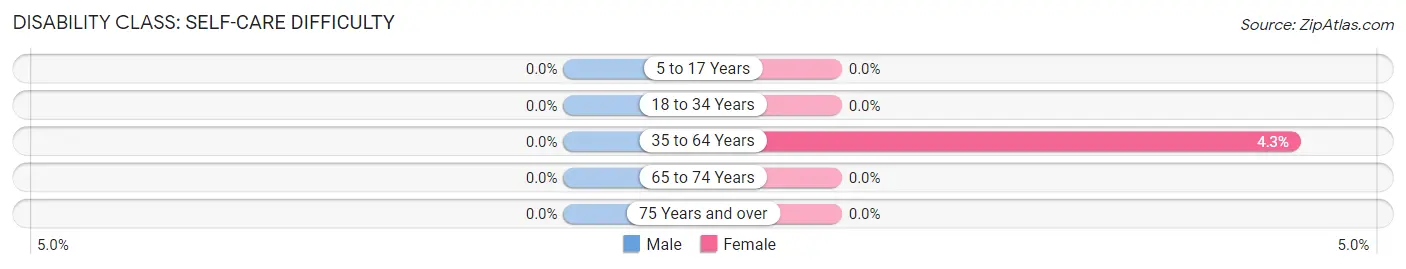
| Age Bracket | Male | Female |
| 5 to 17 Years | 0 (0.0%) | 0 (0.0%) |
| 18 to 34 Years | 0 (0.0%) | 0 (0.0%) |
| 35 to 64 Years | 0 (0.0%) | 22 (4.3%) |
| 65 to 74 Years | 0 (0.0%) | 0 (0.0%) |
| 75 Years and over | 0 (0.0%) | 0 (0.0%) |
Technology Access in Greenwood Lake
Computing Device Access in Greenwood Lake
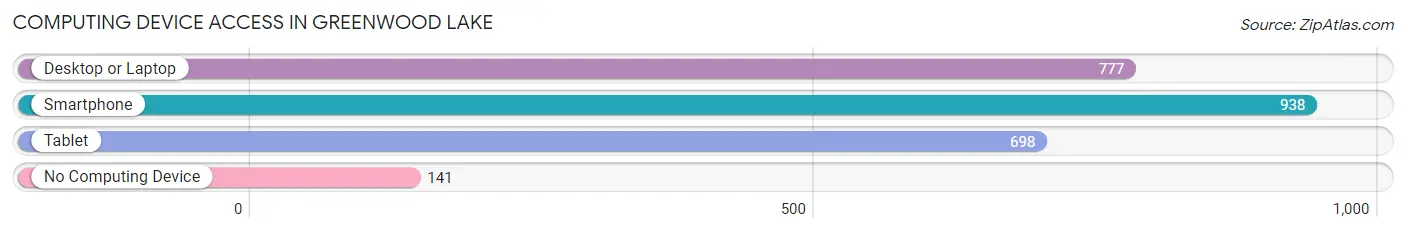
| Device Type | # Households | % Households |
| Desktop or Laptop | 777 | 69.8% |
| Smartphone | 938 | 84.2% |
| Tablet | 698 | 62.7% |
| No Computing Device | 141 | 12.7% |
| Total | 1,114 | 100.0% |
Internet Access in Greenwood Lake
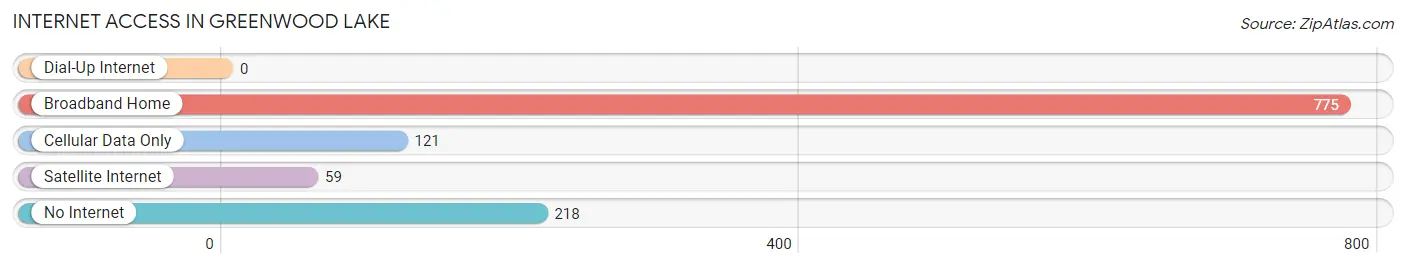
| Internet Type | # Households | % Households |
| Dial-Up Internet | 0 | 0.0% |
| Broadband Home | 775 | 69.6% |
| Cellular Data Only | 121 | 10.9% |
| Satellite Internet | 59 | 5.3% |
| No Internet | 218 | 19.6% |
| Total | 1,114 | 100.0% |
Greenwood Lake Summary
Greenwood Lake is a village located in Orange County, New York, United States. It is situated in the foothills of the Catskill Mountains, and is part of the Town of Warwick. The village is located on the western shore of Greenwood Lake, a 9-mile long lake that straddles the New York-New Jersey border. The village has a population of approximately 3,400 people, and is a popular tourist destination.
Geography
Greenwood Lake is located at 41°17'N 74°20'W (41.28, -74.33). According to the United States Census Bureau, the village has a total area of 2.2 square miles (5.7 km2), of which 1.9 square miles (4.9 km2) is land and 0.3 square miles (0.8 km2) is water.
The village is situated on the western shore of Greenwood Lake, a 9-mile long lake that straddles the New York-New Jersey border. The lake is fed by several small streams, including the Wanaque River, which flows from New Jersey into the lake. The lake is a popular destination for fishing, boating, and swimming.
History
Greenwood Lake was originally inhabited by the Munsee Indians, a branch of the Lenape tribe. The area was first settled by Europeans in the late 17th century, and the village was officially incorporated in 1858.
The village was originally known as Long Pond, and was renamed Greenwood Lake in 1873. The name was chosen to reflect the lake’s beauty and the surrounding forests.
The village was a popular resort destination in the late 19th and early 20th centuries, and was home to several large hotels. The village was also home to a number of summer camps, including Camp Wawayanda, which was founded in 1891.
Economy
Greenwood Lake’s economy is largely based on tourism. The village is home to several hotels, restaurants, and other tourist attractions. The village is also home to several marinas, which offer boat rentals and other services.
The village is also home to several small businesses, including a number of antique shops. The village is also home to a number of artists and craftspeople, who sell their work at local galleries and shops.
Demographics
As of the 2010 census, there were 3,400 people, 1,400 households, and 890 families residing in the village. The population density was 1,741.7 people per square mile (671.7/km2). There were 1,541 housing units at an average density of 801.3 per square mile (309.3/km2). The racial makeup of the village was 94.2% White, 1.2% African American, 0.3% Native American, 1.2% Asian, 0.1% Pacific Islander, 1.2% from other races, and 2.0% from two or more races. Hispanic or Latino of any race were 5.2% of the population.
There were 1,400 households, out of which 28.6% had children under the age of 18 living with them, 48.1% were married couples living together, 11.1% had a female householder with no husband present, and 36.6% were non-families. 30.6% of all households were made up of individuals, and 11.9% had someone living alone who was 65 years of age or older. The average household size was 2.41 and the average family size was 3.02.
In the village, the population was spread out, with 23.2% under the age of 18, 6.7% from 18 to 24, 28.2% from 25 to 44, 25.2% from 45 to 64, and 16.7% who were 65 years of age or older. The median age was 40 years. For every 100 females, there were 95.2 males. For every 100 females age 18 and over, there were 92.2 males.
The median income for a household in the village was $50,000, and the median income for a family was $60,000. Males had a median income of $41,000 versus $30,000 for females. The per capita income for the village was $25,000. About 5.2% of families and 7.2% of the population were below the poverty line, including 8.2% of those under age 18 and 5.2% of those age 65 or over.
Common Questions
What is Per Capita Income in Greenwood Lake?
Per Capita income in Greenwood Lake is $36,794.
What is the Median Family Income in Greenwood Lake?
Median Family Income in Greenwood Lake is $100,399.
What is the Median Household income in Greenwood Lake?
Median Household Income in Greenwood Lake is $79,261.
What is Income or Wage Gap in Greenwood Lake?
Income or Wage Gap in Greenwood Lake is 39.6%.
Women in Greenwood Lake earn 60.4 cents for every dollar earned by a man.
What is Inequality or Gini Index in Greenwood Lake?
Inequality or Gini Index in Greenwood Lake is 0.39.
What is the Total Population of Greenwood Lake?
Total Population of Greenwood Lake is 3,027.
What is the Total Male Population of Greenwood Lake?
Total Male Population of Greenwood Lake is 1,532.
What is the Total Female Population of Greenwood Lake?
Total Female Population of Greenwood Lake is 1,495.
What is the Ratio of Males per 100 Females in Greenwood Lake?
There are 102.47 Males per 100 Females in Greenwood Lake.
What is the Ratio of Females per 100 Males in Greenwood Lake?
There are 97.58 Females per 100 Males in Greenwood Lake.
What is the Median Population Age in Greenwood Lake?
Median Population Age in Greenwood Lake is 37.9 Years.
What is the Average Family Size in Greenwood Lake
Average Family Size in Greenwood Lake is 3.4 People.
What is the Average Household Size in Greenwood Lake
Average Household Size in Greenwood Lake is 2.7 People.
How Large is the Labor Force in Greenwood Lake?
There are 1,396 People in the Labor Forcein in Greenwood Lake.
What is the Percentage of People in the Labor Force in Greenwood Lake?
56.6% of People are in the Labor Force in Greenwood Lake.
What is the Unemployment Rate in Greenwood Lake?
Unemployment Rate in Greenwood Lake is 4.7%.