Eastchester, NY Map & Demographics
Eastchester Map
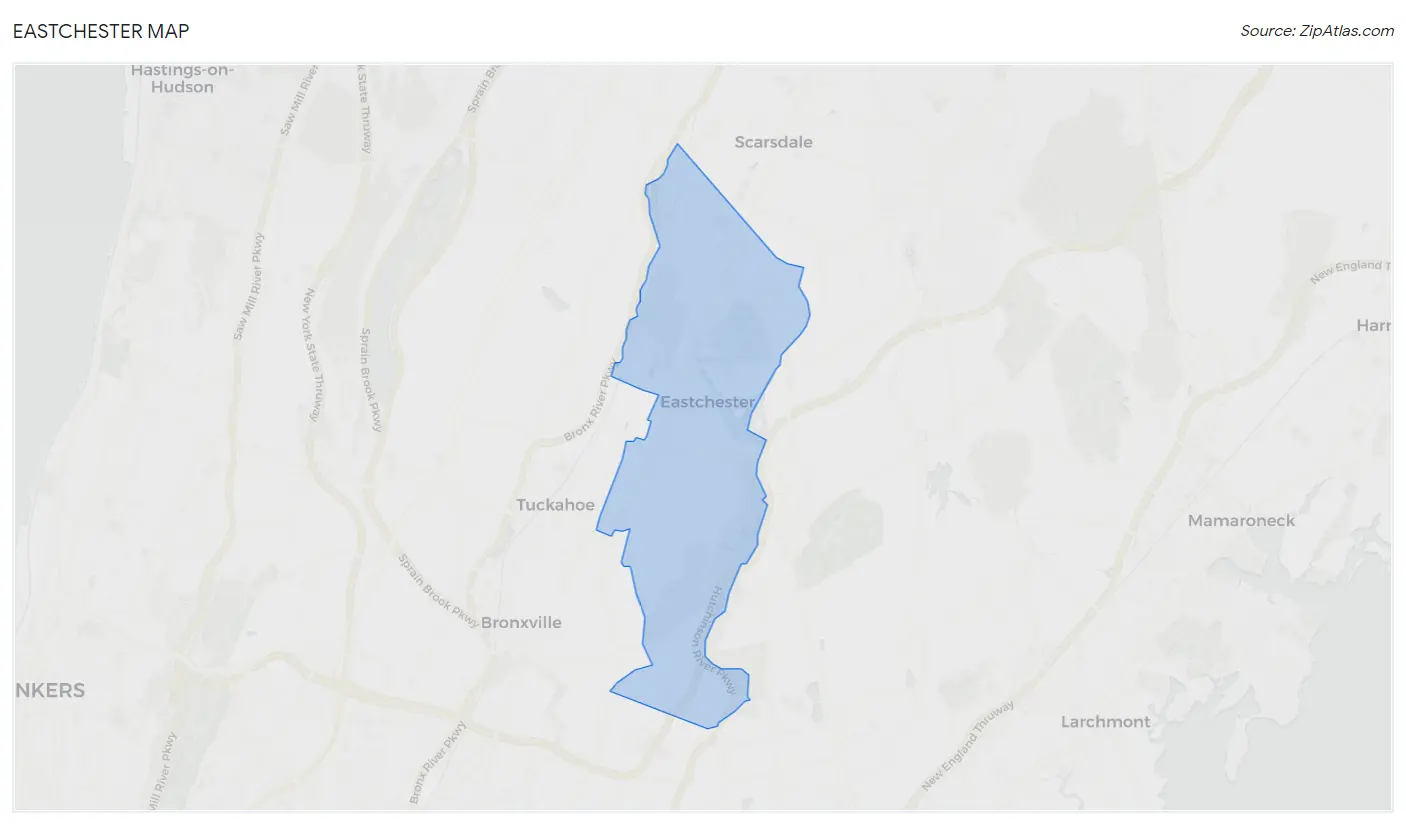
Eastchester Overview
$80,902
PER CAPITA INCOME
$217,375
AVG FAMILY INCOME
$153,482
AVG HOUSEHOLD INCOME
34.1%
WAGE / INCOME GAP [ % ]
65.9¢/ $1
WAGE / INCOME GAP [ $ ]
$13,101
FAMILY INCOME DEFICIT
0.48
INEQUALITY / GINI INDEX
20,633
TOTAL POPULATION
9,817
MALE POPULATION
10,816
FEMALE POPULATION
90.76
MALES / 100 FEMALES
110.18
FEMALES / 100 MALES
44.1
MEDIAN AGE
3.4
AVG FAMILY SIZE
2.6
AVG HOUSEHOLD SIZE
10,365
LABOR FORCE [ PEOPLE ]
62.5%
PERCENT IN LABOR FORCE
3.2%
UNEMPLOYMENT RATE
Eastchester Zip Codes
Eastchester Area Codes
Income in Eastchester
Income Overview in Eastchester
Per Capita Income in Eastchester is $80,902, while median incomes of families and households are $217,375 and $153,482 respectively.
| Characteristic | Number | Measure |
| Per Capita Income | 20,633 | $80,902 |
| Median Family Income | 5,297 | $217,375 |
| Mean Family Income | 5,297 | $259,987 |
| Median Household Income | 7,821 | $153,482 |
| Mean Household Income | 7,821 | $204,429 |
| Income Deficit | 5,297 | $13,101 |
| Wage / Income Gap (%) | 20,633 | 34.11% |
| Wage / Income Gap ($) | 20,633 | 65.89¢ per $1 |
| Gini / Inequality Index | 20,633 | 0.48 |
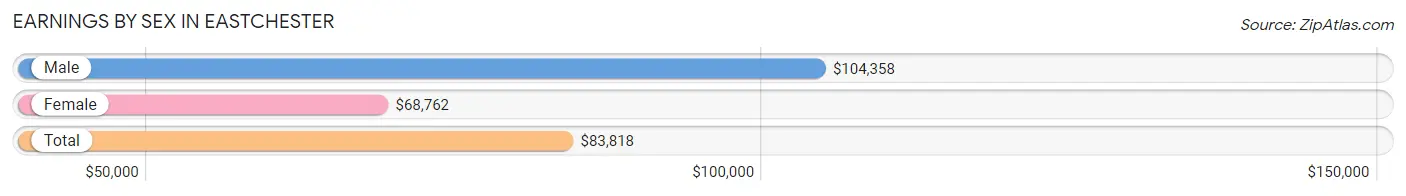
Earnings by Sex in Eastchester
Average Earnings in Eastchester are $83,818, $104,358 for men and $68,762 for women, a difference of 34.1%.
| Sex | Number | Average Earnings |
| Male | 5,609 (50.6%) | $104,358 |
| Female | 5,469 (49.4%) | $68,762 |
| Total | 11,078 (100.0%) | $83,818 |
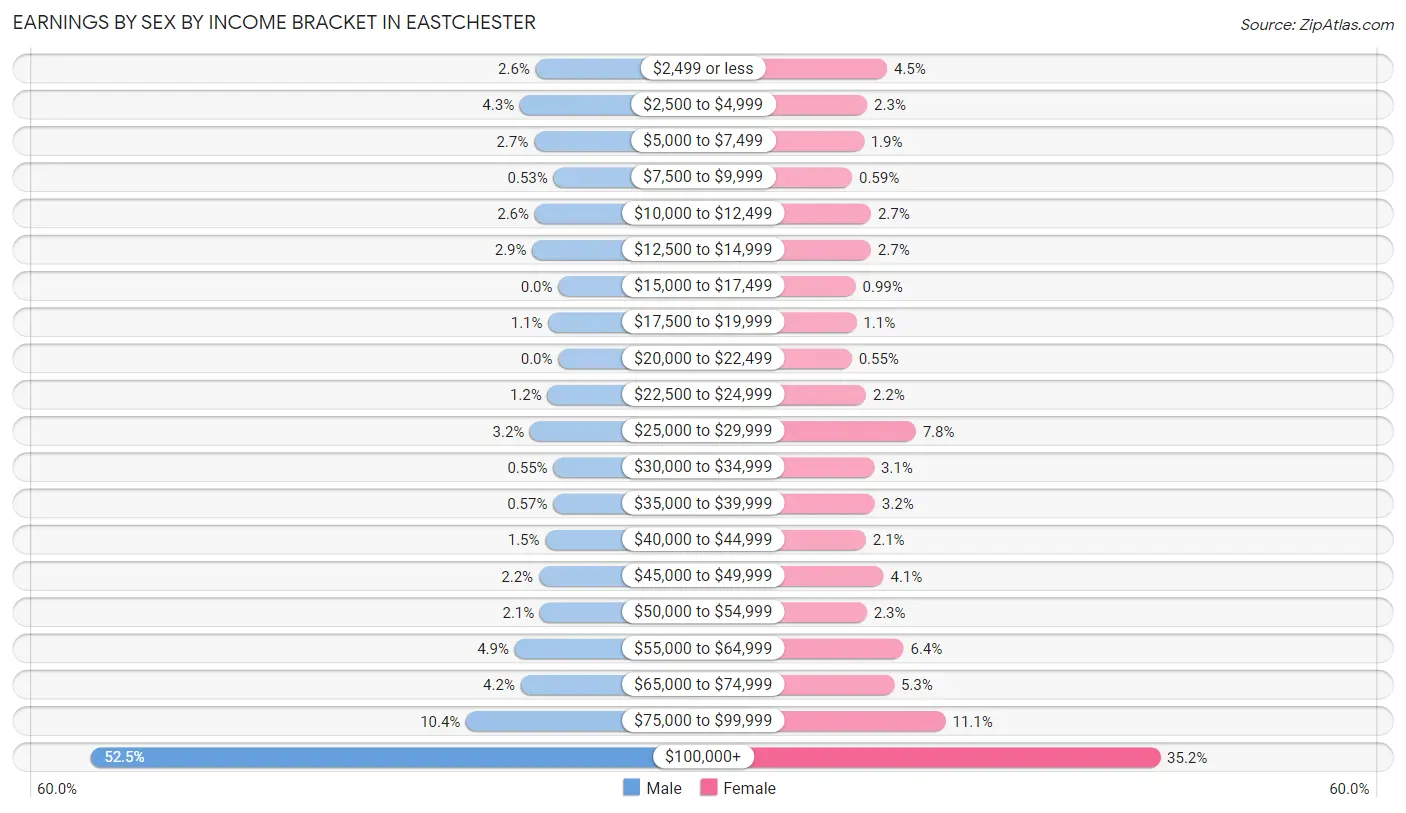
Earnings by Sex by Income Bracket in Eastchester
The most common earnings brackets in Eastchester are $100,000+ for men (2,945 | 52.5%) and $100,000+ for women (1,926 | 35.2%).
| Income | Male | Female |
| $2,499 or less | 143 (2.5%) | 247 (4.5%) |
| $2,500 to $4,999 | 242 (4.3%) | 125 (2.3%) |
| $5,000 to $7,499 | 153 (2.7%) | 104 (1.9%) |
| $7,500 to $9,999 | 30 (0.5%) | 32 (0.6%) |
| $10,000 to $12,499 | 148 (2.6%) | 149 (2.7%) |
| $12,500 to $14,999 | 164 (2.9%) | 148 (2.7%) |
| $15,000 to $17,499 | 0 (0.0%) | 54 (1.0%) |
| $17,500 to $19,999 | 63 (1.1%) | 59 (1.1%) |
| $20,000 to $22,499 | 0 (0.0%) | 30 (0.5%) |
| $22,500 to $24,999 | 68 (1.2%) | 118 (2.2%) |
| $25,000 to $29,999 | 178 (3.2%) | 424 (7.7%) |
| $30,000 to $34,999 | 31 (0.5%) | 168 (3.1%) |
| $35,000 to $39,999 | 32 (0.6%) | 173 (3.2%) |
| $40,000 to $44,999 | 82 (1.5%) | 117 (2.1%) |
| $45,000 to $49,999 | 122 (2.2%) | 226 (4.1%) |
| $50,000 to $54,999 | 115 (2.1%) | 123 (2.2%) |
| $55,000 to $64,999 | 275 (4.9%) | 349 (6.4%) |
| $65,000 to $74,999 | 237 (4.2%) | 290 (5.3%) |
| $75,000 to $99,999 | 581 (10.4%) | 607 (11.1%) |
| $100,000+ | 2,945 (52.5%) | 1,926 (35.2%) |
| Total | 5,609 (100.0%) | 5,469 (100.0%) |
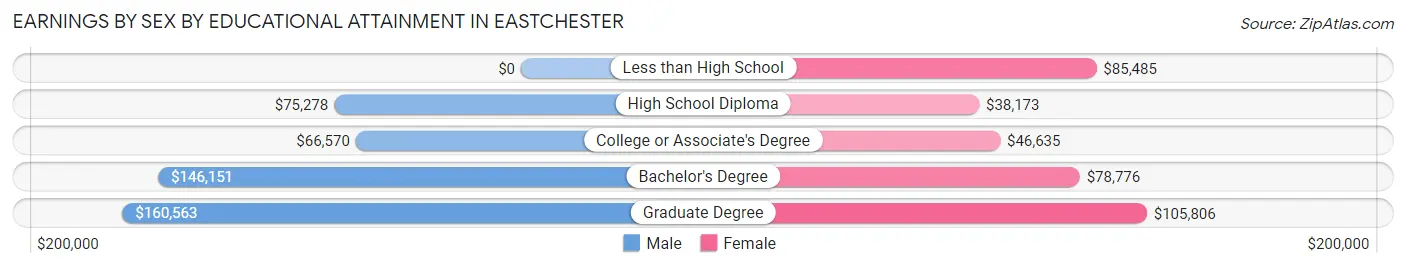
Earnings by Sex by Educational Attainment in Eastchester
Average earnings in Eastchester are $129,450 for men and $79,002 for women, a difference of 39.0%. Men with an educational attainment of graduate degree enjoy the highest average annual earnings of $160,563, while those with college or associate's degree education earn the least with $66,570. Women with an educational attainment of graduate degree earn the most with the average annual earnings of $105,806, while those with high school diploma education have the smallest earnings of $38,173.
| Educational Attainment | Male Income | Female Income |
| Less than High School | - | - |
| High School Diploma | $75,278 | $38,173 |
| College or Associate's Degree | $66,570 | $46,635 |
| Bachelor's Degree | $146,151 | $78,776 |
| Graduate Degree | $160,563 | $105,806 |
| Total | $129,450 | $79,002 |
Family Income in Eastchester
Family Income Brackets in Eastchester
According to the Eastchester family income data, there are 2,839 families falling into the $200,000+ income range, which is the most common income bracket and makes up 53.6% of all families. Conversely, the $10,000 to $14,999 income bracket is the least frequent group with only 11 families (0.2%) belonging to this category.
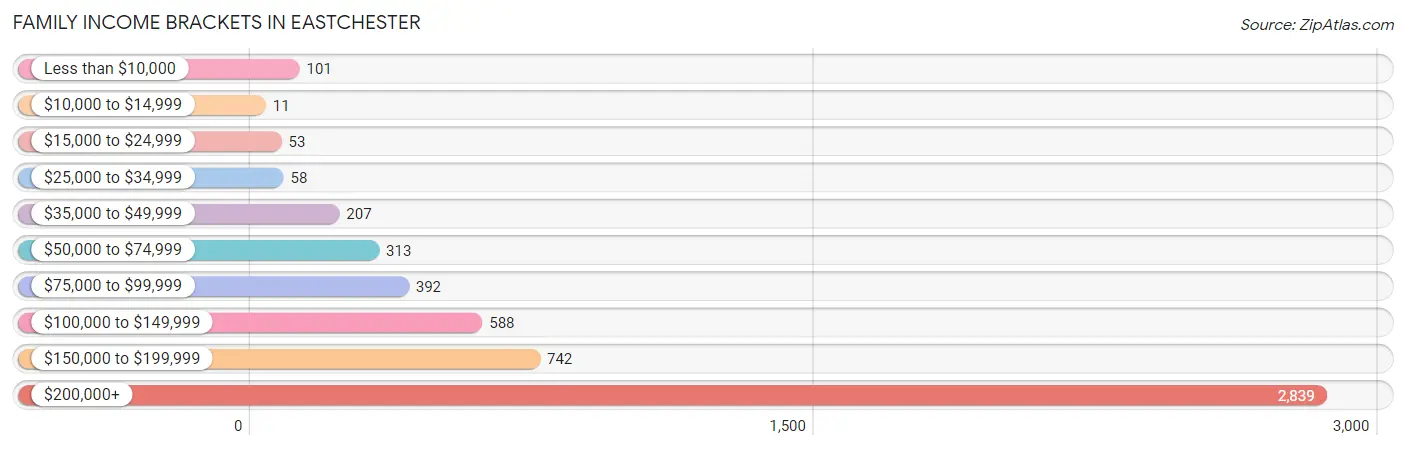
| Income Bracket | # Families | % Families |
| Less than $10,000 | 101 | 1.9% |
| $10,000 to $14,999 | 11 | 0.2% |
| $15,000 to $24,999 | 53 | 1.0% |
| $25,000 to $34,999 | 58 | 1.1% |
| $35,000 to $49,999 | 207 | 3.9% |
| $50,000 to $74,999 | 313 | 5.9% |
| $75,000 to $99,999 | 392 | 7.4% |
| $100,000 to $149,999 | 588 | 11.1% |
| $150,000 to $199,999 | 742 | 14.0% |
| $200,000+ | 2,839 | 53.6% |
Family Income by Famaliy Size in Eastchester
3-person families (1,242 | 23.4%) account for the highest median family income in Eastchester with $250,001 per family, while 3-person families (1,242 | 23.4%) have the highest median income of $83,334 per family member.
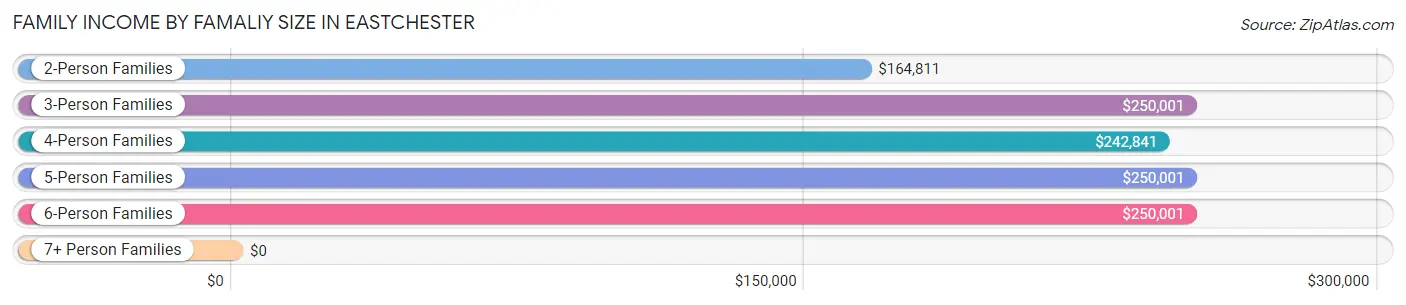
| Income Bracket | # Families | Median Income |
| 2-Person Families | 2,013 (38.0%) | $164,811 |
| 3-Person Families | 1,242 (23.4%) | $250,001 |
| 4-Person Families | 1,345 (25.4%) | $242,841 |
| 5-Person Families | 583 (11.0%) | $250,001 |
| 6-Person Families | 92 (1.7%) | $250,001 |
| 7+ Person Families | 22 (0.4%) | $0 |
| Total | 5,297 (100.0%) | $217,375 |
Family Income by Number of Earners in Eastchester
The median family income in Eastchester is $217,375, with families comprising 3+ earners (730) having the highest median family income of $250,001, while families with no earners (633) have the lowest median family income of $105,417, accounting for 13.8% and 11.9% of families, respectively.
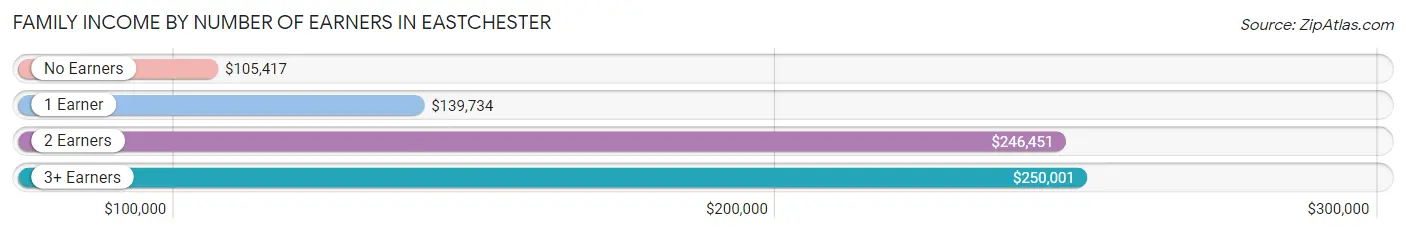
| Number of Earners | # Families | Median Income |
| No Earners | 633 (11.9%) | $105,417 |
| 1 Earner | 1,287 (24.3%) | $139,734 |
| 2 Earners | 2,647 (50.0%) | $246,451 |
| 3+ Earners | 730 (13.8%) | $250,001 |
| Total | 5,297 (100.0%) | $217,375 |
Household Income in Eastchester
Household Income Brackets in Eastchester
With 3,042 households falling in the category, the $200,000+ income range is the most frequent in Eastchester, accounting for 38.9% of all households. In contrast, only 133 households (1.7%) fall into the $10,000 to $14,999 income bracket, making it the least populous group.
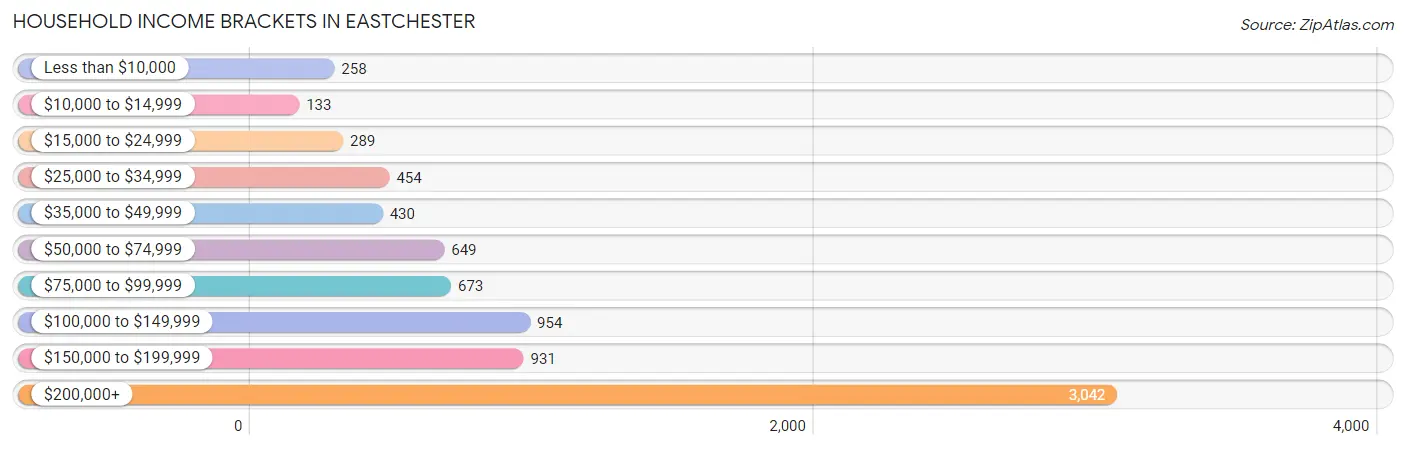
| Income Bracket | # Households | % Households |
| Less than $10,000 | 258 | 3.3% |
| $10,000 to $14,999 | 133 | 1.7% |
| $15,000 to $24,999 | 289 | 3.7% |
| $25,000 to $34,999 | 454 | 5.8% |
| $35,000 to $49,999 | 430 | 5.5% |
| $50,000 to $74,999 | 649 | 8.3% |
| $75,000 to $99,999 | 673 | 8.6% |
| $100,000 to $149,999 | 954 | 12.2% |
| $150,000 to $199,999 | 931 | 11.9% |
| $200,000+ | 3,042 | 38.9% |
Household Income by Householder Age in Eastchester
The median household income in Eastchester is $153,482, with the highest median household income of $242,935 found in the 25 to 44 years age bracket for the primary householder. A total of 1,766 households (22.6%) fall into this category. Meanwhile, the 15 to 24 years age bracket for the primary householder has the lowest median household income of $0, with 13 households (0.2%) in this group.
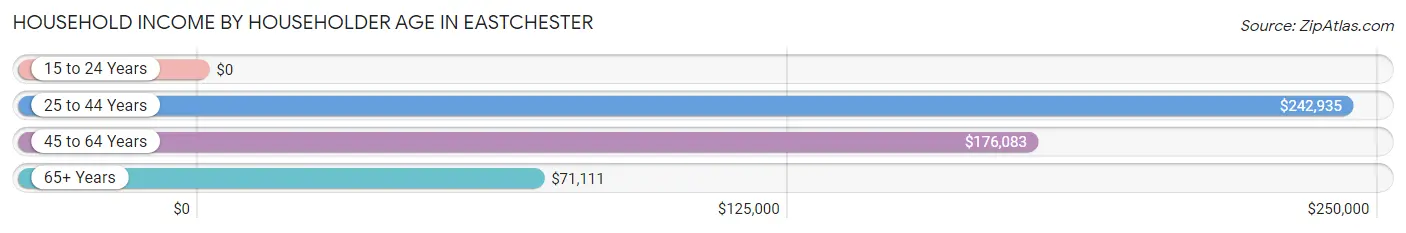
| Income Bracket | # Households | Median Income |
| 15 to 24 Years | 13 (0.2%) | $0 |
| 25 to 44 Years | 1,766 (22.6%) | $242,935 |
| 45 to 64 Years | 3,226 (41.2%) | $176,083 |
| 65+ Years | 2,816 (36.0%) | $71,111 |
| Total | 7,821 (100.0%) | $153,482 |
Poverty in Eastchester
Income Below Poverty by Sex and Age in Eastchester
With 3.9% poverty level for males and 4.2% for females among the residents of Eastchester, 15 year old males and 75 year old and over females are the most vulnerable to poverty, with 8 males (10.5%) and 96 females (7.5%) in their respective age groups living below the poverty level.
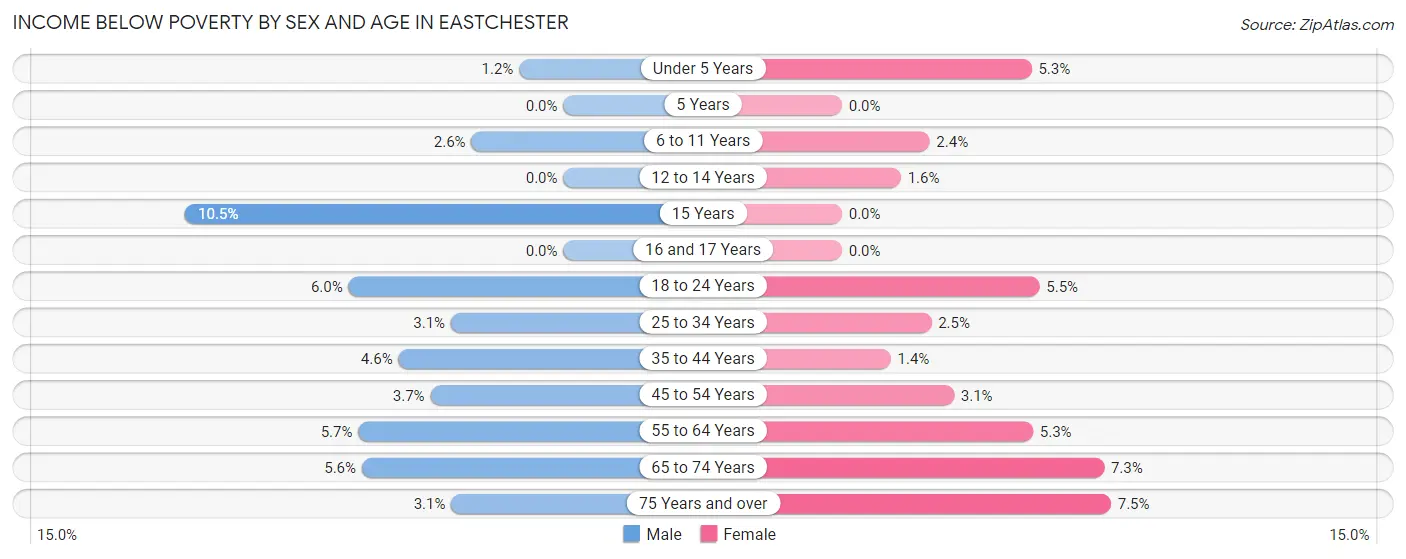
| Age Bracket | Male | Female |
| Under 5 Years | 9 (1.2%) | 27 (5.3%) |
| 5 Years | 0 (0.0%) | 0 (0.0%) |
| 6 to 11 Years | 19 (2.6%) | 19 (2.4%) |
| 12 to 14 Years | 0 (0.0%) | 7 (1.6%) |
| 15 Years | 8 (10.5%) | 0 (0.0%) |
| 16 and 17 Years | 0 (0.0%) | 0 (0.0%) |
| 18 to 24 Years | 58 (6.0%) | 45 (5.5%) |
| 25 to 34 Years | 22 (3.1%) | 24 (2.5%) |
| 35 to 44 Years | 56 (4.6%) | 19 (1.4%) |
| 45 to 54 Years | 53 (3.7%) | 44 (3.1%) |
| 55 to 64 Years | 73 (5.7%) | 82 (5.3%) |
| 65 to 74 Years | 60 (5.6%) | 88 (7.3%) |
| 75 Years and over | 26 (3.1%) | 96 (7.5%) |
| Total | 384 (3.9%) | 451 (4.2%) |
Income Above Poverty by Sex and Age in Eastchester
According to the poverty statistics in Eastchester, males aged 5 years and females aged 5 years are the age groups that are most secure financially, with 100.0% of males and 100.0% of females in these age groups living above the poverty line.
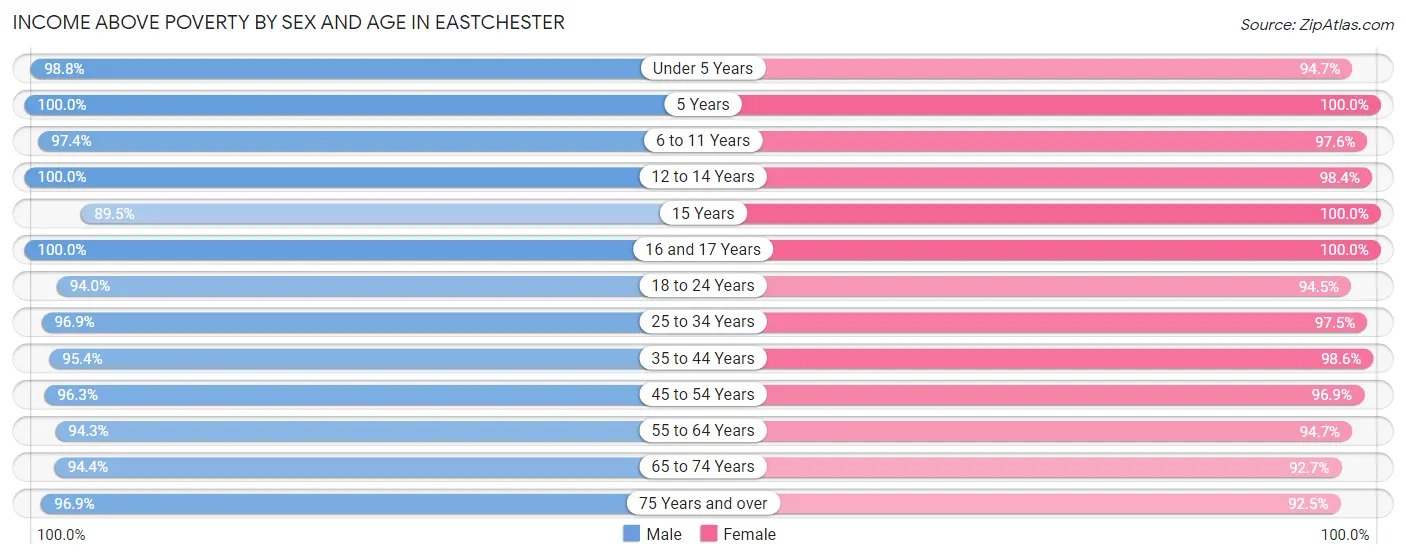
| Age Bracket | Male | Female |
| Under 5 Years | 722 (98.8%) | 484 (94.7%) |
| 5 Years | 63 (100.0%) | 150 (100.0%) |
| 6 to 11 Years | 723 (97.4%) | 760 (97.6%) |
| 12 to 14 Years | 448 (100.0%) | 419 (98.4%) |
| 15 Years | 68 (89.5%) | 115 (100.0%) |
| 16 and 17 Years | 244 (100.0%) | 215 (100.0%) |
| 18 to 24 Years | 912 (94.0%) | 773 (94.5%) |
| 25 to 34 Years | 681 (96.9%) | 941 (97.5%) |
| 35 to 44 Years | 1,163 (95.4%) | 1,377 (98.6%) |
| 45 to 54 Years | 1,380 (96.3%) | 1,368 (96.9%) |
| 55 to 64 Years | 1,205 (94.3%) | 1,460 (94.7%) |
| 65 to 74 Years | 1,009 (94.4%) | 1,117 (92.7%) |
| 75 Years and over | 807 (96.9%) | 1,186 (92.5%) |
| Total | 9,425 (96.1%) | 10,365 (95.8%) |
Income Below Poverty Among Married-Couple Families in Eastchester
The poverty statistics for married-couple families in Eastchester show that 2.5% or 118 of the total 4,668 families live below the poverty line. Families with 1 or 2 children have the highest poverty rate of 3.2%, comprising of 55 families. On the other hand, families with 3 or 4 children have the lowest poverty rate of 0.0%, which includes 0 families.
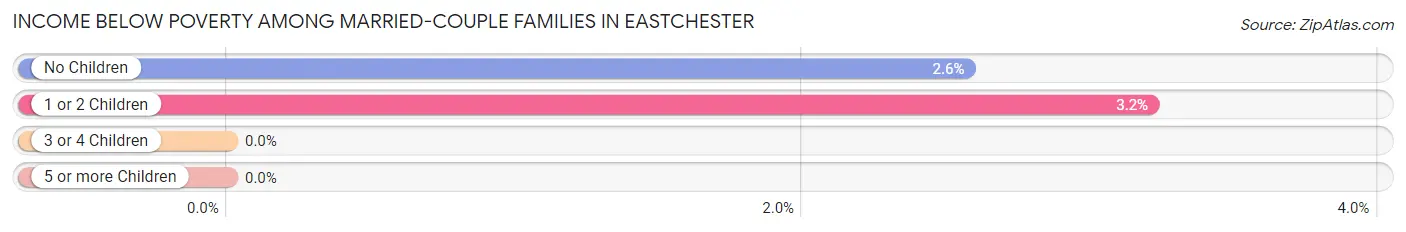
| Children | Above Poverty | Below Poverty |
| No Children | 2,386 (97.4%) | 63 (2.6%) |
| 1 or 2 Children | 1,660 (96.8%) | 55 (3.2%) |
| 3 or 4 Children | 498 (100.0%) | 0 (0.0%) |
| 5 or more Children | 6 (100.0%) | 0 (0.0%) |
| Total | 4,550 (97.5%) | 118 (2.5%) |
Income Below Poverty Among Single-Parent Households in Eastchester
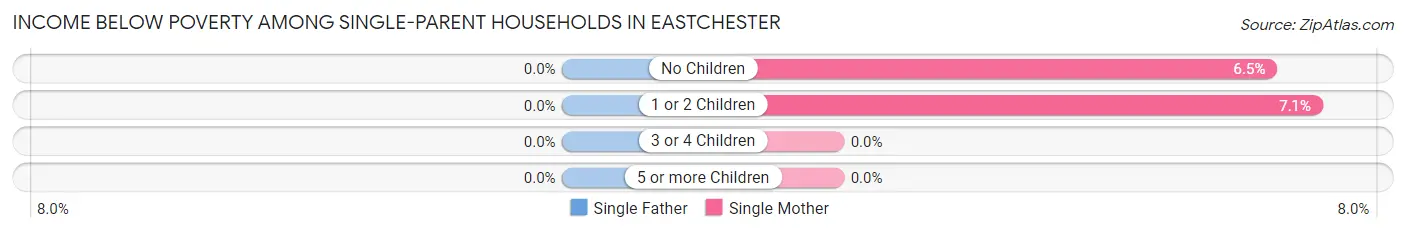
| Children | Single Father | Single Mother |
| No Children | 0 (0.0%) | 23 (6.5%) |
| 1 or 2 Children | 0 (0.0%) | 10 (7.1%) |
| 3 or 4 Children | 0 (0.0%) | 0 (0.0%) |
| 5 or more Children | 0 (0.0%) | 0 (0.0%) |
| Total | 0 (0.0%) | 33 (6.7%) |
Income Below Poverty Among Married-Couple vs Single-Parent Households in Eastchester
The poverty data for Eastchester shows that 118 of the married-couple family households (2.5%) and 33 of the single-parent households (5.2%) are living below the poverty level. Within the married-couple family households, those with 1 or 2 children have the highest poverty rate, with 55 households (3.2%) falling below the poverty line. Among the single-parent households, those with no children have the highest poverty rate, with 23 household (5.9%) living below poverty.
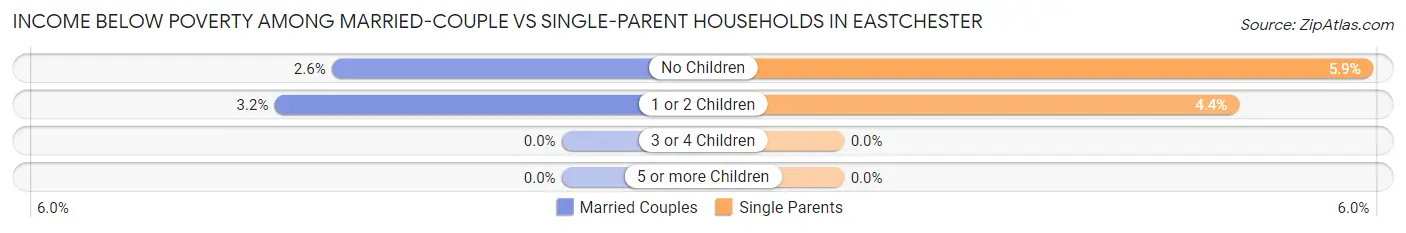
| Children | Married-Couple Families | Single-Parent Households |
| No Children | 63 (2.6%) | 23 (5.9%) |
| 1 or 2 Children | 55 (3.2%) | 10 (4.4%) |
| 3 or 4 Children | 0 (0.0%) | 0 (0.0%) |
| 5 or more Children | 0 (0.0%) | 0 (0.0%) |
| Total | 118 (2.5%) | 33 (5.2%) |
Race in Eastchester
The most populous races in Eastchester are White / Caucasian (16,261 | 78.8%), Asian (2,440 | 11.8%), and Hispanic or Latino (1,563 | 7.6%).
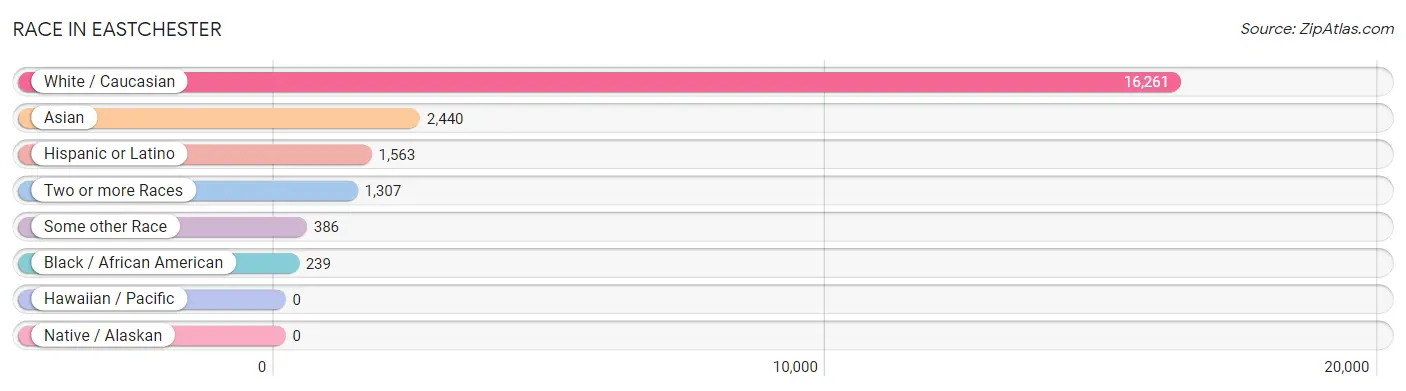
| Race | # Population | % Population |
| Asian | 2,440 | 11.8% |
| Black / African American | 239 | 1.2% |
| Hawaiian / Pacific | 0 | 0.0% |
| Hispanic or Latino | 1,563 | 7.6% |
| Native / Alaskan | 0 | 0.0% |
| White / Caucasian | 16,261 | 78.8% |
| Two or more Races | 1,307 | 6.3% |
| Some other Race | 386 | 1.9% |
| Total | 20,633 | 100.0% |
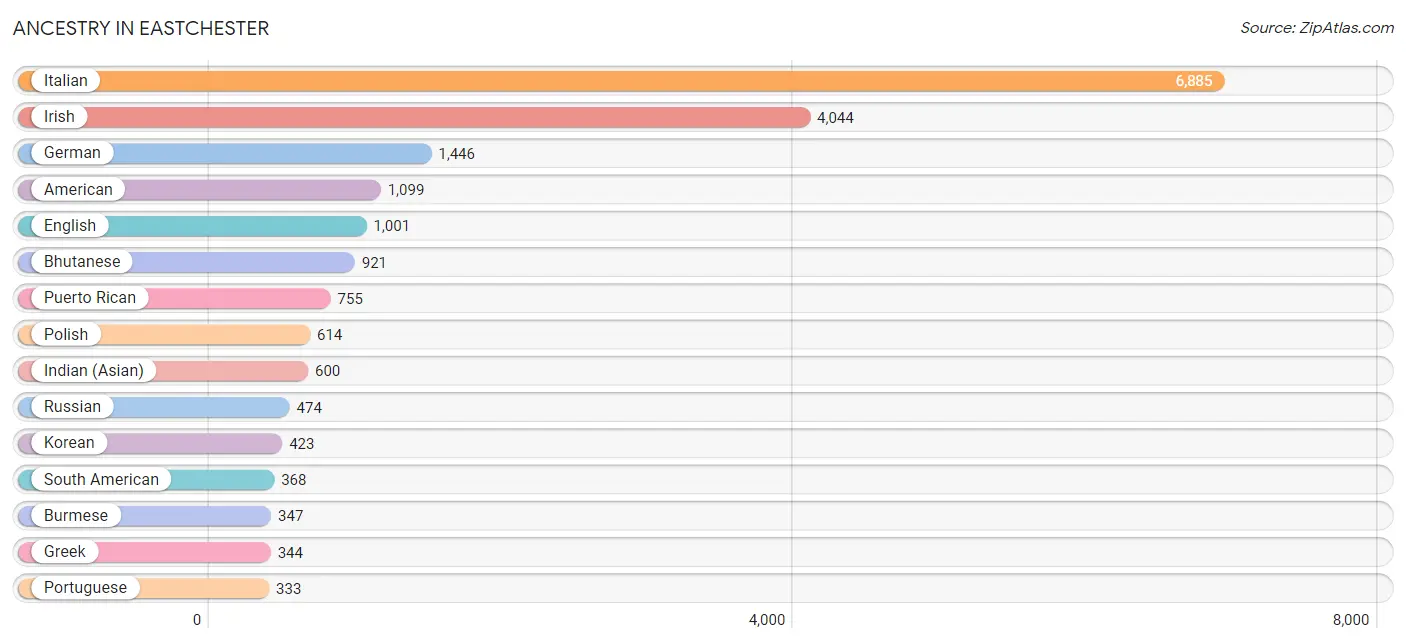
Ancestry in Eastchester
The most populous ancestries reported in Eastchester are Italian (6,885 | 33.4%), Irish (4,044 | 19.6%), German (1,446 | 7.0%), American (1,099 | 5.3%), and English (1,001 | 4.9%), together accounting for 70.2% of all Eastchester residents.
| Ancestry | # Population | % Population |
| African | 87 | 0.4% |
| Albanian | 315 | 1.5% |
| American | 1,099 | 5.3% |
| Arab | 124 | 0.6% |
| Argentinean | 59 | 0.3% |
| Austrian | 71 | 0.3% |
| Bhutanese | 921 | 4.5% |
| Brazilian | 297 | 1.4% |
| British | 84 | 0.4% |
| Bulgarian | 9 | 0.0% |
| Burmese | 347 | 1.7% |
| Celtic | 9 | 0.0% |
| Central American | 130 | 0.6% |
| Cherokee | 12 | 0.1% |
| Colombian | 188 | 0.9% |
| Croatian | 61 | 0.3% |
| Cypriot | 14 | 0.1% |
| Czech | 40 | 0.2% |
| Danish | 45 | 0.2% |
| Dominican | 218 | 1.1% |
| Dutch | 73 | 0.4% |
| Eastern European | 180 | 0.9% |
| Ecuadorian | 71 | 0.3% |
| Egyptian | 6 | 0.0% |
| English | 1,001 | 4.9% |
| European | 236 | 1.1% |
| Filipino | 8 | 0.0% |
| French | 230 | 1.1% |
| French Canadian | 47 | 0.2% |
| German | 1,446 | 7.0% |
| Ghanaian | 62 | 0.3% |
| Greek | 344 | 1.7% |
| Guatemalan | 67 | 0.3% |
| Guyanese | 38 | 0.2% |
| Hungarian | 118 | 0.6% |
| Icelander | 32 | 0.2% |
| Indian (Asian) | 600 | 2.9% |
| Irish | 4,044 | 19.6% |
| Israeli | 24 | 0.1% |
| Italian | 6,885 | 33.4% |
| Japanese | 14 | 0.1% |
| Jordanian | 30 | 0.2% |
| Korean | 423 | 2.1% |
| Latvian | 9 | 0.0% |
| Lebanese | 34 | 0.2% |
| Lithuanian | 28 | 0.1% |
| Macedonian | 117 | 0.6% |
| Maltese | 22 | 0.1% |
| Mexican | 15 | 0.1% |
| Moroccan | 13 | 0.1% |
| Native Hawaiian | 36 | 0.2% |
| Nigerian | 23 | 0.1% |
| Norwegian | 22 | 0.1% |
| Pakistani | 11 | 0.1% |
| Peruvian | 19 | 0.1% |
| Polish | 614 | 3.0% |
| Portuguese | 333 | 1.6% |
| Puerto Rican | 755 | 3.7% |
| Romanian | 65 | 0.3% |
| Russian | 474 | 2.3% |
| Salvadoran | 63 | 0.3% |
| Scandinavian | 10 | 0.1% |
| Scotch-Irish | 60 | 0.3% |
| Scottish | 256 | 1.2% |
| Slavic | 17 | 0.1% |
| Slovak | 130 | 0.6% |
| South African | 1 | 0.0% |
| South American | 368 | 1.8% |
| Spaniard | 7 | 0.0% |
| Spanish | 30 | 0.2% |
| Sri Lankan | 39 | 0.2% |
| Subsaharan African | 173 | 0.8% |
| Swedish | 80 | 0.4% |
| Swiss | 29 | 0.1% |
| Syrian | 16 | 0.1% |
| Thai | 311 | 1.5% |
| Trinidadian and Tobagonian | 5 | 0.0% |
| Turkish | 20 | 0.1% |
| Ukrainian | 79 | 0.4% |
| Venezuelan | 25 | 0.1% |
| Welsh | 24 | 0.1% |
| Yugoslavian | 20 | 0.1% | View All 82 Rows |
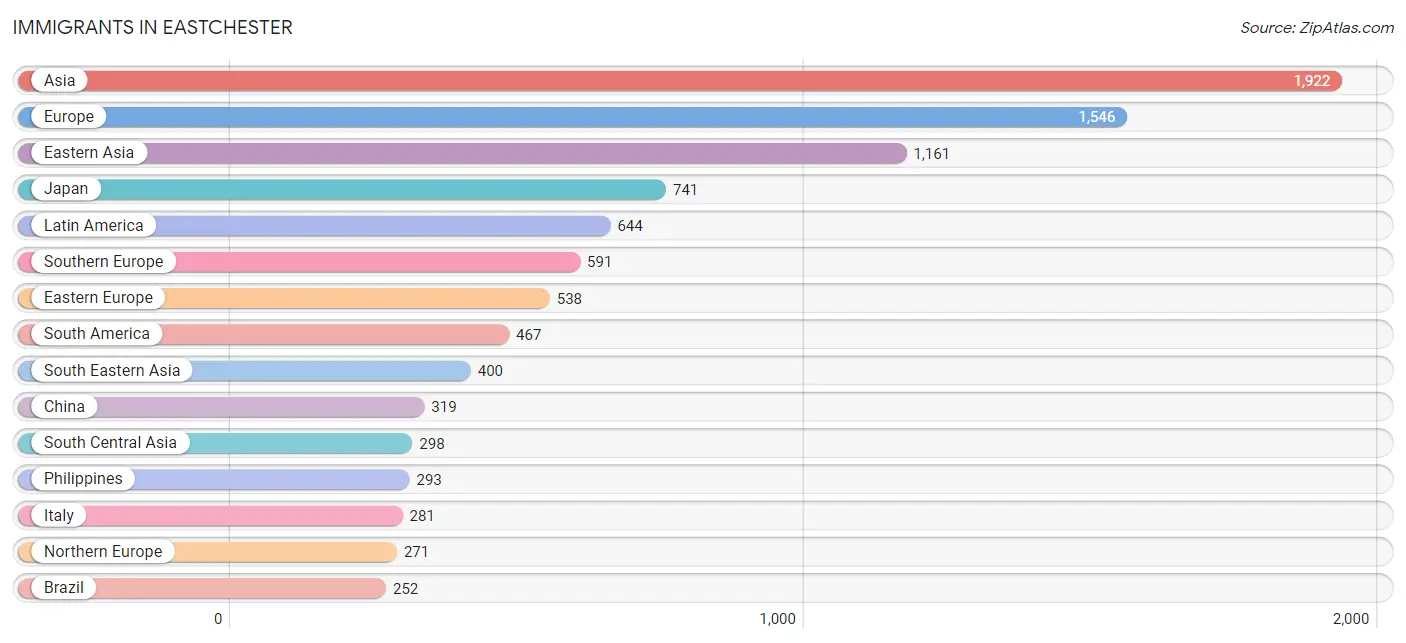
Immigrants in Eastchester
The most numerous immigrant groups reported in Eastchester came from Asia (1,922 | 9.3%), Europe (1,546 | 7.5%), Eastern Asia (1,161 | 5.6%), Japan (741 | 3.6%), and Latin America (644 | 3.1%), together accounting for 29.1% of all Eastchester residents.
| Immigration Origin | # Population | % Population |
| Africa | 55 | 0.3% |
| Albania | 141 | 0.7% |
| Argentina | 29 | 0.1% |
| Asia | 1,922 | 9.3% |
| Australia | 33 | 0.2% |
| Belarus | 20 | 0.1% |
| Brazil | 252 | 1.2% |
| Bulgaria | 9 | 0.0% |
| Canada | 10 | 0.1% |
| Caribbean | 96 | 0.5% |
| Central America | 81 | 0.4% |
| China | 319 | 1.5% |
| Colombia | 120 | 0.6% |
| Croatia | 24 | 0.1% |
| Czechoslovakia | 23 | 0.1% |
| Dominican Republic | 76 | 0.4% |
| Eastern Asia | 1,161 | 5.6% |
| Eastern Europe | 538 | 2.6% |
| Ecuador | 34 | 0.2% |
| Egypt | 6 | 0.0% |
| El Salvador | 20 | 0.1% |
| England | 98 | 0.5% |
| Europe | 1,546 | 7.5% |
| France | 52 | 0.3% |
| Germany | 68 | 0.3% |
| Greece | 162 | 0.8% |
| Guatemala | 61 | 0.3% |
| Guyana | 6 | 0.0% |
| Hong Kong | 12 | 0.1% |
| India | 185 | 0.9% |
| Ireland | 78 | 0.4% |
| Israel | 24 | 0.1% |
| Italy | 281 | 1.4% |
| Jamaica | 1 | 0.0% |
| Japan | 741 | 3.6% |
| Korea | 101 | 0.5% |
| Latin America | 644 | 3.1% |
| Lebanon | 34 | 0.2% |
| Malaysia | 5 | 0.0% |
| Morocco | 13 | 0.1% |
| Nigeria | 12 | 0.1% |
| Northern Africa | 28 | 0.1% |
| Northern Europe | 271 | 1.3% |
| Oceania | 33 | 0.2% |
| Pakistan | 53 | 0.3% |
| Peru | 15 | 0.1% |
| Philippines | 293 | 1.4% |
| Poland | 47 | 0.2% |
| Portugal | 110 | 0.5% |
| Romania | 21 | 0.1% |
| Russia | 148 | 0.7% |
| Scotland | 9 | 0.0% |
| Singapore | 8 | 0.0% |
| South Africa | 15 | 0.1% |
| South America | 467 | 2.3% |
| South Central Asia | 298 | 1.4% |
| South Eastern Asia | 400 | 1.9% |
| Southern Europe | 591 | 2.9% |
| Spain | 27 | 0.1% |
| St. Vincent and the Grenadines | 14 | 0.1% |
| Switzerland | 12 | 0.1% |
| Taiwan | 42 | 0.2% |
| Thailand | 6 | 0.0% |
| Trinidad and Tobago | 5 | 0.0% |
| Turkey | 5 | 0.0% |
| Ukraine | 21 | 0.1% |
| Venezuela | 11 | 0.1% |
| Vietnam | 88 | 0.4% |
| Western Africa | 12 | 0.1% |
| Western Asia | 63 | 0.3% |
| Western Europe | 132 | 0.6% | View All 71 Rows |
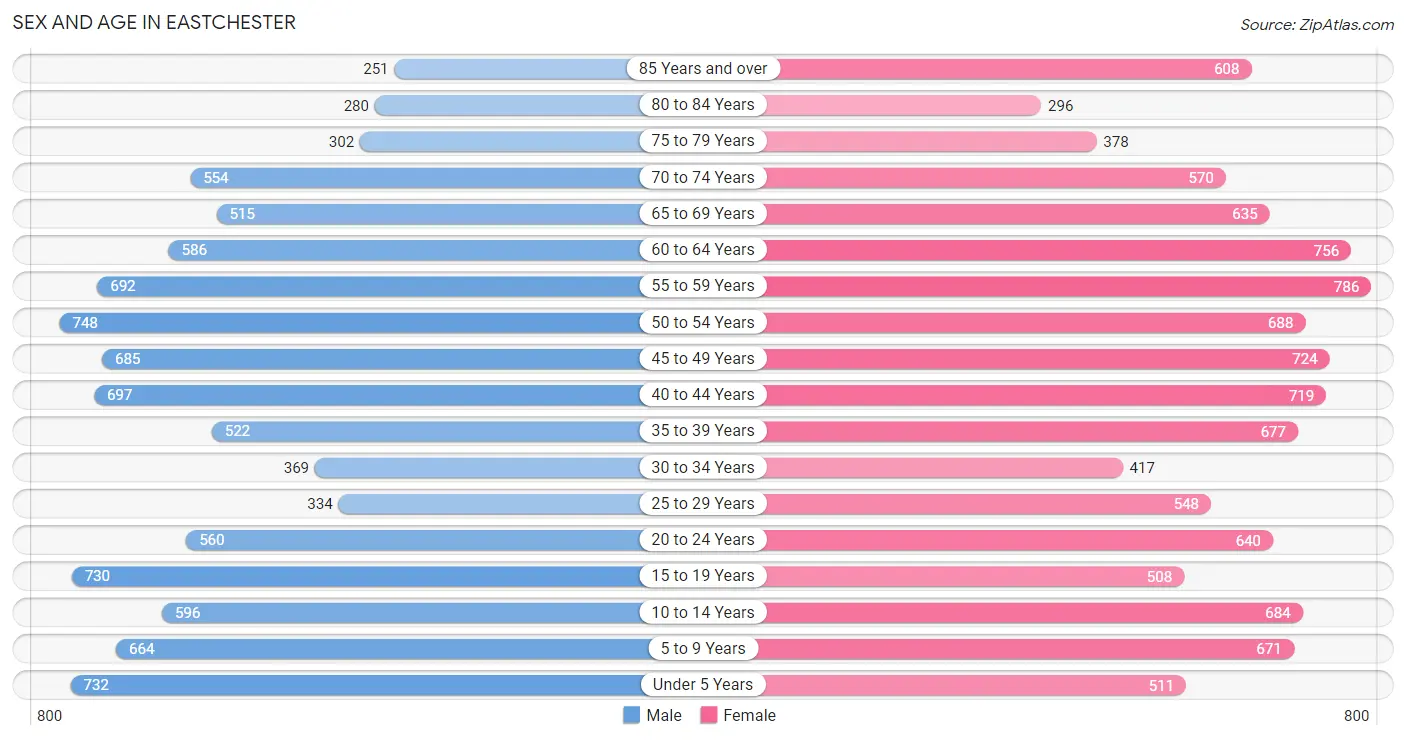
Sex and Age in Eastchester
Sex and Age in Eastchester
The most populous age groups in Eastchester are 50 to 54 Years (748 | 7.6%) for men and 55 to 59 Years (786 | 7.3%) for women.
| Age Bracket | Male | Female |
| Under 5 Years | 732 (7.5%) | 511 (4.7%) |
| 5 to 9 Years | 664 (6.8%) | 671 (6.2%) |
| 10 to 14 Years | 596 (6.1%) | 684 (6.3%) |
| 15 to 19 Years | 730 (7.4%) | 508 (4.7%) |
| 20 to 24 Years | 560 (5.7%) | 640 (5.9%) |
| 25 to 29 Years | 334 (3.4%) | 548 (5.1%) |
| 30 to 34 Years | 369 (3.8%) | 417 (3.9%) |
| 35 to 39 Years | 522 (5.3%) | 677 (6.3%) |
| 40 to 44 Years | 697 (7.1%) | 719 (6.7%) |
| 45 to 49 Years | 685 (7.0%) | 724 (6.7%) |
| 50 to 54 Years | 748 (7.6%) | 688 (6.4%) |
| 55 to 59 Years | 692 (7.0%) | 786 (7.3%) |
| 60 to 64 Years | 586 (6.0%) | 756 (7.0%) |
| 65 to 69 Years | 515 (5.2%) | 635 (5.9%) |
| 70 to 74 Years | 554 (5.6%) | 570 (5.3%) |
| 75 to 79 Years | 302 (3.1%) | 378 (3.5%) |
| 80 to 84 Years | 280 (2.9%) | 296 (2.7%) |
| 85 Years and over | 251 (2.6%) | 608 (5.6%) |
| Total | 9,817 (100.0%) | 10,816 (100.0%) |
Families and Households in Eastchester
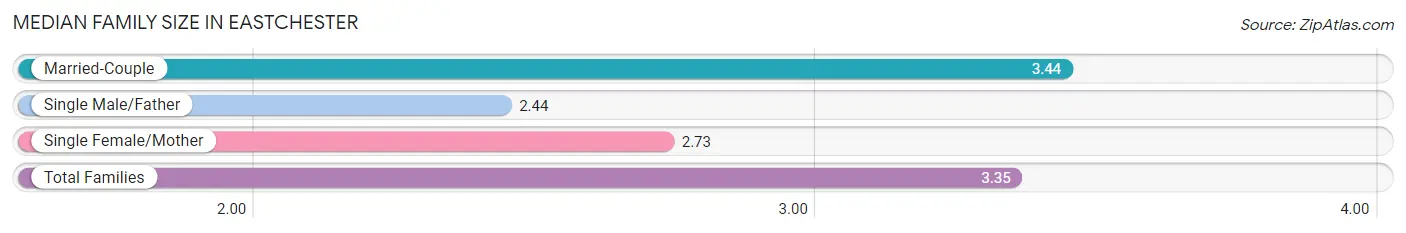
Median Family Size in Eastchester
The median family size in Eastchester is 3.35 persons per family, with married-couple families (4,668 | 88.1%) accounting for the largest median family size of 3.44 persons per family. On the other hand, single male/father families (133 | 2.5%) represent the smallest median family size with 2.44 persons per family.
| Family Type | # Families | Family Size |
| Married-Couple | 4,668 (88.1%) | 3.44 |
| Single Male/Father | 133 (2.5%) | 2.44 |
| Single Female/Mother | 496 (9.4%) | 2.73 |
| Total Families | 5,297 (100.0%) | 3.35 |
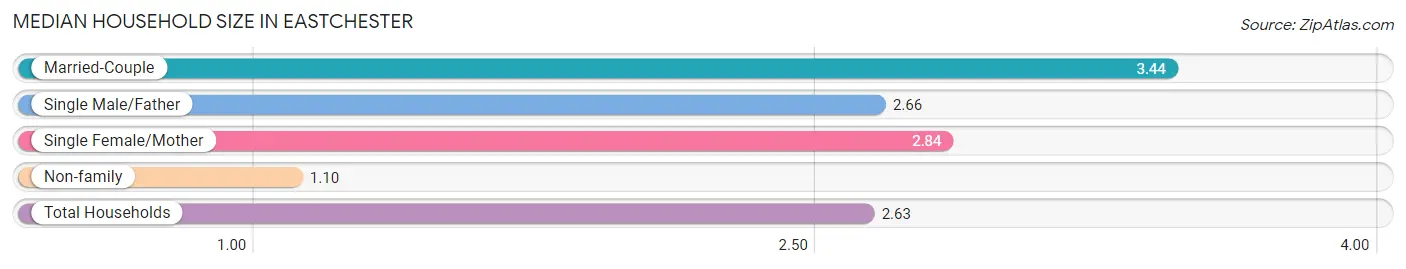
Median Household Size in Eastchester
The median household size in Eastchester is 2.63 persons per household, with married-couple households (4,668 | 59.7%) accounting for the largest median household size of 3.44 persons per household. non-family households (2,524 | 32.3%) represent the smallest median household size with 1.10 persons per household.
| Household Type | # Households | Household Size |
| Married-Couple | 4,668 (59.7%) | 3.44 |
| Single Male/Father | 133 (1.7%) | 2.66 |
| Single Female/Mother | 496 (6.3%) | 2.84 |
| Non-family | 2,524 (32.3%) | 1.10 |
| Total Households | 7,821 (100.0%) | 2.63 |
Household Size by Marriage Status in Eastchester
Out of a total of 7,821 households in Eastchester, 5,297 (67.7%) are family households, while 2,524 (32.3%) are nonfamily households. The most numerous type of family households are 2-person households, comprising 1,981, and the most common type of nonfamily households are 1-person households, comprising 2,285.
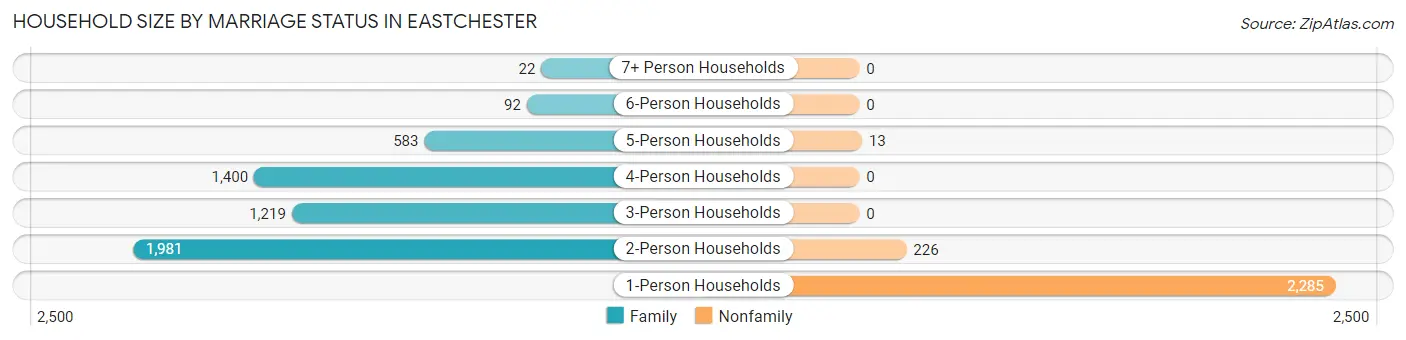
| Household Size | Family Households | Nonfamily Households |
| 1-Person Households | - | 2,285 (29.2%) |
| 2-Person Households | 1,981 (25.3%) | 226 (2.9%) |
| 3-Person Households | 1,219 (15.6%) | 0 (0.0%) |
| 4-Person Households | 1,400 (17.9%) | 0 (0.0%) |
| 5-Person Households | 583 (7.4%) | 13 (0.2%) |
| 6-Person Households | 92 (1.2%) | 0 (0.0%) |
| 7+ Person Households | 22 (0.3%) | 0 (0.0%) |
| Total | 5,297 (67.7%) | 2,524 (32.3%) |
Female Fertility in Eastchester
Fertility by Age in Eastchester
Average fertility rate in Eastchester is 47.0 births per 1,000 women. Women in the age bracket of 35 to 50 years have the highest fertility rate with 76.0 births per 1,000 women. Women in the age bracket of 35 to 50 years acount for 82.2% of all women with births.
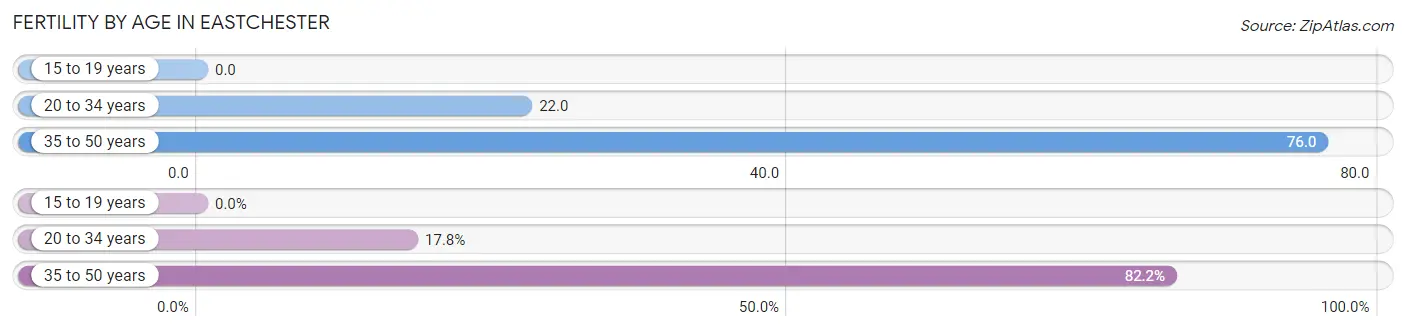
| Age Bracket | Women with Births | Births / 1,000 Women |
| 15 to 19 years | 0 (0.0%) | 0.0 |
| 20 to 34 years | 36 (17.8%) | 22.0 |
| 35 to 50 years | 166 (82.2%) | 76.0 |
| Total | 202 (100.0%) | 47.0 |
Fertility by Age by Marriage Status in Eastchester
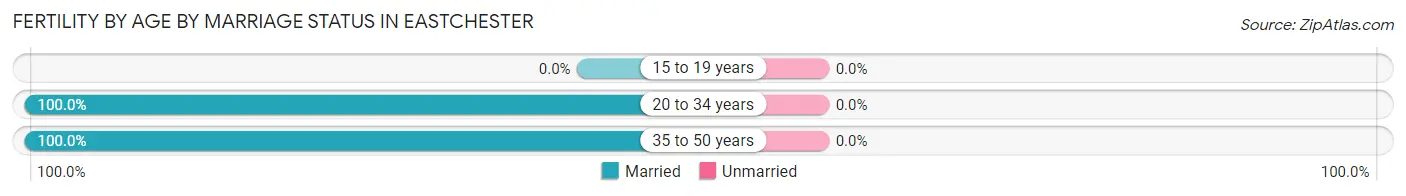
| Age Bracket | Married | Unmarried |
| 15 to 19 years | 0 (0.0%) | 0 (0.0%) |
| 20 to 34 years | 36 (100.0%) | 0 (0.0%) |
| 35 to 50 years | 166 (100.0%) | 0 (0.0%) |
| Total | 202 (100.0%) | 0 (0.0%) |
Fertility by Education in Eastchester
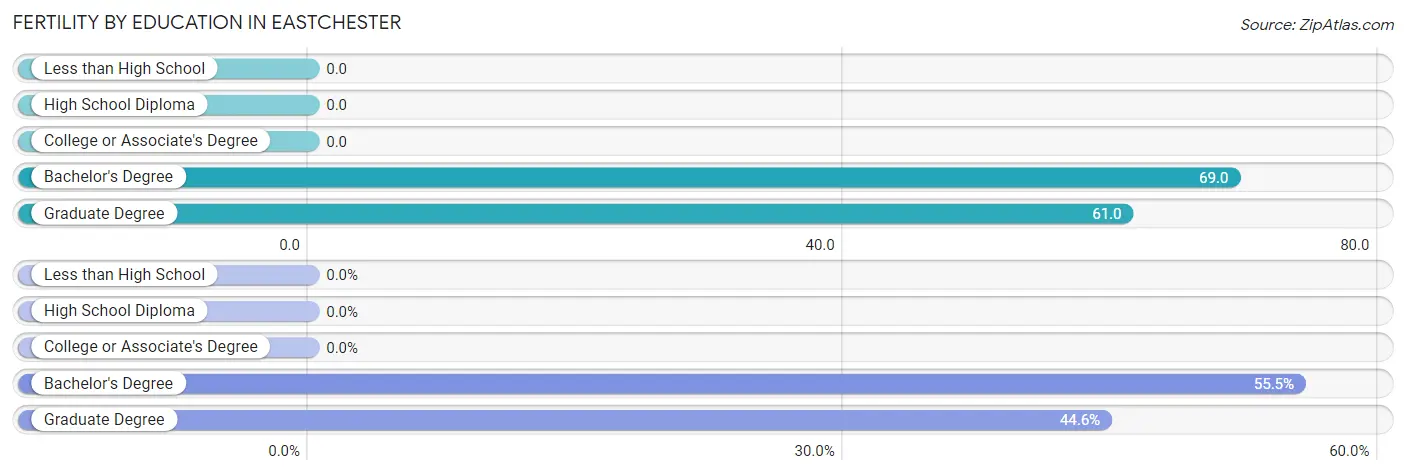
| Educational Attainment | Women with Births | Births / 1,000 Women |
| Less than High School | 0 (0.0%) | 0.0 |
| High School Diploma | 0 (0.0%) | 0.0 |
| College or Associate's Degree | 0 (0.0%) | 0.0 |
| Bachelor's Degree | 112 (55.4%) | 69.0 |
| Graduate Degree | 90 (44.6%) | 61.0 |
| Total | 202 (100.0%) | 47.0 |
Fertility by Education by Marriage Status in Eastchester
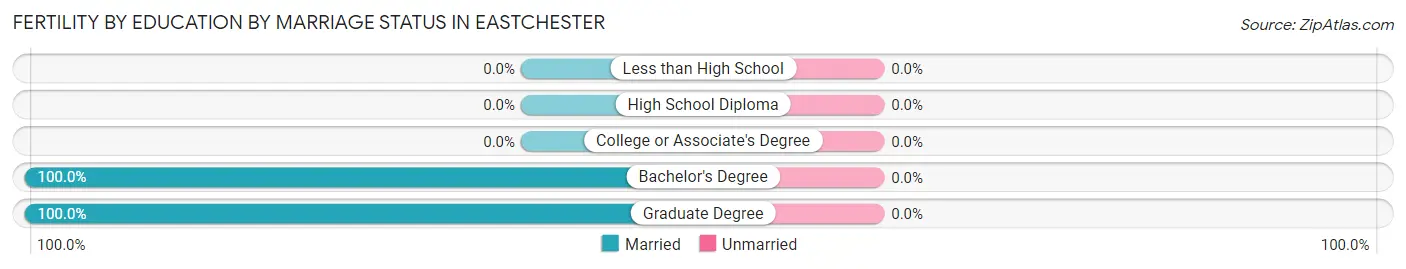
| Educational Attainment | Married | Unmarried |
| Less than High School | 0 (0.0%) | 0 (0.0%) |
| High School Diploma | 0 (0.0%) | 0 (0.0%) |
| College or Associate's Degree | 0 (0.0%) | 0 (0.0%) |
| Bachelor's Degree | 112 (100.0%) | 0 (0.0%) |
| Graduate Degree | 90 (100.0%) | 0 (0.0%) |
| Total | 202 (100.0%) | 0 (0.0%) |
Employment Characteristics in Eastchester
Employment by Class of Employer in Eastchester
Among the 9,883 employed individuals in Eastchester, private company employees (6,155 | 62.3%), not-for-profit organizations (1,203 | 12.2%), and local government employees (1,170 | 11.8%) make up the most common classes of employment.
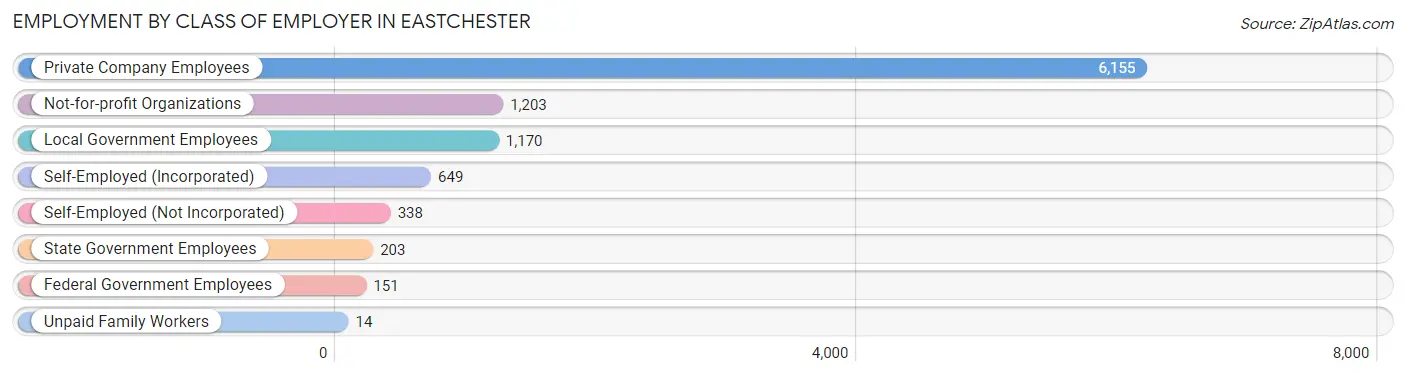
| Employer Class | # Employees | % Employees |
| Private Company Employees | 6,155 | 62.3% |
| Self-Employed (Incorporated) | 649 | 6.6% |
| Self-Employed (Not Incorporated) | 338 | 3.4% |
| Not-for-profit Organizations | 1,203 | 12.2% |
| Local Government Employees | 1,170 | 11.8% |
| State Government Employees | 203 | 2.1% |
| Federal Government Employees | 151 | 1.5% |
| Unpaid Family Workers | 14 | 0.1% |
| Total | 9,883 | 100.0% |
Employment Status by Age in Eastchester
According to the labor force statistics for Eastchester, out of the total population over 16 years of age (16,584), 62.5% or 10,365 individuals are in the labor force, with 3.2% or 332 of them unemployed. The age group with the highest labor force participation rate is 25 to 29 years, with 90.9% or 802 individuals in the labor force. Within the labor force, the 16 to 19 years age range has the highest percentage of unemployed individuals, with 32.9% or 74 of them being unemployed.
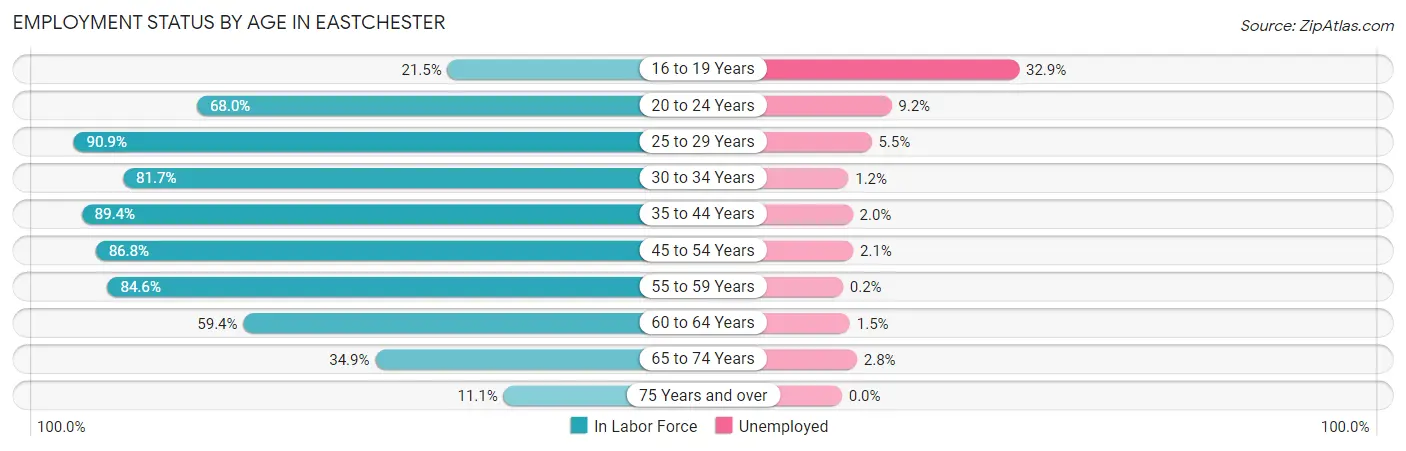
| Age Bracket | In Labor Force | Unemployed |
| 16 to 19 Years | 225 (21.5%) | 74 (32.9%) |
| 20 to 24 Years | 816 (68.0%) | 75 (9.2%) |
| 25 to 29 Years | 802 (90.9%) | 44 (5.5%) |
| 30 to 34 Years | 642 (81.7%) | 8 (1.2%) |
| 35 to 44 Years | 2,338 (89.4%) | 47 (2.0%) |
| 45 to 54 Years | 2,469 (86.8%) | 52 (2.1%) |
| 55 to 59 Years | 1,250 (84.6%) | 2 (0.2%) |
| 60 to 64 Years | 797 (59.4%) | 12 (1.5%) |
| 65 to 74 Years | 794 (34.9%) | 22 (2.8%) |
| 75 Years and over | 235 (11.1%) | 0 (0.0%) |
| Total | 10,365 (62.5%) | 332 (3.2%) |
Employment Status by Educational Attainment in Eastchester
According to labor force statistics for Eastchester, 83.4% of individuals (8,297) out of the total population between 25 and 64 years of age (9,948) are in the labor force, with 2.0% or 166 of them being unemployed. The group with the highest labor force participation rate are those with the educational attainment of bachelor's degree or higher, with 88.4% or 6,446 individuals in the labor force. Within the labor force, individuals with high school diploma education have the highest percentage of unemployment, with 4.6% or 36 of them being unemployed.
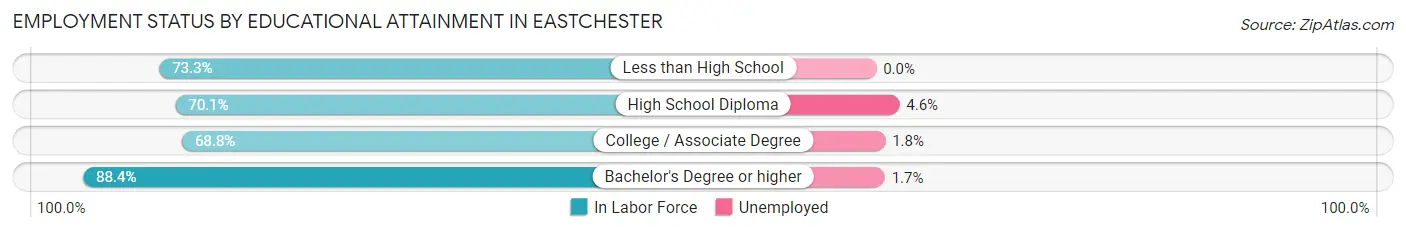
| Educational Attainment | In Labor Force | Unemployed |
| Less than High School | 151 (73.3%) | 0 (0.0%) |
| High School Diploma | 780 (70.1%) | 51 (4.6%) |
| College / Associate Degree | 921 (68.8%) | 24 (1.8%) |
| Bachelor's Degree or higher | 6,446 (88.4%) | 124 (1.7%) |
| Total | 8,297 (83.4%) | 199 (2.0%) |
Employment Occupations by Sex in Eastchester
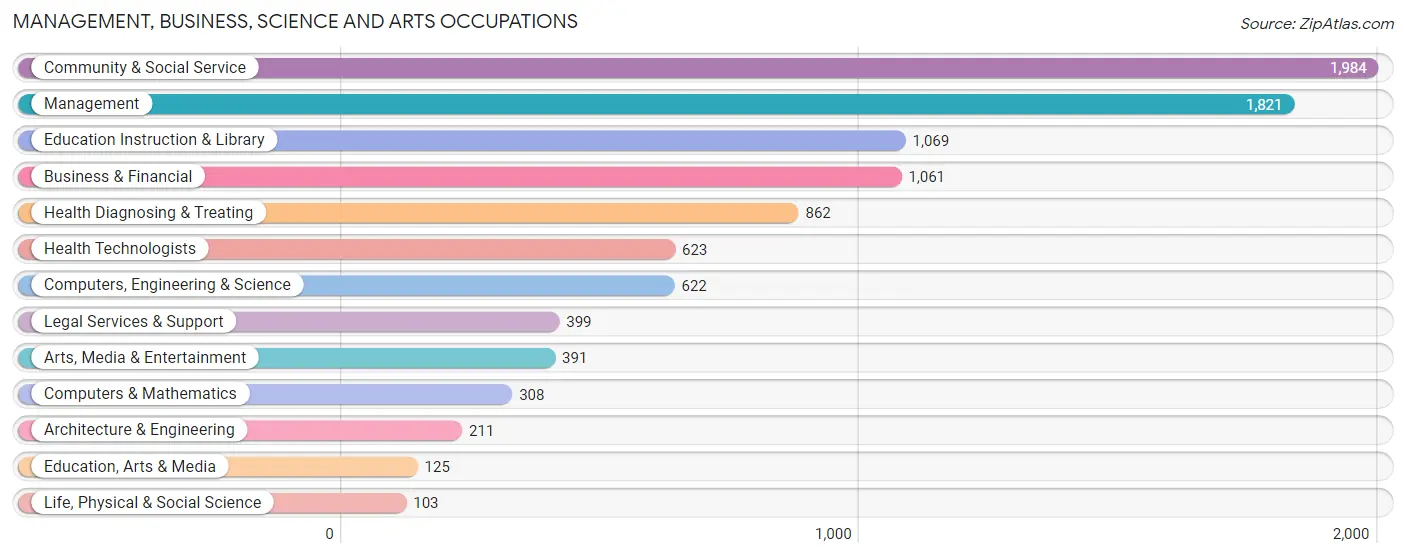
Management, Business, Science and Arts Occupations
The most common Management, Business, Science and Arts occupations in Eastchester are Community & Social Service (1,984 | 19.8%), Management (1,821 | 18.1%), Education Instruction & Library (1,069 | 10.7%), Business & Financial (1,061 | 10.6%), and Health Diagnosing & Treating (862 | 8.6%).
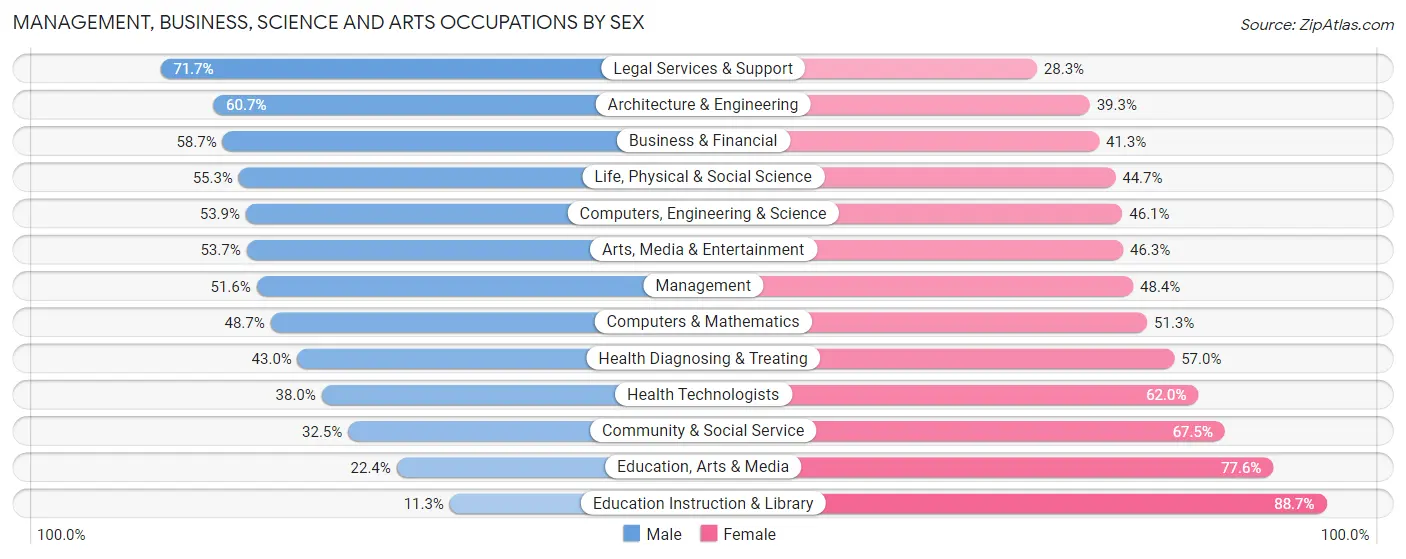
Management, Business, Science and Arts Occupations by Sex
Within the Management, Business, Science and Arts occupations in Eastchester, the most male-oriented occupations are Legal Services & Support (71.7%), Architecture & Engineering (60.7%), and Business & Financial (58.7%), while the most female-oriented occupations are Education Instruction & Library (88.7%), Education, Arts & Media (77.6%), and Community & Social Service (67.5%).
| Occupation | Male | Female |
| Management | 940 (51.6%) | 881 (48.4%) |
| Business & Financial | 623 (58.7%) | 438 (41.3%) |
| Computers, Engineering & Science | 335 (53.9%) | 287 (46.1%) |
| Computers & Mathematics | 150 (48.7%) | 158 (51.3%) |
| Architecture & Engineering | 128 (60.7%) | 83 (39.3%) |
| Life, Physical & Social Science | 57 (55.3%) | 46 (44.7%) |
| Community & Social Service | 645 (32.5%) | 1,339 (67.5%) |
| Education, Arts & Media | 28 (22.4%) | 97 (77.6%) |
| Legal Services & Support | 286 (71.7%) | 113 (28.3%) |
| Education Instruction & Library | 121 (11.3%) | 948 (88.7%) |
| Arts, Media & Entertainment | 210 (53.7%) | 181 (46.3%) |
| Health Diagnosing & Treating | 371 (43.0%) | 491 (57.0%) |
| Health Technologists | 237 (38.0%) | 386 (62.0%) |
| Total (Category) | 2,914 (45.9%) | 3,436 (54.1%) |
| Total (Overall) | 5,042 (50.3%) | 4,990 (49.7%) |
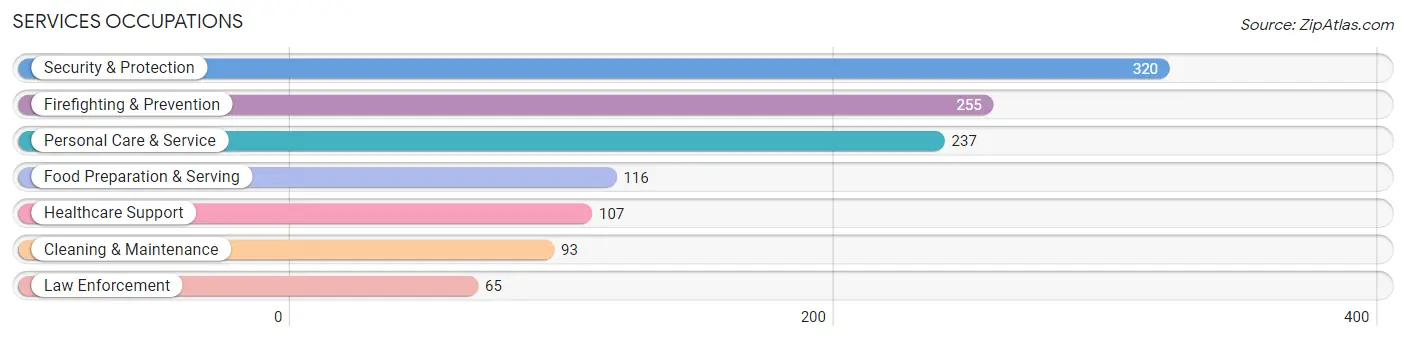
Services Occupations
The most common Services occupations in Eastchester are Security & Protection (320 | 3.2%), Firefighting & Prevention (255 | 2.5%), Personal Care & Service (237 | 2.4%), Food Preparation & Serving (116 | 1.2%), and Healthcare Support (107 | 1.1%).
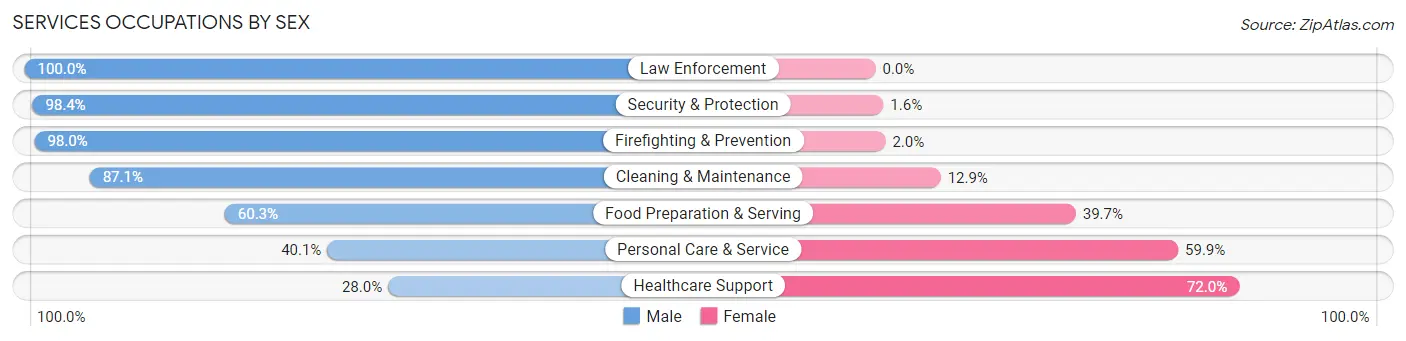
Services Occupations by Sex
Within the Services occupations in Eastchester, the most male-oriented occupations are Law Enforcement (100.0%), Security & Protection (98.4%), and Firefighting & Prevention (98.0%), while the most female-oriented occupations are Healthcare Support (72.0%), Personal Care & Service (59.9%), and Food Preparation & Serving (39.7%).
| Occupation | Male | Female |
| Healthcare Support | 30 (28.0%) | 77 (72.0%) |
| Security & Protection | 315 (98.4%) | 5 (1.6%) |
| Firefighting & Prevention | 250 (98.0%) | 5 (2.0%) |
| Law Enforcement | 65 (100.0%) | 0 (0.0%) |
| Food Preparation & Serving | 70 (60.3%) | 46 (39.7%) |
| Cleaning & Maintenance | 81 (87.1%) | 12 (12.9%) |
| Personal Care & Service | 95 (40.1%) | 142 (59.9%) |
| Total (Category) | 591 (67.7%) | 282 (32.3%) |
| Total (Overall) | 5,042 (50.3%) | 4,990 (49.7%) |
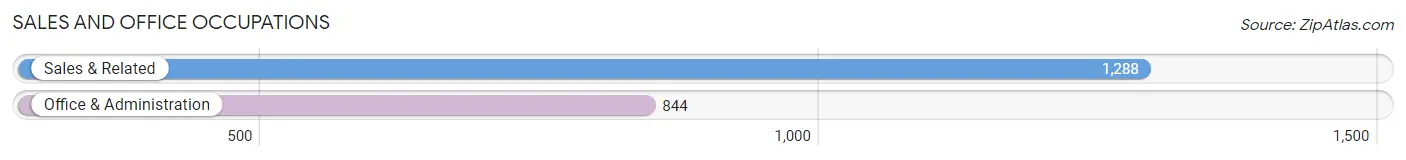
Sales and Office Occupations
The most common Sales and Office occupations in Eastchester are Sales & Related (1,288 | 12.8%), and Office & Administration (844 | 8.4%).
Sales and Office Occupations by Sex
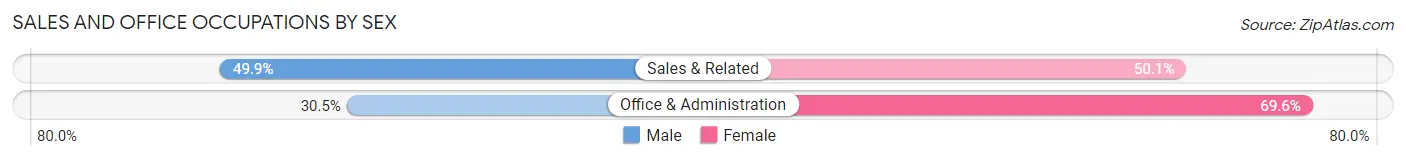
| Occupation | Male | Female |
| Sales & Related | 643 (49.9%) | 645 (50.1%) |
| Office & Administration | 257 (30.4%) | 587 (69.6%) |
| Total (Category) | 900 (42.2%) | 1,232 (57.8%) |
| Total (Overall) | 5,042 (50.3%) | 4,990 (49.7%) |
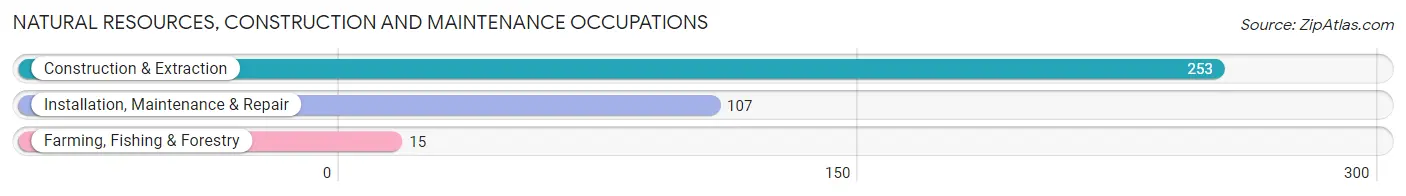
Natural Resources, Construction and Maintenance Occupations
The most common Natural Resources, Construction and Maintenance occupations in Eastchester are Construction & Extraction (253 | 2.5%), Installation, Maintenance & Repair (107 | 1.1%), and Farming, Fishing & Forestry (15 | 0.2%).
Natural Resources, Construction and Maintenance Occupations by Sex
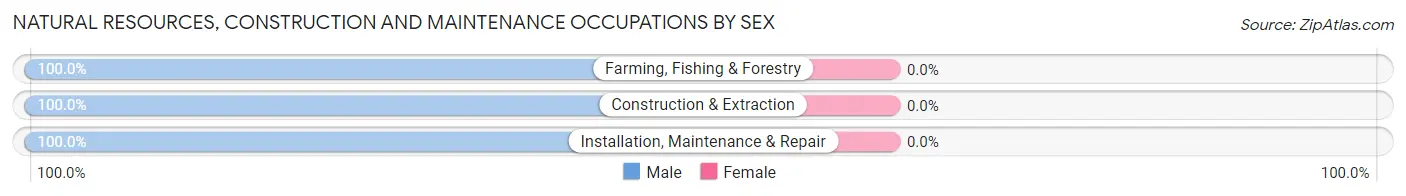
| Occupation | Male | Female |
| Farming, Fishing & Forestry | 15 (100.0%) | 0 (0.0%) |
| Construction & Extraction | 253 (100.0%) | 0 (0.0%) |
| Installation, Maintenance & Repair | 107 (100.0%) | 0 (0.0%) |
| Total (Category) | 375 (100.0%) | 0 (0.0%) |
| Total (Overall) | 5,042 (50.3%) | 4,990 (49.7%) |
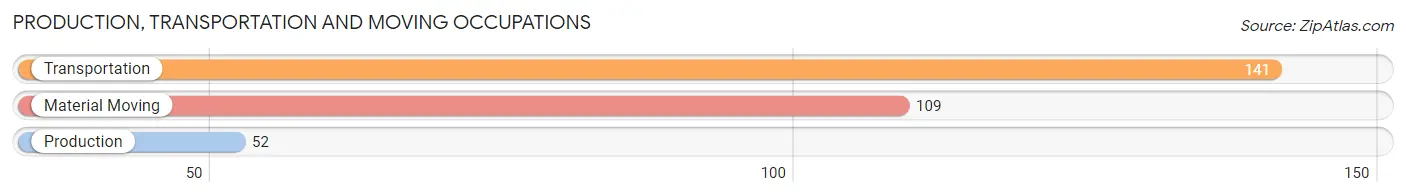
Production, Transportation and Moving Occupations
The most common Production, Transportation and Moving occupations in Eastchester are Transportation (141 | 1.4%), Material Moving (109 | 1.1%), and Production (52 | 0.5%).
Production, Transportation and Moving Occupations by Sex
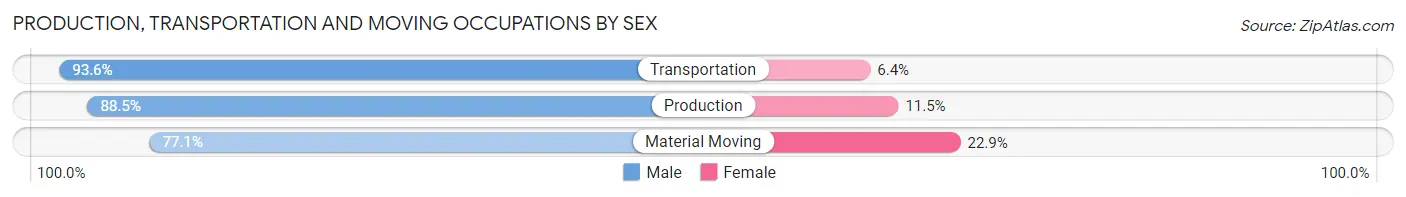
| Occupation | Male | Female |
| Production | 46 (88.5%) | 6 (11.5%) |
| Transportation | 132 (93.6%) | 9 (6.4%) |
| Material Moving | 84 (77.1%) | 25 (22.9%) |
| Total (Category) | 262 (86.8%) | 40 (13.3%) |
| Total (Overall) | 5,042 (50.3%) | 4,990 (49.7%) |
Employment Industries by Sex in Eastchester
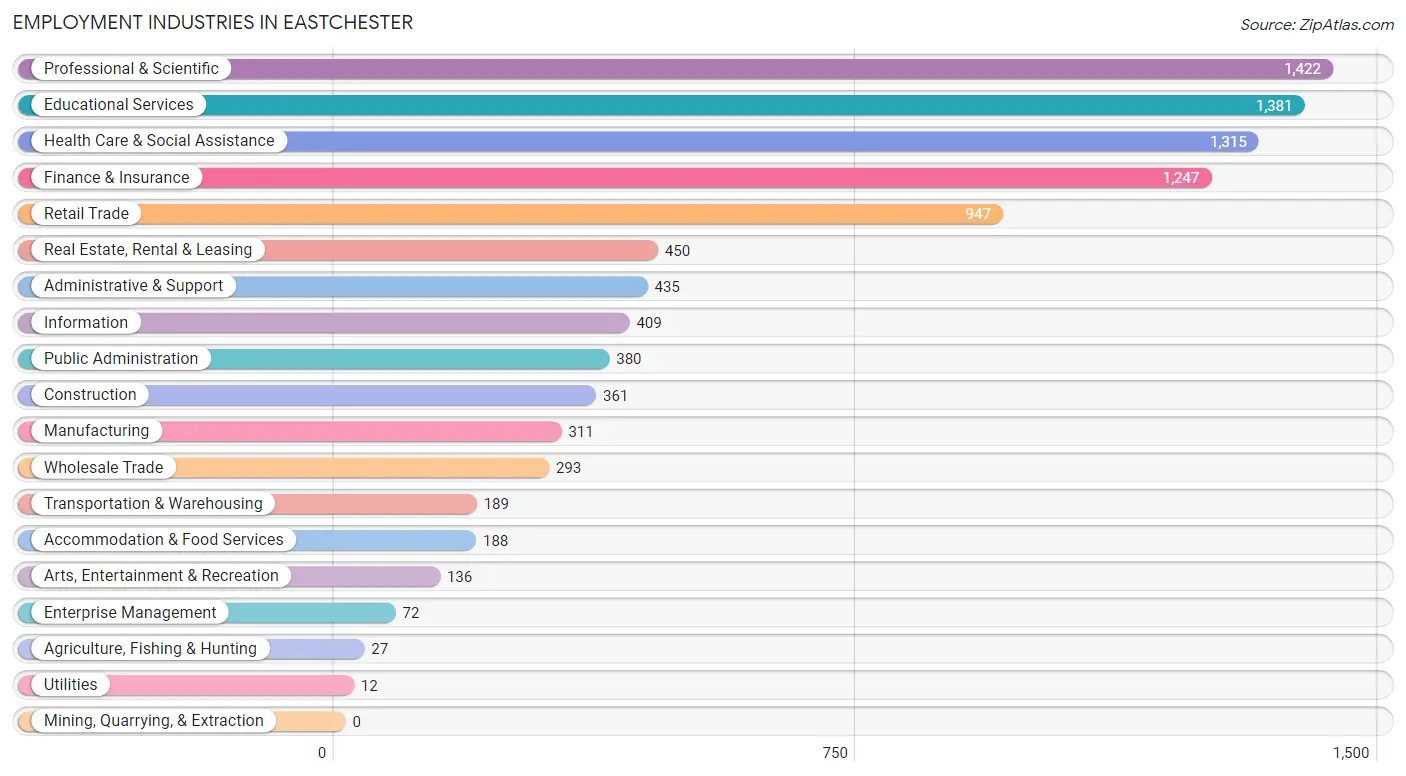
Employment Industries in Eastchester
The major employment industries in Eastchester include Professional & Scientific (1,422 | 14.2%), Educational Services (1,381 | 13.8%), Health Care & Social Assistance (1,315 | 13.1%), Finance & Insurance (1,247 | 12.4%), and Retail Trade (947 | 9.4%).
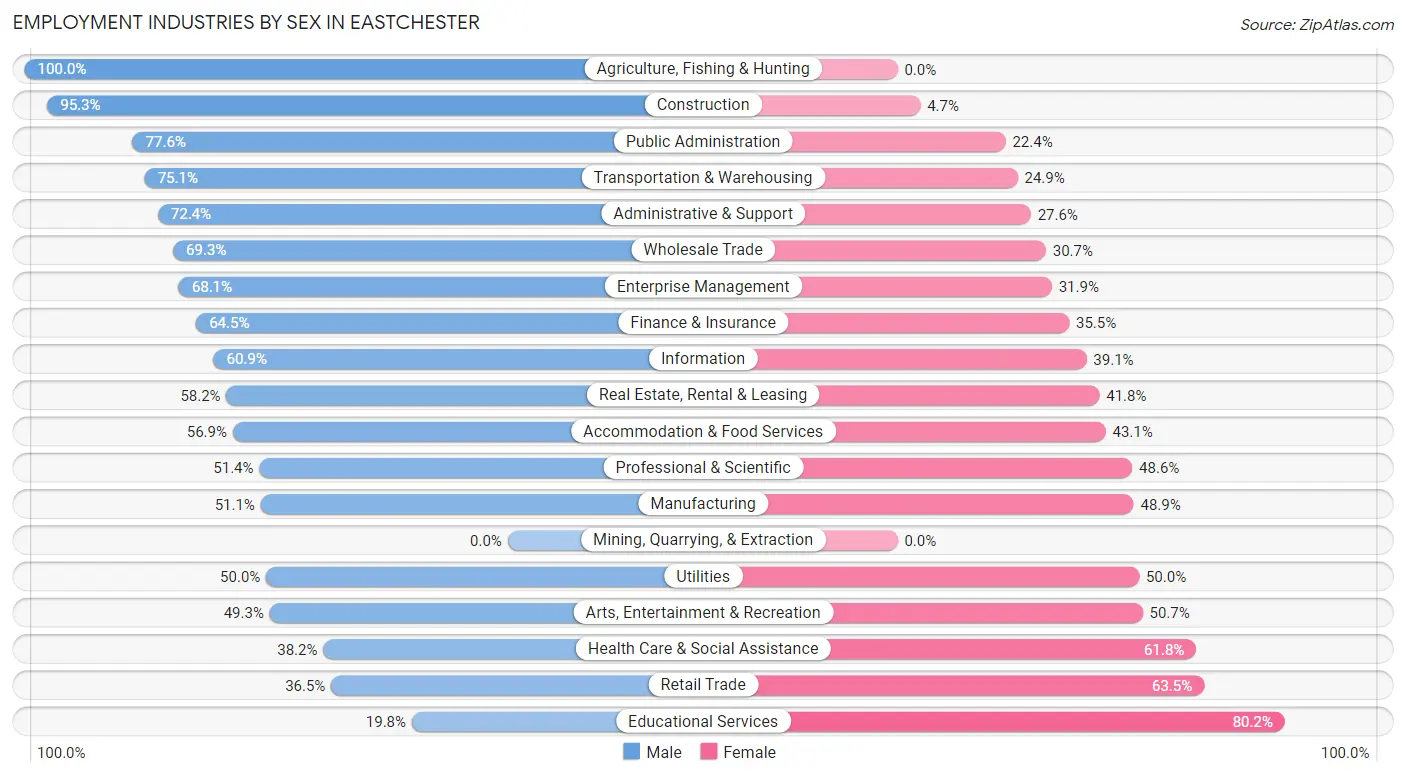
Employment Industries by Sex in Eastchester
The Eastchester industries that see more men than women are Agriculture, Fishing & Hunting (100.0%), Construction (95.3%), and Public Administration (77.6%), whereas the industries that tend to have a higher number of women are Educational Services (80.2%), Retail Trade (63.5%), and Health Care & Social Assistance (61.8%).
| Industry | Male | Female |
| Agriculture, Fishing & Hunting | 27 (100.0%) | 0 (0.0%) |
| Mining, Quarrying, & Extraction | 0 (0.0%) | 0 (0.0%) |
| Construction | 344 (95.3%) | 17 (4.7%) |
| Manufacturing | 159 (51.1%) | 152 (48.9%) |
| Wholesale Trade | 203 (69.3%) | 90 (30.7%) |
| Retail Trade | 346 (36.5%) | 601 (63.5%) |
| Transportation & Warehousing | 142 (75.1%) | 47 (24.9%) |
| Utilities | 6 (50.0%) | 6 (50.0%) |
| Information | 249 (60.9%) | 160 (39.1%) |
| Finance & Insurance | 804 (64.5%) | 443 (35.5%) |
| Real Estate, Rental & Leasing | 262 (58.2%) | 188 (41.8%) |
| Professional & Scientific | 731 (51.4%) | 691 (48.6%) |
| Enterprise Management | 49 (68.1%) | 23 (31.9%) |
| Administrative & Support | 315 (72.4%) | 120 (27.6%) |
| Educational Services | 274 (19.8%) | 1,107 (80.2%) |
| Health Care & Social Assistance | 502 (38.2%) | 813 (61.8%) |
| Arts, Entertainment & Recreation | 67 (49.3%) | 69 (50.7%) |
| Accommodation & Food Services | 107 (56.9%) | 81 (43.1%) |
| Public Administration | 295 (77.6%) | 85 (22.4%) |
| Total | 5,042 (50.3%) | 4,990 (49.7%) |
Education in Eastchester
School Enrollment in Eastchester
The most common levels of schooling among the 5,085 students in Eastchester are elementary school (1,069 | 21.0%), middle school (1,028 | 20.2%), and college / undergraduate (1,024 | 20.1%).
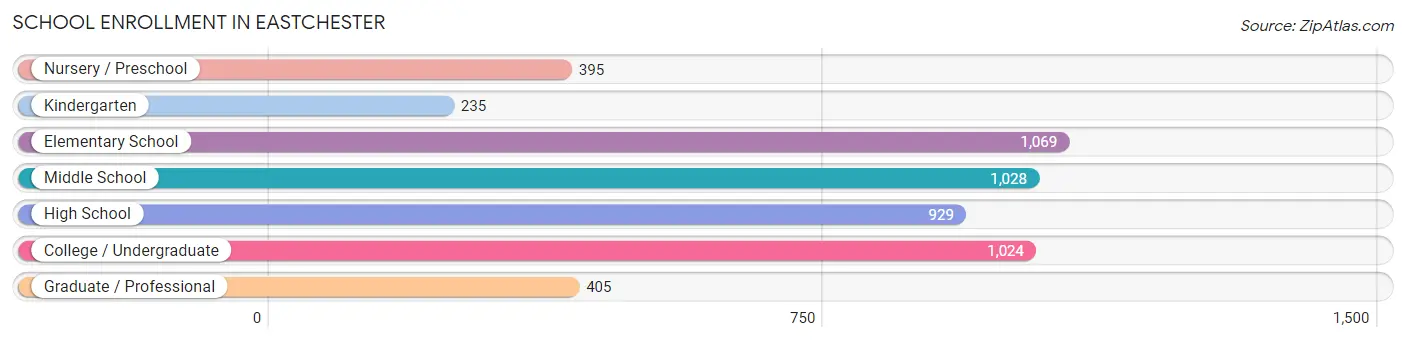
| School Level | # Students | % Students |
| Nursery / Preschool | 395 | 7.8% |
| Kindergarten | 235 | 4.6% |
| Elementary School | 1,069 | 21.0% |
| Middle School | 1,028 | 20.2% |
| High School | 929 | 18.3% |
| College / Undergraduate | 1,024 | 20.1% |
| Graduate / Professional | 405 | 8.0% |
| Total | 5,085 | 100.0% |
School Enrollment by Age by Funding Source in Eastchester
Out of a total of 5,085 students who are enrolled in schools in Eastchester, 1,444 (28.4%) attend a private institution, while the remaining 3,641 (71.6%) are enrolled in public schools. The age group of 3 to 4 year olds has the highest likelihood of being enrolled in private schools, with 264 (85.2% in the age bracket) enrolled. Conversely, the age group of 10 to 14 year olds has the lowest likelihood of being enrolled in a private school, with 1,160 (91.5% in the age bracket) attending a public institution.
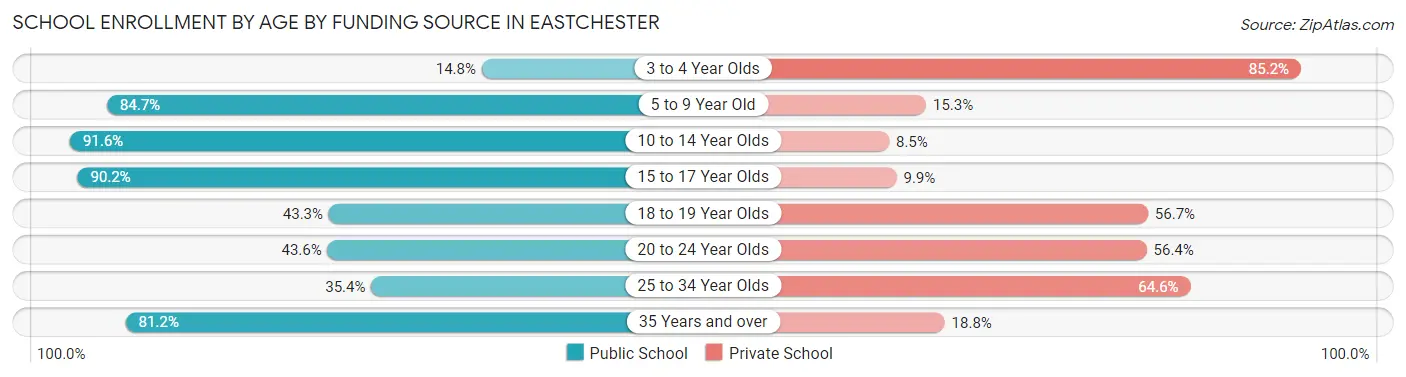
| Age Bracket | Public School | Private School |
| 3 to 4 Year Olds | 46 (14.8%) | 264 (85.2%) |
| 5 to 9 Year Old | 1,098 (84.7%) | 199 (15.3%) |
| 10 to 14 Year Olds | 1,160 (91.5%) | 107 (8.5%) |
| 15 to 17 Year Olds | 586 (90.1%) | 64 (9.9%) |
| 18 to 19 Year Olds | 250 (43.3%) | 327 (56.7%) |
| 20 to 24 Year Olds | 271 (43.6%) | 351 (56.4%) |
| 25 to 34 Year Olds | 51 (35.4%) | 93 (64.6%) |
| 35 Years and over | 177 (81.2%) | 41 (18.8%) |
| Total | 3,641 (71.6%) | 1,444 (28.4%) |
Educational Attainment by Field of Study in Eastchester
Business (2,741 | 27.1%), social sciences (1,057 | 10.4%), education (822 | 8.1%), literature & languages (818 | 8.1%), and science & technology (637 | 6.3%) are the most common fields of study among 10,127 individuals in Eastchester who have obtained a bachelor's degree or higher.
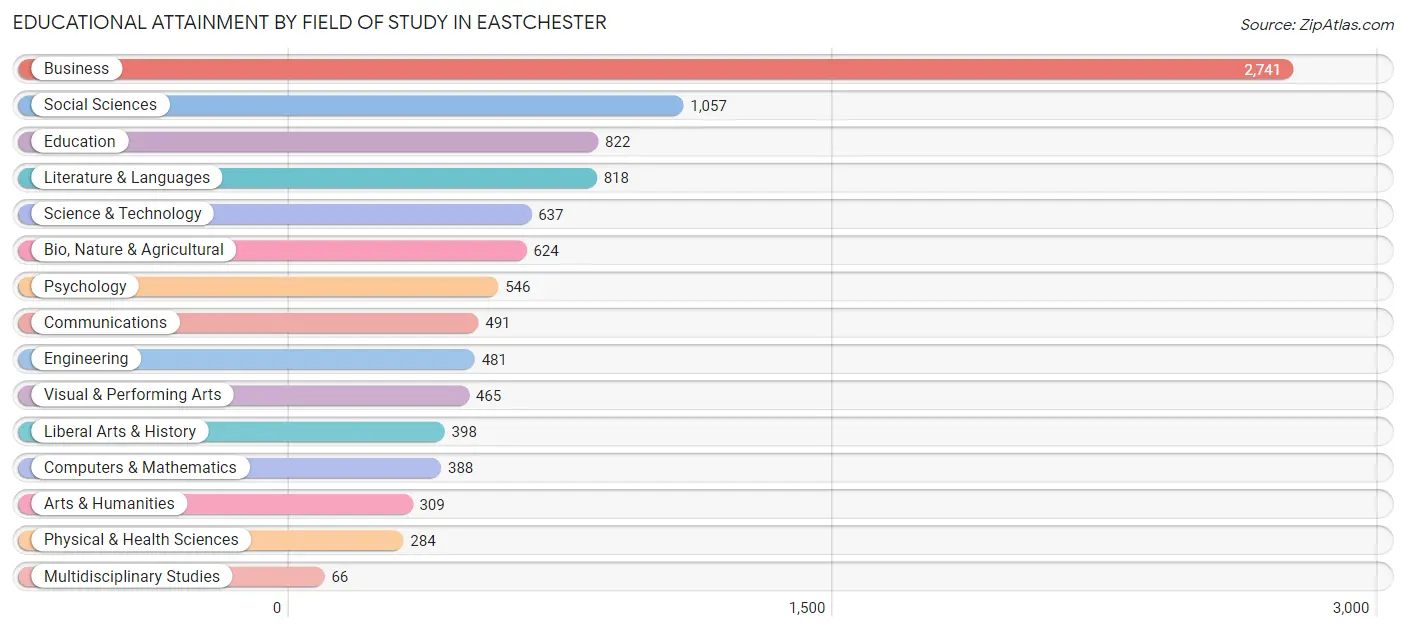
| Field of Study | # Graduates | % Graduates |
| Computers & Mathematics | 388 | 3.8% |
| Bio, Nature & Agricultural | 624 | 6.2% |
| Physical & Health Sciences | 284 | 2.8% |
| Psychology | 546 | 5.4% |
| Social Sciences | 1,057 | 10.4% |
| Engineering | 481 | 4.8% |
| Multidisciplinary Studies | 66 | 0.6% |
| Science & Technology | 637 | 6.3% |
| Business | 2,741 | 27.1% |
| Education | 822 | 8.1% |
| Literature & Languages | 818 | 8.1% |
| Liberal Arts & History | 398 | 3.9% |
| Visual & Performing Arts | 465 | 4.6% |
| Communications | 491 | 4.9% |
| Arts & Humanities | 309 | 3.0% |
| Total | 10,127 | 100.0% |
Transportation & Commute in Eastchester
Vehicle Availability by Sex in Eastchester
The most prevalent vehicle ownership categories in Eastchester are males with 2 vehicles (2,177, accounting for 43.6%) and females with 2 vehicles (2,060, making up 44.6%).
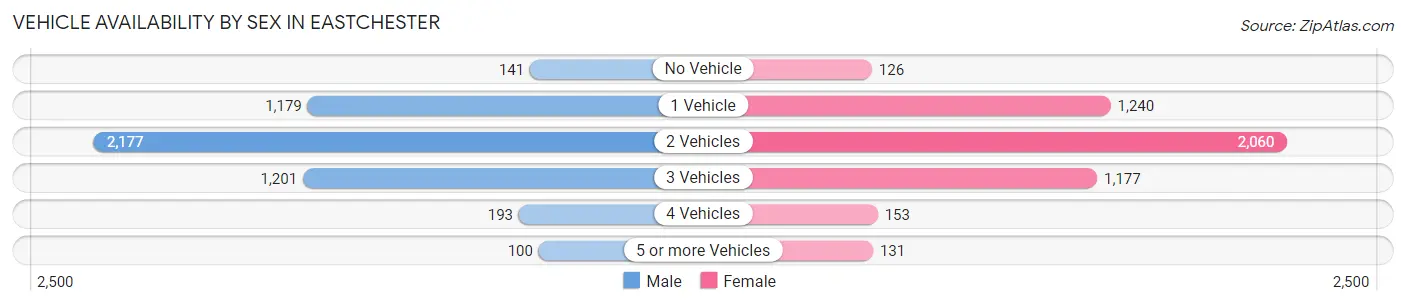
| Vehicles Available | Male | Female |
| No Vehicle | 141 (2.8%) | 126 (2.6%) |
| 1 Vehicle | 1,179 (23.6%) | 1,240 (25.4%) |
| 2 Vehicles | 2,177 (43.6%) | 2,060 (42.1%) |
| 3 Vehicles | 1,201 (24.1%) | 1,177 (24.1%) |
| 4 Vehicles | 193 (3.9%) | 153 (3.1%) |
| 5 or more Vehicles | 100 (2.0%) | 131 (2.7%) |
| Total | 4,991 (100.0%) | 4,887 (100.0%) |
Commute Time in Eastchester
The most frequently occuring commute durations in Eastchester are 60 to 89 minutes (1,506 commuters, 17.7%), 15 to 19 minutes (1,155 commuters, 13.6%), and 30 to 34 minutes (922 commuters, 10.8%).
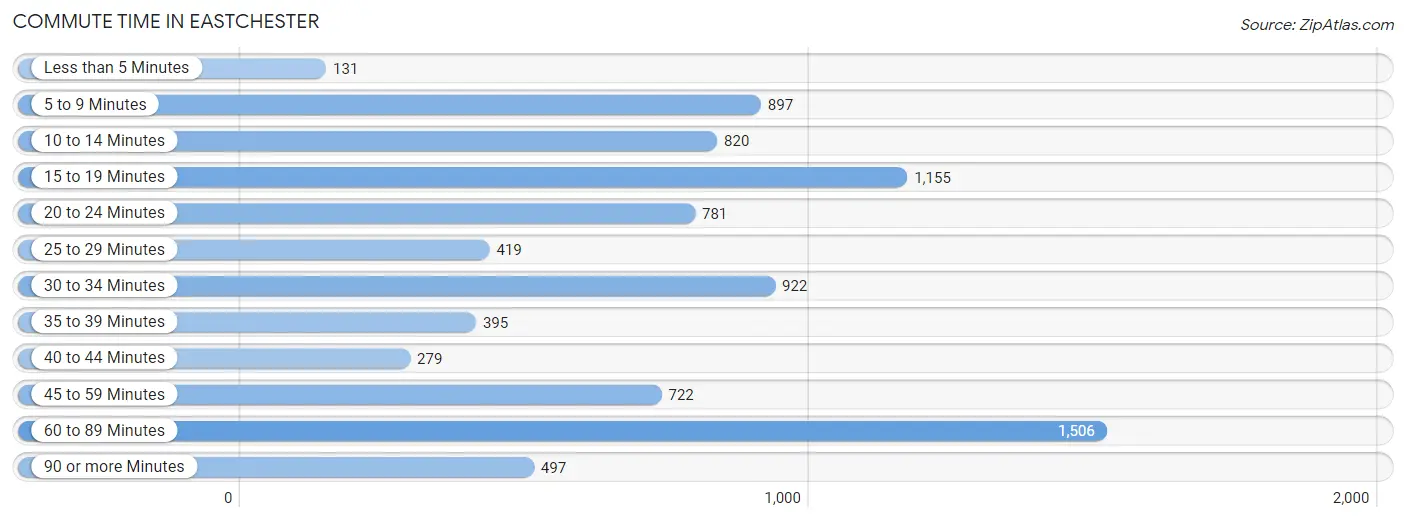
| Commute Time | # Commuters | % Commuters |
| Less than 5 Minutes | 131 | 1.5% |
| 5 to 9 Minutes | 897 | 10.5% |
| 10 to 14 Minutes | 820 | 9.6% |
| 15 to 19 Minutes | 1,155 | 13.6% |
| 20 to 24 Minutes | 781 | 9.2% |
| 25 to 29 Minutes | 419 | 4.9% |
| 30 to 34 Minutes | 922 | 10.8% |
| 35 to 39 Minutes | 395 | 4.6% |
| 40 to 44 Minutes | 279 | 3.3% |
| 45 to 59 Minutes | 722 | 8.5% |
| 60 to 89 Minutes | 1,506 | 17.7% |
| 90 or more Minutes | 497 | 5.8% |
Commute Time by Sex in Eastchester
The most common commute times in Eastchester are 60 to 89 minutes (1,003 commuters, 23.3%) for males and 5 to 9 minutes (719 commuters, 17.0%) for females.
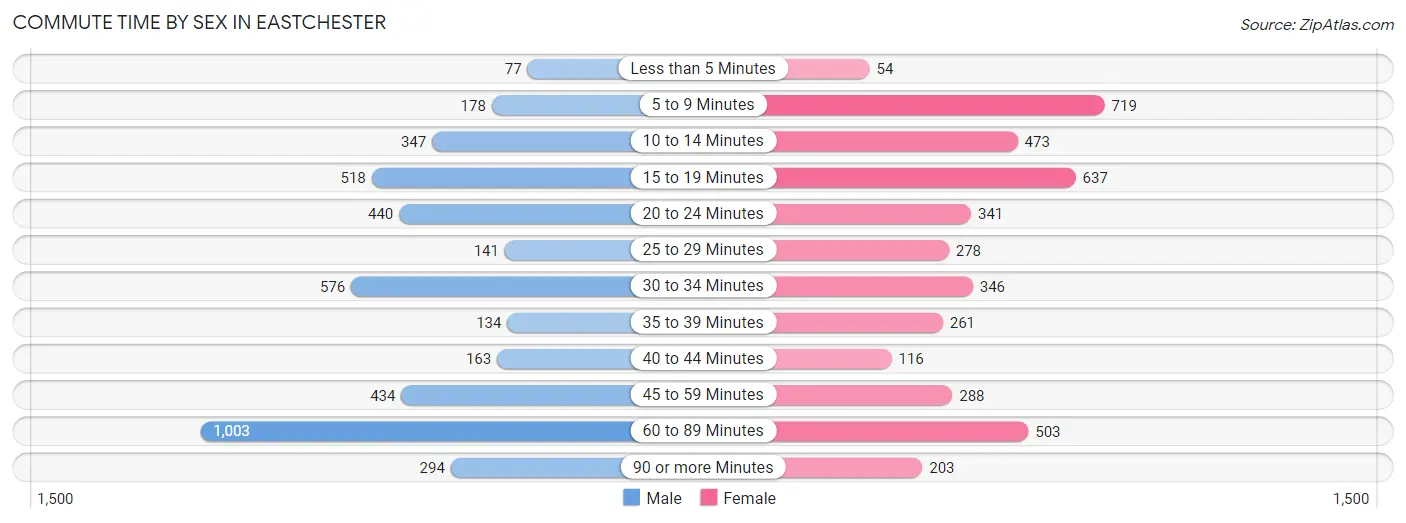
| Commute Time | Male | Female |
| Less than 5 Minutes | 77 (1.8%) | 54 (1.3%) |
| 5 to 9 Minutes | 178 (4.1%) | 719 (17.0%) |
| 10 to 14 Minutes | 347 (8.1%) | 473 (11.2%) |
| 15 to 19 Minutes | 518 (12.0%) | 637 (15.1%) |
| 20 to 24 Minutes | 440 (10.2%) | 341 (8.1%) |
| 25 to 29 Minutes | 141 (3.3%) | 278 (6.6%) |
| 30 to 34 Minutes | 576 (13.4%) | 346 (8.2%) |
| 35 to 39 Minutes | 134 (3.1%) | 261 (6.2%) |
| 40 to 44 Minutes | 163 (3.8%) | 116 (2.8%) |
| 45 to 59 Minutes | 434 (10.1%) | 288 (6.8%) |
| 60 to 89 Minutes | 1,003 (23.3%) | 503 (11.9%) |
| 90 or more Minutes | 294 (6.8%) | 203 (4.8%) |
Time of Departure to Work by Sex in Eastchester
The most frequent times of departure to work in Eastchester are 7:30 AM to 7:59 AM (694, 16.1%) for males and 7:30 AM to 7:59 AM (874, 20.7%) for females.
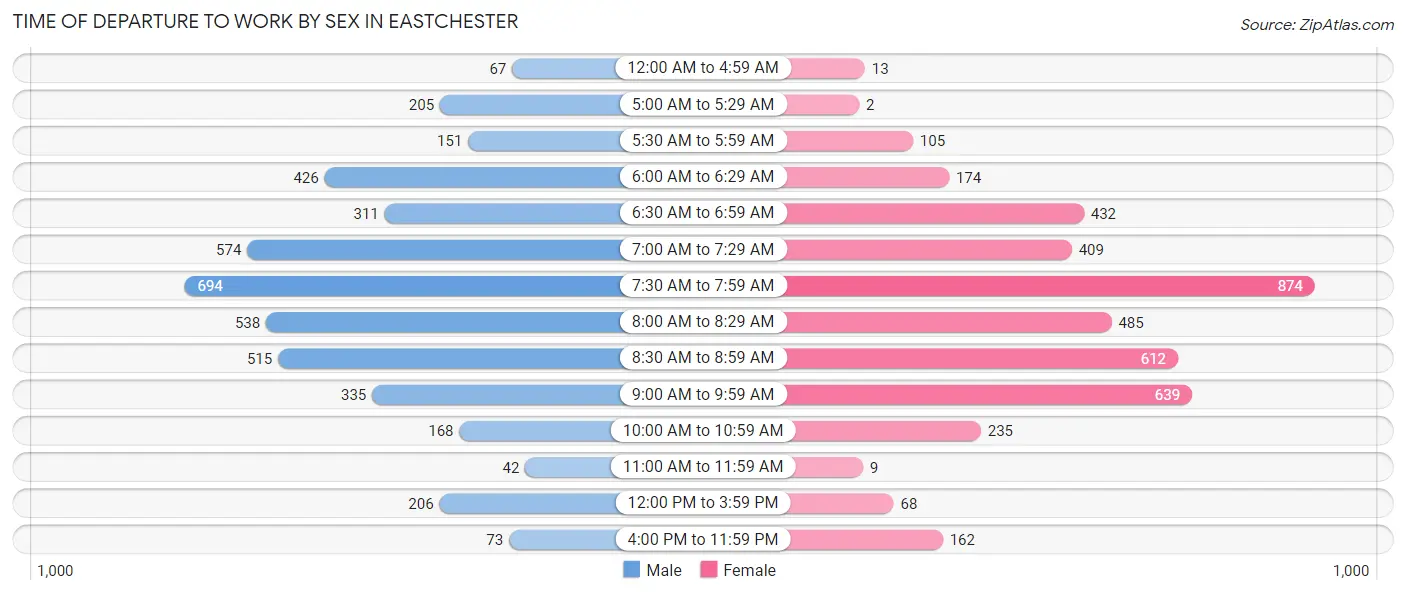
| Time of Departure | Male | Female |
| 12:00 AM to 4:59 AM | 67 (1.6%) | 13 (0.3%) |
| 5:00 AM to 5:29 AM | 205 (4.8%) | 2 (0.1%) |
| 5:30 AM to 5:59 AM | 151 (3.5%) | 105 (2.5%) |
| 6:00 AM to 6:29 AM | 426 (9.9%) | 174 (4.1%) |
| 6:30 AM to 6:59 AM | 311 (7.2%) | 432 (10.2%) |
| 7:00 AM to 7:29 AM | 574 (13.3%) | 409 (9.7%) |
| 7:30 AM to 7:59 AM | 694 (16.1%) | 874 (20.7%) |
| 8:00 AM to 8:29 AM | 538 (12.5%) | 485 (11.5%) |
| 8:30 AM to 8:59 AM | 515 (12.0%) | 612 (14.5%) |
| 9:00 AM to 9:59 AM | 335 (7.8%) | 639 (15.1%) |
| 10:00 AM to 10:59 AM | 168 (3.9%) | 235 (5.6%) |
| 11:00 AM to 11:59 AM | 42 (1.0%) | 9 (0.2%) |
| 12:00 PM to 3:59 PM | 206 (4.8%) | 68 (1.6%) |
| 4:00 PM to 11:59 PM | 73 (1.7%) | 162 (3.8%) |
| Total | 4,305 (100.0%) | 4,219 (100.0%) |
Housing Occupancy in Eastchester
Occupancy by Ownership in Eastchester
Of the total 7,821 dwellings in Eastchester, owner-occupied units account for 6,131 (78.4%), while renter-occupied units make up 1,690 (21.6%).
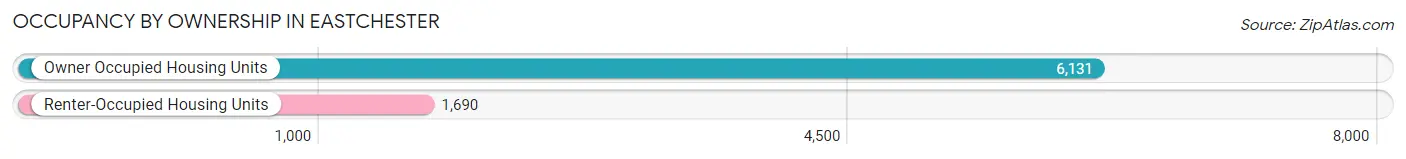
| Occupancy | # Housing Units | % Housing Units |
| Owner Occupied Housing Units | 6,131 | 78.4% |
| Renter-Occupied Housing Units | 1,690 | 21.6% |
| Total Occupied Housing Units | 7,821 | 100.0% |
Occupancy by Household Size in Eastchester
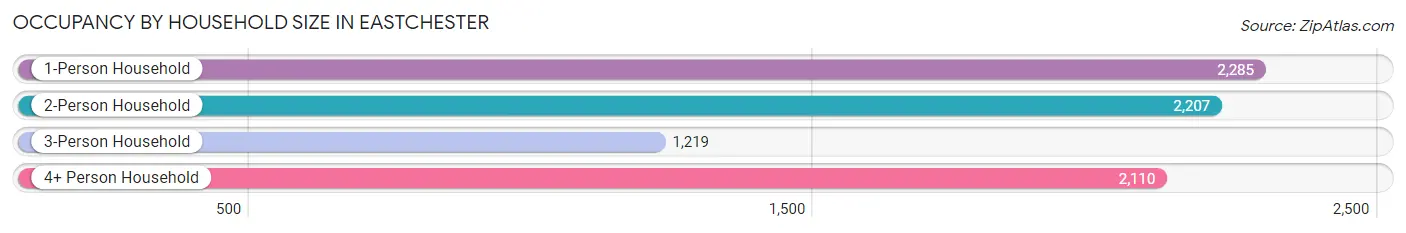
| Household Size | # Housing Units | % Housing Units |
| 1-Person Household | 2,285 | 29.2% |
| 2-Person Household | 2,207 | 28.2% |
| 3-Person Household | 1,219 | 15.6% |
| 4+ Person Household | 2,110 | 27.0% |
| Total Housing Units | 7,821 | 100.0% |
Occupancy by Ownership by Household Size in Eastchester
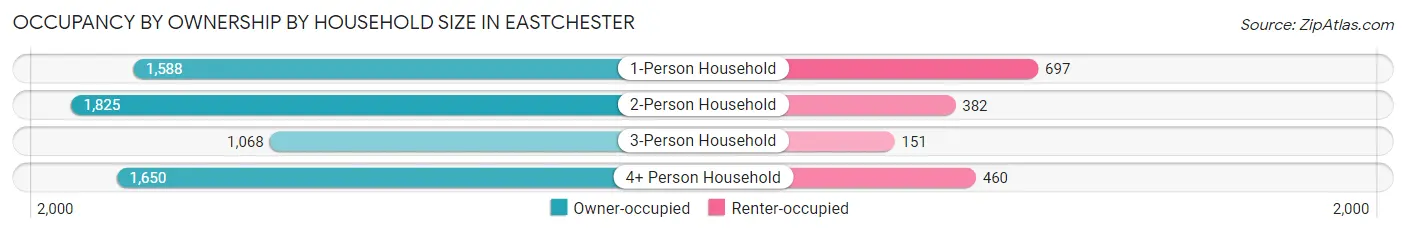
| Household Size | Owner-occupied | Renter-occupied |
| 1-Person Household | 1,588 (69.5%) | 697 (30.5%) |
| 2-Person Household | 1,825 (82.7%) | 382 (17.3%) |
| 3-Person Household | 1,068 (87.6%) | 151 (12.4%) |
| 4+ Person Household | 1,650 (78.2%) | 460 (21.8%) |
| Total Housing Units | 6,131 (78.4%) | 1,690 (21.6%) |
Occupancy by Educational Attainment in Eastchester
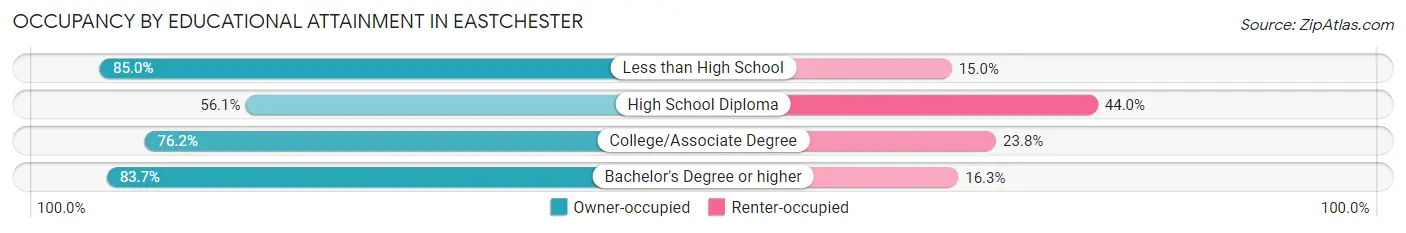
| Household Size | Owner-occupied | Renter-occupied |
| Less than High School | 278 (85.0%) | 49 (15.0%) |
| High School Diploma | 667 (56.0%) | 523 (44.0%) |
| College/Associate Degree | 929 (76.2%) | 290 (23.8%) |
| Bachelor's Degree or higher | 4,257 (83.7%) | 828 (16.3%) |
Occupancy by Age of Householder in Eastchester
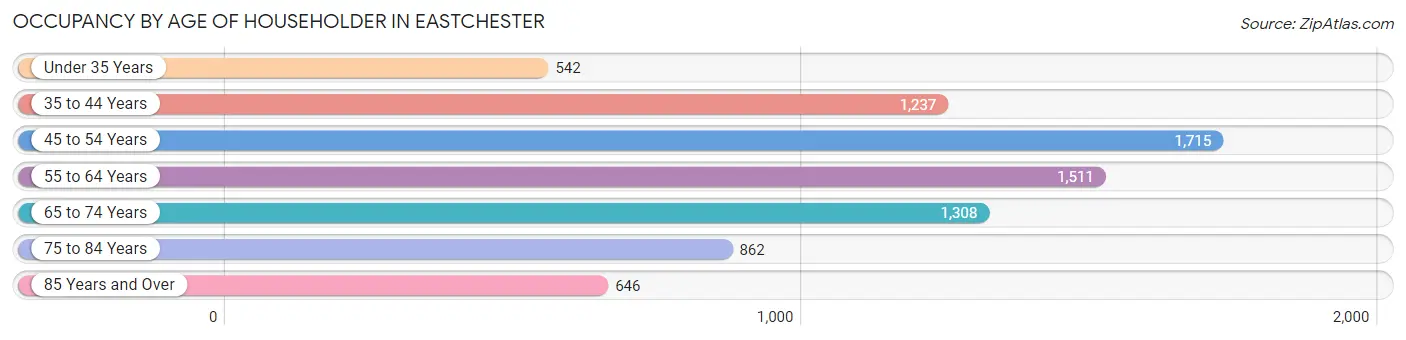
| Age Bracket | # Households | % Households |
| Under 35 Years | 542 | 6.9% |
| 35 to 44 Years | 1,237 | 15.8% |
| 45 to 54 Years | 1,715 | 21.9% |
| 55 to 64 Years | 1,511 | 19.3% |
| 65 to 74 Years | 1,308 | 16.7% |
| 75 to 84 Years | 862 | 11.0% |
| 85 Years and Over | 646 | 8.3% |
| Total | 7,821 | 100.0% |
Housing Finances in Eastchester
Median Income by Occupancy in Eastchester
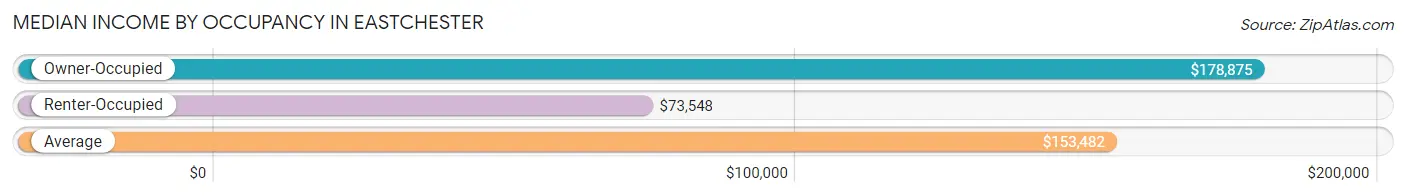
| Occupancy Type | # Households | Median Income |
| Owner-Occupied | 6,131 (78.4%) | $178,875 |
| Renter-Occupied | 1,690 (21.6%) | $73,548 |
| Average | 7,821 (100.0%) | $153,482 |
Occupancy by Householder Income Bracket in Eastchester
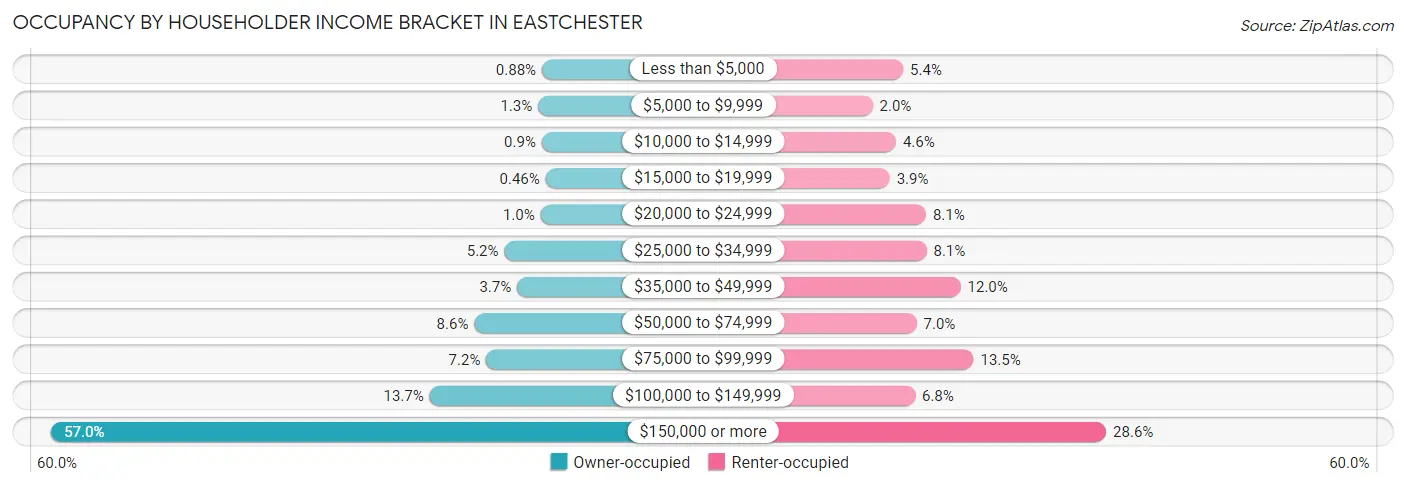
| Income Bracket | Owner-occupied | Renter-occupied |
| Less than $5,000 | 54 (0.9%) | 92 (5.4%) |
| $5,000 to $9,999 | 81 (1.3%) | 33 (1.9%) |
| $10,000 to $14,999 | 55 (0.9%) | 78 (4.6%) |
| $15,000 to $19,999 | 28 (0.5%) | 66 (3.9%) |
| $20,000 to $24,999 | 63 (1.0%) | 136 (8.1%) |
| $25,000 to $34,999 | 317 (5.2%) | 137 (8.1%) |
| $35,000 to $49,999 | 228 (3.7%) | 203 (12.0%) |
| $50,000 to $74,999 | 528 (8.6%) | 118 (7.0%) |
| $75,000 to $99,999 | 444 (7.2%) | 228 (13.5%) |
| $100,000 to $149,999 | 841 (13.7%) | 115 (6.8%) |
| $150,000 or more | 3,492 (57.0%) | 484 (28.6%) |
| Total | 6,131 (100.0%) | 1,690 (100.0%) |
Monthly Housing Cost Tiers in Eastchester
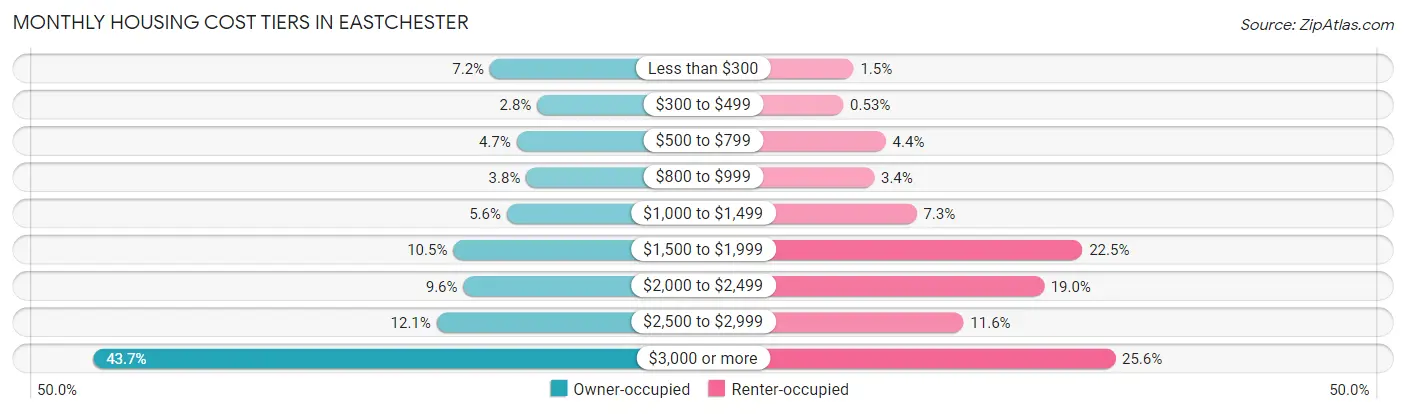
| Monthly Cost | Owner-occupied | Renter-occupied |
| Less than $300 | 439 (7.2%) | 25 (1.5%) |
| $300 to $499 | 172 (2.8%) | 9 (0.5%) |
| $500 to $799 | 289 (4.7%) | 75 (4.4%) |
| $800 to $999 | 234 (3.8%) | 57 (3.4%) |
| $1,000 to $1,499 | 344 (5.6%) | 123 (7.3%) |
| $1,500 to $1,999 | 646 (10.5%) | 381 (22.5%) |
| $2,000 to $2,499 | 589 (9.6%) | 321 (19.0%) |
| $2,500 to $2,999 | 740 (12.1%) | 196 (11.6%) |
| $3,000 or more | 2,678 (43.7%) | 432 (25.6%) |
| Total | 6,131 (100.0%) | 1,690 (100.0%) |
Physical Housing Characteristics in Eastchester
Housing Structures in Eastchester
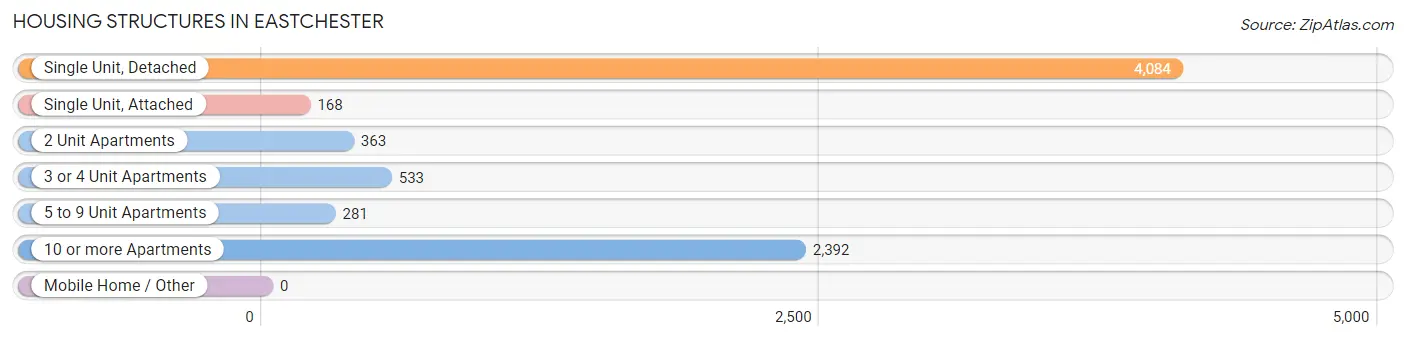
| Structure Type | # Housing Units | % Housing Units |
| Single Unit, Detached | 4,084 | 52.2% |
| Single Unit, Attached | 168 | 2.1% |
| 2 Unit Apartments | 363 | 4.6% |
| 3 or 4 Unit Apartments | 533 | 6.8% |
| 5 to 9 Unit Apartments | 281 | 3.6% |
| 10 or more Apartments | 2,392 | 30.6% |
| Mobile Home / Other | 0 | 0.0% |
| Total | 7,821 | 100.0% |
Housing Structures by Occupancy in Eastchester
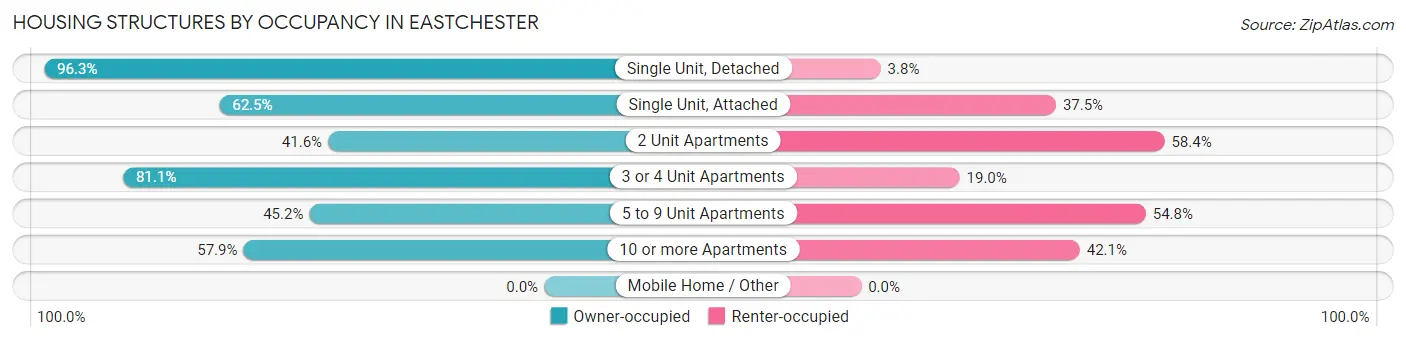
| Structure Type | Owner-occupied | Renter-occupied |
| Single Unit, Detached | 3,931 (96.3%) | 153 (3.7%) |
| Single Unit, Attached | 105 (62.5%) | 63 (37.5%) |
| 2 Unit Apartments | 151 (41.6%) | 212 (58.4%) |
| 3 or 4 Unit Apartments | 432 (81.0%) | 101 (19.0%) |
| 5 to 9 Unit Apartments | 127 (45.2%) | 154 (54.8%) |
| 10 or more Apartments | 1,385 (57.9%) | 1,007 (42.1%) |
| Mobile Home / Other | 0 (0.0%) | 0 (0.0%) |
| Total | 6,131 (78.4%) | 1,690 (21.6%) |
Housing Structures by Number of Rooms in Eastchester
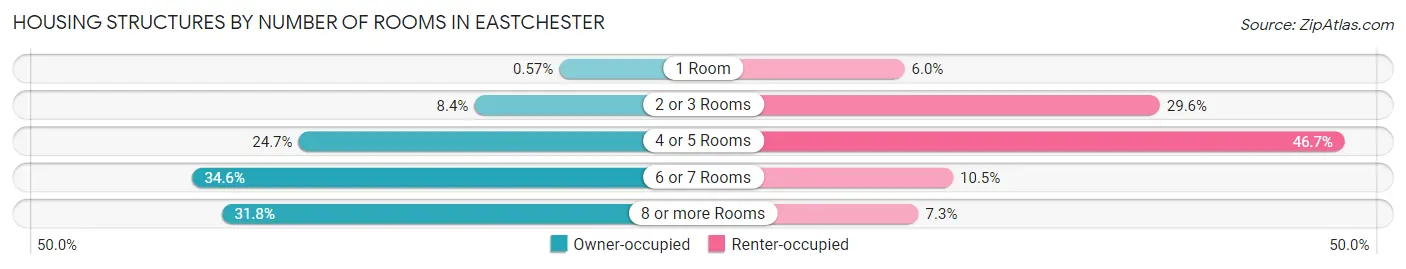
| Number of Rooms | Owner-occupied | Renter-occupied |
| 1 Room | 35 (0.6%) | 101 (6.0%) |
| 2 or 3 Rooms | 516 (8.4%) | 500 (29.6%) |
| 4 or 5 Rooms | 1,513 (24.7%) | 789 (46.7%) |
| 6 or 7 Rooms | 2,118 (34.5%) | 177 (10.5%) |
| 8 or more Rooms | 1,949 (31.8%) | 123 (7.3%) |
| Total | 6,131 (100.0%) | 1,690 (100.0%) |
Housing Structure by Heating Type in Eastchester
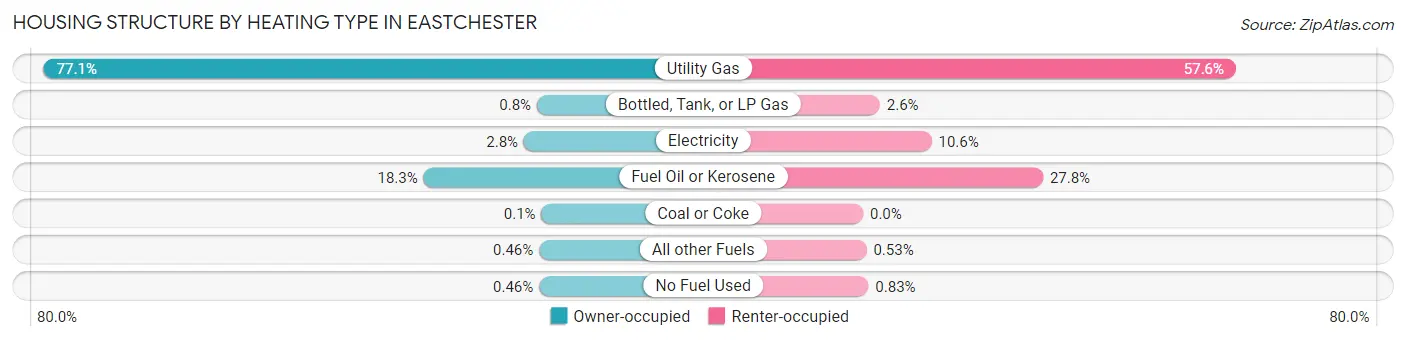
| Heating Type | Owner-occupied | Renter-occupied |
| Utility Gas | 4,724 (77.0%) | 974 (57.6%) |
| Bottled, Tank, or LP Gas | 49 (0.8%) | 44 (2.6%) |
| Electricity | 172 (2.8%) | 179 (10.6%) |
| Fuel Oil or Kerosene | 1,124 (18.3%) | 470 (27.8%) |
| Coal or Coke | 6 (0.1%) | 0 (0.0%) |
| All other Fuels | 28 (0.5%) | 9 (0.5%) |
| No Fuel Used | 28 (0.5%) | 14 (0.8%) |
| Total | 6,131 (100.0%) | 1,690 (100.0%) |
Household Vehicle Usage in Eastchester
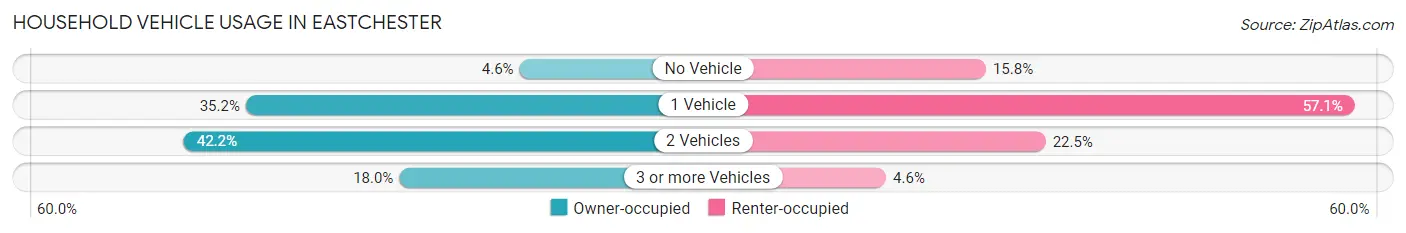
| Vehicles per Household | Owner-occupied | Renter-occupied |
| No Vehicle | 280 (4.6%) | 267 (15.8%) |
| 1 Vehicle | 2,160 (35.2%) | 965 (57.1%) |
| 2 Vehicles | 2,585 (42.2%) | 380 (22.5%) |
| 3 or more Vehicles | 1,106 (18.0%) | 78 (4.6%) |
| Total | 6,131 (100.0%) | 1,690 (100.0%) |
Real Estate & Mortgages in Eastchester
Real Estate and Mortgage Overview in Eastchester
| Characteristic | Without Mortgage | With Mortgage |
| Housing Units | 2,625 | 3,506 |
| Median Property Value | $666,100 | $807,100 |
| Median Household Income | $118,327 | $2,411 |
| Monthly Housing Costs | $1,501 | $2,371 |
| Real Estate Taxes | $10,001 | $426 |
Property Value by Mortgage Status in Eastchester
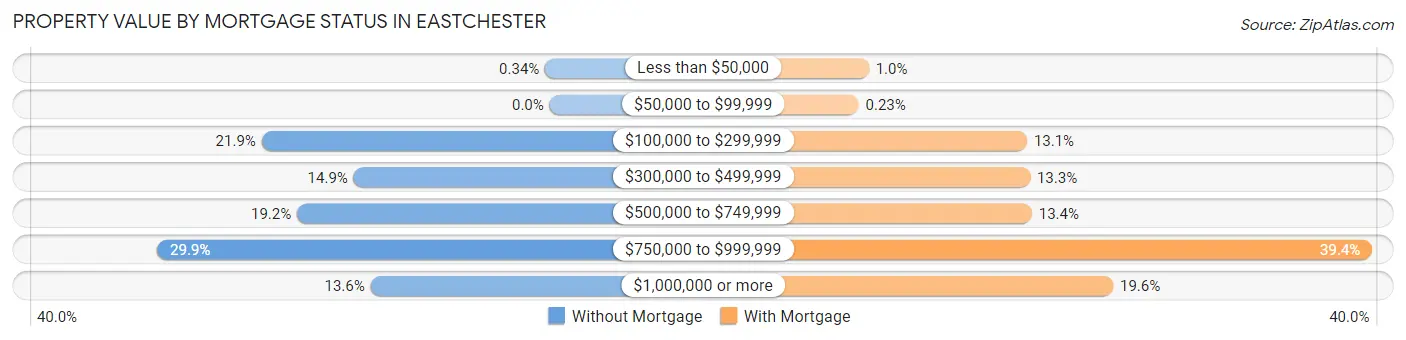
| Property Value | Without Mortgage | With Mortgage |
| Less than $50,000 | 9 (0.3%) | 35 (1.0%) |
| $50,000 to $99,999 | 0 (0.0%) | 8 (0.2%) |
| $100,000 to $299,999 | 576 (21.9%) | 458 (13.1%) |
| $300,000 to $499,999 | 392 (14.9%) | 466 (13.3%) |
| $500,000 to $749,999 | 505 (19.2%) | 471 (13.4%) |
| $750,000 to $999,999 | 785 (29.9%) | 1,380 (39.4%) |
| $1,000,000 or more | 358 (13.6%) | 688 (19.6%) |
| Total | 2,625 (100.0%) | 3,506 (100.0%) |
Household Income by Mortgage Status in Eastchester
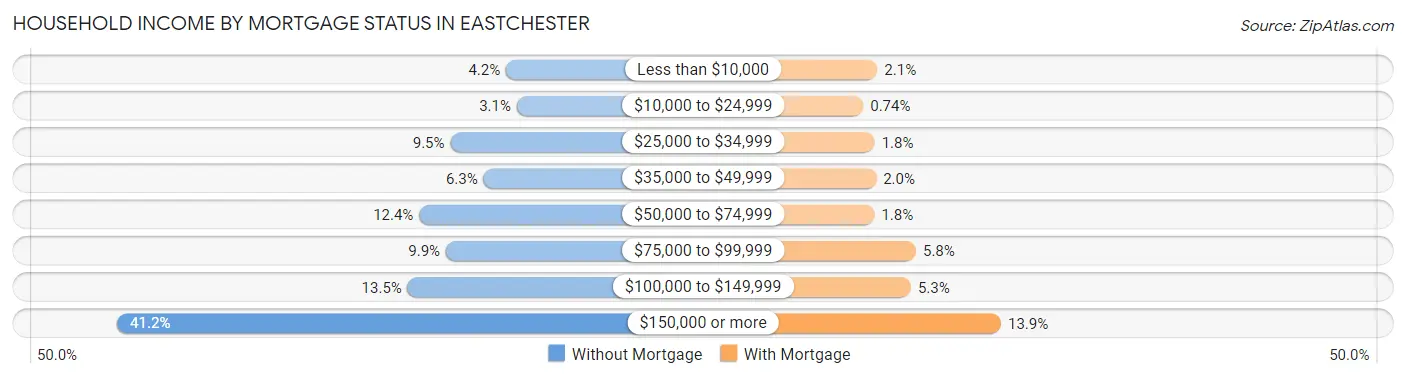
| Household Income | Without Mortgage | With Mortgage |
| Less than $10,000 | 109 (4.2%) | 73 (2.1%) |
| $10,000 to $24,999 | 82 (3.1%) | 26 (0.7%) |
| $25,000 to $34,999 | 248 (9.5%) | 64 (1.8%) |
| $35,000 to $49,999 | 165 (6.3%) | 69 (2.0%) |
| $50,000 to $74,999 | 326 (12.4%) | 63 (1.8%) |
| $75,000 to $99,999 | 259 (9.9%) | 202 (5.8%) |
| $100,000 to $149,999 | 355 (13.5%) | 185 (5.3%) |
| $150,000 or more | 1,081 (41.2%) | 486 (13.9%) |
| Total | 2,625 (100.0%) | 3,506 (100.0%) |
Property Value to Household Income Ratio in Eastchester
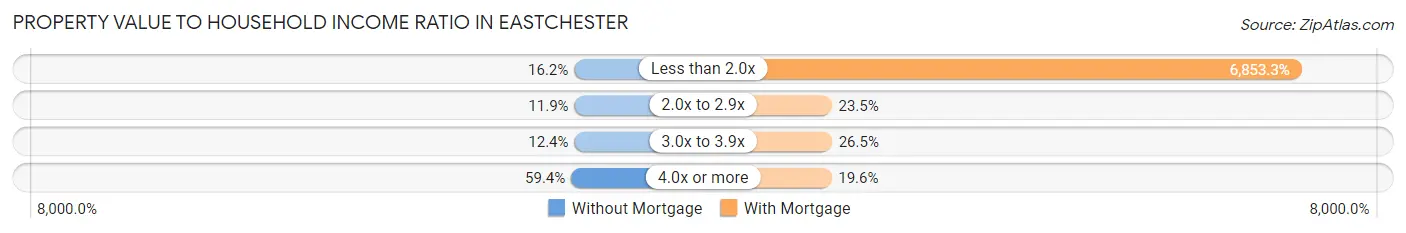
| Value-to-Income Ratio | Without Mortgage | With Mortgage |
| Less than 2.0x | 426 (16.2%) | 240,278 (6,853.3%) |
| 2.0x to 2.9x | 313 (11.9%) | 825 (23.5%) |
| 3.0x to 3.9x | 326 (12.4%) | 928 (26.5%) |
| 4.0x or more | 1,560 (59.4%) | 686 (19.6%) |
| Total | 2,625 (100.0%) | 3,506 (100.0%) |
Real Estate Taxes by Mortgage Status in Eastchester
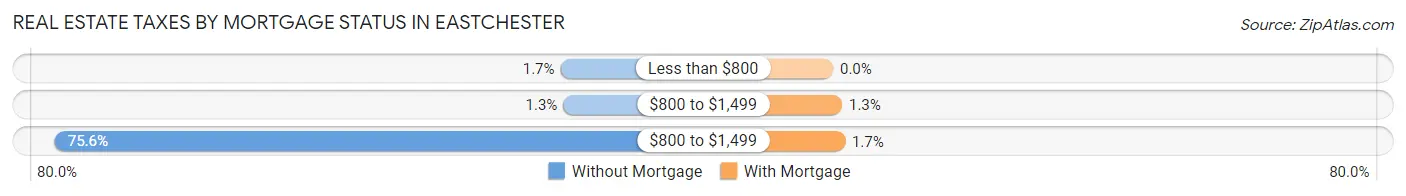
| Property Taxes | Without Mortgage | With Mortgage |
| Less than $800 | 45 (1.7%) | 0 (0.0%) |
| $800 to $1,499 | 34 (1.3%) | 46 (1.3%) |
| $800 to $1,499 | 1,984 (75.6%) | 61 (1.7%) |
| Total | 2,625 (100.0%) | 3,506 (100.0%) |
Health & Disability in Eastchester
Health Insurance Coverage by Age in Eastchester
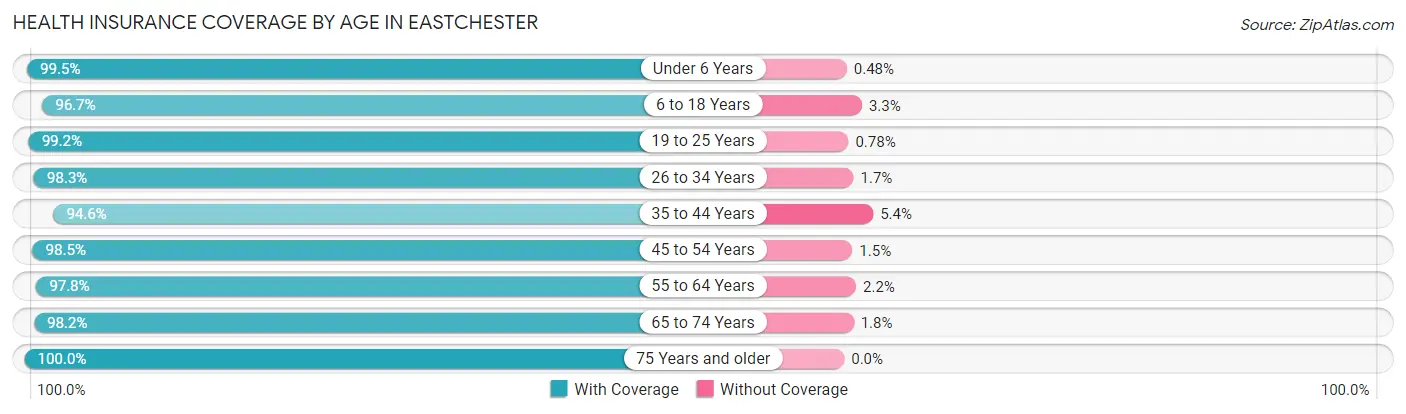
| Age Bracket | With Coverage | Without Coverage |
| Under 6 Years | 1,449 (99.5%) | 7 (0.5%) |
| 6 to 18 Years | 3,312 (96.7%) | 113 (3.3%) |
| 19 to 25 Years | 1,522 (99.2%) | 12 (0.8%) |
| 26 to 34 Years | 1,522 (98.3%) | 27 (1.7%) |
| 35 to 44 Years | 2,474 (94.6%) | 141 (5.4%) |
| 45 to 54 Years | 2,802 (98.5%) | 43 (1.5%) |
| 55 to 64 Years | 2,758 (97.8%) | 62 (2.2%) |
| 65 to 74 Years | 2,234 (98.2%) | 40 (1.8%) |
| 75 Years and older | 2,115 (100.0%) | 0 (0.0%) |
| Total | 20,188 (97.8%) | 445 (2.2%) |
Health Insurance Coverage by Citizenship Status in Eastchester
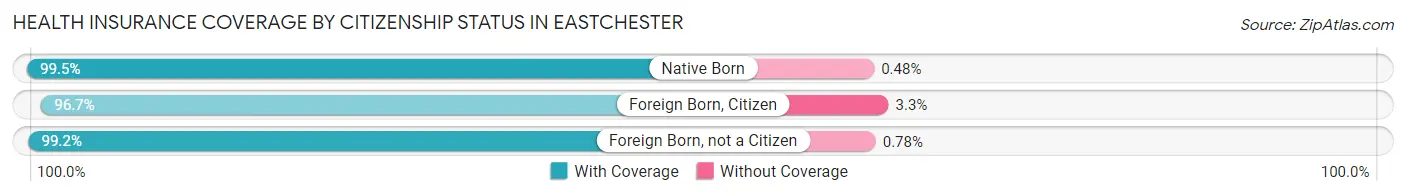
| Citizenship Status | With Coverage | Without Coverage |
| Native Born | 1,449 (99.5%) | 7 (0.5%) |
| Foreign Born, Citizen | 3,312 (96.7%) | 113 (3.3%) |
| Foreign Born, not a Citizen | 1,522 (99.2%) | 12 (0.8%) |
Health Insurance Coverage by Household Income in Eastchester
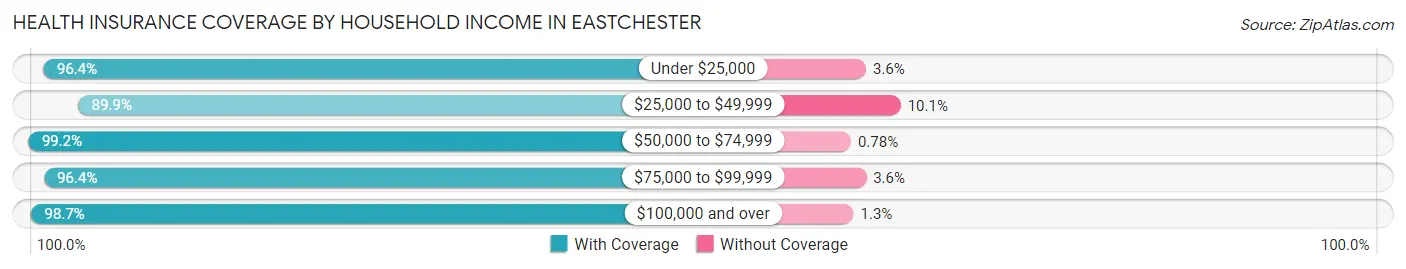
| Household Income | With Coverage | Without Coverage |
| Under $25,000 | 964 (96.4%) | 36 (3.6%) |
| $25,000 to $49,999 | 1,271 (89.9%) | 143 (10.1%) |
| $50,000 to $74,999 | 1,275 (99.2%) | 10 (0.8%) |
| $75,000 to $99,999 | 1,588 (96.4%) | 60 (3.6%) |
| $100,000 and over | 15,059 (98.7%) | 196 (1.3%) |
Public vs Private Health Insurance Coverage by Age in Eastchester
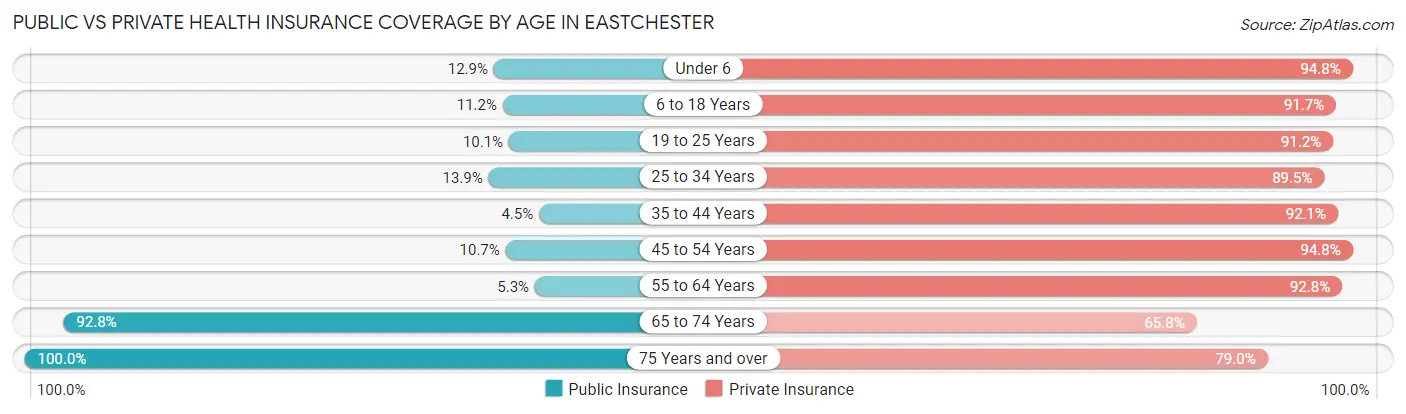
| Age Bracket | Public Insurance | Private Insurance |
| Under 6 | 188 (12.9%) | 1,380 (94.8%) |
| 6 to 18 Years | 385 (11.2%) | 3,142 (91.7%) |
| 19 to 25 Years | 155 (10.1%) | 1,399 (91.2%) |
| 25 to 34 Years | 215 (13.9%) | 1,387 (89.5%) |
| 35 to 44 Years | 118 (4.5%) | 2,407 (92.0%) |
| 45 to 54 Years | 305 (10.7%) | 2,697 (94.8%) |
| 55 to 64 Years | 149 (5.3%) | 2,618 (92.8%) |
| 65 to 74 Years | 2,110 (92.8%) | 1,497 (65.8%) |
| 75 Years and over | 2,115 (100.0%) | 1,671 (79.0%) |
| Total | 5,740 (27.8%) | 18,198 (88.2%) |
Disability Status by Sex by Age in Eastchester
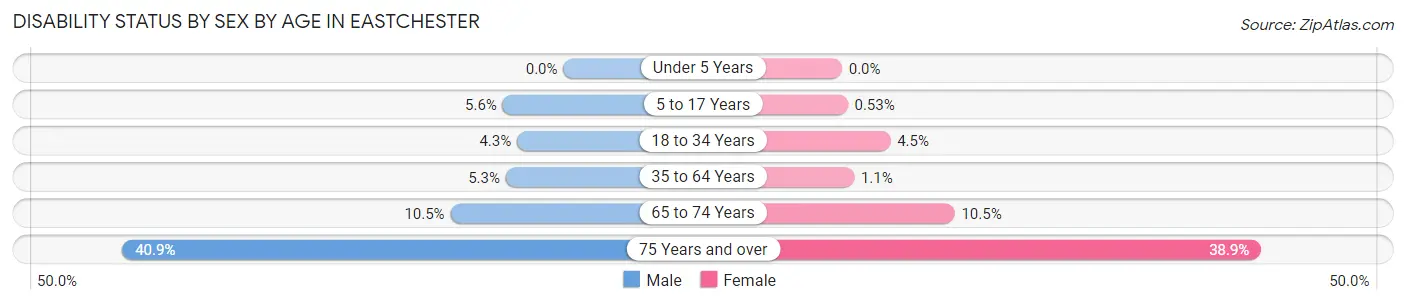
| Age Bracket | Male | Female |
| Under 5 Years | 0 (0.0%) | 0 (0.0%) |
| 5 to 17 Years | 89 (5.6%) | 9 (0.5%) |
| 18 to 34 Years | 72 (4.3%) | 80 (4.5%) |
| 35 to 64 Years | 210 (5.3%) | 49 (1.1%) |
| 65 to 74 Years | 112 (10.5%) | 126 (10.5%) |
| 75 Years and over | 341 (40.9%) | 499 (38.9%) |
Disability Class by Sex by Age in Eastchester
Disability Class: Hearing Difficulty
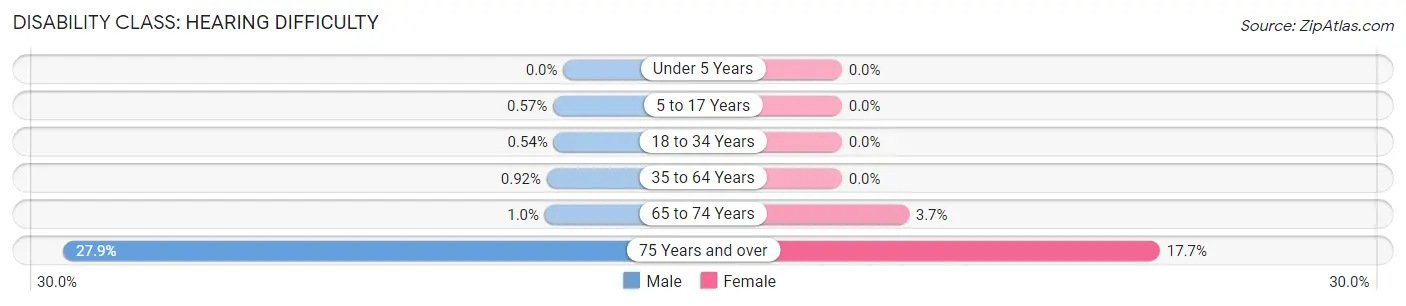
| Age Bracket | Male | Female |
| Under 5 Years | 0 (0.0%) | 0 (0.0%) |
| 5 to 17 Years | 9 (0.6%) | 0 (0.0%) |
| 18 to 34 Years | 9 (0.5%) | 0 (0.0%) |
| 35 to 64 Years | 36 (0.9%) | 0 (0.0%) |
| 65 to 74 Years | 11 (1.0%) | 45 (3.7%) |
| 75 Years and over | 232 (27.9%) | 227 (17.7%) |
Disability Class: Vision Difficulty
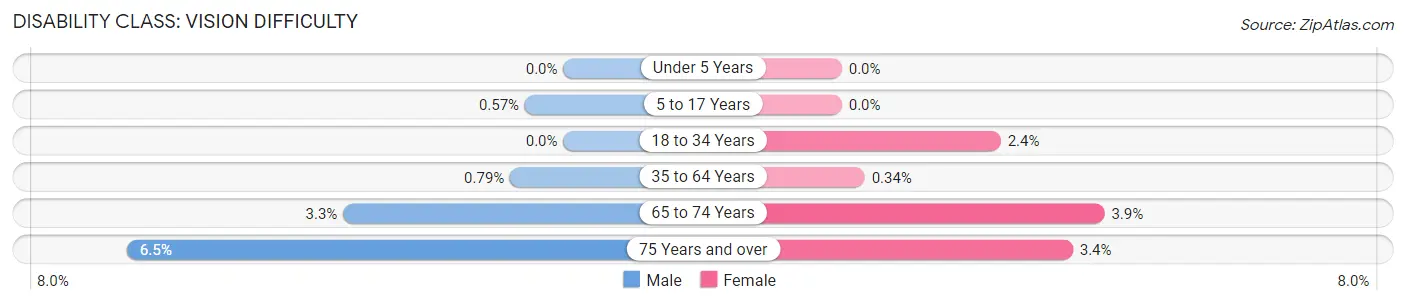
| Age Bracket | Male | Female |
| Under 5 Years | 0 (0.0%) | 0 (0.0%) |
| 5 to 17 Years | 9 (0.6%) | 0 (0.0%) |
| 18 to 34 Years | 0 (0.0%) | 42 (2.4%) |
| 35 to 64 Years | 31 (0.8%) | 15 (0.3%) |
| 65 to 74 Years | 35 (3.3%) | 47 (3.9%) |
| 75 Years and over | 54 (6.5%) | 44 (3.4%) |
Disability Class: Cognitive Difficulty
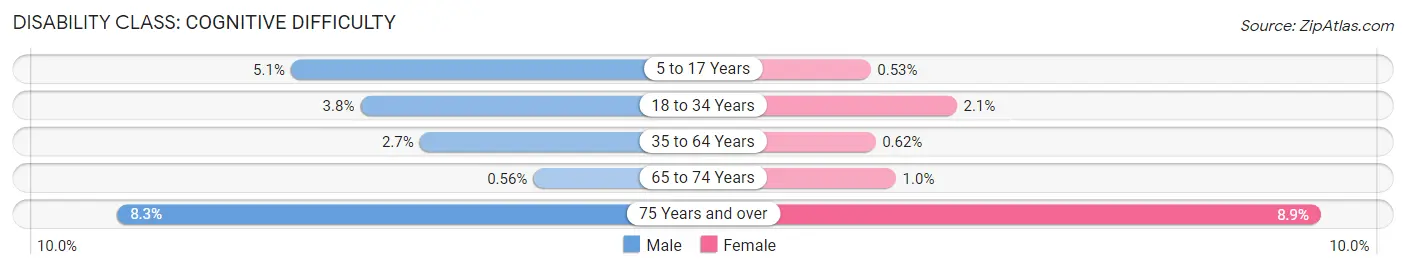
| Age Bracket | Male | Female |
| 5 to 17 Years | 80 (5.1%) | 9 (0.5%) |
| 18 to 34 Years | 63 (3.8%) | 38 (2.1%) |
| 35 to 64 Years | 105 (2.7%) | 27 (0.6%) |
| 65 to 74 Years | 6 (0.6%) | 12 (1.0%) |
| 75 Years and over | 69 (8.3%) | 114 (8.9%) |
Disability Class: Ambulatory Difficulty
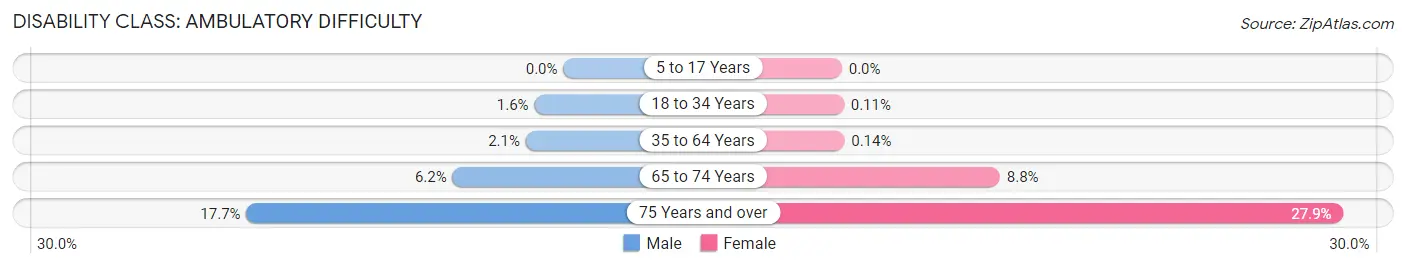
| Age Bracket | Male | Female |
| 5 to 17 Years | 0 (0.0%) | 0 (0.0%) |
| 18 to 34 Years | 27 (1.6%) | 2 (0.1%) |
| 35 to 64 Years | 82 (2.1%) | 6 (0.1%) |
| 65 to 74 Years | 66 (6.2%) | 106 (8.8%) |
| 75 Years and over | 147 (17.6%) | 358 (27.9%) |
Disability Class: Self-Care Difficulty

| Age Bracket | Male | Female |
| 5 to 17 Years | 55 (3.5%) | 0 (0.0%) |
| 18 to 34 Years | 25 (1.5%) | 2 (0.1%) |
| 35 to 64 Years | 17 (0.4%) | 12 (0.3%) |
| 65 to 74 Years | 0 (0.0%) | 47 (3.9%) |
| 75 Years and over | 73 (8.8%) | 219 (17.1%) |
Technology Access in Eastchester
Computing Device Access in Eastchester
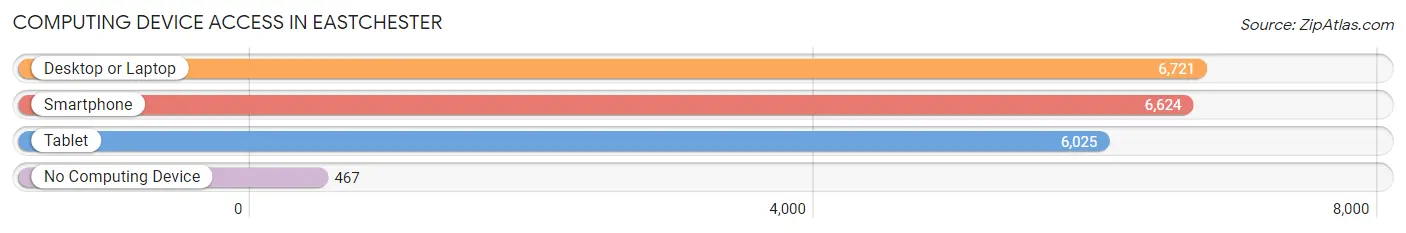
| Device Type | # Households | % Households |
| Desktop or Laptop | 6,721 | 85.9% |
| Smartphone | 6,624 | 84.7% |
| Tablet | 6,025 | 77.0% |
| No Computing Device | 467 | 6.0% |
| Total | 7,821 | 100.0% |
Internet Access in Eastchester
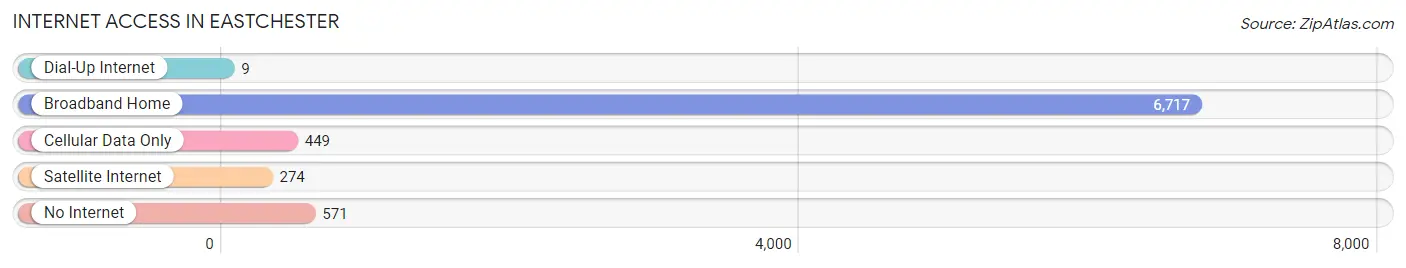
| Internet Type | # Households | % Households |
| Dial-Up Internet | 9 | 0.1% |
| Broadband Home | 6,717 | 85.9% |
| Cellular Data Only | 449 | 5.7% |
| Satellite Internet | 274 | 3.5% |
| No Internet | 571 | 7.3% |
| Total | 7,821 | 100.0% |
Eastchester Summary
History
The history of Eastchester, New York dates back to 1664 when the area was purchased from the Native Americans by Thomas Pell. The area was originally part of the town of Westchester, but in 1788 it was incorporated as the town of Eastchester. The town was named after Eastchester, England, which was the hometown of Thomas Pell.
The town of Eastchester was originally an agricultural community, with many farms and orchards. In the late 19th century, the town began to develop into a residential community, with the construction of the New York and Harlem Railroad in 1848. This allowed for easy access to New York City, and the town began to attract more residents.
In the early 20th century, Eastchester began to experience a population boom, as many people moved to the area from New York City. This influx of people led to the development of many new businesses and industries, including the Eastchester Manufacturing Company, which produced a variety of products, including furniture, clothing, and toys.
The town of Eastchester continued to grow throughout the 20th century, and by the year 2000, it had a population of over 32,000 people.
Geography
Eastchester is located in Westchester County, New York, about 25 miles north of New York City. The town is bordered by the towns of Scarsdale to the north, New Rochelle to the east, Mount Vernon to the south, and White Plains to the west.
The town of Eastchester covers an area of 5.3 square miles, and is mostly made up of residential neighborhoods. The town is home to several parks, including the Eastchester Bay Park, which offers a variety of recreational activities, such as swimming, fishing, and boating.
Economy
The economy of Eastchester is largely based on the service industry, with many residents employed in retail, healthcare, and education. The town is also home to several large corporations, including PepsiCo, which has its headquarters in Eastchester.
The town is also home to several small businesses, including restaurants, shops, and professional services.
Demographics
As of the 2010 census, the population of Eastchester was 32,363. The racial makeup of the town was 79.2% White, 11.2% African American, 0.3% Native American, 4.2% Asian, and 4.9% from other races. Hispanic or Latino of any race were 11.7% of the population.
The median household income in Eastchester was $90,945, and the median family income was $106,945. The per capita income was $41,945. About 4.2% of families and 5.7% of the population were below the poverty line.
Common Questions
What is Per Capita Income in Eastchester?
Per Capita income in Eastchester is $80,902.
What is the Median Family Income in Eastchester?
Median Family Income in Eastchester is $217,375.
What is the Median Household income in Eastchester?
Median Household Income in Eastchester is $153,482.
What is Income or Wage Gap in Eastchester?
Income or Wage Gap in Eastchester is 34.1%.
Women in Eastchester earn 65.9 cents for every dollar earned by a man.
What is Family Income Deficit in Eastchester?
Family Income Deficit in Eastchester is $13,101.
Families that are below poverty line in Eastchester earn $13,101 less on average than the poverty threshold level.
What is Inequality or Gini Index in Eastchester?
Inequality or Gini Index in Eastchester is 0.48.
What is the Total Population of Eastchester?
Total Population of Eastchester is 20,633.
What is the Total Male Population of Eastchester?
Total Male Population of Eastchester is 9,817.
What is the Total Female Population of Eastchester?
Total Female Population of Eastchester is 10,816.
What is the Ratio of Males per 100 Females in Eastchester?
There are 90.76 Males per 100 Females in Eastchester.
What is the Ratio of Females per 100 Males in Eastchester?
There are 110.18 Females per 100 Males in Eastchester.
What is the Median Population Age in Eastchester?
Median Population Age in Eastchester is 44.1 Years.
What is the Average Family Size in Eastchester
Average Family Size in Eastchester is 3.4 People.
What is the Average Household Size in Eastchester
Average Household Size in Eastchester is 2.6 People.
How Large is the Labor Force in Eastchester?
There are 10,365 People in the Labor Forcein in Eastchester.
What is the Percentage of People in the Labor Force in Eastchester?
62.5% of People are in the Labor Force in Eastchester.
What is the Unemployment Rate in Eastchester?
Unemployment Rate in Eastchester is 3.2%.