Tarrytown, NY Map & Demographics
Tarrytown Map
Tarrytown Overview
$74,362
PER CAPITA INCOME
$161,120
AVG FAMILY INCOME
$109,945
AVG HOUSEHOLD INCOME
25.8%
WAGE / INCOME GAP [ % ]
74.2¢/ $1
WAGE / INCOME GAP [ $ ]
0.49
INEQUALITY / GINI INDEX
11,776
TOTAL POPULATION
5,841
MALE POPULATION
5,935
FEMALE POPULATION
98.42
MALES / 100 FEMALES
101.61
FEMALES / 100 MALES
42.9
MEDIAN AGE
3.0
AVG FAMILY SIZE
2.3
AVG HOUSEHOLD SIZE
6,371
LABOR FORCE [ PEOPLE ]
63.6%
PERCENT IN LABOR FORCE
2.8%
UNEMPLOYMENT RATE
Tarrytown Zip Codes
Tarrytown Area Codes
Income in Tarrytown
Income Overview in Tarrytown
Per Capita Income in Tarrytown is $74,362, while median incomes of families and households are $161,120 and $109,945 respectively.
| Characteristic | Number | Measure |
| Per Capita Income | 11,776 | $74,362 |
| Median Family Income | 2,896 | $161,120 |
| Mean Family Income | 2,896 | $224,345 |
| Median Household Income | 4,921 | $109,945 |
| Mean Household Income | 4,921 | $173,382 |
| Income Deficit | 2,896 | $0 |
| Wage / Income Gap (%) | 11,776 | 25.80% |
| Wage / Income Gap ($) | 11,776 | 74.20¢ per $1 |
| Gini / Inequality Index | 11,776 | 0.49 |
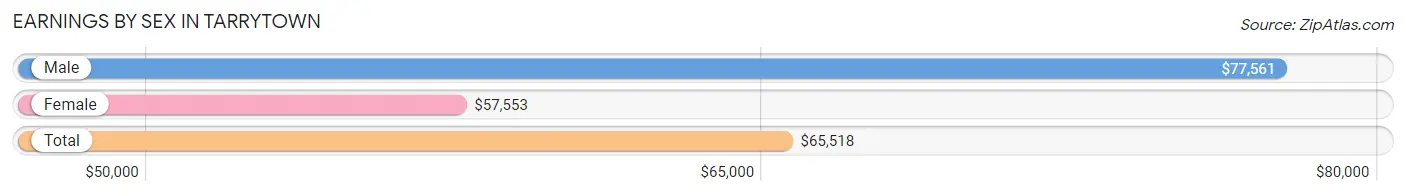
Earnings by Sex in Tarrytown
Average Earnings in Tarrytown are $65,518, $77,561 for men and $57,553 for women, a difference of 25.8%.
| Sex | Number | Average Earnings |
| Male | 3,701 (54.4%) | $77,561 |
| Female | 3,104 (45.6%) | $57,553 |
| Total | 6,805 (100.0%) | $65,518 |
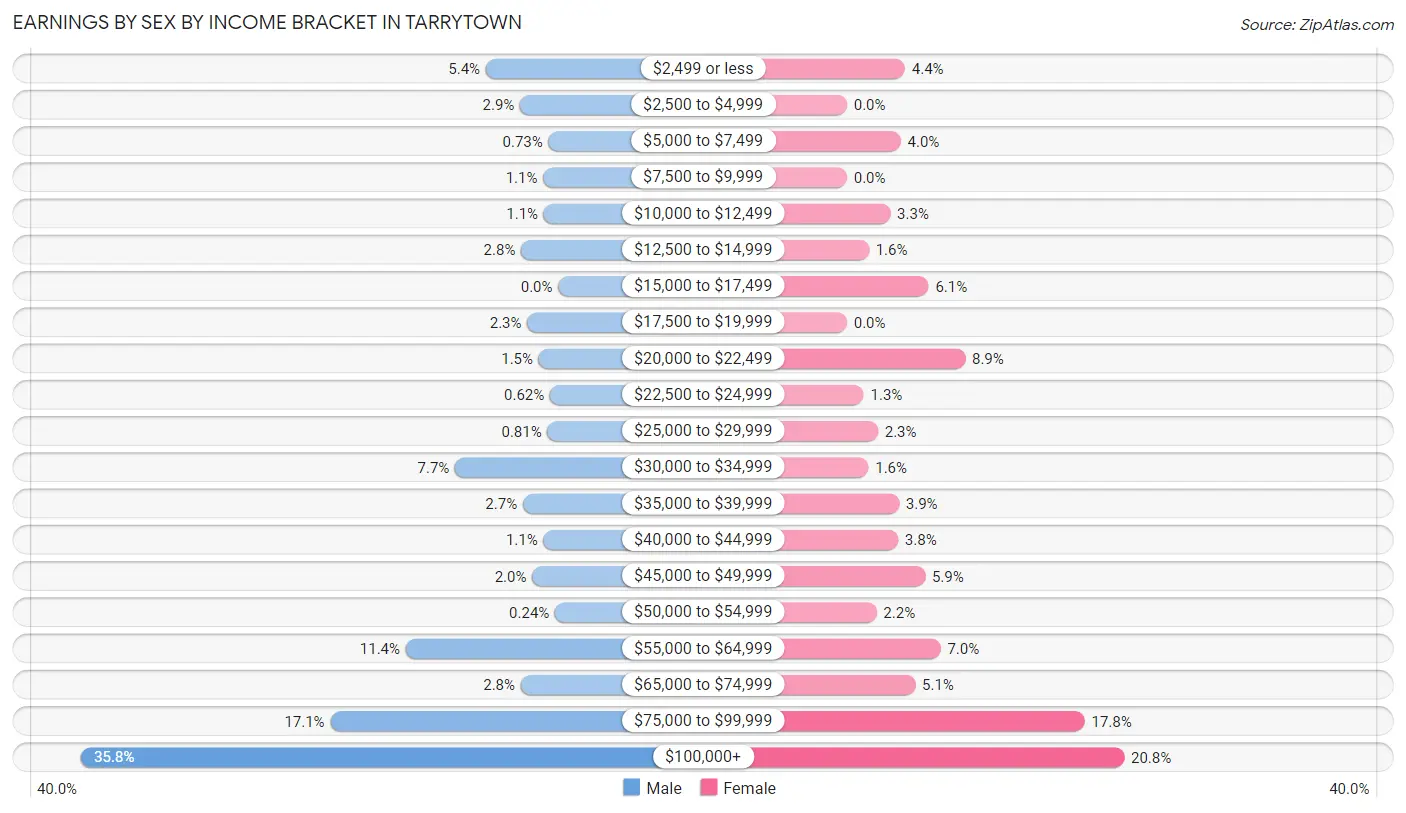
Earnings by Sex by Income Bracket in Tarrytown
The most common earnings brackets in Tarrytown are $100,000+ for men (1,324 | 35.8%) and $100,000+ for women (645 | 20.8%).
| Income | Male | Female |
| $2,499 or less | 201 (5.4%) | 135 (4.3%) |
| $2,500 to $4,999 | 106 (2.9%) | 0 (0.0%) |
| $5,000 to $7,499 | 27 (0.7%) | 125 (4.0%) |
| $7,500 to $9,999 | 42 (1.1%) | 0 (0.0%) |
| $10,000 to $12,499 | 40 (1.1%) | 101 (3.3%) |
| $12,500 to $14,999 | 103 (2.8%) | 51 (1.6%) |
| $15,000 to $17,499 | 0 (0.0%) | 190 (6.1%) |
| $17,500 to $19,999 | 86 (2.3%) | 0 (0.0%) |
| $20,000 to $22,499 | 54 (1.5%) | 275 (8.9%) |
| $22,500 to $24,999 | 23 (0.6%) | 39 (1.3%) |
| $25,000 to $29,999 | 30 (0.8%) | 72 (2.3%) |
| $30,000 to $34,999 | 286 (7.7%) | 50 (1.6%) |
| $35,000 to $39,999 | 98 (2.6%) | 121 (3.9%) |
| $40,000 to $44,999 | 41 (1.1%) | 119 (3.8%) |
| $45,000 to $49,999 | 72 (1.9%) | 182 (5.9%) |
| $50,000 to $54,999 | 9 (0.2%) | 69 (2.2%) |
| $55,000 to $64,999 | 423 (11.4%) | 218 (7.0%) |
| $65,000 to $74,999 | 104 (2.8%) | 159 (5.1%) |
| $75,000 to $99,999 | 632 (17.1%) | 553 (17.8%) |
| $100,000+ | 1,324 (35.8%) | 645 (20.8%) |
| Total | 3,701 (100.0%) | 3,104 (100.0%) |
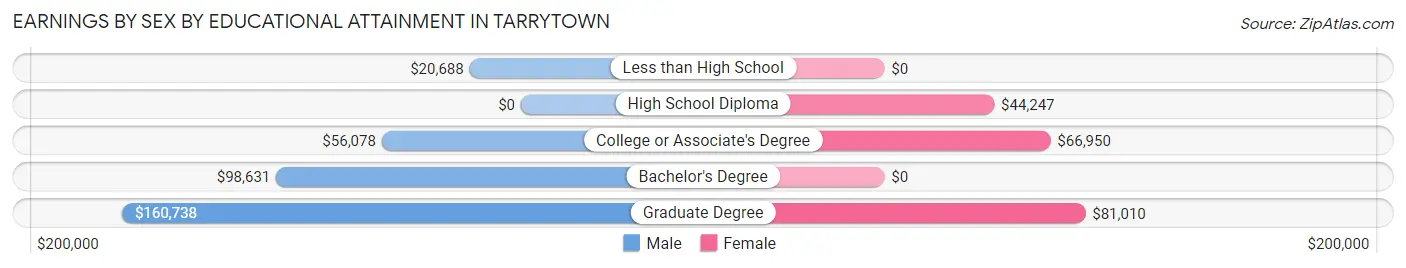
Earnings by Sex by Educational Attainment in Tarrytown
Average earnings in Tarrytown are $85,074 for men and $60,451 for women, a difference of 28.9%. Men with an educational attainment of graduate degree enjoy the highest average annual earnings of $160,738, while those with less than high school education earn the least with $20,688. Women with an educational attainment of graduate degree earn the most with the average annual earnings of $81,010, while those with high school diploma education have the smallest earnings of $44,247.
| Educational Attainment | Male Income | Female Income |
| Less than High School | $20,688 | $0 |
| High School Diploma | - | - |
| College or Associate's Degree | $56,078 | $66,950 |
| Bachelor's Degree | $98,631 | $0 |
| Graduate Degree | $160,738 | $81,010 |
| Total | $85,074 | $60,451 |
Family Income in Tarrytown
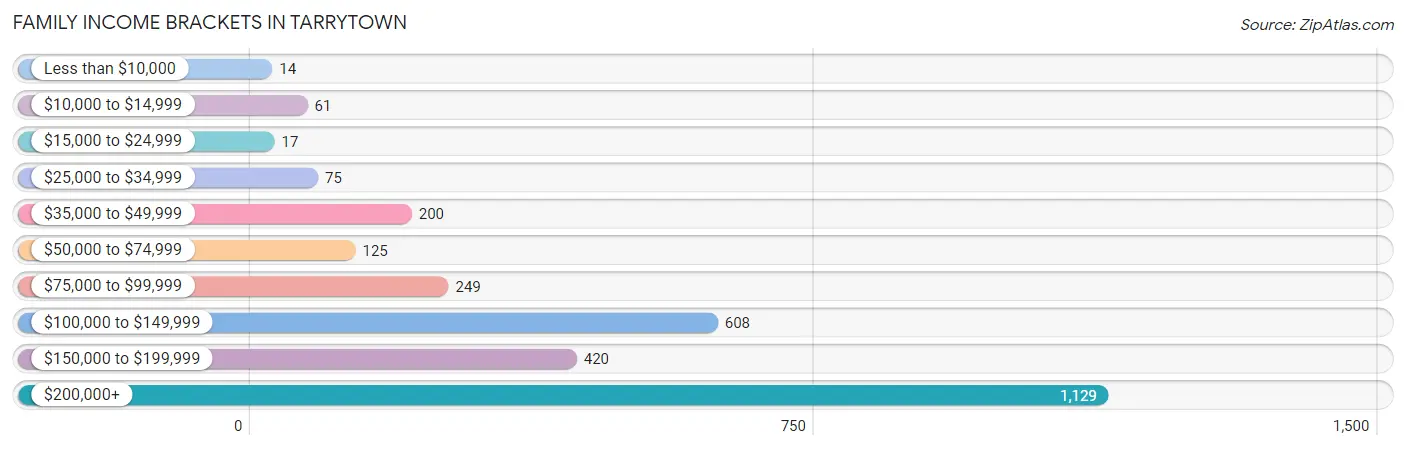
Family Income Brackets in Tarrytown
According to the Tarrytown family income data, there are 1,129 families falling into the $200,000+ income range, which is the most common income bracket and makes up 39.0% of all families. Conversely, the less than $10,000 income bracket is the least frequent group with only 14 families (0.5%) belonging to this category.
| Income Bracket | # Families | % Families |
| Less than $10,000 | 14 | 0.5% |
| $10,000 to $14,999 | 61 | 2.1% |
| $15,000 to $24,999 | 17 | 0.6% |
| $25,000 to $34,999 | 75 | 2.6% |
| $35,000 to $49,999 | 200 | 6.9% |
| $50,000 to $74,999 | 125 | 4.3% |
| $75,000 to $99,999 | 249 | 8.6% |
| $100,000 to $149,999 | 608 | 21.0% |
| $150,000 to $199,999 | 420 | 14.5% |
| $200,000+ | 1,129 | 39.0% |
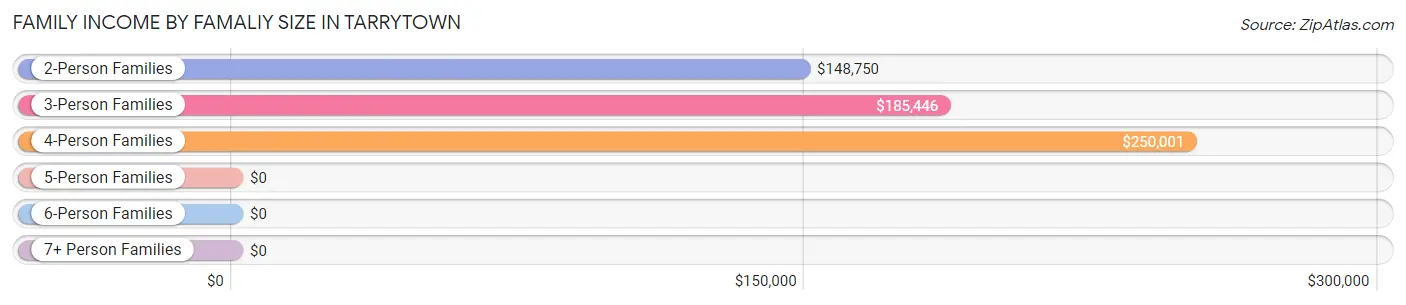
Family Income by Famaliy Size in Tarrytown
4-person families (390 | 13.5%) account for the highest median family income in Tarrytown with $250,001 per family, while 2-person families (1,482 | 51.2%) have the highest median income of $74,375 per family member.
| Income Bracket | # Families | Median Income |
| 2-Person Families | 1,482 (51.2%) | $148,750 |
| 3-Person Families | 662 (22.9%) | $185,446 |
| 4-Person Families | 390 (13.5%) | $250,001 |
| 5-Person Families | 342 (11.8%) | $0 |
| 6-Person Families | 7 (0.2%) | $0 |
| 7+ Person Families | 13 (0.4%) | $0 |
| Total | 2,896 (100.0%) | $161,120 |
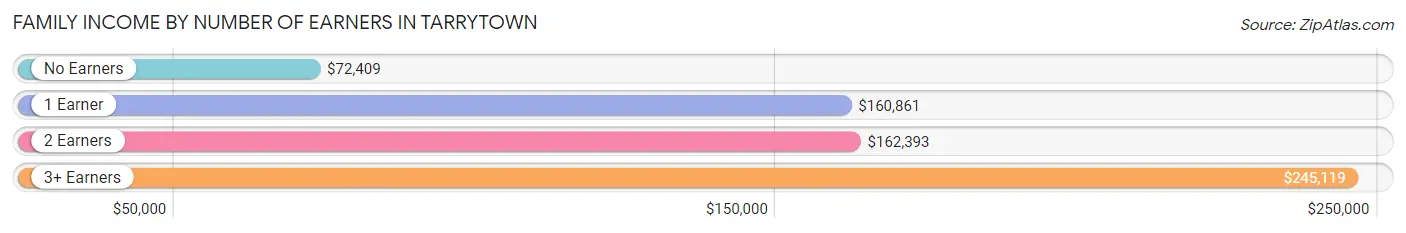
Family Income by Number of Earners in Tarrytown
The median family income in Tarrytown is $161,120, with families comprising 3+ earners (304) having the highest median family income of $245,119, while families with no earners (337) have the lowest median family income of $72,409, accounting for 10.5% and 11.6% of families, respectively.
| Number of Earners | # Families | Median Income |
| No Earners | 337 (11.6%) | $72,409 |
| 1 Earner | 808 (27.9%) | $160,861 |
| 2 Earners | 1,447 (50.0%) | $162,393 |
| 3+ Earners | 304 (10.5%) | $245,119 |
| Total | 2,896 (100.0%) | $161,120 |
Household Income in Tarrytown
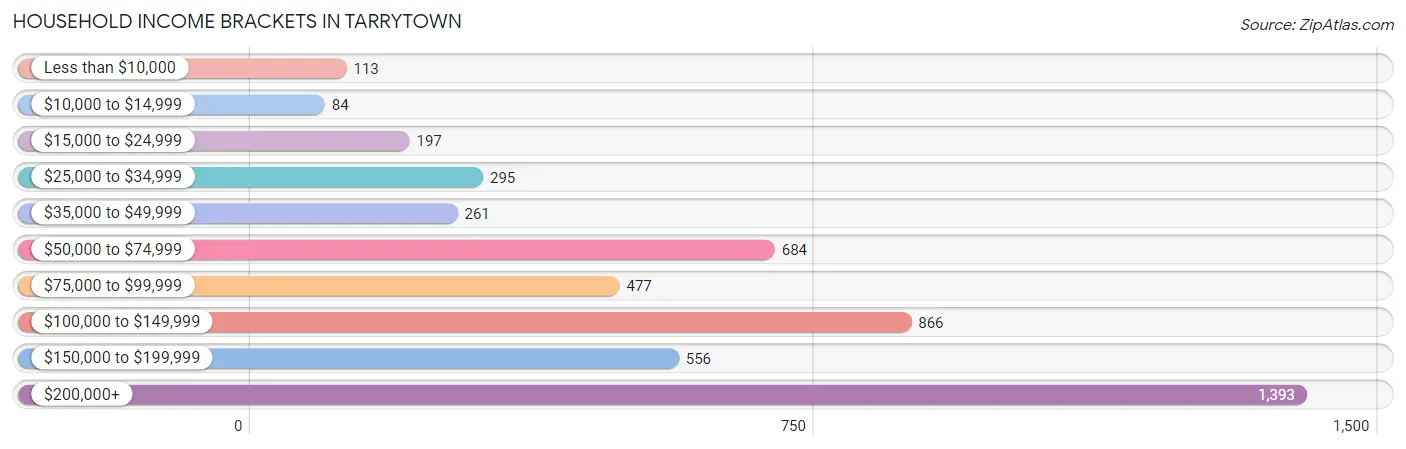
Household Income Brackets in Tarrytown
With 1,393 households falling in the category, the $200,000+ income range is the most frequent in Tarrytown, accounting for 28.3% of all households. In contrast, only 84 households (1.7%) fall into the $10,000 to $14,999 income bracket, making it the least populous group.
| Income Bracket | # Households | % Households |
| Less than $10,000 | 113 | 2.3% |
| $10,000 to $14,999 | 84 | 1.7% |
| $15,000 to $24,999 | 197 | 4.0% |
| $25,000 to $34,999 | 295 | 6.0% |
| $35,000 to $49,999 | 261 | 5.3% |
| $50,000 to $74,999 | 684 | 13.9% |
| $75,000 to $99,999 | 477 | 9.7% |
| $100,000 to $149,999 | 866 | 17.6% |
| $150,000 to $199,999 | 556 | 11.3% |
| $200,000+ | 1,393 | 28.3% |
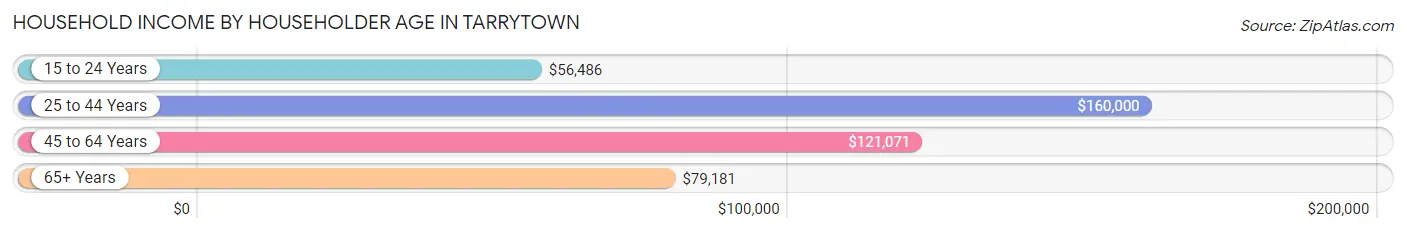
Household Income by Householder Age in Tarrytown
The median household income in Tarrytown is $109,945, with the highest median household income of $160,000 found in the 25 to 44 years age bracket for the primary householder. A total of 1,244 households (25.3%) fall into this category. Meanwhile, the 15 to 24 years age bracket for the primary householder has the lowest median household income of $56,486, with 226 households (4.6%) in this group.
| Income Bracket | # Households | Median Income |
| 15 to 24 Years | 226 (4.6%) | $56,486 |
| 25 to 44 Years | 1,244 (25.3%) | $160,000 |
| 45 to 64 Years | 1,692 (34.4%) | $121,071 |
| 65+ Years | 1,759 (35.7%) | $79,181 |
| Total | 4,921 (100.0%) | $109,945 |
Poverty in Tarrytown
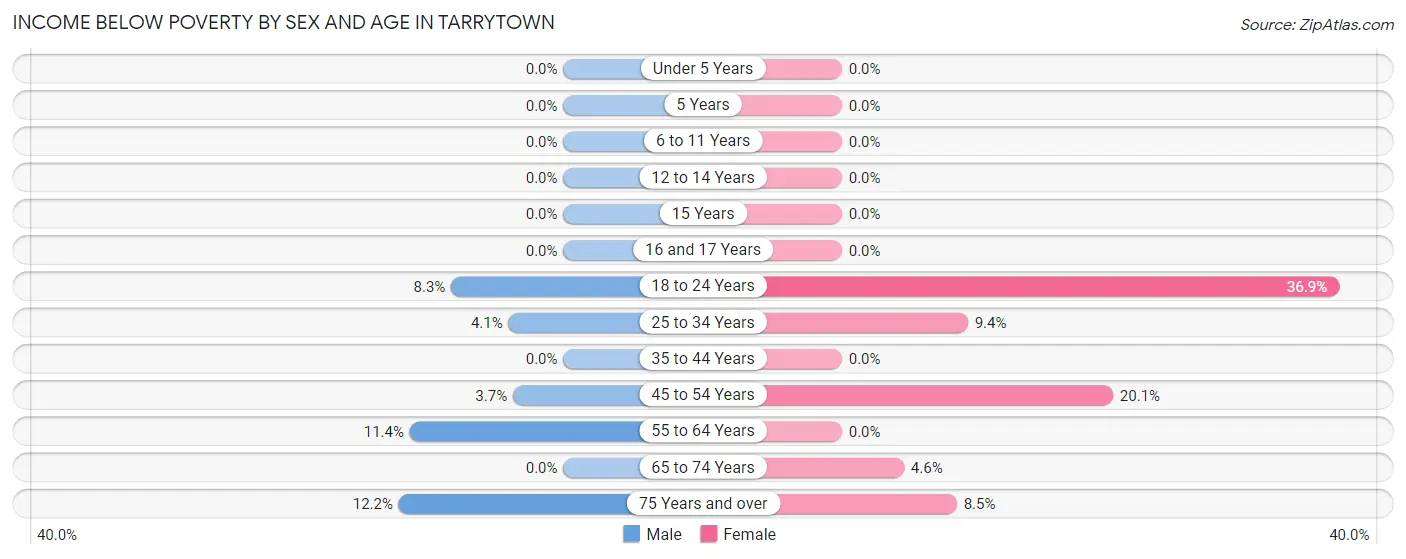
Income Below Poverty by Sex and Age in Tarrytown
With 4.5% poverty level for males and 7.7% for females among the residents of Tarrytown, 75 year old and over males and 18 to 24 year old females are the most vulnerable to poverty, with 55 males (12.2%) and 175 females (36.9%) in their respective age groups living below the poverty level.
| Age Bracket | Male | Female |
| Under 5 Years | 0 (0.0%) | 0 (0.0%) |
| 5 Years | 0 (0.0%) | 0 (0.0%) |
| 6 to 11 Years | 0 (0.0%) | 0 (0.0%) |
| 12 to 14 Years | 0 (0.0%) | 0 (0.0%) |
| 15 Years | 0 (0.0%) | 0 (0.0%) |
| 16 and 17 Years | 0 (0.0%) | 0 (0.0%) |
| 18 to 24 Years | 37 (8.3%) | 175 (36.9%) |
| 25 to 34 Years | 41 (4.1%) | 69 (9.3%) |
| 35 to 44 Years | 0 (0.0%) | 0 (0.0%) |
| 45 to 54 Years | 30 (3.7%) | 121 (20.1%) |
| 55 to 64 Years | 92 (11.4%) | 0 (0.0%) |
| 65 to 74 Years | 0 (0.0%) | 49 (4.6%) |
| 75 Years and over | 55 (12.2%) | 40 (8.5%) |
| Total | 255 (4.5%) | 454 (7.7%) |
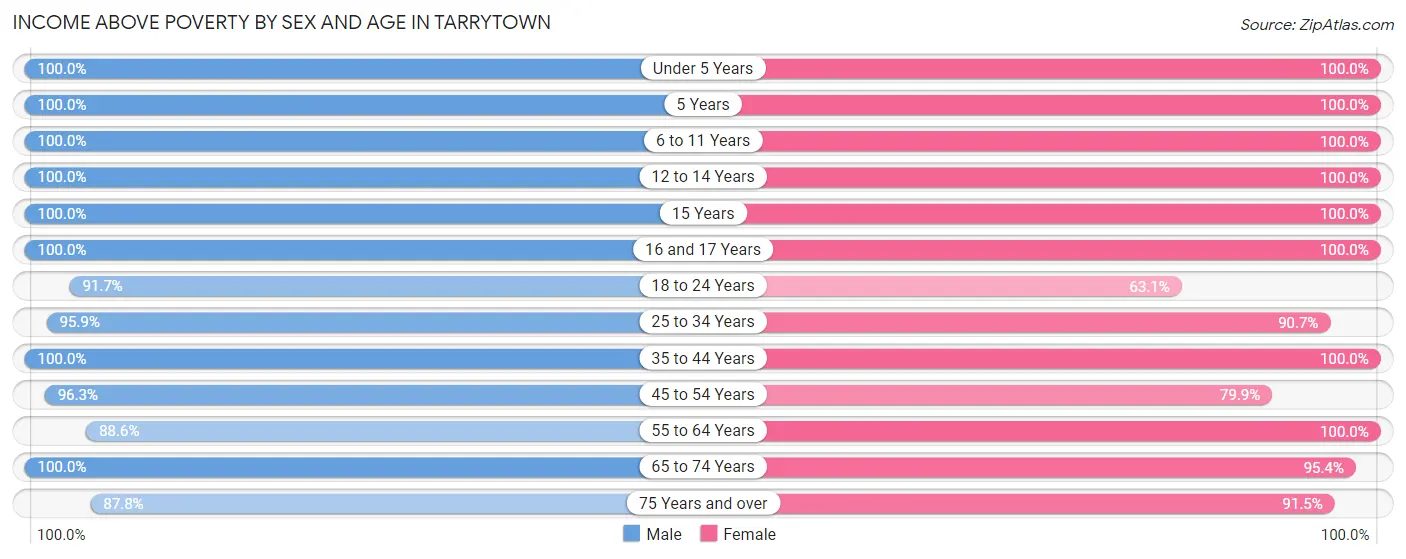
Income Above Poverty by Sex and Age in Tarrytown
According to the poverty statistics in Tarrytown, males aged under 5 years and females aged under 5 years are the age groups that are most secure financially, with 100.0% of males and 100.0% of females in these age groups living above the poverty line.
| Age Bracket | Male | Female |
| Under 5 Years | 334 (100.0%) | 257 (100.0%) |
| 5 Years | 39 (100.0%) | 11 (100.0%) |
| 6 to 11 Years | 292 (100.0%) | 419 (100.0%) |
| 12 to 14 Years | 100 (100.0%) | 99 (100.0%) |
| 15 Years | 105 (100.0%) | 83 (100.0%) |
| 16 and 17 Years | 98 (100.0%) | 113 (100.0%) |
| 18 to 24 Years | 407 (91.7%) | 299 (63.1%) |
| 25 to 34 Years | 967 (95.9%) | 669 (90.6%) |
| 35 to 44 Years | 735 (100.0%) | 678 (100.0%) |
| 45 to 54 Years | 772 (96.3%) | 480 (79.9%) |
| 55 to 64 Years | 715 (88.6%) | 857 (100.0%) |
| 65 to 74 Years | 509 (100.0%) | 1,015 (95.4%) |
| 75 Years and over | 395 (87.8%) | 429 (91.5%) |
| Total | 5,468 (95.5%) | 5,409 (92.3%) |
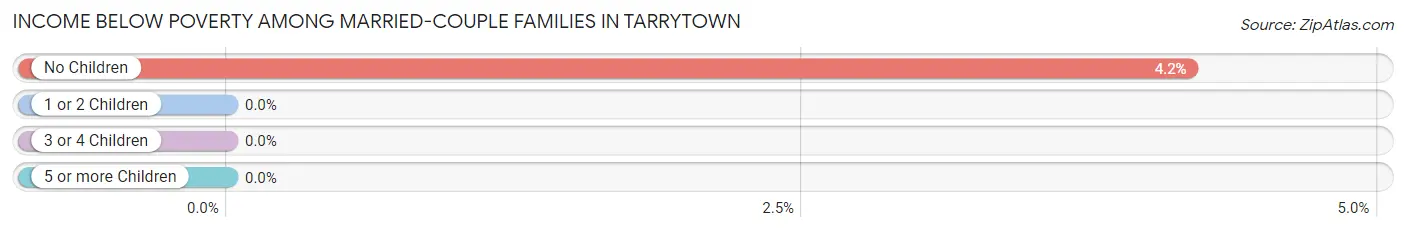
Income Below Poverty Among Married-Couple Families in Tarrytown
The poverty statistics for married-couple families in Tarrytown show that 2.6% or 60 of the total 2,329 families live below the poverty line. Families with no children have the highest poverty rate of 4.2%, comprising of 60 families. On the other hand, families with 1 or 2 children have the lowest poverty rate of 0.0%, which includes 0 families.
| Children | Above Poverty | Below Poverty |
| No Children | 1,377 (95.8%) | 60 (4.2%) |
| 1 or 2 Children | 530 (100.0%) | 0 (0.0%) |
| 3 or 4 Children | 362 (100.0%) | 0 (0.0%) |
| 5 or more Children | 0 (0.0%) | 0 (0.0%) |
| Total | 2,269 (97.4%) | 60 (2.6%) |
Income Below Poverty Among Single-Parent Households in Tarrytown
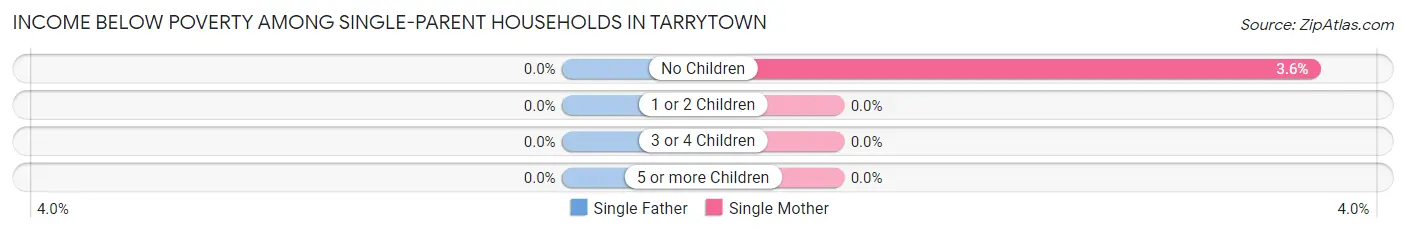
| Children | Single Father | Single Mother |
| No Children | 0 (0.0%) | 15 (3.5%) |
| 1 or 2 Children | 0 (0.0%) | 0 (0.0%) |
| 3 or 4 Children | 0 (0.0%) | 0 (0.0%) |
| 5 or more Children | 0 (0.0%) | 0 (0.0%) |
| Total | 0 (0.0%) | 15 (3.1%) |
Income Below Poverty Among Married-Couple vs Single-Parent Households in Tarrytown
The poverty data for Tarrytown shows that 60 of the married-couple family households (2.6%) and 15 of the single-parent households (2.6%) are living below the poverty level. Within the married-couple family households, those with no children have the highest poverty rate, with 60 households (4.2%) falling below the poverty line. Among the single-parent households, those with no children have the highest poverty rate, with 15 household (3.2%) living below poverty.
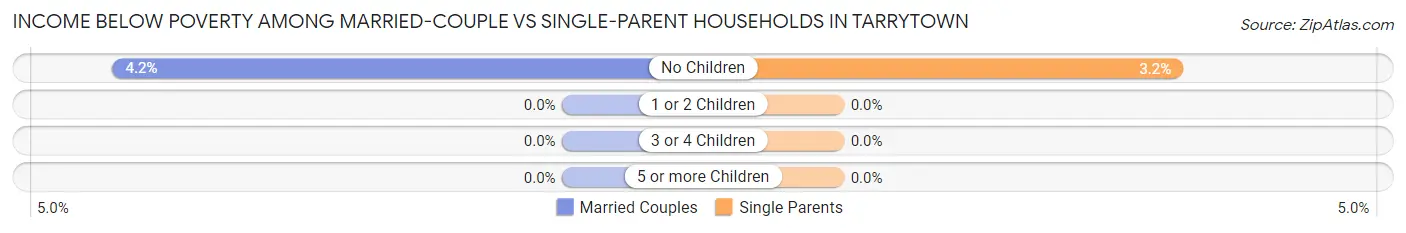
| Children | Married-Couple Families | Single-Parent Households |
| No Children | 60 (4.2%) | 15 (3.2%) |
| 1 or 2 Children | 0 (0.0%) | 0 (0.0%) |
| 3 or 4 Children | 0 (0.0%) | 0 (0.0%) |
| 5 or more Children | 0 (0.0%) | 0 (0.0%) |
| Total | 60 (2.6%) | 15 (2.6%) |
Race in Tarrytown
The most populous races in Tarrytown are White / Caucasian (8,234 | 69.9%), Hispanic or Latino (2,812 | 23.9%), and Two or more Races (1,468 | 12.5%).
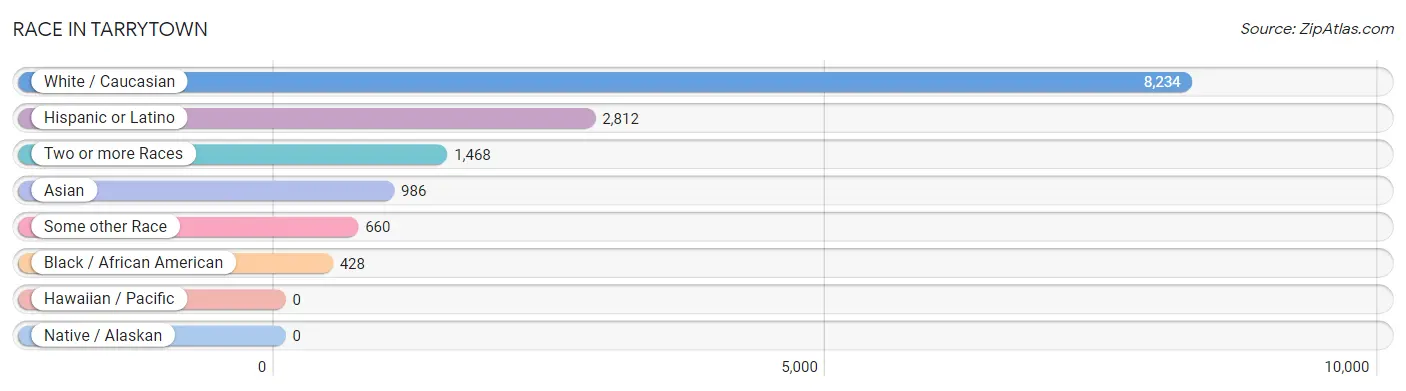
| Race | # Population | % Population |
| Asian | 986 | 8.4% |
| Black / African American | 428 | 3.6% |
| Hawaiian / Pacific | 0 | 0.0% |
| Hispanic or Latino | 2,812 | 23.9% |
| Native / Alaskan | 0 | 0.0% |
| White / Caucasian | 8,234 | 69.9% |
| Two or more Races | 1,468 | 12.5% |
| Some other Race | 660 | 5.6% |
| Total | 11,776 | 100.0% |
Ancestry in Tarrytown
The most populous ancestries reported in Tarrytown are Italian (2,578 | 21.9%), Irish (1,684 | 14.3%), German (935 | 7.9%), Cuban (737 | 6.3%), and Dominican (658 | 5.6%), together accounting for 56.0% of all Tarrytown residents.
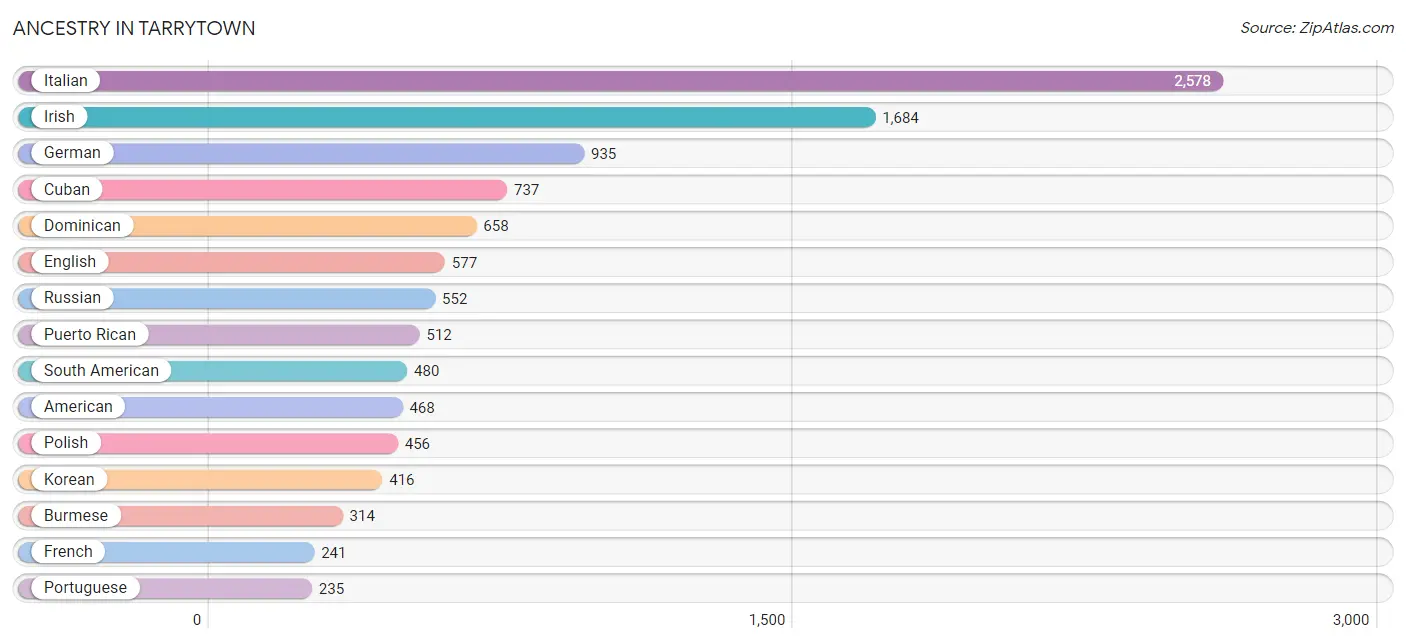
| Ancestry | # Population | % Population |
| American | 468 | 4.0% |
| Arab | 88 | 0.7% |
| Austrian | 162 | 1.4% |
| Barbadian | 21 | 0.2% |
| Bhutanese | 26 | 0.2% |
| Brazilian | 48 | 0.4% |
| British | 181 | 1.5% |
| Burmese | 314 | 2.7% |
| Central American | 64 | 0.5% |
| Chickasaw | 33 | 0.3% |
| Chippewa | 23 | 0.2% |
| Colombian | 187 | 1.6% |
| Croatian | 41 | 0.4% |
| Cuban | 737 | 6.3% |
| Czech | 12 | 0.1% |
| Dominican | 658 | 5.6% |
| Dutch | 61 | 0.5% |
| Eastern European | 192 | 1.6% |
| Ecuadorian | 85 | 0.7% |
| English | 577 | 4.9% |
| European | 210 | 1.8% |
| French | 241 | 2.1% |
| French Canadian | 31 | 0.3% |
| German | 935 | 7.9% |
| Greek | 18 | 0.2% |
| Guatemalan | 64 | 0.5% |
| Hungarian | 129 | 1.1% |
| Indian (Asian) | 104 | 0.9% |
| Iranian | 20 | 0.2% |
| Irish | 1,684 | 14.3% |
| Israeli | 34 | 0.3% |
| Italian | 2,578 | 21.9% |
| Jamaican | 10 | 0.1% |
| Japanese | 25 | 0.2% |
| Jordanian | 19 | 0.2% |
| Korean | 416 | 3.5% |
| Lithuanian | 16 | 0.1% |
| Mexican | 160 | 1.4% |
| Norwegian | 19 | 0.2% |
| Palestinian | 15 | 0.1% |
| Pennsylvania German | 32 | 0.3% |
| Peruvian | 203 | 1.7% |
| Polish | 456 | 3.9% |
| Portuguese | 235 | 2.0% |
| Potawatomi | 58 | 0.5% |
| Puerto Rican | 512 | 4.3% |
| Romanian | 213 | 1.8% |
| Russian | 552 | 4.7% |
| Scotch-Irish | 16 | 0.1% |
| Scottish | 86 | 0.7% |
| Senegalese | 7 | 0.1% |
| Slavic | 32 | 0.3% |
| Slovak | 8 | 0.1% |
| South African | 13 | 0.1% |
| South American | 480 | 4.1% |
| South American Indian | 19 | 0.2% |
| Spaniard | 46 | 0.4% |
| Spanish | 55 | 0.5% |
| Subsaharan African | 34 | 0.3% |
| Sudanese | 14 | 0.1% |
| Swedish | 86 | 0.7% |
| Swiss | 29 | 0.3% |
| Thai | 183 | 1.5% |
| Trinidadian and Tobagonian | 62 | 0.5% |
| Turkish | 18 | 0.2% |
| Ukrainian | 76 | 0.6% |
| Uruguayan | 5 | 0.0% |
| Welsh | 5 | 0.0% |
| West Indian | 28 | 0.2% | View All 69 Rows |
Immigrants in Tarrytown
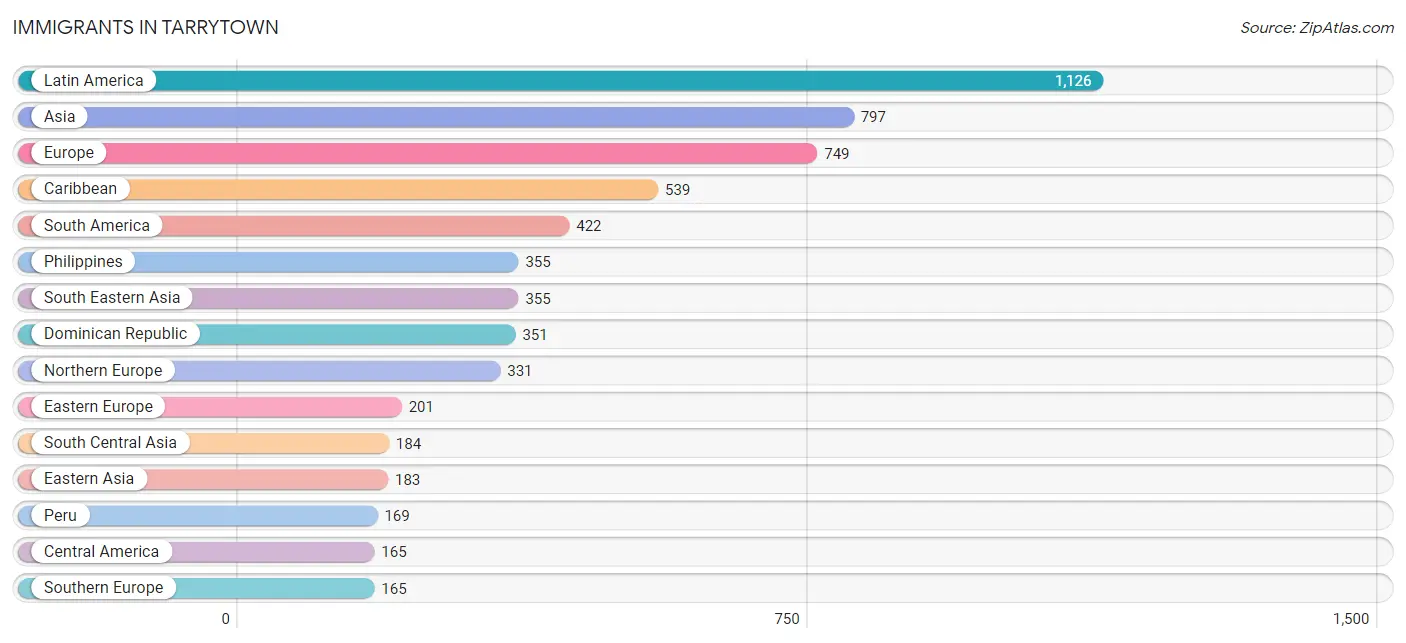
The most numerous immigrant groups reported in Tarrytown came from Latin America (1,126 | 9.6%), Asia (797 | 6.8%), Europe (749 | 6.4%), Caribbean (539 | 4.6%), and South America (422 | 3.6%), together accounting for 30.8% of all Tarrytown residents.
| Immigration Origin | # Population | % Population |
| Africa | 92 | 0.8% |
| Argentina | 34 | 0.3% |
| Asia | 797 | 6.8% |
| Canada | 138 | 1.2% |
| Caribbean | 539 | 4.6% |
| Central America | 165 | 1.4% |
| China | 58 | 0.5% |
| Colombia | 150 | 1.3% |
| Cuba | 161 | 1.4% |
| Dominican Republic | 351 | 3.0% |
| Eastern Asia | 183 | 1.5% |
| Eastern Europe | 201 | 1.7% |
| Ecuador | 64 | 0.5% |
| Europe | 749 | 6.4% |
| France | 12 | 0.1% |
| Germany | 40 | 0.3% |
| Greece | 3 | 0.0% |
| Guatemala | 90 | 0.8% |
| India | 119 | 1.0% |
| Ireland | 38 | 0.3% |
| Israel | 56 | 0.5% |
| Italy | 109 | 0.9% |
| Jamaica | 10 | 0.1% |
| Jordan | 19 | 0.2% |
| Korea | 125 | 1.1% |
| Latin America | 1,126 | 9.6% |
| Mexico | 75 | 0.6% |
| Moldova | 8 | 0.1% |
| Nigeria | 33 | 0.3% |
| Northern Africa | 15 | 0.1% |
| Northern Europe | 331 | 2.8% |
| Pakistan | 65 | 0.5% |
| Peru | 169 | 1.4% |
| Philippines | 355 | 3.0% |
| Poland | 49 | 0.4% |
| Portugal | 21 | 0.2% |
| Russia | 14 | 0.1% |
| Scotland | 69 | 0.6% |
| Senegal | 13 | 0.1% |
| South Africa | 26 | 0.2% |
| South America | 422 | 3.6% |
| South Central Asia | 184 | 1.6% |
| South Eastern Asia | 355 | 3.0% |
| Southern Europe | 165 | 1.4% |
| Spain | 32 | 0.3% |
| Sudan | 15 | 0.1% |
| Sweden | 43 | 0.4% |
| Taiwan | 13 | 0.1% |
| Trinidad and Tobago | 17 | 0.1% |
| Ukraine | 28 | 0.2% |
| Uruguay | 5 | 0.0% |
| Western Africa | 51 | 0.4% |
| Western Asia | 75 | 0.6% |
| Western Europe | 52 | 0.4% | View All 54 Rows |
Sex and Age in Tarrytown
Sex and Age in Tarrytown
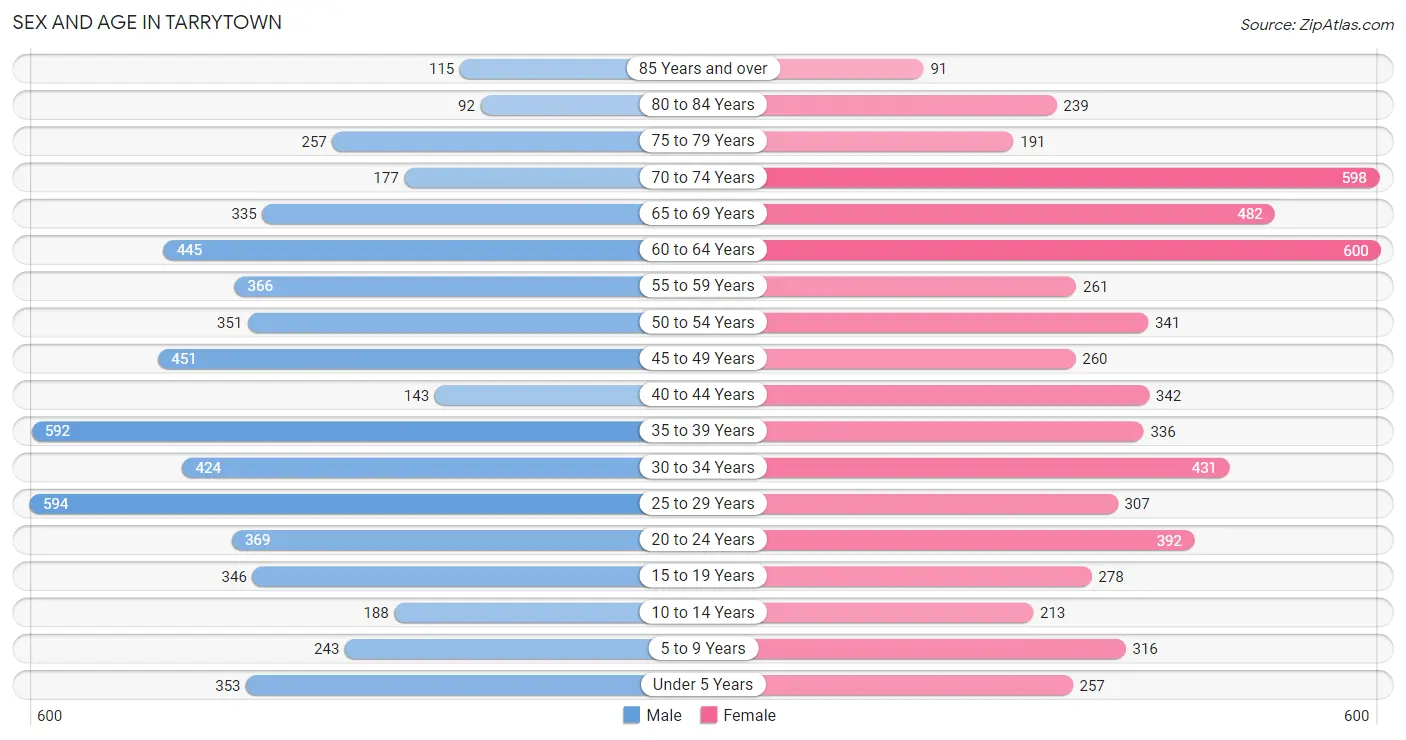
The most populous age groups in Tarrytown are 25 to 29 Years (594 | 10.2%) for men and 60 to 64 Years (600 | 10.1%) for women.
| Age Bracket | Male | Female |
| Under 5 Years | 353 (6.0%) | 257 (4.3%) |
| 5 to 9 Years | 243 (4.2%) | 316 (5.3%) |
| 10 to 14 Years | 188 (3.2%) | 213 (3.6%) |
| 15 to 19 Years | 346 (5.9%) | 278 (4.7%) |
| 20 to 24 Years | 369 (6.3%) | 392 (6.6%) |
| 25 to 29 Years | 594 (10.2%) | 307 (5.2%) |
| 30 to 34 Years | 424 (7.3%) | 431 (7.3%) |
| 35 to 39 Years | 592 (10.1%) | 336 (5.7%) |
| 40 to 44 Years | 143 (2.5%) | 342 (5.8%) |
| 45 to 49 Years | 451 (7.7%) | 260 (4.4%) |
| 50 to 54 Years | 351 (6.0%) | 341 (5.8%) |
| 55 to 59 Years | 366 (6.3%) | 261 (4.4%) |
| 60 to 64 Years | 445 (7.6%) | 600 (10.1%) |
| 65 to 69 Years | 335 (5.7%) | 482 (8.1%) |
| 70 to 74 Years | 177 (3.0%) | 598 (10.1%) |
| 75 to 79 Years | 257 (4.4%) | 191 (3.2%) |
| 80 to 84 Years | 92 (1.6%) | 239 (4.0%) |
| 85 Years and over | 115 (2.0%) | 91 (1.5%) |
| Total | 5,841 (100.0%) | 5,935 (100.0%) |
Families and Households in Tarrytown
Median Family Size in Tarrytown
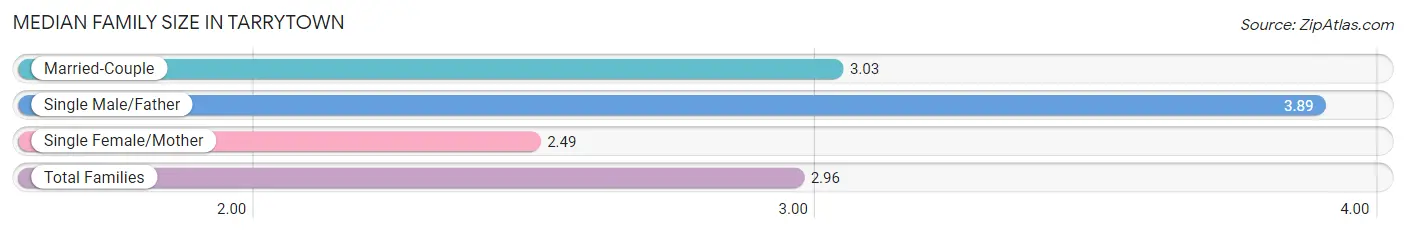
The median family size in Tarrytown is 2.96 persons per family, with single male/father families (80 | 2.8%) accounting for the largest median family size of 3.89 persons per family. On the other hand, single female/mother families (487 | 16.8%) represent the smallest median family size with 2.49 persons per family.
| Family Type | # Families | Family Size |
| Married-Couple | 2,329 (80.4%) | 3.03 |
| Single Male/Father | 80 (2.8%) | 3.89 |
| Single Female/Mother | 487 (16.8%) | 2.49 |
| Total Families | 2,896 (100.0%) | 2.96 |
Median Household Size in Tarrytown
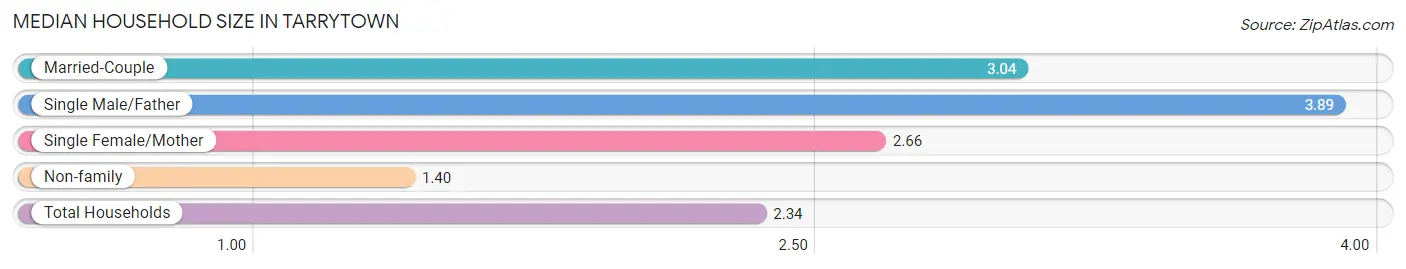
The median household size in Tarrytown is 2.34 persons per household, with single male/father households (80 | 1.6%) accounting for the largest median household size of 3.89 persons per household. non-family households (2,025 | 41.1%) represent the smallest median household size with 1.40 persons per household.
| Household Type | # Households | Household Size |
| Married-Couple | 2,329 (47.3%) | 3.04 |
| Single Male/Father | 80 (1.6%) | 3.89 |
| Single Female/Mother | 487 (9.9%) | 2.66 |
| Non-family | 2,025 (41.1%) | 1.40 |
| Total Households | 4,921 (100.0%) | 2.34 |
Household Size by Marriage Status in Tarrytown
Out of a total of 4,921 households in Tarrytown, 2,896 (58.9%) are family households, while 2,025 (41.1%) are nonfamily households. The most numerous type of family households are 2-person households, comprising 1,417, and the most common type of nonfamily households are 1-person households, comprising 1,560.
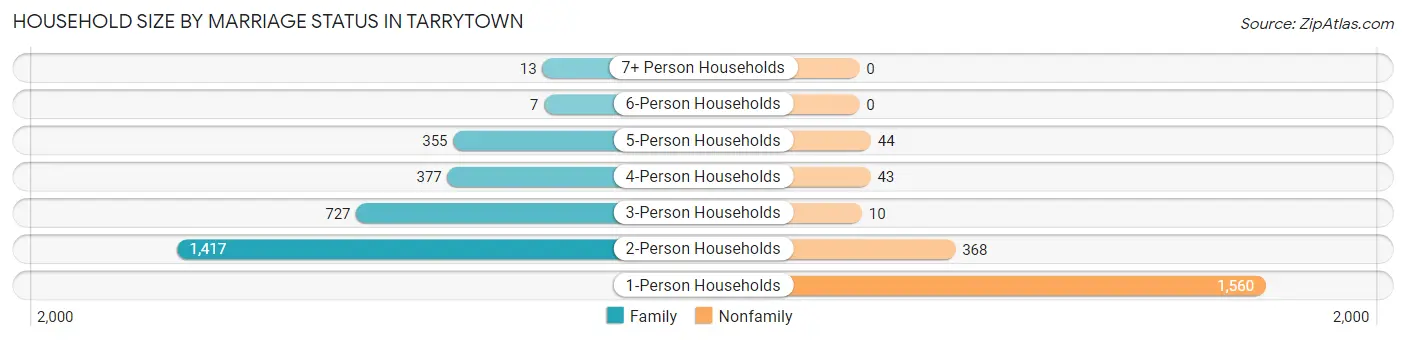
| Household Size | Family Households | Nonfamily Households |
| 1-Person Households | - | 1,560 (31.7%) |
| 2-Person Households | 1,417 (28.8%) | 368 (7.5%) |
| 3-Person Households | 727 (14.8%) | 10 (0.2%) |
| 4-Person Households | 377 (7.7%) | 43 (0.9%) |
| 5-Person Households | 355 (7.2%) | 44 (0.9%) |
| 6-Person Households | 7 (0.1%) | 0 (0.0%) |
| 7+ Person Households | 13 (0.3%) | 0 (0.0%) |
| Total | 2,896 (58.9%) | 2,025 (41.1%) |
Female Fertility in Tarrytown
Fertility by Age in Tarrytown
Average fertility rate in Tarrytown is 38.0 births per 1,000 women. Women in the age bracket of 20 to 34 years have the highest fertility rate with 79.0 births per 1,000 women. Women in the age bracket of 20 to 34 years acount for 100.0% of all women with births.
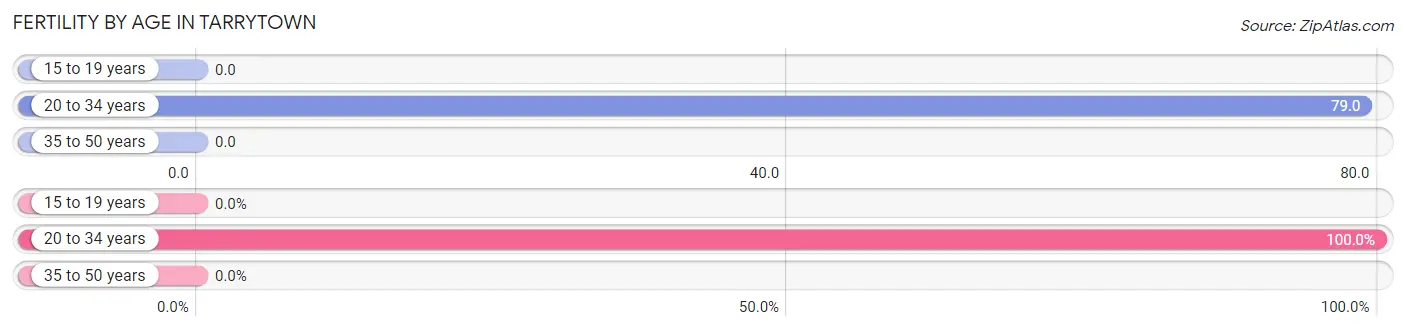
| Age Bracket | Women with Births | Births / 1,000 Women |
| 15 to 19 years | 0 (0.0%) | 0.0 |
| 20 to 34 years | 89 (100.0%) | 79.0 |
| 35 to 50 years | 0 (0.0%) | 0.0 |
| Total | 89 (100.0%) | 38.0 |
Fertility by Age by Marriage Status in Tarrytown
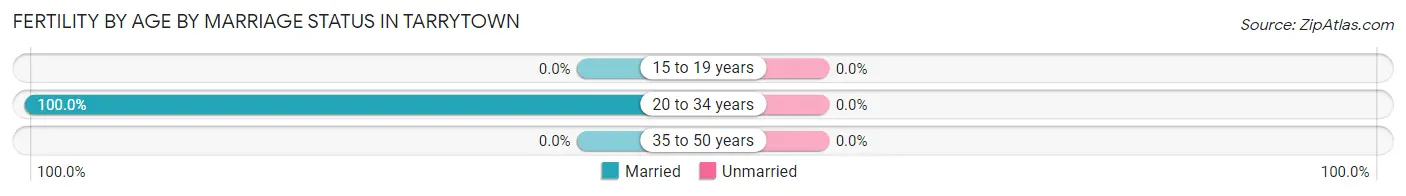
| Age Bracket | Married | Unmarried |
| 15 to 19 years | 0 (0.0%) | 0 (0.0%) |
| 20 to 34 years | 89 (100.0%) | 0 (0.0%) |
| 35 to 50 years | 0 (0.0%) | 0 (0.0%) |
| Total | 89 (100.0%) | 0 (0.0%) |
Fertility by Education in Tarrytown
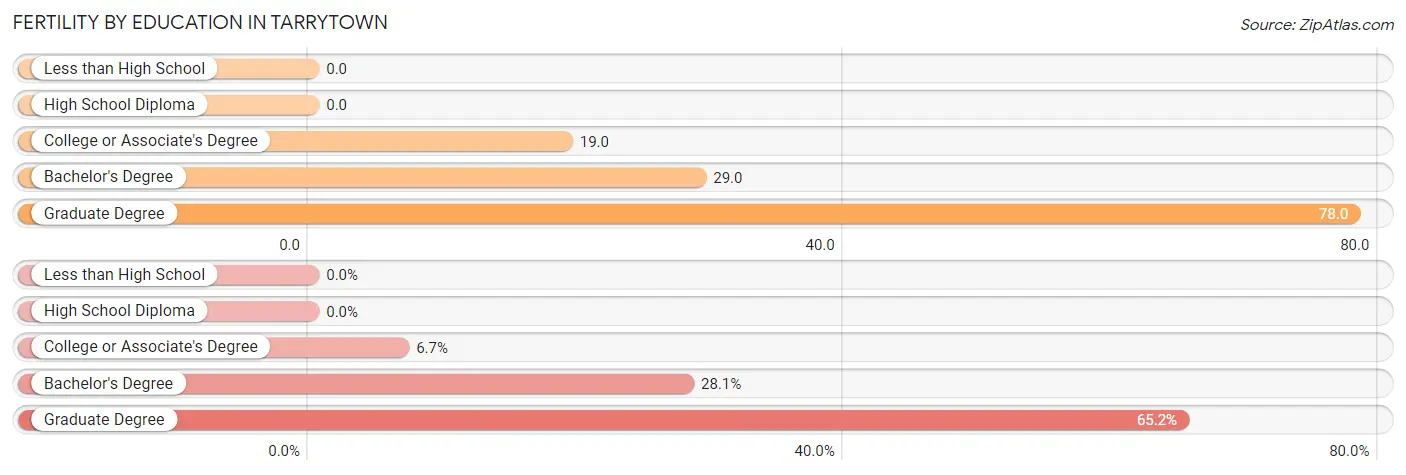
| Educational Attainment | Women with Births | Births / 1,000 Women |
| Less than High School | 0 (0.0%) | 0.0 |
| High School Diploma | 0 (0.0%) | 0.0 |
| College or Associate's Degree | 6 (6.7%) | 19.0 |
| Bachelor's Degree | 25 (28.1%) | 29.0 |
| Graduate Degree | 58 (65.2%) | 78.0 |
| Total | 89 (100.0%) | 38.0 |
Fertility by Education by Marriage Status in Tarrytown
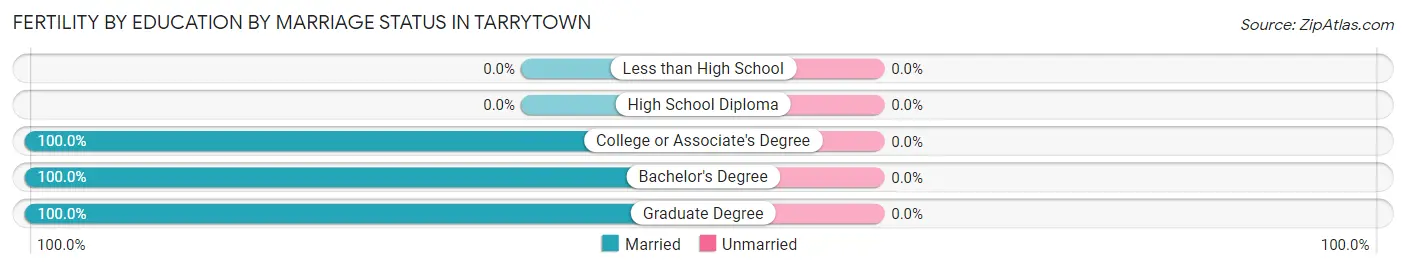
| Educational Attainment | Married | Unmarried |
| Less than High School | 0 (0.0%) | 0 (0.0%) |
| High School Diploma | 0 (0.0%) | 0 (0.0%) |
| College or Associate's Degree | 6 (100.0%) | 0 (0.0%) |
| Bachelor's Degree | 25 (100.0%) | 0 (0.0%) |
| Graduate Degree | 58 (100.0%) | 0 (0.0%) |
| Total | 89 (100.0%) | 0 (0.0%) |
Employment Characteristics in Tarrytown
Employment by Class of Employer in Tarrytown
Among the 6,146 employed individuals in Tarrytown, private company employees (3,702 | 60.2%), not-for-profit organizations (750 | 12.2%), and local government employees (619 | 10.1%) make up the most common classes of employment.
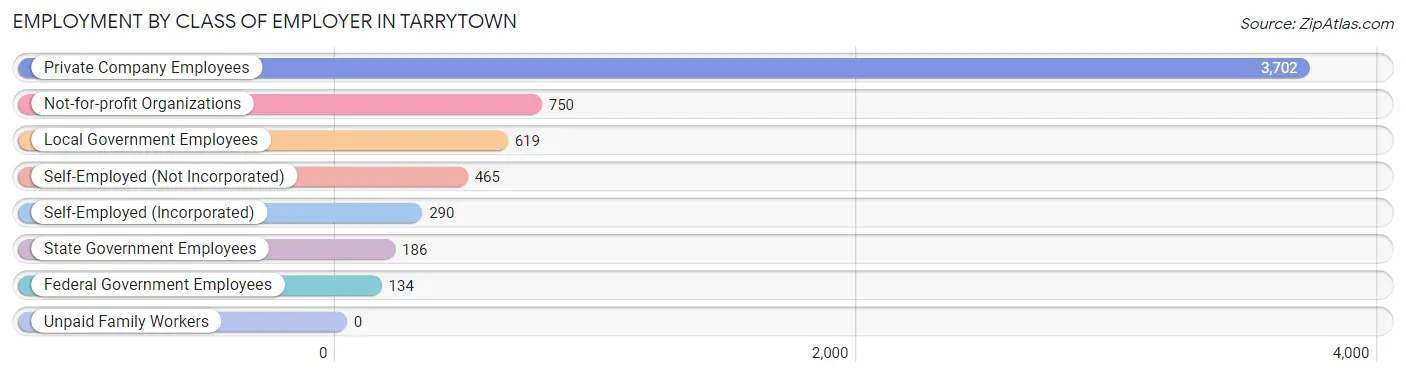
| Employer Class | # Employees | % Employees |
| Private Company Employees | 3,702 | 60.2% |
| Self-Employed (Incorporated) | 290 | 4.7% |
| Self-Employed (Not Incorporated) | 465 | 7.6% |
| Not-for-profit Organizations | 750 | 12.2% |
| Local Government Employees | 619 | 10.1% |
| State Government Employees | 186 | 3.0% |
| Federal Government Employees | 134 | 2.2% |
| Unpaid Family Workers | 0 | 0.0% |
| Total | 6,146 | 100.0% |
Employment Status by Age in Tarrytown
According to the labor force statistics for Tarrytown, out of the total population over 16 years of age (10,018), 63.6% or 6,371 individuals are in the labor force, with 2.8% or 178 of them unemployed. The age group with the highest labor force participation rate is 30 to 34 years, with 88.2% or 754 individuals in the labor force. Within the labor force, the 45 to 54 years age range has the highest percentage of unemployed individuals, with 9.5% or 110 of them being unemployed.
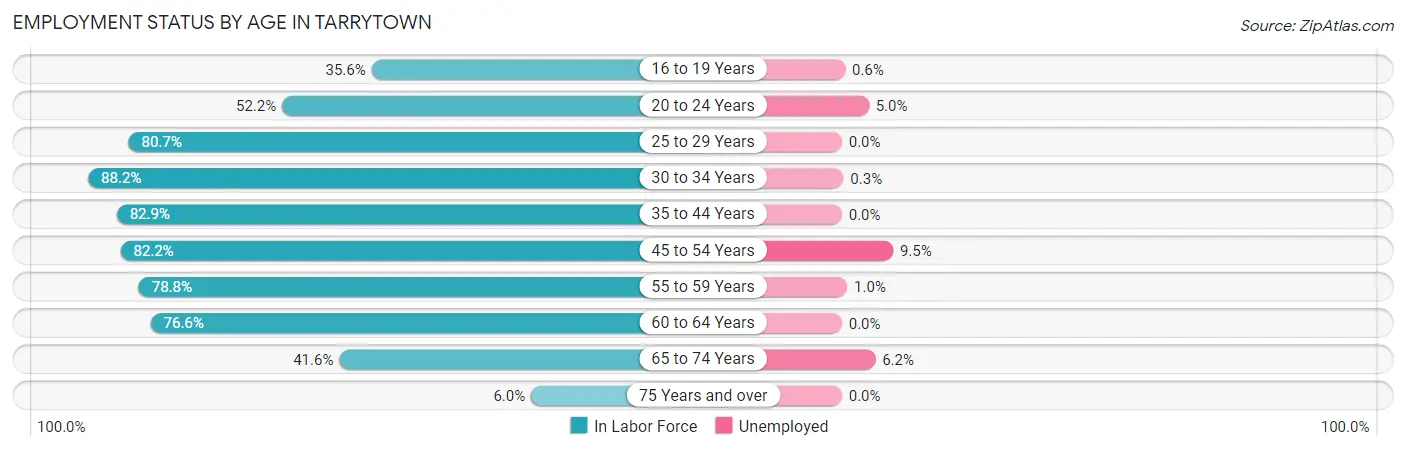
| Age Bracket | In Labor Force | Unemployed |
| 16 to 19 Years | 155 (35.6%) | 1 (0.6%) |
| 20 to 24 Years | 397 (52.2%) | 20 (5.0%) |
| 25 to 29 Years | 727 (80.7%) | 0 (0.0%) |
| 30 to 34 Years | 754 (88.2%) | 2 (0.3%) |
| 35 to 44 Years | 1,171 (82.9%) | 0 (0.0%) |
| 45 to 54 Years | 1,153 (82.2%) | 110 (9.5%) |
| 55 to 59 Years | 494 (78.8%) | 5 (1.0%) |
| 60 to 64 Years | 800 (76.6%) | 0 (0.0%) |
| 65 to 74 Years | 662 (41.6%) | 41 (6.2%) |
| 75 Years and over | 59 (6.0%) | 0 (0.0%) |
| Total | 6,371 (63.6%) | 178 (2.8%) |
Employment Status by Educational Attainment in Tarrytown
According to labor force statistics for Tarrytown, 81.7% of individuals (5,101) out of the total population between 25 and 64 years of age (6,244) are in the labor force, with 2.3% or 117 of them being unemployed. The group with the highest labor force participation rate are those with the educational attainment of college / associate degree, with 89.4% or 896 individuals in the labor force. Within the labor force, individuals with high school diploma education have the highest percentage of unemployment, with 3.5% or 20 of them being unemployed.
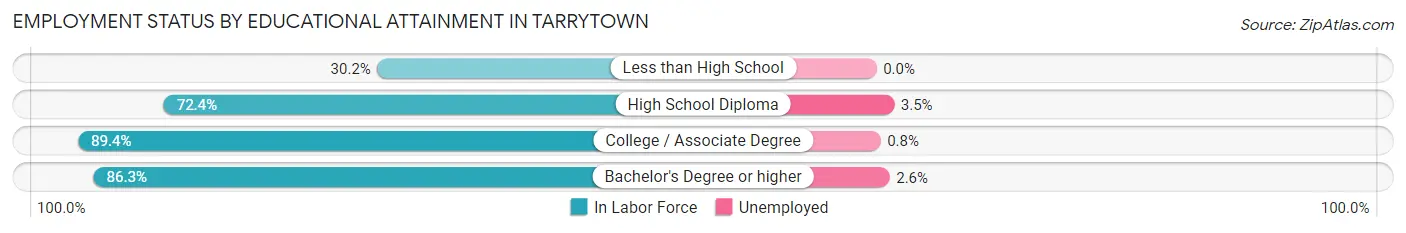
| Educational Attainment | In Labor Force | Unemployed |
| Less than High School | 113 (30.2%) | 0 (0.0%) |
| High School Diploma | 571 (72.4%) | 28 (3.5%) |
| College / Associate Degree | 896 (89.4%) | 8 (0.8%) |
| Bachelor's Degree or higher | 3,520 (86.3%) | 106 (2.6%) |
| Total | 5,101 (81.7%) | 144 (2.3%) |
Employment Occupations by Sex in Tarrytown
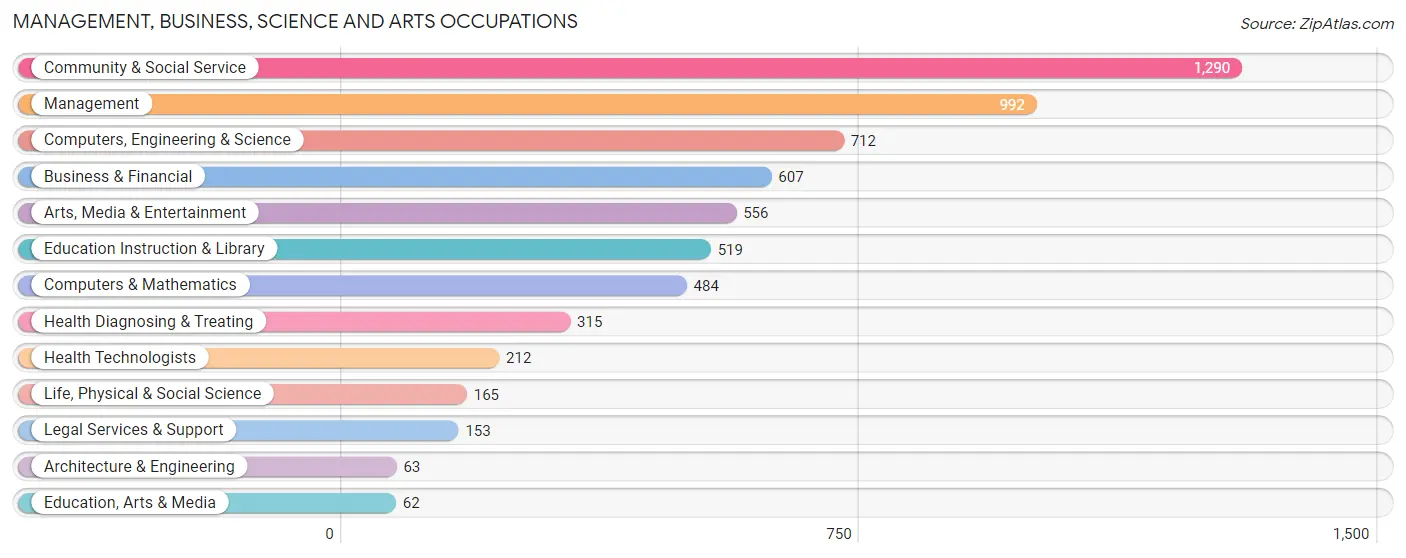
Management, Business, Science and Arts Occupations
The most common Management, Business, Science and Arts occupations in Tarrytown are Community & Social Service (1,290 | 20.8%), Management (992 | 16.0%), Computers, Engineering & Science (712 | 11.5%), Business & Financial (607 | 9.8%), and Arts, Media & Entertainment (556 | 9.0%).
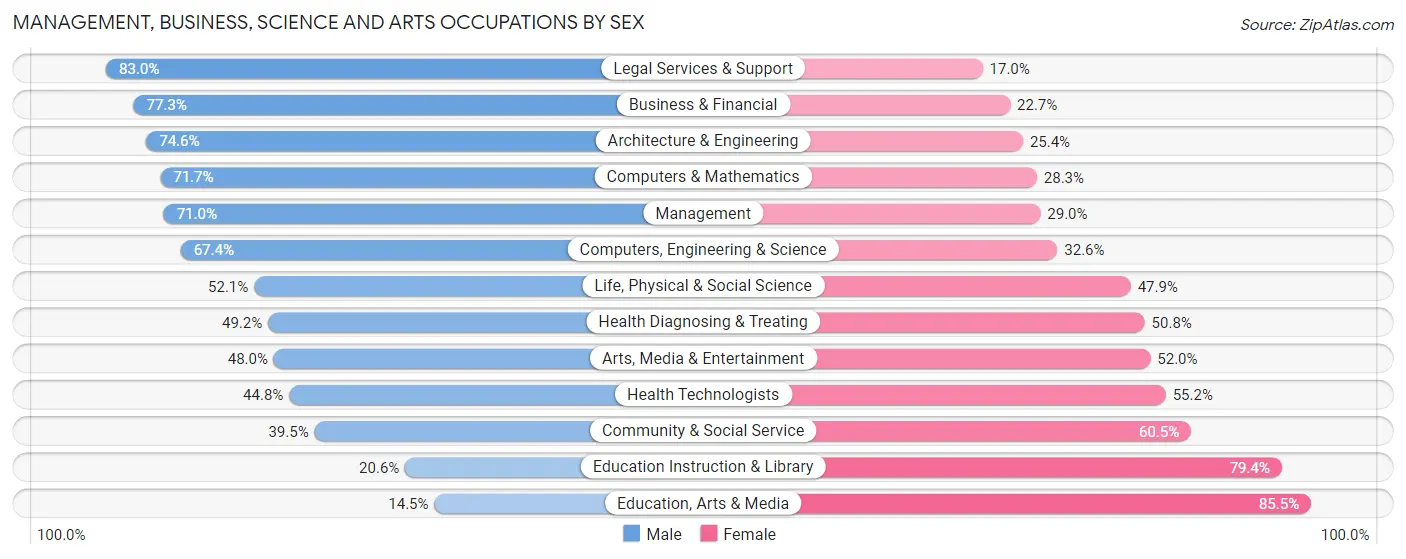
Management, Business, Science and Arts Occupations by Sex
Within the Management, Business, Science and Arts occupations in Tarrytown, the most male-oriented occupations are Legal Services & Support (83.0%), Business & Financial (77.3%), and Architecture & Engineering (74.6%), while the most female-oriented occupations are Education, Arts & Media (85.5%), Education Instruction & Library (79.4%), and Community & Social Service (60.5%).
| Occupation | Male | Female |
| Management | 704 (71.0%) | 288 (29.0%) |
| Business & Financial | 469 (77.3%) | 138 (22.7%) |
| Computers, Engineering & Science | 480 (67.4%) | 232 (32.6%) |
| Computers & Mathematics | 347 (71.7%) | 137 (28.3%) |
| Architecture & Engineering | 47 (74.6%) | 16 (25.4%) |
| Life, Physical & Social Science | 86 (52.1%) | 79 (47.9%) |
| Community & Social Service | 510 (39.5%) | 780 (60.5%) |
| Education, Arts & Media | 9 (14.5%) | 53 (85.5%) |
| Legal Services & Support | 127 (83.0%) | 26 (17.0%) |
| Education Instruction & Library | 107 (20.6%) | 412 (79.4%) |
| Arts, Media & Entertainment | 267 (48.0%) | 289 (52.0%) |
| Health Diagnosing & Treating | 155 (49.2%) | 160 (50.8%) |
| Health Technologists | 95 (44.8%) | 117 (55.2%) |
| Total (Category) | 2,318 (59.2%) | 1,598 (40.8%) |
| Total (Overall) | 3,428 (55.3%) | 2,766 (44.7%) |
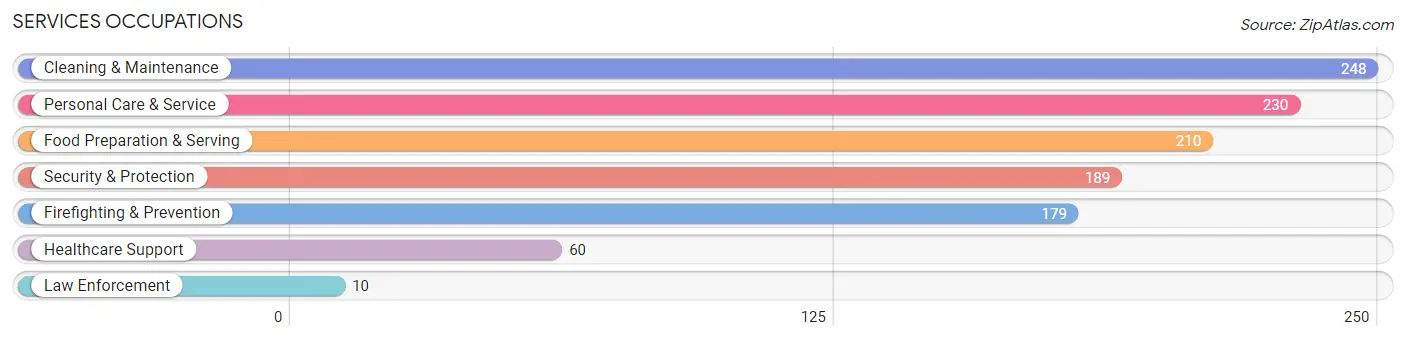
Services Occupations
The most common Services occupations in Tarrytown are Cleaning & Maintenance (248 | 4.0%), Personal Care & Service (230 | 3.7%), Food Preparation & Serving (210 | 3.4%), Security & Protection (189 | 3.0%), and Firefighting & Prevention (179 | 2.9%).
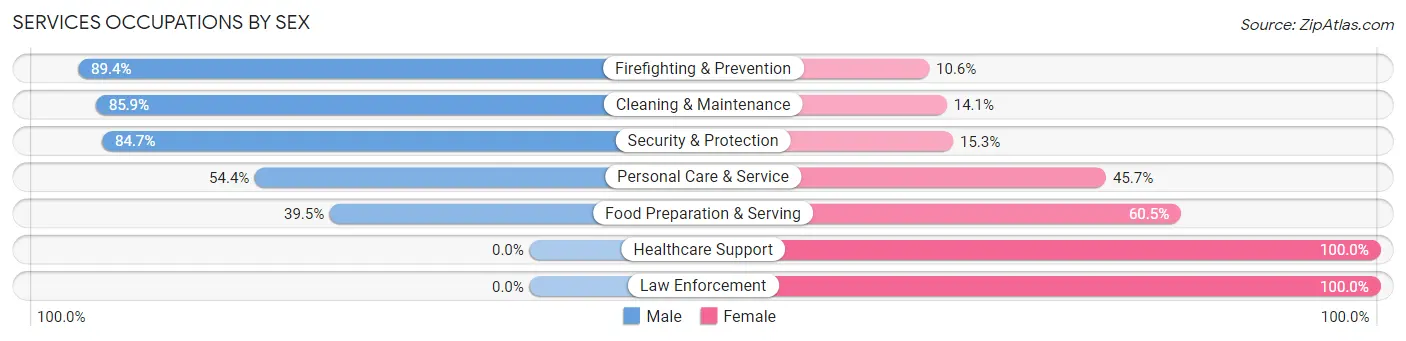
Services Occupations by Sex
Within the Services occupations in Tarrytown, the most male-oriented occupations are Firefighting & Prevention (89.4%), Cleaning & Maintenance (85.9%), and Security & Protection (84.7%), while the most female-oriented occupations are Healthcare Support (100.0%), Law Enforcement (100.0%), and Food Preparation & Serving (60.5%).
| Occupation | Male | Female |
| Healthcare Support | 0 (0.0%) | 60 (100.0%) |
| Security & Protection | 160 (84.7%) | 29 (15.3%) |
| Firefighting & Prevention | 160 (89.4%) | 19 (10.6%) |
| Law Enforcement | 0 (0.0%) | 10 (100.0%) |
| Food Preparation & Serving | 83 (39.5%) | 127 (60.5%) |
| Cleaning & Maintenance | 213 (85.9%) | 35 (14.1%) |
| Personal Care & Service | 125 (54.3%) | 105 (45.7%) |
| Total (Category) | 581 (62.0%) | 356 (38.0%) |
| Total (Overall) | 3,428 (55.3%) | 2,766 (44.7%) |
Sales and Office Occupations
The most common Sales and Office occupations in Tarrytown are Office & Administration (587 | 9.5%), and Sales & Related (378 | 6.1%).
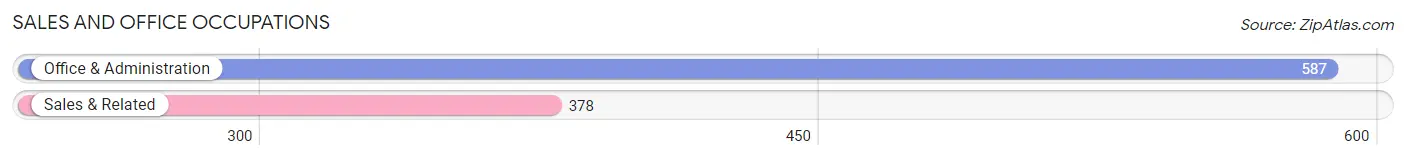
Sales and Office Occupations by Sex

| Occupation | Male | Female |
| Sales & Related | 251 (66.4%) | 127 (33.6%) |
| Office & Administration | 113 (19.3%) | 474 (80.7%) |
| Total (Category) | 364 (37.7%) | 601 (62.3%) |
| Total (Overall) | 3,428 (55.3%) | 2,766 (44.7%) |
Natural Resources, Construction and Maintenance Occupations
The most common Natural Resources, Construction and Maintenance occupations in Tarrytown are Construction & Extraction (69 | 1.1%), and Installation, Maintenance & Repair (39 | 0.6%).
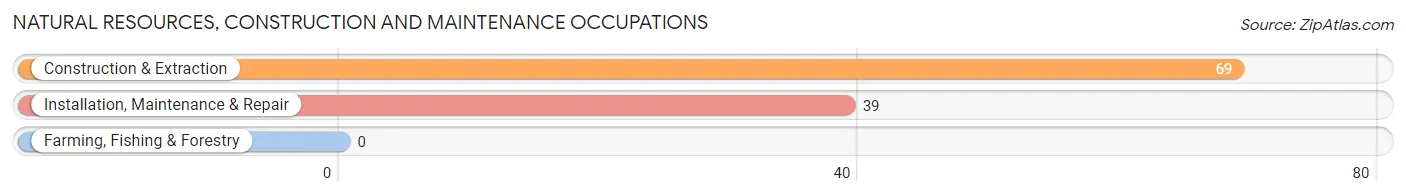
Natural Resources, Construction and Maintenance Occupations by Sex
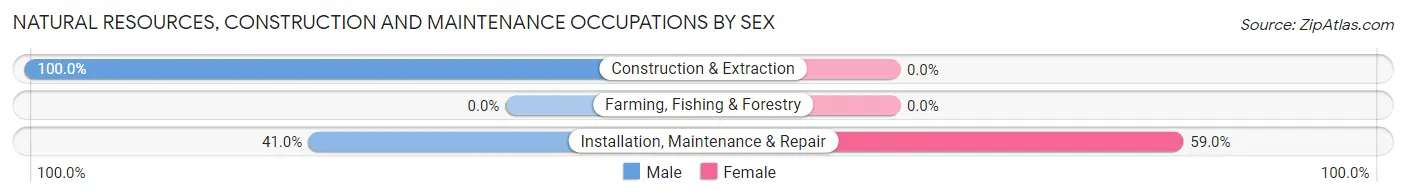
| Occupation | Male | Female |
| Farming, Fishing & Forestry | 0 (0.0%) | 0 (0.0%) |
| Construction & Extraction | 69 (100.0%) | 0 (0.0%) |
| Installation, Maintenance & Repair | 16 (41.0%) | 23 (59.0%) |
| Total (Category) | 85 (78.7%) | 23 (21.3%) |
| Total (Overall) | 3,428 (55.3%) | 2,766 (44.7%) |
Production, Transportation and Moving Occupations
The most common Production, Transportation and Moving occupations in Tarrytown are , and Production (268 | 4.3%).
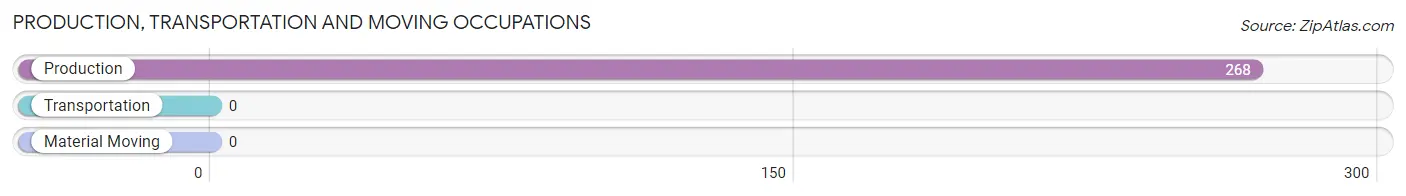
Production, Transportation and Moving Occupations by Sex
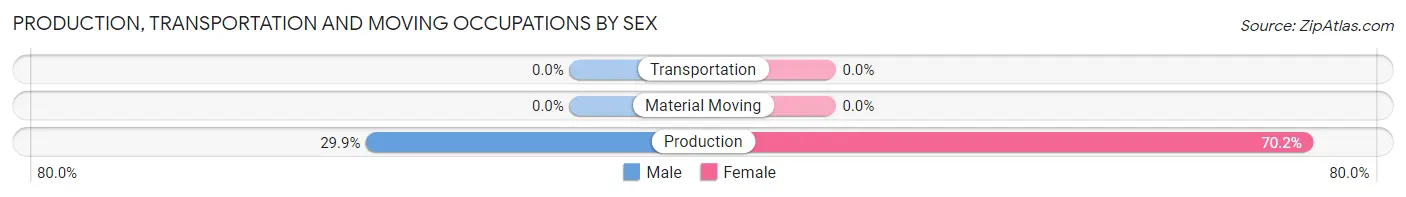
| Occupation | Male | Female |
| Production | 80 (29.8%) | 188 (70.2%) |
| Transportation | 0 (0.0%) | 0 (0.0%) |
| Material Moving | 0 (0.0%) | 0 (0.0%) |
| Total (Category) | 80 (29.8%) | 188 (70.2%) |
| Total (Overall) | 3,428 (55.3%) | 2,766 (44.7%) |
Employment Industries by Sex in Tarrytown
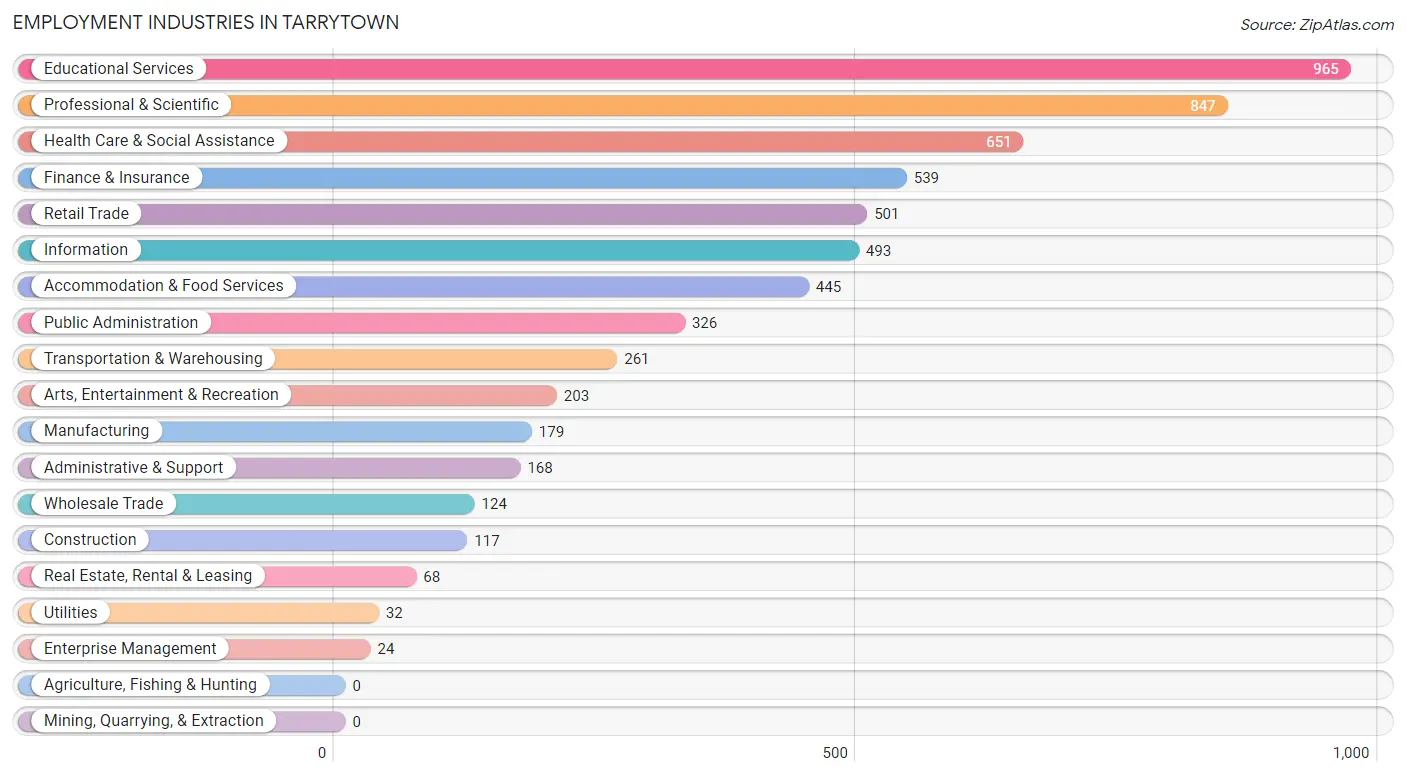
Employment Industries in Tarrytown
The major employment industries in Tarrytown include Educational Services (965 | 15.6%), Professional & Scientific (847 | 13.7%), Health Care & Social Assistance (651 | 10.5%), Finance & Insurance (539 | 8.7%), and Retail Trade (501 | 8.1%).
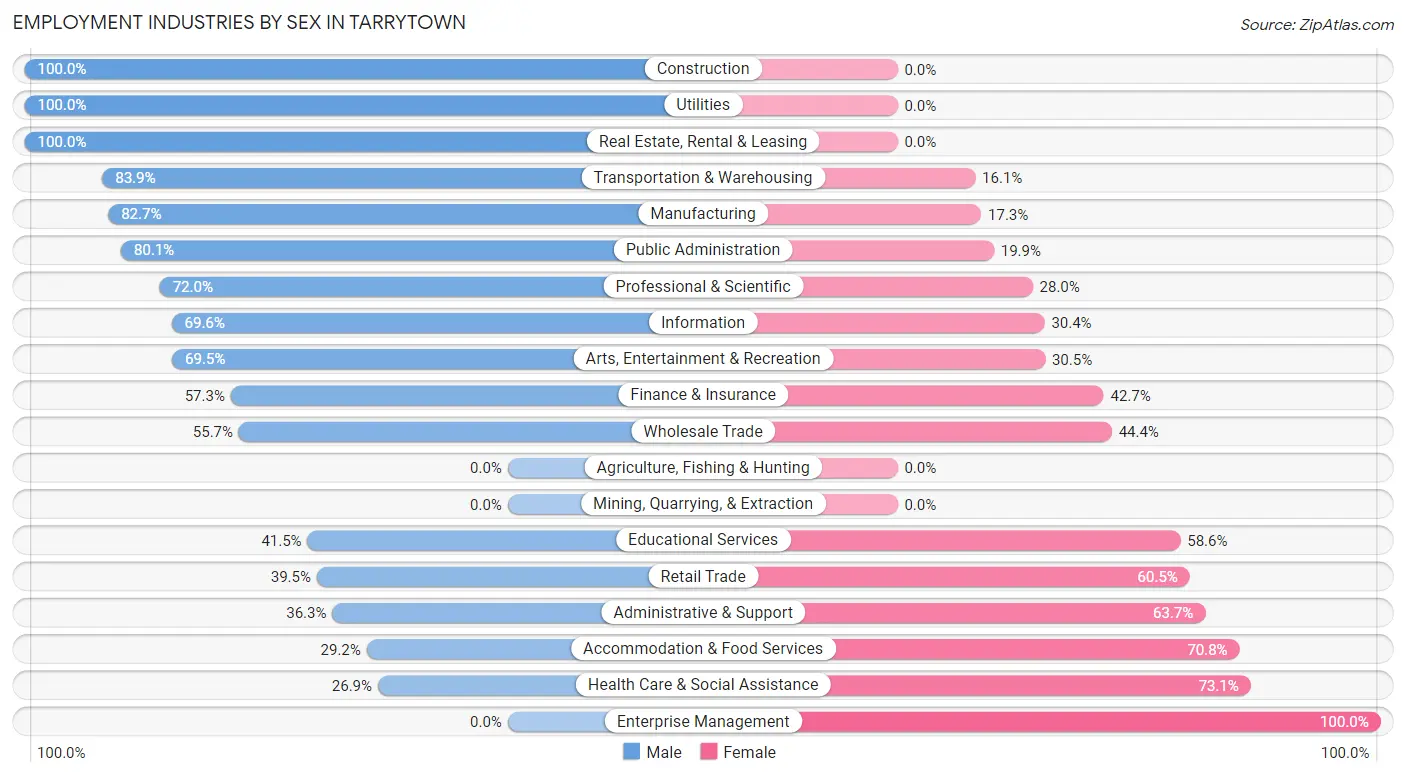
Employment Industries by Sex in Tarrytown
The Tarrytown industries that see more men than women are Construction (100.0%), Utilities (100.0%), and Real Estate, Rental & Leasing (100.0%), whereas the industries that tend to have a higher number of women are Enterprise Management (100.0%), Health Care & Social Assistance (73.1%), and Accommodation & Food Services (70.8%).
| Industry | Male | Female |
| Agriculture, Fishing & Hunting | 0 (0.0%) | 0 (0.0%) |
| Mining, Quarrying, & Extraction | 0 (0.0%) | 0 (0.0%) |
| Construction | 117 (100.0%) | 0 (0.0%) |
| Manufacturing | 148 (82.7%) | 31 (17.3%) |
| Wholesale Trade | 69 (55.6%) | 55 (44.4%) |
| Retail Trade | 198 (39.5%) | 303 (60.5%) |
| Transportation & Warehousing | 219 (83.9%) | 42 (16.1%) |
| Utilities | 32 (100.0%) | 0 (0.0%) |
| Information | 343 (69.6%) | 150 (30.4%) |
| Finance & Insurance | 309 (57.3%) | 230 (42.7%) |
| Real Estate, Rental & Leasing | 68 (100.0%) | 0 (0.0%) |
| Professional & Scientific | 610 (72.0%) | 237 (28.0%) |
| Enterprise Management | 0 (0.0%) | 24 (100.0%) |
| Administrative & Support | 61 (36.3%) | 107 (63.7%) |
| Educational Services | 400 (41.4%) | 565 (58.6%) |
| Health Care & Social Assistance | 175 (26.9%) | 476 (73.1%) |
| Arts, Entertainment & Recreation | 141 (69.5%) | 62 (30.5%) |
| Accommodation & Food Services | 130 (29.2%) | 315 (70.8%) |
| Public Administration | 261 (80.1%) | 65 (19.9%) |
| Total | 3,428 (55.3%) | 2,766 (44.7%) |
Education in Tarrytown
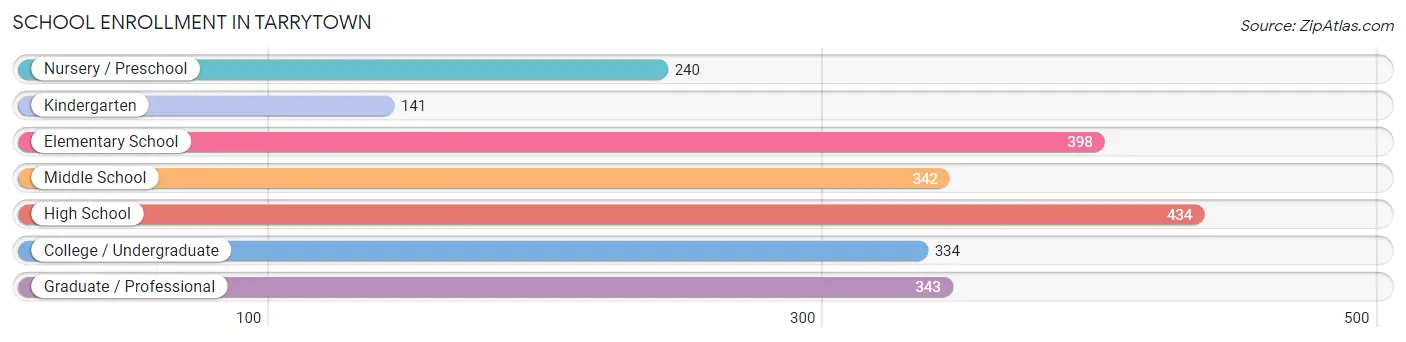
School Enrollment in Tarrytown
The most common levels of schooling among the 2,232 students in Tarrytown are high school (434 | 19.4%), elementary school (398 | 17.8%), and graduate / professional (343 | 15.4%).
| School Level | # Students | % Students |
| Nursery / Preschool | 240 | 10.7% |
| Kindergarten | 141 | 6.3% |
| Elementary School | 398 | 17.8% |
| Middle School | 342 | 15.3% |
| High School | 434 | 19.4% |
| College / Undergraduate | 334 | 15.0% |
| Graduate / Professional | 343 | 15.4% |
| Total | 2,232 | 100.0% |
School Enrollment by Age by Funding Source in Tarrytown
Out of a total of 2,232 students who are enrolled in schools in Tarrytown, 654 (29.3%) attend a private institution, while the remaining 1,578 (70.7%) are enrolled in public schools. The age group of 25 to 34 year olds has the highest likelihood of being enrolled in private schools, with 112 (66.3% in the age bracket) enrolled. Conversely, the age group of 35 years and over has the lowest likelihood of being enrolled in a private school, with 31 (100.0% in the age bracket) attending a public institution.
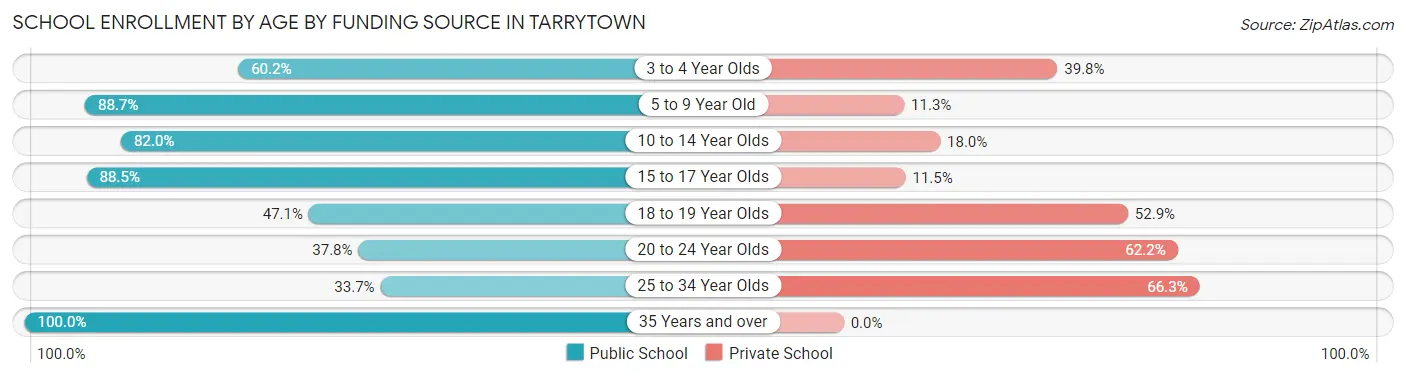
| Age Bracket | Public School | Private School |
| 3 to 4 Year Olds | 118 (60.2%) | 78 (39.8%) |
| 5 to 9 Year Old | 496 (88.7%) | 63 (11.3%) |
| 10 to 14 Year Olds | 329 (82.0%) | 72 (18.0%) |
| 15 to 17 Year Olds | 353 (88.5%) | 46 (11.5%) |
| 18 to 19 Year Olds | 64 (47.1%) | 72 (52.9%) |
| 20 to 24 Year Olds | 129 (37.8%) | 212 (62.2%) |
| 25 to 34 Year Olds | 57 (33.7%) | 112 (66.3%) |
| 35 Years and over | 31 (100.0%) | 0 (0.0%) |
| Total | 1,578 (70.7%) | 654 (29.3%) |
Educational Attainment by Field of Study in Tarrytown
Business (958 | 15.6%), education (713 | 11.6%), visual & performing arts (681 | 11.1%), social sciences (652 | 10.6%), and computers & mathematics (578 | 9.4%) are the most common fields of study among 6,152 individuals in Tarrytown who have obtained a bachelor's degree or higher.
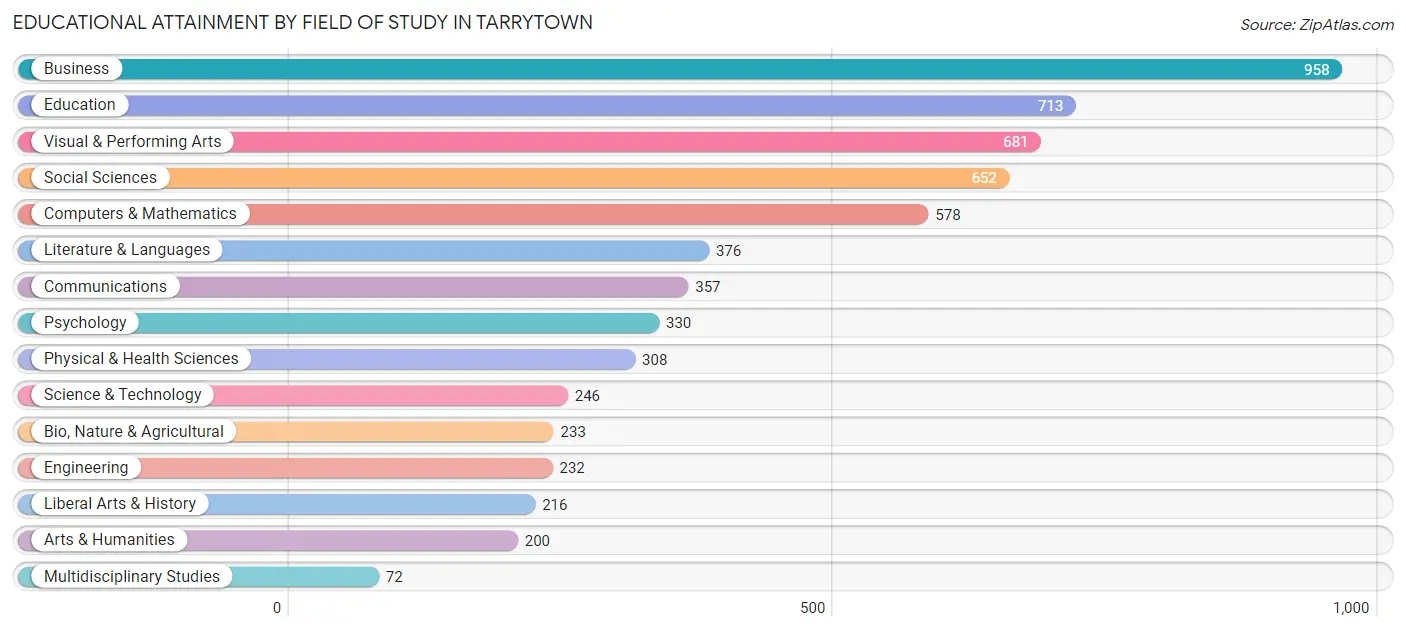
| Field of Study | # Graduates | % Graduates |
| Computers & Mathematics | 578 | 9.4% |
| Bio, Nature & Agricultural | 233 | 3.8% |
| Physical & Health Sciences | 308 | 5.0% |
| Psychology | 330 | 5.4% |
| Social Sciences | 652 | 10.6% |
| Engineering | 232 | 3.8% |
| Multidisciplinary Studies | 72 | 1.2% |
| Science & Technology | 246 | 4.0% |
| Business | 958 | 15.6% |
| Education | 713 | 11.6% |
| Literature & Languages | 376 | 6.1% |
| Liberal Arts & History | 216 | 3.5% |
| Visual & Performing Arts | 681 | 11.1% |
| Communications | 357 | 5.8% |
| Arts & Humanities | 200 | 3.3% |
| Total | 6,152 | 100.0% |
Transportation & Commute in Tarrytown
Vehicle Availability by Sex in Tarrytown
The most prevalent vehicle ownership categories in Tarrytown are males with 2 vehicles (1,588, accounting for 47.2%) and females with 2 vehicles (980, making up 58.4%).
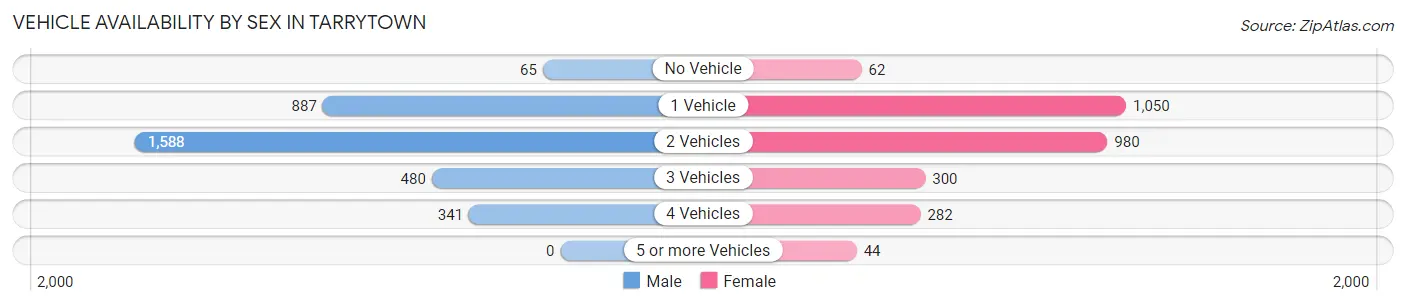
| Vehicles Available | Male | Female |
| No Vehicle | 65 (1.9%) | 62 (2.3%) |
| 1 Vehicle | 887 (26.4%) | 1,050 (38.6%) |
| 2 Vehicles | 1,588 (47.2%) | 980 (36.1%) |
| 3 Vehicles | 480 (14.3%) | 300 (11.0%) |
| 4 Vehicles | 341 (10.2%) | 282 (10.4%) |
| 5 or more Vehicles | 0 (0.0%) | 44 (1.6%) |
| Total | 3,361 (100.0%) | 2,718 (100.0%) |
Commute Time in Tarrytown
The most frequently occuring commute durations in Tarrytown are 20 to 24 minutes (875 commuters, 17.1%), 60 to 89 minutes (779 commuters, 15.2%), and 30 to 34 minutes (659 commuters, 12.9%).
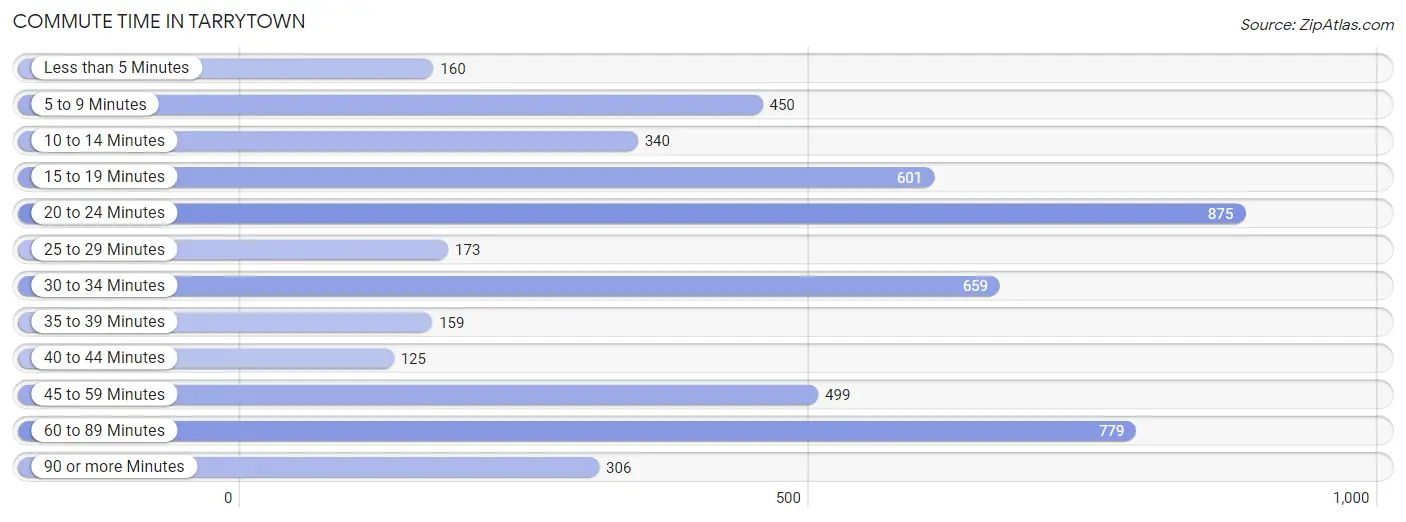
| Commute Time | # Commuters | % Commuters |
| Less than 5 Minutes | 160 | 3.1% |
| 5 to 9 Minutes | 450 | 8.8% |
| 10 to 14 Minutes | 340 | 6.6% |
| 15 to 19 Minutes | 601 | 11.7% |
| 20 to 24 Minutes | 875 | 17.1% |
| 25 to 29 Minutes | 173 | 3.4% |
| 30 to 34 Minutes | 659 | 12.9% |
| 35 to 39 Minutes | 159 | 3.1% |
| 40 to 44 Minutes | 125 | 2.4% |
| 45 to 59 Minutes | 499 | 9.7% |
| 60 to 89 Minutes | 779 | 15.2% |
| 90 or more Minutes | 306 | 6.0% |
Commute Time by Sex in Tarrytown
The most common commute times in Tarrytown are 60 to 89 minutes (502 commuters, 16.7%) for males and 20 to 24 minutes (684 commuters, 32.3%) for females.
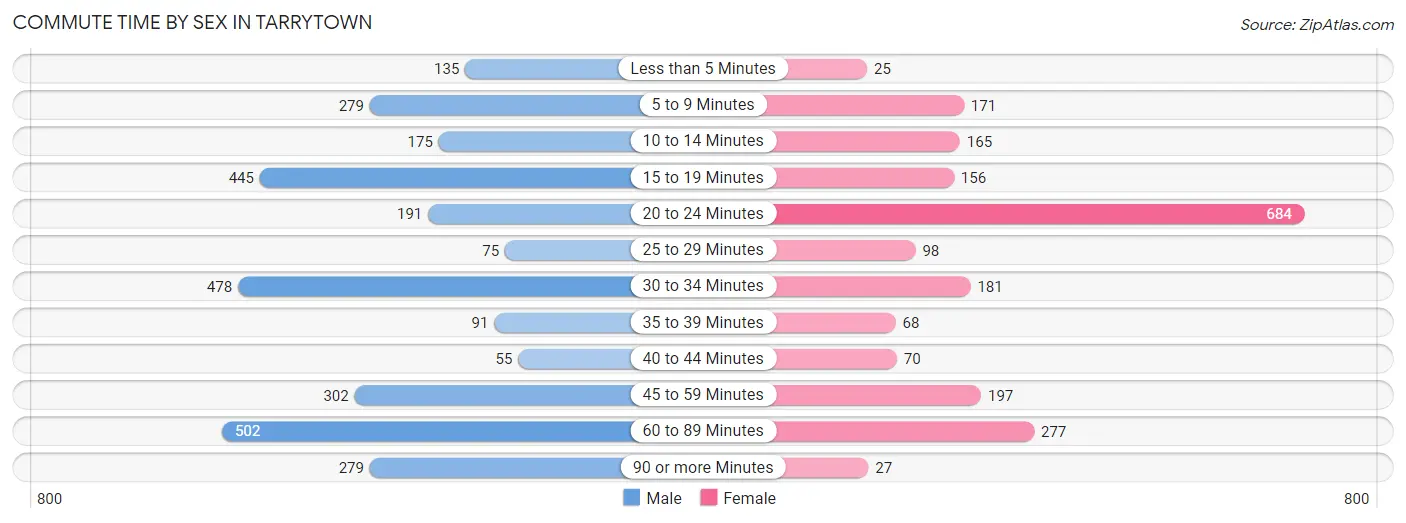
| Commute Time | Male | Female |
| Less than 5 Minutes | 135 (4.5%) | 25 (1.2%) |
| 5 to 9 Minutes | 279 (9.3%) | 171 (8.1%) |
| 10 to 14 Minutes | 175 (5.8%) | 165 (7.8%) |
| 15 to 19 Minutes | 445 (14.8%) | 156 (7.4%) |
| 20 to 24 Minutes | 191 (6.4%) | 684 (32.3%) |
| 25 to 29 Minutes | 75 (2.5%) | 98 (4.6%) |
| 30 to 34 Minutes | 478 (15.9%) | 181 (8.5%) |
| 35 to 39 Minutes | 91 (3.0%) | 68 (3.2%) |
| 40 to 44 Minutes | 55 (1.8%) | 70 (3.3%) |
| 45 to 59 Minutes | 302 (10.0%) | 197 (9.3%) |
| 60 to 89 Minutes | 502 (16.7%) | 277 (13.1%) |
| 90 or more Minutes | 279 (9.3%) | 27 (1.3%) |
Time of Departure to Work by Sex in Tarrytown
The most frequent times of departure to work in Tarrytown are 8:30 AM to 8:59 AM (629, 20.9%) for males and 8:00 AM to 8:29 AM (489, 23.1%) for females.
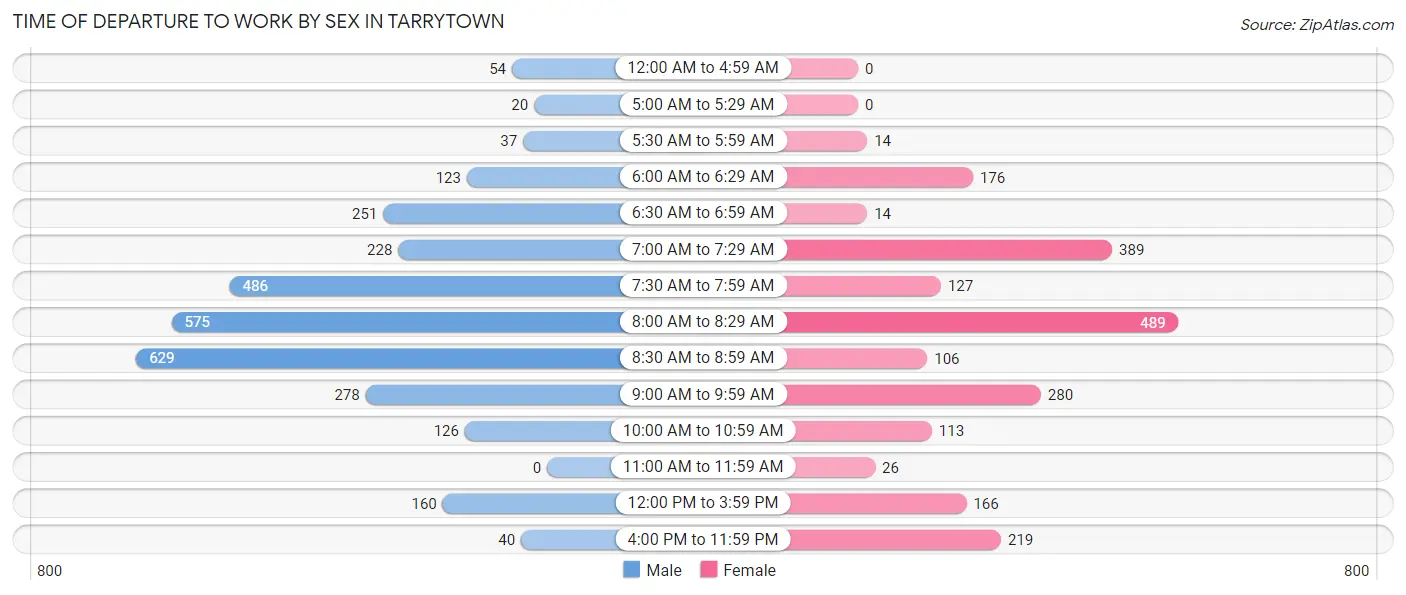
| Time of Departure | Male | Female |
| 12:00 AM to 4:59 AM | 54 (1.8%) | 0 (0.0%) |
| 5:00 AM to 5:29 AM | 20 (0.7%) | 0 (0.0%) |
| 5:30 AM to 5:59 AM | 37 (1.2%) | 14 (0.7%) |
| 6:00 AM to 6:29 AM | 123 (4.1%) | 176 (8.3%) |
| 6:30 AM to 6:59 AM | 251 (8.4%) | 14 (0.7%) |
| 7:00 AM to 7:29 AM | 228 (7.6%) | 389 (18.4%) |
| 7:30 AM to 7:59 AM | 486 (16.2%) | 127 (6.0%) |
| 8:00 AM to 8:29 AM | 575 (19.1%) | 489 (23.1%) |
| 8:30 AM to 8:59 AM | 629 (20.9%) | 106 (5.0%) |
| 9:00 AM to 9:59 AM | 278 (9.2%) | 280 (13.2%) |
| 10:00 AM to 10:59 AM | 126 (4.2%) | 113 (5.3%) |
| 11:00 AM to 11:59 AM | 0 (0.0%) | 26 (1.2%) |
| 12:00 PM to 3:59 PM | 160 (5.3%) | 166 (7.8%) |
| 4:00 PM to 11:59 PM | 40 (1.3%) | 219 (10.3%) |
| Total | 3,007 (100.0%) | 2,119 (100.0%) |
Housing Occupancy in Tarrytown
Occupancy by Ownership in Tarrytown
Of the total 4,921 dwellings in Tarrytown, owner-occupied units account for 3,077 (62.5%), while renter-occupied units make up 1,844 (37.5%).
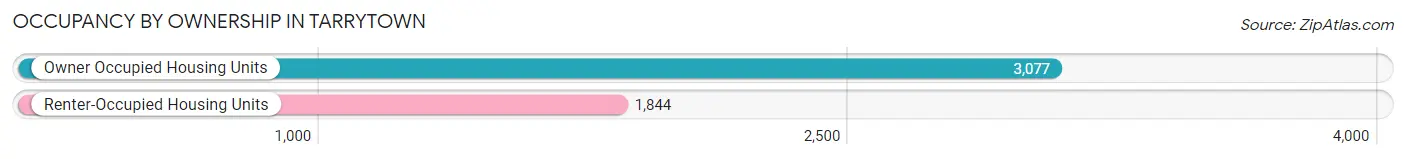
| Occupancy | # Housing Units | % Housing Units |
| Owner Occupied Housing Units | 3,077 | 62.5% |
| Renter-Occupied Housing Units | 1,844 | 37.5% |
| Total Occupied Housing Units | 4,921 | 100.0% |
Occupancy by Household Size in Tarrytown
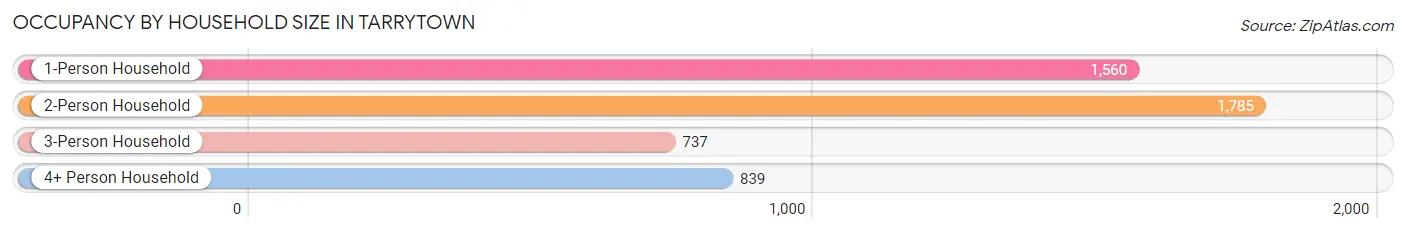
| Household Size | # Housing Units | % Housing Units |
| 1-Person Household | 1,560 | 31.7% |
| 2-Person Household | 1,785 | 36.3% |
| 3-Person Household | 737 | 15.0% |
| 4+ Person Household | 839 | 17.1% |
| Total Housing Units | 4,921 | 100.0% |
Occupancy by Ownership by Household Size in Tarrytown
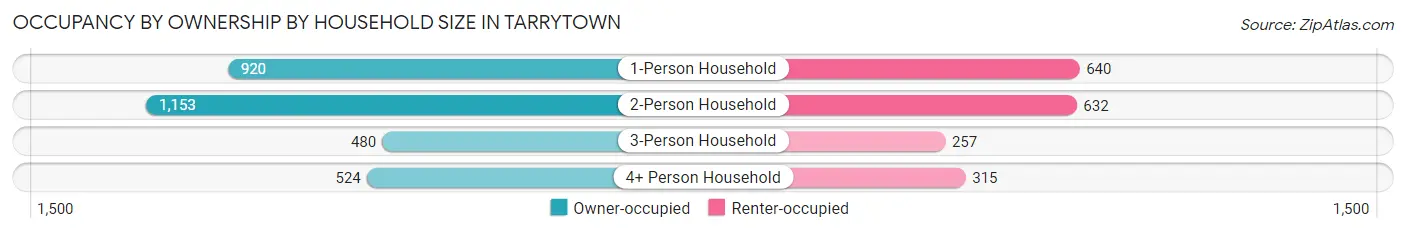
| Household Size | Owner-occupied | Renter-occupied |
| 1-Person Household | 920 (59.0%) | 640 (41.0%) |
| 2-Person Household | 1,153 (64.6%) | 632 (35.4%) |
| 3-Person Household | 480 (65.1%) | 257 (34.9%) |
| 4+ Person Household | 524 (62.5%) | 315 (37.5%) |
| Total Housing Units | 3,077 (62.5%) | 1,844 (37.5%) |
Occupancy by Educational Attainment in Tarrytown
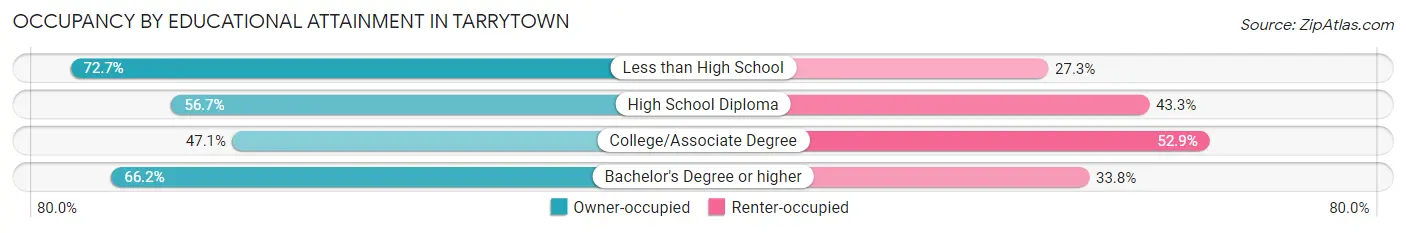
| Household Size | Owner-occupied | Renter-occupied |
| Less than High School | 200 (72.7%) | 75 (27.3%) |
| High School Diploma | 422 (56.7%) | 322 (43.3%) |
| College/Associate Degree | 320 (47.1%) | 359 (52.9%) |
| Bachelor's Degree or higher | 2,135 (66.2%) | 1,088 (33.8%) |
Occupancy by Age of Householder in Tarrytown
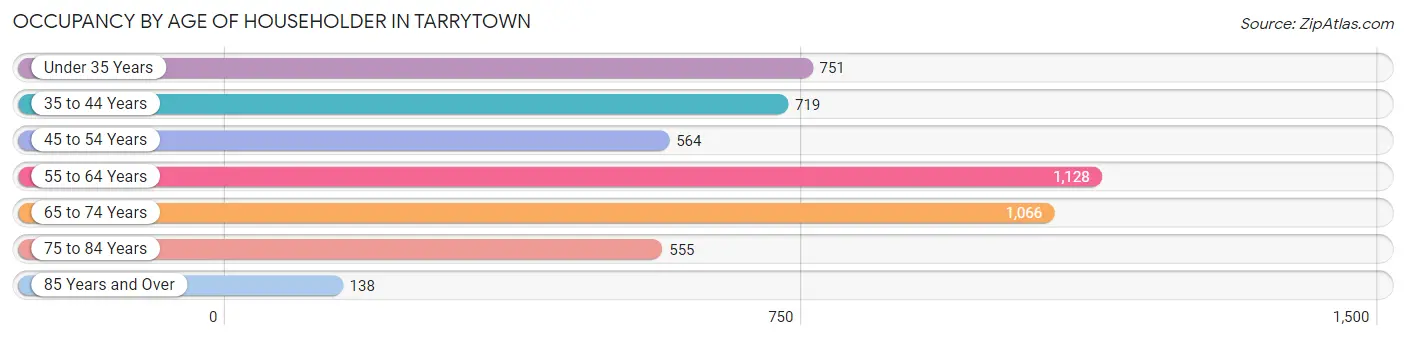
| Age Bracket | # Households | % Households |
| Under 35 Years | 751 | 15.3% |
| 35 to 44 Years | 719 | 14.6% |
| 45 to 54 Years | 564 | 11.5% |
| 55 to 64 Years | 1,128 | 22.9% |
| 65 to 74 Years | 1,066 | 21.7% |
| 75 to 84 Years | 555 | 11.3% |
| 85 Years and Over | 138 | 2.8% |
| Total | 4,921 | 100.0% |
Housing Finances in Tarrytown
Median Income by Occupancy in Tarrytown
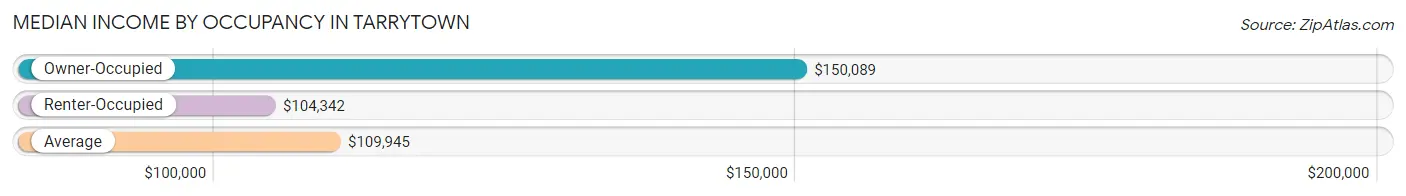
| Occupancy Type | # Households | Median Income |
| Owner-Occupied | 3,077 (62.5%) | $150,089 |
| Renter-Occupied | 1,844 (37.5%) | $104,342 |
| Average | 4,921 (100.0%) | $109,945 |
Occupancy by Householder Income Bracket in Tarrytown
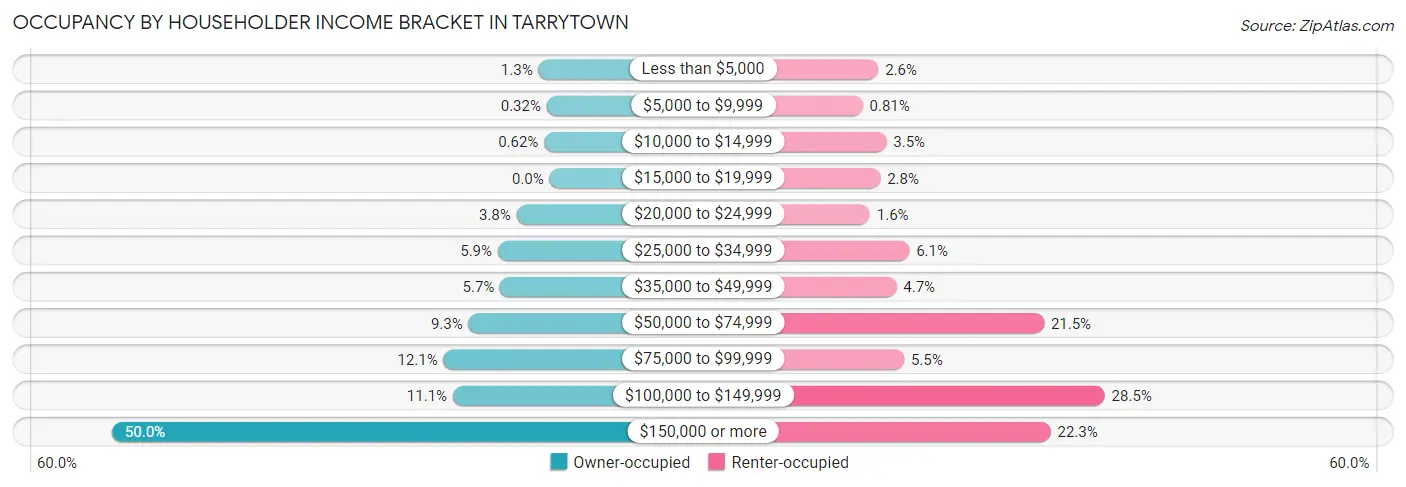
| Income Bracket | Owner-occupied | Renter-occupied |
| Less than $5,000 | 39 (1.3%) | 48 (2.6%) |
| $5,000 to $9,999 | 10 (0.3%) | 15 (0.8%) |
| $10,000 to $14,999 | 19 (0.6%) | 65 (3.5%) |
| $15,000 to $19,999 | 0 (0.0%) | 52 (2.8%) |
| $20,000 to $24,999 | 116 (3.8%) | 30 (1.6%) |
| $25,000 to $34,999 | 182 (5.9%) | 113 (6.1%) |
| $35,000 to $49,999 | 174 (5.7%) | 86 (4.7%) |
| $50,000 to $74,999 | 285 (9.3%) | 397 (21.5%) |
| $75,000 to $99,999 | 373 (12.1%) | 102 (5.5%) |
| $100,000 to $149,999 | 340 (11.1%) | 525 (28.5%) |
| $150,000 or more | 1,539 (50.0%) | 411 (22.3%) |
| Total | 3,077 (100.0%) | 1,844 (100.0%) |
Monthly Housing Cost Tiers in Tarrytown
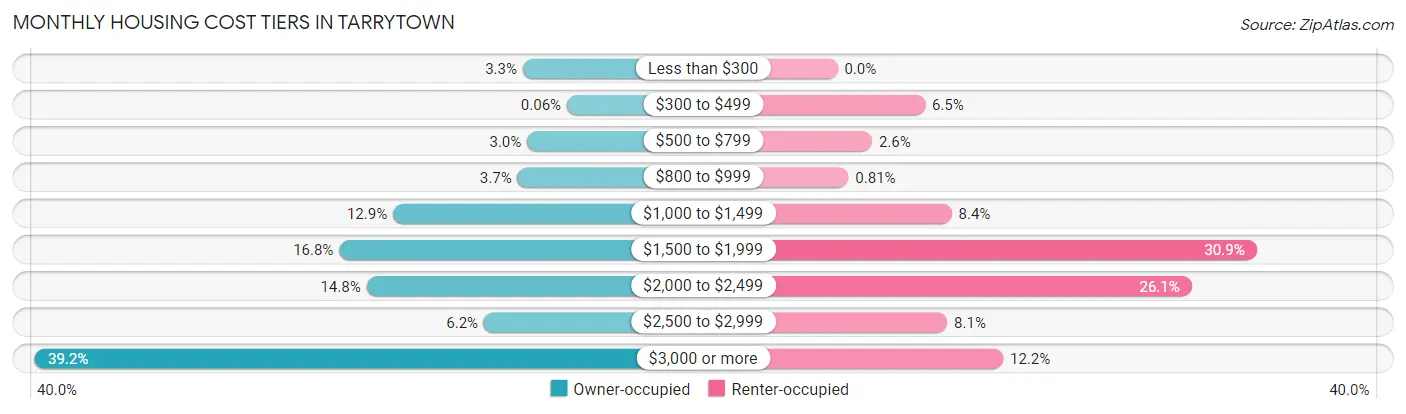
| Monthly Cost | Owner-occupied | Renter-occupied |
| Less than $300 | 102 (3.3%) | 0 (0.0%) |
| $300 to $499 | 2 (0.1%) | 119 (6.5%) |
| $500 to $799 | 92 (3.0%) | 47 (2.5%) |
| $800 to $999 | 114 (3.7%) | 15 (0.8%) |
| $1,000 to $1,499 | 396 (12.9%) | 155 (8.4%) |
| $1,500 to $1,999 | 518 (16.8%) | 569 (30.9%) |
| $2,000 to $2,499 | 456 (14.8%) | 481 (26.1%) |
| $2,500 to $2,999 | 190 (6.2%) | 149 (8.1%) |
| $3,000 or more | 1,207 (39.2%) | 225 (12.2%) |
| Total | 3,077 (100.0%) | 1,844 (100.0%) |
Physical Housing Characteristics in Tarrytown
Housing Structures in Tarrytown
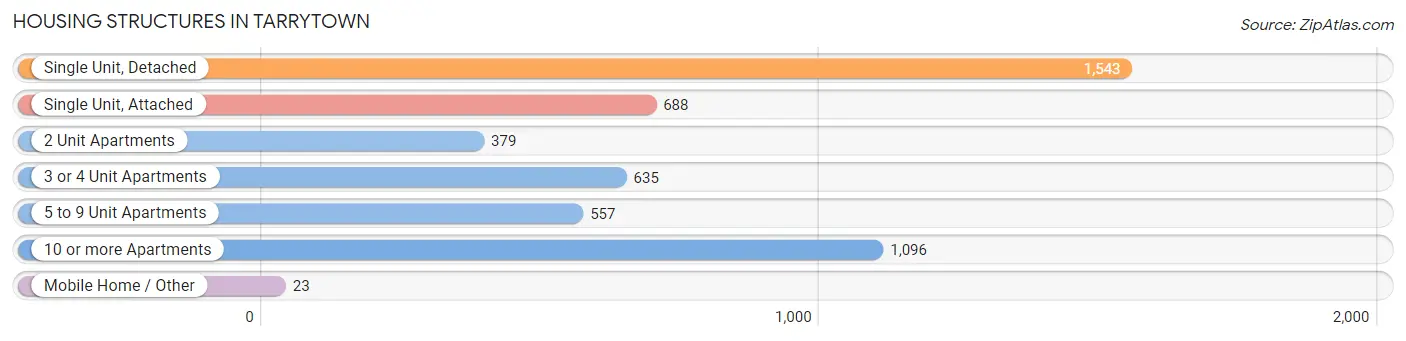
| Structure Type | # Housing Units | % Housing Units |
| Single Unit, Detached | 1,543 | 31.4% |
| Single Unit, Attached | 688 | 14.0% |
| 2 Unit Apartments | 379 | 7.7% |
| 3 or 4 Unit Apartments | 635 | 12.9% |
| 5 to 9 Unit Apartments | 557 | 11.3% |
| 10 or more Apartments | 1,096 | 22.3% |
| Mobile Home / Other | 23 | 0.5% |
| Total | 4,921 | 100.0% |
Housing Structures by Occupancy in Tarrytown
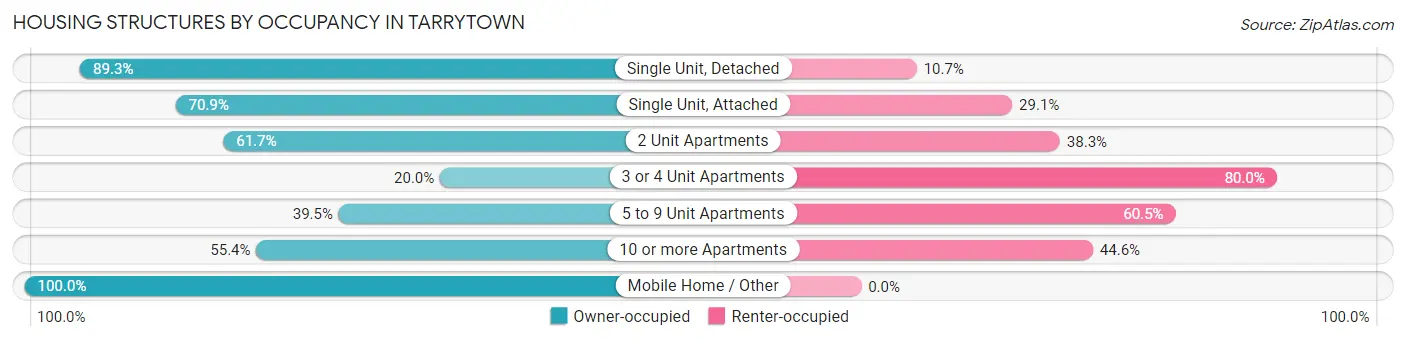
| Structure Type | Owner-occupied | Renter-occupied |
| Single Unit, Detached | 1,378 (89.3%) | 165 (10.7%) |
| Single Unit, Attached | 488 (70.9%) | 200 (29.1%) |
| 2 Unit Apartments | 234 (61.7%) | 145 (38.3%) |
| 3 or 4 Unit Apartments | 127 (20.0%) | 508 (80.0%) |
| 5 to 9 Unit Apartments | 220 (39.5%) | 337 (60.5%) |
| 10 or more Apartments | 607 (55.4%) | 489 (44.6%) |
| Mobile Home / Other | 23 (100.0%) | 0 (0.0%) |
| Total | 3,077 (62.5%) | 1,844 (37.5%) |
Housing Structures by Number of Rooms in Tarrytown
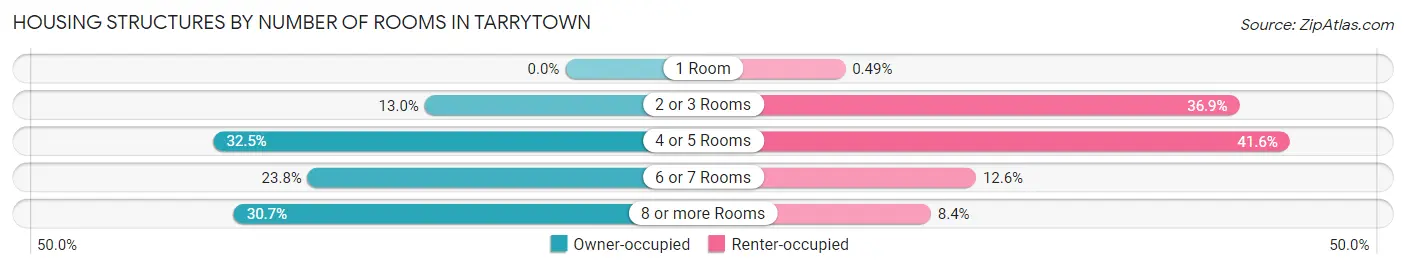
| Number of Rooms | Owner-occupied | Renter-occupied |
| 1 Room | 0 (0.0%) | 9 (0.5%) |
| 2 or 3 Rooms | 400 (13.0%) | 681 (36.9%) |
| 4 or 5 Rooms | 1,001 (32.5%) | 767 (41.6%) |
| 6 or 7 Rooms | 733 (23.8%) | 232 (12.6%) |
| 8 or more Rooms | 943 (30.6%) | 155 (8.4%) |
| Total | 3,077 (100.0%) | 1,844 (100.0%) |
Housing Structure by Heating Type in Tarrytown
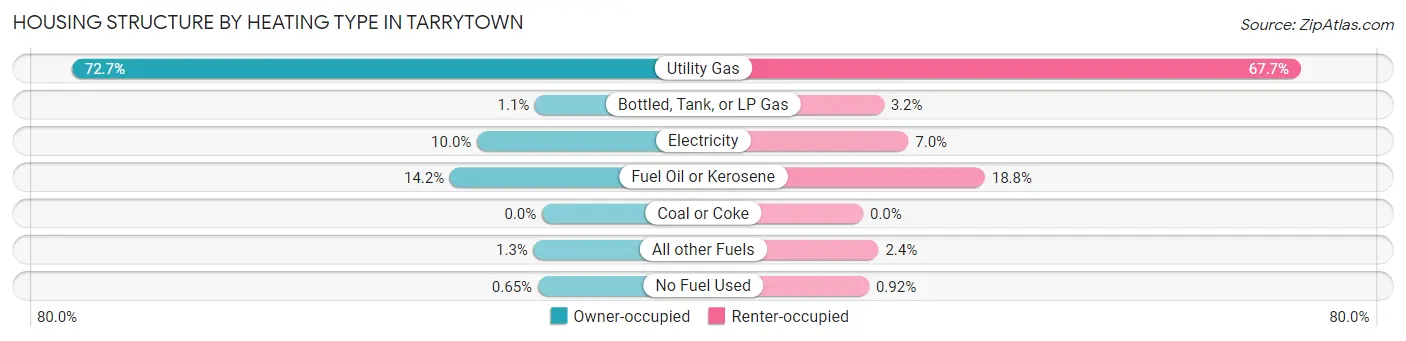
| Heating Type | Owner-occupied | Renter-occupied |
| Utility Gas | 2,237 (72.7%) | 1,248 (67.7%) |
| Bottled, Tank, or LP Gas | 33 (1.1%) | 59 (3.2%) |
| Electricity | 309 (10.0%) | 129 (7.0%) |
| Fuel Oil or Kerosene | 438 (14.2%) | 347 (18.8%) |
| Coal or Coke | 0 (0.0%) | 0 (0.0%) |
| All other Fuels | 40 (1.3%) | 44 (2.4%) |
| No Fuel Used | 20 (0.6%) | 17 (0.9%) |
| Total | 3,077 (100.0%) | 1,844 (100.0%) |
Household Vehicle Usage in Tarrytown
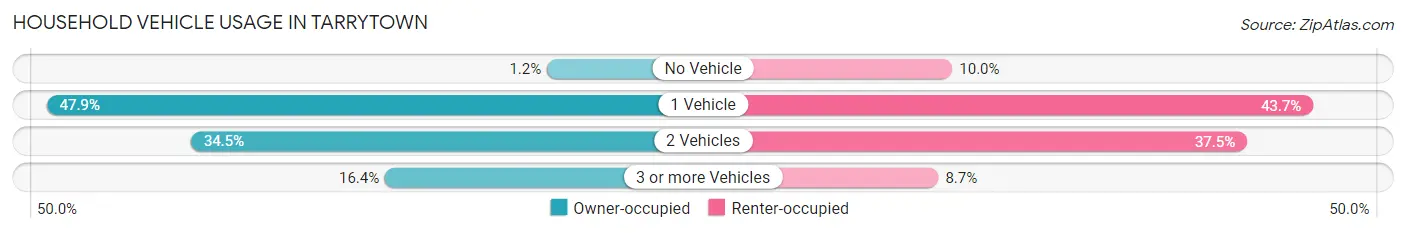
| Vehicles per Household | Owner-occupied | Renter-occupied |
| No Vehicle | 38 (1.2%) | 185 (10.0%) |
| 1 Vehicle | 1,475 (47.9%) | 806 (43.7%) |
| 2 Vehicles | 1,061 (34.5%) | 692 (37.5%) |
| 3 or more Vehicles | 503 (16.4%) | 161 (8.7%) |
| Total | 3,077 (100.0%) | 1,844 (100.0%) |
Real Estate & Mortgages in Tarrytown
Real Estate and Mortgage Overview in Tarrytown
| Characteristic | Without Mortgage | With Mortgage |
| Housing Units | 1,383 | 1,694 |
| Median Property Value | $598,600 | $655,800 |
| Median Household Income | $86,404 | $1,116 |
| Monthly Housing Costs | $1,501 | $1,059 |
| Real Estate Taxes | $10,001 | $194 |
Property Value by Mortgage Status in Tarrytown
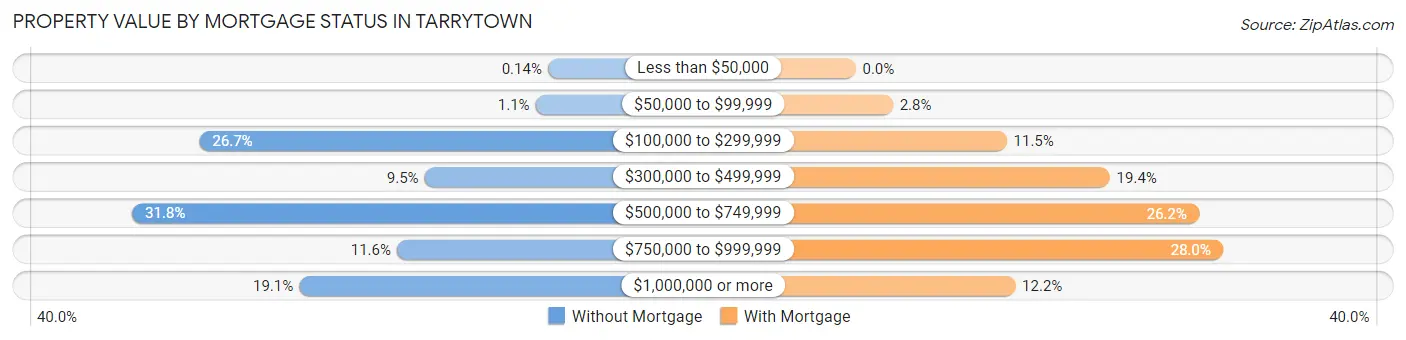
| Property Value | Without Mortgage | With Mortgage |
| Less than $50,000 | 2 (0.1%) | 0 (0.0%) |
| $50,000 to $99,999 | 15 (1.1%) | 48 (2.8%) |
| $100,000 to $299,999 | 369 (26.7%) | 195 (11.5%) |
| $300,000 to $499,999 | 132 (9.5%) | 328 (19.4%) |
| $500,000 to $749,999 | 440 (31.8%) | 443 (26.2%) |
| $750,000 to $999,999 | 161 (11.6%) | 474 (28.0%) |
| $1,000,000 or more | 264 (19.1%) | 206 (12.2%) |
| Total | 1,383 (100.0%) | 1,694 (100.0%) |
Household Income by Mortgage Status in Tarrytown
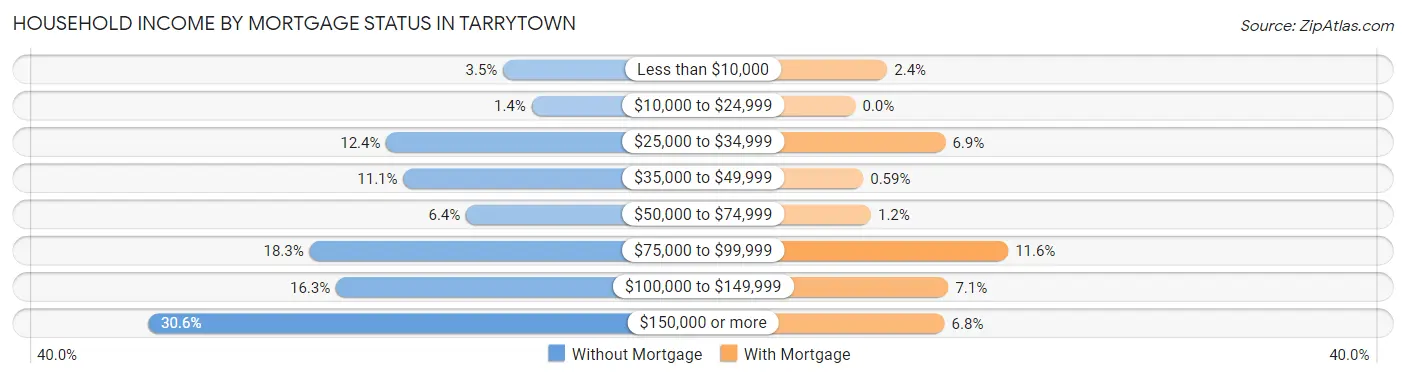
| Household Income | Without Mortgage | With Mortgage |
| Less than $10,000 | 49 (3.5%) | 41 (2.4%) |
| $10,000 to $24,999 | 19 (1.4%) | 0 (0.0%) |
| $25,000 to $34,999 | 172 (12.4%) | 116 (6.9%) |
| $35,000 to $49,999 | 154 (11.1%) | 10 (0.6%) |
| $50,000 to $74,999 | 88 (6.4%) | 20 (1.2%) |
| $75,000 to $99,999 | 253 (18.3%) | 197 (11.6%) |
| $100,000 to $149,999 | 225 (16.3%) | 120 (7.1%) |
| $150,000 or more | 423 (30.6%) | 115 (6.8%) |
| Total | 1,383 (100.0%) | 1,694 (100.0%) |
Property Value to Household Income Ratio in Tarrytown
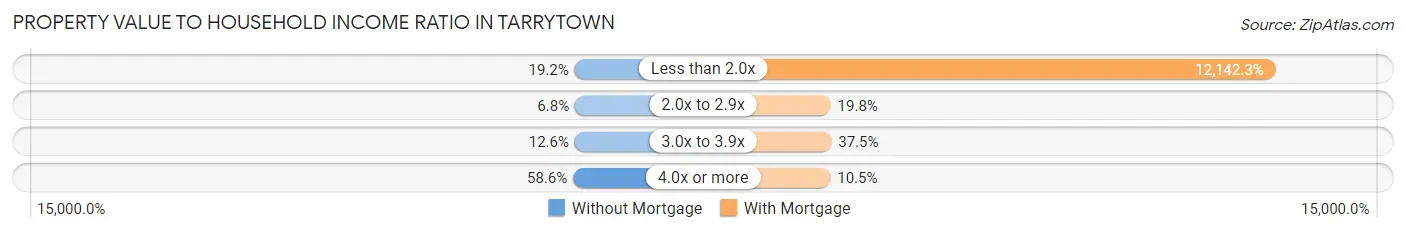
| Value-to-Income Ratio | Without Mortgage | With Mortgage |
| Less than 2.0x | 266 (19.2%) | 205,690 (12,142.3%) |
| 2.0x to 2.9x | 94 (6.8%) | 336 (19.8%) |
| 3.0x to 3.9x | 174 (12.6%) | 636 (37.5%) |
| 4.0x or more | 810 (58.6%) | 178 (10.5%) |
| Total | 1,383 (100.0%) | 1,694 (100.0%) |
Real Estate Taxes by Mortgage Status in Tarrytown
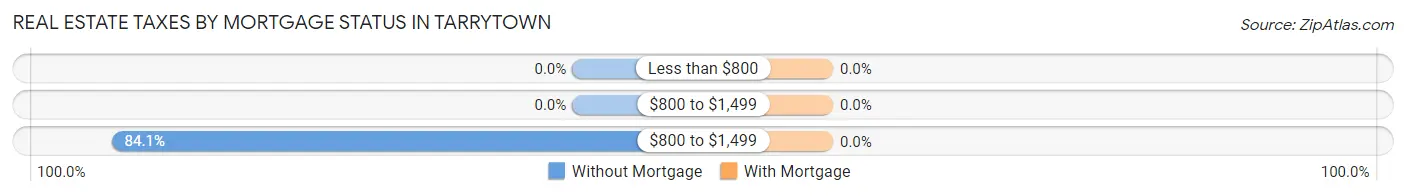
| Property Taxes | Without Mortgage | With Mortgage |
| Less than $800 | 0 (0.0%) | 0 (0.0%) |
| $800 to $1,499 | 0 (0.0%) | 0 (0.0%) |
| $800 to $1,499 | 1,163 (84.1%) | 0 (0.0%) |
| Total | 1,383 (100.0%) | 1,694 (100.0%) |
Health & Disability in Tarrytown
Health Insurance Coverage by Age in Tarrytown
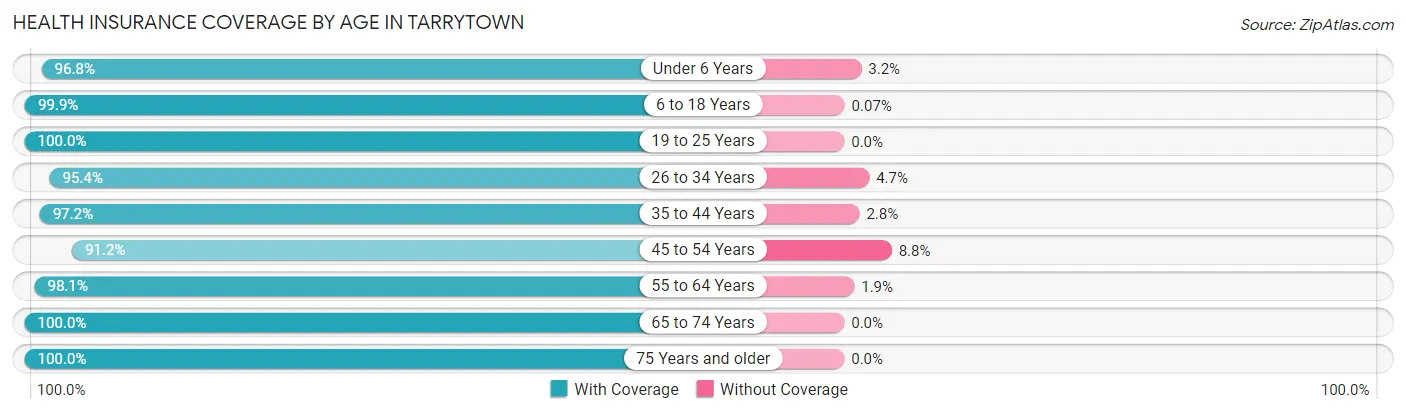
| Age Bracket | With Coverage | Without Coverage |
| Under 6 Years | 639 (96.8%) | 21 (3.2%) |
| 6 to 18 Years | 1,341 (99.9%) | 1 (0.1%) |
| 19 to 25 Years | 1,205 (100.0%) | 0 (0.0%) |
| 26 to 34 Years | 1,434 (95.4%) | 70 (4.6%) |
| 35 to 44 Years | 1,373 (97.2%) | 40 (2.8%) |
| 45 to 54 Years | 1,279 (91.2%) | 124 (8.8%) |
| 55 to 64 Years | 1,633 (98.1%) | 31 (1.9%) |
| 65 to 74 Years | 1,573 (100.0%) | 0 (0.0%) |
| 75 Years and older | 919 (100.0%) | 0 (0.0%) |
| Total | 11,396 (97.5%) | 287 (2.5%) |
Health Insurance Coverage by Citizenship Status in Tarrytown
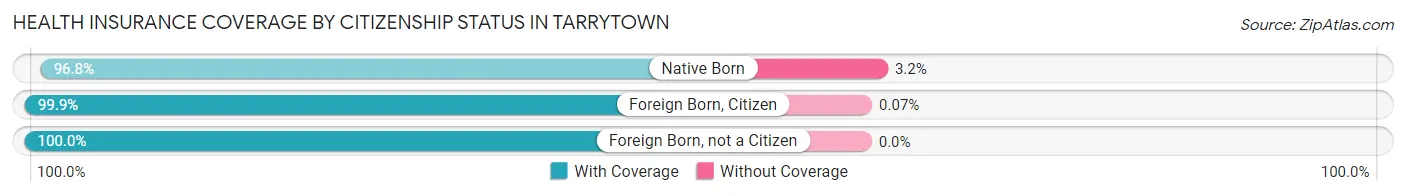
| Citizenship Status | With Coverage | Without Coverage |
| Native Born | 639 (96.8%) | 21 (3.2%) |
| Foreign Born, Citizen | 1,341 (99.9%) | 1 (0.1%) |
| Foreign Born, not a Citizen | 1,205 (100.0%) | 0 (0.0%) |
Health Insurance Coverage by Household Income in Tarrytown
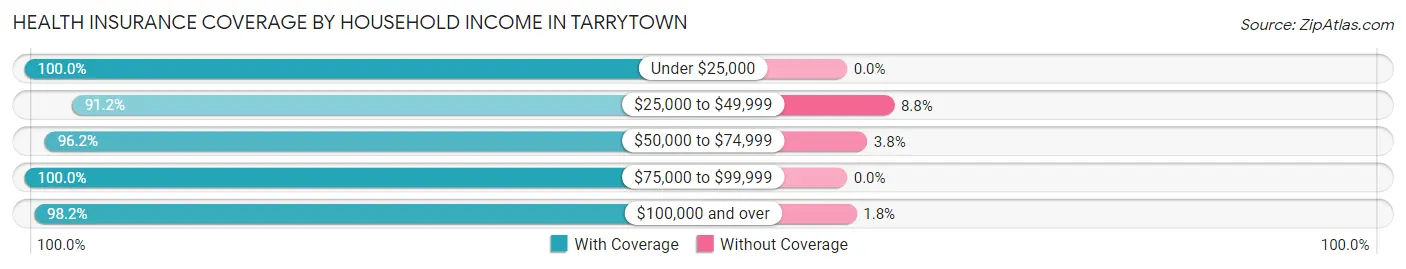
| Household Income | With Coverage | Without Coverage |
| Under $25,000 | 521 (100.0%) | 0 (0.0%) |
| $25,000 to $49,999 | 1,084 (91.2%) | 105 (8.8%) |
| $50,000 to $74,999 | 1,046 (96.2%) | 41 (3.8%) |
| $75,000 to $99,999 | 872 (100.0%) | 0 (0.0%) |
| $100,000 and over | 7,699 (98.2%) | 140 (1.8%) |
Public vs Private Health Insurance Coverage by Age in Tarrytown
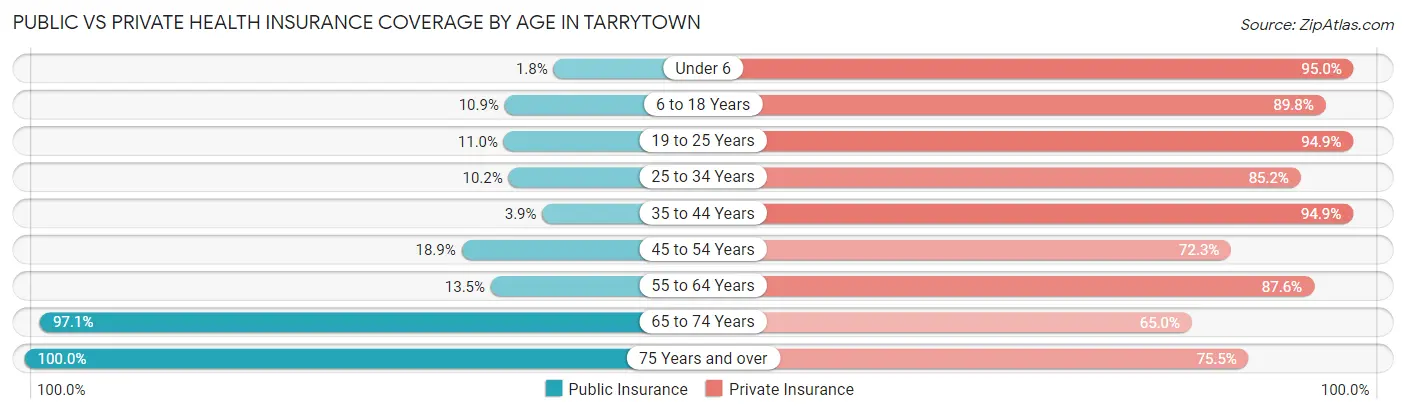
| Age Bracket | Public Insurance | Private Insurance |
| Under 6 | 12 (1.8%) | 627 (95.0%) |
| 6 to 18 Years | 146 (10.9%) | 1,205 (89.8%) |
| 19 to 25 Years | 133 (11.0%) | 1,144 (94.9%) |
| 25 to 34 Years | 153 (10.2%) | 1,281 (85.2%) |
| 35 to 44 Years | 55 (3.9%) | 1,341 (94.9%) |
| 45 to 54 Years | 265 (18.9%) | 1,014 (72.3%) |
| 55 to 64 Years | 224 (13.5%) | 1,458 (87.6%) |
| 65 to 74 Years | 1,528 (97.1%) | 1,022 (65.0%) |
| 75 Years and over | 919 (100.0%) | 694 (75.5%) |
| Total | 3,435 (29.4%) | 9,786 (83.8%) |
Disability Status by Sex by Age in Tarrytown
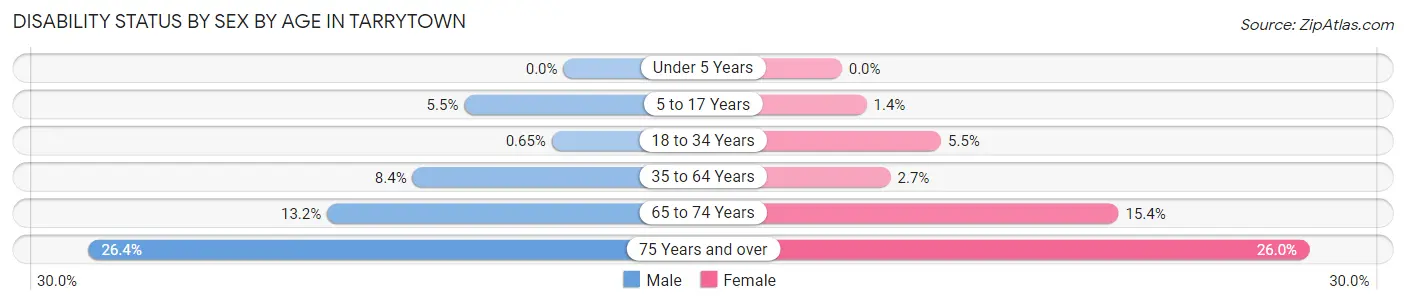
| Age Bracket | Male | Female |
| Under 5 Years | 0 (0.0%) | 0 (0.0%) |
| 5 to 17 Years | 35 (5.5%) | 10 (1.4%) |
| 18 to 34 Years | 10 (0.6%) | 67 (5.5%) |
| 35 to 64 Years | 197 (8.4%) | 58 (2.7%) |
| 65 to 74 Years | 67 (13.2%) | 164 (15.4%) |
| 75 Years and over | 119 (26.4%) | 122 (26.0%) |
Disability Class by Sex by Age in Tarrytown
Disability Class: Hearing Difficulty
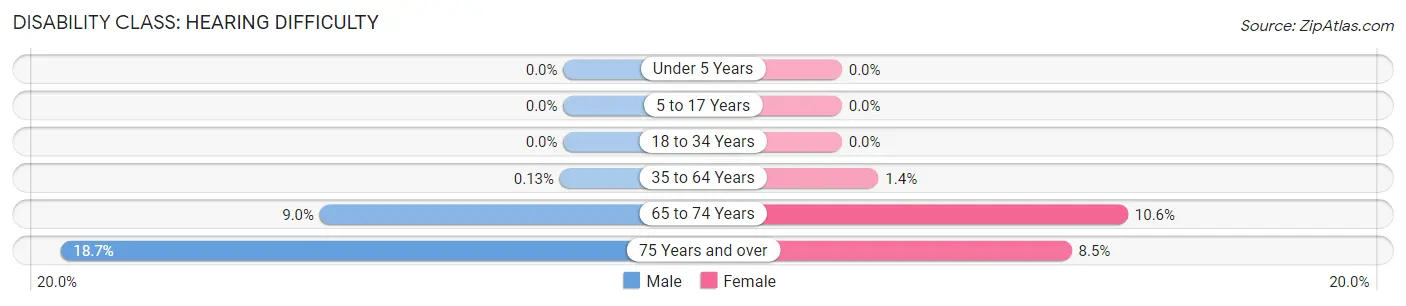
| Age Bracket | Male | Female |
| Under 5 Years | 0 (0.0%) | 0 (0.0%) |
| 5 to 17 Years | 0 (0.0%) | 0 (0.0%) |
| 18 to 34 Years | 0 (0.0%) | 0 (0.0%) |
| 35 to 64 Years | 3 (0.1%) | 29 (1.4%) |
| 65 to 74 Years | 46 (9.0%) | 113 (10.6%) |
| 75 Years and over | 84 (18.7%) | 40 (8.5%) |
Disability Class: Vision Difficulty
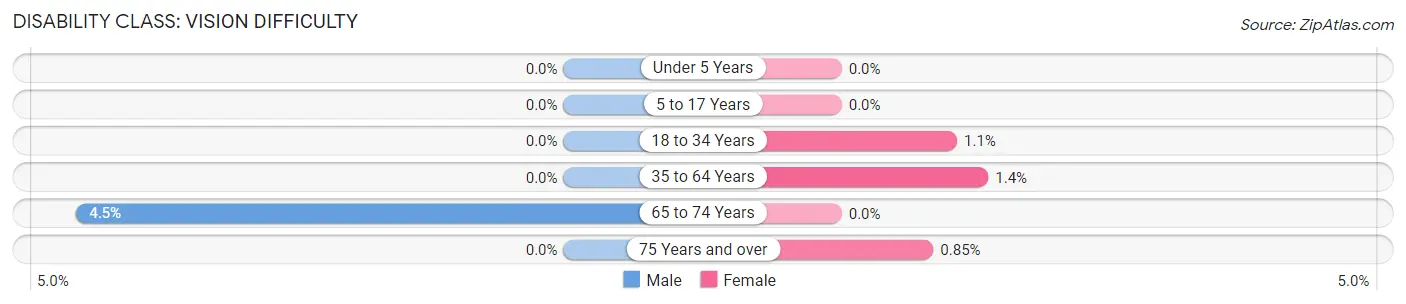
| Age Bracket | Male | Female |
| Under 5 Years | 0 (0.0%) | 0 (0.0%) |
| 5 to 17 Years | 0 (0.0%) | 0 (0.0%) |
| 18 to 34 Years | 0 (0.0%) | 13 (1.1%) |
| 35 to 64 Years | 0 (0.0%) | 29 (1.4%) |
| 65 to 74 Years | 23 (4.5%) | 0 (0.0%) |
| 75 Years and over | 0 (0.0%) | 4 (0.9%) |
Disability Class: Cognitive Difficulty
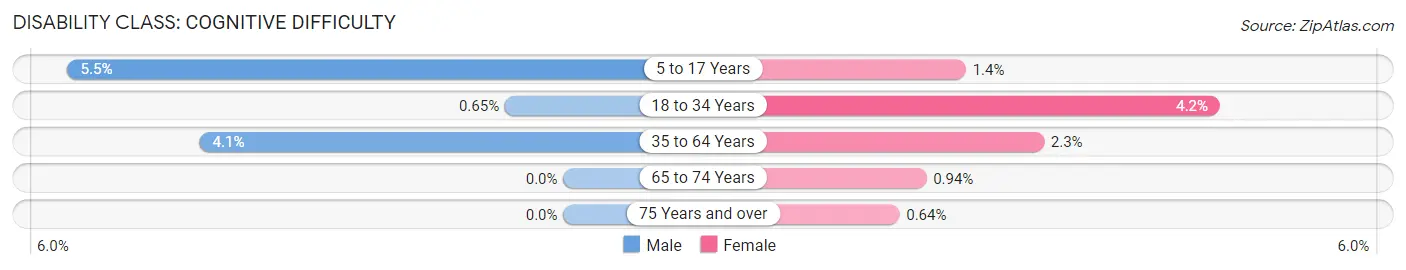
| Age Bracket | Male | Female |
| 5 to 17 Years | 35 (5.5%) | 10 (1.4%) |
| 18 to 34 Years | 10 (0.6%) | 51 (4.2%) |
| 35 to 64 Years | 95 (4.1%) | 48 (2.2%) |
| 65 to 74 Years | 0 (0.0%) | 10 (0.9%) |
| 75 Years and over | 0 (0.0%) | 3 (0.6%) |
Disability Class: Ambulatory Difficulty
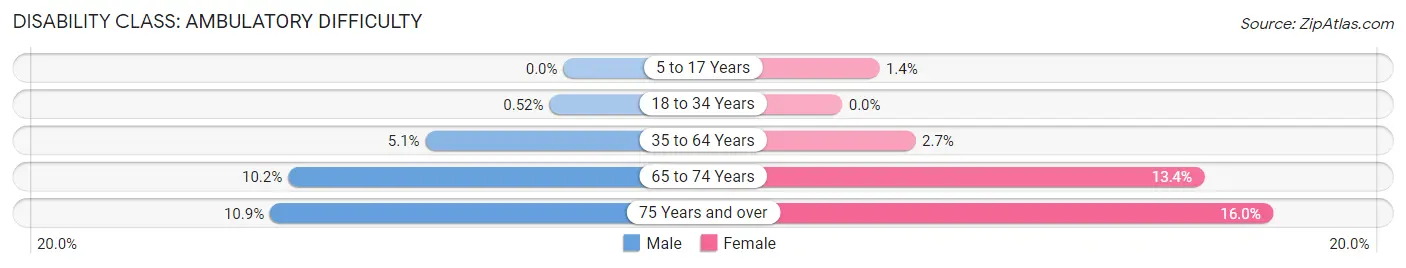
| Age Bracket | Male | Female |
| 5 to 17 Years | 0 (0.0%) | 10 (1.4%) |
| 18 to 34 Years | 8 (0.5%) | 0 (0.0%) |
| 35 to 64 Years | 120 (5.1%) | 58 (2.7%) |
| 65 to 74 Years | 52 (10.2%) | 143 (13.4%) |
| 75 Years and over | 49 (10.9%) | 75 (16.0%) |
Disability Class: Self-Care Difficulty
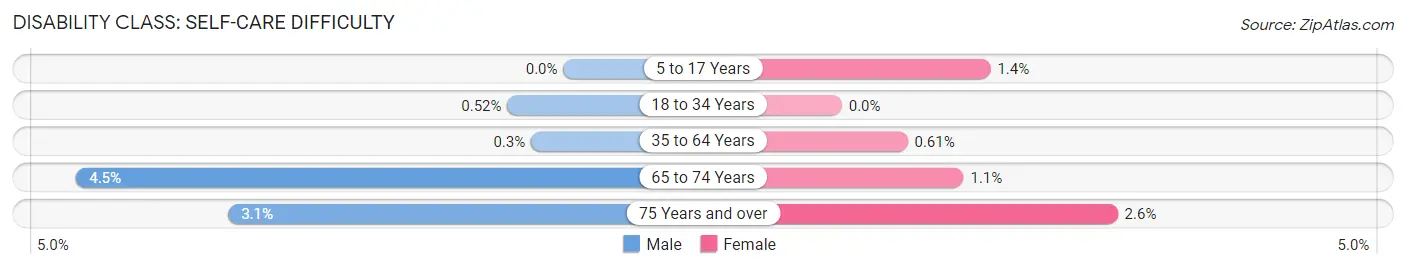
| Age Bracket | Male | Female |
| 5 to 17 Years | 0 (0.0%) | 10 (1.4%) |
| 18 to 34 Years | 8 (0.5%) | 0 (0.0%) |
| 35 to 64 Years | 7 (0.3%) | 13 (0.6%) |
| 65 to 74 Years | 23 (4.5%) | 12 (1.1%) |
| 75 Years and over | 14 (3.1%) | 12 (2.6%) |
Technology Access in Tarrytown
Computing Device Access in Tarrytown
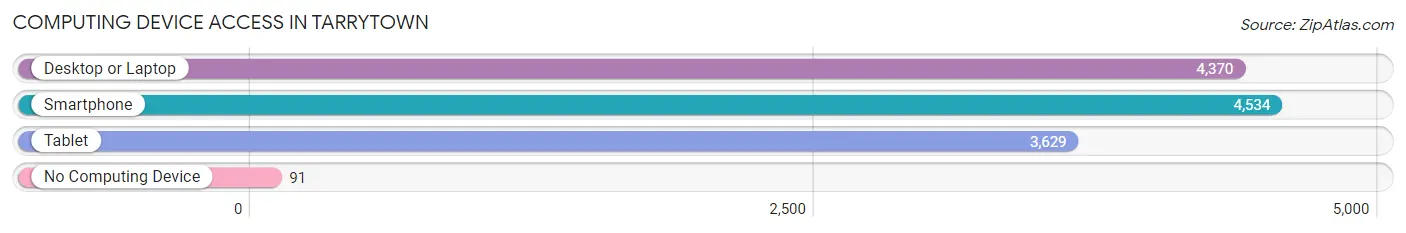
| Device Type | # Households | % Households |
| Desktop or Laptop | 4,370 | 88.8% |
| Smartphone | 4,534 | 92.1% |
| Tablet | 3,629 | 73.8% |
| No Computing Device | 91 | 1.8% |
| Total | 4,921 | 100.0% |
Internet Access in Tarrytown
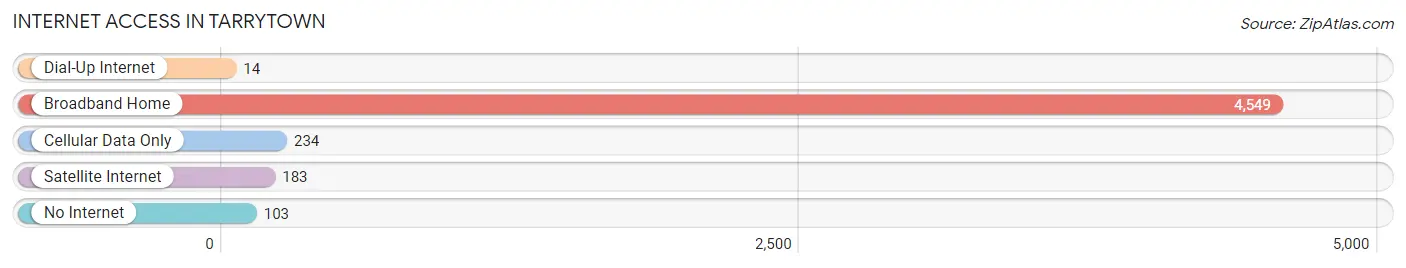
| Internet Type | # Households | % Households |
| Dial-Up Internet | 14 | 0.3% |
| Broadband Home | 4,549 | 92.4% |
| Cellular Data Only | 234 | 4.8% |
| Satellite Internet | 183 | 3.7% |
| No Internet | 103 | 2.1% |
| Total | 4,921 | 100.0% |
Tarrytown Summary
Tarrytown is a village located in Westchester County, New York, United States. It is located on the eastern bank of the Hudson River, about 25 miles north of New York City. The village has a population of 11,277 as of the 2010 census.
History
The area that is now Tarrytown was originally inhabited by the Weckquaesgeek Native Americans. The first European settlers arrived in the area in 1645, when Frederick Philipse purchased the land from the Native Americans. The village was originally known as “Philipsburg”, but was later changed to “Tarrytown” in 1817. The name is derived from the Dutch word “terwe”, which means “to delay”.
The village was an important port during the Revolutionary War, and was the site of the Battle of Tarrytown in 1779. The village was also the site of the first steamboat to travel up the Hudson River in 1807.
Geography
Tarrytown is located in Westchester County, New York, on the eastern bank of the Hudson River. It is bordered by the villages of Sleepy Hollow to the north, Irvington to the east, and Dobbs Ferry to the south. The village is located approximately 25 miles north of New York City.
The village has a total area of 4.2 square miles, of which 3.9 square miles is land and 0.3 square miles is water. The village is located at an elevation of approximately 200 feet above sea level.
Economy
Tarrytown’s economy is largely based on tourism and retail. The village is home to several popular tourist attractions, including the Lyndhurst Mansion, the Tarrytown Music Hall, and the Sleepy Hollow Cemetery. The village is also home to several large retail stores, including Target, Best Buy, and Home Depot.
The village is also home to several large employers, including Regeneron Pharmaceuticals, PepsiCo, and IBM. The village is also home to several educational institutions, including the College of New Rochelle, Pace University, and Mercy College.
Demographics
As of the 2010 census, the village had a population of 11,277. The racial makeup of the village was 79.2% White, 8.3% African American, 0.2% Native American, 5.7% Asian, 0.1% Pacific Islander, 3.2% from other races, and 3.3% from two or more races. Hispanic or Latino of any race were 11.2% of the population.
The median income for a household in the village was $76,945, and the median income for a family was $90,917. The per capita income for the village was $37,945. About 4.3% of families and 6.2% of the population were below the poverty line, including 8.2% of those under age 18 and 4.2% of those age 65 or over.
Common Questions
What is Per Capita Income in Tarrytown?
Per Capita income in Tarrytown is $74,362.
What is the Median Family Income in Tarrytown?
Median Family Income in Tarrytown is $161,120.
What is the Median Household income in Tarrytown?
Median Household Income in Tarrytown is $109,945.
What is Income or Wage Gap in Tarrytown?
Income or Wage Gap in Tarrytown is 25.8%.
Women in Tarrytown earn 74.2 cents for every dollar earned by a man.
What is Inequality or Gini Index in Tarrytown?
Inequality or Gini Index in Tarrytown is 0.49.
What is the Total Population of Tarrytown?
Total Population of Tarrytown is 11,776.
What is the Total Male Population of Tarrytown?
Total Male Population of Tarrytown is 5,841.
What is the Total Female Population of Tarrytown?
Total Female Population of Tarrytown is 5,935.
What is the Ratio of Males per 100 Females in Tarrytown?
There are 98.42 Males per 100 Females in Tarrytown.
What is the Ratio of Females per 100 Males in Tarrytown?
There are 101.61 Females per 100 Males in Tarrytown.
What is the Median Population Age in Tarrytown?
Median Population Age in Tarrytown is 42.9 Years.
What is the Average Family Size in Tarrytown
Average Family Size in Tarrytown is 3.0 People.
What is the Average Household Size in Tarrytown
Average Household Size in Tarrytown is 2.3 People.
How Large is the Labor Force in Tarrytown?
There are 6,371 People in the Labor Forcein in Tarrytown.
What is the Percentage of People in the Labor Force in Tarrytown?
63.6% of People are in the Labor Force in Tarrytown.
What is the Unemployment Rate in Tarrytown?
Unemployment Rate in Tarrytown is 2.8%.