Cities with the Highest Percentage of Slovene Population in New York
RELATED REPORTS & OPTIONS
Slovene
New York
Compare Cities
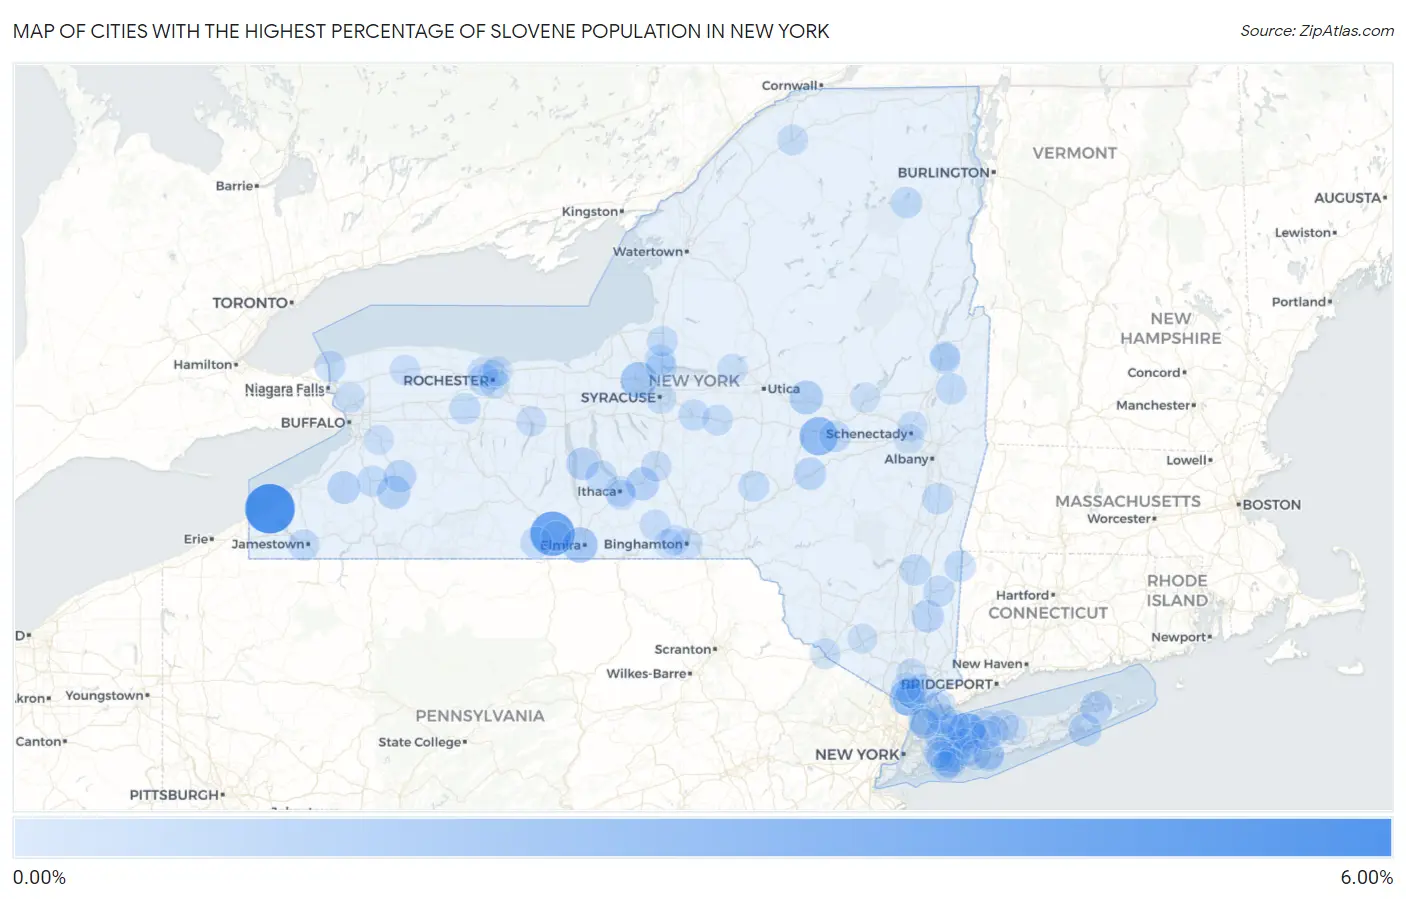
Map of Cities with the Highest Percentage of Slovene Population in New York
0.00%
6.00%
Cities with the Highest Percentage of Slovene Population in New York
| City | Slovene | vs State | vs National | |
| 1. | Westfield | 5.08% | 0.024%(+5.06)#1 | 0.052%(+5.03)#49 |
| 2. | Painted Post | 3.69% | 0.024%(+3.66)#2 | 0.052%(+3.64)#72 |
| 3. | Cherry Valley | 2.13% | 0.024%(+2.11)#3 | 0.052%(+2.08)#131 |
| 4. | Mountain Dale | 1.92% | 0.024%(+1.90)#4 | 0.052%(+1.87)#153 |
| 5. | Cold Spring Harbor | 1.68% | 0.024%(+1.65)#5 | 0.052%(+1.63)#180 |
| 6. | West Nyack | 1.54% | 0.024%(+1.52)#6 | 0.052%(+1.49)#199 |
| 7. | Baldwinsville | 1.50% | 0.024%(+1.47)#7 | 0.052%(+1.45)#210 |
| 8. | West Elmira | 1.38% | 0.024%(+1.35)#8 | 0.052%(+1.32)#227 |
| 9. | Little Falls | 0.98% | 0.024%(+0.955)#9 | 0.052%(+0.927)#329 |
| 10. | Lime Lake | 0.79% | 0.024%(+0.771)#10 | 0.052%(+0.743)#406 |
| 11. | Dryden | 0.76% | 0.024%(+0.738)#11 | 0.052%(+0.710)#424 |
| 12. | Gowanda | 0.69% | 0.024%(+0.661)#12 | 0.052%(+0.633)#483 |
| 13. | Lodi | 0.66% | 0.024%(+0.636)#13 | 0.052%(+0.608)#500 |
| 14. | Southampton | 0.65% | 0.024%(+0.623)#14 | 0.052%(+0.595)#505 |
| 15. | Hillside Lake | 0.64% | 0.024%(+0.613)#15 | 0.052%(+0.585)#511 |
| 16. | Arcade | 0.62% | 0.024%(+0.597)#16 | 0.052%(+0.569)#523 |
| 17. | Schenevus | 0.62% | 0.024%(+0.592)#17 | 0.052%(+0.564)#526 |
| 18. | North Haven | 0.55% | 0.024%(+0.524)#18 | 0.052%(+0.496)#572 |
| 19. | Blauvelt | 0.49% | 0.024%(+0.461)#19 | 0.052%(+0.433)#651 |
| 20. | Sharon Springs | 0.47% | 0.024%(+0.451)#20 | 0.052%(+0.423)#661 |
| 21. | Addison | 0.38% | 0.024%(+0.356)#21 | 0.052%(+0.329)#808 |
| 22. | Gates | 0.36% | 0.024%(+0.337)#22 | 0.052%(+0.309)#850 |
| 23. | Lake Placid | 0.35% | 0.024%(+0.327)#23 | 0.052%(+0.299)#869 |
| 24. | Millerton | 0.35% | 0.024%(+0.324)#24 | 0.052%(+0.296)#875 |
| 25. | Jamestown West | 0.35% | 0.024%(+0.324)#25 | 0.052%(+0.296)#876 |
| 26. | Old Westbury | 0.34% | 0.024%(+0.316)#26 | 0.052%(+0.288)#889 |
| 27. | Trumansburg | 0.34% | 0.024%(+0.313)#27 | 0.052%(+0.285)#901 |
| 28. | Rhinebeck | 0.33% | 0.024%(+0.310)#28 | 0.052%(+0.282)#907 |
| 29. | Pelham | 0.32% | 0.024%(+0.293)#29 | 0.052%(+0.265)#941 |
| 30. | Springville | 0.31% | 0.024%(+0.284)#30 | 0.052%(+0.256)#961 |
| 31. | Schuylerville | 0.30% | 0.024%(+0.281)#31 | 0.052%(+0.253)#965 |
| 32. | Brewerton | 0.30% | 0.024%(+0.273)#32 | 0.052%(+0.245)#984 |
| 33. | Gilbertsville | 0.30% | 0.024%(+0.273)#33 | 0.052%(+0.245)#985 |
| 34. | Kinderhook | 0.30% | 0.024%(+0.272)#34 | 0.052%(+0.244)#987 |
| 35. | Caledonia | 0.29% | 0.024%(+0.270)#35 | 0.052%(+0.242)#993 |
| 36. | Millbrook | 0.29% | 0.024%(+0.266)#36 | 0.052%(+0.238)#1,005 |
| 37. | Cazenovia | 0.29% | 0.024%(+0.266)#37 | 0.052%(+0.238)#1,007 |
| 38. | Youngstown | 0.25% | 0.024%(+0.231)#38 | 0.052%(+0.203)#1,122 |
| 39. | Central Square | 0.24% | 0.024%(+0.217)#39 | 0.052%(+0.189)#1,181 |
| 40. | Cortland | 0.23% | 0.024%(+0.204)#40 | 0.052%(+0.176)#1,223 |
| 41. | Locust Valley | 0.22% | 0.024%(+0.198)#41 | 0.052%(+0.170)#1,241 |
| 42. | Valley Cottage | 0.20% | 0.024%(+0.175)#42 | 0.052%(+0.147)#1,324 |
| 43. | Potsdam | 0.20% | 0.024%(+0.175)#43 | 0.052%(+0.147)#1,325 |
| 44. | Morrisville | 0.20% | 0.024%(+0.173)#44 | 0.052%(+0.145)#1,328 |
| 45. | East Meadow | 0.20% | 0.024%(+0.172)#45 | 0.052%(+0.144)#1,334 |
| 46. | Port Jervis | 0.19% | 0.024%(+0.171)#46 | 0.052%(+0.143)#1,335 |
| 47. | Brightwaters | 0.19% | 0.024%(+0.165)#47 | 0.052%(+0.137)#1,371 |
| 48. | South Glens Falls | 0.19% | 0.024%(+0.163)#48 | 0.052%(+0.135)#1,378 |
| 49. | Newark Valley | 0.19% | 0.024%(+0.161)#49 | 0.052%(+0.133)#1,388 |
| 50. | Bronxville | 0.18% | 0.024%(+0.159)#50 | 0.052%(+0.131)#1,396 |
| 51. | Parish | 0.18% | 0.024%(+0.156)#51 | 0.052%(+0.128)#1,410 |
| 52. | West Bay Shore | 0.18% | 0.024%(+0.155)#52 | 0.052%(+0.127)#1,415 |
| 53. | Stewart Manor | 0.18% | 0.024%(+0.154)#53 | 0.052%(+0.127)#1,417 |
| 54. | Fort Salonga | 0.17% | 0.024%(+0.149)#54 | 0.052%(+0.121)#1,439 |
| 55. | Rye Brook | 0.17% | 0.024%(+0.148)#55 | 0.052%(+0.120)#1,449 |
| 56. | Stony Brook | 0.15% | 0.024%(+0.128)#56 | 0.052%(+0.100)#1,544 |
| 57. | Floral Park | 0.15% | 0.024%(+0.127)#57 | 0.052%(+0.099)#1,549 |
| 58. | Port Washington | 0.15% | 0.024%(+0.123)#58 | 0.052%(+0.095)#1,577 |
| 59. | Rye | 0.15% | 0.024%(+0.122)#59 | 0.052%(+0.094)#1,582 |
| 60. | Smithtown | 0.14% | 0.024%(+0.121)#60 | 0.052%(+0.093)#1,594 |
| 61. | Montrose | 0.13% | 0.024%(+0.110)#61 | 0.052%(+0.082)#1,634 |
| 62. | Ithaca | 0.12% | 0.024%(+0.101)#62 | 0.052%(+0.073)#1,705 |
| 63. | Binghamton | 0.12% | 0.024%(+0.098)#63 | 0.052%(+0.070)#1,715 |
| 64. | South Hill | 0.12% | 0.024%(+0.097)#64 | 0.052%(+0.069)#1,721 |
| 65. | North Merrick | 0.11% | 0.024%(+0.091)#65 | 0.052%(+0.063)#1,766 |
| 66. | Greece | 0.11% | 0.024%(+0.087)#66 | 0.052%(+0.059)#1,791 |
| 67. | South Huntington | 0.11% | 0.024%(+0.083)#67 | 0.052%(+0.055)#1,821 |
| 68. | Medina | 0.10% | 0.024%(+0.079)#68 | 0.052%(+0.051)#1,842 |
| 69. | Canandaigua | 0.095% | 0.024%(+0.071)#69 | 0.052%(+0.043)#1,890 |
| 70. | Briarcliff Manor | 0.095% | 0.024%(+0.071)#70 | 0.052%(+0.043)#1,891 |
| 71. | Syracuse | 0.094% | 0.024%(+0.070)#71 | 0.052%(+0.042)#1,895 |
| 72. | De Witt | 0.089% | 0.024%(+0.065)#72 | 0.052%(+0.037)#1,940 |
| 73. | East Glenville | 0.087% | 0.024%(+0.063)#73 | 0.052%(+0.035)#1,958 |
| 74. | Huntington | 0.087% | 0.024%(+0.063)#74 | 0.052%(+0.035)#1,961 |
| 75. | Corning | 0.084% | 0.024%(+0.060)#75 | 0.052%(+0.033)#1,983 |
| 76. | Endwell | 0.076% | 0.024%(+0.052)#76 | 0.052%(+0.024)#2,062 |
| 77. | Freeport | 0.068% | 0.024%(+0.044)#77 | 0.052%(+0.016)#2,128 |
| 78. | East Aurora | 0.067% | 0.024%(+0.043)#78 | 0.052%(+0.015)#2,135 |
| 79. | North Tonawanda | 0.066% | 0.024%(+0.042)#79 | 0.052%(+0.014)#2,144 |
| 80. | Rome | 0.062% | 0.024%(+0.039)#80 | 0.052%(+0.011)#2,178 |
| 81. | Farmingdale | 0.059% | 0.024%(+0.036)#81 | 0.052%(+0.008)#2,208 |
| 82. | Endicott | 0.059% | 0.024%(+0.035)#82 | 0.052%(+0.007)#2,210 |
| 83. | Rochester | 0.058% | 0.024%(+0.034)#83 | 0.052%(+0.006)#2,230 |
| 84. | Plainview | 0.056% | 0.024%(+0.033)#84 | 0.052%(+0.005)#2,250 |
| 85. | Glens Falls | 0.054% | 0.024%(+0.030)#85 | 0.052%(+0.003)#2,266 |
| 86. | Gloversville | 0.053% | 0.024%(+0.029)#86 | 0.052%(+0.001)#2,280 |
| 87. | Rotterdam | 0.053% | 0.024%(+0.029)#87 | 0.052%(+0.001)#2,281 |
| 88. | Franklin Square | 0.050% | 0.024%(+0.026)#88 | 0.052%(-0.002)#2,313 |
| 89. | West Babylon | 0.049% | 0.024%(+0.025)#89 | 0.052%(-0.003)#2,331 |
| 90. | Brighton | 0.046% | 0.024%(+0.022)#90 | 0.052%(-0.006)#2,364 |
| 91. | Scotchtown | 0.039% | 0.024%(+0.015)#91 | 0.052%(-0.013)#2,464 |
| 92. | Baldwin | 0.038% | 0.024%(+0.015)#92 | 0.052%(-0.013)#2,468 |
| 93. | Selden | 0.037% | 0.024%(+0.013)#93 | 0.052%(-0.015)#2,489 |
| 94. | Oceanside | 0.035% | 0.024%(+0.011)#94 | 0.052%(-0.017)#2,519 |
| 95. | Harrison | 0.035% | 0.024%(+0.011)#95 | 0.052%(-0.017)#2,521 |
| 96. | Commack | 0.034% | 0.024%(+0.010)#96 | 0.052%(-0.018)#2,537 |
| 97. | Mount Vernon | 0.033% | 0.024%(+0.009)#97 | 0.052%(-0.019)#2,547 |
| 98. | Irondequoit | 0.032% | 0.024%(+0.008)#98 | 0.052%(-0.020)#2,571 |
| 99. | Bayville | 0.030% | 0.024%(+0.006)#99 | 0.052%(-0.022)#2,595 |
| 100. | New City | 0.027% | 0.024%(+0.003)#100 | 0.052%(-0.025)#2,650 |
Common Questions
What are the Top 10 Cities with the Highest Percentage of Slovene Population in New York?
Top 10 Cities with the Highest Percentage of Slovene Population in New York are:
#1
5.08%
#2
3.69%
#3
2.13%
#4
1.68%
#5
1.54%
#6
1.50%
#7
1.38%
#8
0.98%
#9
0.79%
#10
0.76%
What city has the Highest Percentage of Slovene Population in New York?
Westfield has the Highest Percentage of Slovene Population in New York with 5.08%.
What is the Percentage of Slovene Population in the State of New York?
Percentage of Slovene Population in New York is 0.024%.
What is the Percentage of Slovene Population in the United States?
Percentage of Slovene Population in the United States is 0.052%.