Holbrook, NY Map & Demographics
Holbrook Map
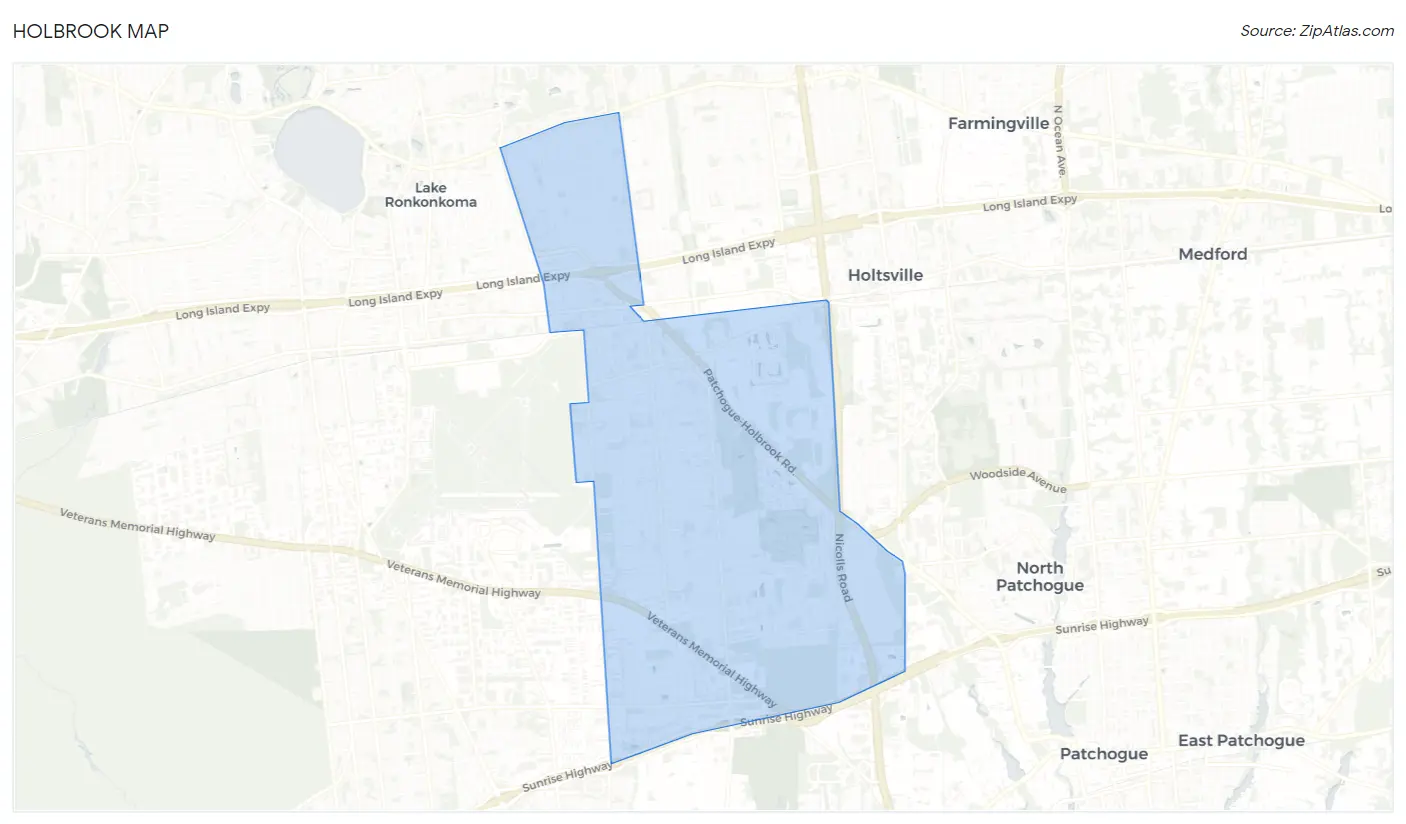
Holbrook Overview
$53,279
PER CAPITA INCOME
$150,143
AVG FAMILY INCOME
$140,563
AVG HOUSEHOLD INCOME
32.3%
WAGE / INCOME GAP [ % ]
67.7¢/ $1
WAGE / INCOME GAP [ $ ]
$12,905
FAMILY INCOME DEFICIT
0.37
INEQUALITY / GINI INDEX
27,220
TOTAL POPULATION
12,741
MALE POPULATION
14,479
FEMALE POPULATION
88.00
MALES / 100 FEMALES
113.64
FEMALES / 100 MALES
40.9
MEDIAN AGE
3.5
AVG FAMILY SIZE
3.0
AVG HOUSEHOLD SIZE
15,184
LABOR FORCE [ PEOPLE ]
68.5%
PERCENT IN LABOR FORCE
4.2%
UNEMPLOYMENT RATE
Holbrook Zip Codes
Holbrook Area Codes
Income in Holbrook
Income Overview in Holbrook
Per Capita Income in Holbrook is $53,279, while median incomes of families and households are $150,143 and $140,563 respectively.
| Characteristic | Number | Measure |
| Per Capita Income | 27,220 | $53,279 |
| Median Family Income | 6,880 | $150,143 |
| Mean Family Income | 6,880 | $167,801 |
| Median Household Income | 9,059 | $140,563 |
| Mean Household Income | 9,059 | $155,137 |
| Income Deficit | 6,880 | $12,905 |
| Wage / Income Gap (%) | 27,220 | 32.31% |
| Wage / Income Gap ($) | 27,220 | 67.69¢ per $1 |
| Gini / Inequality Index | 27,220 | 0.37 |
Earnings by Sex in Holbrook
Average Earnings in Holbrook are $59,858, $74,919 for men and $50,716 for women, a difference of 32.3%.
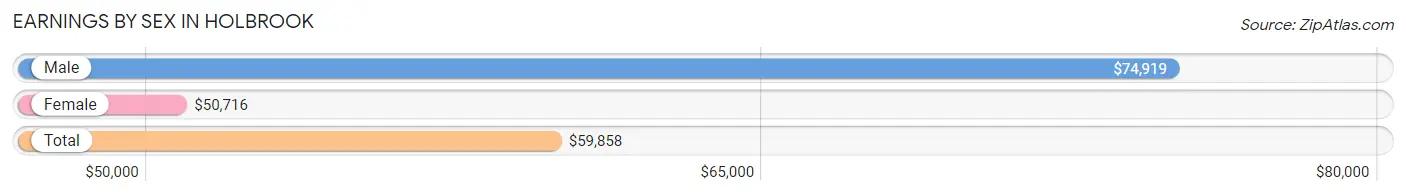
| Sex | Number | Average Earnings |
| Male | 8,090 (51.5%) | $74,919 |
| Female | 7,632 (48.5%) | $50,716 |
| Total | 15,722 (100.0%) | $59,858 |
Earnings by Sex by Income Bracket in Holbrook
The most common earnings brackets in Holbrook are $100,000+ for men (2,889 | 35.7%) and $100,000+ for women (1,207 | 15.8%).
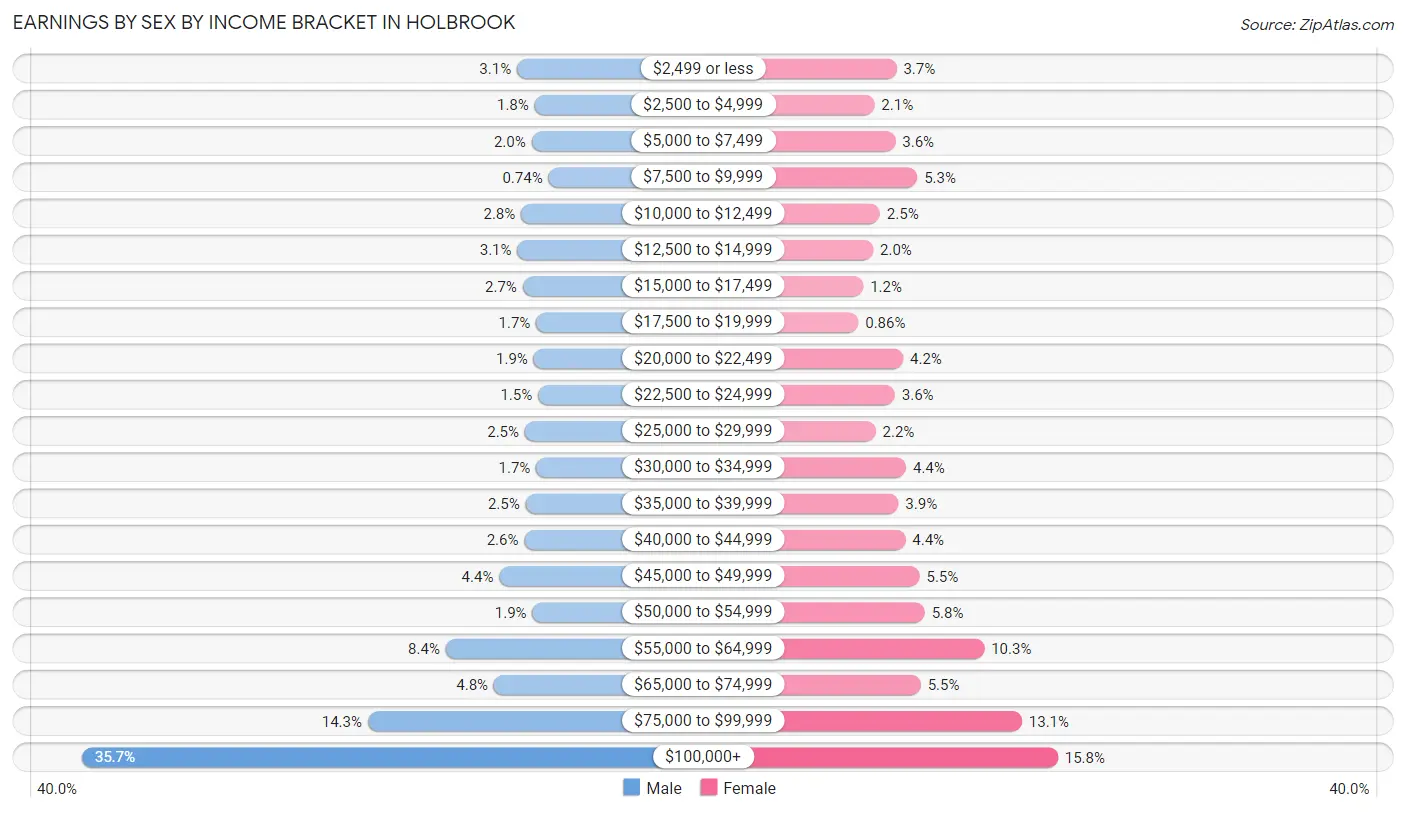
| Income | Male | Female |
| $2,499 or less | 251 (3.1%) | 284 (3.7%) |
| $2,500 to $4,999 | 144 (1.8%) | 158 (2.1%) |
| $5,000 to $7,499 | 163 (2.0%) | 278 (3.6%) |
| $7,500 to $9,999 | 60 (0.7%) | 403 (5.3%) |
| $10,000 to $12,499 | 226 (2.8%) | 189 (2.5%) |
| $12,500 to $14,999 | 248 (3.1%) | 150 (2.0%) |
| $15,000 to $17,499 | 216 (2.7%) | 94 (1.2%) |
| $17,500 to $19,999 | 134 (1.7%) | 66 (0.9%) |
| $20,000 to $22,499 | 150 (1.8%) | 322 (4.2%) |
| $22,500 to $24,999 | 123 (1.5%) | 275 (3.6%) |
| $25,000 to $29,999 | 203 (2.5%) | 165 (2.2%) |
| $30,000 to $34,999 | 134 (1.7%) | 339 (4.4%) |
| $35,000 to $39,999 | 199 (2.5%) | 295 (3.9%) |
| $40,000 to $44,999 | 206 (2.5%) | 335 (4.4%) |
| $45,000 to $49,999 | 358 (4.4%) | 416 (5.4%) |
| $50,000 to $54,999 | 157 (1.9%) | 446 (5.8%) |
| $55,000 to $64,999 | 683 (8.4%) | 786 (10.3%) |
| $65,000 to $74,999 | 391 (4.8%) | 423 (5.5%) |
| $75,000 to $99,999 | 1,155 (14.3%) | 1,001 (13.1%) |
| $100,000+ | 2,889 (35.7%) | 1,207 (15.8%) |
| Total | 8,090 (100.0%) | 7,632 (100.0%) |
Earnings by Sex by Educational Attainment in Holbrook
Average earnings in Holbrook are $91,764 for men and $55,785 for women, a difference of 39.2%. Men with an educational attainment of graduate degree enjoy the highest average annual earnings of $128,088, while those with less than high school education earn the least with $47,656. Women with an educational attainment of graduate degree earn the most with the average annual earnings of $85,257, while those with less than high school education have the smallest earnings of $30,114.
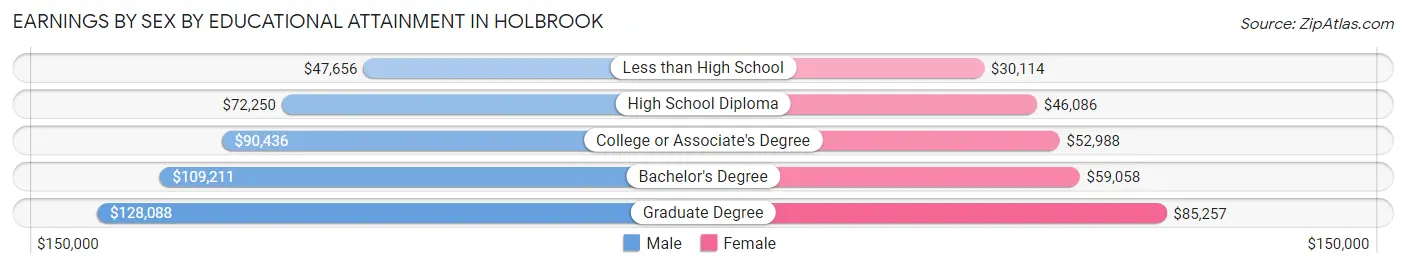
| Educational Attainment | Male Income | Female Income |
| Less than High School | $47,656 | $30,114 |
| High School Diploma | $72,250 | $46,086 |
| College or Associate's Degree | $90,436 | $52,988 |
| Bachelor's Degree | $109,211 | $59,058 |
| Graduate Degree | $128,088 | $85,257 |
| Total | $91,764 | $55,785 |
Family Income in Holbrook
Family Income Brackets in Holbrook
According to the Holbrook family income data, there are 1,913 families falling into the $200,000+ income range, which is the most common income bracket and makes up 27.8% of all families. Conversely, the less than $10,000 income bracket is the least frequent group with only 55 families (0.8%) belonging to this category.
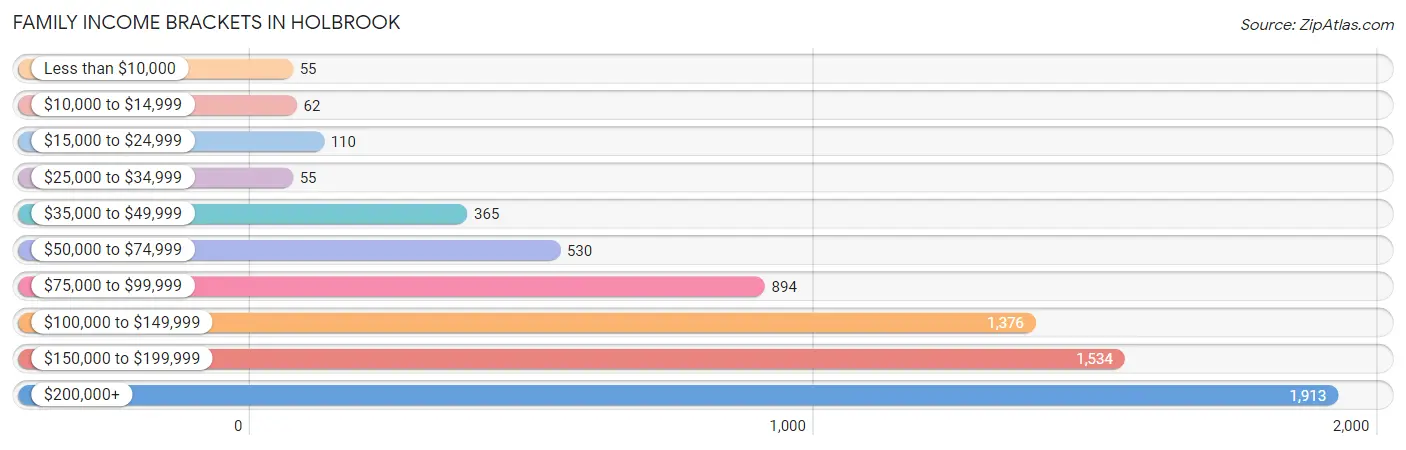
| Income Bracket | # Families | % Families |
| Less than $10,000 | 55 | 0.8% |
| $10,000 to $14,999 | 62 | 0.9% |
| $15,000 to $24,999 | 110 | 1.6% |
| $25,000 to $34,999 | 55 | 0.8% |
| $35,000 to $49,999 | 365 | 5.3% |
| $50,000 to $74,999 | 530 | 7.7% |
| $75,000 to $99,999 | 894 | 13.0% |
| $100,000 to $149,999 | 1,376 | 20.0% |
| $150,000 to $199,999 | 1,534 | 22.3% |
| $200,000+ | 1,913 | 27.8% |
Family Income by Famaliy Size in Holbrook
7+ person families (109 | 1.6%) account for the highest median family income in Holbrook with $202,326 per family, while 2-person families (2,511 | 36.5%) have the highest median income of $54,174 per family member.
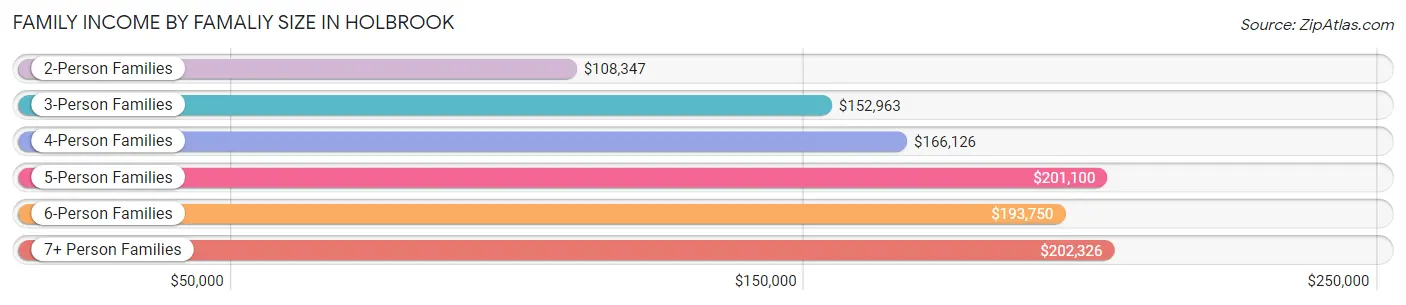
| Income Bracket | # Families | Median Income |
| 2-Person Families | 2,511 (36.5%) | $108,347 |
| 3-Person Families | 1,572 (22.9%) | $152,963 |
| 4-Person Families | 1,614 (23.5%) | $166,126 |
| 5-Person Families | 890 (12.9%) | $201,100 |
| 6-Person Families | 184 (2.7%) | $193,750 |
| 7+ Person Families | 109 (1.6%) | $202,326 |
| Total | 6,880 (100.0%) | $150,143 |
Family Income by Number of Earners in Holbrook
The median family income in Holbrook is $150,143, with families comprising 3+ earners (1,333) having the highest median family income of $215,781, while families with no earners (712) have the lowest median family income of $78,362, accounting for 19.4% and 10.3% of families, respectively.
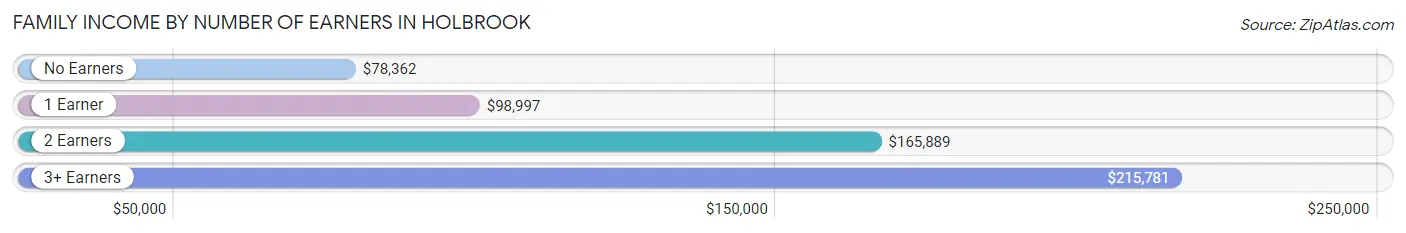
| Number of Earners | # Families | Median Income |
| No Earners | 712 (10.3%) | $78,362 |
| 1 Earner | 1,627 (23.6%) | $98,997 |
| 2 Earners | 3,208 (46.6%) | $165,889 |
| 3+ Earners | 1,333 (19.4%) | $215,781 |
| Total | 6,880 (100.0%) | $150,143 |
Household Income in Holbrook
Household Income Brackets in Holbrook
With 2,292 households falling in the category, the $200,000+ income range is the most frequent in Holbrook, accounting for 25.3% of all households. In contrast, only 118 households (1.3%) fall into the $25,000 to $34,999 income bracket, making it the least populous group.
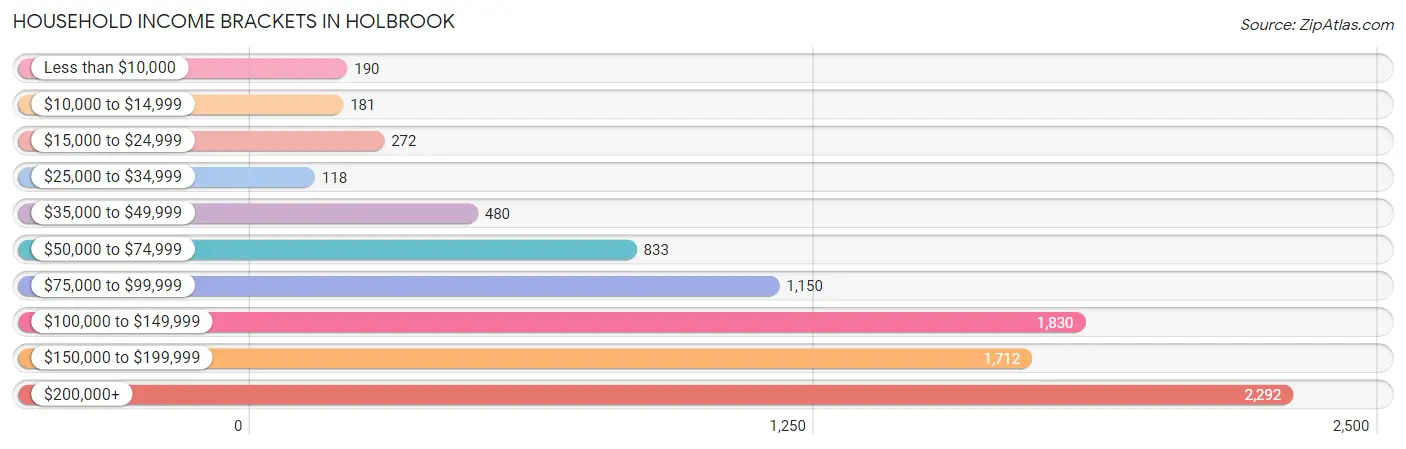
| Income Bracket | # Households | % Households |
| Less than $10,000 | 190 | 2.1% |
| $10,000 to $14,999 | 181 | 2.0% |
| $15,000 to $24,999 | 272 | 3.0% |
| $25,000 to $34,999 | 118 | 1.3% |
| $35,000 to $49,999 | 480 | 5.3% |
| $50,000 to $74,999 | 833 | 9.2% |
| $75,000 to $99,999 | 1,150 | 12.7% |
| $100,000 to $149,999 | 1,830 | 20.2% |
| $150,000 to $199,999 | 1,712 | 18.9% |
| $200,000+ | 2,292 | 25.3% |
Household Income by Householder Age in Holbrook
The median household income in Holbrook is $140,563, with the highest median household income of $154,545 found in the 45 to 64 years age bracket for the primary householder. A total of 4,160 households (45.9%) fall into this category. Meanwhile, the 15 to 24 years age bracket for the primary householder has the lowest median household income of $2,499, with 110 households (1.2%) in this group.
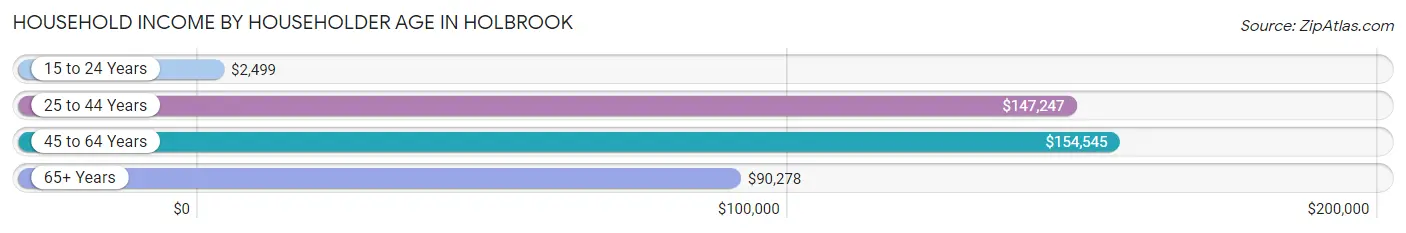
| Income Bracket | # Households | Median Income |
| 15 to 24 Years | 110 (1.2%) | $2,499 |
| 25 to 44 Years | 2,433 (26.9%) | $147,247 |
| 45 to 64 Years | 4,160 (45.9%) | $154,545 |
| 65+ Years | 2,356 (26.0%) | $90,278 |
| Total | 9,059 (100.0%) | $140,563 |
Poverty in Holbrook
Income Below Poverty by Sex and Age in Holbrook
With 4.7% poverty level for males and 4.9% for females among the residents of Holbrook, 5 year old males and 5 year old females are the most vulnerable to poverty, with 24 males (18.2%) and 42 females (31.8%) in their respective age groups living below the poverty level.
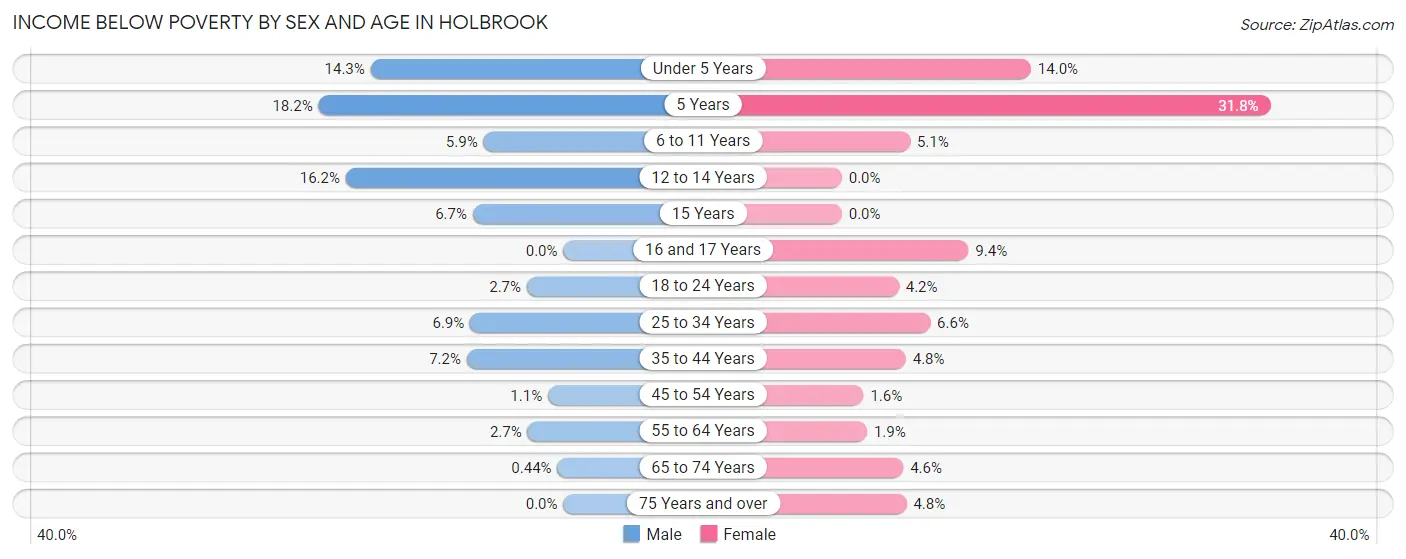
| Age Bracket | Male | Female |
| Under 5 Years | 84 (14.3%) | 123 (14.0%) |
| 5 Years | 24 (18.2%) | 42 (31.8%) |
| 6 to 11 Years | 49 (5.9%) | 53 (5.1%) |
| 12 to 14 Years | 94 (16.2%) | 0 (0.0%) |
| 15 Years | 8 (6.7%) | 0 (0.0%) |
| 16 and 17 Years | 0 (0.0%) | 53 (9.4%) |
| 18 to 24 Years | 38 (2.7%) | 38 (4.2%) |
| 25 to 34 Years | 99 (6.9%) | 127 (6.6%) |
| 35 to 44 Years | 121 (7.2%) | 90 (4.8%) |
| 45 to 54 Years | 23 (1.1%) | 29 (1.6%) |
| 55 to 64 Years | 53 (2.7%) | 37 (1.9%) |
| 65 to 74 Years | 4 (0.4%) | 75 (4.6%) |
| 75 Years and over | 0 (0.0%) | 46 (4.8%) |
| Total | 597 (4.7%) | 713 (4.9%) |
Income Above Poverty by Sex and Age in Holbrook
According to the poverty statistics in Holbrook, males aged 16 and 17 years and females aged 12 to 14 years are the age groups that are most secure financially, with 100.0% of males and 100.0% of females in these age groups living above the poverty line.
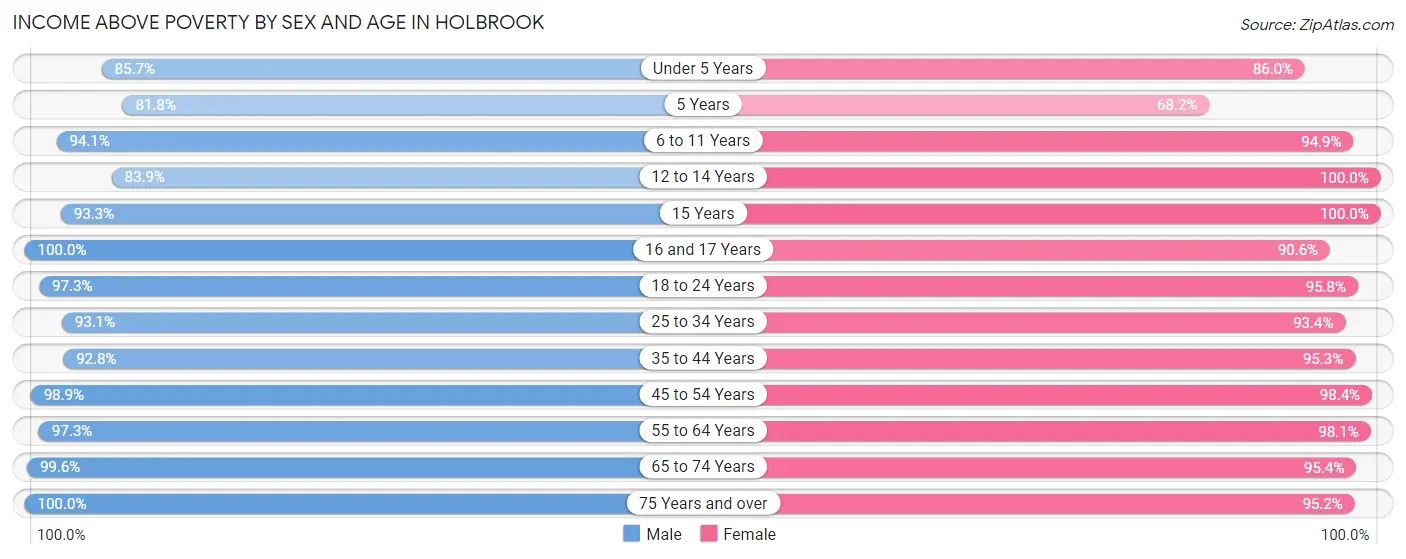
| Age Bracket | Male | Female |
| Under 5 Years | 503 (85.7%) | 753 (86.0%) |
| 5 Years | 108 (81.8%) | 90 (68.2%) |
| 6 to 11 Years | 777 (94.1%) | 995 (94.9%) |
| 12 to 14 Years | 488 (83.9%) | 608 (100.0%) |
| 15 Years | 111 (93.3%) | 113 (100.0%) |
| 16 and 17 Years | 318 (100.0%) | 511 (90.6%) |
| 18 to 24 Years | 1,363 (97.3%) | 861 (95.8%) |
| 25 to 34 Years | 1,332 (93.1%) | 1,809 (93.4%) |
| 35 to 44 Years | 1,567 (92.8%) | 1,804 (95.3%) |
| 45 to 54 Years | 2,000 (98.9%) | 1,768 (98.4%) |
| 55 to 64 Years | 1,941 (97.3%) | 1,945 (98.1%) |
| 65 to 74 Years | 906 (99.6%) | 1,570 (95.4%) |
| 75 Years and over | 714 (100.0%) | 913 (95.2%) |
| Total | 12,128 (95.3%) | 13,740 (95.1%) |
Income Below Poverty Among Married-Couple Families in Holbrook
The poverty statistics for married-couple families in Holbrook show that 1.8% or 97 of the total 5,422 families live below the poverty line. Families with 3 or 4 children have the highest poverty rate of 7.1%, comprising of 32 families. On the other hand, families with no children have the lowest poverty rate of 0.7%, which includes 22 families.
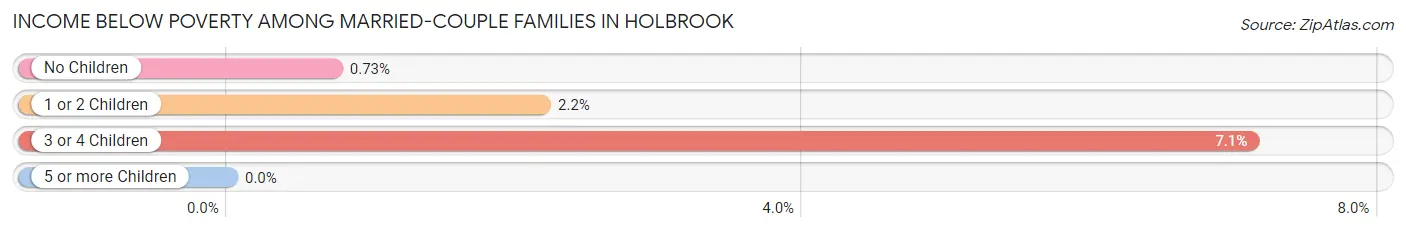
| Children | Above Poverty | Below Poverty |
| No Children | 2,976 (99.3%) | 22 (0.7%) |
| 1 or 2 Children | 1,931 (97.8%) | 43 (2.2%) |
| 3 or 4 Children | 418 (92.9%) | 32 (7.1%) |
| 5 or more Children | 0 (0.0%) | 0 (0.0%) |
| Total | 5,325 (98.2%) | 97 (1.8%) |
Income Below Poverty Among Single-Parent Households in Holbrook
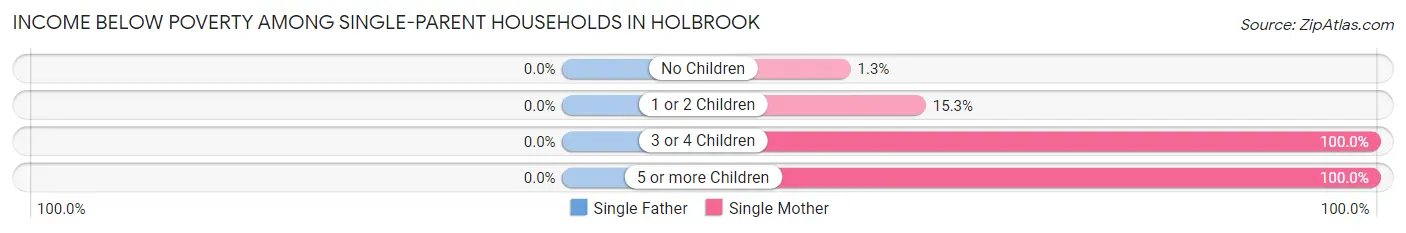
| Children | Single Father | Single Mother |
| No Children | 0 (0.0%) | 9 (1.3%) |
| 1 or 2 Children | 0 (0.0%) | 60 (15.3%) |
| 3 or 4 Children | 0 (0.0%) | 34 (100.0%) |
| 5 or more Children | 0 (0.0%) | 18 (100.0%) |
| Total | 0 (0.0%) | 121 (10.6%) |
Income Below Poverty Among Married-Couple vs Single-Parent Households in Holbrook
The poverty data for Holbrook shows that 97 of the married-couple family households (1.8%) and 121 of the single-parent households (8.3%) are living below the poverty level. Within the married-couple family households, those with 3 or 4 children have the highest poverty rate, with 32 households (7.1%) falling below the poverty line. Among the single-parent households, those with 3 or 4 children have the highest poverty rate, with 34 household (100.0%) living below poverty.
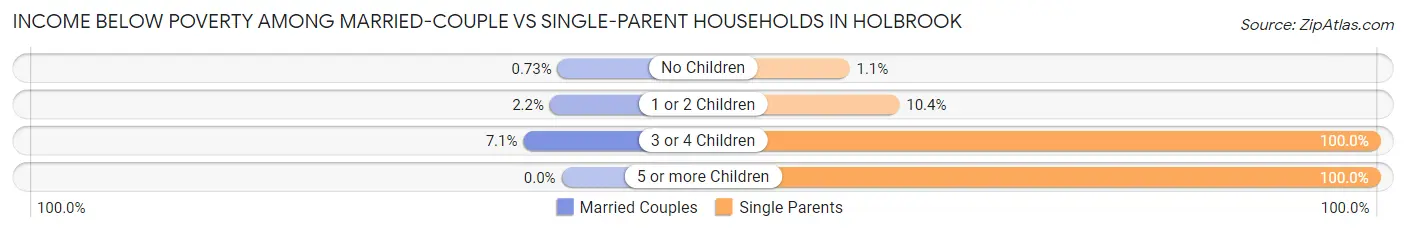
| Children | Married-Couple Families | Single-Parent Households |
| No Children | 22 (0.7%) | 9 (1.1%) |
| 1 or 2 Children | 43 (2.2%) | 60 (10.4%) |
| 3 or 4 Children | 32 (7.1%) | 34 (100.0%) |
| 5 or more Children | 0 (0.0%) | 18 (100.0%) |
| Total | 97 (1.8%) | 121 (8.3%) |
Race in Holbrook
The most populous races in Holbrook are White / Caucasian (23,601 | 86.7%), Hispanic or Latino (4,015 | 14.7%), and Asian (1,175 | 4.3%).
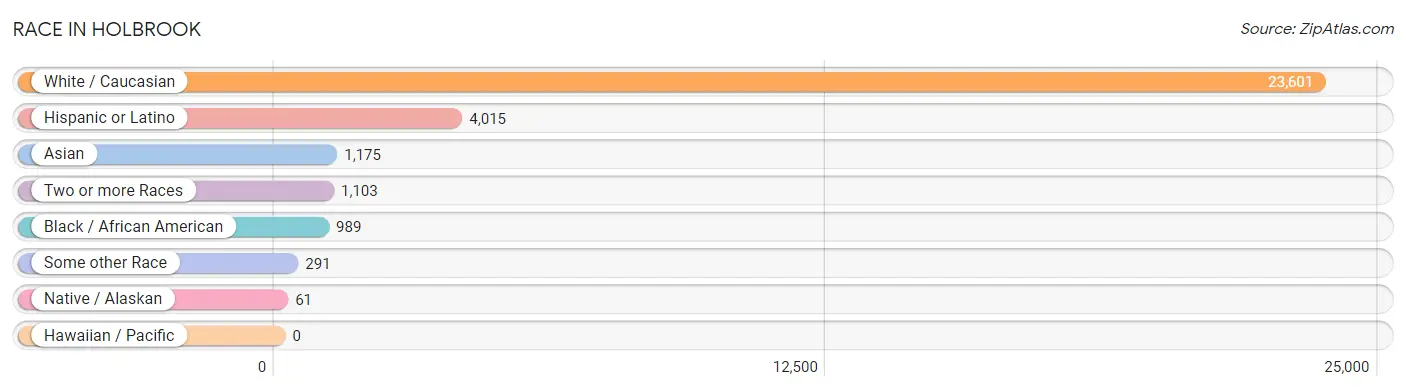
| Race | # Population | % Population |
| Asian | 1,175 | 4.3% |
| Black / African American | 989 | 3.6% |
| Hawaiian / Pacific | 0 | 0.0% |
| Hispanic or Latino | 4,015 | 14.7% |
| Native / Alaskan | 61 | 0.2% |
| White / Caucasian | 23,601 | 86.7% |
| Two or more Races | 1,103 | 4.1% |
| Some other Race | 291 | 1.1% |
| Total | 27,220 | 100.0% |
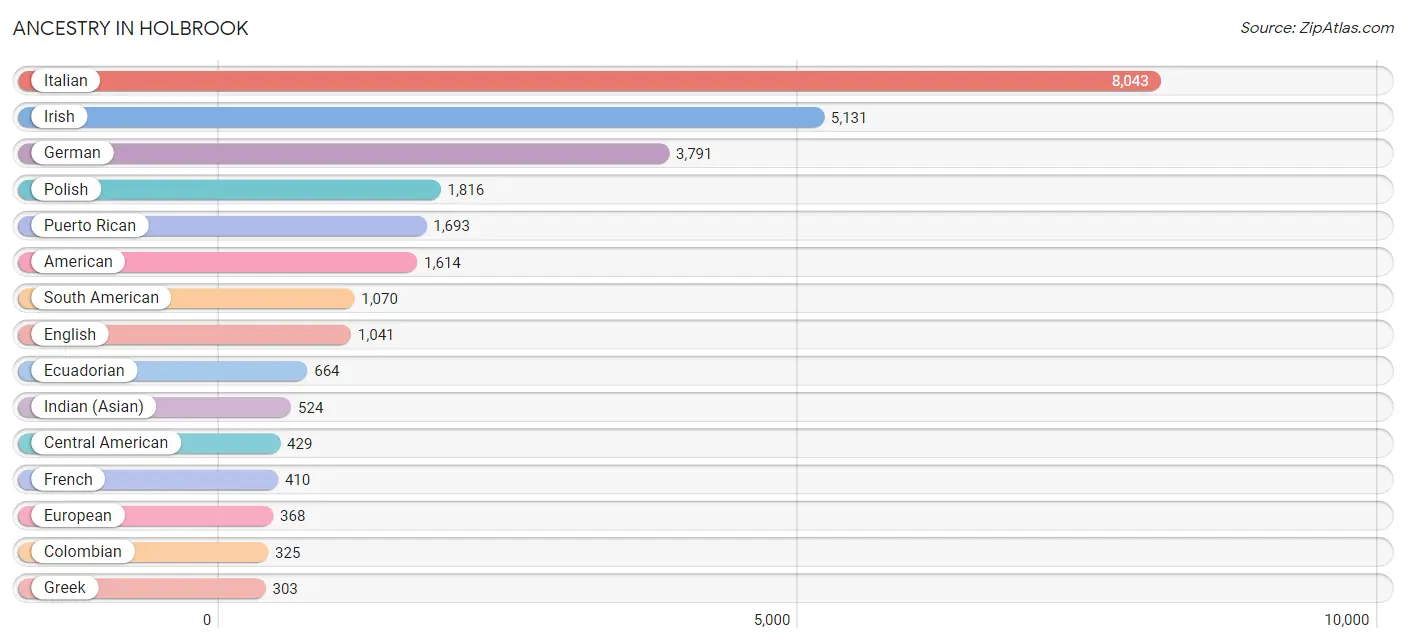
Ancestry in Holbrook
The most populous ancestries reported in Holbrook are Italian (8,043 | 29.5%), Irish (5,131 | 18.9%), German (3,791 | 13.9%), Polish (1,816 | 6.7%), and Puerto Rican (1,693 | 6.2%), together accounting for 75.2% of all Holbrook residents.
| Ancestry | # Population | % Population |
| Afghan | 51 | 0.2% |
| American | 1,614 | 5.9% |
| Arab | 60 | 0.2% |
| Argentinean | 34 | 0.1% |
| Armenian | 9 | 0.0% |
| Austrian | 56 | 0.2% |
| Barbadian | 34 | 0.1% |
| Bhutanese | 10 | 0.0% |
| Blackfeet | 3 | 0.0% |
| Bolivian | 47 | 0.2% |
| British | 56 | 0.2% |
| Burmese | 158 | 0.6% |
| Canadian | 21 | 0.1% |
| Central American | 429 | 1.6% |
| Cherokee | 25 | 0.1% |
| Choctaw | 2 | 0.0% |
| Colombian | 325 | 1.2% |
| Costa Rican | 49 | 0.2% |
| Croatian | 150 | 0.5% |
| Cuban | 15 | 0.1% |
| Czech | 72 | 0.3% |
| Danish | 84 | 0.3% |
| Dominican | 246 | 0.9% |
| Dutch | 148 | 0.5% |
| Eastern European | 128 | 0.5% |
| Ecuadorian | 664 | 2.4% |
| Egyptian | 9 | 0.0% |
| English | 1,041 | 3.8% |
| European | 368 | 1.3% |
| Finnish | 11 | 0.0% |
| French | 410 | 1.5% |
| French American Indian | 22 | 0.1% |
| French Canadian | 92 | 0.3% |
| German | 3,791 | 13.9% |
| Greek | 303 | 1.1% |
| Guatemalan | 38 | 0.1% |
| Haitian | 22 | 0.1% |
| Honduran | 48 | 0.2% |
| Hungarian | 157 | 0.6% |
| Indian (Asian) | 524 | 1.9% |
| Iraqi | 14 | 0.1% |
| Irish | 5,131 | 18.9% |
| Italian | 8,043 | 29.5% |
| Jamaican | 268 | 1.0% |
| Korean | 217 | 0.8% |
| Lebanese | 18 | 0.1% |
| Maltese | 9 | 0.0% |
| Mexican | 258 | 0.9% |
| Norwegian | 241 | 0.9% |
| Osage | 2 | 0.0% |
| Panamanian | 41 | 0.2% |
| Polish | 1,816 | 6.7% |
| Portuguese | 37 | 0.1% |
| Puerto Rican | 1,693 | 6.2% |
| Romanian | 61 | 0.2% |
| Russian | 300 | 1.1% |
| Salvadoran | 253 | 0.9% |
| Scandinavian | 1 | 0.0% |
| Scotch-Irish | 48 | 0.2% |
| Scottish | 192 | 0.7% |
| Seminole | 3 | 0.0% |
| Serbian | 10 | 0.0% |
| South American | 1,070 | 3.9% |
| South American Indian | 39 | 0.1% |
| Spaniard | 264 | 1.0% |
| Spanish | 8 | 0.0% |
| Sri Lankan | 1 | 0.0% |
| Swedish | 135 | 0.5% |
| Syrian | 9 | 0.0% |
| Thai | 259 | 0.9% |
| Trinidadian and Tobagonian | 15 | 0.1% |
| Turkish | 89 | 0.3% |
| Ukrainian | 64 | 0.2% |
| Welsh | 34 | 0.1% |
| West Indian | 42 | 0.2% | View All 75 Rows |
Immigrants in Holbrook
The most numerous immigrant groups reported in Holbrook came from Asia (1,044 | 3.8%), Latin America (961 | 3.5%), South Eastern Asia (437 | 1.6%), Europe (419 | 1.5%), and Philippines (419 | 1.5%), together accounting for 12.1% of all Holbrook residents.
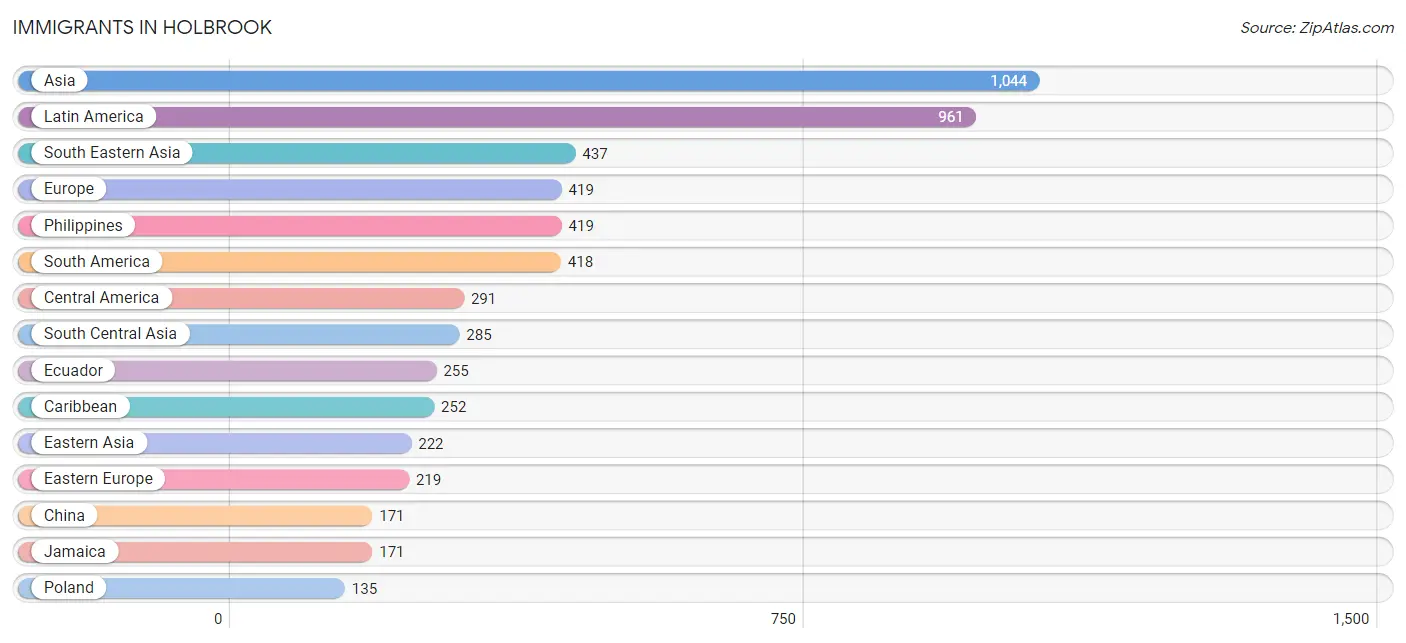
| Immigration Origin | # Population | % Population |
| Afghanistan | 32 | 0.1% |
| Africa | 24 | 0.1% |
| Argentina | 34 | 0.1% |
| Asia | 1,044 | 3.8% |
| Austria | 8 | 0.0% |
| Bangladesh | 36 | 0.1% |
| Barbados | 24 | 0.1% |
| Bolivia | 27 | 0.1% |
| Cambodia | 17 | 0.1% |
| Canada | 29 | 0.1% |
| Caribbean | 252 | 0.9% |
| Central America | 291 | 1.1% |
| China | 171 | 0.6% |
| Colombia | 97 | 0.4% |
| Croatia | 40 | 0.2% |
| Czechoslovakia | 8 | 0.0% |
| Dominican Republic | 46 | 0.2% |
| Eastern Africa | 20 | 0.1% |
| Eastern Asia | 222 | 0.8% |
| Eastern Europe | 219 | 0.8% |
| Ecuador | 255 | 0.9% |
| El Salvador | 118 | 0.4% |
| Europe | 419 | 1.5% |
| Germany | 23 | 0.1% |
| Greece | 7 | 0.0% |
| Guatemala | 16 | 0.1% |
| Guyana | 5 | 0.0% |
| Honduras | 40 | 0.2% |
| Hong Kong | 40 | 0.2% |
| India | 112 | 0.4% |
| Ireland | 37 | 0.1% |
| Italy | 46 | 0.2% |
| Jamaica | 171 | 0.6% |
| Korea | 51 | 0.2% |
| Latin America | 961 | 3.5% |
| Lebanon | 29 | 0.1% |
| Mexico | 76 | 0.3% |
| Netherlands | 5 | 0.0% |
| Northern Europe | 90 | 0.3% |
| Pakistan | 105 | 0.4% |
| Panama | 41 | 0.2% |
| Philippines | 419 | 1.5% |
| Poland | 135 | 0.5% |
| Portugal | 21 | 0.1% |
| Romania | 24 | 0.1% |
| Serbia | 10 | 0.0% |
| South America | 418 | 1.5% |
| South Central Asia | 285 | 1.1% |
| South Eastern Asia | 437 | 1.6% |
| Southern Europe | 74 | 0.3% |
| Trinidad and Tobago | 11 | 0.0% |
| Turkey | 71 | 0.3% |
| Ukraine | 2 | 0.0% |
| Vietnam | 1 | 0.0% |
| Western Asia | 100 | 0.4% |
| Western Europe | 36 | 0.1% | View All 56 Rows |
Sex and Age in Holbrook
Sex and Age in Holbrook
The most populous age groups in Holbrook are 20 to 24 Years (1,101 | 8.6%) for men and 40 to 44 Years (1,211 | 8.4%) for women.
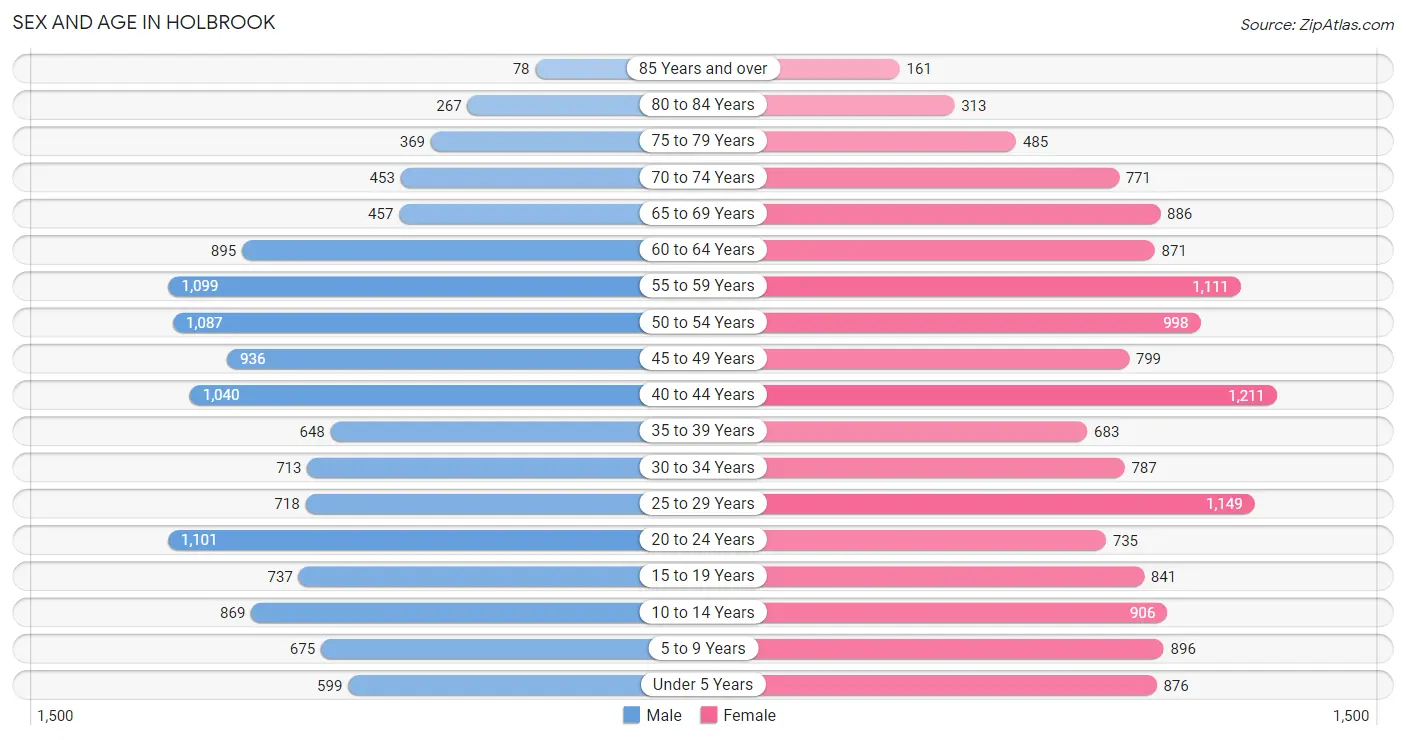
| Age Bracket | Male | Female |
| Under 5 Years | 599 (4.7%) | 876 (6.0%) |
| 5 to 9 Years | 675 (5.3%) | 896 (6.2%) |
| 10 to 14 Years | 869 (6.8%) | 906 (6.3%) |
| 15 to 19 Years | 737 (5.8%) | 841 (5.8%) |
| 20 to 24 Years | 1,101 (8.6%) | 735 (5.1%) |
| 25 to 29 Years | 718 (5.6%) | 1,149 (7.9%) |
| 30 to 34 Years | 713 (5.6%) | 787 (5.4%) |
| 35 to 39 Years | 648 (5.1%) | 683 (4.7%) |
| 40 to 44 Years | 1,040 (8.2%) | 1,211 (8.4%) |
| 45 to 49 Years | 936 (7.3%) | 799 (5.5%) |
| 50 to 54 Years | 1,087 (8.5%) | 998 (6.9%) |
| 55 to 59 Years | 1,099 (8.6%) | 1,111 (7.7%) |
| 60 to 64 Years | 895 (7.0%) | 871 (6.0%) |
| 65 to 69 Years | 457 (3.6%) | 886 (6.1%) |
| 70 to 74 Years | 453 (3.6%) | 771 (5.3%) |
| 75 to 79 Years | 369 (2.9%) | 485 (3.4%) |
| 80 to 84 Years | 267 (2.1%) | 313 (2.2%) |
| 85 Years and over | 78 (0.6%) | 161 (1.1%) |
| Total | 12,741 (100.0%) | 14,479 (100.0%) |
Families and Households in Holbrook
Median Family Size in Holbrook
The median family size in Holbrook is 3.48 persons per family, with single male/father families (315 | 4.6%) accounting for the largest median family size of 4.07 persons per family. On the other hand, single female/mother families (1,143 | 16.6%) represent the smallest median family size with 3.17 persons per family.
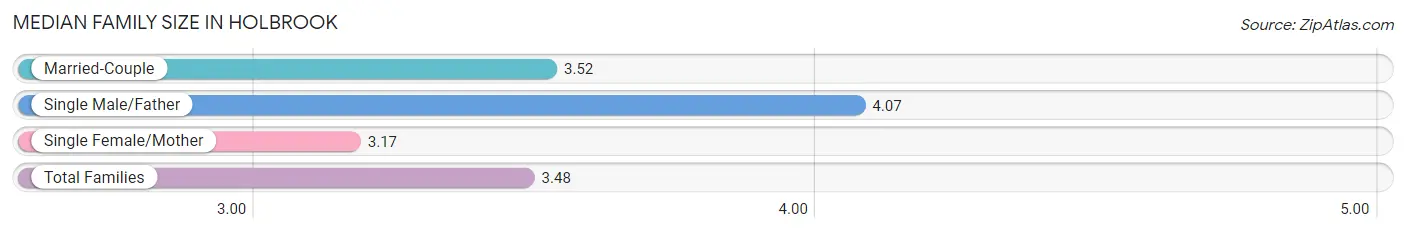
| Family Type | # Families | Family Size |
| Married-Couple | 5,422 (78.8%) | 3.52 |
| Single Male/Father | 315 (4.6%) | 4.07 |
| Single Female/Mother | 1,143 (16.6%) | 3.17 |
| Total Families | 6,880 (100.0%) | 3.48 |
Median Household Size in Holbrook
The median household size in Holbrook is 2.99 persons per household, with single male/father households (315 | 3.5%) accounting for the largest median household size of 4.45 persons per household. non-family households (2,179 | 24.0%) represent the smallest median household size with 1.25 persons per household.
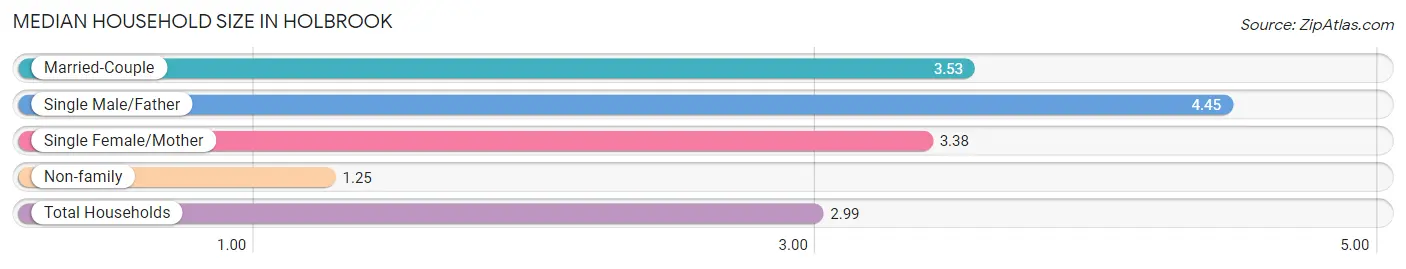
| Household Type | # Households | Household Size |
| Married-Couple | 5,422 (59.9%) | 3.53 |
| Single Male/Father | 315 (3.5%) | 4.45 |
| Single Female/Mother | 1,143 (12.6%) | 3.38 |
| Non-family | 2,179 (24.0%) | 1.25 |
| Total Households | 9,059 (100.0%) | 2.99 |
Household Size by Marriage Status in Holbrook
Out of a total of 9,059 households in Holbrook, 6,880 (75.9%) are family households, while 2,179 (24.0%) are nonfamily households. The most numerous type of family households are 2-person households, comprising 2,385, and the most common type of nonfamily households are 1-person households, comprising 1,725.
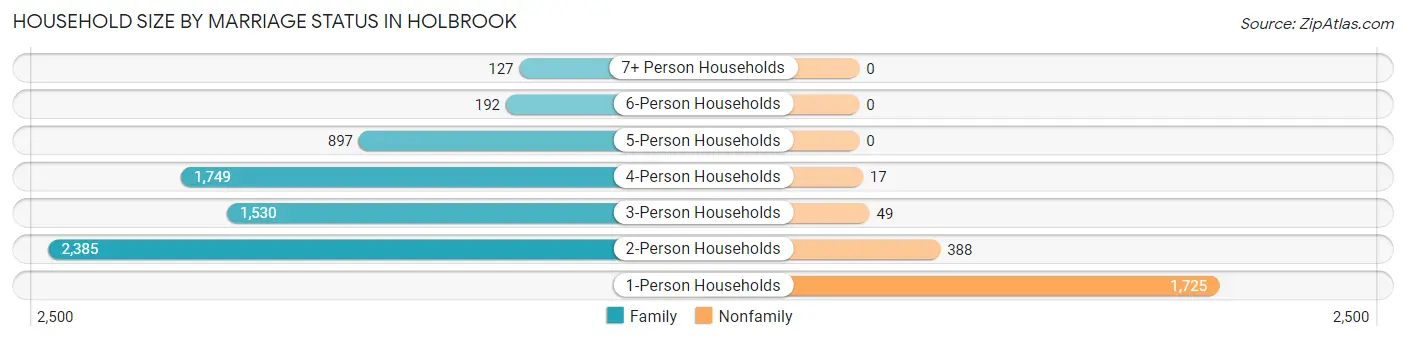
| Household Size | Family Households | Nonfamily Households |
| 1-Person Households | - | 1,725 (19.0%) |
| 2-Person Households | 2,385 (26.3%) | 388 (4.3%) |
| 3-Person Households | 1,530 (16.9%) | 49 (0.5%) |
| 4-Person Households | 1,749 (19.3%) | 17 (0.2%) |
| 5-Person Households | 897 (9.9%) | 0 (0.0%) |
| 6-Person Households | 192 (2.1%) | 0 (0.0%) |
| 7+ Person Households | 127 (1.4%) | 0 (0.0%) |
| Total | 6,880 (75.9%) | 2,179 (24.0%) |
Female Fertility in Holbrook
Fertility by Age in Holbrook
Average fertility rate in Holbrook is 34.0 births per 1,000 women. Women in the age bracket of 20 to 34 years have the highest fertility rate with 55.0 births per 1,000 women. Women in the age bracket of 20 to 34 years acount for 67.9% of all women with births.
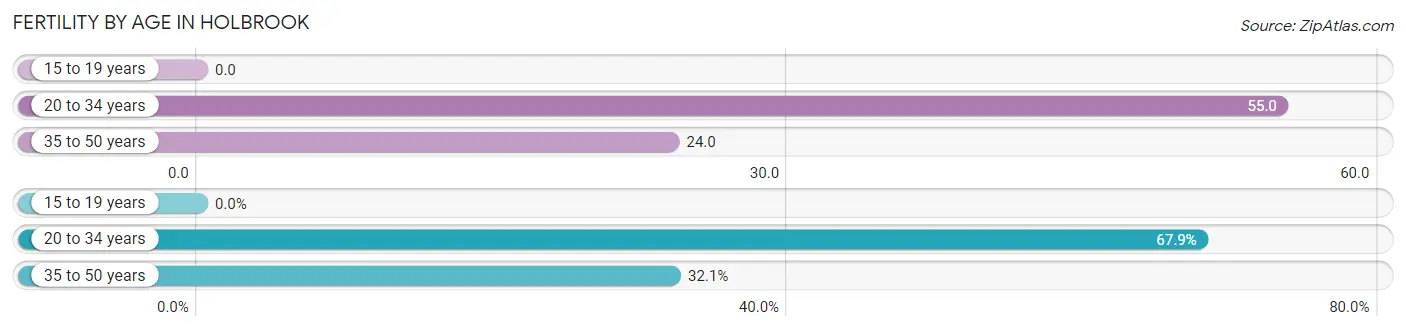
| Age Bracket | Women with Births | Births / 1,000 Women |
| 15 to 19 years | 0 (0.0%) | 0.0 |
| 20 to 34 years | 148 (67.9%) | 55.0 |
| 35 to 50 years | 70 (32.1%) | 24.0 |
| Total | 218 (100.0%) | 34.0 |
Fertility by Age by Marriage Status in Holbrook
72.9% of women with births (218) in Holbrook are married. The highest percentage of unmarried women with births falls into 20 to 34 years age bracket with 31.1% of them unmarried at the time of birth, while the lowest percentage of unmarried women with births belong to 35 to 50 years age bracket with 18.6% of them unmarried.
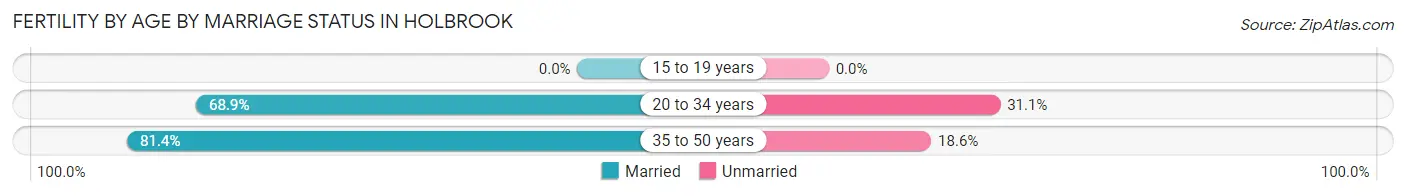
| Age Bracket | Married | Unmarried |
| 15 to 19 years | 0 (0.0%) | 0 (0.0%) |
| 20 to 34 years | 102 (68.9%) | 46 (31.1%) |
| 35 to 50 years | 57 (81.4%) | 13 (18.6%) |
| Total | 159 (72.9%) | 59 (27.1%) |
Fertility by Education in Holbrook
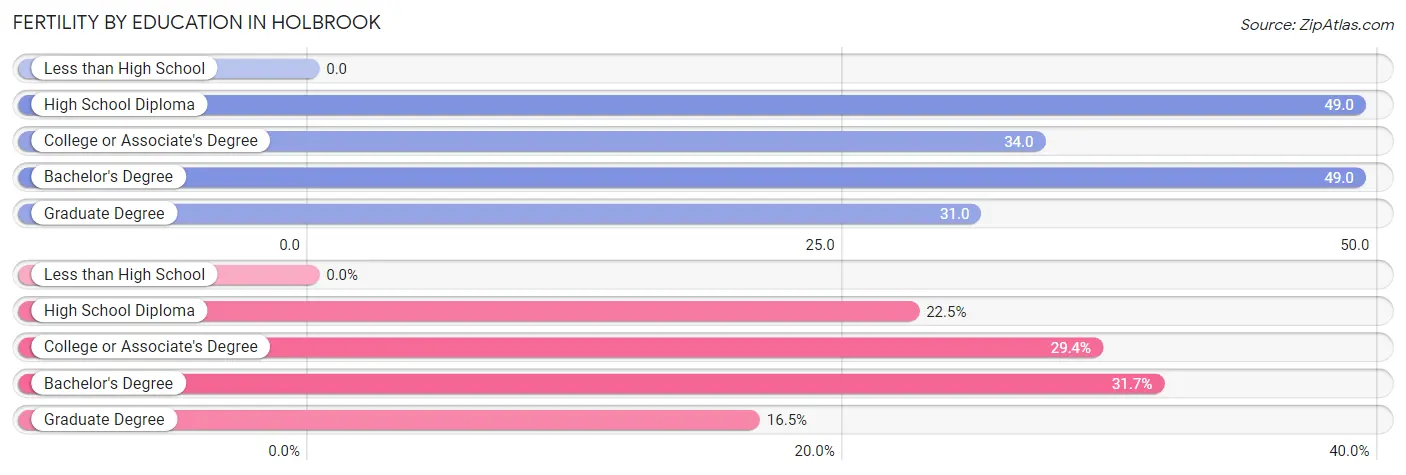
| Educational Attainment | Women with Births | Births / 1,000 Women |
| Less than High School | 0 (0.0%) | 0.0 |
| High School Diploma | 49 (22.5%) | 49.0 |
| College or Associate's Degree | 64 (29.4%) | 34.0 |
| Bachelor's Degree | 69 (31.7%) | 49.0 |
| Graduate Degree | 36 (16.5%) | 31.0 |
| Total | 218 (100.0%) | 34.0 |
Fertility by Education by Marriage Status in Holbrook
27.1% of women with births in Holbrook are unmarried. Women with the educational attainment of bachelor's degree are most likely to be married with 100.0% of them married at childbirth, while women with the educational attainment of high school diploma are least likely to be married with 71.4% of them unmarried at childbirth.
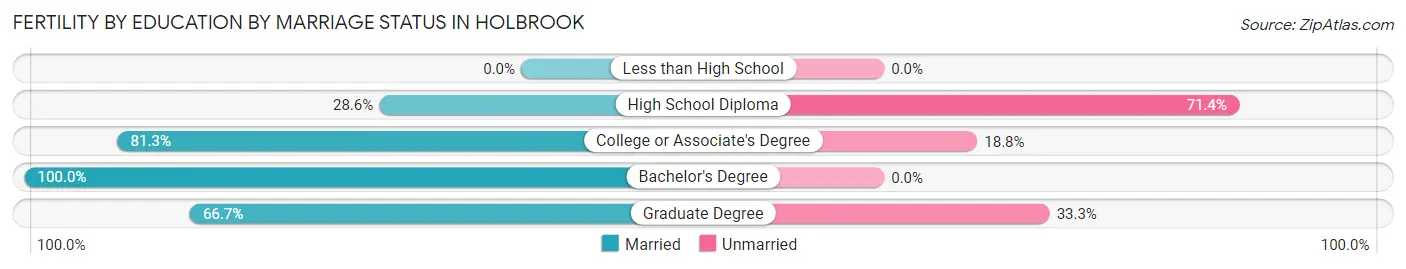
| Educational Attainment | Married | Unmarried |
| Less than High School | 0 (0.0%) | 0 (0.0%) |
| High School Diploma | 14 (28.6%) | 35 (71.4%) |
| College or Associate's Degree | 52 (81.2%) | 12 (18.8%) |
| Bachelor's Degree | 69 (100.0%) | 0 (0.0%) |
| Graduate Degree | 24 (66.7%) | 12 (33.3%) |
| Total | 159 (72.9%) | 59 (27.1%) |
Employment Characteristics in Holbrook
Employment by Class of Employer in Holbrook
Among the 14,379 employed individuals in Holbrook, private company employees (9,528 | 66.3%), local government employees (1,470 | 10.2%), and state government employees (1,034 | 7.2%) make up the most common classes of employment.
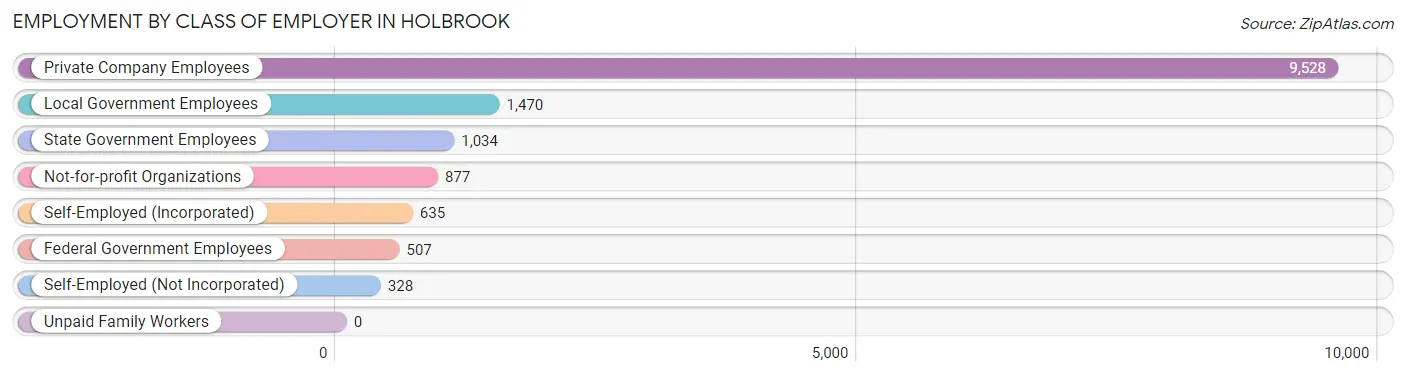
| Employer Class | # Employees | % Employees |
| Private Company Employees | 9,528 | 66.3% |
| Self-Employed (Incorporated) | 635 | 4.4% |
| Self-Employed (Not Incorporated) | 328 | 2.3% |
| Not-for-profit Organizations | 877 | 6.1% |
| Local Government Employees | 1,470 | 10.2% |
| State Government Employees | 1,034 | 7.2% |
| Federal Government Employees | 507 | 3.5% |
| Unpaid Family Workers | 0 | 0.0% |
| Total | 14,379 | 100.0% |
Employment Status by Age in Holbrook
According to the labor force statistics for Holbrook, out of the total population over 16 years of age (22,167), 68.5% or 15,184 individuals are in the labor force, with 4.2% or 638 of them unemployed. The age group with the highest labor force participation rate is 45 to 54 years, with 91.2% or 3,484 individuals in the labor force. Within the labor force, the 16 to 19 years age range has the highest percentage of unemployed individuals, with 15.5% or 81 of them being unemployed.
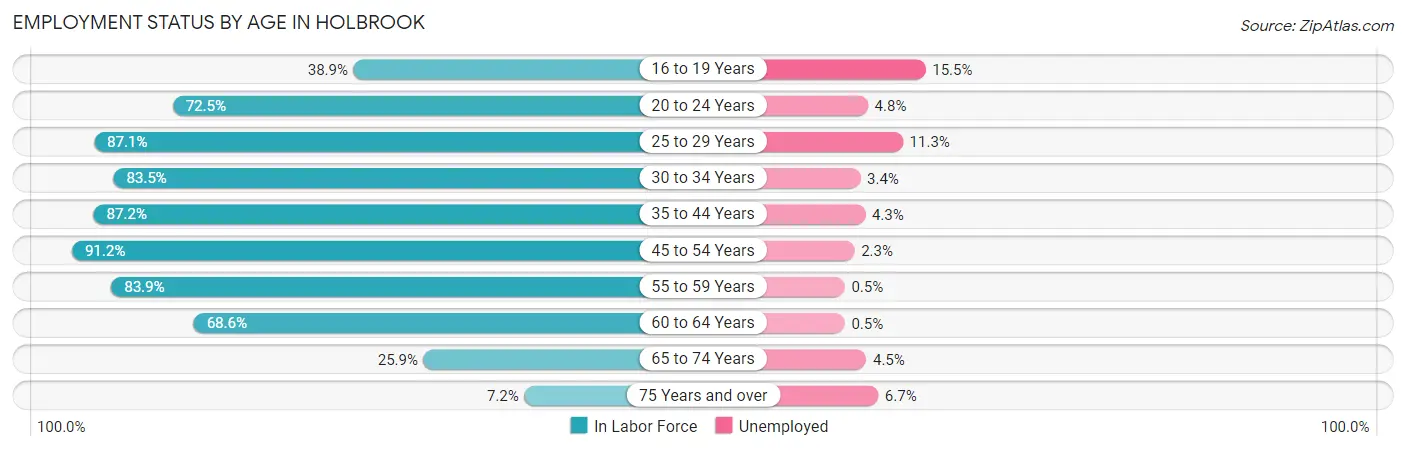
| Age Bracket | In Labor Force | Unemployed |
| 16 to 19 Years | 524 (38.9%) | 81 (15.5%) |
| 20 to 24 Years | 1,331 (72.5%) | 64 (4.8%) |
| 25 to 29 Years | 1,626 (87.1%) | 184 (11.3%) |
| 30 to 34 Years | 1,252 (83.5%) | 43 (3.4%) |
| 35 to 44 Years | 3,124 (87.2%) | 134 (4.3%) |
| 45 to 54 Years | 3,484 (91.2%) | 80 (2.3%) |
| 55 to 59 Years | 1,854 (83.9%) | 9 (0.5%) |
| 60 to 64 Years | 1,211 (68.6%) | 6 (0.5%) |
| 65 to 74 Years | 665 (25.9%) | 30 (4.5%) |
| 75 Years and over | 120 (7.2%) | 8 (6.7%) |
| Total | 15,184 (68.5%) | 638 (4.2%) |
Employment Status by Educational Attainment in Holbrook
According to labor force statistics for Holbrook, 85.1% of individuals (12,548) out of the total population between 25 and 64 years of age (14,745) are in the labor force, with 3.6% or 452 of them being unemployed. The group with the highest labor force participation rate are those with the educational attainment of bachelor's degree or higher, with 90.4% or 5,174 individuals in the labor force. Within the labor force, individuals with less than high school education have the highest percentage of unemployment, with 15.4% or 87 of them being unemployed.
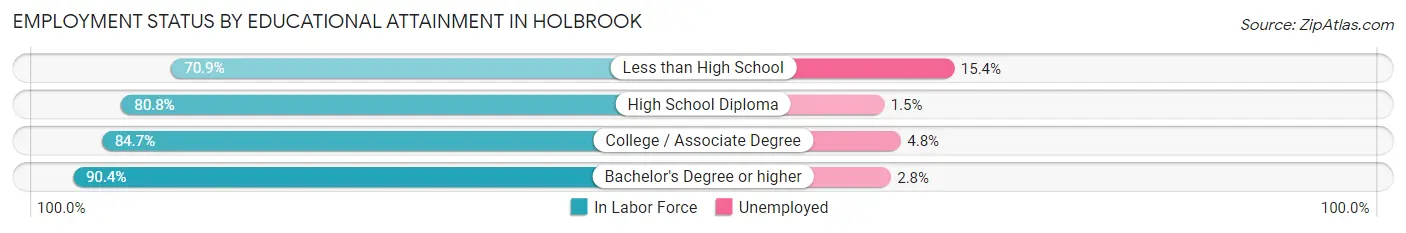
| Educational Attainment | In Labor Force | Unemployed |
| Less than High School | 564 (70.9%) | 123 (15.4%) |
| High School Diploma | 2,990 (80.8%) | 56 (1.5%) |
| College / Associate Degree | 3,832 (84.7%) | 217 (4.8%) |
| Bachelor's Degree or higher | 5,174 (90.4%) | 160 (2.8%) |
| Total | 12,548 (85.1%) | 531 (3.6%) |
Employment Occupations by Sex in Holbrook
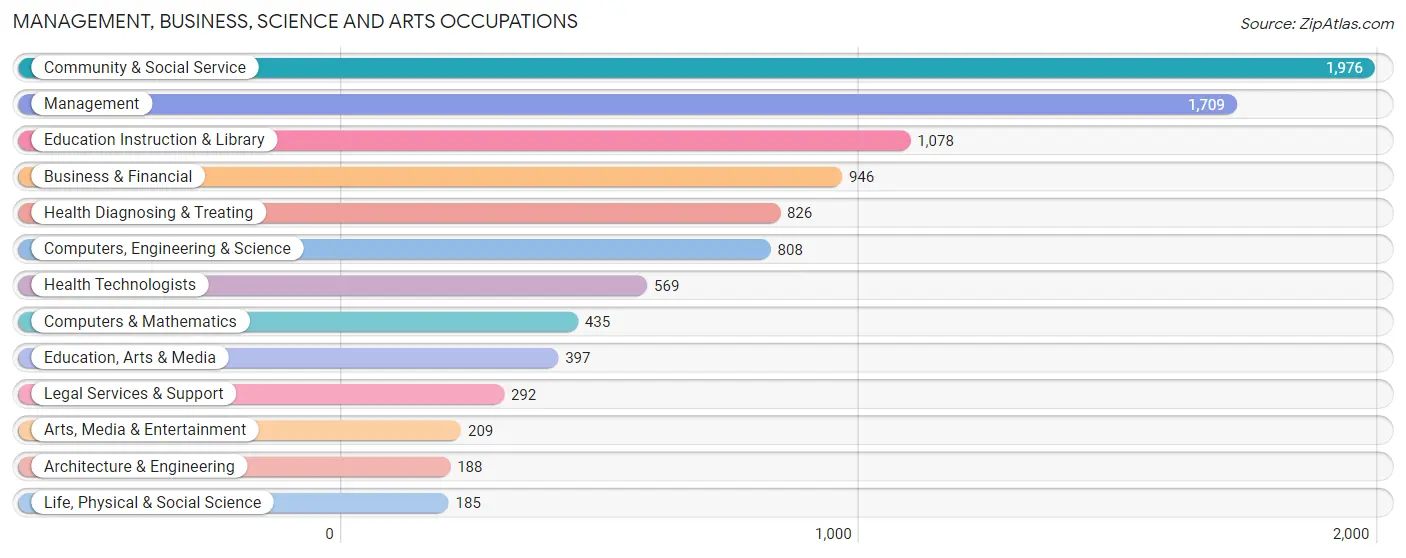
Management, Business, Science and Arts Occupations
The most common Management, Business, Science and Arts occupations in Holbrook are Community & Social Service (1,976 | 13.6%), Management (1,709 | 11.8%), Education Instruction & Library (1,078 | 7.4%), Business & Financial (946 | 6.5%), and Health Diagnosing & Treating (826 | 5.7%).
Management, Business, Science and Arts Occupations by Sex
Within the Management, Business, Science and Arts occupations in Holbrook, the most male-oriented occupations are Architecture & Engineering (89.4%), Computers & Mathematics (86.9%), and Computers, Engineering & Science (76.1%), while the most female-oriented occupations are Education Instruction & Library (81.6%), Health Technologists (74.0%), and Health Diagnosing & Treating (70.3%).
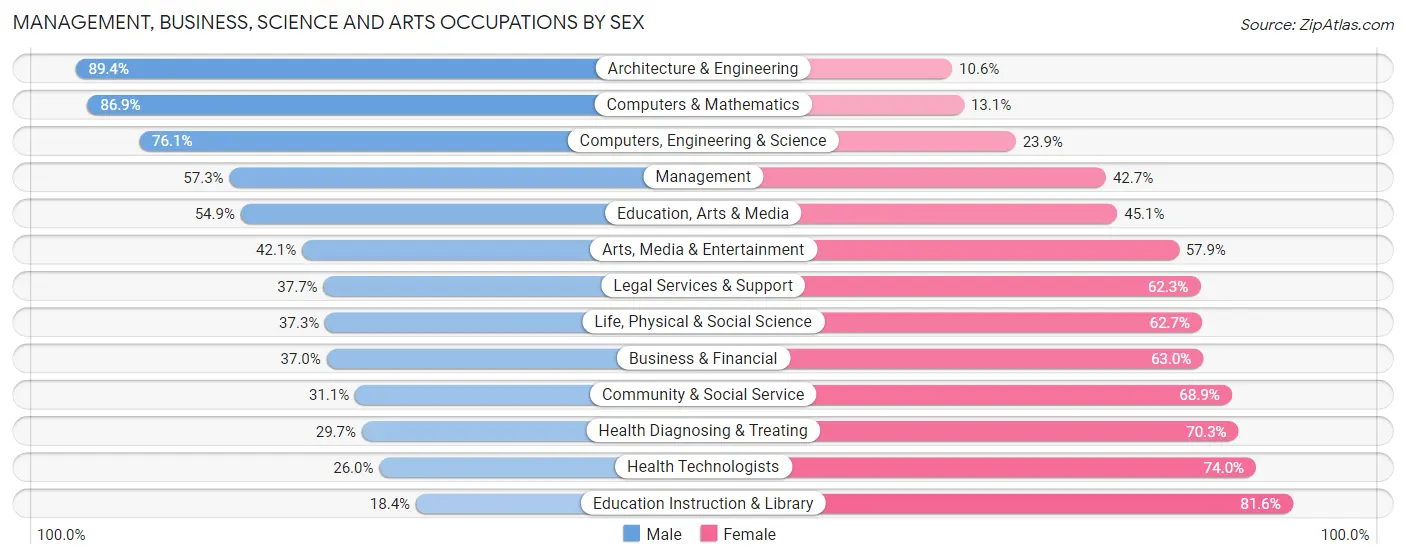
| Occupation | Male | Female |
| Management | 979 (57.3%) | 730 (42.7%) |
| Business & Financial | 350 (37.0%) | 596 (63.0%) |
| Computers, Engineering & Science | 615 (76.1%) | 193 (23.9%) |
| Computers & Mathematics | 378 (86.9%) | 57 (13.1%) |
| Architecture & Engineering | 168 (89.4%) | 20 (10.6%) |
| Life, Physical & Social Science | 69 (37.3%) | 116 (62.7%) |
| Community & Social Service | 614 (31.1%) | 1,362 (68.9%) |
| Education, Arts & Media | 218 (54.9%) | 179 (45.1%) |
| Legal Services & Support | 110 (37.7%) | 182 (62.3%) |
| Education Instruction & Library | 198 (18.4%) | 880 (81.6%) |
| Arts, Media & Entertainment | 88 (42.1%) | 121 (57.9%) |
| Health Diagnosing & Treating | 245 (29.7%) | 581 (70.3%) |
| Health Technologists | 148 (26.0%) | 421 (74.0%) |
| Total (Category) | 2,803 (44.7%) | 3,462 (55.3%) |
| Total (Overall) | 7,527 (51.8%) | 6,990 (48.1%) |
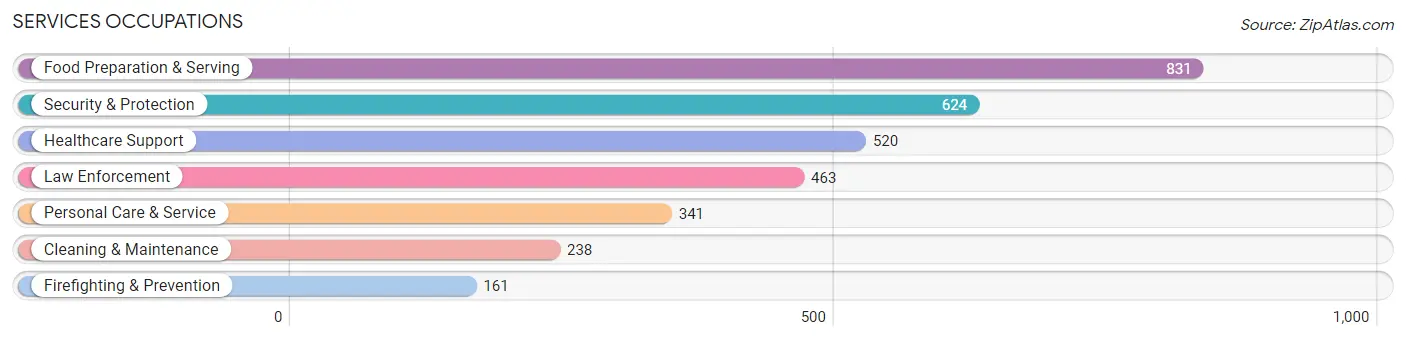
Services Occupations
The most common Services occupations in Holbrook are Food Preparation & Serving (831 | 5.7%), Security & Protection (624 | 4.3%), Healthcare Support (520 | 3.6%), Law Enforcement (463 | 3.2%), and Personal Care & Service (341 | 2.4%).
Services Occupations by Sex
Within the Services occupations in Holbrook, the most male-oriented occupations are Law Enforcement (83.2%), Security & Protection (75.6%), and Personal Care & Service (66.6%), while the most female-oriented occupations are Healthcare Support (77.5%), Cleaning & Maintenance (48.3%), and Firefighting & Prevention (46.0%).
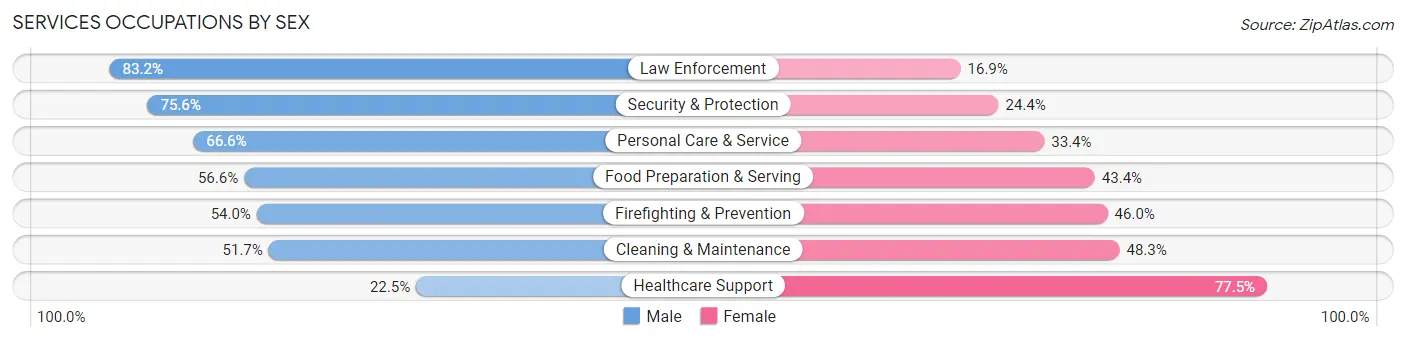
| Occupation | Male | Female |
| Healthcare Support | 117 (22.5%) | 403 (77.5%) |
| Security & Protection | 472 (75.6%) | 152 (24.4%) |
| Firefighting & Prevention | 87 (54.0%) | 74 (46.0%) |
| Law Enforcement | 385 (83.2%) | 78 (16.9%) |
| Food Preparation & Serving | 470 (56.6%) | 361 (43.4%) |
| Cleaning & Maintenance | 123 (51.7%) | 115 (48.3%) |
| Personal Care & Service | 227 (66.6%) | 114 (33.4%) |
| Total (Category) | 1,409 (55.2%) | 1,145 (44.8%) |
| Total (Overall) | 7,527 (51.8%) | 6,990 (48.1%) |
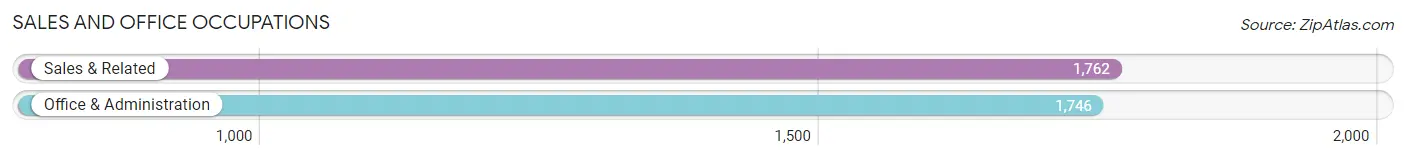
Sales and Office Occupations
The most common Sales and Office occupations in Holbrook are Sales & Related (1,762 | 12.1%), and Office & Administration (1,746 | 12.0%).
Sales and Office Occupations by Sex
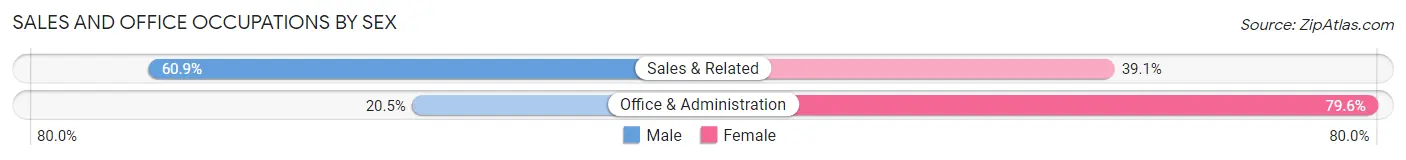
| Occupation | Male | Female |
| Sales & Related | 1,073 (60.9%) | 689 (39.1%) |
| Office & Administration | 357 (20.4%) | 1,389 (79.5%) |
| Total (Category) | 1,430 (40.8%) | 2,078 (59.2%) |
| Total (Overall) | 7,527 (51.8%) | 6,990 (48.1%) |
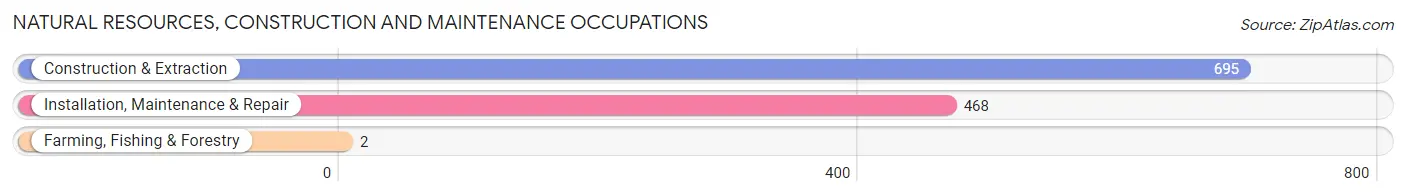
Natural Resources, Construction and Maintenance Occupations
The most common Natural Resources, Construction and Maintenance occupations in Holbrook are Construction & Extraction (695 | 4.8%), Installation, Maintenance & Repair (468 | 3.2%), and Farming, Fishing & Forestry (2 | 0.0%).
Natural Resources, Construction and Maintenance Occupations by Sex
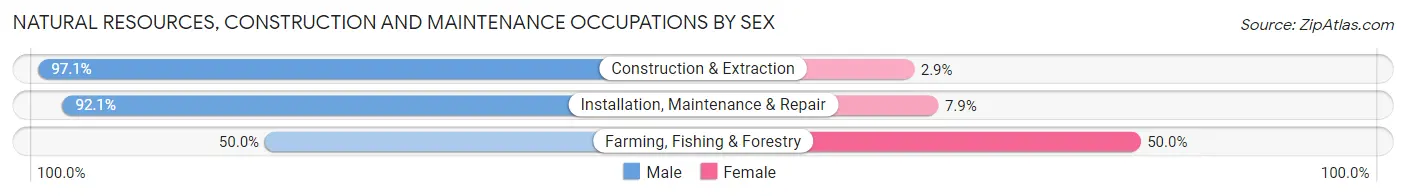
| Occupation | Male | Female |
| Farming, Fishing & Forestry | 1 (50.0%) | 1 (50.0%) |
| Construction & Extraction | 675 (97.1%) | 20 (2.9%) |
| Installation, Maintenance & Repair | 431 (92.1%) | 37 (7.9%) |
| Total (Category) | 1,107 (95.0%) | 58 (5.0%) |
| Total (Overall) | 7,527 (51.8%) | 6,990 (48.1%) |
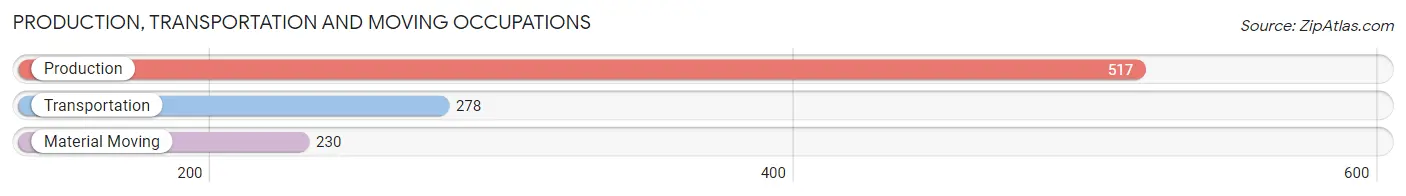
Production, Transportation and Moving Occupations
The most common Production, Transportation and Moving occupations in Holbrook are Production (517 | 3.6%), Transportation (278 | 1.9%), and Material Moving (230 | 1.6%).
Production, Transportation and Moving Occupations by Sex
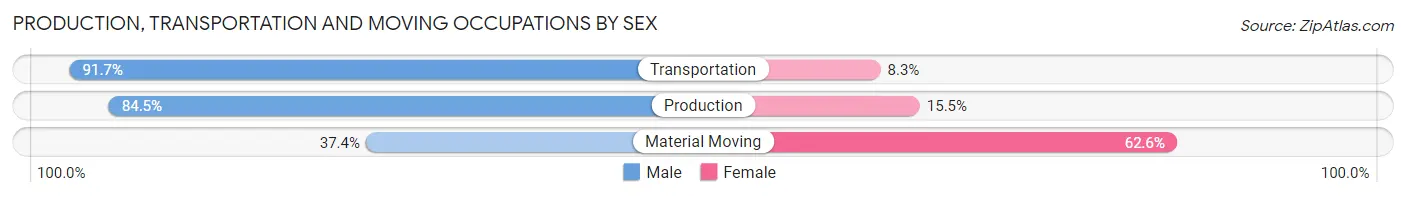
| Occupation | Male | Female |
| Production | 437 (84.5%) | 80 (15.5%) |
| Transportation | 255 (91.7%) | 23 (8.3%) |
| Material Moving | 86 (37.4%) | 144 (62.6%) |
| Total (Category) | 778 (75.9%) | 247 (24.1%) |
| Total (Overall) | 7,527 (51.8%) | 6,990 (48.1%) |
Employment Industries by Sex in Holbrook
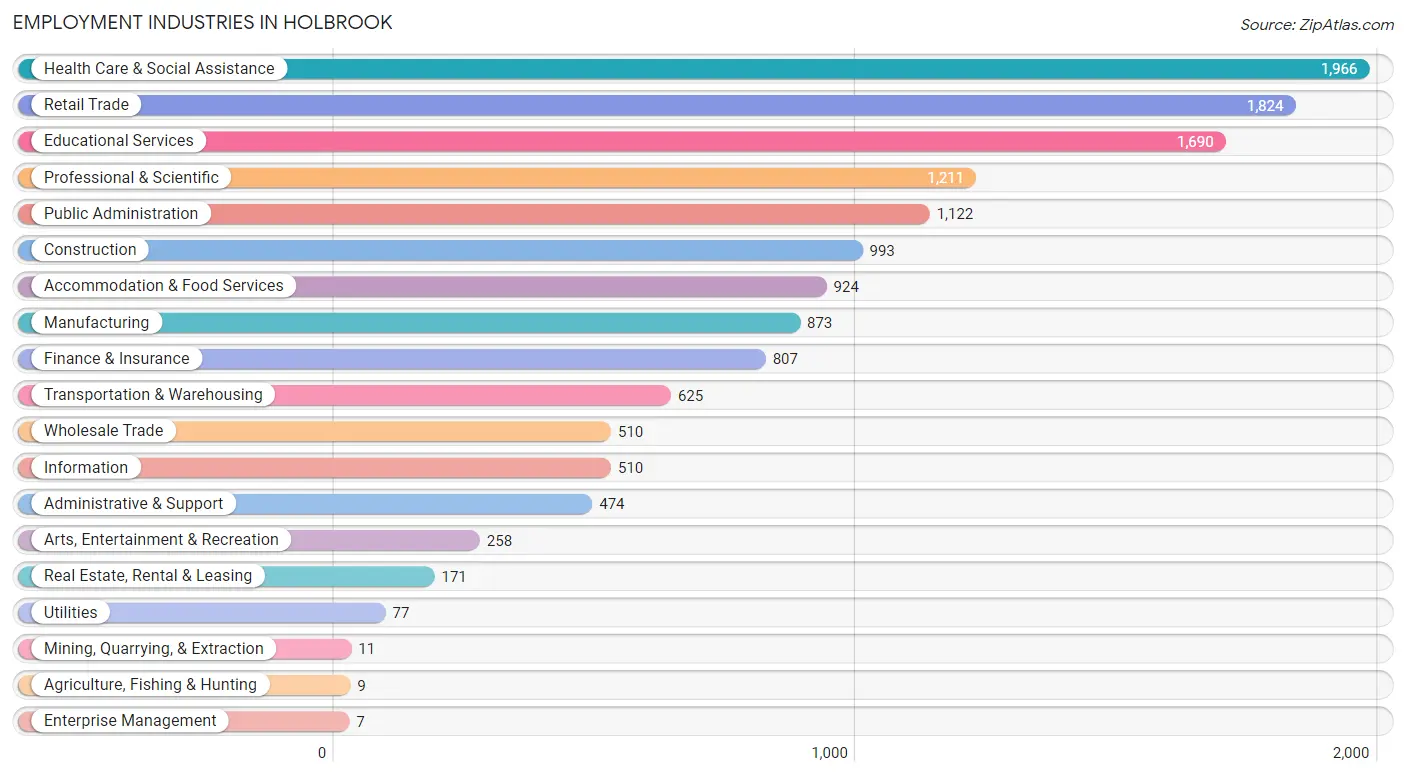
Employment Industries in Holbrook
The major employment industries in Holbrook include Health Care & Social Assistance (1,966 | 13.5%), Retail Trade (1,824 | 12.6%), Educational Services (1,690 | 11.6%), Professional & Scientific (1,211 | 8.3%), and Public Administration (1,122 | 7.7%).
Employment Industries by Sex in Holbrook
The Holbrook industries that see more men than women are Mining, Quarrying, & Extraction (100.0%), Enterprise Management (100.0%), and Real Estate, Rental & Leasing (97.7%), whereas the industries that tend to have a higher number of women are Agriculture, Fishing & Hunting (88.9%), Educational Services (73.9%), and Health Care & Social Assistance (65.6%).
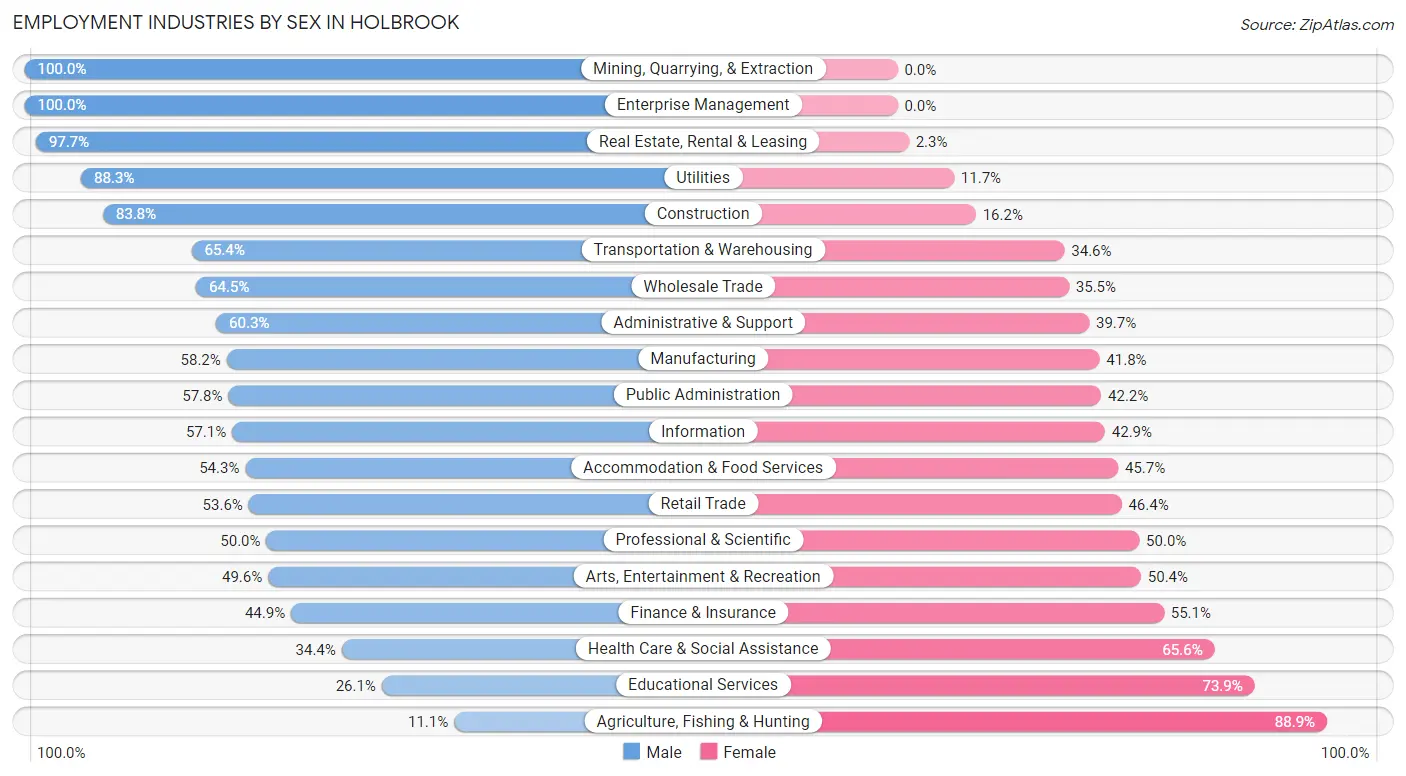
| Industry | Male | Female |
| Agriculture, Fishing & Hunting | 1 (11.1%) | 8 (88.9%) |
| Mining, Quarrying, & Extraction | 11 (100.0%) | 0 (0.0%) |
| Construction | 832 (83.8%) | 161 (16.2%) |
| Manufacturing | 508 (58.2%) | 365 (41.8%) |
| Wholesale Trade | 329 (64.5%) | 181 (35.5%) |
| Retail Trade | 978 (53.6%) | 846 (46.4%) |
| Transportation & Warehousing | 409 (65.4%) | 216 (34.6%) |
| Utilities | 68 (88.3%) | 9 (11.7%) |
| Information | 291 (57.1%) | 219 (42.9%) |
| Finance & Insurance | 362 (44.9%) | 445 (55.1%) |
| Real Estate, Rental & Leasing | 167 (97.7%) | 4 (2.3%) |
| Professional & Scientific | 605 (50.0%) | 606 (50.0%) |
| Enterprise Management | 7 (100.0%) | 0 (0.0%) |
| Administrative & Support | 286 (60.3%) | 188 (39.7%) |
| Educational Services | 441 (26.1%) | 1,249 (73.9%) |
| Health Care & Social Assistance | 676 (34.4%) | 1,290 (65.6%) |
| Arts, Entertainment & Recreation | 128 (49.6%) | 130 (50.4%) |
| Accommodation & Food Services | 502 (54.3%) | 422 (45.7%) |
| Public Administration | 649 (57.8%) | 473 (42.2%) |
| Total | 7,527 (51.8%) | 6,990 (48.1%) |
Education in Holbrook
School Enrollment in Holbrook
The most common levels of schooling among the 6,314 students in Holbrook are high school (1,652 | 26.2%), elementary school (1,318 | 20.9%), and middle school (1,283 | 20.3%).
| School Level | # Students | % Students |
| Nursery / Preschool | 200 | 3.2% |
| Kindergarten | 235 | 3.7% |
| Elementary School | 1,318 | 20.9% |
| Middle School | 1,283 | 20.3% |
| High School | 1,652 | 26.2% |
| College / Undergraduate | 1,261 | 20.0% |
| Graduate / Professional | 365 | 5.8% |
| Total | 6,314 | 100.0% |
School Enrollment by Age by Funding Source in Holbrook
Out of a total of 6,314 students who are enrolled in schools in Holbrook, 644 (10.2%) attend a private institution, while the remaining 5,670 (89.8%) are enrolled in public schools. The age group of 25 to 34 year olds has the highest likelihood of being enrolled in private schools, with 143 (43.5% in the age bracket) enrolled. Conversely, the age group of 10 to 14 year olds has the lowest likelihood of being enrolled in a private school, with 1,695 (99.0% in the age bracket) attending a public institution.
| Age Bracket | Public School | Private School |
| 3 to 4 Year Olds | 117 (79.0%) | 31 (20.9%) |
| 5 to 9 Year Old | 1,399 (90.5%) | 147 (9.5%) |
| 10 to 14 Year Olds | 1,695 (99.0%) | 17 (1.0%) |
| 15 to 17 Year Olds | 1,058 (96.7%) | 36 (3.3%) |
| 18 to 19 Year Olds | 285 (82.4%) | 61 (17.6%) |
| 20 to 24 Year Olds | 738 (83.3%) | 148 (16.7%) |
| 25 to 34 Year Olds | 186 (56.5%) | 143 (43.5%) |
| 35 Years and over | 192 (75.9%) | 61 (24.1%) |
| Total | 5,670 (89.8%) | 644 (10.2%) |
Educational Attainment by Field of Study in Holbrook
Business (1,629 | 22.8%), education (1,074 | 15.0%), science & technology (887 | 12.4%), social sciences (616 | 8.6%), and psychology (564 | 7.9%) are the most common fields of study among 7,151 individuals in Holbrook who have obtained a bachelor's degree or higher.
| Field of Study | # Graduates | % Graduates |
| Computers & Mathematics | 228 | 3.2% |
| Bio, Nature & Agricultural | 286 | 4.0% |
| Physical & Health Sciences | 315 | 4.4% |
| Psychology | 564 | 7.9% |
| Social Sciences | 616 | 8.6% |
| Engineering | 168 | 2.4% |
| Multidisciplinary Studies | 69 | 1.0% |
| Science & Technology | 887 | 12.4% |
| Business | 1,629 | 22.8% |
| Education | 1,074 | 15.0% |
| Literature & Languages | 282 | 3.9% |
| Liberal Arts & History | 231 | 3.2% |
| Visual & Performing Arts | 226 | 3.2% |
| Communications | 173 | 2.4% |
| Arts & Humanities | 403 | 5.6% |
| Total | 7,151 | 100.0% |
Transportation & Commute in Holbrook
Vehicle Availability by Sex in Holbrook
The most prevalent vehicle ownership categories in Holbrook are males with 2 vehicles (3,198, accounting for 42.5%) and females with 2 vehicles (2,921, making up 46.7%).
| Vehicles Available | Male | Female |
| No Vehicle | 153 (2.0%) | 80 (1.2%) |
| 1 Vehicle | 773 (10.3%) | 817 (11.9%) |
| 2 Vehicles | 3,198 (42.5%) | 2,921 (42.6%) |
| 3 Vehicles | 1,670 (22.2%) | 1,818 (26.5%) |
| 4 Vehicles | 1,183 (15.7%) | 949 (13.9%) |
| 5 or more Vehicles | 545 (7.2%) | 266 (3.9%) |
| Total | 7,522 (100.0%) | 6,851 (100.0%) |
Commute Time in Holbrook
The most frequently occuring commute durations in Holbrook are 10 to 14 minutes (2,388 commuters, 18.0%), 30 to 34 minutes (2,015 commuters, 15.2%), and 15 to 19 minutes (1,495 commuters, 11.3%).
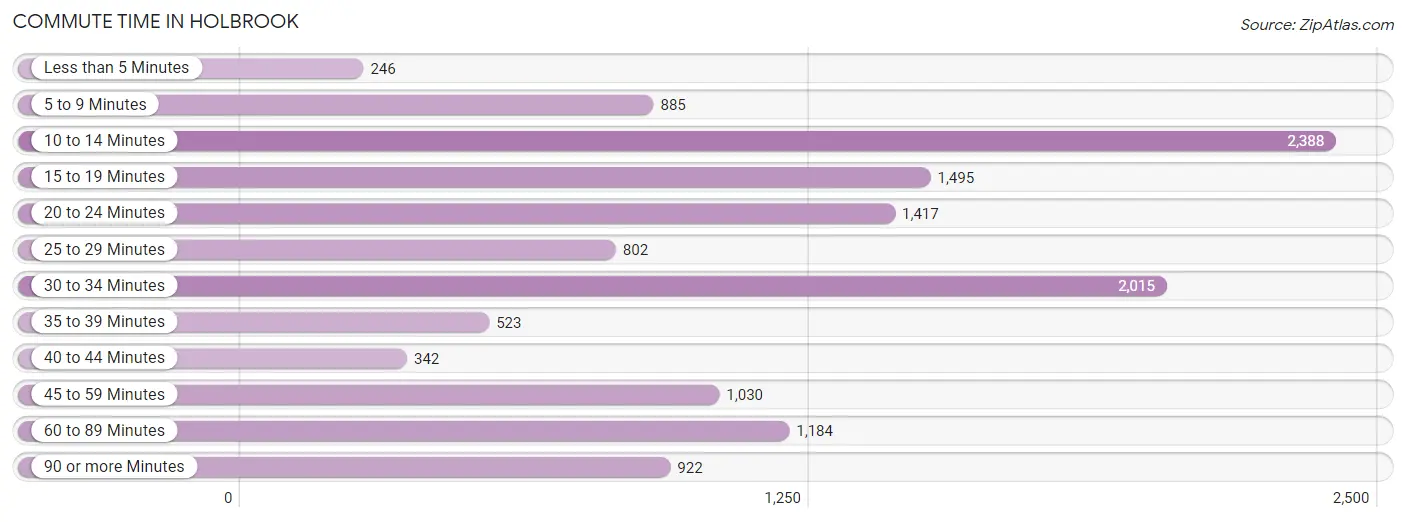
| Commute Time | # Commuters | % Commuters |
| Less than 5 Minutes | 246 | 1.9% |
| 5 to 9 Minutes | 885 | 6.7% |
| 10 to 14 Minutes | 2,388 | 18.0% |
| 15 to 19 Minutes | 1,495 | 11.3% |
| 20 to 24 Minutes | 1,417 | 10.7% |
| 25 to 29 Minutes | 802 | 6.0% |
| 30 to 34 Minutes | 2,015 | 15.2% |
| 35 to 39 Minutes | 523 | 4.0% |
| 40 to 44 Minutes | 342 | 2.6% |
| 45 to 59 Minutes | 1,030 | 7.8% |
| 60 to 89 Minutes | 1,184 | 8.9% |
| 90 or more Minutes | 922 | 7.0% |
Commute Time by Sex in Holbrook
The most common commute times in Holbrook are 10 to 14 minutes (1,166 commuters, 17.0%) for males and 10 to 14 minutes (1,222 commuters, 19.2%) for females.
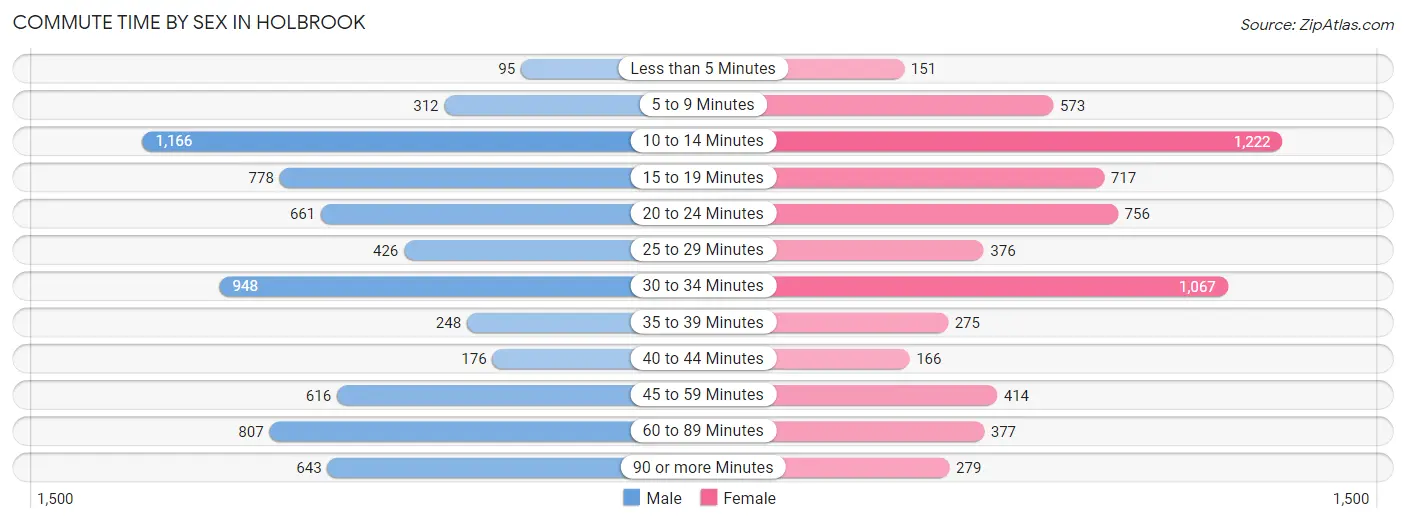
| Commute Time | Male | Female |
| Less than 5 Minutes | 95 (1.4%) | 151 (2.4%) |
| 5 to 9 Minutes | 312 (4.5%) | 573 (9.0%) |
| 10 to 14 Minutes | 1,166 (17.0%) | 1,222 (19.2%) |
| 15 to 19 Minutes | 778 (11.3%) | 717 (11.3%) |
| 20 to 24 Minutes | 661 (9.6%) | 756 (11.9%) |
| 25 to 29 Minutes | 426 (6.2%) | 376 (5.9%) |
| 30 to 34 Minutes | 948 (13.8%) | 1,067 (16.7%) |
| 35 to 39 Minutes | 248 (3.6%) | 275 (4.3%) |
| 40 to 44 Minutes | 176 (2.6%) | 166 (2.6%) |
| 45 to 59 Minutes | 616 (9.0%) | 414 (6.5%) |
| 60 to 89 Minutes | 807 (11.7%) | 377 (5.9%) |
| 90 or more Minutes | 643 (9.3%) | 279 (4.4%) |
Time of Departure to Work by Sex in Holbrook
The most frequent times of departure to work in Holbrook are 6:00 AM to 6:29 AM (792, 11.5%) for males and 8:00 AM to 8:29 AM (1,423, 22.3%) for females.
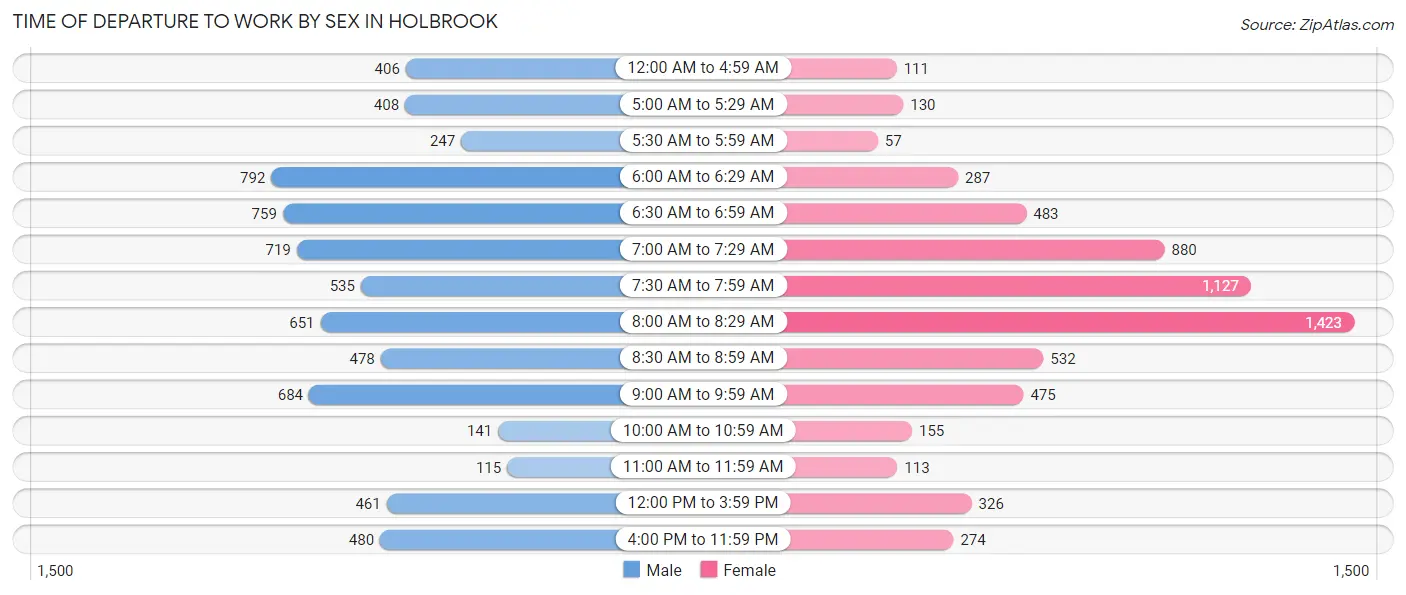
| Time of Departure | Male | Female |
| 12:00 AM to 4:59 AM | 406 (5.9%) | 111 (1.7%) |
| 5:00 AM to 5:29 AM | 408 (5.9%) | 130 (2.0%) |
| 5:30 AM to 5:59 AM | 247 (3.6%) | 57 (0.9%) |
| 6:00 AM to 6:29 AM | 792 (11.5%) | 287 (4.5%) |
| 6:30 AM to 6:59 AM | 759 (11.0%) | 483 (7.6%) |
| 7:00 AM to 7:29 AM | 719 (10.5%) | 880 (13.8%) |
| 7:30 AM to 7:59 AM | 535 (7.8%) | 1,127 (17.7%) |
| 8:00 AM to 8:29 AM | 651 (9.5%) | 1,423 (22.3%) |
| 8:30 AM to 8:59 AM | 478 (7.0%) | 532 (8.4%) |
| 9:00 AM to 9:59 AM | 684 (10.0%) | 475 (7.4%) |
| 10:00 AM to 10:59 AM | 141 (2.1%) | 155 (2.4%) |
| 11:00 AM to 11:59 AM | 115 (1.7%) | 113 (1.8%) |
| 12:00 PM to 3:59 PM | 461 (6.7%) | 326 (5.1%) |
| 4:00 PM to 11:59 PM | 480 (7.0%) | 274 (4.3%) |
| Total | 6,876 (100.0%) | 6,373 (100.0%) |
Housing Occupancy in Holbrook
Occupancy by Ownership in Holbrook
Of the total 9,059 dwellings in Holbrook, owner-occupied units account for 7,070 (78.0%), while renter-occupied units make up 1,989 (22.0%).
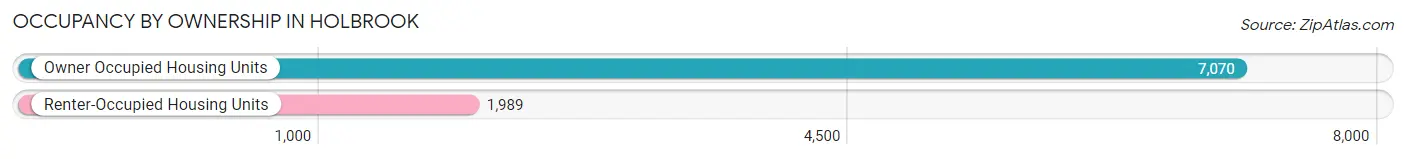
| Occupancy | # Housing Units | % Housing Units |
| Owner Occupied Housing Units | 7,070 | 78.0% |
| Renter-Occupied Housing Units | 1,989 | 22.0% |
| Total Occupied Housing Units | 9,059 | 100.0% |
Occupancy by Household Size in Holbrook
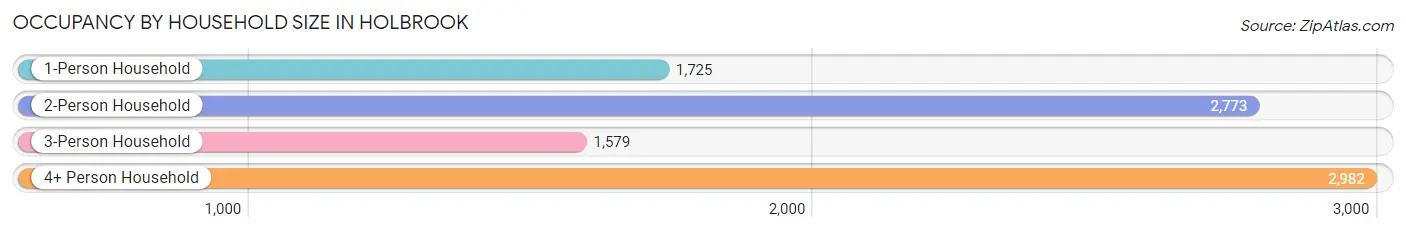
| Household Size | # Housing Units | % Housing Units |
| 1-Person Household | 1,725 | 19.0% |
| 2-Person Household | 2,773 | 30.6% |
| 3-Person Household | 1,579 | 17.4% |
| 4+ Person Household | 2,982 | 32.9% |
| Total Housing Units | 9,059 | 100.0% |
Occupancy by Ownership by Household Size in Holbrook
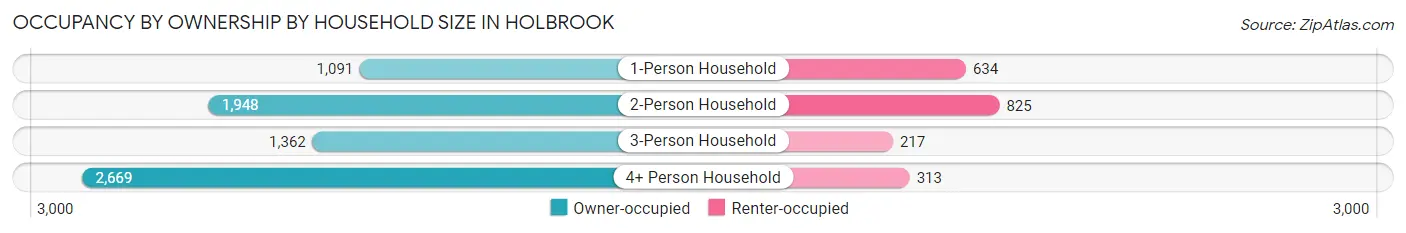
| Household Size | Owner-occupied | Renter-occupied |
| 1-Person Household | 1,091 (63.2%) | 634 (36.7%) |
| 2-Person Household | 1,948 (70.3%) | 825 (29.7%) |
| 3-Person Household | 1,362 (86.3%) | 217 (13.7%) |
| 4+ Person Household | 2,669 (89.5%) | 313 (10.5%) |
| Total Housing Units | 7,070 (78.0%) | 1,989 (22.0%) |
Occupancy by Educational Attainment in Holbrook
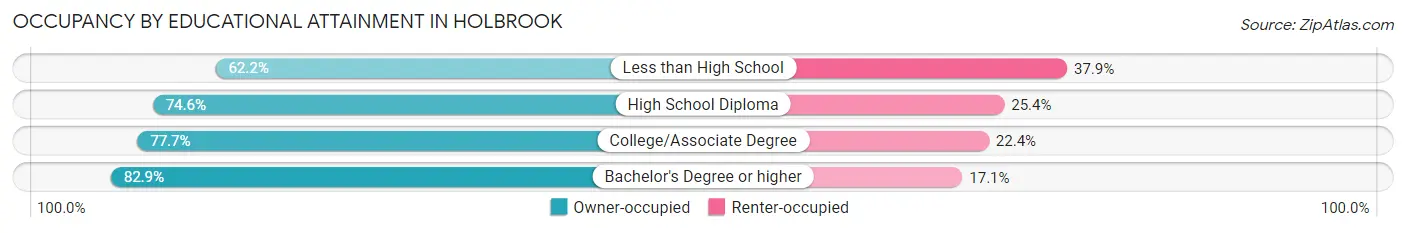
| Household Size | Owner-occupied | Renter-occupied |
| Less than High School | 289 (62.2%) | 176 (37.9%) |
| High School Diploma | 1,782 (74.6%) | 607 (25.4%) |
| College/Associate Degree | 2,151 (77.6%) | 619 (22.4%) |
| Bachelor's Degree or higher | 2,848 (82.9%) | 587 (17.1%) |
Occupancy by Age of Householder in Holbrook
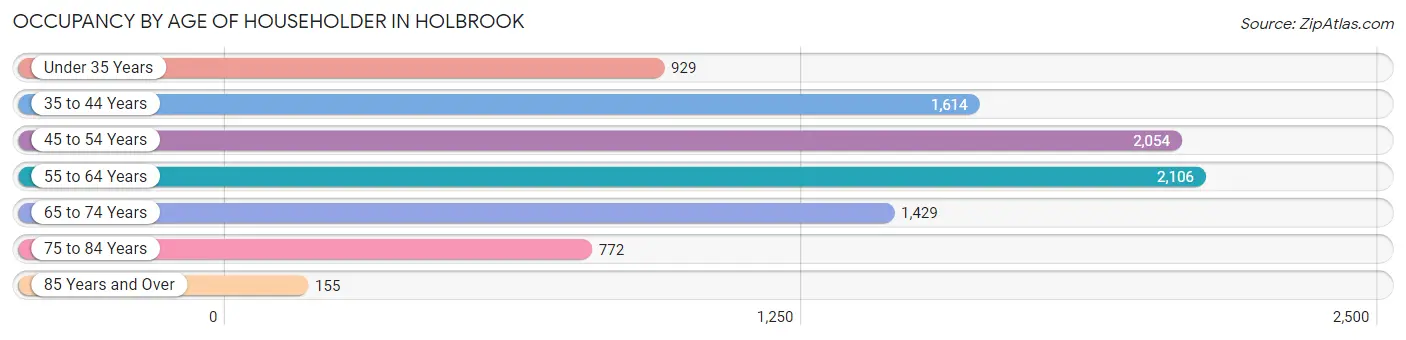
| Age Bracket | # Households | % Households |
| Under 35 Years | 929 | 10.2% |
| 35 to 44 Years | 1,614 | 17.8% |
| 45 to 54 Years | 2,054 | 22.7% |
| 55 to 64 Years | 2,106 | 23.3% |
| 65 to 74 Years | 1,429 | 15.8% |
| 75 to 84 Years | 772 | 8.5% |
| 85 Years and Over | 155 | 1.7% |
| Total | 9,059 | 100.0% |
Housing Finances in Holbrook
Median Income by Occupancy in Holbrook
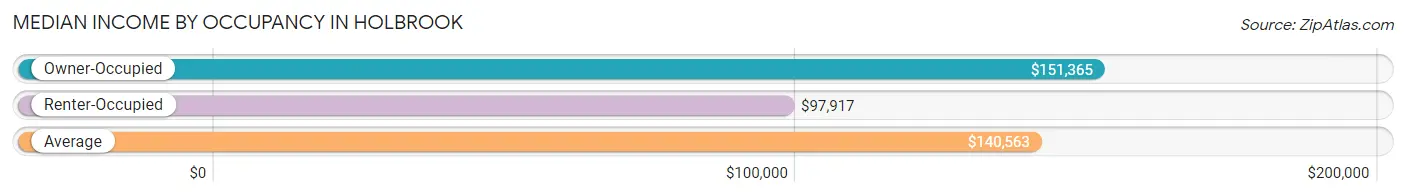
| Occupancy Type | # Households | Median Income |
| Owner-Occupied | 7,070 (78.0%) | $151,365 |
| Renter-Occupied | 1,989 (22.0%) | $97,917 |
| Average | 9,059 (100.0%) | $140,563 |
Occupancy by Householder Income Bracket in Holbrook
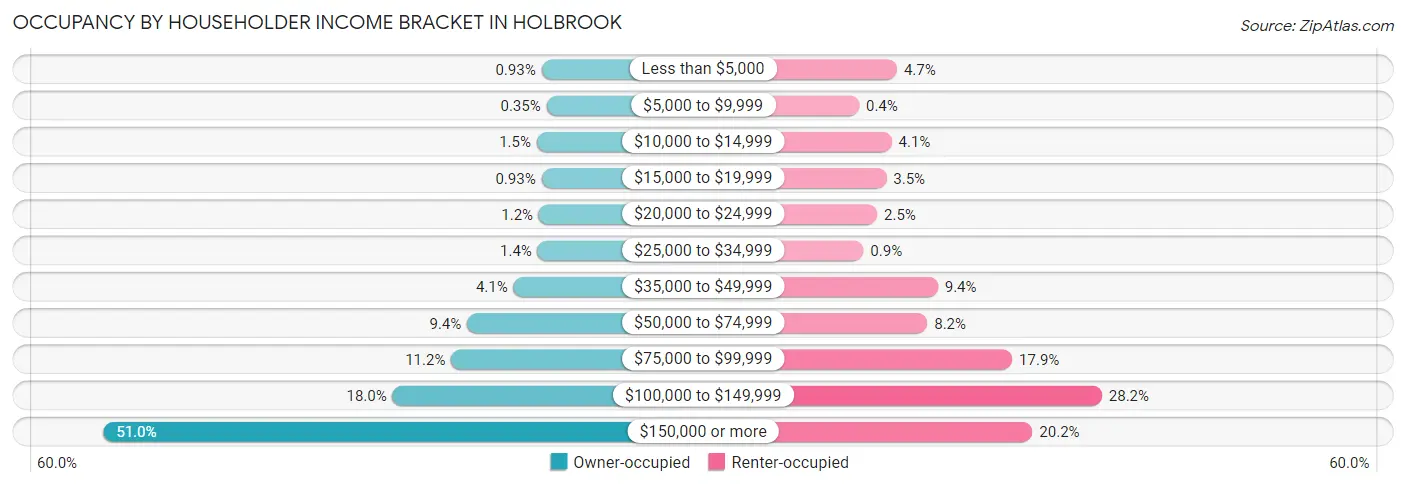
| Income Bracket | Owner-occupied | Renter-occupied |
| Less than $5,000 | 66 (0.9%) | 94 (4.7%) |
| $5,000 to $9,999 | 25 (0.4%) | 8 (0.4%) |
| $10,000 to $14,999 | 103 (1.5%) | 82 (4.1%) |
| $15,000 to $19,999 | 66 (0.9%) | 70 (3.5%) |
| $20,000 to $24,999 | 86 (1.2%) | 49 (2.5%) |
| $25,000 to $34,999 | 96 (1.4%) | 18 (0.9%) |
| $35,000 to $49,999 | 291 (4.1%) | 187 (9.4%) |
| $50,000 to $74,999 | 667 (9.4%) | 163 (8.2%) |
| $75,000 to $99,999 | 795 (11.2%) | 356 (17.9%) |
| $100,000 to $149,999 | 1,269 (17.9%) | 560 (28.1%) |
| $150,000 or more | 3,606 (51.0%) | 402 (20.2%) |
| Total | 7,070 (100.0%) | 1,989 (100.0%) |
Monthly Housing Cost Tiers in Holbrook
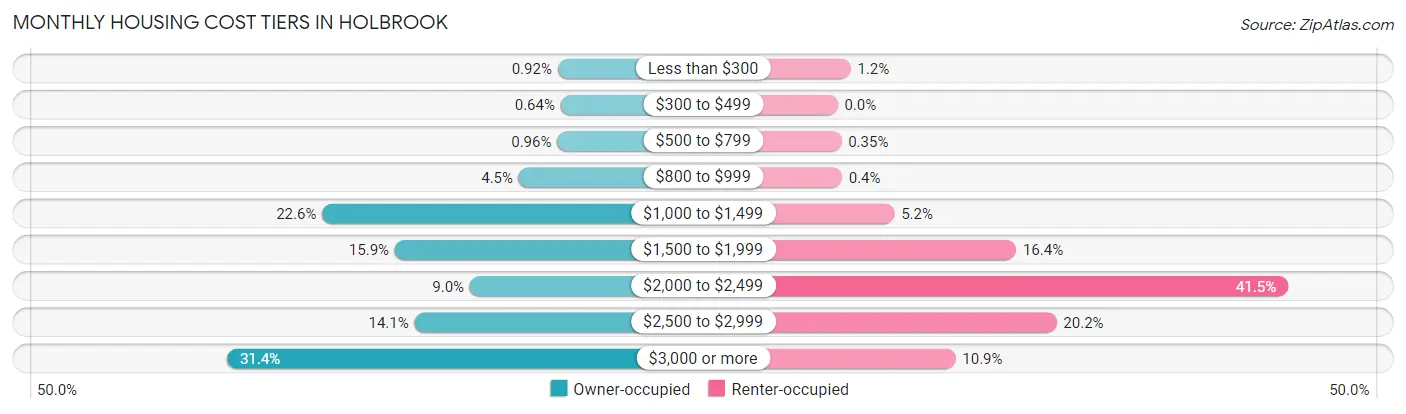
| Monthly Cost | Owner-occupied | Renter-occupied |
| Less than $300 | 65 (0.9%) | 24 (1.2%) |
| $300 to $499 | 45 (0.6%) | 0 (0.0%) |
| $500 to $799 | 68 (1.0%) | 7 (0.4%) |
| $800 to $999 | 318 (4.5%) | 8 (0.4%) |
| $1,000 to $1,499 | 1,598 (22.6%) | 104 (5.2%) |
| $1,500 to $1,999 | 1,125 (15.9%) | 327 (16.4%) |
| $2,000 to $2,499 | 636 (9.0%) | 825 (41.5%) |
| $2,500 to $2,999 | 997 (14.1%) | 401 (20.2%) |
| $3,000 or more | 2,218 (31.4%) | 216 (10.9%) |
| Total | 7,070 (100.0%) | 1,989 (100.0%) |
Physical Housing Characteristics in Holbrook
Housing Structures in Holbrook
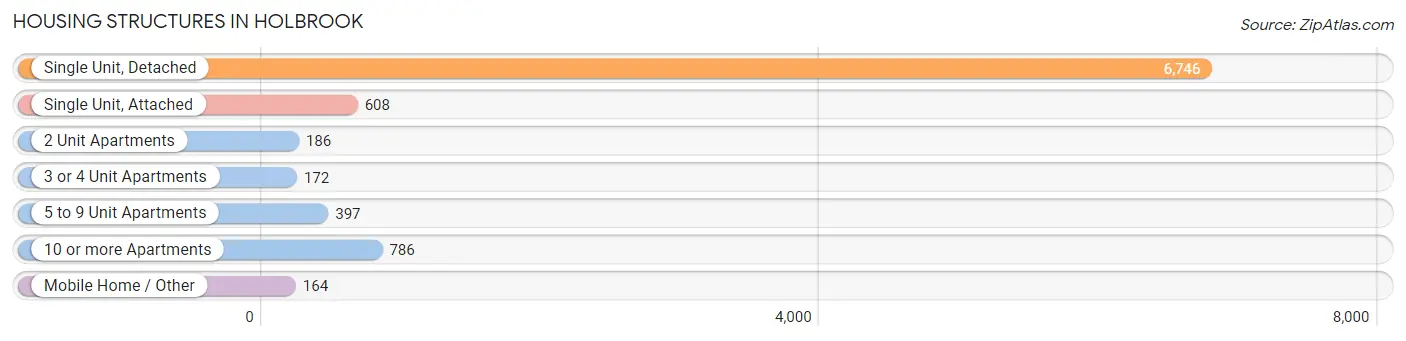
| Structure Type | # Housing Units | % Housing Units |
| Single Unit, Detached | 6,746 | 74.5% |
| Single Unit, Attached | 608 | 6.7% |
| 2 Unit Apartments | 186 | 2.1% |
| 3 or 4 Unit Apartments | 172 | 1.9% |
| 5 to 9 Unit Apartments | 397 | 4.4% |
| 10 or more Apartments | 786 | 8.7% |
| Mobile Home / Other | 164 | 1.8% |
| Total | 9,059 | 100.0% |
Housing Structures by Occupancy in Holbrook
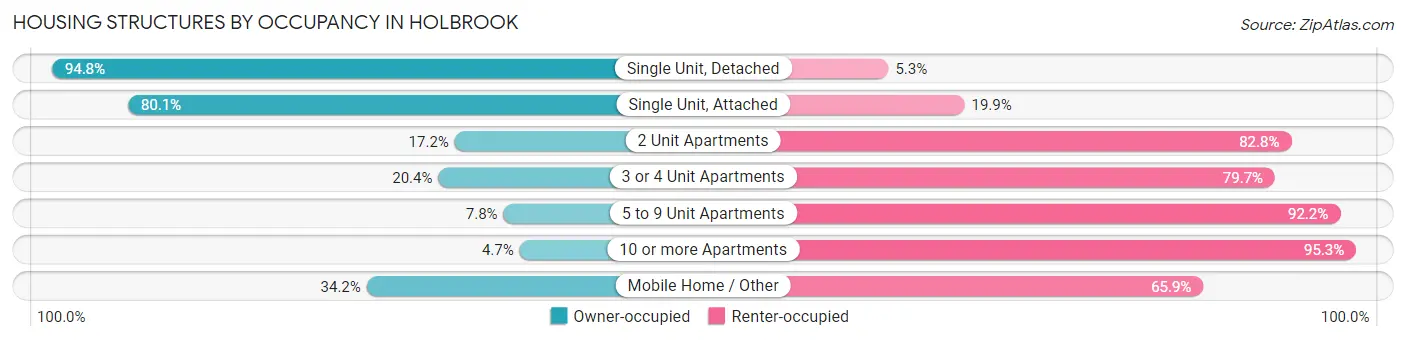
| Structure Type | Owner-occupied | Renter-occupied |
| Single Unit, Detached | 6,392 (94.8%) | 354 (5.2%) |
| Single Unit, Attached | 487 (80.1%) | 121 (19.9%) |
| 2 Unit Apartments | 32 (17.2%) | 154 (82.8%) |
| 3 or 4 Unit Apartments | 35 (20.3%) | 137 (79.6%) |
| 5 to 9 Unit Apartments | 31 (7.8%) | 366 (92.2%) |
| 10 or more Apartments | 37 (4.7%) | 749 (95.3%) |
| Mobile Home / Other | 56 (34.2%) | 108 (65.8%) |
| Total | 7,070 (78.0%) | 1,989 (22.0%) |
Housing Structures by Number of Rooms in Holbrook
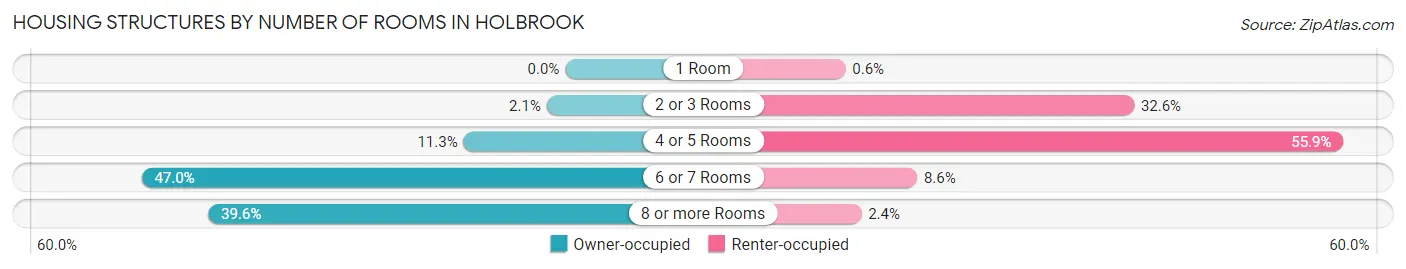
| Number of Rooms | Owner-occupied | Renter-occupied |
| 1 Room | 0 (0.0%) | 12 (0.6%) |
| 2 or 3 Rooms | 145 (2.1%) | 649 (32.6%) |
| 4 or 5 Rooms | 798 (11.3%) | 1,111 (55.9%) |
| 6 or 7 Rooms | 3,325 (47.0%) | 170 (8.6%) |
| 8 or more Rooms | 2,802 (39.6%) | 47 (2.4%) |
| Total | 7,070 (100.0%) | 1,989 (100.0%) |
Housing Structure by Heating Type in Holbrook
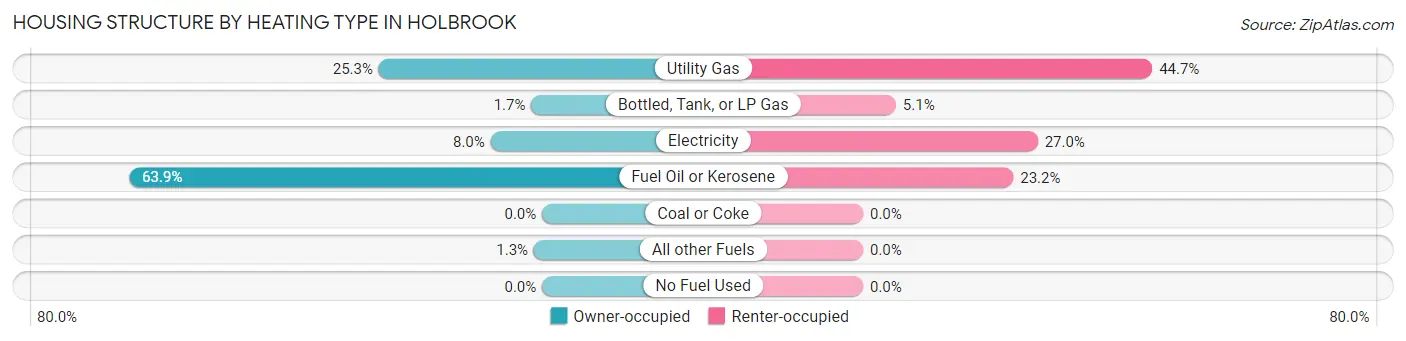
| Heating Type | Owner-occupied | Renter-occupied |
| Utility Gas | 1,785 (25.3%) | 889 (44.7%) |
| Bottled, Tank, or LP Gas | 118 (1.7%) | 101 (5.1%) |
| Electricity | 563 (8.0%) | 537 (27.0%) |
| Fuel Oil or Kerosene | 4,515 (63.9%) | 462 (23.2%) |
| Coal or Coke | 0 (0.0%) | 0 (0.0%) |
| All other Fuels | 89 (1.3%) | 0 (0.0%) |
| No Fuel Used | 0 (0.0%) | 0 (0.0%) |
| Total | 7,070 (100.0%) | 1,989 (100.0%) |
Household Vehicle Usage in Holbrook
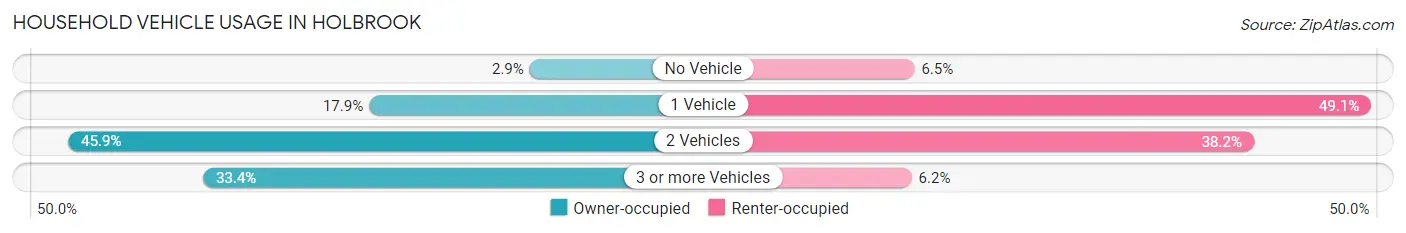
| Vehicles per Household | Owner-occupied | Renter-occupied |
| No Vehicle | 202 (2.9%) | 129 (6.5%) |
| 1 Vehicle | 1,262 (17.8%) | 977 (49.1%) |
| 2 Vehicles | 3,248 (45.9%) | 759 (38.2%) |
| 3 or more Vehicles | 2,358 (33.4%) | 124 (6.2%) |
| Total | 7,070 (100.0%) | 1,989 (100.0%) |
Real Estate & Mortgages in Holbrook
Real Estate and Mortgage Overview in Holbrook
| Characteristic | Without Mortgage | With Mortgage |
| Housing Units | 2,604 | 4,466 |
| Median Property Value | $469,600 | $469,600 |
| Median Household Income | $134,531 | $2,409 |
| Monthly Housing Costs | $1,374 | $2,218 |
| Real Estate Taxes | $9,743 | $13 |
Property Value by Mortgage Status in Holbrook
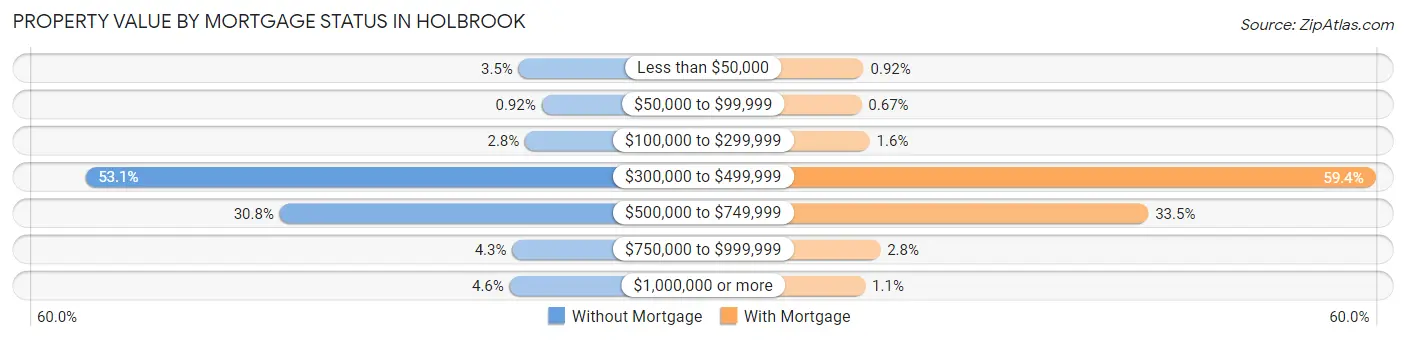
| Property Value | Without Mortgage | With Mortgage |
| Less than $50,000 | 92 (3.5%) | 41 (0.9%) |
| $50,000 to $99,999 | 24 (0.9%) | 30 (0.7%) |
| $100,000 to $299,999 | 73 (2.8%) | 72 (1.6%) |
| $300,000 to $499,999 | 1,382 (53.1%) | 2,654 (59.4%) |
| $500,000 to $749,999 | 803 (30.8%) | 1,494 (33.5%) |
| $750,000 to $999,999 | 111 (4.3%) | 126 (2.8%) |
| $1,000,000 or more | 119 (4.6%) | 49 (1.1%) |
| Total | 2,604 (100.0%) | 4,466 (100.0%) |
Household Income by Mortgage Status in Holbrook
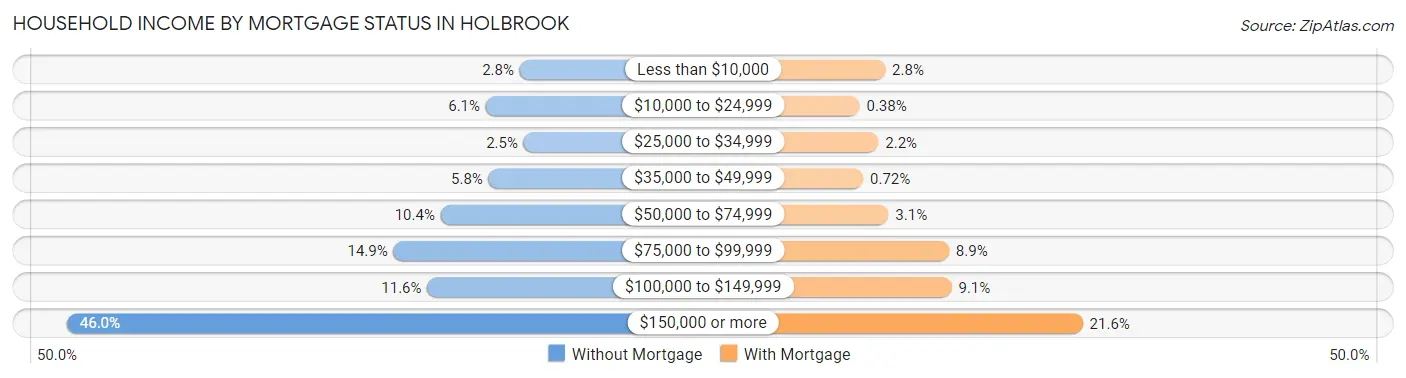
| Household Income | Without Mortgage | With Mortgage |
| Less than $10,000 | 74 (2.8%) | 126 (2.8%) |
| $10,000 to $24,999 | 158 (6.1%) | 17 (0.4%) |
| $25,000 to $34,999 | 64 (2.5%) | 97 (2.2%) |
| $35,000 to $49,999 | 151 (5.8%) | 32 (0.7%) |
| $50,000 to $74,999 | 270 (10.4%) | 140 (3.1%) |
| $75,000 to $99,999 | 387 (14.9%) | 397 (8.9%) |
| $100,000 to $149,999 | 303 (11.6%) | 408 (9.1%) |
| $150,000 or more | 1,197 (46.0%) | 966 (21.6%) |
| Total | 2,604 (100.0%) | 4,466 (100.0%) |
Property Value to Household Income Ratio in Holbrook
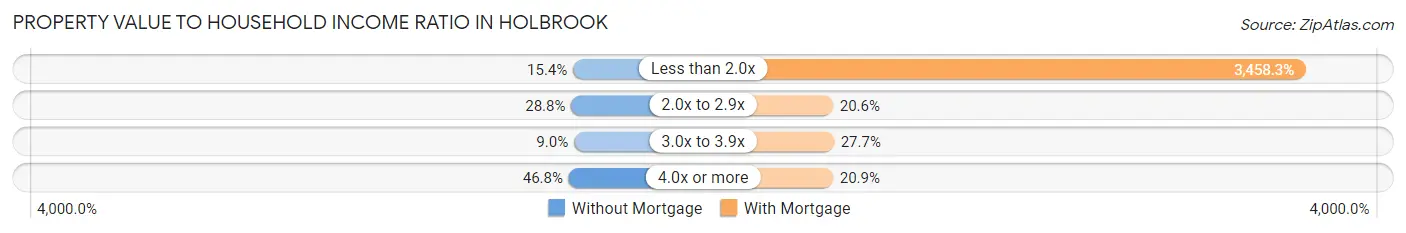
| Value-to-Income Ratio | Without Mortgage | With Mortgage |
| Less than 2.0x | 401 (15.4%) | 154,449 (3,458.3%) |
| 2.0x to 2.9x | 749 (28.8%) | 921 (20.6%) |
| 3.0x to 3.9x | 235 (9.0%) | 1,239 (27.7%) |
| 4.0x or more | 1,219 (46.8%) | 935 (20.9%) |
| Total | 2,604 (100.0%) | 4,466 (100.0%) |
Real Estate Taxes by Mortgage Status in Holbrook
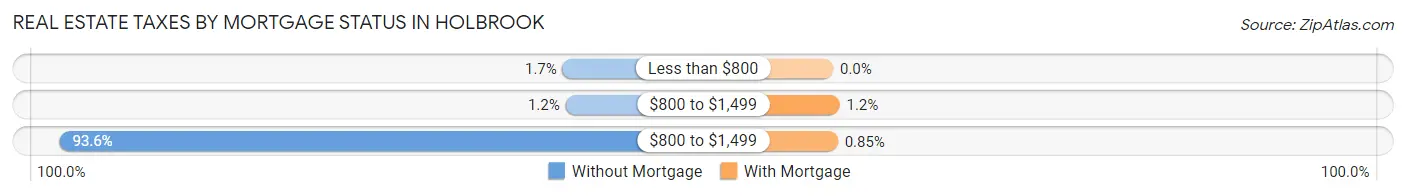
| Property Taxes | Without Mortgage | With Mortgage |
| Less than $800 | 45 (1.7%) | 0 (0.0%) |
| $800 to $1,499 | 31 (1.2%) | 53 (1.2%) |
| $800 to $1,499 | 2,438 (93.6%) | 38 (0.9%) |
| Total | 2,604 (100.0%) | 4,466 (100.0%) |
Health & Disability in Holbrook
Health Insurance Coverage by Age in Holbrook
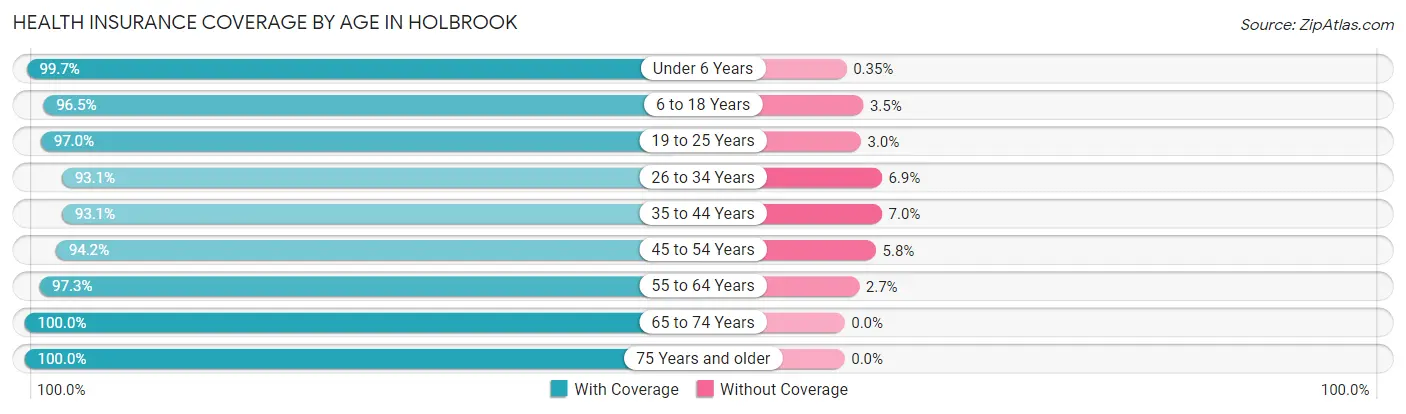
| Age Bracket | With Coverage | Without Coverage |
| Under 6 Years | 1,733 (99.7%) | 6 (0.4%) |
| 6 to 18 Years | 4,293 (96.5%) | 155 (3.5%) |
| 19 to 25 Years | 2,463 (97.0%) | 77 (3.0%) |
| 26 to 34 Years | 2,661 (93.1%) | 198 (6.9%) |
| 35 to 44 Years | 3,333 (93.0%) | 249 (7.0%) |
| 45 to 54 Years | 3,597 (94.2%) | 223 (5.8%) |
| 55 to 64 Years | 3,846 (97.3%) | 107 (2.7%) |
| 65 to 74 Years | 2,555 (100.0%) | 0 (0.0%) |
| 75 Years and older | 1,673 (100.0%) | 0 (0.0%) |
| Total | 26,154 (96.3%) | 1,015 (3.7%) |
Health Insurance Coverage by Citizenship Status in Holbrook
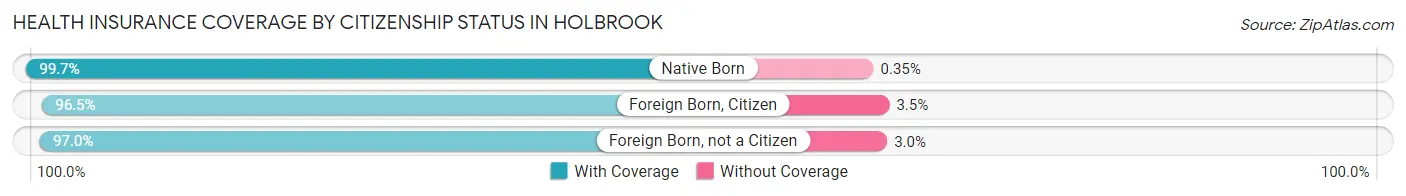
| Citizenship Status | With Coverage | Without Coverage |
| Native Born | 1,733 (99.7%) | 6 (0.4%) |
| Foreign Born, Citizen | 4,293 (96.5%) | 155 (3.5%) |
| Foreign Born, not a Citizen | 2,463 (97.0%) | 77 (3.0%) |
Health Insurance Coverage by Household Income in Holbrook
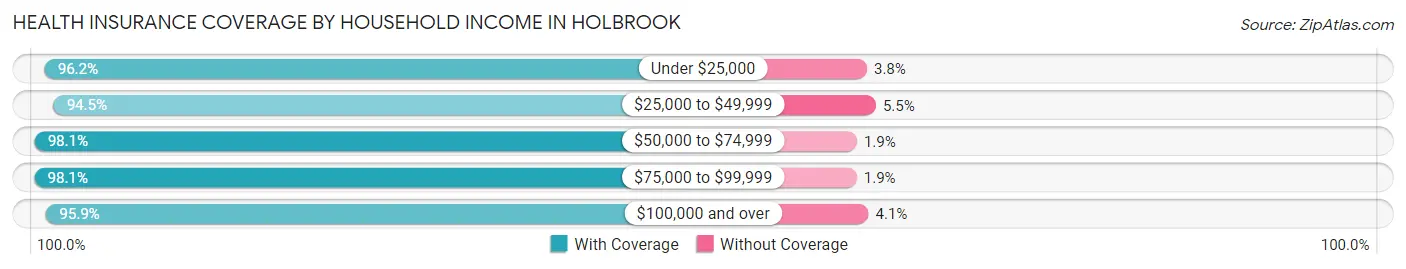
| Household Income | With Coverage | Without Coverage |
| Under $25,000 | 1,218 (96.2%) | 48 (3.8%) |
| $25,000 to $49,999 | 1,022 (94.5%) | 59 (5.5%) |
| $50,000 to $74,999 | 2,111 (98.1%) | 41 (1.9%) |
| $75,000 to $99,999 | 2,557 (98.1%) | 49 (1.9%) |
| $100,000 and over | 19,159 (95.9%) | 817 (4.1%) |
Public vs Private Health Insurance Coverage by Age in Holbrook
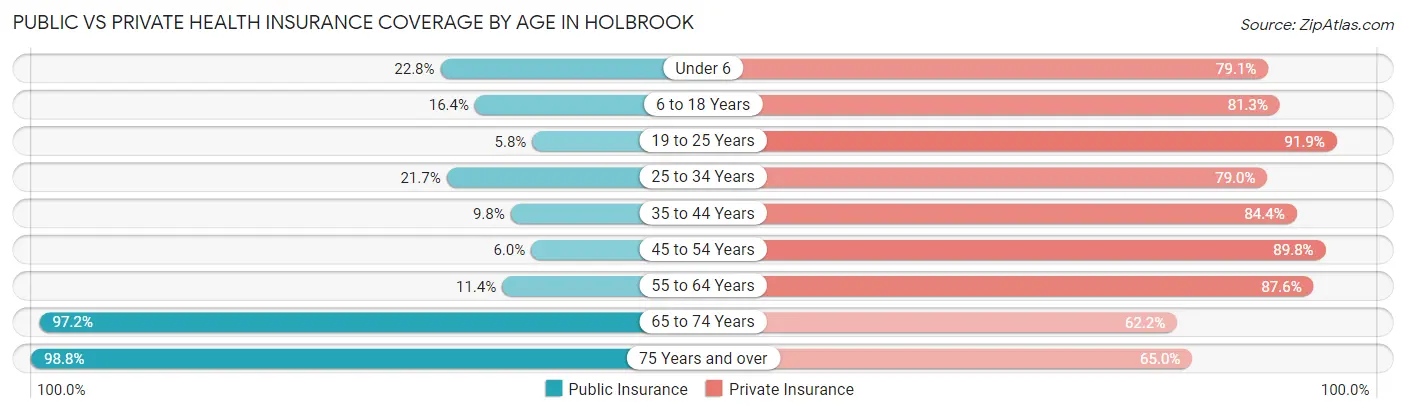
| Age Bracket | Public Insurance | Private Insurance |
| Under 6 | 397 (22.8%) | 1,376 (79.1%) |
| 6 to 18 Years | 731 (16.4%) | 3,616 (81.3%) |
| 19 to 25 Years | 147 (5.8%) | 2,333 (91.8%) |
| 25 to 34 Years | 620 (21.7%) | 2,258 (79.0%) |
| 35 to 44 Years | 351 (9.8%) | 3,023 (84.4%) |
| 45 to 54 Years | 229 (6.0%) | 3,429 (89.8%) |
| 55 to 64 Years | 450 (11.4%) | 3,461 (87.5%) |
| 65 to 74 Years | 2,484 (97.2%) | 1,590 (62.2%) |
| 75 Years and over | 1,653 (98.8%) | 1,088 (65.0%) |
| Total | 7,062 (26.0%) | 22,174 (81.6%) |
Disability Status by Sex by Age in Holbrook
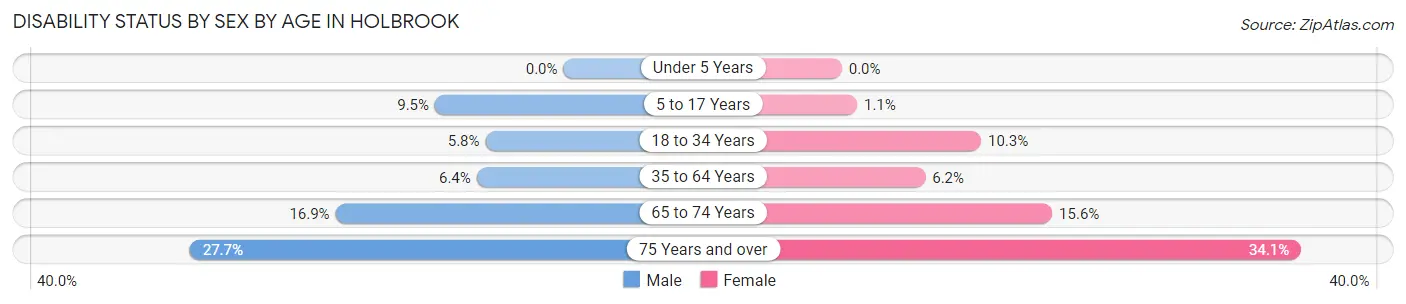
| Age Bracket | Male | Female |
| Under 5 Years | 0 (0.0%) | 0 (0.0%) |
| 5 to 17 Years | 189 (9.5%) | 28 (1.1%) |
| 18 to 34 Years | 163 (5.8%) | 293 (10.3%) |
| 35 to 64 Years | 366 (6.4%) | 352 (6.2%) |
| 65 to 74 Years | 154 (16.9%) | 257 (15.6%) |
| 75 Years and over | 198 (27.7%) | 327 (34.1%) |
Disability Class by Sex by Age in Holbrook
Disability Class: Hearing Difficulty
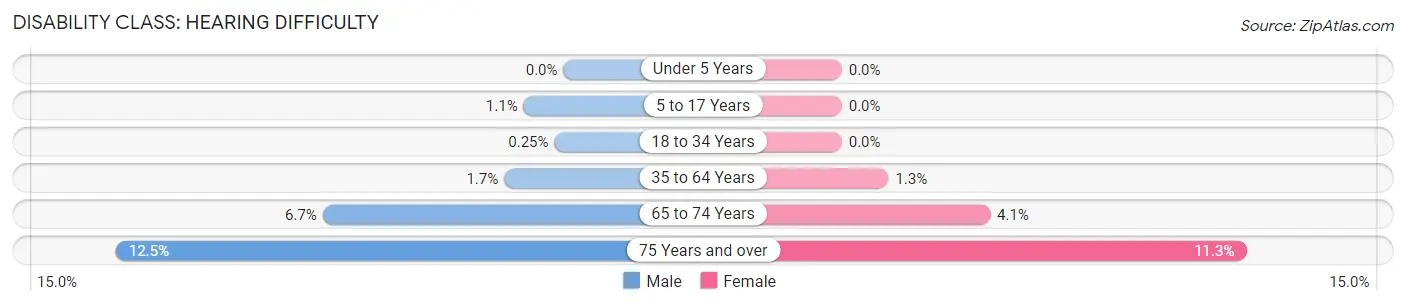
| Age Bracket | Male | Female |
| Under 5 Years | 0 (0.0%) | 0 (0.0%) |
| 5 to 17 Years | 22 (1.1%) | 0 (0.0%) |
| 18 to 34 Years | 7 (0.3%) | 0 (0.0%) |
| 35 to 64 Years | 94 (1.7%) | 74 (1.3%) |
| 65 to 74 Years | 61 (6.7%) | 68 (4.1%) |
| 75 Years and over | 89 (12.5%) | 108 (11.3%) |
Disability Class: Vision Difficulty
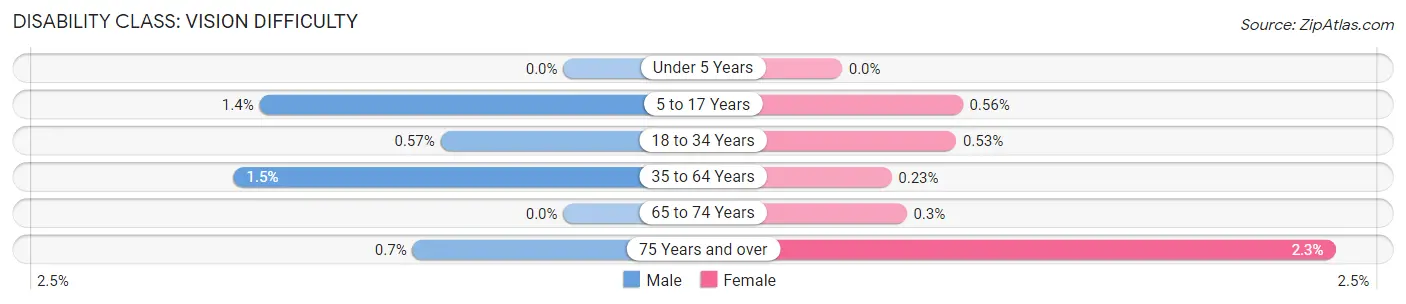
| Age Bracket | Male | Female |
| Under 5 Years | 0 (0.0%) | 0 (0.0%) |
| 5 to 17 Years | 28 (1.4%) | 14 (0.6%) |
| 18 to 34 Years | 16 (0.6%) | 15 (0.5%) |
| 35 to 64 Years | 87 (1.5%) | 13 (0.2%) |
| 65 to 74 Years | 0 (0.0%) | 5 (0.3%) |
| 75 Years and over | 5 (0.7%) | 22 (2.3%) |
Disability Class: Cognitive Difficulty
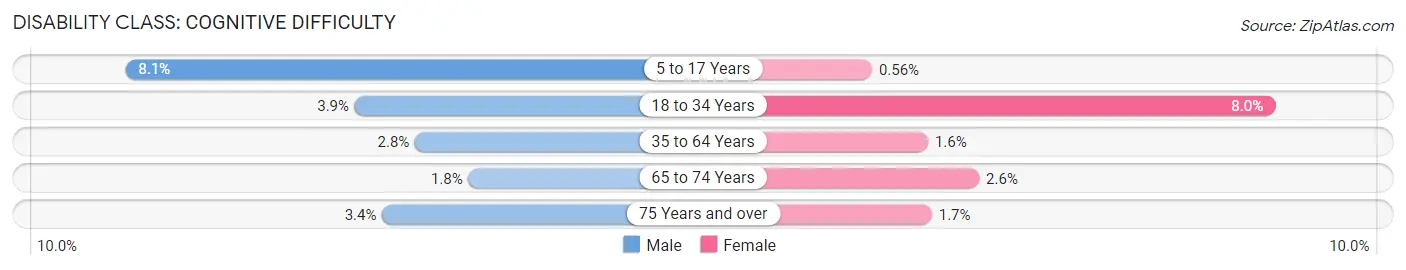
| Age Bracket | Male | Female |
| 5 to 17 Years | 161 (8.1%) | 14 (0.6%) |
| 18 to 34 Years | 109 (3.9%) | 228 (8.0%) |
| 35 to 64 Years | 156 (2.8%) | 91 (1.6%) |
| 65 to 74 Years | 16 (1.8%) | 42 (2.5%) |
| 75 Years and over | 24 (3.4%) | 16 (1.7%) |
Disability Class: Ambulatory Difficulty
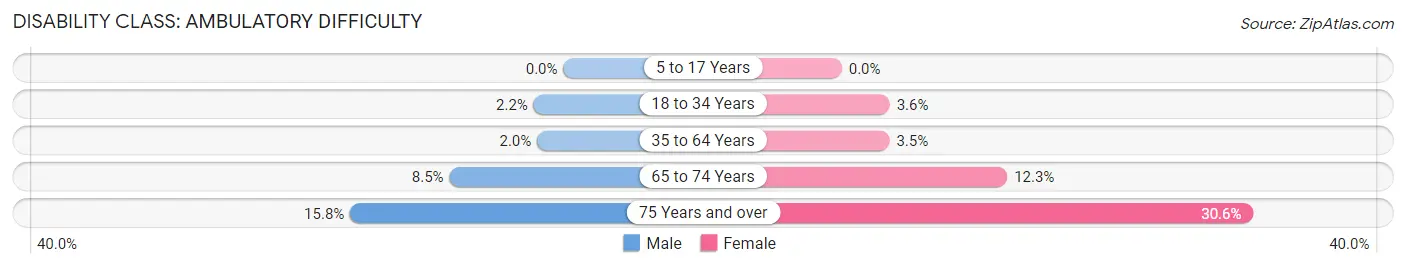
| Age Bracket | Male | Female |
| 5 to 17 Years | 0 (0.0%) | 0 (0.0%) |
| 18 to 34 Years | 62 (2.2%) | 101 (3.6%) |
| 35 to 64 Years | 111 (1.9%) | 201 (3.5%) |
| 65 to 74 Years | 77 (8.5%) | 202 (12.3%) |
| 75 Years and over | 113 (15.8%) | 293 (30.5%) |
Disability Class: Self-Care Difficulty
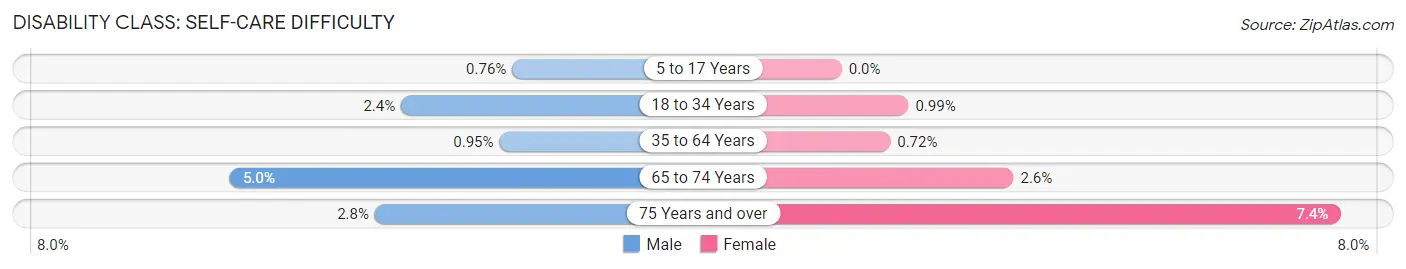
| Age Bracket | Male | Female |
| 5 to 17 Years | 15 (0.8%) | 0 (0.0%) |
| 18 to 34 Years | 68 (2.4%) | 28 (1.0%) |
| 35 to 64 Years | 54 (0.9%) | 41 (0.7%) |
| 65 to 74 Years | 45 (5.0%) | 42 (2.5%) |
| 75 Years and over | 20 (2.8%) | 71 (7.4%) |
Technology Access in Holbrook
Computing Device Access in Holbrook
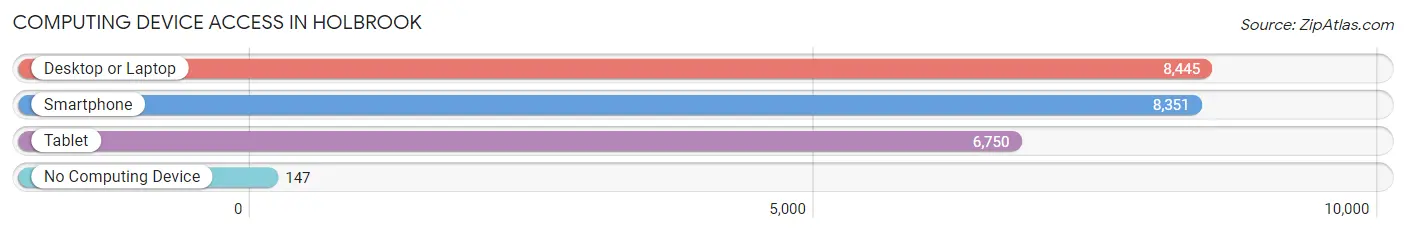
| Device Type | # Households | % Households |
| Desktop or Laptop | 8,445 | 93.2% |
| Smartphone | 8,351 | 92.2% |
| Tablet | 6,750 | 74.5% |
| No Computing Device | 147 | 1.6% |
| Total | 9,059 | 100.0% |
Internet Access in Holbrook
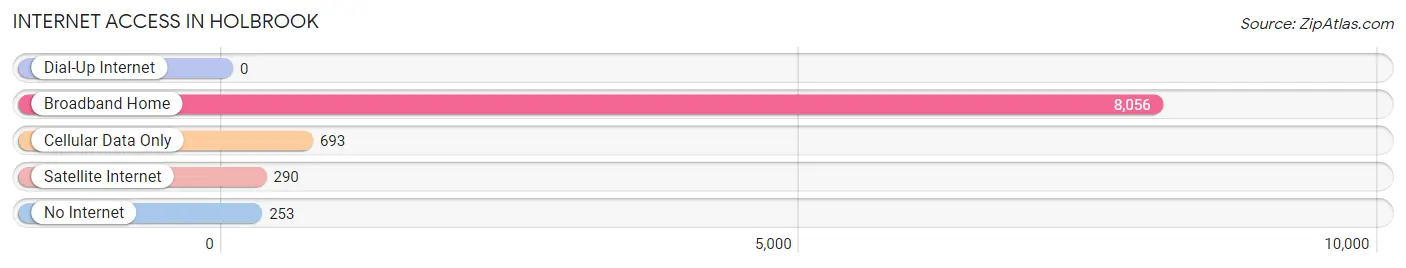
| Internet Type | # Households | % Households |
| Dial-Up Internet | 0 | 0.0% |
| Broadband Home | 8,056 | 88.9% |
| Cellular Data Only | 693 | 7.6% |
| Satellite Internet | 290 | 3.2% |
| No Internet | 253 | 2.8% |
| Total | 9,059 | 100.0% |
Holbrook Summary
Holbrook is a hamlet located in the Town of Islip in Suffolk County, New York. It is situated on the south shore of Long Island, approximately 50 miles east of New York City. The hamlet is bordered by the hamlets of Ronkonkoma to the west, Bohemia to the east, and Holtsville to the north. Holbrook is home to a population of approximately 11,000 people.
History
The area that is now Holbrook was originally inhabited by the Secatogue Indians, a branch of the Algonquin tribe. The first European settlers arrived in the area in the late 1600s, and the hamlet was officially established in 1790. The hamlet was named after the Holbrook family, who were among the first settlers in the area.
In the late 1800s, Holbrook began to develop as a farming community. The hamlet was home to several farms, as well as a number of small businesses. In the early 1900s, the Long Island Rail Road opened a station in Holbrook, which helped to spur the growth of the hamlet.
In the 1950s, Holbrook began to experience a population boom as people moved to the area from New York City. This influx of people led to the development of new housing developments and businesses.
Geography
Holbrook is located on the south shore of Long Island, approximately 50 miles east of New York City. The hamlet is bordered by the hamlets of Ronkonkoma to the west, Bohemia to the east, and Holtsville to the north. Holbrook is situated on an area of flat terrain, with an elevation of approximately 50 feet above sea level.
The hamlet is home to several parks, including Holbrook Pond Park, Holbrook Heritage Park, and Holbrook Beach Park. Holbrook Pond Park is a popular spot for fishing, while Holbrook Heritage Park is home to a number of historic buildings. Holbrook Beach Park is a popular spot for swimming and sunbathing.
Economy
Holbrook is home to a number of businesses, including retail stores, restaurants, and professional services. The hamlet is also home to a number of industrial businesses, including a printing company, a plastics manufacturer, and a metal fabrication company.
The hamlet is home to a number of educational institutions, including a public elementary school, a middle school, and a high school. Holbrook is also home to a branch of Suffolk County Community College.
Demographics
As of the 2010 census, Holbrook had a population of 11,000 people. The population is predominantly white (90.3%), with small percentages of African American (3.2%), Asian (2.2%), and Hispanic (2.2%) residents. The median household income in Holbrook is $77,000, and the median home value is $360,000.
Holbrook is a diverse community, with a variety of religious and cultural backgrounds. The hamlet is home to a number of churches, including Catholic, Protestant, and Jewish congregations. Holbrook is also home to a number of cultural organizations, including the Holbrook Historical Society and the Holbrook Arts Council.
Common Questions
What is Per Capita Income in Holbrook?
Per Capita income in Holbrook is $53,279.
What is the Median Family Income in Holbrook?
Median Family Income in Holbrook is $150,143.
What is the Median Household income in Holbrook?
Median Household Income in Holbrook is $140,563.
What is Income or Wage Gap in Holbrook?
Income or Wage Gap in Holbrook is 32.3%.
Women in Holbrook earn 67.7 cents for every dollar earned by a man.
What is Family Income Deficit in Holbrook?
Family Income Deficit in Holbrook is $12,905.
Families that are below poverty line in Holbrook earn $12,905 less on average than the poverty threshold level.
What is Inequality or Gini Index in Holbrook?
Inequality or Gini Index in Holbrook is 0.37.
What is the Total Population of Holbrook?
Total Population of Holbrook is 27,220.
What is the Total Male Population of Holbrook?
Total Male Population of Holbrook is 12,741.
What is the Total Female Population of Holbrook?
Total Female Population of Holbrook is 14,479.
What is the Ratio of Males per 100 Females in Holbrook?
There are 88.00 Males per 100 Females in Holbrook.
What is the Ratio of Females per 100 Males in Holbrook?
There are 113.64 Females per 100 Males in Holbrook.
What is the Median Population Age in Holbrook?
Median Population Age in Holbrook is 40.9 Years.
What is the Average Family Size in Holbrook
Average Family Size in Holbrook is 3.5 People.
What is the Average Household Size in Holbrook
Average Household Size in Holbrook is 3.0 People.
How Large is the Labor Force in Holbrook?
There are 15,184 People in the Labor Forcein in Holbrook.
What is the Percentage of People in the Labor Force in Holbrook?
68.5% of People are in the Labor Force in Holbrook.
What is the Unemployment Rate in Holbrook?
Unemployment Rate in Holbrook is 4.2%.