New City, NY Map & Demographics
New City Map
New City Overview
$61,573
PER CAPITA INCOME
$180,752
AVG FAMILY INCOME
$168,672
AVG HOUSEHOLD INCOME
32.6%
WAGE / INCOME GAP [ % ]
67.4¢/ $1
WAGE / INCOME GAP [ $ ]
0.40
INEQUALITY / GINI INDEX
33,837
TOTAL POPULATION
16,445
MALE POPULATION
17,392
FEMALE POPULATION
94.55
MALES / 100 FEMALES
105.76
FEMALES / 100 MALES
43.3
MEDIAN AGE
3.5
AVG FAMILY SIZE
3.2
AVG HOUSEHOLD SIZE
17,959
LABOR FORCE [ PEOPLE ]
64.8%
PERCENT IN LABOR FORCE
7.2%
UNEMPLOYMENT RATE
New City Zip Codes
New City Area Codes
Income in New City
Income Overview in New City
Per Capita Income in New City is $61,573, while median incomes of families and households are $180,752 and $168,672 respectively.
| Characteristic | Number | Measure |
| Per Capita Income | 33,837 | $61,573 |
| Median Family Income | 8,881 | $180,752 |
| Mean Family Income | 8,881 | $206,168 |
| Median Household Income | 10,523 | $168,672 |
| Mean Household Income | 10,523 | $192,897 |
| Income Deficit | 8,881 | $0 |
| Wage / Income Gap (%) | 33,837 | 32.61% |
| Wage / Income Gap ($) | 33,837 | 67.39¢ per $1 |
| Gini / Inequality Index | 33,837 | 0.40 |
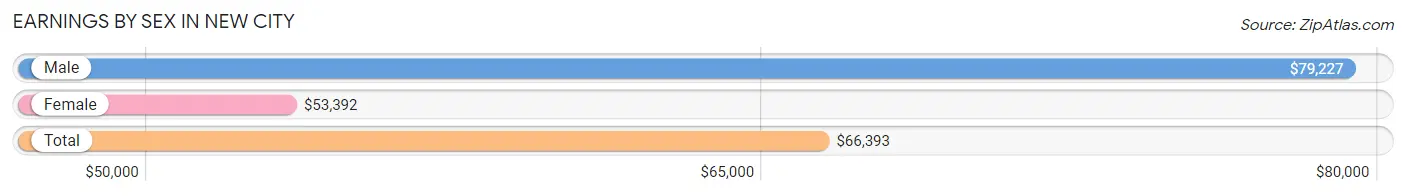
Earnings by Sex in New City
Average Earnings in New City are $66,393, $79,227 for men and $53,392 for women, a difference of 32.6%.
| Sex | Number | Average Earnings |
| Male | 9,697 (51.6%) | $79,227 |
| Female | 9,109 (48.4%) | $53,392 |
| Total | 18,806 (100.0%) | $66,393 |
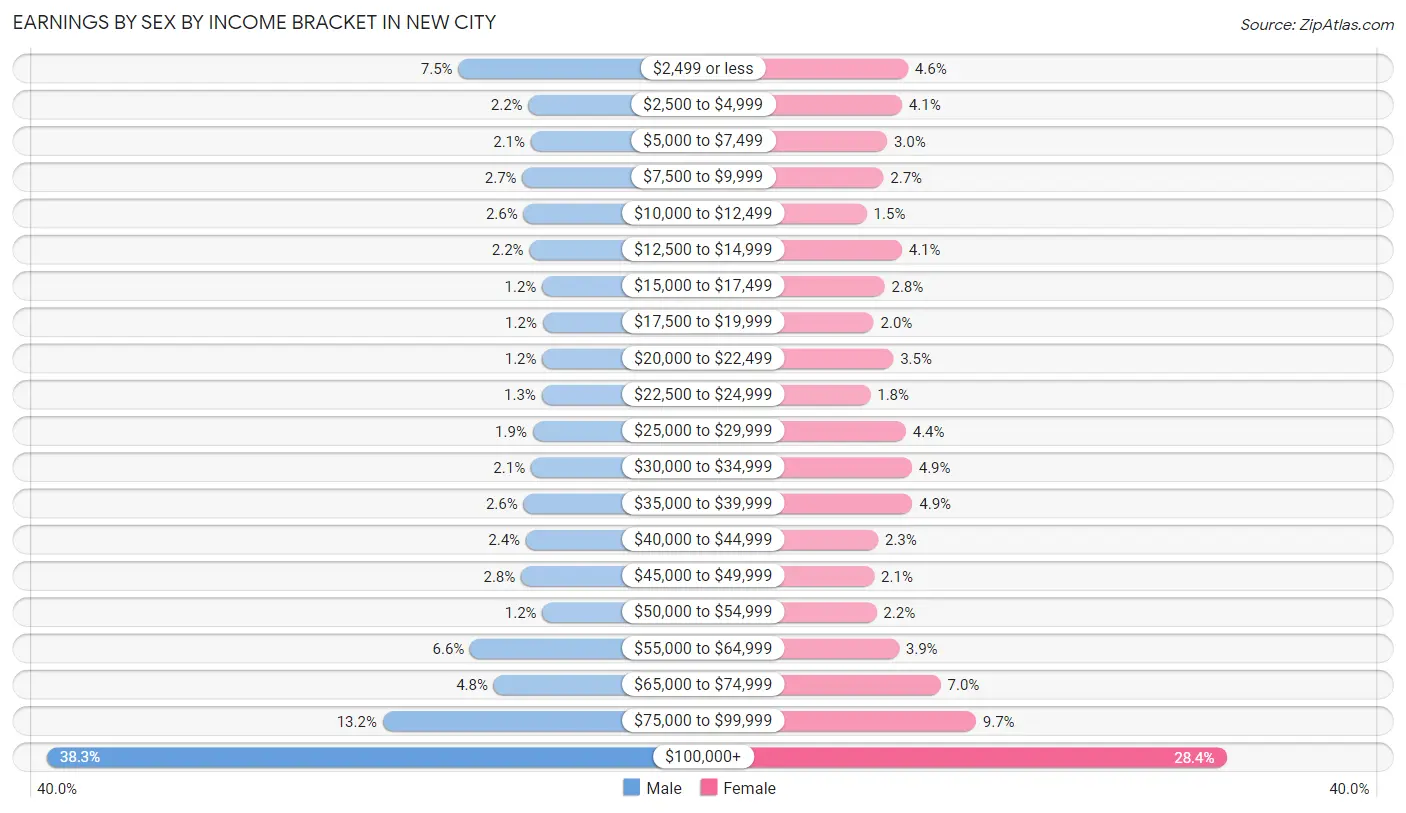
Earnings by Sex by Income Bracket in New City
The most common earnings brackets in New City are $100,000+ for men (3,717 | 38.3%) and $100,000+ for women (2,591 | 28.4%).
| Income | Male | Female |
| $2,499 or less | 726 (7.5%) | 417 (4.6%) |
| $2,500 to $4,999 | 217 (2.2%) | 376 (4.1%) |
| $5,000 to $7,499 | 200 (2.1%) | 274 (3.0%) |
| $7,500 to $9,999 | 261 (2.7%) | 250 (2.7%) |
| $10,000 to $12,499 | 253 (2.6%) | 136 (1.5%) |
| $12,500 to $14,999 | 210 (2.2%) | 375 (4.1%) |
| $15,000 to $17,499 | 117 (1.2%) | 258 (2.8%) |
| $17,500 to $19,999 | 113 (1.2%) | 183 (2.0%) |
| $20,000 to $22,499 | 116 (1.2%) | 317 (3.5%) |
| $22,500 to $24,999 | 121 (1.3%) | 160 (1.8%) |
| $25,000 to $29,999 | 186 (1.9%) | 403 (4.4%) |
| $30,000 to $34,999 | 199 (2.1%) | 444 (4.9%) |
| $35,000 to $39,999 | 253 (2.6%) | 447 (4.9%) |
| $40,000 to $44,999 | 236 (2.4%) | 213 (2.3%) |
| $45,000 to $49,999 | 271 (2.8%) | 187 (2.1%) |
| $50,000 to $54,999 | 115 (1.2%) | 202 (2.2%) |
| $55,000 to $64,999 | 641 (6.6%) | 355 (3.9%) |
| $65,000 to $74,999 | 469 (4.8%) | 640 (7.0%) |
| $75,000 to $99,999 | 1,276 (13.2%) | 881 (9.7%) |
| $100,000+ | 3,717 (38.3%) | 2,591 (28.4%) |
| Total | 9,697 (100.0%) | 9,109 (100.0%) |
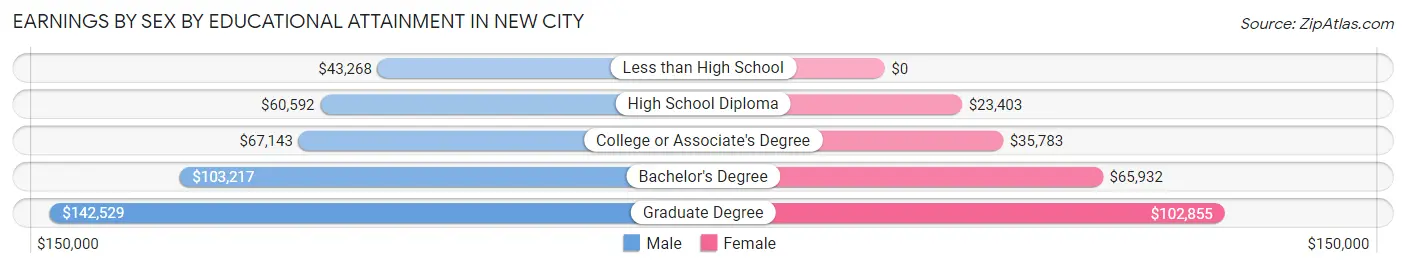
Earnings by Sex by Educational Attainment in New City
Average earnings in New City are $93,339 for men and $67,086 for women, a difference of 28.1%. Men with an educational attainment of graduate degree enjoy the highest average annual earnings of $142,529, while those with less than high school education earn the least with $43,268. Women with an educational attainment of graduate degree earn the most with the average annual earnings of $102,855, while those with high school diploma education have the smallest earnings of $23,403.
| Educational Attainment | Male Income | Female Income |
| Less than High School | $43,268 | $0 |
| High School Diploma | $60,592 | $23,403 |
| College or Associate's Degree | $67,143 | $35,783 |
| Bachelor's Degree | $103,217 | $65,932 |
| Graduate Degree | $142,529 | $102,855 |
| Total | $93,339 | $67,086 |
Family Income in New City
Family Income Brackets in New City
According to the New City family income data, there are 3,854 families falling into the $200,000+ income range, which is the most common income bracket and makes up 43.4% of all families. Conversely, the less than $10,000 income bracket is the least frequent group with only 71 families (0.8%) belonging to this category.
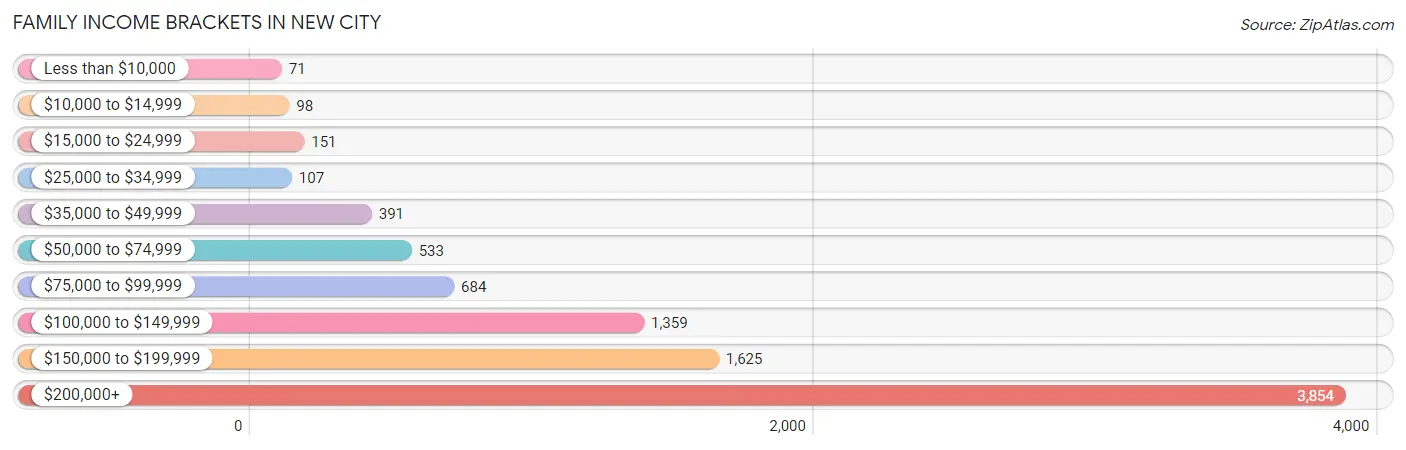
| Income Bracket | # Families | % Families |
| Less than $10,000 | 71 | 0.8% |
| $10,000 to $14,999 | 98 | 1.1% |
| $15,000 to $24,999 | 151 | 1.7% |
| $25,000 to $34,999 | 107 | 1.2% |
| $35,000 to $49,999 | 391 | 4.4% |
| $50,000 to $74,999 | 533 | 6.0% |
| $75,000 to $99,999 | 684 | 7.7% |
| $100,000 to $149,999 | 1,359 | 15.3% |
| $150,000 to $199,999 | 1,625 | 18.3% |
| $200,000+ | 3,854 | 43.4% |
Family Income by Famaliy Size in New City
5-person families (1,024 | 11.5%) account for the highest median family income in New City with $234,712 per family, while 2-person families (3,345 | 37.7%) have the highest median income of $68,576 per family member.
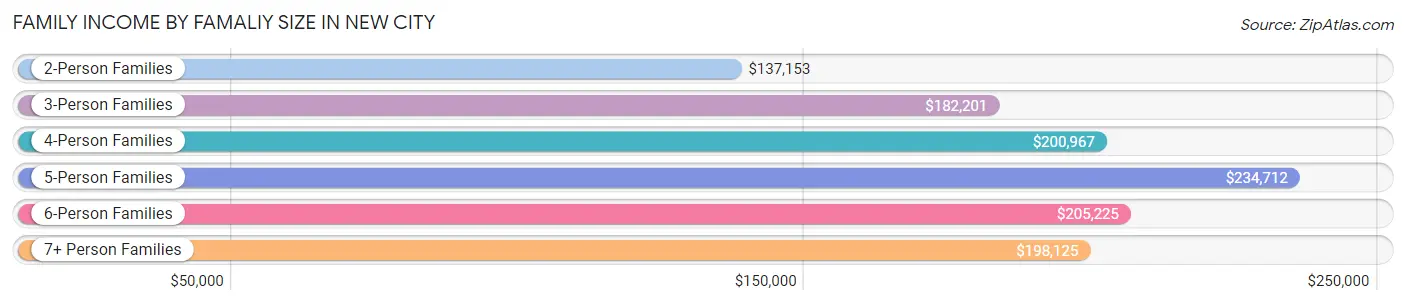
| Income Bracket | # Families | Median Income |
| 2-Person Families | 3,345 (37.7%) | $137,153 |
| 3-Person Families | 1,943 (21.9%) | $182,201 |
| 4-Person Families | 1,994 (22.5%) | $200,967 |
| 5-Person Families | 1,024 (11.5%) | $234,712 |
| 6-Person Families | 231 (2.6%) | $205,225 |
| 7+ Person Families | 344 (3.9%) | $198,125 |
| Total | 8,881 (100.0%) | $180,752 |
Family Income by Number of Earners in New City
The median family income in New City is $180,752, with families comprising 3+ earners (1,910) having the highest median family income of $216,250, while families with no earners (1,079) have the lowest median family income of $97,962, accounting for 21.5% and 12.1% of families, respectively.
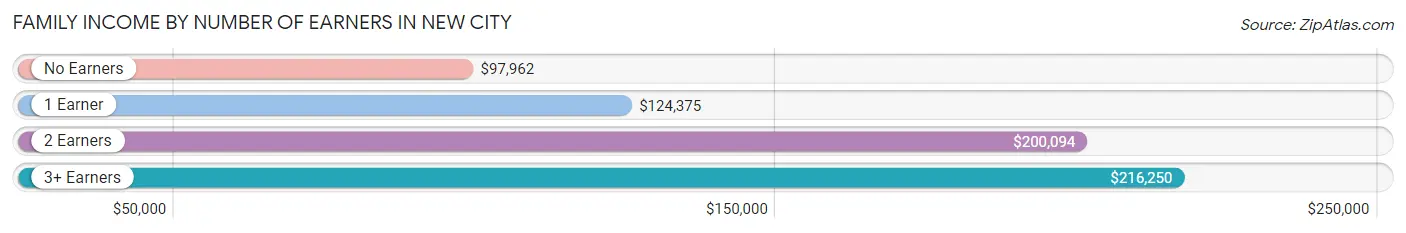
| Number of Earners | # Families | Median Income |
| No Earners | 1,079 (12.1%) | $97,962 |
| 1 Earner | 1,873 (21.1%) | $124,375 |
| 2 Earners | 4,019 (45.3%) | $200,094 |
| 3+ Earners | 1,910 (21.5%) | $216,250 |
| Total | 8,881 (100.0%) | $180,752 |
Household Income in New City
Household Income Brackets in New City
With 4,093 households falling in the category, the $200,000+ income range is the most frequent in New City, accounting for 38.9% of all households. In contrast, only 116 households (1.1%) fall into the $10,000 to $14,999 income bracket, making it the least populous group.
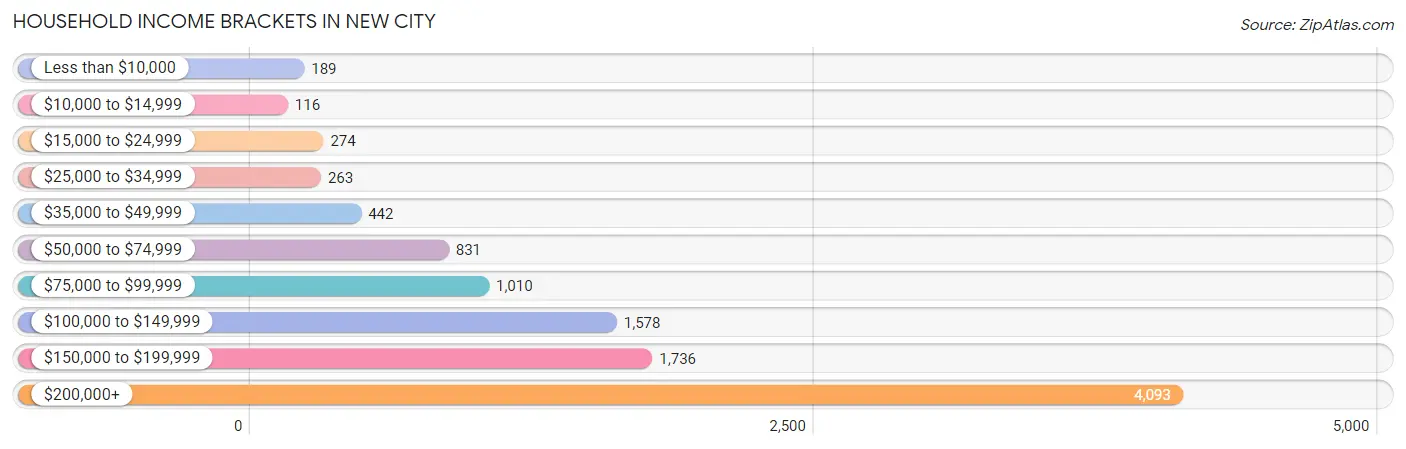
| Income Bracket | # Households | % Households |
| Less than $10,000 | 189 | 1.8% |
| $10,000 to $14,999 | 116 | 1.1% |
| $15,000 to $24,999 | 274 | 2.6% |
| $25,000 to $34,999 | 263 | 2.5% |
| $35,000 to $49,999 | 442 | 4.2% |
| $50,000 to $74,999 | 831 | 7.9% |
| $75,000 to $99,999 | 1,010 | 9.6% |
| $100,000 to $149,999 | 1,578 | 15.0% |
| $150,000 to $199,999 | 1,736 | 16.5% |
| $200,000+ | 4,093 | 38.9% |
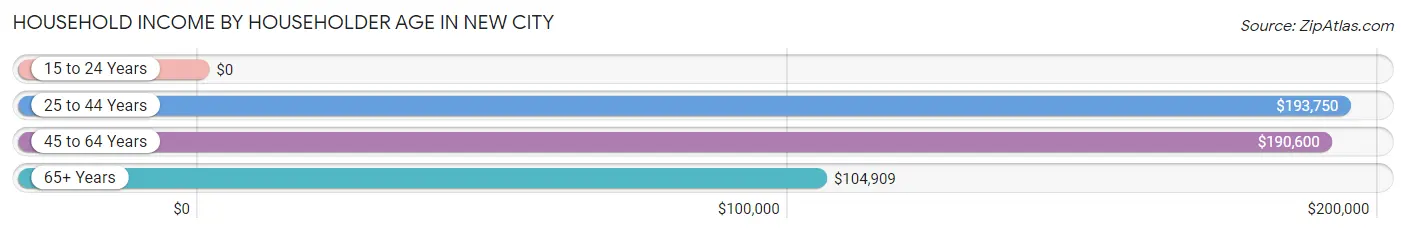
Household Income by Householder Age in New City
The median household income in New City is $168,672, with the highest median household income of $193,750 found in the 25 to 44 years age bracket for the primary householder. A total of 2,114 households (20.1%) fall into this category.
| Income Bracket | # Households | Median Income |
| 15 to 24 Years | 0 (0.0%) | $0 |
| 25 to 44 Years | 2,114 (20.1%) | $193,750 |
| 45 to 64 Years | 4,798 (45.6%) | $190,600 |
| 65+ Years | 3,611 (34.3%) | $104,909 |
| Total | 10,523 (100.0%) | $168,672 |
Poverty in New City
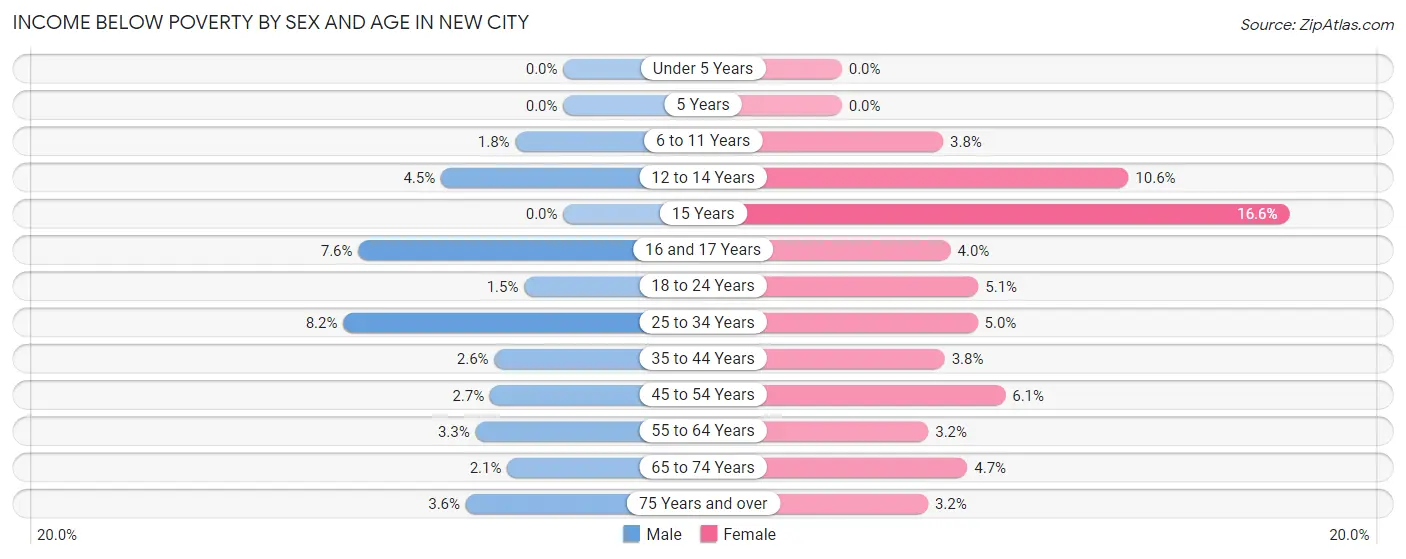
Income Below Poverty by Sex and Age in New City
With 3.2% poverty level for males and 4.4% for females among the residents of New City, 25 to 34 year old males and 15 year old females are the most vulnerable to poverty, with 132 males (8.2%) and 45 females (16.6%) in their respective age groups living below the poverty level.
| Age Bracket | Male | Female |
| Under 5 Years | 0 (0.0%) | 0 (0.0%) |
| 5 Years | 0 (0.0%) | 0 (0.0%) |
| 6 to 11 Years | 21 (1.8%) | 43 (3.8%) |
| 12 to 14 Years | 27 (4.5%) | 60 (10.6%) |
| 15 Years | 0 (0.0%) | 45 (16.6%) |
| 16 and 17 Years | 37 (7.6%) | 24 (4.0%) |
| 18 to 24 Years | 22 (1.5%) | 60 (5.1%) |
| 25 to 34 Years | 132 (8.2%) | 83 (5.0%) |
| 35 to 44 Years | 50 (2.6%) | 84 (3.8%) |
| 45 to 54 Years | 61 (2.7%) | 140 (6.1%) |
| 55 to 64 Years | 83 (3.3%) | 80 (3.2%) |
| 65 to 74 Years | 39 (2.1%) | 94 (4.7%) |
| 75 Years and over | 44 (3.6%) | 54 (3.2%) |
| Total | 516 (3.2%) | 767 (4.4%) |
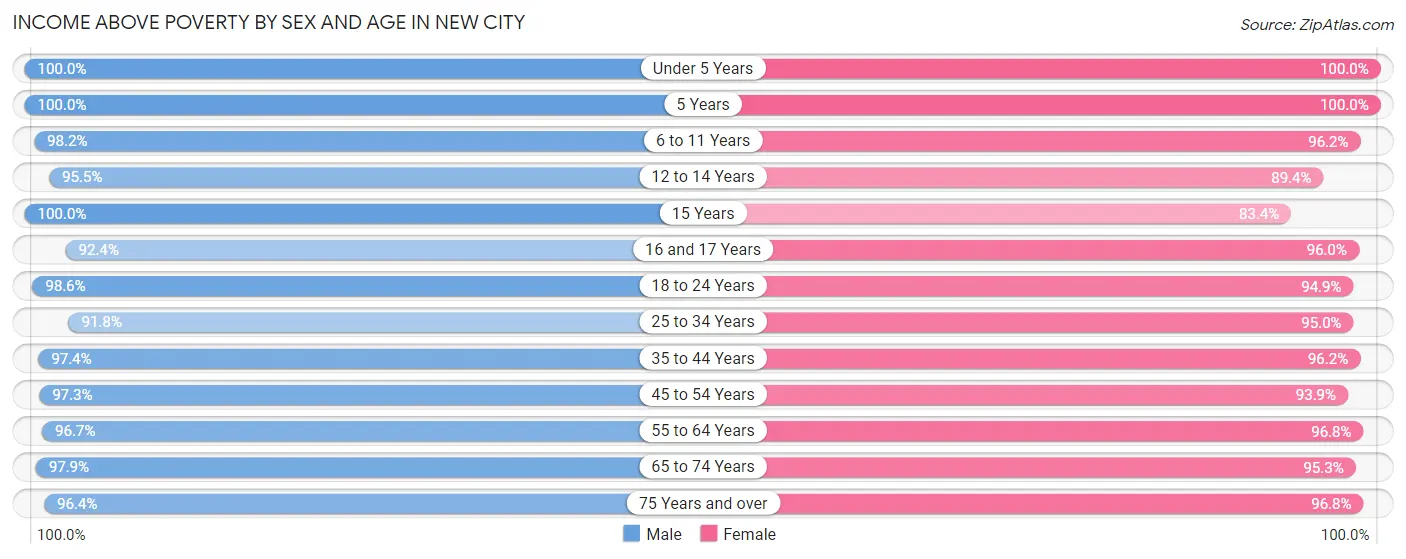
Income Above Poverty by Sex and Age in New City
According to the poverty statistics in New City, males aged under 5 years and females aged under 5 years are the age groups that are most secure financially, with 100.0% of males and 100.0% of females in these age groups living above the poverty line.
| Age Bracket | Male | Female |
| Under 5 Years | 682 (100.0%) | 1,089 (100.0%) |
| 5 Years | 202 (100.0%) | 174 (100.0%) |
| 6 to 11 Years | 1,162 (98.2%) | 1,100 (96.2%) |
| 12 to 14 Years | 568 (95.5%) | 504 (89.4%) |
| 15 Years | 140 (100.0%) | 226 (83.4%) |
| 16 and 17 Years | 449 (92.4%) | 570 (96.0%) |
| 18 to 24 Years | 1,500 (98.6%) | 1,124 (94.9%) |
| 25 to 34 Years | 1,484 (91.8%) | 1,565 (95.0%) |
| 35 to 44 Years | 1,900 (97.4%) | 2,113 (96.2%) |
| 45 to 54 Years | 2,183 (97.3%) | 2,167 (93.9%) |
| 55 to 64 Years | 2,462 (96.7%) | 2,414 (96.8%) |
| 65 to 74 Years | 1,835 (97.9%) | 1,922 (95.3%) |
| 75 Years and over | 1,173 (96.4%) | 1,634 (96.8%) |
| Total | 15,740 (96.8%) | 16,602 (95.6%) |
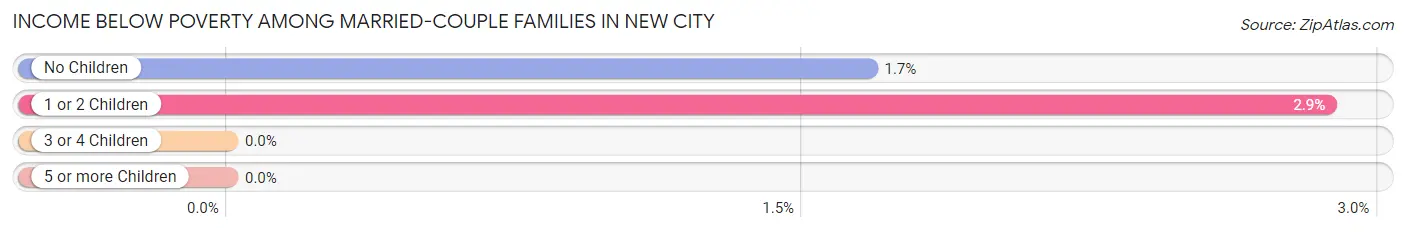
Income Below Poverty Among Married-Couple Families in New City
The poverty statistics for married-couple families in New City show that 1.9% or 146 of the total 7,568 families live below the poverty line. Families with 1 or 2 children have the highest poverty rate of 2.9%, comprising of 72 families. On the other hand, families with 3 or 4 children have the lowest poverty rate of 0.0%, which includes 0 families.
| Children | Above Poverty | Below Poverty |
| No Children | 4,351 (98.3%) | 74 (1.7%) |
| 1 or 2 Children | 2,435 (97.1%) | 72 (2.9%) |
| 3 or 4 Children | 623 (100.0%) | 0 (0.0%) |
| 5 or more Children | 13 (100.0%) | 0 (0.0%) |
| Total | 7,422 (98.1%) | 146 (1.9%) |
Income Below Poverty Among Single-Parent Households in New City
According to the poverty data in New City, 10.0% or 46 single-father households and 11.8% or 101 single-mother households are living below the poverty line. Among single-father households, those with no children have the highest poverty rate, with 46 households (17.1%) experiencing poverty. Likewise, among single-mother households, those with 3 or 4 children have the highest poverty rate, with 50 households (100.0%) falling below the poverty line.
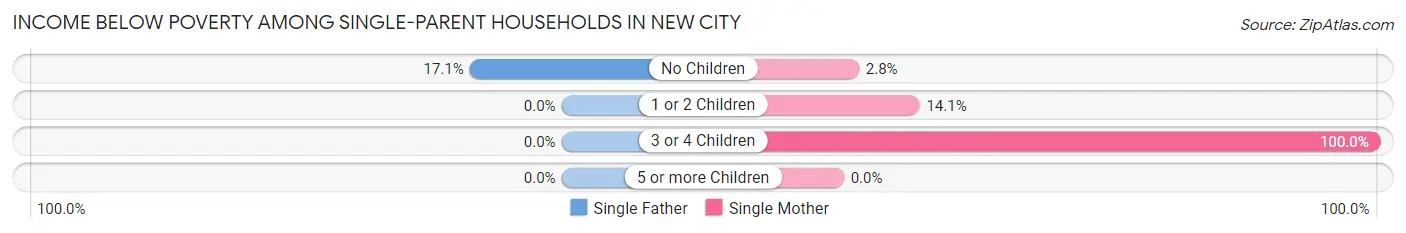
| Children | Single Father | Single Mother |
| No Children | 46 (17.1%) | 15 (2.8%) |
| 1 or 2 Children | 0 (0.0%) | 36 (14.1%) |
| 3 or 4 Children | 0 (0.0%) | 50 (100.0%) |
| 5 or more Children | 0 (0.0%) | 0 (0.0%) |
| Total | 46 (10.0%) | 101 (11.8%) |
Income Below Poverty Among Married-Couple vs Single-Parent Households in New City
The poverty data for New City shows that 146 of the married-couple family households (1.9%) and 147 of the single-parent households (11.2%) are living below the poverty level. Within the married-couple family households, those with 1 or 2 children have the highest poverty rate, with 72 households (2.9%) falling below the poverty line. Among the single-parent households, those with 3 or 4 children have the highest poverty rate, with 50 household (69.4%) living below poverty.
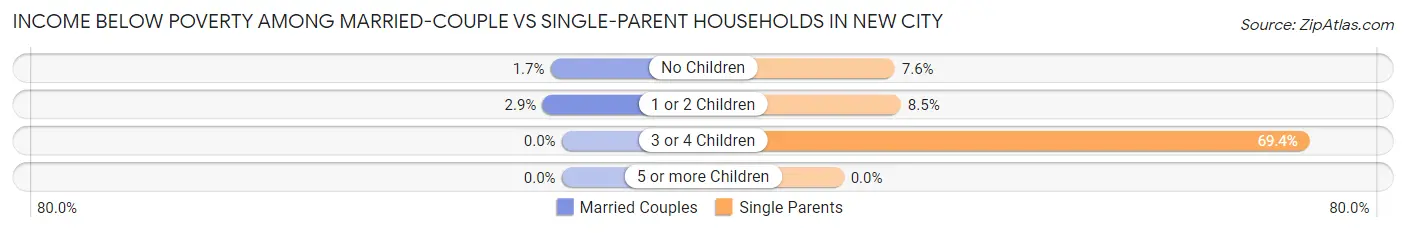
| Children | Married-Couple Families | Single-Parent Households |
| No Children | 74 (1.7%) | 61 (7.6%) |
| 1 or 2 Children | 72 (2.9%) | 36 (8.5%) |
| 3 or 4 Children | 0 (0.0%) | 50 (69.4%) |
| 5 or more Children | 0 (0.0%) | 0 (0.0%) |
| Total | 146 (1.9%) | 147 (11.2%) |
Race in New City
The most populous races in New City are White / Caucasian (22,375 | 66.1%), Hispanic or Latino (5,058 | 14.9%), and Asian (4,705 | 13.9%).
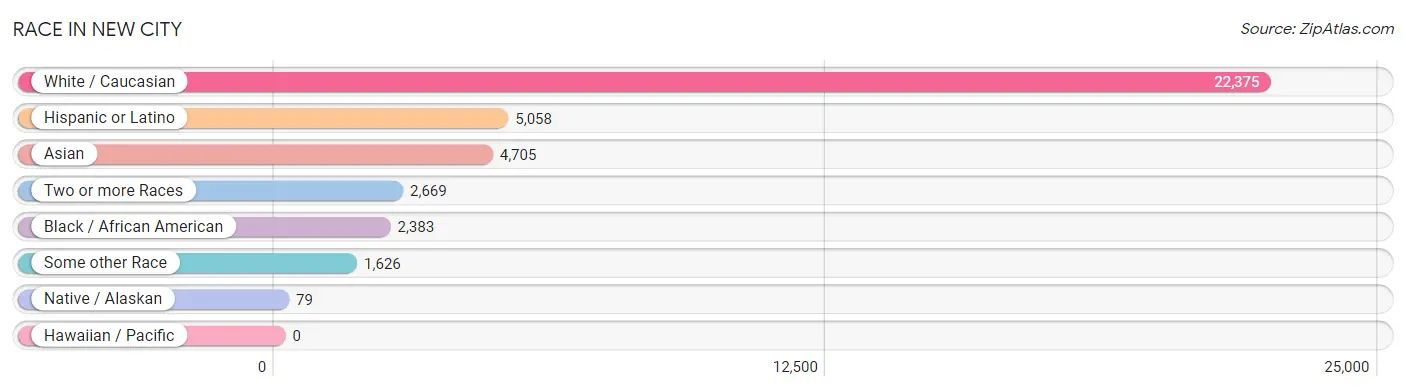
| Race | # Population | % Population |
| Asian | 4,705 | 13.9% |
| Black / African American | 2,383 | 7.0% |
| Hawaiian / Pacific | 0 | 0.0% |
| Hispanic or Latino | 5,058 | 14.9% |
| Native / Alaskan | 79 | 0.2% |
| White / Caucasian | 22,375 | 66.1% |
| Two or more Races | 2,669 | 7.9% |
| Some other Race | 1,626 | 4.8% |
| Total | 33,837 | 100.0% |
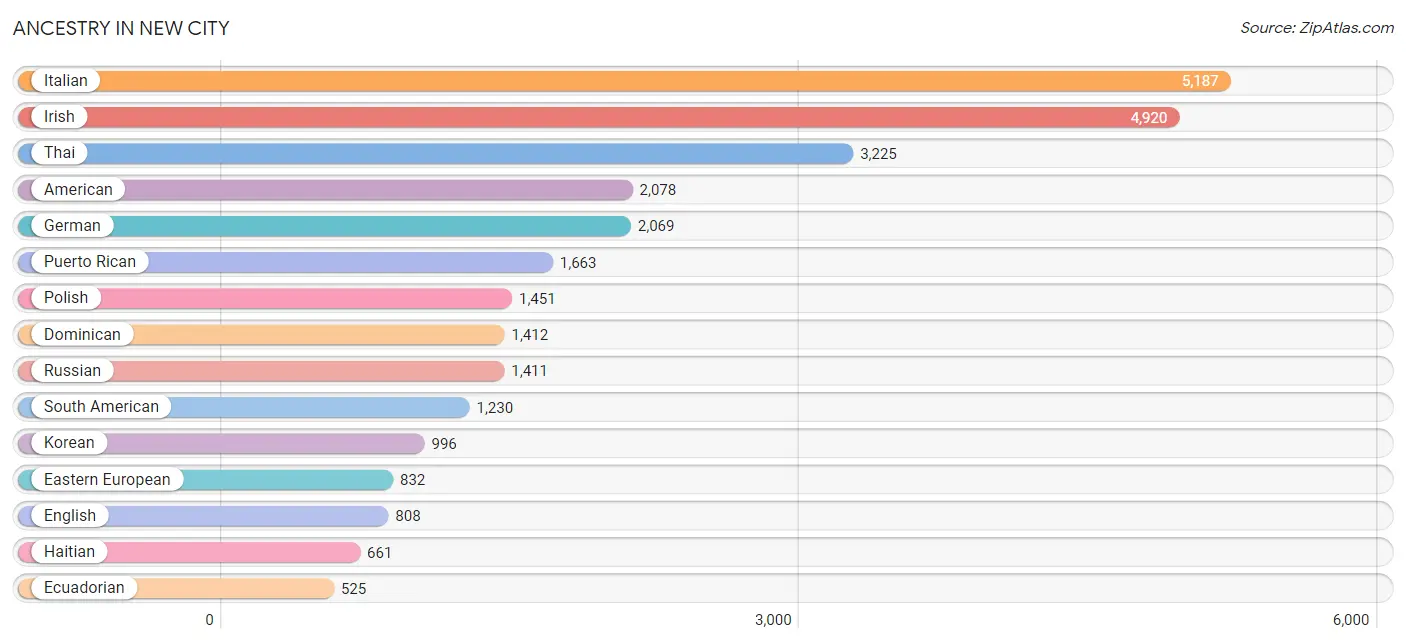
Ancestry in New City
The most populous ancestries reported in New City are Italian (5,187 | 15.3%), Irish (4,920 | 14.5%), Thai (3,225 | 9.5%), American (2,078 | 6.1%), and German (2,069 | 6.1%), together accounting for 51.6% of all New City residents.
| Ancestry | # Population | % Population |
| African | 210 | 0.6% |
| Albanian | 253 | 0.7% |
| American | 2,078 | 6.1% |
| Arab | 185 | 0.5% |
| Argentinean | 176 | 0.5% |
| Australian | 27 | 0.1% |
| Austrian | 284 | 0.8% |
| Bahamian | 17 | 0.1% |
| Barbadian | 24 | 0.1% |
| Basque | 28 | 0.1% |
| Belgian | 20 | 0.1% |
| Belizean | 12 | 0.0% |
| Bhutanese | 39 | 0.1% |
| Bolivian | 14 | 0.0% |
| Brazilian | 32 | 0.1% |
| British | 91 | 0.3% |
| Burmese | 410 | 1.2% |
| Canadian | 53 | 0.2% |
| Cape Verdean | 11 | 0.0% |
| Celtic | 16 | 0.1% |
| Central American | 181 | 0.5% |
| Central American Indian | 12 | 0.0% |
| Cherokee | 25 | 0.1% |
| Chilean | 13 | 0.0% |
| Colombian | 275 | 0.8% |
| Costa Rican | 2 | 0.0% |
| Croatian | 39 | 0.1% |
| Cuban | 203 | 0.6% |
| Czech | 84 | 0.3% |
| Czechoslovakian | 43 | 0.1% |
| Danish | 6 | 0.0% |
| Dominican | 1,412 | 4.2% |
| Dutch | 323 | 0.9% |
| Eastern European | 832 | 2.5% |
| Ecuadorian | 525 | 1.5% |
| Egyptian | 22 | 0.1% |
| English | 808 | 2.4% |
| European | 469 | 1.4% |
| Filipino | 23 | 0.1% |
| Finnish | 21 | 0.1% |
| French | 311 | 0.9% |
| French Canadian | 41 | 0.1% |
| German | 2,069 | 6.1% |
| Ghanaian | 55 | 0.2% |
| Greek | 220 | 0.6% |
| Guatemalan | 8 | 0.0% |
| Guyanese | 29 | 0.1% |
| Haitian | 661 | 1.9% |
| Honduran | 12 | 0.0% |
| Hungarian | 137 | 0.4% |
| Indian (Asian) | 360 | 1.1% |
| Iranian | 10 | 0.0% |
| Iraqi | 26 | 0.1% |
| Irish | 4,920 | 14.5% |
| Israeli | 96 | 0.3% |
| Italian | 5,187 | 15.3% |
| Jamaican | 321 | 0.9% |
| Jordanian | 28 | 0.1% |
| Korean | 996 | 2.9% |
| Latvian | 20 | 0.1% |
| Lithuanian | 78 | 0.2% |
| Maltese | 11 | 0.0% |
| Mexican | 111 | 0.3% |
| Mexican American Indian | 34 | 0.1% |
| Native Hawaiian | 31 | 0.1% |
| Nigerian | 37 | 0.1% |
| Northern European | 10 | 0.0% |
| Norwegian | 59 | 0.2% |
| Peruvian | 227 | 0.7% |
| Polish | 1,451 | 4.3% |
| Portuguese | 177 | 0.5% |
| Puerto Rican | 1,663 | 4.9% |
| Romanian | 316 | 0.9% |
| Russian | 1,411 | 4.2% |
| Salvadoran | 159 | 0.5% |
| Scandinavian | 25 | 0.1% |
| Scotch-Irish | 63 | 0.2% |
| Scottish | 188 | 0.6% |
| Serbian | 10 | 0.0% |
| Slavic | 8 | 0.0% |
| Slovak | 23 | 0.1% |
| Slovene | 9 | 0.0% |
| South American | 1,230 | 3.6% |
| Spaniard | 112 | 0.3% |
| Spanish | 21 | 0.1% |
| Spanish American | 6 | 0.0% |
| Sri Lankan | 29 | 0.1% |
| Subsaharan African | 423 | 1.3% |
| Swedish | 184 | 0.5% |
| Swiss | 286 | 0.9% |
| Syrian | 24 | 0.1% |
| Thai | 3,225 | 9.5% |
| Turkish | 28 | 0.1% |
| Ugandan | 30 | 0.1% |
| Ukrainian | 355 | 1.1% |
| Vietnamese | 72 | 0.2% |
| Welsh | 25 | 0.1% |
| West Indian | 17 | 0.1% | View All 98 Rows |
Immigrants in New City
The most numerous immigrant groups reported in New City came from Asia (3,280 | 9.7%), Latin America (2,759 | 8.2%), South Central Asia (1,925 | 5.7%), Caribbean (1,892 | 5.6%), and India (1,682 | 5.0%), together accounting for 34.1% of all New City residents.
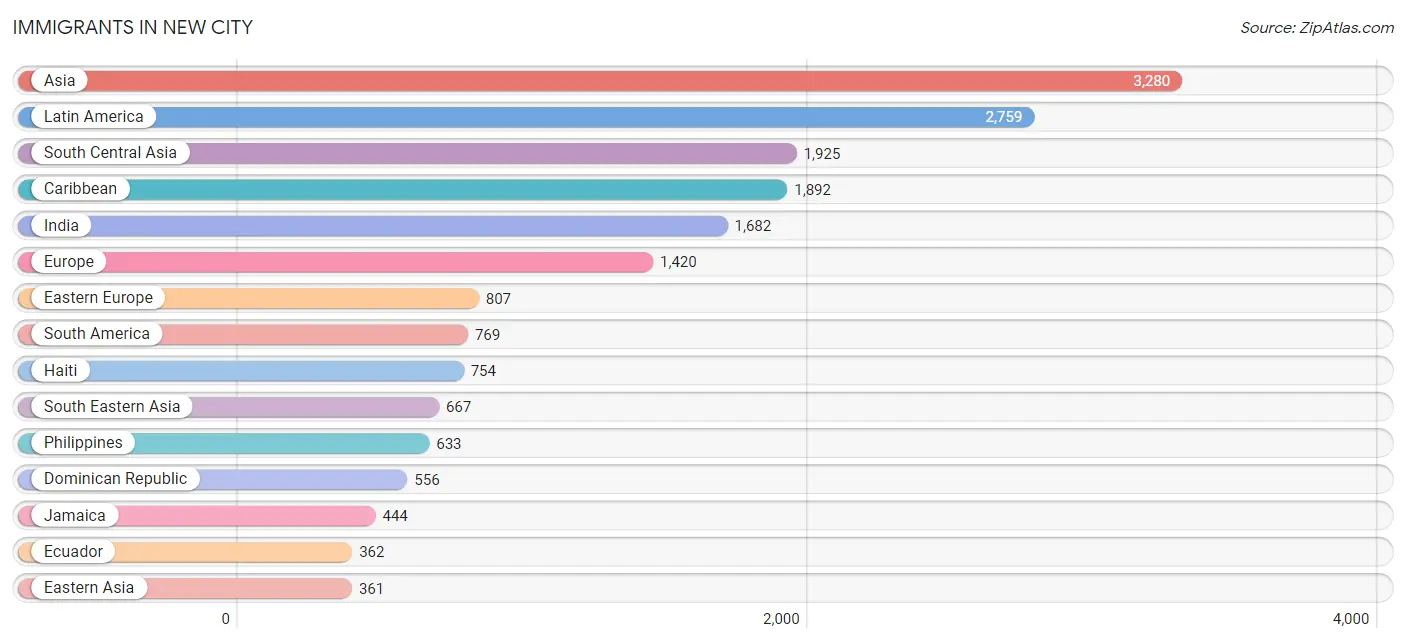
| Immigration Origin | # Population | % Population |
| Africa | 133 | 0.4% |
| Albania | 93 | 0.3% |
| Argentina | 20 | 0.1% |
| Asia | 3,280 | 9.7% |
| Australia | 27 | 0.1% |
| Bangladesh | 50 | 0.2% |
| Barbados | 9 | 0.0% |
| Bolivia | 14 | 0.0% |
| Brazil | 25 | 0.1% |
| Canada | 136 | 0.4% |
| Caribbean | 1,892 | 5.6% |
| Central America | 98 | 0.3% |
| Chile | 7 | 0.0% |
| China | 196 | 0.6% |
| Colombia | 155 | 0.5% |
| Costa Rica | 2 | 0.0% |
| Croatia | 10 | 0.0% |
| Cuba | 81 | 0.2% |
| Czechoslovakia | 29 | 0.1% |
| Dominican Republic | 556 | 1.6% |
| Eastern Africa | 55 | 0.2% |
| Eastern Asia | 361 | 1.1% |
| Eastern Europe | 807 | 2.4% |
| Ecuador | 362 | 1.1% |
| Egypt | 10 | 0.0% |
| El Salvador | 60 | 0.2% |
| England | 79 | 0.2% |
| Europe | 1,420 | 4.2% |
| Germany | 81 | 0.2% |
| Ghana | 55 | 0.2% |
| Greece | 54 | 0.2% |
| Grenada | 31 | 0.1% |
| Guyana | 54 | 0.2% |
| Haiti | 754 | 2.2% |
| Honduras | 12 | 0.0% |
| Hong Kong | 22 | 0.1% |
| India | 1,682 | 5.0% |
| Iraq | 26 | 0.1% |
| Ireland | 197 | 0.6% |
| Israel | 114 | 0.3% |
| Italy | 122 | 0.4% |
| Jamaica | 444 | 1.3% |
| Japan | 10 | 0.0% |
| Jordan | 56 | 0.2% |
| Korea | 155 | 0.5% |
| Latin America | 2,759 | 8.2% |
| Lithuania | 8 | 0.0% |
| Mexico | 24 | 0.1% |
| Moldova | 37 | 0.1% |
| Nigeria | 13 | 0.0% |
| Northern Africa | 10 | 0.0% |
| Northern Europe | 323 | 0.9% |
| Oceania | 27 | 0.1% |
| Pakistan | 174 | 0.5% |
| Peru | 116 | 0.3% |
| Philippines | 633 | 1.9% |
| Poland | 125 | 0.4% |
| Portugal | 14 | 0.0% |
| Romania | 99 | 0.3% |
| Russia | 77 | 0.2% |
| Saudi Arabia | 63 | 0.2% |
| South America | 769 | 2.3% |
| South Central Asia | 1,925 | 5.7% |
| South Eastern Asia | 667 | 2.0% |
| Southern Europe | 201 | 0.6% |
| Spain | 11 | 0.0% |
| Syria | 7 | 0.0% |
| Taiwan | 28 | 0.1% |
| Uganda | 16 | 0.1% |
| Ukraine | 196 | 0.6% |
| Uruguay | 9 | 0.0% |
| Uzbekistan | 19 | 0.1% |
| Venezuela | 7 | 0.0% |
| Vietnam | 34 | 0.1% |
| West Indies | 17 | 0.1% |
| Western Africa | 68 | 0.2% |
| Western Asia | 327 | 1.0% |
| Western Europe | 81 | 0.2% | View All 78 Rows |
Sex and Age in New City
Sex and Age in New City
The most populous age groups in New City are 60 to 64 Years (1,398 | 8.5%) for men and 60 to 64 Years (1,360 | 7.8%) for women.
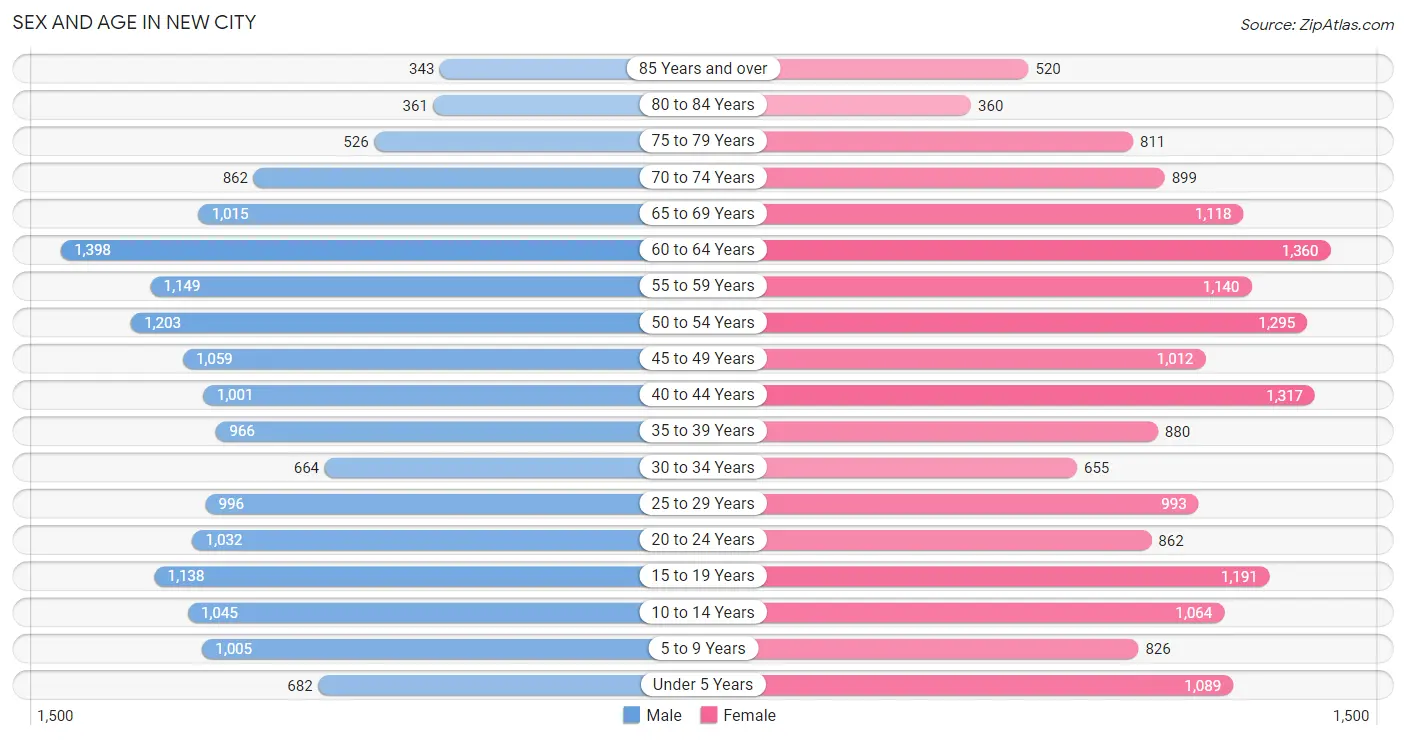
| Age Bracket | Male | Female |
| Under 5 Years | 682 (4.2%) | 1,089 (6.3%) |
| 5 to 9 Years | 1,005 (6.1%) | 826 (4.8%) |
| 10 to 14 Years | 1,045 (6.4%) | 1,064 (6.1%) |
| 15 to 19 Years | 1,138 (6.9%) | 1,191 (6.9%) |
| 20 to 24 Years | 1,032 (6.3%) | 862 (5.0%) |
| 25 to 29 Years | 996 (6.1%) | 993 (5.7%) |
| 30 to 34 Years | 664 (4.0%) | 655 (3.8%) |
| 35 to 39 Years | 966 (5.9%) | 880 (5.1%) |
| 40 to 44 Years | 1,001 (6.1%) | 1,317 (7.6%) |
| 45 to 49 Years | 1,059 (6.4%) | 1,012 (5.8%) |
| 50 to 54 Years | 1,203 (7.3%) | 1,295 (7.4%) |
| 55 to 59 Years | 1,149 (7.0%) | 1,140 (6.6%) |
| 60 to 64 Years | 1,398 (8.5%) | 1,360 (7.8%) |
| 65 to 69 Years | 1,015 (6.2%) | 1,118 (6.4%) |
| 70 to 74 Years | 862 (5.2%) | 899 (5.2%) |
| 75 to 79 Years | 526 (3.2%) | 811 (4.7%) |
| 80 to 84 Years | 361 (2.2%) | 360 (2.1%) |
| 85 Years and over | 343 (2.1%) | 520 (3.0%) |
| Total | 16,445 (100.0%) | 17,392 (100.0%) |
Families and Households in New City
Median Family Size in New City
The median family size in New City is 3.46 persons per family, with married-couple families (7,568 | 85.2%) accounting for the largest median family size of 3.51 persons per family. On the other hand, single male/father families (458 | 5.2%) represent the smallest median family size with 2.90 persons per family.
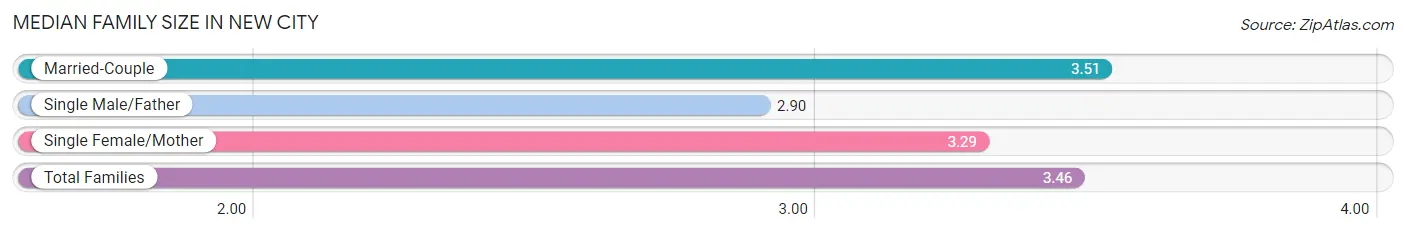
| Family Type | # Families | Family Size |
| Married-Couple | 7,568 (85.2%) | 3.51 |
| Single Male/Father | 458 (5.2%) | 2.90 |
| Single Female/Mother | 855 (9.6%) | 3.29 |
| Total Families | 8,881 (100.0%) | 3.46 |
Median Household Size in New City
The median household size in New City is 3.18 persons per household, with married-couple households (7,568 | 71.9%) accounting for the largest median household size of 3.55 persons per household. non-family households (1,642 | 15.6%) represent the smallest median household size with 1.22 persons per household.
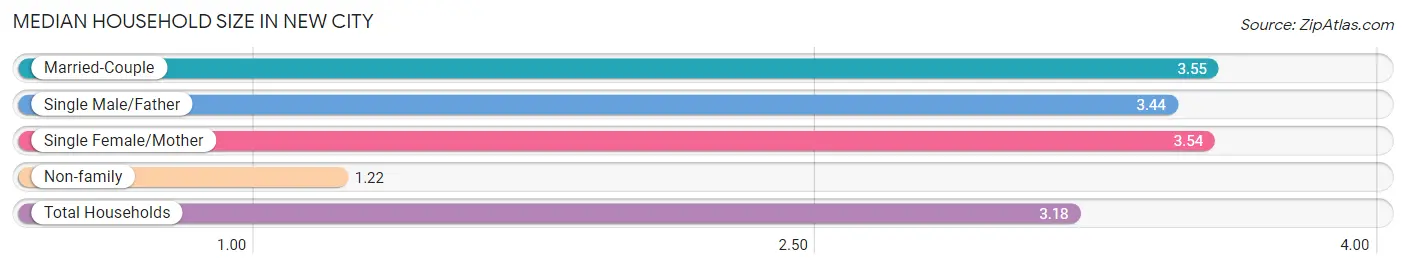
| Household Type | # Households | Household Size |
| Married-Couple | 7,568 (71.9%) | 3.55 |
| Single Male/Father | 458 (4.3%) | 3.44 |
| Single Female/Mother | 855 (8.1%) | 3.54 |
| Non-family | 1,642 (15.6%) | 1.22 |
| Total Households | 10,523 (100.0%) | 3.18 |
Household Size by Marriage Status in New City
Out of a total of 10,523 households in New City, 8,881 (84.4%) are family households, while 1,642 (15.6%) are nonfamily households. The most numerous type of family households are 2-person households, comprising 3,093, and the most common type of nonfamily households are 1-person households, comprising 1,410.
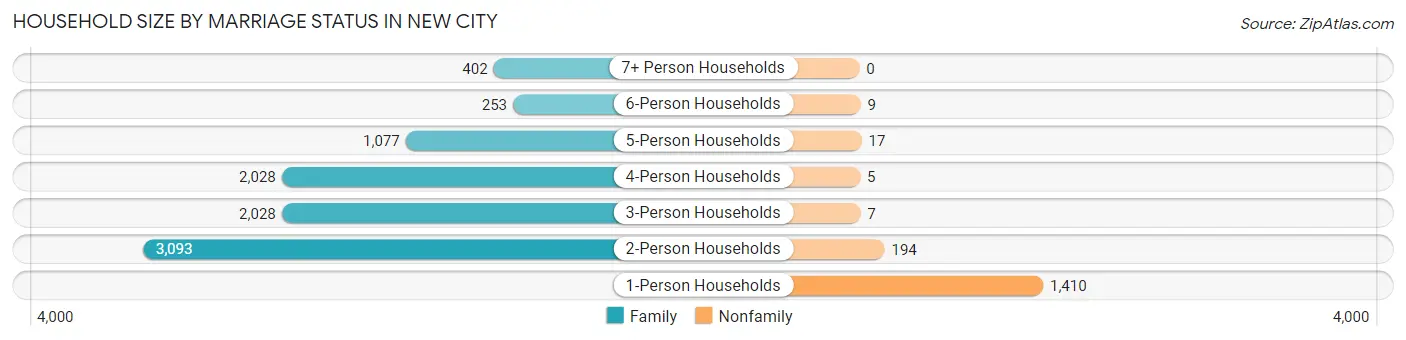
| Household Size | Family Households | Nonfamily Households |
| 1-Person Households | - | 1,410 (13.4%) |
| 2-Person Households | 3,093 (29.4%) | 194 (1.8%) |
| 3-Person Households | 2,028 (19.3%) | 7 (0.1%) |
| 4-Person Households | 2,028 (19.3%) | 5 (0.1%) |
| 5-Person Households | 1,077 (10.2%) | 17 (0.2%) |
| 6-Person Households | 253 (2.4%) | 9 (0.1%) |
| 7+ Person Households | 402 (3.8%) | 0 (0.0%) |
| Total | 8,881 (84.4%) | 1,642 (15.6%) |
Female Fertility in New City
Fertility by Age in New City
Average fertility rate in New City is 27.0 births per 1,000 women. Women in the age bracket of 20 to 34 years have the highest fertility rate with 33.0 births per 1,000 women. Women in the age bracket of 35 to 50 years acount for 57.5% of all women with births.
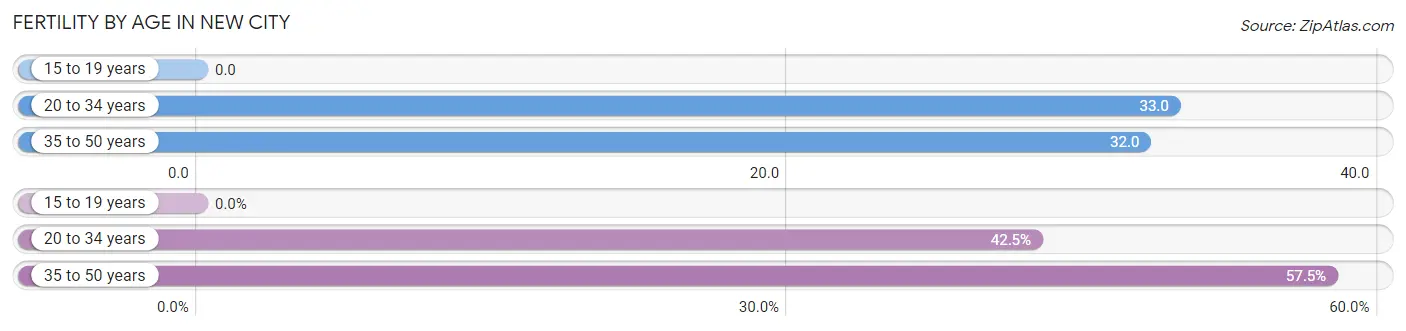
| Age Bracket | Women with Births | Births / 1,000 Women |
| 15 to 19 years | 0 (0.0%) | 0.0 |
| 20 to 34 years | 82 (42.5%) | 33.0 |
| 35 to 50 years | 111 (57.5%) | 32.0 |
| Total | 193 (100.0%) | 27.0 |
Fertility by Age by Marriage Status in New City
87.6% of women with births (193) in New City are married. The highest percentage of unmarried women with births falls into 35 to 50 years age bracket with 18.0% of them unmarried at the time of birth, while the lowest percentage of unmarried women with births belong to 20 to 34 years age bracket with 4.9% of them unmarried.
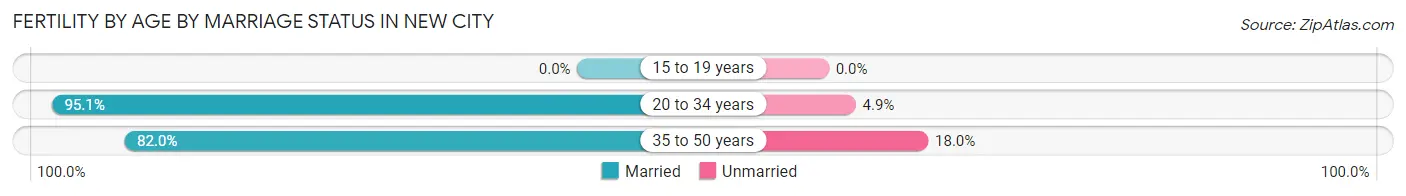
| Age Bracket | Married | Unmarried |
| 15 to 19 years | 0 (0.0%) | 0 (0.0%) |
| 20 to 34 years | 78 (95.1%) | 4 (4.9%) |
| 35 to 50 years | 91 (82.0%) | 20 (18.0%) |
| Total | 169 (87.6%) | 24 (12.4%) |
Fertility by Education in New City
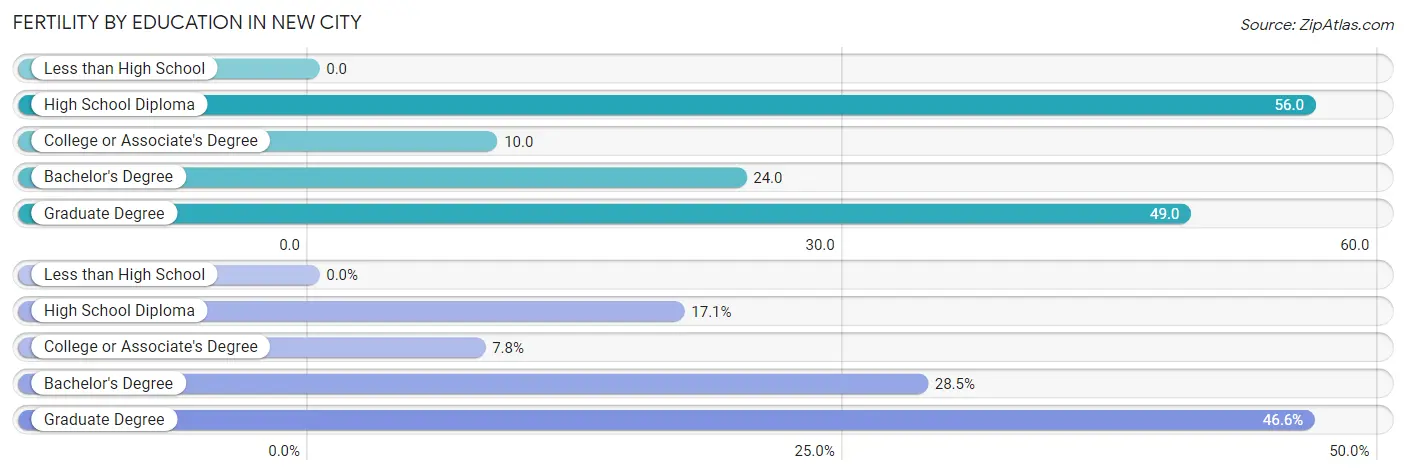
| Educational Attainment | Women with Births | Births / 1,000 Women |
| Less than High School | 0 (0.0%) | 0.0 |
| High School Diploma | 33 (17.1%) | 56.0 |
| College or Associate's Degree | 15 (7.8%) | 10.0 |
| Bachelor's Degree | 55 (28.5%) | 24.0 |
| Graduate Degree | 90 (46.6%) | 49.0 |
| Total | 193 (100.0%) | 27.0 |
Fertility by Education by Marriage Status in New City
12.4% of women with births in New City are unmarried. Women with the educational attainment of high school diploma are most likely to be married with 100.0% of them married at childbirth, while women with the educational attainment of bachelor's degree are least likely to be married with 20.0% of them unmarried at childbirth.
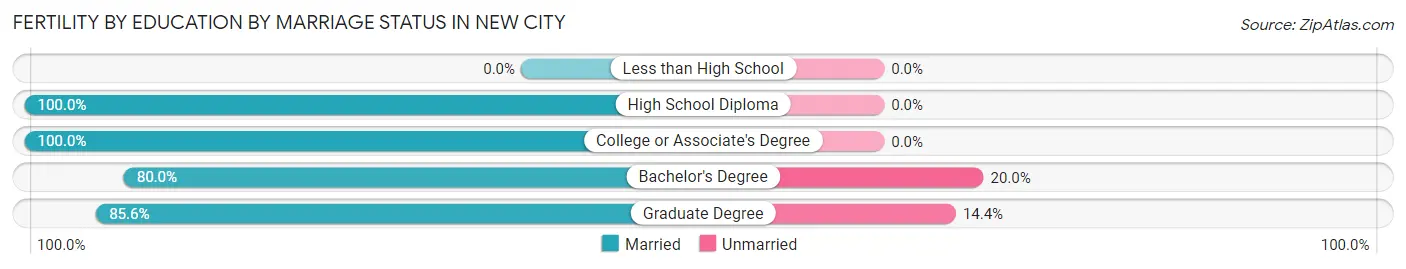
| Educational Attainment | Married | Unmarried |
| Less than High School | 0 (0.0%) | 0 (0.0%) |
| High School Diploma | 33 (100.0%) | 0 (0.0%) |
| College or Associate's Degree | 15 (100.0%) | 0 (0.0%) |
| Bachelor's Degree | 44 (80.0%) | 11 (20.0%) |
| Graduate Degree | 77 (85.6%) | 13 (14.4%) |
| Total | 169 (87.6%) | 24 (12.4%) |
Employment Characteristics in New City
Employment by Class of Employer in New City
Among the 16,403 employed individuals in New City, private company employees (9,611 | 58.6%), local government employees (2,167 | 13.2%), and not-for-profit organizations (1,874 | 11.4%) make up the most common classes of employment.
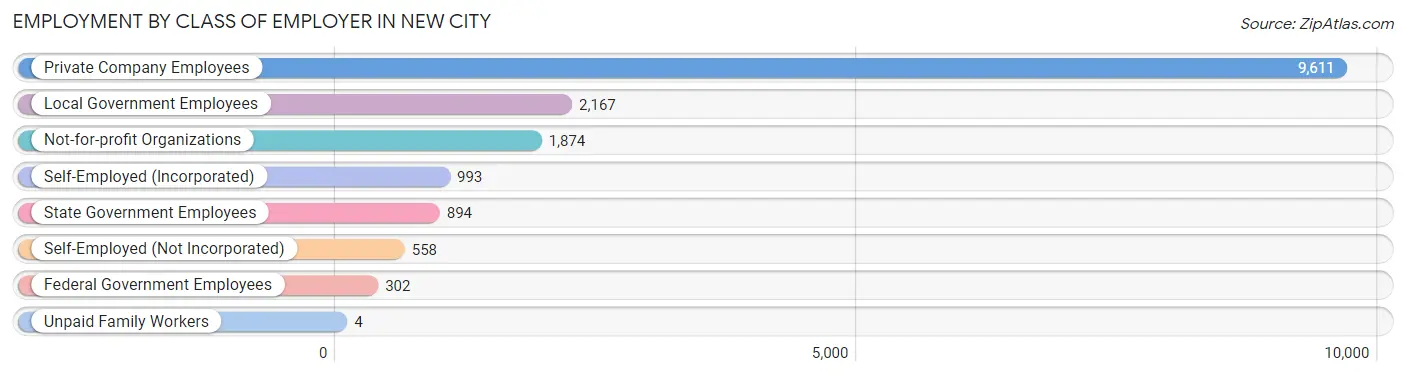
| Employer Class | # Employees | % Employees |
| Private Company Employees | 9,611 | 58.6% |
| Self-Employed (Incorporated) | 993 | 6.0% |
| Self-Employed (Not Incorporated) | 558 | 3.4% |
| Not-for-profit Organizations | 1,874 | 11.4% |
| Local Government Employees | 2,167 | 13.2% |
| State Government Employees | 894 | 5.4% |
| Federal Government Employees | 302 | 1.8% |
| Unpaid Family Workers | 4 | 0.0% |
| Total | 16,403 | 100.0% |
Employment Status by Age in New City
According to the labor force statistics for New City, out of the total population over 16 years of age (27,715), 64.8% or 17,959 individuals are in the labor force, with 7.2% or 1,293 of them unemployed. The age group with the highest labor force participation rate is 35 to 44 years, with 89.5% or 3,727 individuals in the labor force. Within the labor force, the 20 to 24 years age range has the highest percentage of unemployed individuals, with 23.4% or 334 of them being unemployed.
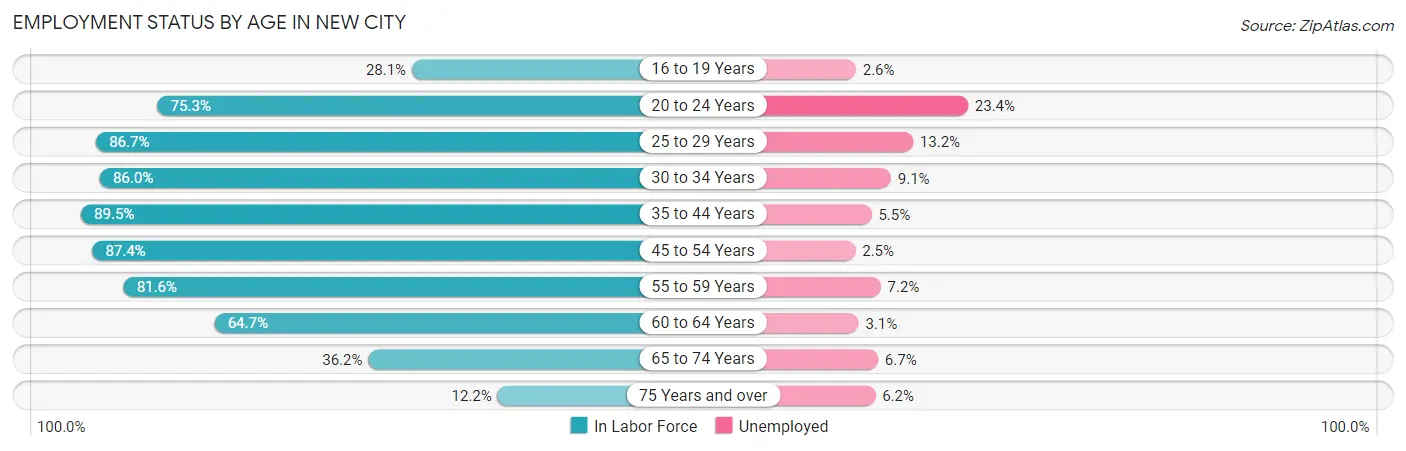
| Age Bracket | In Labor Force | Unemployed |
| 16 to 19 Years | 539 (28.1%) | 14 (2.6%) |
| 20 to 24 Years | 1,426 (75.3%) | 334 (23.4%) |
| 25 to 29 Years | 1,724 (86.7%) | 228 (13.2%) |
| 30 to 34 Years | 1,134 (86.0%) | 103 (9.1%) |
| 35 to 44 Years | 3,727 (89.5%) | 205 (5.5%) |
| 45 to 54 Years | 3,993 (87.4%) | 100 (2.5%) |
| 55 to 59 Years | 1,868 (81.6%) | 134 (7.2%) |
| 60 to 64 Years | 1,784 (64.7%) | 55 (3.1%) |
| 65 to 74 Years | 1,410 (36.2%) | 94 (6.7%) |
| 75 Years and over | 356 (12.2%) | 22 (6.2%) |
| Total | 17,959 (64.8%) | 1,293 (7.2%) |
Employment Status by Educational Attainment in New City
According to labor force statistics for New City, 83.3% of individuals (14,234) out of the total population between 25 and 64 years of age (17,088) are in the labor force, with 5.8% or 826 of them being unemployed. The group with the highest labor force participation rate are those with the educational attainment of bachelor's degree or higher, with 90.6% or 9,502 individuals in the labor force. Within the labor force, individuals with high school diploma education have the highest percentage of unemployment, with 21.7% or 305 of them being unemployed.
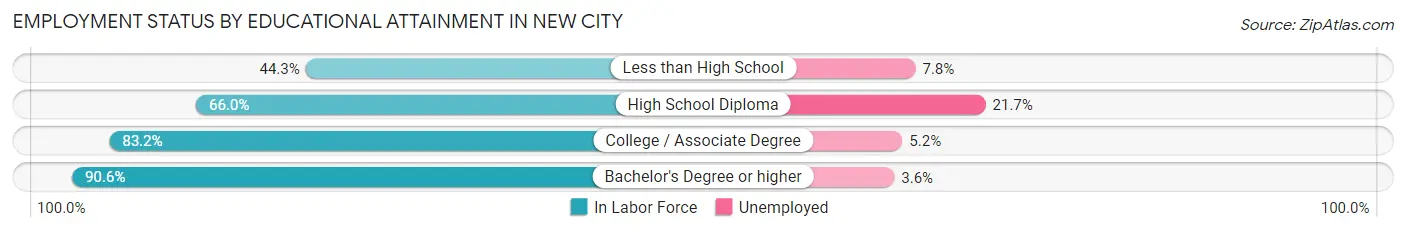
| Educational Attainment | In Labor Force | Unemployed |
| Less than High School | 448 (44.3%) | 79 (7.8%) |
| High School Diploma | 1,404 (66.0%) | 462 (21.7%) |
| College / Associate Degree | 2,880 (83.2%) | 180 (5.2%) |
| Bachelor's Degree or higher | 9,502 (90.6%) | 378 (3.6%) |
| Total | 14,234 (83.3%) | 991 (5.8%) |
Employment Occupations by Sex in New City
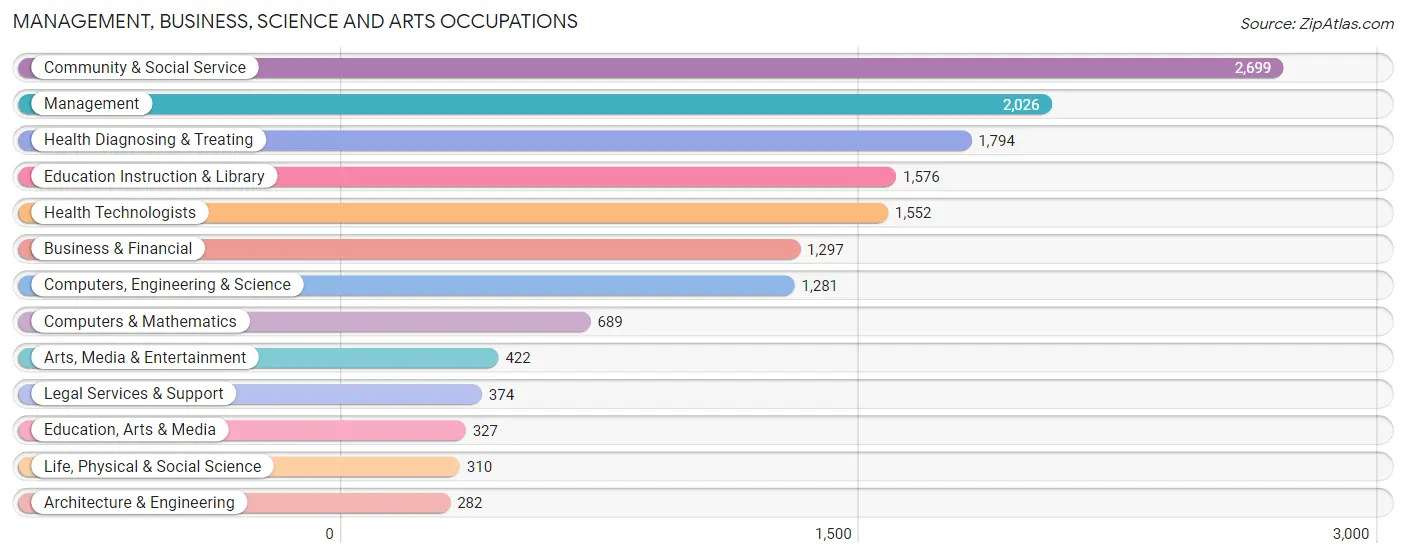
Management, Business, Science and Arts Occupations
The most common Management, Business, Science and Arts occupations in New City are Community & Social Service (2,699 | 16.2%), Management (2,026 | 12.2%), Health Diagnosing & Treating (1,794 | 10.8%), Education Instruction & Library (1,576 | 9.5%), and Health Technologists (1,552 | 9.3%).
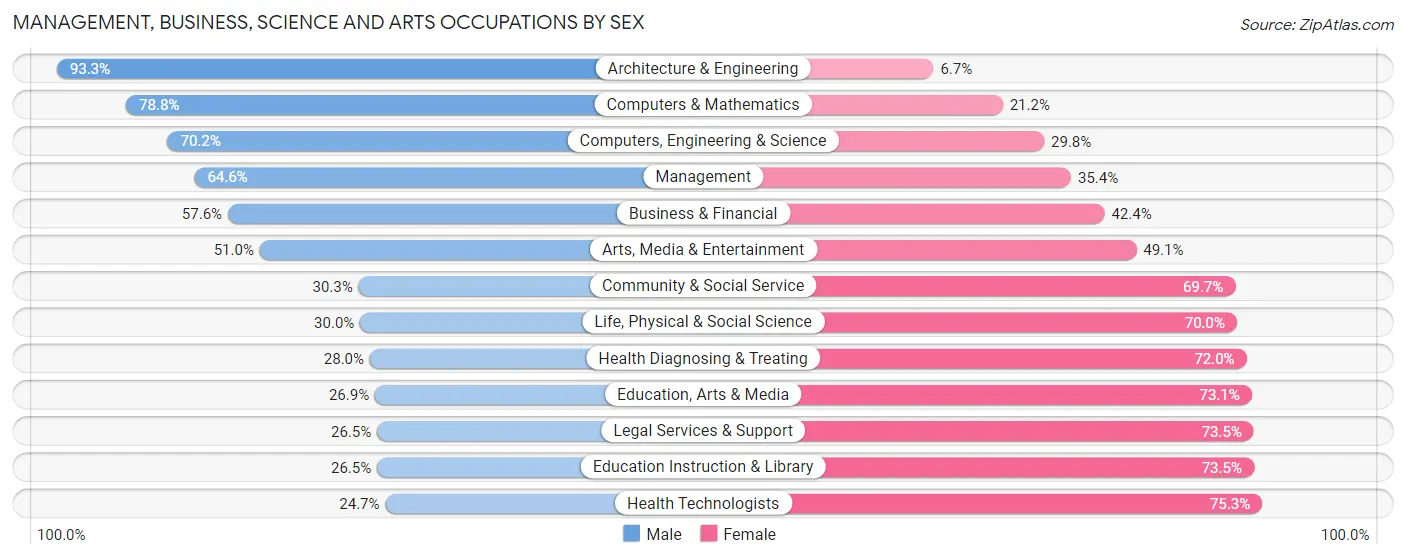
Management, Business, Science and Arts Occupations by Sex
Within the Management, Business, Science and Arts occupations in New City, the most male-oriented occupations are Architecture & Engineering (93.3%), Computers & Mathematics (78.8%), and Computers, Engineering & Science (70.2%), while the most female-oriented occupations are Health Technologists (75.3%), Education Instruction & Library (73.5%), and Legal Services & Support (73.5%).
| Occupation | Male | Female |
| Management | 1,308 (64.6%) | 718 (35.4%) |
| Business & Financial | 747 (57.6%) | 550 (42.4%) |
| Computers, Engineering & Science | 899 (70.2%) | 382 (29.8%) |
| Computers & Mathematics | 543 (78.8%) | 146 (21.2%) |
| Architecture & Engineering | 263 (93.3%) | 19 (6.7%) |
| Life, Physical & Social Science | 93 (30.0%) | 217 (70.0%) |
| Community & Social Service | 819 (30.3%) | 1,880 (69.7%) |
| Education, Arts & Media | 88 (26.9%) | 239 (73.1%) |
| Legal Services & Support | 99 (26.5%) | 275 (73.5%) |
| Education Instruction & Library | 417 (26.5%) | 1,159 (73.5%) |
| Arts, Media & Entertainment | 215 (50.9%) | 207 (49.0%) |
| Health Diagnosing & Treating | 502 (28.0%) | 1,292 (72.0%) |
| Health Technologists | 384 (24.7%) | 1,168 (75.3%) |
| Total (Category) | 4,275 (47.0%) | 4,822 (53.0%) |
| Total (Overall) | 8,290 (49.7%) | 8,377 (50.3%) |
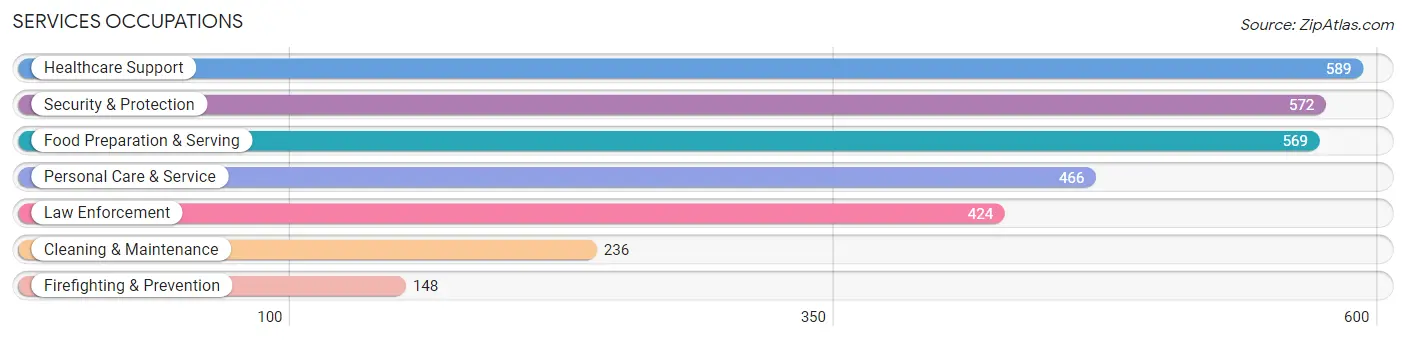
Services Occupations
The most common Services occupations in New City are Healthcare Support (589 | 3.5%), Security & Protection (572 | 3.4%), Food Preparation & Serving (569 | 3.4%), Personal Care & Service (466 | 2.8%), and Law Enforcement (424 | 2.5%).
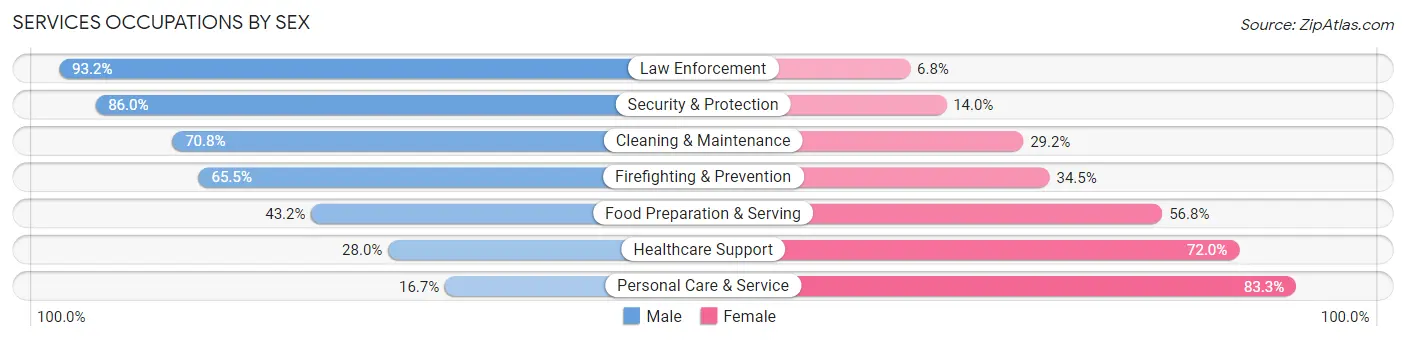
Services Occupations by Sex
Within the Services occupations in New City, the most male-oriented occupations are Law Enforcement (93.2%), Security & Protection (86.0%), and Cleaning & Maintenance (70.8%), while the most female-oriented occupations are Personal Care & Service (83.3%), Healthcare Support (72.0%), and Food Preparation & Serving (56.8%).
| Occupation | Male | Female |
| Healthcare Support | 165 (28.0%) | 424 (72.0%) |
| Security & Protection | 492 (86.0%) | 80 (14.0%) |
| Firefighting & Prevention | 97 (65.5%) | 51 (34.5%) |
| Law Enforcement | 395 (93.2%) | 29 (6.8%) |
| Food Preparation & Serving | 246 (43.2%) | 323 (56.8%) |
| Cleaning & Maintenance | 167 (70.8%) | 69 (29.2%) |
| Personal Care & Service | 78 (16.7%) | 388 (83.3%) |
| Total (Category) | 1,148 (47.2%) | 1,284 (52.8%) |
| Total (Overall) | 8,290 (49.7%) | 8,377 (50.3%) |
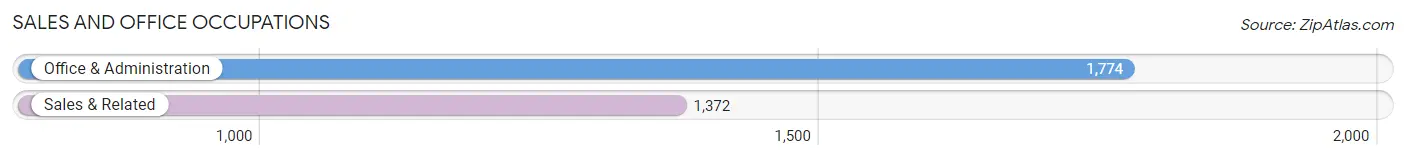
Sales and Office Occupations
The most common Sales and Office occupations in New City are Office & Administration (1,774 | 10.6%), and Sales & Related (1,372 | 8.2%).
Sales and Office Occupations by Sex
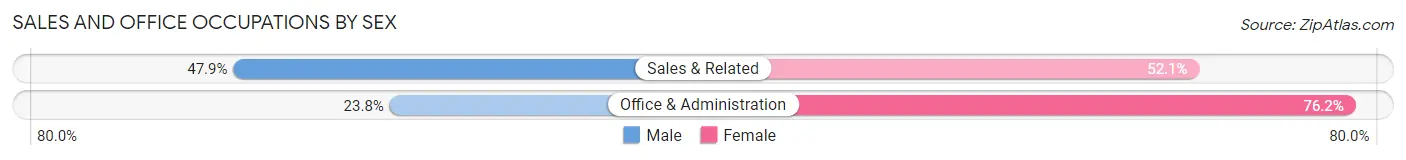
| Occupation | Male | Female |
| Sales & Related | 657 (47.9%) | 715 (52.1%) |
| Office & Administration | 423 (23.8%) | 1,351 (76.2%) |
| Total (Category) | 1,080 (34.3%) | 2,066 (65.7%) |
| Total (Overall) | 8,290 (49.7%) | 8,377 (50.3%) |
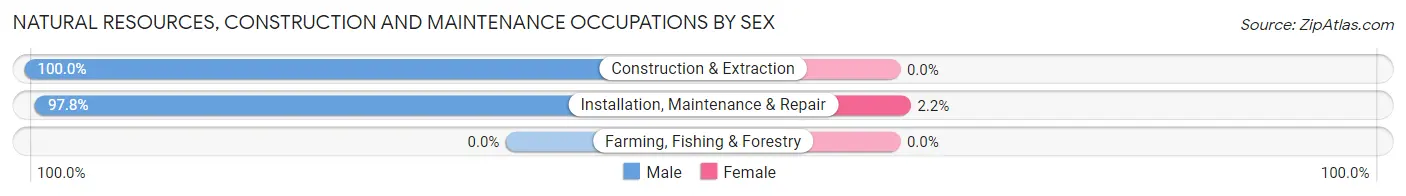
Natural Resources, Construction and Maintenance Occupations
The most common Natural Resources, Construction and Maintenance occupations in New City are Installation, Maintenance & Repair (320 | 1.9%), and Construction & Extraction (261 | 1.6%).

Natural Resources, Construction and Maintenance Occupations by Sex
| Occupation | Male | Female |
| Farming, Fishing & Forestry | 0 (0.0%) | 0 (0.0%) |
| Construction & Extraction | 261 (100.0%) | 0 (0.0%) |
| Installation, Maintenance & Repair | 313 (97.8%) | 7 (2.2%) |
| Total (Category) | 574 (98.8%) | 7 (1.2%) |
| Total (Overall) | 8,290 (49.7%) | 8,377 (50.3%) |
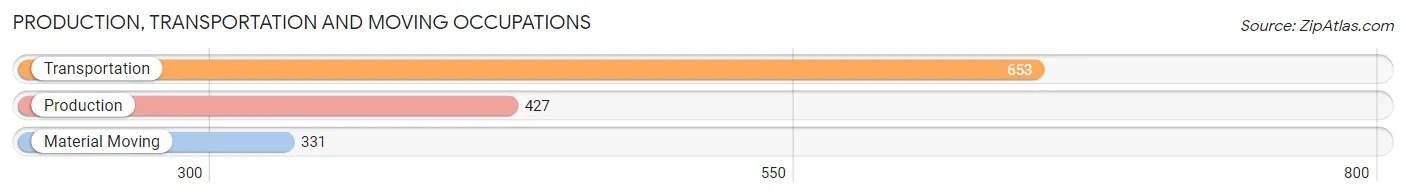
Production, Transportation and Moving Occupations
The most common Production, Transportation and Moving occupations in New City are Transportation (653 | 3.9%), Production (427 | 2.6%), and Material Moving (331 | 2.0%).
Production, Transportation and Moving Occupations by Sex
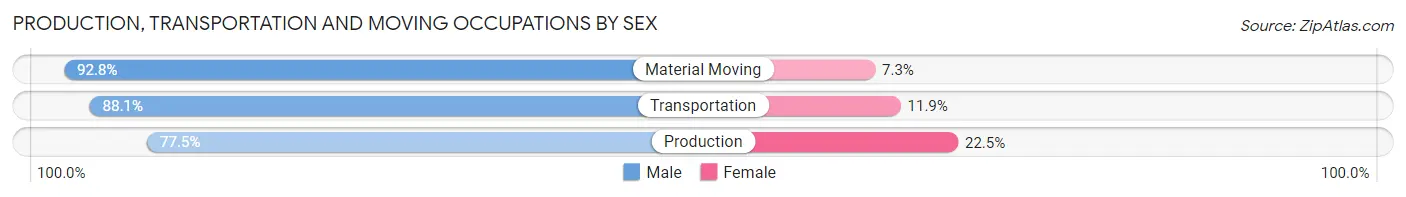
| Occupation | Male | Female |
| Production | 331 (77.5%) | 96 (22.5%) |
| Transportation | 575 (88.1%) | 78 (11.9%) |
| Material Moving | 307 (92.7%) | 24 (7.2%) |
| Total (Category) | 1,213 (86.0%) | 198 (14.0%) |
| Total (Overall) | 8,290 (49.7%) | 8,377 (50.3%) |
Employment Industries by Sex in New City
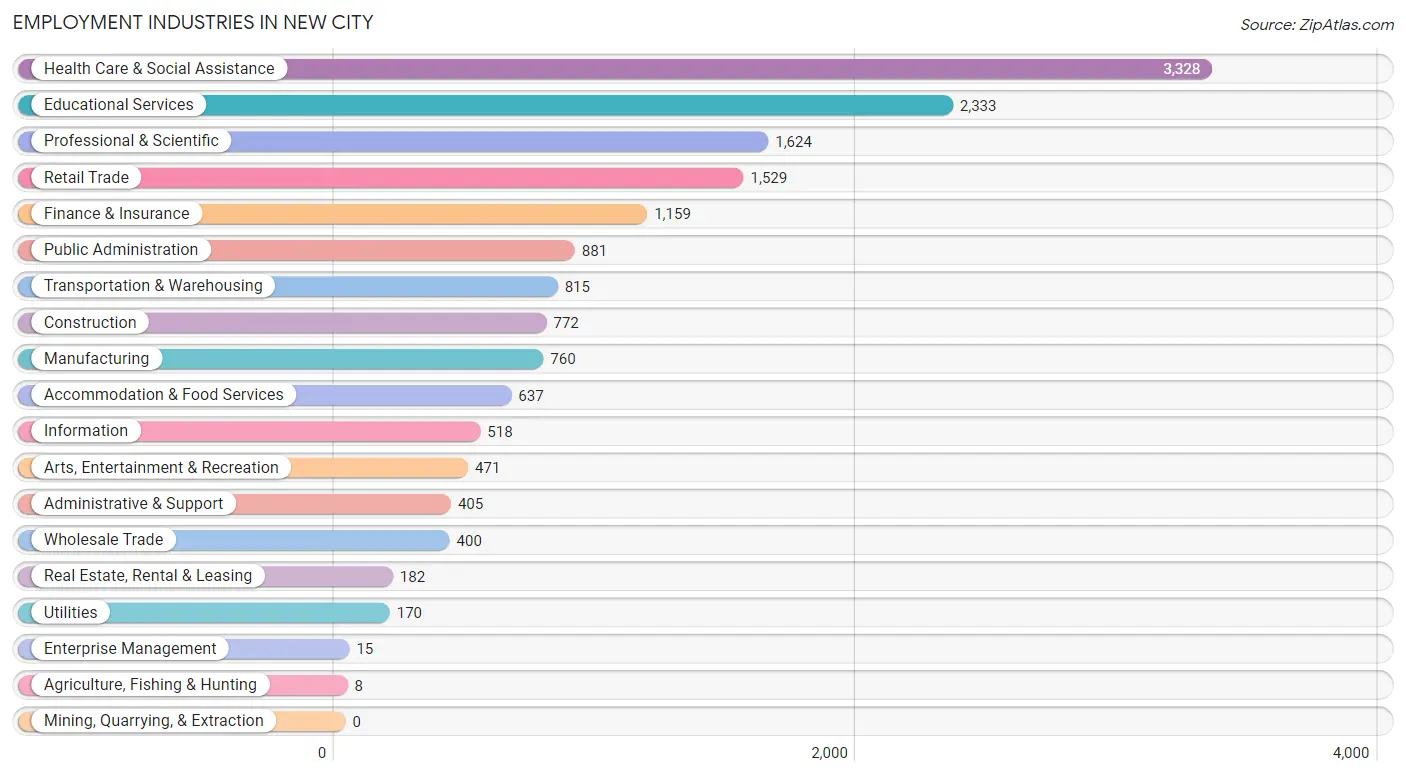
Employment Industries in New City
The major employment industries in New City include Health Care & Social Assistance (3,328 | 20.0%), Educational Services (2,333 | 14.0%), Professional & Scientific (1,624 | 9.7%), Retail Trade (1,529 | 9.2%), and Finance & Insurance (1,159 | 7.0%).
Employment Industries by Sex in New City
The New City industries that see more men than women are Agriculture, Fishing & Hunting (100.0%), Transportation & Warehousing (91.3%), and Construction (83.9%), whereas the industries that tend to have a higher number of women are Health Care & Social Assistance (76.1%), Educational Services (75.3%), and Utilities (74.7%).
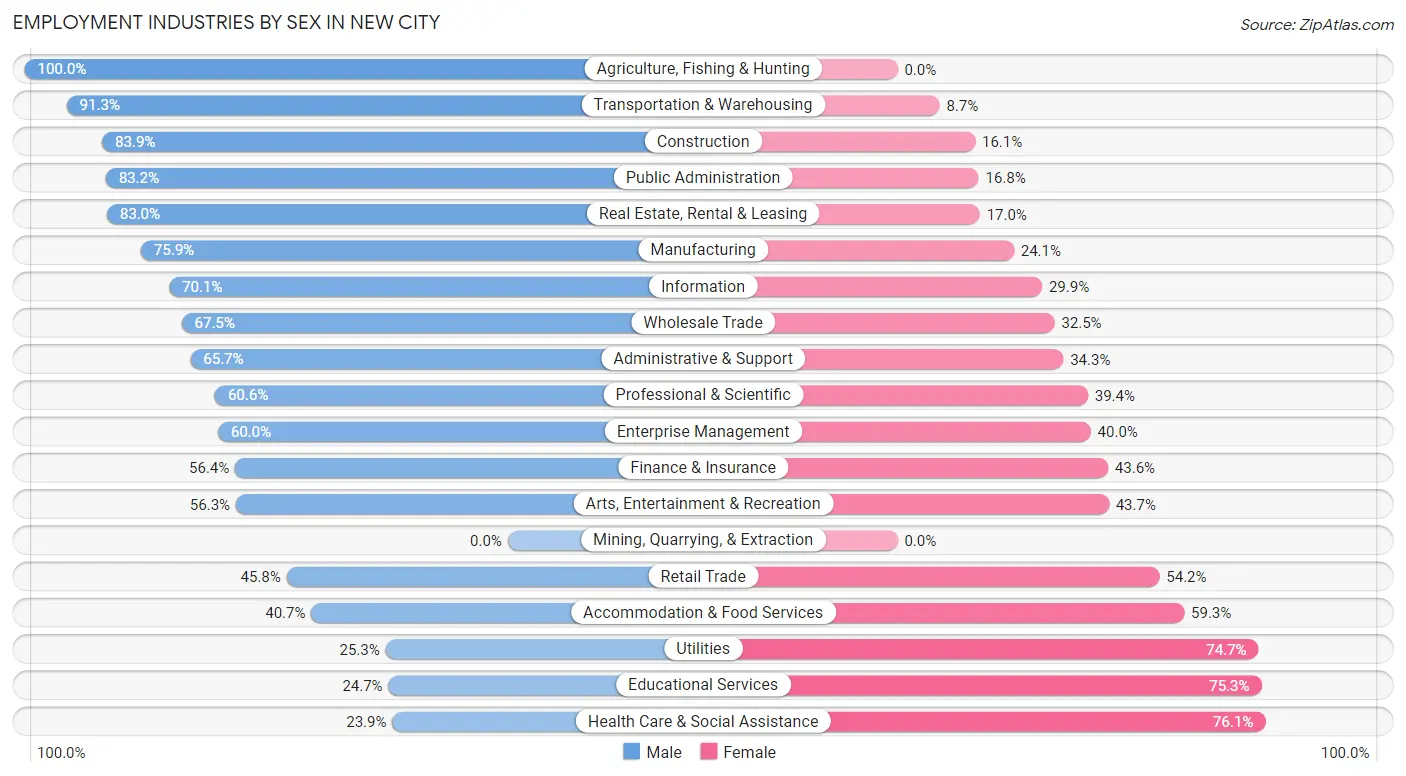
| Industry | Male | Female |
| Agriculture, Fishing & Hunting | 8 (100.0%) | 0 (0.0%) |
| Mining, Quarrying, & Extraction | 0 (0.0%) | 0 (0.0%) |
| Construction | 648 (83.9%) | 124 (16.1%) |
| Manufacturing | 577 (75.9%) | 183 (24.1%) |
| Wholesale Trade | 270 (67.5%) | 130 (32.5%) |
| Retail Trade | 700 (45.8%) | 829 (54.2%) |
| Transportation & Warehousing | 744 (91.3%) | 71 (8.7%) |
| Utilities | 43 (25.3%) | 127 (74.7%) |
| Information | 363 (70.1%) | 155 (29.9%) |
| Finance & Insurance | 654 (56.4%) | 505 (43.6%) |
| Real Estate, Rental & Leasing | 151 (83.0%) | 31 (17.0%) |
| Professional & Scientific | 984 (60.6%) | 640 (39.4%) |
| Enterprise Management | 9 (60.0%) | 6 (40.0%) |
| Administrative & Support | 266 (65.7%) | 139 (34.3%) |
| Educational Services | 576 (24.7%) | 1,757 (75.3%) |
| Health Care & Social Assistance | 795 (23.9%) | 2,533 (76.1%) |
| Arts, Entertainment & Recreation | 265 (56.3%) | 206 (43.7%) |
| Accommodation & Food Services | 259 (40.7%) | 378 (59.3%) |
| Public Administration | 733 (83.2%) | 148 (16.8%) |
| Total | 8,290 (49.7%) | 8,377 (50.3%) |
Education in New City
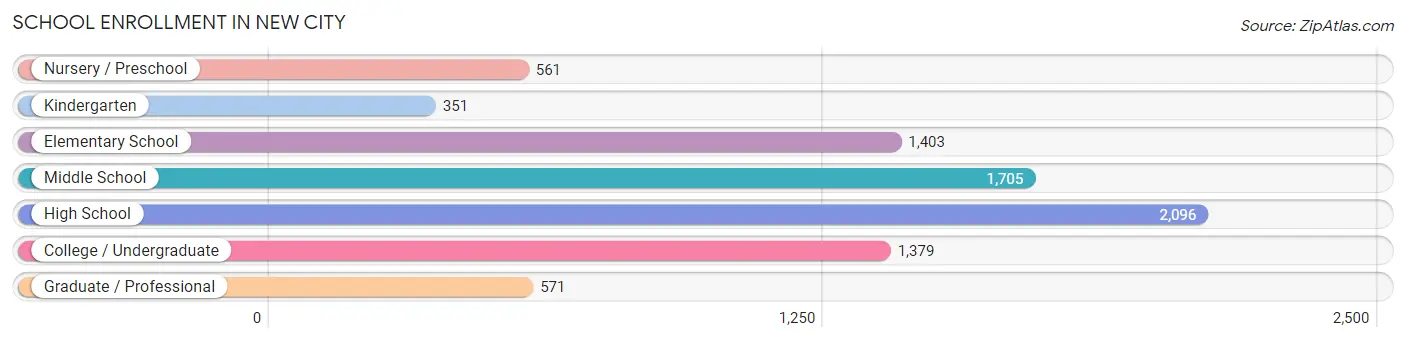
School Enrollment in New City
The most common levels of schooling among the 8,066 students in New City are high school (2,096 | 26.0%), middle school (1,705 | 21.1%), and elementary school (1,403 | 17.4%).
| School Level | # Students | % Students |
| Nursery / Preschool | 561 | 7.0% |
| Kindergarten | 351 | 4.3% |
| Elementary School | 1,403 | 17.4% |
| Middle School | 1,705 | 21.1% |
| High School | 2,096 | 26.0% |
| College / Undergraduate | 1,379 | 17.1% |
| Graduate / Professional | 571 | 7.1% |
| Total | 8,066 | 100.0% |
School Enrollment by Age by Funding Source in New City
Out of a total of 8,066 students who are enrolled in schools in New City, 1,621 (20.1%) attend a private institution, while the remaining 6,445 (79.9%) are enrolled in public schools. The age group of 3 to 4 year olds has the highest likelihood of being enrolled in private schools, with 305 (67.8% in the age bracket) enrolled. Conversely, the age group of 15 to 17 year olds has the lowest likelihood of being enrolled in a private school, with 1,440 (97.2% in the age bracket) attending a public institution.
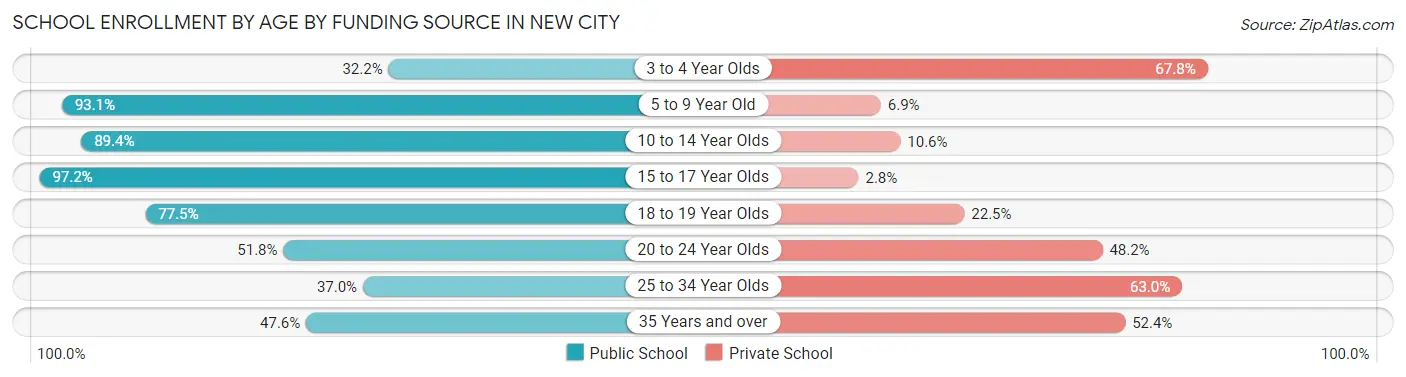
| Age Bracket | Public School | Private School |
| 3 to 4 Year Olds | 145 (32.2%) | 305 (67.8%) |
| 5 to 9 Year Old | 1,682 (93.1%) | 125 (6.9%) |
| 10 to 14 Year Olds | 1,872 (89.4%) | 221 (10.6%) |
| 15 to 17 Year Olds | 1,440 (97.2%) | 41 (2.8%) |
| 18 to 19 Year Olds | 631 (77.5%) | 183 (22.5%) |
| 20 to 24 Year Olds | 402 (51.8%) | 374 (48.2%) |
| 25 to 34 Year Olds | 125 (37.0%) | 213 (63.0%) |
| 35 Years and over | 146 (47.6%) | 161 (52.4%) |
| Total | 6,445 (79.9%) | 1,621 (20.1%) |
Educational Attainment by Field of Study in New City
Business (3,225 | 21.4%), science & technology (1,985 | 13.2%), education (1,709 | 11.4%), social sciences (1,189 | 7.9%), and engineering (1,001 | 6.7%) are the most common fields of study among 15,041 individuals in New City who have obtained a bachelor's degree or higher.
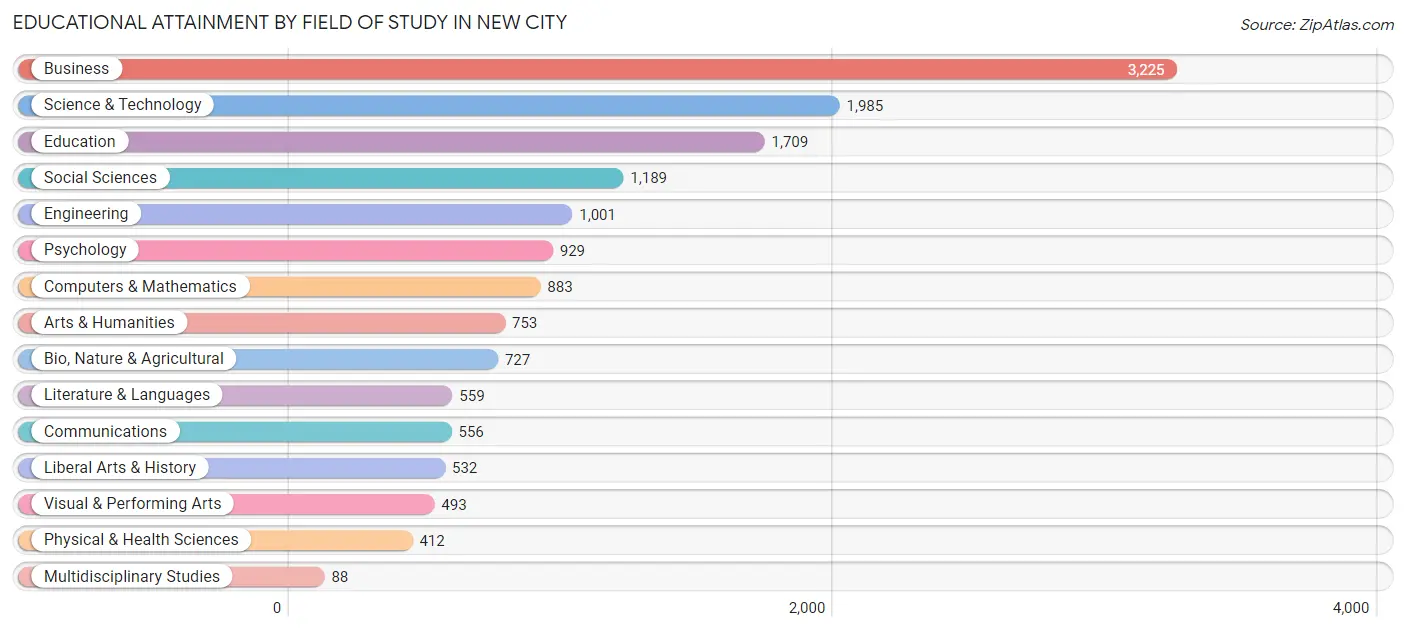
| Field of Study | # Graduates | % Graduates |
| Computers & Mathematics | 883 | 5.9% |
| Bio, Nature & Agricultural | 727 | 4.8% |
| Physical & Health Sciences | 412 | 2.7% |
| Psychology | 929 | 6.2% |
| Social Sciences | 1,189 | 7.9% |
| Engineering | 1,001 | 6.7% |
| Multidisciplinary Studies | 88 | 0.6% |
| Science & Technology | 1,985 | 13.2% |
| Business | 3,225 | 21.4% |
| Education | 1,709 | 11.4% |
| Literature & Languages | 559 | 3.7% |
| Liberal Arts & History | 532 | 3.5% |
| Visual & Performing Arts | 493 | 3.3% |
| Communications | 556 | 3.7% |
| Arts & Humanities | 753 | 5.0% |
| Total | 15,041 | 100.0% |
Transportation & Commute in New City
Vehicle Availability by Sex in New City
The most prevalent vehicle ownership categories in New City are males with 2 vehicles (3,469, accounting for 42.5%) and females with 2 vehicles (3,343, making up 42.2%).
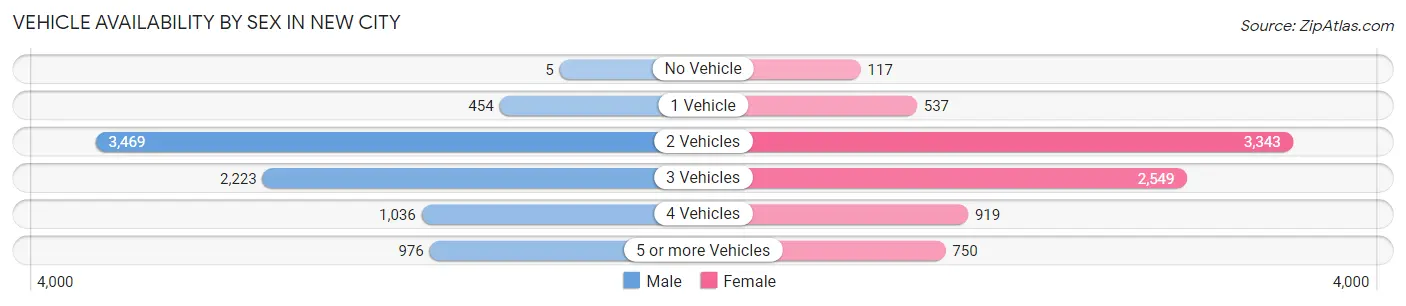
| Vehicles Available | Male | Female |
| No Vehicle | 5 (0.1%) | 117 (1.4%) |
| 1 Vehicle | 454 (5.6%) | 537 (6.5%) |
| 2 Vehicles | 3,469 (42.5%) | 3,343 (40.7%) |
| 3 Vehicles | 2,223 (27.2%) | 2,549 (31.0%) |
| 4 Vehicles | 1,036 (12.7%) | 919 (11.2%) |
| 5 or more Vehicles | 976 (12.0%) | 750 (9.1%) |
| Total | 8,163 (100.0%) | 8,215 (100.0%) |
Commute Time in New City
The most frequently occuring commute durations in New City are 15 to 19 minutes (2,612 commuters, 18.6%), 60 to 89 minutes (1,828 commuters, 13.0%), and 20 to 24 minutes (1,653 commuters, 11.7%).
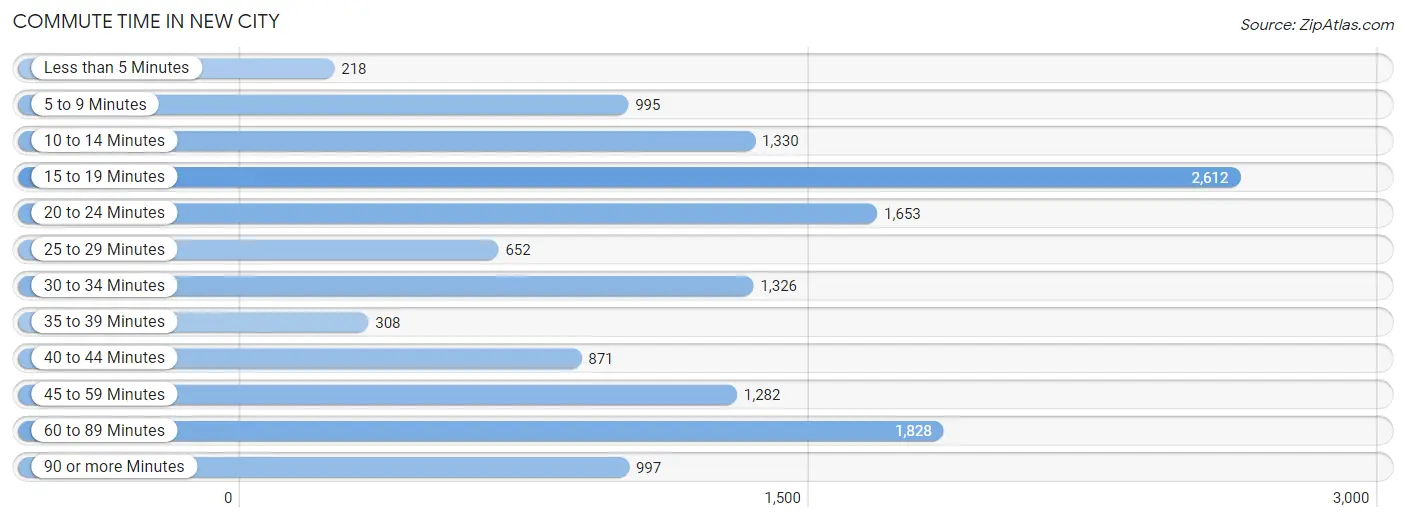
| Commute Time | # Commuters | % Commuters |
| Less than 5 Minutes | 218 | 1.5% |
| 5 to 9 Minutes | 995 | 7.1% |
| 10 to 14 Minutes | 1,330 | 9.5% |
| 15 to 19 Minutes | 2,612 | 18.6% |
| 20 to 24 Minutes | 1,653 | 11.7% |
| 25 to 29 Minutes | 652 | 4.6% |
| 30 to 34 Minutes | 1,326 | 9.4% |
| 35 to 39 Minutes | 308 | 2.2% |
| 40 to 44 Minutes | 871 | 6.2% |
| 45 to 59 Minutes | 1,282 | 9.1% |
| 60 to 89 Minutes | 1,828 | 13.0% |
| 90 or more Minutes | 997 | 7.1% |
Commute Time by Sex in New City
The most common commute times in New City are 15 to 19 minutes (1,160 commuters, 16.5%) for males and 15 to 19 minutes (1,452 commuters, 20.7%) for females.
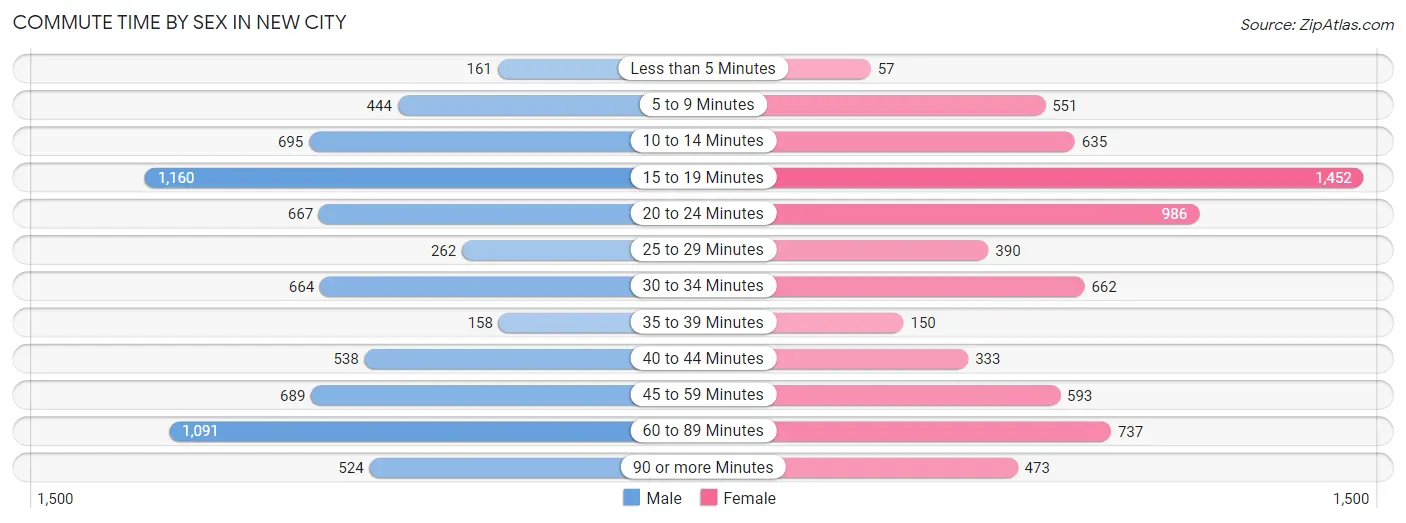
| Commute Time | Male | Female |
| Less than 5 Minutes | 161 (2.3%) | 57 (0.8%) |
| 5 to 9 Minutes | 444 (6.3%) | 551 (7.9%) |
| 10 to 14 Minutes | 695 (9.9%) | 635 (9.0%) |
| 15 to 19 Minutes | 1,160 (16.5%) | 1,452 (20.7%) |
| 20 to 24 Minutes | 667 (9.5%) | 986 (14.1%) |
| 25 to 29 Minutes | 262 (3.7%) | 390 (5.6%) |
| 30 to 34 Minutes | 664 (9.4%) | 662 (9.4%) |
| 35 to 39 Minutes | 158 (2.2%) | 150 (2.1%) |
| 40 to 44 Minutes | 538 (7.6%) | 333 (4.7%) |
| 45 to 59 Minutes | 689 (9.8%) | 593 (8.5%) |
| 60 to 89 Minutes | 1,091 (15.5%) | 737 (10.5%) |
| 90 or more Minutes | 524 (7.4%) | 473 (6.7%) |
Time of Departure to Work by Sex in New City
The most frequent times of departure to work in New City are 7:30 AM to 7:59 AM (855, 12.1%) for males and 6:30 AM to 6:59 AM (938, 13.4%) for females.
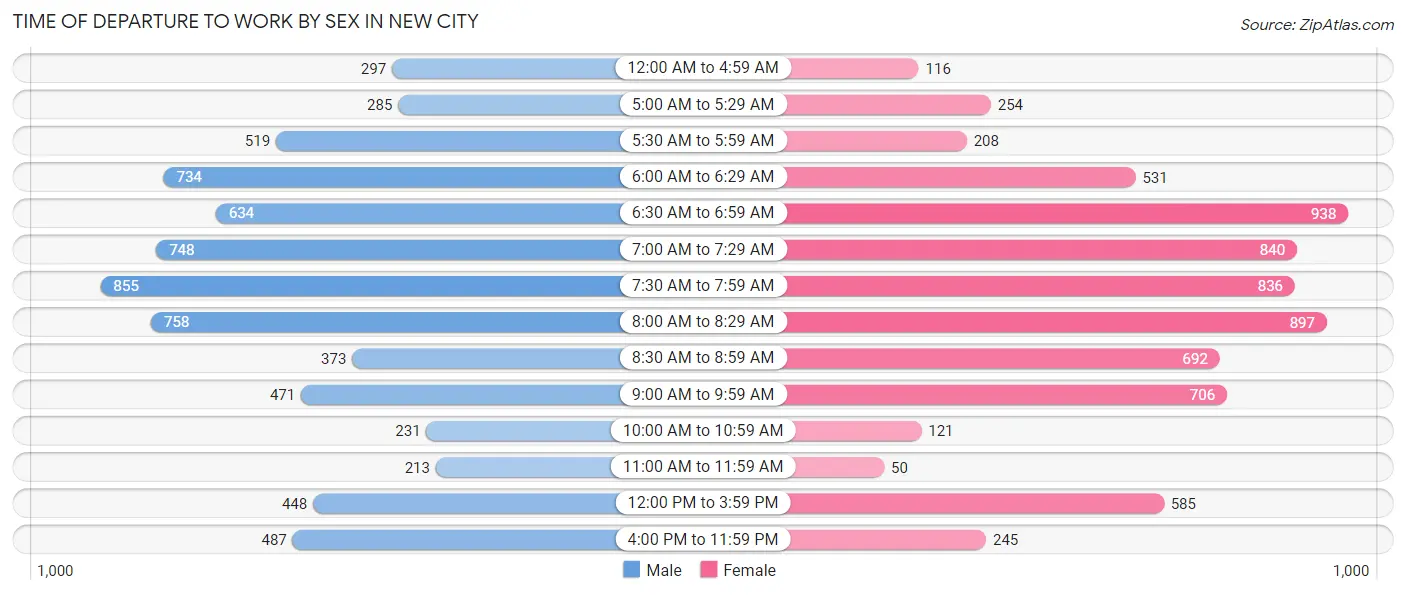
| Time of Departure | Male | Female |
| 12:00 AM to 4:59 AM | 297 (4.2%) | 116 (1.7%) |
| 5:00 AM to 5:29 AM | 285 (4.0%) | 254 (3.6%) |
| 5:30 AM to 5:59 AM | 519 (7.4%) | 208 (3.0%) |
| 6:00 AM to 6:29 AM | 734 (10.4%) | 531 (7.6%) |
| 6:30 AM to 6:59 AM | 634 (9.0%) | 938 (13.4%) |
| 7:00 AM to 7:29 AM | 748 (10.6%) | 840 (12.0%) |
| 7:30 AM to 7:59 AM | 855 (12.1%) | 836 (11.9%) |
| 8:00 AM to 8:29 AM | 758 (10.7%) | 897 (12.8%) |
| 8:30 AM to 8:59 AM | 373 (5.3%) | 692 (9.9%) |
| 9:00 AM to 9:59 AM | 471 (6.7%) | 706 (10.1%) |
| 10:00 AM to 10:59 AM | 231 (3.3%) | 121 (1.7%) |
| 11:00 AM to 11:59 AM | 213 (3.0%) | 50 (0.7%) |
| 12:00 PM to 3:59 PM | 448 (6.4%) | 585 (8.3%) |
| 4:00 PM to 11:59 PM | 487 (6.9%) | 245 (3.5%) |
| Total | 7,053 (100.0%) | 7,019 (100.0%) |
Housing Occupancy in New City
Occupancy by Ownership in New City
Of the total 10,523 dwellings in New City, owner-occupied units account for 9,809 (93.2%), while renter-occupied units make up 714 (6.8%).
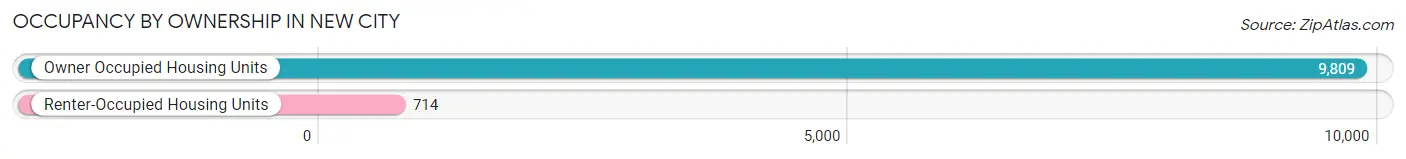
| Occupancy | # Housing Units | % Housing Units |
| Owner Occupied Housing Units | 9,809 | 93.2% |
| Renter-Occupied Housing Units | 714 | 6.8% |
| Total Occupied Housing Units | 10,523 | 100.0% |
Occupancy by Household Size in New City
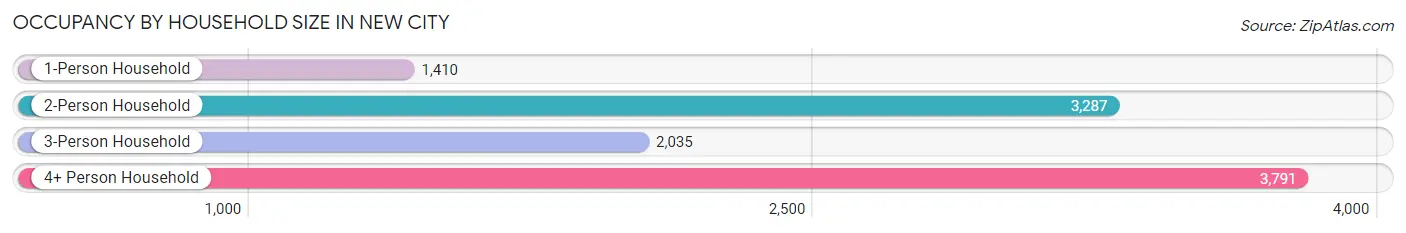
| Household Size | # Housing Units | % Housing Units |
| 1-Person Household | 1,410 | 13.4% |
| 2-Person Household | 3,287 | 31.2% |
| 3-Person Household | 2,035 | 19.3% |
| 4+ Person Household | 3,791 | 36.0% |
| Total Housing Units | 10,523 | 100.0% |
Occupancy by Ownership by Household Size in New City
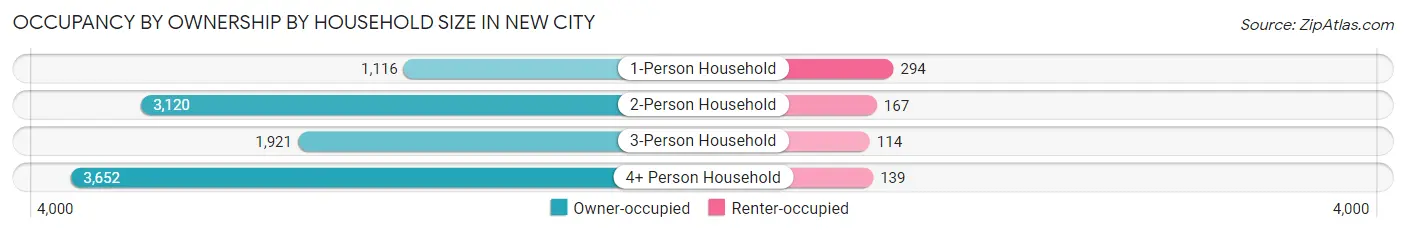
| Household Size | Owner-occupied | Renter-occupied |
| 1-Person Household | 1,116 (79.1%) | 294 (20.8%) |
| 2-Person Household | 3,120 (94.9%) | 167 (5.1%) |
| 3-Person Household | 1,921 (94.4%) | 114 (5.6%) |
| 4+ Person Household | 3,652 (96.3%) | 139 (3.7%) |
| Total Housing Units | 9,809 (93.2%) | 714 (6.8%) |
Occupancy by Educational Attainment in New City
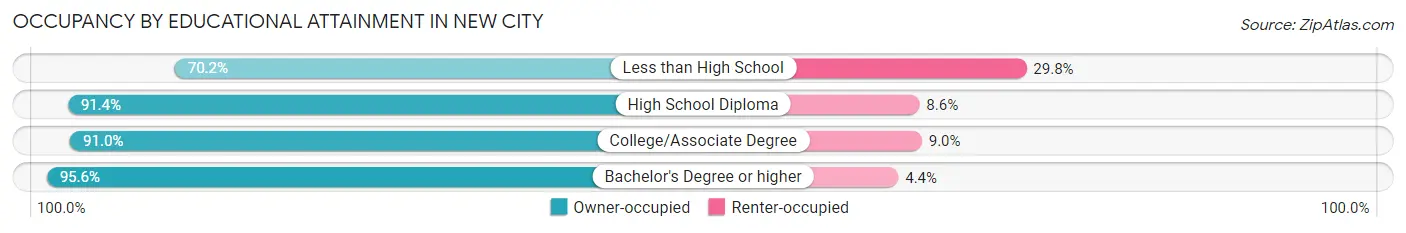
| Household Size | Owner-occupied | Renter-occupied |
| Less than High School | 271 (70.2%) | 115 (29.8%) |
| High School Diploma | 1,312 (91.4%) | 123 (8.6%) |
| College/Associate Degree | 1,842 (91.0%) | 183 (9.0%) |
| Bachelor's Degree or higher | 6,384 (95.6%) | 293 (4.4%) |
Occupancy by Age of Householder in New City
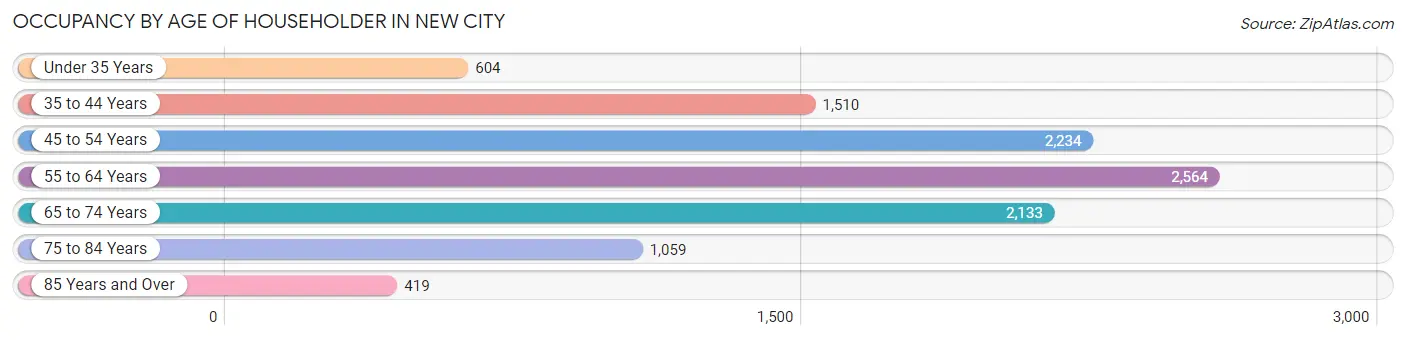
| Age Bracket | # Households | % Households |
| Under 35 Years | 604 | 5.7% |
| 35 to 44 Years | 1,510 | 14.3% |
| 45 to 54 Years | 2,234 | 21.2% |
| 55 to 64 Years | 2,564 | 24.4% |
| 65 to 74 Years | 2,133 | 20.3% |
| 75 to 84 Years | 1,059 | 10.1% |
| 85 Years and Over | 419 | 4.0% |
| Total | 10,523 | 100.0% |
Housing Finances in New City
Median Income by Occupancy in New City
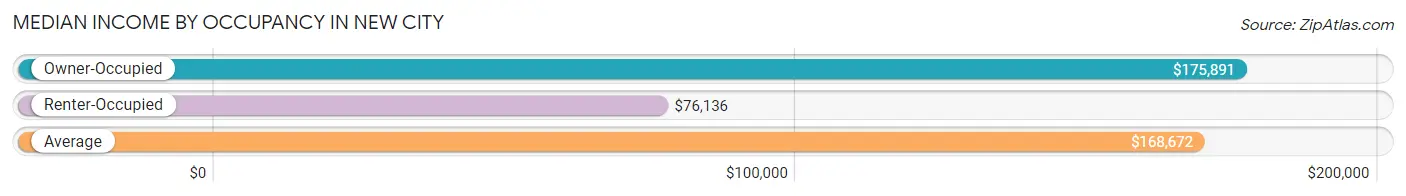
| Occupancy Type | # Households | Median Income |
| Owner-Occupied | 9,809 (93.2%) | $175,891 |
| Renter-Occupied | 714 (6.8%) | $76,136 |
| Average | 10,523 (100.0%) | $168,672 |
Occupancy by Householder Income Bracket in New City
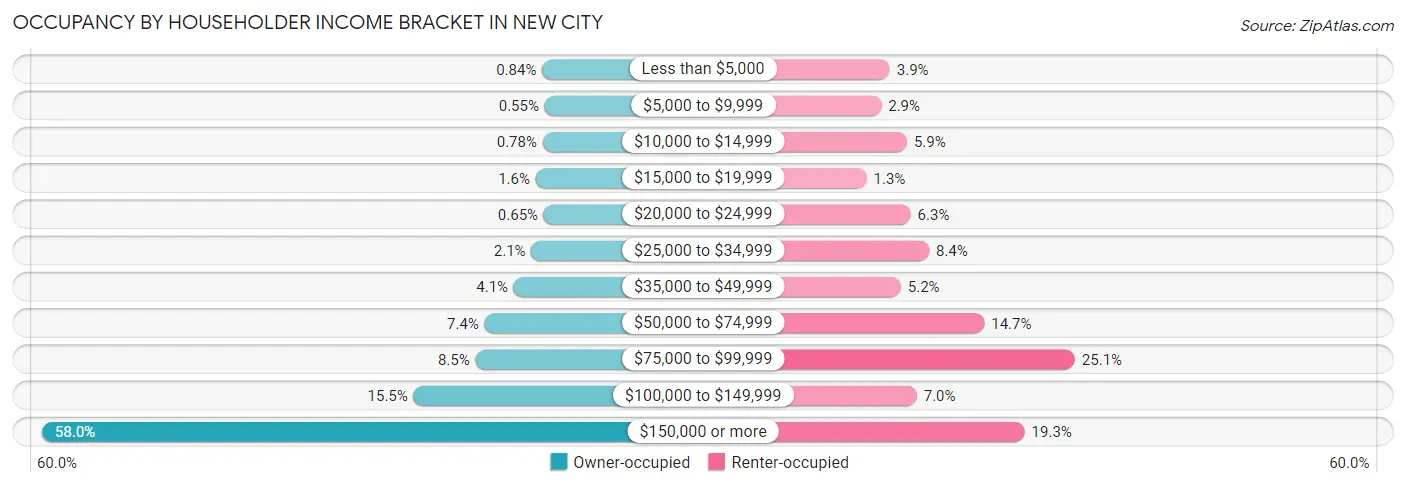
| Income Bracket | Owner-occupied | Renter-occupied |
| Less than $5,000 | 82 (0.8%) | 28 (3.9%) |
| $5,000 to $9,999 | 54 (0.5%) | 21 (2.9%) |
| $10,000 to $14,999 | 77 (0.8%) | 42 (5.9%) |
| $15,000 to $19,999 | 155 (1.6%) | 9 (1.3%) |
| $20,000 to $24,999 | 64 (0.6%) | 45 (6.3%) |
| $25,000 to $34,999 | 204 (2.1%) | 60 (8.4%) |
| $35,000 to $49,999 | 400 (4.1%) | 37 (5.2%) |
| $50,000 to $74,999 | 728 (7.4%) | 105 (14.7%) |
| $75,000 to $99,999 | 830 (8.5%) | 179 (25.1%) |
| $100,000 to $149,999 | 1,524 (15.5%) | 50 (7.0%) |
| $150,000 or more | 5,691 (58.0%) | 138 (19.3%) |
| Total | 9,809 (100.0%) | 714 (100.0%) |
Monthly Housing Cost Tiers in New City
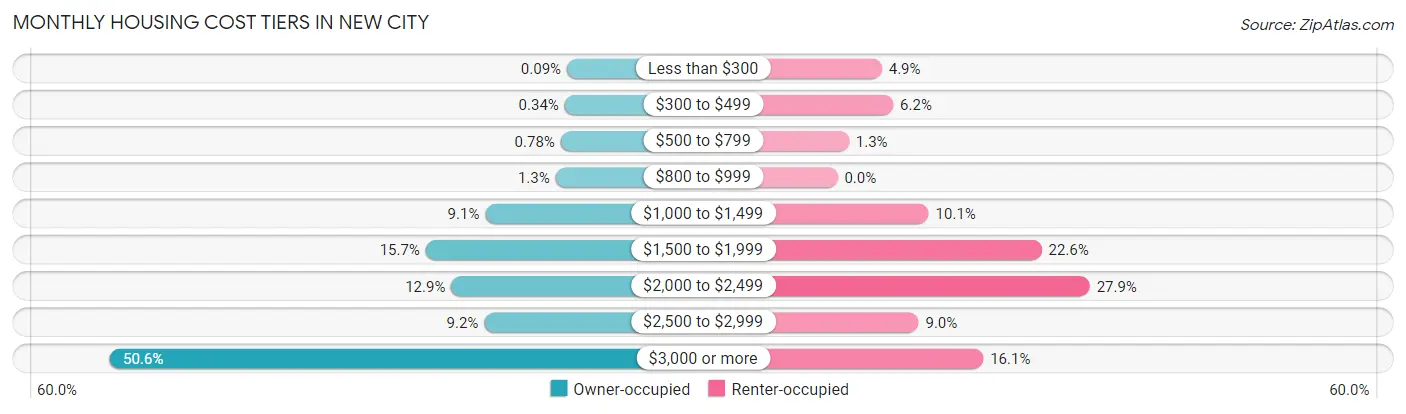
| Monthly Cost | Owner-occupied | Renter-occupied |
| Less than $300 | 9 (0.1%) | 35 (4.9%) |
| $300 to $499 | 33 (0.3%) | 44 (6.2%) |
| $500 to $799 | 77 (0.8%) | 9 (1.3%) |
| $800 to $999 | 131 (1.3%) | 0 (0.0%) |
| $1,000 to $1,499 | 894 (9.1%) | 72 (10.1%) |
| $1,500 to $1,999 | 1,539 (15.7%) | 161 (22.6%) |
| $2,000 to $2,499 | 1,262 (12.9%) | 199 (27.9%) |
| $2,500 to $2,999 | 905 (9.2%) | 64 (9.0%) |
| $3,000 or more | 4,959 (50.6%) | 115 (16.1%) |
| Total | 9,809 (100.0%) | 714 (100.0%) |
Physical Housing Characteristics in New City
Housing Structures in New City
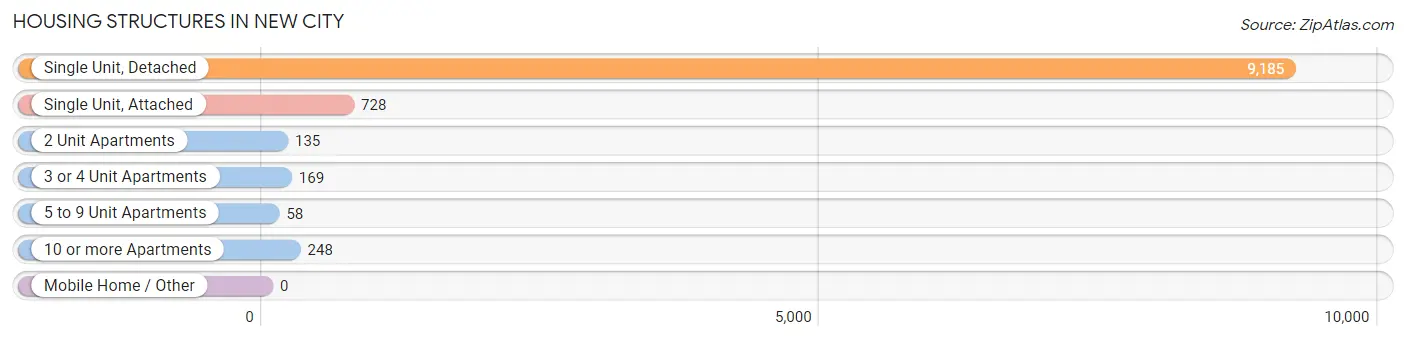
| Structure Type | # Housing Units | % Housing Units |
| Single Unit, Detached | 9,185 | 87.3% |
| Single Unit, Attached | 728 | 6.9% |
| 2 Unit Apartments | 135 | 1.3% |
| 3 or 4 Unit Apartments | 169 | 1.6% |
| 5 to 9 Unit Apartments | 58 | 0.5% |
| 10 or more Apartments | 248 | 2.4% |
| Mobile Home / Other | 0 | 0.0% |
| Total | 10,523 | 100.0% |
Housing Structures by Occupancy in New City
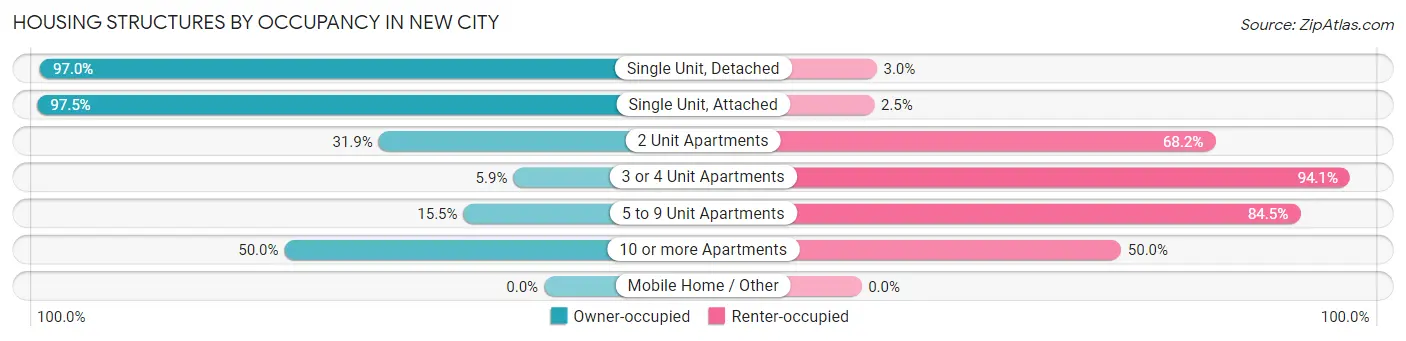
| Structure Type | Owner-occupied | Renter-occupied |
| Single Unit, Detached | 8,913 (97.0%) | 272 (3.0%) |
| Single Unit, Attached | 710 (97.5%) | 18 (2.5%) |
| 2 Unit Apartments | 43 (31.9%) | 92 (68.1%) |
| 3 or 4 Unit Apartments | 10 (5.9%) | 159 (94.1%) |
| 5 to 9 Unit Apartments | 9 (15.5%) | 49 (84.5%) |
| 10 or more Apartments | 124 (50.0%) | 124 (50.0%) |
| Mobile Home / Other | 0 (0.0%) | 0 (0.0%) |
| Total | 9,809 (93.2%) | 714 (6.8%) |
Housing Structures by Number of Rooms in New City
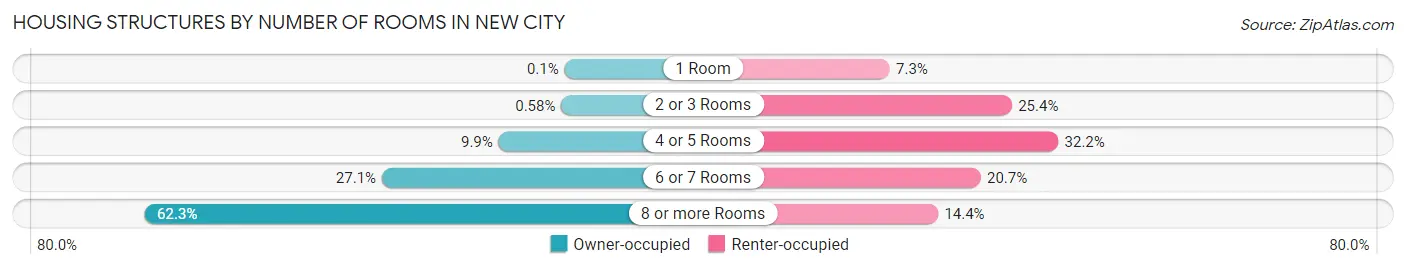
| Number of Rooms | Owner-occupied | Renter-occupied |
| 1 Room | 10 (0.1%) | 52 (7.3%) |
| 2 or 3 Rooms | 57 (0.6%) | 181 (25.4%) |
| 4 or 5 Rooms | 967 (9.9%) | 230 (32.2%) |
| 6 or 7 Rooms | 2,661 (27.1%) | 148 (20.7%) |
| 8 or more Rooms | 6,114 (62.3%) | 103 (14.4%) |
| Total | 9,809 (100.0%) | 714 (100.0%) |
Housing Structure by Heating Type in New City
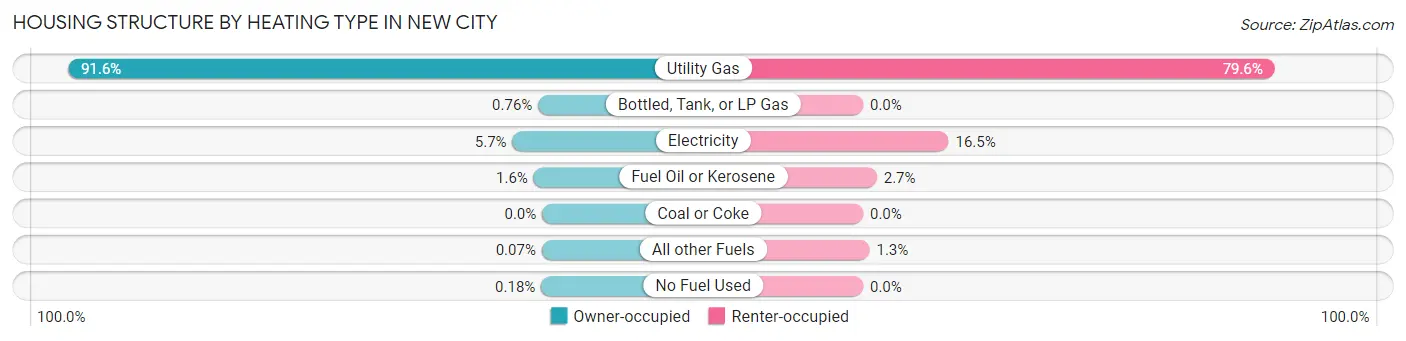
| Heating Type | Owner-occupied | Renter-occupied |
| Utility Gas | 8,987 (91.6%) | 568 (79.5%) |
| Bottled, Tank, or LP Gas | 75 (0.8%) | 0 (0.0%) |
| Electricity | 562 (5.7%) | 118 (16.5%) |
| Fuel Oil or Kerosene | 160 (1.6%) | 19 (2.7%) |
| Coal or Coke | 0 (0.0%) | 0 (0.0%) |
| All other Fuels | 7 (0.1%) | 9 (1.3%) |
| No Fuel Used | 18 (0.2%) | 0 (0.0%) |
| Total | 9,809 (100.0%) | 714 (100.0%) |
Household Vehicle Usage in New City
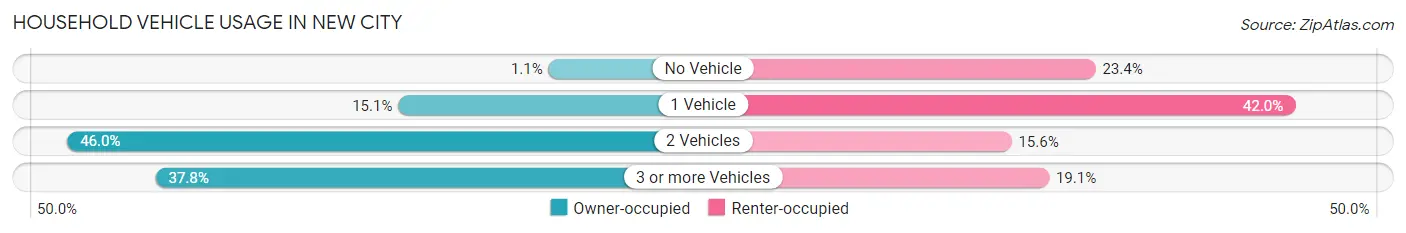
| Vehicles per Household | Owner-occupied | Renter-occupied |
| No Vehicle | 107 (1.1%) | 167 (23.4%) |
| 1 Vehicle | 1,483 (15.1%) | 300 (42.0%) |
| 2 Vehicles | 4,514 (46.0%) | 111 (15.5%) |
| 3 or more Vehicles | 3,705 (37.8%) | 136 (19.1%) |
| Total | 9,809 (100.0%) | 714 (100.0%) |
Real Estate & Mortgages in New City
Real Estate and Mortgage Overview in New City
| Characteristic | Without Mortgage | With Mortgage |
| Housing Units | 3,466 | 6,343 |
| Median Property Value | $582,700 | $604,200 |
| Median Household Income | $122,765 | $4,229 |
| Monthly Housing Costs | $1,501 | $4,801 |
| Real Estate Taxes | $10,001 | $42 |
Property Value by Mortgage Status in New City
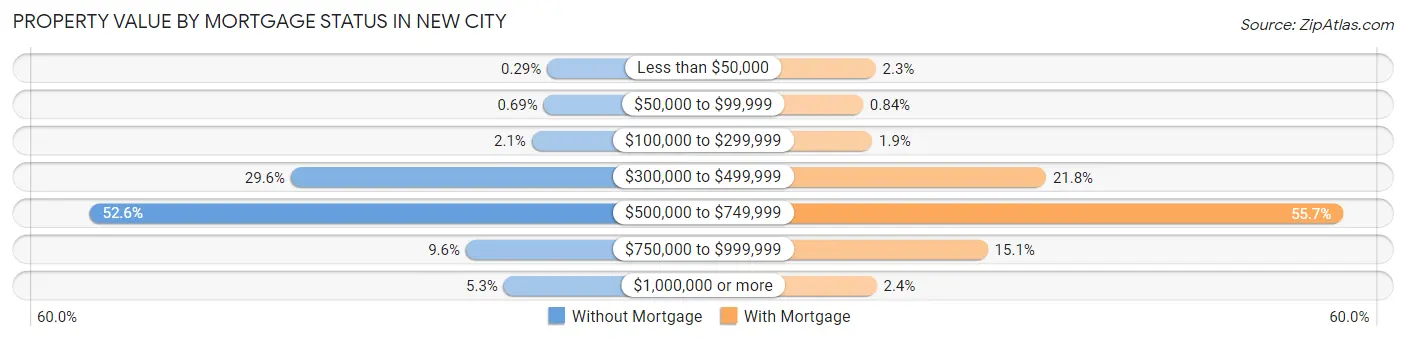
| Property Value | Without Mortgage | With Mortgage |
| Less than $50,000 | 10 (0.3%) | 145 (2.3%) |
| $50,000 to $99,999 | 24 (0.7%) | 53 (0.8%) |
| $100,000 to $299,999 | 71 (2.1%) | 120 (1.9%) |
| $300,000 to $499,999 | 1,025 (29.6%) | 1,380 (21.8%) |
| $500,000 to $749,999 | 1,822 (52.6%) | 3,535 (55.7%) |
| $750,000 to $999,999 | 332 (9.6%) | 958 (15.1%) |
| $1,000,000 or more | 182 (5.2%) | 152 (2.4%) |
| Total | 3,466 (100.0%) | 6,343 (100.0%) |
Household Income by Mortgage Status in New City
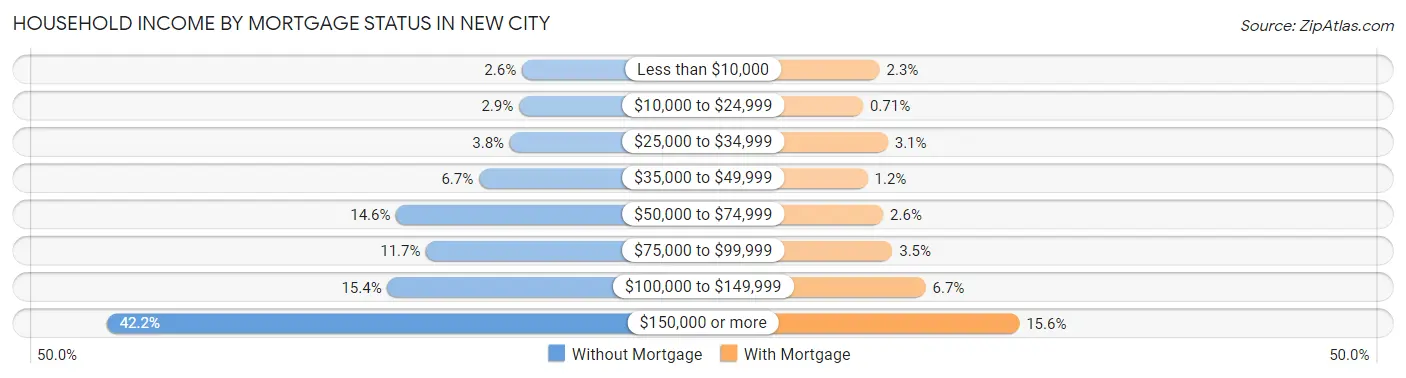
| Household Income | Without Mortgage | With Mortgage |
| Less than $10,000 | 91 (2.6%) | 145 (2.3%) |
| $10,000 to $24,999 | 101 (2.9%) | 45 (0.7%) |
| $25,000 to $34,999 | 131 (3.8%) | 195 (3.1%) |
| $35,000 to $49,999 | 233 (6.7%) | 73 (1.1%) |
| $50,000 to $74,999 | 506 (14.6%) | 167 (2.6%) |
| $75,000 to $99,999 | 407 (11.7%) | 222 (3.5%) |
| $100,000 to $149,999 | 535 (15.4%) | 423 (6.7%) |
| $150,000 or more | 1,462 (42.2%) | 989 (15.6%) |
| Total | 3,466 (100.0%) | 6,343 (100.0%) |
Property Value to Household Income Ratio in New City
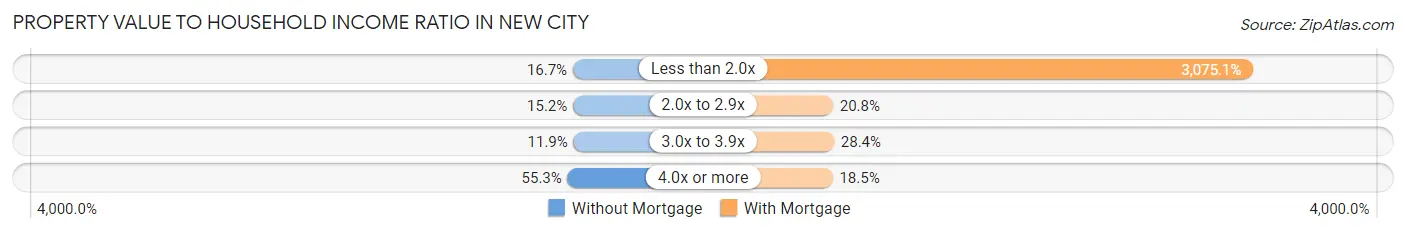
| Value-to-Income Ratio | Without Mortgage | With Mortgage |
| Less than 2.0x | 579 (16.7%) | 195,054 (3,075.1%) |
| 2.0x to 2.9x | 527 (15.2%) | 1,320 (20.8%) |
| 3.0x to 3.9x | 411 (11.9%) | 1,801 (28.4%) |
| 4.0x or more | 1,915 (55.2%) | 1,171 (18.5%) |
| Total | 3,466 (100.0%) | 6,343 (100.0%) |
Real Estate Taxes by Mortgage Status in New City
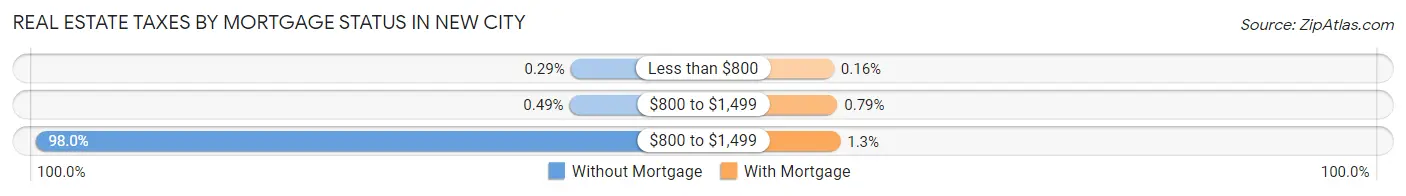
| Property Taxes | Without Mortgage | With Mortgage |
| Less than $800 | 10 (0.3%) | 10 (0.2%) |
| $800 to $1,499 | 17 (0.5%) | 50 (0.8%) |
| $800 to $1,499 | 3,397 (98.0%) | 84 (1.3%) |
| Total | 3,466 (100.0%) | 6,343 (100.0%) |
Health & Disability in New City
Health Insurance Coverage by Age in New City
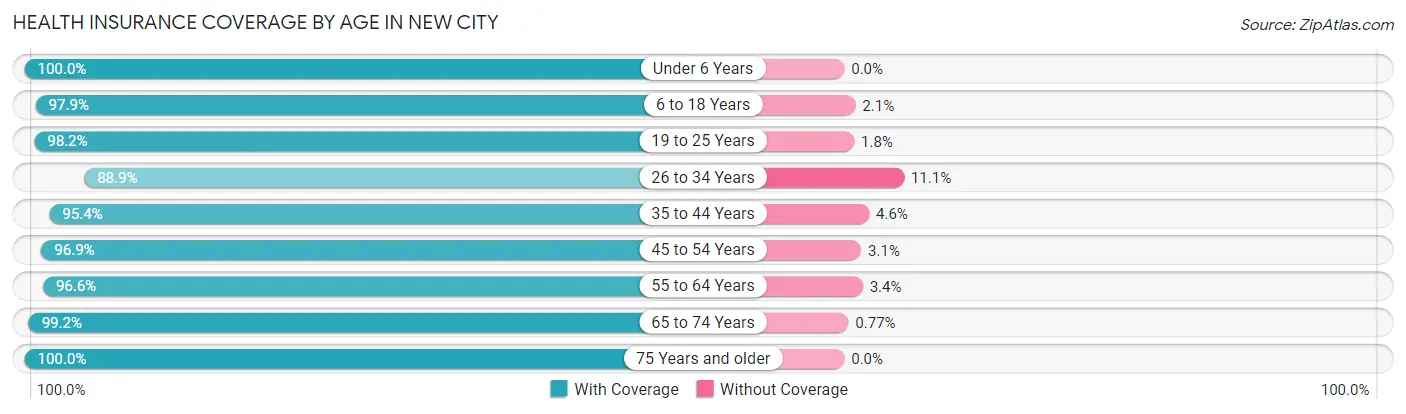
| Age Bracket | With Coverage | Without Coverage |
| Under 6 Years | 2,156 (100.0%) | 0 (0.0%) |
| 6 to 18 Years | 5,394 (97.9%) | 114 (2.1%) |
| 19 to 25 Years | 2,628 (98.2%) | 49 (1.8%) |
| 26 to 34 Years | 2,516 (88.9%) | 315 (11.1%) |
| 35 to 44 Years | 3,955 (95.4%) | 192 (4.6%) |
| 45 to 54 Years | 4,408 (96.9%) | 143 (3.1%) |
| 55 to 64 Years | 4,866 (96.6%) | 173 (3.4%) |
| 65 to 74 Years | 3,860 (99.2%) | 30 (0.8%) |
| 75 Years and older | 2,905 (100.0%) | 0 (0.0%) |
| Total | 32,688 (97.0%) | 1,016 (3.0%) |
Health Insurance Coverage by Citizenship Status in New City
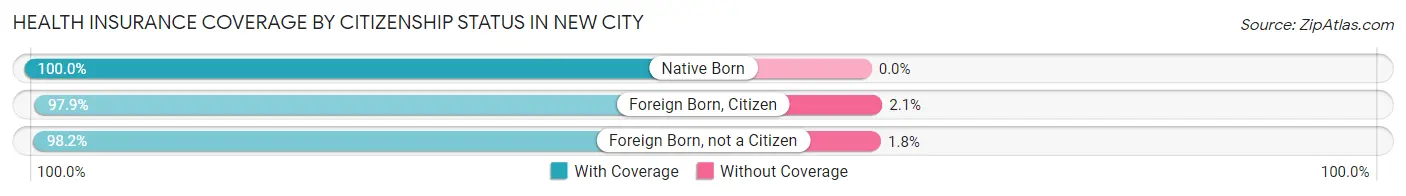
| Citizenship Status | With Coverage | Without Coverage |
| Native Born | 2,156 (100.0%) | 0 (0.0%) |
| Foreign Born, Citizen | 5,394 (97.9%) | 114 (2.1%) |
| Foreign Born, not a Citizen | 2,628 (98.2%) | 49 (1.8%) |
Health Insurance Coverage by Household Income in New City
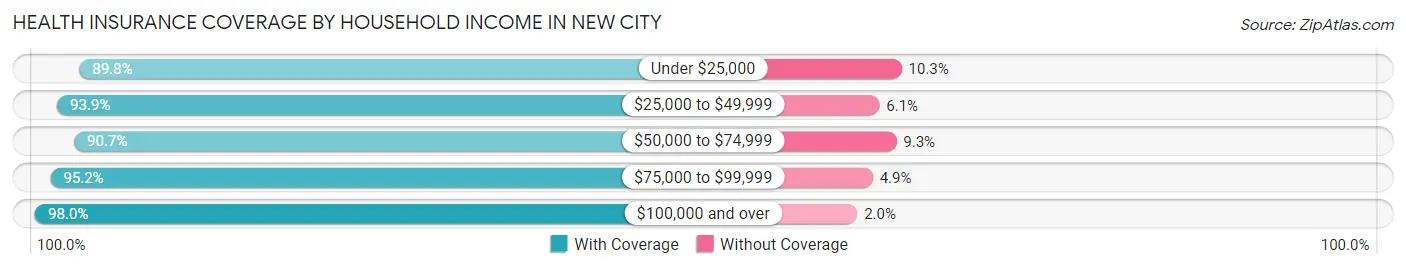
| Household Income | With Coverage | Without Coverage |
| Under $25,000 | 1,024 (89.7%) | 117 (10.2%) |
| $25,000 to $49,999 | 1,263 (93.9%) | 82 (6.1%) |
| $50,000 to $74,999 | 1,659 (90.7%) | 170 (9.3%) |
| $75,000 to $99,999 | 2,489 (95.2%) | 127 (4.9%) |
| $100,000 and over | 26,013 (98.0%) | 520 (2.0%) |
Public vs Private Health Insurance Coverage by Age in New City
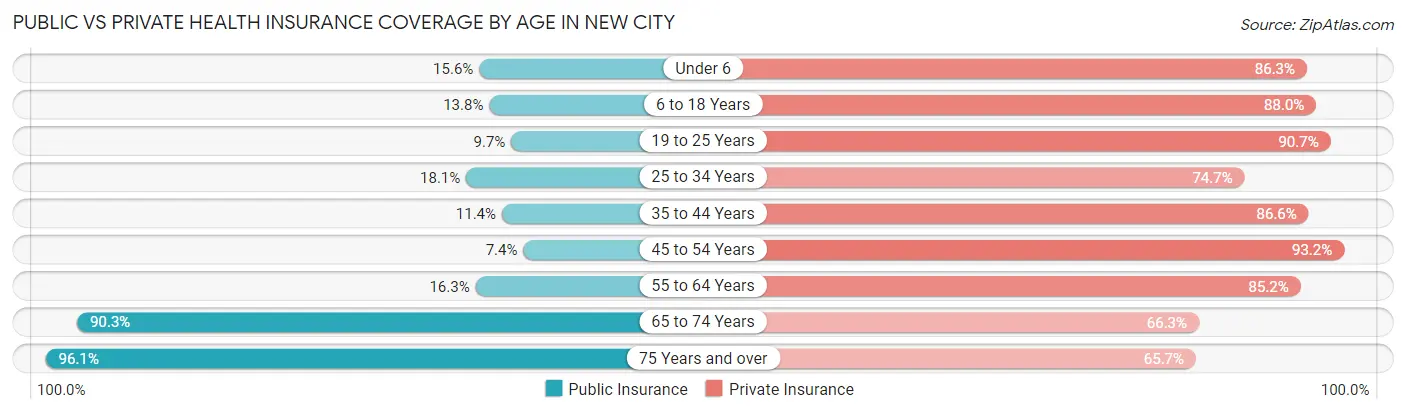
| Age Bracket | Public Insurance | Private Insurance |
| Under 6 | 337 (15.6%) | 1,861 (86.3%) |
| 6 to 18 Years | 758 (13.8%) | 4,849 (88.0%) |
| 19 to 25 Years | 259 (9.7%) | 2,428 (90.7%) |
| 25 to 34 Years | 511 (18.0%) | 2,116 (74.7%) |
| 35 to 44 Years | 473 (11.4%) | 3,593 (86.6%) |
| 45 to 54 Years | 338 (7.4%) | 4,242 (93.2%) |
| 55 to 64 Years | 822 (16.3%) | 4,291 (85.2%) |
| 65 to 74 Years | 3,512 (90.3%) | 2,578 (66.3%) |
| 75 Years and over | 2,792 (96.1%) | 1,909 (65.7%) |
| Total | 9,802 (29.1%) | 27,867 (82.7%) |
Disability Status by Sex by Age in New City
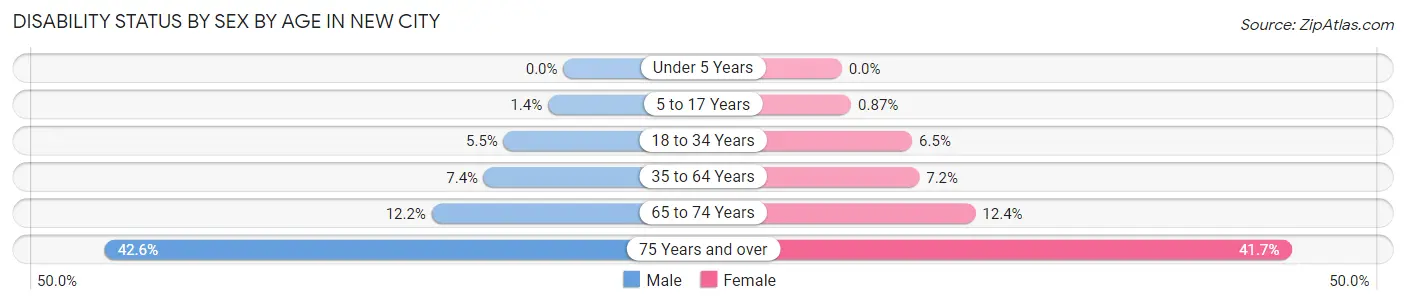
| Age Bracket | Male | Female |
| Under 5 Years | 0 (0.0%) | 0 (0.0%) |
| 5 to 17 Years | 38 (1.4%) | 24 (0.9%) |
| 18 to 34 Years | 174 (5.5%) | 185 (6.5%) |
| 35 to 64 Years | 497 (7.4%) | 503 (7.2%) |
| 65 to 74 Years | 229 (12.2%) | 250 (12.4%) |
| 75 Years and over | 518 (42.6%) | 704 (41.7%) |
Disability Class by Sex by Age in New City
Disability Class: Hearing Difficulty
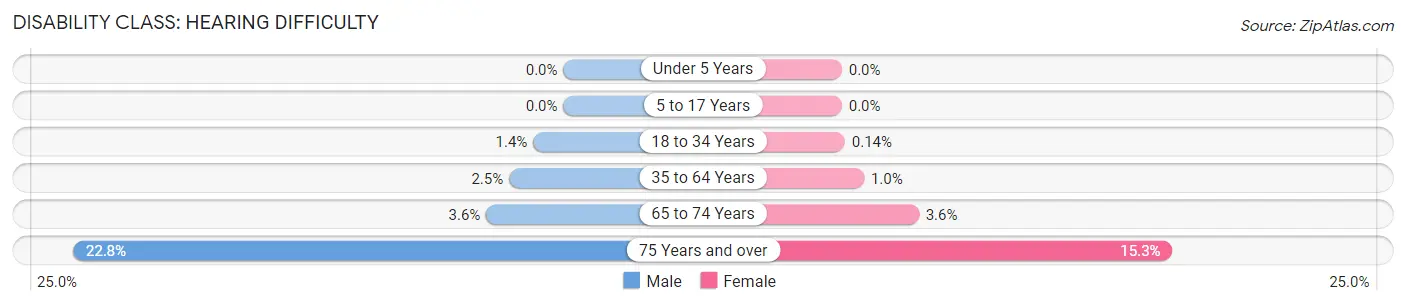
| Age Bracket | Male | Female |
| Under 5 Years | 0 (0.0%) | 0 (0.0%) |
| 5 to 17 Years | 0 (0.0%) | 0 (0.0%) |
| 18 to 34 Years | 44 (1.4%) | 4 (0.1%) |
| 35 to 64 Years | 170 (2.5%) | 72 (1.0%) |
| 65 to 74 Years | 67 (3.6%) | 72 (3.6%) |
| 75 Years and over | 277 (22.8%) | 259 (15.3%) |
Disability Class: Vision Difficulty
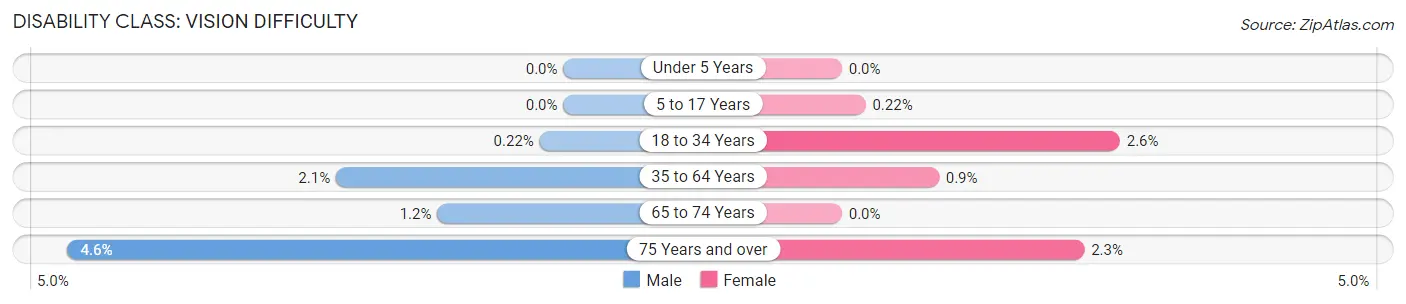
| Age Bracket | Male | Female |
| Under 5 Years | 0 (0.0%) | 0 (0.0%) |
| 5 to 17 Years | 0 (0.0%) | 6 (0.2%) |
| 18 to 34 Years | 7 (0.2%) | 73 (2.6%) |
| 35 to 64 Years | 142 (2.1%) | 63 (0.9%) |
| 65 to 74 Years | 22 (1.2%) | 0 (0.0%) |
| 75 Years and over | 56 (4.6%) | 38 (2.2%) |
Disability Class: Cognitive Difficulty
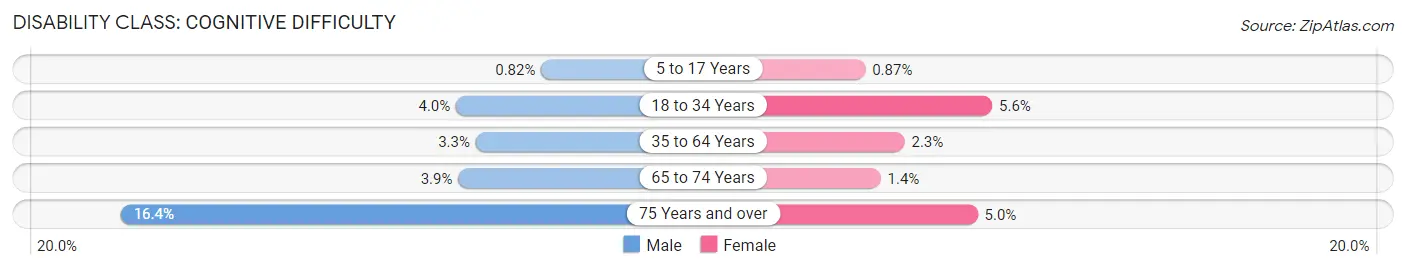
| Age Bracket | Male | Female |
| 5 to 17 Years | 22 (0.8%) | 24 (0.9%) |
| 18 to 34 Years | 125 (4.0%) | 158 (5.6%) |
| 35 to 64 Years | 219 (3.3%) | 163 (2.3%) |
| 65 to 74 Years | 73 (3.9%) | 29 (1.4%) |
| 75 Years and over | 200 (16.4%) | 85 (5.0%) |
Disability Class: Ambulatory Difficulty
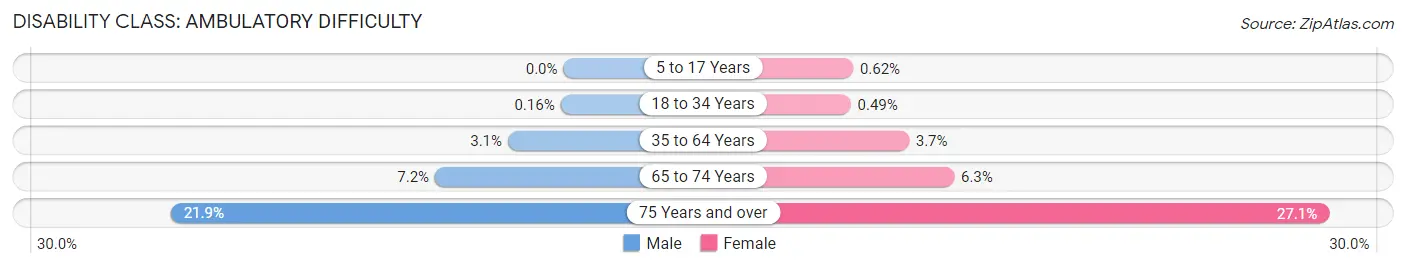
| Age Bracket | Male | Female |
| 5 to 17 Years | 0 (0.0%) | 17 (0.6%) |
| 18 to 34 Years | 5 (0.2%) | 14 (0.5%) |
| 35 to 64 Years | 208 (3.1%) | 261 (3.7%) |
| 65 to 74 Years | 134 (7.1%) | 126 (6.2%) |
| 75 Years and over | 266 (21.9%) | 458 (27.1%) |
Disability Class: Self-Care Difficulty
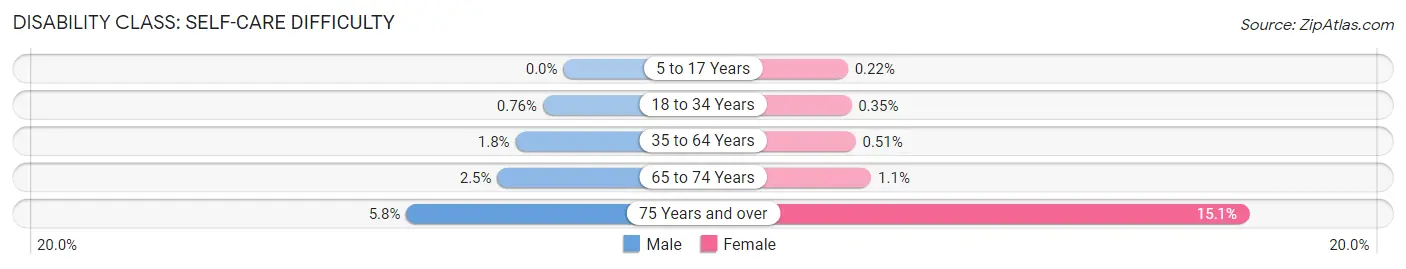
| Age Bracket | Male | Female |
| 5 to 17 Years | 0 (0.0%) | 6 (0.2%) |
| 18 to 34 Years | 24 (0.8%) | 10 (0.4%) |
| 35 to 64 Years | 120 (1.8%) | 36 (0.5%) |
| 65 to 74 Years | 46 (2.5%) | 22 (1.1%) |
| 75 Years and over | 71 (5.8%) | 255 (15.1%) |
Technology Access in New City
Computing Device Access in New City
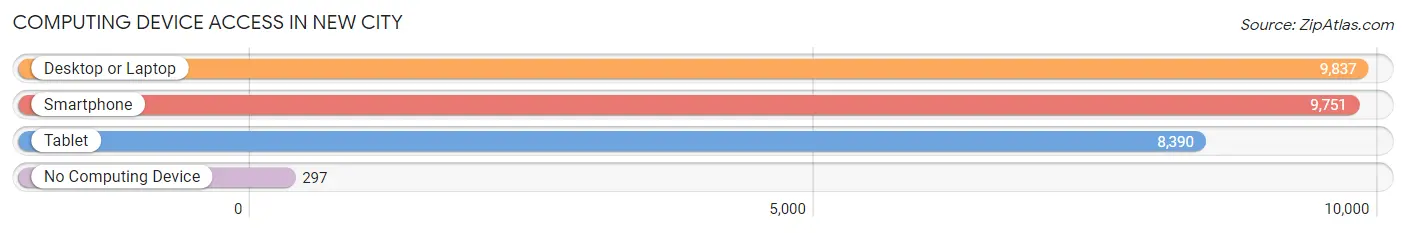
| Device Type | # Households | % Households |
| Desktop or Laptop | 9,837 | 93.5% |
| Smartphone | 9,751 | 92.7% |
| Tablet | 8,390 | 79.7% |
| No Computing Device | 297 | 2.8% |
| Total | 10,523 | 100.0% |
Internet Access in New City
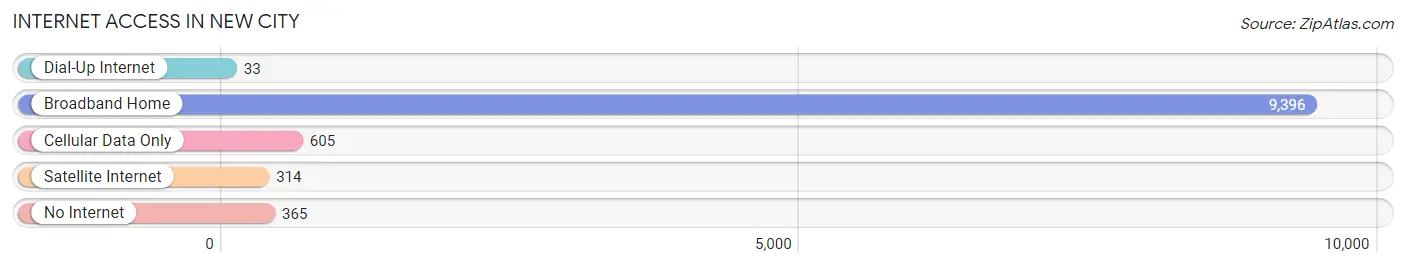
| Internet Type | # Households | % Households |
| Dial-Up Internet | 33 | 0.3% |
| Broadband Home | 9,396 | 89.3% |
| Cellular Data Only | 605 | 5.8% |
| Satellite Internet | 314 | 3.0% |
| No Internet | 365 | 3.5% |
| Total | 10,523 | 100.0% |
New City Summary
New City is a village located in the town of Clarkstown in Rockland County, New York. It is located about 20 miles north of New York City and is part of the New York metropolitan area. The village has a population of about 10,000 people and is a popular destination for commuters due to its proximity to New York City.
Geography
New City is located in the town of Clarkstown in Rockland County, New York. It is located about 20 miles north of New York City and is part of the New York metropolitan area. The village is situated on the western side of the Hudson River and is bordered by the towns of Orangetown to the north, Ramapo to the east, and Haverstraw to the south. The village is located in the Ramapo Mountains and is surrounded by hills and forests. The village is home to several parks, including the Rockland Lake State Park, which offers a variety of recreational activities.
Economy
New City is a popular destination for commuters due to its proximity to New York City. The village is home to several businesses, including retail stores, restaurants, and professional services. The village is also home to several corporate headquarters, including the headquarters of the pharmaceutical company Pfizer. The village is also home to several medical centers, including the New City Medical Center.
Demographics
As of the 2010 census, the population of New City was 10,356. The racial makeup of the village was 79.3% White, 8.2% African American, 0.2% Native American, 6.2% Asian, 0.1% Pacific Islander, and 4.9% from other races. The median household income in New City was $90,845, and the median family income was $103,945. The per capita income in New City was $41,945.
Conclusion
New City is a village located in the town of Clarkstown in Rockland County, New York. It is located about 20 miles north of New York City and is part of the New York metropolitan area. The village has a population of about 10,000 people and is a popular destination for commuters due to its proximity to New York City. The village is home to several businesses, including retail stores, restaurants, and professional services. The village is also home to several corporate headquarters, including the headquarters of the pharmaceutical company Pfizer. The village is also home to several medical centers, including the New City Medical Center. As of the 2010 census, the population of New City was 10,356. The racial makeup of the village was 79.3% White, 8.2% African American, 0.2% Native American, 6.2% Asian, 0.1% Pacific Islander, and 4.9% from other races. The median household income in New City was $90,845, and the median family income was $103,945. The per capita income in New City was $41,945.
Common Questions
What is Per Capita Income in New City?
Per Capita income in New City is $61,573.
What is the Median Family Income in New City?
Median Family Income in New City is $180,752.
What is the Median Household income in New City?
Median Household Income in New City is $168,672.
What is Income or Wage Gap in New City?
Income or Wage Gap in New City is 32.6%.
Women in New City earn 67.4 cents for every dollar earned by a man.
What is Inequality or Gini Index in New City?
Inequality or Gini Index in New City is 0.40.
What is the Total Population of New City?
Total Population of New City is 33,837.
What is the Total Male Population of New City?
Total Male Population of New City is 16,445.
What is the Total Female Population of New City?
Total Female Population of New City is 17,392.
What is the Ratio of Males per 100 Females in New City?
There are 94.55 Males per 100 Females in New City.
What is the Ratio of Females per 100 Males in New City?
There are 105.76 Females per 100 Males in New City.
What is the Median Population Age in New City?
Median Population Age in New City is 43.3 Years.
What is the Average Family Size in New City
Average Family Size in New City is 3.5 People.
What is the Average Household Size in New City
Average Household Size in New City is 3.2 People.
How Large is the Labor Force in New City?
There are 17,959 People in the Labor Forcein in New City.
What is the Percentage of People in the Labor Force in New City?
64.8% of People are in the Labor Force in New City.
What is the Unemployment Rate in New City?
Unemployment Rate in New City is 7.2%.