Gloversville, NY Map & Demographics
Gloversville Map
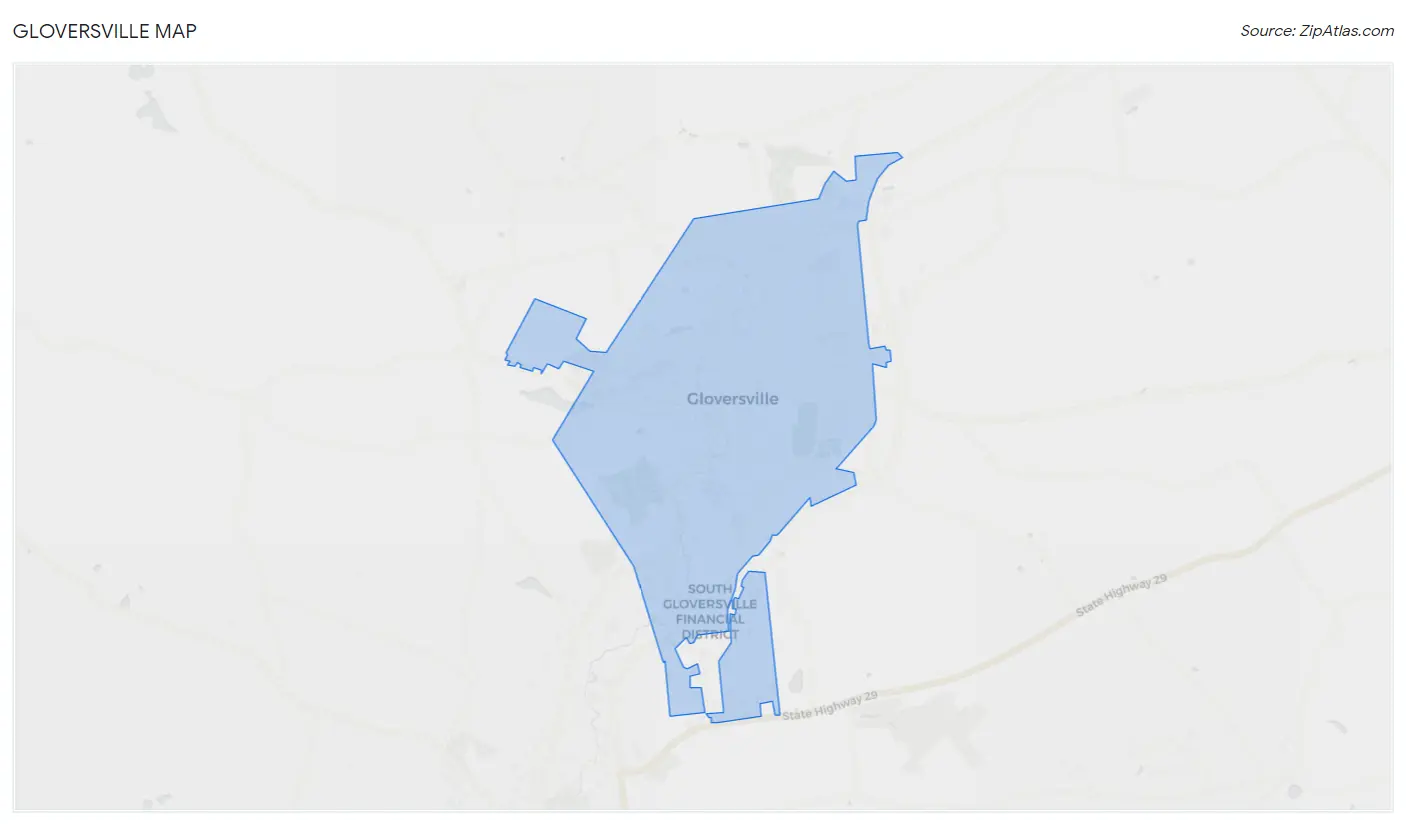
Gloversville Overview
$25,627
PER CAPITA INCOME
$53,971
AVG FAMILY INCOME
$47,205
AVG HOUSEHOLD INCOME
12.7%
WAGE / INCOME GAP [ % ]
87.3¢/ $1
WAGE / INCOME GAP [ $ ]
$9,812
FAMILY INCOME DEFICIT
0.41
INEQUALITY / GINI INDEX
15,113
TOTAL POPULATION
7,506
MALE POPULATION
7,607
FEMALE POPULATION
98.67
MALES / 100 FEMALES
101.35
FEMALES / 100 MALES
38.1
MEDIAN AGE
2.9
AVG FAMILY SIZE
2.4
AVG HOUSEHOLD SIZE
6,880
LABOR FORCE [ PEOPLE ]
56.6%
PERCENT IN LABOR FORCE
7.2%
UNEMPLOYMENT RATE
Gloversville Zip Codes
Gloversville Area Codes
Income in Gloversville
Income Overview in Gloversville
Per Capita Income in Gloversville is $25,627, while median incomes of families and households are $53,971 and $47,205 respectively.
| Characteristic | Number | Measure |
| Per Capita Income | 15,113 | $25,627 |
| Median Family Income | 3,748 | $53,971 |
| Mean Family Income | 3,748 | $66,955 |
| Median Household Income | 6,226 | $47,205 |
| Mean Household Income | 6,226 | $60,433 |
| Income Deficit | 3,748 | $9,812 |
| Wage / Income Gap (%) | 15,113 | 12.66% |
| Wage / Income Gap ($) | 15,113 | 87.34¢ per $1 |
| Gini / Inequality Index | 15,113 | 0.41 |
Earnings by Sex in Gloversville
Average Earnings in Gloversville are $32,796, $34,455 for men and $30,093 for women, a difference of 12.7%.
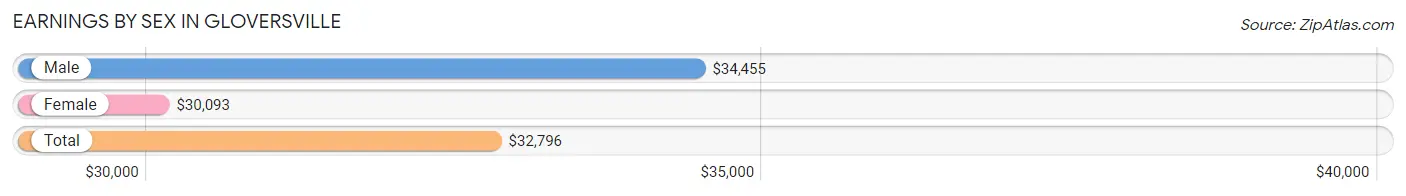
| Sex | Number | Average Earnings |
| Male | 3,883 (55.2%) | $34,455 |
| Female | 3,147 (44.8%) | $30,093 |
| Total | 7,030 (100.0%) | $32,796 |
Earnings by Sex by Income Bracket in Gloversville
The most common earnings brackets in Gloversville are $55,000 to $64,999 for men (458 | 11.8%) and $25,000 to $29,999 for women (346 | 11.0%).
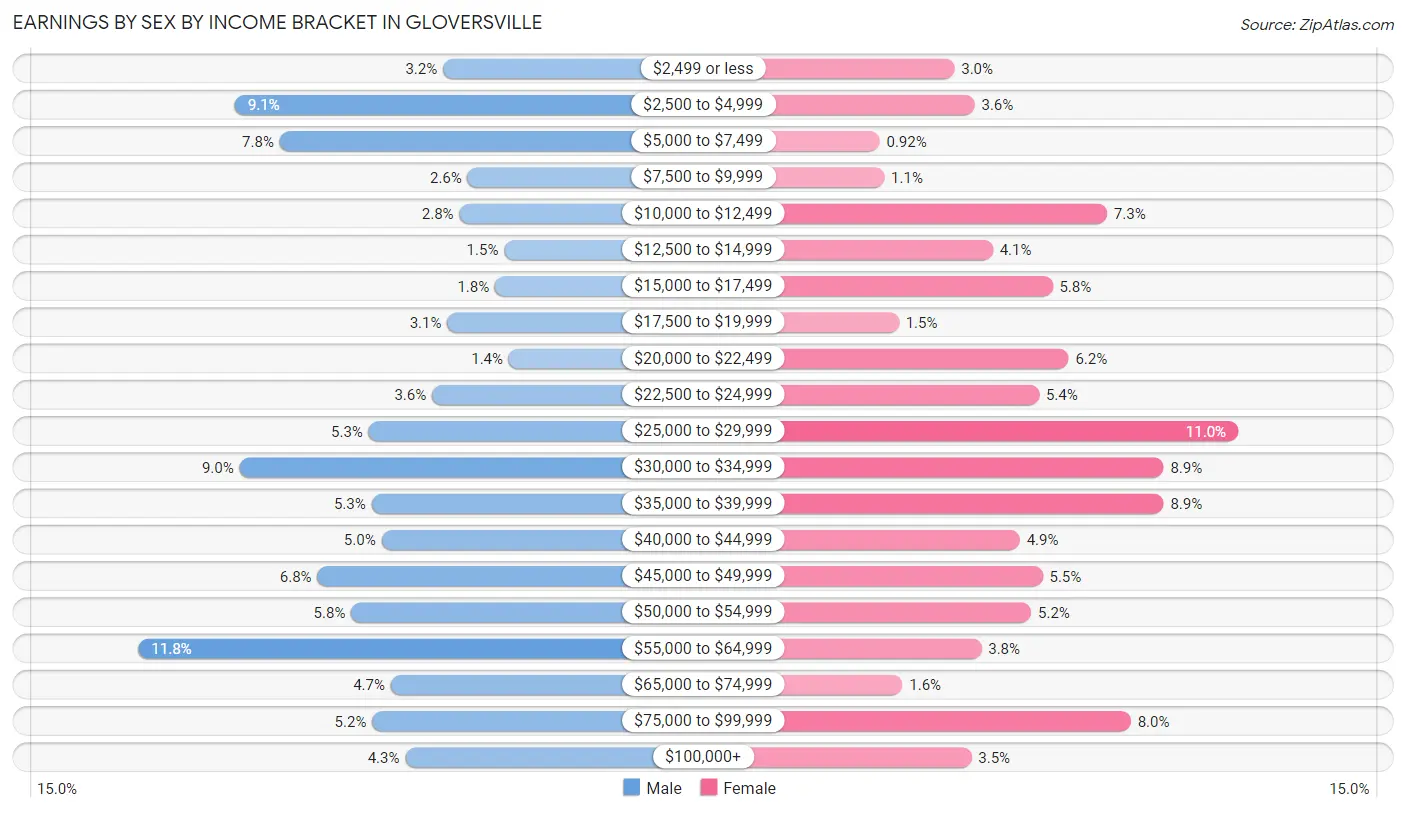
| Income | Male | Female |
| $2,499 or less | 126 (3.2%) | 95 (3.0%) |
| $2,500 to $4,999 | 353 (9.1%) | 113 (3.6%) |
| $5,000 to $7,499 | 304 (7.8%) | 29 (0.9%) |
| $7,500 to $9,999 | 99 (2.5%) | 33 (1.1%) |
| $10,000 to $12,499 | 108 (2.8%) | 230 (7.3%) |
| $12,500 to $14,999 | 59 (1.5%) | 129 (4.1%) |
| $15,000 to $17,499 | 69 (1.8%) | 182 (5.8%) |
| $17,500 to $19,999 | 121 (3.1%) | 46 (1.5%) |
| $20,000 to $22,499 | 54 (1.4%) | 196 (6.2%) |
| $22,500 to $24,999 | 138 (3.5%) | 170 (5.4%) |
| $25,000 to $29,999 | 207 (5.3%) | 346 (11.0%) |
| $30,000 to $34,999 | 348 (9.0%) | 280 (8.9%) |
| $35,000 to $39,999 | 204 (5.2%) | 280 (8.9%) |
| $40,000 to $44,999 | 193 (5.0%) | 153 (4.9%) |
| $45,000 to $49,999 | 263 (6.8%) | 173 (5.5%) |
| $50,000 to $54,999 | 226 (5.8%) | 163 (5.2%) |
| $55,000 to $64,999 | 458 (11.8%) | 119 (3.8%) |
| $65,000 to $74,999 | 183 (4.7%) | 49 (1.6%) |
| $75,000 to $99,999 | 203 (5.2%) | 251 (8.0%) |
| $100,000+ | 167 (4.3%) | 110 (3.5%) |
| Total | 3,883 (100.0%) | 3,147 (100.0%) |
Earnings by Sex by Educational Attainment in Gloversville
Average earnings in Gloversville are $42,326 for men and $34,298 for women, a difference of 19.0%. Men with an educational attainment of graduate degree enjoy the highest average annual earnings of $98,095, while those with less than high school education earn the least with $29,808. Women with an educational attainment of graduate degree earn the most with the average annual earnings of $83,047, while those with less than high school education have the smallest earnings of $21,544.
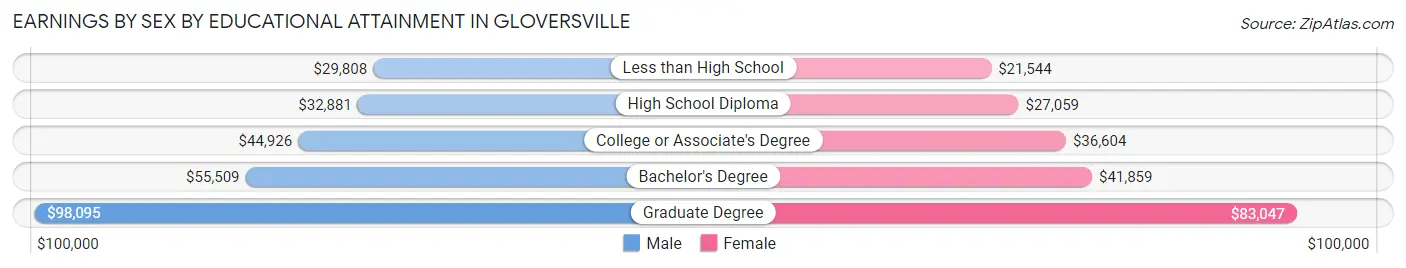
| Educational Attainment | Male Income | Female Income |
| Less than High School | $29,808 | $21,544 |
| High School Diploma | $32,881 | $27,059 |
| College or Associate's Degree | $44,926 | $36,604 |
| Bachelor's Degree | $55,509 | $41,859 |
| Graduate Degree | $98,095 | $83,047 |
| Total | $42,326 | $34,298 |
Family Income in Gloversville
Family Income Brackets in Gloversville
According to the Gloversville family income data, there are 802 families falling into the $50,000 to $74,999 income range, which is the most common income bracket and makes up 21.4% of all families. Conversely, the less than $10,000 income bracket is the least frequent group with only 94 families (2.5%) belonging to this category.
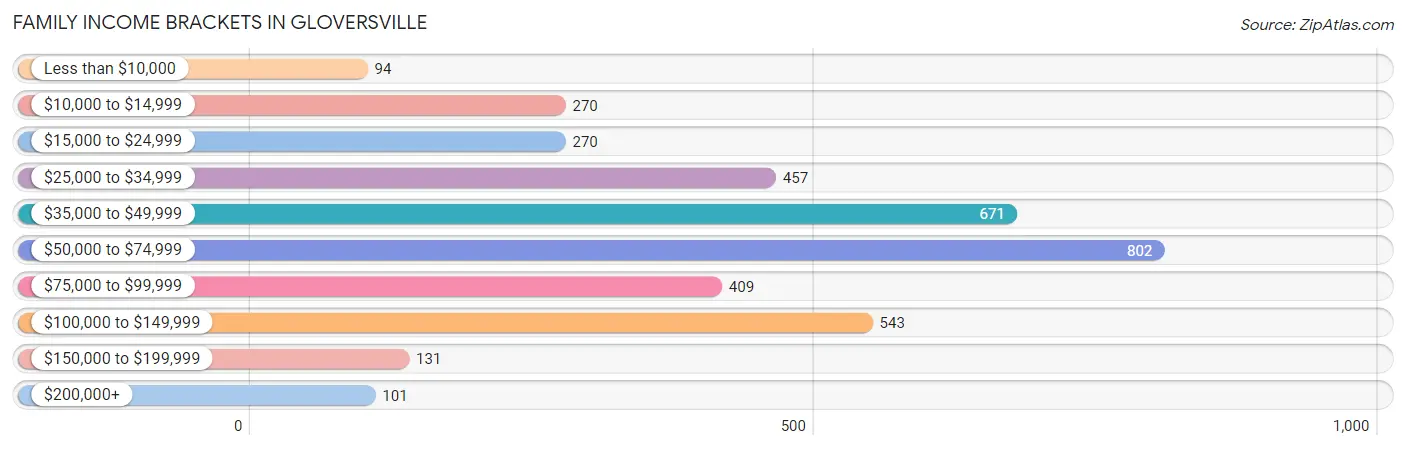
| Income Bracket | # Families | % Families |
| Less than $10,000 | 94 | 2.5% |
| $10,000 to $14,999 | 270 | 7.2% |
| $15,000 to $24,999 | 270 | 7.2% |
| $25,000 to $34,999 | 457 | 12.2% |
| $35,000 to $49,999 | 671 | 17.9% |
| $50,000 to $74,999 | 802 | 21.4% |
| $75,000 to $99,999 | 409 | 10.9% |
| $100,000 to $149,999 | 543 | 14.5% |
| $150,000 to $199,999 | 131 | 3.5% |
| $200,000+ | 101 | 2.7% |
Family Income by Famaliy Size in Gloversville
4-person families (561 | 15.0%) account for the highest median family income in Gloversville with $60,304 per family, while 2-person families (1,807 | 48.2%) have the highest median income of $27,513 per family member.
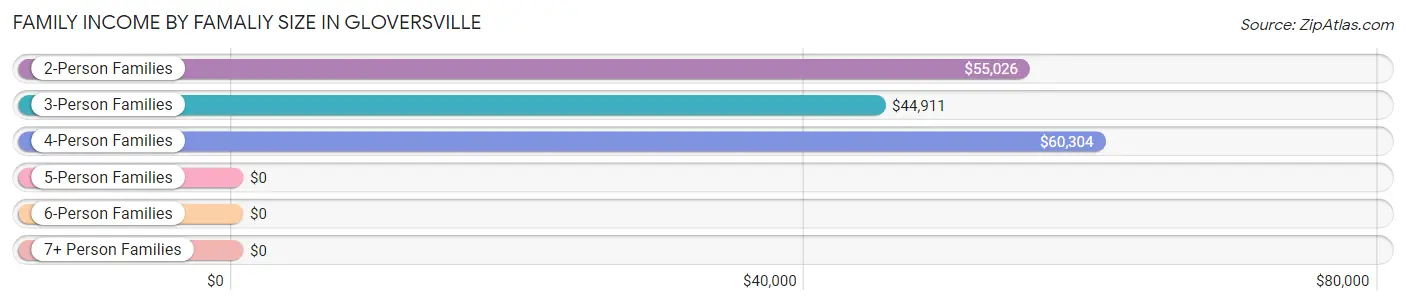
| Income Bracket | # Families | Median Income |
| 2-Person Families | 1,807 (48.2%) | $55,026 |
| 3-Person Families | 989 (26.4%) | $44,911 |
| 4-Person Families | 561 (15.0%) | $60,304 |
| 5-Person Families | 255 (6.8%) | $0 |
| 6-Person Families | 121 (3.2%) | $0 |
| 7+ Person Families | 15 (0.4%) | $0 |
| Total | 3,748 (100.0%) | $53,971 |
Family Income by Number of Earners in Gloversville
The median family income in Gloversville is $53,971, with families comprising 3+ earners (230) having the highest median family income of $113,409, while families with no earners (816) have the lowest median family income of $26,371, accounting for 6.1% and 21.8% of families, respectively.
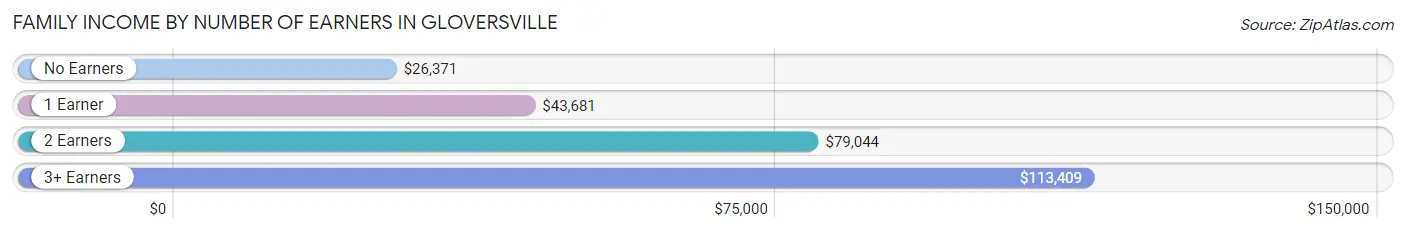
| Number of Earners | # Families | Median Income |
| No Earners | 816 (21.8%) | $26,371 |
| 1 Earner | 1,386 (37.0%) | $43,681 |
| 2 Earners | 1,316 (35.1%) | $79,044 |
| 3+ Earners | 230 (6.1%) | $113,409 |
| Total | 3,748 (100.0%) | $53,971 |
Household Income in Gloversville
Household Income Brackets in Gloversville
With 1,239 households falling in the category, the $50,000 to $74,999 income range is the most frequent in Gloversville, accounting for 19.9% of all households. In contrast, only 131 households (2.1%) fall into the $200,000+ income bracket, making it the least populous group.
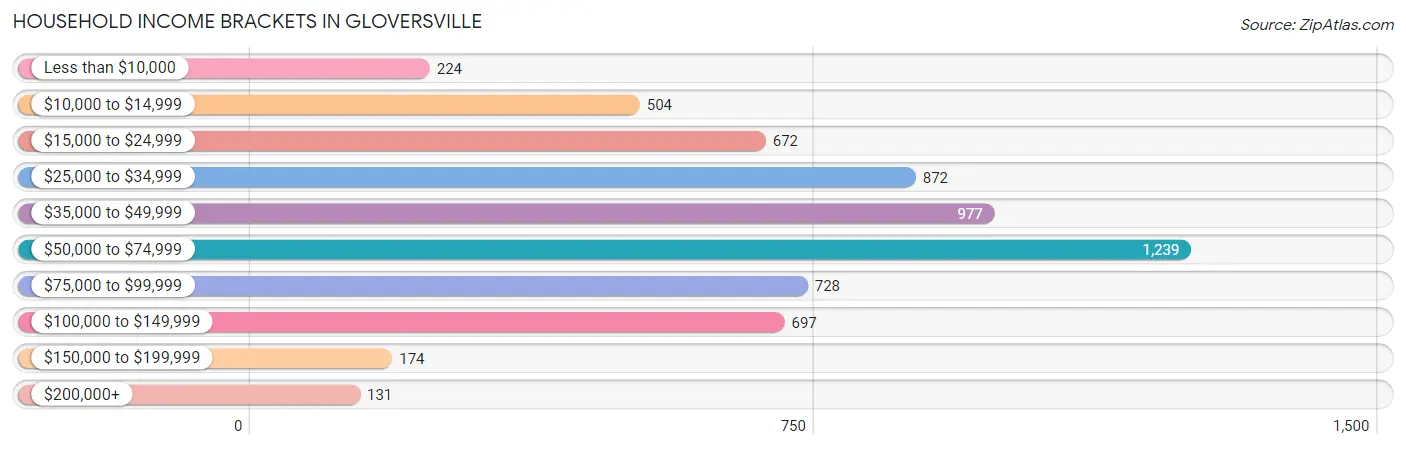
| Income Bracket | # Households | % Households |
| Less than $10,000 | 224 | 3.6% |
| $10,000 to $14,999 | 504 | 8.1% |
| $15,000 to $24,999 | 672 | 10.8% |
| $25,000 to $34,999 | 872 | 14.0% |
| $35,000 to $49,999 | 977 | 15.7% |
| $50,000 to $74,999 | 1,239 | 19.9% |
| $75,000 to $99,999 | 728 | 11.7% |
| $100,000 to $149,999 | 697 | 11.2% |
| $150,000 to $199,999 | 174 | 2.8% |
| $200,000+ | 131 | 2.1% |
Household Income by Householder Age in Gloversville
The median household income in Gloversville is $47,205, with the highest median household income of $58,125 found in the 25 to 44 years age bracket for the primary householder. A total of 1,849 households (29.7%) fall into this category. Meanwhile, the 15 to 24 years age bracket for the primary householder has the lowest median household income of $26,942, with 305 households (4.9%) in this group.
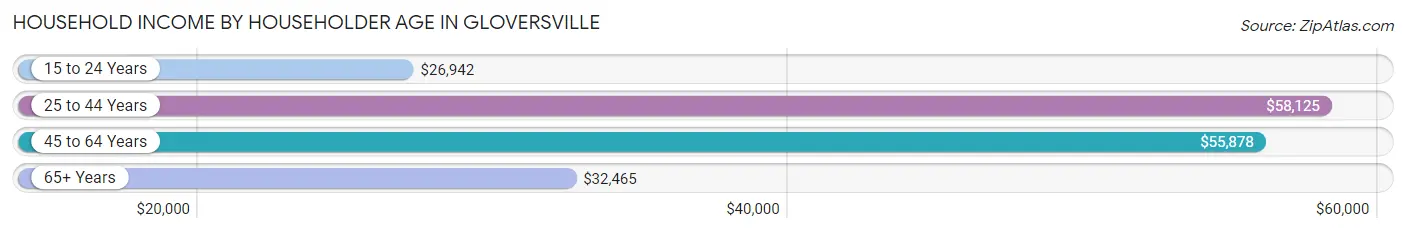
| Income Bracket | # Households | Median Income |
| 15 to 24 Years | 305 (4.9%) | $26,942 |
| 25 to 44 Years | 1,849 (29.7%) | $58,125 |
| 45 to 64 Years | 2,354 (37.8%) | $55,878 |
| 65+ Years | 1,718 (27.6%) | $32,465 |
| Total | 6,226 (100.0%) | $47,205 |
Poverty in Gloversville
Income Below Poverty by Sex and Age in Gloversville
With 22.1% poverty level for males and 19.3% for females among the residents of Gloversville, 5 year old males and 15 year old females are the most vulnerable to poverty, with 47 males (82.5%) and 44 females (50.0%) in their respective age groups living below the poverty level.
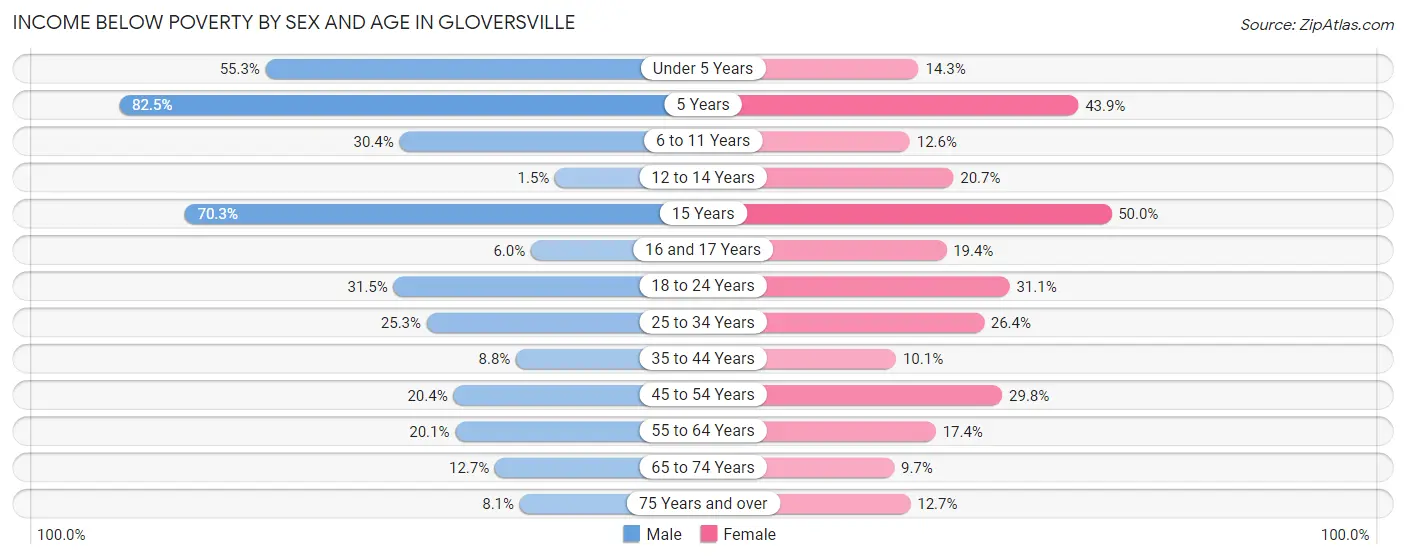
| Age Bracket | Male | Female |
| Under 5 Years | 258 (55.2%) | 56 (14.2%) |
| 5 Years | 47 (82.5%) | 43 (43.9%) |
| 6 to 11 Years | 155 (30.4%) | 47 (12.6%) |
| 12 to 14 Years | 6 (1.5%) | 89 (20.7%) |
| 15 Years | 71 (70.3%) | 44 (50.0%) |
| 16 and 17 Years | 10 (6.0%) | 25 (19.4%) |
| 18 to 24 Years | 219 (31.5%) | 207 (31.1%) |
| 25 to 34 Years | 287 (25.3%) | 242 (26.4%) |
| 35 to 44 Years | 72 (8.7%) | 113 (10.1%) |
| 45 to 54 Years | 190 (20.4%) | 233 (29.8%) |
| 55 to 64 Years | 219 (20.1%) | 202 (17.4%) |
| 65 to 74 Years | 70 (12.7%) | 65 (9.7%) |
| 75 Years and over | 43 (8.1%) | 90 (12.7%) |
| Total | 1,647 (22.1%) | 1,456 (19.3%) |
Income Above Poverty by Sex and Age in Gloversville
According to the poverty statistics in Gloversville, males aged 12 to 14 years and females aged 65 to 74 years are the age groups that are most secure financially, with 98.5% of males and 90.3% of females in these age groups living above the poverty line.
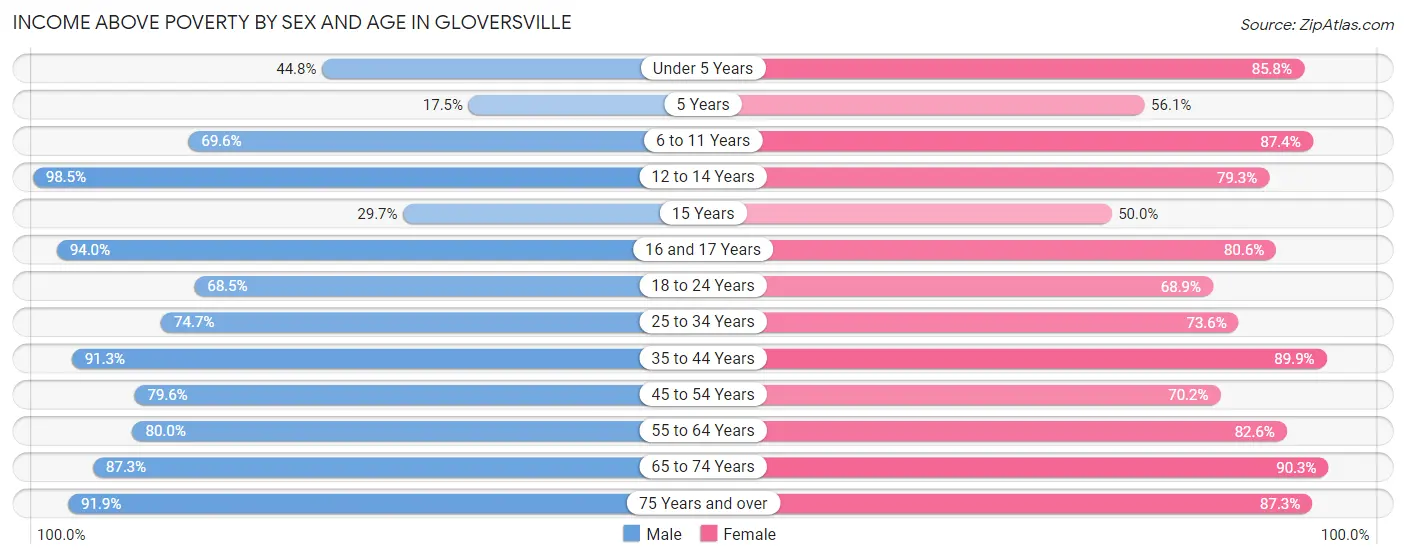
| Age Bracket | Male | Female |
| Under 5 Years | 209 (44.8%) | 337 (85.8%) |
| 5 Years | 10 (17.5%) | 55 (56.1%) |
| 6 to 11 Years | 355 (69.6%) | 325 (87.4%) |
| 12 to 14 Years | 389 (98.5%) | 341 (79.3%) |
| 15 Years | 30 (29.7%) | 44 (50.0%) |
| 16 and 17 Years | 157 (94.0%) | 104 (80.6%) |
| 18 to 24 Years | 476 (68.5%) | 458 (68.9%) |
| 25 to 34 Years | 846 (74.7%) | 676 (73.6%) |
| 35 to 44 Years | 751 (91.2%) | 1,010 (89.9%) |
| 45 to 54 Years | 742 (79.6%) | 550 (70.2%) |
| 55 to 64 Years | 873 (79.9%) | 957 (82.6%) |
| 65 to 74 Years | 482 (87.3%) | 605 (90.3%) |
| 75 Years and over | 490 (91.9%) | 618 (87.3%) |
| Total | 5,810 (77.9%) | 6,080 (80.7%) |
Income Below Poverty Among Married-Couple Families in Gloversville
The poverty statistics for married-couple families in Gloversville show that 8.7% or 175 of the total 2,005 families live below the poverty line. Families with 3 or 4 children have the highest poverty rate of 45.0%, comprising of 99 families. On the other hand, families with 5 or more children have the lowest poverty rate of 0.0%, which includes 0 families.
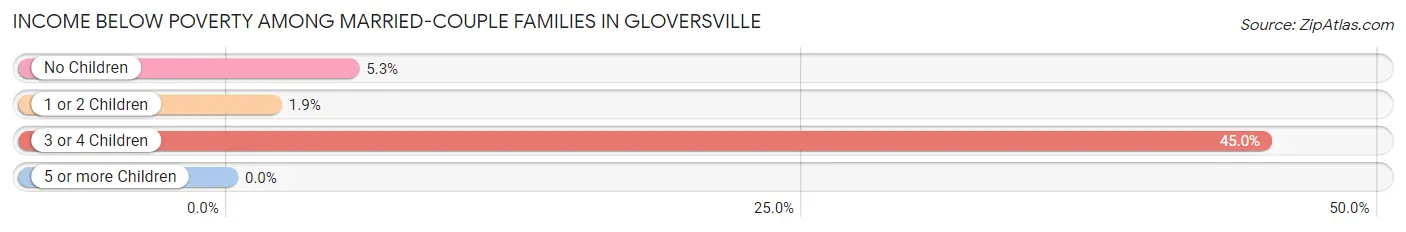
| Children | Above Poverty | Below Poverty |
| No Children | 1,183 (94.7%) | 66 (5.3%) |
| 1 or 2 Children | 513 (98.1%) | 10 (1.9%) |
| 3 or 4 Children | 121 (55.0%) | 99 (45.0%) |
| 5 or more Children | 13 (100.0%) | 0 (0.0%) |
| Total | 1,830 (91.3%) | 175 (8.7%) |
Income Below Poverty Among Single-Parent Households in Gloversville
According to the poverty data in Gloversville, 20.3% or 119 single-father households and 24.0% or 277 single-mother households are living below the poverty line. Among single-father households, those with 1 or 2 children have the highest poverty rate, with 85 households (37.4%) experiencing poverty. Likewise, among single-mother households, those with 5 or more children have the highest poverty rate, with 2 households (100.0%) falling below the poverty line.
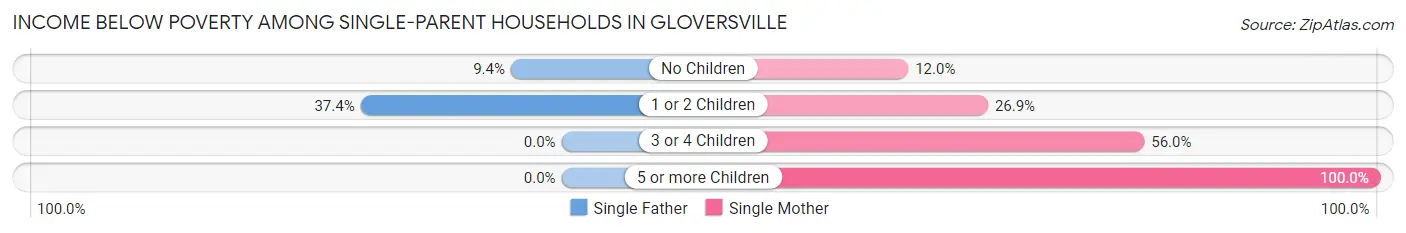
| Children | Single Father | Single Mother |
| No Children | 34 (9.4%) | 58 (12.0%) |
| 1 or 2 Children | 85 (37.4%) | 147 (26.9%) |
| 3 or 4 Children | 0 (0.0%) | 70 (56.0%) |
| 5 or more Children | 0 (0.0%) | 2 (100.0%) |
| Total | 119 (20.3%) | 277 (24.0%) |
Income Below Poverty Among Married-Couple vs Single-Parent Households in Gloversville
The poverty data for Gloversville shows that 175 of the married-couple family households (8.7%) and 396 of the single-parent households (22.7%) are living below the poverty level. Within the married-couple family households, those with 3 or 4 children have the highest poverty rate, with 99 households (45.0%) falling below the poverty line. Among the single-parent households, those with 5 or more children have the highest poverty rate, with 2 household (100.0%) living below poverty.
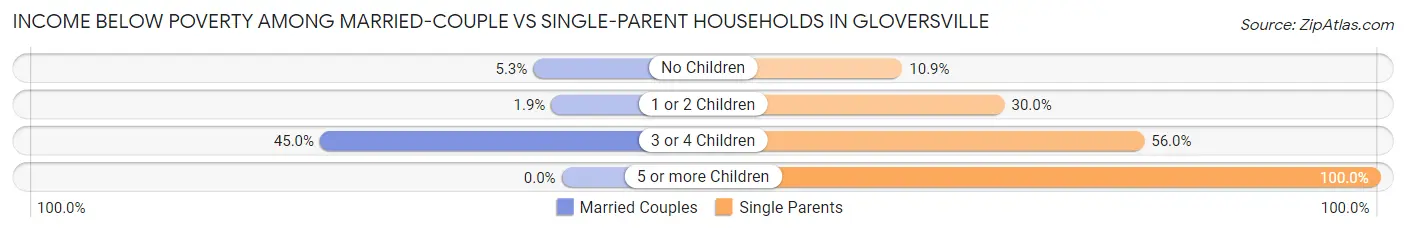
| Children | Married-Couple Families | Single-Parent Households |
| No Children | 66 (5.3%) | 92 (10.9%) |
| 1 or 2 Children | 10 (1.9%) | 232 (30.0%) |
| 3 or 4 Children | 99 (45.0%) | 70 (56.0%) |
| 5 or more Children | 0 (0.0%) | 2 (100.0%) |
| Total | 175 (8.7%) | 396 (22.7%) |
Race in Gloversville
The most populous races in Gloversville are White / Caucasian (12,952 | 85.7%), Two or more Races (1,287 | 8.5%), and Hispanic or Latino (791 | 5.2%).
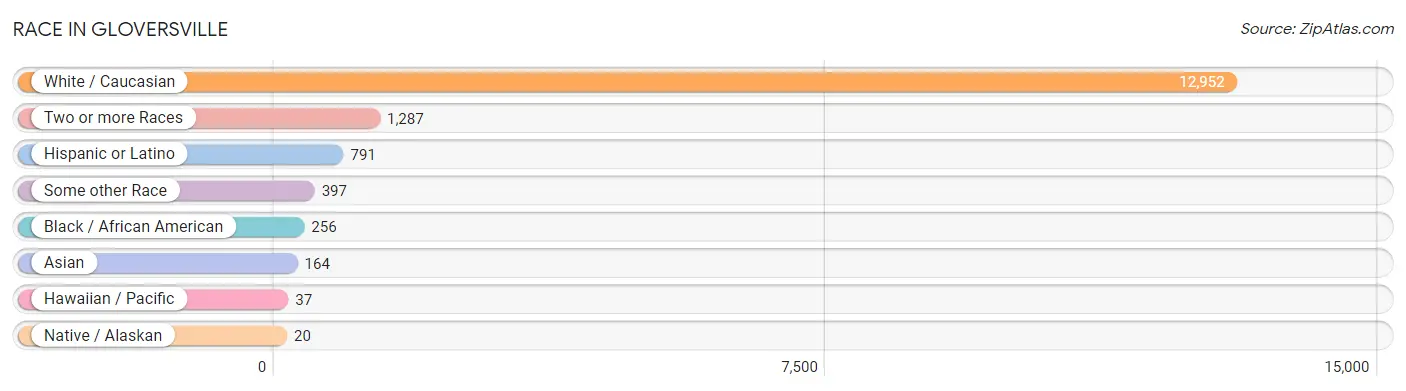
| Race | # Population | % Population |
| Asian | 164 | 1.1% |
| Black / African American | 256 | 1.7% |
| Hawaiian / Pacific | 37 | 0.2% |
| Hispanic or Latino | 791 | 5.2% |
| Native / Alaskan | 20 | 0.1% |
| White / Caucasian | 12,952 | 85.7% |
| Two or more Races | 1,287 | 8.5% |
| Some other Race | 397 | 2.6% |
| Total | 15,113 | 100.0% |
Ancestry in Gloversville
The most populous ancestries reported in Gloversville are German (2,958 | 19.6%), American (2,452 | 16.2%), Italian (1,900 | 12.6%), Irish (1,782 | 11.8%), and French (1,075 | 7.1%), together accounting for 67.3% of all Gloversville residents.
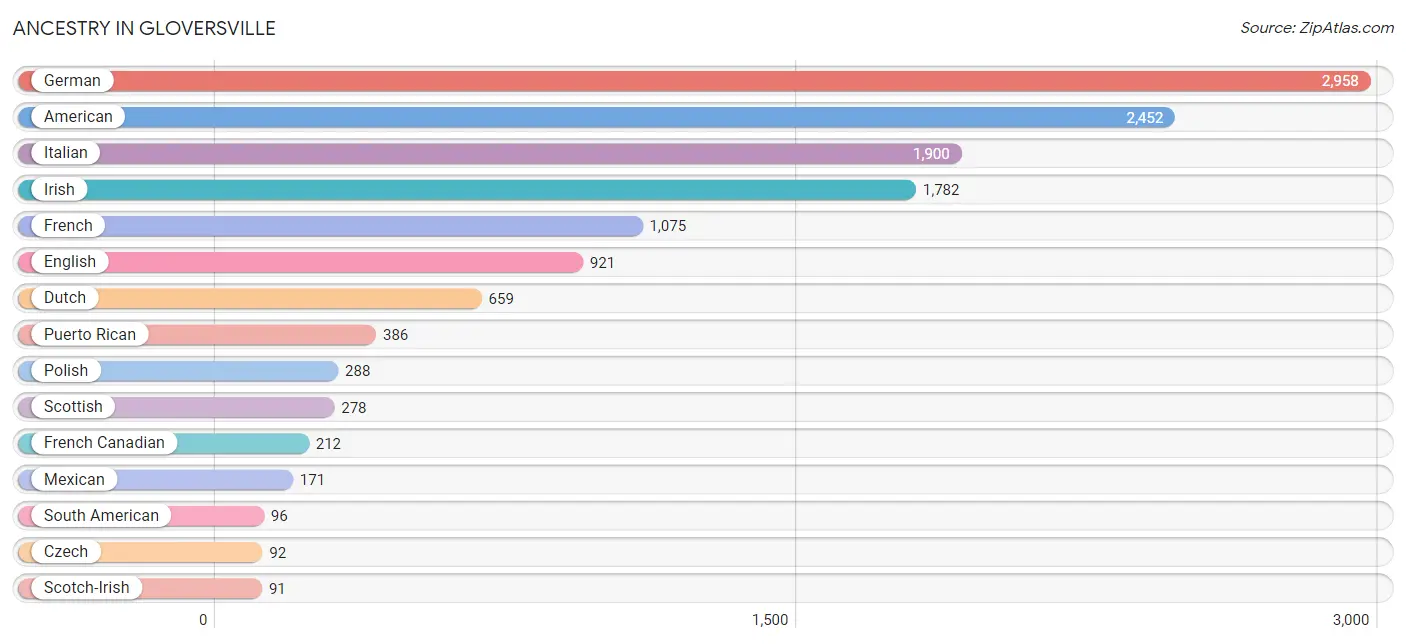
| Ancestry | # Population | % Population |
| African | 53 | 0.4% |
| American | 2,452 | 16.2% |
| Arab | 13 | 0.1% |
| Austrian | 10 | 0.1% |
| British | 30 | 0.2% |
| British West Indian | 18 | 0.1% |
| Burmese | 27 | 0.2% |
| Canadian | 12 | 0.1% |
| Colombian | 11 | 0.1% |
| Czech | 92 | 0.6% |
| Czechoslovakian | 51 | 0.3% |
| Danish | 16 | 0.1% |
| Dominican | 30 | 0.2% |
| Dutch | 659 | 4.4% |
| Eastern European | 51 | 0.3% |
| Ecuadorian | 85 | 0.6% |
| English | 921 | 6.1% |
| European | 63 | 0.4% |
| French | 1,075 | 7.1% |
| French Canadian | 212 | 1.4% |
| German | 2,958 | 19.6% |
| Greek | 31 | 0.2% |
| Hungarian | 5 | 0.0% |
| Indian (Asian) | 51 | 0.3% |
| Indonesian | 17 | 0.1% |
| Irish | 1,782 | 11.8% |
| Iroquois | 20 | 0.1% |
| Italian | 1,900 | 12.6% |
| Jamaican | 12 | 0.1% |
| Korean | 90 | 0.6% |
| Lebanese | 13 | 0.1% |
| Lithuanian | 65 | 0.4% |
| Mexican | 171 | 1.1% |
| Native Hawaiian | 37 | 0.2% |
| Norwegian | 14 | 0.1% |
| Polish | 288 | 1.9% |
| Portuguese | 90 | 0.6% |
| Puerto Rican | 386 | 2.5% |
| Russian | 68 | 0.4% |
| Scotch-Irish | 91 | 0.6% |
| Scottish | 278 | 1.8% |
| Slovak | 89 | 0.6% |
| Slovene | 8 | 0.1% |
| South American | 96 | 0.6% |
| Spaniard | 41 | 0.3% |
| Spanish | 19 | 0.1% |
| Sri Lankan | 6 | 0.0% |
| Subsaharan African | 53 | 0.4% |
| Swedish | 43 | 0.3% |
| Trinidadian and Tobagonian | 12 | 0.1% |
| Ukrainian | 3 | 0.0% |
| Vietnamese | 24 | 0.2% |
| Welsh | 19 | 0.1% |
| West Indian | 4 | 0.0% | View All 54 Rows |
Immigrants in Gloversville
The most numerous immigrant groups reported in Gloversville came from Asia (158 | 1.1%), South Eastern Asia (107 | 0.7%), Latin America (100 | 0.7%), Philippines (90 | 0.6%), and South America (57 | 0.4%), together accounting for 3.4% of all Gloversville residents.
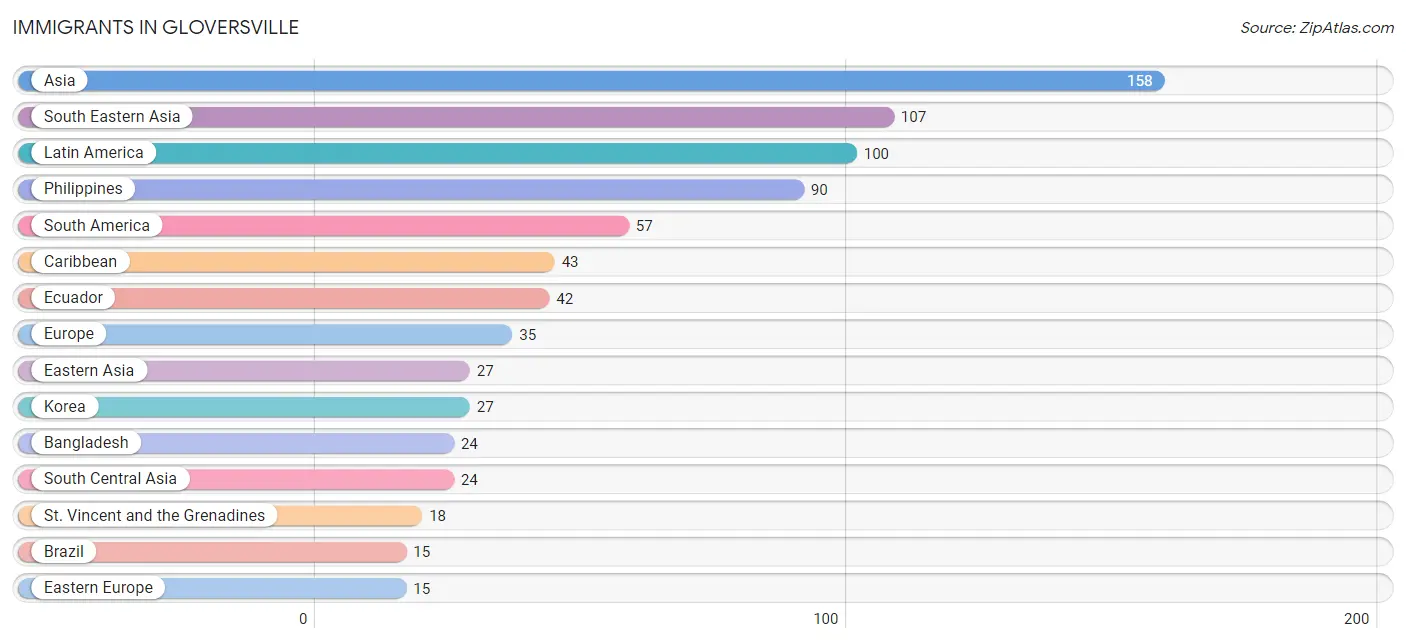
| Immigration Origin | # Population | % Population |
| Asia | 158 | 1.1% |
| Austria | 10 | 0.1% |
| Bangladesh | 24 | 0.2% |
| Brazil | 15 | 0.1% |
| Caribbean | 43 | 0.3% |
| Eastern Asia | 27 | 0.2% |
| Eastern Europe | 15 | 0.1% |
| Ecuador | 42 | 0.3% |
| Europe | 35 | 0.2% |
| Hungary | 15 | 0.1% |
| Italy | 10 | 0.1% |
| Jamaica | 13 | 0.1% |
| Korea | 27 | 0.2% |
| Latin America | 100 | 0.7% |
| Philippines | 90 | 0.6% |
| South America | 57 | 0.4% |
| South Central Asia | 24 | 0.2% |
| South Eastern Asia | 107 | 0.7% |
| Southern Europe | 10 | 0.1% |
| St. Vincent and the Grenadines | 18 | 0.1% |
| Trinidad and Tobago | 12 | 0.1% |
| Western Europe | 10 | 0.1% | View All 22 Rows |
Sex and Age in Gloversville
Sex and Age in Gloversville
The most populous age groups in Gloversville are 25 to 29 Years (642 | 8.6%) for men and 35 to 39 Years (721 | 9.5%) for women.
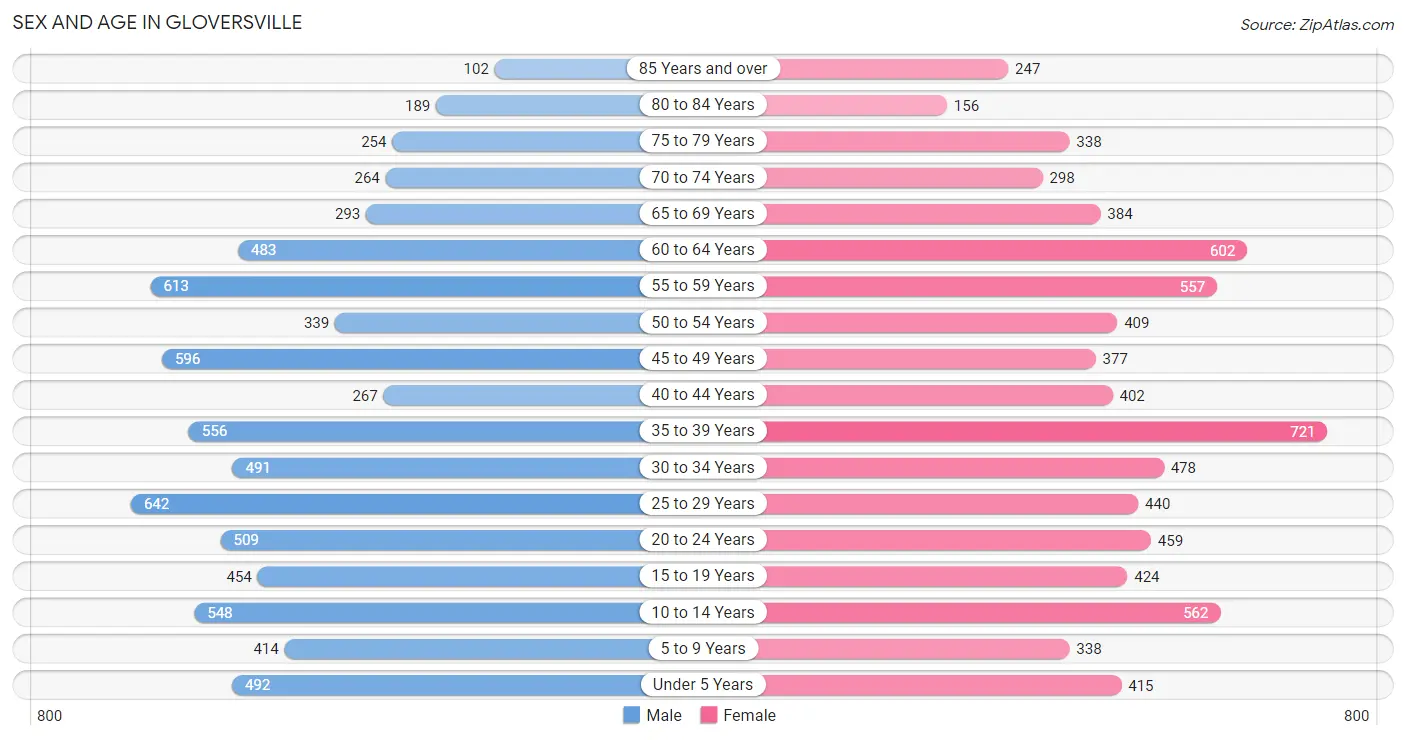
| Age Bracket | Male | Female |
| Under 5 Years | 492 (6.6%) | 415 (5.5%) |
| 5 to 9 Years | 414 (5.5%) | 338 (4.4%) |
| 10 to 14 Years | 548 (7.3%) | 562 (7.4%) |
| 15 to 19 Years | 454 (6.0%) | 424 (5.6%) |
| 20 to 24 Years | 509 (6.8%) | 459 (6.0%) |
| 25 to 29 Years | 642 (8.6%) | 440 (5.8%) |
| 30 to 34 Years | 491 (6.5%) | 478 (6.3%) |
| 35 to 39 Years | 556 (7.4%) | 721 (9.5%) |
| 40 to 44 Years | 267 (3.6%) | 402 (5.3%) |
| 45 to 49 Years | 596 (7.9%) | 377 (5.0%) |
| 50 to 54 Years | 339 (4.5%) | 409 (5.4%) |
| 55 to 59 Years | 613 (8.2%) | 557 (7.3%) |
| 60 to 64 Years | 483 (6.4%) | 602 (7.9%) |
| 65 to 69 Years | 293 (3.9%) | 384 (5.1%) |
| 70 to 74 Years | 264 (3.5%) | 298 (3.9%) |
| 75 to 79 Years | 254 (3.4%) | 338 (4.4%) |
| 80 to 84 Years | 189 (2.5%) | 156 (2.1%) |
| 85 Years and over | 102 (1.4%) | 247 (3.3%) |
| Total | 7,506 (100.0%) | 7,607 (100.0%) |
Families and Households in Gloversville
Median Family Size in Gloversville
The median family size in Gloversville is 2.93 persons per family, with married-couple families (2,005 | 53.5%) accounting for the largest median family size of 2.98 persons per family. On the other hand, single male/father families (587 | 15.7%) represent the smallest median family size with 2.68 persons per family.
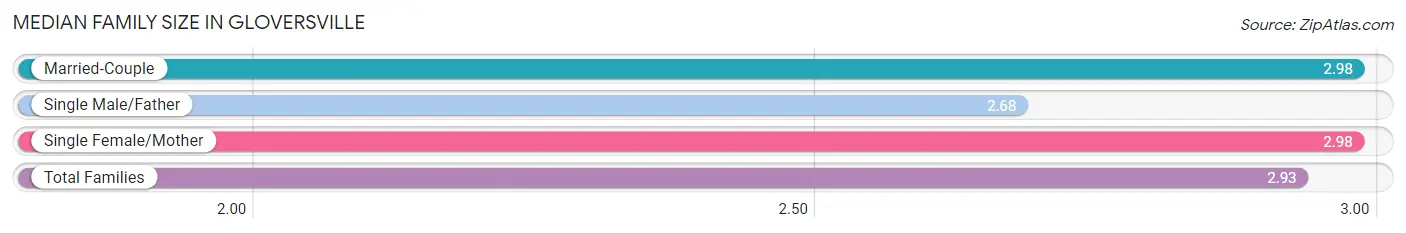
| Family Type | # Families | Family Size |
| Married-Couple | 2,005 (53.5%) | 2.98 |
| Single Male/Father | 587 (15.7%) | 2.68 |
| Single Female/Mother | 1,156 (30.8%) | 2.98 |
| Total Families | 3,748 (100.0%) | 2.93 |
Median Household Size in Gloversville
The median household size in Gloversville is 2.38 persons per household, with single male/father households (587 | 9.4%) accounting for the largest median household size of 3.27 persons per household. non-family households (2,478 | 39.8%) represent the smallest median household size with 1.26 persons per household.
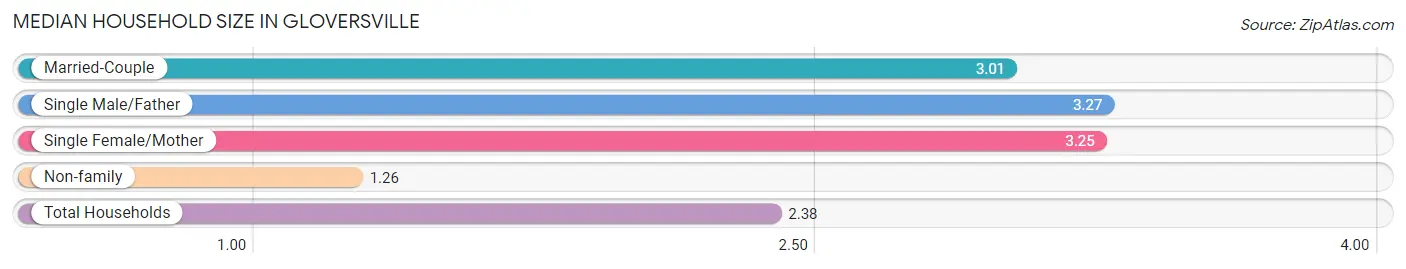
| Household Type | # Households | Household Size |
| Married-Couple | 2,005 (32.2%) | 3.01 |
| Single Male/Father | 587 (9.4%) | 3.27 |
| Single Female/Mother | 1,156 (18.6%) | 3.25 |
| Non-family | 2,478 (39.8%) | 1.26 |
| Total Households | 6,226 (100.0%) | 2.38 |
Household Size by Marriage Status in Gloversville
Out of a total of 6,226 households in Gloversville, 3,748 (60.2%) are family households, while 2,478 (39.8%) are nonfamily households. The most numerous type of family households are 2-person households, comprising 1,567, and the most common type of nonfamily households are 1-person households, comprising 1,917.
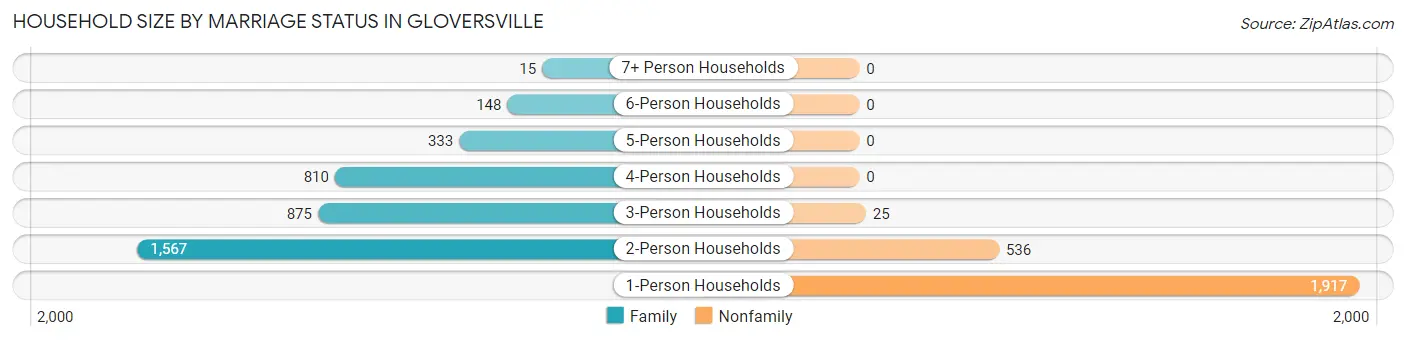
| Household Size | Family Households | Nonfamily Households |
| 1-Person Households | - | 1,917 (30.8%) |
| 2-Person Households | 1,567 (25.2%) | 536 (8.6%) |
| 3-Person Households | 875 (14.1%) | 25 (0.4%) |
| 4-Person Households | 810 (13.0%) | 0 (0.0%) |
| 5-Person Households | 333 (5.3%) | 0 (0.0%) |
| 6-Person Households | 148 (2.4%) | 0 (0.0%) |
| 7+ Person Households | 15 (0.2%) | 0 (0.0%) |
| Total | 3,748 (60.2%) | 2,478 (39.8%) |
Female Fertility in Gloversville
Fertility by Age in Gloversville
Average fertility rate in Gloversville is 76.0 births per 1,000 women. Women in the age bracket of 20 to 34 years have the highest fertility rate with 121.0 births per 1,000 women. Women in the age bracket of 20 to 34 years acount for 64.5% of all women with births.
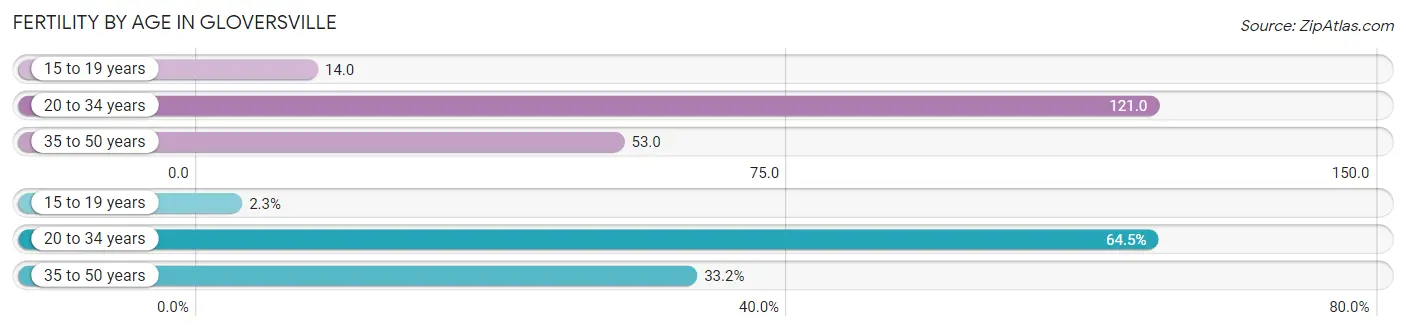
| Age Bracket | Women with Births | Births / 1,000 Women |
| 15 to 19 years | 6 (2.3%) | 14.0 |
| 20 to 34 years | 167 (64.5%) | 121.0 |
| 35 to 50 years | 86 (33.2%) | 53.0 |
| Total | 259 (100.0%) | 76.0 |
Fertility by Age by Marriage Status in Gloversville
41.7% of women with births (259) in Gloversville are married. The highest percentage of unmarried women with births falls into 15 to 19 years age bracket with 100.0% of them unmarried at the time of birth, while the lowest percentage of unmarried women with births belong to 35 to 50 years age bracket with 57.0% of them unmarried.
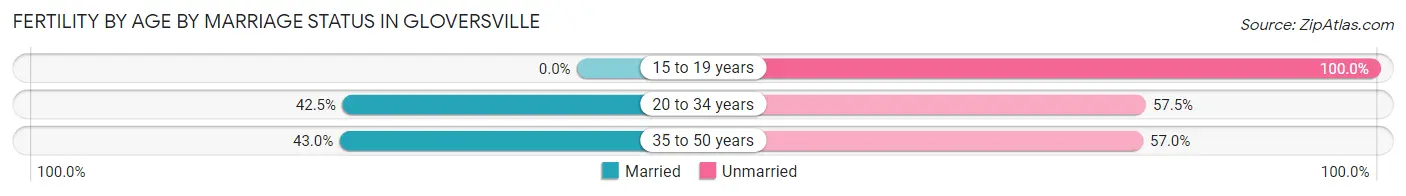
| Age Bracket | Married | Unmarried |
| 15 to 19 years | 0 (0.0%) | 6 (100.0%) |
| 20 to 34 years | 71 (42.5%) | 96 (57.5%) |
| 35 to 50 years | 37 (43.0%) | 49 (57.0%) |
| Total | 108 (41.7%) | 151 (58.3%) |
Fertility by Education in Gloversville
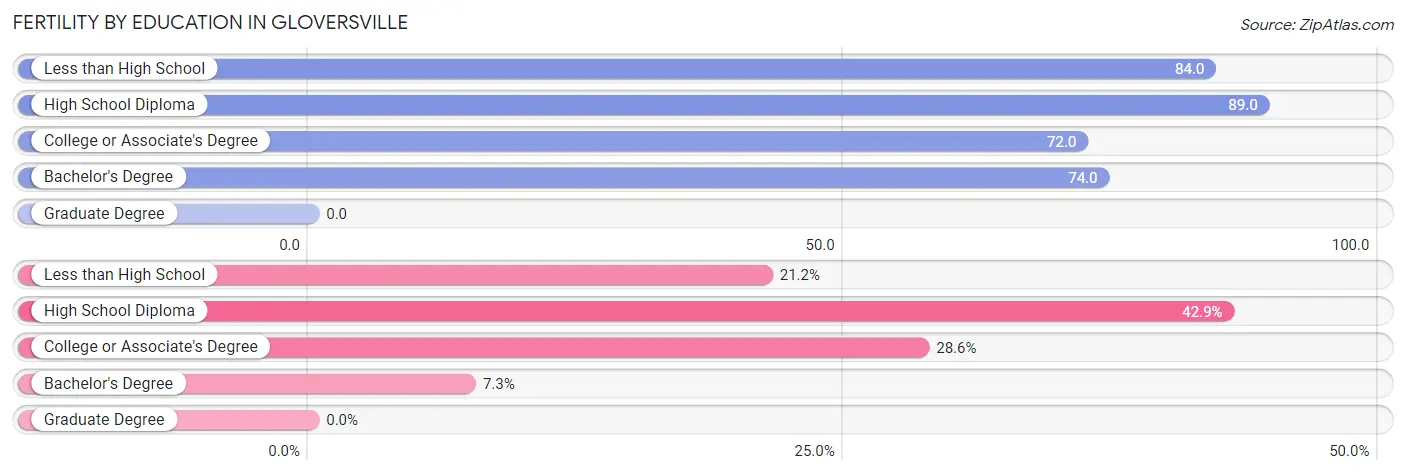
| Educational Attainment | Women with Births | Births / 1,000 Women |
| Less than High School | 55 (21.2%) | 84.0 |
| High School Diploma | 111 (42.9%) | 89.0 |
| College or Associate's Degree | 74 (28.6%) | 72.0 |
| Bachelor's Degree | 19 (7.3%) | 74.0 |
| Graduate Degree | 0 (0.0%) | 0.0 |
| Total | 259 (100.0%) | 76.0 |
Fertility by Education by Marriage Status in Gloversville
58.3% of women with births in Gloversville are unmarried. Women with the educational attainment of bachelor's degree are most likely to be married with 100.0% of them married at childbirth, while women with the educational attainment of college or associate's degree are least likely to be married with 75.7% of them unmarried at childbirth.
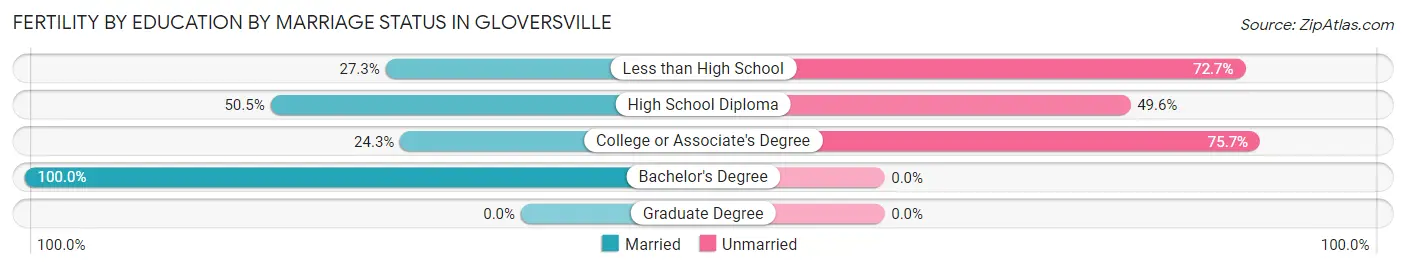
| Educational Attainment | Married | Unmarried |
| Less than High School | 15 (27.3%) | 40 (72.7%) |
| High School Diploma | 56 (50.4%) | 55 (49.5%) |
| College or Associate's Degree | 18 (24.3%) | 56 (75.7%) |
| Bachelor's Degree | 19 (100.0%) | 0 (0.0%) |
| Graduate Degree | 0 (0.0%) | 0 (0.0%) |
| Total | 108 (41.7%) | 151 (58.3%) |
Employment Characteristics in Gloversville
Employment by Class of Employer in Gloversville
Among the 6,275 employed individuals in Gloversville, private company employees (3,870 | 61.7%), not-for-profit organizations (908 | 14.5%), and local government employees (533 | 8.5%) make up the most common classes of employment.
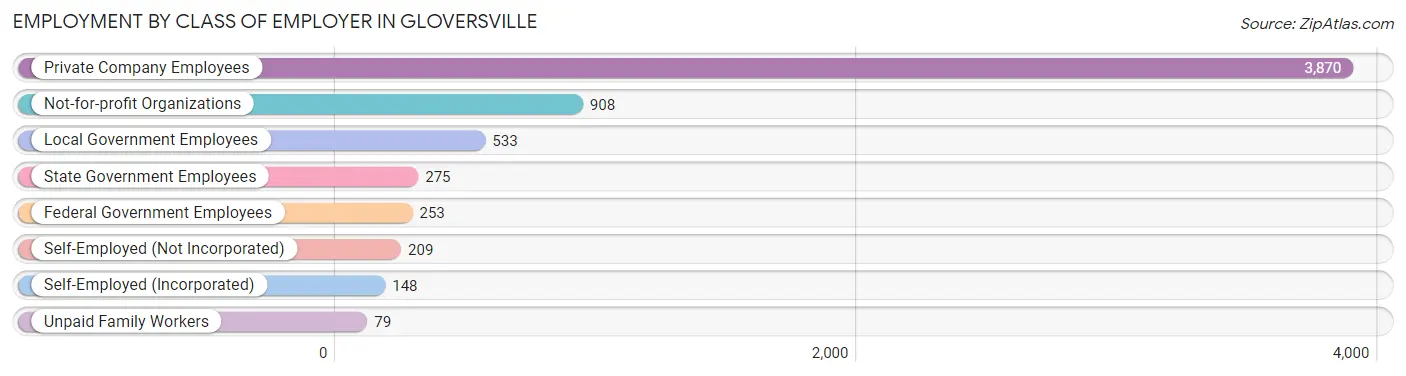
| Employer Class | # Employees | % Employees |
| Private Company Employees | 3,870 | 61.7% |
| Self-Employed (Incorporated) | 148 | 2.4% |
| Self-Employed (Not Incorporated) | 209 | 3.3% |
| Not-for-profit Organizations | 908 | 14.5% |
| Local Government Employees | 533 | 8.5% |
| State Government Employees | 275 | 4.4% |
| Federal Government Employees | 253 | 4.0% |
| Unpaid Family Workers | 79 | 1.3% |
| Total | 6,275 | 100.0% |
Employment Status by Age in Gloversville
According to the labor force statistics for Gloversville, out of the total population over 16 years of age (12,155), 56.6% or 6,880 individuals are in the labor force, with 7.2% or 495 of them unemployed. The age group with the highest labor force participation rate is 20 to 24 years, with 86.1% or 833 individuals in the labor force. Within the labor force, the 16 to 19 years age range has the highest percentage of unemployed individuals, with 26.6% or 118 of them being unemployed.
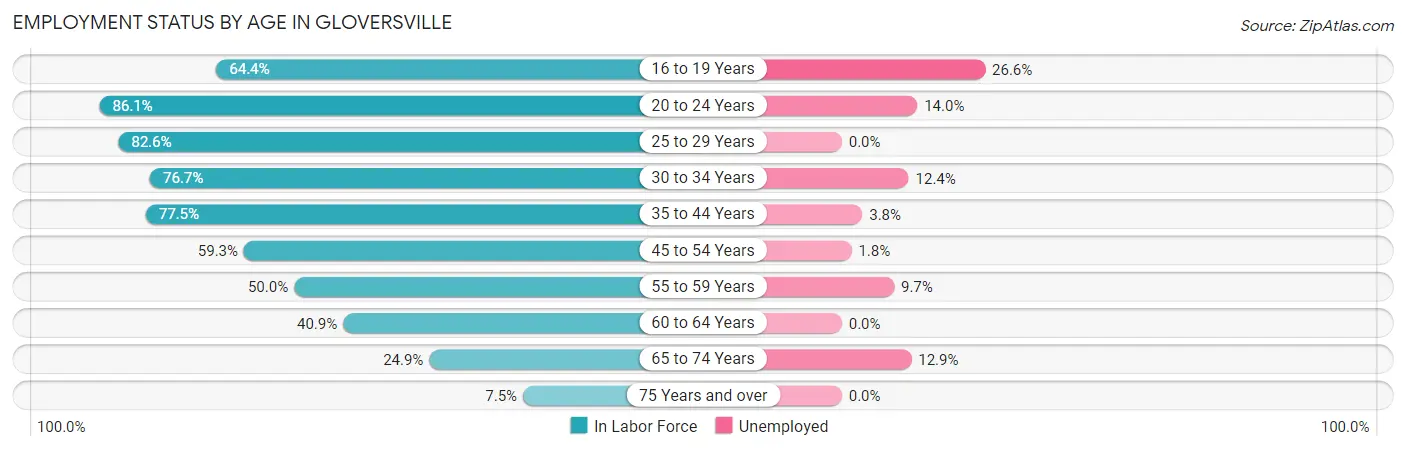
| Age Bracket | In Labor Force | Unemployed |
| 16 to 19 Years | 444 (64.4%) | 118 (26.6%) |
| 20 to 24 Years | 833 (86.1%) | 117 (14.0%) |
| 25 to 29 Years | 894 (82.6%) | 0 (0.0%) |
| 30 to 34 Years | 743 (76.7%) | 92 (12.4%) |
| 35 to 44 Years | 1,508 (77.5%) | 57 (3.8%) |
| 45 to 54 Years | 1,021 (59.3%) | 18 (1.8%) |
| 55 to 59 Years | 585 (50.0%) | 57 (9.7%) |
| 60 to 64 Years | 444 (40.9%) | 0 (0.0%) |
| 65 to 74 Years | 309 (24.9%) | 40 (12.9%) |
| 75 Years and over | 96 (7.5%) | 0 (0.0%) |
| Total | 6,880 (56.6%) | 495 (7.2%) |
Employment Status by Educational Attainment in Gloversville
According to labor force statistics for Gloversville, 65.2% of individuals (5,198) out of the total population between 25 and 64 years of age (7,973) are in the labor force, with 4.3% or 224 of them being unemployed. The group with the highest labor force participation rate are those with the educational attainment of bachelor's degree or higher, with 86.3% or 1,038 individuals in the labor force. Within the labor force, individuals with less than high school education have the highest percentage of unemployment, with 12.2% or 63 of them being unemployed.

| Educational Attainment | In Labor Force | Unemployed |
| Less than High School | 517 (41.1%) | 154 (12.2%) |
| High School Diploma | 2,072 (66.1%) | 160 (5.1%) |
| College / Associate Degree | 1,566 (65.9%) | 62 (2.6%) |
| Bachelor's Degree or higher | 1,038 (86.3%) | 17 (1.4%) |
| Total | 5,198 (65.2%) | 343 (4.3%) |
Employment Occupations by Sex in Gloversville
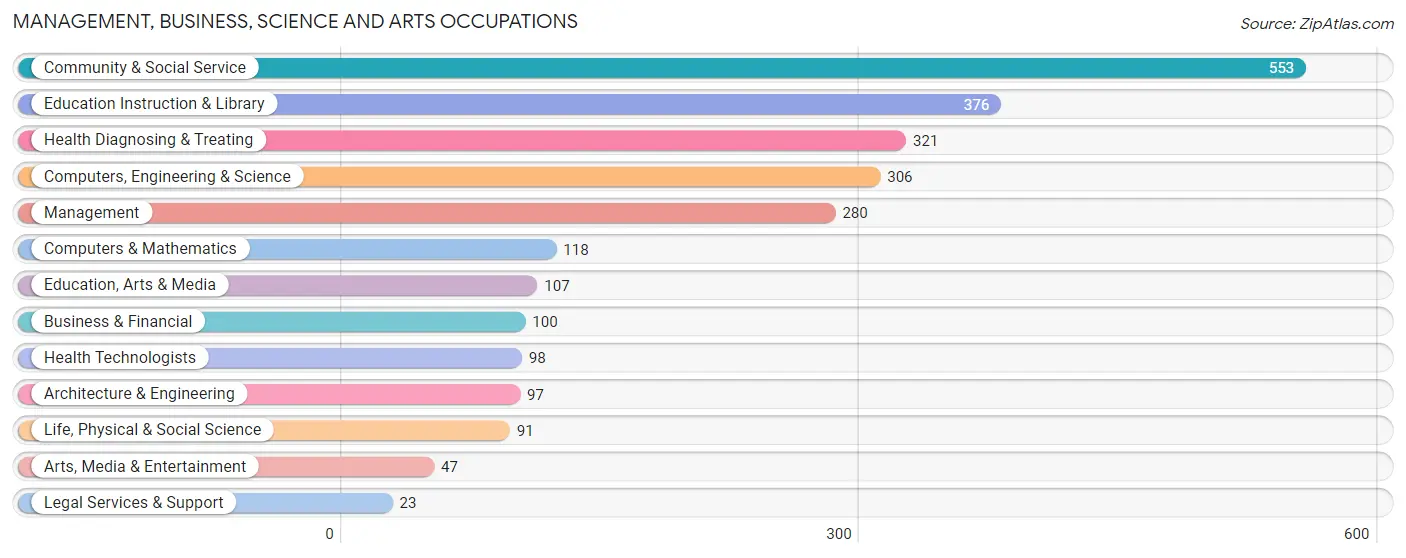
Management, Business, Science and Arts Occupations
The most common Management, Business, Science and Arts occupations in Gloversville are Community & Social Service (553 | 8.7%), Education Instruction & Library (376 | 5.9%), Health Diagnosing & Treating (321 | 5.1%), Computers, Engineering & Science (306 | 4.8%), and Management (280 | 4.4%).
Management, Business, Science and Arts Occupations by Sex
Within the Management, Business, Science and Arts occupations in Gloversville, the most male-oriented occupations are Arts, Media & Entertainment (87.2%), Life, Physical & Social Science (52.7%), and Computers & Mathematics (49.1%), while the most female-oriented occupations are Legal Services & Support (100.0%), Health Diagnosing & Treating (81.0%), and Education Instruction & Library (78.7%).
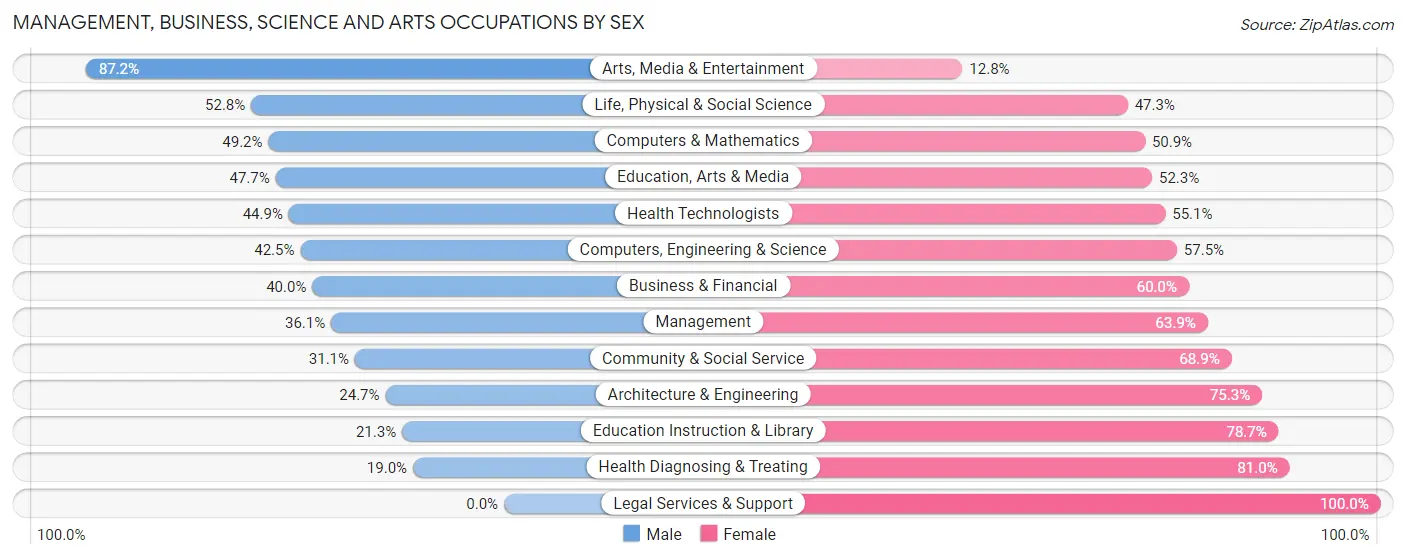
| Occupation | Male | Female |
| Management | 101 (36.1%) | 179 (63.9%) |
| Business & Financial | 40 (40.0%) | 60 (60.0%) |
| Computers, Engineering & Science | 130 (42.5%) | 176 (57.5%) |
| Computers & Mathematics | 58 (49.1%) | 60 (50.8%) |
| Architecture & Engineering | 24 (24.7%) | 73 (75.3%) |
| Life, Physical & Social Science | 48 (52.7%) | 43 (47.2%) |
| Community & Social Service | 172 (31.1%) | 381 (68.9%) |
| Education, Arts & Media | 51 (47.7%) | 56 (52.3%) |
| Legal Services & Support | 0 (0.0%) | 23 (100.0%) |
| Education Instruction & Library | 80 (21.3%) | 296 (78.7%) |
| Arts, Media & Entertainment | 41 (87.2%) | 6 (12.8%) |
| Health Diagnosing & Treating | 61 (19.0%) | 260 (81.0%) |
| Health Technologists | 44 (44.9%) | 54 (55.1%) |
| Total (Category) | 504 (32.3%) | 1,056 (67.7%) |
| Total (Overall) | 3,405 (53.6%) | 2,942 (46.4%) |
Services Occupations
The most common Services occupations in Gloversville are Healthcare Support (618 | 9.7%), Cleaning & Maintenance (333 | 5.2%), Food Preparation & Serving (276 | 4.3%), Security & Protection (180 | 2.8%), and Personal Care & Service (128 | 2.0%).
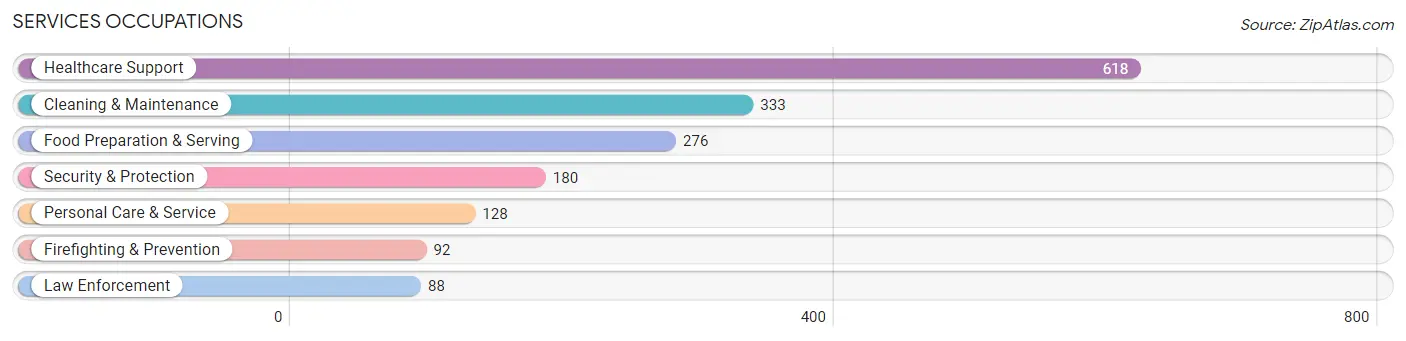
Services Occupations by Sex
Within the Services occupations in Gloversville, the most male-oriented occupations are Law Enforcement (100.0%), Security & Protection (80.6%), and Cleaning & Maintenance (62.5%), while the most female-oriented occupations are Healthcare Support (88.3%), Food Preparation & Serving (62.0%), and Personal Care & Service (60.9%).
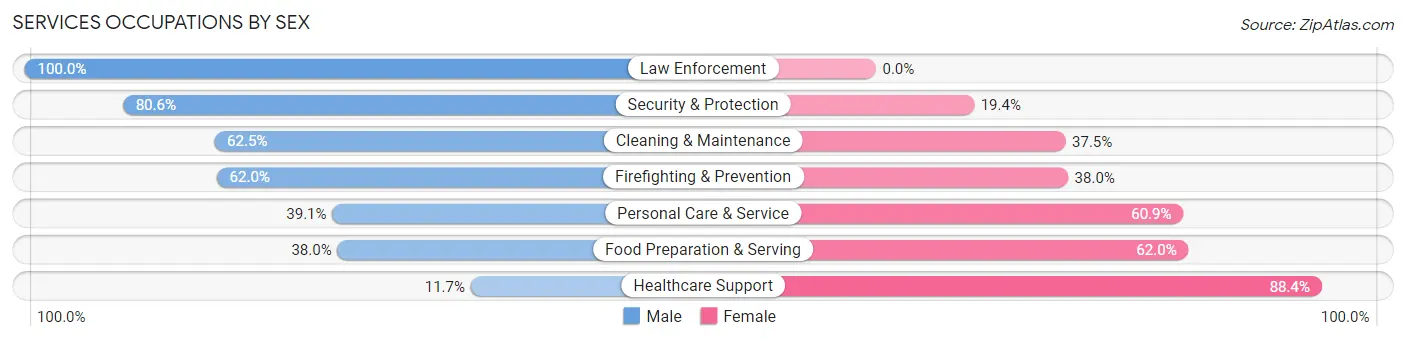
| Occupation | Male | Female |
| Healthcare Support | 72 (11.7%) | 546 (88.3%) |
| Security & Protection | 145 (80.6%) | 35 (19.4%) |
| Firefighting & Prevention | 57 (62.0%) | 35 (38.0%) |
| Law Enforcement | 88 (100.0%) | 0 (0.0%) |
| Food Preparation & Serving | 105 (38.0%) | 171 (62.0%) |
| Cleaning & Maintenance | 208 (62.5%) | 125 (37.5%) |
| Personal Care & Service | 50 (39.1%) | 78 (60.9%) |
| Total (Category) | 580 (37.8%) | 955 (62.2%) |
| Total (Overall) | 3,405 (53.6%) | 2,942 (46.4%) |
Sales and Office Occupations
The most common Sales and Office occupations in Gloversville are Sales & Related (773 | 12.2%), and Office & Administration (625 | 9.9%).

Sales and Office Occupations by Sex

| Occupation | Male | Female |
| Sales & Related | 445 (57.6%) | 328 (42.4%) |
| Office & Administration | 240 (38.4%) | 385 (61.6%) |
| Total (Category) | 685 (49.0%) | 713 (51.0%) |
| Total (Overall) | 3,405 (53.6%) | 2,942 (46.4%) |
Natural Resources, Construction and Maintenance Occupations
The most common Natural Resources, Construction and Maintenance occupations in Gloversville are Construction & Extraction (302 | 4.8%), Installation, Maintenance & Repair (214 | 3.4%), and Farming, Fishing & Forestry (27 | 0.4%).

Natural Resources, Construction and Maintenance Occupations by Sex

| Occupation | Male | Female |
| Farming, Fishing & Forestry | 0 (0.0%) | 27 (100.0%) |
| Construction & Extraction | 302 (100.0%) | 0 (0.0%) |
| Installation, Maintenance & Repair | 214 (100.0%) | 0 (0.0%) |
| Total (Category) | 516 (95.0%) | 27 (5.0%) |
| Total (Overall) | 3,405 (53.6%) | 2,942 (46.4%) |
Production, Transportation and Moving Occupations
The most common Production, Transportation and Moving occupations in Gloversville are Material Moving (580 | 9.1%), Production (501 | 7.9%), and Transportation (230 | 3.6%).
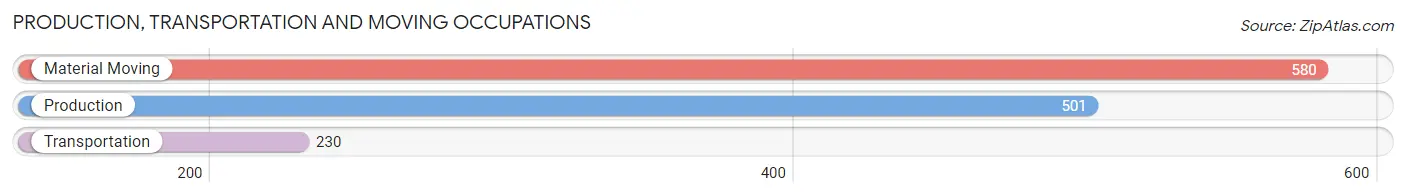
Production, Transportation and Moving Occupations by Sex

| Occupation | Male | Female |
| Production | 361 (72.1%) | 140 (27.9%) |
| Transportation | 214 (93.0%) | 16 (7.0%) |
| Material Moving | 545 (94.0%) | 35 (6.0%) |
| Total (Category) | 1,120 (85.4%) | 191 (14.6%) |
| Total (Overall) | 3,405 (53.6%) | 2,942 (46.4%) |
Employment Industries by Sex in Gloversville
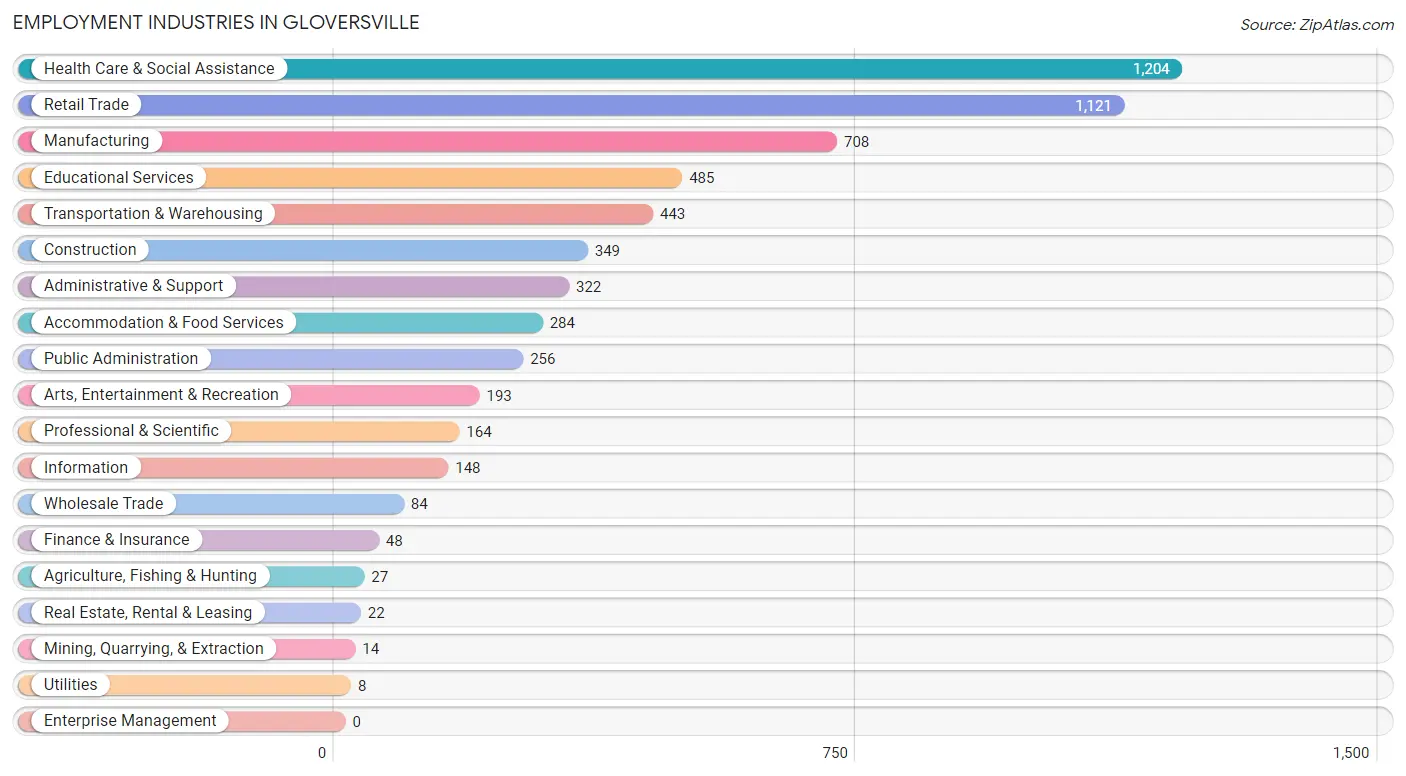
Employment Industries in Gloversville
The major employment industries in Gloversville include Health Care & Social Assistance (1,204 | 19.0%), Retail Trade (1,121 | 17.7%), Manufacturing (708 | 11.2%), Educational Services (485 | 7.6%), and Transportation & Warehousing (443 | 7.0%).
Employment Industries by Sex in Gloversville
The Gloversville industries that see more men than women are Mining, Quarrying, & Extraction (100.0%), Construction (100.0%), and Real Estate, Rental & Leasing (100.0%), whereas the industries that tend to have a higher number of women are Agriculture, Fishing & Hunting (100.0%), Utilities (100.0%), and Finance & Insurance (100.0%).
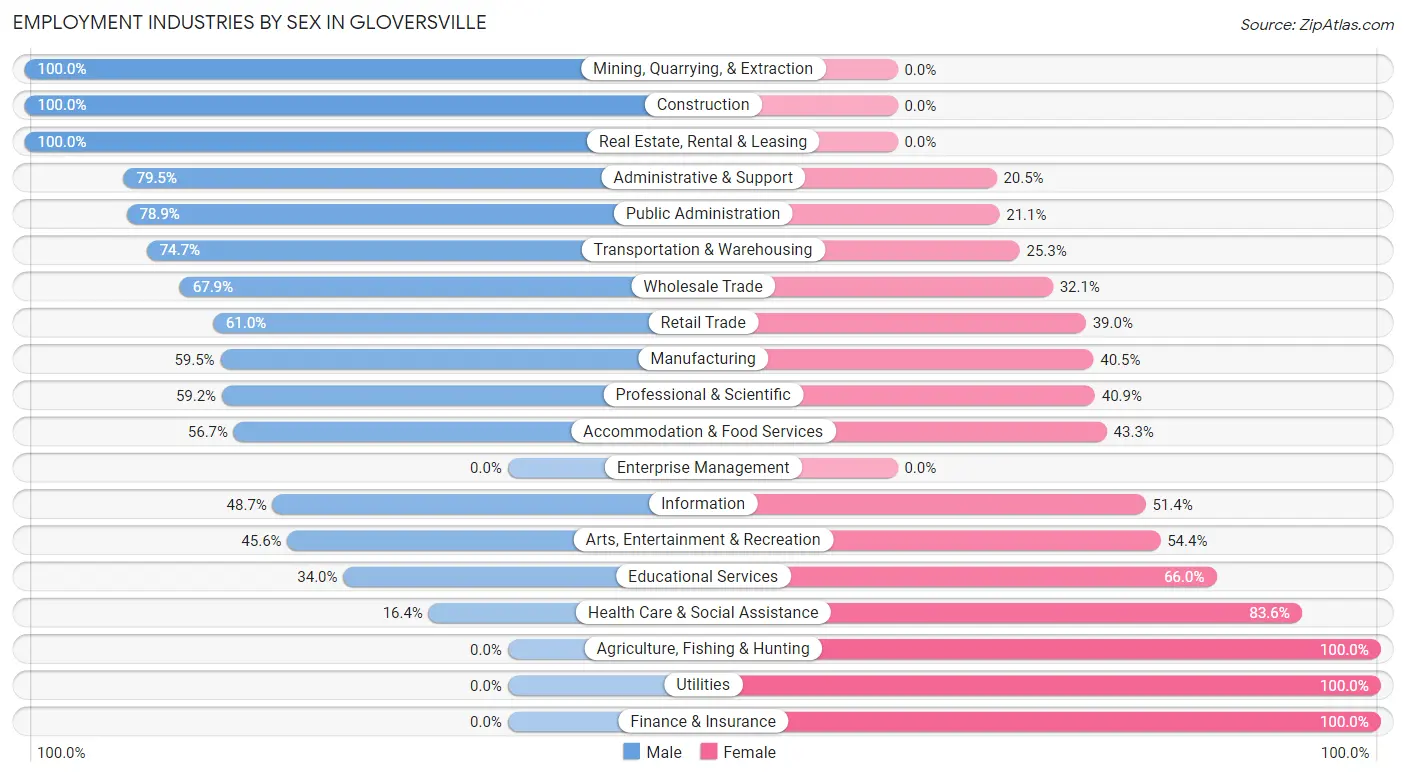
| Industry | Male | Female |
| Agriculture, Fishing & Hunting | 0 (0.0%) | 27 (100.0%) |
| Mining, Quarrying, & Extraction | 14 (100.0%) | 0 (0.0%) |
| Construction | 349 (100.0%) | 0 (0.0%) |
| Manufacturing | 421 (59.5%) | 287 (40.5%) |
| Wholesale Trade | 57 (67.9%) | 27 (32.1%) |
| Retail Trade | 684 (61.0%) | 437 (39.0%) |
| Transportation & Warehousing | 331 (74.7%) | 112 (25.3%) |
| Utilities | 0 (0.0%) | 8 (100.0%) |
| Information | 72 (48.6%) | 76 (51.3%) |
| Finance & Insurance | 0 (0.0%) | 48 (100.0%) |
| Real Estate, Rental & Leasing | 22 (100.0%) | 0 (0.0%) |
| Professional & Scientific | 97 (59.2%) | 67 (40.8%) |
| Enterprise Management | 0 (0.0%) | 0 (0.0%) |
| Administrative & Support | 256 (79.5%) | 66 (20.5%) |
| Educational Services | 165 (34.0%) | 320 (66.0%) |
| Health Care & Social Assistance | 197 (16.4%) | 1,007 (83.6%) |
| Arts, Entertainment & Recreation | 88 (45.6%) | 105 (54.4%) |
| Accommodation & Food Services | 161 (56.7%) | 123 (43.3%) |
| Public Administration | 202 (78.9%) | 54 (21.1%) |
| Total | 3,405 (53.6%) | 2,942 (46.4%) |
Education in Gloversville
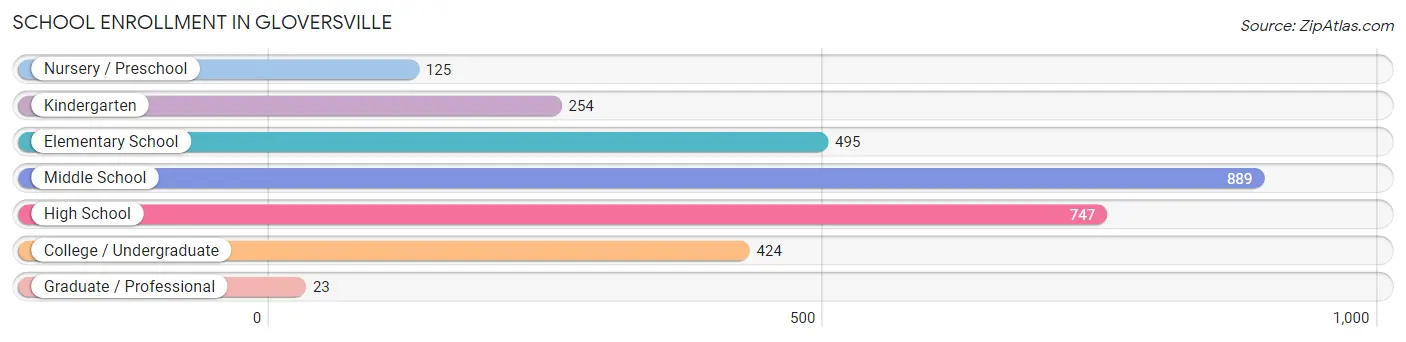
School Enrollment in Gloversville
The most common levels of schooling among the 2,957 students in Gloversville are middle school (889 | 30.1%), high school (747 | 25.3%), and elementary school (495 | 16.7%).
| School Level | # Students | % Students |
| Nursery / Preschool | 125 | 4.2% |
| Kindergarten | 254 | 8.6% |
| Elementary School | 495 | 16.7% |
| Middle School | 889 | 30.1% |
| High School | 747 | 25.3% |
| College / Undergraduate | 424 | 14.3% |
| Graduate / Professional | 23 | 0.8% |
| Total | 2,957 | 100.0% |
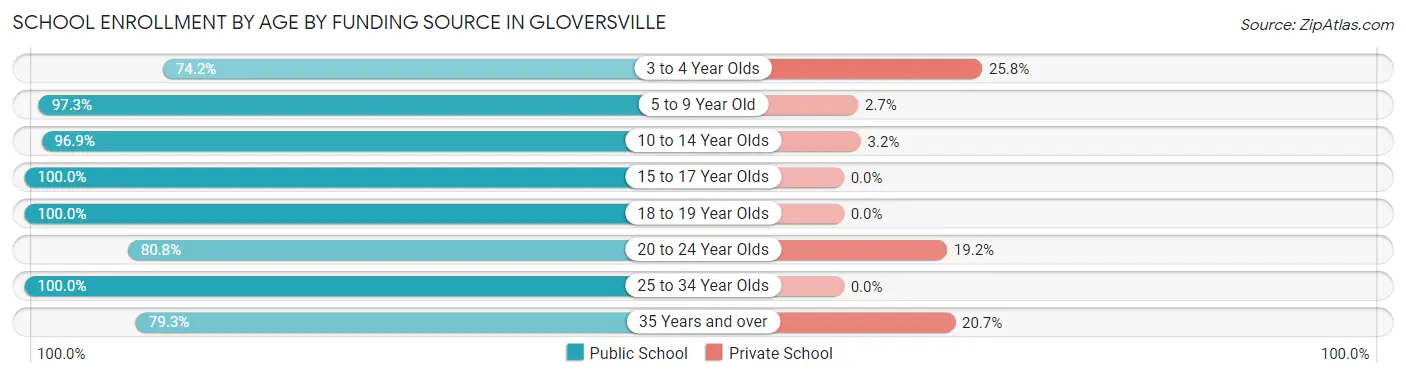
School Enrollment by Age by Funding Source in Gloversville
Out of a total of 2,957 students who are enrolled in schools in Gloversville, 142 (4.8%) attend a private institution, while the remaining 2,815 (95.2%) are enrolled in public schools. The age group of 3 to 4 year olds has the highest likelihood of being enrolled in private schools, with 42 (25.8% in the age bracket) enrolled. Conversely, the age group of 15 to 17 year olds has the lowest likelihood of being enrolled in a private school, with 486 (100.0% in the age bracket) attending a public institution.
| Age Bracket | Public School | Private School |
| 3 to 4 Year Olds | 121 (74.2%) | 42 (25.8%) |
| 5 to 9 Year Old | 659 (97.3%) | 18 (2.7%) |
| 10 to 14 Year Olds | 1,013 (96.9%) | 33 (3.2%) |
| 15 to 17 Year Olds | 486 (100.0%) | 0 (0.0%) |
| 18 to 19 Year Olds | 210 (100.0%) | 0 (0.0%) |
| 20 to 24 Year Olds | 84 (80.8%) | 20 (19.2%) |
| 25 to 34 Year Olds | 136 (100.0%) | 0 (0.0%) |
| 35 Years and over | 107 (79.3%) | 28 (20.7%) |
| Total | 2,815 (95.2%) | 142 (4.8%) |
Educational Attainment by Field of Study in Gloversville
Education (364 | 20.3%), business (252 | 14.1%), liberal arts & history (204 | 11.4%), arts & humanities (189 | 10.6%), and social sciences (159 | 8.9%) are the most common fields of study among 1,789 individuals in Gloversville who have obtained a bachelor's degree or higher.
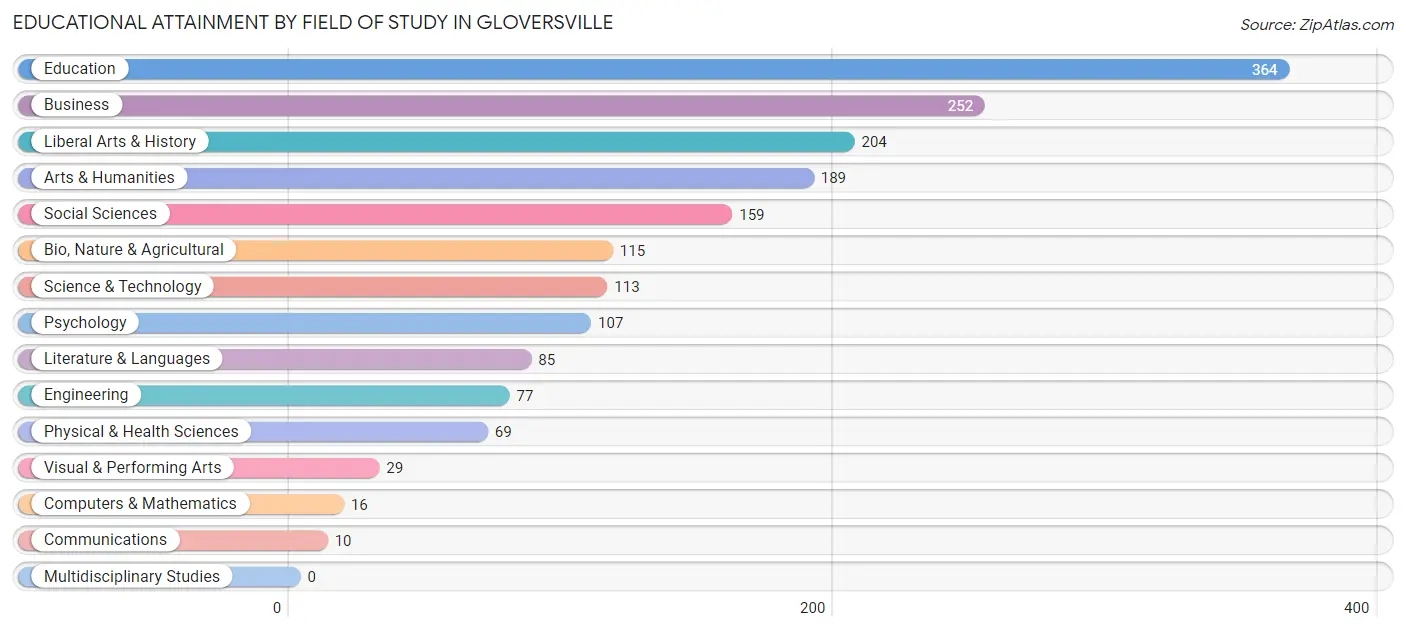
| Field of Study | # Graduates | % Graduates |
| Computers & Mathematics | 16 | 0.9% |
| Bio, Nature & Agricultural | 115 | 6.4% |
| Physical & Health Sciences | 69 | 3.9% |
| Psychology | 107 | 6.0% |
| Social Sciences | 159 | 8.9% |
| Engineering | 77 | 4.3% |
| Multidisciplinary Studies | 0 | 0.0% |
| Science & Technology | 113 | 6.3% |
| Business | 252 | 14.1% |
| Education | 364 | 20.3% |
| Literature & Languages | 85 | 4.8% |
| Liberal Arts & History | 204 | 11.4% |
| Visual & Performing Arts | 29 | 1.6% |
| Communications | 10 | 0.6% |
| Arts & Humanities | 189 | 10.6% |
| Total | 1,789 | 100.0% |
Transportation & Commute in Gloversville
Vehicle Availability by Sex in Gloversville
The most prevalent vehicle ownership categories in Gloversville are males with 2 vehicles (1,513, accounting for 44.3%) and females with 2 vehicles (1,047, making up 52.9%).
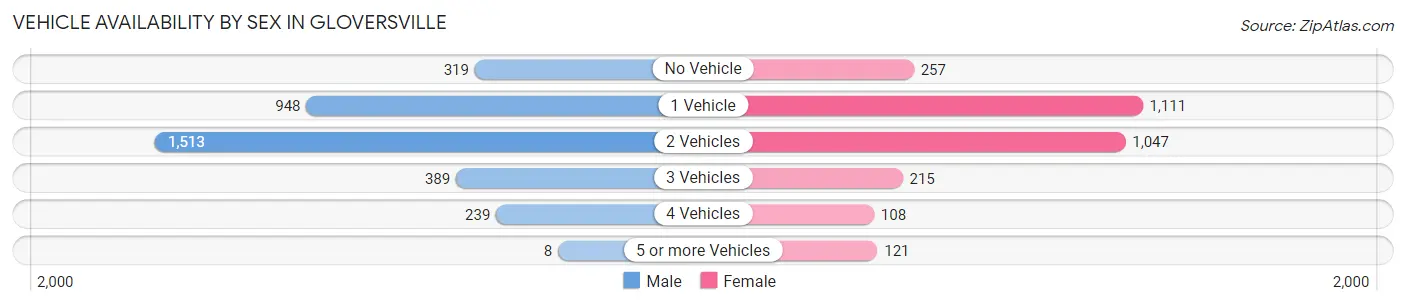
| Vehicles Available | Male | Female |
| No Vehicle | 319 (9.3%) | 257 (9.0%) |
| 1 Vehicle | 948 (27.8%) | 1,111 (38.9%) |
| 2 Vehicles | 1,513 (44.3%) | 1,047 (36.6%) |
| 3 Vehicles | 389 (11.4%) | 215 (7.5%) |
| 4 Vehicles | 239 (7.0%) | 108 (3.8%) |
| 5 or more Vehicles | 8 (0.2%) | 121 (4.2%) |
| Total | 3,416 (100.0%) | 2,859 (100.0%) |
Commute Time in Gloversville
The most frequently occuring commute durations in Gloversville are 10 to 14 minutes (1,112 commuters, 18.2%), 5 to 9 minutes (1,030 commuters, 16.9%), and 45 to 59 minutes (771 commuters, 12.6%).
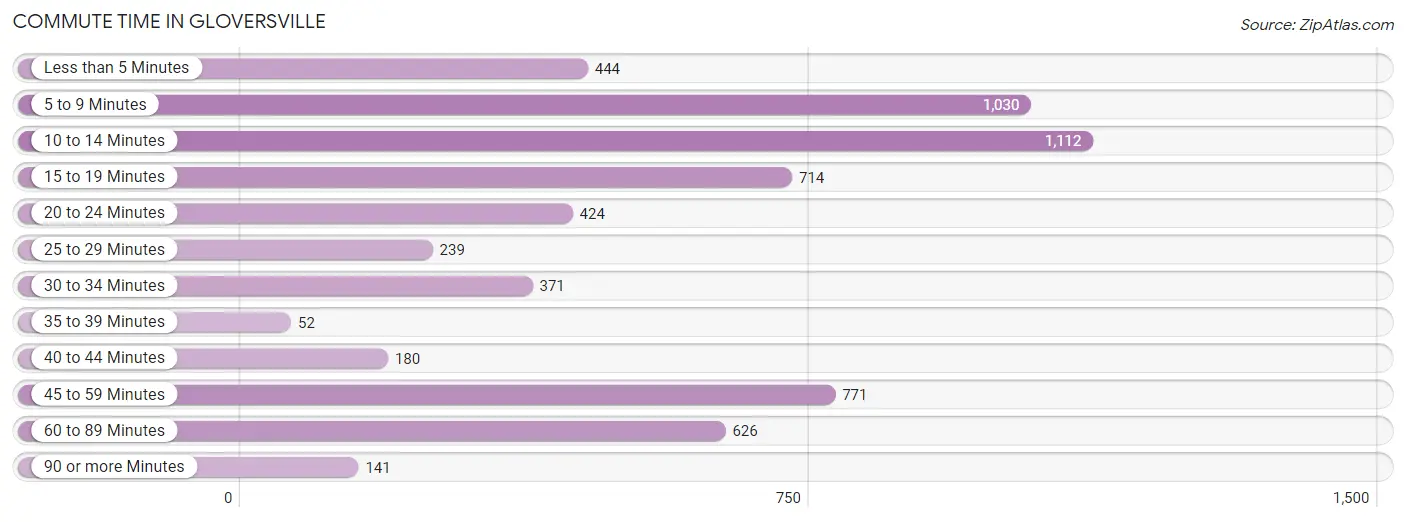
| Commute Time | # Commuters | % Commuters |
| Less than 5 Minutes | 444 | 7.3% |
| 5 to 9 Minutes | 1,030 | 16.9% |
| 10 to 14 Minutes | 1,112 | 18.2% |
| 15 to 19 Minutes | 714 | 11.7% |
| 20 to 24 Minutes | 424 | 7.0% |
| 25 to 29 Minutes | 239 | 3.9% |
| 30 to 34 Minutes | 371 | 6.1% |
| 35 to 39 Minutes | 52 | 0.9% |
| 40 to 44 Minutes | 180 | 2.9% |
| 45 to 59 Minutes | 771 | 12.6% |
| 60 to 89 Minutes | 626 | 10.3% |
| 90 or more Minutes | 141 | 2.3% |
Commute Time by Sex in Gloversville
The most common commute times in Gloversville are 45 to 59 minutes (616 commuters, 18.5%) for males and 10 to 14 minutes (729 commuters, 26.3%) for females.
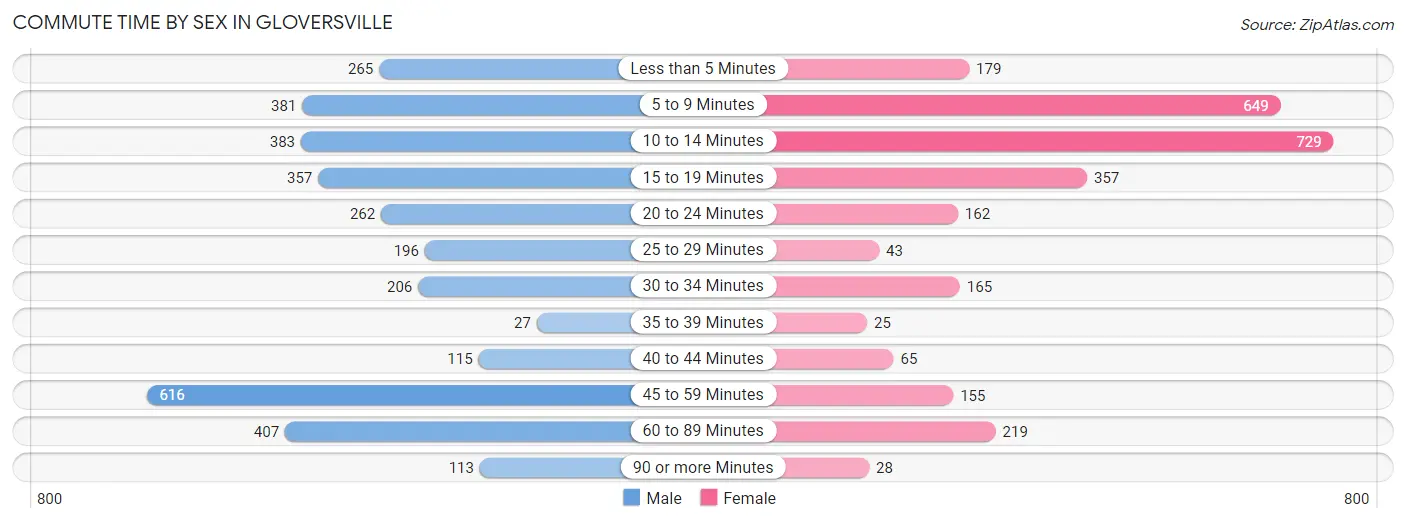
| Commute Time | Male | Female |
| Less than 5 Minutes | 265 (8.0%) | 179 (6.5%) |
| 5 to 9 Minutes | 381 (11.5%) | 649 (23.4%) |
| 10 to 14 Minutes | 383 (11.5%) | 729 (26.3%) |
| 15 to 19 Minutes | 357 (10.7%) | 357 (12.9%) |
| 20 to 24 Minutes | 262 (7.9%) | 162 (5.8%) |
| 25 to 29 Minutes | 196 (5.9%) | 43 (1.5%) |
| 30 to 34 Minutes | 206 (6.2%) | 165 (5.9%) |
| 35 to 39 Minutes | 27 (0.8%) | 25 (0.9%) |
| 40 to 44 Minutes | 115 (3.5%) | 65 (2.3%) |
| 45 to 59 Minutes | 616 (18.5%) | 155 (5.6%) |
| 60 to 89 Minutes | 407 (12.2%) | 219 (7.9%) |
| 90 or more Minutes | 113 (3.4%) | 28 (1.0%) |
Time of Departure to Work by Sex in Gloversville
The most frequent times of departure to work in Gloversville are 7:00 AM to 7:29 AM (540, 16.2%) for males and 7:30 AM to 7:59 AM (614, 22.1%) for females.
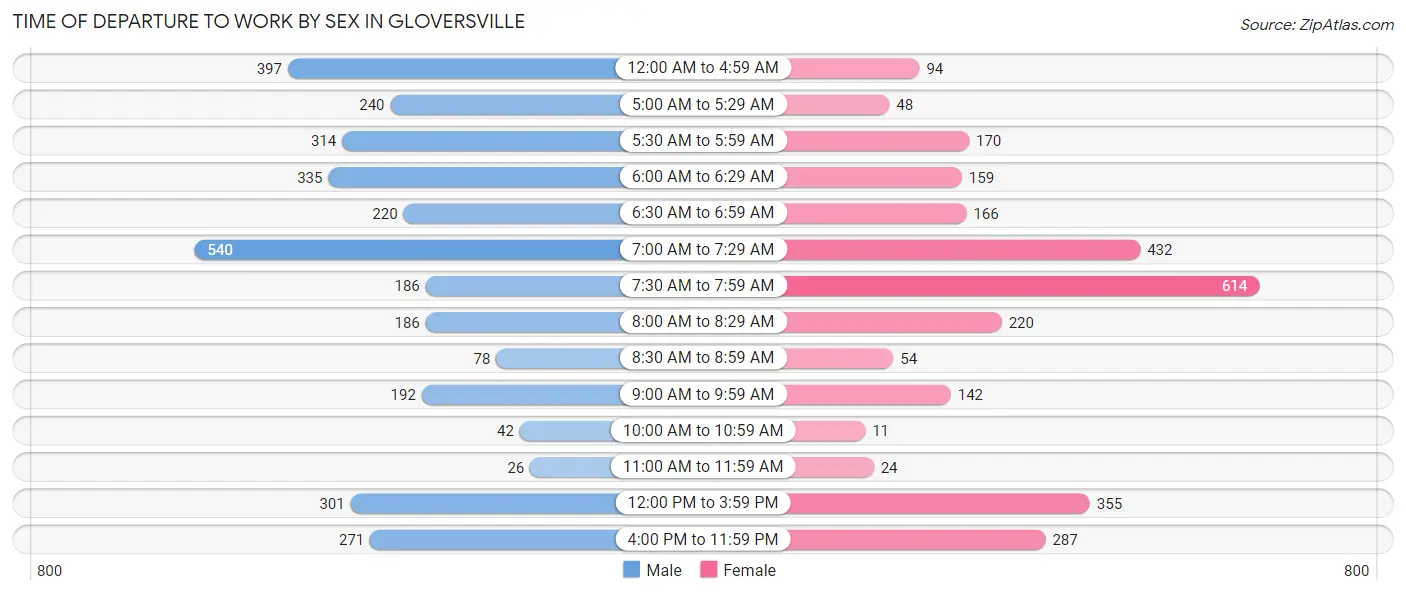
| Time of Departure | Male | Female |
| 12:00 AM to 4:59 AM | 397 (11.9%) | 94 (3.4%) |
| 5:00 AM to 5:29 AM | 240 (7.2%) | 48 (1.7%) |
| 5:30 AM to 5:59 AM | 314 (9.4%) | 170 (6.1%) |
| 6:00 AM to 6:29 AM | 335 (10.1%) | 159 (5.7%) |
| 6:30 AM to 6:59 AM | 220 (6.6%) | 166 (6.0%) |
| 7:00 AM to 7:29 AM | 540 (16.2%) | 432 (15.6%) |
| 7:30 AM to 7:59 AM | 186 (5.6%) | 614 (22.1%) |
| 8:00 AM to 8:29 AM | 186 (5.6%) | 220 (7.9%) |
| 8:30 AM to 8:59 AM | 78 (2.3%) | 54 (1.9%) |
| 9:00 AM to 9:59 AM | 192 (5.8%) | 142 (5.1%) |
| 10:00 AM to 10:59 AM | 42 (1.3%) | 11 (0.4%) |
| 11:00 AM to 11:59 AM | 26 (0.8%) | 24 (0.9%) |
| 12:00 PM to 3:59 PM | 301 (9.0%) | 355 (12.8%) |
| 4:00 PM to 11:59 PM | 271 (8.1%) | 287 (10.3%) |
| Total | 3,328 (100.0%) | 2,776 (100.0%) |
Housing Occupancy in Gloversville
Occupancy by Ownership in Gloversville
Of the total 6,226 dwellings in Gloversville, owner-occupied units account for 2,931 (47.1%), while renter-occupied units make up 3,295 (52.9%).
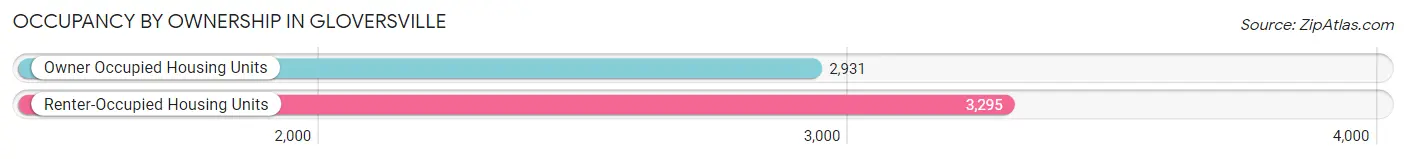
| Occupancy | # Housing Units | % Housing Units |
| Owner Occupied Housing Units | 2,931 | 47.1% |
| Renter-Occupied Housing Units | 3,295 | 52.9% |
| Total Occupied Housing Units | 6,226 | 100.0% |
Occupancy by Household Size in Gloversville
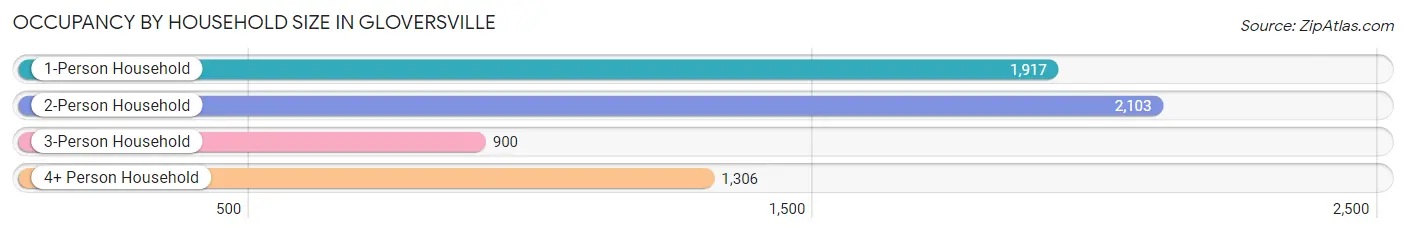
| Household Size | # Housing Units | % Housing Units |
| 1-Person Household | 1,917 | 30.8% |
| 2-Person Household | 2,103 | 33.8% |
| 3-Person Household | 900 | 14.5% |
| 4+ Person Household | 1,306 | 21.0% |
| Total Housing Units | 6,226 | 100.0% |
Occupancy by Ownership by Household Size in Gloversville
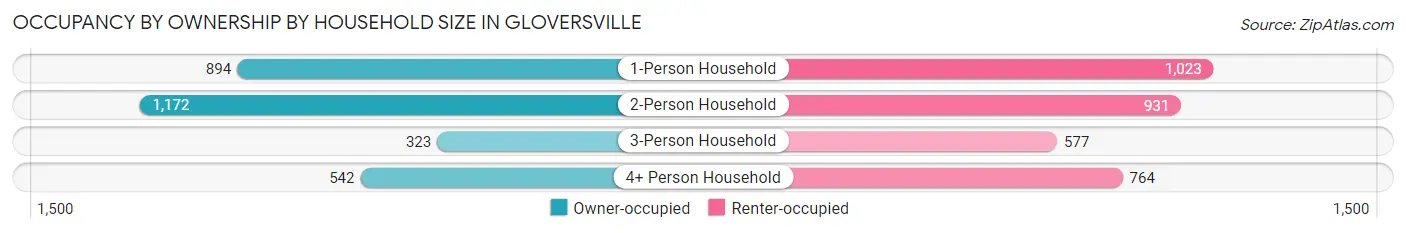
| Household Size | Owner-occupied | Renter-occupied |
| 1-Person Household | 894 (46.6%) | 1,023 (53.4%) |
| 2-Person Household | 1,172 (55.7%) | 931 (44.3%) |
| 3-Person Household | 323 (35.9%) | 577 (64.1%) |
| 4+ Person Household | 542 (41.5%) | 764 (58.5%) |
| Total Housing Units | 2,931 (47.1%) | 3,295 (52.9%) |
Occupancy by Educational Attainment in Gloversville
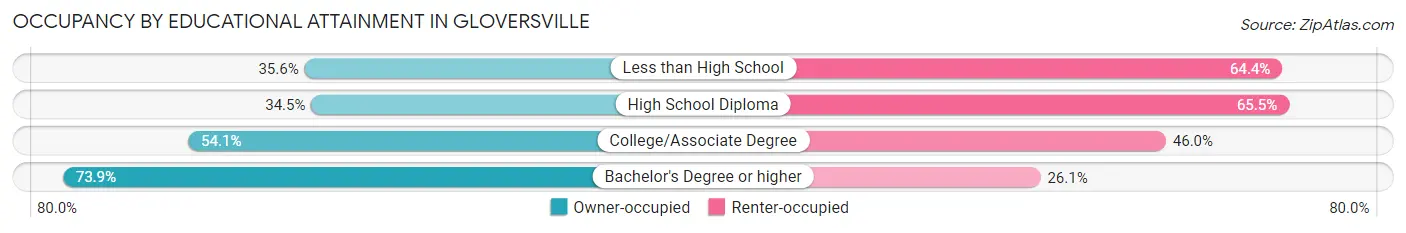
| Household Size | Owner-occupied | Renter-occupied |
| Less than High School | 307 (35.6%) | 555 (64.4%) |
| High School Diploma | 827 (34.5%) | 1,568 (65.5%) |
| College/Associate Degree | 1,082 (54.0%) | 920 (46.0%) |
| Bachelor's Degree or higher | 715 (73.9%) | 252 (26.1%) |
Occupancy by Age of Householder in Gloversville
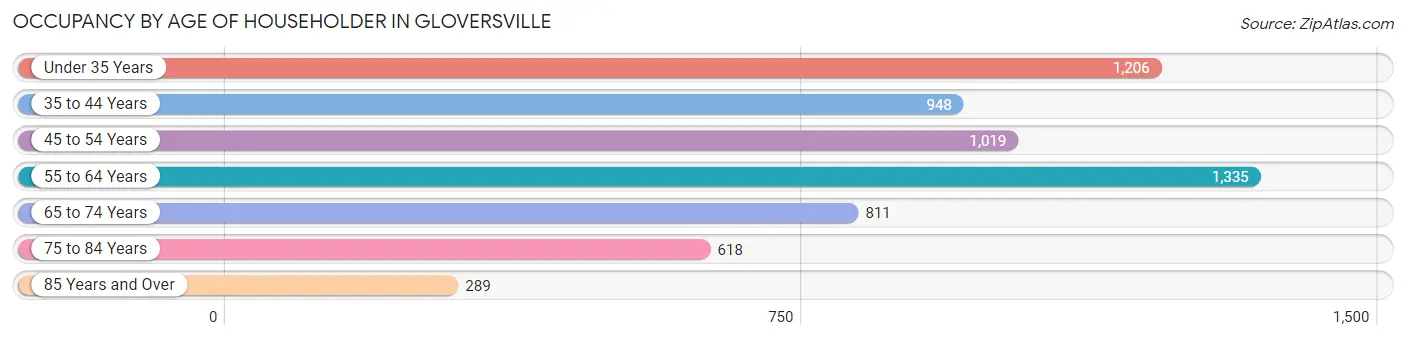
| Age Bracket | # Households | % Households |
| Under 35 Years | 1,206 | 19.4% |
| 35 to 44 Years | 948 | 15.2% |
| 45 to 54 Years | 1,019 | 16.4% |
| 55 to 64 Years | 1,335 | 21.4% |
| 65 to 74 Years | 811 | 13.0% |
| 75 to 84 Years | 618 | 9.9% |
| 85 Years and Over | 289 | 4.6% |
| Total | 6,226 | 100.0% |
Housing Finances in Gloversville
Median Income by Occupancy in Gloversville
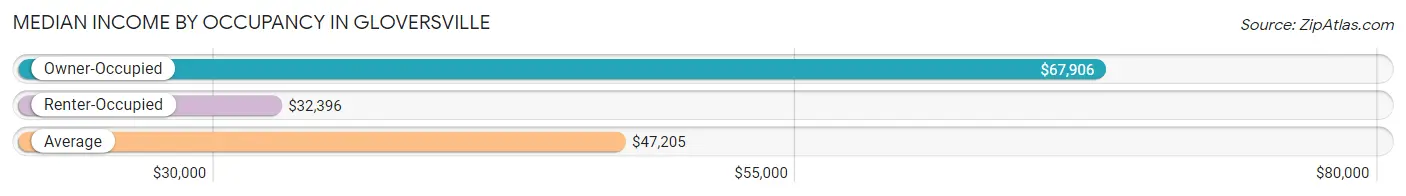
| Occupancy Type | # Households | Median Income |
| Owner-Occupied | 2,931 (47.1%) | $67,906 |
| Renter-Occupied | 3,295 (52.9%) | $32,396 |
| Average | 6,226 (100.0%) | $47,205 |
Occupancy by Householder Income Bracket in Gloversville
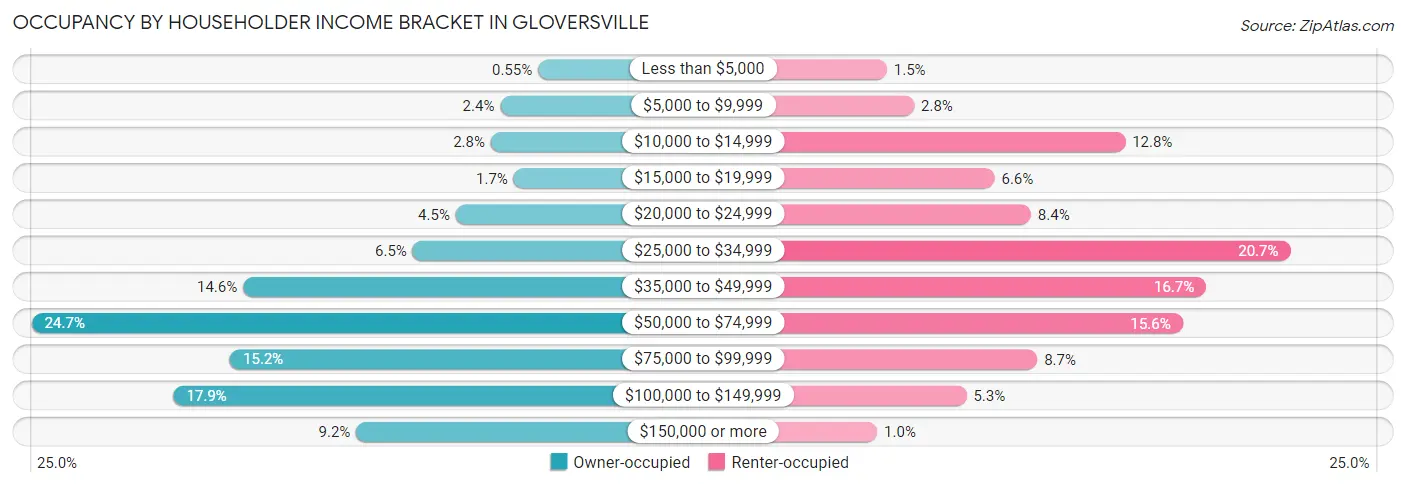
| Income Bracket | Owner-occupied | Renter-occupied |
| Less than $5,000 | 16 (0.5%) | 49 (1.5%) |
| $5,000 to $9,999 | 69 (2.4%) | 92 (2.8%) |
| $10,000 to $14,999 | 82 (2.8%) | 423 (12.8%) |
| $15,000 to $19,999 | 50 (1.7%) | 218 (6.6%) |
| $20,000 to $24,999 | 131 (4.5%) | 275 (8.4%) |
| $25,000 to $34,999 | 191 (6.5%) | 682 (20.7%) |
| $35,000 to $49,999 | 428 (14.6%) | 550 (16.7%) |
| $50,000 to $74,999 | 723 (24.7%) | 513 (15.6%) |
| $75,000 to $99,999 | 446 (15.2%) | 285 (8.6%) |
| $100,000 to $149,999 | 525 (17.9%) | 174 (5.3%) |
| $150,000 or more | 270 (9.2%) | 34 (1.0%) |
| Total | 2,931 (100.0%) | 3,295 (100.0%) |
Monthly Housing Cost Tiers in Gloversville
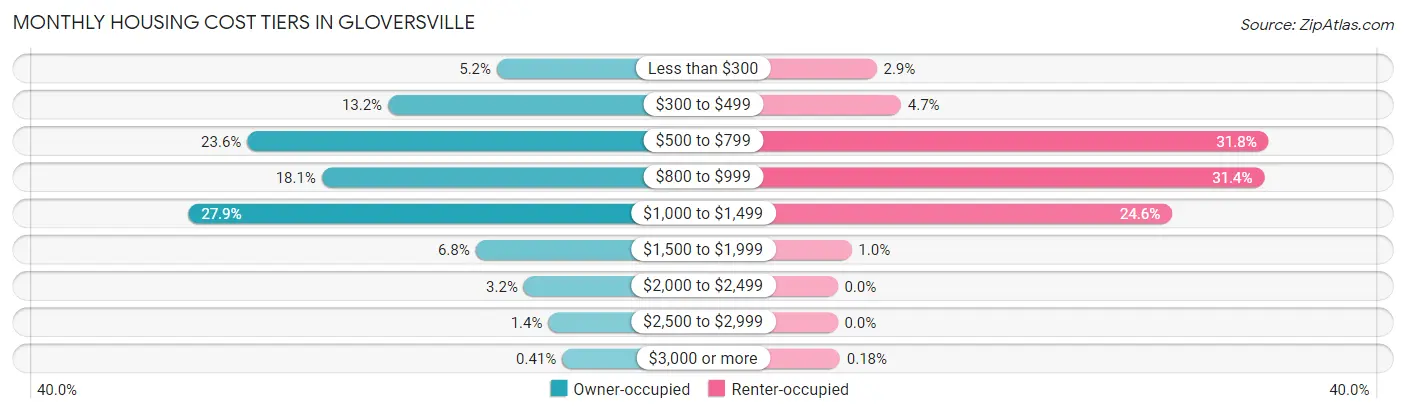
| Monthly Cost | Owner-occupied | Renter-occupied |
| Less than $300 | 153 (5.2%) | 95 (2.9%) |
| $300 to $499 | 388 (13.2%) | 154 (4.7%) |
| $500 to $799 | 692 (23.6%) | 1,046 (31.8%) |
| $800 to $999 | 531 (18.1%) | 1,036 (31.4%) |
| $1,000 to $1,499 | 819 (27.9%) | 812 (24.6%) |
| $1,500 to $1,999 | 199 (6.8%) | 34 (1.0%) |
| $2,000 to $2,499 | 95 (3.2%) | 0 (0.0%) |
| $2,500 to $2,999 | 42 (1.4%) | 0 (0.0%) |
| $3,000 or more | 12 (0.4%) | 6 (0.2%) |
| Total | 2,931 (100.0%) | 3,295 (100.0%) |
Physical Housing Characteristics in Gloversville
Housing Structures in Gloversville
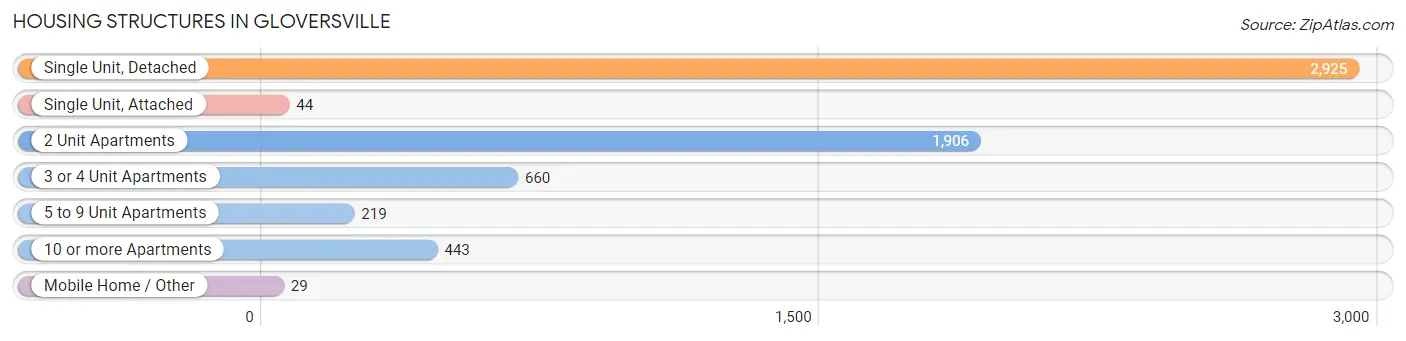
| Structure Type | # Housing Units | % Housing Units |
| Single Unit, Detached | 2,925 | 47.0% |
| Single Unit, Attached | 44 | 0.7% |
| 2 Unit Apartments | 1,906 | 30.6% |
| 3 or 4 Unit Apartments | 660 | 10.6% |
| 5 to 9 Unit Apartments | 219 | 3.5% |
| 10 or more Apartments | 443 | 7.1% |
| Mobile Home / Other | 29 | 0.5% |
| Total | 6,226 | 100.0% |
Housing Structures by Occupancy in Gloversville
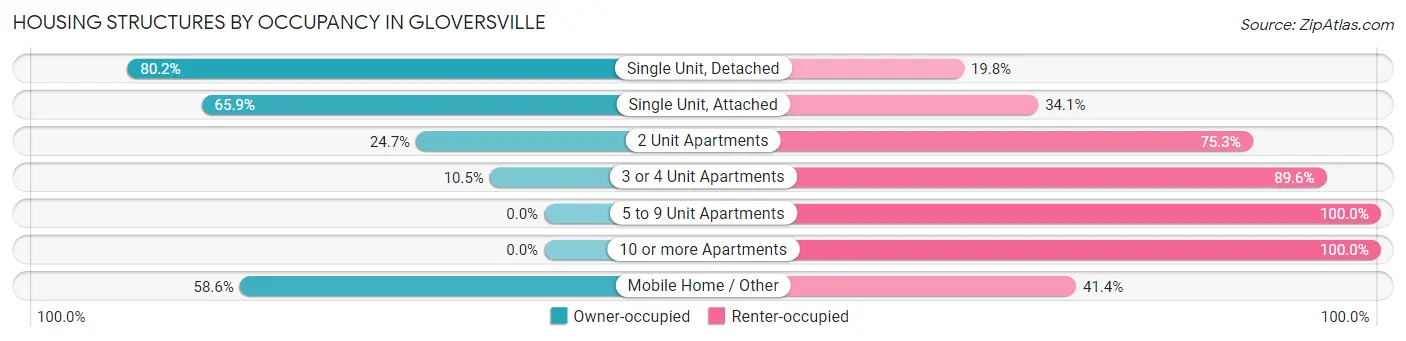
| Structure Type | Owner-occupied | Renter-occupied |
| Single Unit, Detached | 2,346 (80.2%) | 579 (19.8%) |
| Single Unit, Attached | 29 (65.9%) | 15 (34.1%) |
| 2 Unit Apartments | 470 (24.7%) | 1,436 (75.3%) |
| 3 or 4 Unit Apartments | 69 (10.4%) | 591 (89.5%) |
| 5 to 9 Unit Apartments | 0 (0.0%) | 219 (100.0%) |
| 10 or more Apartments | 0 (0.0%) | 443 (100.0%) |
| Mobile Home / Other | 17 (58.6%) | 12 (41.4%) |
| Total | 2,931 (47.1%) | 3,295 (52.9%) |
Housing Structures by Number of Rooms in Gloversville
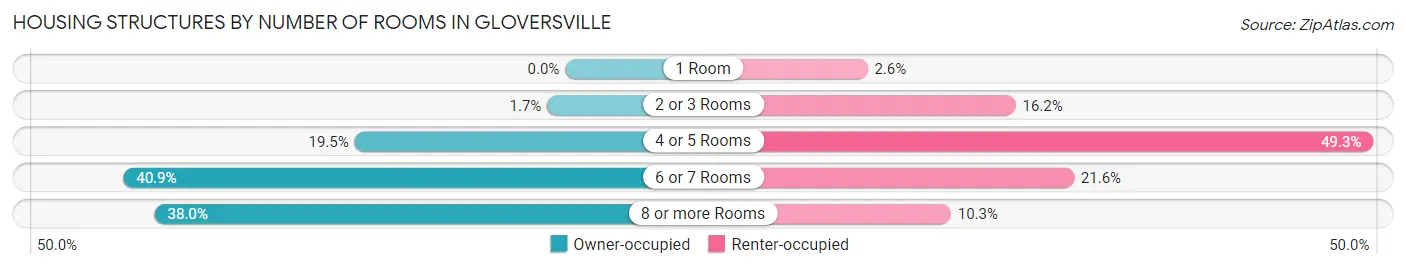
| Number of Rooms | Owner-occupied | Renter-occupied |
| 1 Room | 0 (0.0%) | 84 (2.5%) |
| 2 or 3 Rooms | 49 (1.7%) | 535 (16.2%) |
| 4 or 5 Rooms | 571 (19.5%) | 1,625 (49.3%) |
| 6 or 7 Rooms | 1,198 (40.9%) | 713 (21.6%) |
| 8 or more Rooms | 1,113 (38.0%) | 338 (10.3%) |
| Total | 2,931 (100.0%) | 3,295 (100.0%) |
Housing Structure by Heating Type in Gloversville
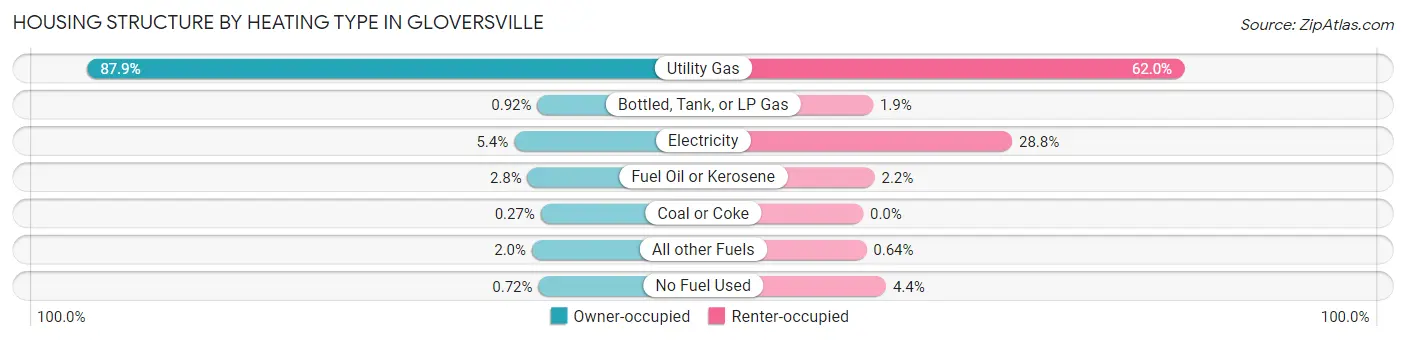
| Heating Type | Owner-occupied | Renter-occupied |
| Utility Gas | 2,576 (87.9%) | 2,043 (62.0%) |
| Bottled, Tank, or LP Gas | 27 (0.9%) | 63 (1.9%) |
| Electricity | 159 (5.4%) | 949 (28.8%) |
| Fuel Oil or Kerosene | 82 (2.8%) | 73 (2.2%) |
| Coal or Coke | 8 (0.3%) | 0 (0.0%) |
| All other Fuels | 58 (2.0%) | 21 (0.6%) |
| No Fuel Used | 21 (0.7%) | 146 (4.4%) |
| Total | 2,931 (100.0%) | 3,295 (100.0%) |
Household Vehicle Usage in Gloversville
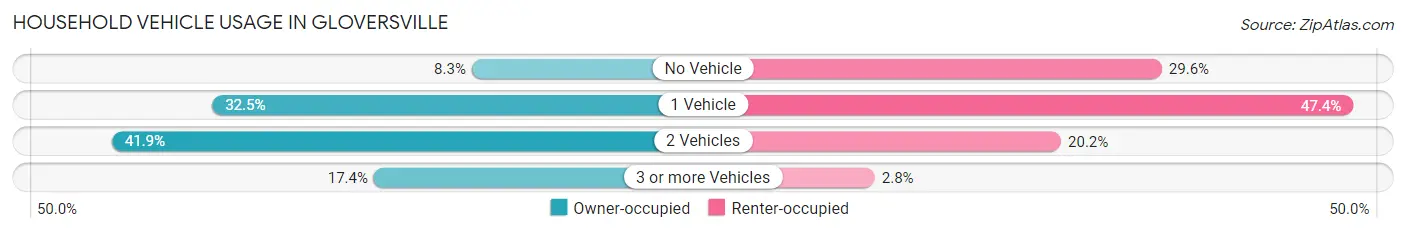
| Vehicles per Household | Owner-occupied | Renter-occupied |
| No Vehicle | 242 (8.3%) | 975 (29.6%) |
| 1 Vehicle | 952 (32.5%) | 1,563 (47.4%) |
| 2 Vehicles | 1,227 (41.9%) | 665 (20.2%) |
| 3 or more Vehicles | 510 (17.4%) | 92 (2.8%) |
| Total | 2,931 (100.0%) | 3,295 (100.0%) |
Real Estate & Mortgages in Gloversville
Real Estate and Mortgage Overview in Gloversville
| Characteristic | Without Mortgage | With Mortgage |
| Housing Units | 1,204 | 1,727 |
| Median Property Value | $79,400 | $93,000 |
| Median Household Income | $52,054 | $156 |
| Monthly Housing Costs | $546 | $12 |
| Real Estate Taxes | $2,449 | $53 |
Property Value by Mortgage Status in Gloversville
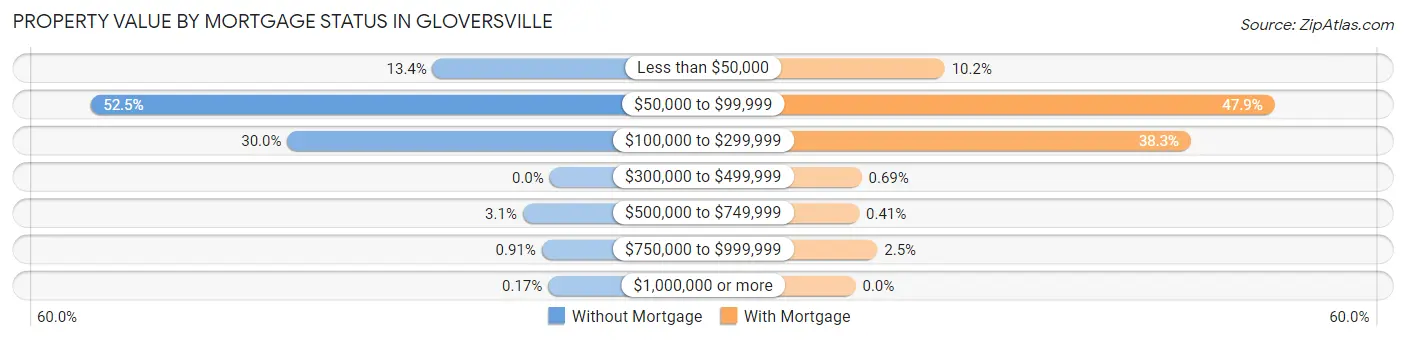
| Property Value | Without Mortgage | With Mortgage |
| Less than $50,000 | 161 (13.4%) | 176 (10.2%) |
| $50,000 to $99,999 | 632 (52.5%) | 827 (47.9%) |
| $100,000 to $299,999 | 361 (30.0%) | 662 (38.3%) |
| $300,000 to $499,999 | 0 (0.0%) | 12 (0.7%) |
| $500,000 to $749,999 | 37 (3.1%) | 7 (0.4%) |
| $750,000 to $999,999 | 11 (0.9%) | 43 (2.5%) |
| $1,000,000 or more | 2 (0.2%) | 0 (0.0%) |
| Total | 1,204 (100.0%) | 1,727 (100.0%) |
Household Income by Mortgage Status in Gloversville
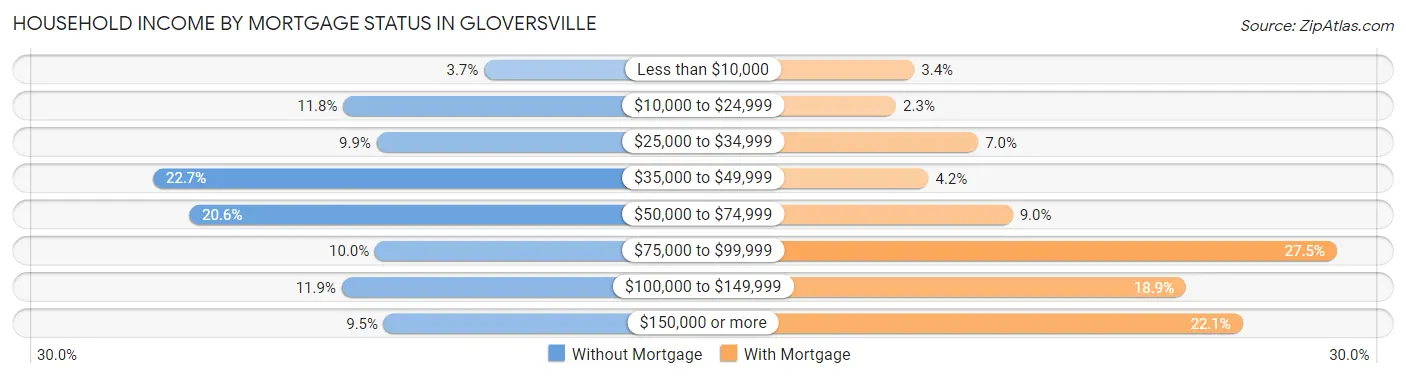
| Household Income | Without Mortgage | With Mortgage |
| Less than $10,000 | 45 (3.7%) | 58 (3.4%) |
| $10,000 to $24,999 | 142 (11.8%) | 40 (2.3%) |
| $25,000 to $34,999 | 119 (9.9%) | 121 (7.0%) |
| $35,000 to $49,999 | 273 (22.7%) | 72 (4.2%) |
| $50,000 to $74,999 | 248 (20.6%) | 155 (9.0%) |
| $75,000 to $99,999 | 120 (10.0%) | 475 (27.5%) |
| $100,000 to $149,999 | 143 (11.9%) | 326 (18.9%) |
| $150,000 or more | 114 (9.5%) | 382 (22.1%) |
| Total | 1,204 (100.0%) | 1,727 (100.0%) |
Property Value to Household Income Ratio in Gloversville
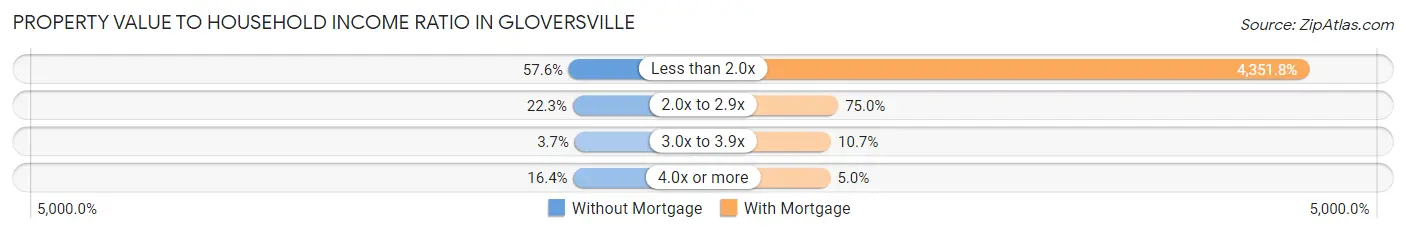
| Value-to-Income Ratio | Without Mortgage | With Mortgage |
| Less than 2.0x | 694 (57.6%) | 75,156 (4,351.8%) |
| 2.0x to 2.9x | 269 (22.3%) | 1,296 (75.0%) |
| 3.0x to 3.9x | 44 (3.6%) | 184 (10.6%) |
| 4.0x or more | 197 (16.4%) | 87 (5.0%) |
| Total | 1,204 (100.0%) | 1,727 (100.0%) |
Real Estate Taxes by Mortgage Status in Gloversville

| Property Taxes | Without Mortgage | With Mortgage |
| Less than $800 | 49 (4.1%) | 0 (0.0%) |
| $800 to $1,499 | 212 (17.6%) | 81 (4.7%) |
| $800 to $1,499 | 837 (69.5%) | 204 (11.8%) |
| Total | 1,204 (100.0%) | 1,727 (100.0%) |
Health & Disability in Gloversville
Health Insurance Coverage by Age in Gloversville
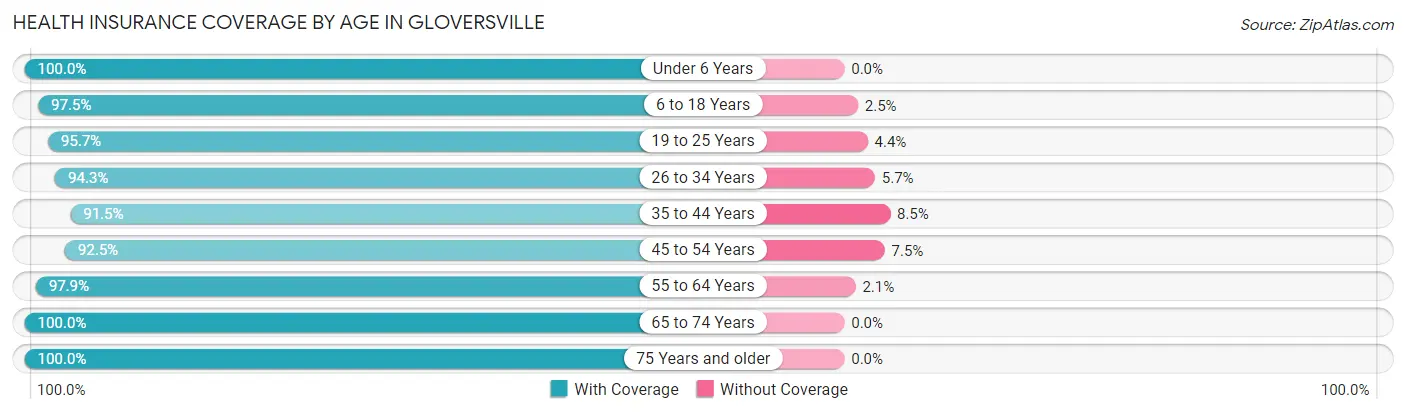
| Age Bracket | With Coverage | Without Coverage |
| Under 6 Years | 1,062 (100.0%) | 0 (0.0%) |
| 6 to 18 Years | 2,384 (97.5%) | 62 (2.5%) |
| 19 to 25 Years | 1,297 (95.7%) | 59 (4.3%) |
| 26 to 34 Years | 1,688 (94.3%) | 102 (5.7%) |
| 35 to 44 Years | 1,759 (91.5%) | 164 (8.5%) |
| 45 to 54 Years | 1,586 (92.5%) | 129 (7.5%) |
| 55 to 64 Years | 2,204 (97.9%) | 47 (2.1%) |
| 65 to 74 Years | 1,222 (100.0%) | 0 (0.0%) |
| 75 Years and older | 1,241 (100.0%) | 0 (0.0%) |
| Total | 14,443 (96.3%) | 563 (3.7%) |
Health Insurance Coverage by Citizenship Status in Gloversville

| Citizenship Status | With Coverage | Without Coverage |
| Native Born | 1,062 (100.0%) | 0 (0.0%) |
| Foreign Born, Citizen | 2,384 (97.5%) | 62 (2.5%) |
| Foreign Born, not a Citizen | 1,297 (95.7%) | 59 (4.3%) |
Health Insurance Coverage by Household Income in Gloversville
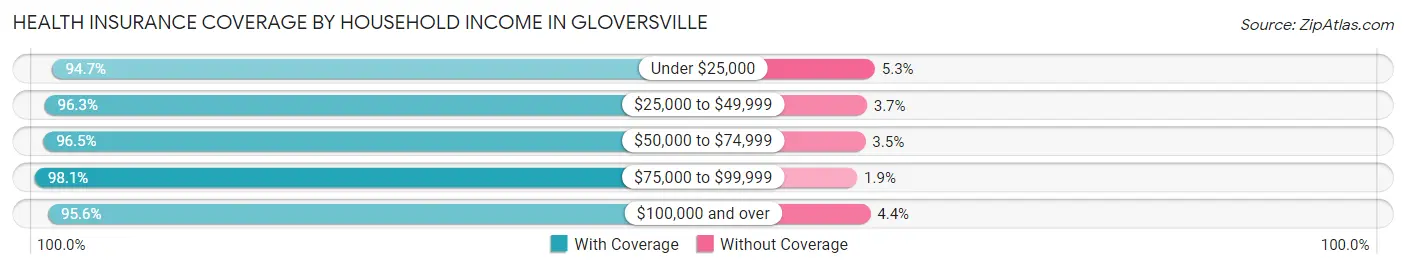
| Household Income | With Coverage | Without Coverage |
| Under $25,000 | 2,379 (94.7%) | 132 (5.3%) |
| $25,000 to $49,999 | 4,373 (96.3%) | 170 (3.7%) |
| $50,000 to $74,999 | 2,600 (96.5%) | 94 (3.5%) |
| $75,000 to $99,999 | 2,178 (98.1%) | 43 (1.9%) |
| $100,000 and over | 2,687 (95.6%) | 124 (4.4%) |
Public vs Private Health Insurance Coverage by Age in Gloversville
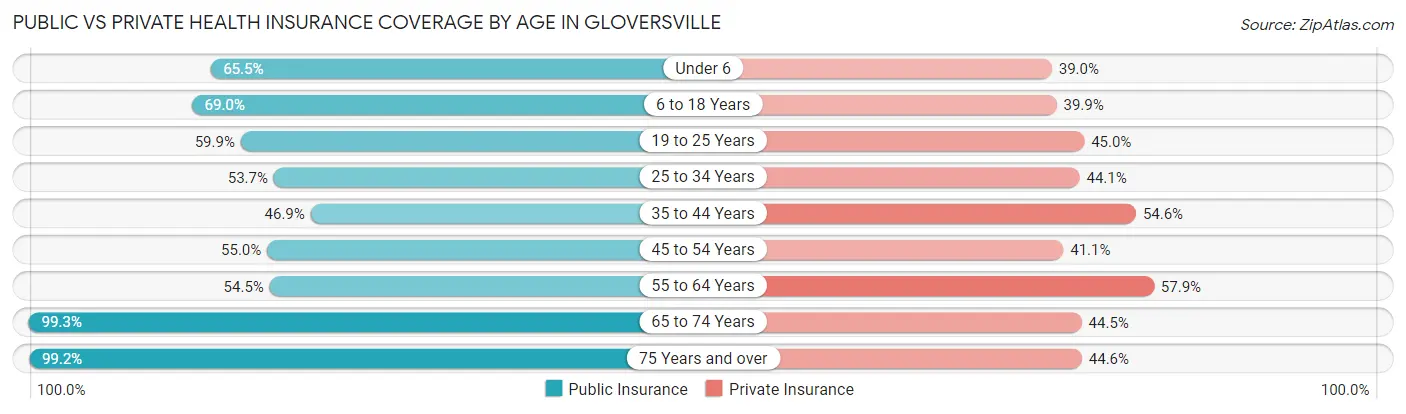
| Age Bracket | Public Insurance | Private Insurance |
| Under 6 | 696 (65.5%) | 414 (39.0%) |
| 6 to 18 Years | 1,688 (69.0%) | 975 (39.9%) |
| 19 to 25 Years | 812 (59.9%) | 610 (45.0%) |
| 25 to 34 Years | 962 (53.7%) | 790 (44.1%) |
| 35 to 44 Years | 902 (46.9%) | 1,050 (54.6%) |
| 45 to 54 Years | 943 (55.0%) | 705 (41.1%) |
| 55 to 64 Years | 1,227 (54.5%) | 1,304 (57.9%) |
| 65 to 74 Years | 1,213 (99.3%) | 544 (44.5%) |
| 75 Years and over | 1,231 (99.2%) | 553 (44.6%) |
| Total | 9,674 (64.5%) | 6,945 (46.3%) |
Disability Status by Sex by Age in Gloversville
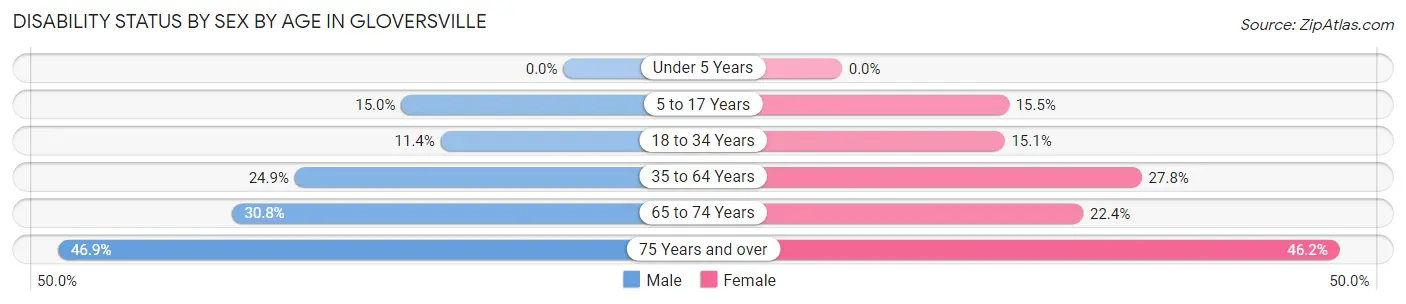
| Age Bracket | Male | Female |
| Under 5 Years | 0 (0.0%) | 0 (0.0%) |
| 5 to 17 Years | 185 (15.0%) | 173 (15.5%) |
| 18 to 34 Years | 207 (11.4%) | 239 (15.1%) |
| 35 to 64 Years | 704 (24.9%) | 853 (27.8%) |
| 65 to 74 Years | 170 (30.8%) | 150 (22.4%) |
| 75 Years and over | 250 (46.9%) | 327 (46.2%) |
Disability Class by Sex by Age in Gloversville
Disability Class: Hearing Difficulty
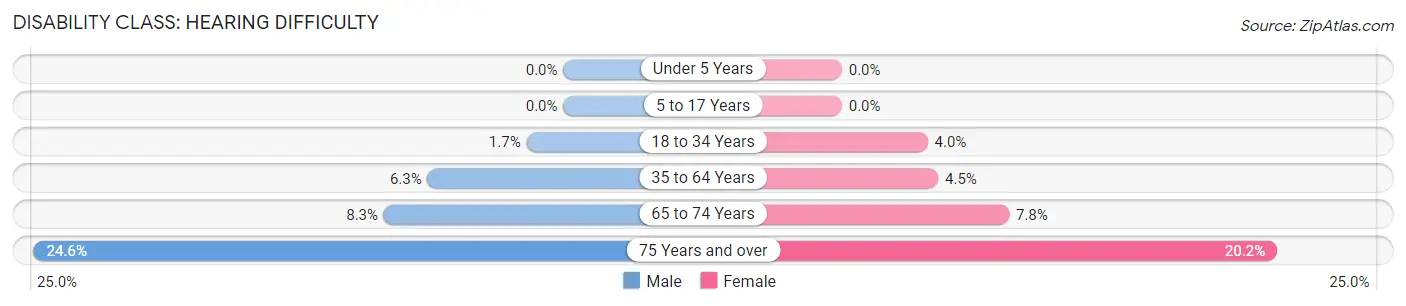
| Age Bracket | Male | Female |
| Under 5 Years | 0 (0.0%) | 0 (0.0%) |
| 5 to 17 Years | 0 (0.0%) | 0 (0.0%) |
| 18 to 34 Years | 31 (1.7%) | 63 (4.0%) |
| 35 to 64 Years | 178 (6.3%) | 137 (4.5%) |
| 65 to 74 Years | 46 (8.3%) | 52 (7.8%) |
| 75 Years and over | 131 (24.6%) | 143 (20.2%) |
Disability Class: Vision Difficulty
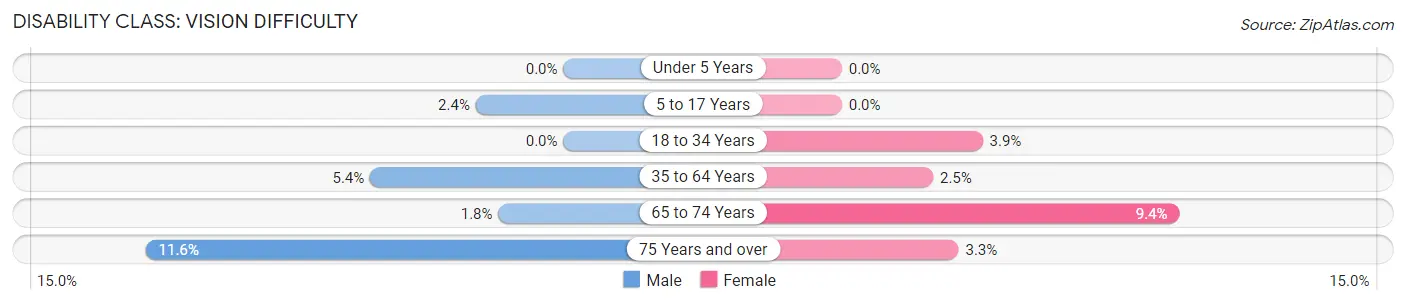
| Age Bracket | Male | Female |
| Under 5 Years | 0 (0.0%) | 0 (0.0%) |
| 5 to 17 Years | 30 (2.4%) | 0 (0.0%) |
| 18 to 34 Years | 0 (0.0%) | 62 (3.9%) |
| 35 to 64 Years | 152 (5.4%) | 78 (2.5%) |
| 65 to 74 Years | 10 (1.8%) | 63 (9.4%) |
| 75 Years and over | 62 (11.6%) | 23 (3.3%) |
Disability Class: Cognitive Difficulty
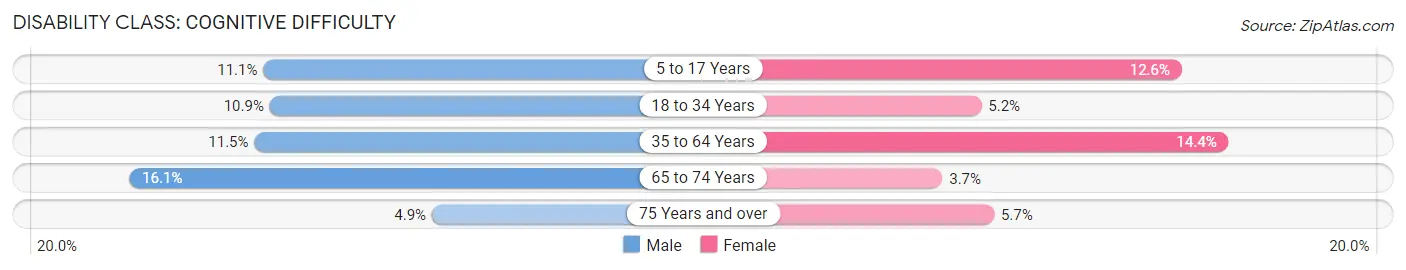
| Age Bracket | Male | Female |
| 5 to 17 Years | 137 (11.1%) | 141 (12.6%) |
| 18 to 34 Years | 198 (10.9%) | 82 (5.2%) |
| 35 to 64 Years | 324 (11.5%) | 440 (14.4%) |
| 65 to 74 Years | 89 (16.1%) | 25 (3.7%) |
| 75 Years and over | 26 (4.9%) | 40 (5.7%) |
Disability Class: Ambulatory Difficulty
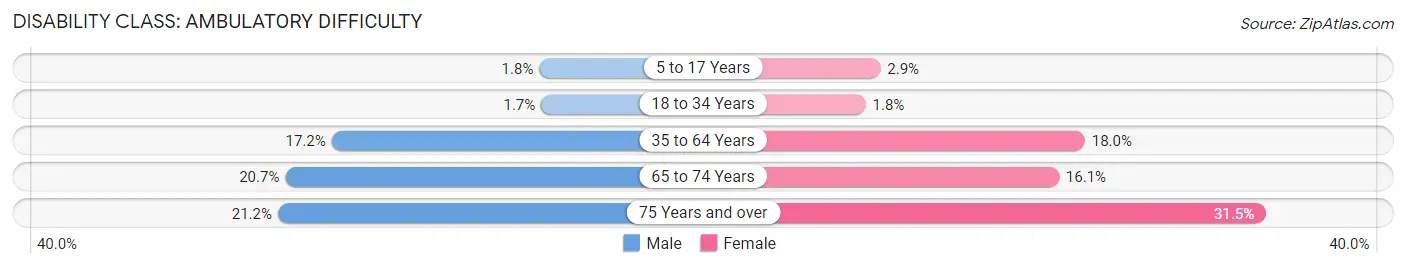
| Age Bracket | Male | Female |
| 5 to 17 Years | 22 (1.8%) | 32 (2.9%) |
| 18 to 34 Years | 30 (1.7%) | 28 (1.8%) |
| 35 to 64 Years | 486 (17.2%) | 553 (18.0%) |
| 65 to 74 Years | 114 (20.6%) | 108 (16.1%) |
| 75 Years and over | 113 (21.2%) | 223 (31.5%) |
Disability Class: Self-Care Difficulty

| Age Bracket | Male | Female |
| 5 to 17 Years | 10 (0.8%) | 28 (2.5%) |
| 18 to 34 Years | 32 (1.8%) | 39 (2.5%) |
| 35 to 64 Years | 114 (4.0%) | 142 (4.6%) |
| 65 to 74 Years | 11 (2.0%) | 55 (8.2%) |
| 75 Years and over | 4 (0.7%) | 25 (3.5%) |
Technology Access in Gloversville
Computing Device Access in Gloversville
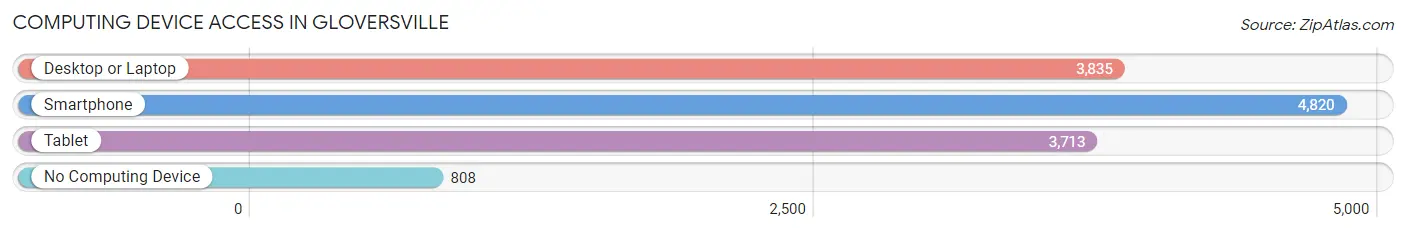
| Device Type | # Households | % Households |
| Desktop or Laptop | 3,835 | 61.6% |
| Smartphone | 4,820 | 77.4% |
| Tablet | 3,713 | 59.6% |
| No Computing Device | 808 | 13.0% |
| Total | 6,226 | 100.0% |
Internet Access in Gloversville
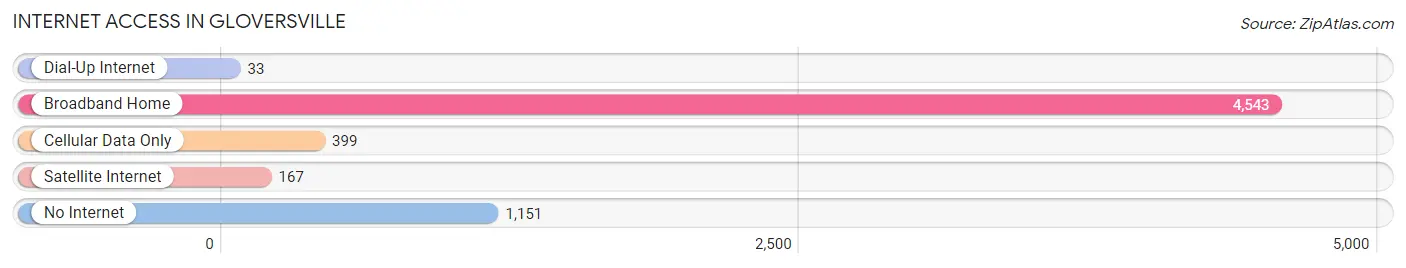
| Internet Type | # Households | % Households |
| Dial-Up Internet | 33 | 0.5% |
| Broadband Home | 4,543 | 73.0% |
| Cellular Data Only | 399 | 6.4% |
| Satellite Internet | 167 | 2.7% |
| No Internet | 1,151 | 18.5% |
| Total | 6,226 | 100.0% |
Gloversville Summary
Gloversville is a city located in Fulton County, New York, United States. It is the county seat of Fulton County and is located in the foothills of the Adirondack Mountains. The city is located in the Mohawk Valley region of New York and is part of the Gloversville-Johnstown Metropolitan Statistical Area. As of the 2010 census, the city had a population of 15,665.
History
Gloversville was first settled in 1763 by John Glove, a German immigrant. The city was incorporated in 1808 and was named after him. Glove was a tanner and glove maker, and the city quickly became a center for the leather industry. By the late 19th century, Gloversville was the largest producer of leather gloves in the world. The city was also home to several glove factories, tanneries, and leather goods manufacturers.
The city experienced a period of growth and prosperity in the late 19th and early 20th centuries. The population of Gloversville increased from 4,000 in 1880 to over 20,000 in 1920. The city was home to several prominent businesses, including the Glove City Bank, the Glove City Trust Company, and the Glove City Savings Bank.
The city's economy began to decline in the mid-20th century as the leather industry moved away from Gloversville. The population of the city decreased from 20,000 in 1920 to 15,665 in 2010.
Geography
Gloversville is located at 42°59′N 74°20′W (42.983, -74.333). The city is located in the foothills of the Adirondack Mountains and is part of the Mohawk Valley region of New York. The city is situated on the banks of the Cayadutta Creek.
The city has a total area of 4.2 square miles, all of which is land. Gloversville is located approximately 30 miles northwest of Albany and 60 miles east of Syracuse.
Economy
Gloversville's economy is largely based on the service industry. The city is home to several retail stores, restaurants, and other businesses. The city is also home to several manufacturing companies, including a paper mill and a plastics factory.
The city is also home to several educational institutions, including Fulton-Montgomery Community College and the Gloversville Enlarged School District.
Demographics
As of the 2010 census, the city had a population of 15,665. The racial makeup of the city was 94.2% White, 1.7% African American, 0.3% Native American, 0.7% Asian, 0.1% Pacific Islander, 1.3% from other races, and 1.7% from two or more races. Hispanic or Latino of any race were 4.2% of the population.
The median income for a household in the city was $35,945, and the median income for a family was $45,945. The per capita income for the city was $19,945. About 16.2% of the population was below the poverty line.
Common Questions
What is Per Capita Income in Gloversville?
Per Capita income in Gloversville is $25,627.
What is the Median Family Income in Gloversville?
Median Family Income in Gloversville is $53,971.
What is the Median Household income in Gloversville?
Median Household Income in Gloversville is $47,205.
What is Income or Wage Gap in Gloversville?
Income or Wage Gap in Gloversville is 12.7%.
Women in Gloversville earn 87.3 cents for every dollar earned by a man.
What is Family Income Deficit in Gloversville?
Family Income Deficit in Gloversville is $9,812.
Families that are below poverty line in Gloversville earn $9,812 less on average than the poverty threshold level.
What is Inequality or Gini Index in Gloversville?
Inequality or Gini Index in Gloversville is 0.41.
What is the Total Population of Gloversville?
Total Population of Gloversville is 15,113.
What is the Total Male Population of Gloversville?
Total Male Population of Gloversville is 7,506.
What is the Total Female Population of Gloversville?
Total Female Population of Gloversville is 7,607.
What is the Ratio of Males per 100 Females in Gloversville?
There are 98.67 Males per 100 Females in Gloversville.
What is the Ratio of Females per 100 Males in Gloversville?
There are 101.35 Females per 100 Males in Gloversville.
What is the Median Population Age in Gloversville?
Median Population Age in Gloversville is 38.1 Years.
What is the Average Family Size in Gloversville
Average Family Size in Gloversville is 2.9 People.
What is the Average Household Size in Gloversville
Average Household Size in Gloversville is 2.4 People.
How Large is the Labor Force in Gloversville?
There are 6,880 People in the Labor Forcein in Gloversville.
What is the Percentage of People in the Labor Force in Gloversville?
56.6% of People are in the Labor Force in Gloversville.
What is the Unemployment Rate in Gloversville?
Unemployment Rate in Gloversville is 7.2%.