Cities with the Most Immigrants from Afghanistan in New York
RELATED REPORTS & OPTIONS
Afghanistan
New York
Compare Cities
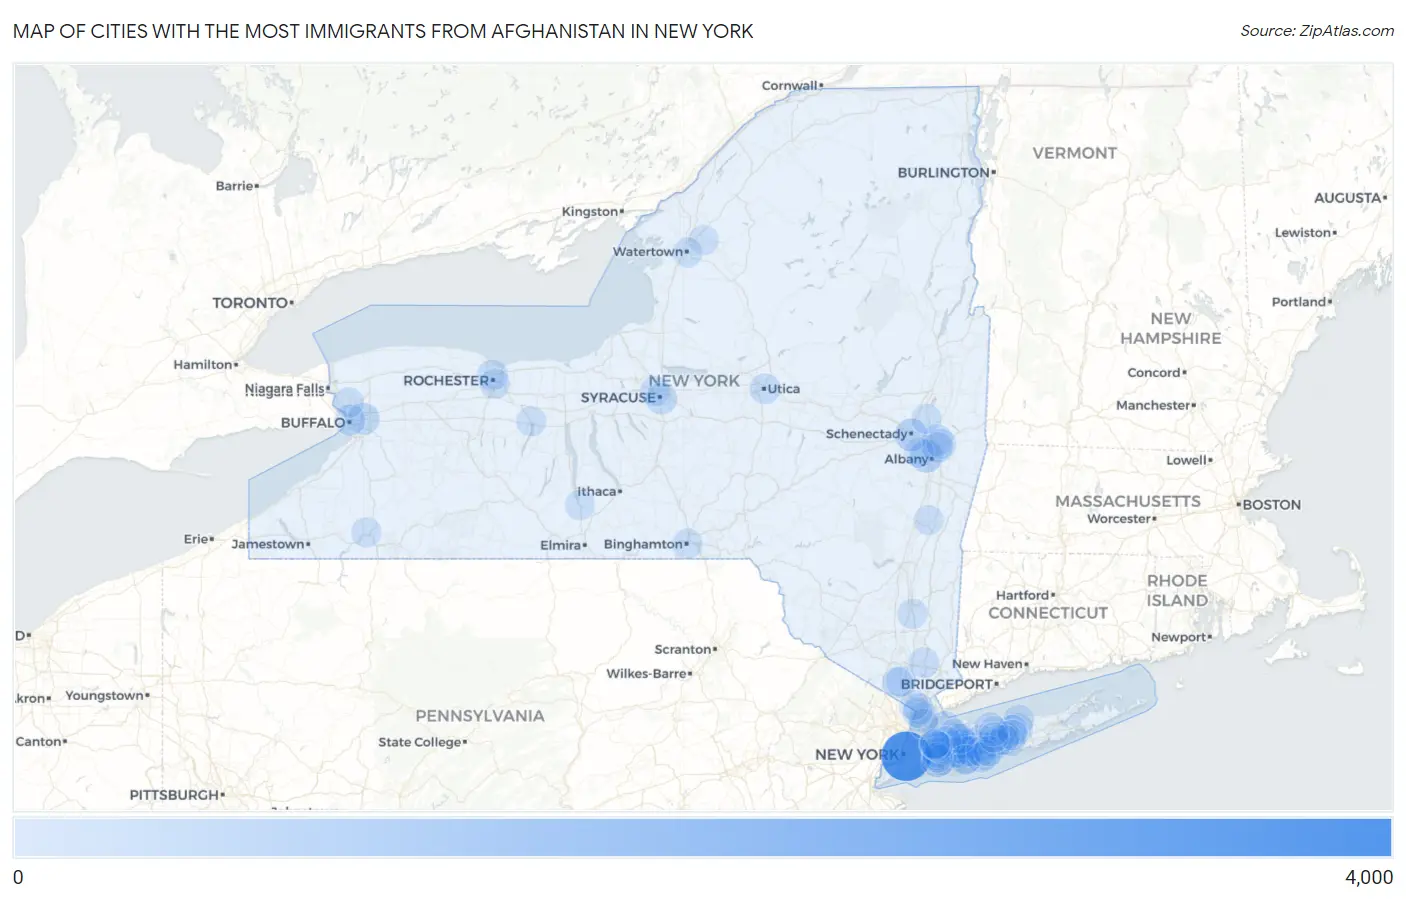
Map of Cities with the Most Immigrants from Afghanistan in New York
0
4,000
Cities with the Most Immigrants from Afghanistan in New York
| City | Afghanistan | vs State | vs National | |
| 1. | New York | 3,061 | 8,745(35.00%)#1 | 136,364(2.24%)#3 |
| 2. | Hicksville | 514 | 8,745(5.88%)#2 | 136,364(0.38%)#53 |
| 3. | Albany | 426 | 8,745(4.87%)#3 | 136,364(0.31%)#59 |
| 4. | Schenectady | 407 | 8,745(4.65%)#4 | 136,364(0.30%)#64 |
| 5. | Valley Stream | 315 | 8,745(3.60%)#5 | 136,364(0.23%)#77 |
| 6. | Clifton Gardens | 253 | 8,745(2.89%)#6 | 136,364(0.19%)#105 |
| 7. | Cheektowaga | 242 | 8,745(2.77%)#7 | 136,364(0.18%)#110 |
| 8. | Syracuse | 210 | 8,745(2.40%)#8 | 136,364(0.15%)#128 |
| 9. | Levittown | 186 | 8,745(2.13%)#9 | 136,364(0.14%)#144 |
| 10. | Coram | 178 | 8,745(2.04%)#10 | 136,364(0.13%)#152 |
| 11. | Cohoes | 123 | 8,745(1.41%)#11 | 136,364(0.09%)#216 |
| 12. | Watervliet | 119 | 8,745(1.36%)#12 | 136,364(0.09%)#222 |
| 13. | Buffalo | 101 | 8,745(1.15%)#13 | 136,364(0.07%)#247 |
| 14. | Deer Park | 99 | 8,745(1.13%)#14 | 136,364(0.07%)#254 |
| 15. | Utica | 95 | 8,745(1.09%)#15 | 136,364(0.07%)#260 |
| 16. | Rochester | 92 | 8,745(1.05%)#16 | 136,364(0.07%)#266 |
| 17. | Great Neck Plaza | 92 | 8,745(1.05%)#17 | 136,364(0.07%)#270 |
| 18. | Miller Place | 66 | 8,745(0.75%)#18 | 136,364(0.05%)#330 |
| 19. | Melville | 65 | 8,745(0.74%)#19 | 136,364(0.05%)#334 |
| 20. | Glen Cove | 59 | 8,745(0.67%)#20 | 136,364(0.04%)#348 |
| 21. | Dix Hills | 58 | 8,745(0.66%)#21 | 136,364(0.04%)#355 |
| 22. | Mount Ivy | 51 | 8,745(0.58%)#22 | 136,364(0.04%)#379 |
| 23. | Massapequa Park | 50 | 8,745(0.57%)#23 | 136,364(0.04%)#383 |
| 24. | Pomona | 50 | 8,745(0.57%)#24 | 136,364(0.04%)#385 |
| 25. | Dobbs Ferry | 45 | 8,745(0.51%)#25 | 136,364(0.03%)#410 |
| 26. | Shrub Oak | 38 | 8,745(0.43%)#26 | 136,364(0.03%)#450 |
| 27. | Plainview | 36 | 8,745(0.41%)#27 | 136,364(0.03%)#459 |
| 28. | Gananda | 36 | 8,745(0.41%)#28 | 136,364(0.03%)#463 |
| 29. | Farmingdale | 35 | 8,745(0.40%)#29 | 136,364(0.03%)#468 |
| 30. | Muttontown | 34 | 8,745(0.39%)#30 | 136,364(0.02%)#474 |
| 31. | Holbrook | 32 | 8,745(0.37%)#31 | 136,364(0.02%)#486 |
| 32. | Bard College | 32 | 8,745(0.37%)#32 | 136,364(0.02%)#491 |
| 33. | Kings Park | 30 | 8,745(0.34%)#33 | 136,364(0.02%)#503 |
| 34. | Elmont | 29 | 8,745(0.33%)#34 | 136,364(0.02%)#511 |
| 35. | Binghamton | 28 | 8,745(0.32%)#35 | 136,364(0.02%)#520 |
| 36. | East Meadow | 27 | 8,745(0.31%)#36 | 136,364(0.02%)#529 |
| 37. | Brighton | 26 | 8,745(0.30%)#37 | 136,364(0.02%)#538 |
| 38. | Selden | 26 | 8,745(0.30%)#38 | 136,364(0.02%)#539 |
| 39. | Galeville | 24 | 8,745(0.27%)#39 | 136,364(0.02%)#554 |
| 40. | Vassar College | 23 | 8,745(0.26%)#40 | 136,364(0.02%)#561 |
| 41. | Crown Heights | 22 | 8,745(0.25%)#41 | 136,364(0.02%)#571 |
| 42. | Manhasset Hills | 19 | 8,745(0.22%)#42 | 136,364(0.01%)#592 |
| 43. | Islandia | 19 | 8,745(0.22%)#43 | 136,364(0.01%)#593 |
| 44. | Bethpage | 17 | 8,745(0.19%)#44 | 136,364(0.01%)#612 |
| 45. | Tuckahoe | 17 | 8,745(0.19%)#45 | 136,364(0.01%)#614 |
| 46. | East Farmingdale | 17 | 8,745(0.19%)#46 | 136,364(0.01%)#615 |
| 47. | Mount Vernon | 16 | 8,745(0.18%)#47 | 136,364(0.01%)#622 |
| 48. | Upper Brookville | 16 | 8,745(0.18%)#48 | 136,364(0.01%)#635 |
| 49. | Fort Drum | 15 | 8,745(0.17%)#49 | 136,364(0.01%)#645 |
| 50. | Latham | 15 | 8,745(0.17%)#50 | 136,364(0.01%)#646 |
| 51. | Central Islip | 14 | 8,745(0.16%)#51 | 136,364(0.01%)#653 |
| 52. | Malverne | 14 | 8,745(0.16%)#52 | 136,364(0.01%)#662 |
| 53. | West Islip | 13 | 8,745(0.15%)#53 | 136,364(0.01%)#668 |
| 54. | Lake Ronkonkoma | 13 | 8,745(0.15%)#54 | 136,364(0.01%)#671 |
| 55. | Tonawanda | 12 | 8,745(0.14%)#55 | 136,364(0.01%)#676 |
| 56. | Ronkonkoma | 12 | 8,745(0.14%)#56 | 136,364(0.01%)#682 |
| 57. | Hastings On Hudson | 12 | 8,745(0.14%)#57 | 136,364(0.01%)#686 |
| 58. | Country Knolls | 12 | 8,745(0.14%)#58 | 136,364(0.01%)#687 |
| 59. | Westmere | 11 | 8,745(0.13%)#59 | 136,364(0.01%)#698 |
| 60. | East Hills | 11 | 8,745(0.13%)#60 | 136,364(0.01%)#699 |
| 61. | Farmingville | 10 | 8,745(0.11%)#61 | 136,364(0.01%)#707 |
| 62. | Babylon | 10 | 8,745(0.11%)#62 | 136,364(0.01%)#708 |
| 63. | Troy | 8 | 8,745(0.09%)#63 | 136,364(0.01%)#726 |
| 64. | Floral Park | 8 | 8,745(0.09%)#64 | 136,364(0.01%)#731 |
| 65. | Marist College | 8 | 8,745(0.09%)#65 | 136,364(0.01%)#736 |
| 66. | Syosset | 7 | 8,745(0.08%)#66 | 136,364(0.01%)#744 |
| 67. | Hudson | 7 | 8,745(0.08%)#67 | 136,364(0.01%)#747 |
| 68. | Massapequa | 6 | 8,745(0.07%)#68 | 136,364(0.00%)#761 |
| 69. | North Valley Stream | 6 | 8,745(0.07%)#69 | 136,364(0.00%)#762 |
| 70. | University Gardens | 6 | 8,745(0.07%)#70 | 136,364(0.00%)#767 |
| 71. | Piermont | 6 | 8,745(0.07%)#71 | 136,364(0.00%)#768 |
| 72. | North Babylon | 3 | 8,745(0.03%)#72 | 136,364(0.00%)#795 |
| 73. | Lake Success | 3 | 8,745(0.03%)#73 | 136,364(0.00%)#797 |
| 74. | Russell Gardens | 2 | 8,745(0.02%)#74 | 136,364(0.00%)#811 |
| 75. | Bay Shore | 1 | 8,745(0.01%)#75 | 136,364(0.00%)#815 |
| 76. | Smithtown | 1 | 8,745(0.01%)#76 | 136,364(0.00%)#816 |
| 77. | Watertown | 1 | 8,745(0.01%)#77 | 136,364(0.00%)#817 |
| 78. | Hauppauge | 1 | 8,745(0.01%)#78 | 136,364(0.00%)#818 |
| 79. | Canandaigua | 1 | 8,745(0.01%)#79 | 136,364(0.00%)#821 |
| 80. | Salamanca | 1 | 8,745(0.01%)#80 | 136,364(0.00%)#822 |
| 81. | Montour Falls | 1 | 8,745(0.01%)#81 | 136,364(0.00%)#823 |
Common Questions
What are the Top 10 Cities with the Most Immigrants from Afghanistan in New York?
Top 10 Cities with the Most Immigrants from Afghanistan in New York are:
#1
3,061
#2
514
#3
426
#4
407
#5
315
#6
242
#7
210
#8
186
#9
178
#10
123
What city has the Most Immigrants from Afghanistan in New York?
New York has the Most Immigrants from Afghanistan in New York with 3,061.
What is the Total Immigrants from Afghanistan in the State of New York?
Total Immigrants from Afghanistan in New York is 8,745.
What is the Total Immigrants from Afghanistan in the United States?
Total Immigrants from Afghanistan in the United States is 136,364.