Thiells, NY Map & Demographics
Thiells Map
Thiells Overview
$57,548
PER CAPITA INCOME
$147,569
AVG FAMILY INCOME
$122,417
AVG HOUSEHOLD INCOME
14.9%
WAGE / INCOME GAP [ % ]
85.1¢/ $1
WAGE / INCOME GAP [ $ ]
0.38
INEQUALITY / GINI INDEX
4,491
TOTAL POPULATION
2,295
MALE POPULATION
2,196
FEMALE POPULATION
104.51
MALES / 100 FEMALES
95.69
FEMALES / 100 MALES
44.1
MEDIAN AGE
3.2
AVG FAMILY SIZE
2.8
AVG HOUSEHOLD SIZE
2,420
LABOR FORCE [ PEOPLE ]
66.8%
PERCENT IN LABOR FORCE
1.1%
UNEMPLOYMENT RATE
Thiells Zip Codes
Thiells Area Codes
Income in Thiells
Income Overview in Thiells
Per Capita Income in Thiells is $57,548, while median incomes of families and households are $147,569 and $122,417 respectively.
| Characteristic | Number | Measure |
| Per Capita Income | 4,491 | $57,548 |
| Median Family Income | 1,252 | $147,569 |
| Mean Family Income | 1,252 | $174,864 |
| Median Household Income | 1,590 | $122,417 |
| Mean Household Income | 1,590 | $161,300 |
| Income Deficit | 1,252 | $0 |
| Wage / Income Gap (%) | 4,491 | 14.89% |
| Wage / Income Gap ($) | 4,491 | 85.11¢ per $1 |
| Gini / Inequality Index | 4,491 | 0.38 |
Earnings by Sex in Thiells
Average Earnings in Thiells are $65,393, $70,325 for men and $59,855 for women, a difference of 14.9%.
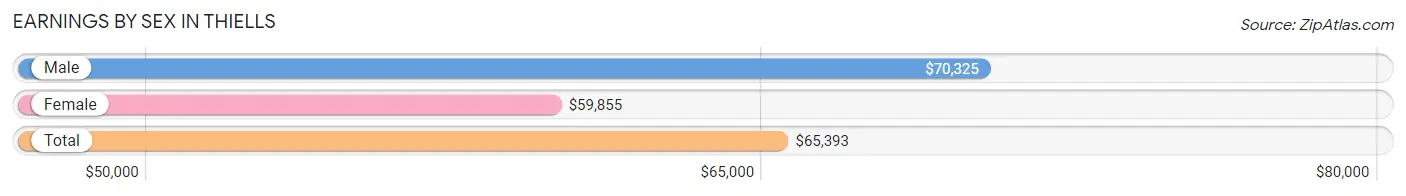
| Sex | Number | Average Earnings |
| Male | 1,289 (52.1%) | $70,325 |
| Female | 1,183 (47.9%) | $59,855 |
| Total | 2,472 (100.0%) | $65,393 |
Earnings by Sex by Income Bracket in Thiells
The most common earnings brackets in Thiells are $100,000+ for men (443 | 34.4%) and $100,000+ for women (225 | 19.0%).
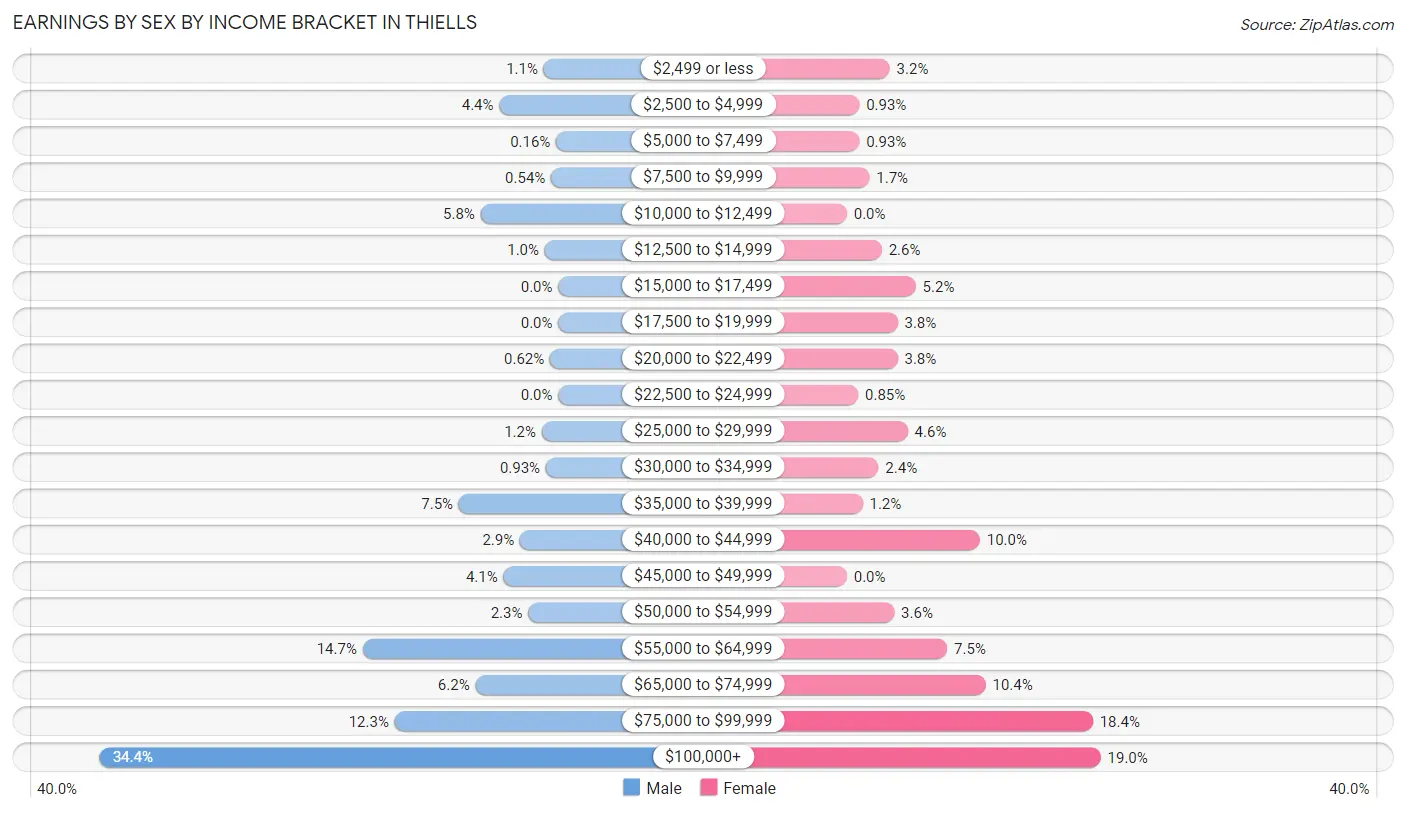
| Income | Male | Female |
| $2,499 or less | 14 (1.1%) | 38 (3.2%) |
| $2,500 to $4,999 | 57 (4.4%) | 11 (0.9%) |
| $5,000 to $7,499 | 2 (0.2%) | 11 (0.9%) |
| $7,500 to $9,999 | 7 (0.5%) | 20 (1.7%) |
| $10,000 to $12,499 | 75 (5.8%) | 0 (0.0%) |
| $12,500 to $14,999 | 13 (1.0%) | 31 (2.6%) |
| $15,000 to $17,499 | 0 (0.0%) | 61 (5.2%) |
| $17,500 to $19,999 | 0 (0.0%) | 45 (3.8%) |
| $20,000 to $22,499 | 8 (0.6%) | 45 (3.8%) |
| $22,500 to $24,999 | 0 (0.0%) | 10 (0.9%) |
| $25,000 to $29,999 | 16 (1.2%) | 54 (4.6%) |
| $30,000 to $34,999 | 12 (0.9%) | 28 (2.4%) |
| $35,000 to $39,999 | 96 (7.4%) | 14 (1.2%) |
| $40,000 to $44,999 | 37 (2.9%) | 118 (10.0%) |
| $45,000 to $49,999 | 53 (4.1%) | 0 (0.0%) |
| $50,000 to $54,999 | 29 (2.2%) | 42 (3.5%) |
| $55,000 to $64,999 | 189 (14.7%) | 89 (7.5%) |
| $65,000 to $74,999 | 80 (6.2%) | 123 (10.4%) |
| $75,000 to $99,999 | 158 (12.3%) | 218 (18.4%) |
| $100,000+ | 443 (34.4%) | 225 (19.0%) |
| Total | 1,289 (100.0%) | 1,183 (100.0%) |
Earnings by Sex by Educational Attainment in Thiells
Average earnings in Thiells are $71,550 for men and $66,358 for women, a difference of 7.3%. Men with an educational attainment of graduate degree enjoy the highest average annual earnings of $107,946, while those with high school diploma education earn the least with $45,944. Women with an educational attainment of graduate degree earn the most with the average annual earnings of $97,604, while those with college or associate's degree education have the smallest earnings of $36,964.
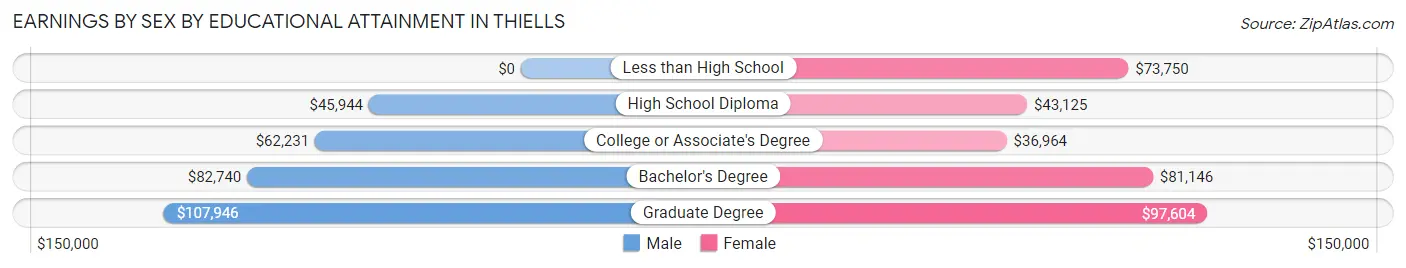
| Educational Attainment | Male Income | Female Income |
| Less than High School | - | - |
| High School Diploma | $45,944 | $43,125 |
| College or Associate's Degree | $62,231 | $36,964 |
| Bachelor's Degree | $82,740 | $81,146 |
| Graduate Degree | $107,946 | $97,604 |
| Total | $71,550 | $66,358 |
Family Income in Thiells
Family Income Brackets in Thiells
According to the Thiells family income data, there are 422 families falling into the $200,000+ income range, which is the most common income bracket and makes up 33.7% of all families.
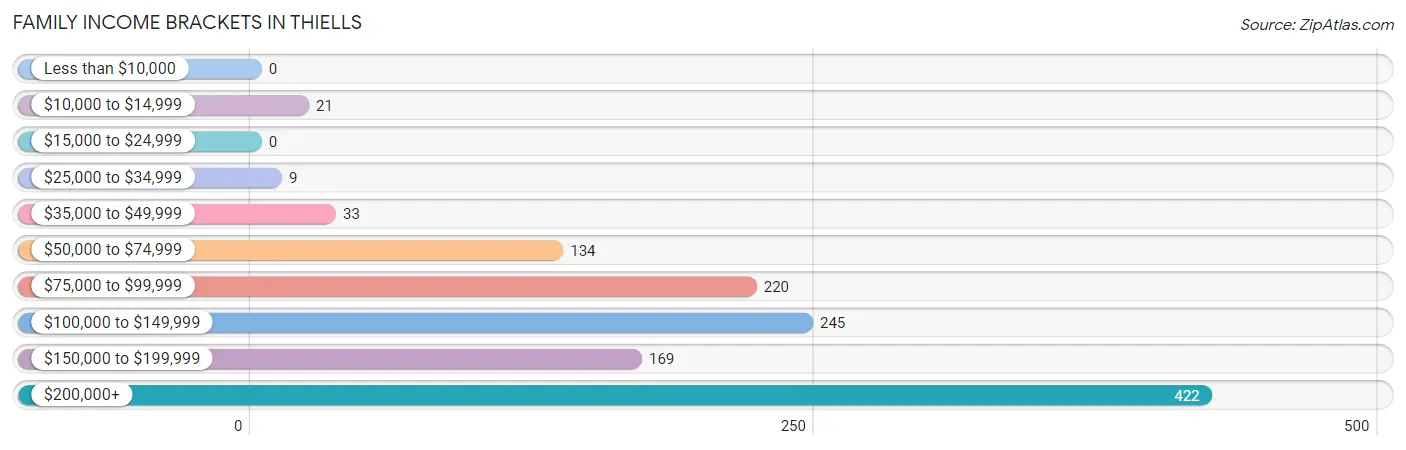
| Income Bracket | # Families | % Families |
| Less than $10,000 | 0 | 0.0% |
| $10,000 to $14,999 | 21 | 1.7% |
| $15,000 to $24,999 | 0 | 0.0% |
| $25,000 to $34,999 | 9 | 0.7% |
| $35,000 to $49,999 | 33 | 2.6% |
| $50,000 to $74,999 | 134 | 10.7% |
| $75,000 to $99,999 | 220 | 17.6% |
| $100,000 to $149,999 | 245 | 19.6% |
| $150,000 to $199,999 | 169 | 13.5% |
| $200,000+ | 422 | 33.7% |
Family Income by Famaliy Size in Thiells
5-person families (73 | 5.8%) account for the highest median family income in Thiells with $250,001 per family, while 3-person families (322 | 25.7%) have the highest median income of $66,364 per family member.
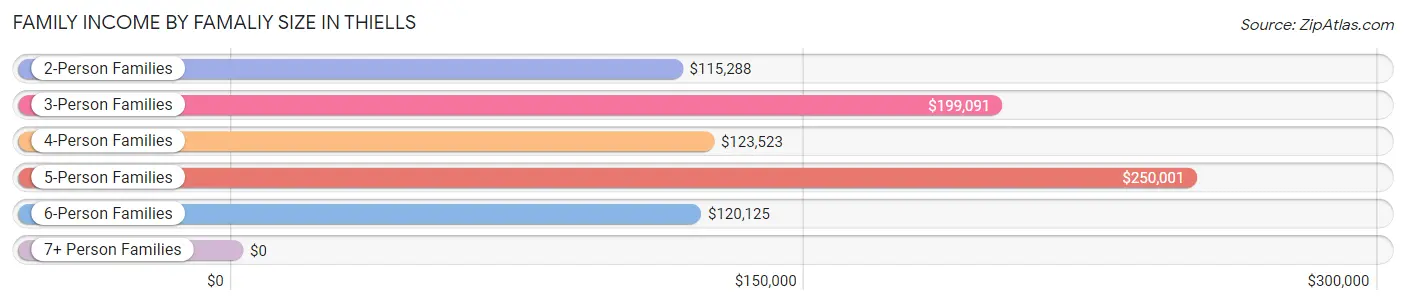
| Income Bracket | # Families | Median Income |
| 2-Person Families | 485 (38.7%) | $115,288 |
| 3-Person Families | 322 (25.7%) | $199,091 |
| 4-Person Families | 288 (23.0%) | $123,523 |
| 5-Person Families | 73 (5.8%) | $250,001 |
| 6-Person Families | 73 (5.8%) | $120,125 |
| 7+ Person Families | 11 (0.9%) | $0 |
| Total | 1,252 (100.0%) | $147,569 |
Family Income by Number of Earners in Thiells
The median family income in Thiells is $147,569, with families comprising 3+ earners (145) having the highest median family income of $200,875, while families with no earners (148) have the lowest median family income of $68,438, accounting for 11.6% and 11.8% of families, respectively.
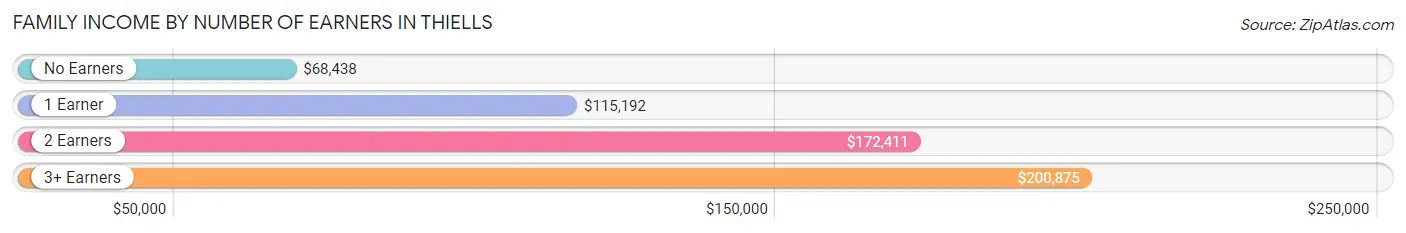
| Number of Earners | # Families | Median Income |
| No Earners | 148 (11.8%) | $68,438 |
| 1 Earner | 272 (21.7%) | $115,192 |
| 2 Earners | 687 (54.9%) | $172,411 |
| 3+ Earners | 145 (11.6%) | $200,875 |
| Total | 1,252 (100.0%) | $147,569 |
Household Income in Thiells
Household Income Brackets in Thiells
With 467 households falling in the category, the $200,000+ income range is the most frequent in Thiells, accounting for 29.4% of all households.
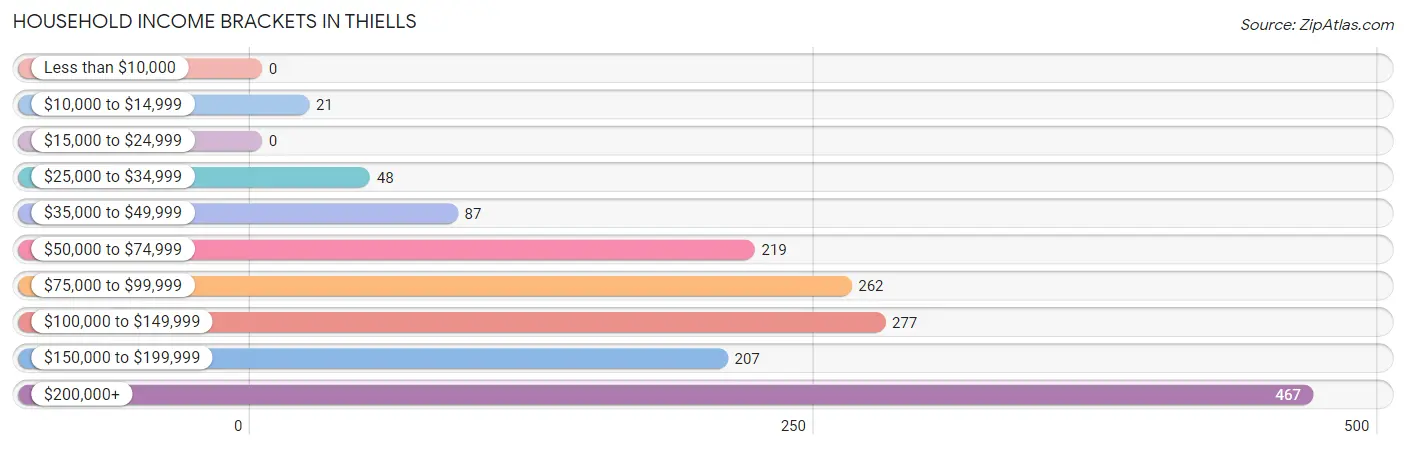
| Income Bracket | # Households | % Households |
| Less than $10,000 | 0 | 0.0% |
| $10,000 to $14,999 | 21 | 1.3% |
| $15,000 to $24,999 | 0 | 0.0% |
| $25,000 to $34,999 | 48 | 3.0% |
| $35,000 to $49,999 | 87 | 5.5% |
| $50,000 to $74,999 | 219 | 13.8% |
| $75,000 to $99,999 | 262 | 16.5% |
| $100,000 to $149,999 | 277 | 17.4% |
| $150,000 to $199,999 | 207 | 13.0% |
| $200,000+ | 467 | 29.4% |
Household Income by Householder Age in Thiells
The median household income in Thiells is $122,417, with the highest median household income of $156,500 found in the 45 to 64 years age bracket for the primary householder. A total of 686 households (43.1%) fall into this category.
| Income Bracket | # Households | Median Income |
| 15 to 24 Years | 0 (0.0%) | $0 |
| 25 to 44 Years | 368 (23.1%) | $118,636 |
| 45 to 64 Years | 686 (43.1%) | $156,500 |
| 65+ Years | 536 (33.7%) | $97,969 |
| Total | 1,590 (100.0%) | $122,417 |
Poverty in Thiells
Income Below Poverty by Sex and Age in Thiells
With 2.5% poverty level for males and 1.7% for females among the residents of Thiells, 16 and 17 year old males and 15 year old females are the most vulnerable to poverty, with 13 males (25.0%) and 11 females (23.4%) in their respective age groups living below the poverty level.
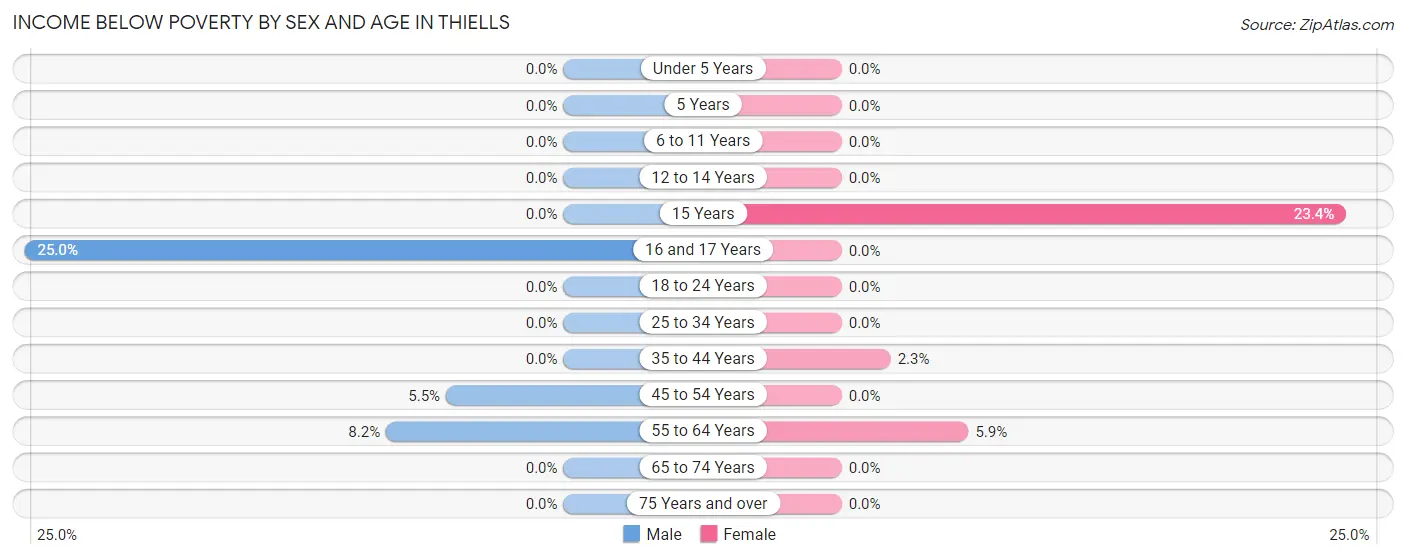
| Age Bracket | Male | Female |
| Under 5 Years | 0 (0.0%) | 0 (0.0%) |
| 5 Years | 0 (0.0%) | 0 (0.0%) |
| 6 to 11 Years | 0 (0.0%) | 0 (0.0%) |
| 12 to 14 Years | 0 (0.0%) | 0 (0.0%) |
| 15 Years | 0 (0.0%) | 11 (23.4%) |
| 16 and 17 Years | 13 (25.0%) | 0 (0.0%) |
| 18 to 24 Years | 0 (0.0%) | 0 (0.0%) |
| 25 to 34 Years | 0 (0.0%) | 0 (0.0%) |
| 35 to 44 Years | 0 (0.0%) | 5 (2.3%) |
| 45 to 54 Years | 11 (5.4%) | 0 (0.0%) |
| 55 to 64 Years | 33 (8.2%) | 21 (5.9%) |
| 65 to 74 Years | 0 (0.0%) | 0 (0.0%) |
| 75 Years and over | 0 (0.0%) | 0 (0.0%) |
| Total | 57 (2.5%) | 37 (1.7%) |
Income Above Poverty by Sex and Age in Thiells
According to the poverty statistics in Thiells, males aged under 5 years and females aged under 5 years are the age groups that are most secure financially, with 100.0% of males and 100.0% of females in these age groups living above the poverty line.
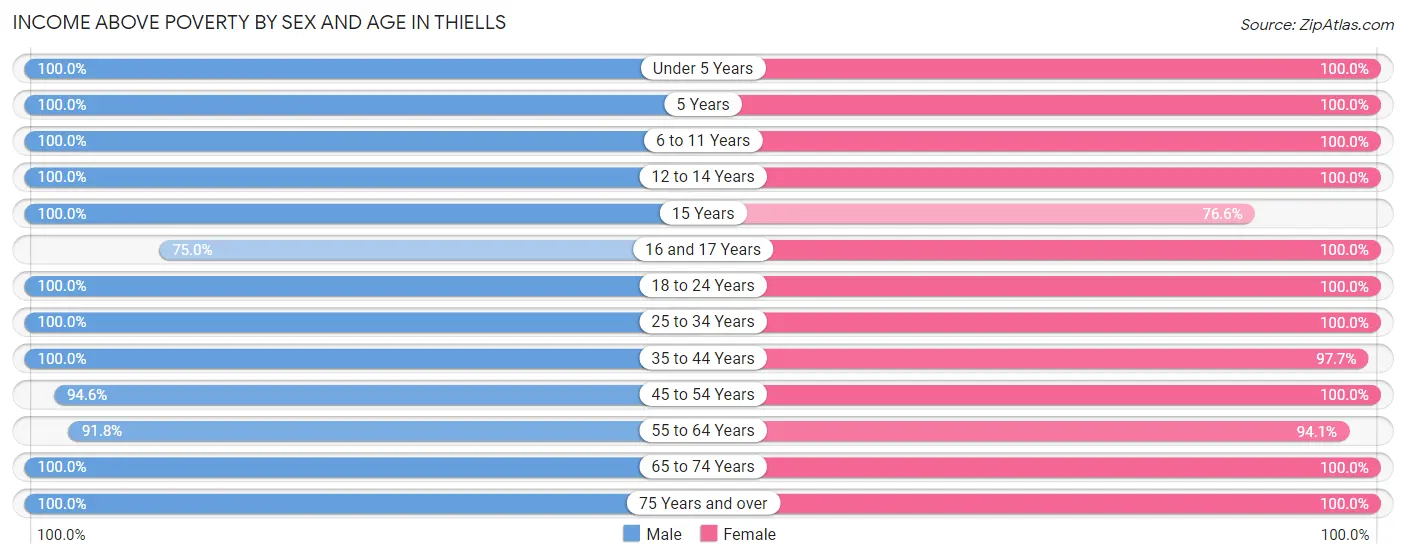
| Age Bracket | Male | Female |
| Under 5 Years | 177 (100.0%) | 163 (100.0%) |
| 5 Years | 12 (100.0%) | 4 (100.0%) |
| 6 to 11 Years | 205 (100.0%) | 46 (100.0%) |
| 12 to 14 Years | 36 (100.0%) | 150 (100.0%) |
| 15 Years | 19 (100.0%) | 36 (76.6%) |
| 16 and 17 Years | 39 (75.0%) | 26 (100.0%) |
| 18 to 24 Years | 77 (100.0%) | 201 (100.0%) |
| 25 to 34 Years | 369 (100.0%) | 229 (100.0%) |
| 35 to 44 Years | 264 (100.0%) | 215 (97.7%) |
| 45 to 54 Years | 191 (94.6%) | 293 (100.0%) |
| 55 to 64 Years | 368 (91.8%) | 336 (94.1%) |
| 65 to 74 Years | 294 (100.0%) | 254 (100.0%) |
| 75 Years and over | 187 (100.0%) | 197 (100.0%) |
| Total | 2,238 (97.5%) | 2,150 (98.3%) |
Income Below Poverty Among Married-Couple Families in Thiells
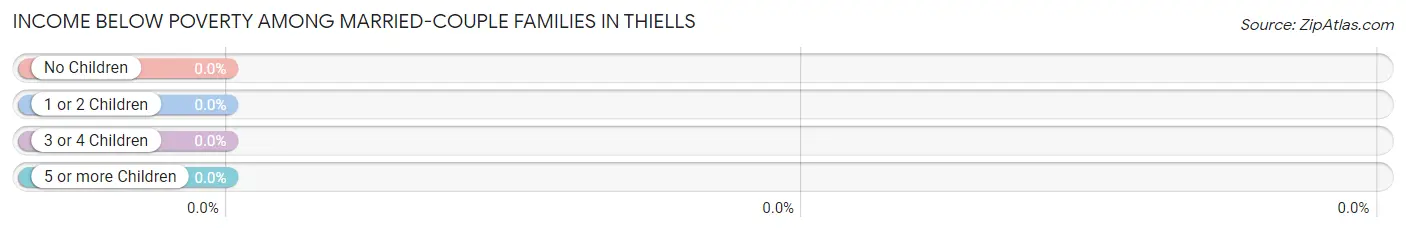
| Children | Above Poverty | Below Poverty |
| No Children | 632 (100.0%) | 0 (0.0%) |
| 1 or 2 Children | 307 (100.0%) | 0 (0.0%) |
| 3 or 4 Children | 68 (100.0%) | 0 (0.0%) |
| 5 or more Children | 0 (0.0%) | 0 (0.0%) |
| Total | 1,007 (100.0%) | 0 (0.0%) |
Income Below Poverty Among Single-Parent Households in Thiells
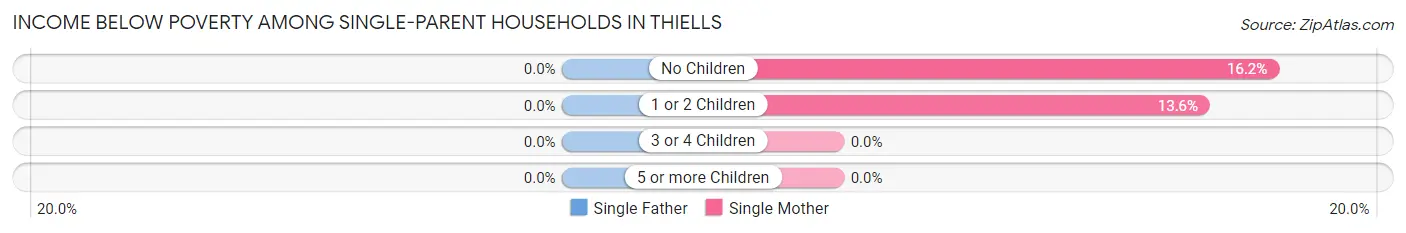
| Children | Single Father | Single Mother |
| No Children | 0 (0.0%) | 12 (16.2%) |
| 1 or 2 Children | 0 (0.0%) | 9 (13.6%) |
| 3 or 4 Children | 0 (0.0%) | 0 (0.0%) |
| 5 or more Children | 0 (0.0%) | 0 (0.0%) |
| Total | 0 (0.0%) | 21 (12.4%) |
Income Below Poverty Among Married-Couple vs Single-Parent Households in Thiells
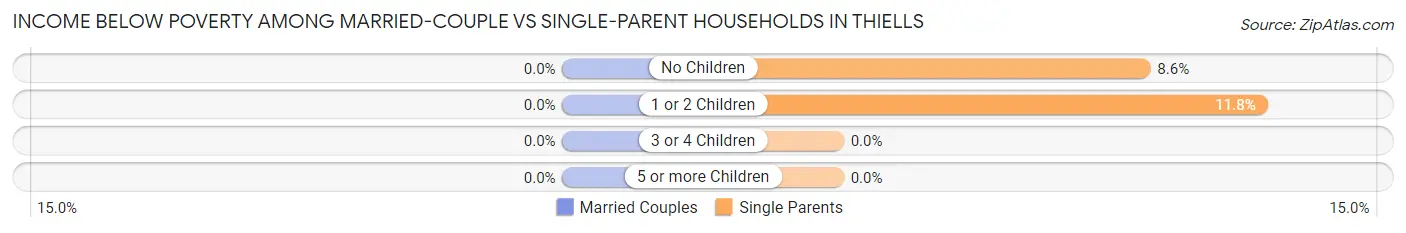
| Children | Married-Couple Families | Single-Parent Households |
| No Children | 0 (0.0%) | 12 (8.6%) |
| 1 or 2 Children | 0 (0.0%) | 9 (11.8%) |
| 3 or 4 Children | 0 (0.0%) | 0 (0.0%) |
| 5 or more Children | 0 (0.0%) | 0 (0.0%) |
| Total | 0 (0.0%) | 21 (8.6%) |
Race in Thiells
The most populous races in Thiells are White / Caucasian (3,127 | 69.6%), Hispanic or Latino (914 | 20.3%), and Black / African American (456 | 10.2%).
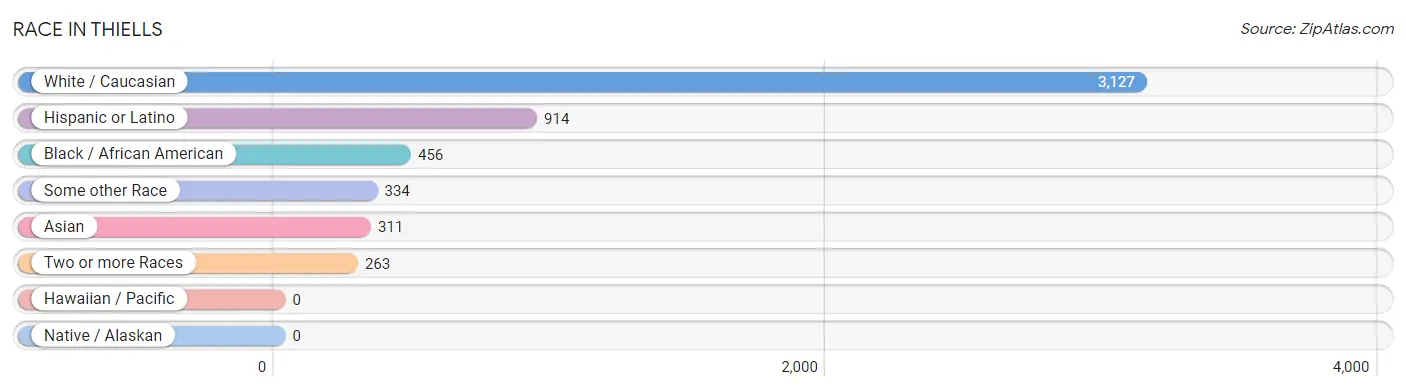
| Race | # Population | % Population |
| Asian | 311 | 6.9% |
| Black / African American | 456 | 10.2% |
| Hawaiian / Pacific | 0 | 0.0% |
| Hispanic or Latino | 914 | 20.3% |
| Native / Alaskan | 0 | 0.0% |
| White / Caucasian | 3,127 | 69.6% |
| Two or more Races | 263 | 5.9% |
| Some other Race | 334 | 7.4% |
| Total | 4,491 | 100.0% |
Ancestry in Thiells
The most populous ancestries reported in Thiells are Italian (640 | 14.2%), Irish (503 | 11.2%), Puerto Rican (460 | 10.2%), German (326 | 7.3%), and Dominican (294 | 6.6%), together accounting for 49.5% of all Thiells residents.
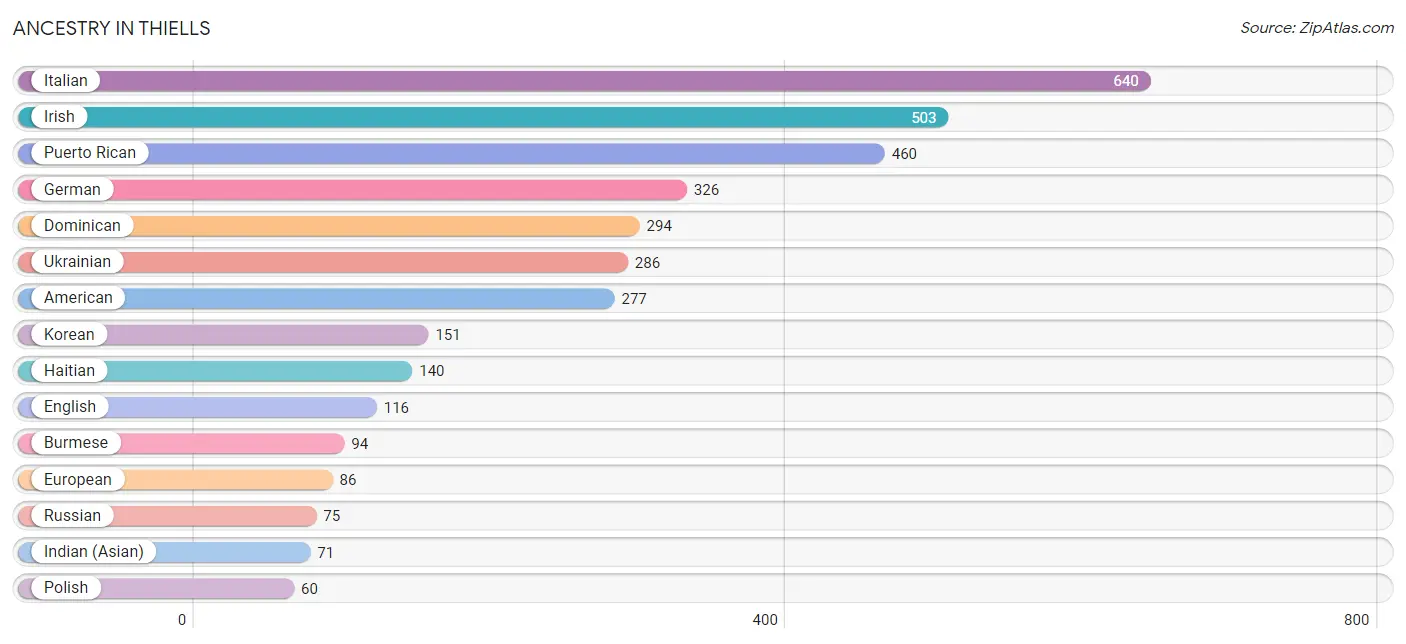
| Ancestry | # Population | % Population |
| Albanian | 44 | 1.0% |
| American | 277 | 6.2% |
| Arab | 34 | 0.8% |
| Austrian | 13 | 0.3% |
| Burmese | 94 | 2.1% |
| Central American | 46 | 1.0% |
| Chilean | 14 | 0.3% |
| Costa Rican | 12 | 0.3% |
| Cuban | 13 | 0.3% |
| Dominican | 294 | 6.6% |
| Dutch | 25 | 0.6% |
| English | 116 | 2.6% |
| European | 86 | 1.9% |
| French | 9 | 0.2% |
| French Canadian | 9 | 0.2% |
| German | 326 | 7.3% |
| Greek | 26 | 0.6% |
| Guatemalan | 34 | 0.8% |
| Haitian | 140 | 3.1% |
| Icelander | 23 | 0.5% |
| Indian (Asian) | 71 | 1.6% |
| Irish | 503 | 11.2% |
| Israeli | 30 | 0.7% |
| Italian | 640 | 14.2% |
| Jamaican | 21 | 0.5% |
| Korean | 151 | 3.4% |
| Lithuanian | 12 | 0.3% |
| Mexican | 14 | 0.3% |
| Mexican American Indian | 14 | 0.3% |
| Moroccan | 34 | 0.8% |
| Northern European | 10 | 0.2% |
| Norwegian | 6 | 0.1% |
| Peruvian | 22 | 0.5% |
| Polish | 60 | 1.3% |
| Portuguese | 9 | 0.2% |
| Puerto Rican | 460 | 10.2% |
| Russian | 75 | 1.7% |
| Scandinavian | 8 | 0.2% |
| Scottish | 41 | 0.9% |
| South American | 36 | 0.8% |
| Spanish | 39 | 0.9% |
| Swedish | 9 | 0.2% |
| Ukrainian | 286 | 6.4% |
| Welsh | 9 | 0.2% | View All 44 Rows |
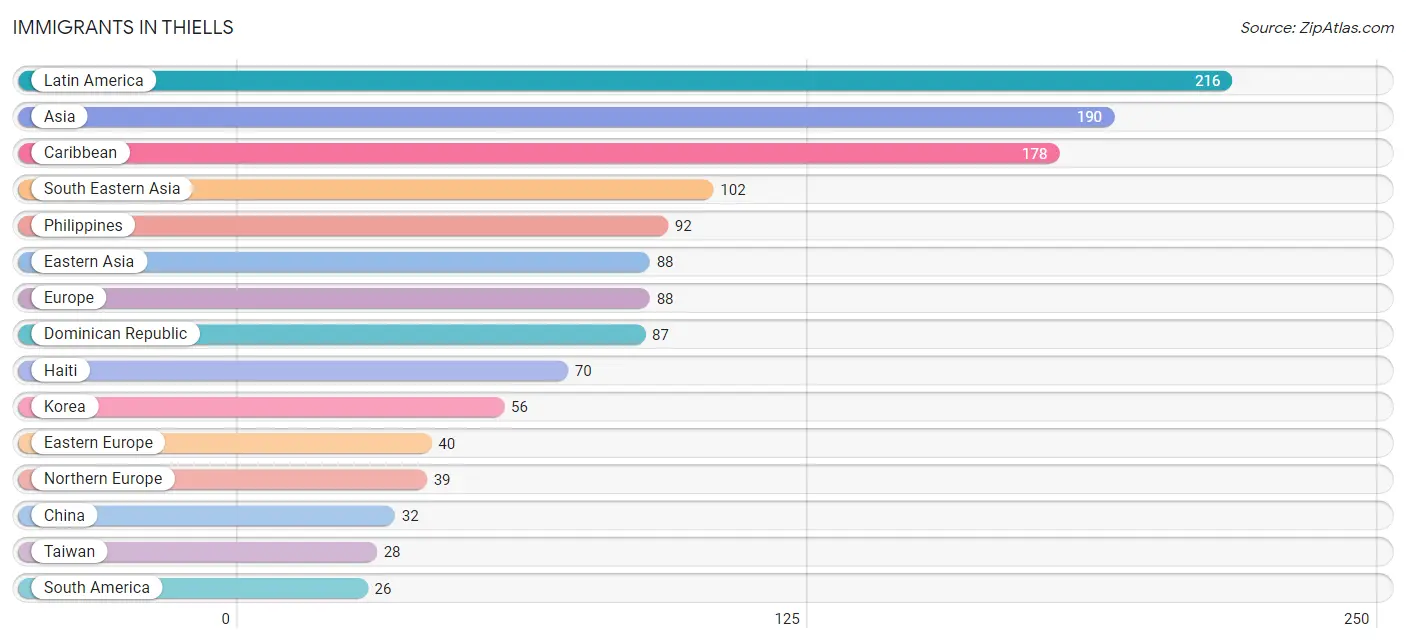
Immigrants in Thiells
The most numerous immigrant groups reported in Thiells came from Latin America (216 | 4.8%), Asia (190 | 4.2%), Caribbean (178 | 4.0%), South Eastern Asia (102 | 2.3%), and Philippines (92 | 2.1%), together accounting for 17.3% of all Thiells residents.
| Immigration Origin | # Population | % Population |
| Albania | 16 | 0.4% |
| Asia | 190 | 4.2% |
| Caribbean | 178 | 4.0% |
| Central America | 12 | 0.3% |
| Chile | 14 | 0.3% |
| China | 32 | 0.7% |
| Costa Rica | 12 | 0.3% |
| Croatia | 8 | 0.2% |
| Dominican Republic | 87 | 1.9% |
| Eastern Asia | 88 | 2.0% |
| Eastern Europe | 40 | 0.9% |
| Europe | 88 | 2.0% |
| Haiti | 70 | 1.6% |
| Jamaica | 21 | 0.5% |
| Korea | 56 | 1.3% |
| Latin America | 216 | 4.8% |
| Malaysia | 10 | 0.2% |
| Northern Europe | 39 | 0.9% |
| Peru | 12 | 0.3% |
| Philippines | 92 | 2.1% |
| Poland | 16 | 0.4% |
| Portugal | 9 | 0.2% |
| South America | 26 | 0.6% |
| South Eastern Asia | 102 | 2.3% |
| Southern Europe | 9 | 0.2% |
| Taiwan | 28 | 0.6% | View All 26 Rows |
Sex and Age in Thiells
Sex and Age in Thiells
The most populous age groups in Thiells are 25 to 29 Years (247 | 10.8%) for men and 15 to 19 Years (196 | 8.9%) for women.
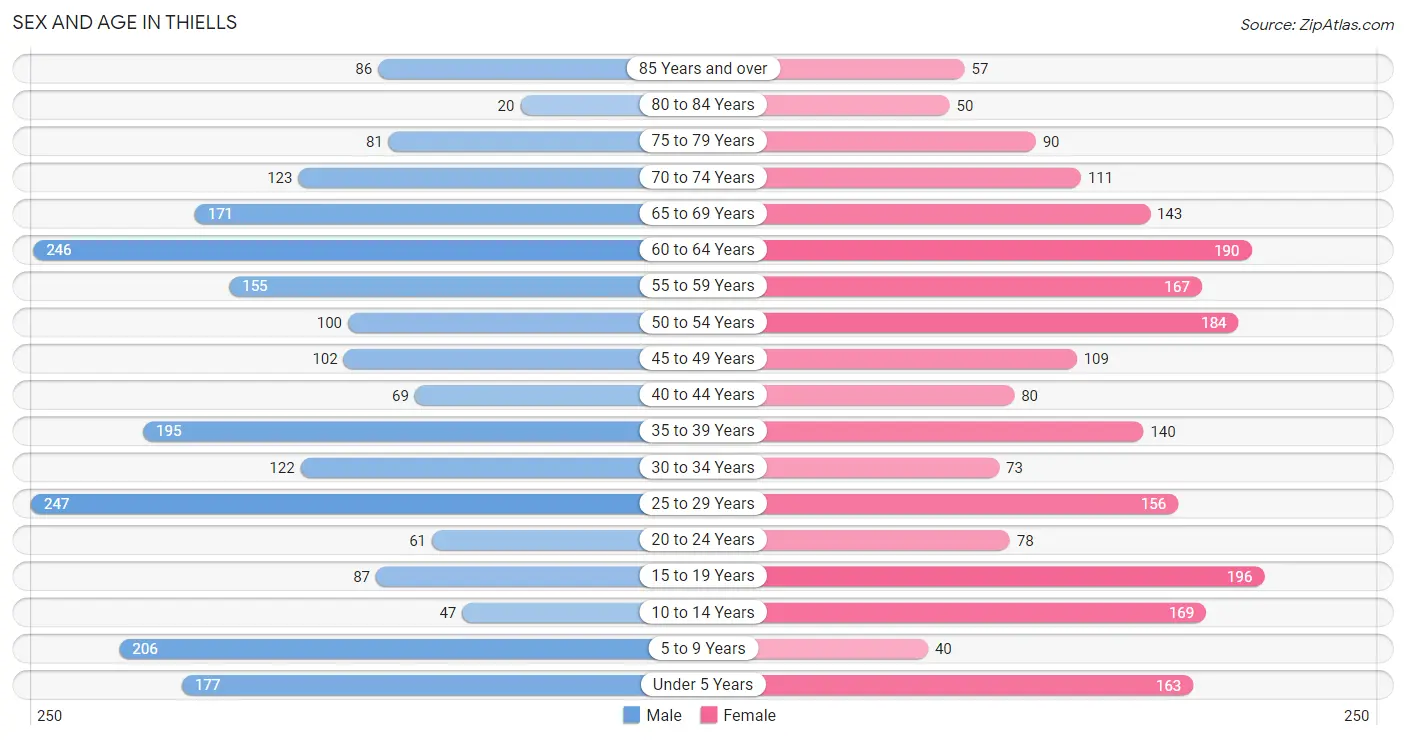
| Age Bracket | Male | Female |
| Under 5 Years | 177 (7.7%) | 163 (7.4%) |
| 5 to 9 Years | 206 (9.0%) | 40 (1.8%) |
| 10 to 14 Years | 47 (2.1%) | 169 (7.7%) |
| 15 to 19 Years | 87 (3.8%) | 196 (8.9%) |
| 20 to 24 Years | 61 (2.7%) | 78 (3.5%) |
| 25 to 29 Years | 247 (10.8%) | 156 (7.1%) |
| 30 to 34 Years | 122 (5.3%) | 73 (3.3%) |
| 35 to 39 Years | 195 (8.5%) | 140 (6.4%) |
| 40 to 44 Years | 69 (3.0%) | 80 (3.6%) |
| 45 to 49 Years | 102 (4.4%) | 109 (5.0%) |
| 50 to 54 Years | 100 (4.4%) | 184 (8.4%) |
| 55 to 59 Years | 155 (6.8%) | 167 (7.6%) |
| 60 to 64 Years | 246 (10.7%) | 190 (8.6%) |
| 65 to 69 Years | 171 (7.4%) | 143 (6.5%) |
| 70 to 74 Years | 123 (5.4%) | 111 (5.1%) |
| 75 to 79 Years | 81 (3.5%) | 90 (4.1%) |
| 80 to 84 Years | 20 (0.9%) | 50 (2.3%) |
| 85 Years and over | 86 (3.7%) | 57 (2.6%) |
| Total | 2,295 (100.0%) | 2,196 (100.0%) |
Families and Households in Thiells
Median Family Size in Thiells
The median family size in Thiells is 3.18 persons per family, with single male/father families (76 | 6.1%) accounting for the largest median family size of 4.37 persons per family. On the other hand, married-couple families (1,007 | 80.4%) represent the smallest median family size with 3.03 persons per family.
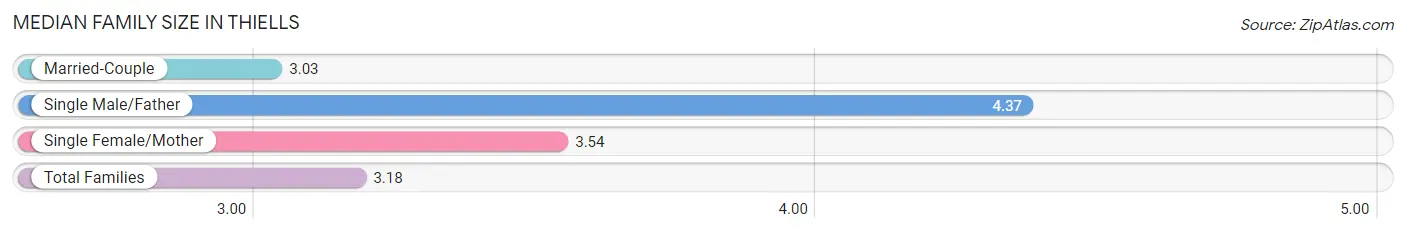
| Family Type | # Families | Family Size |
| Married-Couple | 1,007 (80.4%) | 3.03 |
| Single Male/Father | 76 (6.1%) | 4.37 |
| Single Female/Mother | 169 (13.5%) | 3.54 |
| Total Families | 1,252 (100.0%) | 3.18 |
Median Household Size in Thiells
The median household size in Thiells is 2.82 persons per household, with single male/father households (76 | 4.8%) accounting for the largest median household size of 4.37 persons per household. non-family households (338 | 21.3%) represent the smallest median household size with 1.30 persons per household.
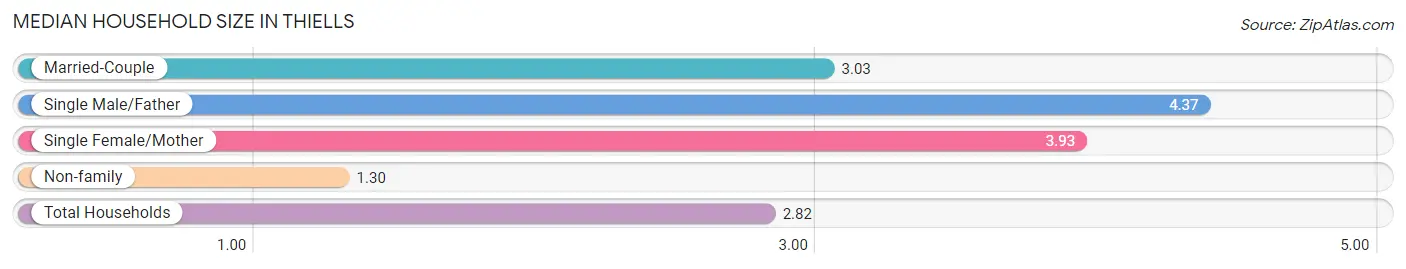
| Household Type | # Households | Household Size |
| Married-Couple | 1,007 (63.3%) | 3.03 |
| Single Male/Father | 76 (4.8%) | 4.37 |
| Single Female/Mother | 169 (10.6%) | 3.93 |
| Non-family | 338 (21.3%) | 1.30 |
| Total Households | 1,590 (100.0%) | 2.82 |
Household Size by Marriage Status in Thiells
Out of a total of 1,590 households in Thiells, 1,252 (78.7%) are family households, while 338 (21.3%) are nonfamily households. The most numerous type of family households are 2-person households, comprising 485, and the most common type of nonfamily households are 1-person households, comprising 247.
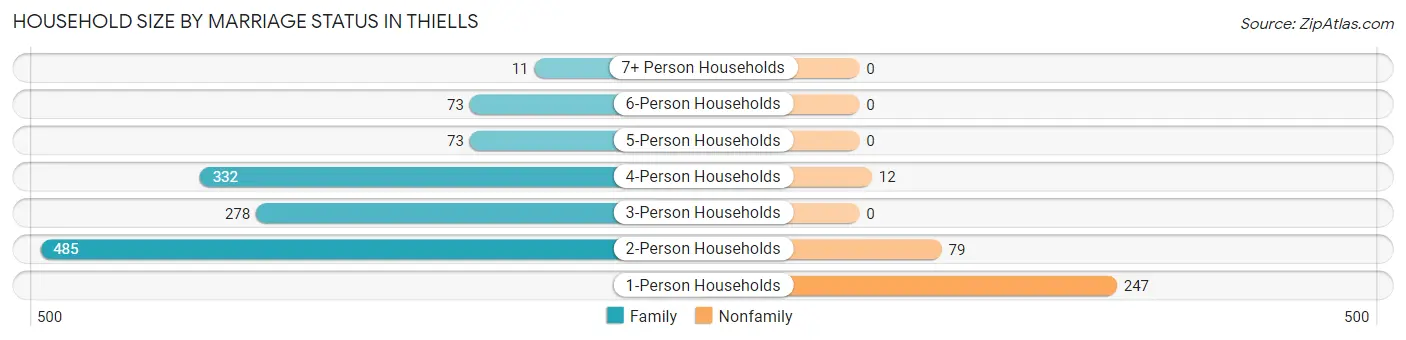
| Household Size | Family Households | Nonfamily Households |
| 1-Person Households | - | 247 (15.5%) |
| 2-Person Households | 485 (30.5%) | 79 (5.0%) |
| 3-Person Households | 278 (17.5%) | 0 (0.0%) |
| 4-Person Households | 332 (20.9%) | 12 (0.7%) |
| 5-Person Households | 73 (4.6%) | 0 (0.0%) |
| 6-Person Households | 73 (4.6%) | 0 (0.0%) |
| 7+ Person Households | 11 (0.7%) | 0 (0.0%) |
| Total | 1,252 (78.7%) | 338 (21.3%) |
Female Fertility in Thiells
Fertility by Age in Thiells
Average fertility rate in Thiells is 58.0 births per 1,000 women. Women in the age bracket of 20 to 34 years have the highest fertility rate with 156.0 births per 1,000 women. Women in the age bracket of 20 to 34 years acount for 90.6% of all women with births.
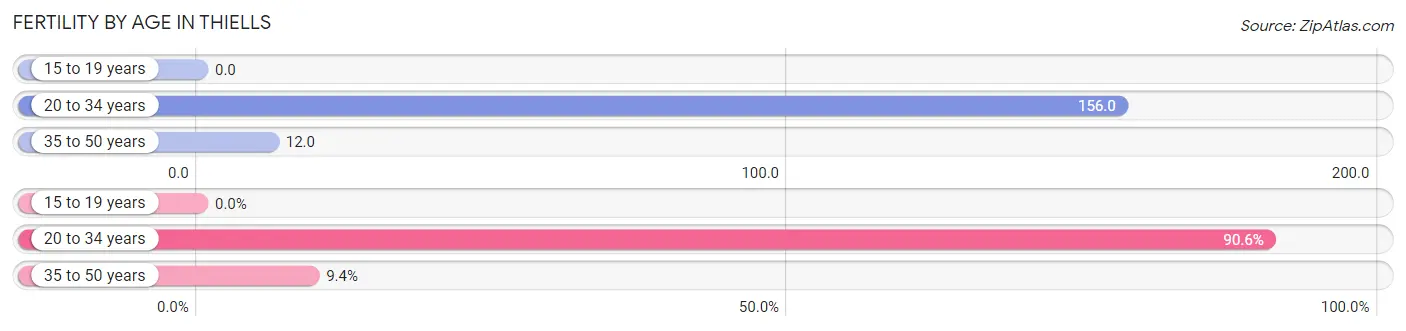
| Age Bracket | Women with Births | Births / 1,000 Women |
| 15 to 19 years | 0 (0.0%) | 0.0 |
| 20 to 34 years | 48 (90.6%) | 156.0 |
| 35 to 50 years | 5 (9.4%) | 12.0 |
| Total | 53 (100.0%) | 58.0 |
Fertility by Age by Marriage Status in Thiells
90.6% of women with births (53) in Thiells are married. The highest percentage of unmarried women with births falls into 35 to 50 years age bracket with 100.0% of them unmarried at the time of birth, while the lowest percentage of unmarried women with births belong to 20 to 34 years age bracket with 0.0% of them unmarried.
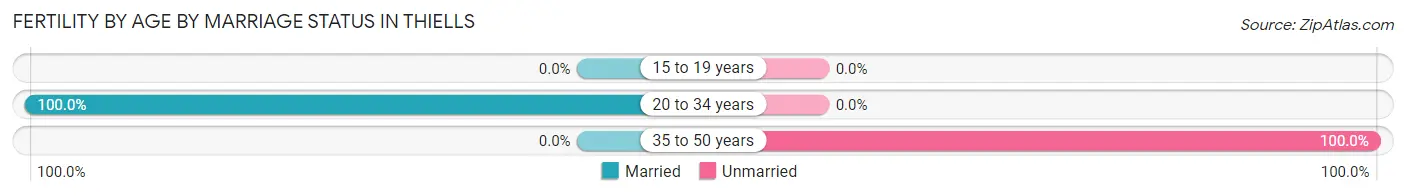
| Age Bracket | Married | Unmarried |
| 15 to 19 years | 0 (0.0%) | 0 (0.0%) |
| 20 to 34 years | 48 (100.0%) | 0 (0.0%) |
| 35 to 50 years | 0 (0.0%) | 5 (100.0%) |
| Total | 48 (90.6%) | 5 (9.4%) |
Fertility by Education in Thiells
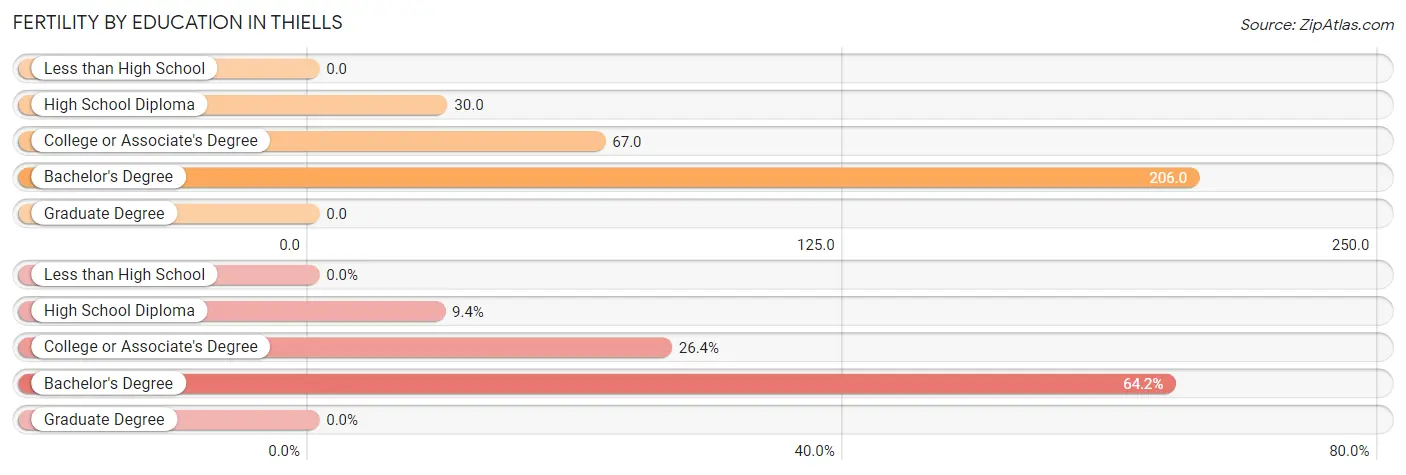
| Educational Attainment | Women with Births | Births / 1,000 Women |
| Less than High School | 0 (0.0%) | 0.0 |
| High School Diploma | 5 (9.4%) | 30.0 |
| College or Associate's Degree | 14 (26.4%) | 67.0 |
| Bachelor's Degree | 34 (64.1%) | 206.0 |
| Graduate Degree | 0 (0.0%) | 0.0 |
| Total | 53 (100.0%) | 58.0 |
Fertility by Education by Marriage Status in Thiells
9.4% of women with births in Thiells are unmarried. Women with the educational attainment of college or associate's degree are most likely to be married with 100.0% of them married at childbirth, while women with the educational attainment of high school diploma are least likely to be married with 100.0% of them unmarried at childbirth.
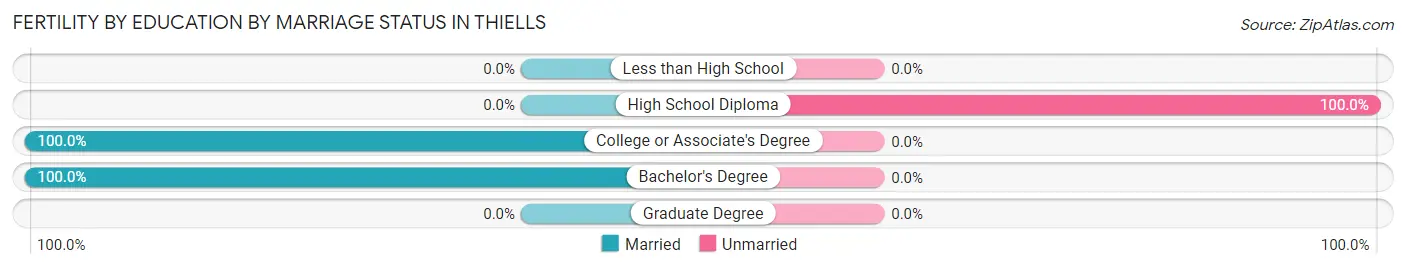
| Educational Attainment | Married | Unmarried |
| Less than High School | 0 (0.0%) | 0 (0.0%) |
| High School Diploma | 0 (0.0%) | 5 (100.0%) |
| College or Associate's Degree | 14 (100.0%) | 0 (0.0%) |
| Bachelor's Degree | 34 (100.0%) | 0 (0.0%) |
| Graduate Degree | 0 (0.0%) | 0 (0.0%) |
| Total | 48 (90.6%) | 5 (9.4%) |
Employment Characteristics in Thiells
Employment by Class of Employer in Thiells
Among the 2,380 employed individuals in Thiells, private company employees (1,356 | 57.0%), local government employees (267 | 11.2%), and not-for-profit organizations (234 | 9.8%) make up the most common classes of employment.
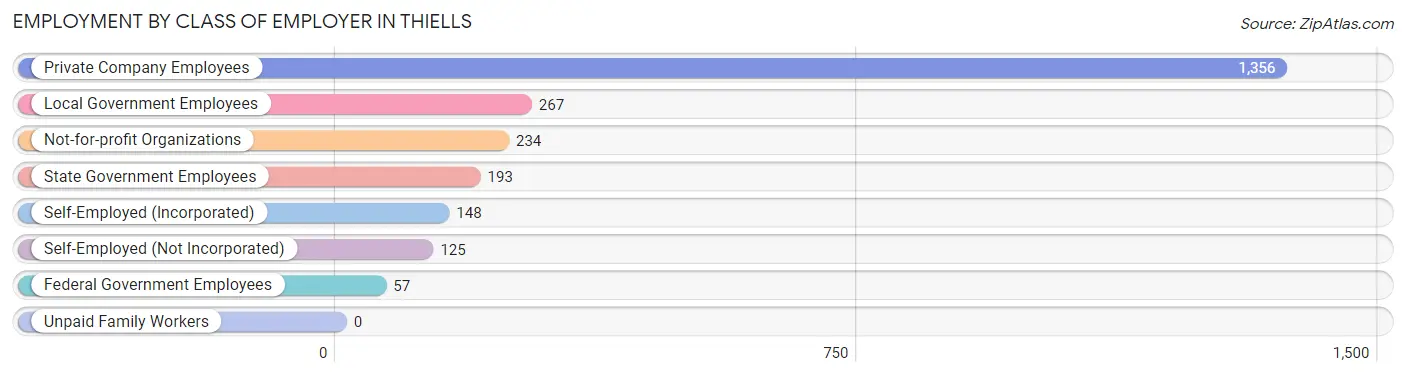
| Employer Class | # Employees | % Employees |
| Private Company Employees | 1,356 | 57.0% |
| Self-Employed (Incorporated) | 148 | 6.2% |
| Self-Employed (Not Incorporated) | 125 | 5.2% |
| Not-for-profit Organizations | 234 | 9.8% |
| Local Government Employees | 267 | 11.2% |
| State Government Employees | 193 | 8.1% |
| Federal Government Employees | 57 | 2.4% |
| Unpaid Family Workers | 0 | 0.0% |
| Total | 2,380 | 100.0% |
Employment Status by Age in Thiells
According to the labor force statistics for Thiells, out of the total population over 16 years of age (3,623), 66.8% or 2,420 individuals are in the labor force, with 1.1% or 27 of them unemployed. The age group with the highest labor force participation rate is 25 to 29 years, with 100.0% or 403 individuals in the labor force. Within the labor force, the 45 to 54 years age range has the highest percentage of unemployed individuals, with 5.6% or 26 of them being unemployed.
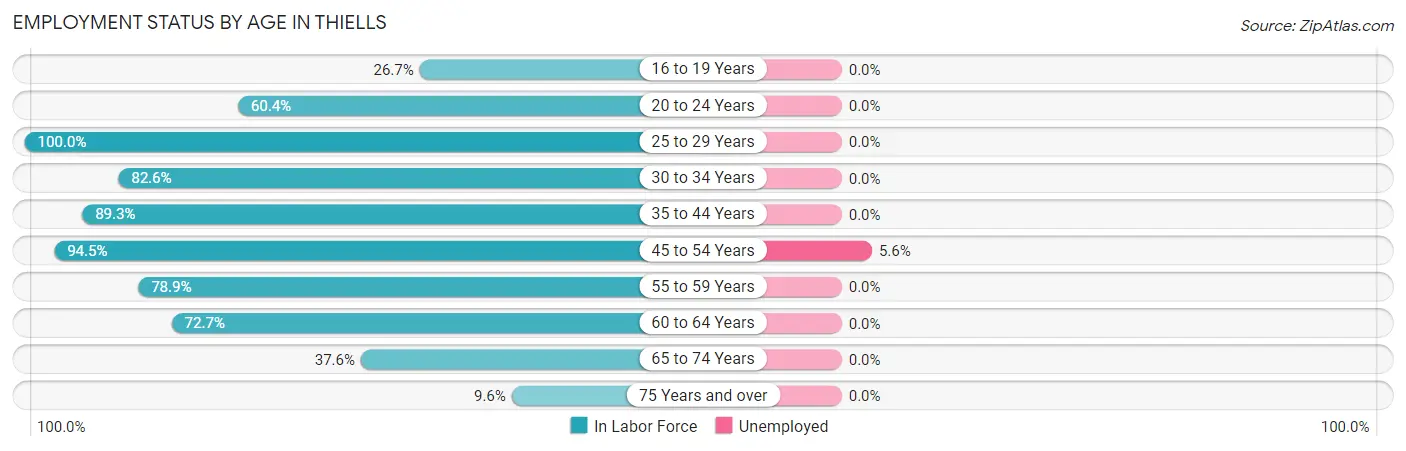
| Age Bracket | In Labor Force | Unemployed |
| 16 to 19 Years | 58 (26.7%) | 0 (0.0%) |
| 20 to 24 Years | 84 (60.4%) | 0 (0.0%) |
| 25 to 29 Years | 403 (100.0%) | 0 (0.0%) |
| 30 to 34 Years | 161 (82.6%) | 0 (0.0%) |
| 35 to 44 Years | 432 (89.3%) | 0 (0.0%) |
| 45 to 54 Years | 468 (94.5%) | 26 (5.6%) |
| 55 to 59 Years | 254 (78.9%) | 0 (0.0%) |
| 60 to 64 Years | 317 (72.7%) | 0 (0.0%) |
| 65 to 74 Years | 206 (37.6%) | 0 (0.0%) |
| 75 Years and over | 37 (9.6%) | 0 (0.0%) |
| Total | 2,420 (66.8%) | 27 (1.1%) |
Employment Status by Educational Attainment in Thiells
According to labor force statistics for Thiells, 87.2% of individuals (2,036) out of the total population between 25 and 64 years of age (2,335) are in the labor force, with 1.3% or 26 of them being unemployed. The group with the highest labor force participation rate are those with the educational attainment of less than high school, with 95.6% or 65 individuals in the labor force. Within the labor force, individuals with bachelor's degree or higher education have the highest percentage of unemployment, with 2.3% or 26 of them being unemployed.
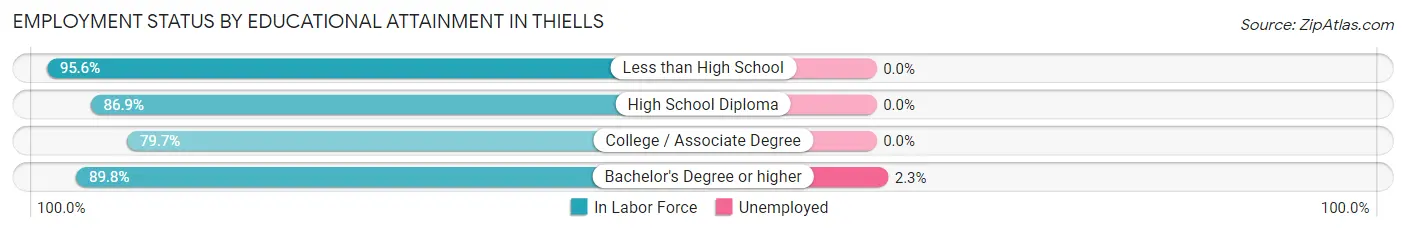
| Educational Attainment | In Labor Force | Unemployed |
| Less than High School | 65 (95.6%) | 0 (0.0%) |
| High School Diploma | 424 (86.9%) | 0 (0.0%) |
| College / Associate Degree | 404 (79.7%) | 0 (0.0%) |
| Bachelor's Degree or higher | 1,142 (89.8%) | 29 (2.3%) |
| Total | 2,036 (87.2%) | 30 (1.3%) |
Employment Occupations by Sex in Thiells
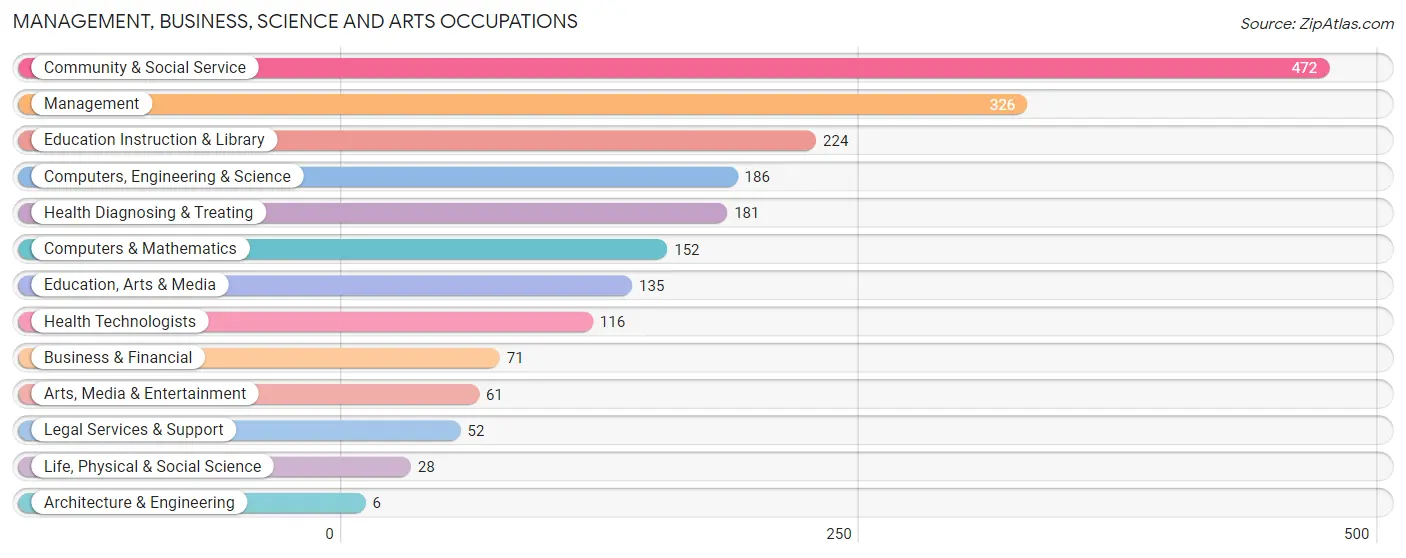
Management, Business, Science and Arts Occupations
The most common Management, Business, Science and Arts occupations in Thiells are Community & Social Service (472 | 19.7%), Management (326 | 13.6%), Education Instruction & Library (224 | 9.4%), Computers, Engineering & Science (186 | 7.8%), and Health Diagnosing & Treating (181 | 7.6%).
Management, Business, Science and Arts Occupations by Sex
Within the Management, Business, Science and Arts occupations in Thiells, the most male-oriented occupations are Architecture & Engineering (100.0%), Life, Physical & Social Science (100.0%), and Arts, Media & Entertainment (90.2%), while the most female-oriented occupations are Education, Arts & Media (100.0%), Legal Services & Support (69.2%), and Community & Social Service (63.3%).
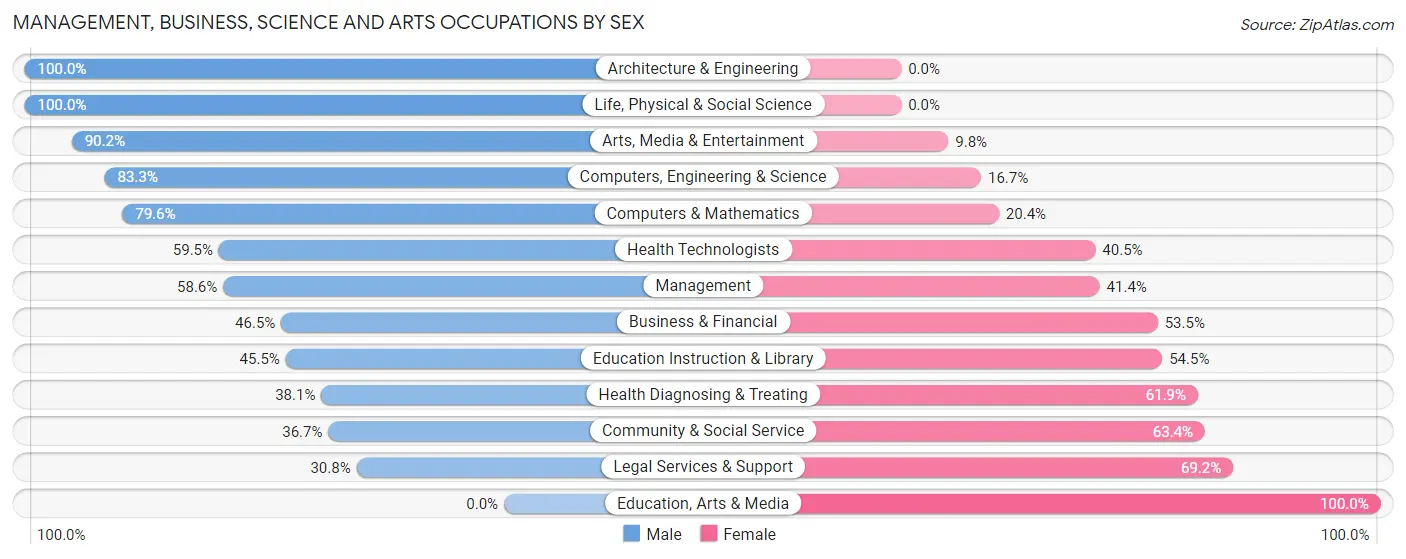
| Occupation | Male | Female |
| Management | 191 (58.6%) | 135 (41.4%) |
| Business & Financial | 33 (46.5%) | 38 (53.5%) |
| Computers, Engineering & Science | 155 (83.3%) | 31 (16.7%) |
| Computers & Mathematics | 121 (79.6%) | 31 (20.4%) |
| Architecture & Engineering | 6 (100.0%) | 0 (0.0%) |
| Life, Physical & Social Science | 28 (100.0%) | 0 (0.0%) |
| Community & Social Service | 173 (36.6%) | 299 (63.3%) |
| Education, Arts & Media | 0 (0.0%) | 135 (100.0%) |
| Legal Services & Support | 16 (30.8%) | 36 (69.2%) |
| Education Instruction & Library | 102 (45.5%) | 122 (54.5%) |
| Arts, Media & Entertainment | 55 (90.2%) | 6 (9.8%) |
| Health Diagnosing & Treating | 69 (38.1%) | 112 (61.9%) |
| Health Technologists | 69 (59.5%) | 47 (40.5%) |
| Total (Category) | 621 (50.2%) | 615 (49.8%) |
| Total (Overall) | 1,244 (52.0%) | 1,150 (48.0%) |
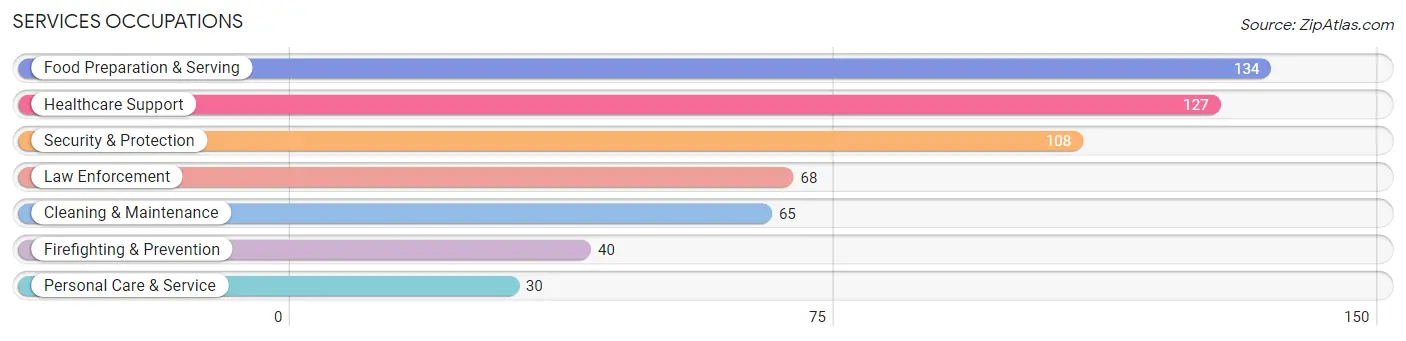
Services Occupations
The most common Services occupations in Thiells are Food Preparation & Serving (134 | 5.6%), Healthcare Support (127 | 5.3%), Security & Protection (108 | 4.5%), Law Enforcement (68 | 2.8%), and Cleaning & Maintenance (65 | 2.7%).
Services Occupations by Sex
Within the Services occupations in Thiells, the most male-oriented occupations are Security & Protection (100.0%), Firefighting & Prevention (100.0%), and Law Enforcement (100.0%), while the most female-oriented occupations are Healthcare Support (100.0%), Cleaning & Maintenance (72.3%), and Personal Care & Service (46.7%).
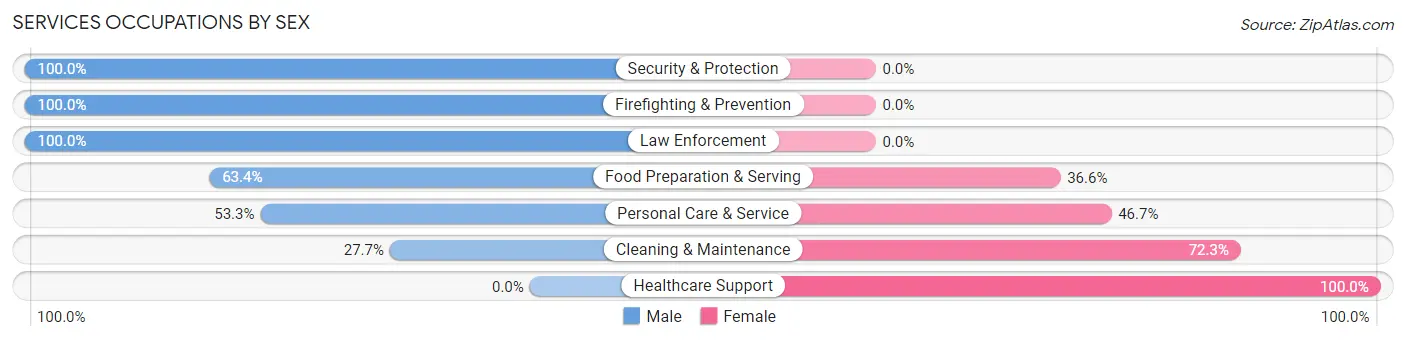
| Occupation | Male | Female |
| Healthcare Support | 0 (0.0%) | 127 (100.0%) |
| Security & Protection | 108 (100.0%) | 0 (0.0%) |
| Firefighting & Prevention | 40 (100.0%) | 0 (0.0%) |
| Law Enforcement | 68 (100.0%) | 0 (0.0%) |
| Food Preparation & Serving | 85 (63.4%) | 49 (36.6%) |
| Cleaning & Maintenance | 18 (27.7%) | 47 (72.3%) |
| Personal Care & Service | 16 (53.3%) | 14 (46.7%) |
| Total (Category) | 227 (48.9%) | 237 (51.1%) |
| Total (Overall) | 1,244 (52.0%) | 1,150 (48.0%) |
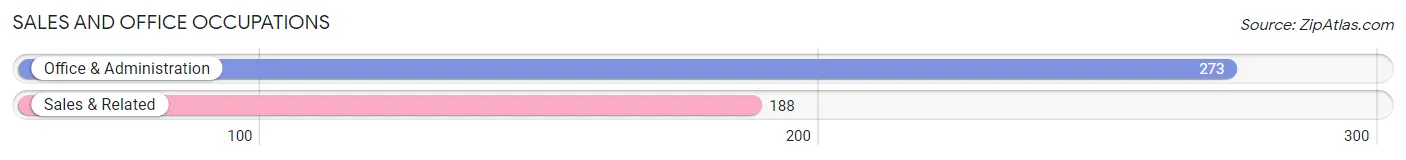
Sales and Office Occupations
The most common Sales and Office occupations in Thiells are Office & Administration (273 | 11.4%), and Sales & Related (188 | 7.9%).
Sales and Office Occupations by Sex
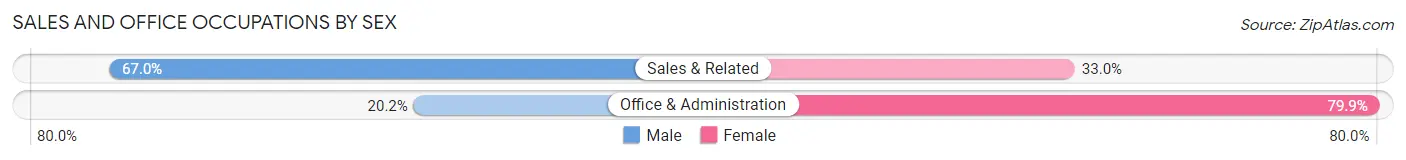
| Occupation | Male | Female |
| Sales & Related | 126 (67.0%) | 62 (33.0%) |
| Office & Administration | 55 (20.2%) | 218 (79.8%) |
| Total (Category) | 181 (39.3%) | 280 (60.7%) |
| Total (Overall) | 1,244 (52.0%) | 1,150 (48.0%) |
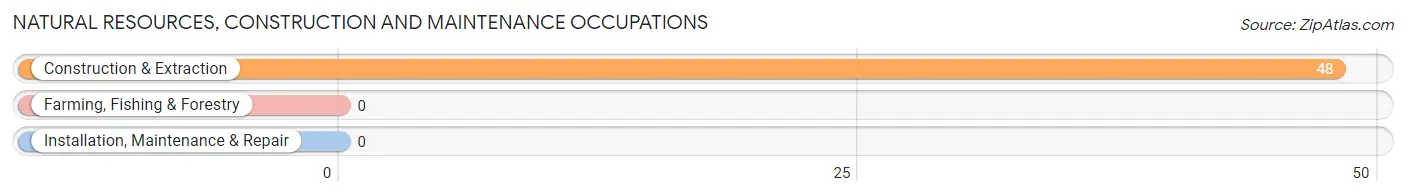
Natural Resources, Construction and Maintenance Occupations
The most common Natural Resources, Construction and Maintenance occupations in Thiells are , and Construction & Extraction (48 | 2.0%).
Natural Resources, Construction and Maintenance Occupations by Sex
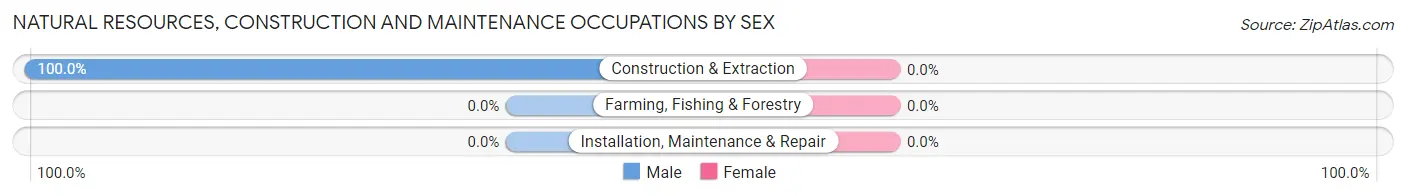
| Occupation | Male | Female |
| Farming, Fishing & Forestry | 0 (0.0%) | 0 (0.0%) |
| Construction & Extraction | 48 (100.0%) | 0 (0.0%) |
| Installation, Maintenance & Repair | 0 (0.0%) | 0 (0.0%) |
| Total (Category) | 48 (100.0%) | 0 (0.0%) |
| Total (Overall) | 1,244 (52.0%) | 1,150 (48.0%) |
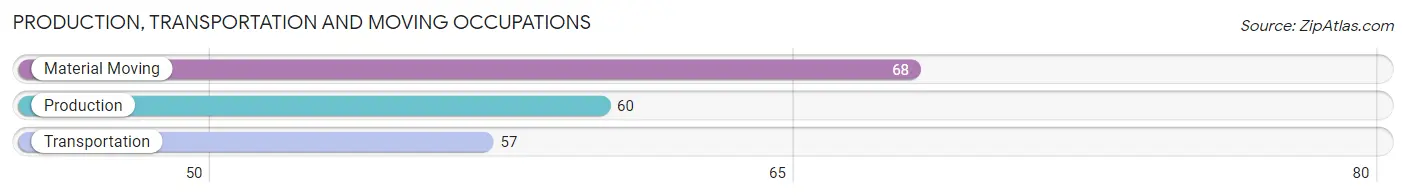
Production, Transportation and Moving Occupations
The most common Production, Transportation and Moving occupations in Thiells are Material Moving (68 | 2.8%), Production (60 | 2.5%), and Transportation (57 | 2.4%).
Production, Transportation and Moving Occupations by Sex
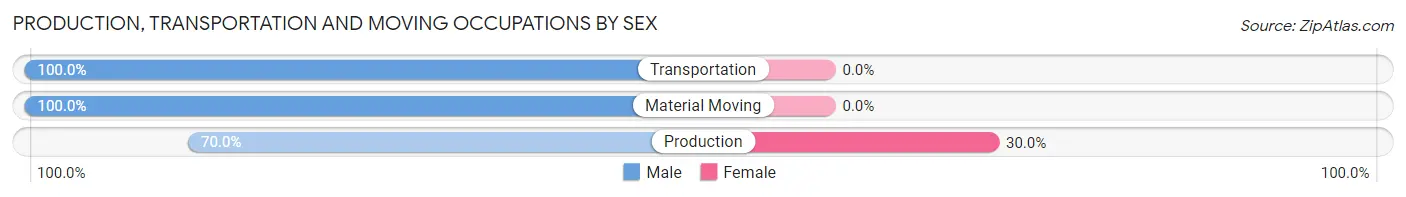
| Occupation | Male | Female |
| Production | 42 (70.0%) | 18 (30.0%) |
| Transportation | 57 (100.0%) | 0 (0.0%) |
| Material Moving | 68 (100.0%) | 0 (0.0%) |
| Total (Category) | 167 (90.3%) | 18 (9.7%) |
| Total (Overall) | 1,244 (52.0%) | 1,150 (48.0%) |
Employment Industries by Sex in Thiells
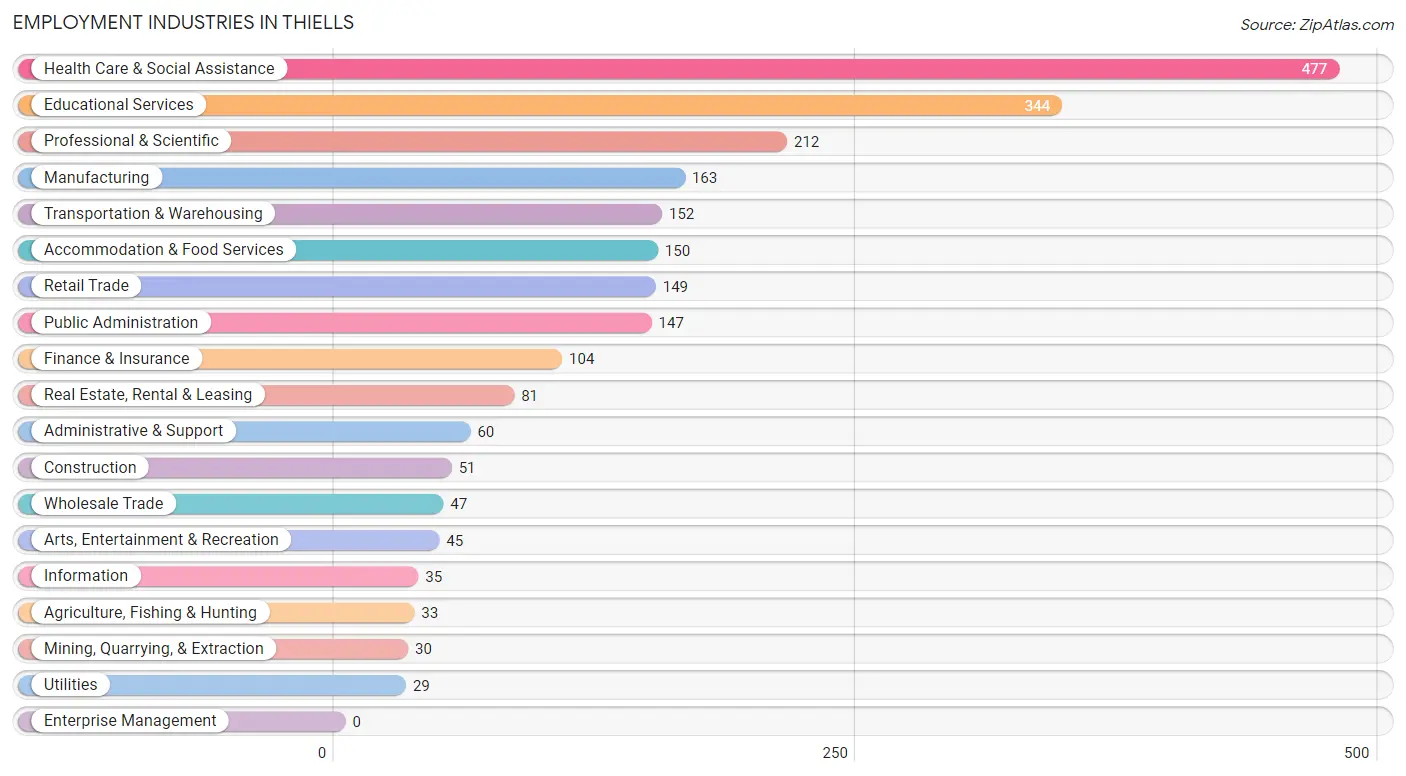
Employment Industries in Thiells
The major employment industries in Thiells include Health Care & Social Assistance (477 | 19.9%), Educational Services (344 | 14.4%), Professional & Scientific (212 | 8.9%), Manufacturing (163 | 6.8%), and Transportation & Warehousing (152 | 6.4%).
Employment Industries by Sex in Thiells
The Thiells industries that see more men than women are Mining, Quarrying, & Extraction (100.0%), Construction (100.0%), and Wholesale Trade (100.0%), whereas the industries that tend to have a higher number of women are Agriculture, Fishing & Hunting (100.0%), Finance & Insurance (100.0%), and Administrative & Support (78.3%).
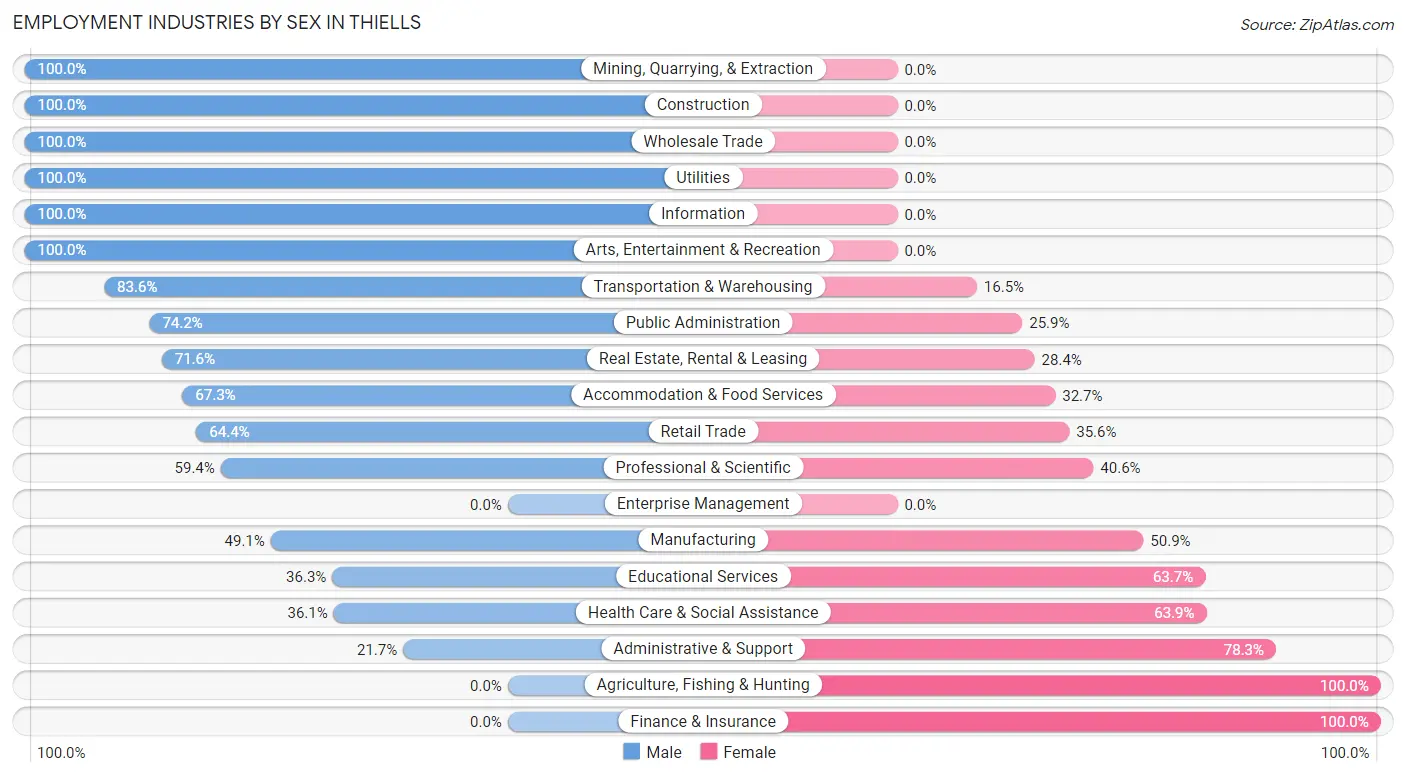
| Industry | Male | Female |
| Agriculture, Fishing & Hunting | 0 (0.0%) | 33 (100.0%) |
| Mining, Quarrying, & Extraction | 30 (100.0%) | 0 (0.0%) |
| Construction | 51 (100.0%) | 0 (0.0%) |
| Manufacturing | 80 (49.1%) | 83 (50.9%) |
| Wholesale Trade | 47 (100.0%) | 0 (0.0%) |
| Retail Trade | 96 (64.4%) | 53 (35.6%) |
| Transportation & Warehousing | 127 (83.6%) | 25 (16.5%) |
| Utilities | 29 (100.0%) | 0 (0.0%) |
| Information | 35 (100.0%) | 0 (0.0%) |
| Finance & Insurance | 0 (0.0%) | 104 (100.0%) |
| Real Estate, Rental & Leasing | 58 (71.6%) | 23 (28.4%) |
| Professional & Scientific | 126 (59.4%) | 86 (40.6%) |
| Enterprise Management | 0 (0.0%) | 0 (0.0%) |
| Administrative & Support | 13 (21.7%) | 47 (78.3%) |
| Educational Services | 125 (36.3%) | 219 (63.7%) |
| Health Care & Social Assistance | 172 (36.1%) | 305 (63.9%) |
| Arts, Entertainment & Recreation | 45 (100.0%) | 0 (0.0%) |
| Accommodation & Food Services | 101 (67.3%) | 49 (32.7%) |
| Public Administration | 109 (74.2%) | 38 (25.9%) |
| Total | 1,244 (52.0%) | 1,150 (48.0%) |
Education in Thiells
School Enrollment in Thiells
The most common levels of schooling among the 919 students in Thiells are elementary school (225 | 24.5%), middle school (177 | 19.3%), and high school (162 | 17.6%).
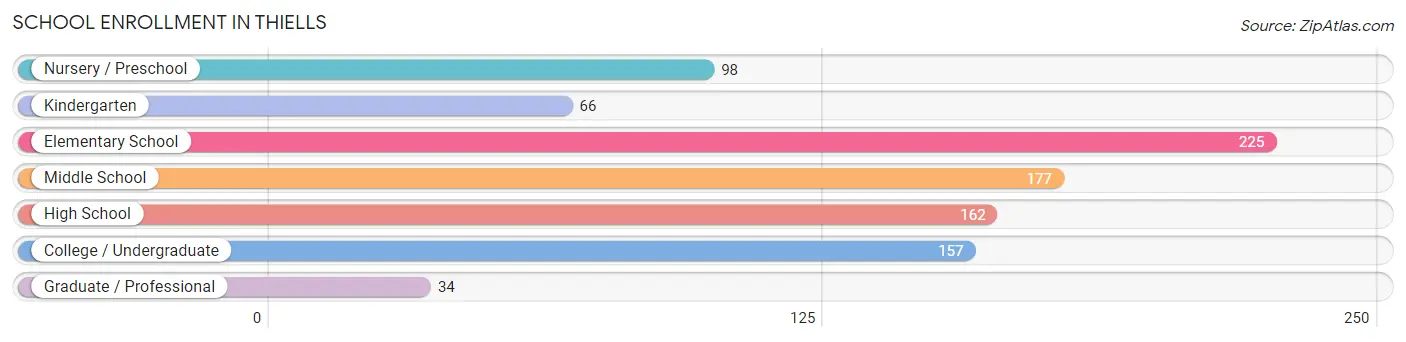
| School Level | # Students | % Students |
| Nursery / Preschool | 98 | 10.7% |
| Kindergarten | 66 | 7.2% |
| Elementary School | 225 | 24.5% |
| Middle School | 177 | 19.3% |
| High School | 162 | 17.6% |
| College / Undergraduate | 157 | 17.1% |
| Graduate / Professional | 34 | 3.7% |
| Total | 919 | 100.0% |
School Enrollment by Age by Funding Source in Thiells
Out of a total of 919 students who are enrolled in schools in Thiells, 163 (17.7%) attend a private institution, while the remaining 756 (82.3%) are enrolled in public schools. The age group of 20 to 24 year olds has the highest likelihood of being enrolled in private schools, with 9 (100.0% in the age bracket) enrolled. Conversely, the age group of 10 to 14 year olds has the lowest likelihood of being enrolled in a private school, with 216 (100.0% in the age bracket) attending a public institution.
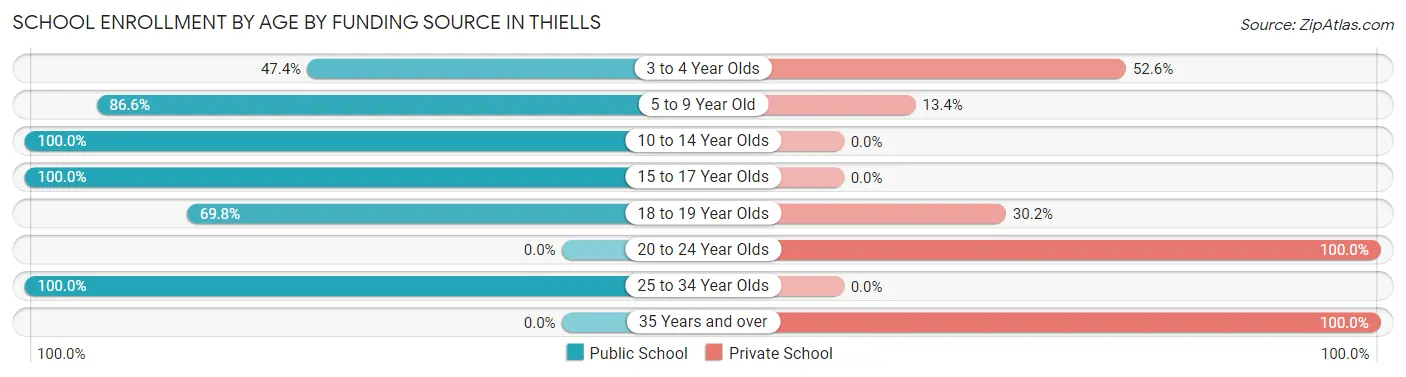
| Age Bracket | Public School | Private School |
| 3 to 4 Year Olds | 64 (47.4%) | 71 (52.6%) |
| 5 to 9 Year Old | 213 (86.6%) | 33 (13.4%) |
| 10 to 14 Year Olds | 216 (100.0%) | 0 (0.0%) |
| 15 to 17 Year Olds | 131 (100.0%) | 0 (0.0%) |
| 18 to 19 Year Olds | 97 (69.8%) | 42 (30.2%) |
| 20 to 24 Year Olds | 0 (0.0%) | 9 (100.0%) |
| 25 to 34 Year Olds | 35 (100.0%) | 0 (0.0%) |
| 35 Years and over | 0 (0.0%) | 8 (100.0%) |
| Total | 756 (82.3%) | 163 (17.7%) |
Educational Attainment by Field of Study in Thiells
Computers & mathematics (278 | 16.1%), business (261 | 15.1%), education (170 | 9.8%), science & technology (159 | 9.2%), and psychology (151 | 8.7%) are the most common fields of study among 1,727 individuals in Thiells who have obtained a bachelor's degree or higher.
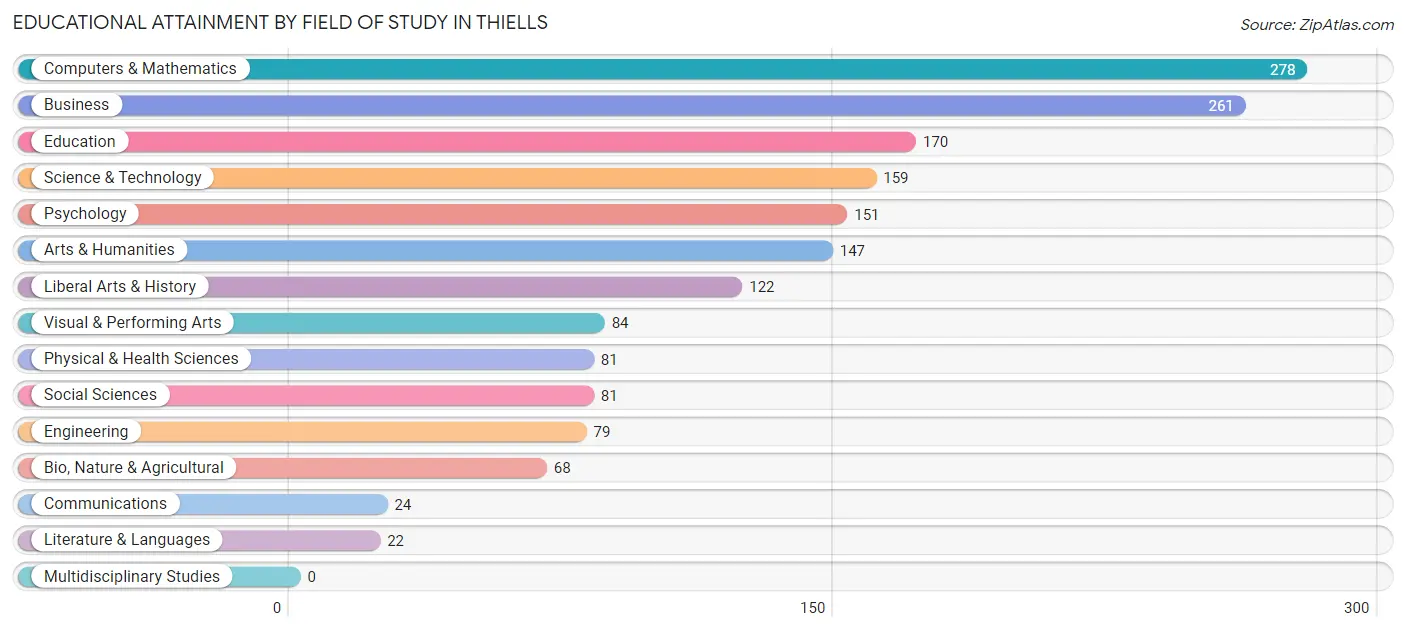
| Field of Study | # Graduates | % Graduates |
| Computers & Mathematics | 278 | 16.1% |
| Bio, Nature & Agricultural | 68 | 3.9% |
| Physical & Health Sciences | 81 | 4.7% |
| Psychology | 151 | 8.7% |
| Social Sciences | 81 | 4.7% |
| Engineering | 79 | 4.6% |
| Multidisciplinary Studies | 0 | 0.0% |
| Science & Technology | 159 | 9.2% |
| Business | 261 | 15.1% |
| Education | 170 | 9.8% |
| Literature & Languages | 22 | 1.3% |
| Liberal Arts & History | 122 | 7.1% |
| Visual & Performing Arts | 84 | 4.9% |
| Communications | 24 | 1.4% |
| Arts & Humanities | 147 | 8.5% |
| Total | 1,727 | 100.0% |
Transportation & Commute in Thiells
Vehicle Availability by Sex in Thiells
The most prevalent vehicle ownership categories in Thiells are males with 2 vehicles (587, accounting for 47.2%) and females with 2 vehicles (669, making up 51.9%).
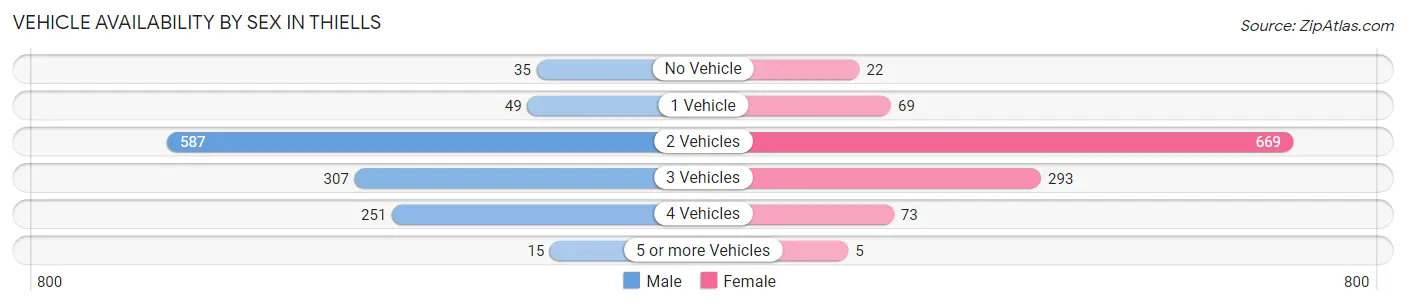
| Vehicles Available | Male | Female |
| No Vehicle | 35 (2.8%) | 22 (1.9%) |
| 1 Vehicle | 49 (3.9%) | 69 (6.1%) |
| 2 Vehicles | 587 (47.2%) | 669 (59.2%) |
| 3 Vehicles | 307 (24.7%) | 293 (25.9%) |
| 4 Vehicles | 251 (20.2%) | 73 (6.5%) |
| 5 or more Vehicles | 15 (1.2%) | 5 (0.4%) |
| Total | 1,244 (100.0%) | 1,131 (100.0%) |
Commute Time in Thiells
The most frequently occuring commute durations in Thiells are 20 to 24 minutes (374 commuters, 16.4%), 10 to 14 minutes (328 commuters, 14.4%), and 60 to 89 minutes (314 commuters, 13.8%).
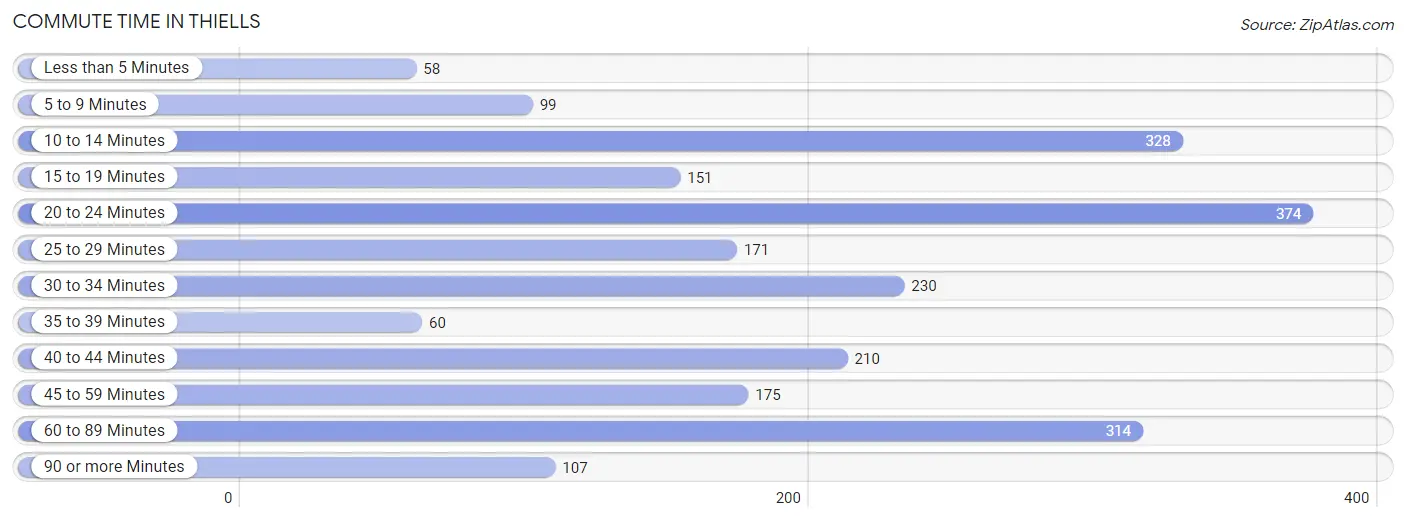
| Commute Time | # Commuters | % Commuters |
| Less than 5 Minutes | 58 | 2.5% |
| 5 to 9 Minutes | 99 | 4.3% |
| 10 to 14 Minutes | 328 | 14.4% |
| 15 to 19 Minutes | 151 | 6.6% |
| 20 to 24 Minutes | 374 | 16.4% |
| 25 to 29 Minutes | 171 | 7.5% |
| 30 to 34 Minutes | 230 | 10.1% |
| 35 to 39 Minutes | 60 | 2.6% |
| 40 to 44 Minutes | 210 | 9.2% |
| 45 to 59 Minutes | 175 | 7.7% |
| 60 to 89 Minutes | 314 | 13.8% |
| 90 or more Minutes | 107 | 4.7% |
Commute Time by Sex in Thiells
The most common commute times in Thiells are 60 to 89 minutes (270 commuters, 23.2%) for males and 20 to 24 minutes (233 commuters, 20.9%) for females.
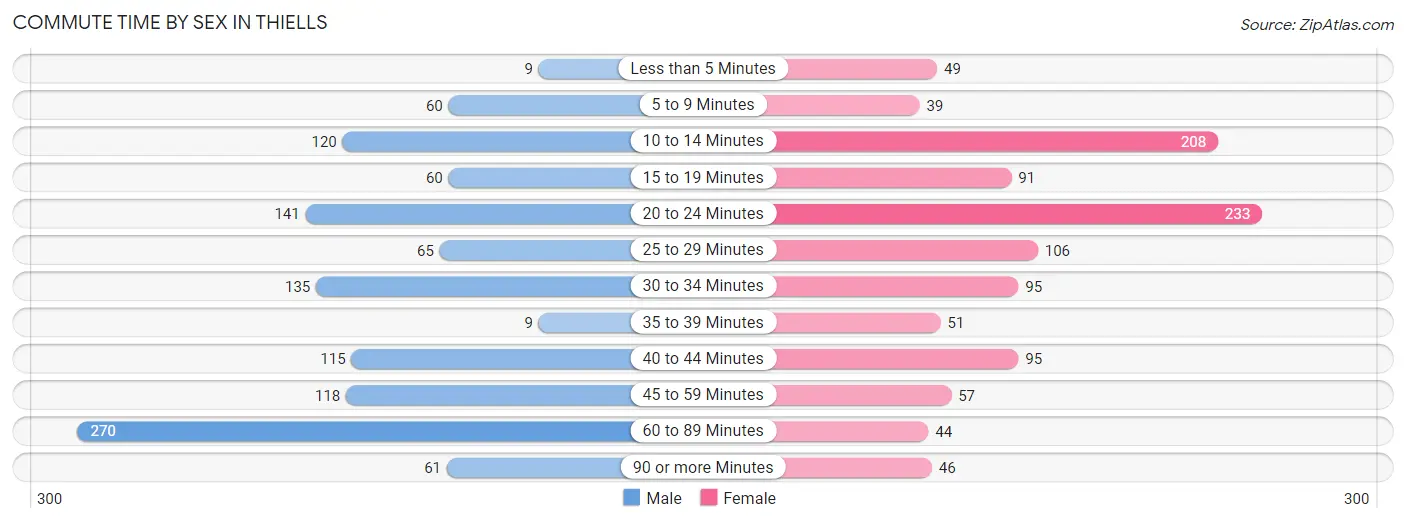
| Commute Time | Male | Female |
| Less than 5 Minutes | 9 (0.8%) | 49 (4.4%) |
| 5 to 9 Minutes | 60 (5.2%) | 39 (3.5%) |
| 10 to 14 Minutes | 120 (10.3%) | 208 (18.7%) |
| 15 to 19 Minutes | 60 (5.2%) | 91 (8.2%) |
| 20 to 24 Minutes | 141 (12.1%) | 233 (20.9%) |
| 25 to 29 Minutes | 65 (5.6%) | 106 (9.5%) |
| 30 to 34 Minutes | 135 (11.6%) | 95 (8.5%) |
| 35 to 39 Minutes | 9 (0.8%) | 51 (4.6%) |
| 40 to 44 Minutes | 115 (9.9%) | 95 (8.5%) |
| 45 to 59 Minutes | 118 (10.2%) | 57 (5.1%) |
| 60 to 89 Minutes | 270 (23.2%) | 44 (4.0%) |
| 90 or more Minutes | 61 (5.2%) | 46 (4.1%) |
Time of Departure to Work by Sex in Thiells
The most frequent times of departure to work in Thiells are 7:00 AM to 7:29 AM (227, 19.5%) for males and 7:30 AM to 7:59 AM (274, 24.6%) for females.
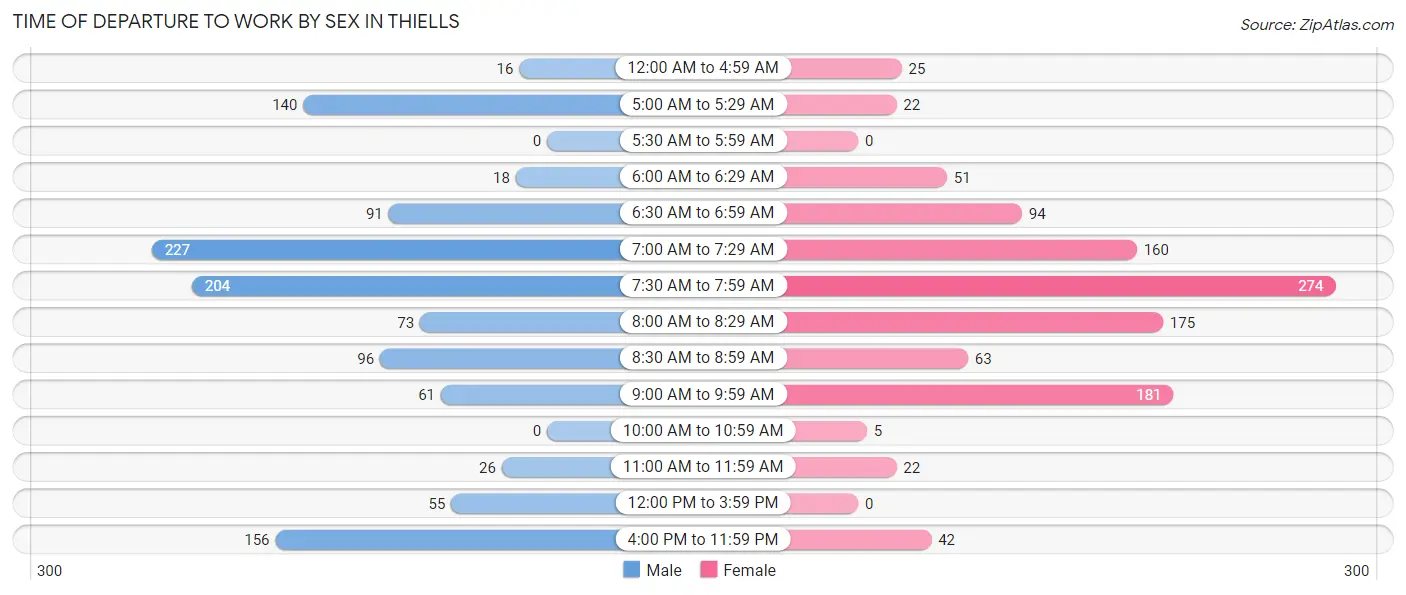
| Time of Departure | Male | Female |
| 12:00 AM to 4:59 AM | 16 (1.4%) | 25 (2.2%) |
| 5:00 AM to 5:29 AM | 140 (12.0%) | 22 (2.0%) |
| 5:30 AM to 5:59 AM | 0 (0.0%) | 0 (0.0%) |
| 6:00 AM to 6:29 AM | 18 (1.5%) | 51 (4.6%) |
| 6:30 AM to 6:59 AM | 91 (7.8%) | 94 (8.4%) |
| 7:00 AM to 7:29 AM | 227 (19.5%) | 160 (14.4%) |
| 7:30 AM to 7:59 AM | 204 (17.5%) | 274 (24.6%) |
| 8:00 AM to 8:29 AM | 73 (6.3%) | 175 (15.7%) |
| 8:30 AM to 8:59 AM | 96 (8.3%) | 63 (5.7%) |
| 9:00 AM to 9:59 AM | 61 (5.2%) | 181 (16.3%) |
| 10:00 AM to 10:59 AM | 0 (0.0%) | 5 (0.4%) |
| 11:00 AM to 11:59 AM | 26 (2.2%) | 22 (2.0%) |
| 12:00 PM to 3:59 PM | 55 (4.7%) | 0 (0.0%) |
| 4:00 PM to 11:59 PM | 156 (13.4%) | 42 (3.8%) |
| Total | 1,163 (100.0%) | 1,114 (100.0%) |
Housing Occupancy in Thiells
Occupancy by Ownership in Thiells
Of the total 1,590 dwellings in Thiells, owner-occupied units account for 1,485 (93.4%), while renter-occupied units make up 105 (6.6%).
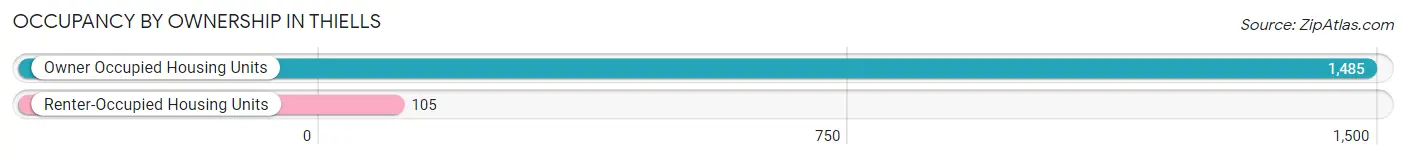
| Occupancy | # Housing Units | % Housing Units |
| Owner Occupied Housing Units | 1,485 | 93.4% |
| Renter-Occupied Housing Units | 105 | 6.6% |
| Total Occupied Housing Units | 1,590 | 100.0% |
Occupancy by Household Size in Thiells
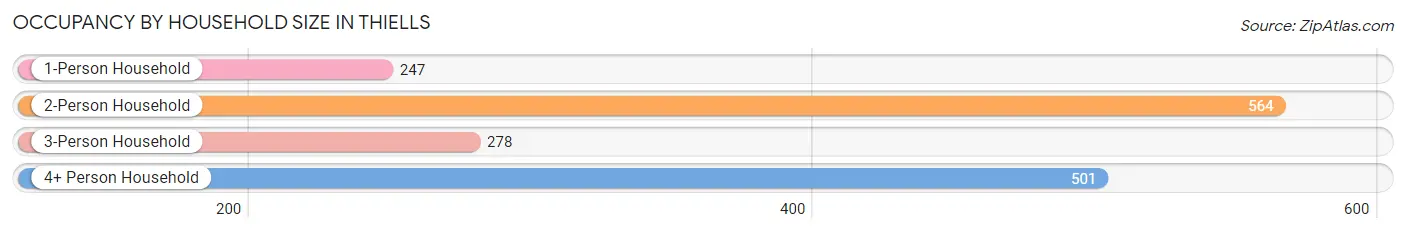
| Household Size | # Housing Units | % Housing Units |
| 1-Person Household | 247 | 15.5% |
| 2-Person Household | 564 | 35.5% |
| 3-Person Household | 278 | 17.5% |
| 4+ Person Household | 501 | 31.5% |
| Total Housing Units | 1,590 | 100.0% |
Occupancy by Ownership by Household Size in Thiells
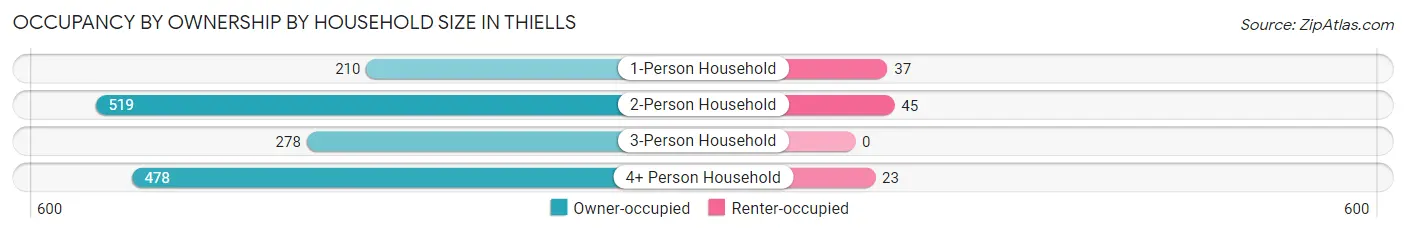
| Household Size | Owner-occupied | Renter-occupied |
| 1-Person Household | 210 (85.0%) | 37 (15.0%) |
| 2-Person Household | 519 (92.0%) | 45 (8.0%) |
| 3-Person Household | 278 (100.0%) | 0 (0.0%) |
| 4+ Person Household | 478 (95.4%) | 23 (4.6%) |
| Total Housing Units | 1,485 (93.4%) | 105 (6.6%) |
Occupancy by Educational Attainment in Thiells
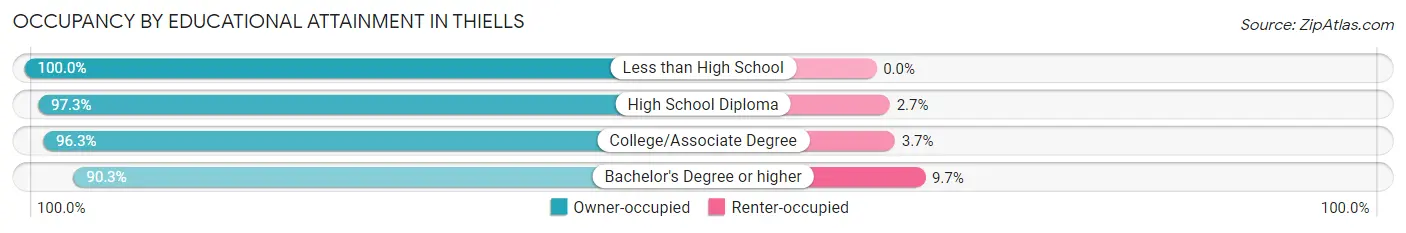
| Household Size | Owner-occupied | Renter-occupied |
| Less than High School | 78 (100.0%) | 0 (0.0%) |
| High School Diploma | 327 (97.3%) | 9 (2.7%) |
| College/Associate Degree | 287 (96.3%) | 11 (3.7%) |
| Bachelor's Degree or higher | 793 (90.3%) | 85 (9.7%) |
Occupancy by Age of Householder in Thiells
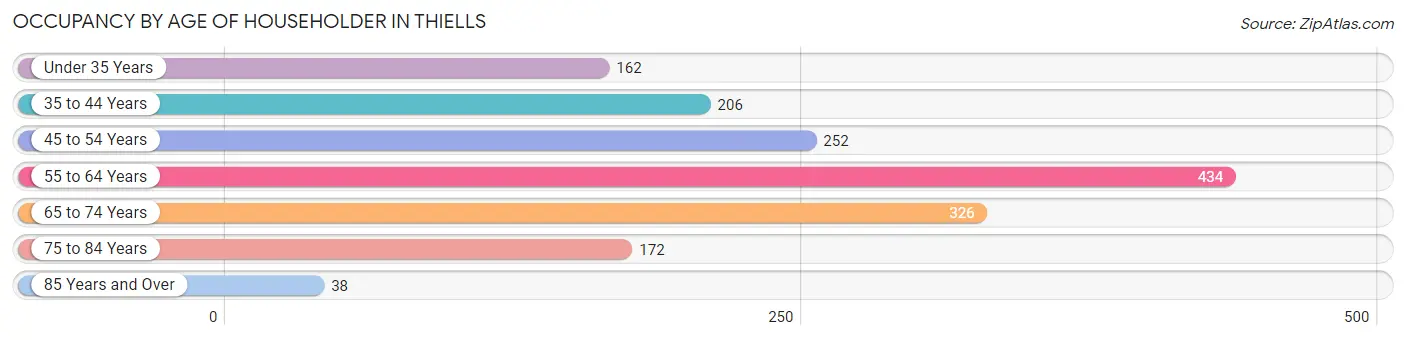
| Age Bracket | # Households | % Households |
| Under 35 Years | 162 | 10.2% |
| 35 to 44 Years | 206 | 13.0% |
| 45 to 54 Years | 252 | 15.9% |
| 55 to 64 Years | 434 | 27.3% |
| 65 to 74 Years | 326 | 20.5% |
| 75 to 84 Years | 172 | 10.8% |
| 85 Years and Over | 38 | 2.4% |
| Total | 1,590 | 100.0% |
Housing Finances in Thiells
Median Income by Occupancy in Thiells
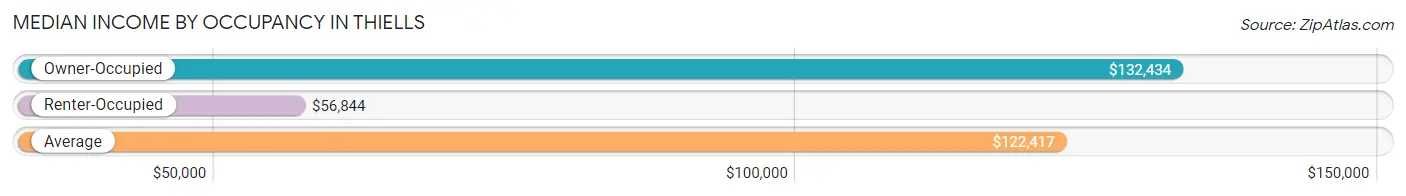
| Occupancy Type | # Households | Median Income |
| Owner-Occupied | 1,485 (93.4%) | $132,434 |
| Renter-Occupied | 105 (6.6%) | $56,844 |
| Average | 1,590 (100.0%) | $122,417 |
Occupancy by Householder Income Bracket in Thiells
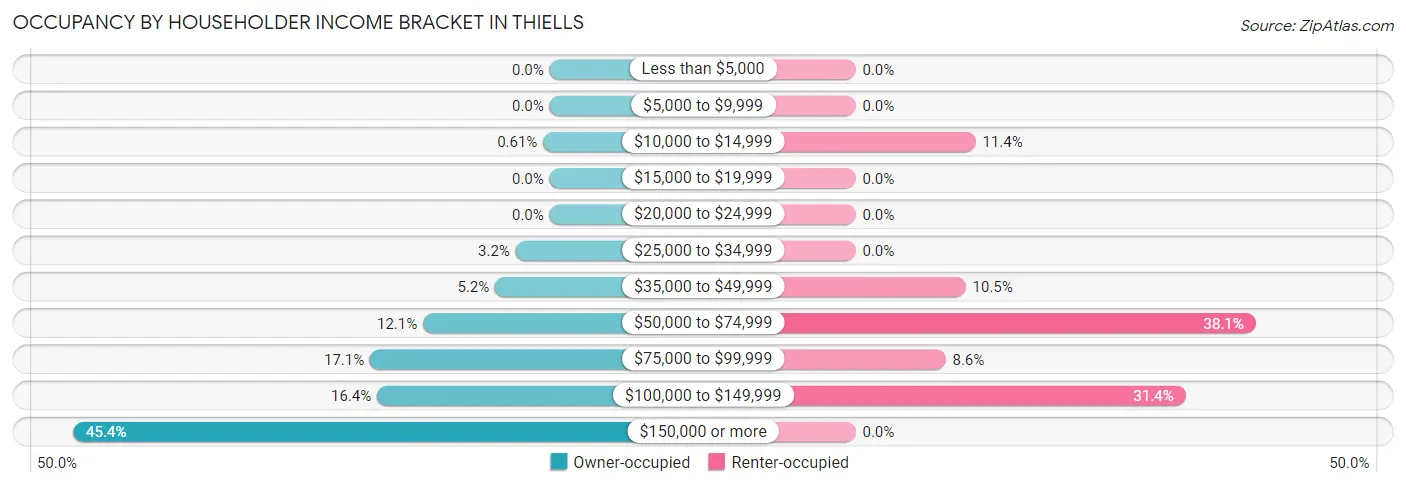
| Income Bracket | Owner-occupied | Renter-occupied |
| Less than $5,000 | 0 (0.0%) | 0 (0.0%) |
| $5,000 to $9,999 | 0 (0.0%) | 0 (0.0%) |
| $10,000 to $14,999 | 9 (0.6%) | 12 (11.4%) |
| $15,000 to $19,999 | 0 (0.0%) | 0 (0.0%) |
| $20,000 to $24,999 | 0 (0.0%) | 0 (0.0%) |
| $25,000 to $34,999 | 48 (3.2%) | 0 (0.0%) |
| $35,000 to $49,999 | 77 (5.2%) | 11 (10.5%) |
| $50,000 to $74,999 | 179 (12.0%) | 40 (38.1%) |
| $75,000 to $99,999 | 254 (17.1%) | 9 (8.6%) |
| $100,000 to $149,999 | 244 (16.4%) | 33 (31.4%) |
| $150,000 or more | 674 (45.4%) | 0 (0.0%) |
| Total | 1,485 (100.0%) | 105 (100.0%) |
Monthly Housing Cost Tiers in Thiells
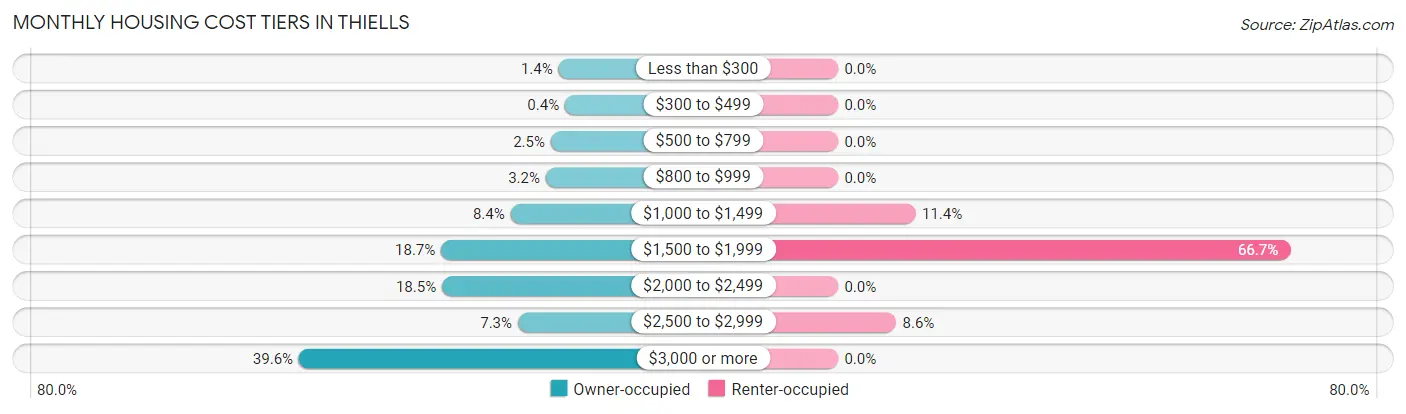
| Monthly Cost | Owner-occupied | Renter-occupied |
| Less than $300 | 20 (1.3%) | 0 (0.0%) |
| $300 to $499 | 6 (0.4%) | 0 (0.0%) |
| $500 to $799 | 37 (2.5%) | 0 (0.0%) |
| $800 to $999 | 48 (3.2%) | 0 (0.0%) |
| $1,000 to $1,499 | 125 (8.4%) | 12 (11.4%) |
| $1,500 to $1,999 | 277 (18.6%) | 70 (66.7%) |
| $2,000 to $2,499 | 275 (18.5%) | 0 (0.0%) |
| $2,500 to $2,999 | 109 (7.3%) | 9 (8.6%) |
| $3,000 or more | 588 (39.6%) | 0 (0.0%) |
| Total | 1,485 (100.0%) | 105 (100.0%) |
Physical Housing Characteristics in Thiells
Housing Structures in Thiells
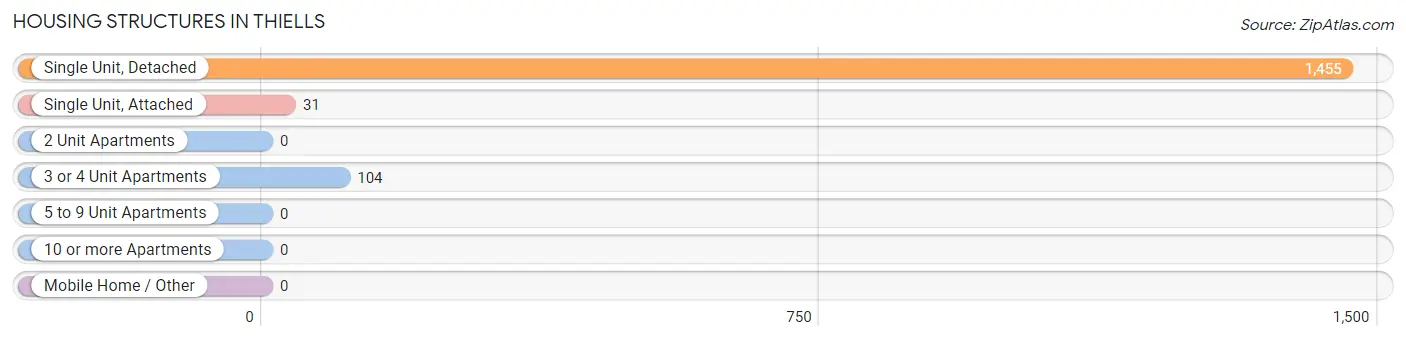
| Structure Type | # Housing Units | % Housing Units |
| Single Unit, Detached | 1,455 | 91.5% |
| Single Unit, Attached | 31 | 1.9% |
| 2 Unit Apartments | 0 | 0.0% |
| 3 or 4 Unit Apartments | 104 | 6.5% |
| 5 to 9 Unit Apartments | 0 | 0.0% |
| 10 or more Apartments | 0 | 0.0% |
| Mobile Home / Other | 0 | 0.0% |
| Total | 1,590 | 100.0% |
Housing Structures by Occupancy in Thiells
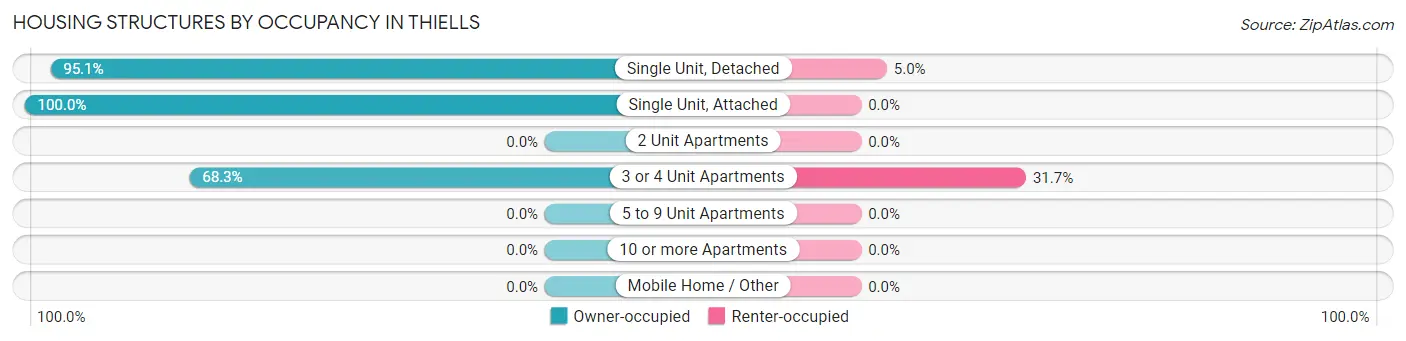
| Structure Type | Owner-occupied | Renter-occupied |
| Single Unit, Detached | 1,383 (95.1%) | 72 (5.0%) |
| Single Unit, Attached | 31 (100.0%) | 0 (0.0%) |
| 2 Unit Apartments | 0 (0.0%) | 0 (0.0%) |
| 3 or 4 Unit Apartments | 71 (68.3%) | 33 (31.7%) |
| 5 to 9 Unit Apartments | 0 (0.0%) | 0 (0.0%) |
| 10 or more Apartments | 0 (0.0%) | 0 (0.0%) |
| Mobile Home / Other | 0 (0.0%) | 0 (0.0%) |
| Total | 1,485 (93.4%) | 105 (6.6%) |
Housing Structures by Number of Rooms in Thiells
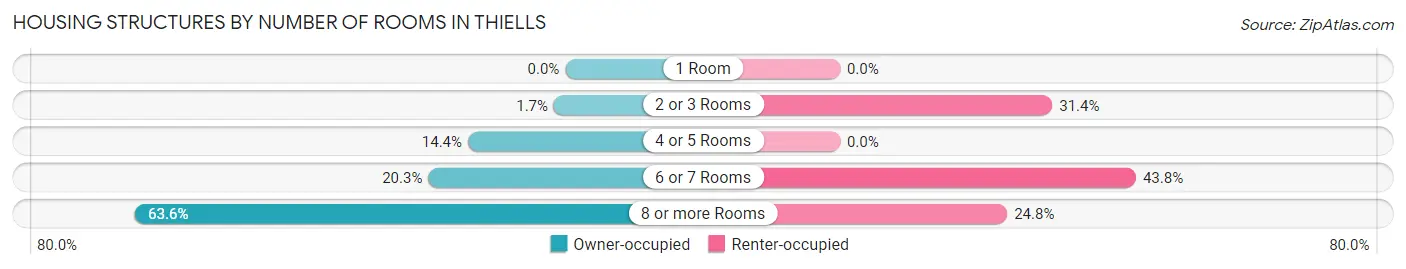
| Number of Rooms | Owner-occupied | Renter-occupied |
| 1 Room | 0 (0.0%) | 0 (0.0%) |
| 2 or 3 Rooms | 25 (1.7%) | 33 (31.4%) |
| 4 or 5 Rooms | 214 (14.4%) | 0 (0.0%) |
| 6 or 7 Rooms | 301 (20.3%) | 46 (43.8%) |
| 8 or more Rooms | 945 (63.6%) | 26 (24.8%) |
| Total | 1,485 (100.0%) | 105 (100.0%) |
Housing Structure by Heating Type in Thiells
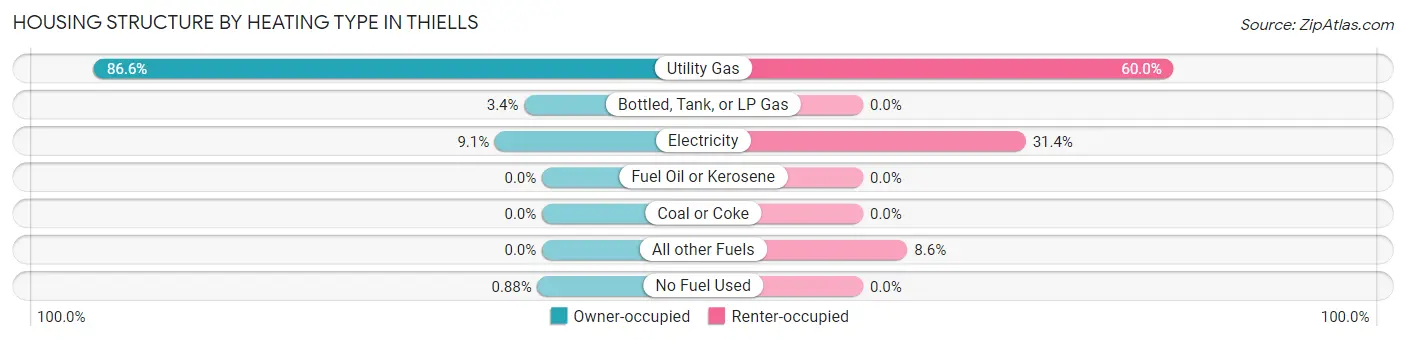
| Heating Type | Owner-occupied | Renter-occupied |
| Utility Gas | 1,286 (86.6%) | 63 (60.0%) |
| Bottled, Tank, or LP Gas | 51 (3.4%) | 0 (0.0%) |
| Electricity | 135 (9.1%) | 33 (31.4%) |
| Fuel Oil or Kerosene | 0 (0.0%) | 0 (0.0%) |
| Coal or Coke | 0 (0.0%) | 0 (0.0%) |
| All other Fuels | 0 (0.0%) | 9 (8.6%) |
| No Fuel Used | 13 (0.9%) | 0 (0.0%) |
| Total | 1,485 (100.0%) | 105 (100.0%) |
Household Vehicle Usage in Thiells
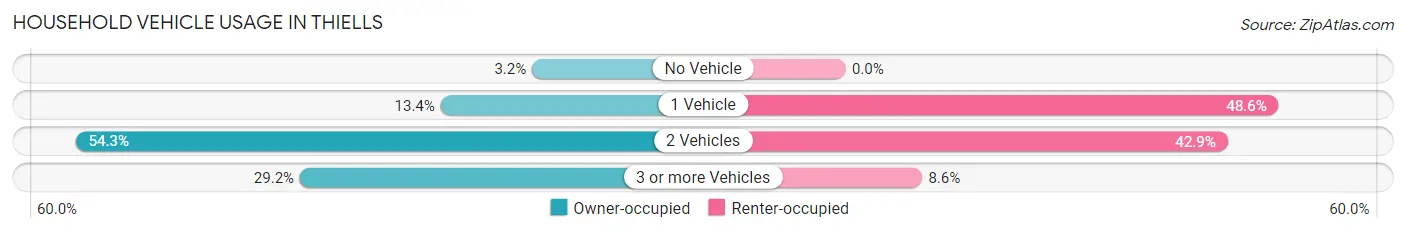
| Vehicles per Household | Owner-occupied | Renter-occupied |
| No Vehicle | 47 (3.2%) | 0 (0.0%) |
| 1 Vehicle | 199 (13.4%) | 51 (48.6%) |
| 2 Vehicles | 806 (54.3%) | 45 (42.9%) |
| 3 or more Vehicles | 433 (29.2%) | 9 (8.6%) |
| Total | 1,485 (100.0%) | 105 (100.0%) |
Real Estate & Mortgages in Thiells
Real Estate and Mortgage Overview in Thiells
| Characteristic | Without Mortgage | With Mortgage |
| Housing Units | 606 | 879 |
| Median Property Value | $446,300 | $496,200 |
| Median Household Income | $93,958 | $458 |
| Monthly Housing Costs | $1,501 | $588 |
| Real Estate Taxes | $10,001 | $10 |
Property Value by Mortgage Status in Thiells
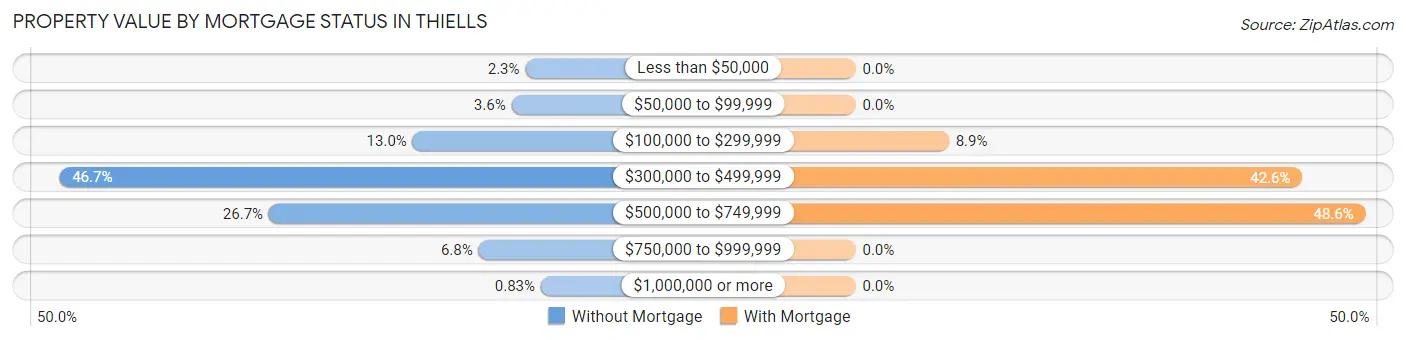
| Property Value | Without Mortgage | With Mortgage |
| Less than $50,000 | 14 (2.3%) | 0 (0.0%) |
| $50,000 to $99,999 | 22 (3.6%) | 0 (0.0%) |
| $100,000 to $299,999 | 79 (13.0%) | 78 (8.9%) |
| $300,000 to $499,999 | 283 (46.7%) | 374 (42.5%) |
| $500,000 to $749,999 | 162 (26.7%) | 427 (48.6%) |
| $750,000 to $999,999 | 41 (6.8%) | 0 (0.0%) |
| $1,000,000 or more | 5 (0.8%) | 0 (0.0%) |
| Total | 606 (100.0%) | 879 (100.0%) |
Household Income by Mortgage Status in Thiells
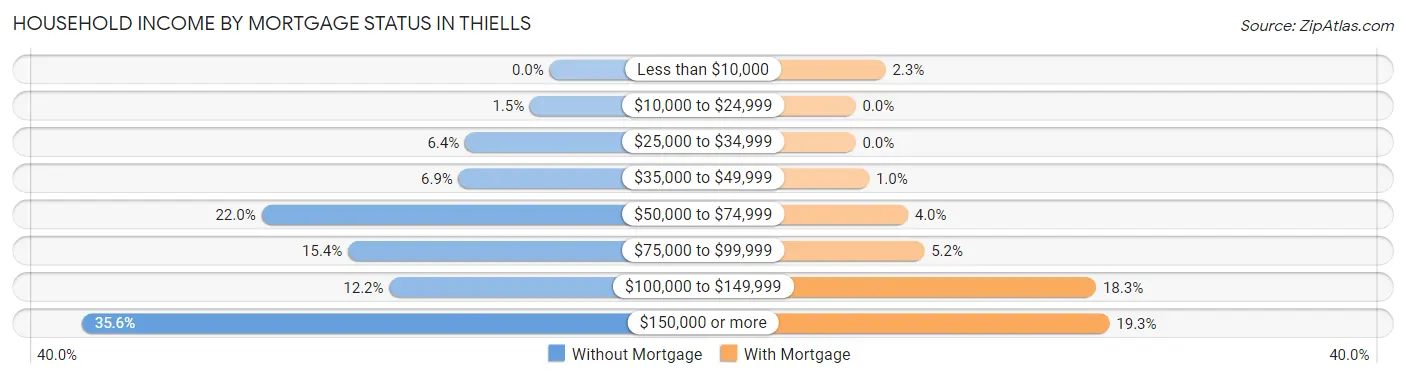
| Household Income | Without Mortgage | With Mortgage |
| Less than $10,000 | 0 (0.0%) | 20 (2.3%) |
| $10,000 to $24,999 | 9 (1.5%) | 0 (0.0%) |
| $25,000 to $34,999 | 39 (6.4%) | 0 (0.0%) |
| $35,000 to $49,999 | 42 (6.9%) | 9 (1.0%) |
| $50,000 to $74,999 | 133 (22.0%) | 35 (4.0%) |
| $75,000 to $99,999 | 93 (15.3%) | 46 (5.2%) |
| $100,000 to $149,999 | 74 (12.2%) | 161 (18.3%) |
| $150,000 or more | 216 (35.6%) | 170 (19.3%) |
| Total | 606 (100.0%) | 879 (100.0%) |
Property Value to Household Income Ratio in Thiells
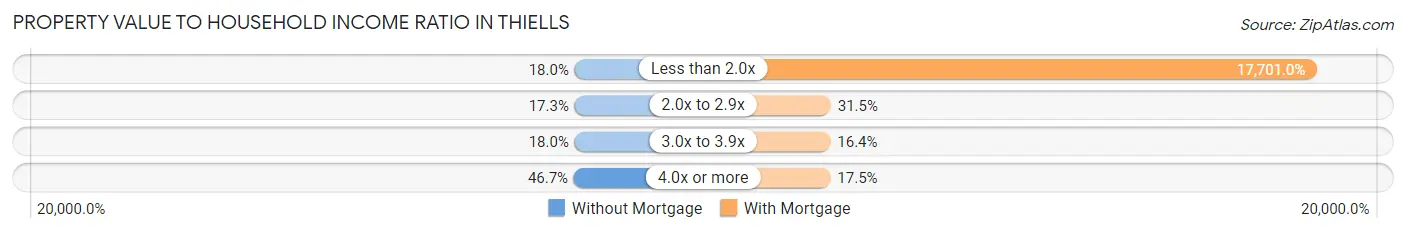
| Value-to-Income Ratio | Without Mortgage | With Mortgage |
| Less than 2.0x | 109 (18.0%) | 155,592 (17,701.0%) |
| 2.0x to 2.9x | 105 (17.3%) | 277 (31.5%) |
| 3.0x to 3.9x | 109 (18.0%) | 144 (16.4%) |
| 4.0x or more | 283 (46.7%) | 154 (17.5%) |
| Total | 606 (100.0%) | 879 (100.0%) |
Real Estate Taxes by Mortgage Status in Thiells
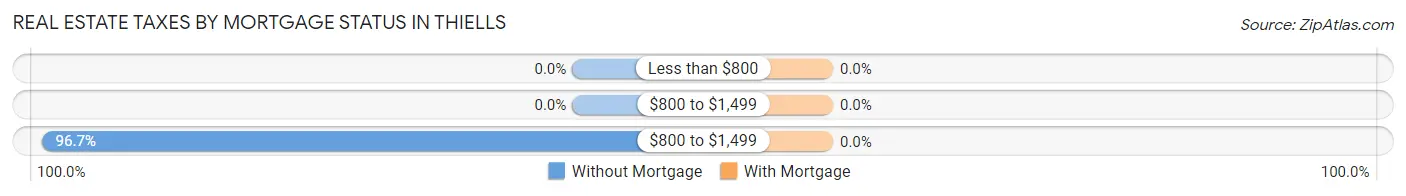
| Property Taxes | Without Mortgage | With Mortgage |
| Less than $800 | 0 (0.0%) | 0 (0.0%) |
| $800 to $1,499 | 0 (0.0%) | 0 (0.0%) |
| $800 to $1,499 | 586 (96.7%) | 0 (0.0%) |
| Total | 606 (100.0%) | 879 (100.0%) |
Health & Disability in Thiells
Health Insurance Coverage by Age in Thiells
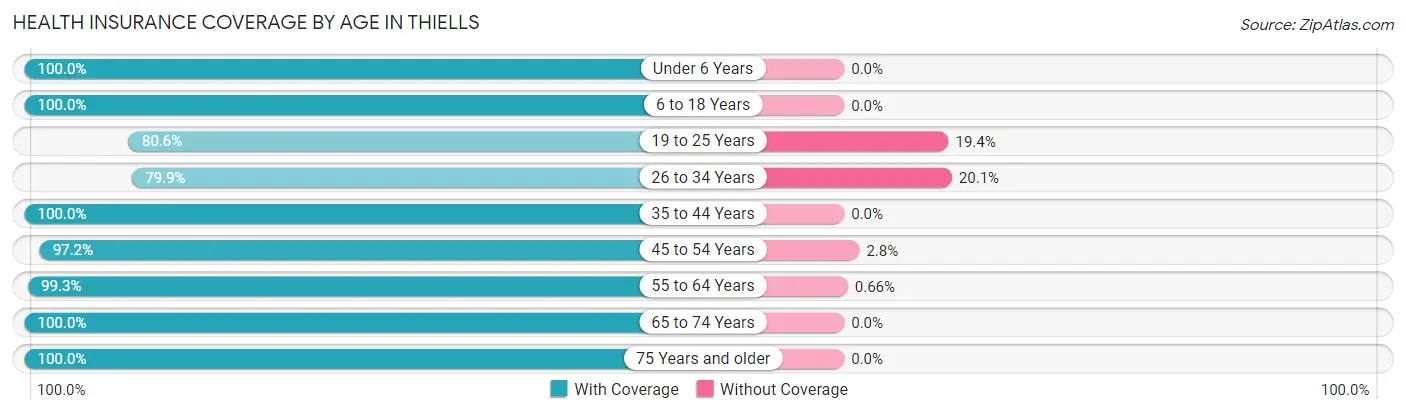
| Age Bracket | With Coverage | Without Coverage |
| Under 6 Years | 356 (100.0%) | 0 (0.0%) |
| 6 to 18 Years | 666 (100.0%) | 0 (0.0%) |
| 19 to 25 Years | 203 (80.6%) | 49 (19.4%) |
| 26 to 34 Years | 438 (79.9%) | 110 (20.1%) |
| 35 to 44 Years | 484 (100.0%) | 0 (0.0%) |
| 45 to 54 Years | 481 (97.2%) | 14 (2.8%) |
| 55 to 64 Years | 753 (99.3%) | 5 (0.7%) |
| 65 to 74 Years | 548 (100.0%) | 0 (0.0%) |
| 75 Years and older | 384 (100.0%) | 0 (0.0%) |
| Total | 4,313 (96.0%) | 178 (4.0%) |
Health Insurance Coverage by Citizenship Status in Thiells
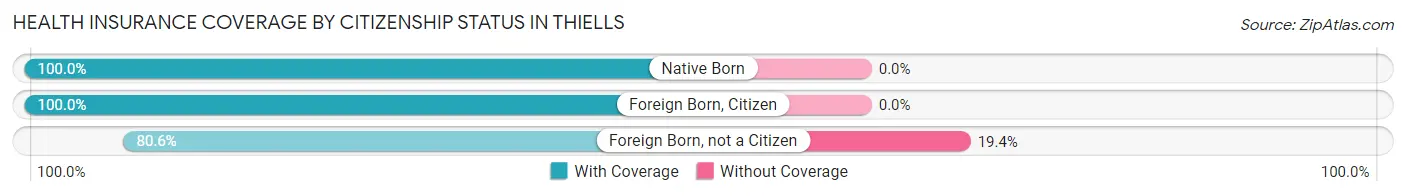
| Citizenship Status | With Coverage | Without Coverage |
| Native Born | 356 (100.0%) | 0 (0.0%) |
| Foreign Born, Citizen | 666 (100.0%) | 0 (0.0%) |
| Foreign Born, not a Citizen | 203 (80.6%) | 49 (19.4%) |
Health Insurance Coverage by Household Income in Thiells
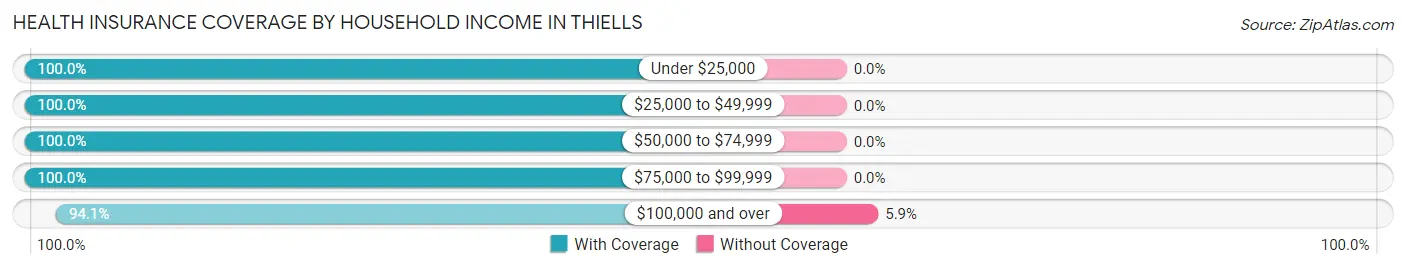
| Household Income | With Coverage | Without Coverage |
| Under $25,000 | 47 (100.0%) | 0 (0.0%) |
| $25,000 to $49,999 | 220 (100.0%) | 0 (0.0%) |
| $50,000 to $74,999 | 424 (100.0%) | 0 (0.0%) |
| $75,000 to $99,999 | 779 (100.0%) | 0 (0.0%) |
| $100,000 and over | 2,838 (94.1%) | 178 (5.9%) |
Public vs Private Health Insurance Coverage by Age in Thiells
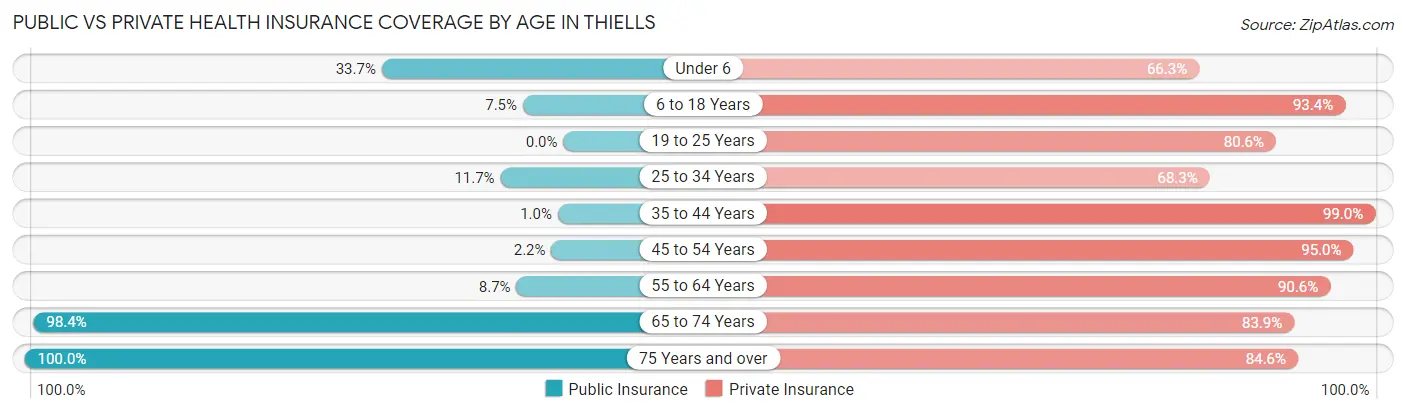
| Age Bracket | Public Insurance | Private Insurance |
| Under 6 | 120 (33.7%) | 236 (66.3%) |
| 6 to 18 Years | 50 (7.5%) | 622 (93.4%) |
| 19 to 25 Years | 0 (0.0%) | 203 (80.6%) |
| 25 to 34 Years | 64 (11.7%) | 374 (68.2%) |
| 35 to 44 Years | 5 (1.0%) | 479 (99.0%) |
| 45 to 54 Years | 11 (2.2%) | 470 (95.0%) |
| 55 to 64 Years | 66 (8.7%) | 687 (90.6%) |
| 65 to 74 Years | 539 (98.4%) | 460 (83.9%) |
| 75 Years and over | 384 (100.0%) | 325 (84.6%) |
| Total | 1,239 (27.6%) | 3,856 (85.9%) |
Disability Status by Sex by Age in Thiells
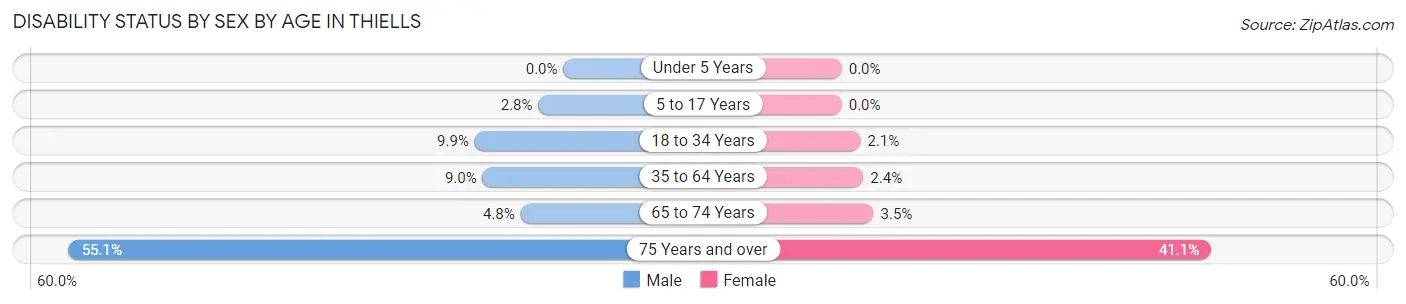
| Age Bracket | Male | Female |
| Under 5 Years | 0 (0.0%) | 0 (0.0%) |
| 5 to 17 Years | 9 (2.8%) | 0 (0.0%) |
| 18 to 34 Years | 44 (9.9%) | 9 (2.1%) |
| 35 to 64 Years | 78 (9.0%) | 21 (2.4%) |
| 65 to 74 Years | 14 (4.8%) | 9 (3.5%) |
| 75 Years and over | 103 (55.1%) | 81 (41.1%) |
Disability Class by Sex by Age in Thiells
Disability Class: Hearing Difficulty
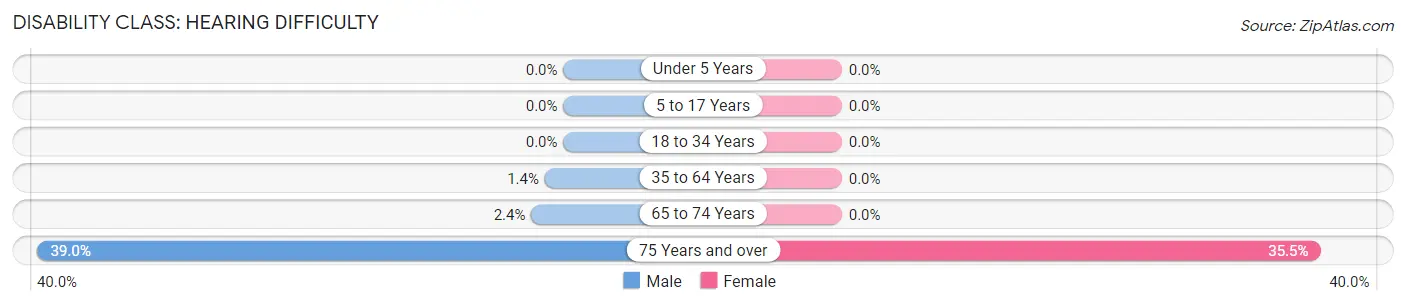
| Age Bracket | Male | Female |
| Under 5 Years | 0 (0.0%) | 0 (0.0%) |
| 5 to 17 Years | 0 (0.0%) | 0 (0.0%) |
| 18 to 34 Years | 0 (0.0%) | 0 (0.0%) |
| 35 to 64 Years | 12 (1.4%) | 0 (0.0%) |
| 65 to 74 Years | 7 (2.4%) | 0 (0.0%) |
| 75 Years and over | 73 (39.0%) | 70 (35.5%) |
Disability Class: Vision Difficulty
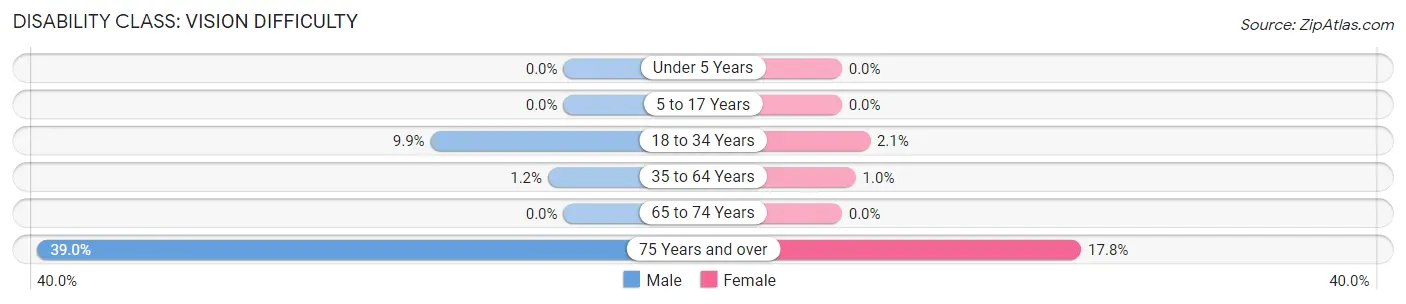
| Age Bracket | Male | Female |
| Under 5 Years | 0 (0.0%) | 0 (0.0%) |
| 5 to 17 Years | 0 (0.0%) | 0 (0.0%) |
| 18 to 34 Years | 44 (9.9%) | 9 (2.1%) |
| 35 to 64 Years | 10 (1.1%) | 9 (1.0%) |
| 65 to 74 Years | 0 (0.0%) | 0 (0.0%) |
| 75 Years and over | 73 (39.0%) | 35 (17.8%) |
Disability Class: Cognitive Difficulty
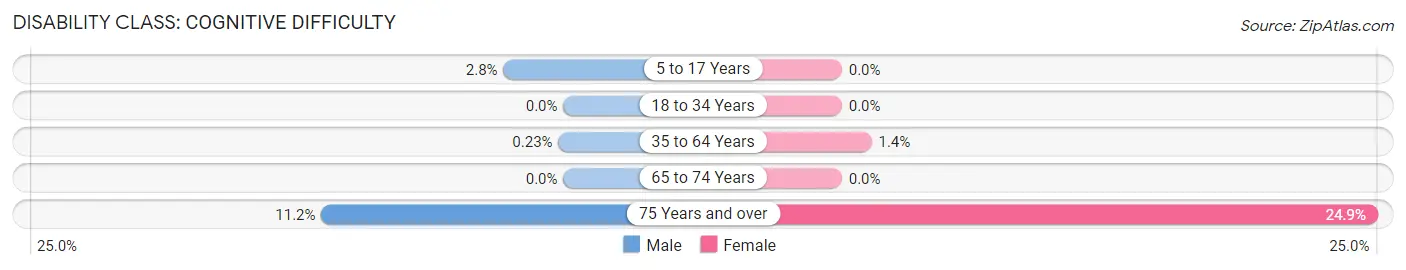
| Age Bracket | Male | Female |
| 5 to 17 Years | 9 (2.8%) | 0 (0.0%) |
| 18 to 34 Years | 0 (0.0%) | 0 (0.0%) |
| 35 to 64 Years | 2 (0.2%) | 12 (1.4%) |
| 65 to 74 Years | 0 (0.0%) | 0 (0.0%) |
| 75 Years and over | 21 (11.2%) | 49 (24.9%) |
Disability Class: Ambulatory Difficulty
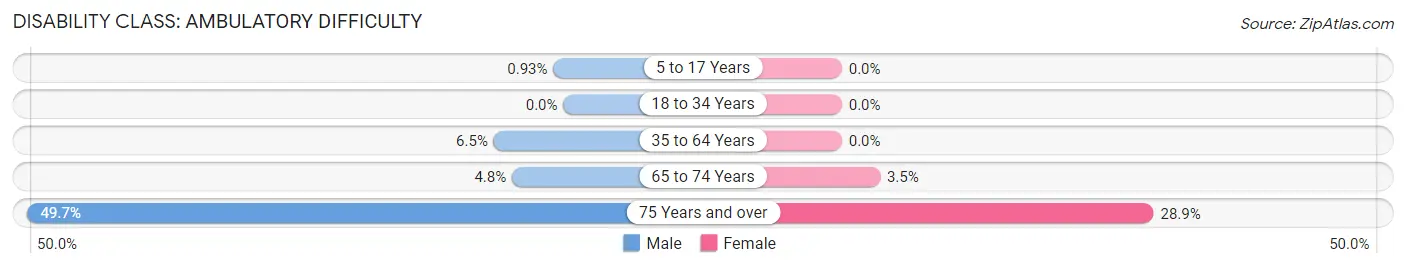
| Age Bracket | Male | Female |
| 5 to 17 Years | 3 (0.9%) | 0 (0.0%) |
| 18 to 34 Years | 0 (0.0%) | 0 (0.0%) |
| 35 to 64 Years | 56 (6.5%) | 0 (0.0%) |
| 65 to 74 Years | 14 (4.8%) | 9 (3.5%) |
| 75 Years and over | 93 (49.7%) | 57 (28.9%) |
Disability Class: Self-Care Difficulty
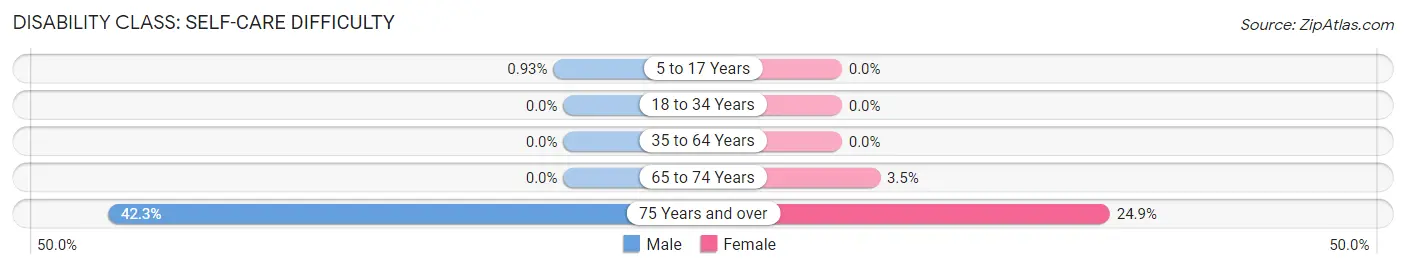
| Age Bracket | Male | Female |
| 5 to 17 Years | 3 (0.9%) | 0 (0.0%) |
| 18 to 34 Years | 0 (0.0%) | 0 (0.0%) |
| 35 to 64 Years | 0 (0.0%) | 0 (0.0%) |
| 65 to 74 Years | 0 (0.0%) | 9 (3.5%) |
| 75 Years and over | 79 (42.2%) | 49 (24.9%) |
Technology Access in Thiells
Computing Device Access in Thiells
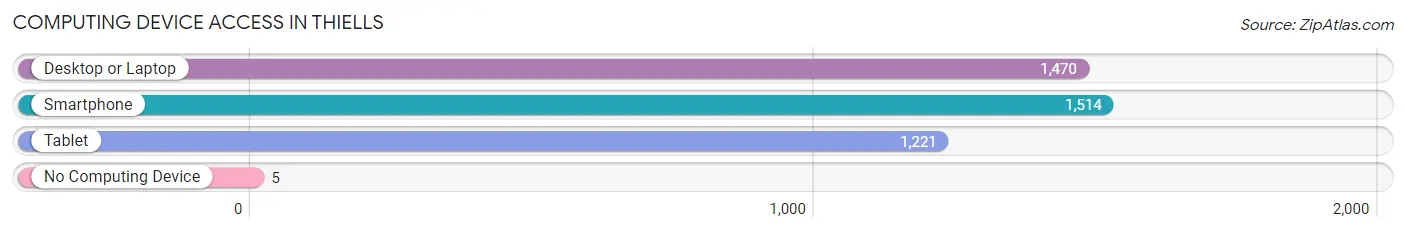
| Device Type | # Households | % Households |
| Desktop or Laptop | 1,470 | 92.4% |
| Smartphone | 1,514 | 95.2% |
| Tablet | 1,221 | 76.8% |
| No Computing Device | 5 | 0.3% |
| Total | 1,590 | 100.0% |
Internet Access in Thiells
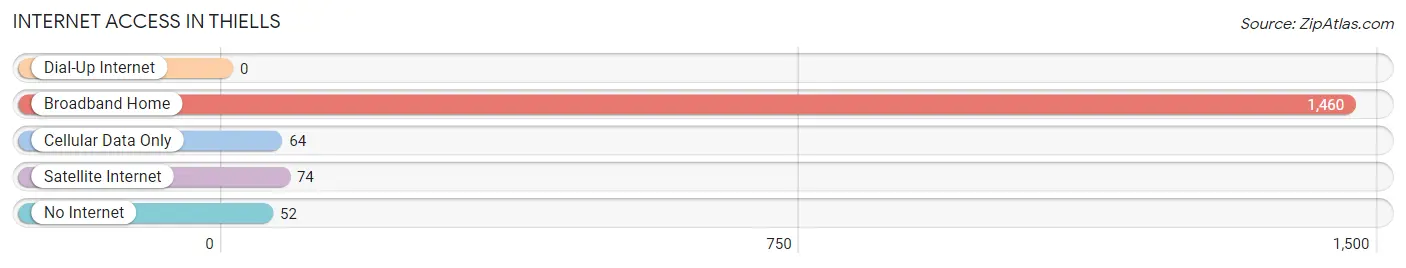
| Internet Type | # Households | % Households |
| Dial-Up Internet | 0 | 0.0% |
| Broadband Home | 1,460 | 91.8% |
| Cellular Data Only | 64 | 4.0% |
| Satellite Internet | 74 | 4.6% |
| No Internet | 52 | 3.3% |
| Total | 1,590 | 100.0% |
Thiells Summary
Thiells is a hamlet located in the town of Haverstraw, Rockland County, New York. It is situated on the west bank of the Hudson River, about 25 miles north of New York City. The hamlet is part of the larger Haverstraw-Stony Point Central School District.
History
The hamlet of Thiells was first settled in the late 1700s by Dutch and German immigrants. The name Thiells is derived from the Dutch word “thiel”, which means “valley”. The hamlet was originally known as “Thiel’s Valley”, and was later shortened to Thiells.
In the early 1800s, the hamlet was home to a number of small farms and businesses. The hamlet was also home to a number of quarries, which provided stone for the construction of the nearby Croton Aqueduct.
In the late 1800s, the hamlet began to grow and develop. The hamlet was home to a number of stores, churches, and other businesses. The hamlet was also home to a number of schools, including the Thiells School, which was built in 1891.
In the early 1900s, the hamlet continued to grow and develop. The hamlet was home to a number of stores, churches, and other businesses. The hamlet was also home to a number of schools, including the Thiells School, which was built in 1891.
In the late 1900s, the hamlet continued to grow and develop. The hamlet was home to a number of stores, churches, and other businesses. The hamlet was also home to a number of schools, including the Thiells School, which was built in 1891.
Geography
Thiells is located in the town of Haverstraw, Rockland County, New York. The hamlet is situated on the west bank of the Hudson River, about 25 miles north of New York City. The hamlet is part of the larger Haverstraw-Stony Point Central School District.
The hamlet is bordered by the hamlets of Stony Point to the north, West Haverstraw to the east, and Garnerville to the south. The hamlet is also bordered by the Hudson River to the west.
Economy
The economy of Thiells is largely based on the service industry. The hamlet is home to a number of restaurants, stores, and other businesses. The hamlet is also home to a number of schools, including the Thiells School, which was built in 1891.
The hamlet is also home to a number of manufacturing and industrial businesses. The hamlet is home to a number of quarries, which provide stone for the construction of the nearby Croton Aqueduct. The hamlet is also home to a number of warehouses and distribution centers.
Demographics
As of the 2010 census, the population of Thiells was 4,845. The population of the hamlet is largely white (90.2%), with a small percentage of African Americans (3.2%), Asians (2.2%), and other races (4.4%). The median household income in the hamlet is $68,944. The median age in the hamlet is 41.7 years.
Common Questions
What is Per Capita Income in Thiells?
Per Capita income in Thiells is $57,548.
What is the Median Family Income in Thiells?
Median Family Income in Thiells is $147,569.
What is the Median Household income in Thiells?
Median Household Income in Thiells is $122,417.
What is Income or Wage Gap in Thiells?
Income or Wage Gap in Thiells is 14.9%.
Women in Thiells earn 85.1 cents for every dollar earned by a man.
What is Inequality or Gini Index in Thiells?
Inequality or Gini Index in Thiells is 0.38.
What is the Total Population of Thiells?
Total Population of Thiells is 4,491.
What is the Total Male Population of Thiells?
Total Male Population of Thiells is 2,295.
What is the Total Female Population of Thiells?
Total Female Population of Thiells is 2,196.
What is the Ratio of Males per 100 Females in Thiells?
There are 104.51 Males per 100 Females in Thiells.
What is the Ratio of Females per 100 Males in Thiells?
There are 95.69 Females per 100 Males in Thiells.
What is the Median Population Age in Thiells?
Median Population Age in Thiells is 44.1 Years.
What is the Average Family Size in Thiells
Average Family Size in Thiells is 3.2 People.
What is the Average Household Size in Thiells
Average Household Size in Thiells is 2.8 People.
How Large is the Labor Force in Thiells?
There are 2,420 People in the Labor Forcein in Thiells.
What is the Percentage of People in the Labor Force in Thiells?
66.8% of People are in the Labor Force in Thiells.
What is the Unemployment Rate in Thiells?
Unemployment Rate in Thiells is 1.1%.