Cities with the Highest Percentage of Federal Government Employees in New Hampshire

RELATED REPORTS & OPTIONS

Federal Government Employees
Population
Families and Households
Female Fertility
Female Fertility (Unmarried)
Race (Community Size)
Race (Percentage)
Ancestry (Community Size)
AfghanAfricanAlaska NativeAlaskan AthabascanAlbanianAleutAlsatianAmericanApacheArabArapahoArgentineanArmenianAssyrian / Chaldean / SyriacAustralianAustrianBahamianBangladeshiBarbadianBasqueBelgianBelizeanBermudanBhutaneseBlackfeetBolivianBrazilianBritishBritish West IndianBulgarianBurmeseCajunCambodianCanadianCape VerdeanCarpatho RusynCelticCentral AmericanCentral American IndianCherokeeCheyenneChickasawChileanChineseChippewaChoctawColombianColvilleComancheCosta RicanCreeCreekCroatianCrowCubanCypriotCzechCzechoslovakianDanishDelawareDominicanDutchDutch West IndianEastern EuropeanEcuadorianEgyptianEnglishEstonianEthiopianEuropeanFijianFilipinoFinnishFrenchFrench American IndianFrench CanadianGermanGerman RussianGhanaianGreekGuamanian / ChamorroGuatemalanGuyaneseHaitianHmongHonduranHopiHoumaHungarianIcelanderIndian (Asian)IndonesianInupiatIranianIraqiIrishIroquoisIsraeliItalianJamaicanJapaneseJordanianKenyanKiowaKoreanLaotianLatvianLebaneseLiberianLithuanianLumbeeLuxembourgerMacedonianMalaysianMalteseMarshalleseMenomineeMexicanMexican American IndianMongolianMoroccanNative HawaiianNavajoNepaleseNew ZealanderNicaraguanNigerianNorthern EuropeanNorwegianOkinawanOsageOttawaPaiutePakistaniPalestinianPanamanianParaguayanPennsylvania GermanPeruvianPimaPolishPortuguesePotawatomiPuebloPuerto RicanPuget Sound SalishRomanianRussianSalvadoranSamoanScandinavianScotch-IrishScottishSeminoleSenegaleseSerbianShoshoneSierra LeoneanSiouxSlavicSlovakSloveneSomaliSouth AfricanSouth AmericanSouth American IndianSoviet UnionSpaniardSpanishSpanish AmericanSpanish American IndianSri LankanSubsaharan AfricanSudaneseSwedishSwissSyrianTaiwaneseThaiTlingit-HaidaTohono O'OdhamTonganTrinidadian and TobagonianTsimshianTurkishU.S. Virgin IslanderUgandanUkrainianUruguayanUteVenezuelanVietnameseWelshWest IndianYakamaYaquiYugoslavianYumanYup'ikZimbabwean
Ancestry (Percentage)
AfghanAfricanAlaska NativeAlaskan AthabascanAlbanianAleutAlsatianAmericanApacheArabArapahoArgentineanArmenianAssyrian / Chaldean / SyriacAustralianAustrianBahamianBangladeshiBarbadianBasqueBelgianBelizeanBermudanBhutaneseBlackfeetBolivianBrazilianBritishBritish West IndianBulgarianBurmeseCajunCambodianCanadianCape VerdeanCarpatho RusynCelticCentral AmericanCentral American IndianCherokeeCheyenneChickasawChileanChineseChippewaChoctawColombianColvilleComancheCosta RicanCreeCreekCroatianCrowCubanCypriotCzechCzechoslovakianDanishDelawareDominicanDutchDutch West IndianEastern EuropeanEcuadorianEgyptianEnglishEstonianEthiopianEuropeanFijianFilipinoFinnishFrenchFrench American IndianFrench CanadianGermanGerman RussianGhanaianGreekGuamanian / ChamorroGuatemalanGuyaneseHaitianHmongHonduranHopiHoumaHungarianIcelanderIndian (Asian)IndonesianInupiatIranianIraqiIrishIroquoisIsraeliItalianJamaicanJapaneseJordanianKenyanKiowaKoreanLaotianLatvianLebaneseLiberianLithuanianLumbeeLuxembourgerMacedonianMalaysianMalteseMarshalleseMenomineeMexicanMexican American IndianMongolianMoroccanNative HawaiianNavajoNepaleseNew ZealanderNicaraguanNigerianNorthern EuropeanNorwegianOkinawanOsageOttawaPaiutePakistaniPalestinianPanamanianParaguayanPennsylvania GermanPeruvianPimaPolishPortuguesePotawatomiPuebloPuerto RicanPuget Sound SalishRomanianRussianSalvadoranSamoanScandinavianScotch-IrishScottishSeminoleSenegaleseSerbianShoshoneSierra LeoneanSiouxSlavicSlovakSloveneSomaliSouth AfricanSouth AmericanSouth American IndianSoviet UnionSpaniardSpanishSpanish AmericanSpanish American IndianSri LankanSubsaharan AfricanSudaneseSwedishSwissSyrianTaiwaneseThaiTlingit-HaidaTohono O'OdhamTonganTrinidadian and TobagonianTsimshianTurkishU.S. Virgin IslanderUgandanUkrainianUruguayanUteVenezuelanVietnameseWelshWest IndianYakamaYaquiYugoslavianYumanYup'ikZimbabwean
Immigrant Origin (Total)
AfghanistanAfricaAlbaniaArgentinaArmeniaAsiaAustraliaAustriaAzoresBahamasBangladeshBarbadosBelarusBelgiumBelizeBoliviaBosnia and HerzegovinaBrazilBulgariaBurma / MyanmarCabo VerdeCambodiaCameroonCanadaCaribbeanCentral AmericaChileChinaColombiaCongoCosta RicaCroatiaCubaCzechoslovakiaDenmarkDominicaDominican RepublicEastern AfricaEastern AsiaEastern EuropeEcuadorEgyptEl SalvadorEnglandEritreaEthiopiaEuropeFijiFranceGermanyGhanaGreeceGrenadaGuatemalaGuyanaHaitiHondurasHong KongHungaryIndiaIndonesiaIranIraqIrelandIsraelItalyJamaicaJapanJordanKazakhstanKenyaKoreaKuwaitLaosLatin AmericaLatviaLebanonLiberiaLithuaniaMalaysiaMexicoMicronesiaMiddle AfricaMoldovaMoroccoNepalNetherlandsNicaraguaNigeriaNorth MacedoniaNorthern AfricaNorthern EuropeNorwayOceaniaPakistanPanamaPeruPhilippinesPolandPortugalRomaniaRussiaSaudi ArabiaScotlandSenegalSerbiaSierra LeoneSingaporeSomaliaSouth AfricaSouth AmericaSouth Central AsiaSouth Eastern AsiaSouthern EuropeSpainSri LankaSt. Vincent and the GrenadinesSudanSwedenSwitzerlandSyriaTaiwanThailandTrinidad and TobagoTurkeyUgandaUkraineUruguayUzbekistanVenezuelaVietnamWest IndiesWestern AfricaWestern AsiaWestern EuropeYemenZaireZimbabwe
Immigrant Origin (Percentage)
AfghanistanAfricaAlbaniaArgentinaArmeniaAsiaAustraliaAustriaAzoresBahamasBangladeshBarbadosBelarusBelgiumBelizeBoliviaBosnia and HerzegovinaBrazilBulgariaBurma / MyanmarCabo VerdeCambodiaCameroonCanadaCaribbeanCentral AmericaChileChinaColombiaCongoCosta RicaCroatiaCubaCzechoslovakiaDenmarkDominicaDominican RepublicEastern AfricaEastern AsiaEastern EuropeEcuadorEgyptEl SalvadorEnglandEritreaEthiopiaEuropeFijiFranceGermanyGhanaGreeceGrenadaGuatemalaGuyanaHaitiHondurasHong KongHungaryIndiaIndonesiaIranIraqIrelandIsraelItalyJamaicaJapanJordanKazakhstanKenyaKoreaKuwaitLaosLatin AmericaLatviaLebanonLiberiaLithuaniaMalaysiaMexicoMicronesiaMiddle AfricaMoldovaMoroccoNepalNetherlandsNicaraguaNigeriaNorth MacedoniaNorthern AfricaNorthern EuropeNorwayOceaniaPakistanPanamaPeruPhilippinesPolandPortugalRomaniaRussiaSaudi ArabiaScotlandSenegalSerbiaSierra LeoneSingaporeSomaliaSouth AfricaSouth AmericaSouth Central AsiaSouth Eastern AsiaSouthern EuropeSpainSri LankaSt. Vincent and the GrenadinesSudanSwedenSwitzerlandSyriaTaiwanThailandTrinidad and TobagoTurkeyUgandaUkraineUruguayUzbekistanVenezuelaVietnamWest IndiesWestern AfricaWestern AsiaWestern EuropeYemenZaireZimbabwe
Income
Income (Families)
Income (Households)
Poverty
Poverty (Families)
Unemployment
Employment Occupations
Employment Industries
Employer Class
Commute Time
Commute Means
School Enrollment
Education by Degree Field
Occupancy
Finances
Physical Characteristics
New Hampshire
Compare Cities
Comparison Subject

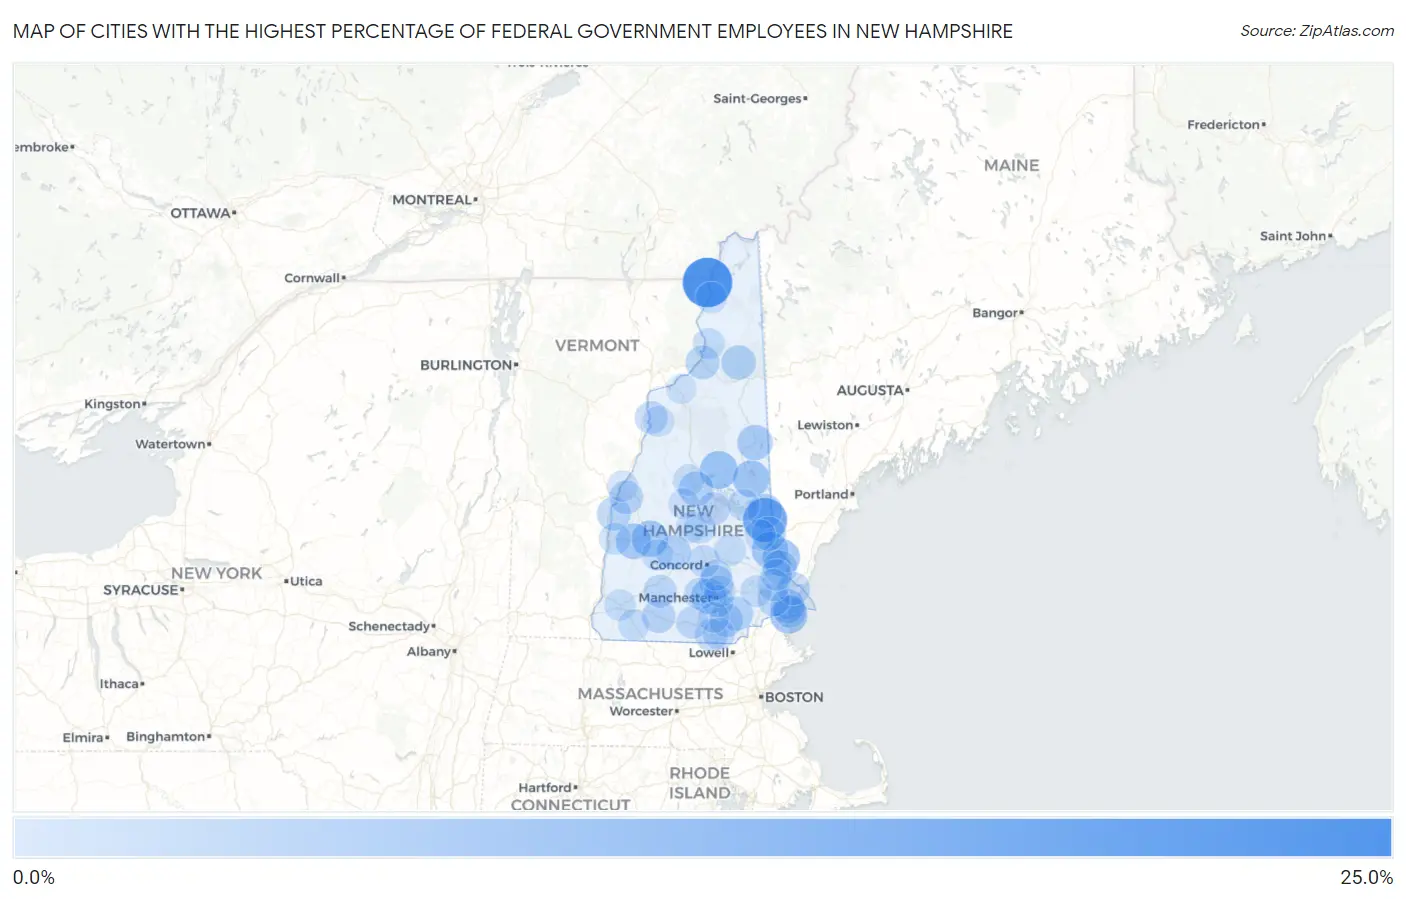
Map of Cities with the Highest Percentage of Federal Government Employees in New Hampshire

0.0%
25.0%
Cities with the Highest Percentage of Federal Government Employees in New Hampshire Map

Cities with the Highest Percentage of Federal Government Employees in New Hampshire

City % Federal Government Employees vs State vs National
1.West Stewartstown21.5%2.6%(+18.8)#13.4%(+18.1)#756
2.Union15.3%2.6%(+12.7)#23.4%(+12.0)#1,258
3.Center Sandwich8.2%2.6%(+5.54)#33.4%(+4.80)#2,846
4.Somersworth7.8%2.6%(+5.19)#43.4%(+4.46)#2,974
5.Seabrook Beach7.6%2.6%(+4.99)#53.4%(+4.26)#3,055
6.Center Ossipee7.0%2.6%(+4.41)#63.4%(+3.67)#3,352
7.Rochester7.0%2.6%(+4.32)#73.4%(+3.59)#3,409
8.Blodgett Landing6.7%2.6%(+4.02)#83.4%(+3.29)#3,583
9.Newport5.9%2.6%(+3.27)#93.4%(+2.54)#4,104
10.Pinardville5.8%2.6%(+3.12)#103.4%(+2.39)#4,228
11.Conway5.5%2.6%(+2.86)#113.4%(+2.12)#4,461
12.Francestown5.5%2.6%(+2.81)#123.4%(+2.08)#4,498
13.Sanbornville5.0%2.6%(+2.31)#133.4%(+1.57)#5,010
14.Ashland4.7%2.6%(+2.10)#143.4%(+1.36)#5,262
15.Warner4.7%2.6%(+2.06)#153.4%(+1.33)#5,297
16.Hampton4.6%2.6%(+1.91)#163.4%(+1.18)#5,472
17.Hooksett4.4%2.6%(+1.80)#173.4%(+1.07)#5,628
18.Dover4.4%2.6%(+1.76)#183.4%(+1.03)#5,679
19.Milton4.4%2.6%(+1.75)#193.4%(+1.01)#5,702
20.Berlin4.4%2.6%(+1.73)#203.4%(+0.995)#5,729
21.Derry4.3%2.6%(+1.63)#213.4%(+0.900)#5,874
22.Plainfield3.9%2.6%(+1.24)#223.4%(+0.506)#6,501
23.Lancaster3.9%2.6%(+1.23)#233.4%(+0.497)#6,516
24.Londonderry3.7%2.6%(+1.10)#243.4%(+0.364)#6,735
25.Peterborough3.6%2.6%(+0.979)#253.4%(+0.246)#6,940
26.Lebanon3.6%2.6%(+0.949)#263.4%(+0.216)#7,010
27.Laconia3.1%2.6%(+0.472)#273.4%(-0.261)#8,051
28.Antrim3.0%2.6%(+0.368)#283.4%(-0.366)#8,298
29.Woodsville2.9%2.6%(+0.259)#293.4%(-0.475)#8,579
30.Hampton Beach2.9%2.6%(+0.256)#303.4%(-0.477)#8,586
31.Nashua2.9%2.6%(+0.218)#313.4%(-0.515)#8,683
32.Portsmouth2.8%2.6%(+0.158)#323.4%(-0.575)#8,850
33.Exeter2.5%2.6%(-0.096)#333.4%(-0.829)#9,592
34.Milford2.4%2.6%(-0.201)#343.4%(-0.934)#9,956
35.Newmarket2.2%2.6%(-0.401)#353.4%(-1.13)#10,669
36.Manchester2.2%2.6%(-0.411)#363.4%(-1.14)#10,707
37.Goffstown2.1%2.6%(-0.527)#373.4%(-1.26)#11,174
38.Concord2.0%2.6%(-0.599)#383.4%(-1.33)#11,464
39.Hudson2.0%2.6%(-0.658)#393.4%(-1.39)#11,712
40.Wolfeboro1.9%2.6%(-0.739)#403.4%(-1.47)#12,019
41.Claremont1.9%2.6%(-0.786)#413.4%(-1.52)#12,240
42.Pittsfield1.8%2.6%(-0.816)#423.4%(-1.55)#12,368
43.Tilton Northfield1.8%2.6%(-0.837)#433.4%(-1.57)#12,468
44.Epping1.6%2.6%(-1.01)#443.4%(-1.75)#13,312
45.Plymouth1.6%2.6%(-1.04)#453.4%(-1.77)#13,437
46.Durham1.6%2.6%(-1.07)#463.4%(-1.80)#13,571
47.South Hooksett1.6%2.6%(-1.08)#473.4%(-1.82)#13,663
48.Groveton1.5%2.6%(-1.19)#483.4%(-1.92)#14,199
49.Colebrook1.4%2.6%(-1.22)#493.4%(-1.95)#14,329
50.Keene1.4%2.6%(-1.28)#503.4%(-2.01)#14,678
51.Troy1.3%2.6%(-1.31)#513.4%(-2.04)#14,809
52.Bradford1.3%2.6%(-1.35)#523.4%(-2.08)#15,060
53.Hanover1.3%2.6%(-1.39)#533.4%(-2.12)#15,267
54.Farmington1.2%2.6%(-1.47)#543.4%(-2.20)#15,688
55.Suncook1.1%2.6%(-1.50)#553.4%(-2.24)#15,866
56.Mountain Lakes1.0%2.6%(-1.63)#563.4%(-2.36)#16,599
57.Franklin0.98%2.6%(-1.67)#573.4%(-2.40)#16,772
58.Bristol0.88%2.6%(-1.77)#583.4%(-2.50)#17,278
59.East Merrimack0.54%2.6%(-2.11)#593.4%(-2.84)#18,999
60.Littleton0.40%2.6%(-2.24)#603.4%(-2.97)#19,557

Common Questions

What are the Top 10 Cities with the Highest Percentage of Federal Government Employees in New Hampshire?
Top 10 Cities with the Highest Percentage of Federal Government Employees in New Hampshire are:
What city has the Highest Percentage of Federal Government Employees in New Hampshire?
West Stewartstown has the Highest Percentage of Federal Government Employees in New Hampshire with 21.5%.
What is the Percentage of Federal Government Employees in the State of New Hampshire?
Percentage of Federal Government Employees in New Hampshire is 2.6%.
What is the Percentage of Federal Government Employees in the United States?
Percentage of Federal Government Employees in the United States is 3.4%.