Philipsburg, MT Map & Demographics
Philipsburg Map
Philipsburg Overview
$20,143
PER CAPITA INCOME
$32,353
AVG HOUSEHOLD INCOME
0.41
INEQUALITY / GINI INDEX
914
TOTAL POPULATION
448
MALE POPULATION
466
FEMALE POPULATION
96.14
MALES / 100 FEMALES
104.02
FEMALES / 100 MALES
49.8
MEDIAN AGE
3.2
AVG FAMILY SIZE
2.2
AVG HOUSEHOLD SIZE
405
LABOR FORCE [ PEOPLE ]
49.9%
PERCENT IN LABOR FORCE
13.8%
UNEMPLOYMENT RATE
Philipsburg Zip Codes
Philipsburg Area Codes
Income in Philipsburg
Income Overview in Philipsburg
| Characteristic | Number | Measure |
| Per Capita Income | 914 | $20,143 |
| Median Family Income | 193 | $0 |
| Mean Family Income | 193 | $56,913 |
| Median Household Income | 394 | $32,353 |
| Mean Household Income | 394 | $43,873 |
| Income Deficit | 193 | $0 |
| Wage / Income Gap (%) | 914 | 0.00% |
| Wage / Income Gap ($) | 914 | 100.00¢ per $1 |
| Gini / Inequality Index | 914 | 0.41 |
Earnings by Sex in Philipsburg
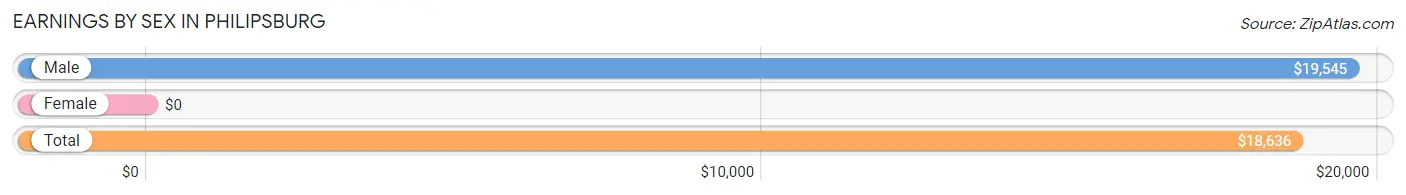
| Sex | Number | Average Earnings |
| Male | 210 (51.2%) | $19,545 |
| Female | 200 (48.8%) | $0 |
| Total | 410 (100.0%) | $18,636 |
Earnings by Sex by Income Bracket in Philipsburg
The most common earnings brackets in Philipsburg are $2,499 or less for men (52 | 24.8%) and $2,499 or less for women (74 | 37.0%).
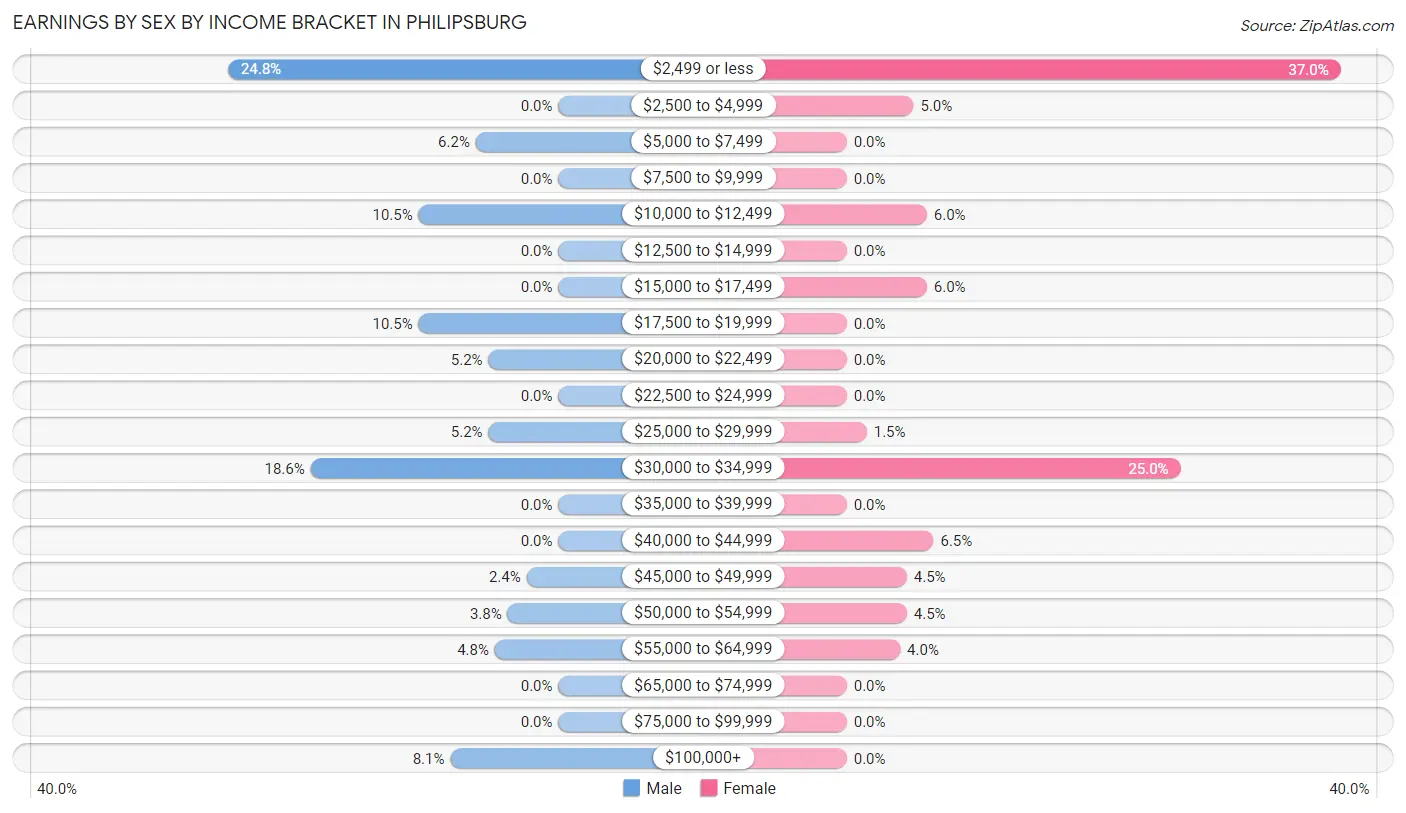
| Income | Male | Female |
| $2,499 or less | 52 (24.8%) | 74 (37.0%) |
| $2,500 to $4,999 | 0 (0.0%) | 10 (5.0%) |
| $5,000 to $7,499 | 13 (6.2%) | 0 (0.0%) |
| $7,500 to $9,999 | 0 (0.0%) | 0 (0.0%) |
| $10,000 to $12,499 | 22 (10.5%) | 12 (6.0%) |
| $12,500 to $14,999 | 0 (0.0%) | 0 (0.0%) |
| $15,000 to $17,499 | 0 (0.0%) | 12 (6.0%) |
| $17,500 to $19,999 | 22 (10.5%) | 0 (0.0%) |
| $20,000 to $22,499 | 11 (5.2%) | 0 (0.0%) |
| $22,500 to $24,999 | 0 (0.0%) | 0 (0.0%) |
| $25,000 to $29,999 | 11 (5.2%) | 3 (1.5%) |
| $30,000 to $34,999 | 39 (18.6%) | 50 (25.0%) |
| $35,000 to $39,999 | 0 (0.0%) | 0 (0.0%) |
| $40,000 to $44,999 | 0 (0.0%) | 13 (6.5%) |
| $45,000 to $49,999 | 5 (2.4%) | 9 (4.5%) |
| $50,000 to $54,999 | 8 (3.8%) | 9 (4.5%) |
| $55,000 to $64,999 | 10 (4.8%) | 8 (4.0%) |
| $65,000 to $74,999 | 0 (0.0%) | 0 (0.0%) |
| $75,000 to $99,999 | 0 (0.0%) | 0 (0.0%) |
| $100,000+ | 17 (8.1%) | 0 (0.0%) |
| Total | 210 (100.0%) | 200 (100.0%) |
Earnings by Sex by Educational Attainment in Philipsburg
Average earnings in Philipsburg are $32,794 for men and $31,932 for women, a difference of 2.6%. Men with an educational attainment of college or associate's degree enjoy the highest average annual earnings of $34,444, while those with high school diploma education earn the least with $33,203. Women with an educational attainment of bachelor's degree earn the most with the average annual earnings of $34,706, while those with high school diploma education have the smallest earnings of $2,499.
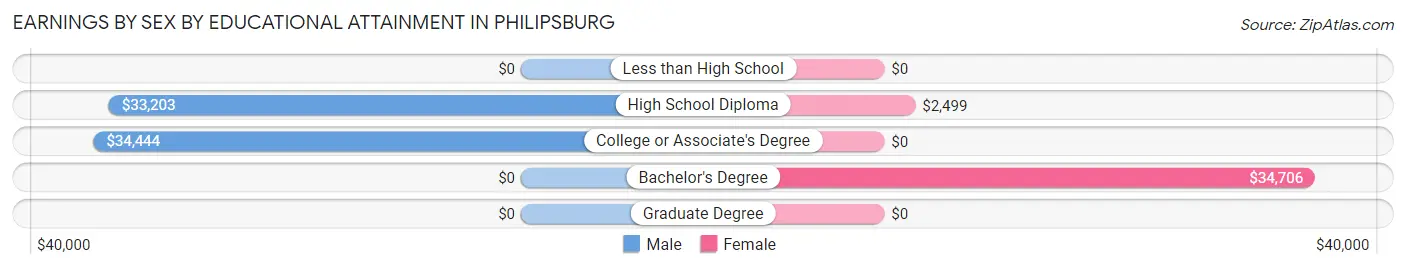
| Educational Attainment | Male Income | Female Income |
| Less than High School | - | - |
| High School Diploma | $33,203 | $2,499 |
| College or Associate's Degree | $34,444 | $0 |
| Bachelor's Degree | - | - |
| Graduate Degree | - | - |
| Total | $32,794 | $31,932 |
Family Income in Philipsburg
Family Income Brackets in Philipsburg
According to the Philipsburg family income data, there are 53 families falling into the $50,000 to $74,999 income range, which is the most common income bracket and makes up 27.5% of all families.
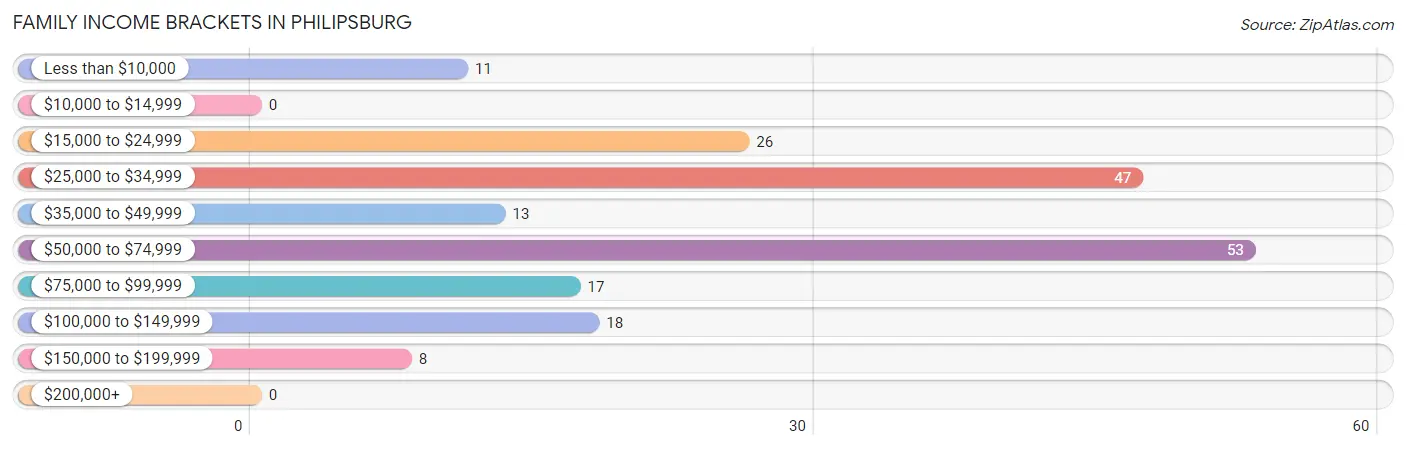
| Income Bracket | # Families | % Families |
| Less than $10,000 | 11 | 5.7% |
| $10,000 to $14,999 | 0 | 0.0% |
| $15,000 to $24,999 | 26 | 13.5% |
| $25,000 to $34,999 | 47 | 24.4% |
| $35,000 to $49,999 | 13 | 6.7% |
| $50,000 to $74,999 | 53 | 27.5% |
| $75,000 to $99,999 | 17 | 8.8% |
| $100,000 to $149,999 | 18 | 9.3% |
| $150,000 to $199,999 | 8 | 4.1% |
| $200,000+ | 0 | 0.0% |
Family Income by Famaliy Size in Philipsburg
| Income Bracket | # Families | Median Income |
| 2-Person Families | 135 (70.0%) | $0 |
| 3-Person Families | 32 (16.6%) | $0 |
| 4-Person Families | 17 (8.8%) | $0 |
| 5-Person Families | 9 (4.7%) | $0 |
| 6-Person Families | 0 (0.0%) | $0 |
| 7+ Person Families | 0 (0.0%) | $0 |
| Total | 193 (100.0%) | $0 |
Family Income by Number of Earners in Philipsburg
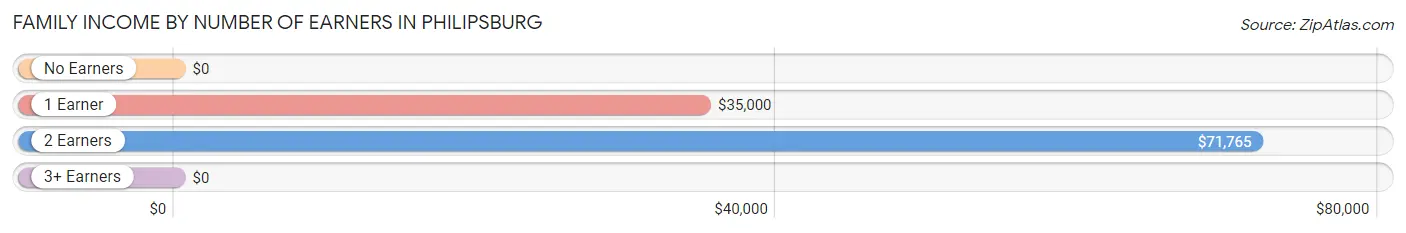
| Number of Earners | # Families | Median Income |
| No Earners | 51 (26.4%) | $0 |
| 1 Earner | 44 (22.8%) | $35,000 |
| 2 Earners | 68 (35.2%) | $71,765 |
| 3+ Earners | 30 (15.5%) | $0 |
| Total | 193 (100.0%) | $0 |
Household Income in Philipsburg
Household Income Brackets in Philipsburg
With 84 households falling in the category, the $25,000 to $34,999 income range is the most frequent in Philipsburg, accounting for 21.3% of all households.
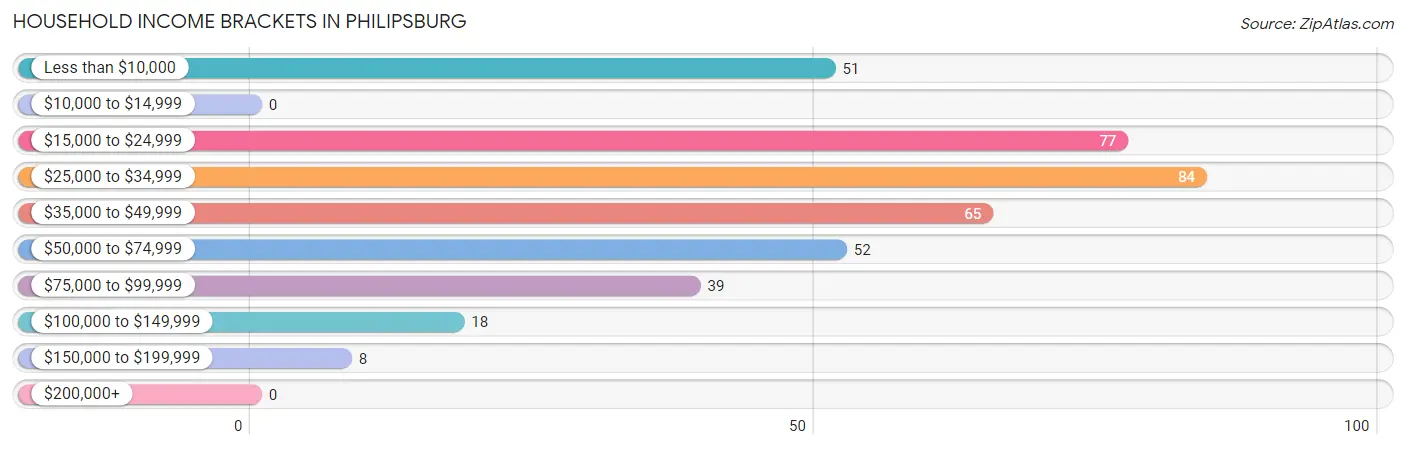
| Income Bracket | # Households | % Households |
| Less than $10,000 | 51 | 12.9% |
| $10,000 to $14,999 | 0 | 0.0% |
| $15,000 to $24,999 | 77 | 19.5% |
| $25,000 to $34,999 | 84 | 21.3% |
| $35,000 to $49,999 | 65 | 16.5% |
| $50,000 to $74,999 | 52 | 13.2% |
| $75,000 to $99,999 | 39 | 9.9% |
| $100,000 to $149,999 | 18 | 4.6% |
| $150,000 to $199,999 | 8 | 2.0% |
| $200,000+ | 0 | 0.0% |
Household Income by Householder Age in Philipsburg
The median household income in Philipsburg is $32,353, with the highest median household income of $58,875 found in the 25 to 44 years age bracket for the primary householder. A total of 111 households (28.2%) fall into this category.
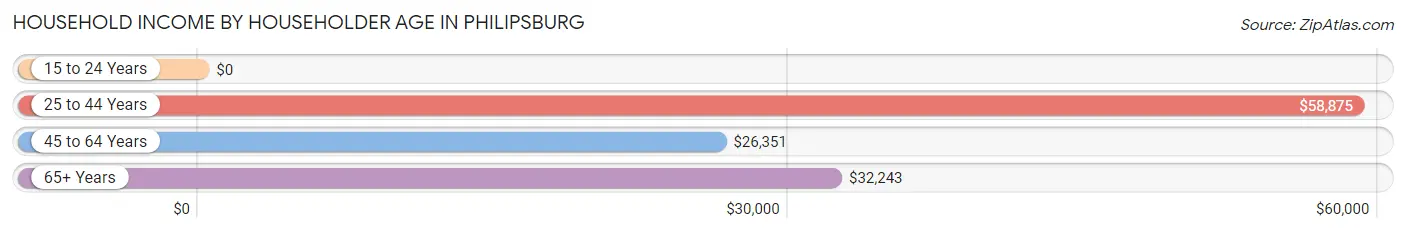
| Income Bracket | # Households | Median Income |
| 15 to 24 Years | 0 (0.0%) | $0 |
| 25 to 44 Years | 111 (28.2%) | $58,875 |
| 45 to 64 Years | 116 (29.4%) | $26,351 |
| 65+ Years | 167 (42.4%) | $32,243 |
| Total | 394 (100.0%) | $32,353 |
Poverty in Philipsburg
Income Below Poverty by Sex and Age in Philipsburg
With 31.9% poverty level for males and 12.0% for females among the residents of Philipsburg, 18 to 24 year old males and 25 to 34 year old females are the most vulnerable to poverty, with 71 males (100.0%) and 10 females (100.0%) in their respective age groups living below the poverty level.
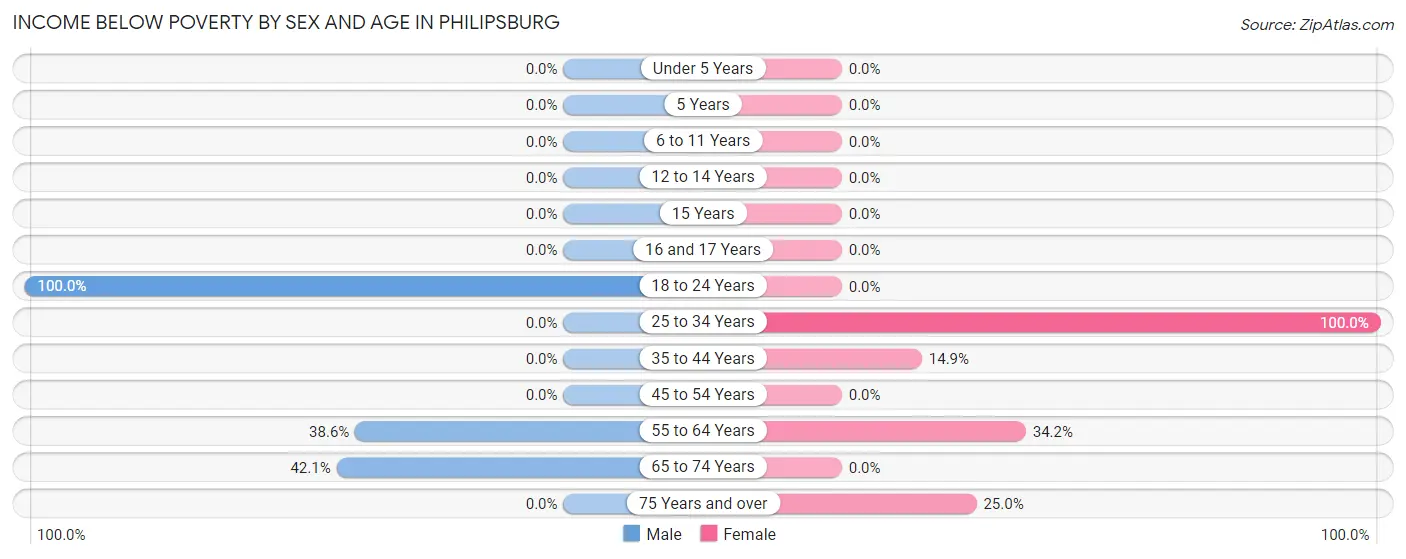
| Age Bracket | Male | Female |
| Under 5 Years | 0 (0.0%) | 0 (0.0%) |
| 5 Years | 0 (0.0%) | 0 (0.0%) |
| 6 to 11 Years | 0 (0.0%) | 0 (0.0%) |
| 12 to 14 Years | 0 (0.0%) | 0 (0.0%) |
| 15 Years | 0 (0.0%) | 0 (0.0%) |
| 16 and 17 Years | 0 (0.0%) | 0 (0.0%) |
| 18 to 24 Years | 71 (100.0%) | 0 (0.0%) |
| 25 to 34 Years | 0 (0.0%) | 10 (100.0%) |
| 35 to 44 Years | 0 (0.0%) | 11 (14.9%) |
| 45 to 54 Years | 0 (0.0%) | 0 (0.0%) |
| 55 to 64 Years | 51 (38.6%) | 14 (34.2%) |
| 65 to 74 Years | 16 (42.1%) | 0 (0.0%) |
| 75 Years and over | 0 (0.0%) | 18 (25.0%) |
| Total | 138 (31.9%) | 53 (12.0%) |
Income Above Poverty by Sex and Age in Philipsburg
According to the poverty statistics in Philipsburg, males aged under 5 years and females aged under 5 years are the age groups that are most secure financially, with 100.0% of males and 100.0% of females in these age groups living above the poverty line.
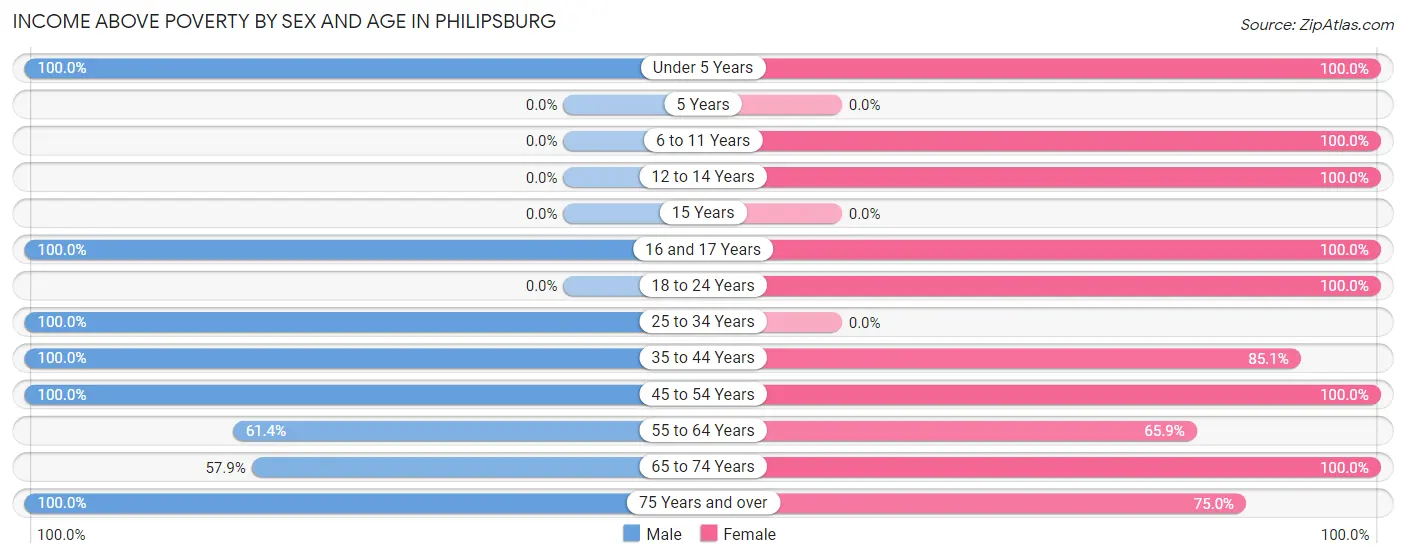
| Age Bracket | Male | Female |
| Under 5 Years | 13 (100.0%) | 74 (100.0%) |
| 5 Years | 0 (0.0%) | 0 (0.0%) |
| 6 to 11 Years | 0 (0.0%) | 7 (100.0%) |
| 12 to 14 Years | 0 (0.0%) | 8 (100.0%) |
| 15 Years | 0 (0.0%) | 0 (0.0%) |
| 16 and 17 Years | 18 (100.0%) | 9 (100.0%) |
| 18 to 24 Years | 0 (0.0%) | 30 (100.0%) |
| 25 to 34 Years | 16 (100.0%) | 0 (0.0%) |
| 35 to 44 Years | 68 (100.0%) | 63 (85.1%) |
| 45 to 54 Years | 53 (100.0%) | 25 (100.0%) |
| 55 to 64 Years | 81 (61.4%) | 27 (65.8%) |
| 65 to 74 Years | 22 (57.9%) | 93 (100.0%) |
| 75 Years and over | 23 (100.0%) | 54 (75.0%) |
| Total | 294 (68.1%) | 390 (88.0%) |
Income Below Poverty Among Married-Couple Families in Philipsburg
The poverty statistics for married-couple families in Philipsburg show that 8.2% or 14 of the total 171 families live below the poverty line. Families with no children have the highest poverty rate of 10.4%, comprising of 14 families. On the other hand, families with 1 or 2 children have the lowest poverty rate of 0.0%, which includes 0 families.
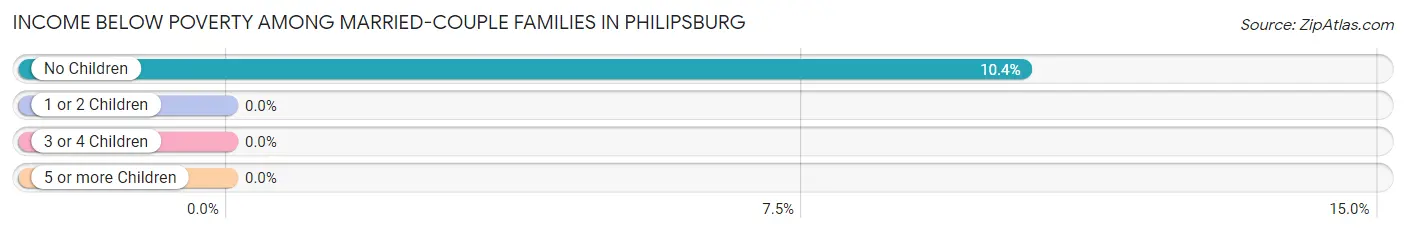
| Children | Above Poverty | Below Poverty |
| No Children | 121 (89.6%) | 14 (10.4%) |
| 1 or 2 Children | 27 (100.0%) | 0 (0.0%) |
| 3 or 4 Children | 9 (100.0%) | 0 (0.0%) |
| 5 or more Children | 0 (0.0%) | 0 (0.0%) |
| Total | 157 (91.8%) | 14 (8.2%) |
Income Below Poverty Among Single-Parent Households in Philipsburg
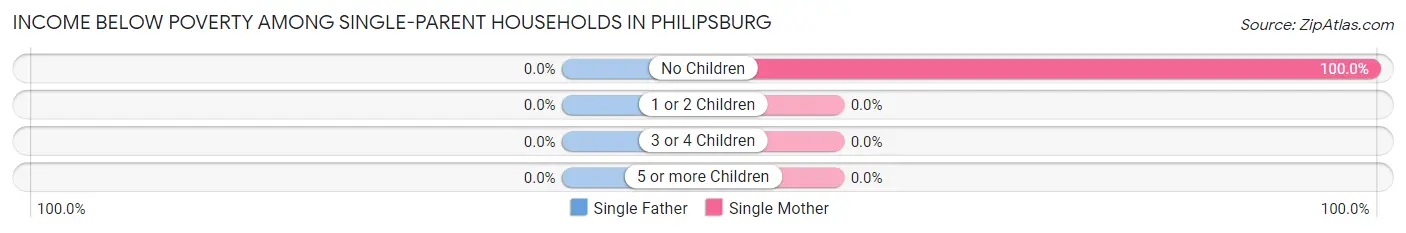
| Children | Single Father | Single Mother |
| No Children | 0 (0.0%) | 11 (100.0%) |
| 1 or 2 Children | 0 (0.0%) | 0 (0.0%) |
| 3 or 4 Children | 0 (0.0%) | 0 (0.0%) |
| 5 or more Children | 0 (0.0%) | 0 (0.0%) |
| Total | 0 (0.0%) | 11 (100.0%) |
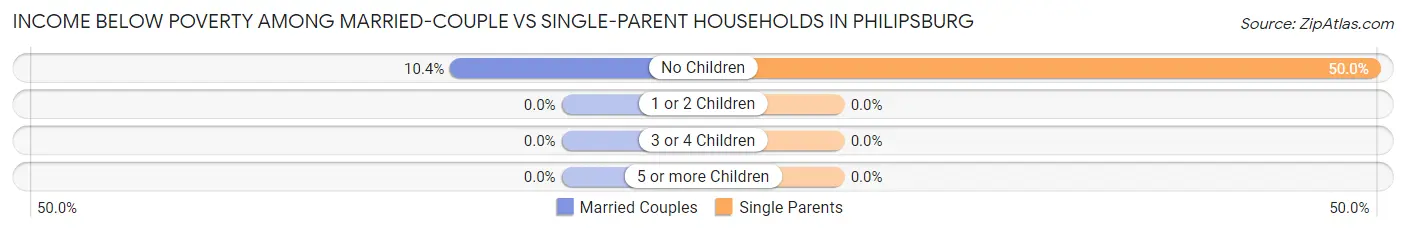
Income Below Poverty Among Married-Couple vs Single-Parent Households in Philipsburg
The poverty data for Philipsburg shows that 14 of the married-couple family households (8.2%) and 11 of the single-parent households (50.0%) are living below the poverty level. Within the married-couple family households, those with no children have the highest poverty rate, with 14 households (10.4%) falling below the poverty line. Among the single-parent households, those with no children have the highest poverty rate, with 11 household (50.0%) living below poverty.
| Children | Married-Couple Families | Single-Parent Households |
| No Children | 14 (10.4%) | 11 (50.0%) |
| 1 or 2 Children | 0 (0.0%) | 0 (0.0%) |
| 3 or 4 Children | 0 (0.0%) | 0 (0.0%) |
| 5 or more Children | 0 (0.0%) | 0 (0.0%) |
| Total | 14 (8.2%) | 11 (50.0%) |
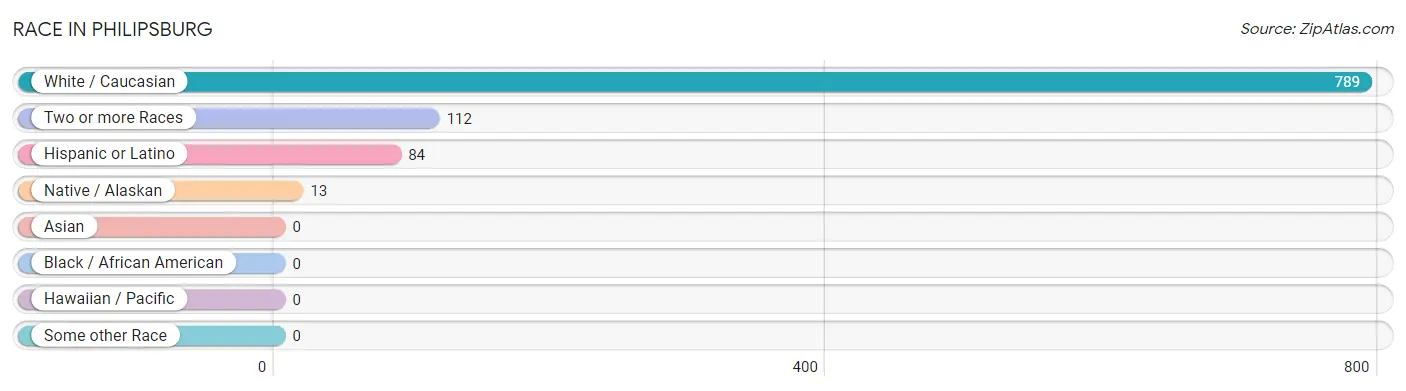
Race in Philipsburg
The most populous races in Philipsburg are White / Caucasian (789 | 86.3%), Two or more Races (112 | 12.2%), and Hispanic or Latino (84 | 9.2%).
| Race | # Population | % Population |
| Asian | 0 | 0.0% |
| Black / African American | 0 | 0.0% |
| Hawaiian / Pacific | 0 | 0.0% |
| Hispanic or Latino | 84 | 9.2% |
| Native / Alaskan | 13 | 1.4% |
| White / Caucasian | 789 | 86.3% |
| Two or more Races | 112 | 12.2% |
| Some other Race | 0 | 0.0% |
| Total | 914 | 100.0% |
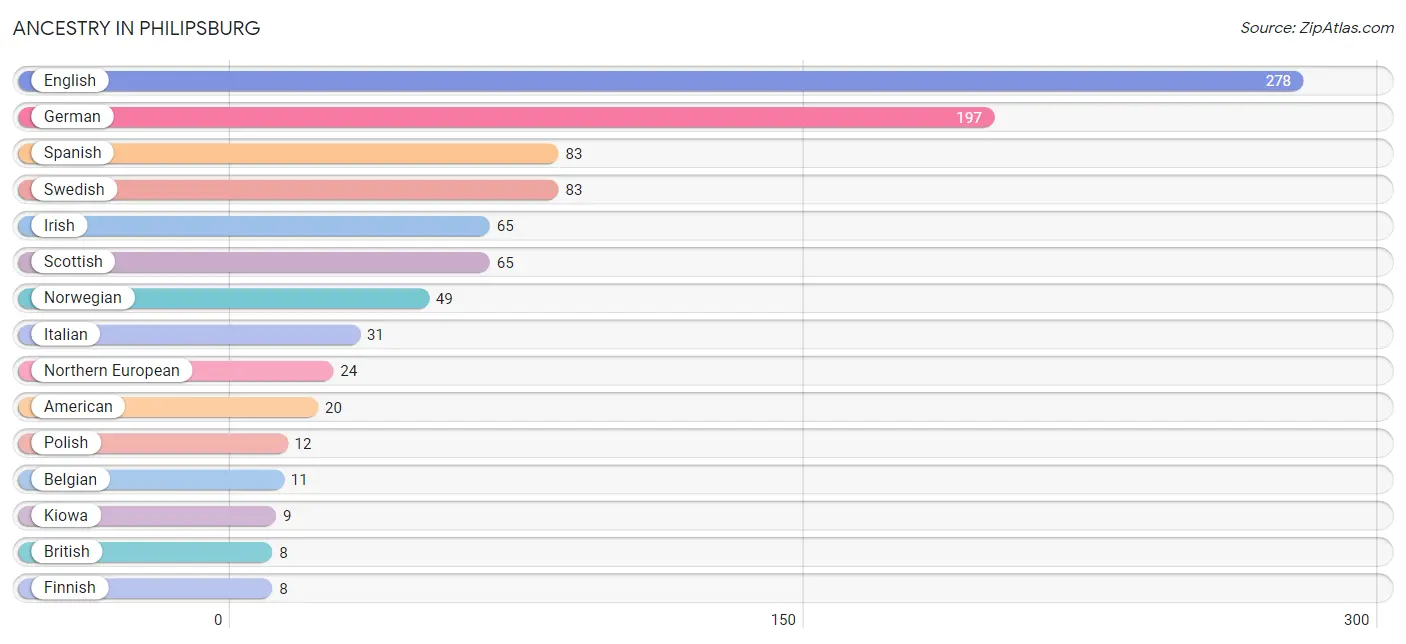
Ancestry in Philipsburg
The most populous ancestries reported in Philipsburg are English (278 | 30.4%), German (197 | 21.5%), Spanish (83 | 9.1%), Swedish (83 | 9.1%), and Irish (65 | 7.1%), together accounting for 77.2% of all Philipsburg residents.
| Ancestry | # Population | % Population |
| American | 20 | 2.2% |
| Belgian | 11 | 1.2% |
| British | 8 | 0.9% |
| Cheyenne | 6 | 0.7% |
| Chippewa | 5 | 0.5% |
| Crow | 1 | 0.1% |
| English | 278 | 30.4% |
| Finnish | 8 | 0.9% |
| French | 8 | 0.9% |
| French Canadian | 8 | 0.9% |
| German | 197 | 21.5% |
| Irish | 65 | 7.1% |
| Italian | 31 | 3.4% |
| Kiowa | 9 | 1.0% |
| Mexican | 1 | 0.1% |
| Northern European | 24 | 2.6% |
| Norwegian | 49 | 5.4% |
| Polish | 12 | 1.3% |
| Scotch-Irish | 5 | 0.5% |
| Scottish | 65 | 7.1% |
| Spanish | 83 | 9.1% |
| Swedish | 83 | 9.1% | View All 22 Rows |
Immigrants in Philipsburg
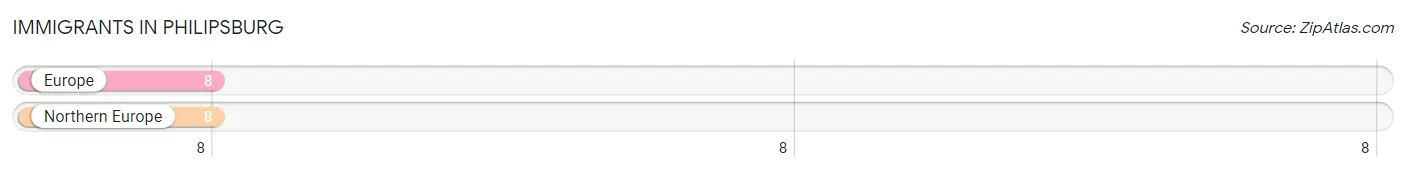
The most numerous immigrant groups reported in Philipsburg came from Europe (8 | 0.9%), and Northern Europe (8 | 0.9%), together accounting for 1.8% of all Philipsburg residents.
| Immigration Origin | # Population | % Population |
| Europe | 8 | 0.9% |
| Northern Europe | 8 | 0.9% | View All 2 Rows |
Sex and Age in Philipsburg
Sex and Age in Philipsburg
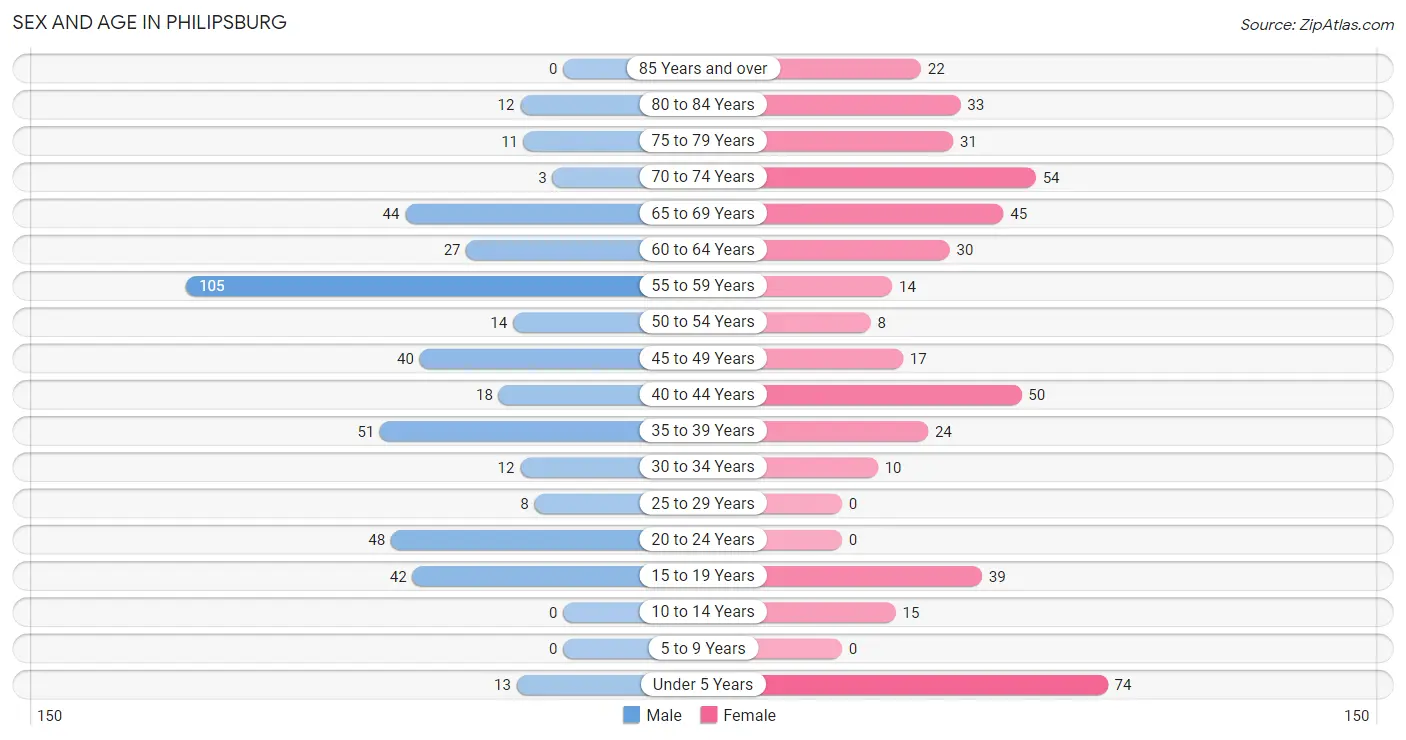
The most populous age groups in Philipsburg are 55 to 59 Years (105 | 23.4%) for men and Under 5 Years (74 | 15.9%) for women.
| Age Bracket | Male | Female |
| Under 5 Years | 13 (2.9%) | 74 (15.9%) |
| 5 to 9 Years | 0 (0.0%) | 0 (0.0%) |
| 10 to 14 Years | 0 (0.0%) | 15 (3.2%) |
| 15 to 19 Years | 42 (9.4%) | 39 (8.4%) |
| 20 to 24 Years | 48 (10.7%) | 0 (0.0%) |
| 25 to 29 Years | 8 (1.8%) | 0 (0.0%) |
| 30 to 34 Years | 12 (2.7%) | 10 (2.1%) |
| 35 to 39 Years | 51 (11.4%) | 24 (5.1%) |
| 40 to 44 Years | 18 (4.0%) | 50 (10.7%) |
| 45 to 49 Years | 40 (8.9%) | 17 (3.6%) |
| 50 to 54 Years | 14 (3.1%) | 8 (1.7%) |
| 55 to 59 Years | 105 (23.4%) | 14 (3.0%) |
| 60 to 64 Years | 27 (6.0%) | 30 (6.4%) |
| 65 to 69 Years | 44 (9.8%) | 45 (9.7%) |
| 70 to 74 Years | 3 (0.7%) | 54 (11.6%) |
| 75 to 79 Years | 11 (2.5%) | 31 (6.7%) |
| 80 to 84 Years | 12 (2.7%) | 33 (7.1%) |
| 85 Years and over | 0 (0.0%) | 22 (4.7%) |
| Total | 448 (100.0%) | 466 (100.0%) |
Families and Households in Philipsburg
Median Family Size in Philipsburg
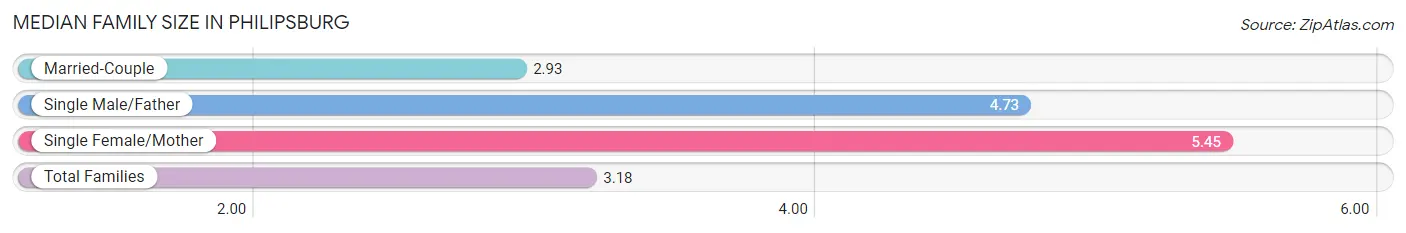
The median family size in Philipsburg is 3.18 persons per family, with single female/mother families (11 | 5.7%) accounting for the largest median family size of 5.45 persons per family. On the other hand, married-couple families (171 | 88.6%) represent the smallest median family size with 2.93 persons per family.
| Family Type | # Families | Family Size |
| Married-Couple | 171 (88.6%) | 2.93 |
| Single Male/Father | 11 (5.7%) | 4.73 |
| Single Female/Mother | 11 (5.7%) | 5.45 |
| Total Families | 193 (100.0%) | 3.18 |
Median Household Size in Philipsburg
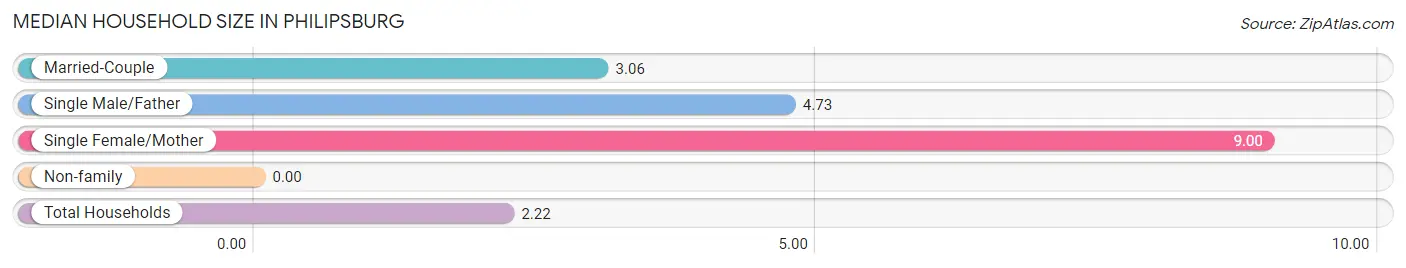
| Household Type | # Households | Household Size |
| Married-Couple | 171 (43.4%) | 3.06 |
| Single Male/Father | 11 (2.8%) | 4.73 |
| Single Female/Mother | 11 (2.8%) | 9.00 |
| Non-family | 201 (51.0%) | - |
| Total Households | 394 (100.0%) | 2.22 |
Household Size by Marriage Status in Philipsburg
Out of a total of 394 households in Philipsburg, 193 (49.0%) are family households, while 201 (51.0%) are nonfamily households. The most numerous type of family households are 2-person households, comprising 135, and the most common type of nonfamily households are 1-person households, comprising 201.
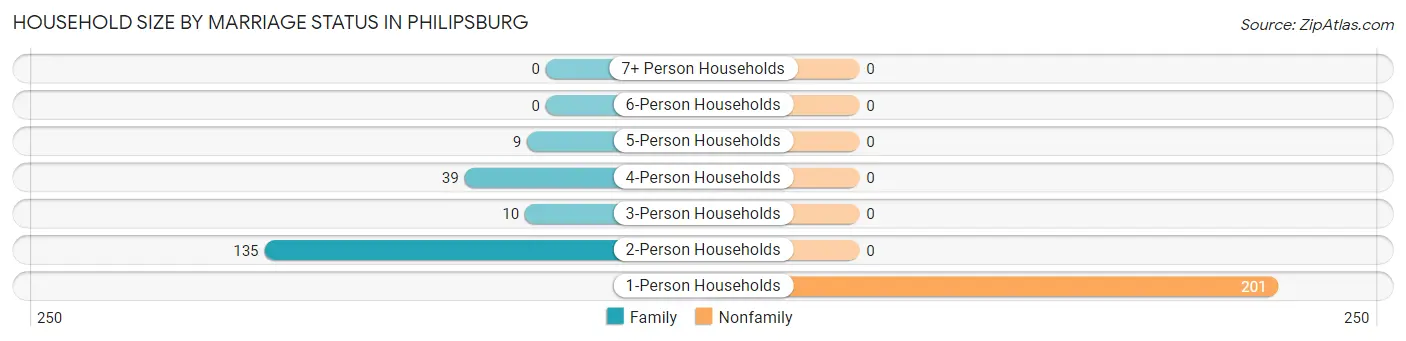
| Household Size | Family Households | Nonfamily Households |
| 1-Person Households | - | 201 (51.0%) |
| 2-Person Households | 135 (34.3%) | 0 (0.0%) |
| 3-Person Households | 10 (2.5%) | 0 (0.0%) |
| 4-Person Households | 39 (9.9%) | 0 (0.0%) |
| 5-Person Households | 9 (2.3%) | 0 (0.0%) |
| 6-Person Households | 0 (0.0%) | 0 (0.0%) |
| 7+ Person Households | 0 (0.0%) | 0 (0.0%) |
| Total | 193 (49.0%) | 201 (51.0%) |
Female Fertility in Philipsburg
Fertility by Age in Philipsburg
| Age Bracket | Women with Births | Births / 1,000 Women |
| 15 to 19 years | 0 (0.0%) | 0.0 |
| 20 to 34 years | 0 (0.0%) | 0.0 |
| 35 to 50 years | 0 (0.0%) | 0.0 |
| Total | 0 (0.0%) | 0.0 |
Fertility by Age by Marriage Status in Philipsburg
| Age Bracket | Married | Unmarried |
| 15 to 19 years | 0 (0.0%) | 0 (0.0%) |
| 20 to 34 years | 0 (0.0%) | 0 (0.0%) |
| 35 to 50 years | 0 (0.0%) | 0 (0.0%) |
| Total | 0 (0.0%) | 0 (0.0%) |
Fertility by Education in Philipsburg
| Educational Attainment | Women with Births | Births / 1,000 Women |
| Less than High School | 0 (0.0%) | 0.0 |
| High School Diploma | 0 (0.0%) | 0.0 |
| College or Associate's Degree | 0 (0.0%) | 0.0 |
| Bachelor's Degree | 0 (0.0%) | 0.0 |
| Graduate Degree | 0 (0.0%) | 0.0 |
| Total | 0 (0.0%) | 0.0 |
Fertility by Education by Marriage Status in Philipsburg
| Educational Attainment | Married | Unmarried |
| Less than High School | 0 (0.0%) | 0 (0.0%) |
| High School Diploma | 0 (0.0%) | 0 (0.0%) |
| College or Associate's Degree | 0 (0.0%) | 0 (0.0%) |
| Bachelor's Degree | 0 (0.0%) | 0 (0.0%) |
| Graduate Degree | 0 (0.0%) | 0 (0.0%) |
| Total | 0 (0.0%) | 0 (0.0%) |
Employment Characteristics in Philipsburg
Employment by Class of Employer in Philipsburg
Among the 340 employed individuals in Philipsburg, private company employees (218 | 64.1%), self-employed (not incorporated) (56 | 16.5%), and self-employed (incorporated) (41 | 12.1%) make up the most common classes of employment.
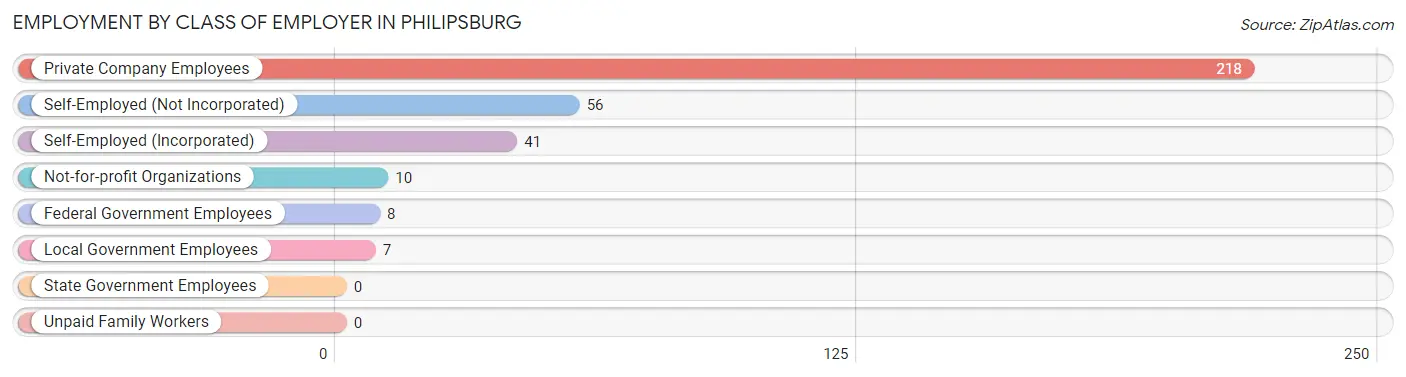
| Employer Class | # Employees | % Employees |
| Private Company Employees | 218 | 64.1% |
| Self-Employed (Incorporated) | 41 | 12.1% |
| Self-Employed (Not Incorporated) | 56 | 16.5% |
| Not-for-profit Organizations | 10 | 2.9% |
| Local Government Employees | 7 | 2.1% |
| State Government Employees | 0 | 0.0% |
| Federal Government Employees | 8 | 2.4% |
| Unpaid Family Workers | 0 | 0.0% |
| Total | 340 | 100.0% |
Employment Status by Age in Philipsburg
According to the labor force statistics for Philipsburg, out of the total population over 16 years of age (812), 49.9% or 405 individuals are in the labor force, with 13.8% or 56 of them unemployed. The age group with the highest labor force participation rate is 20 to 24 years, with 97.9% or 47 individuals in the labor force. Within the labor force, the 55 to 59 years age range has the highest percentage of unemployed individuals, with 41.4% or 12 of them being unemployed.
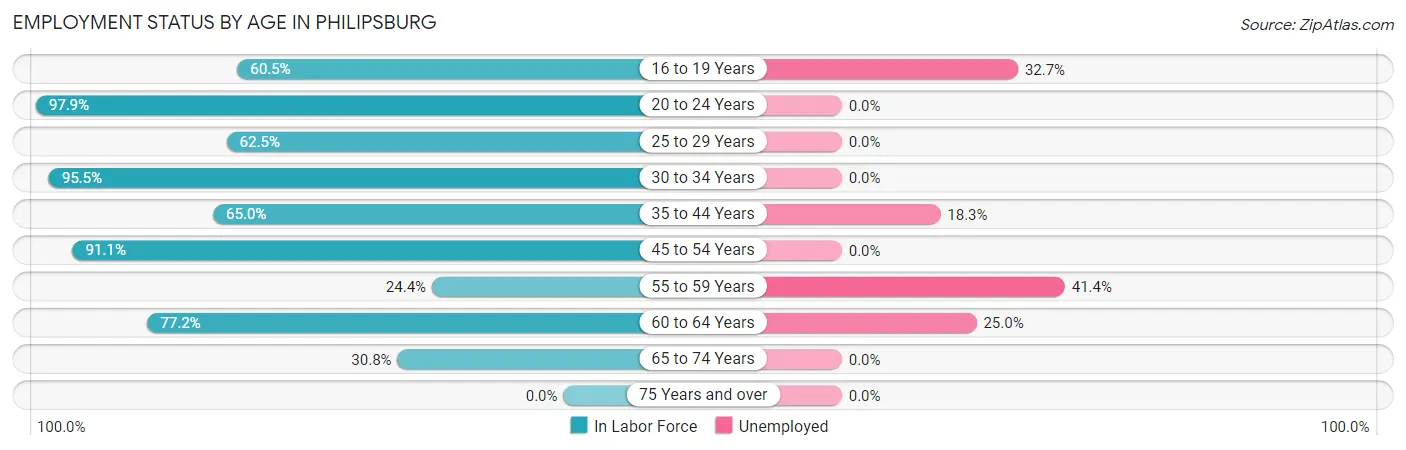
| Age Bracket | In Labor Force | Unemployed |
| 16 to 19 Years | 49 (60.5%) | 16 (32.7%) |
| 20 to 24 Years | 47 (97.9%) | 0 (0.0%) |
| 25 to 29 Years | 5 (62.5%) | 0 (0.0%) |
| 30 to 34 Years | 21 (95.5%) | 0 (0.0%) |
| 35 to 44 Years | 93 (65.0%) | 17 (18.3%) |
| 45 to 54 Years | 72 (91.1%) | 0 (0.0%) |
| 55 to 59 Years | 29 (24.4%) | 12 (41.4%) |
| 60 to 64 Years | 44 (77.2%) | 11 (25.0%) |
| 65 to 74 Years | 45 (30.8%) | 0 (0.0%) |
| 75 Years and over | 0 (0.0%) | 0 (0.0%) |
| Total | 405 (49.9%) | 56 (13.8%) |
Employment Status by Educational Attainment in Philipsburg
According to labor force statistics for Philipsburg, 61.7% of individuals (264) out of the total population between 25 and 64 years of age (428) are in the labor force, with 15.2% or 40 of them being unemployed. The group with the highest labor force participation rate are those with the educational attainment of bachelor's degree or higher, with 91.9% or 68 individuals in the labor force. Within the labor force, individuals with college / associate degree education have the highest percentage of unemployment, with 26.6% or 29 of them being unemployed.
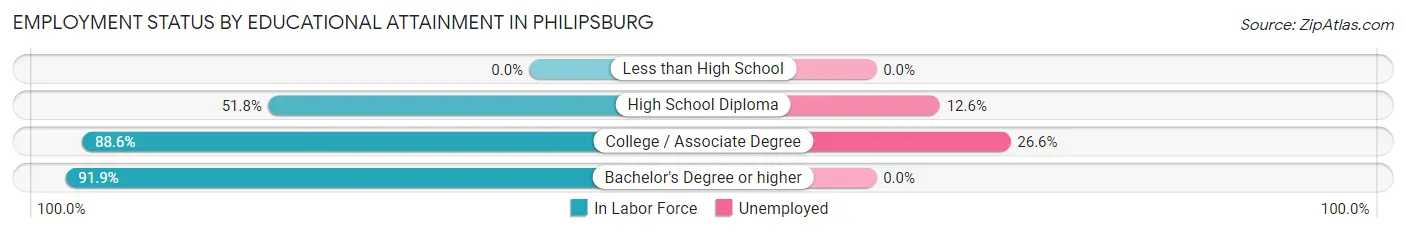
| Educational Attainment | In Labor Force | Unemployed |
| Less than High School | 0 (0.0%) | 0 (0.0%) |
| High School Diploma | 87 (51.8%) | 21 (12.6%) |
| College / Associate Degree | 109 (88.6%) | 33 (26.6%) |
| Bachelor's Degree or higher | 68 (91.9%) | 0 (0.0%) |
| Total | 264 (61.7%) | 65 (15.2%) |
Employment Occupations by Sex in Philipsburg
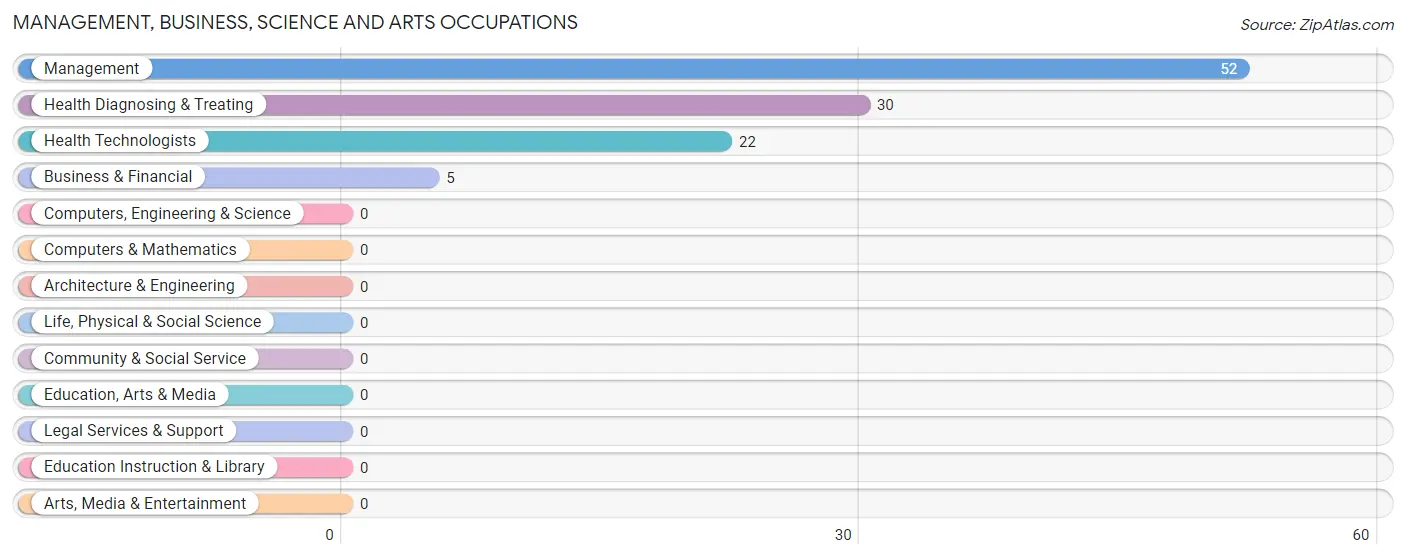
Management, Business, Science and Arts Occupations
The most common Management, Business, Science and Arts occupations in Philipsburg are Management (52 | 14.9%), Health Diagnosing & Treating (30 | 8.6%), Health Technologists (22 | 6.3%), and Business & Financial (5 | 1.4%).
Management, Business, Science and Arts Occupations by Sex
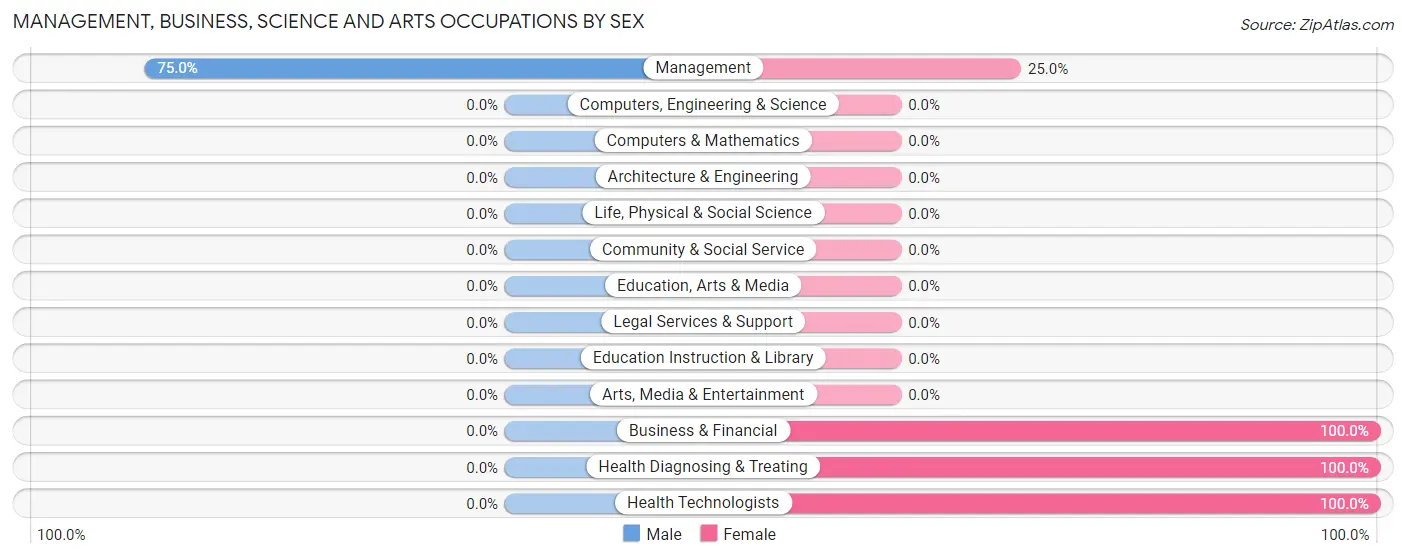
| Occupation | Male | Female |
| Management | 39 (75.0%) | 13 (25.0%) |
| Business & Financial | 0 (0.0%) | 5 (100.0%) |
| Computers, Engineering & Science | 0 (0.0%) | 0 (0.0%) |
| Computers & Mathematics | 0 (0.0%) | 0 (0.0%) |
| Architecture & Engineering | 0 (0.0%) | 0 (0.0%) |
| Life, Physical & Social Science | 0 (0.0%) | 0 (0.0%) |
| Community & Social Service | 0 (0.0%) | 0 (0.0%) |
| Education, Arts & Media | 0 (0.0%) | 0 (0.0%) |
| Legal Services & Support | 0 (0.0%) | 0 (0.0%) |
| Education Instruction & Library | 0 (0.0%) | 0 (0.0%) |
| Arts, Media & Entertainment | 0 (0.0%) | 0 (0.0%) |
| Health Diagnosing & Treating | 0 (0.0%) | 30 (100.0%) |
| Health Technologists | 0 (0.0%) | 22 (100.0%) |
| Total (Category) | 39 (44.8%) | 48 (55.2%) |
| Total (Overall) | 188 (53.9%) | 161 (46.1%) |
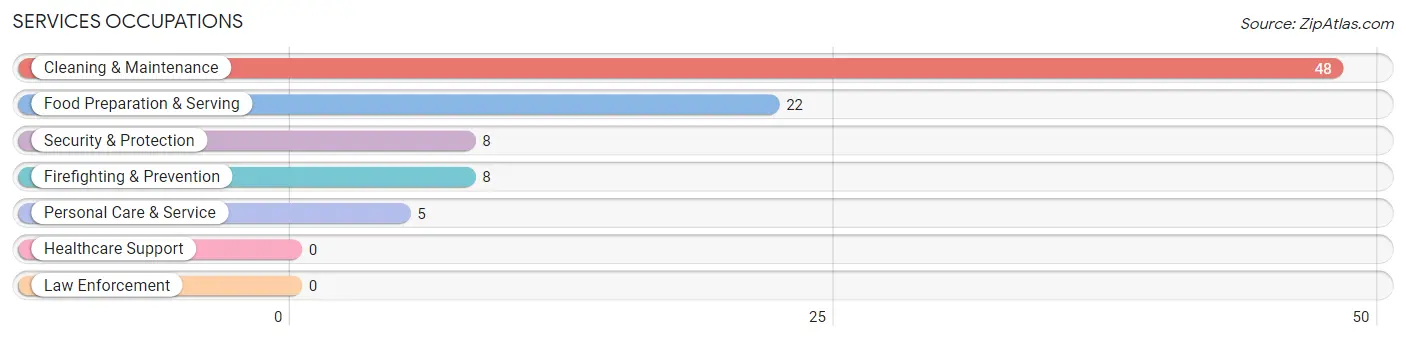
Services Occupations
The most common Services occupations in Philipsburg are Cleaning & Maintenance (48 | 13.8%), Food Preparation & Serving (22 | 6.3%), Security & Protection (8 | 2.3%), Firefighting & Prevention (8 | 2.3%), and Personal Care & Service (5 | 1.4%).
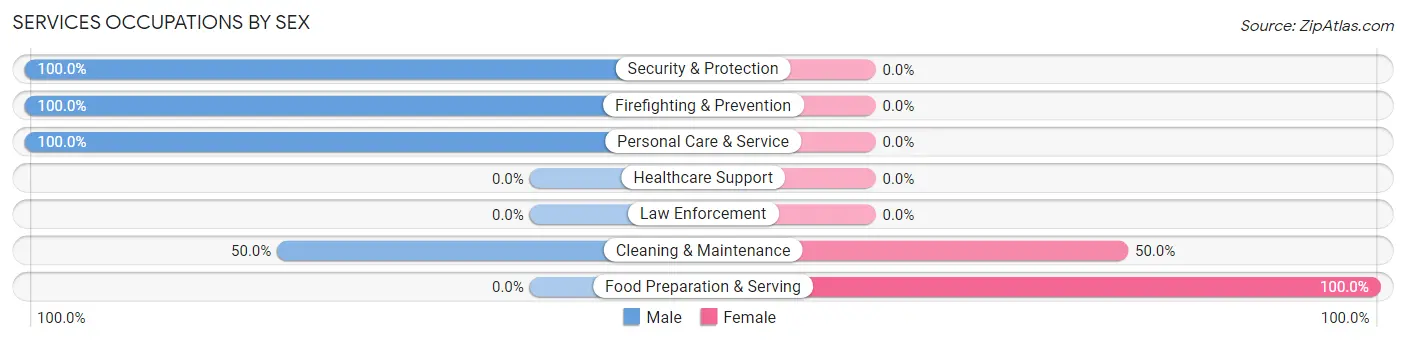
Services Occupations by Sex
Within the Services occupations in Philipsburg, the most male-oriented occupations are Security & Protection (100.0%), Firefighting & Prevention (100.0%), and Personal Care & Service (100.0%), while the most female-oriented occupations are Food Preparation & Serving (100.0%), and Cleaning & Maintenance (50.0%).
| Occupation | Male | Female |
| Healthcare Support | 0 (0.0%) | 0 (0.0%) |
| Security & Protection | 8 (100.0%) | 0 (0.0%) |
| Firefighting & Prevention | 8 (100.0%) | 0 (0.0%) |
| Law Enforcement | 0 (0.0%) | 0 (0.0%) |
| Food Preparation & Serving | 0 (0.0%) | 22 (100.0%) |
| Cleaning & Maintenance | 24 (50.0%) | 24 (50.0%) |
| Personal Care & Service | 5 (100.0%) | 0 (0.0%) |
| Total (Category) | 37 (44.6%) | 46 (55.4%) |
| Total (Overall) | 188 (53.9%) | 161 (46.1%) |
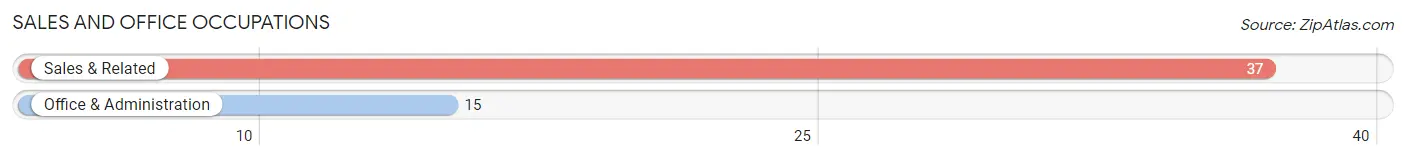
Sales and Office Occupations
The most common Sales and Office occupations in Philipsburg are Sales & Related (37 | 10.6%), and Office & Administration (15 | 4.3%).
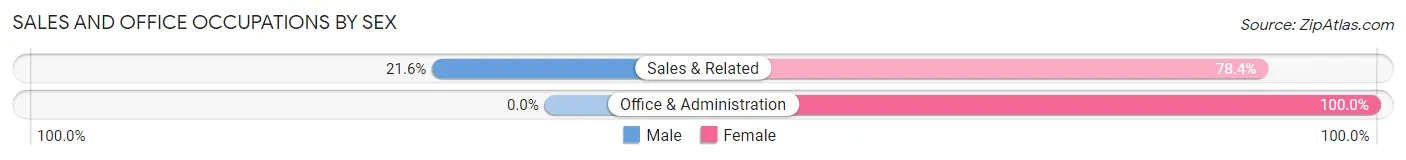
Sales and Office Occupations by Sex
| Occupation | Male | Female |
| Sales & Related | 8 (21.6%) | 29 (78.4%) |
| Office & Administration | 0 (0.0%) | 15 (100.0%) |
| Total (Category) | 8 (15.4%) | 44 (84.6%) |
| Total (Overall) | 188 (53.9%) | 161 (46.1%) |
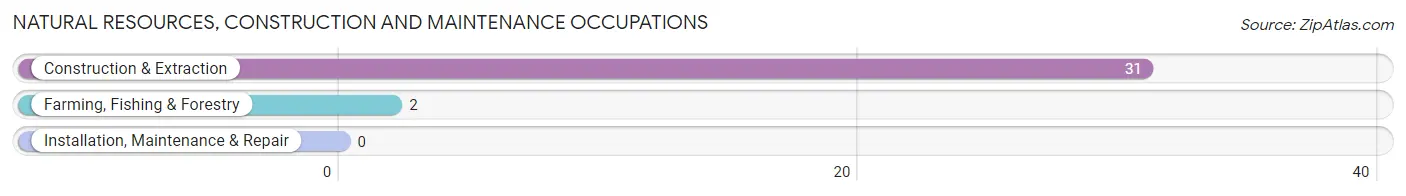
Natural Resources, Construction and Maintenance Occupations
The most common Natural Resources, Construction and Maintenance occupations in Philipsburg are Construction & Extraction (31 | 8.9%), and Farming, Fishing & Forestry (2 | 0.6%).
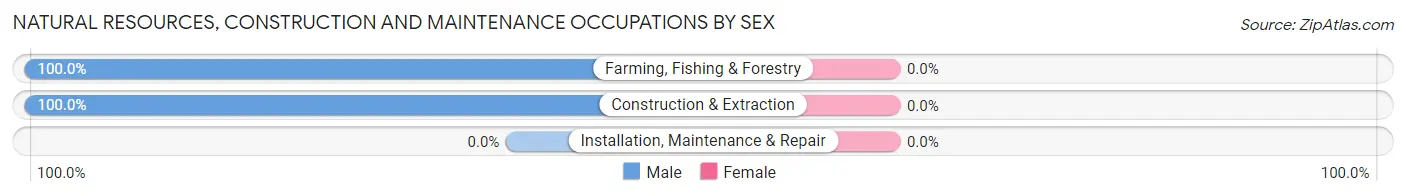
Natural Resources, Construction and Maintenance Occupations by Sex
| Occupation | Male | Female |
| Farming, Fishing & Forestry | 2 (100.0%) | 0 (0.0%) |
| Construction & Extraction | 31 (100.0%) | 0 (0.0%) |
| Installation, Maintenance & Repair | 0 (0.0%) | 0 (0.0%) |
| Total (Category) | 33 (100.0%) | 0 (0.0%) |
| Total (Overall) | 188 (53.9%) | 161 (46.1%) |
Production, Transportation and Moving Occupations
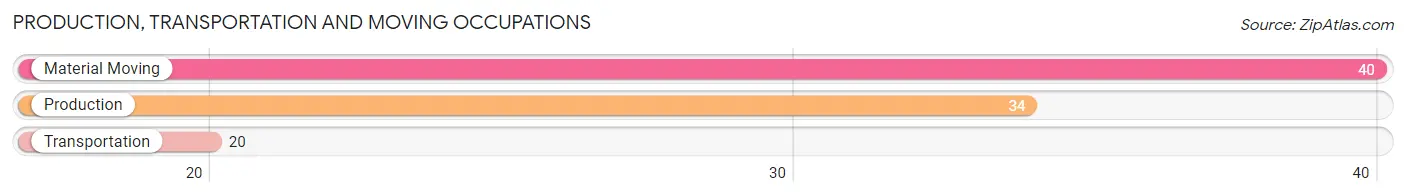
The most common Production, Transportation and Moving occupations in Philipsburg are Material Moving (40 | 11.5%), Production (34 | 9.7%), and Transportation (20 | 5.7%).
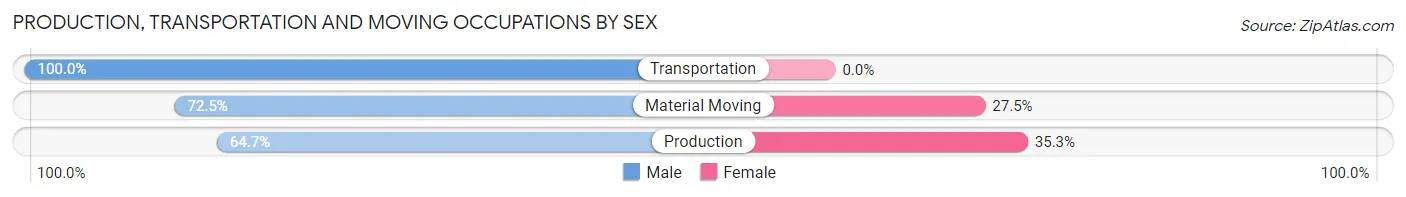
Production, Transportation and Moving Occupations by Sex
| Occupation | Male | Female |
| Production | 22 (64.7%) | 12 (35.3%) |
| Transportation | 20 (100.0%) | 0 (0.0%) |
| Material Moving | 29 (72.5%) | 11 (27.5%) |
| Total (Category) | 71 (75.5%) | 23 (24.5%) |
| Total (Overall) | 188 (53.9%) | 161 (46.1%) |
Employment Industries by Sex in Philipsburg
Employment Industries in Philipsburg
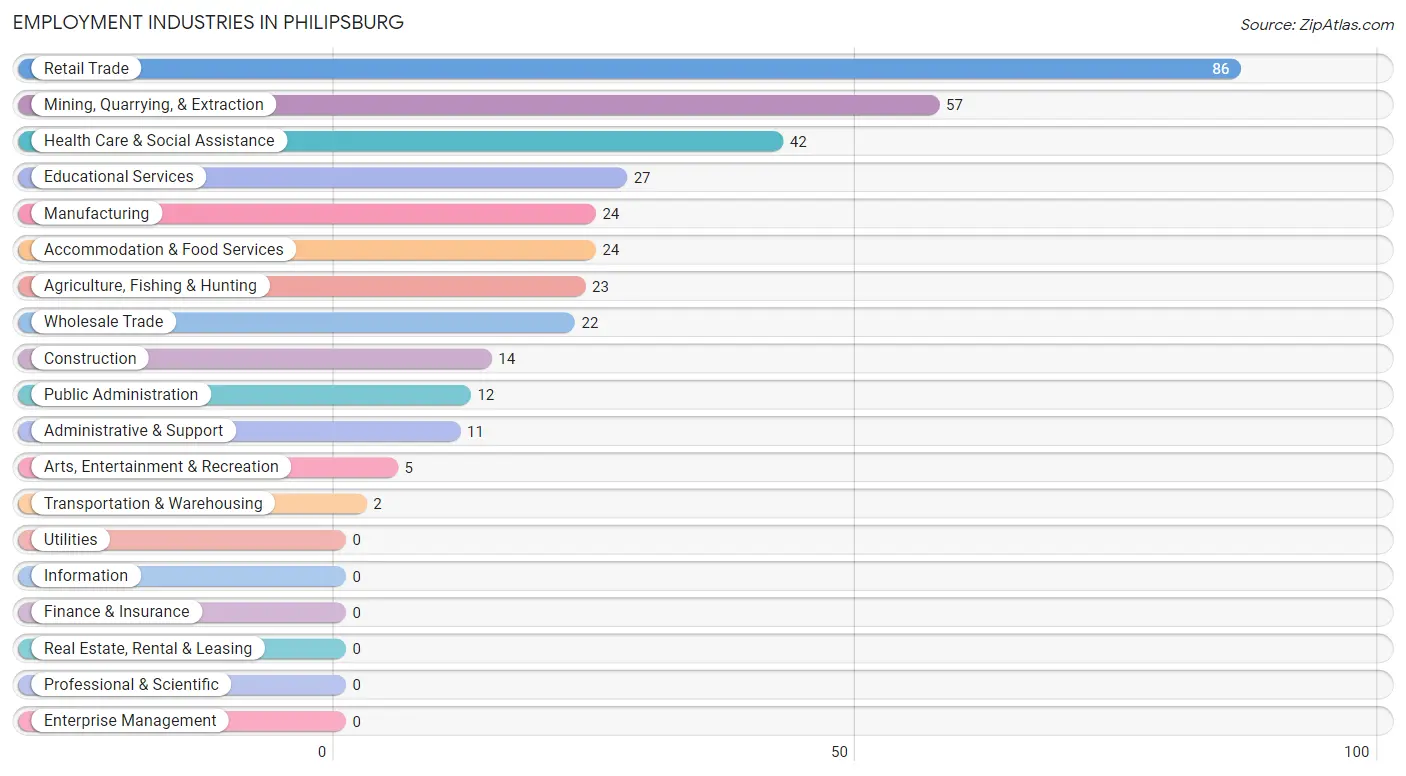
The major employment industries in Philipsburg include Retail Trade (86 | 24.6%), Mining, Quarrying, & Extraction (57 | 16.3%), Health Care & Social Assistance (42 | 12.0%), Educational Services (27 | 7.7%), and Manufacturing (24 | 6.9%).
Employment Industries by Sex in Philipsburg
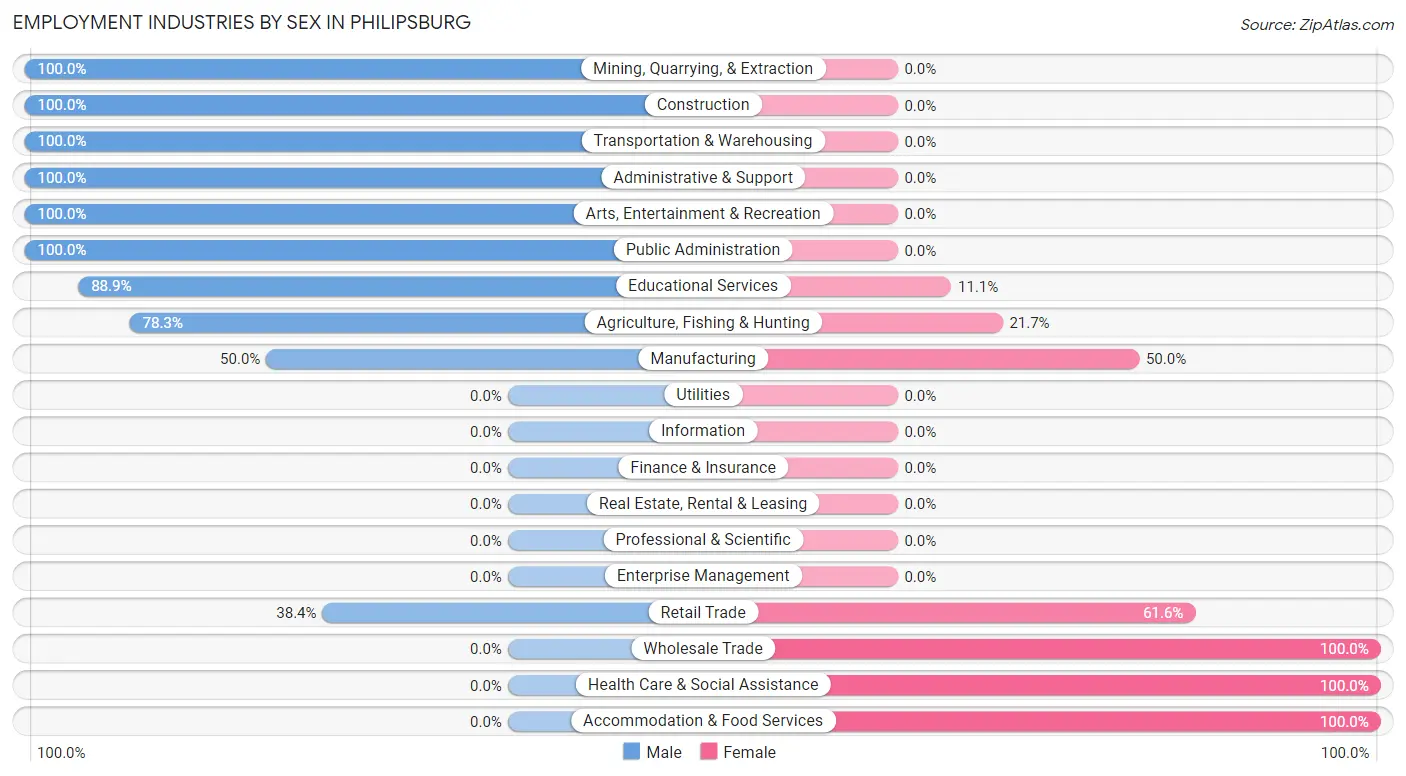
The Philipsburg industries that see more men than women are Mining, Quarrying, & Extraction (100.0%), Construction (100.0%), and Transportation & Warehousing (100.0%), whereas the industries that tend to have a higher number of women are Wholesale Trade (100.0%), Health Care & Social Assistance (100.0%), and Accommodation & Food Services (100.0%).
| Industry | Male | Female |
| Agriculture, Fishing & Hunting | 18 (78.3%) | 5 (21.7%) |
| Mining, Quarrying, & Extraction | 57 (100.0%) | 0 (0.0%) |
| Construction | 14 (100.0%) | 0 (0.0%) |
| Manufacturing | 12 (50.0%) | 12 (50.0%) |
| Wholesale Trade | 0 (0.0%) | 22 (100.0%) |
| Retail Trade | 33 (38.4%) | 53 (61.6%) |
| Transportation & Warehousing | 2 (100.0%) | 0 (0.0%) |
| Utilities | 0 (0.0%) | 0 (0.0%) |
| Information | 0 (0.0%) | 0 (0.0%) |
| Finance & Insurance | 0 (0.0%) | 0 (0.0%) |
| Real Estate, Rental & Leasing | 0 (0.0%) | 0 (0.0%) |
| Professional & Scientific | 0 (0.0%) | 0 (0.0%) |
| Enterprise Management | 0 (0.0%) | 0 (0.0%) |
| Administrative & Support | 11 (100.0%) | 0 (0.0%) |
| Educational Services | 24 (88.9%) | 3 (11.1%) |
| Health Care & Social Assistance | 0 (0.0%) | 42 (100.0%) |
| Arts, Entertainment & Recreation | 5 (100.0%) | 0 (0.0%) |
| Accommodation & Food Services | 0 (0.0%) | 24 (100.0%) |
| Public Administration | 12 (100.0%) | 0 (0.0%) |
| Total | 188 (53.9%) | 161 (46.1%) |
Education in Philipsburg
School Enrollment in Philipsburg
The most common levels of schooling among the 177 students in Philipsburg are nursery / preschool (74 | 41.8%), high school (66 | 37.3%), and graduate / professional (22 | 12.4%).
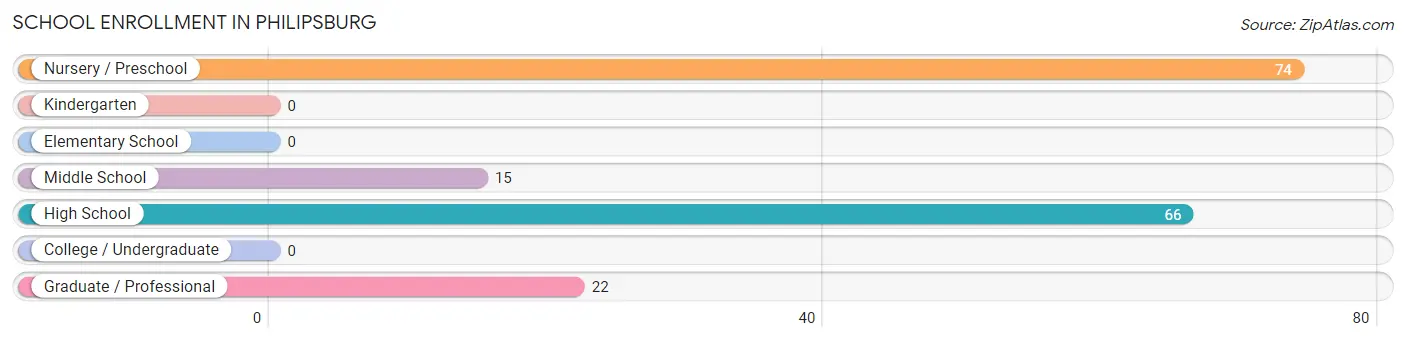
| School Level | # Students | % Students |
| Nursery / Preschool | 74 | 41.8% |
| Kindergarten | 0 | 0.0% |
| Elementary School | 0 | 0.0% |
| Middle School | 15 | 8.5% |
| High School | 66 | 37.3% |
| College / Undergraduate | 0 | 0.0% |
| Graduate / Professional | 22 | 12.4% |
| Total | 177 | 100.0% |
School Enrollment by Age by Funding Source in Philipsburg
Out of a total of 177 students who are enrolled in schools in Philipsburg, 74 (41.8%) attend a private institution, while the remaining 103 (58.2%) are enrolled in public schools. The age group of 3 to 4 year olds has the highest likelihood of being enrolled in private schools, with 74 (100.0% in the age bracket) enrolled. Conversely, the age group of 10 to 14 year olds has the lowest likelihood of being enrolled in a private school, with 15 (100.0% in the age bracket) attending a public institution.
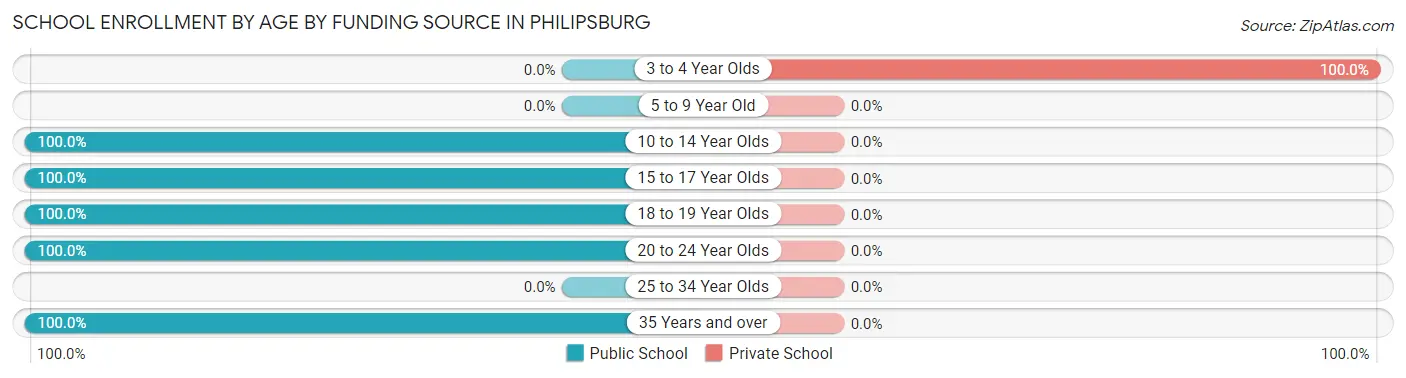
| Age Bracket | Public School | Private School |
| 3 to 4 Year Olds | 0 (0.0%) | 74 (100.0%) |
| 5 to 9 Year Old | 0 (0.0%) | 0 (0.0%) |
| 10 to 14 Year Olds | 15 (100.0%) | 0 (0.0%) |
| 15 to 17 Year Olds | 27 (100.0%) | 0 (0.0%) |
| 18 to 19 Year Olds | 38 (100.0%) | 0 (0.0%) |
| 20 to 24 Year Olds | 1 (100.0%) | 0 (0.0%) |
| 25 to 34 Year Olds | 0 (0.0%) | 0 (0.0%) |
| 35 Years and over | 22 (100.0%) | 0 (0.0%) |
| Total | 103 (58.2%) | 74 (41.8%) |
Educational Attainment by Field of Study in Philipsburg
Social sciences (46 | 19.9%), education (28 | 12.1%), business (25 | 10.8%), arts & humanities (24 | 10.4%), and communications (22 | 9.5%) are the most common fields of study among 231 individuals in Philipsburg who have obtained a bachelor's degree or higher.
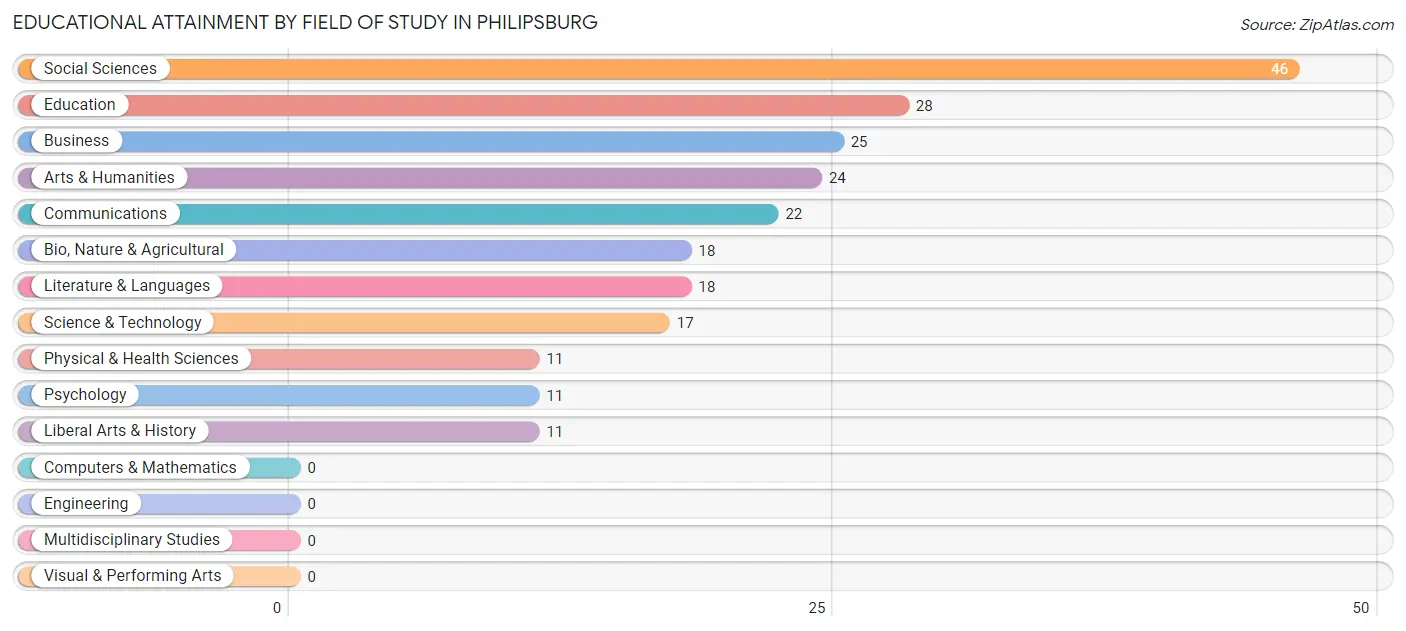
| Field of Study | # Graduates | % Graduates |
| Computers & Mathematics | 0 | 0.0% |
| Bio, Nature & Agricultural | 18 | 7.8% |
| Physical & Health Sciences | 11 | 4.8% |
| Psychology | 11 | 4.8% |
| Social Sciences | 46 | 19.9% |
| Engineering | 0 | 0.0% |
| Multidisciplinary Studies | 0 | 0.0% |
| Science & Technology | 17 | 7.4% |
| Business | 25 | 10.8% |
| Education | 28 | 12.1% |
| Literature & Languages | 18 | 7.8% |
| Liberal Arts & History | 11 | 4.8% |
| Visual & Performing Arts | 0 | 0.0% |
| Communications | 22 | 9.5% |
| Arts & Humanities | 24 | 10.4% |
| Total | 231 | 100.0% |
Transportation & Commute in Philipsburg
Vehicle Availability by Sex in Philipsburg
The most prevalent vehicle ownership categories in Philipsburg are males with 2 vehicles (80, accounting for 44.7%) and females with 2 vehicles (44, making up 49.7%).
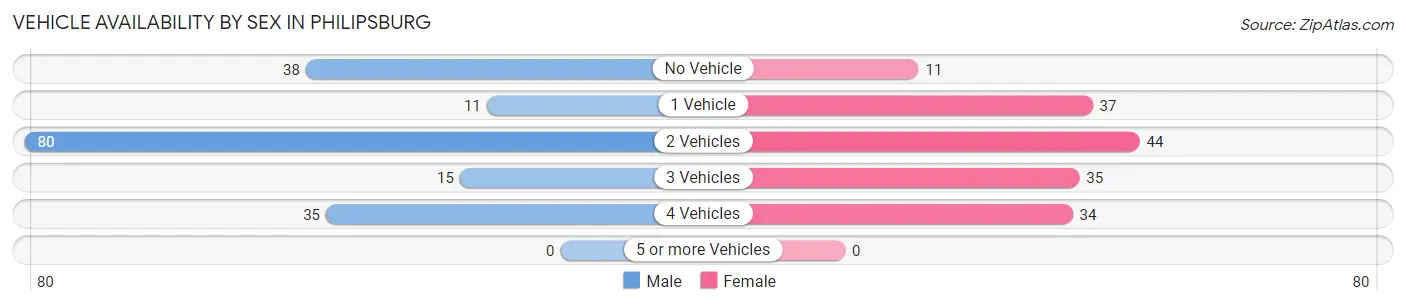
| Vehicles Available | Male | Female |
| No Vehicle | 38 (21.2%) | 11 (6.8%) |
| 1 Vehicle | 11 (6.1%) | 37 (23.0%) |
| 2 Vehicles | 80 (44.7%) | 44 (27.3%) |
| 3 Vehicles | 15 (8.4%) | 35 (21.7%) |
| 4 Vehicles | 35 (19.6%) | 34 (21.1%) |
| 5 or more Vehicles | 0 (0.0%) | 0 (0.0%) |
| Total | 179 (100.0%) | 161 (100.0%) |
Commute Time in Philipsburg
The most frequently occuring commute durations in Philipsburg are 5 to 9 minutes (137 commuters, 41.5%), 30 to 34 minutes (75 commuters, 22.7%), and 15 to 19 minutes (25 commuters, 7.6%).
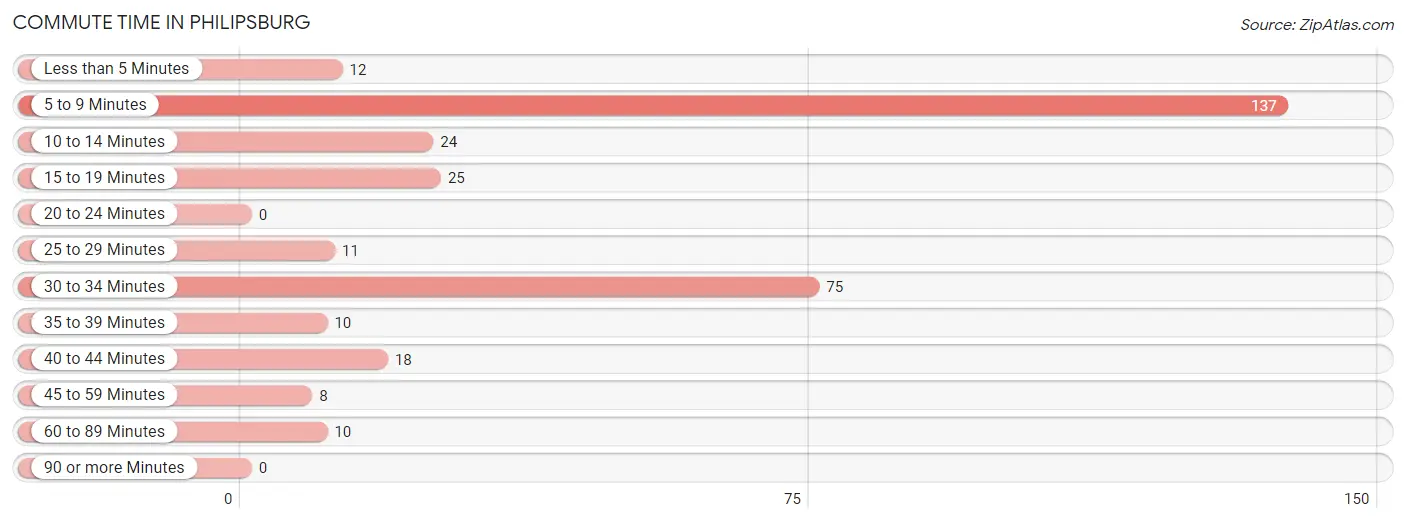
| Commute Time | # Commuters | % Commuters |
| Less than 5 Minutes | 12 | 3.6% |
| 5 to 9 Minutes | 137 | 41.5% |
| 10 to 14 Minutes | 24 | 7.3% |
| 15 to 19 Minutes | 25 | 7.6% |
| 20 to 24 Minutes | 0 | 0.0% |
| 25 to 29 Minutes | 11 | 3.3% |
| 30 to 34 Minutes | 75 | 22.7% |
| 35 to 39 Minutes | 10 | 3.0% |
| 40 to 44 Minutes | 18 | 5.4% |
| 45 to 59 Minutes | 8 | 2.4% |
| 60 to 89 Minutes | 10 | 3.0% |
| 90 or more Minutes | 0 | 0.0% |
Commute Time by Sex in Philipsburg
The most common commute times in Philipsburg are 5 to 9 minutes (57 commuters, 31.8%) for males and 5 to 9 minutes (80 commuters, 53.0%) for females.
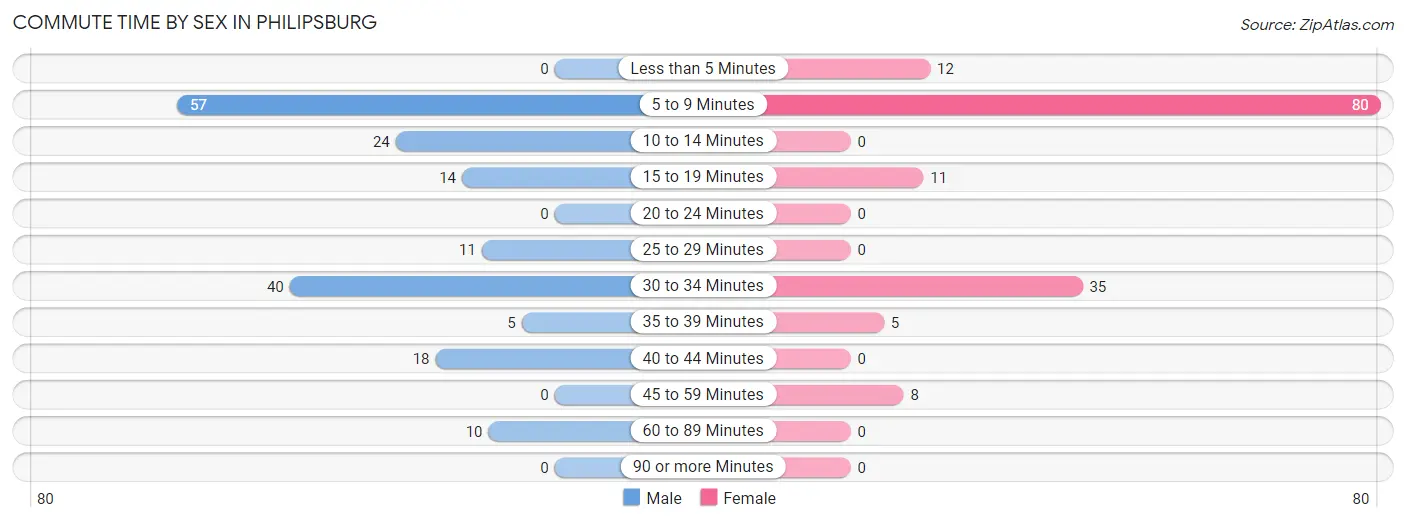
| Commute Time | Male | Female |
| Less than 5 Minutes | 0 (0.0%) | 12 (8.0%) |
| 5 to 9 Minutes | 57 (31.8%) | 80 (53.0%) |
| 10 to 14 Minutes | 24 (13.4%) | 0 (0.0%) |
| 15 to 19 Minutes | 14 (7.8%) | 11 (7.3%) |
| 20 to 24 Minutes | 0 (0.0%) | 0 (0.0%) |
| 25 to 29 Minutes | 11 (6.1%) | 0 (0.0%) |
| 30 to 34 Minutes | 40 (22.4%) | 35 (23.2%) |
| 35 to 39 Minutes | 5 (2.8%) | 5 (3.3%) |
| 40 to 44 Minutes | 18 (10.1%) | 0 (0.0%) |
| 45 to 59 Minutes | 0 (0.0%) | 8 (5.3%) |
| 60 to 89 Minutes | 10 (5.6%) | 0 (0.0%) |
| 90 or more Minutes | 0 (0.0%) | 0 (0.0%) |
Time of Departure to Work by Sex in Philipsburg
The most frequent times of departure to work in Philipsburg are 5:30 AM to 5:59 AM (38, 21.2%) for males and 9:00 AM to 9:59 AM (37, 24.5%) for females.
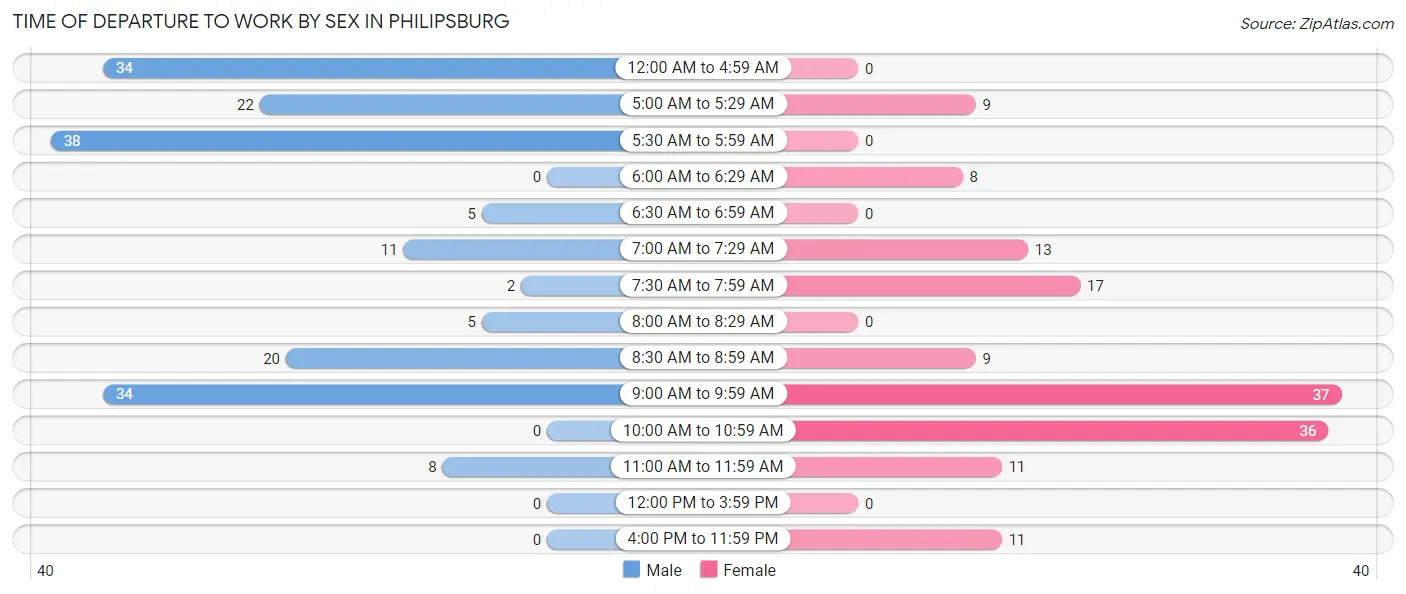
| Time of Departure | Male | Female |
| 12:00 AM to 4:59 AM | 34 (19.0%) | 0 (0.0%) |
| 5:00 AM to 5:29 AM | 22 (12.3%) | 9 (6.0%) |
| 5:30 AM to 5:59 AM | 38 (21.2%) | 0 (0.0%) |
| 6:00 AM to 6:29 AM | 0 (0.0%) | 8 (5.3%) |
| 6:30 AM to 6:59 AM | 5 (2.8%) | 0 (0.0%) |
| 7:00 AM to 7:29 AM | 11 (6.1%) | 13 (8.6%) |
| 7:30 AM to 7:59 AM | 2 (1.1%) | 17 (11.3%) |
| 8:00 AM to 8:29 AM | 5 (2.8%) | 0 (0.0%) |
| 8:30 AM to 8:59 AM | 20 (11.2%) | 9 (6.0%) |
| 9:00 AM to 9:59 AM | 34 (19.0%) | 37 (24.5%) |
| 10:00 AM to 10:59 AM | 0 (0.0%) | 36 (23.8%) |
| 11:00 AM to 11:59 AM | 8 (4.5%) | 11 (7.3%) |
| 12:00 PM to 3:59 PM | 0 (0.0%) | 0 (0.0%) |
| 4:00 PM to 11:59 PM | 0 (0.0%) | 11 (7.3%) |
| Total | 179 (100.0%) | 151 (100.0%) |
Housing Occupancy in Philipsburg
Occupancy by Ownership in Philipsburg
Of the total 394 dwellings in Philipsburg, owner-occupied units account for 214 (54.3%), while renter-occupied units make up 180 (45.7%).
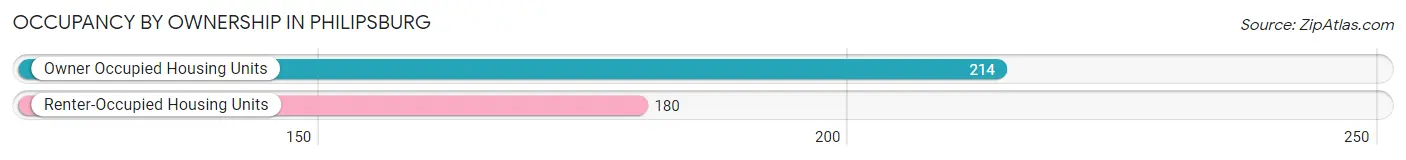
| Occupancy | # Housing Units | % Housing Units |
| Owner Occupied Housing Units | 214 | 54.3% |
| Renter-Occupied Housing Units | 180 | 45.7% |
| Total Occupied Housing Units | 394 | 100.0% |
Occupancy by Household Size in Philipsburg
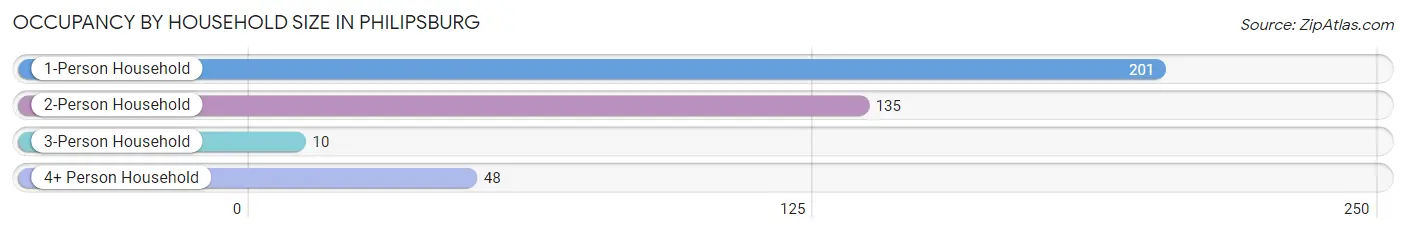
| Household Size | # Housing Units | % Housing Units |
| 1-Person Household | 201 | 51.0% |
| 2-Person Household | 135 | 34.3% |
| 3-Person Household | 10 | 2.5% |
| 4+ Person Household | 48 | 12.2% |
| Total Housing Units | 394 | 100.0% |
Occupancy by Ownership by Household Size in Philipsburg
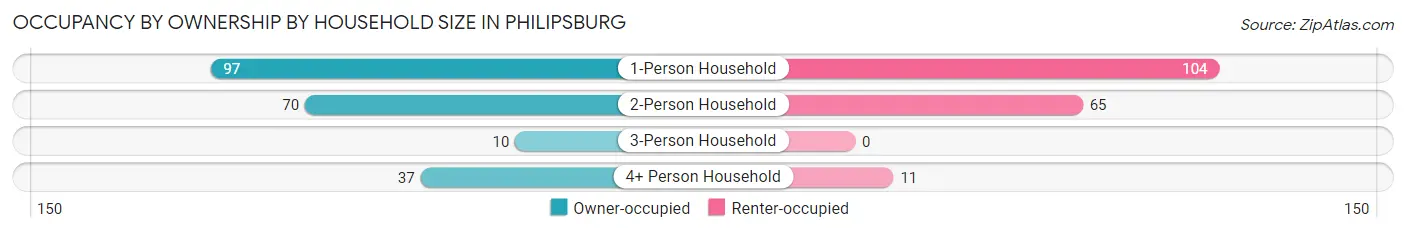
| Household Size | Owner-occupied | Renter-occupied |
| 1-Person Household | 97 (48.3%) | 104 (51.7%) |
| 2-Person Household | 70 (51.8%) | 65 (48.1%) |
| 3-Person Household | 10 (100.0%) | 0 (0.0%) |
| 4+ Person Household | 37 (77.1%) | 11 (22.9%) |
| Total Housing Units | 214 (54.3%) | 180 (45.7%) |
Occupancy by Educational Attainment in Philipsburg
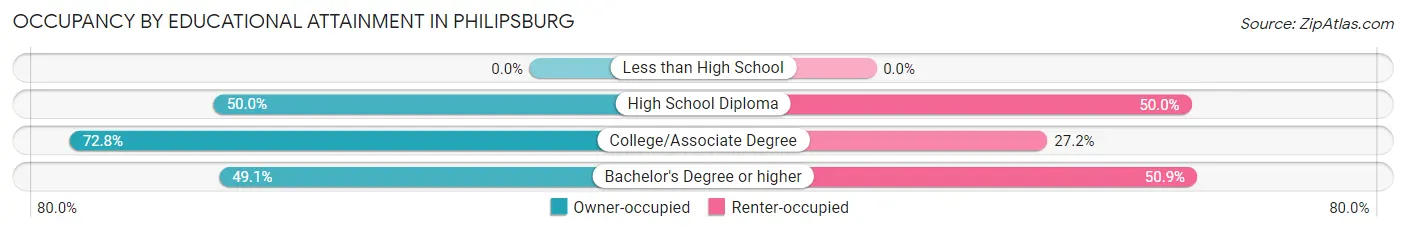
| Household Size | Owner-occupied | Renter-occupied |
| Less than High School | 0 (0.0%) | 0 (0.0%) |
| High School Diploma | 70 (50.0%) | 70 (50.0%) |
| College/Associate Degree | 59 (72.8%) | 22 (27.2%) |
| Bachelor's Degree or higher | 85 (49.1%) | 88 (50.9%) |
Occupancy by Age of Householder in Philipsburg
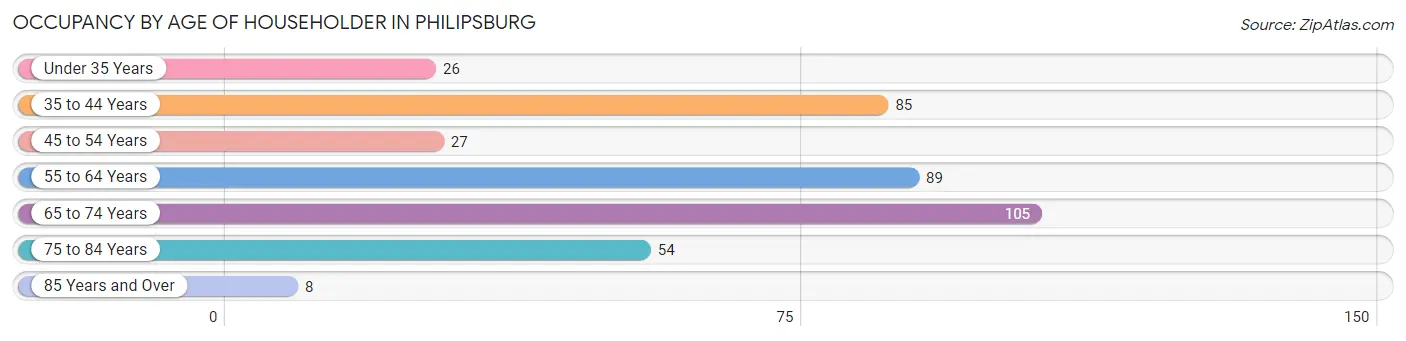
| Age Bracket | # Households | % Households |
| Under 35 Years | 26 | 6.6% |
| 35 to 44 Years | 85 | 21.6% |
| 45 to 54 Years | 27 | 6.9% |
| 55 to 64 Years | 89 | 22.6% |
| 65 to 74 Years | 105 | 26.7% |
| 75 to 84 Years | 54 | 13.7% |
| 85 Years and Over | 8 | 2.0% |
| Total | 394 | 100.0% |
Housing Finances in Philipsburg
Median Income by Occupancy in Philipsburg
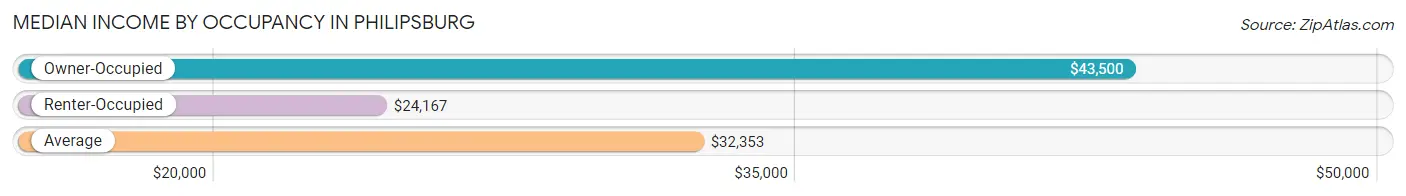
| Occupancy Type | # Households | Median Income |
| Owner-Occupied | 214 (54.3%) | $43,500 |
| Renter-Occupied | 180 (45.7%) | $24,167 |
| Average | 394 (100.0%) | $32,353 |
Occupancy by Householder Income Bracket in Philipsburg
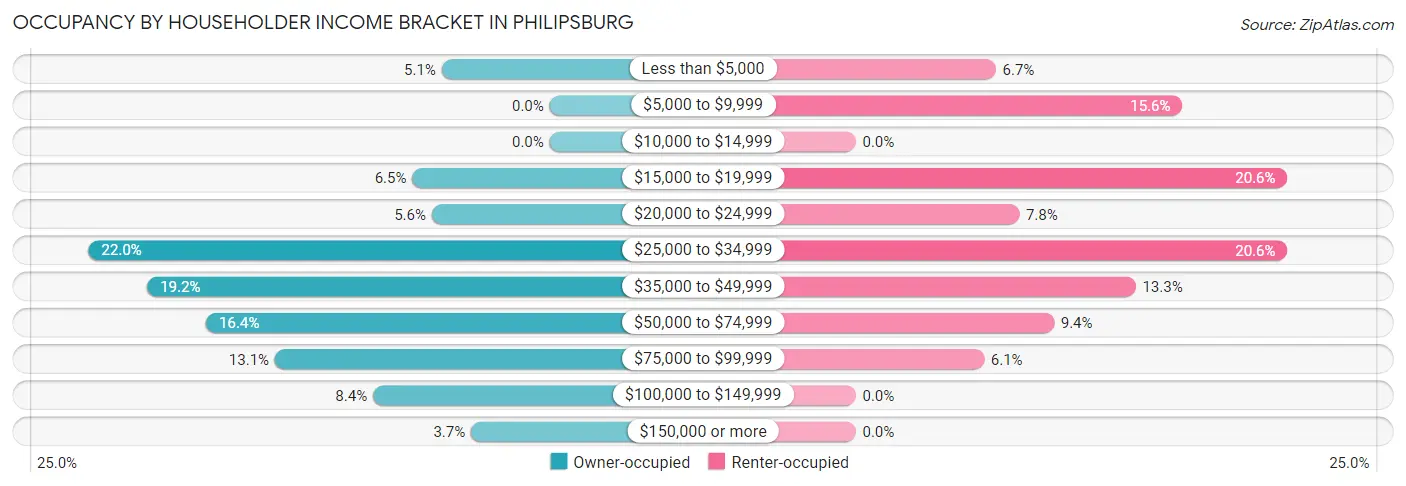
| Income Bracket | Owner-occupied | Renter-occupied |
| Less than $5,000 | 11 (5.1%) | 12 (6.7%) |
| $5,000 to $9,999 | 0 (0.0%) | 28 (15.6%) |
| $10,000 to $14,999 | 0 (0.0%) | 0 (0.0%) |
| $15,000 to $19,999 | 14 (6.5%) | 37 (20.6%) |
| $20,000 to $24,999 | 12 (5.6%) | 14 (7.8%) |
| $25,000 to $34,999 | 47 (22.0%) | 37 (20.6%) |
| $35,000 to $49,999 | 41 (19.2%) | 24 (13.3%) |
| $50,000 to $74,999 | 35 (16.4%) | 17 (9.4%) |
| $75,000 to $99,999 | 28 (13.1%) | 11 (6.1%) |
| $100,000 to $149,999 | 18 (8.4%) | 0 (0.0%) |
| $150,000 or more | 8 (3.7%) | 0 (0.0%) |
| Total | 214 (100.0%) | 180 (100.0%) |
Monthly Housing Cost Tiers in Philipsburg
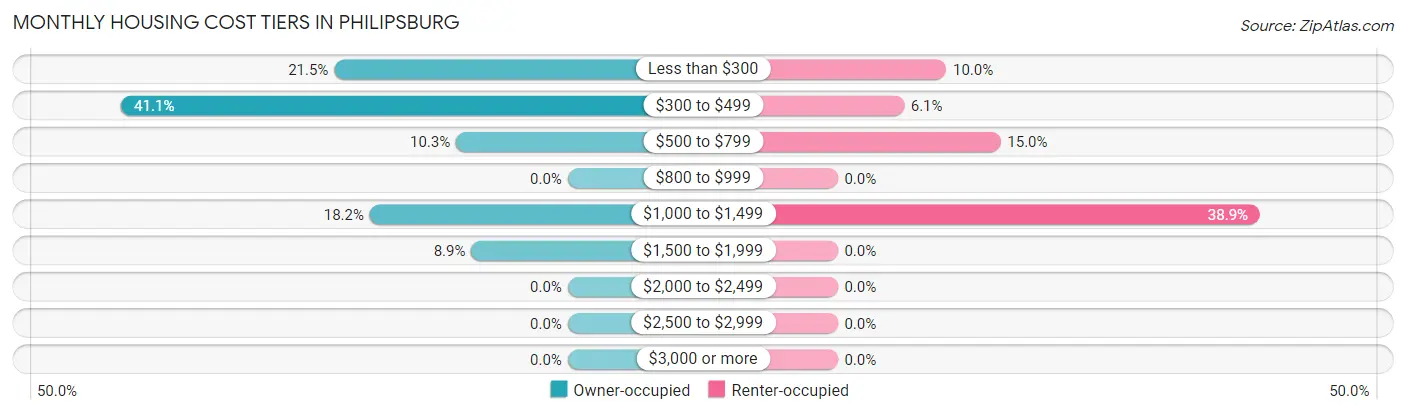
| Monthly Cost | Owner-occupied | Renter-occupied |
| Less than $300 | 46 (21.5%) | 18 (10.0%) |
| $300 to $499 | 88 (41.1%) | 11 (6.1%) |
| $500 to $799 | 22 (10.3%) | 27 (15.0%) |
| $800 to $999 | 0 (0.0%) | 0 (0.0%) |
| $1,000 to $1,499 | 39 (18.2%) | 70 (38.9%) |
| $1,500 to $1,999 | 19 (8.9%) | 0 (0.0%) |
| $2,000 to $2,499 | 0 (0.0%) | 0 (0.0%) |
| $2,500 to $2,999 | 0 (0.0%) | 0 (0.0%) |
| $3,000 or more | 0 (0.0%) | 0 (0.0%) |
| Total | 214 (100.0%) | 180 (100.0%) |
Physical Housing Characteristics in Philipsburg
Housing Structures in Philipsburg
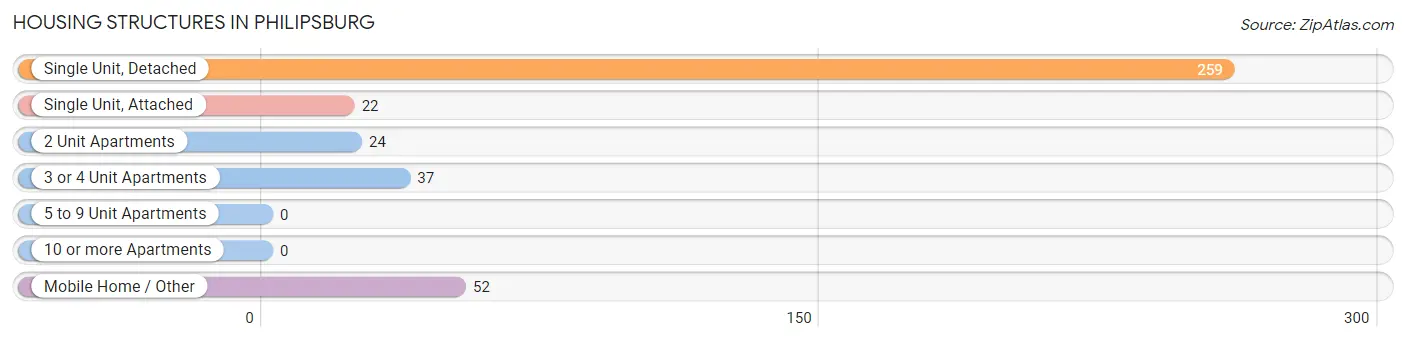
| Structure Type | # Housing Units | % Housing Units |
| Single Unit, Detached | 259 | 65.7% |
| Single Unit, Attached | 22 | 5.6% |
| 2 Unit Apartments | 24 | 6.1% |
| 3 or 4 Unit Apartments | 37 | 9.4% |
| 5 to 9 Unit Apartments | 0 | 0.0% |
| 10 or more Apartments | 0 | 0.0% |
| Mobile Home / Other | 52 | 13.2% |
| Total | 394 | 100.0% |
Housing Structures by Occupancy in Philipsburg
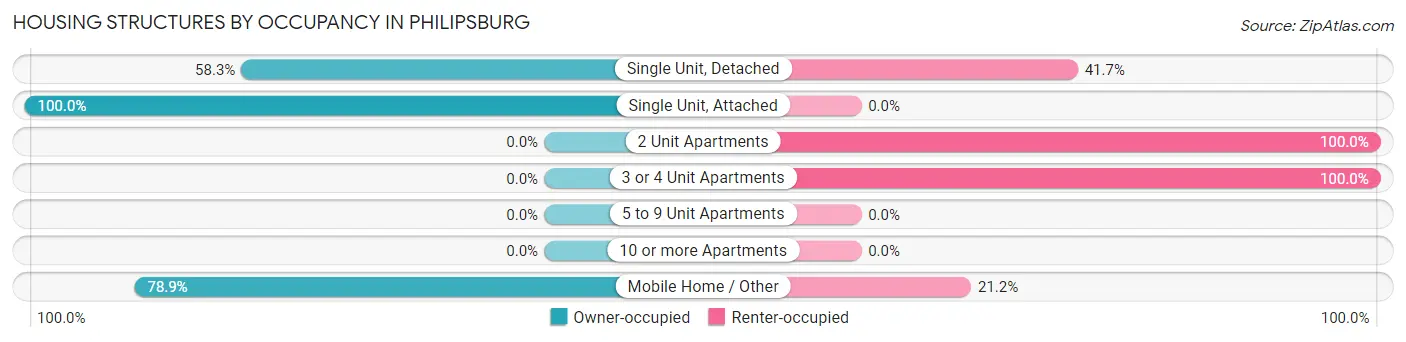
| Structure Type | Owner-occupied | Renter-occupied |
| Single Unit, Detached | 151 (58.3%) | 108 (41.7%) |
| Single Unit, Attached | 22 (100.0%) | 0 (0.0%) |
| 2 Unit Apartments | 0 (0.0%) | 24 (100.0%) |
| 3 or 4 Unit Apartments | 0 (0.0%) | 37 (100.0%) |
| 5 to 9 Unit Apartments | 0 (0.0%) | 0 (0.0%) |
| 10 or more Apartments | 0 (0.0%) | 0 (0.0%) |
| Mobile Home / Other | 41 (78.8%) | 11 (21.1%) |
| Total | 214 (54.3%) | 180 (45.7%) |
Housing Structures by Number of Rooms in Philipsburg
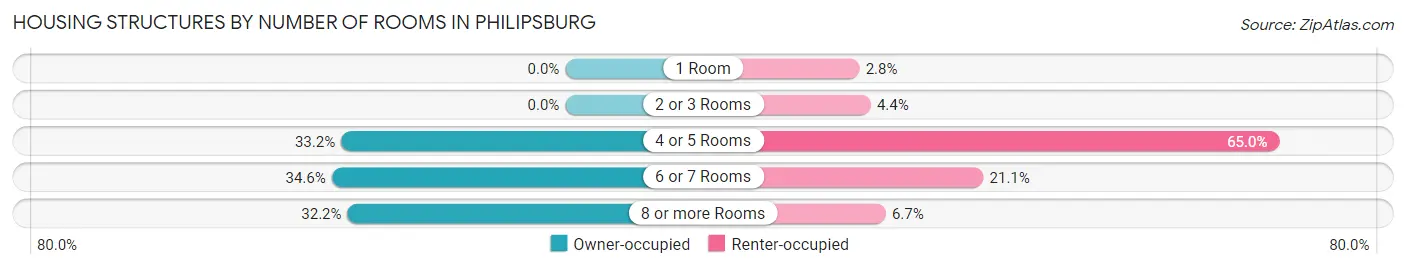
| Number of Rooms | Owner-occupied | Renter-occupied |
| 1 Room | 0 (0.0%) | 5 (2.8%) |
| 2 or 3 Rooms | 0 (0.0%) | 8 (4.4%) |
| 4 or 5 Rooms | 71 (33.2%) | 117 (65.0%) |
| 6 or 7 Rooms | 74 (34.6%) | 38 (21.1%) |
| 8 or more Rooms | 69 (32.2%) | 12 (6.7%) |
| Total | 214 (100.0%) | 180 (100.0%) |
Housing Structure by Heating Type in Philipsburg
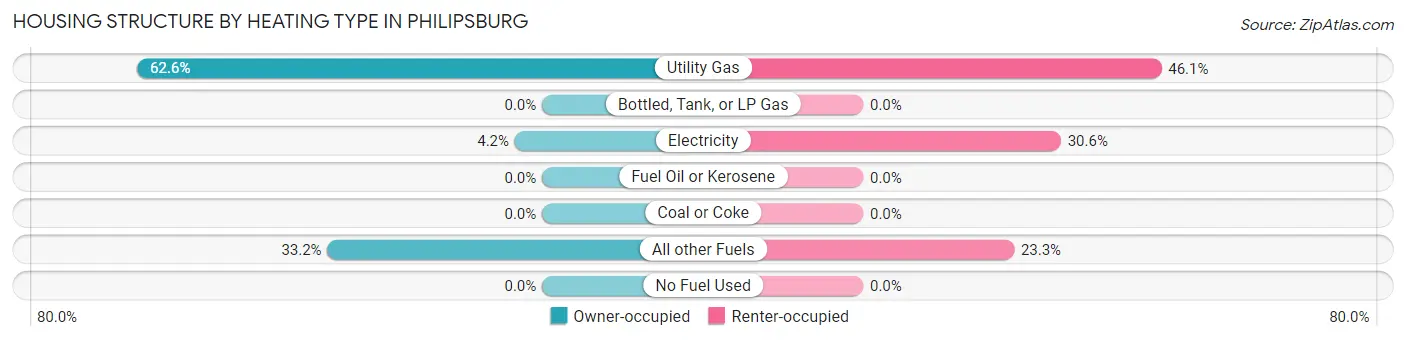
| Heating Type | Owner-occupied | Renter-occupied |
| Utility Gas | 134 (62.6%) | 83 (46.1%) |
| Bottled, Tank, or LP Gas | 0 (0.0%) | 0 (0.0%) |
| Electricity | 9 (4.2%) | 55 (30.6%) |
| Fuel Oil or Kerosene | 0 (0.0%) | 0 (0.0%) |
| Coal or Coke | 0 (0.0%) | 0 (0.0%) |
| All other Fuels | 71 (33.2%) | 42 (23.3%) |
| No Fuel Used | 0 (0.0%) | 0 (0.0%) |
| Total | 214 (100.0%) | 180 (100.0%) |
Household Vehicle Usage in Philipsburg
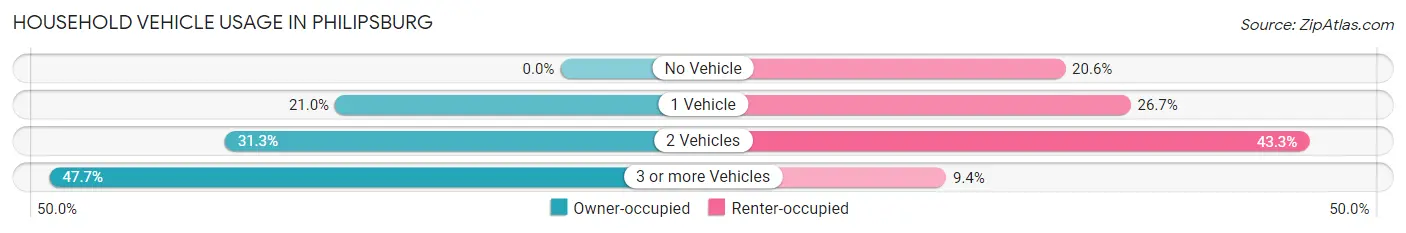
| Vehicles per Household | Owner-occupied | Renter-occupied |
| No Vehicle | 0 (0.0%) | 37 (20.6%) |
| 1 Vehicle | 45 (21.0%) | 48 (26.7%) |
| 2 Vehicles | 67 (31.3%) | 78 (43.3%) |
| 3 or more Vehicles | 102 (47.7%) | 17 (9.4%) |
| Total | 214 (100.0%) | 180 (100.0%) |
Real Estate & Mortgages in Philipsburg
Real Estate and Mortgage Overview in Philipsburg
| Characteristic | Without Mortgage | With Mortgage |
| Housing Units | 156 | 58 |
| Median Property Value | $156,800 | $227,800 |
| Median Household Income | $44,250 | $8 |
| Monthly Housing Costs | $364 | $0 |
| Real Estate Taxes | $1,367 | $15 |
Property Value by Mortgage Status in Philipsburg
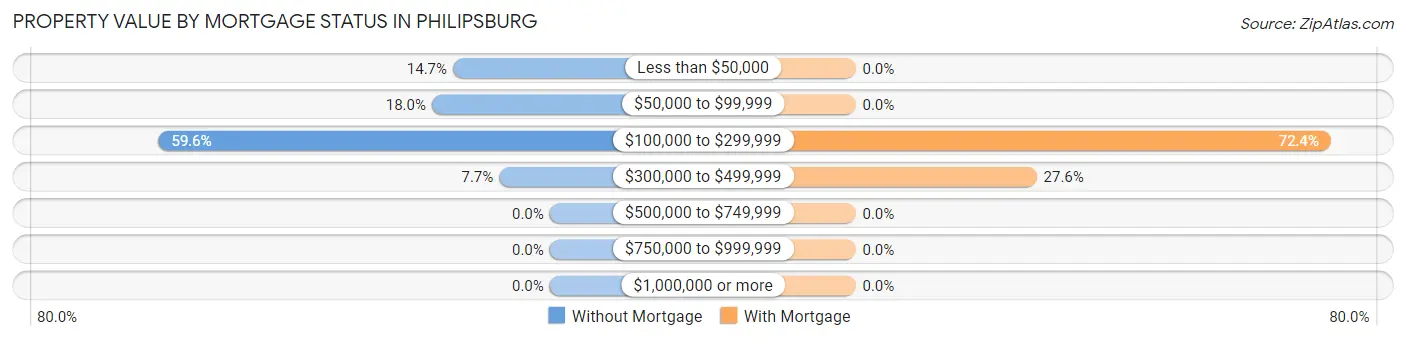
| Property Value | Without Mortgage | With Mortgage |
| Less than $50,000 | 23 (14.7%) | 0 (0.0%) |
| $50,000 to $99,999 | 28 (17.9%) | 0 (0.0%) |
| $100,000 to $299,999 | 93 (59.6%) | 42 (72.4%) |
| $300,000 to $499,999 | 12 (7.7%) | 16 (27.6%) |
| $500,000 to $749,999 | 0 (0.0%) | 0 (0.0%) |
| $750,000 to $999,999 | 0 (0.0%) | 0 (0.0%) |
| $1,000,000 or more | 0 (0.0%) | 0 (0.0%) |
| Total | 156 (100.0%) | 58 (100.0%) |
Household Income by Mortgage Status in Philipsburg
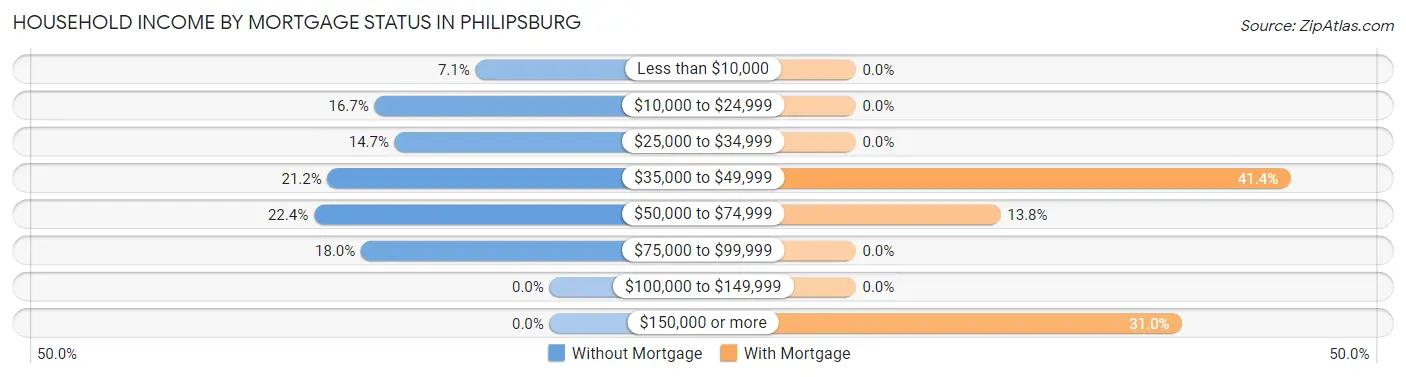
| Household Income | Without Mortgage | With Mortgage |
| Less than $10,000 | 11 (7.0%) | 0 (0.0%) |
| $10,000 to $24,999 | 26 (16.7%) | 0 (0.0%) |
| $25,000 to $34,999 | 23 (14.7%) | 0 (0.0%) |
| $35,000 to $49,999 | 33 (21.1%) | 24 (41.4%) |
| $50,000 to $74,999 | 35 (22.4%) | 8 (13.8%) |
| $75,000 to $99,999 | 28 (17.9%) | 0 (0.0%) |
| $100,000 to $149,999 | 0 (0.0%) | 0 (0.0%) |
| $150,000 or more | 0 (0.0%) | 18 (31.0%) |
| Total | 156 (100.0%) | 58 (100.0%) |
Property Value to Household Income Ratio in Philipsburg
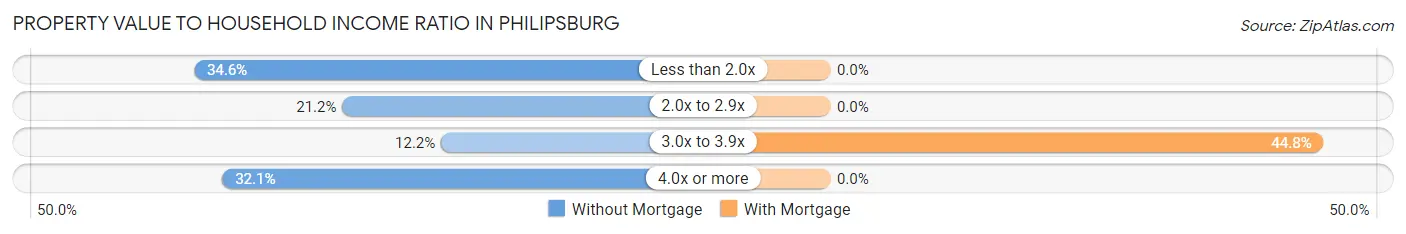
| Value-to-Income Ratio | Without Mortgage | With Mortgage |
| Less than 2.0x | 54 (34.6%) | 0 (0.0%) |
| 2.0x to 2.9x | 33 (21.1%) | 0 (0.0%) |
| 3.0x to 3.9x | 19 (12.2%) | 26 (44.8%) |
| 4.0x or more | 50 (32.1%) | 0 (0.0%) |
| Total | 156 (100.0%) | 58 (100.0%) |
Real Estate Taxes by Mortgage Status in Philipsburg
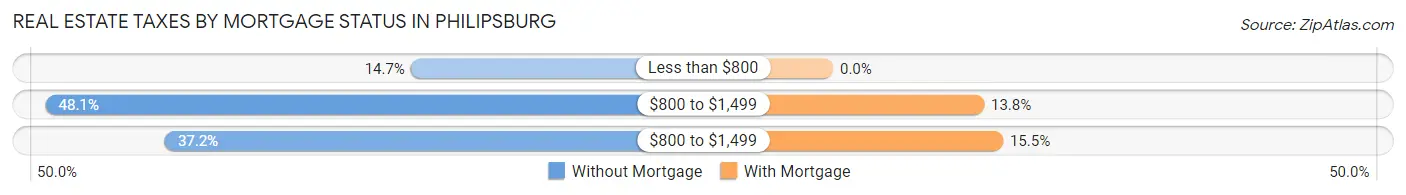
| Property Taxes | Without Mortgage | With Mortgage |
| Less than $800 | 23 (14.7%) | 0 (0.0%) |
| $800 to $1,499 | 75 (48.1%) | 8 (13.8%) |
| $800 to $1,499 | 58 (37.2%) | 9 (15.5%) |
| Total | 156 (100.0%) | 58 (100.0%) |
Health & Disability in Philipsburg
Health Insurance Coverage by Age in Philipsburg
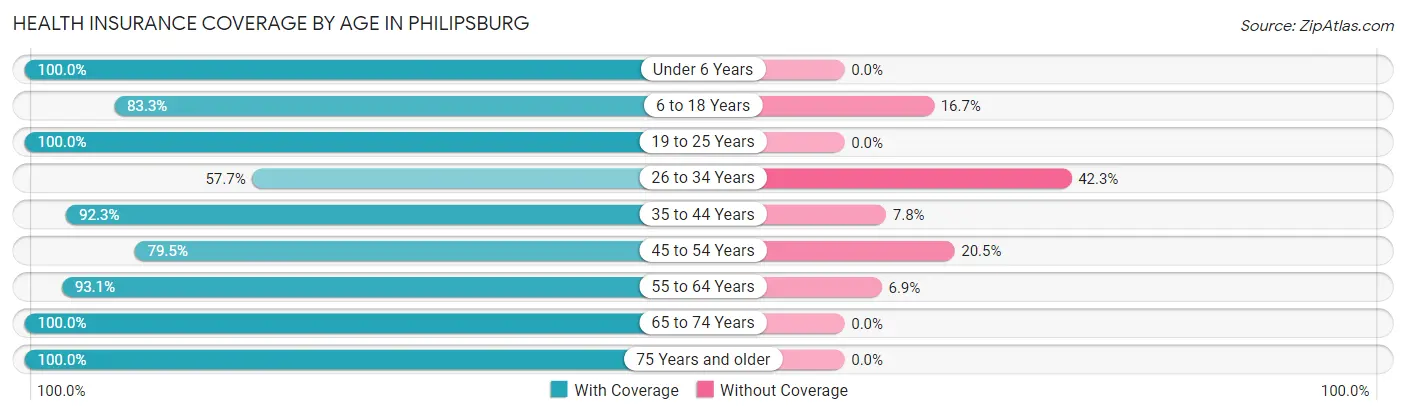
| Age Bracket | With Coverage | Without Coverage |
| Under 6 Years | 87 (100.0%) | 0 (0.0%) |
| 6 to 18 Years | 80 (83.3%) | 16 (16.7%) |
| 19 to 25 Years | 47 (100.0%) | 0 (0.0%) |
| 26 to 34 Years | 15 (57.7%) | 11 (42.3%) |
| 35 to 44 Years | 131 (92.2%) | 11 (7.7%) |
| 45 to 54 Years | 62 (79.5%) | 16 (20.5%) |
| 55 to 64 Years | 161 (93.1%) | 12 (6.9%) |
| 65 to 74 Years | 131 (100.0%) | 0 (0.0%) |
| 75 Years and older | 95 (100.0%) | 0 (0.0%) |
| Total | 809 (92.5%) | 66 (7.5%) |
Health Insurance Coverage by Citizenship Status in Philipsburg
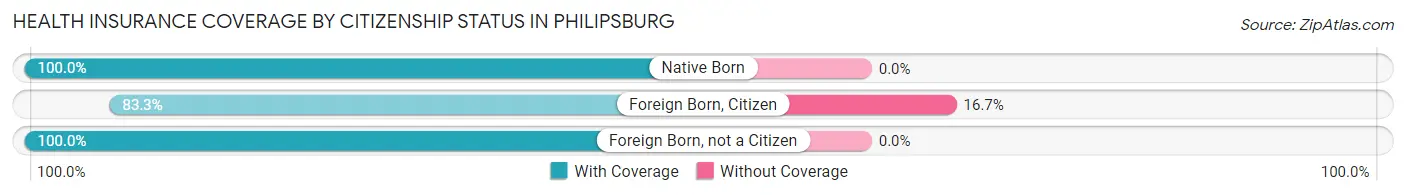
| Citizenship Status | With Coverage | Without Coverage |
| Native Born | 87 (100.0%) | 0 (0.0%) |
| Foreign Born, Citizen | 80 (83.3%) | 16 (16.7%) |
| Foreign Born, not a Citizen | 47 (100.0%) | 0 (0.0%) |
Health Insurance Coverage by Household Income in Philipsburg
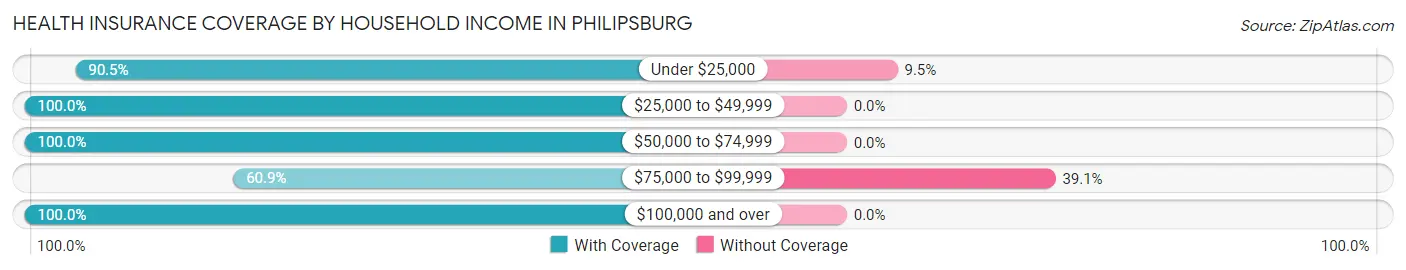
| Household Income | With Coverage | Without Coverage |
| Under $25,000 | 219 (90.5%) | 23 (9.5%) |
| $25,000 to $49,999 | 244 (100.0%) | 0 (0.0%) |
| $50,000 to $74,999 | 91 (100.0%) | 0 (0.0%) |
| $75,000 to $99,999 | 67 (60.9%) | 43 (39.1%) |
| $100,000 and over | 188 (100.0%) | 0 (0.0%) |
Public vs Private Health Insurance Coverage by Age in Philipsburg
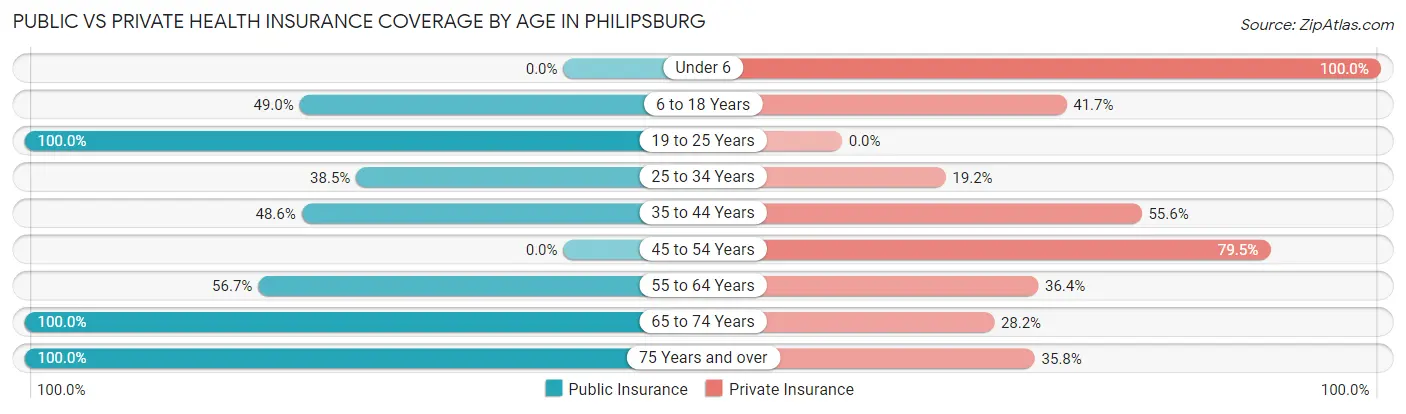
| Age Bracket | Public Insurance | Private Insurance |
| Under 6 | 0 (0.0%) | 87 (100.0%) |
| 6 to 18 Years | 47 (49.0%) | 40 (41.7%) |
| 19 to 25 Years | 47 (100.0%) | 0 (0.0%) |
| 25 to 34 Years | 10 (38.5%) | 5 (19.2%) |
| 35 to 44 Years | 69 (48.6%) | 79 (55.6%) |
| 45 to 54 Years | 0 (0.0%) | 62 (79.5%) |
| 55 to 64 Years | 98 (56.7%) | 63 (36.4%) |
| 65 to 74 Years | 131 (100.0%) | 37 (28.2%) |
| 75 Years and over | 95 (100.0%) | 34 (35.8%) |
| Total | 497 (56.8%) | 407 (46.5%) |
Disability Status by Sex by Age in Philipsburg
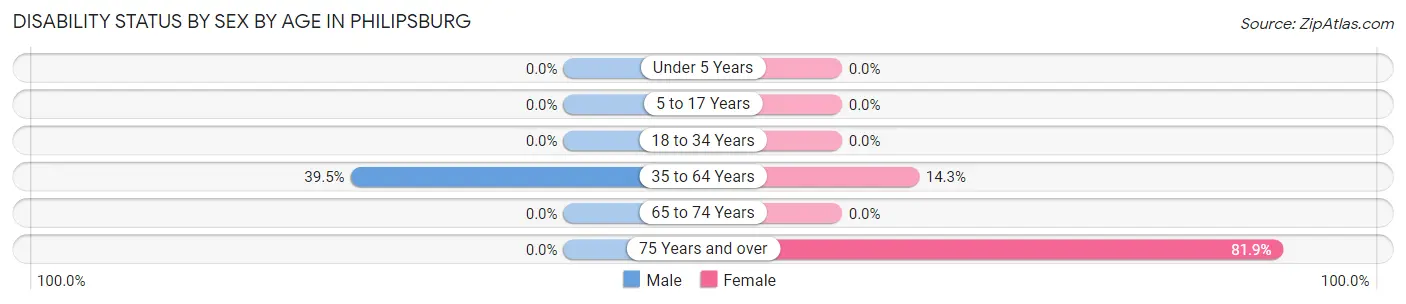
| Age Bracket | Male | Female |
| Under 5 Years | 0 (0.0%) | 0 (0.0%) |
| 5 to 17 Years | 0 (0.0%) | 0 (0.0%) |
| 18 to 34 Years | 0 (0.0%) | 0 (0.0%) |
| 35 to 64 Years | 100 (39.5%) | 20 (14.3%) |
| 65 to 74 Years | 0 (0.0%) | 0 (0.0%) |
| 75 Years and over | 0 (0.0%) | 59 (81.9%) |
Disability Class by Sex by Age in Philipsburg
Disability Class: Hearing Difficulty
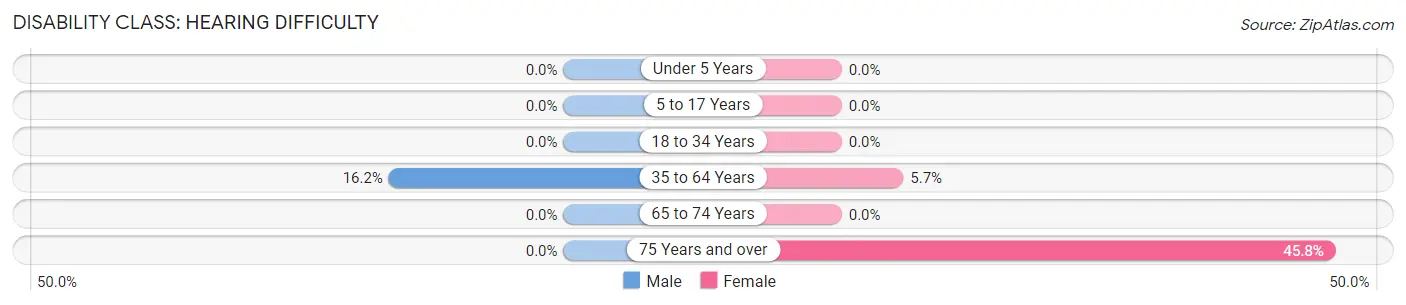
| Age Bracket | Male | Female |
| Under 5 Years | 0 (0.0%) | 0 (0.0%) |
| 5 to 17 Years | 0 (0.0%) | 0 (0.0%) |
| 18 to 34 Years | 0 (0.0%) | 0 (0.0%) |
| 35 to 64 Years | 41 (16.2%) | 8 (5.7%) |
| 65 to 74 Years | 0 (0.0%) | 0 (0.0%) |
| 75 Years and over | 0 (0.0%) | 33 (45.8%) |
Disability Class: Vision Difficulty
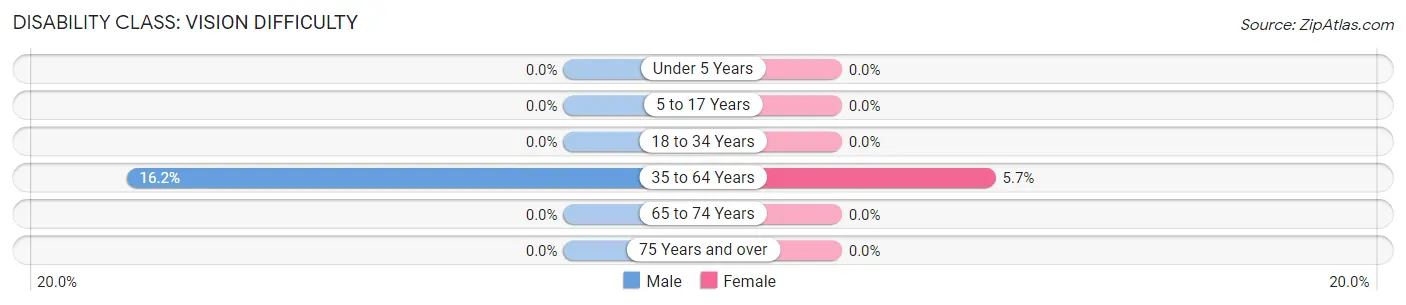
| Age Bracket | Male | Female |
| Under 5 Years | 0 (0.0%) | 0 (0.0%) |
| 5 to 17 Years | 0 (0.0%) | 0 (0.0%) |
| 18 to 34 Years | 0 (0.0%) | 0 (0.0%) |
| 35 to 64 Years | 41 (16.2%) | 8 (5.7%) |
| 65 to 74 Years | 0 (0.0%) | 0 (0.0%) |
| 75 Years and over | 0 (0.0%) | 0 (0.0%) |
Disability Class: Cognitive Difficulty
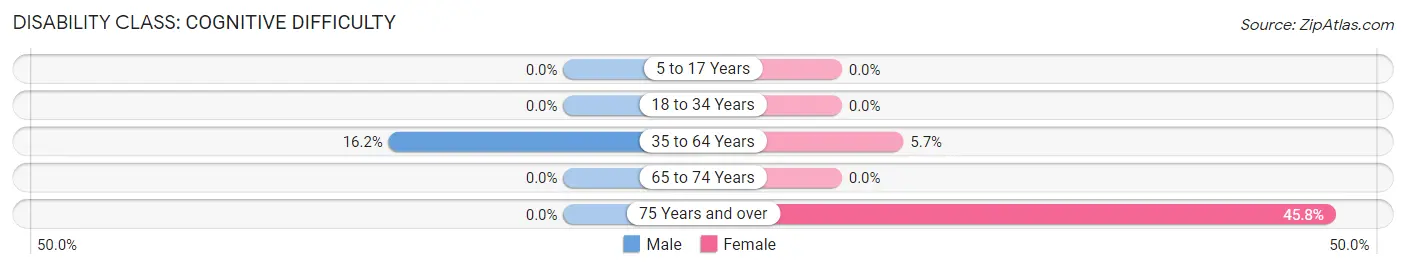
| Age Bracket | Male | Female |
| 5 to 17 Years | 0 (0.0%) | 0 (0.0%) |
| 18 to 34 Years | 0 (0.0%) | 0 (0.0%) |
| 35 to 64 Years | 41 (16.2%) | 8 (5.7%) |
| 65 to 74 Years | 0 (0.0%) | 0 (0.0%) |
| 75 Years and over | 0 (0.0%) | 33 (45.8%) |
Disability Class: Ambulatory Difficulty
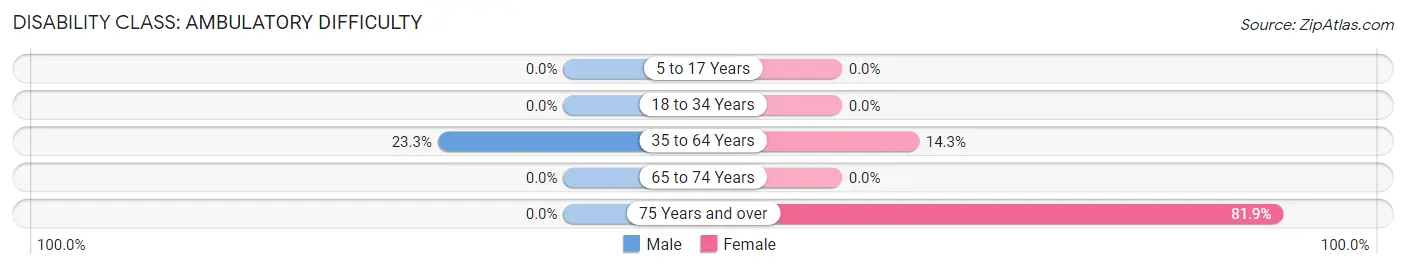
| Age Bracket | Male | Female |
| 5 to 17 Years | 0 (0.0%) | 0 (0.0%) |
| 18 to 34 Years | 0 (0.0%) | 0 (0.0%) |
| 35 to 64 Years | 59 (23.3%) | 20 (14.3%) |
| 65 to 74 Years | 0 (0.0%) | 0 (0.0%) |
| 75 Years and over | 0 (0.0%) | 59 (81.9%) |
Disability Class: Self-Care Difficulty
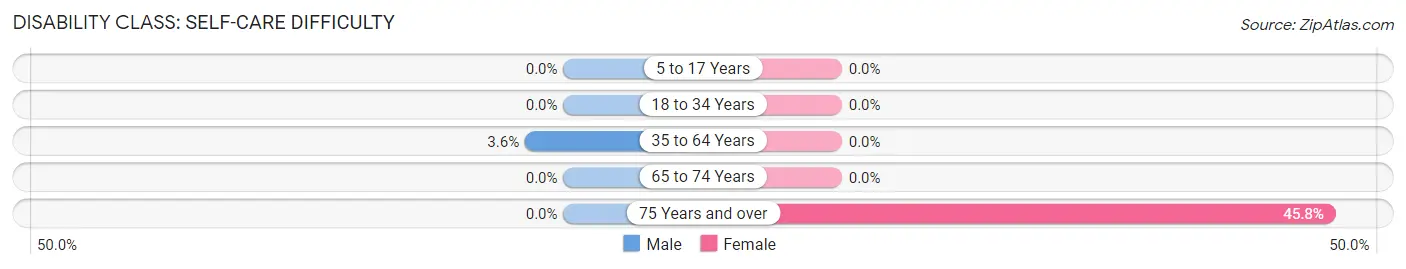
| Age Bracket | Male | Female |
| 5 to 17 Years | 0 (0.0%) | 0 (0.0%) |
| 18 to 34 Years | 0 (0.0%) | 0 (0.0%) |
| 35 to 64 Years | 9 (3.6%) | 0 (0.0%) |
| 65 to 74 Years | 0 (0.0%) | 0 (0.0%) |
| 75 Years and over | 0 (0.0%) | 33 (45.8%) |
Technology Access in Philipsburg
Computing Device Access in Philipsburg
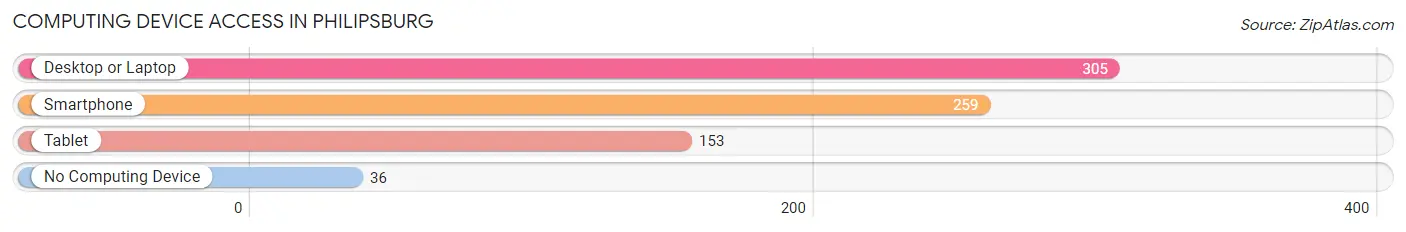
| Device Type | # Households | % Households |
| Desktop or Laptop | 305 | 77.4% |
| Smartphone | 259 | 65.7% |
| Tablet | 153 | 38.8% |
| No Computing Device | 36 | 9.1% |
| Total | 394 | 100.0% |
Internet Access in Philipsburg
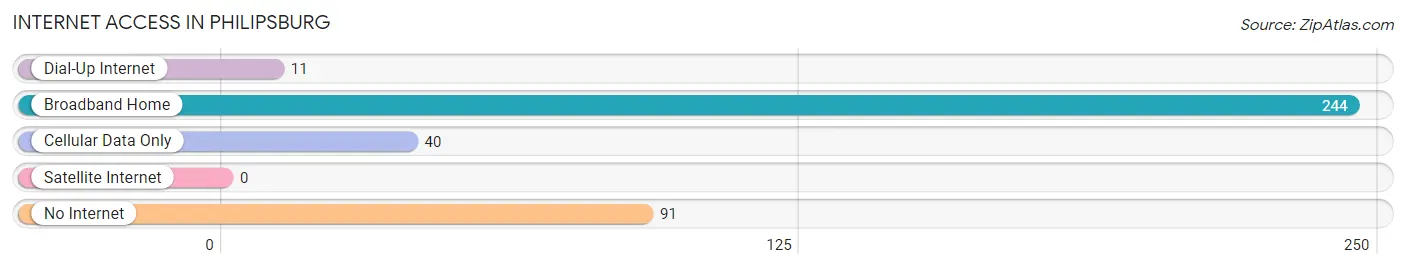
| Internet Type | # Households | % Households |
| Dial-Up Internet | 11 | 2.8% |
| Broadband Home | 244 | 61.9% |
| Cellular Data Only | 40 | 10.2% |
| Satellite Internet | 0 | 0.0% |
| No Internet | 91 | 23.1% |
| Total | 394 | 100.0% |
Philipsburg Summary
Philipsburg, Montana is a small town located in Granite County, Montana. It is situated in the heart of the Sapphire Mountains, and is surrounded by the Beaverhead-Deerlodge National Forest. The town is home to a population of approximately 1,000 people, and is the county seat of Granite County.
History
The area that is now Philipsburg was first settled in the late 1800s by miners and prospectors who were drawn to the area by the discovery of gold and silver in the nearby mountains. The town was officially founded in 1867, and was named after Philip Deidesheimer, a German-born mining engineer who had worked in the area. The town quickly grew, and by the early 1900s, it had become a bustling mining town with a population of over 2,000 people.
The town’s economy was largely based on the mining industry, and it was home to several large mines, including the Philipsburg Mining Company, the Granite Mountain Mining Company, and the Montana Mining Company. The town also had several smelters, which processed the ore from the mines.
In the early 1900s, the town began to decline as the mining industry began to decline. By the 1950s, the population had dropped to just over 1,000 people. The town has since become a popular tourist destination, and its population has grown to over 1,500 people.
Geography
Philipsburg is located in the heart of the Sapphire Mountains, and is surrounded by the Beaverhead-Deerlodge National Forest. The town is situated at an elevation of 5,000 feet, and is located at the intersection of US Highway 1 and Montana Highway 1. The town is located approximately 40 miles south of Missoula, Montana, and is approximately 100 miles north of Butte, Montana.
The town is located in a valley surrounded by mountains, and is home to several lakes, including Georgetown Lake, Georgetown Lake Reservoir, and Georgetown Lake State Park. The town is also home to several creeks, including Rock Creek, which flows through the town.
Economy
The economy of Philipsburg is largely based on tourism, and the town is home to several popular tourist attractions, including the Philipsburg Mining Museum, the Philipsburg Brewing Company, and the Philipsburg Opera House. The town is also home to several restaurants, bars, and shops.
The town is also home to several businesses, including a lumber mill, a sawmill, and a machine shop. The town is also home to several small businesses, including a grocery store, a hardware store, and a gas station.
Demographics
As of the 2010 census, the population of Philipsburg was 1,521 people. The racial makeup of the town was 97.3% White, 0.2% African American, 0.3% Native American, 0.2% Asian, 0.1% Pacific Islander, 0.7% from other races, and 1.3% from two or more races. Hispanic or Latino of any race were 1.7% of the population.
The median income for a household in the town was $37,500, and the median income for a family was $45,000. The per capita income for the town was $20,000. About 11.2% of families and 14.2% of the population were below the poverty line, including 17.2% of those under age 18 and 8.3% of those age 65 or over.
Common Questions
What is Per Capita Income in Philipsburg?
Per Capita income in Philipsburg is $20,143.
What is the Median Household income in Philipsburg?
Median Household Income in Philipsburg is $32,353.
What is Inequality or Gini Index in Philipsburg?
Inequality or Gini Index in Philipsburg is 0.41.
What is the Total Population of Philipsburg?
Total Population of Philipsburg is 914.
What is the Total Male Population of Philipsburg?
Total Male Population of Philipsburg is 448.
What is the Total Female Population of Philipsburg?
Total Female Population of Philipsburg is 466.
What is the Ratio of Males per 100 Females in Philipsburg?
There are 96.14 Males per 100 Females in Philipsburg.
What is the Ratio of Females per 100 Males in Philipsburg?
There are 104.02 Females per 100 Males in Philipsburg.
What is the Median Population Age in Philipsburg?
Median Population Age in Philipsburg is 49.8 Years.
What is the Average Family Size in Philipsburg
Average Family Size in Philipsburg is 3.2 People.
What is the Average Household Size in Philipsburg
Average Household Size in Philipsburg is 2.2 People.
How Large is the Labor Force in Philipsburg?
There are 405 People in the Labor Forcein in Philipsburg.
What is the Percentage of People in the Labor Force in Philipsburg?
49.9% of People are in the Labor Force in Philipsburg.
What is the Unemployment Rate in Philipsburg?
Unemployment Rate in Philipsburg is 13.8%.