Fairfield, MT Map & Demographics
Fairfield Map
Fairfield Overview
$28,386
PER CAPITA INCOME
$75,764
AVG FAMILY INCOME
$64,922
AVG HOUSEHOLD INCOME
48.7%
WAGE / INCOME GAP [ % ]
51.3¢/ $1
WAGE / INCOME GAP [ $ ]
0.39
INEQUALITY / GINI INDEX
759
TOTAL POPULATION
362
MALE POPULATION
397
FEMALE POPULATION
91.18
MALES / 100 FEMALES
109.67
FEMALES / 100 MALES
30.9
MEDIAN AGE
2.9
AVG FAMILY SIZE
2.6
AVG HOUSEHOLD SIZE
361
LABOR FORCE [ PEOPLE ]
62.8%
PERCENT IN LABOR FORCE
7.5%
UNEMPLOYMENT RATE
Fairfield Zip Codes
Fairfield Area Codes
Income in Fairfield
Income Overview in Fairfield
Per Capita Income in Fairfield is $28,386, while median incomes of families and households are $75,764 and $64,922 respectively.
| Characteristic | Number | Measure |
| Per Capita Income | 759 | $28,386 |
| Median Family Income | 229 | $75,764 |
| Mean Family Income | 229 | $84,727 |
| Median Household Income | 295 | $64,922 |
| Mean Household Income | 295 | $73,661 |
| Income Deficit | 229 | $0 |
| Wage / Income Gap (%) | 759 | 48.74% |
| Wage / Income Gap ($) | 759 | 51.26¢ per $1 |
| Gini / Inequality Index | 759 | 0.39 |
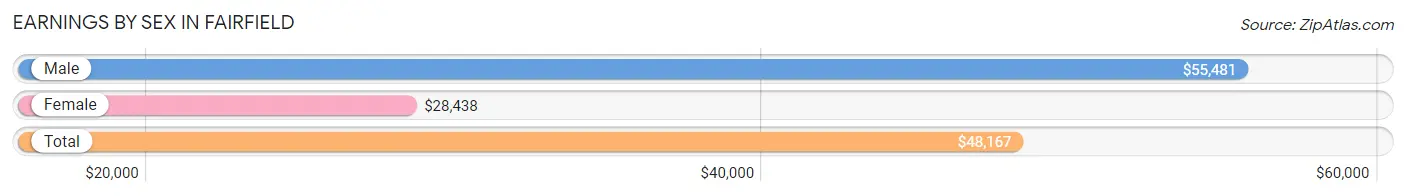
Earnings by Sex in Fairfield
Average Earnings in Fairfield are $48,167, $55,481 for men and $28,438 for women, a difference of 48.7%.
| Sex | Number | Average Earnings |
| Male | 196 (52.1%) | $55,481 |
| Female | 180 (47.9%) | $28,438 |
| Total | 376 (100.0%) | $48,167 |
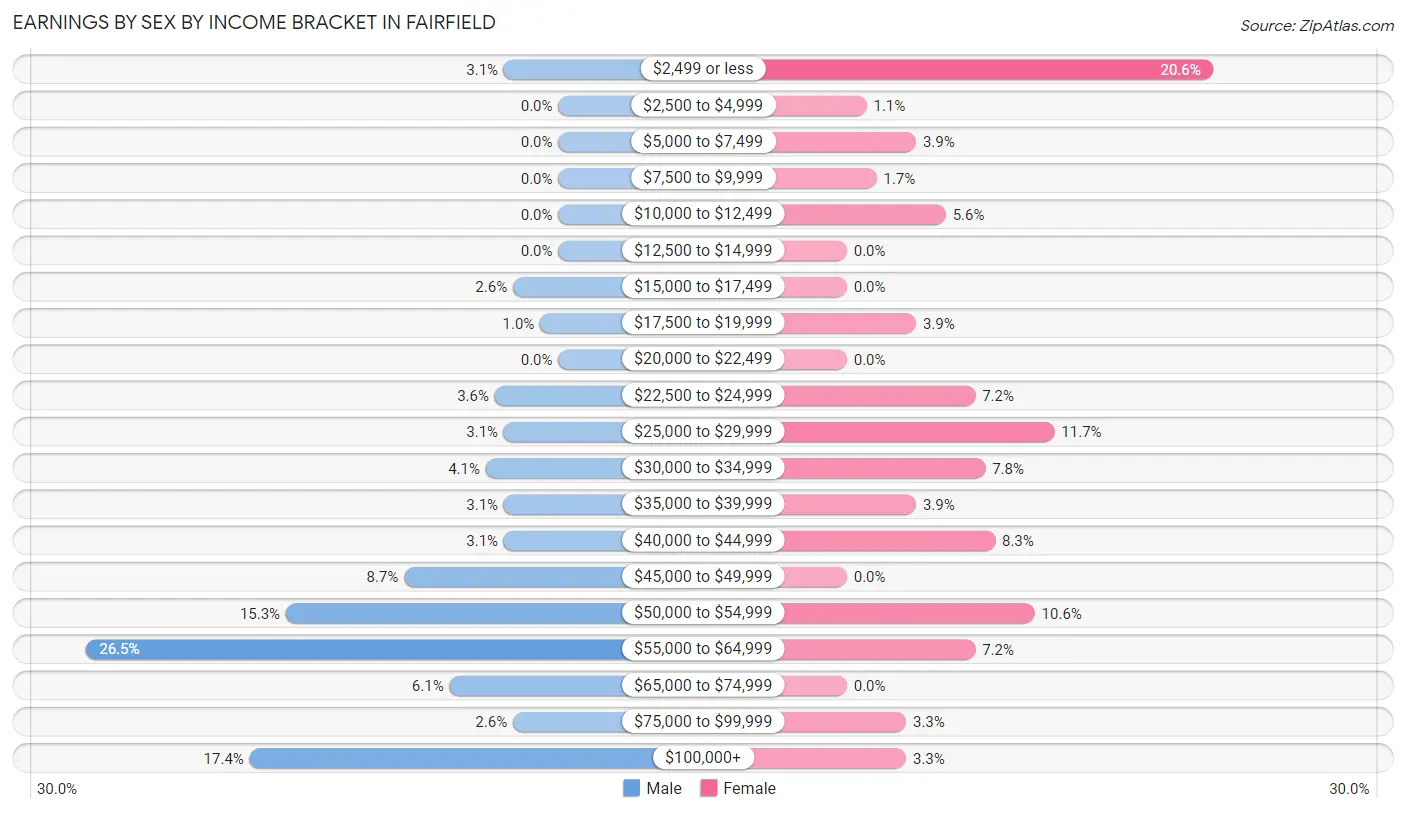
Earnings by Sex by Income Bracket in Fairfield
The most common earnings brackets in Fairfield are $55,000 to $64,999 for men (52 | 26.5%) and $2,499 or less for women (37 | 20.6%).
| Income | Male | Female |
| $2,499 or less | 6 (3.1%) | 37 (20.6%) |
| $2,500 to $4,999 | 0 (0.0%) | 2 (1.1%) |
| $5,000 to $7,499 | 0 (0.0%) | 7 (3.9%) |
| $7,500 to $9,999 | 0 (0.0%) | 3 (1.7%) |
| $10,000 to $12,499 | 0 (0.0%) | 10 (5.6%) |
| $12,500 to $14,999 | 0 (0.0%) | 0 (0.0%) |
| $15,000 to $17,499 | 5 (2.5%) | 0 (0.0%) |
| $17,500 to $19,999 | 2 (1.0%) | 7 (3.9%) |
| $20,000 to $22,499 | 0 (0.0%) | 0 (0.0%) |
| $22,500 to $24,999 | 7 (3.6%) | 13 (7.2%) |
| $25,000 to $29,999 | 6 (3.1%) | 21 (11.7%) |
| $30,000 to $34,999 | 8 (4.1%) | 14 (7.8%) |
| $35,000 to $39,999 | 6 (3.1%) | 7 (3.9%) |
| $40,000 to $44,999 | 6 (3.1%) | 15 (8.3%) |
| $45,000 to $49,999 | 17 (8.7%) | 0 (0.0%) |
| $50,000 to $54,999 | 30 (15.3%) | 19 (10.6%) |
| $55,000 to $64,999 | 52 (26.5%) | 13 (7.2%) |
| $65,000 to $74,999 | 12 (6.1%) | 0 (0.0%) |
| $75,000 to $99,999 | 5 (2.5%) | 6 (3.3%) |
| $100,000+ | 34 (17.3%) | 6 (3.3%) |
| Total | 196 (100.0%) | 180 (100.0%) |
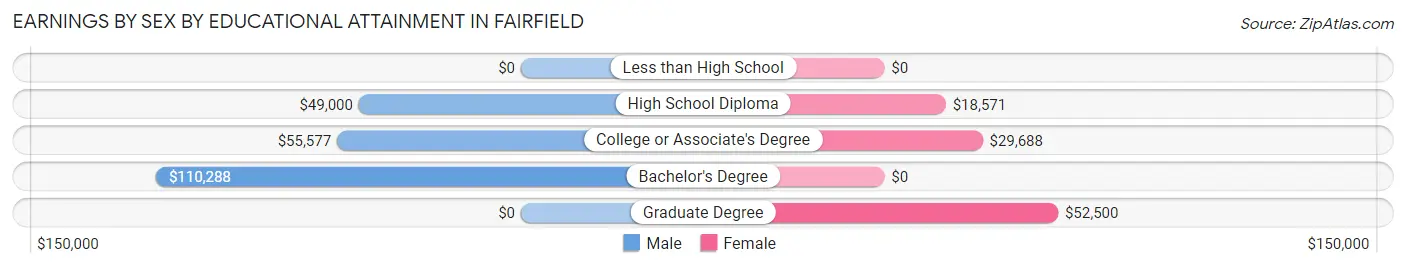
Earnings by Sex by Educational Attainment in Fairfield
Average earnings in Fairfield are $55,769 for men and $32,031 for women, a difference of 42.6%. Men with an educational attainment of bachelor's degree enjoy the highest average annual earnings of $110,288, while those with high school diploma education earn the least with $49,000. Women with an educational attainment of graduate degree earn the most with the average annual earnings of $52,500, while those with high school diploma education have the smallest earnings of $18,571.
| Educational Attainment | Male Income | Female Income |
| Less than High School | - | - |
| High School Diploma | $49,000 | $18,571 |
| College or Associate's Degree | $55,577 | $29,688 |
| Bachelor's Degree | $110,288 | $0 |
| Graduate Degree | - | - |
| Total | $55,769 | $32,031 |
Family Income in Fairfield
Family Income Brackets in Fairfield
According to the Fairfield family income data, there are 73 families falling into the $75,000 to $99,999 income range, which is the most common income bracket and makes up 31.9% of all families.
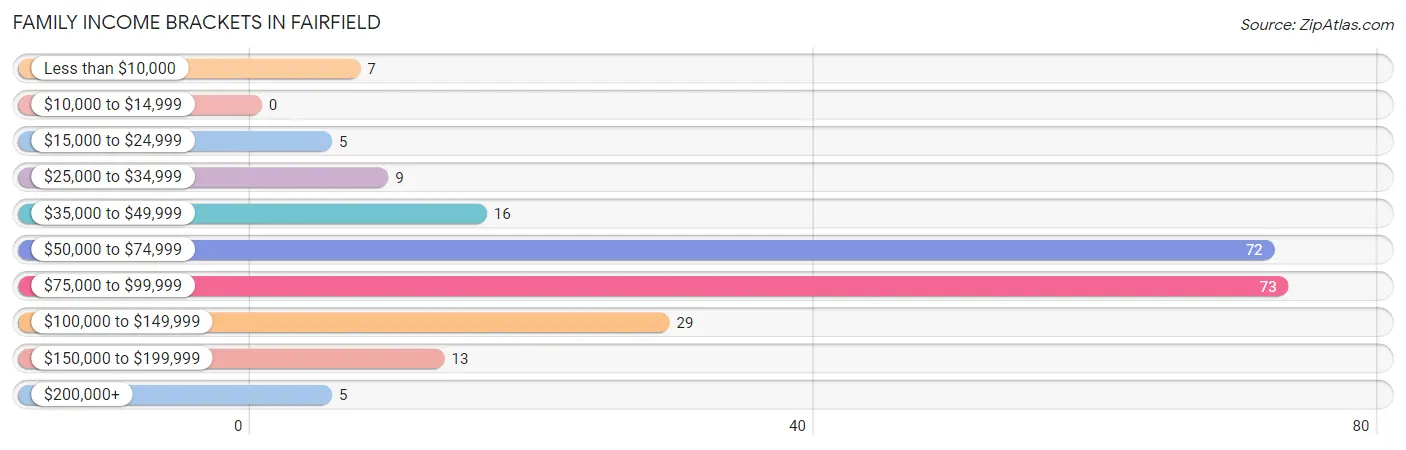
| Income Bracket | # Families | % Families |
| Less than $10,000 | 7 | 3.1% |
| $10,000 to $14,999 | 0 | 0.0% |
| $15,000 to $24,999 | 5 | 2.2% |
| $25,000 to $34,999 | 9 | 3.9% |
| $35,000 to $49,999 | 16 | 7.0% |
| $50,000 to $74,999 | 72 | 31.4% |
| $75,000 to $99,999 | 73 | 31.9% |
| $100,000 to $149,999 | 29 | 12.7% |
| $150,000 to $199,999 | 13 | 5.7% |
| $200,000+ | 5 | 2.2% |
Family Income by Famaliy Size in Fairfield
5-person families (25 | 10.9%) account for the highest median family income in Fairfield with $95,096 per family, while 2-person families (79 | 34.5%) have the highest median income of $41,581 per family member.
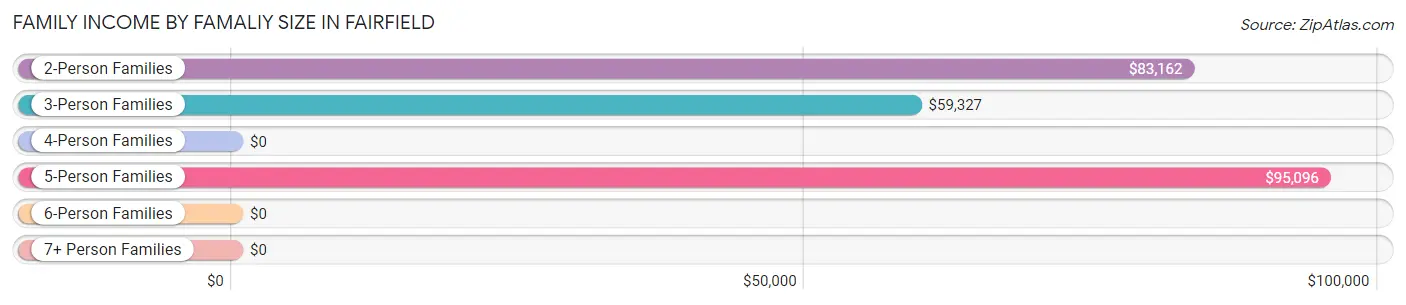
| Income Bracket | # Families | Median Income |
| 2-Person Families | 79 (34.5%) | $83,162 |
| 3-Person Families | 83 (36.2%) | $59,327 |
| 4-Person Families | 29 (12.7%) | $0 |
| 5-Person Families | 25 (10.9%) | $95,096 |
| 6-Person Families | 6 (2.6%) | $0 |
| 7+ Person Families | 7 (3.1%) | $0 |
| Total | 229 (100.0%) | $75,764 |
Family Income by Number of Earners in Fairfield
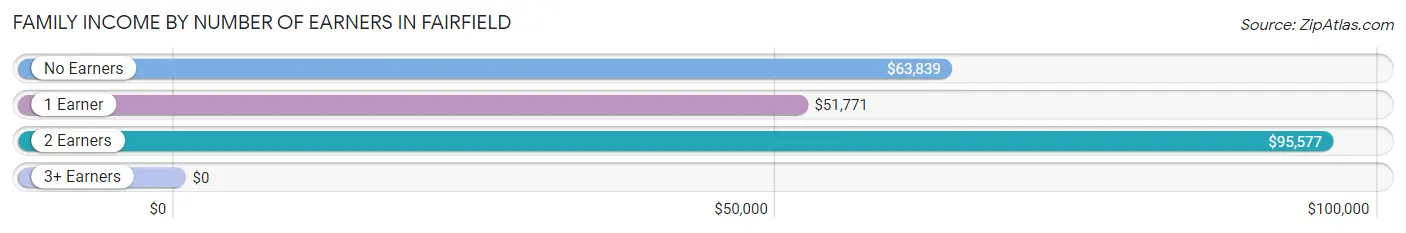
| Number of Earners | # Families | Median Income |
| No Earners | 33 (14.4%) | $63,839 |
| 1 Earner | 84 (36.7%) | $51,771 |
| 2 Earners | 106 (46.3%) | $95,577 |
| 3+ Earners | 6 (2.6%) | $0 |
| Total | 229 (100.0%) | $75,764 |
Household Income in Fairfield
Household Income Brackets in Fairfield
With 80 households falling in the category, the $50,000 to $74,999 income range is the most frequent in Fairfield, accounting for 27.1% of all households.
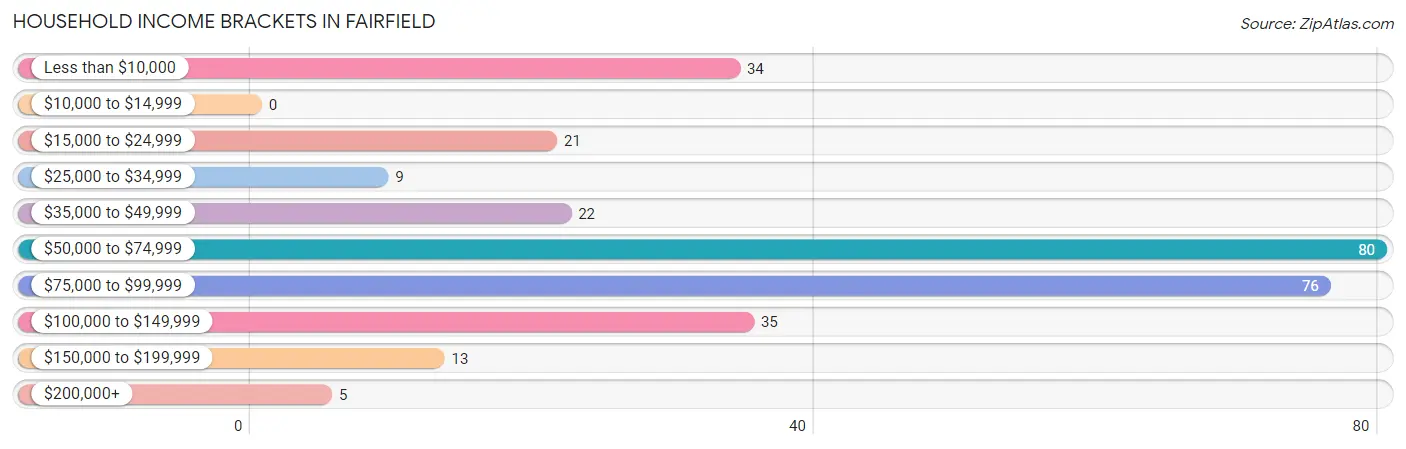
| Income Bracket | # Households | % Households |
| Less than $10,000 | 34 | 11.5% |
| $10,000 to $14,999 | 0 | 0.0% |
| $15,000 to $24,999 | 21 | 7.1% |
| $25,000 to $34,999 | 9 | 3.1% |
| $35,000 to $49,999 | 22 | 7.5% |
| $50,000 to $74,999 | 80 | 27.1% |
| $75,000 to $99,999 | 76 | 25.8% |
| $100,000 to $149,999 | 35 | 11.9% |
| $150,000 to $199,999 | 13 | 4.4% |
| $200,000+ | 5 | 1.7% |
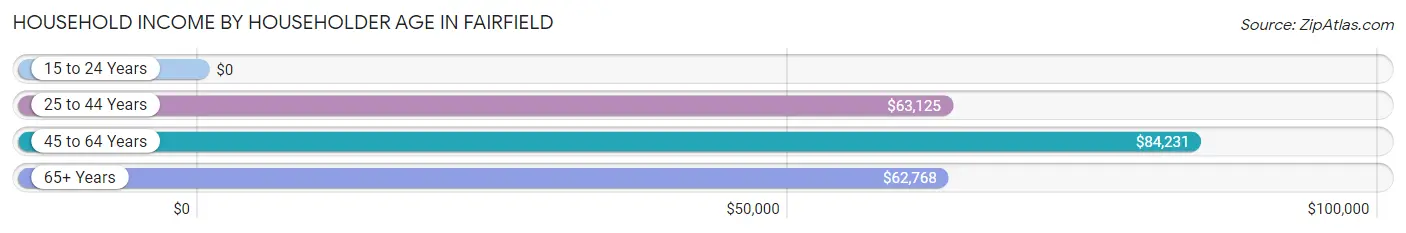
Household Income by Householder Age in Fairfield
The median household income in Fairfield is $64,922, with the highest median household income of $84,231 found in the 45 to 64 years age bracket for the primary householder. A total of 92 households (31.2%) fall into this category. Meanwhile, the 15 to 24 years age bracket for the primary householder has the lowest median household income of $0, with 27 households (9.1%) in this group.
| Income Bracket | # Households | Median Income |
| 15 to 24 Years | 27 (9.1%) | $0 |
| 25 to 44 Years | 123 (41.7%) | $63,125 |
| 45 to 64 Years | 92 (31.2%) | $84,231 |
| 65+ Years | 53 (18.0%) | $62,768 |
| Total | 295 (100.0%) | $64,922 |
Poverty in Fairfield
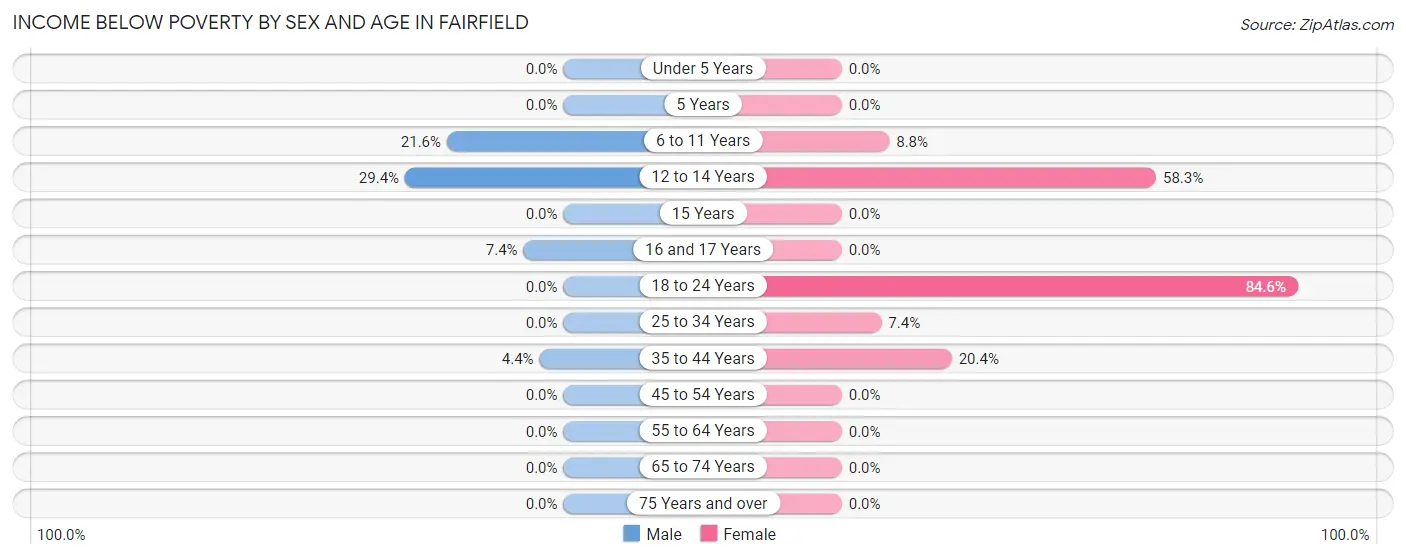
Income Below Poverty by Sex and Age in Fairfield
With 4.7% poverty level for males and 14.7% for females among the residents of Fairfield, 12 to 14 year old males and 18 to 24 year old females are the most vulnerable to poverty, with 5 males (29.4%) and 33 females (84.6%) in their respective age groups living below the poverty level.
| Age Bracket | Male | Female |
| Under 5 Years | 0 (0.0%) | 0 (0.0%) |
| 5 Years | 0 (0.0%) | 0 (0.0%) |
| 6 to 11 Years | 8 (21.6%) | 3 (8.8%) |
| 12 to 14 Years | 5 (29.4%) | 7 (58.3%) |
| 15 Years | 0 (0.0%) | 0 (0.0%) |
| 16 and 17 Years | 2 (7.4%) | 0 (0.0%) |
| 18 to 24 Years | 0 (0.0%) | 33 (84.6%) |
| 25 to 34 Years | 0 (0.0%) | 5 (7.3%) |
| 35 to 44 Years | 2 (4.4%) | 10 (20.4%) |
| 45 to 54 Years | 0 (0.0%) | 0 (0.0%) |
| 55 to 64 Years | 0 (0.0%) | 0 (0.0%) |
| 65 to 74 Years | 0 (0.0%) | 0 (0.0%) |
| 75 Years and over | 0 (0.0%) | 0 (0.0%) |
| Total | 17 (4.7%) | 58 (14.7%) |
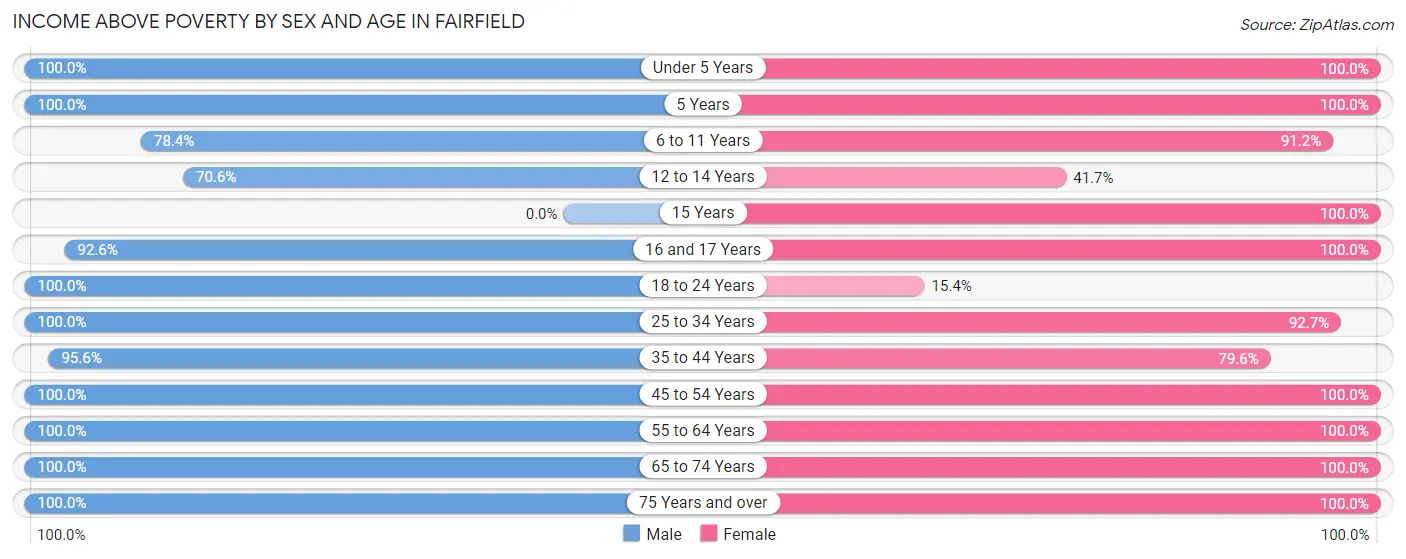
Income Above Poverty by Sex and Age in Fairfield
According to the poverty statistics in Fairfield, males aged under 5 years and females aged under 5 years are the age groups that are most secure financially, with 100.0% of males and 100.0% of females in these age groups living above the poverty line.
| Age Bracket | Male | Female |
| Under 5 Years | 29 (100.0%) | 29 (100.0%) |
| 5 Years | 5 (100.0%) | 7 (100.0%) |
| 6 to 11 Years | 29 (78.4%) | 31 (91.2%) |
| 12 to 14 Years | 12 (70.6%) | 5 (41.7%) |
| 15 Years | 0 (0.0%) | 14 (100.0%) |
| 16 and 17 Years | 25 (92.6%) | 17 (100.0%) |
| 18 to 24 Years | 10 (100.0%) | 6 (15.4%) |
| 25 to 34 Years | 82 (100.0%) | 63 (92.6%) |
| 35 to 44 Years | 43 (95.6%) | 39 (79.6%) |
| 45 to 54 Years | 58 (100.0%) | 68 (100.0%) |
| 55 to 64 Years | 14 (100.0%) | 10 (100.0%) |
| 65 to 74 Years | 14 (100.0%) | 20 (100.0%) |
| 75 Years and over | 24 (100.0%) | 27 (100.0%) |
| Total | 345 (95.3%) | 336 (85.3%) |
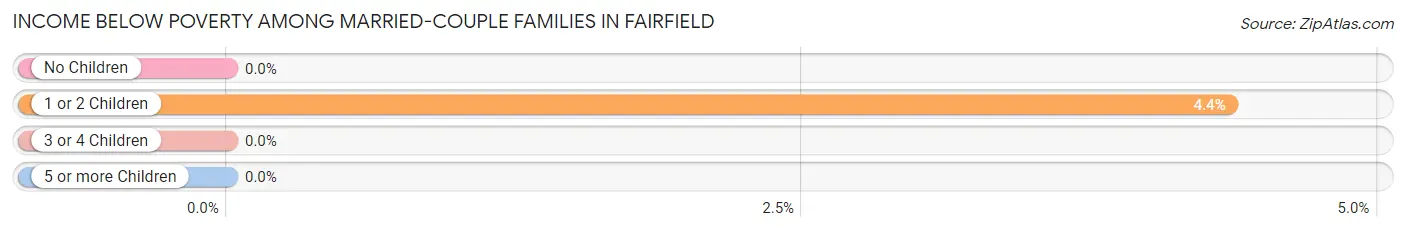
Income Below Poverty Among Married-Couple Families in Fairfield
The poverty statistics for married-couple families in Fairfield show that 1.6% or 3 of the total 184 families live below the poverty line. Families with 1 or 2 children have the highest poverty rate of 4.3%, comprising of 3 families. On the other hand, families with no children have the lowest poverty rate of 0.0%, which includes 0 families.
| Children | Above Poverty | Below Poverty |
| No Children | 80 (100.0%) | 0 (0.0%) |
| 1 or 2 Children | 66 (95.7%) | 3 (4.3%) |
| 3 or 4 Children | 35 (100.0%) | 0 (0.0%) |
| 5 or more Children | 0 (0.0%) | 0 (0.0%) |
| Total | 181 (98.4%) | 3 (1.6%) |
Income Below Poverty Among Single-Parent Households in Fairfield
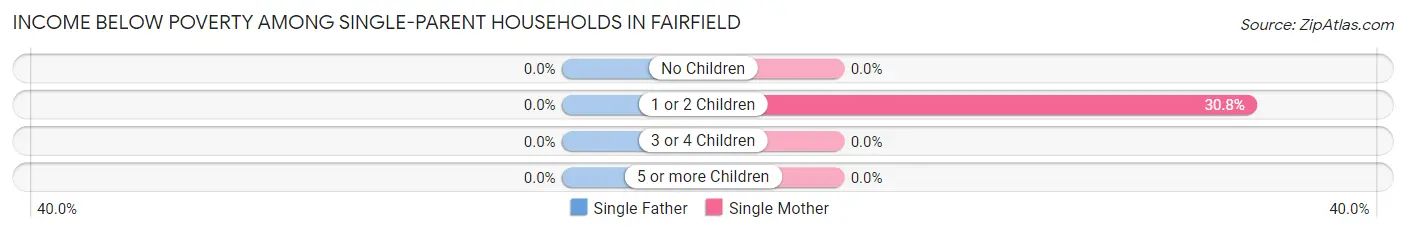
| Children | Single Father | Single Mother |
| No Children | 0 (0.0%) | 0 (0.0%) |
| 1 or 2 Children | 0 (0.0%) | 12 (30.8%) |
| 3 or 4 Children | 0 (0.0%) | 0 (0.0%) |
| 5 or more Children | 0 (0.0%) | 0 (0.0%) |
| Total | 0 (0.0%) | 12 (30.8%) |
Income Below Poverty Among Married-Couple vs Single-Parent Households in Fairfield
The poverty data for Fairfield shows that 3 of the married-couple family households (1.6%) and 12 of the single-parent households (26.7%) are living below the poverty level. Within the married-couple family households, those with 1 or 2 children have the highest poverty rate, with 3 households (4.3%) falling below the poverty line. Among the single-parent households, those with 1 or 2 children have the highest poverty rate, with 12 household (26.7%) living below poverty.
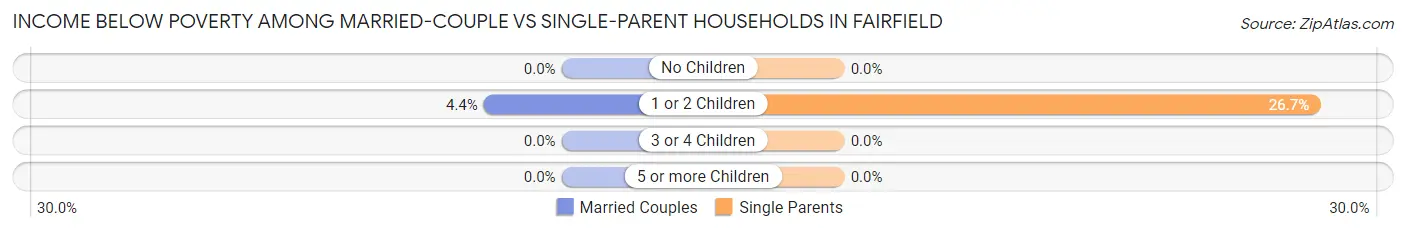
| Children | Married-Couple Families | Single-Parent Households |
| No Children | 0 (0.0%) | 0 (0.0%) |
| 1 or 2 Children | 3 (4.3%) | 12 (26.7%) |
| 3 or 4 Children | 0 (0.0%) | 0 (0.0%) |
| 5 or more Children | 0 (0.0%) | 0 (0.0%) |
| Total | 3 (1.6%) | 12 (26.7%) |
Race in Fairfield
The most populous races in Fairfield are White / Caucasian (692 | 91.2%), Black / African American (42 | 5.5%), and Two or more Races (25 | 3.3%).
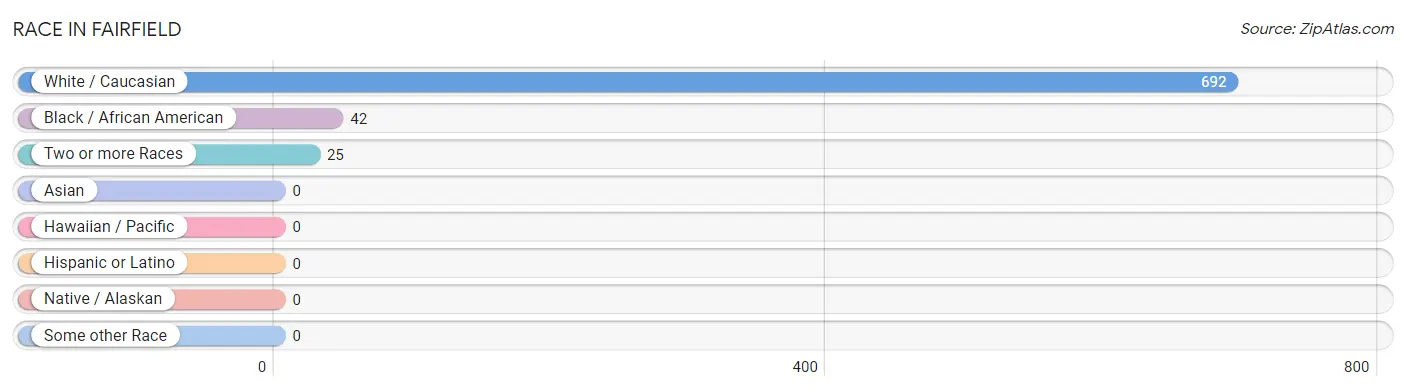
| Race | # Population | % Population |
| Asian | 0 | 0.0% |
| Black / African American | 42 | 5.5% |
| Hawaiian / Pacific | 0 | 0.0% |
| Hispanic or Latino | 0 | 0.0% |
| Native / Alaskan | 0 | 0.0% |
| White / Caucasian | 692 | 91.2% |
| Two or more Races | 25 | 3.3% |
| Some other Race | 0 | 0.0% |
| Total | 759 | 100.0% |
Ancestry in Fairfield
The most populous ancestries reported in Fairfield are German (195 | 25.7%), American (105 | 13.8%), Irish (96 | 12.7%), European (81 | 10.7%), and Haitian (67 | 8.8%), together accounting for 71.7% of all Fairfield residents.
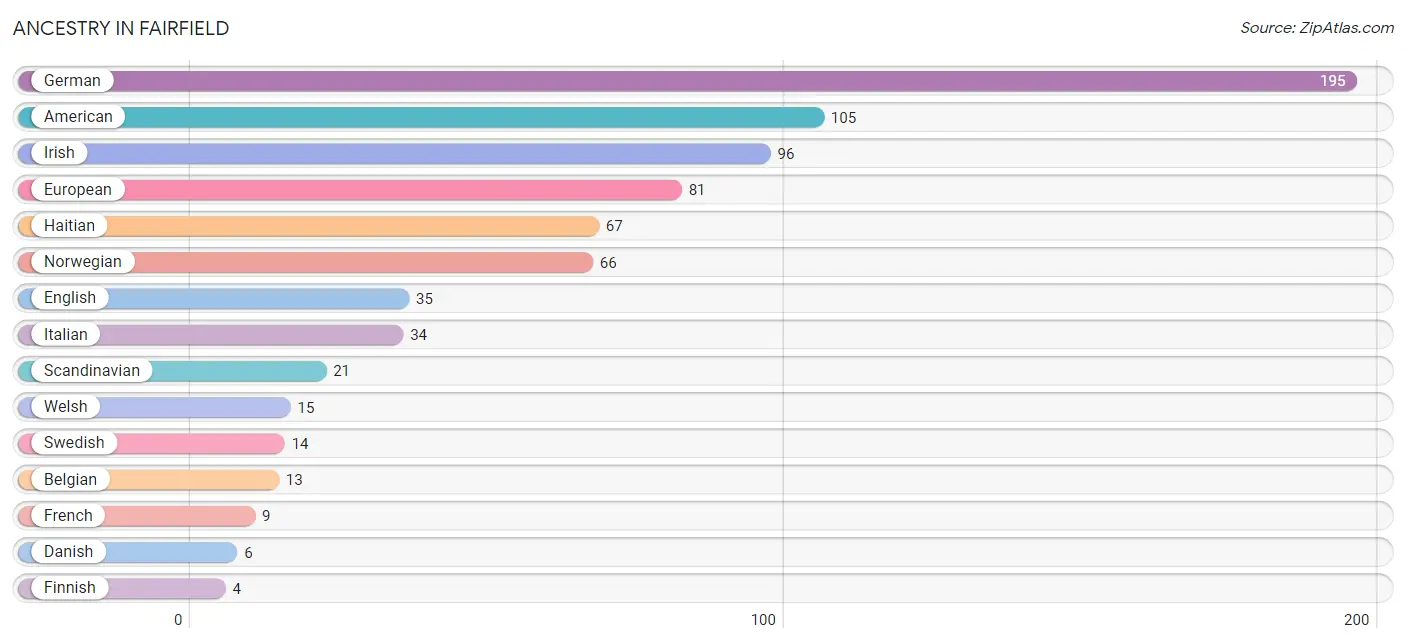
| Ancestry | # Population | % Population |
| American | 105 | 13.8% |
| Belgian | 13 | 1.7% |
| Danish | 6 | 0.8% |
| Dutch | 2 | 0.3% |
| English | 35 | 4.6% |
| European | 81 | 10.7% |
| Finnish | 4 | 0.5% |
| French | 9 | 1.2% |
| German | 195 | 25.7% |
| Haitian | 67 | 8.8% |
| Irish | 96 | 12.7% |
| Italian | 34 | 4.5% |
| Norwegian | 66 | 8.7% |
| Scandinavian | 21 | 2.8% |
| Scottish | 2 | 0.3% |
| Swedish | 14 | 1.8% |
| Welsh | 15 | 2.0% | View All 17 Rows |
Immigrants in Fairfield
The most numerous immigrant groups reported in Fairfield came from Caribbean (32 | 4.2%), Haiti (32 | 4.2%), Latin America (32 | 4.2%), Eastern Europe (5 | 0.7%), and Europe (5 | 0.7%), together accounting for 14.0% of all Fairfield residents.
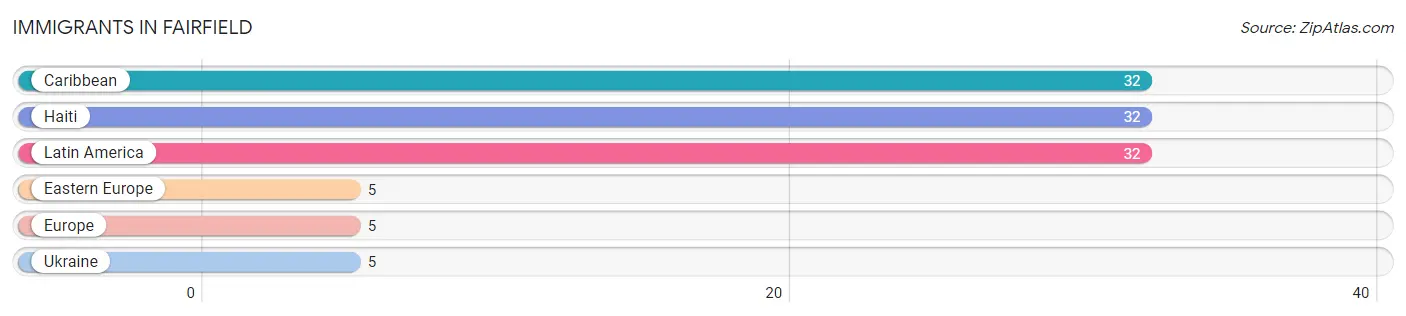
| Immigration Origin | # Population | % Population |
| Caribbean | 32 | 4.2% |
| Eastern Europe | 5 | 0.7% |
| Europe | 5 | 0.7% |
| Haiti | 32 | 4.2% |
| Latin America | 32 | 4.2% |
| Ukraine | 5 | 0.7% | View All 6 Rows |
Sex and Age in Fairfield
Sex and Age in Fairfield
The most populous age groups in Fairfield are 25 to 29 Years (48 | 13.3%) for men and 15 to 19 Years (43 | 10.8%) for women.
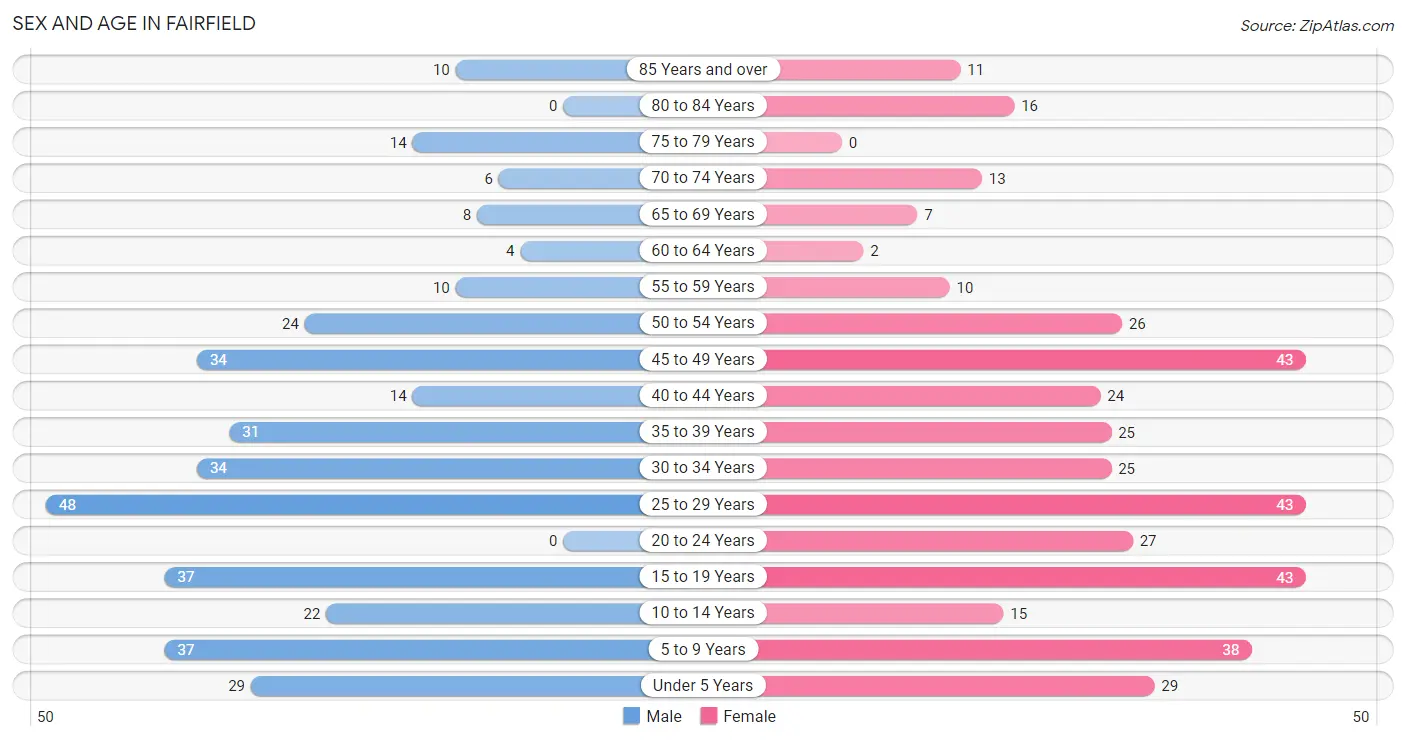
| Age Bracket | Male | Female |
| Under 5 Years | 29 (8.0%) | 29 (7.3%) |
| 5 to 9 Years | 37 (10.2%) | 38 (9.6%) |
| 10 to 14 Years | 22 (6.1%) | 15 (3.8%) |
| 15 to 19 Years | 37 (10.2%) | 43 (10.8%) |
| 20 to 24 Years | 0 (0.0%) | 27 (6.8%) |
| 25 to 29 Years | 48 (13.3%) | 43 (10.8%) |
| 30 to 34 Years | 34 (9.4%) | 25 (6.3%) |
| 35 to 39 Years | 31 (8.6%) | 25 (6.3%) |
| 40 to 44 Years | 14 (3.9%) | 24 (6.0%) |
| 45 to 49 Years | 34 (9.4%) | 43 (10.8%) |
| 50 to 54 Years | 24 (6.6%) | 26 (6.6%) |
| 55 to 59 Years | 10 (2.8%) | 10 (2.5%) |
| 60 to 64 Years | 4 (1.1%) | 2 (0.5%) |
| 65 to 69 Years | 8 (2.2%) | 7 (1.8%) |
| 70 to 74 Years | 6 (1.7%) | 13 (3.3%) |
| 75 to 79 Years | 14 (3.9%) | 0 (0.0%) |
| 80 to 84 Years | 0 (0.0%) | 16 (4.0%) |
| 85 Years and over | 10 (2.8%) | 11 (2.8%) |
| Total | 362 (100.0%) | 397 (100.0%) |
Families and Households in Fairfield
Median Family Size in Fairfield
The median family size in Fairfield is 2.93 persons per family, with single male/father families (6 | 2.6%) accounting for the largest median family size of 3 persons per family. On the other hand, single female/mother families (39 | 17.0%) represent the smallest median family size with 2.67 persons per family.
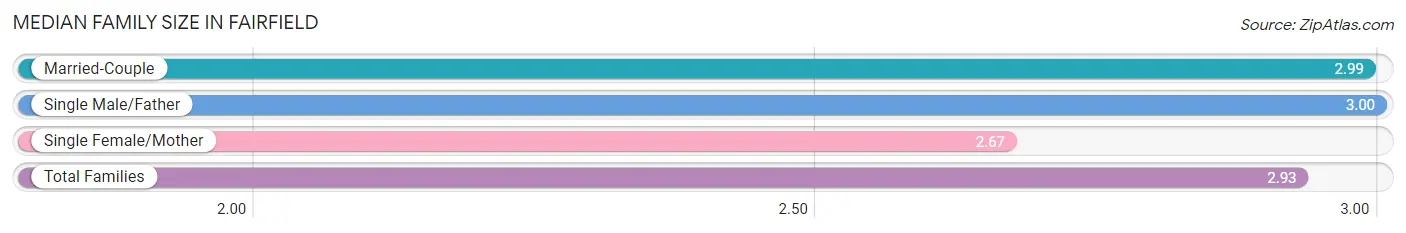
| Family Type | # Families | Family Size |
| Married-Couple | 184 (80.3%) | 2.99 |
| Single Male/Father | 6 (2.6%) | 3.00 |
| Single Female/Mother | 39 (17.0%) | 2.67 |
| Total Families | 229 (100.0%) | 2.93 |
Median Household Size in Fairfield
The median household size in Fairfield is 2.56 persons per household, with single male/father households (6 | 2.0%) accounting for the largest median household size of 3.67 persons per household. non-family households (66 | 22.4%) represent the smallest median household size with 1.09 persons per household.
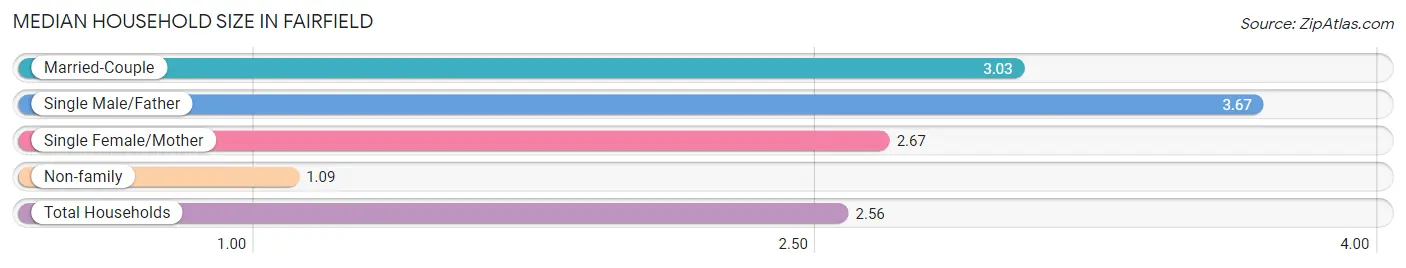
| Household Type | # Households | Household Size |
| Married-Couple | 184 (62.4%) | 3.03 |
| Single Male/Father | 6 (2.0%) | 3.67 |
| Single Female/Mother | 39 (13.2%) | 2.67 |
| Non-family | 66 (22.4%) | 1.09 |
| Total Households | 295 (100.0%) | 2.56 |
Household Size by Marriage Status in Fairfield
Out of a total of 295 households in Fairfield, 229 (77.6%) are family households, while 66 (22.4%) are nonfamily households. The most numerous type of family households are 2-person households, comprising 79, and the most common type of nonfamily households are 1-person households, comprising 63.
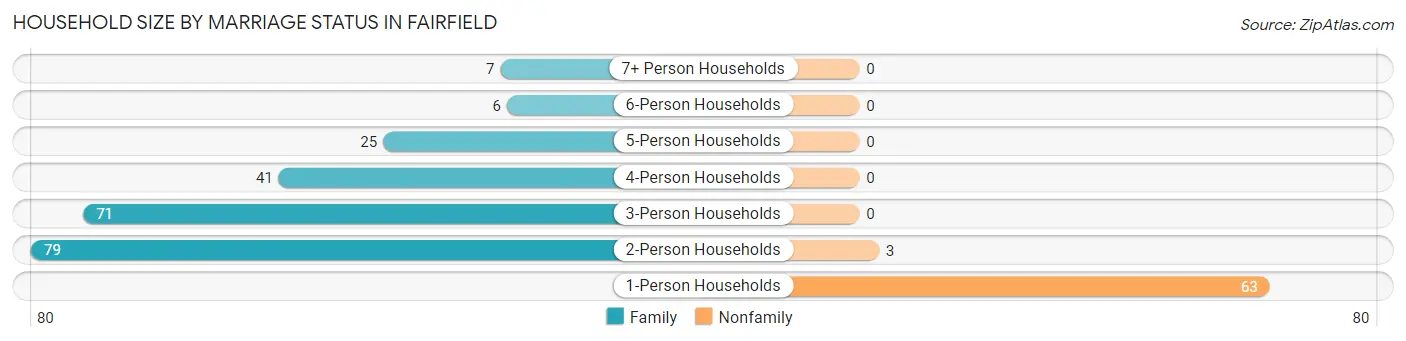
| Household Size | Family Households | Nonfamily Households |
| 1-Person Households | - | 63 (21.4%) |
| 2-Person Households | 79 (26.8%) | 3 (1.0%) |
| 3-Person Households | 71 (24.1%) | 0 (0.0%) |
| 4-Person Households | 41 (13.9%) | 0 (0.0%) |
| 5-Person Households | 25 (8.5%) | 0 (0.0%) |
| 6-Person Households | 6 (2.0%) | 0 (0.0%) |
| 7+ Person Households | 7 (2.4%) | 0 (0.0%) |
| Total | 229 (77.6%) | 66 (22.4%) |
Female Fertility in Fairfield
Fertility by Age in Fairfield
Average fertility rate in Fairfield is 196.0 births per 1,000 women. Women in the age bracket of 20 to 34 years have the highest fertility rate with 400.0 births per 1,000 women. Women in the age bracket of 20 to 34 years acount for 79.2% of all women with births.
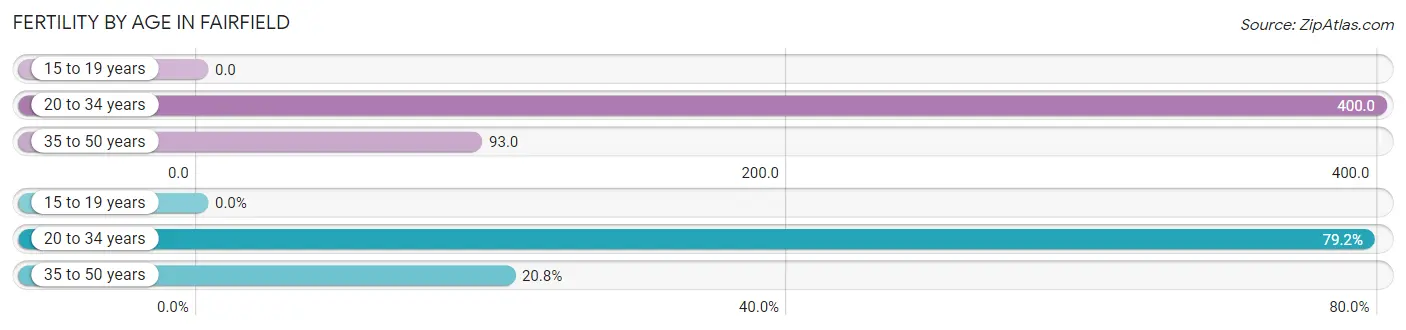
| Age Bracket | Women with Births | Births / 1,000 Women |
| 15 to 19 years | 0 (0.0%) | 0.0 |
| 20 to 34 years | 38 (79.2%) | 400.0 |
| 35 to 50 years | 10 (20.8%) | 93.0 |
| Total | 48 (100.0%) | 196.0 |
Fertility by Age by Marriage Status in Fairfield
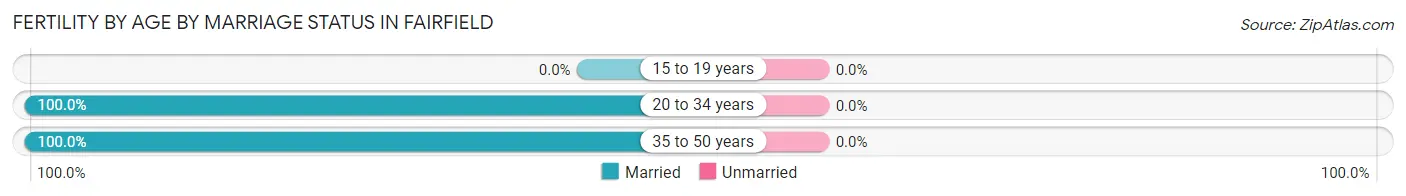
| Age Bracket | Married | Unmarried |
| 15 to 19 years | 0 (0.0%) | 0 (0.0%) |
| 20 to 34 years | 38 (100.0%) | 0 (0.0%) |
| 35 to 50 years | 10 (100.0%) | 0 (0.0%) |
| Total | 48 (100.0%) | 0 (0.0%) |
Fertility by Education in Fairfield
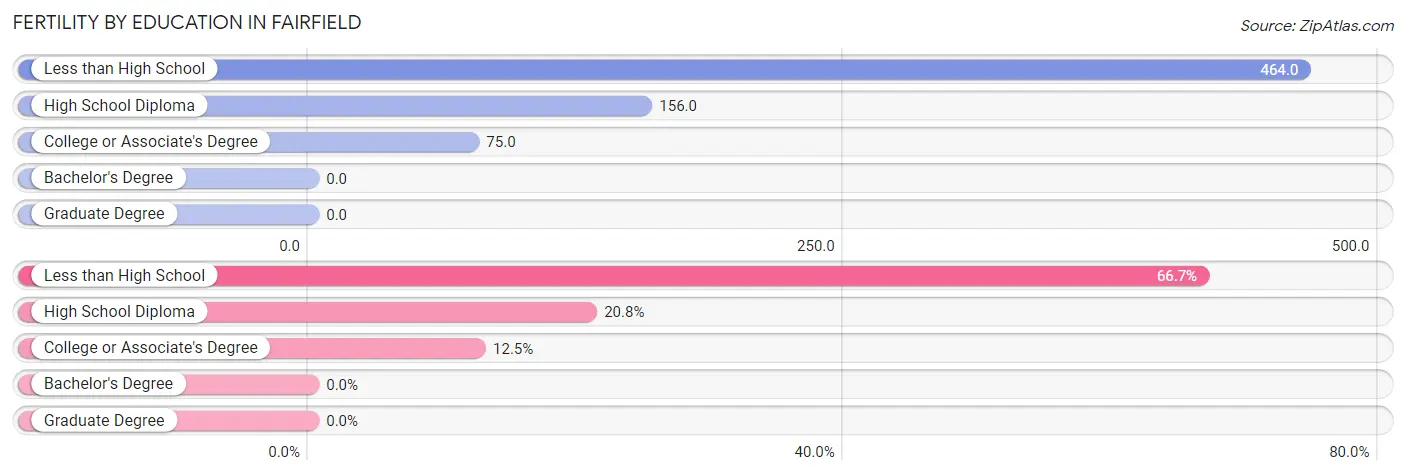
| Educational Attainment | Women with Births | Births / 1,000 Women |
| Less than High School | 32 (66.7%) | 464.0 |
| High School Diploma | 10 (20.8%) | 156.0 |
| College or Associate's Degree | 6 (12.5%) | 75.0 |
| Bachelor's Degree | 0 (0.0%) | 0.0 |
| Graduate Degree | 0 (0.0%) | 0.0 |
| Total | 48 (100.0%) | 196.0 |
Fertility by Education by Marriage Status in Fairfield
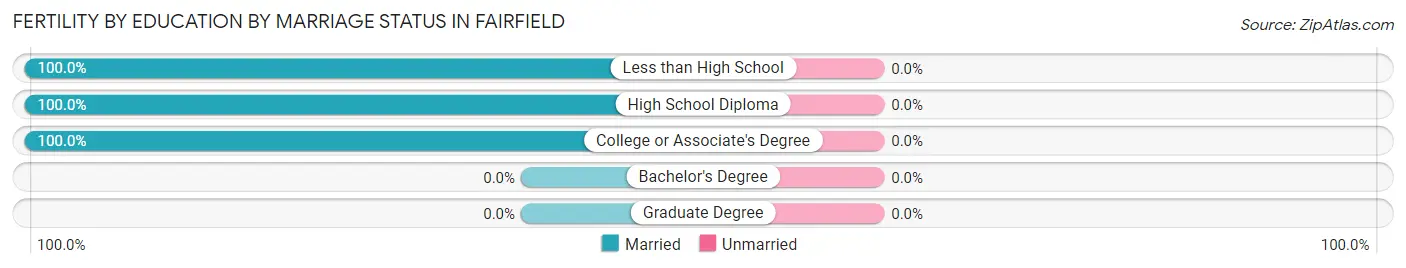
| Educational Attainment | Married | Unmarried |
| Less than High School | 32 (100.0%) | 0 (0.0%) |
| High School Diploma | 10 (100.0%) | 0 (0.0%) |
| College or Associate's Degree | 6 (100.0%) | 0 (0.0%) |
| Bachelor's Degree | 0 (0.0%) | 0 (0.0%) |
| Graduate Degree | 0 (0.0%) | 0 (0.0%) |
| Total | 48 (100.0%) | 0 (0.0%) |
Employment Characteristics in Fairfield
Employment by Class of Employer in Fairfield
Among the 332 employed individuals in Fairfield, private company employees (189 | 56.9%), local government employees (38 | 11.5%), and self-employed (not incorporated) (28 | 8.4%) make up the most common classes of employment.
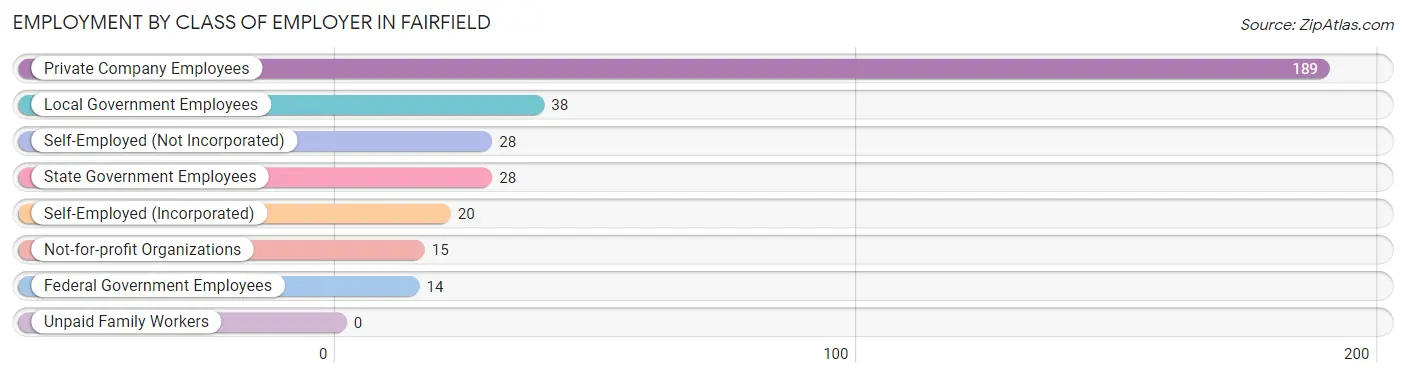
| Employer Class | # Employees | % Employees |
| Private Company Employees | 189 | 56.9% |
| Self-Employed (Incorporated) | 20 | 6.0% |
| Self-Employed (Not Incorporated) | 28 | 8.4% |
| Not-for-profit Organizations | 15 | 4.5% |
| Local Government Employees | 38 | 11.5% |
| State Government Employees | 28 | 8.4% |
| Federal Government Employees | 14 | 4.2% |
| Unpaid Family Workers | 0 | 0.0% |
| Total | 332 | 100.0% |
Employment Status by Age in Fairfield
According to the labor force statistics for Fairfield, out of the total population over 16 years of age (575), 62.8% or 361 individuals are in the labor force, with 7.5% or 27 of them unemployed. The age group with the highest labor force participation rate is 20 to 24 years, with 100.0% or 27 individuals in the labor force. Within the labor force, the 20 to 24 years age range has the highest percentage of unemployed individuals, with 100.0% or 27 of them being unemployed.
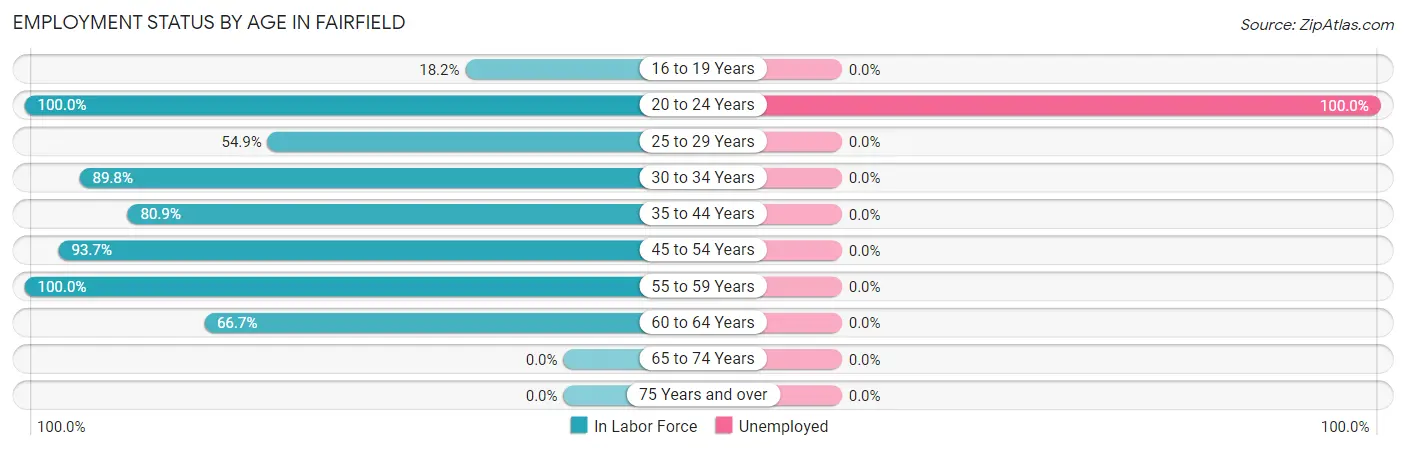
| Age Bracket | In Labor Force | Unemployed |
| 16 to 19 Years | 12 (18.2%) | 0 (0.0%) |
| 20 to 24 Years | 27 (100.0%) | 27 (100.0%) |
| 25 to 29 Years | 50 (54.9%) | 0 (0.0%) |
| 30 to 34 Years | 53 (89.8%) | 0 (0.0%) |
| 35 to 44 Years | 76 (80.9%) | 0 (0.0%) |
| 45 to 54 Years | 119 (93.7%) | 0 (0.0%) |
| 55 to 59 Years | 20 (100.0%) | 0 (0.0%) |
| 60 to 64 Years | 4 (66.7%) | 0 (0.0%) |
| 65 to 74 Years | 0 (0.0%) | 0 (0.0%) |
| 75 Years and over | 0 (0.0%) | 0 (0.0%) |
| Total | 361 (62.8%) | 27 (7.5%) |
Employment Status by Educational Attainment in Fairfield
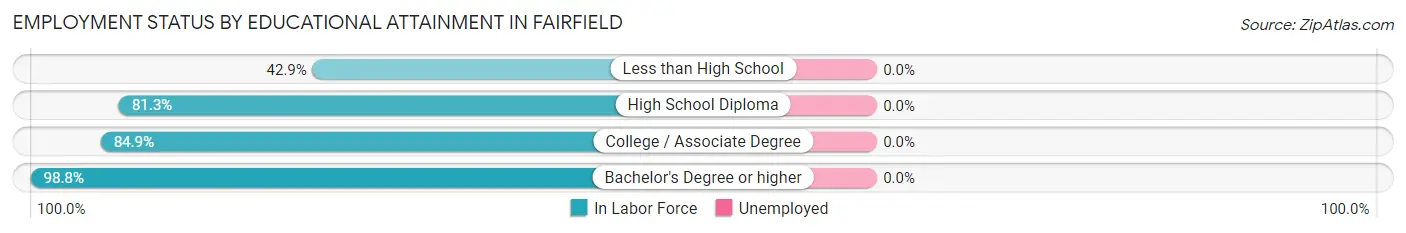
| Educational Attainment | In Labor Force | Unemployed |
| Less than High School | 24 (42.9%) | 0 (0.0%) |
| High School Diploma | 74 (81.3%) | 0 (0.0%) |
| College / Associate Degree | 141 (84.9%) | 0 (0.0%) |
| Bachelor's Degree or higher | 83 (98.8%) | 0 (0.0%) |
| Total | 322 (81.1%) | 0 (0.0%) |
Employment Occupations by Sex in Fairfield
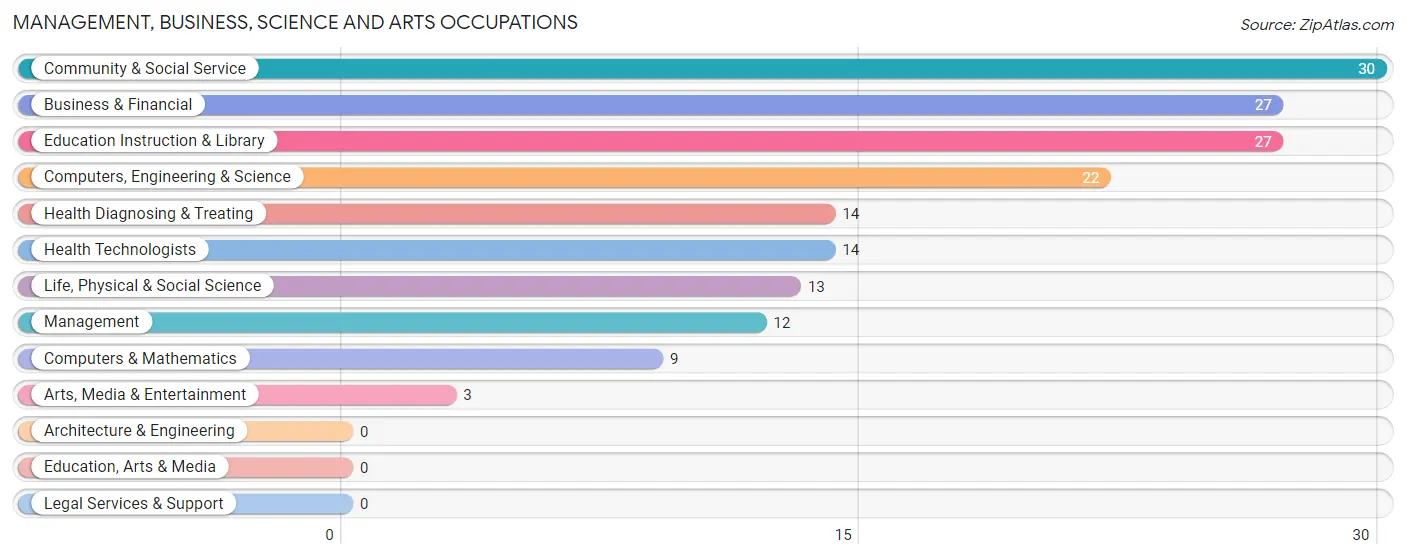
Management, Business, Science and Arts Occupations
The most common Management, Business, Science and Arts occupations in Fairfield are Community & Social Service (30 | 9.0%), Business & Financial (27 | 8.1%), Education Instruction & Library (27 | 8.1%), Computers, Engineering & Science (22 | 6.6%), and Health Diagnosing & Treating (14 | 4.2%).
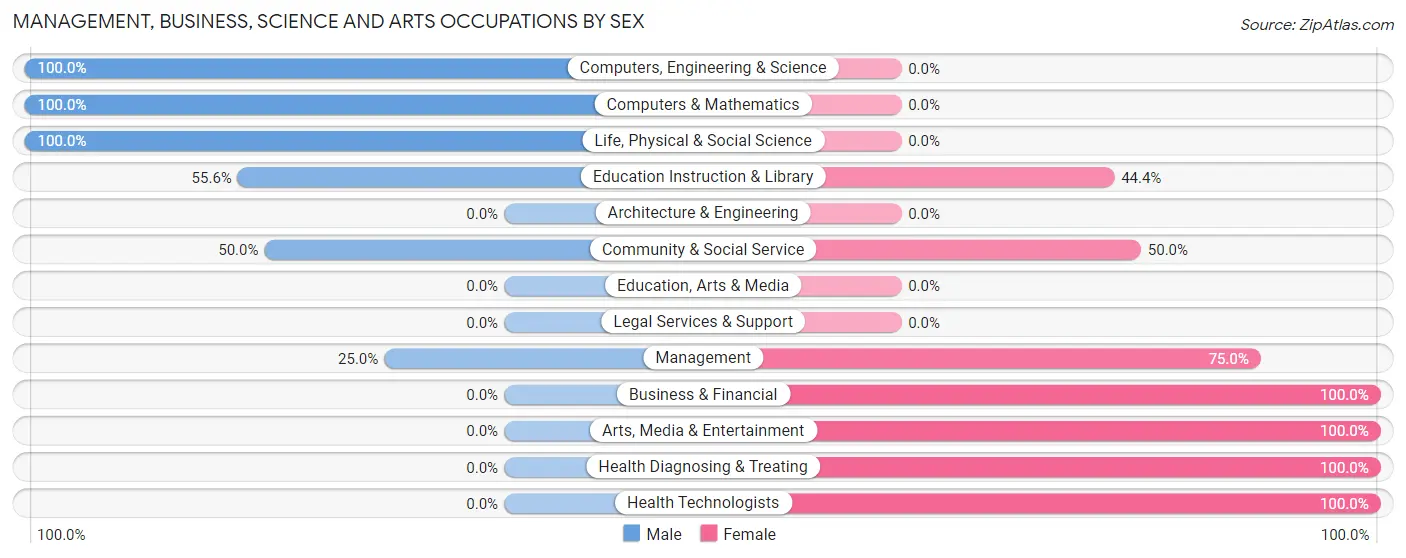
Management, Business, Science and Arts Occupations by Sex
Within the Management, Business, Science and Arts occupations in Fairfield, the most male-oriented occupations are Computers, Engineering & Science (100.0%), Computers & Mathematics (100.0%), and Life, Physical & Social Science (100.0%), while the most female-oriented occupations are Business & Financial (100.0%), Arts, Media & Entertainment (100.0%), and Health Diagnosing & Treating (100.0%).
| Occupation | Male | Female |
| Management | 3 (25.0%) | 9 (75.0%) |
| Business & Financial | 0 (0.0%) | 27 (100.0%) |
| Computers, Engineering & Science | 22 (100.0%) | 0 (0.0%) |
| Computers & Mathematics | 9 (100.0%) | 0 (0.0%) |
| Architecture & Engineering | 0 (0.0%) | 0 (0.0%) |
| Life, Physical & Social Science | 13 (100.0%) | 0 (0.0%) |
| Community & Social Service | 15 (50.0%) | 15 (50.0%) |
| Education, Arts & Media | 0 (0.0%) | 0 (0.0%) |
| Legal Services & Support | 0 (0.0%) | 0 (0.0%) |
| Education Instruction & Library | 15 (55.6%) | 12 (44.4%) |
| Arts, Media & Entertainment | 0 (0.0%) | 3 (100.0%) |
| Health Diagnosing & Treating | 0 (0.0%) | 14 (100.0%) |
| Health Technologists | 0 (0.0%) | 14 (100.0%) |
| Total (Category) | 40 (38.1%) | 65 (61.9%) |
| Total (Overall) | 185 (55.4%) | 149 (44.6%) |
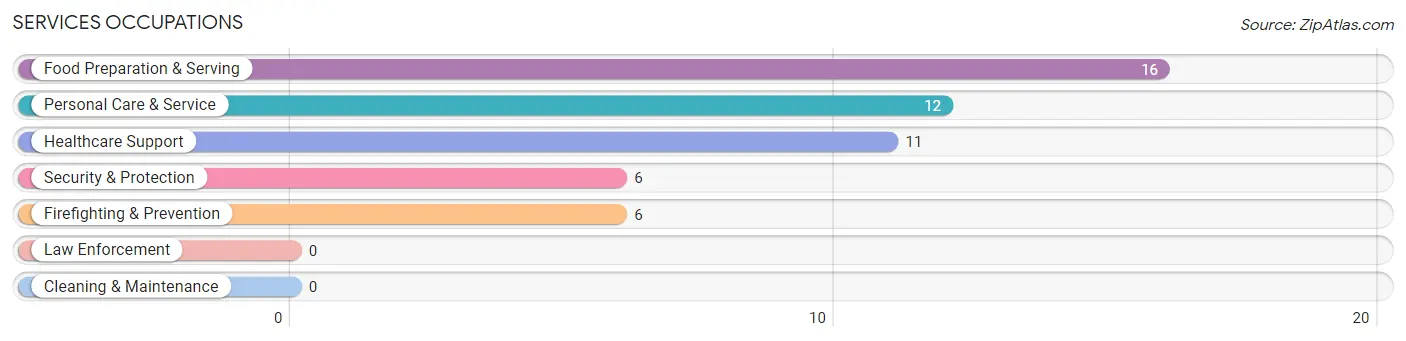
Services Occupations
The most common Services occupations in Fairfield are Food Preparation & Serving (16 | 4.8%), Personal Care & Service (12 | 3.6%), Healthcare Support (11 | 3.3%), Security & Protection (6 | 1.8%), and Firefighting & Prevention (6 | 1.8%).
Services Occupations by Sex
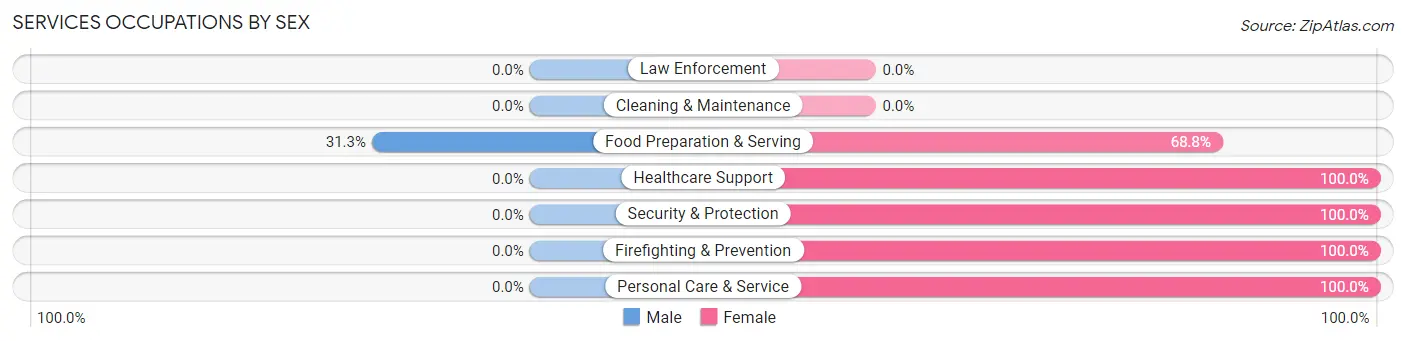
| Occupation | Male | Female |
| Healthcare Support | 0 (0.0%) | 11 (100.0%) |
| Security & Protection | 0 (0.0%) | 6 (100.0%) |
| Firefighting & Prevention | 0 (0.0%) | 6 (100.0%) |
| Law Enforcement | 0 (0.0%) | 0 (0.0%) |
| Food Preparation & Serving | 5 (31.2%) | 11 (68.8%) |
| Cleaning & Maintenance | 0 (0.0%) | 0 (0.0%) |
| Personal Care & Service | 0 (0.0%) | 12 (100.0%) |
| Total (Category) | 5 (11.1%) | 40 (88.9%) |
| Total (Overall) | 185 (55.4%) | 149 (44.6%) |
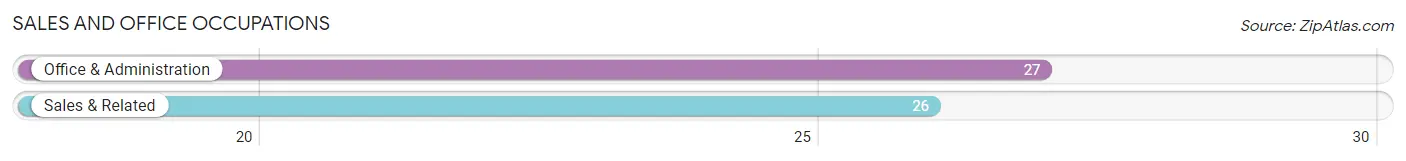
Sales and Office Occupations
The most common Sales and Office occupations in Fairfield are Office & Administration (27 | 8.1%), and Sales & Related (26 | 7.8%).
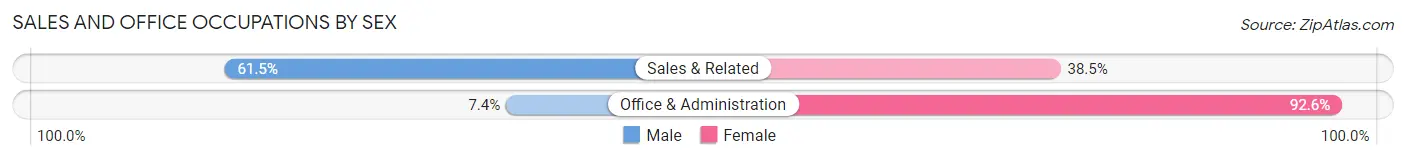
Sales and Office Occupations by Sex
| Occupation | Male | Female |
| Sales & Related | 16 (61.5%) | 10 (38.5%) |
| Office & Administration | 2 (7.4%) | 25 (92.6%) |
| Total (Category) | 18 (34.0%) | 35 (66.0%) |
| Total (Overall) | 185 (55.4%) | 149 (44.6%) |
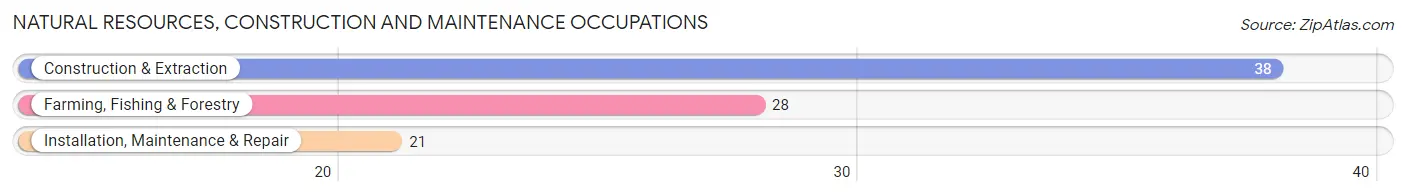
Natural Resources, Construction and Maintenance Occupations
The most common Natural Resources, Construction and Maintenance occupations in Fairfield are Construction & Extraction (38 | 11.4%), Farming, Fishing & Forestry (28 | 8.4%), and Installation, Maintenance & Repair (21 | 6.3%).
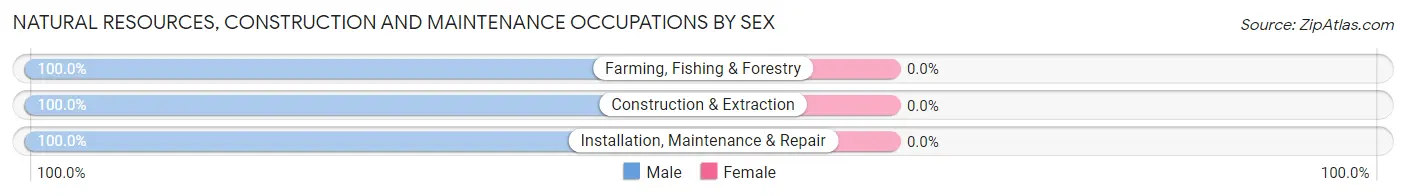
Natural Resources, Construction and Maintenance Occupations by Sex
| Occupation | Male | Female |
| Farming, Fishing & Forestry | 28 (100.0%) | 0 (0.0%) |
| Construction & Extraction | 38 (100.0%) | 0 (0.0%) |
| Installation, Maintenance & Repair | 21 (100.0%) | 0 (0.0%) |
| Total (Category) | 87 (100.0%) | 0 (0.0%) |
| Total (Overall) | 185 (55.4%) | 149 (44.6%) |
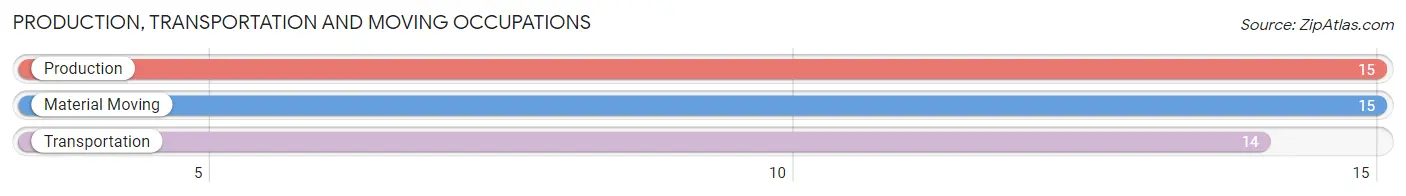
Production, Transportation and Moving Occupations
The most common Production, Transportation and Moving occupations in Fairfield are Production (15 | 4.5%), Material Moving (15 | 4.5%), and Transportation (14 | 4.2%).
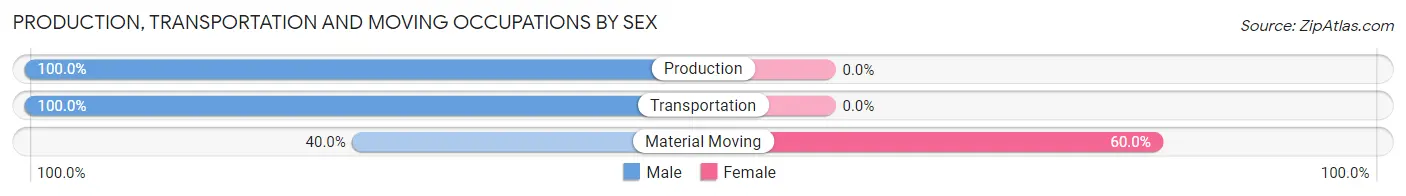
Production, Transportation and Moving Occupations by Sex
| Occupation | Male | Female |
| Production | 15 (100.0%) | 0 (0.0%) |
| Transportation | 14 (100.0%) | 0 (0.0%) |
| Material Moving | 6 (40.0%) | 9 (60.0%) |
| Total (Category) | 35 (79.5%) | 9 (20.4%) |
| Total (Overall) | 185 (55.4%) | 149 (44.6%) |
Employment Industries by Sex in Fairfield
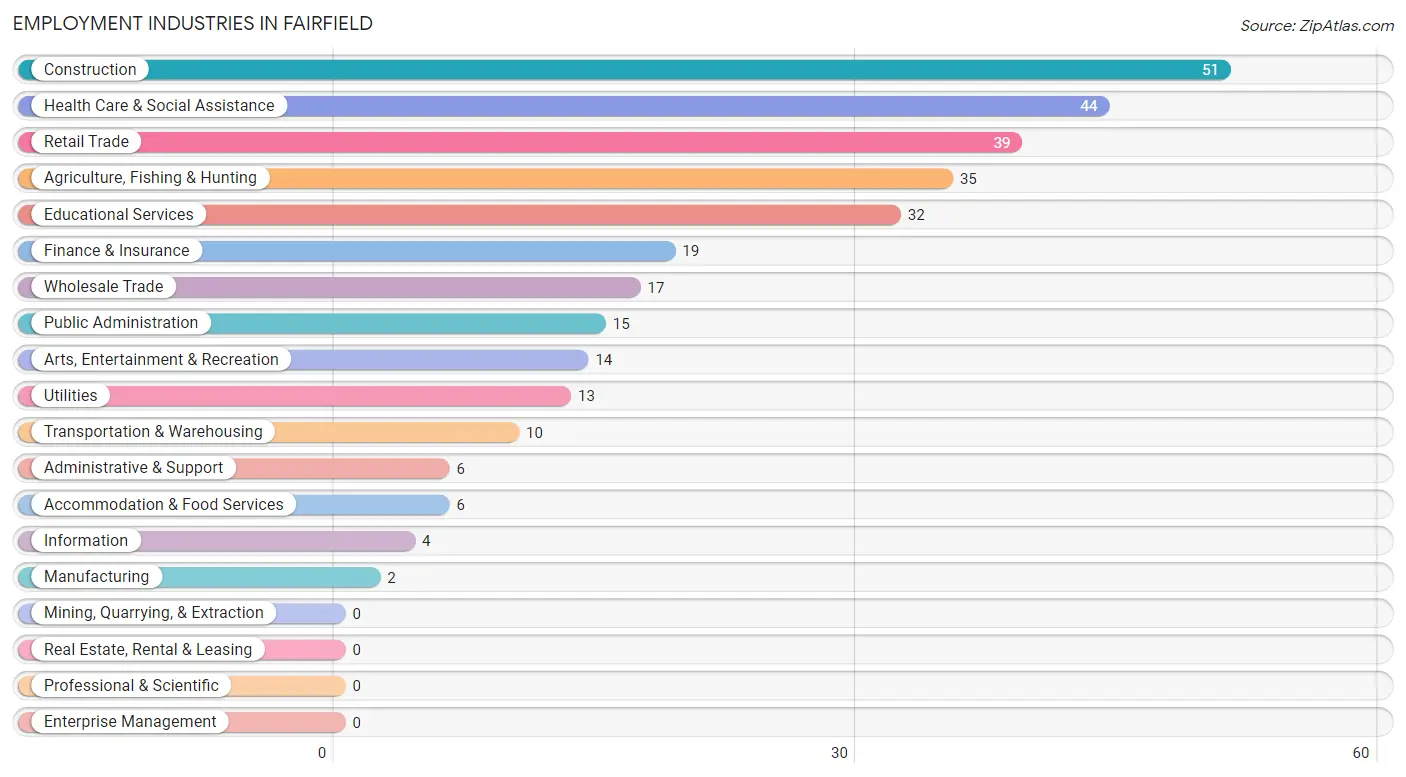
Employment Industries in Fairfield
The major employment industries in Fairfield include Construction (51 | 15.3%), Health Care & Social Assistance (44 | 13.2%), Retail Trade (39 | 11.7%), Agriculture, Fishing & Hunting (35 | 10.5%), and Educational Services (32 | 9.6%).
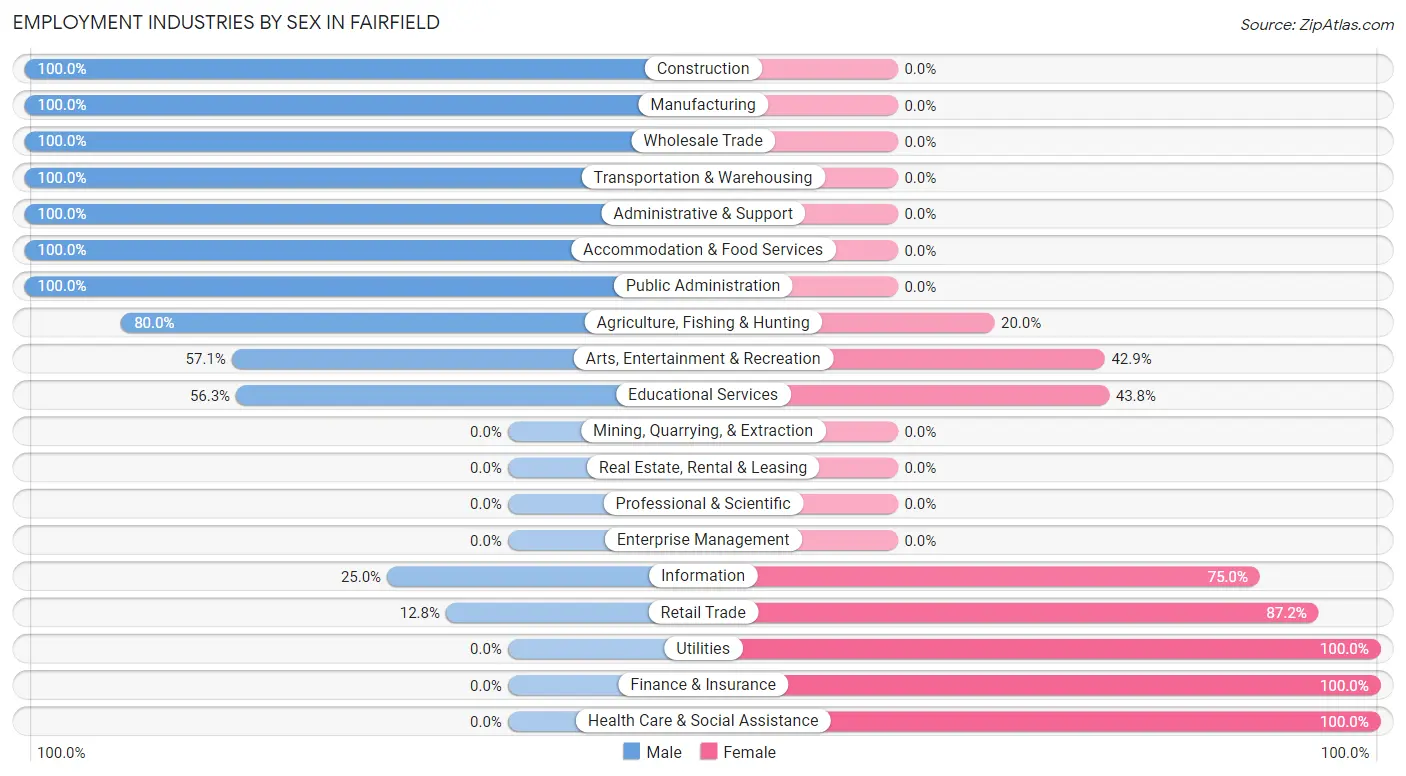
Employment Industries by Sex in Fairfield
The Fairfield industries that see more men than women are Construction (100.0%), Manufacturing (100.0%), and Wholesale Trade (100.0%), whereas the industries that tend to have a higher number of women are Utilities (100.0%), Finance & Insurance (100.0%), and Health Care & Social Assistance (100.0%).
| Industry | Male | Female |
| Agriculture, Fishing & Hunting | 28 (80.0%) | 7 (20.0%) |
| Mining, Quarrying, & Extraction | 0 (0.0%) | 0 (0.0%) |
| Construction | 51 (100.0%) | 0 (0.0%) |
| Manufacturing | 2 (100.0%) | 0 (0.0%) |
| Wholesale Trade | 17 (100.0%) | 0 (0.0%) |
| Retail Trade | 5 (12.8%) | 34 (87.2%) |
| Transportation & Warehousing | 10 (100.0%) | 0 (0.0%) |
| Utilities | 0 (0.0%) | 13 (100.0%) |
| Information | 1 (25.0%) | 3 (75.0%) |
| Finance & Insurance | 0 (0.0%) | 19 (100.0%) |
| Real Estate, Rental & Leasing | 0 (0.0%) | 0 (0.0%) |
| Professional & Scientific | 0 (0.0%) | 0 (0.0%) |
| Enterprise Management | 0 (0.0%) | 0 (0.0%) |
| Administrative & Support | 6 (100.0%) | 0 (0.0%) |
| Educational Services | 18 (56.2%) | 14 (43.8%) |
| Health Care & Social Assistance | 0 (0.0%) | 44 (100.0%) |
| Arts, Entertainment & Recreation | 8 (57.1%) | 6 (42.9%) |
| Accommodation & Food Services | 6 (100.0%) | 0 (0.0%) |
| Public Administration | 15 (100.0%) | 0 (0.0%) |
| Total | 185 (55.4%) | 149 (44.6%) |
Education in Fairfield
School Enrollment in Fairfield
The most common levels of schooling among the 193 students in Fairfield are elementary school (59 | 30.6%), high school (57 | 29.5%), and middle school (34 | 17.6%).
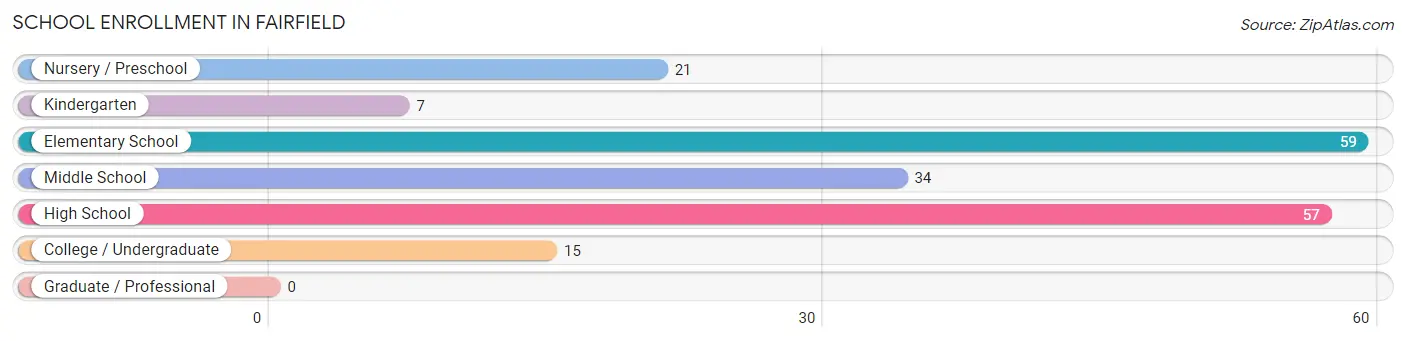
| School Level | # Students | % Students |
| Nursery / Preschool | 21 | 10.9% |
| Kindergarten | 7 | 3.6% |
| Elementary School | 59 | 30.6% |
| Middle School | 34 | 17.6% |
| High School | 57 | 29.5% |
| College / Undergraduate | 15 | 7.8% |
| Graduate / Professional | 0 | 0.0% |
| Total | 193 | 100.0% |
School Enrollment by Age by Funding Source in Fairfield
Out of a total of 193 students who are enrolled in schools in Fairfield, 10 (5.2%) attend a private institution, while the remaining 183 (94.8%) are enrolled in public schools. The age group of 3 to 4 year olds has the highest likelihood of being enrolled in private schools, with 4 (44.4% in the age bracket) enrolled. Conversely, the age group of 5 to 9 year old has the lowest likelihood of being enrolled in a private school, with 75 (100.0% in the age bracket) attending a public institution.
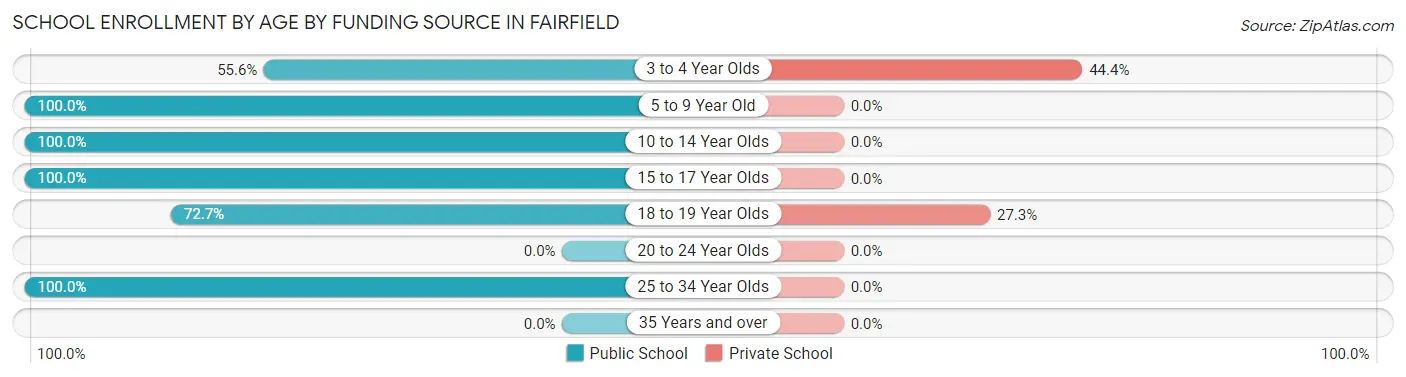
| Age Bracket | Public School | Private School |
| 3 to 4 Year Olds | 5 (55.6%) | 4 (44.4%) |
| 5 to 9 Year Old | 75 (100.0%) | 0 (0.0%) |
| 10 to 14 Year Olds | 37 (100.0%) | 0 (0.0%) |
| 15 to 17 Year Olds | 46 (100.0%) | 0 (0.0%) |
| 18 to 19 Year Olds | 16 (72.7%) | 6 (27.3%) |
| 20 to 24 Year Olds | 0 (0.0%) | 0 (0.0%) |
| 25 to 34 Year Olds | 4 (100.0%) | 0 (0.0%) |
| 35 Years and over | 0 (0.0%) | 0 (0.0%) |
| Total | 183 (94.8%) | 10 (5.2%) |
Educational Attainment by Field of Study in Fairfield
Science & technology (33 | 33.0%), education (29 | 29.0%), bio, nature & agricultural (17 | 17.0%), engineering (13 | 13.0%), and business (5 | 5.0%) are the most common fields of study among 100 individuals in Fairfield who have obtained a bachelor's degree or higher.
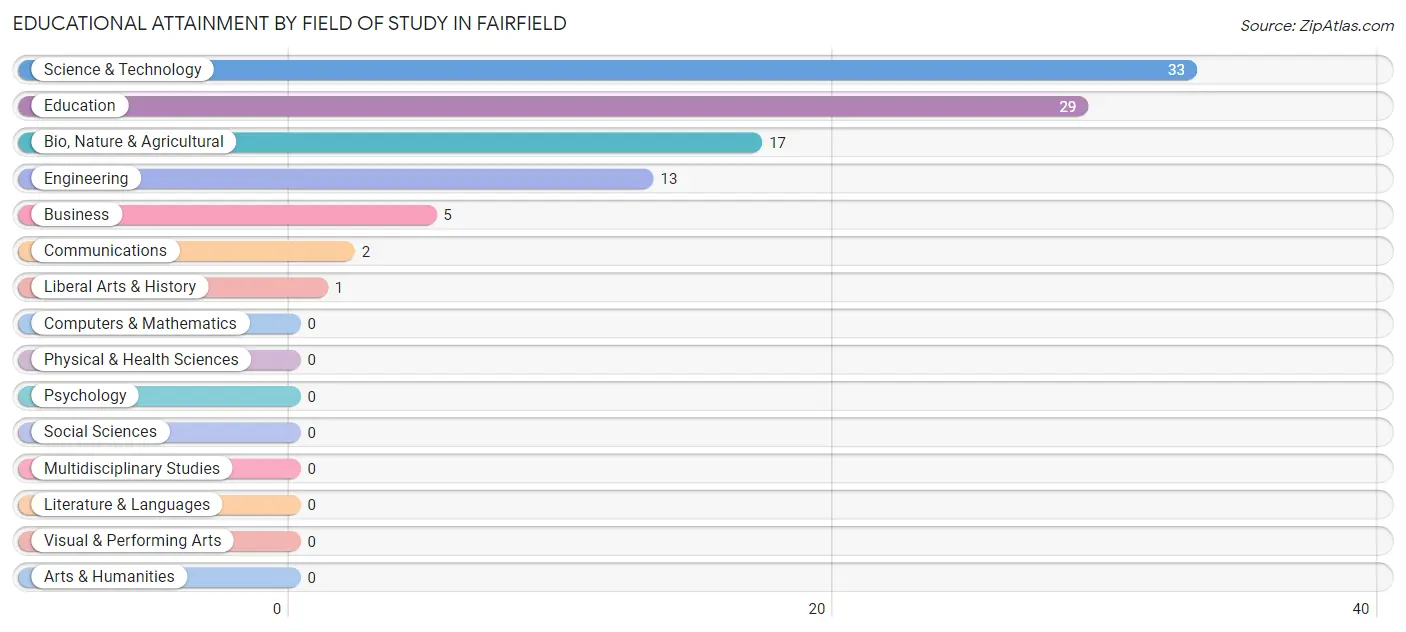
| Field of Study | # Graduates | % Graduates |
| Computers & Mathematics | 0 | 0.0% |
| Bio, Nature & Agricultural | 17 | 17.0% |
| Physical & Health Sciences | 0 | 0.0% |
| Psychology | 0 | 0.0% |
| Social Sciences | 0 | 0.0% |
| Engineering | 13 | 13.0% |
| Multidisciplinary Studies | 0 | 0.0% |
| Science & Technology | 33 | 33.0% |
| Business | 5 | 5.0% |
| Education | 29 | 29.0% |
| Literature & Languages | 0 | 0.0% |
| Liberal Arts & History | 1 | 1.0% |
| Visual & Performing Arts | 0 | 0.0% |
| Communications | 2 | 2.0% |
| Arts & Humanities | 0 | 0.0% |
| Total | 100 | 100.0% |
Transportation & Commute in Fairfield
Vehicle Availability by Sex in Fairfield
The most prevalent vehicle ownership categories in Fairfield are males with 2 vehicles (84, accounting for 45.9%) and females with 2 vehicles (52, making up 56.4%).
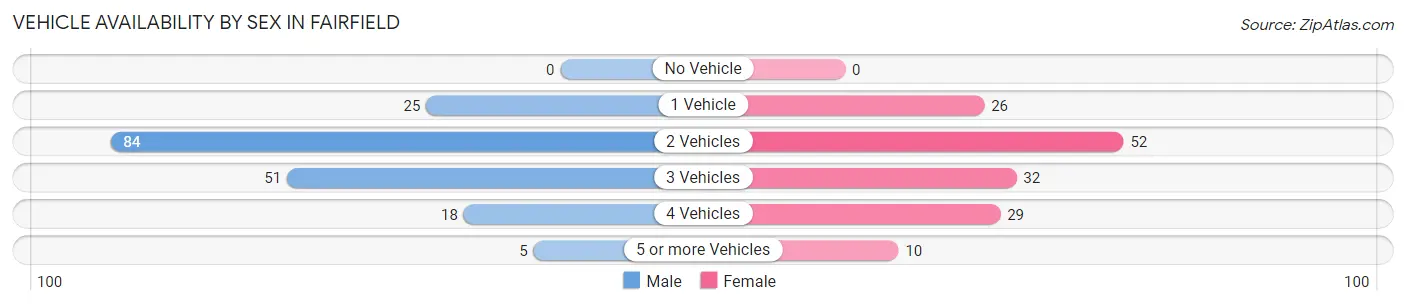
| Vehicles Available | Male | Female |
| No Vehicle | 0 (0.0%) | 0 (0.0%) |
| 1 Vehicle | 25 (13.7%) | 26 (17.4%) |
| 2 Vehicles | 84 (45.9%) | 52 (34.9%) |
| 3 Vehicles | 51 (27.9%) | 32 (21.5%) |
| 4 Vehicles | 18 (9.8%) | 29 (19.5%) |
| 5 or more Vehicles | 5 (2.7%) | 10 (6.7%) |
| Total | 183 (100.0%) | 149 (100.0%) |
Commute Time in Fairfield
The most frequently occuring commute durations in Fairfield are 10 to 14 minutes (56 commuters, 19.9%), 45 to 59 minutes (53 commuters, 18.9%), and 20 to 24 minutes (44 commuters, 15.7%).
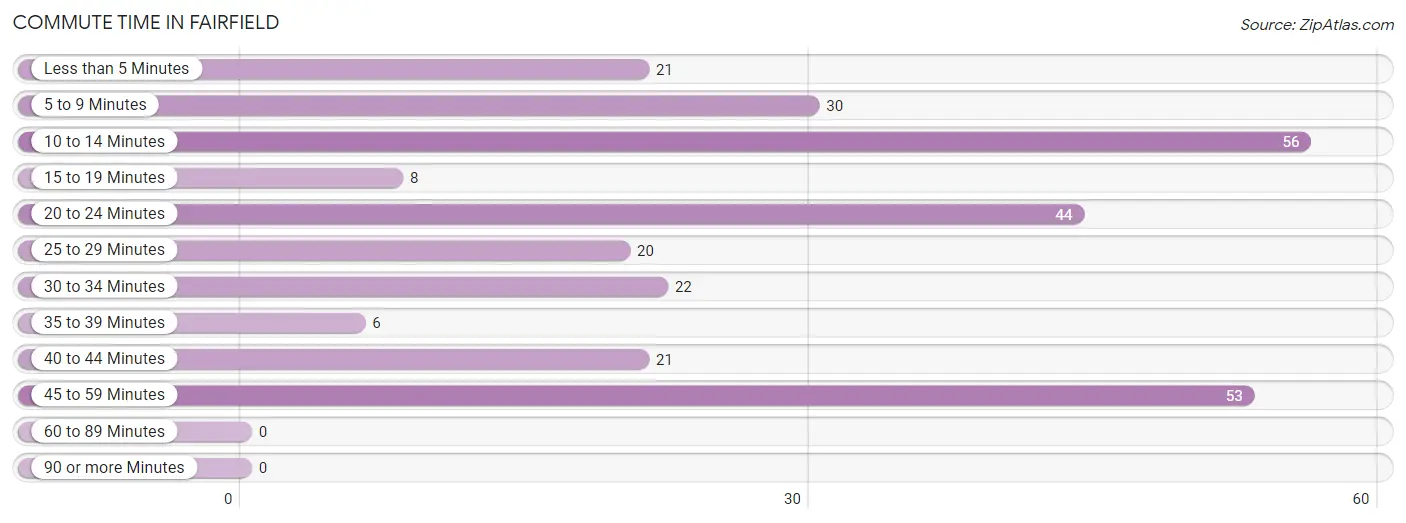
| Commute Time | # Commuters | % Commuters |
| Less than 5 Minutes | 21 | 7.5% |
| 5 to 9 Minutes | 30 | 10.7% |
| 10 to 14 Minutes | 56 | 19.9% |
| 15 to 19 Minutes | 8 | 2.9% |
| 20 to 24 Minutes | 44 | 15.7% |
| 25 to 29 Minutes | 20 | 7.1% |
| 30 to 34 Minutes | 22 | 7.8% |
| 35 to 39 Minutes | 6 | 2.1% |
| 40 to 44 Minutes | 21 | 7.5% |
| 45 to 59 Minutes | 53 | 18.9% |
| 60 to 89 Minutes | 0 | 0.0% |
| 90 or more Minutes | 0 | 0.0% |
Commute Time by Sex in Fairfield
The most common commute times in Fairfield are 20 to 24 minutes (44 commuters, 28.2%) for males and 45 to 59 minutes (36 commuters, 28.8%) for females.
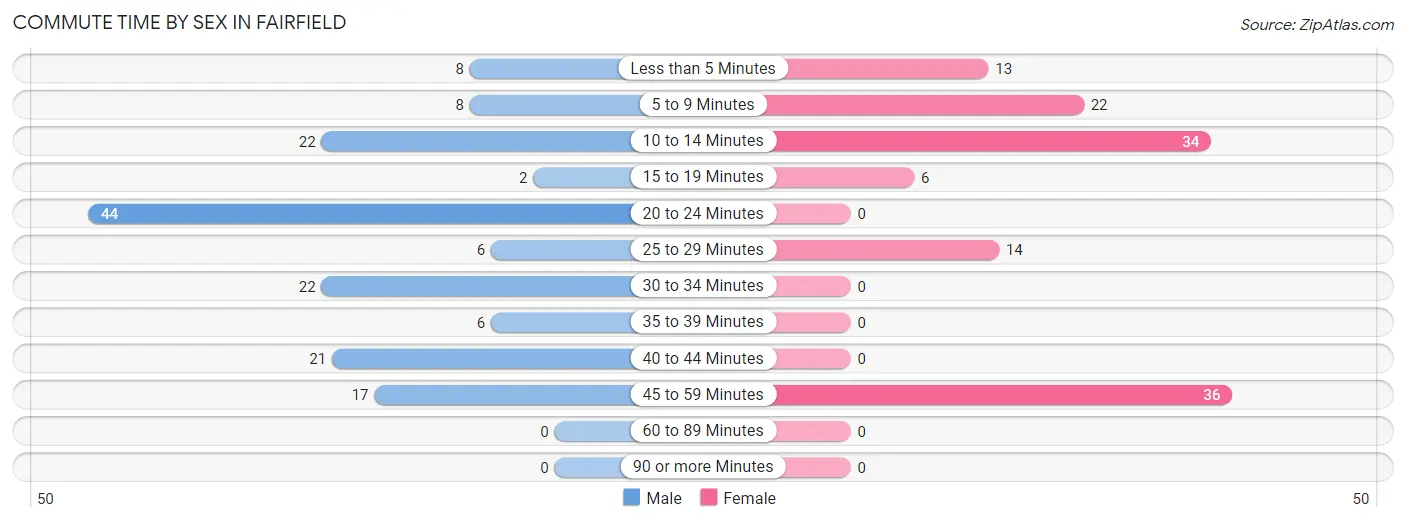
| Commute Time | Male | Female |
| Less than 5 Minutes | 8 (5.1%) | 13 (10.4%) |
| 5 to 9 Minutes | 8 (5.1%) | 22 (17.6%) |
| 10 to 14 Minutes | 22 (14.1%) | 34 (27.2%) |
| 15 to 19 Minutes | 2 (1.3%) | 6 (4.8%) |
| 20 to 24 Minutes | 44 (28.2%) | 0 (0.0%) |
| 25 to 29 Minutes | 6 (3.8%) | 14 (11.2%) |
| 30 to 34 Minutes | 22 (14.1%) | 0 (0.0%) |
| 35 to 39 Minutes | 6 (3.8%) | 0 (0.0%) |
| 40 to 44 Minutes | 21 (13.5%) | 0 (0.0%) |
| 45 to 59 Minutes | 17 (10.9%) | 36 (28.8%) |
| 60 to 89 Minutes | 0 (0.0%) | 0 (0.0%) |
| 90 or more Minutes | 0 (0.0%) | 0 (0.0%) |
Time of Departure to Work by Sex in Fairfield
The most frequent times of departure to work in Fairfield are 7:30 AM to 7:59 AM (60, 38.5%) for males and 8:00 AM to 8:29 AM (42, 33.6%) for females.
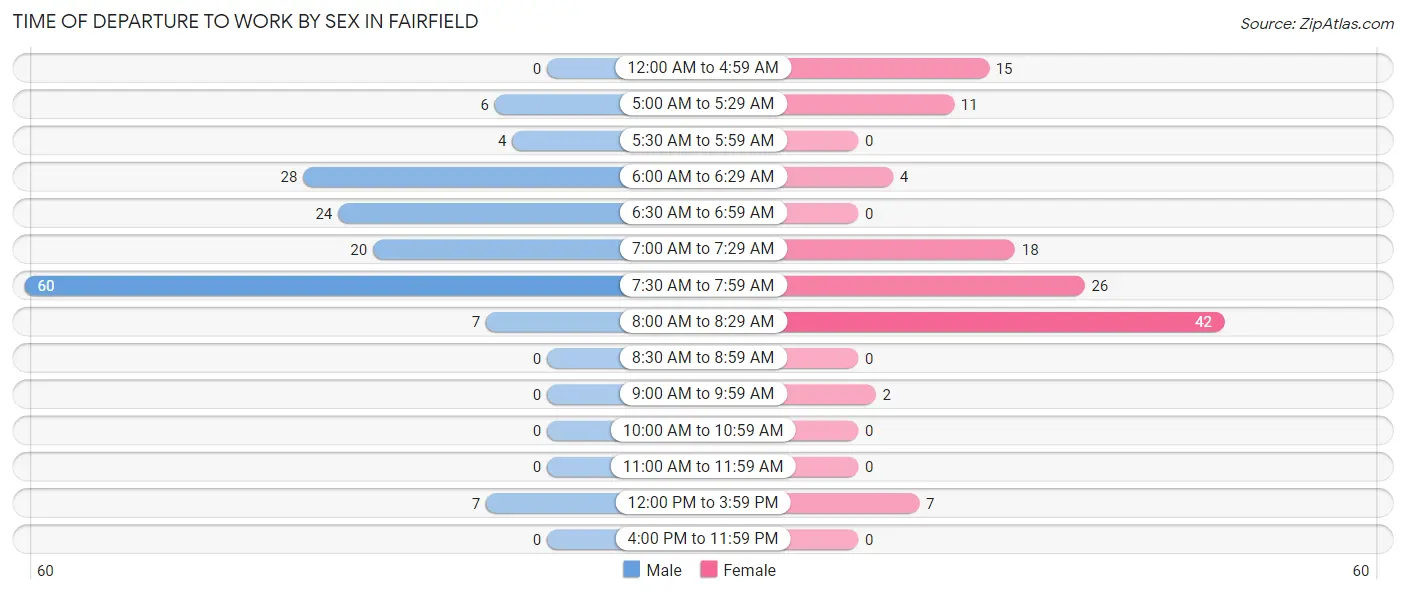
| Time of Departure | Male | Female |
| 12:00 AM to 4:59 AM | 0 (0.0%) | 15 (12.0%) |
| 5:00 AM to 5:29 AM | 6 (3.8%) | 11 (8.8%) |
| 5:30 AM to 5:59 AM | 4 (2.6%) | 0 (0.0%) |
| 6:00 AM to 6:29 AM | 28 (17.9%) | 4 (3.2%) |
| 6:30 AM to 6:59 AM | 24 (15.4%) | 0 (0.0%) |
| 7:00 AM to 7:29 AM | 20 (12.8%) | 18 (14.4%) |
| 7:30 AM to 7:59 AM | 60 (38.5%) | 26 (20.8%) |
| 8:00 AM to 8:29 AM | 7 (4.5%) | 42 (33.6%) |
| 8:30 AM to 8:59 AM | 0 (0.0%) | 0 (0.0%) |
| 9:00 AM to 9:59 AM | 0 (0.0%) | 2 (1.6%) |
| 10:00 AM to 10:59 AM | 0 (0.0%) | 0 (0.0%) |
| 11:00 AM to 11:59 AM | 0 (0.0%) | 0 (0.0%) |
| 12:00 PM to 3:59 PM | 7 (4.5%) | 7 (5.6%) |
| 4:00 PM to 11:59 PM | 0 (0.0%) | 0 (0.0%) |
| Total | 156 (100.0%) | 125 (100.0%) |
Housing Occupancy in Fairfield
Occupancy by Ownership in Fairfield
Of the total 295 dwellings in Fairfield, owner-occupied units account for 208 (70.5%), while renter-occupied units make up 87 (29.5%).
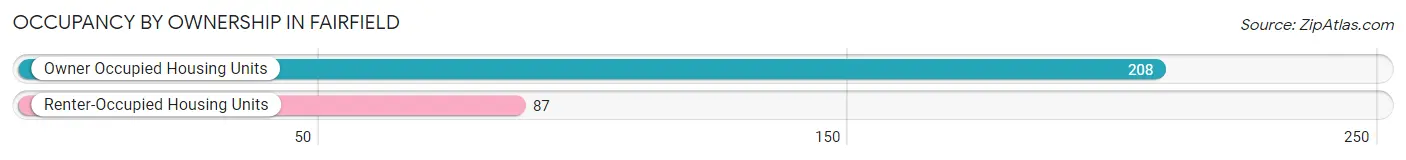
| Occupancy | # Housing Units | % Housing Units |
| Owner Occupied Housing Units | 208 | 70.5% |
| Renter-Occupied Housing Units | 87 | 29.5% |
| Total Occupied Housing Units | 295 | 100.0% |
Occupancy by Household Size in Fairfield
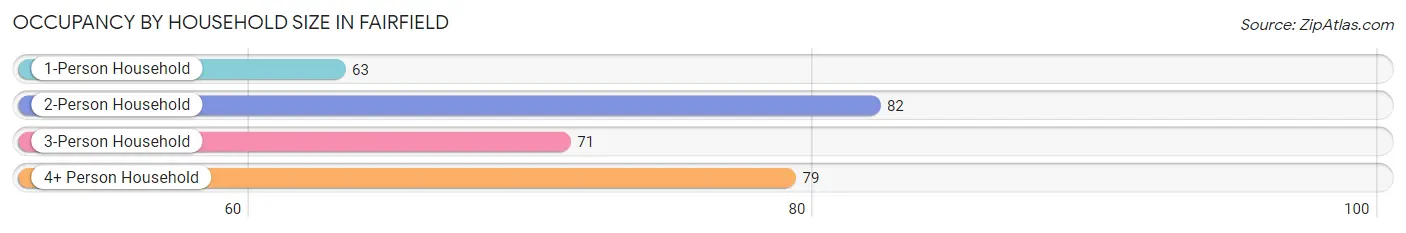
| Household Size | # Housing Units | % Housing Units |
| 1-Person Household | 63 | 21.4% |
| 2-Person Household | 82 | 27.8% |
| 3-Person Household | 71 | 24.1% |
| 4+ Person Household | 79 | 26.8% |
| Total Housing Units | 295 | 100.0% |
Occupancy by Ownership by Household Size in Fairfield
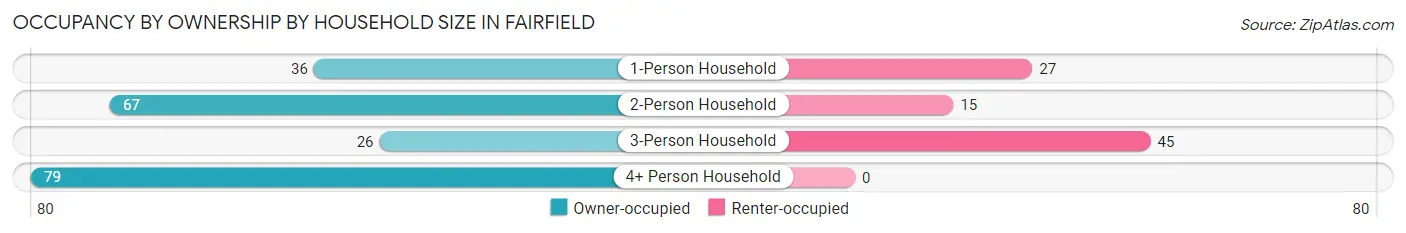
| Household Size | Owner-occupied | Renter-occupied |
| 1-Person Household | 36 (57.1%) | 27 (42.9%) |
| 2-Person Household | 67 (81.7%) | 15 (18.3%) |
| 3-Person Household | 26 (36.6%) | 45 (63.4%) |
| 4+ Person Household | 79 (100.0%) | 0 (0.0%) |
| Total Housing Units | 208 (70.5%) | 87 (29.5%) |
Occupancy by Educational Attainment in Fairfield
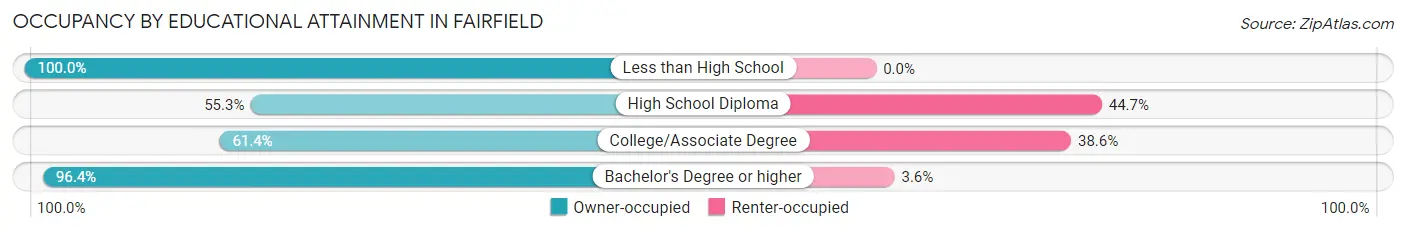
| Household Size | Owner-occupied | Renter-occupied |
| Less than High School | 32 (100.0%) | 0 (0.0%) |
| High School Diploma | 42 (55.3%) | 34 (44.7%) |
| College/Associate Degree | 81 (61.4%) | 51 (38.6%) |
| Bachelor's Degree or higher | 53 (96.4%) | 2 (3.6%) |
Occupancy by Age of Householder in Fairfield
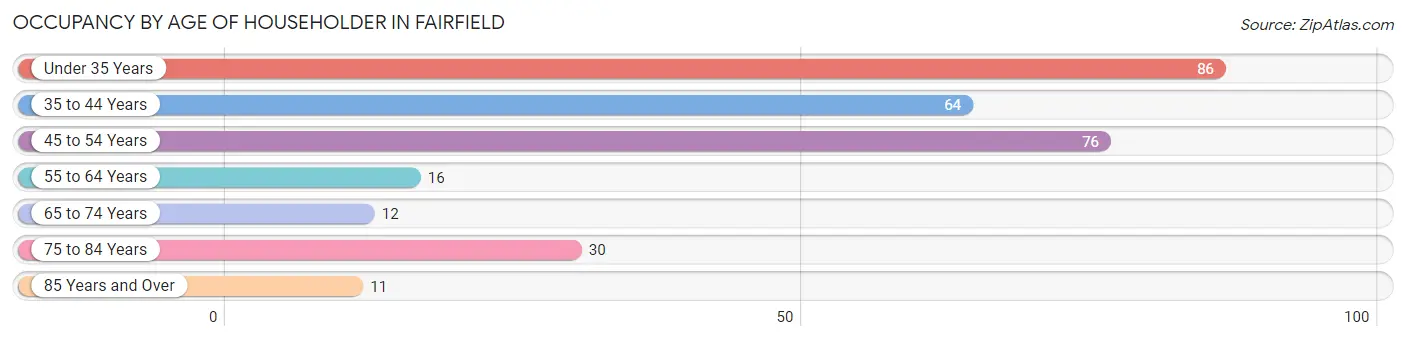
| Age Bracket | # Households | % Households |
| Under 35 Years | 86 | 29.1% |
| 35 to 44 Years | 64 | 21.7% |
| 45 to 54 Years | 76 | 25.8% |
| 55 to 64 Years | 16 | 5.4% |
| 65 to 74 Years | 12 | 4.1% |
| 75 to 84 Years | 30 | 10.2% |
| 85 Years and Over | 11 | 3.7% |
| Total | 295 | 100.0% |
Housing Finances in Fairfield
Median Income by Occupancy in Fairfield
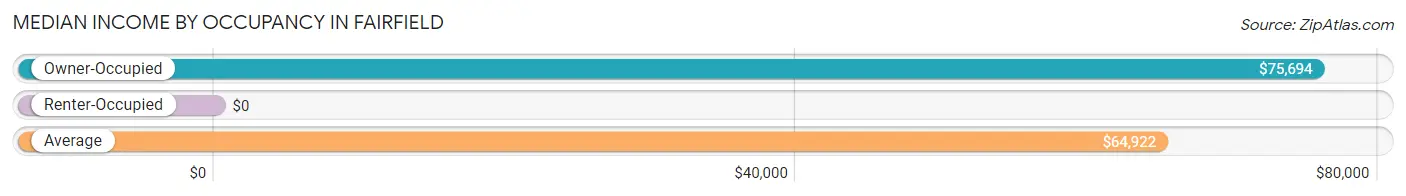
| Occupancy Type | # Households | Median Income |
| Owner-Occupied | 208 (70.5%) | $75,694 |
| Renter-Occupied | 87 (29.5%) | $0 |
| Average | 295 (100.0%) | $64,922 |
Occupancy by Householder Income Bracket in Fairfield
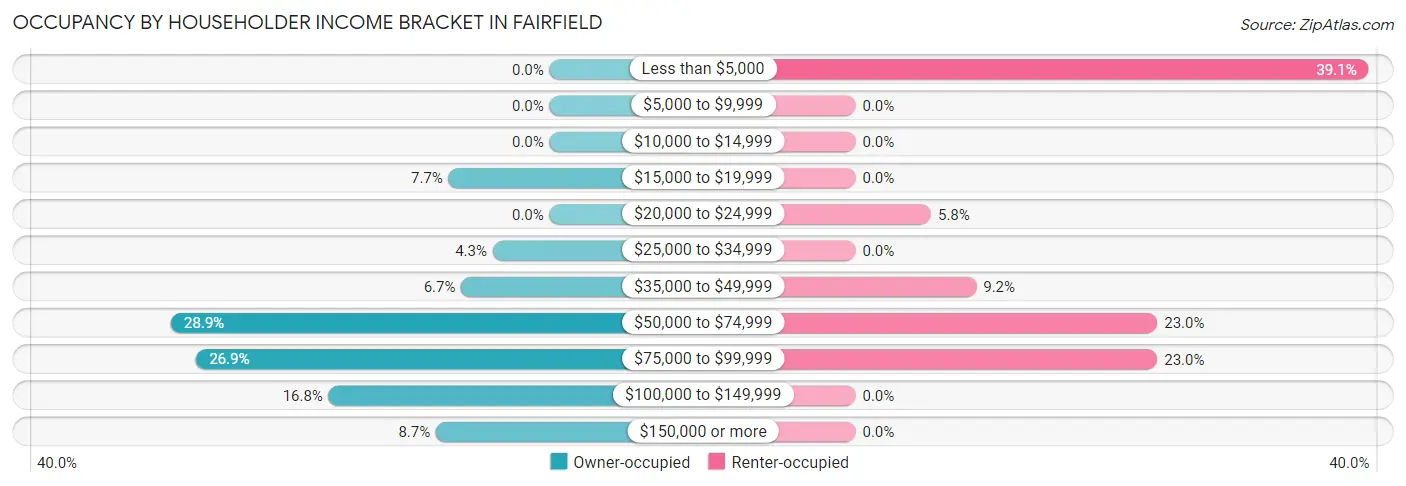
| Income Bracket | Owner-occupied | Renter-occupied |
| Less than $5,000 | 0 (0.0%) | 34 (39.1%) |
| $5,000 to $9,999 | 0 (0.0%) | 0 (0.0%) |
| $10,000 to $14,999 | 0 (0.0%) | 0 (0.0%) |
| $15,000 to $19,999 | 16 (7.7%) | 0 (0.0%) |
| $20,000 to $24,999 | 0 (0.0%) | 5 (5.8%) |
| $25,000 to $34,999 | 9 (4.3%) | 0 (0.0%) |
| $35,000 to $49,999 | 14 (6.7%) | 8 (9.2%) |
| $50,000 to $74,999 | 60 (28.8%) | 20 (23.0%) |
| $75,000 to $99,999 | 56 (26.9%) | 20 (23.0%) |
| $100,000 to $149,999 | 35 (16.8%) | 0 (0.0%) |
| $150,000 or more | 18 (8.6%) | 0 (0.0%) |
| Total | 208 (100.0%) | 87 (100.0%) |
Monthly Housing Cost Tiers in Fairfield
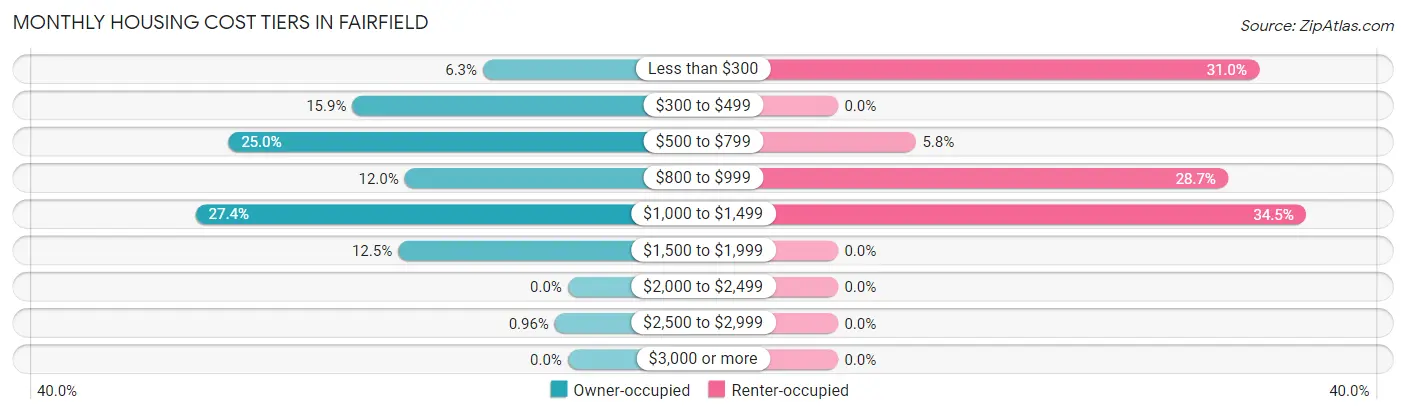
| Monthly Cost | Owner-occupied | Renter-occupied |
| Less than $300 | 13 (6.2%) | 27 (31.0%) |
| $300 to $499 | 33 (15.9%) | 0 (0.0%) |
| $500 to $799 | 52 (25.0%) | 5 (5.8%) |
| $800 to $999 | 25 (12.0%) | 25 (28.7%) |
| $1,000 to $1,499 | 57 (27.4%) | 30 (34.5%) |
| $1,500 to $1,999 | 26 (12.5%) | 0 (0.0%) |
| $2,000 to $2,499 | 0 (0.0%) | 0 (0.0%) |
| $2,500 to $2,999 | 2 (1.0%) | 0 (0.0%) |
| $3,000 or more | 0 (0.0%) | 0 (0.0%) |
| Total | 208 (100.0%) | 87 (100.0%) |
Physical Housing Characteristics in Fairfield
Housing Structures in Fairfield
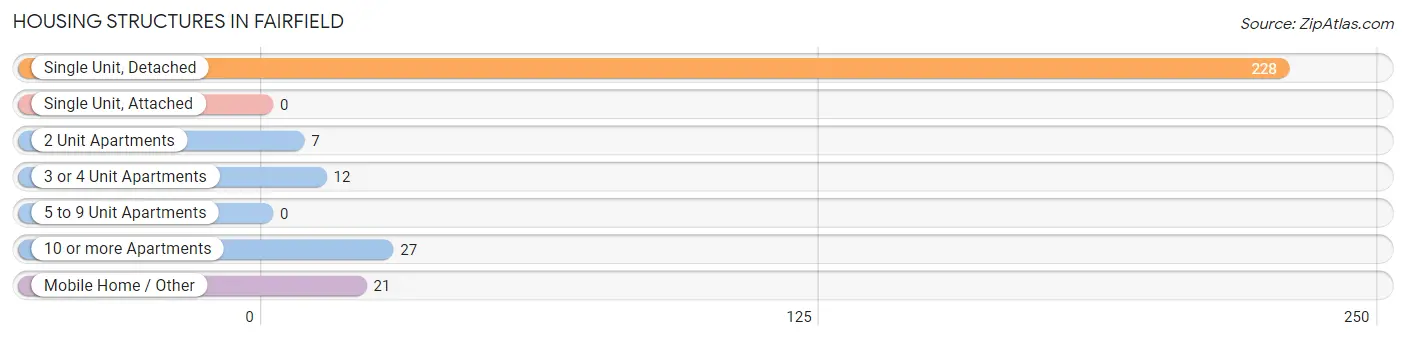
| Structure Type | # Housing Units | % Housing Units |
| Single Unit, Detached | 228 | 77.3% |
| Single Unit, Attached | 0 | 0.0% |
| 2 Unit Apartments | 7 | 2.4% |
| 3 or 4 Unit Apartments | 12 | 4.1% |
| 5 to 9 Unit Apartments | 0 | 0.0% |
| 10 or more Apartments | 27 | 9.1% |
| Mobile Home / Other | 21 | 7.1% |
| Total | 295 | 100.0% |
Housing Structures by Occupancy in Fairfield
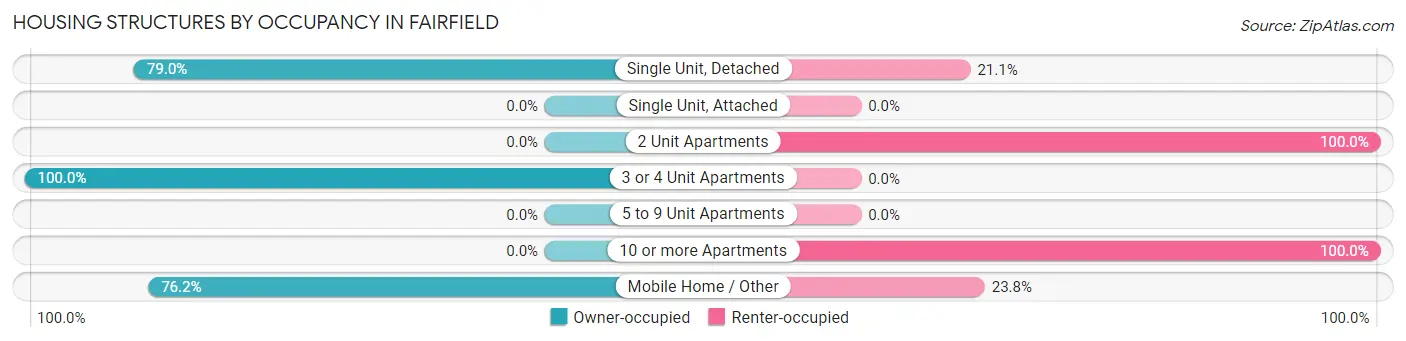
| Structure Type | Owner-occupied | Renter-occupied |
| Single Unit, Detached | 180 (78.9%) | 48 (21.0%) |
| Single Unit, Attached | 0 (0.0%) | 0 (0.0%) |
| 2 Unit Apartments | 0 (0.0%) | 7 (100.0%) |
| 3 or 4 Unit Apartments | 12 (100.0%) | 0 (0.0%) |
| 5 to 9 Unit Apartments | 0 (0.0%) | 0 (0.0%) |
| 10 or more Apartments | 0 (0.0%) | 27 (100.0%) |
| Mobile Home / Other | 16 (76.2%) | 5 (23.8%) |
| Total | 208 (70.5%) | 87 (29.5%) |
Housing Structures by Number of Rooms in Fairfield
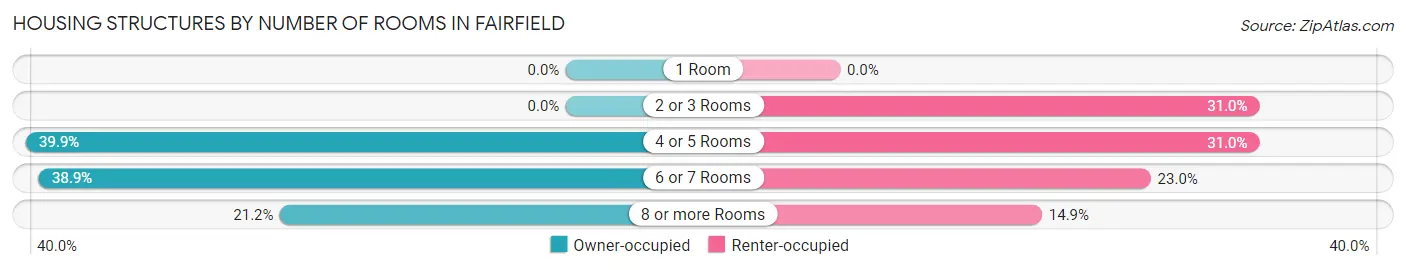
| Number of Rooms | Owner-occupied | Renter-occupied |
| 1 Room | 0 (0.0%) | 0 (0.0%) |
| 2 or 3 Rooms | 0 (0.0%) | 27 (31.0%) |
| 4 or 5 Rooms | 83 (39.9%) | 27 (31.0%) |
| 6 or 7 Rooms | 81 (38.9%) | 20 (23.0%) |
| 8 or more Rooms | 44 (21.1%) | 13 (14.9%) |
| Total | 208 (100.0%) | 87 (100.0%) |
Housing Structure by Heating Type in Fairfield
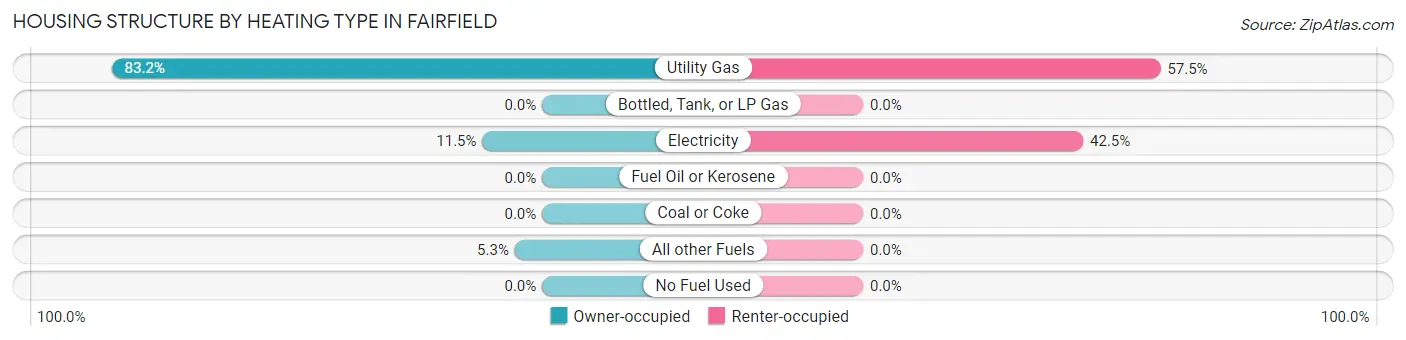
| Heating Type | Owner-occupied | Renter-occupied |
| Utility Gas | 173 (83.2%) | 50 (57.5%) |
| Bottled, Tank, or LP Gas | 0 (0.0%) | 0 (0.0%) |
| Electricity | 24 (11.5%) | 37 (42.5%) |
| Fuel Oil or Kerosene | 0 (0.0%) | 0 (0.0%) |
| Coal or Coke | 0 (0.0%) | 0 (0.0%) |
| All other Fuels | 11 (5.3%) | 0 (0.0%) |
| No Fuel Used | 0 (0.0%) | 0 (0.0%) |
| Total | 208 (100.0%) | 87 (100.0%) |
Household Vehicle Usage in Fairfield
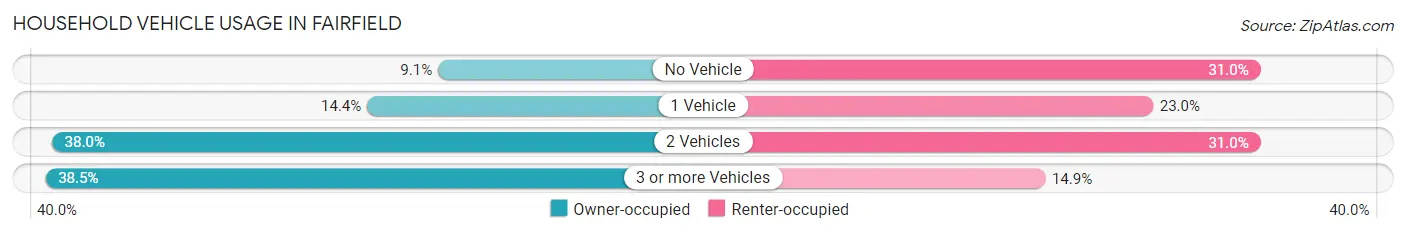
| Vehicles per Household | Owner-occupied | Renter-occupied |
| No Vehicle | 19 (9.1%) | 27 (31.0%) |
| 1 Vehicle | 30 (14.4%) | 20 (23.0%) |
| 2 Vehicles | 79 (38.0%) | 27 (31.0%) |
| 3 or more Vehicles | 80 (38.5%) | 13 (14.9%) |
| Total | 208 (100.0%) | 87 (100.0%) |
Real Estate & Mortgages in Fairfield
Real Estate and Mortgage Overview in Fairfield
| Characteristic | Without Mortgage | With Mortgage |
| Housing Units | 94 | 114 |
| Median Property Value | $184,300 | $170,800 |
| Median Household Income | $64,643 | $18 |
| Monthly Housing Costs | $503 | $0 |
| Real Estate Taxes | $2,163 | $0 |
Property Value by Mortgage Status in Fairfield
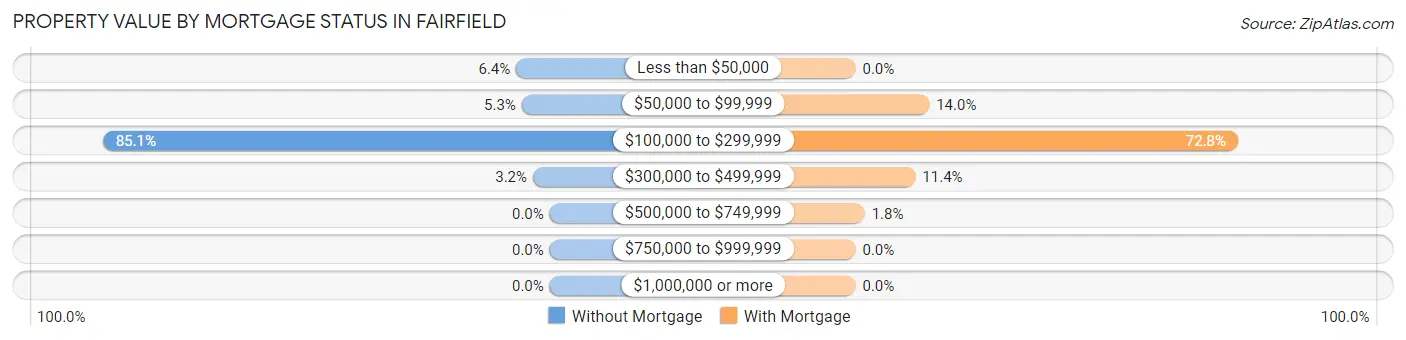
| Property Value | Without Mortgage | With Mortgage |
| Less than $50,000 | 6 (6.4%) | 0 (0.0%) |
| $50,000 to $99,999 | 5 (5.3%) | 16 (14.0%) |
| $100,000 to $299,999 | 80 (85.1%) | 83 (72.8%) |
| $300,000 to $499,999 | 3 (3.2%) | 13 (11.4%) |
| $500,000 to $749,999 | 0 (0.0%) | 2 (1.8%) |
| $750,000 to $999,999 | 0 (0.0%) | 0 (0.0%) |
| $1,000,000 or more | 0 (0.0%) | 0 (0.0%) |
| Total | 94 (100.0%) | 114 (100.0%) |
Household Income by Mortgage Status in Fairfield
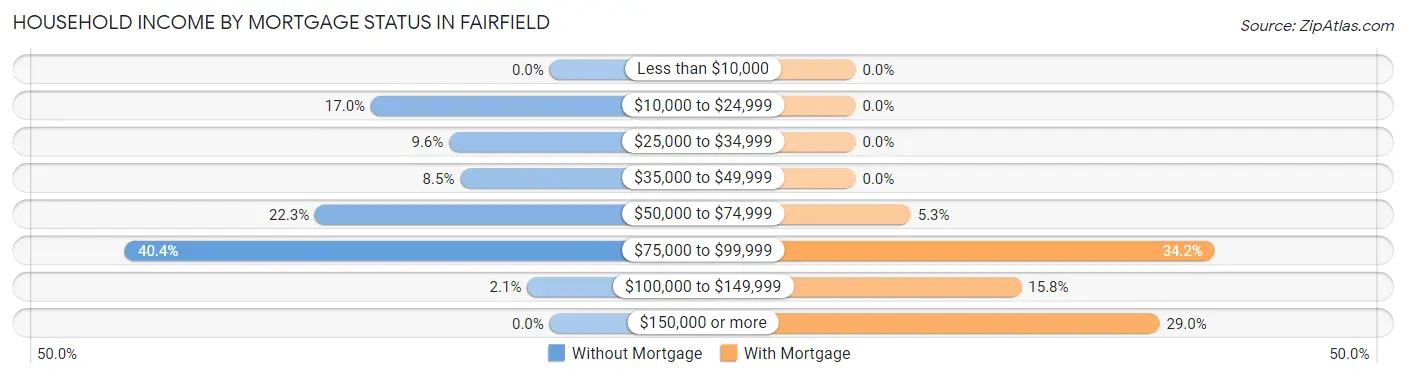
| Household Income | Without Mortgage | With Mortgage |
| Less than $10,000 | 0 (0.0%) | 0 (0.0%) |
| $10,000 to $24,999 | 16 (17.0%) | 0 (0.0%) |
| $25,000 to $34,999 | 9 (9.6%) | 0 (0.0%) |
| $35,000 to $49,999 | 8 (8.5%) | 0 (0.0%) |
| $50,000 to $74,999 | 21 (22.3%) | 6 (5.3%) |
| $75,000 to $99,999 | 38 (40.4%) | 39 (34.2%) |
| $100,000 to $149,999 | 2 (2.1%) | 18 (15.8%) |
| $150,000 or more | 0 (0.0%) | 33 (28.9%) |
| Total | 94 (100.0%) | 114 (100.0%) |
Property Value to Household Income Ratio in Fairfield
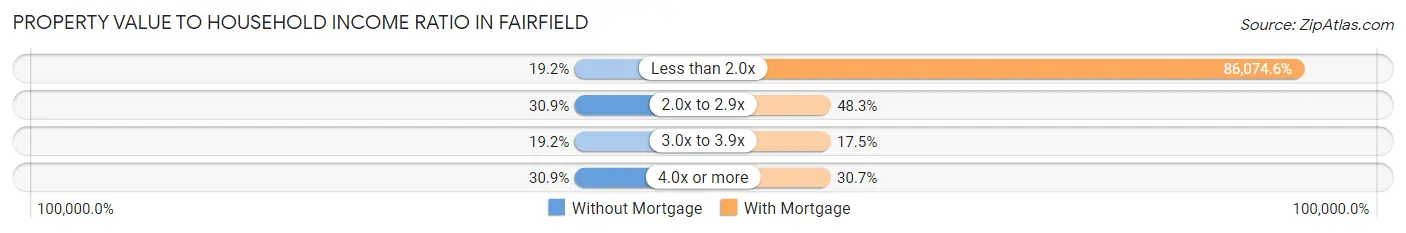
| Value-to-Income Ratio | Without Mortgage | With Mortgage |
| Less than 2.0x | 18 (19.2%) | 98,125 (86,074.6%) |
| 2.0x to 2.9x | 29 (30.8%) | 55 (48.2%) |
| 3.0x to 3.9x | 18 (19.2%) | 20 (17.5%) |
| 4.0x or more | 29 (30.8%) | 35 (30.7%) |
| Total | 94 (100.0%) | 114 (100.0%) |
Real Estate Taxes by Mortgage Status in Fairfield
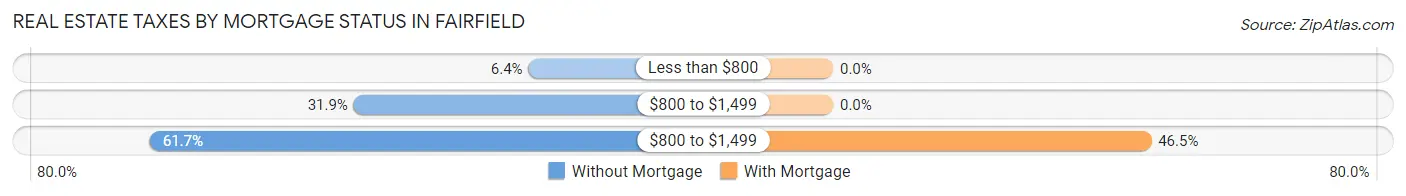
| Property Taxes | Without Mortgage | With Mortgage |
| Less than $800 | 6 (6.4%) | 0 (0.0%) |
| $800 to $1,499 | 30 (31.9%) | 0 (0.0%) |
| $800 to $1,499 | 58 (61.7%) | 53 (46.5%) |
| Total | 94 (100.0%) | 114 (100.0%) |
Health & Disability in Fairfield
Health Insurance Coverage by Age in Fairfield
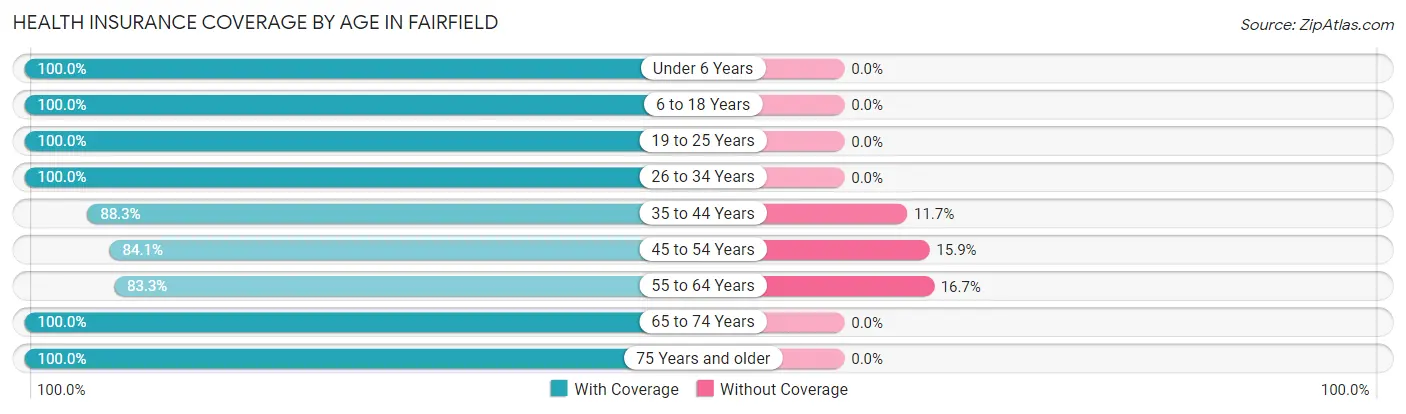
| Age Bracket | With Coverage | Without Coverage |
| Under 6 Years | 70 (100.0%) | 0 (0.0%) |
| 6 to 18 Years | 169 (100.0%) | 0 (0.0%) |
| 19 to 25 Years | 42 (100.0%) | 0 (0.0%) |
| 26 to 34 Years | 146 (100.0%) | 0 (0.0%) |
| 35 to 44 Years | 83 (88.3%) | 11 (11.7%) |
| 45 to 54 Years | 106 (84.1%) | 20 (15.9%) |
| 55 to 64 Years | 20 (83.3%) | 4 (16.7%) |
| 65 to 74 Years | 34 (100.0%) | 0 (0.0%) |
| 75 Years and older | 51 (100.0%) | 0 (0.0%) |
| Total | 721 (95.4%) | 35 (4.6%) |
Health Insurance Coverage by Citizenship Status in Fairfield
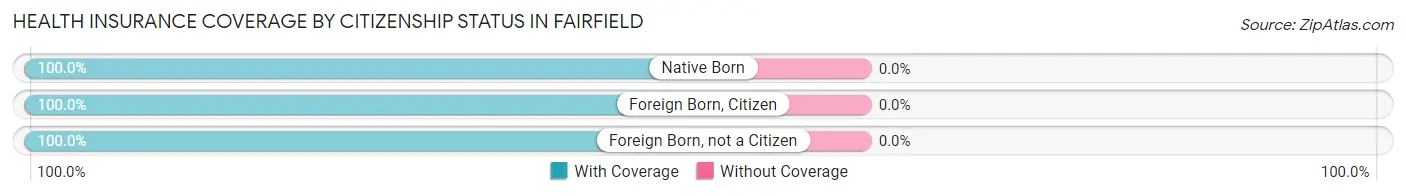
| Citizenship Status | With Coverage | Without Coverage |
| Native Born | 70 (100.0%) | 0 (0.0%) |
| Foreign Born, Citizen | 169 (100.0%) | 0 (0.0%) |
| Foreign Born, not a Citizen | 42 (100.0%) | 0 (0.0%) |
Health Insurance Coverage by Household Income in Fairfield
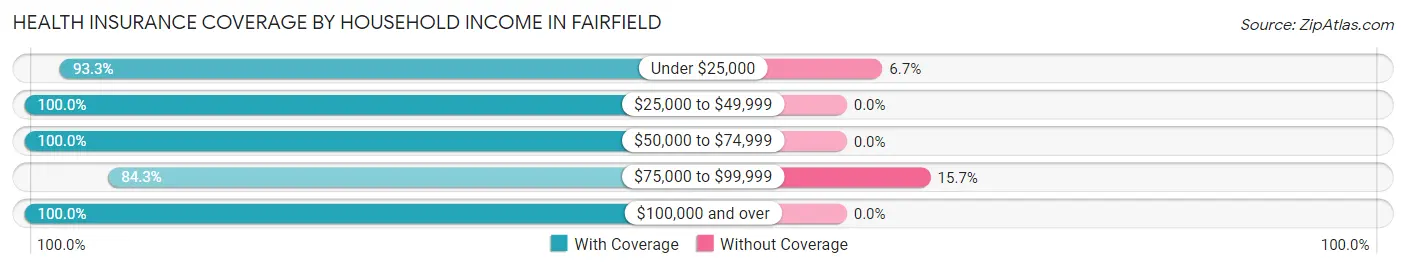
| Household Income | With Coverage | Without Coverage |
| Under $25,000 | 70 (93.3%) | 5 (6.7%) |
| $25,000 to $49,999 | 72 (100.0%) | 0 (0.0%) |
| $50,000 to $74,999 | 222 (100.0%) | 0 (0.0%) |
| $75,000 to $99,999 | 161 (84.3%) | 30 (15.7%) |
| $100,000 and over | 196 (100.0%) | 0 (0.0%) |
Public vs Private Health Insurance Coverage by Age in Fairfield
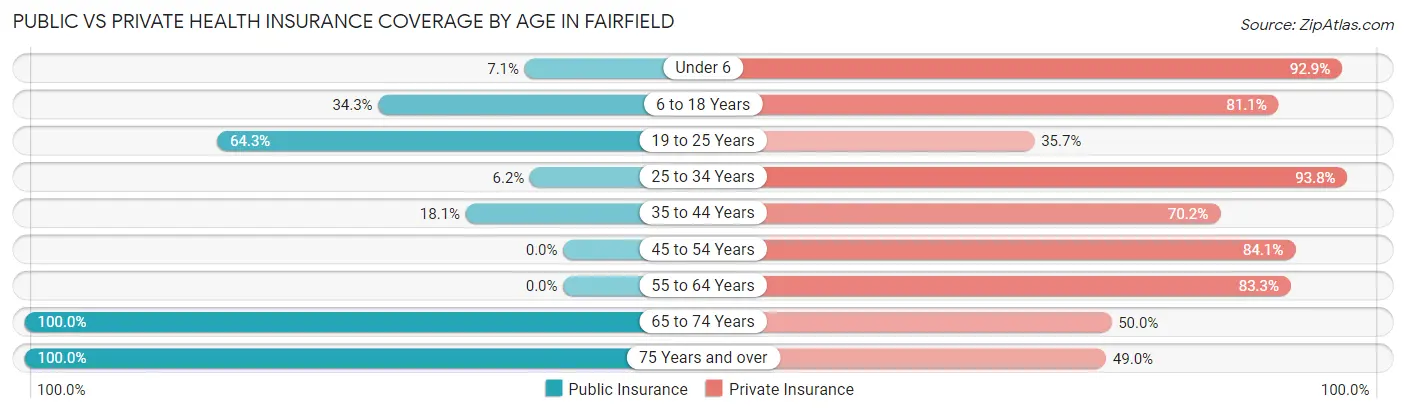
| Age Bracket | Public Insurance | Private Insurance |
| Under 6 | 5 (7.1%) | 65 (92.9%) |
| 6 to 18 Years | 58 (34.3%) | 137 (81.1%) |
| 19 to 25 Years | 27 (64.3%) | 15 (35.7%) |
| 25 to 34 Years | 9 (6.2%) | 137 (93.8%) |
| 35 to 44 Years | 17 (18.1%) | 66 (70.2%) |
| 45 to 54 Years | 0 (0.0%) | 106 (84.1%) |
| 55 to 64 Years | 0 (0.0%) | 20 (83.3%) |
| 65 to 74 Years | 34 (100.0%) | 17 (50.0%) |
| 75 Years and over | 51 (100.0%) | 25 (49.0%) |
| Total | 201 (26.6%) | 588 (77.8%) |
Disability Status by Sex by Age in Fairfield
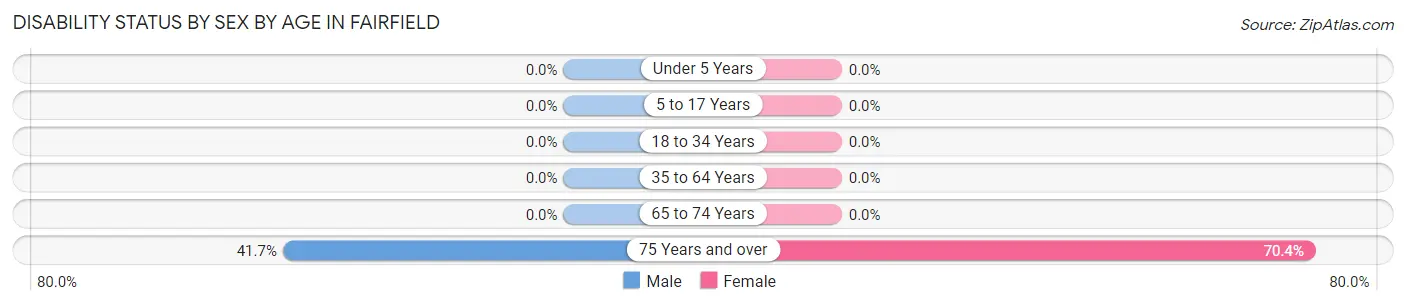
| Age Bracket | Male | Female |
| Under 5 Years | 0 (0.0%) | 0 (0.0%) |
| 5 to 17 Years | 0 (0.0%) | 0 (0.0%) |
| 18 to 34 Years | 0 (0.0%) | 0 (0.0%) |
| 35 to 64 Years | 0 (0.0%) | 0 (0.0%) |
| 65 to 74 Years | 0 (0.0%) | 0 (0.0%) |
| 75 Years and over | 10 (41.7%) | 19 (70.4%) |
Disability Class by Sex by Age in Fairfield
Disability Class: Hearing Difficulty
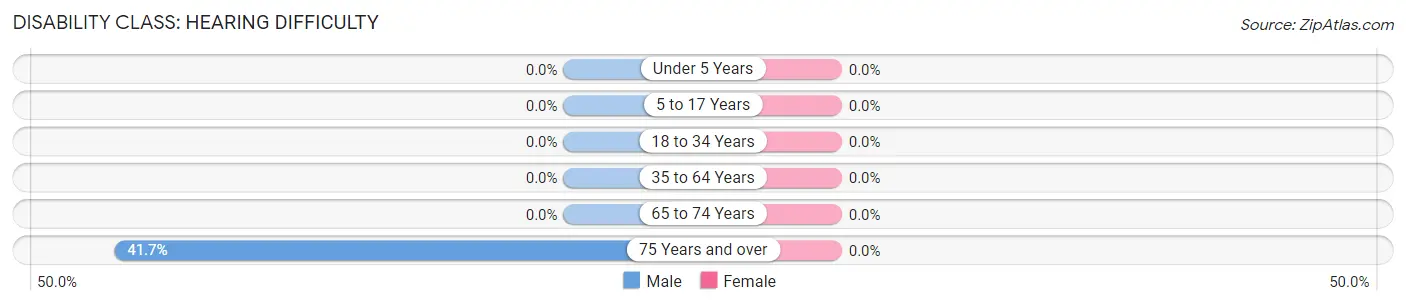
| Age Bracket | Male | Female |
| Under 5 Years | 0 (0.0%) | 0 (0.0%) |
| 5 to 17 Years | 0 (0.0%) | 0 (0.0%) |
| 18 to 34 Years | 0 (0.0%) | 0 (0.0%) |
| 35 to 64 Years | 0 (0.0%) | 0 (0.0%) |
| 65 to 74 Years | 0 (0.0%) | 0 (0.0%) |
| 75 Years and over | 10 (41.7%) | 0 (0.0%) |
Disability Class: Vision Difficulty
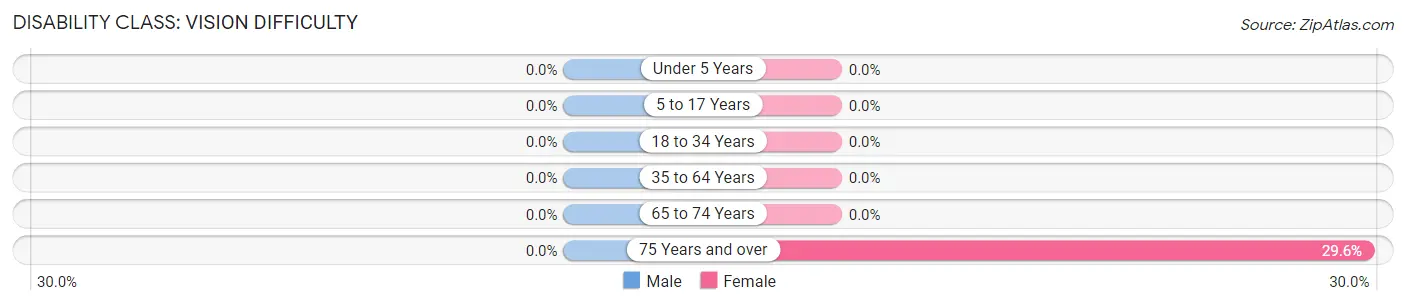
| Age Bracket | Male | Female |
| Under 5 Years | 0 (0.0%) | 0 (0.0%) |
| 5 to 17 Years | 0 (0.0%) | 0 (0.0%) |
| 18 to 34 Years | 0 (0.0%) | 0 (0.0%) |
| 35 to 64 Years | 0 (0.0%) | 0 (0.0%) |
| 65 to 74 Years | 0 (0.0%) | 0 (0.0%) |
| 75 Years and over | 0 (0.0%) | 8 (29.6%) |
Disability Class: Cognitive Difficulty
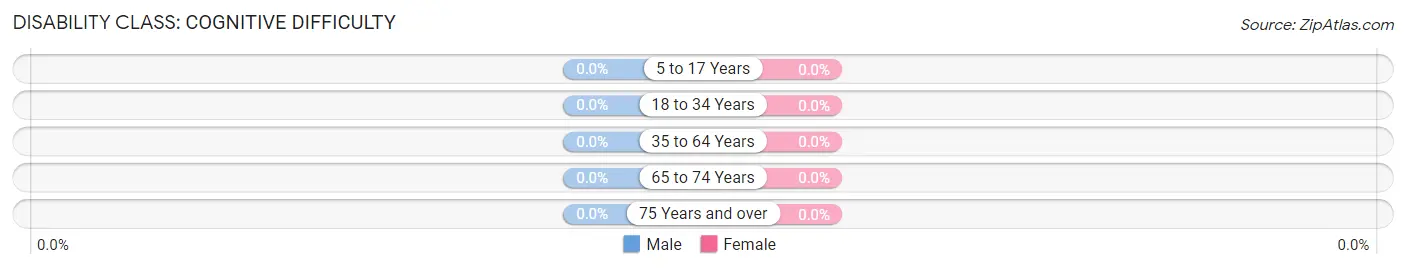
| Age Bracket | Male | Female |
| 5 to 17 Years | 0 (0.0%) | 0 (0.0%) |
| 18 to 34 Years | 0 (0.0%) | 0 (0.0%) |
| 35 to 64 Years | 0 (0.0%) | 0 (0.0%) |
| 65 to 74 Years | 0 (0.0%) | 0 (0.0%) |
| 75 Years and over | 0 (0.0%) | 0 (0.0%) |
Disability Class: Ambulatory Difficulty
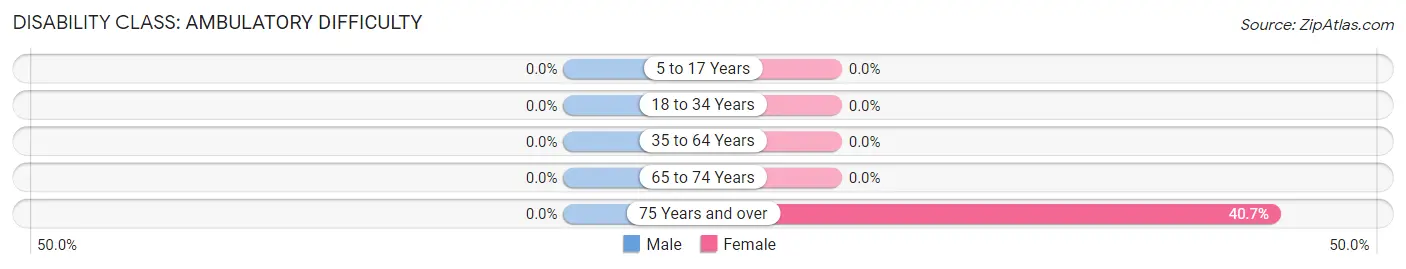
| Age Bracket | Male | Female |
| 5 to 17 Years | 0 (0.0%) | 0 (0.0%) |
| 18 to 34 Years | 0 (0.0%) | 0 (0.0%) |
| 35 to 64 Years | 0 (0.0%) | 0 (0.0%) |
| 65 to 74 Years | 0 (0.0%) | 0 (0.0%) |
| 75 Years and over | 0 (0.0%) | 11 (40.7%) |
Disability Class: Self-Care Difficulty
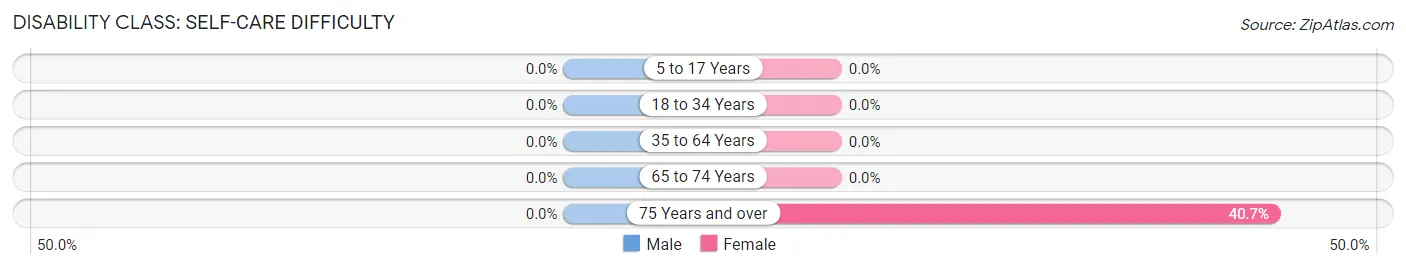
| Age Bracket | Male | Female |
| 5 to 17 Years | 0 (0.0%) | 0 (0.0%) |
| 18 to 34 Years | 0 (0.0%) | 0 (0.0%) |
| 35 to 64 Years | 0 (0.0%) | 0 (0.0%) |
| 65 to 74 Years | 0 (0.0%) | 0 (0.0%) |
| 75 Years and over | 0 (0.0%) | 11 (40.7%) |
Technology Access in Fairfield
Computing Device Access in Fairfield
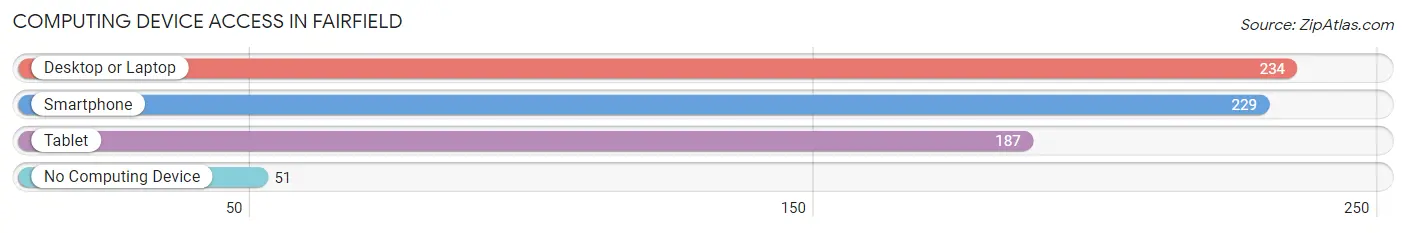
| Device Type | # Households | % Households |
| Desktop or Laptop | 234 | 79.3% |
| Smartphone | 229 | 77.6% |
| Tablet | 187 | 63.4% |
| No Computing Device | 51 | 17.3% |
| Total | 295 | 100.0% |
Internet Access in Fairfield
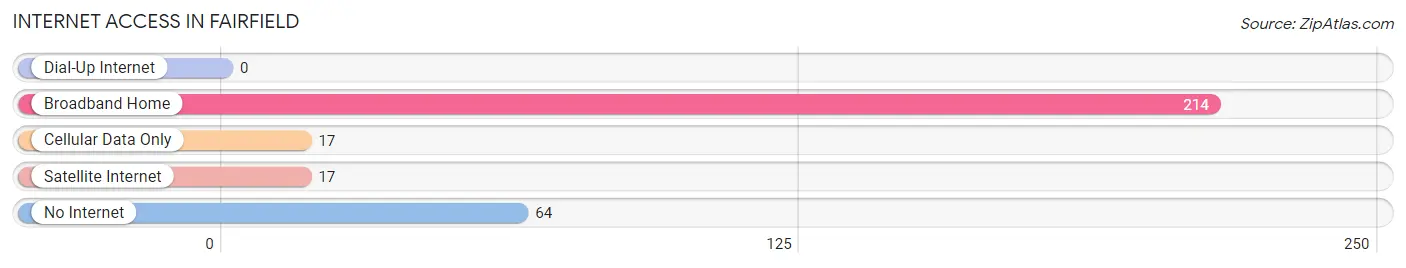
| Internet Type | # Households | % Households |
| Dial-Up Internet | 0 | 0.0% |
| Broadband Home | 214 | 72.5% |
| Cellular Data Only | 17 | 5.8% |
| Satellite Internet | 17 | 5.8% |
| No Internet | 64 | 21.7% |
| Total | 295 | 100.0% |
Fairfield Summary
Fairfield, Montana is a small town located in the north-central part of the state, in Teton County. It is situated at the base of the Rocky Mountains, and is surrounded by the Lewis and Clark National Forest. The town has a population of just over 1,000 people, and is known for its rural charm and outdoor recreation opportunities.
History
Fairfield was founded in 1883 by a group of homesteaders who were looking for a place to settle and start a new life. The town was named after the nearby Fairfield Creek, which was named by a surveyor who was impressed by the beauty of the area. The town quickly grew, and by the early 1900s, it had become a bustling community with a variety of businesses, including a hotel, a general store, a post office, and a school.
In the early 1900s, the town was also home to a large number of sheep and cattle ranches, which provided the town with a steady source of income. The town was also home to a number of coal mines, which provided jobs for many of the town’s residents.
Geography
Fairfield is located in the north-central part of Montana, in Teton County. It is situated at the base of the Rocky Mountains, and is surrounded by the Lewis and Clark National Forest. The town is located at an elevation of 4,400 feet, and has a total area of 1.2 square miles.
The town is located near several major highways, including Interstate 15, US Highway 2, and US Highway 89. The nearest major cities are Great Falls, Montana, which is about 90 miles to the north, and Bozeman, Montana, which is about 100 miles to the south.
Economy
The economy of Fairfield is largely based on agriculture and tourism. The town is home to several large ranches, which provide jobs for many of the town’s residents. The town is also home to a number of small businesses, including restaurants, shops, and hotels.
Tourism is also an important part of the town’s economy. The town is located near several popular outdoor recreation areas, including the Lewis and Clark National Forest, which offers hiking, camping, fishing, and other outdoor activities. The town is also home to several ski resorts, which attract visitors from all over the region.
Demographics
As of the 2010 census, the population of Fairfield was 1,072. The town has a median age of 44.7 years, and a median household income of $41,250. The town is predominantly white, with 92.3% of the population identifying as white. The town also has a small Hispanic population, with 4.3% of the population identifying as Hispanic or Latino. The town also has a small Native American population, with 1.2% of the population identifying as Native American.
Common Questions
What is Per Capita Income in Fairfield?
Per Capita income in Fairfield is $28,386.
What is the Median Family Income in Fairfield?
Median Family Income in Fairfield is $75,764.
What is the Median Household income in Fairfield?
Median Household Income in Fairfield is $64,922.
What is Income or Wage Gap in Fairfield?
Income or Wage Gap in Fairfield is 48.7%.
Women in Fairfield earn 51.3 cents for every dollar earned by a man.
What is Inequality or Gini Index in Fairfield?
Inequality or Gini Index in Fairfield is 0.39.
What is the Total Population of Fairfield?
Total Population of Fairfield is 759.
What is the Total Male Population of Fairfield?
Total Male Population of Fairfield is 362.
What is the Total Female Population of Fairfield?
Total Female Population of Fairfield is 397.
What is the Ratio of Males per 100 Females in Fairfield?
There are 91.18 Males per 100 Females in Fairfield.
What is the Ratio of Females per 100 Males in Fairfield?
There are 109.67 Females per 100 Males in Fairfield.
What is the Median Population Age in Fairfield?
Median Population Age in Fairfield is 30.9 Years.
What is the Average Family Size in Fairfield
Average Family Size in Fairfield is 2.9 People.
What is the Average Household Size in Fairfield
Average Household Size in Fairfield is 2.6 People.
How Large is the Labor Force in Fairfield?
There are 361 People in the Labor Forcein in Fairfield.
What is the Percentage of People in the Labor Force in Fairfield?
62.8% of People are in the Labor Force in Fairfield.
What is the Unemployment Rate in Fairfield?
Unemployment Rate in Fairfield is 7.5%.