Gildford, MT Map & Demographics
Gildford Map
Gildford Overview
$22,970
PER CAPITA INCOME
$110,156
AVG FAMILY INCOME
15.2%
WAGE / INCOME GAP [ % ]
84.8¢/ $1
WAGE / INCOME GAP [ $ ]
0.29
INEQUALITY / GINI INDEX
166
TOTAL POPULATION
92
MALE POPULATION
74
FEMALE POPULATION
124.32
MALES / 100 FEMALES
80.43
FEMALES / 100 MALES
41.1
MEDIAN AGE
4.1
AVG FAMILY SIZE
3.0
AVG HOUSEHOLD SIZE
59
LABOR FORCE [ PEOPLE ]
54.6%
PERCENT IN LABOR FORCE
Gildford Zip Codes
Gildford Area Codes
Income in Gildford
Income Overview in Gildford
| Characteristic | Number | Measure |
| Per Capita Income | 166 | $22,970 |
| Median Family Income | 35 | $110,156 |
| Mean Family Income | 35 | $95,534 |
| Median Household Income | 56 | $0 |
| Mean Household Income | 56 | $75,386 |
| Income Deficit | 35 | $0 |
| Wage / Income Gap (%) | 166 | 15.19% |
| Wage / Income Gap ($) | 166 | 84.81¢ per $1 |
| Gini / Inequality Index | 166 | 0.29 |
Earnings by Sex in Gildford
Average Earnings in Gildford are $42,917, $39,375 for men and $46,429 for women, a difference of 15.2%.
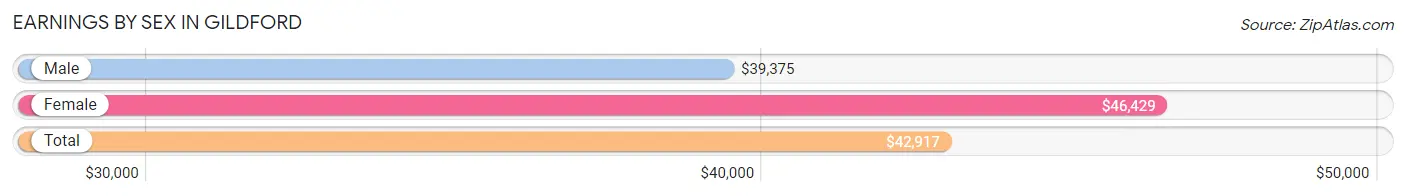
| Sex | Number | Average Earnings |
| Male | 50 (71.4%) | $39,375 |
| Female | 20 (28.6%) | $46,429 |
| Total | 70 (100.0%) | $42,917 |
Earnings by Sex by Income Bracket in Gildford
The most common earnings brackets in Gildford are $40,000 to $44,999 for men (12 | 24.0%) and $45,000 to $49,999 for women (7 | 35.0%).
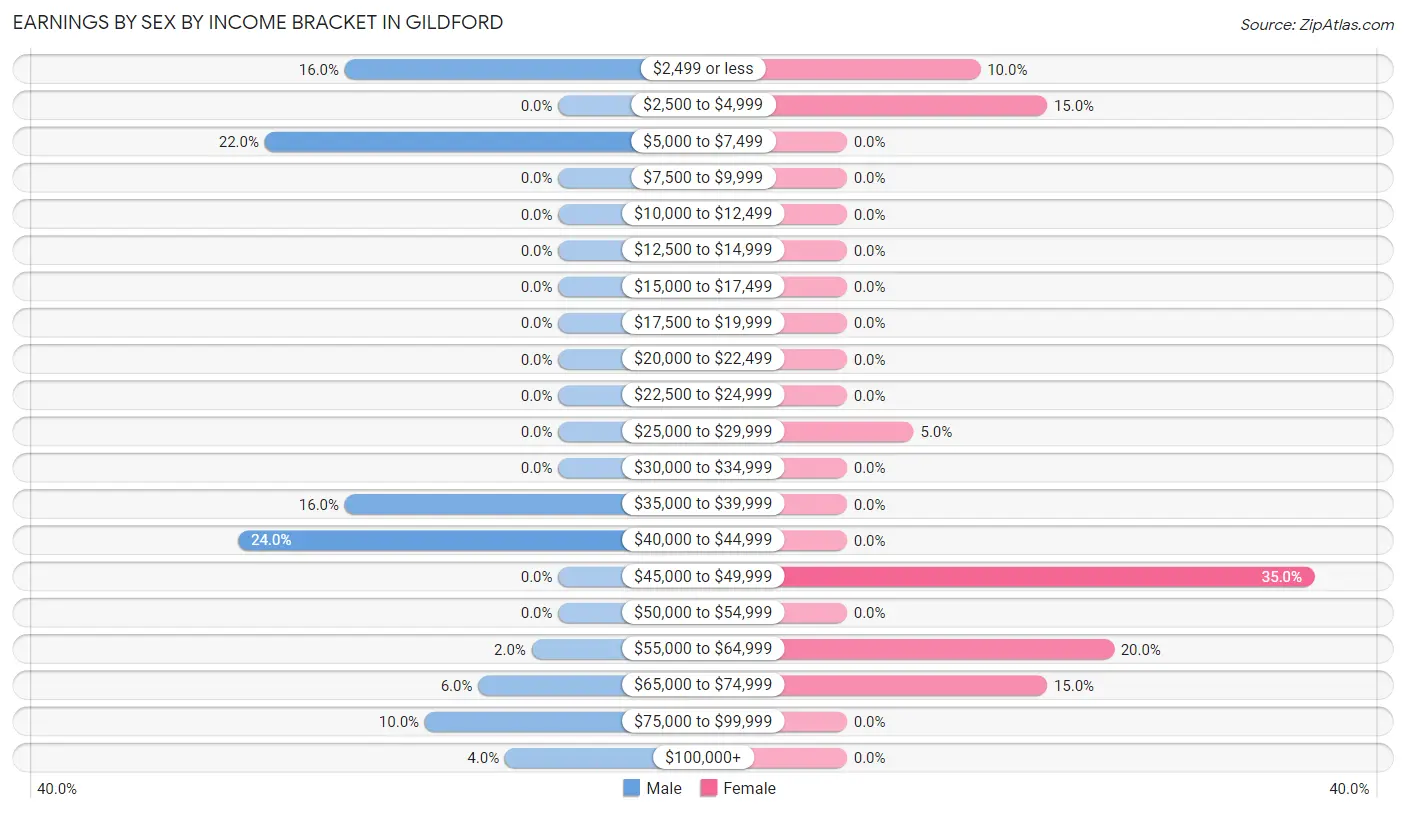
| Income | Male | Female |
| $2,499 or less | 8 (16.0%) | 2 (10.0%) |
| $2,500 to $4,999 | 0 (0.0%) | 3 (15.0%) |
| $5,000 to $7,499 | 11 (22.0%) | 0 (0.0%) |
| $7,500 to $9,999 | 0 (0.0%) | 0 (0.0%) |
| $10,000 to $12,499 | 0 (0.0%) | 0 (0.0%) |
| $12,500 to $14,999 | 0 (0.0%) | 0 (0.0%) |
| $15,000 to $17,499 | 0 (0.0%) | 0 (0.0%) |
| $17,500 to $19,999 | 0 (0.0%) | 0 (0.0%) |
| $20,000 to $22,499 | 0 (0.0%) | 0 (0.0%) |
| $22,500 to $24,999 | 0 (0.0%) | 0 (0.0%) |
| $25,000 to $29,999 | 0 (0.0%) | 1 (5.0%) |
| $30,000 to $34,999 | 0 (0.0%) | 0 (0.0%) |
| $35,000 to $39,999 | 8 (16.0%) | 0 (0.0%) |
| $40,000 to $44,999 | 12 (24.0%) | 0 (0.0%) |
| $45,000 to $49,999 | 0 (0.0%) | 7 (35.0%) |
| $50,000 to $54,999 | 0 (0.0%) | 0 (0.0%) |
| $55,000 to $64,999 | 1 (2.0%) | 4 (20.0%) |
| $65,000 to $74,999 | 3 (6.0%) | 3 (15.0%) |
| $75,000 to $99,999 | 5 (10.0%) | 0 (0.0%) |
| $100,000+ | 2 (4.0%) | 0 (0.0%) |
| Total | 50 (100.0%) | 20 (100.0%) |
Earnings by Sex by Educational Attainment in Gildford
Average earnings in Gildford are $43,229 for men and $47,321 for women, a difference of 8.6%. Men with an educational attainment of high school diploma enjoy the highest average annual earnings of $43,542, while those with college or associate's degree education earn the least with $2,499. Women with an educational attainment of bachelor's degree earn the most with the average annual earnings of $46,607, while those with bachelor's degree education have the smallest earnings of $46,607.
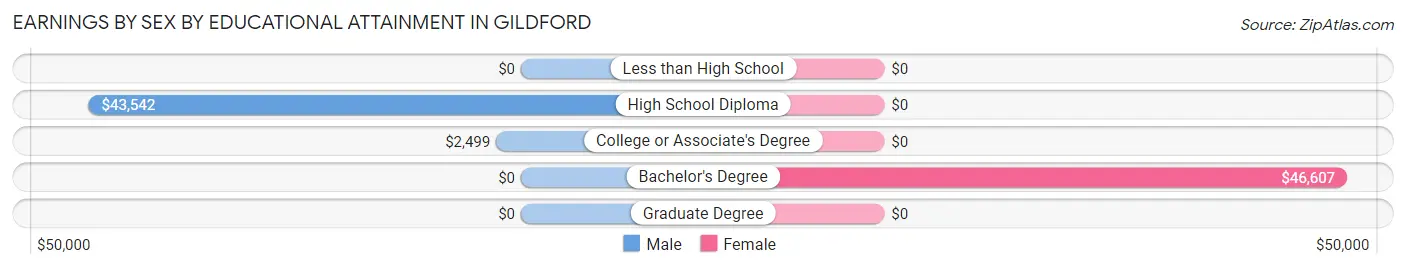
| Educational Attainment | Male Income | Female Income |
| Less than High School | - | - |
| High School Diploma | $43,542 | $0 |
| College or Associate's Degree | $2,499 | $0 |
| Bachelor's Degree | - | - |
| Graduate Degree | - | - |
| Total | $43,229 | $47,321 |
Family Income in Gildford
Family Income Brackets in Gildford
According to the Gildford family income data, there are 15 families falling into the $100,000 to $149,999 income range, which is the most common income bracket and makes up 42.9% of all families.
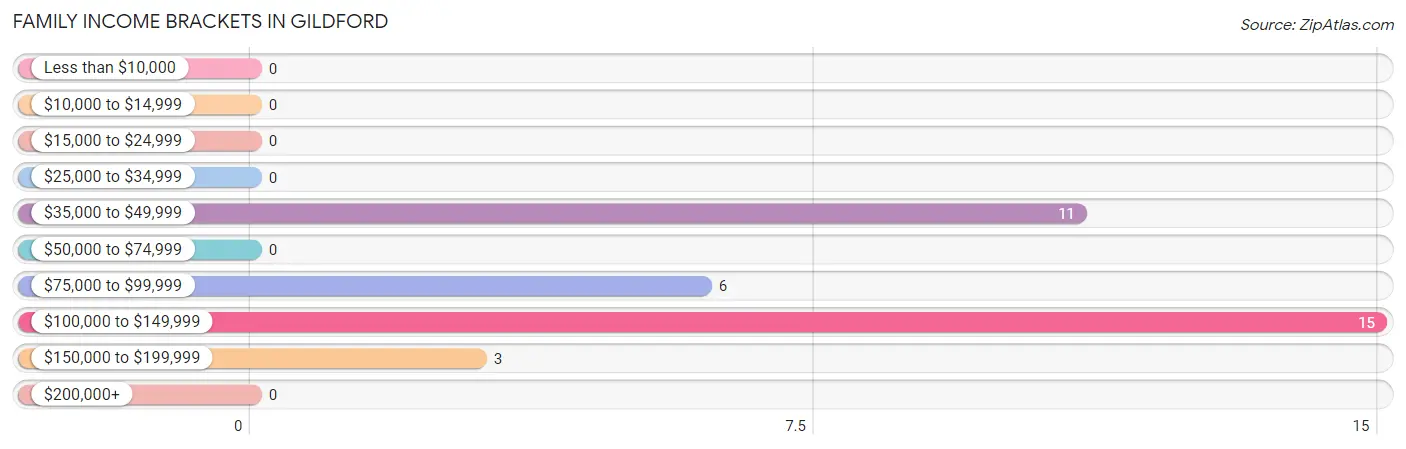
| Income Bracket | # Families | % Families |
| Less than $10,000 | 0 | 0.0% |
| $10,000 to $14,999 | 0 | 0.0% |
| $15,000 to $24,999 | 0 | 0.0% |
| $25,000 to $34,999 | 0 | 0.0% |
| $35,000 to $49,999 | 11 | 31.4% |
| $50,000 to $74,999 | 0 | 0.0% |
| $75,000 to $99,999 | 6 | 17.1% |
| $100,000 to $149,999 | 15 | 42.9% |
| $150,000 to $199,999 | 3 | 8.6% |
| $200,000+ | 0 | 0.0% |
Family Income by Famaliy Size in Gildford
2-person families (19 | 54.3%) account for the highest median family income in Gildford with $112,031 per family, while 2-person families (19 | 54.3%) have the highest median income of $56,016 per family member.
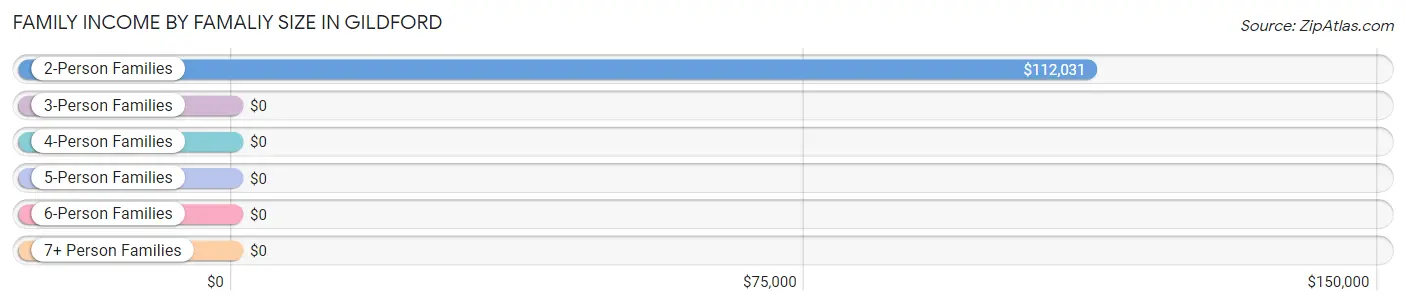
| Income Bracket | # Families | Median Income |
| 2-Person Families | 19 (54.3%) | $112,031 |
| 3-Person Families | 0 (0.0%) | $0 |
| 4-Person Families | 0 (0.0%) | $0 |
| 5-Person Families | 8 (22.9%) | $0 |
| 6-Person Families | 0 (0.0%) | $0 |
| 7+ Person Families | 8 (22.9%) | $0 |
| Total | 35 (100.0%) | $110,156 |
Family Income by Number of Earners in Gildford
| Number of Earners | # Families | Median Income |
| No Earners | 3 (8.6%) | $0 |
| 1 Earner | 14 (40.0%) | $0 |
| 2 Earners | 16 (45.7%) | $0 |
| 3+ Earners | 2 (5.7%) | $0 |
| Total | 35 (100.0%) | $110,156 |
Household Income in Gildford
Household Income Brackets in Gildford
With 30 households falling in the category, the $35,000 to $49,999 income range is the most frequent in Gildford, accounting for 53.6% of all households.
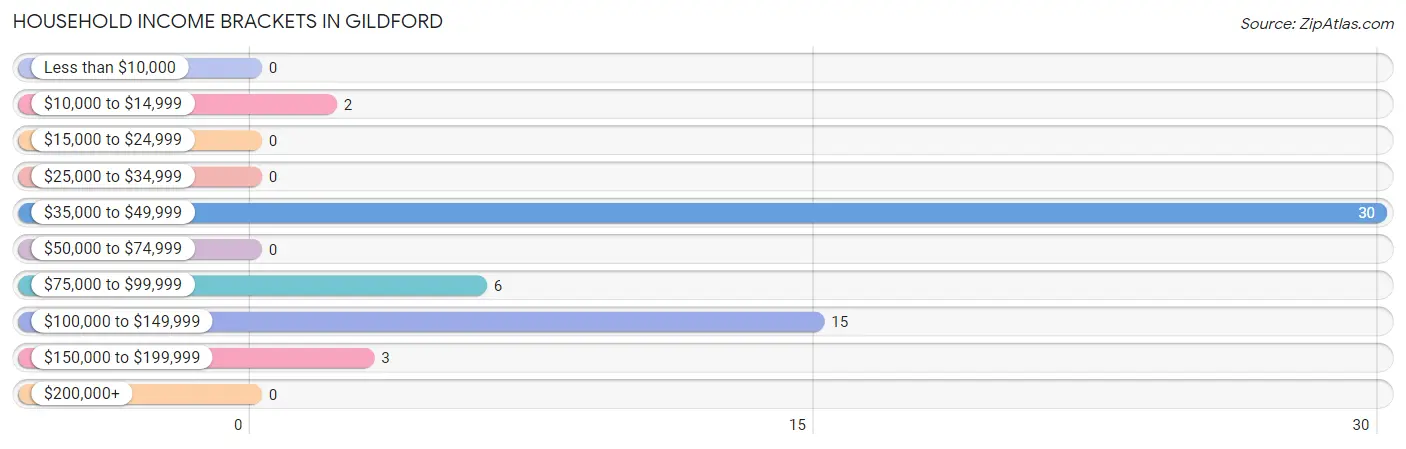
| Income Bracket | # Households | % Households |
| Less than $10,000 | 0 | 0.0% |
| $10,000 to $14,999 | 2 | 3.6% |
| $15,000 to $24,999 | 0 | 0.0% |
| $25,000 to $34,999 | 0 | 0.0% |
| $35,000 to $49,999 | 30 | 53.6% |
| $50,000 to $74,999 | 0 | 0.0% |
| $75,000 to $99,999 | 6 | 10.7% |
| $100,000 to $149,999 | 15 | 26.8% |
| $150,000 to $199,999 | 3 | 5.4% |
| $200,000+ | 0 | 0.0% |
Household Income by Householder Age in Gildford
The median household income in Gildford is $0, with the highest median household income of $70,000 found in the 25 to 44 years age bracket for the primary householder. A total of 16 households (28.6%) fall into this category.
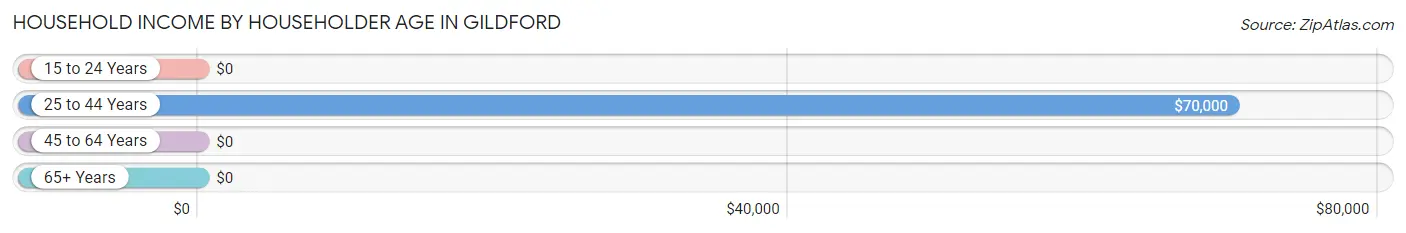
| Income Bracket | # Households | Median Income |
| 15 to 24 Years | 0 (0.0%) | $0 |
| 25 to 44 Years | 16 (28.6%) | $70,000 |
| 45 to 64 Years | 27 (48.2%) | $0 |
| 65+ Years | 13 (23.2%) | $0 |
| Total | 56 (100.0%) | $0 |
Poverty in Gildford
Income Below Poverty by Sex and Age in Gildford
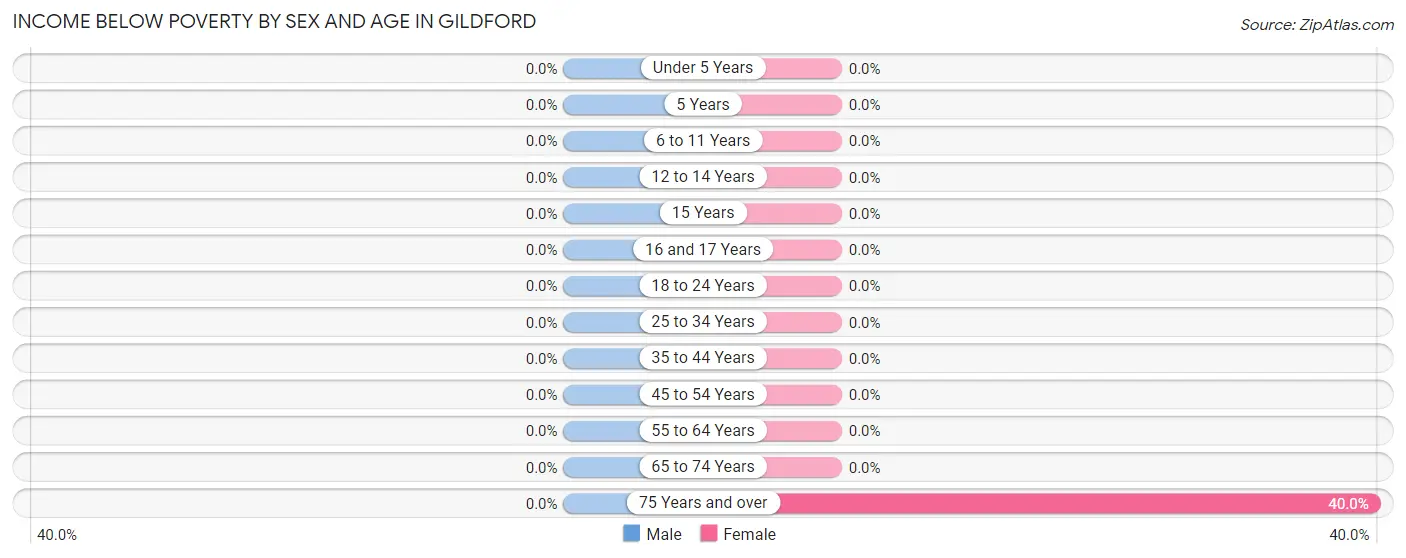
| Age Bracket | Male | Female |
| Under 5 Years | 0 (0.0%) | 0 (0.0%) |
| 5 Years | 0 (0.0%) | 0 (0.0%) |
| 6 to 11 Years | 0 (0.0%) | 0 (0.0%) |
| 12 to 14 Years | 0 (0.0%) | 0 (0.0%) |
| 15 Years | 0 (0.0%) | 0 (0.0%) |
| 16 and 17 Years | 0 (0.0%) | 0 (0.0%) |
| 18 to 24 Years | 0 (0.0%) | 0 (0.0%) |
| 25 to 34 Years | 0 (0.0%) | 0 (0.0%) |
| 35 to 44 Years | 0 (0.0%) | 0 (0.0%) |
| 45 to 54 Years | 0 (0.0%) | 0 (0.0%) |
| 55 to 64 Years | 0 (0.0%) | 0 (0.0%) |
| 65 to 74 Years | 0 (0.0%) | 0 (0.0%) |
| 75 Years and over | 0 (0.0%) | 2 (40.0%) |
| Total | 0 (0.0%) | 2 (2.7%) |
Income Above Poverty by Sex and Age in Gildford
According to the poverty statistics in Gildford, males aged under 5 years and females aged under 5 years are the age groups that are most secure financially, with 100.0% of males and 100.0% of females in these age groups living above the poverty line.
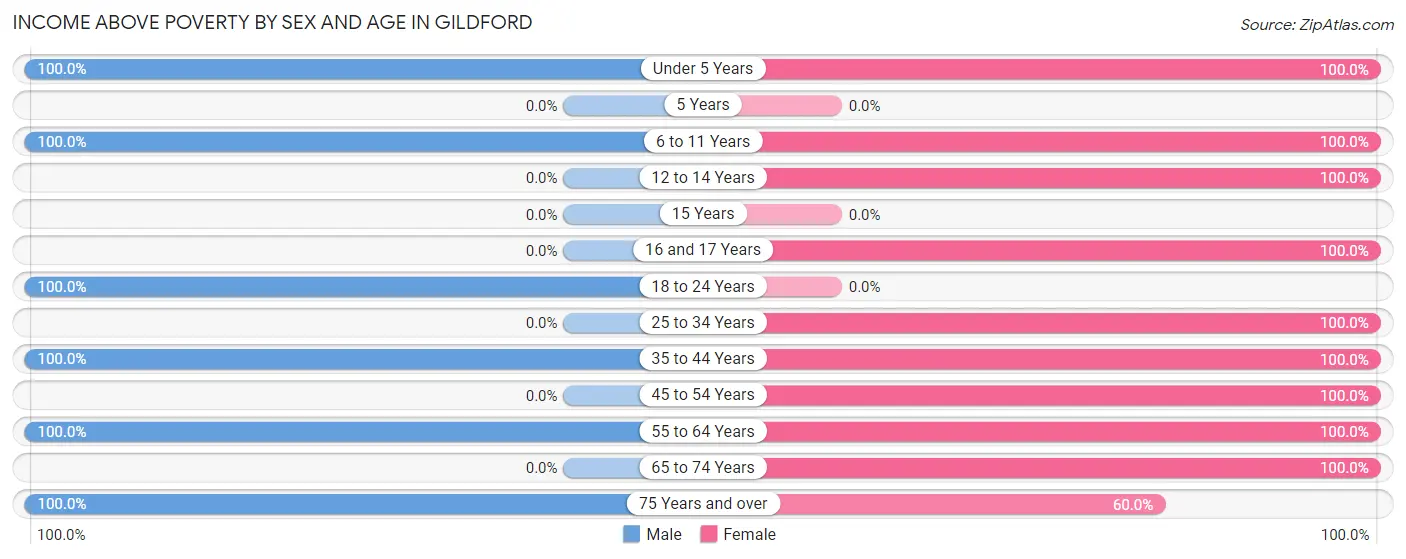
| Age Bracket | Male | Female |
| Under 5 Years | 16 (100.0%) | 7 (100.0%) |
| 5 Years | 0 (0.0%) | 0 (0.0%) |
| 6 to 11 Years | 23 (100.0%) | 9 (100.0%) |
| 12 to 14 Years | 0 (0.0%) | 3 (100.0%) |
| 15 Years | 0 (0.0%) | 0 (0.0%) |
| 16 and 17 Years | 0 (0.0%) | 5 (100.0%) |
| 18 to 24 Years | 11 (100.0%) | 0 (0.0%) |
| 25 to 34 Years | 0 (0.0%) | 6 (100.0%) |
| 35 to 44 Years | 12 (100.0%) | 11 (100.0%) |
| 45 to 54 Years | 0 (0.0%) | 11 (100.0%) |
| 55 to 64 Years | 19 (100.0%) | 8 (100.0%) |
| 65 to 74 Years | 0 (0.0%) | 9 (100.0%) |
| 75 Years and over | 11 (100.0%) | 3 (60.0%) |
| Total | 92 (100.0%) | 72 (97.3%) |
Income Below Poverty Among Married-Couple Families in Gildford
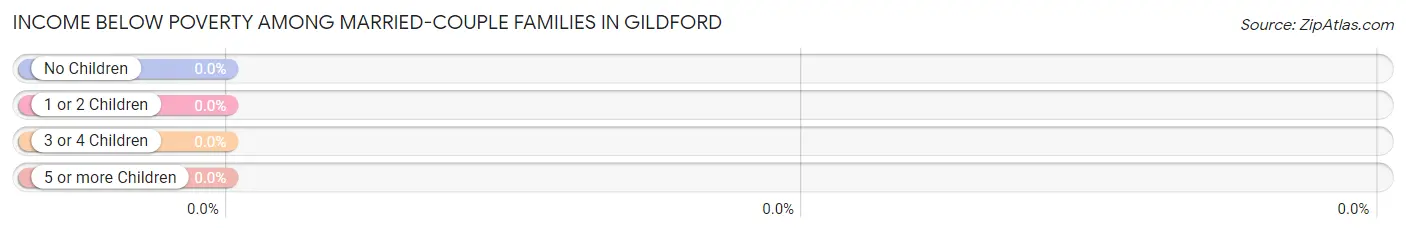
| Children | Above Poverty | Below Poverty |
| No Children | 19 (100.0%) | 0 (0.0%) |
| 1 or 2 Children | 8 (100.0%) | 0 (0.0%) |
| 3 or 4 Children | 0 (0.0%) | 0 (0.0%) |
| 5 or more Children | 8 (100.0%) | 0 (0.0%) |
| Total | 35 (100.0%) | 0 (0.0%) |
Income Below Poverty Among Single-Parent Households in Gildford
| Children | Single Father | Single Mother |
| No Children | 0 (0.0%) | 0 (0.0%) |
| 1 or 2 Children | 0 (0.0%) | 0 (0.0%) |
| 3 or 4 Children | 0 (0.0%) | 0 (0.0%) |
| 5 or more Children | 0 (0.0%) | 0 (0.0%) |
| Total | 0 (0.0%) | 0 (0.0%) |
Income Below Poverty Among Married-Couple vs Single-Parent Households in Gildford
| Children | Married-Couple Families | Single-Parent Households |
| No Children | 0 (0.0%) | 0 (0.0%) |
| 1 or 2 Children | 0 (0.0%) | 0 (0.0%) |
| 3 or 4 Children | 0 (0.0%) | 0 (0.0%) |
| 5 or more Children | 0 (0.0%) | 0 (0.0%) |
| Total | 0 (0.0%) | 0 (0.0%) |
Race in Gildford
The most populous races in Gildford are White / Caucasian (164 | 98.8%), Hispanic or Latino (6 | 3.6%), and Two or more Races (2 | 1.2%).
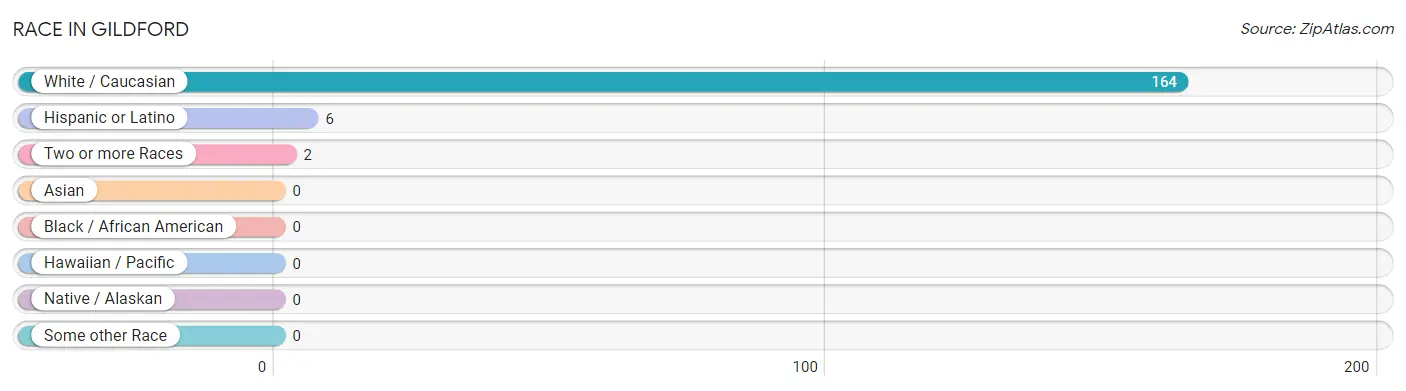
| Race | # Population | % Population |
| Asian | 0 | 0.0% |
| Black / African American | 0 | 0.0% |
| Hawaiian / Pacific | 0 | 0.0% |
| Hispanic or Latino | 6 | 3.6% |
| Native / Alaskan | 0 | 0.0% |
| White / Caucasian | 164 | 98.8% |
| Two or more Races | 2 | 1.2% |
| Some other Race | 0 | 0.0% |
| Total | 166 | 100.0% |
Ancestry in Gildford
The most populous ancestries reported in Gildford are German (59 | 35.5%), American (45 | 27.1%), Norwegian (26 | 15.7%), Irish (24 | 14.5%), and English (22 | 13.3%), together accounting for 106.0% of all Gildford residents.
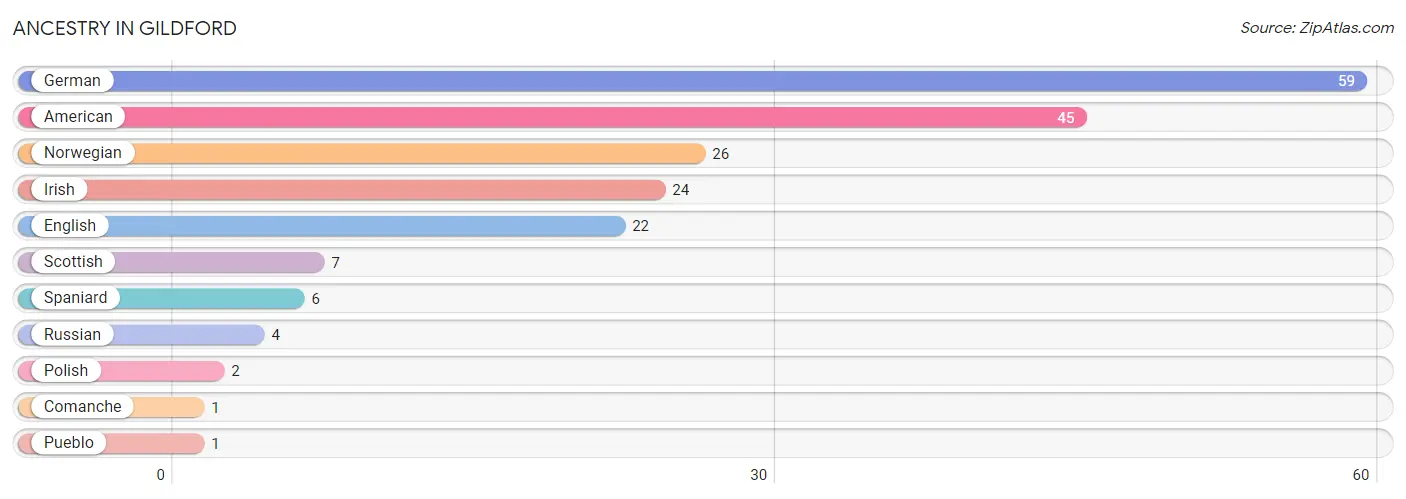
| Ancestry | # Population | % Population |
| American | 45 | 27.1% |
| Comanche | 1 | 0.6% |
| English | 22 | 13.3% |
| German | 59 | 35.5% |
| Irish | 24 | 14.5% |
| Norwegian | 26 | 15.7% |
| Polish | 2 | 1.2% |
| Pueblo | 1 | 0.6% |
| Russian | 4 | 2.4% |
| Scottish | 7 | 4.2% |
| Spaniard | 6 | 3.6% | View All 11 Rows |
Immigrants in Gildford

| Immigration Origin | # Population | % Population | View All 0 Rows |
Sex and Age in Gildford
Sex and Age in Gildford
The most populous age groups in Gildford are 5 to 9 Years (20 | 21.7%) for men and 40 to 44 Years (11 | 14.9%) for women.
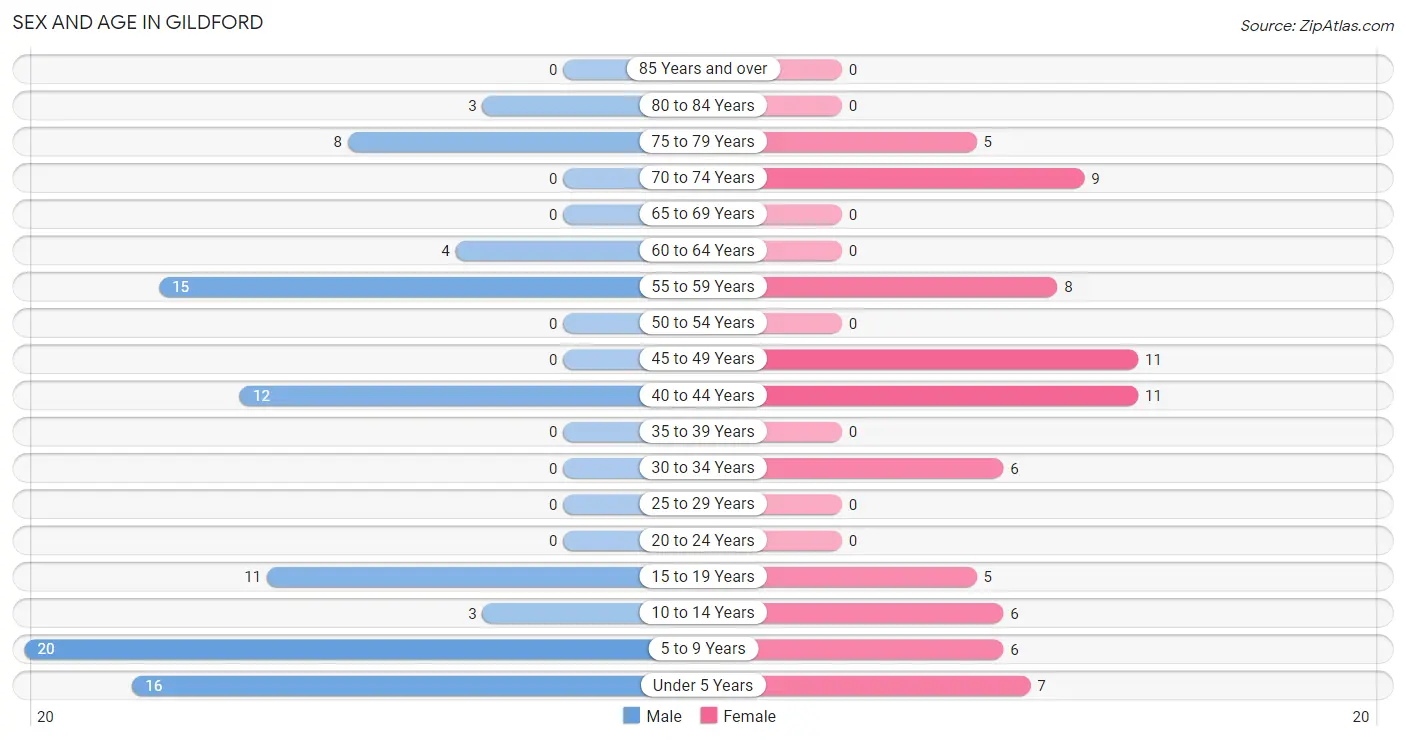
| Age Bracket | Male | Female |
| Under 5 Years | 16 (17.4%) | 7 (9.5%) |
| 5 to 9 Years | 20 (21.7%) | 6 (8.1%) |
| 10 to 14 Years | 3 (3.3%) | 6 (8.1%) |
| 15 to 19 Years | 11 (12.0%) | 5 (6.8%) |
| 20 to 24 Years | 0 (0.0%) | 0 (0.0%) |
| 25 to 29 Years | 0 (0.0%) | 0 (0.0%) |
| 30 to 34 Years | 0 (0.0%) | 6 (8.1%) |
| 35 to 39 Years | 0 (0.0%) | 0 (0.0%) |
| 40 to 44 Years | 12 (13.0%) | 11 (14.9%) |
| 45 to 49 Years | 0 (0.0%) | 11 (14.9%) |
| 50 to 54 Years | 0 (0.0%) | 0 (0.0%) |
| 55 to 59 Years | 15 (16.3%) | 8 (10.8%) |
| 60 to 64 Years | 4 (4.3%) | 0 (0.0%) |
| 65 to 69 Years | 0 (0.0%) | 0 (0.0%) |
| 70 to 74 Years | 0 (0.0%) | 9 (12.2%) |
| 75 to 79 Years | 8 (8.7%) | 5 (6.8%) |
| 80 to 84 Years | 3 (3.3%) | 0 (0.0%) |
| 85 Years and over | 0 (0.0%) | 0 (0.0%) |
| Total | 92 (100.0%) | 74 (100.0%) |
Families and Households in Gildford
Median Family Size in Gildford
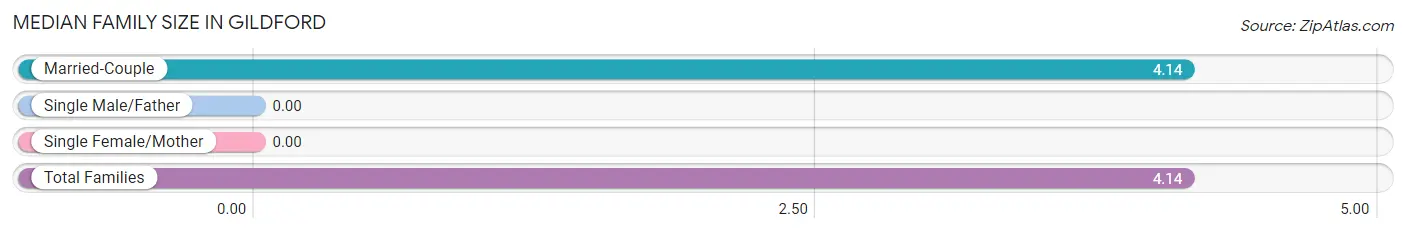
| Family Type | # Families | Family Size |
| Married-Couple | 35 (100.0%) | 4.14 |
| Single Male/Father | 0 (0.0%) | - |
| Single Female/Mother | 0 (0.0%) | - |
| Total Families | 35 (100.0%) | 4.14 |
Median Household Size in Gildford
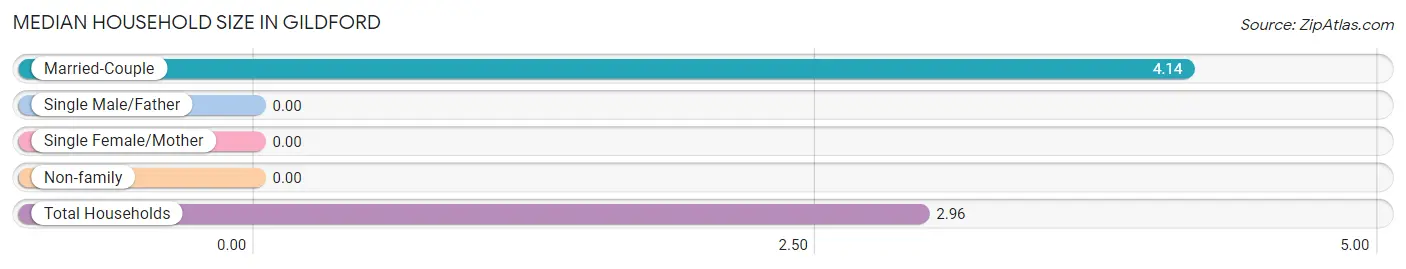
| Household Type | # Households | Household Size |
| Married-Couple | 35 (62.5%) | 4.14 |
| Single Male/Father | 0 (0.0%) | - |
| Single Female/Mother | 0 (0.0%) | - |
| Non-family | 21 (37.5%) | - |
| Total Households | 56 (100.0%) | 2.96 |
Household Size by Marriage Status in Gildford
Out of a total of 56 households in Gildford, 35 (62.5%) are family households, while 21 (37.5%) are nonfamily households. The most numerous type of family households are 2-person households, comprising 19, and the most common type of nonfamily households are 1-person households, comprising 21.
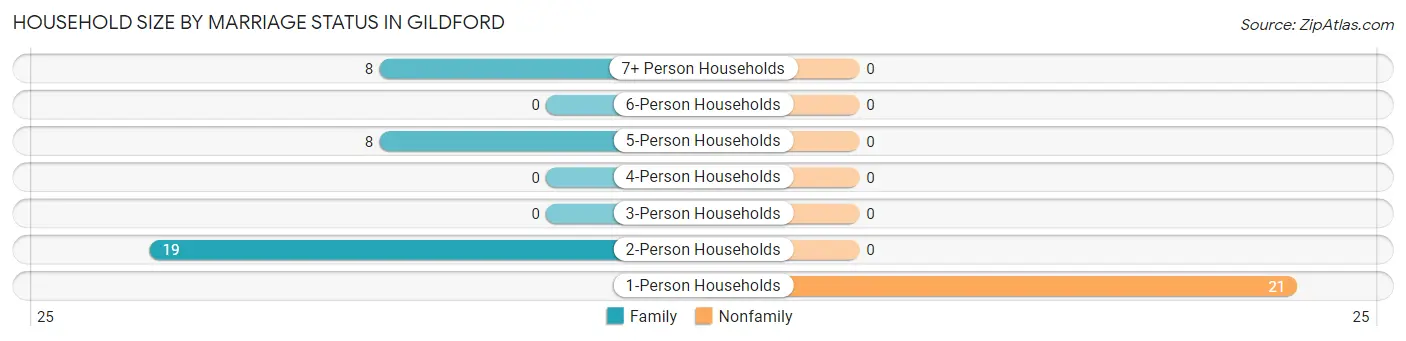
| Household Size | Family Households | Nonfamily Households |
| 1-Person Households | - | 21 (37.5%) |
| 2-Person Households | 19 (33.9%) | 0 (0.0%) |
| 3-Person Households | 0 (0.0%) | 0 (0.0%) |
| 4-Person Households | 0 (0.0%) | 0 (0.0%) |
| 5-Person Households | 8 (14.3%) | 0 (0.0%) |
| 6-Person Households | 0 (0.0%) | 0 (0.0%) |
| 7+ Person Households | 8 (14.3%) | 0 (0.0%) |
| Total | 35 (62.5%) | 21 (37.5%) |
Female Fertility in Gildford
Fertility by Age in Gildford
Average fertility rate in Gildford is 515.0 births per 1,000 women. Women in the age bracket of 20 to 34 years have the highest fertility rate with 1,000.0 births per 1,000 women. Women in the age bracket of 35 to 50 years acount for 64.7% of all women with births.
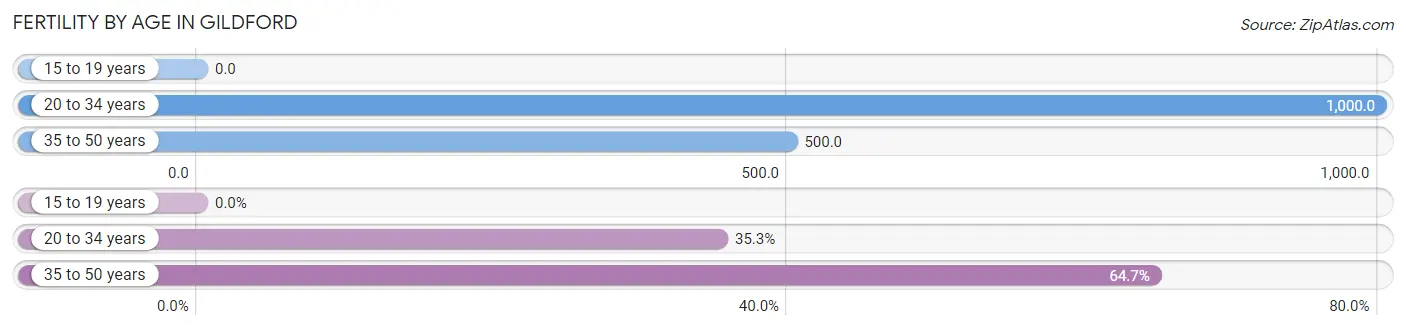
| Age Bracket | Women with Births | Births / 1,000 Women |
| 15 to 19 years | 0 (0.0%) | 0.0 |
| 20 to 34 years | 6 (35.3%) | 1,000.0 |
| 35 to 50 years | 11 (64.7%) | 500.0 |
| Total | 17 (100.0%) | 515.0 |
Fertility by Age by Marriage Status in Gildford
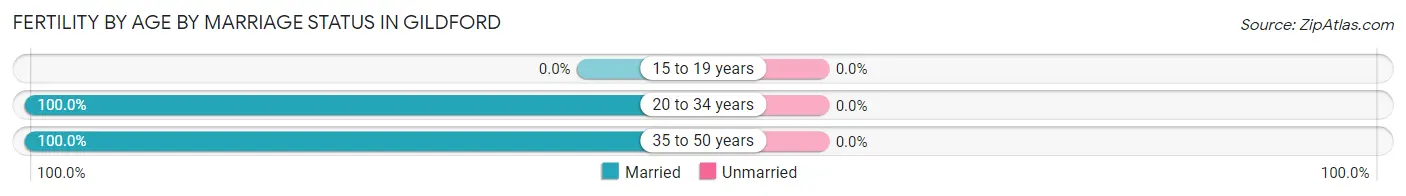
| Age Bracket | Married | Unmarried |
| 15 to 19 years | 0 (0.0%) | 0 (0.0%) |
| 20 to 34 years | 6 (100.0%) | 0 (0.0%) |
| 35 to 50 years | 11 (100.0%) | 0 (0.0%) |
| Total | 17 (100.0%) | 0 (0.0%) |
Fertility by Education in Gildford
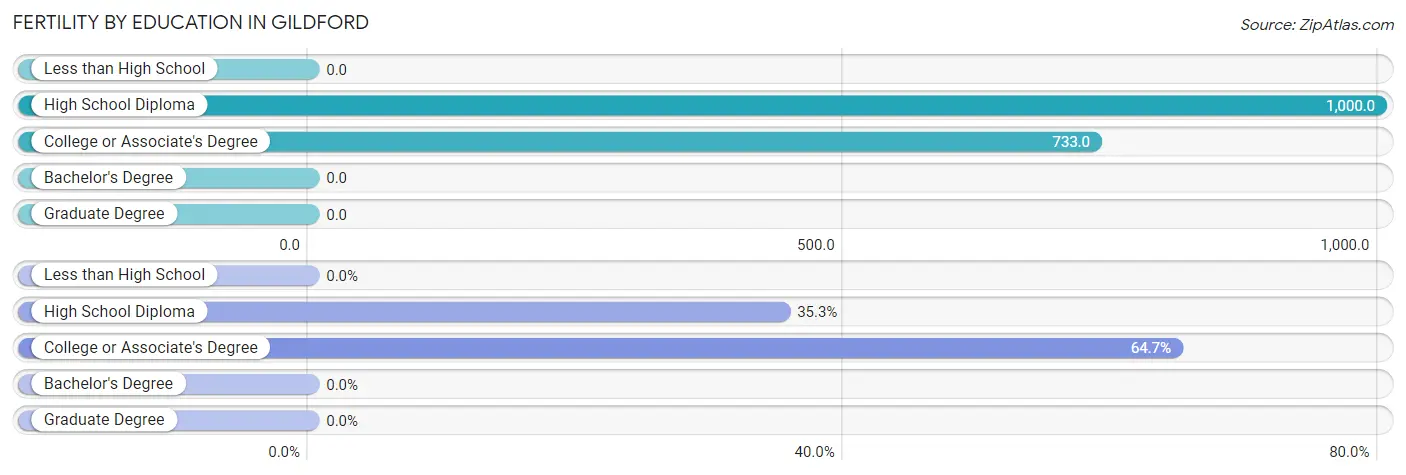
| Educational Attainment | Women with Births | Births / 1,000 Women |
| Less than High School | 0 (0.0%) | 0.0 |
| High School Diploma | 6 (35.3%) | 1,000.0 |
| College or Associate's Degree | 11 (64.7%) | 733.0 |
| Bachelor's Degree | 0 (0.0%) | 0.0 |
| Graduate Degree | 0 (0.0%) | 0.0 |
| Total | 17 (100.0%) | 515.0 |
Fertility by Education by Marriage Status in Gildford
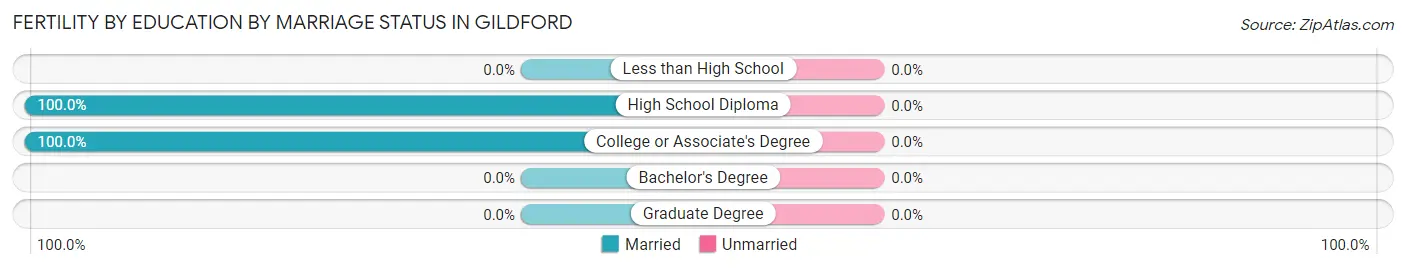
| Educational Attainment | Married | Unmarried |
| Less than High School | 0 (0.0%) | 0 (0.0%) |
| High School Diploma | 6 (100.0%) | 0 (0.0%) |
| College or Associate's Degree | 11 (100.0%) | 0 (0.0%) |
| Bachelor's Degree | 0 (0.0%) | 0 (0.0%) |
| Graduate Degree | 0 (0.0%) | 0 (0.0%) |
| Total | 17 (100.0%) | 0 (0.0%) |
Employment Characteristics in Gildford
Employment by Class of Employer in Gildford
Among the 58 employed individuals in Gildford, private company employees (41 | 70.7%), local government employees (7 | 12.1%), and state government employees (4 | 6.9%) make up the most common classes of employment.
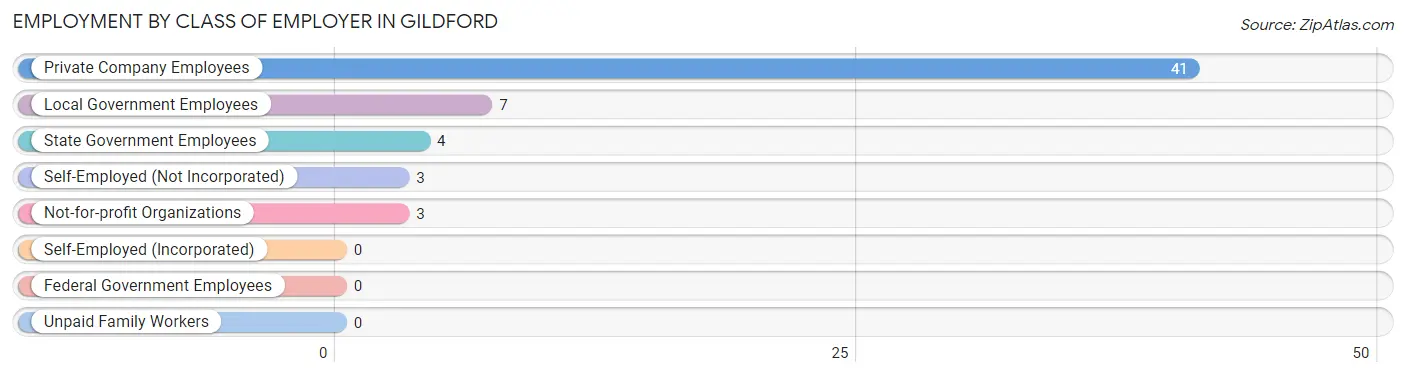
| Employer Class | # Employees | % Employees |
| Private Company Employees | 41 | 70.7% |
| Self-Employed (Incorporated) | 0 | 0.0% |
| Self-Employed (Not Incorporated) | 3 | 5.2% |
| Not-for-profit Organizations | 3 | 5.2% |
| Local Government Employees | 7 | 12.1% |
| State Government Employees | 4 | 6.9% |
| Federal Government Employees | 0 | 0.0% |
| Unpaid Family Workers | 0 | 0.0% |
| Total | 58 | 100.0% |
Employment Status by Age in Gildford
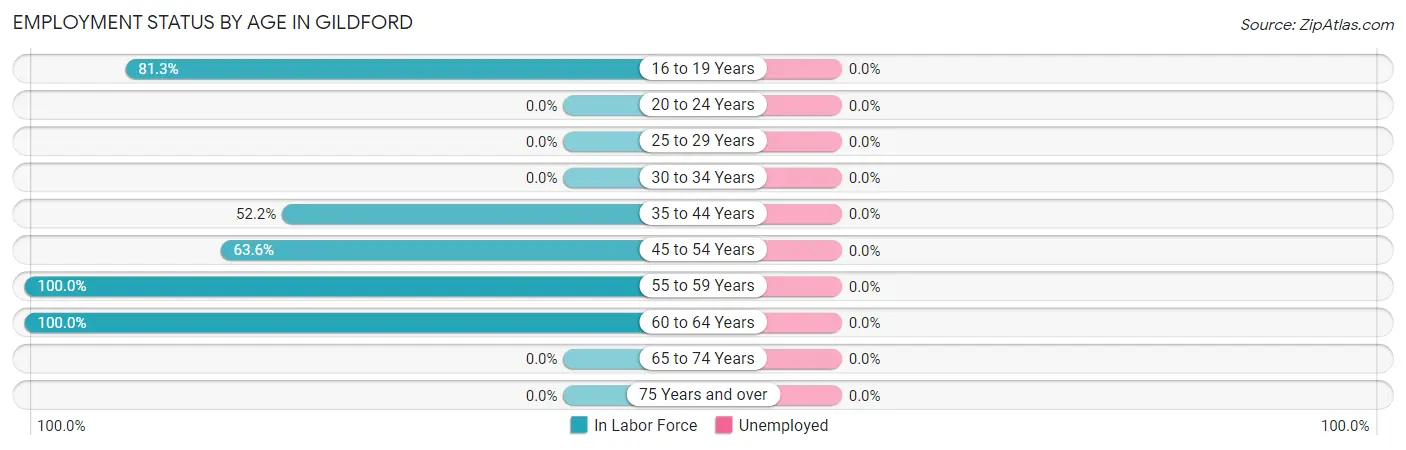
| Age Bracket | In Labor Force | Unemployed |
| 16 to 19 Years | 13 (81.3%) | 0 (0.0%) |
| 20 to 24 Years | 0 (0.0%) | 0 (0.0%) |
| 25 to 29 Years | 0 (0.0%) | 0 (0.0%) |
| 30 to 34 Years | 0 (0.0%) | 0 (0.0%) |
| 35 to 44 Years | 12 (52.2%) | 0 (0.0%) |
| 45 to 54 Years | 7 (63.6%) | 0 (0.0%) |
| 55 to 59 Years | 23 (100.0%) | 0 (0.0%) |
| 60 to 64 Years | 4 (100.0%) | 0 (0.0%) |
| 65 to 74 Years | 0 (0.0%) | 0 (0.0%) |
| 75 Years and over | 0 (0.0%) | 0 (0.0%) |
| Total | 59 (54.6%) | 0 (0.0%) |
Employment Status by Educational Attainment in Gildford
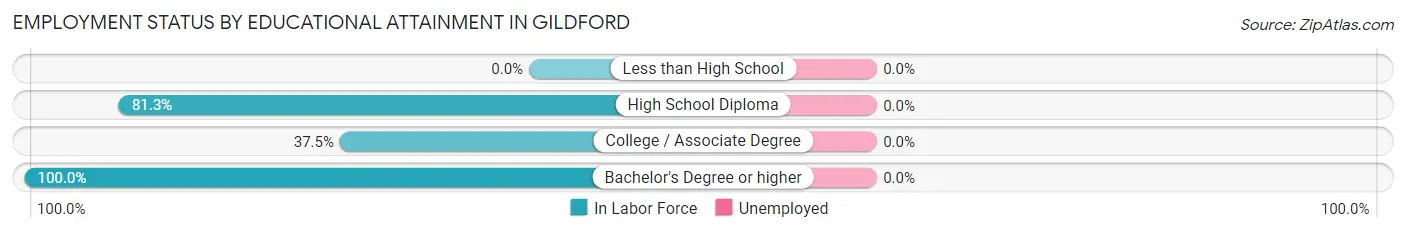
| Educational Attainment | In Labor Force | Unemployed |
| Less than High School | 0 (0.0%) | 0 (0.0%) |
| High School Diploma | 26 (81.3%) | 0 (0.0%) |
| College / Associate Degree | 9 (37.5%) | 0 (0.0%) |
| Bachelor's Degree or higher | 11 (100.0%) | 0 (0.0%) |
| Total | 46 (68.7%) | 0 (0.0%) |
Employment Occupations by Sex in Gildford
Management, Business, Science and Arts Occupations
The most common Management, Business, Science and Arts occupations in Gildford are Management (7 | 11.9%), Community & Social Service (7 | 11.9%), Education Instruction & Library (7 | 11.9%), Computers, Engineering & Science (3 | 5.1%), and Health Diagnosing & Treating (3 | 5.1%).
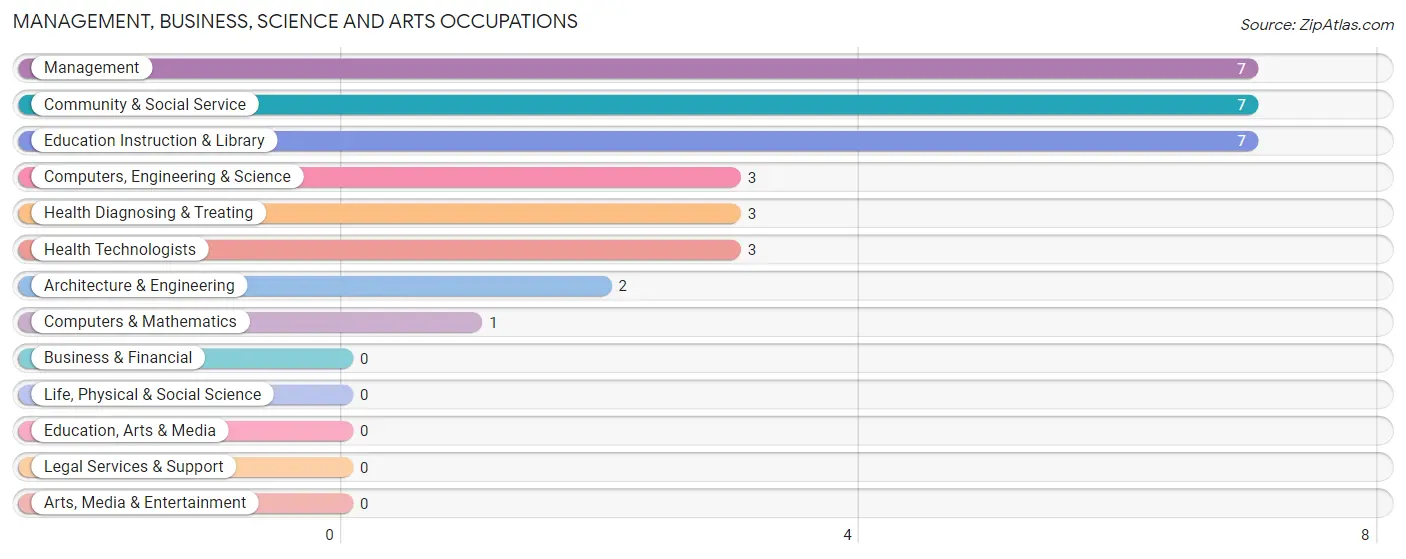
Management, Business, Science and Arts Occupations by Sex
Within the Management, Business, Science and Arts occupations in Gildford, the most male-oriented occupations are Computers, Engineering & Science (100.0%), Computers & Mathematics (100.0%), and Architecture & Engineering (100.0%), while the most female-oriented occupations are Community & Social Service (100.0%), Education Instruction & Library (100.0%), and Health Diagnosing & Treating (100.0%).
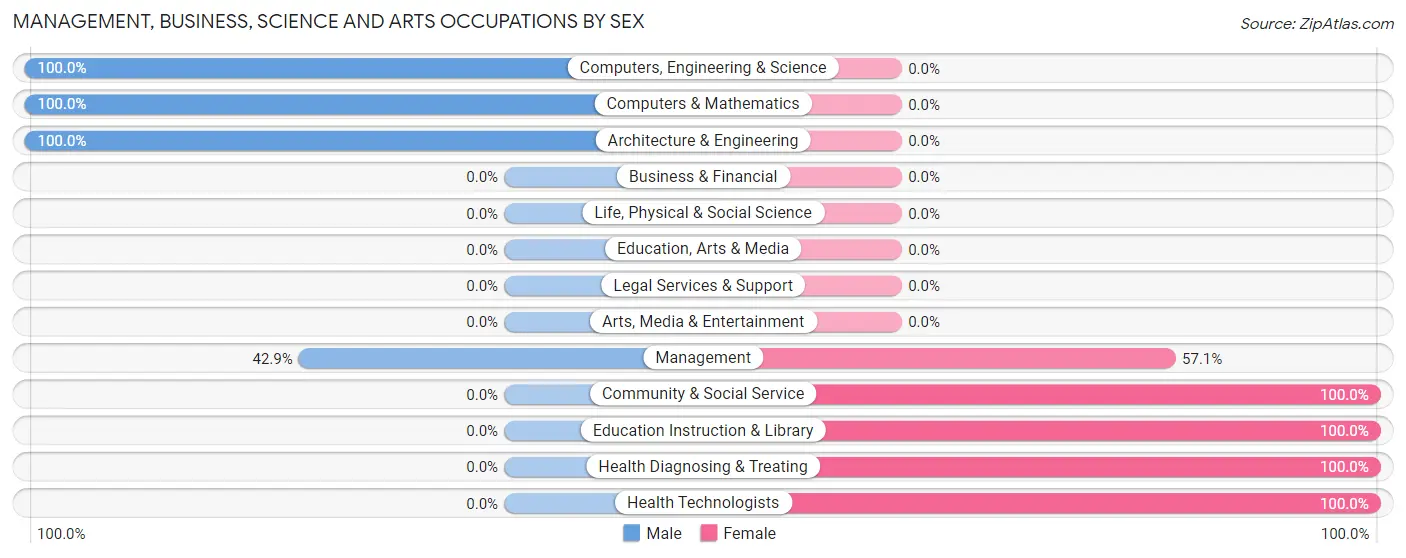
| Occupation | Male | Female |
| Management | 3 (42.9%) | 4 (57.1%) |
| Business & Financial | 0 (0.0%) | 0 (0.0%) |
| Computers, Engineering & Science | 3 (100.0%) | 0 (0.0%) |
| Computers & Mathematics | 1 (100.0%) | 0 (0.0%) |
| Architecture & Engineering | 2 (100.0%) | 0 (0.0%) |
| Life, Physical & Social Science | 0 (0.0%) | 0 (0.0%) |
| Community & Social Service | 0 (0.0%) | 7 (100.0%) |
| Education, Arts & Media | 0 (0.0%) | 0 (0.0%) |
| Legal Services & Support | 0 (0.0%) | 0 (0.0%) |
| Education Instruction & Library | 0 (0.0%) | 7 (100.0%) |
| Arts, Media & Entertainment | 0 (0.0%) | 0 (0.0%) |
| Health Diagnosing & Treating | 0 (0.0%) | 3 (100.0%) |
| Health Technologists | 0 (0.0%) | 3 (100.0%) |
| Total (Category) | 6 (30.0%) | 14 (70.0%) |
| Total (Overall) | 42 (71.2%) | 17 (28.8%) |
Services Occupations
Services Occupations by Sex
| Occupation | Male | Female |
| Healthcare Support | 0 (0.0%) | 0 (0.0%) |
| Security & Protection | 0 (0.0%) | 0 (0.0%) |
| Firefighting & Prevention | 0 (0.0%) | 0 (0.0%) |
| Law Enforcement | 0 (0.0%) | 0 (0.0%) |
| Food Preparation & Serving | 0 (0.0%) | 0 (0.0%) |
| Cleaning & Maintenance | 0 (0.0%) | 0 (0.0%) |
| Personal Care & Service | 0 (0.0%) | 0 (0.0%) |
| Total (Category) | 0 (0.0%) | 0 (0.0%) |
| Total (Overall) | 42 (71.2%) | 17 (28.8%) |
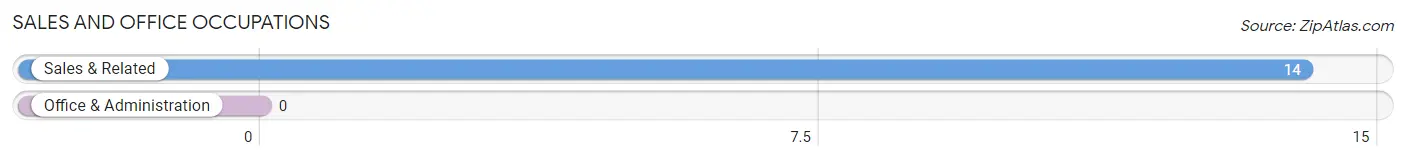
Sales and Office Occupations
The most common Sales and Office occupations in Gildford are , and Sales & Related (14 | 23.7%).
Sales and Office Occupations by Sex
| Occupation | Male | Female |
| Sales & Related | 11 (78.6%) | 3 (21.4%) |
| Office & Administration | 0 (0.0%) | 0 (0.0%) |
| Total (Category) | 11 (78.6%) | 3 (21.4%) |
| Total (Overall) | 42 (71.2%) | 17 (28.8%) |
Natural Resources, Construction and Maintenance Occupations
The most common Natural Resources, Construction and Maintenance occupations in Gildford are Installation, Maintenance & Repair (12 | 20.3%), and Farming, Fishing & Forestry (11 | 18.6%).
Natural Resources, Construction and Maintenance Occupations by Sex
| Occupation | Male | Female |
| Farming, Fishing & Forestry | 11 (100.0%) | 0 (0.0%) |
| Construction & Extraction | 0 (0.0%) | 0 (0.0%) |
| Installation, Maintenance & Repair | 12 (100.0%) | 0 (0.0%) |
| Total (Category) | 23 (100.0%) | 0 (0.0%) |
| Total (Overall) | 42 (71.2%) | 17 (28.8%) |
Production, Transportation and Moving Occupations
The most common Production, Transportation and Moving occupations in Gildford are , and Transportation (2 | 3.4%).
Production, Transportation and Moving Occupations by Sex
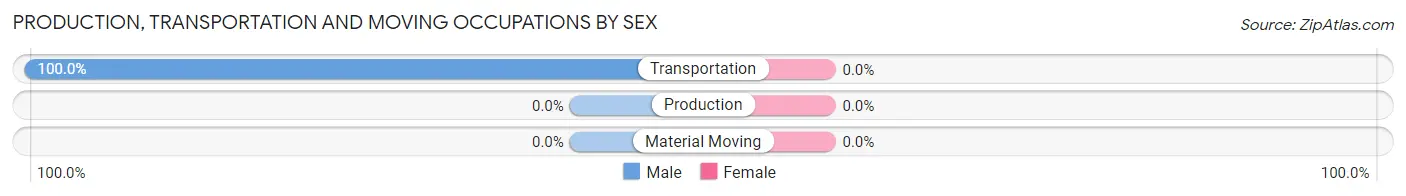
| Occupation | Male | Female |
| Production | 0 (0.0%) | 0 (0.0%) |
| Transportation | 2 (100.0%) | 0 (0.0%) |
| Material Moving | 0 (0.0%) | 0 (0.0%) |
| Total (Category) | 2 (100.0%) | 0 (0.0%) |
| Total (Overall) | 42 (71.2%) | 17 (28.8%) |
Employment Industries by Sex in Gildford
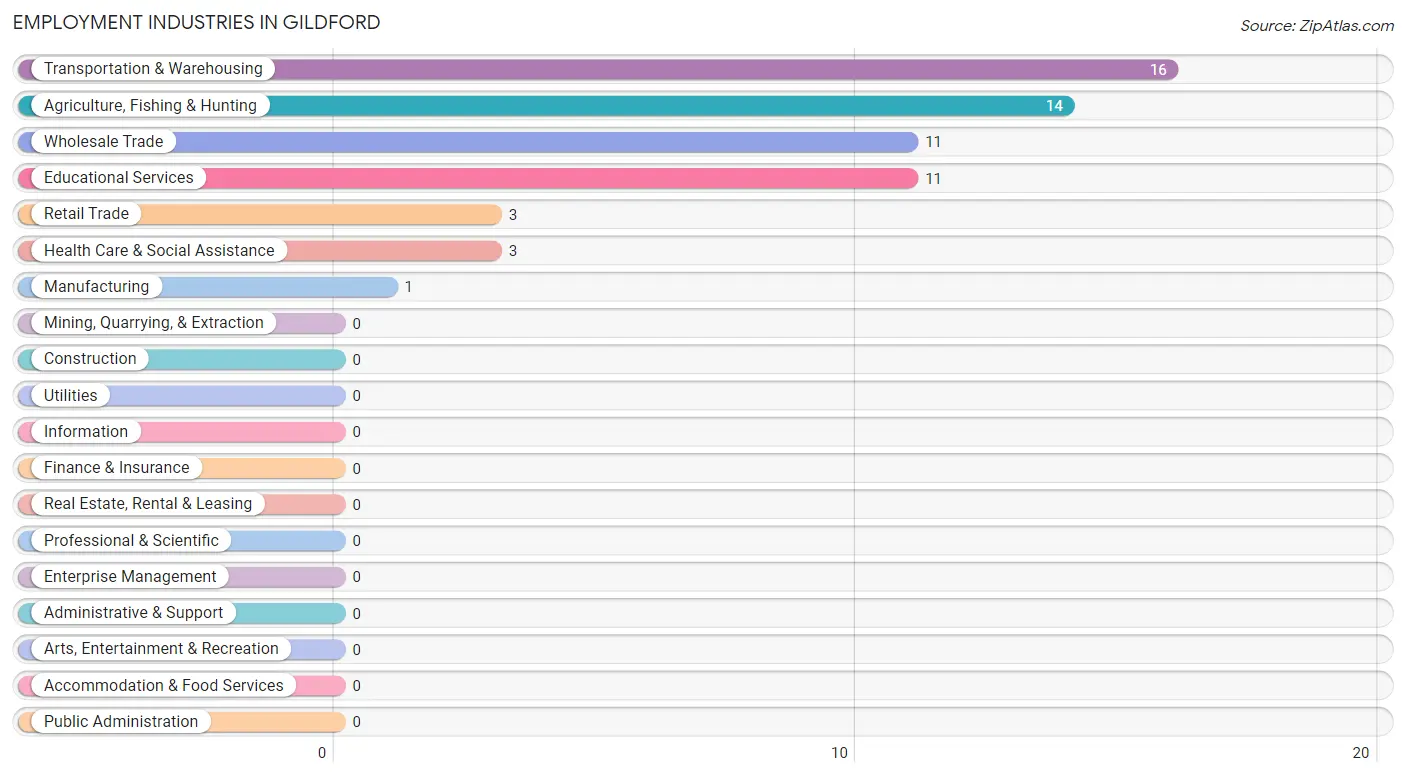
Employment Industries in Gildford
The major employment industries in Gildford include Transportation & Warehousing (16 | 27.1%), Agriculture, Fishing & Hunting (14 | 23.7%), Wholesale Trade (11 | 18.6%), Educational Services (11 | 18.6%), and Retail Trade (3 | 5.1%).
Employment Industries by Sex in Gildford
The Gildford industries that see more men than women are Agriculture, Fishing & Hunting (100.0%), Manufacturing (100.0%), and Wholesale Trade (100.0%), whereas the industries that tend to have a higher number of women are Retail Trade (100.0%), Educational Services (100.0%), and Health Care & Social Assistance (100.0%).
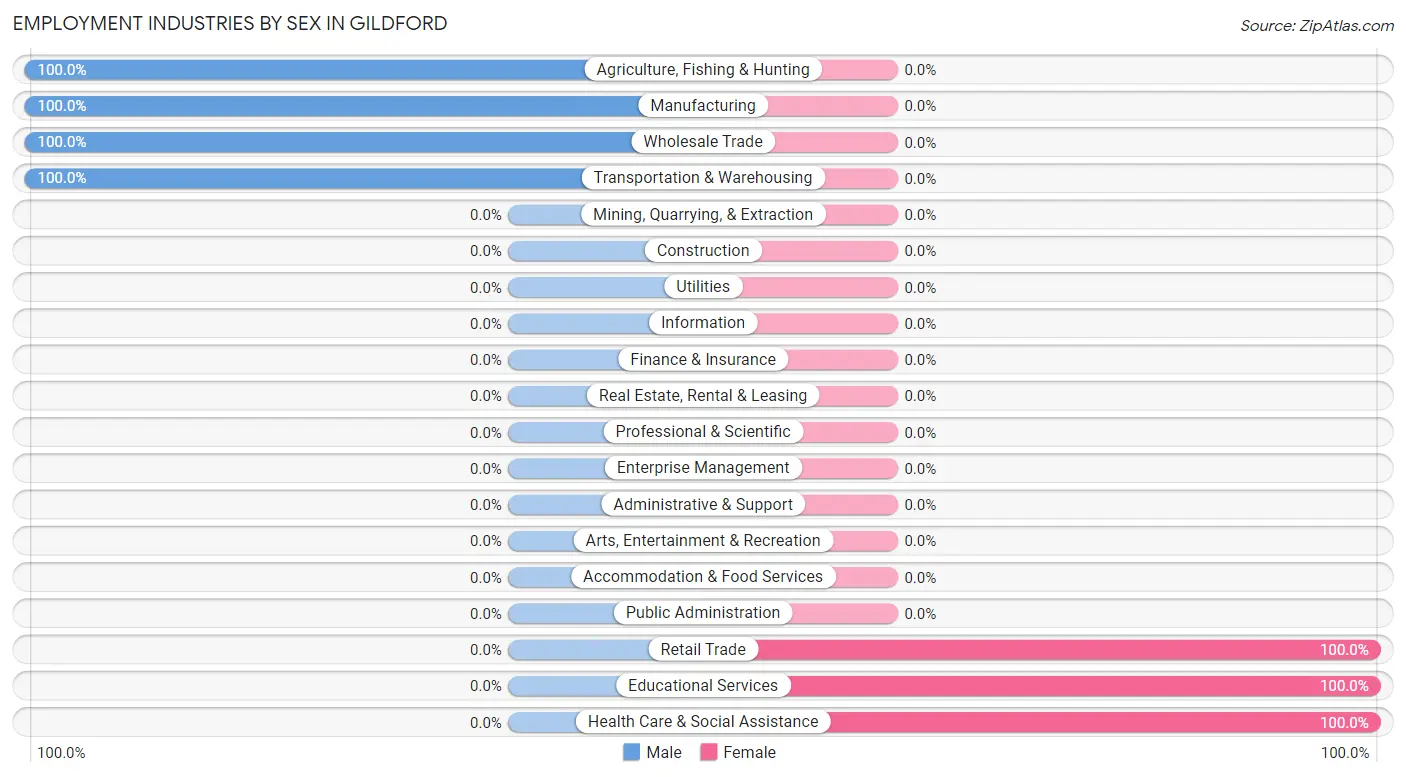
| Industry | Male | Female |
| Agriculture, Fishing & Hunting | 14 (100.0%) | 0 (0.0%) |
| Mining, Quarrying, & Extraction | 0 (0.0%) | 0 (0.0%) |
| Construction | 0 (0.0%) | 0 (0.0%) |
| Manufacturing | 1 (100.0%) | 0 (0.0%) |
| Wholesale Trade | 11 (100.0%) | 0 (0.0%) |
| Retail Trade | 0 (0.0%) | 3 (100.0%) |
| Transportation & Warehousing | 16 (100.0%) | 0 (0.0%) |
| Utilities | 0 (0.0%) | 0 (0.0%) |
| Information | 0 (0.0%) | 0 (0.0%) |
| Finance & Insurance | 0 (0.0%) | 0 (0.0%) |
| Real Estate, Rental & Leasing | 0 (0.0%) | 0 (0.0%) |
| Professional & Scientific | 0 (0.0%) | 0 (0.0%) |
| Enterprise Management | 0 (0.0%) | 0 (0.0%) |
| Administrative & Support | 0 (0.0%) | 0 (0.0%) |
| Educational Services | 0 (0.0%) | 11 (100.0%) |
| Health Care & Social Assistance | 0 (0.0%) | 3 (100.0%) |
| Arts, Entertainment & Recreation | 0 (0.0%) | 0 (0.0%) |
| Accommodation & Food Services | 0 (0.0%) | 0 (0.0%) |
| Public Administration | 0 (0.0%) | 0 (0.0%) |
| Total | 42 (71.2%) | 17 (28.8%) |
Education in Gildford
School Enrollment in Gildford
The most common levels of schooling among the 40 students in Gildford are elementary school (26 | 65.0%), middle school (9 | 22.5%), and high school (5 | 12.5%).
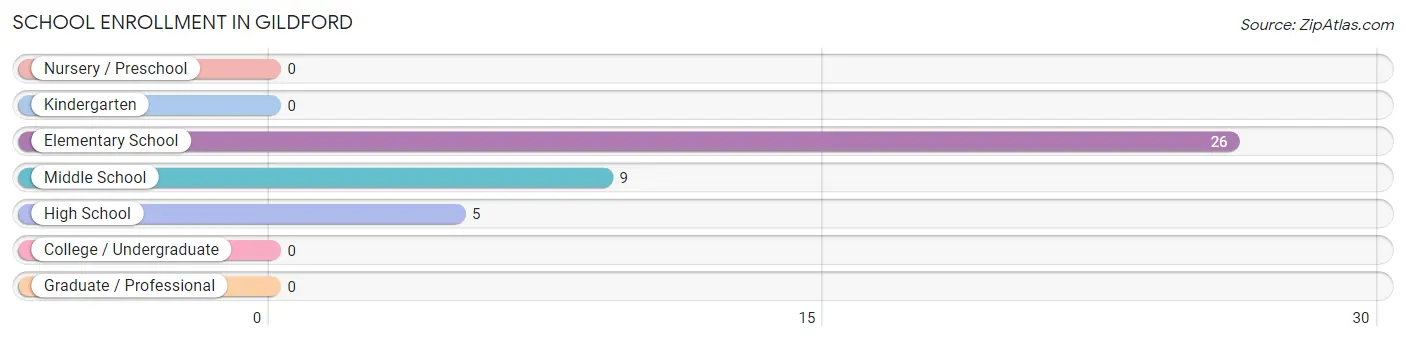
| School Level | # Students | % Students |
| Nursery / Preschool | 0 | 0.0% |
| Kindergarten | 0 | 0.0% |
| Elementary School | 26 | 65.0% |
| Middle School | 9 | 22.5% |
| High School | 5 | 12.5% |
| College / Undergraduate | 0 | 0.0% |
| Graduate / Professional | 0 | 0.0% |
| Total | 40 | 100.0% |
School Enrollment by Age by Funding Source in Gildford
Out of a total of 40 students who are enrolled in schools in Gildford, 24 (60.0%) attend a private institution, while the remaining 16 (40.0%) are enrolled in public schools. The age group of 5 to 9 year old has the highest likelihood of being enrolled in private schools, with 18 (69.2% in the age bracket) enrolled. Conversely, the age group of 15 to 17 year olds has the lowest likelihood of being enrolled in a private school, with 5 (100.0% in the age bracket) attending a public institution.
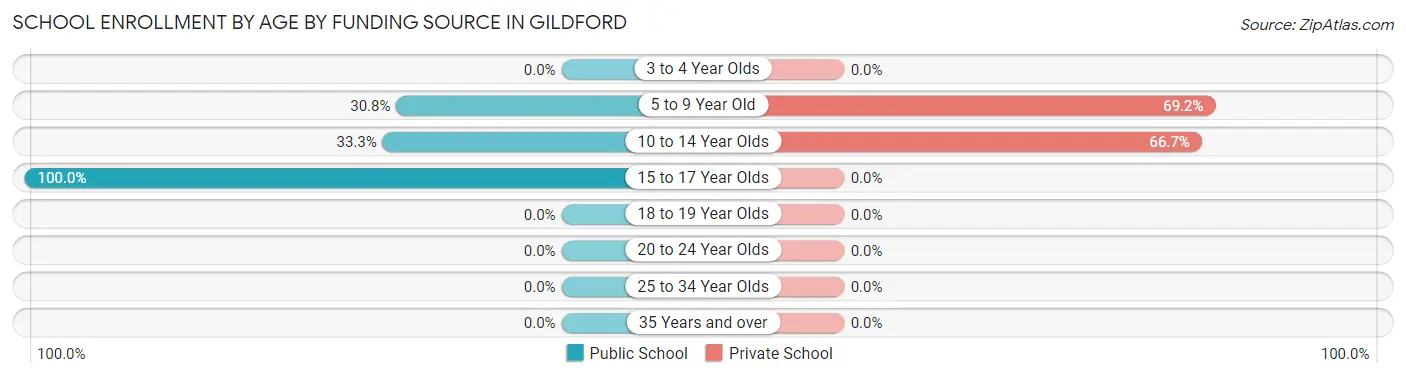
| Age Bracket | Public School | Private School |
| 3 to 4 Year Olds | 0 (0.0%) | 0 (0.0%) |
| 5 to 9 Year Old | 8 (30.8%) | 18 (69.2%) |
| 10 to 14 Year Olds | 3 (33.3%) | 6 (66.7%) |
| 15 to 17 Year Olds | 5 (100.0%) | 0 (0.0%) |
| 18 to 19 Year Olds | 0 (0.0%) | 0 (0.0%) |
| 20 to 24 Year Olds | 0 (0.0%) | 0 (0.0%) |
| 25 to 34 Year Olds | 0 (0.0%) | 0 (0.0%) |
| 35 Years and over | 0 (0.0%) | 0 (0.0%) |
| Total | 16 (40.0%) | 24 (60.0%) |
Educational Attainment by Field of Study in Gildford
Social sciences (7 | 28.0%), liberal arts & history (7 | 28.0%), visual & performing arts (7 | 28.0%), science & technology (3 | 12.0%), and literature & languages (1 | 4.0%) are the most common fields of study among 25 individuals in Gildford who have obtained a bachelor's degree or higher.
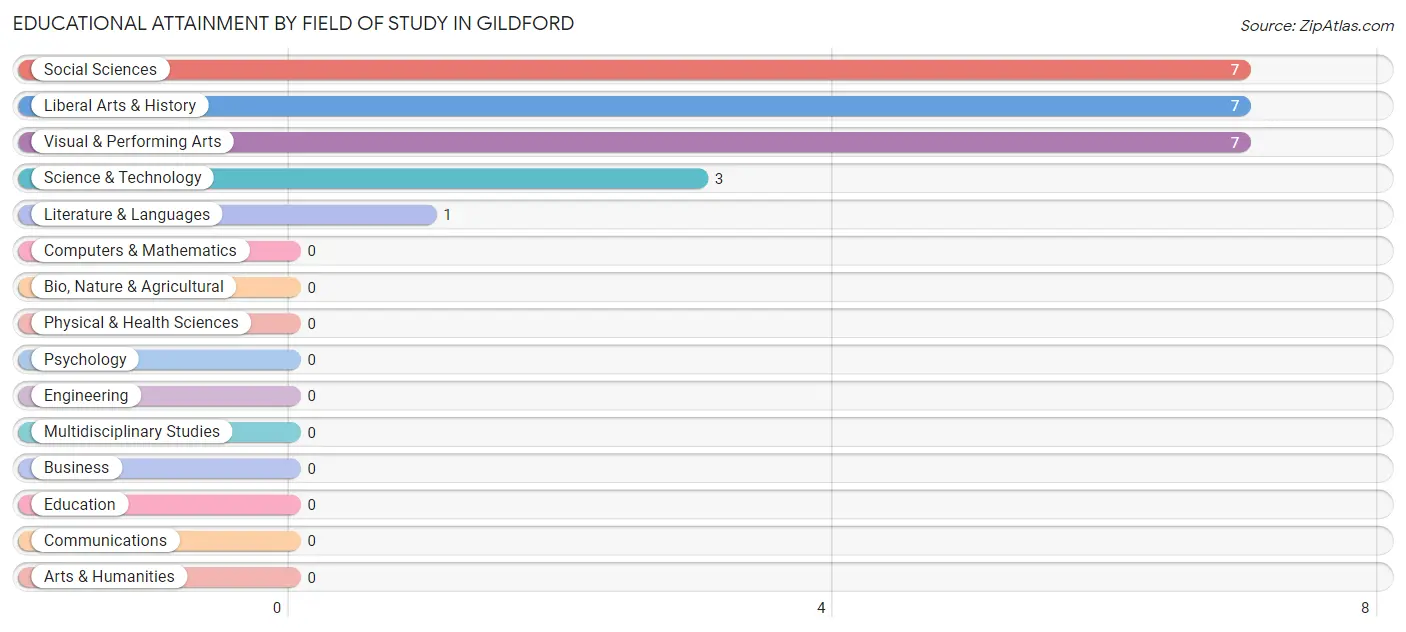
| Field of Study | # Graduates | % Graduates |
| Computers & Mathematics | 0 | 0.0% |
| Bio, Nature & Agricultural | 0 | 0.0% |
| Physical & Health Sciences | 0 | 0.0% |
| Psychology | 0 | 0.0% |
| Social Sciences | 7 | 28.0% |
| Engineering | 0 | 0.0% |
| Multidisciplinary Studies | 0 | 0.0% |
| Science & Technology | 3 | 12.0% |
| Business | 0 | 0.0% |
| Education | 0 | 0.0% |
| Literature & Languages | 1 | 4.0% |
| Liberal Arts & History | 7 | 28.0% |
| Visual & Performing Arts | 7 | 28.0% |
| Communications | 0 | 0.0% |
| Arts & Humanities | 0 | 0.0% |
| Total | 25 | 100.0% |
Transportation & Commute in Gildford
Vehicle Availability by Sex in Gildford
The most prevalent vehicle ownership categories in Gildford are males with 5 or more vehicles (19, accounting for 46.3%) and females with 5 or more vehicles (0, making up 111.8%).
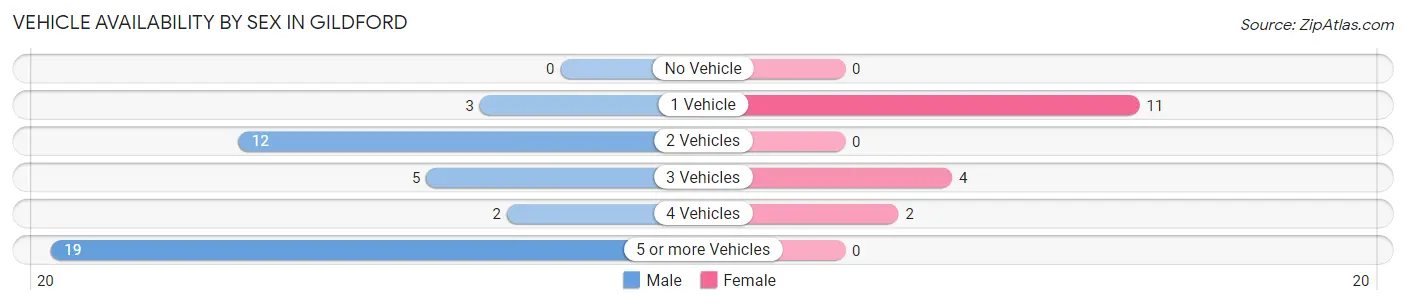
| Vehicles Available | Male | Female |
| No Vehicle | 0 (0.0%) | 0 (0.0%) |
| 1 Vehicle | 3 (7.3%) | 11 (64.7%) |
| 2 Vehicles | 12 (29.3%) | 0 (0.0%) |
| 3 Vehicles | 5 (12.2%) | 4 (23.5%) |
| 4 Vehicles | 2 (4.9%) | 2 (11.8%) |
| 5 or more Vehicles | 19 (46.3%) | 0 (0.0%) |
| Total | 41 (100.0%) | 17 (100.0%) |
Commute Time in Gildford
The most frequently occuring commute durations in Gildford are 20 to 24 minutes (23 commuters, 39.7%), 30 to 34 minutes (15 commuters, 25.9%), and 15 to 19 minutes (7 commuters, 12.1%).
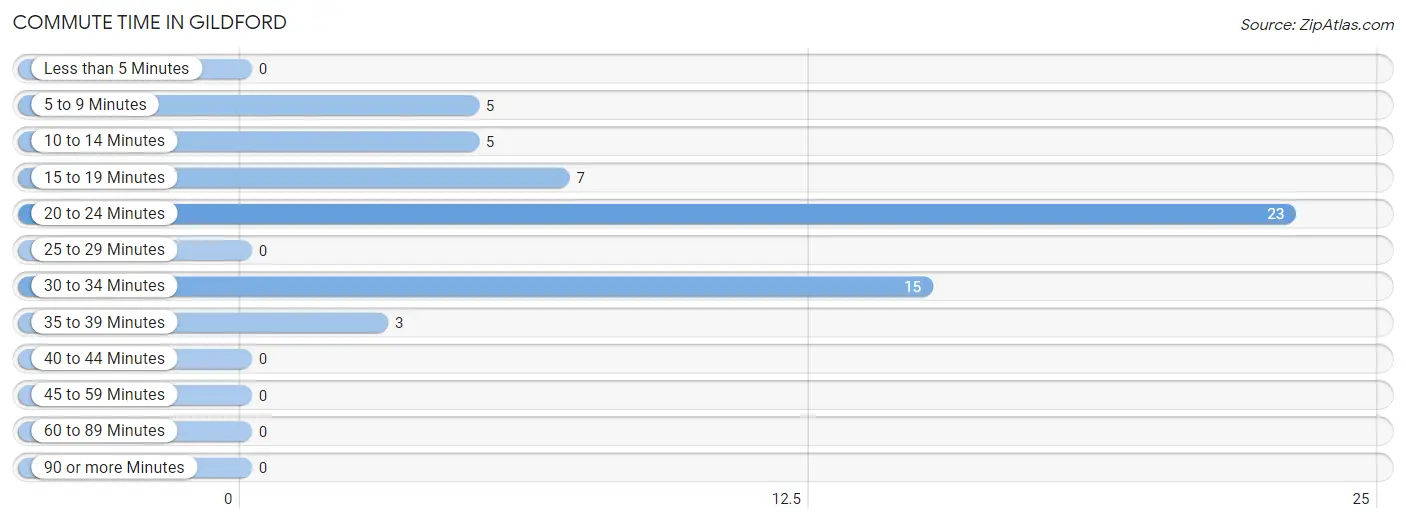
| Commute Time | # Commuters | % Commuters |
| Less than 5 Minutes | 0 | 0.0% |
| 5 to 9 Minutes | 5 | 8.6% |
| 10 to 14 Minutes | 5 | 8.6% |
| 15 to 19 Minutes | 7 | 12.1% |
| 20 to 24 Minutes | 23 | 39.7% |
| 25 to 29 Minutes | 0 | 0.0% |
| 30 to 34 Minutes | 15 | 25.9% |
| 35 to 39 Minutes | 3 | 5.2% |
| 40 to 44 Minutes | 0 | 0.0% |
| 45 to 59 Minutes | 0 | 0.0% |
| 60 to 89 Minutes | 0 | 0.0% |
| 90 or more Minutes | 0 | 0.0% |
Commute Time by Sex in Gildford
The most common commute times in Gildford are 20 to 24 minutes (23 commuters, 56.1%) for males and 15 to 19 minutes (7 commuters, 41.2%) for females.
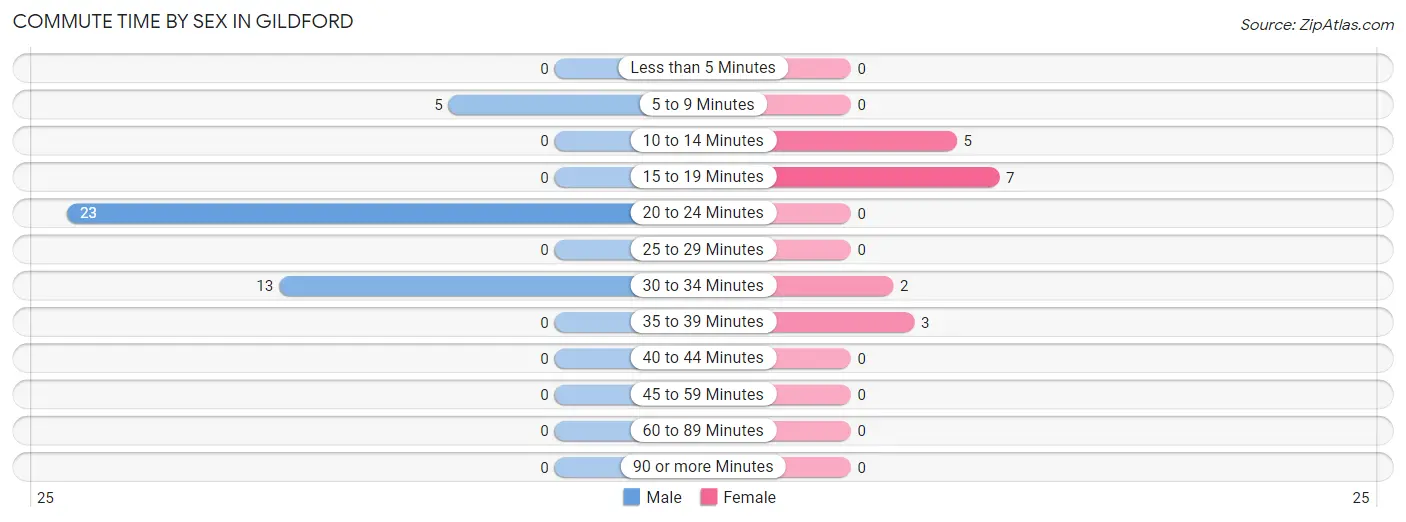
| Commute Time | Male | Female |
| Less than 5 Minutes | 0 (0.0%) | 0 (0.0%) |
| 5 to 9 Minutes | 5 (12.2%) | 0 (0.0%) |
| 10 to 14 Minutes | 0 (0.0%) | 5 (29.4%) |
| 15 to 19 Minutes | 0 (0.0%) | 7 (41.2%) |
| 20 to 24 Minutes | 23 (56.1%) | 0 (0.0%) |
| 25 to 29 Minutes | 0 (0.0%) | 0 (0.0%) |
| 30 to 34 Minutes | 13 (31.7%) | 2 (11.8%) |
| 35 to 39 Minutes | 0 (0.0%) | 3 (17.6%) |
| 40 to 44 Minutes | 0 (0.0%) | 0 (0.0%) |
| 45 to 59 Minutes | 0 (0.0%) | 0 (0.0%) |
| 60 to 89 Minutes | 0 (0.0%) | 0 (0.0%) |
| 90 or more Minutes | 0 (0.0%) | 0 (0.0%) |
Time of Departure to Work by Sex in Gildford
The most frequent times of departure to work in Gildford are 7:00 AM to 7:29 AM (17, 41.5%) for males and 9:00 AM to 9:59 AM (7, 41.2%) for females.
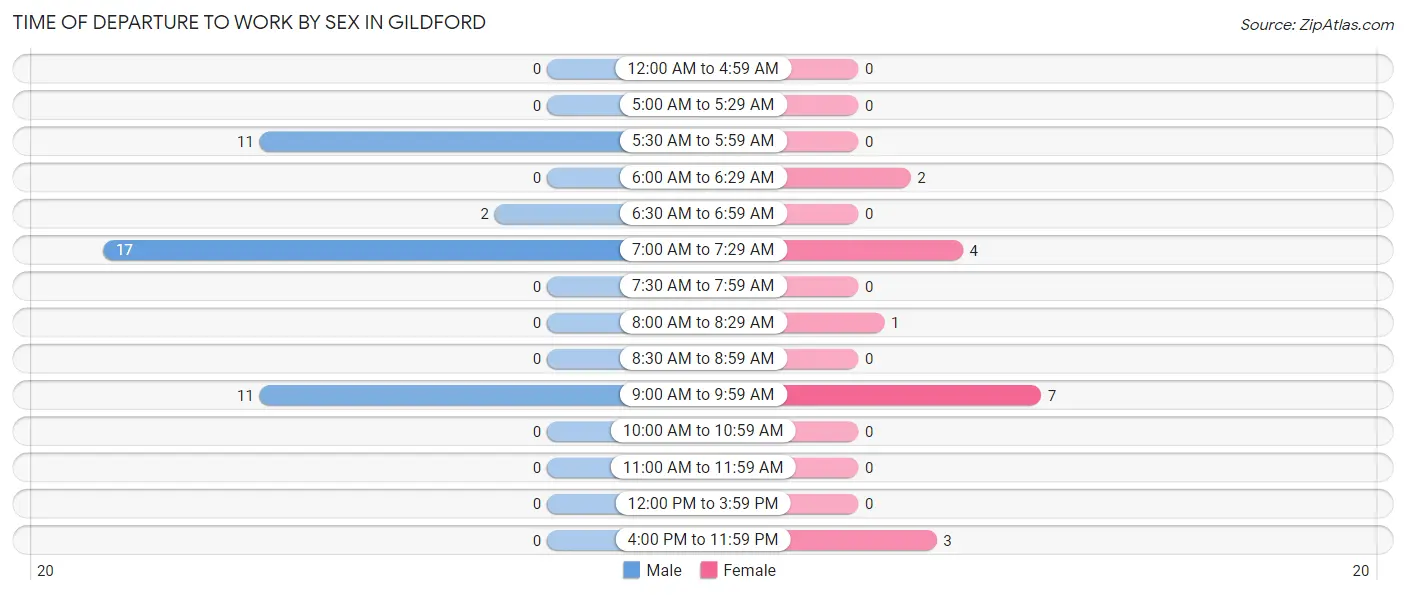
| Time of Departure | Male | Female |
| 12:00 AM to 4:59 AM | 0 (0.0%) | 0 (0.0%) |
| 5:00 AM to 5:29 AM | 0 (0.0%) | 0 (0.0%) |
| 5:30 AM to 5:59 AM | 11 (26.8%) | 0 (0.0%) |
| 6:00 AM to 6:29 AM | 0 (0.0%) | 2 (11.8%) |
| 6:30 AM to 6:59 AM | 2 (4.9%) | 0 (0.0%) |
| 7:00 AM to 7:29 AM | 17 (41.5%) | 4 (23.5%) |
| 7:30 AM to 7:59 AM | 0 (0.0%) | 0 (0.0%) |
| 8:00 AM to 8:29 AM | 0 (0.0%) | 1 (5.9%) |
| 8:30 AM to 8:59 AM | 0 (0.0%) | 0 (0.0%) |
| 9:00 AM to 9:59 AM | 11 (26.8%) | 7 (41.2%) |
| 10:00 AM to 10:59 AM | 0 (0.0%) | 0 (0.0%) |
| 11:00 AM to 11:59 AM | 0 (0.0%) | 0 (0.0%) |
| 12:00 PM to 3:59 PM | 0 (0.0%) | 0 (0.0%) |
| 4:00 PM to 11:59 PM | 0 (0.0%) | 3 (17.6%) |
| Total | 41 (100.0%) | 17 (100.0%) |
Housing Occupancy in Gildford
Occupancy by Ownership in Gildford
Of the total 56 dwellings in Gildford, owner-occupied units account for 37 (66.1%), while renter-occupied units make up 19 (33.9%).
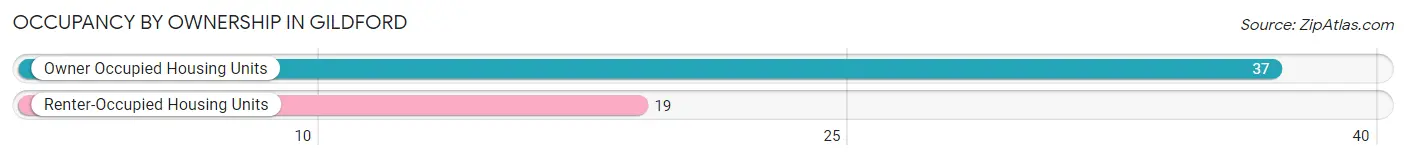
| Occupancy | # Housing Units | % Housing Units |
| Owner Occupied Housing Units | 37 | 66.1% |
| Renter-Occupied Housing Units | 19 | 33.9% |
| Total Occupied Housing Units | 56 | 100.0% |
Occupancy by Household Size in Gildford
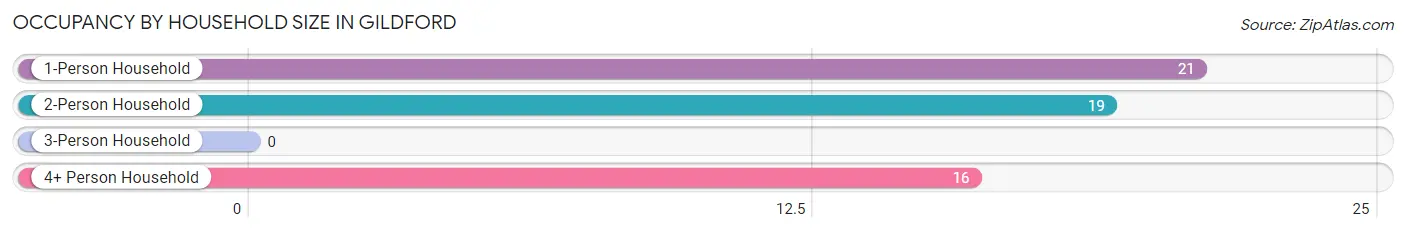
| Household Size | # Housing Units | % Housing Units |
| 1-Person Household | 21 | 37.5% |
| 2-Person Household | 19 | 33.9% |
| 3-Person Household | 0 | 0.0% |
| 4+ Person Household | 16 | 28.6% |
| Total Housing Units | 56 | 100.0% |
Occupancy by Ownership by Household Size in Gildford
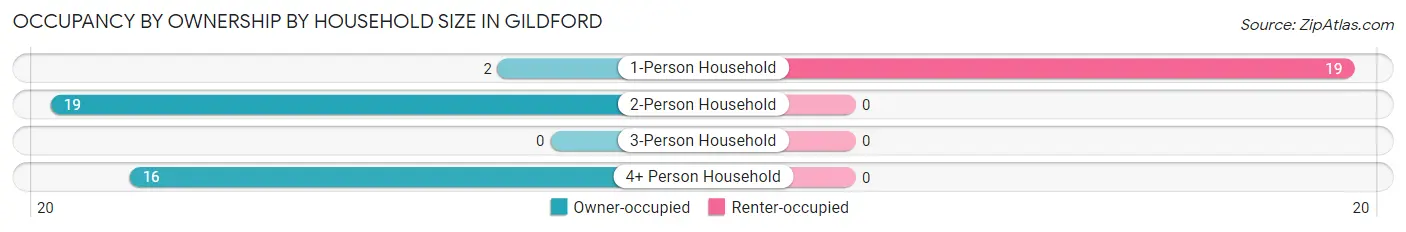
| Household Size | Owner-occupied | Renter-occupied |
| 1-Person Household | 2 (9.5%) | 19 (90.5%) |
| 2-Person Household | 19 (100.0%) | 0 (0.0%) |
| 3-Person Household | 0 (0.0%) | 0 (0.0%) |
| 4+ Person Household | 16 (100.0%) | 0 (0.0%) |
| Total Housing Units | 37 (66.1%) | 19 (33.9%) |
Occupancy by Educational Attainment in Gildford
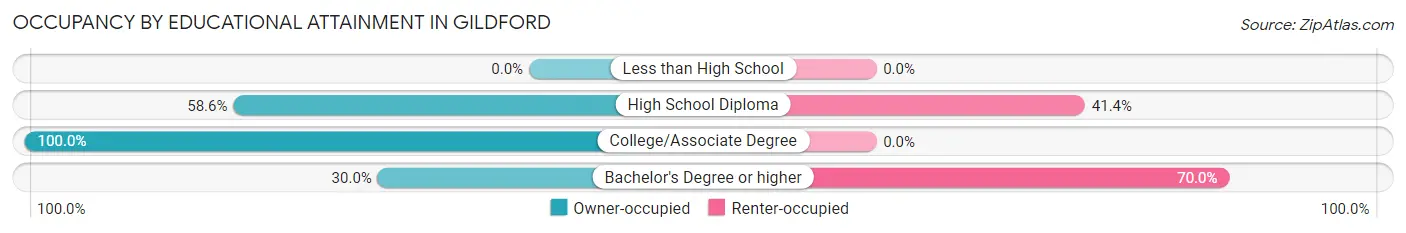
| Household Size | Owner-occupied | Renter-occupied |
| Less than High School | 0 (0.0%) | 0 (0.0%) |
| High School Diploma | 17 (58.6%) | 12 (41.4%) |
| College/Associate Degree | 17 (100.0%) | 0 (0.0%) |
| Bachelor's Degree or higher | 3 (30.0%) | 7 (70.0%) |
Occupancy by Age of Householder in Gildford
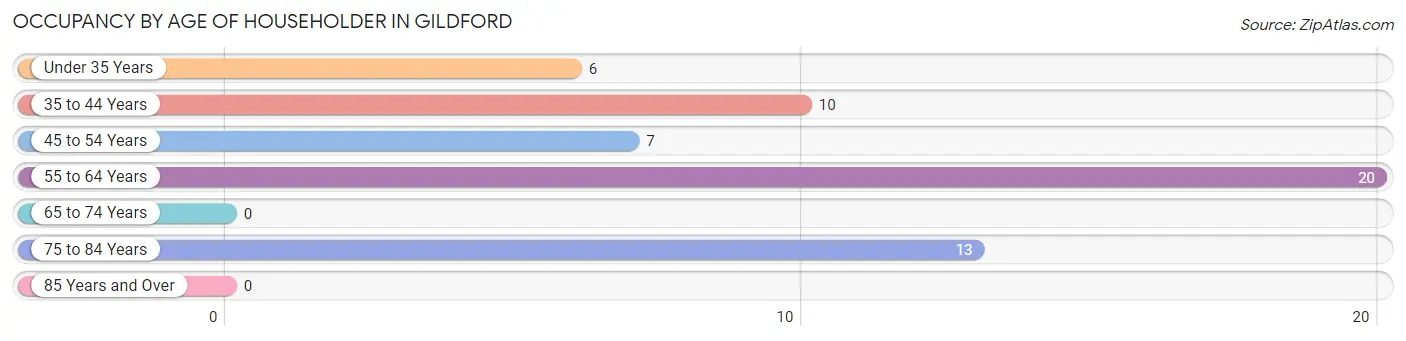
| Age Bracket | # Households | % Households |
| Under 35 Years | 6 | 10.7% |
| 35 to 44 Years | 10 | 17.9% |
| 45 to 54 Years | 7 | 12.5% |
| 55 to 64 Years | 20 | 35.7% |
| 65 to 74 Years | 0 | 0.0% |
| 75 to 84 Years | 13 | 23.2% |
| 85 Years and Over | 0 | 0.0% |
| Total | 56 | 100.0% |
Housing Finances in Gildford
Median Income by Occupancy in Gildford
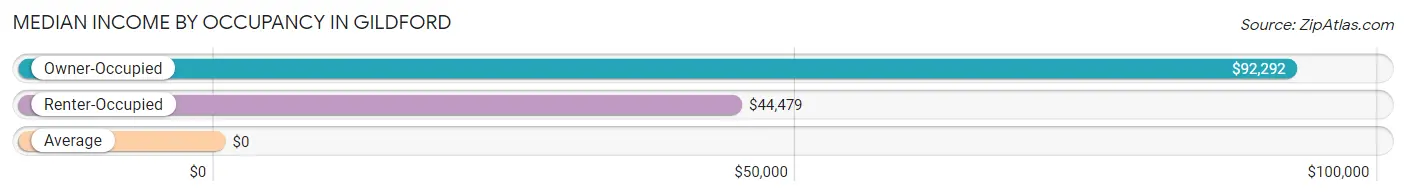
| Occupancy Type | # Households | Median Income |
| Owner-Occupied | 37 (66.1%) | $92,292 |
| Renter-Occupied | 19 (33.9%) | $44,479 |
| Average | 56 (100.0%) | $0 |
Occupancy by Householder Income Bracket in Gildford
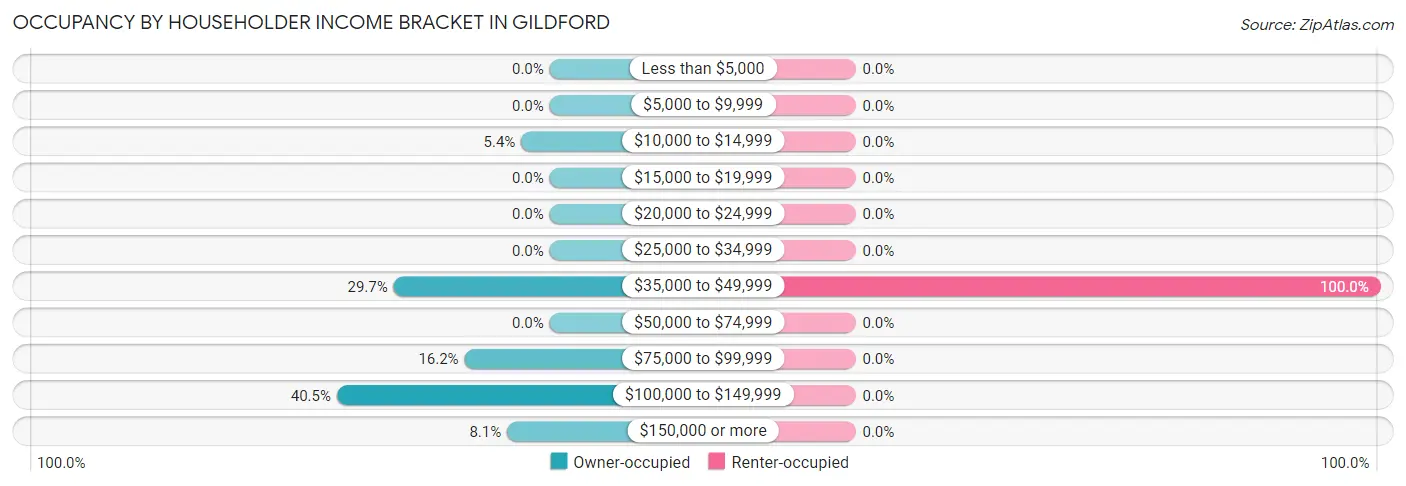
| Income Bracket | Owner-occupied | Renter-occupied |
| Less than $5,000 | 0 (0.0%) | 0 (0.0%) |
| $5,000 to $9,999 | 0 (0.0%) | 0 (0.0%) |
| $10,000 to $14,999 | 2 (5.4%) | 0 (0.0%) |
| $15,000 to $19,999 | 0 (0.0%) | 0 (0.0%) |
| $20,000 to $24,999 | 0 (0.0%) | 0 (0.0%) |
| $25,000 to $34,999 | 0 (0.0%) | 0 (0.0%) |
| $35,000 to $49,999 | 11 (29.7%) | 19 (100.0%) |
| $50,000 to $74,999 | 0 (0.0%) | 0 (0.0%) |
| $75,000 to $99,999 | 6 (16.2%) | 0 (0.0%) |
| $100,000 to $149,999 | 15 (40.5%) | 0 (0.0%) |
| $150,000 or more | 3 (8.1%) | 0 (0.0%) |
| Total | 37 (100.0%) | 19 (100.0%) |
Monthly Housing Cost Tiers in Gildford
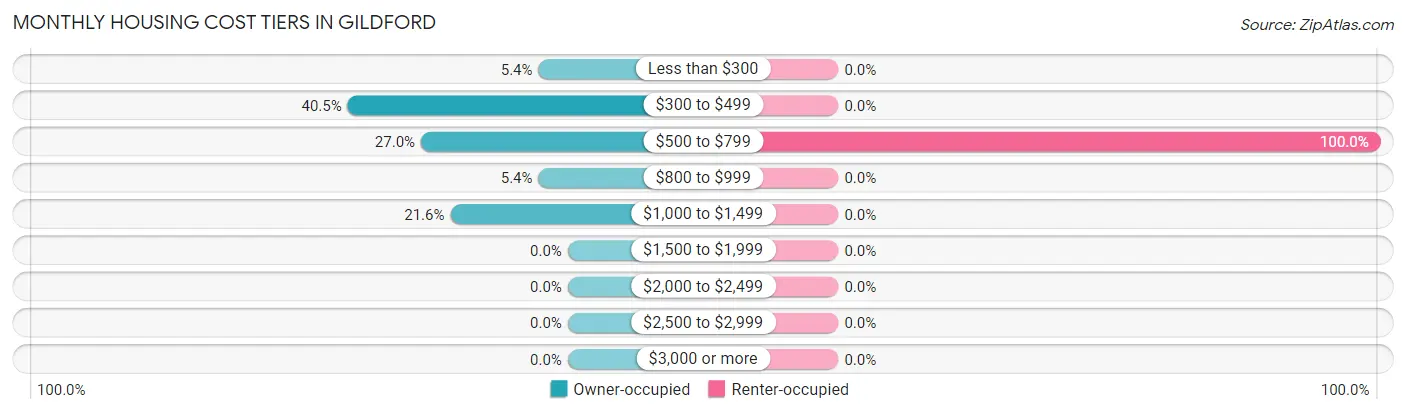
| Monthly Cost | Owner-occupied | Renter-occupied |
| Less than $300 | 2 (5.4%) | 0 (0.0%) |
| $300 to $499 | 15 (40.5%) | 0 (0.0%) |
| $500 to $799 | 10 (27.0%) | 19 (100.0%) |
| $800 to $999 | 2 (5.4%) | 0 (0.0%) |
| $1,000 to $1,499 | 8 (21.6%) | 0 (0.0%) |
| $1,500 to $1,999 | 0 (0.0%) | 0 (0.0%) |
| $2,000 to $2,499 | 0 (0.0%) | 0 (0.0%) |
| $2,500 to $2,999 | 0 (0.0%) | 0 (0.0%) |
| $3,000 or more | 0 (0.0%) | 0 (0.0%) |
| Total | 37 (100.0%) | 19 (100.0%) |
Physical Housing Characteristics in Gildford
Housing Structures in Gildford
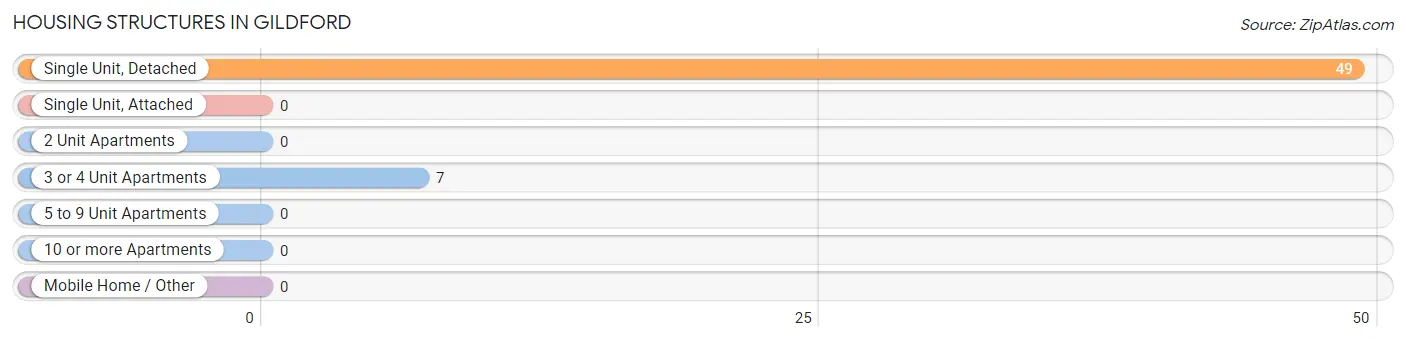
| Structure Type | # Housing Units | % Housing Units |
| Single Unit, Detached | 49 | 87.5% |
| Single Unit, Attached | 0 | 0.0% |
| 2 Unit Apartments | 0 | 0.0% |
| 3 or 4 Unit Apartments | 7 | 12.5% |
| 5 to 9 Unit Apartments | 0 | 0.0% |
| 10 or more Apartments | 0 | 0.0% |
| Mobile Home / Other | 0 | 0.0% |
| Total | 56 | 100.0% |
Housing Structures by Occupancy in Gildford
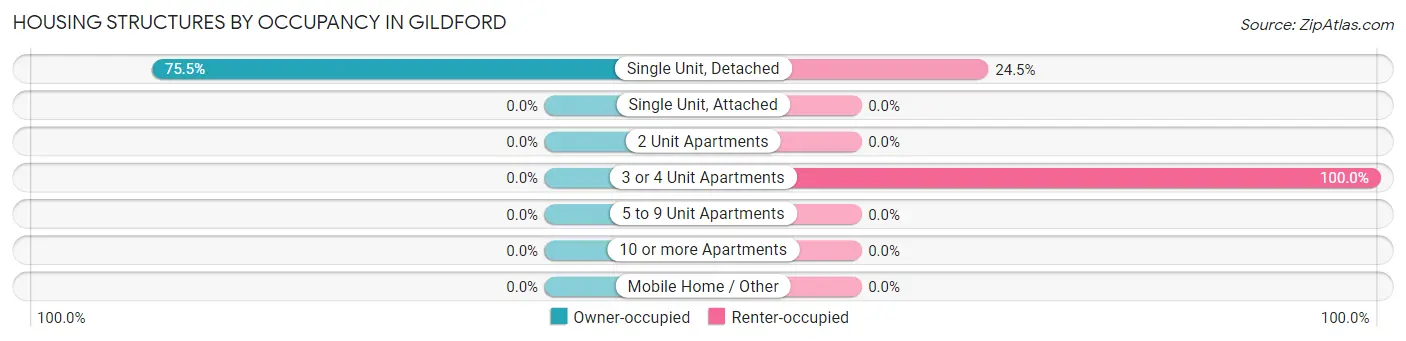
| Structure Type | Owner-occupied | Renter-occupied |
| Single Unit, Detached | 37 (75.5%) | 12 (24.5%) |
| Single Unit, Attached | 0 (0.0%) | 0 (0.0%) |
| 2 Unit Apartments | 0 (0.0%) | 0 (0.0%) |
| 3 or 4 Unit Apartments | 0 (0.0%) | 7 (100.0%) |
| 5 to 9 Unit Apartments | 0 (0.0%) | 0 (0.0%) |
| 10 or more Apartments | 0 (0.0%) | 0 (0.0%) |
| Mobile Home / Other | 0 (0.0%) | 0 (0.0%) |
| Total | 37 (66.1%) | 19 (33.9%) |
Housing Structures by Number of Rooms in Gildford
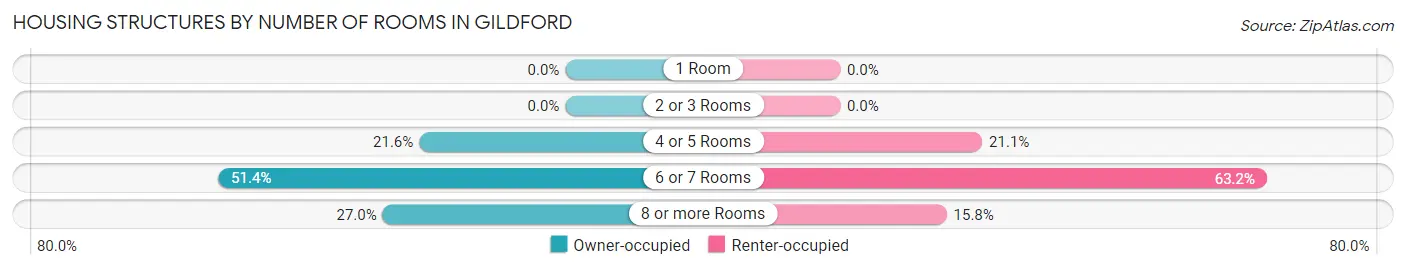
| Number of Rooms | Owner-occupied | Renter-occupied |
| 1 Room | 0 (0.0%) | 0 (0.0%) |
| 2 or 3 Rooms | 0 (0.0%) | 0 (0.0%) |
| 4 or 5 Rooms | 8 (21.6%) | 4 (21.0%) |
| 6 or 7 Rooms | 19 (51.3%) | 12 (63.2%) |
| 8 or more Rooms | 10 (27.0%) | 3 (15.8%) |
| Total | 37 (100.0%) | 19 (100.0%) |
Housing Structure by Heating Type in Gildford
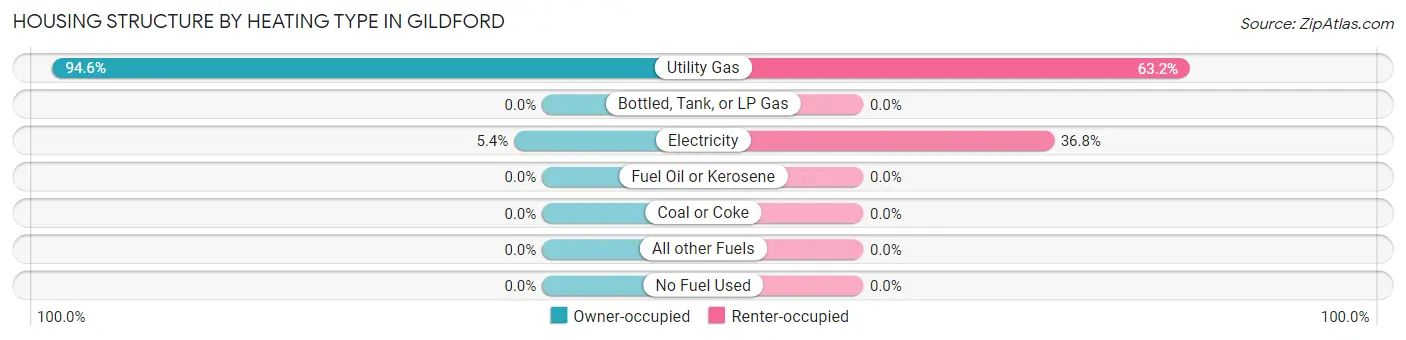
| Heating Type | Owner-occupied | Renter-occupied |
| Utility Gas | 35 (94.6%) | 12 (63.2%) |
| Bottled, Tank, or LP Gas | 0 (0.0%) | 0 (0.0%) |
| Electricity | 2 (5.4%) | 7 (36.8%) |
| Fuel Oil or Kerosene | 0 (0.0%) | 0 (0.0%) |
| Coal or Coke | 0 (0.0%) | 0 (0.0%) |
| All other Fuels | 0 (0.0%) | 0 (0.0%) |
| No Fuel Used | 0 (0.0%) | 0 (0.0%) |
| Total | 37 (100.0%) | 19 (100.0%) |
Household Vehicle Usage in Gildford
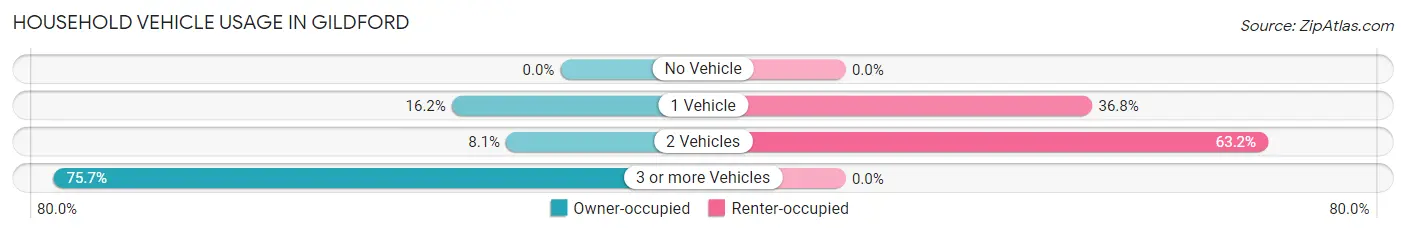
| Vehicles per Household | Owner-occupied | Renter-occupied |
| No Vehicle | 0 (0.0%) | 0 (0.0%) |
| 1 Vehicle | 6 (16.2%) | 7 (36.8%) |
| 2 Vehicles | 3 (8.1%) | 12 (63.2%) |
| 3 or more Vehicles | 28 (75.7%) | 0 (0.0%) |
| Total | 37 (100.0%) | 19 (100.0%) |
Real Estate & Mortgages in Gildford
Real Estate and Mortgage Overview in Gildford
| Characteristic | Without Mortgage | With Mortgage |
| Housing Units | 27 | 10 |
| Median Property Value | $112,500 | $0 |
| Median Household Income | $110,781 | $0 |
| Monthly Housing Costs | $456 | $0 |
| Real Estate Taxes | $1,341 | $0 |
Property Value by Mortgage Status in Gildford
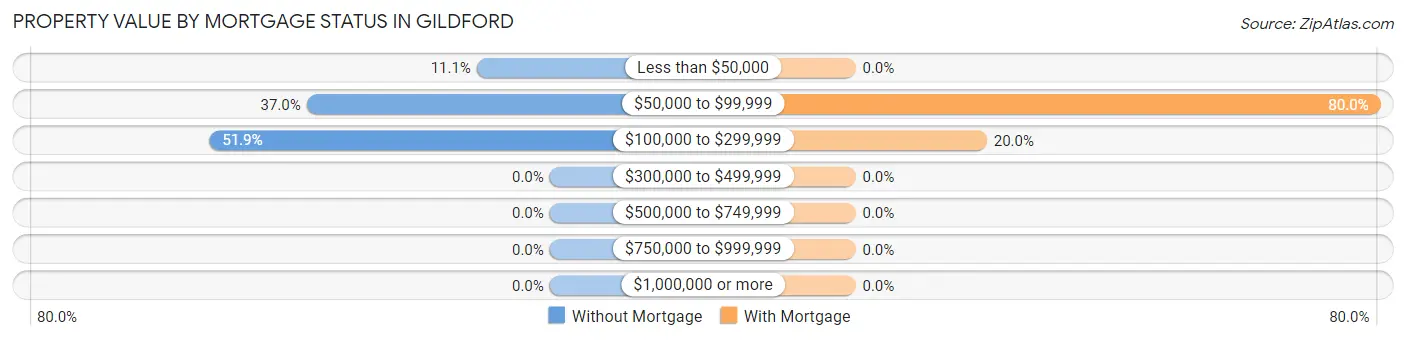
| Property Value | Without Mortgage | With Mortgage |
| Less than $50,000 | 3 (11.1%) | 0 (0.0%) |
| $50,000 to $99,999 | 10 (37.0%) | 8 (80.0%) |
| $100,000 to $299,999 | 14 (51.8%) | 2 (20.0%) |
| $300,000 to $499,999 | 0 (0.0%) | 0 (0.0%) |
| $500,000 to $749,999 | 0 (0.0%) | 0 (0.0%) |
| $750,000 to $999,999 | 0 (0.0%) | 0 (0.0%) |
| $1,000,000 or more | 0 (0.0%) | 0 (0.0%) |
| Total | 27 (100.0%) | 10 (100.0%) |
Household Income by Mortgage Status in Gildford
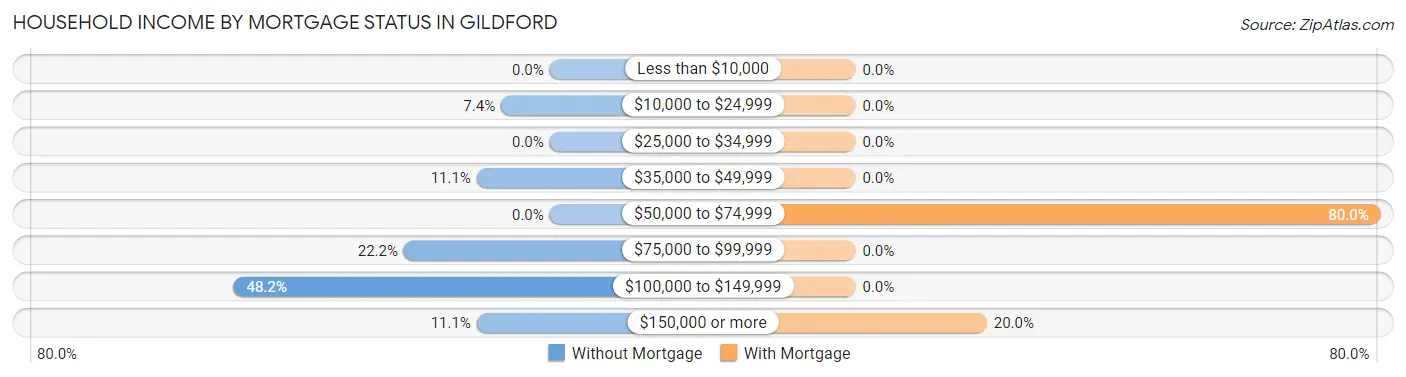
| Household Income | Without Mortgage | With Mortgage |
| Less than $10,000 | 0 (0.0%) | 0 (0.0%) |
| $10,000 to $24,999 | 2 (7.4%) | 0 (0.0%) |
| $25,000 to $34,999 | 0 (0.0%) | 0 (0.0%) |
| $35,000 to $49,999 | 3 (11.1%) | 0 (0.0%) |
| $50,000 to $74,999 | 0 (0.0%) | 8 (80.0%) |
| $75,000 to $99,999 | 6 (22.2%) | 0 (0.0%) |
| $100,000 to $149,999 | 13 (48.1%) | 0 (0.0%) |
| $150,000 or more | 3 (11.1%) | 2 (20.0%) |
| Total | 27 (100.0%) | 10 (100.0%) |
Property Value to Household Income Ratio in Gildford

| Value-to-Income Ratio | Without Mortgage | With Mortgage |
| Less than 2.0x | 22 (81.5%) | 0 (0.0%) |
| 2.0x to 2.9x | 0 (0.0%) | 10 (100.0%) |
| 3.0x to 3.9x | 3 (11.1%) | 0 (0.0%) |
| 4.0x or more | 2 (7.4%) | 0 (0.0%) |
| Total | 27 (100.0%) | 10 (100.0%) |
Real Estate Taxes by Mortgage Status in Gildford
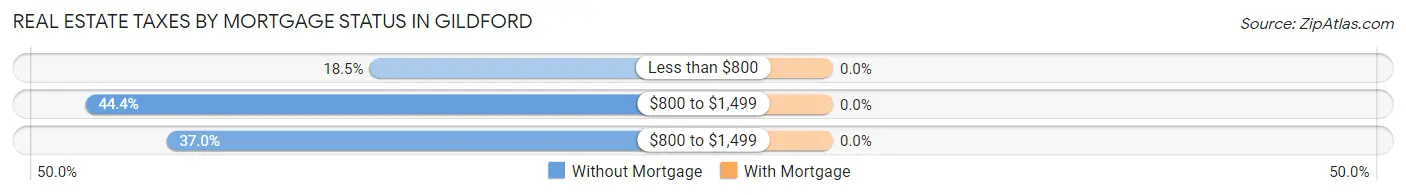
| Property Taxes | Without Mortgage | With Mortgage |
| Less than $800 | 5 (18.5%) | 0 (0.0%) |
| $800 to $1,499 | 12 (44.4%) | 0 (0.0%) |
| $800 to $1,499 | 10 (37.0%) | 0 (0.0%) |
| Total | 27 (100.0%) | 10 (100.0%) |
Health & Disability in Gildford
Health Insurance Coverage by Age in Gildford
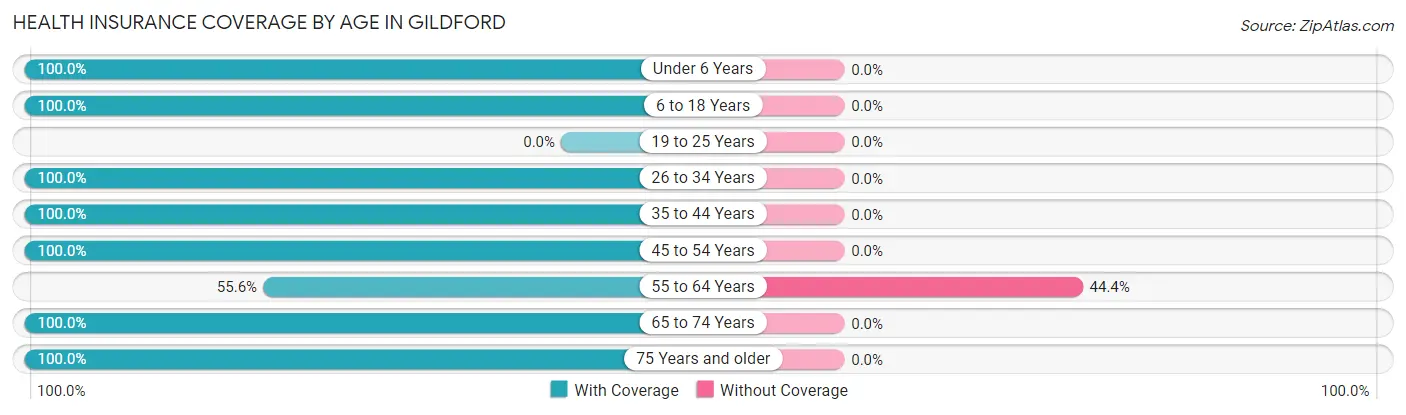
| Age Bracket | With Coverage | Without Coverage |
| Under 6 Years | 23 (100.0%) | 0 (0.0%) |
| 6 to 18 Years | 51 (100.0%) | 0 (0.0%) |
| 19 to 25 Years | 0 (0.0%) | 0 (0.0%) |
| 26 to 34 Years | 6 (100.0%) | 0 (0.0%) |
| 35 to 44 Years | 23 (100.0%) | 0 (0.0%) |
| 45 to 54 Years | 11 (100.0%) | 0 (0.0%) |
| 55 to 64 Years | 15 (55.6%) | 12 (44.4%) |
| 65 to 74 Years | 9 (100.0%) | 0 (0.0%) |
| 75 Years and older | 16 (100.0%) | 0 (0.0%) |
| Total | 154 (92.8%) | 12 (7.2%) |
Health Insurance Coverage by Citizenship Status in Gildford
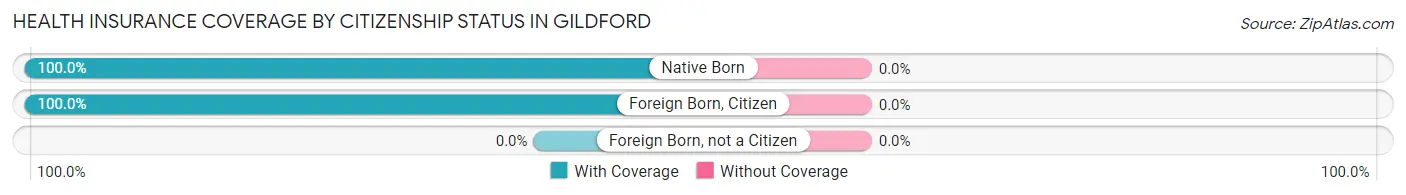
| Citizenship Status | With Coverage | Without Coverage |
| Native Born | 23 (100.0%) | 0 (0.0%) |
| Foreign Born, Citizen | 51 (100.0%) | 0 (0.0%) |
| Foreign Born, not a Citizen | 0 (0.0%) | 0 (0.0%) |
Health Insurance Coverage by Household Income in Gildford
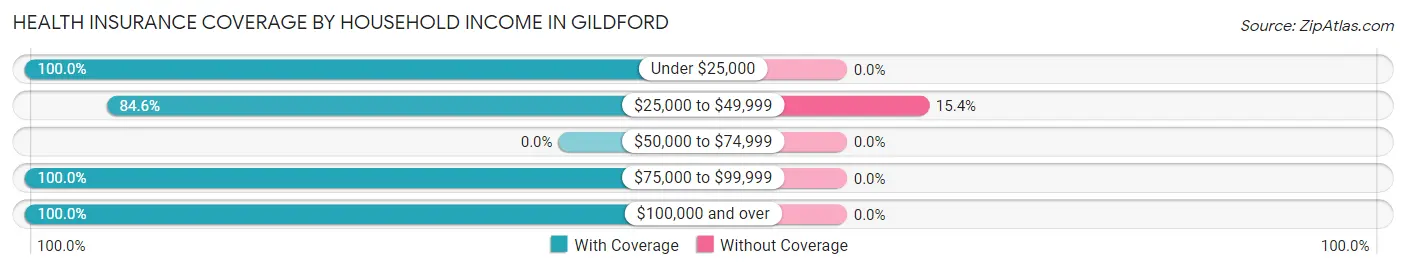
| Household Income | With Coverage | Without Coverage |
| Under $25,000 | 2 (100.0%) | 0 (0.0%) |
| $25,000 to $49,999 | 66 (84.6%) | 12 (15.4%) |
| $50,000 to $74,999 | 0 (0.0%) | 0 (0.0%) |
| $75,000 to $99,999 | 32 (100.0%) | 0 (0.0%) |
| $100,000 and over | 54 (100.0%) | 0 (0.0%) |
Public vs Private Health Insurance Coverage by Age in Gildford
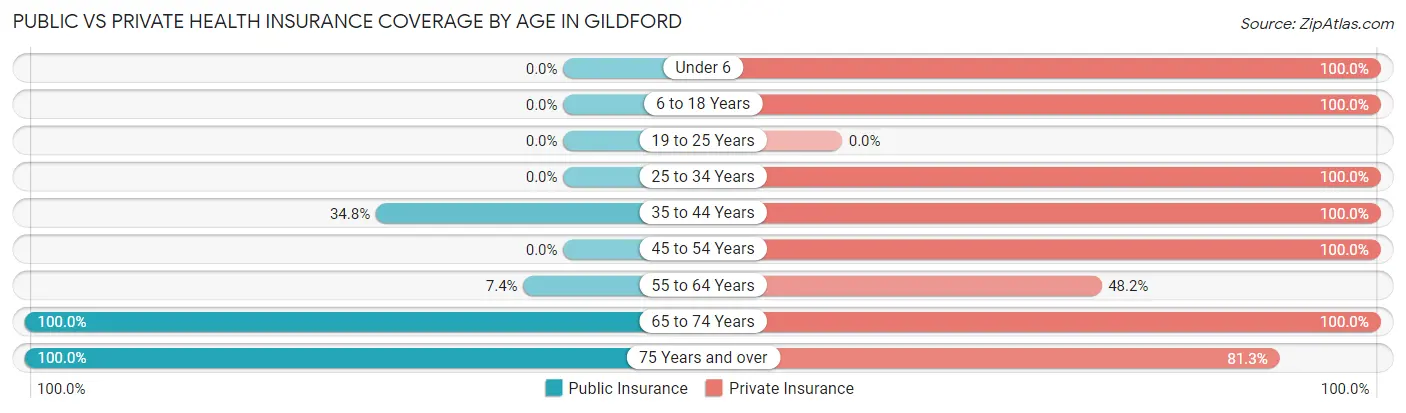
| Age Bracket | Public Insurance | Private Insurance |
| Under 6 | 0 (0.0%) | 23 (100.0%) |
| 6 to 18 Years | 0 (0.0%) | 51 (100.0%) |
| 19 to 25 Years | 0 (0.0%) | 0 (0.0%) |
| 25 to 34 Years | 0 (0.0%) | 6 (100.0%) |
| 35 to 44 Years | 8 (34.8%) | 23 (100.0%) |
| 45 to 54 Years | 0 (0.0%) | 11 (100.0%) |
| 55 to 64 Years | 2 (7.4%) | 13 (48.1%) |
| 65 to 74 Years | 9 (100.0%) | 9 (100.0%) |
| 75 Years and over | 16 (100.0%) | 13 (81.2%) |
| Total | 35 (21.1%) | 149 (89.8%) |
Disability Status by Sex by Age in Gildford
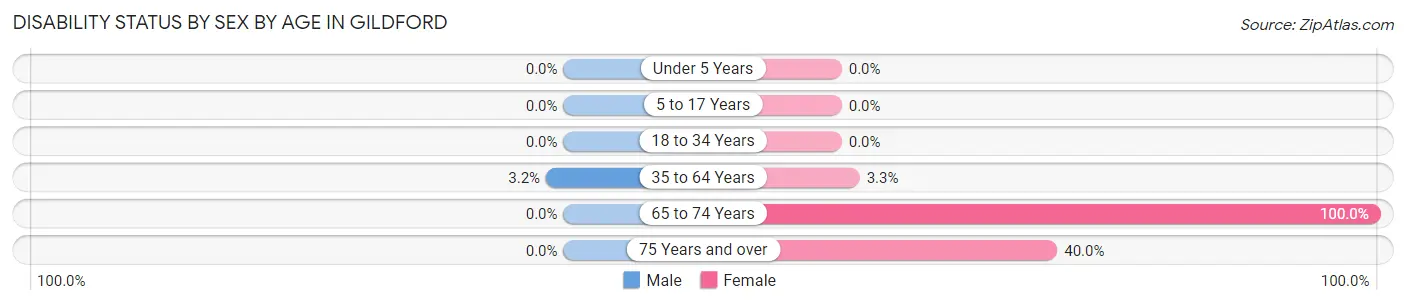
| Age Bracket | Male | Female |
| Under 5 Years | 0 (0.0%) | 0 (0.0%) |
| 5 to 17 Years | 0 (0.0%) | 0 (0.0%) |
| 18 to 34 Years | 0 (0.0%) | 0 (0.0%) |
| 35 to 64 Years | 1 (3.2%) | 1 (3.3%) |
| 65 to 74 Years | 0 (0.0%) | 9 (100.0%) |
| 75 Years and over | 0 (0.0%) | 2 (40.0%) |
Disability Class by Sex by Age in Gildford
Disability Class: Hearing Difficulty
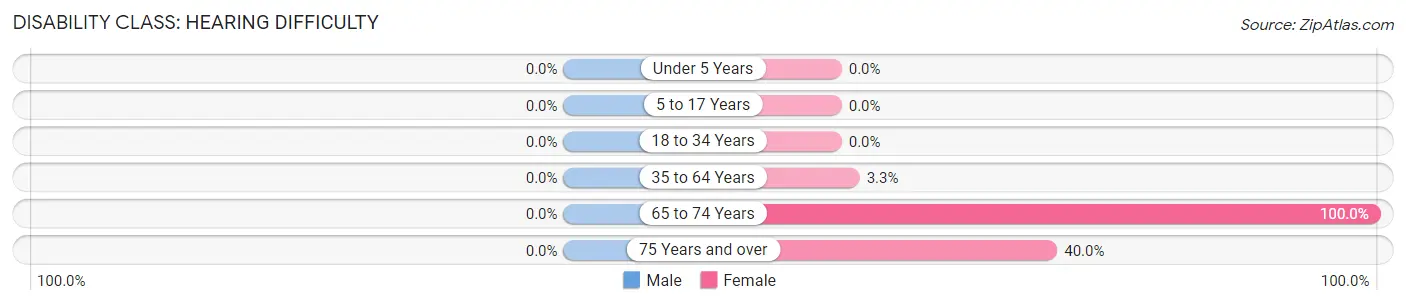
| Age Bracket | Male | Female |
| Under 5 Years | 0 (0.0%) | 0 (0.0%) |
| 5 to 17 Years | 0 (0.0%) | 0 (0.0%) |
| 18 to 34 Years | 0 (0.0%) | 0 (0.0%) |
| 35 to 64 Years | 0 (0.0%) | 1 (3.3%) |
| 65 to 74 Years | 0 (0.0%) | 9 (100.0%) |
| 75 Years and over | 0 (0.0%) | 2 (40.0%) |
Disability Class: Vision Difficulty
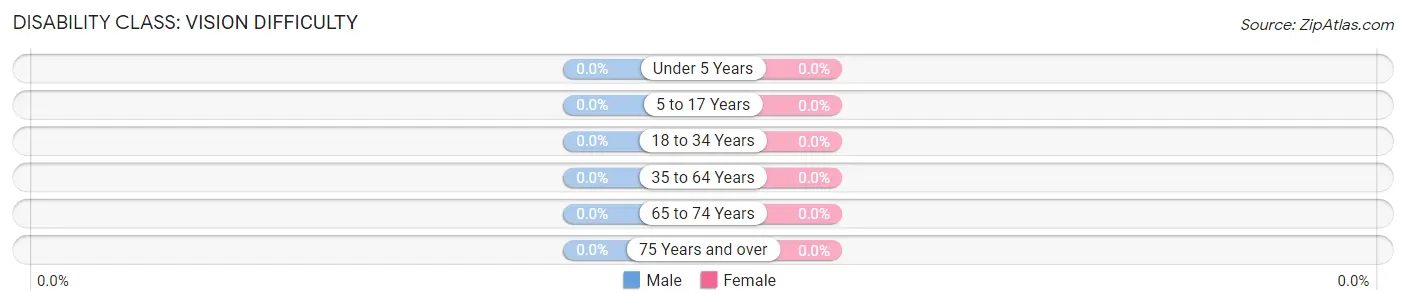
| Age Bracket | Male | Female |
| Under 5 Years | 0 (0.0%) | 0 (0.0%) |
| 5 to 17 Years | 0 (0.0%) | 0 (0.0%) |
| 18 to 34 Years | 0 (0.0%) | 0 (0.0%) |
| 35 to 64 Years | 0 (0.0%) | 0 (0.0%) |
| 65 to 74 Years | 0 (0.0%) | 0 (0.0%) |
| 75 Years and over | 0 (0.0%) | 0 (0.0%) |
Disability Class: Cognitive Difficulty
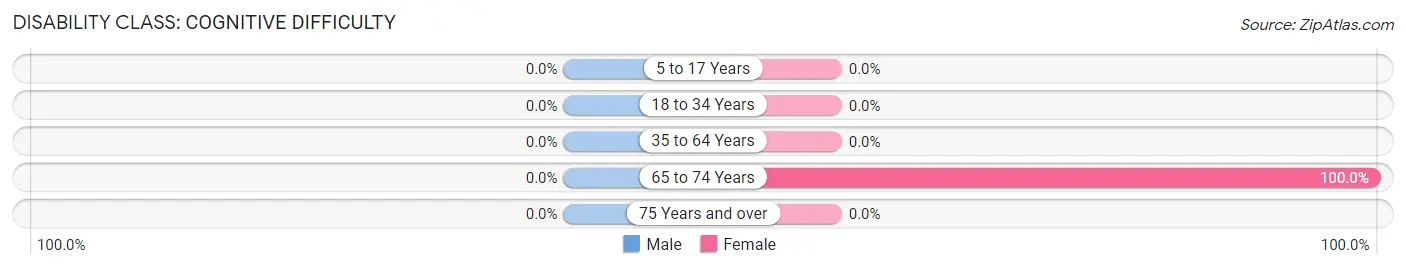
| Age Bracket | Male | Female |
| 5 to 17 Years | 0 (0.0%) | 0 (0.0%) |
| 18 to 34 Years | 0 (0.0%) | 0 (0.0%) |
| 35 to 64 Years | 0 (0.0%) | 0 (0.0%) |
| 65 to 74 Years | 0 (0.0%) | 9 (100.0%) |
| 75 Years and over | 0 (0.0%) | 0 (0.0%) |
Disability Class: Ambulatory Difficulty
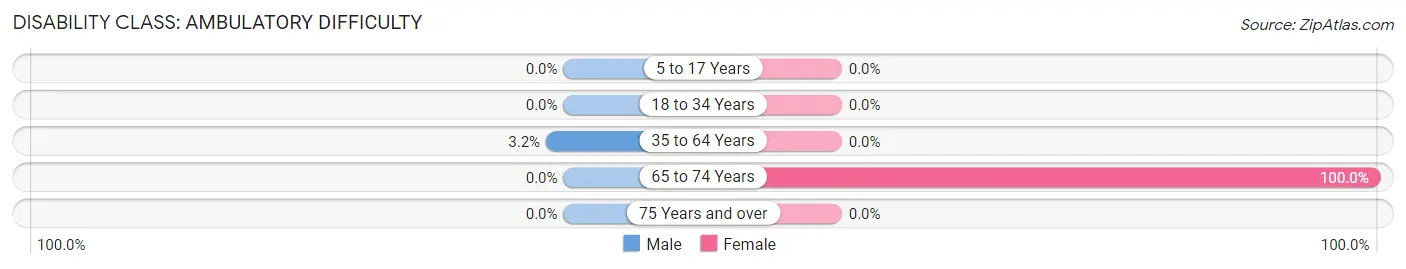
| Age Bracket | Male | Female |
| 5 to 17 Years | 0 (0.0%) | 0 (0.0%) |
| 18 to 34 Years | 0 (0.0%) | 0 (0.0%) |
| 35 to 64 Years | 1 (3.2%) | 0 (0.0%) |
| 65 to 74 Years | 0 (0.0%) | 9 (100.0%) |
| 75 Years and over | 0 (0.0%) | 0 (0.0%) |
Disability Class: Self-Care Difficulty
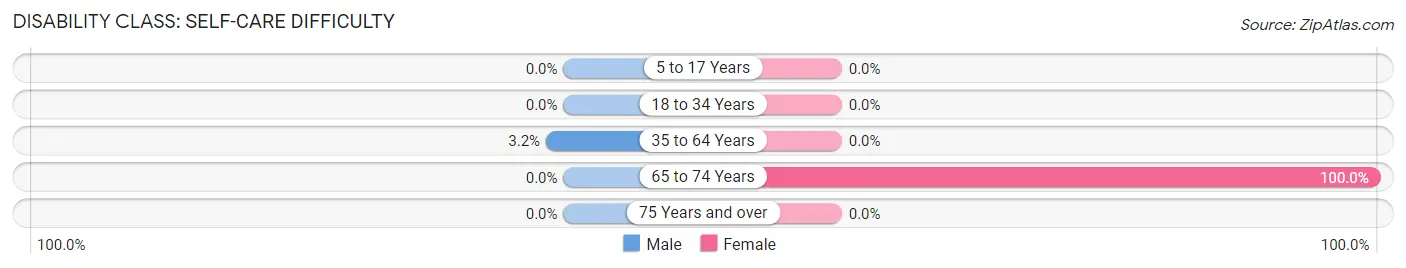
| Age Bracket | Male | Female |
| 5 to 17 Years | 0 (0.0%) | 0 (0.0%) |
| 18 to 34 Years | 0 (0.0%) | 0 (0.0%) |
| 35 to 64 Years | 1 (3.2%) | 0 (0.0%) |
| 65 to 74 Years | 0 (0.0%) | 9 (100.0%) |
| 75 Years and over | 0 (0.0%) | 0 (0.0%) |
Technology Access in Gildford
Computing Device Access in Gildford
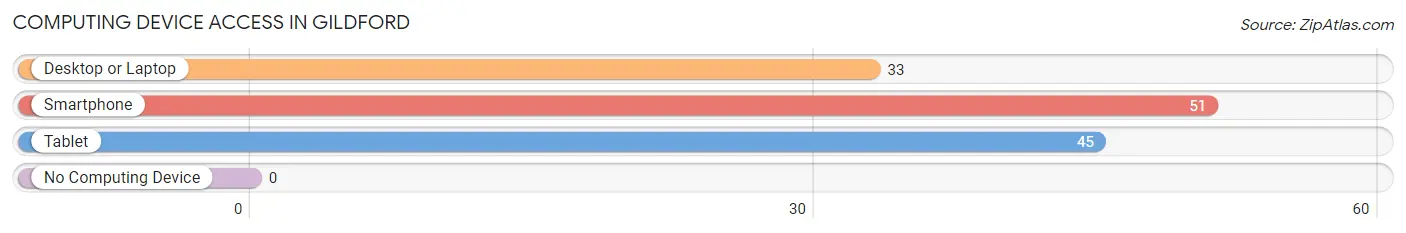
| Device Type | # Households | % Households |
| Desktop or Laptop | 33 | 58.9% |
| Smartphone | 51 | 91.1% |
| Tablet | 45 | 80.4% |
| No Computing Device | 0 | 0.0% |
| Total | 56 | 100.0% |
Internet Access in Gildford
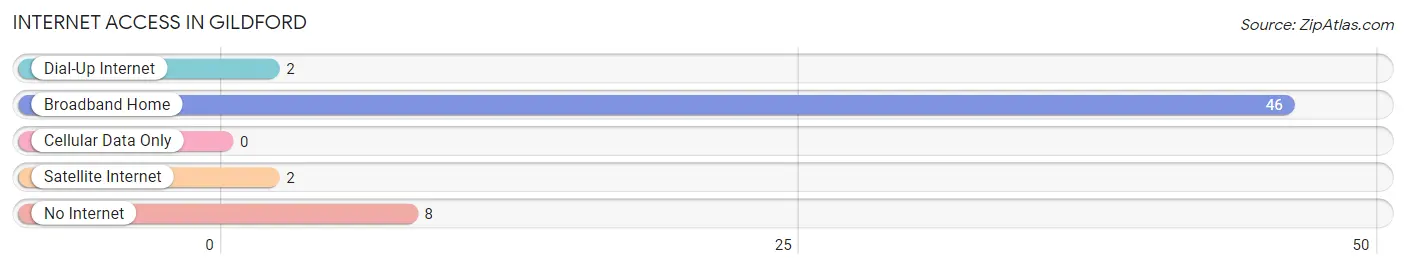
| Internet Type | # Households | % Households |
| Dial-Up Internet | 2 | 3.6% |
| Broadband Home | 46 | 82.1% |
| Cellular Data Only | 0 | 0.0% |
| Satellite Internet | 2 | 3.6% |
| No Internet | 8 | 14.3% |
| Total | 56 | 100.0% |
Gildford Summary
Gildford, Montana is a small town located in the north-central part of the state, about an hour and a half drive from the state capital of Helena. It is situated in the foothills of the Rocky Mountains, and is surrounded by rolling hills and lush forests. The town has a population of just over 1,000 people, and is known for its small-town charm and friendly atmosphere.
Gildford was founded in 1883 by a group of settlers from the Midwest. The town was named after a local Native American chief, and the settlers quickly began to build a thriving community. The town was built around a central square, and the streets were laid out in a grid pattern. The town quickly grew, and by the turn of the century, it had become a bustling center of commerce and industry.
The economy of Gildford is largely based on agriculture and tourism. The town is home to several farms, and the surrounding area is known for its production of wheat, barley, and other grains. The town is also home to several small businesses, including a grocery store, a hardware store, and a few restaurants. Tourism is also an important part of the local economy, as the town is located near several popular outdoor recreation areas, including the Bob Marshall Wilderness and the Lewis and Clark National Forest.
The demographics of Gildford are largely white, with a small percentage of Native Americans and African Americans. The median household income is around $40,000, and the median age is around 40 years old. The town is home to several churches, and the local school district serves the town and the surrounding area.
Gildford is a small town with a big heart. The town is known for its friendly atmosphere and its commitment to preserving its small-town charm. The town is home to several parks and recreational areas, and the local economy is largely based on agriculture and tourism. The town is also home to several churches, and the local school district serves the town and the surrounding area. Gildford is a great place to live, work, and raise a family.
Common Questions
What is Per Capita Income in Gildford?
Per Capita income in Gildford is $22,970.
What is the Median Family Income in Gildford?
Median Family Income in Gildford is $110,156.
What is Income or Wage Gap in Gildford?
Income or Wage Gap in Gildford is 15.2%.
Women in Gildford earn 84.8 cents for every dollar earned by a man.
What is Inequality or Gini Index in Gildford?
Inequality or Gini Index in Gildford is 0.29.
What is the Total Population of Gildford?
Total Population of Gildford is 166.
What is the Total Male Population of Gildford?
Total Male Population of Gildford is 92.
What is the Total Female Population of Gildford?
Total Female Population of Gildford is 74.
What is the Ratio of Males per 100 Females in Gildford?
There are 124.32 Males per 100 Females in Gildford.
What is the Ratio of Females per 100 Males in Gildford?
There are 80.43 Females per 100 Males in Gildford.
What is the Median Population Age in Gildford?
Median Population Age in Gildford is 41.1 Years.
What is the Average Family Size in Gildford
Average Family Size in Gildford is 4.1 People.
What is the Average Household Size in Gildford
Average Household Size in Gildford is 3.0 People.
How Large is the Labor Force in Gildford?
There are 59 People in the Labor Forcein in Gildford.
What is the Percentage of People in the Labor Force in Gildford?
54.6% of People are in the Labor Force in Gildford.