Superior, MT Map & Demographics
Superior Map
Superior Overview
$25,957
PER CAPITA INCOME
$62,917
AVG FAMILY INCOME
$42,632
AVG HOUSEHOLD INCOME
26.0%
WAGE / INCOME GAP [ % ]
74.0¢/ $1
WAGE / INCOME GAP [ $ ]
$2,300
FAMILY INCOME DEFICIT
0.36
INEQUALITY / GINI INDEX
872
TOTAL POPULATION
413
MALE POPULATION
459
FEMALE POPULATION
89.98
MALES / 100 FEMALES
111.14
FEMALES / 100 MALES
60.7
MEDIAN AGE
2.6
AVG FAMILY SIZE
2.0
AVG HOUSEHOLD SIZE
307
LABOR FORCE [ PEOPLE ]
41.3%
PERCENT IN LABOR FORCE
6.5%
UNEMPLOYMENT RATE
Superior Zip Codes
Superior Area Codes
Income in Superior
Income Overview in Superior
Per Capita Income in Superior is $25,957, while median incomes of families and households are $62,917 and $42,632 respectively.
| Characteristic | Number | Measure |
| Per Capita Income | 872 | $25,957 |
| Median Family Income | 249 | $62,917 |
| Mean Family Income | 249 | $67,782 |
| Median Household Income | 420 | $42,632 |
| Mean Household Income | 420 | $54,484 |
| Income Deficit | 249 | $2,300 |
| Wage / Income Gap (%) | 872 | 25.98% |
| Wage / Income Gap ($) | 872 | 74.02¢ per $1 |
| Gini / Inequality Index | 872 | 0.36 |
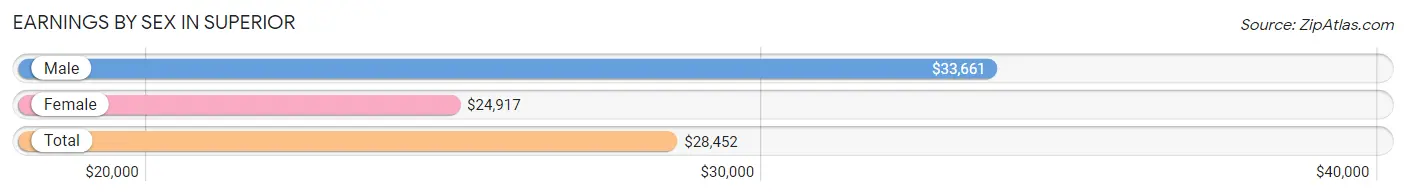
Earnings by Sex in Superior
Average Earnings in Superior are $28,452, $33,661 for men and $24,917 for women, a difference of 26.0%.
| Sex | Number | Average Earnings |
| Male | 163 (50.9%) | $33,661 |
| Female | 157 (49.1%) | $24,917 |
| Total | 320 (100.0%) | $28,452 |
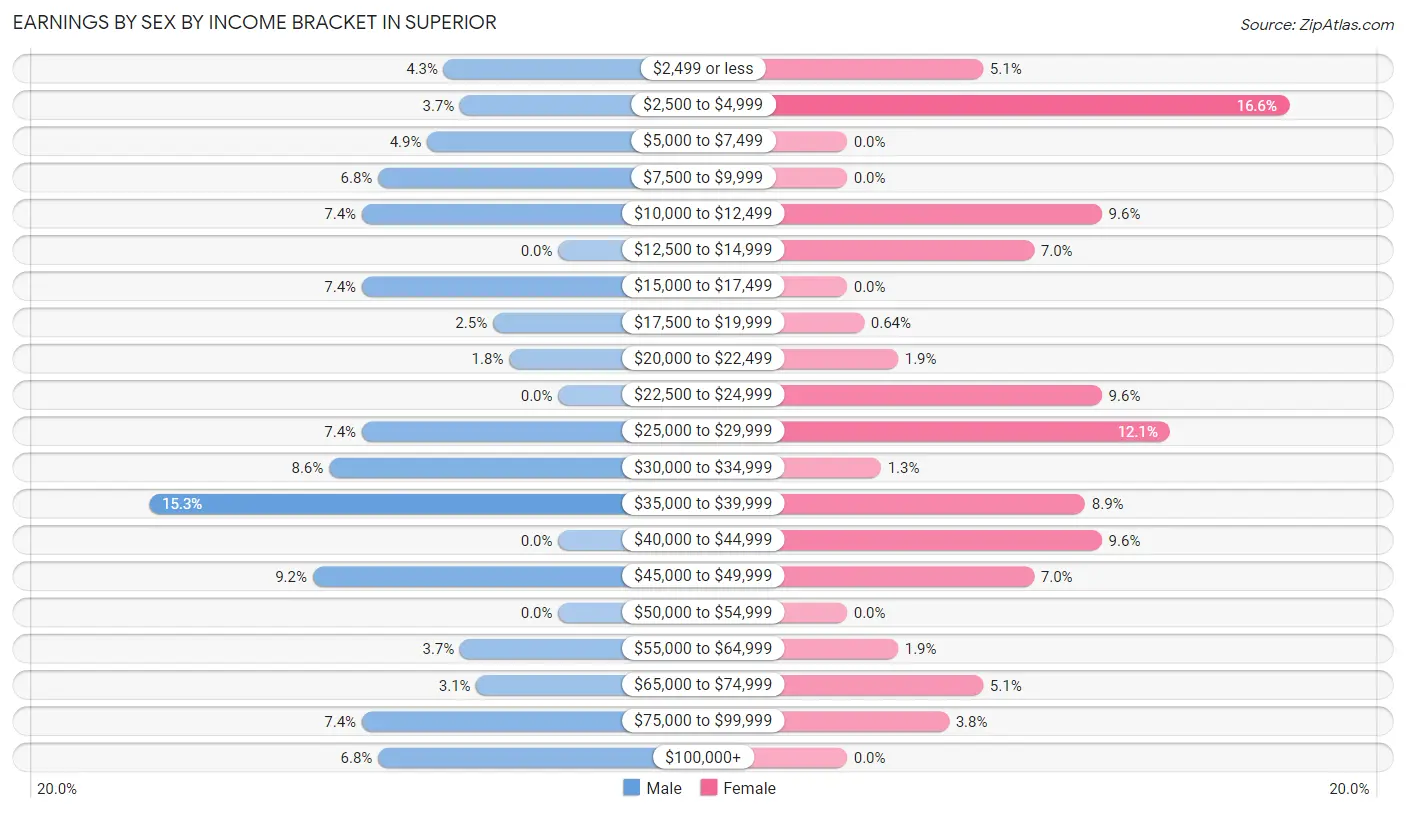
Earnings by Sex by Income Bracket in Superior
The most common earnings brackets in Superior are $35,000 to $39,999 for men (25 | 15.3%) and $2,500 to $4,999 for women (26 | 16.6%).
| Income | Male | Female |
| $2,499 or less | 7 (4.3%) | 8 (5.1%) |
| $2,500 to $4,999 | 6 (3.7%) | 26 (16.6%) |
| $5,000 to $7,499 | 8 (4.9%) | 0 (0.0%) |
| $7,500 to $9,999 | 11 (6.8%) | 0 (0.0%) |
| $10,000 to $12,499 | 12 (7.4%) | 15 (9.6%) |
| $12,500 to $14,999 | 0 (0.0%) | 11 (7.0%) |
| $15,000 to $17,499 | 12 (7.4%) | 0 (0.0%) |
| $17,500 to $19,999 | 4 (2.5%) | 1 (0.6%) |
| $20,000 to $22,499 | 3 (1.8%) | 3 (1.9%) |
| $22,500 to $24,999 | 0 (0.0%) | 15 (9.6%) |
| $25,000 to $29,999 | 12 (7.4%) | 19 (12.1%) |
| $30,000 to $34,999 | 14 (8.6%) | 2 (1.3%) |
| $35,000 to $39,999 | 25 (15.3%) | 14 (8.9%) |
| $40,000 to $44,999 | 0 (0.0%) | 15 (9.6%) |
| $45,000 to $49,999 | 15 (9.2%) | 11 (7.0%) |
| $50,000 to $54,999 | 0 (0.0%) | 0 (0.0%) |
| $55,000 to $64,999 | 6 (3.7%) | 3 (1.9%) |
| $65,000 to $74,999 | 5 (3.1%) | 8 (5.1%) |
| $75,000 to $99,999 | 12 (7.4%) | 6 (3.8%) |
| $100,000+ | 11 (6.8%) | 0 (0.0%) |
| Total | 163 (100.0%) | 157 (100.0%) |
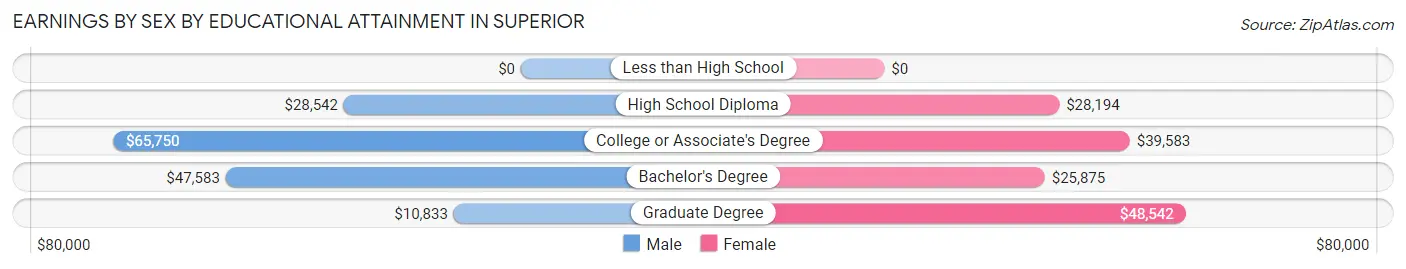
Earnings by Sex by Educational Attainment in Superior
Average earnings in Superior are $34,196 for men and $28,889 for women, a difference of 15.5%. Men with an educational attainment of college or associate's degree enjoy the highest average annual earnings of $65,750, while those with graduate degree education earn the least with $10,833. Women with an educational attainment of graduate degree earn the most with the average annual earnings of $48,542, while those with bachelor's degree education have the smallest earnings of $25,875.
| Educational Attainment | Male Income | Female Income |
| Less than High School | - | - |
| High School Diploma | $28,542 | $28,194 |
| College or Associate's Degree | $65,750 | $39,583 |
| Bachelor's Degree | $47,583 | $25,875 |
| Graduate Degree | $10,833 | $48,542 |
| Total | $34,196 | $28,889 |
Family Income in Superior
Family Income Brackets in Superior
According to the Superior family income data, there are 75 families falling into the $35,000 to $49,999 income range, which is the most common income bracket and makes up 30.1% of all families.
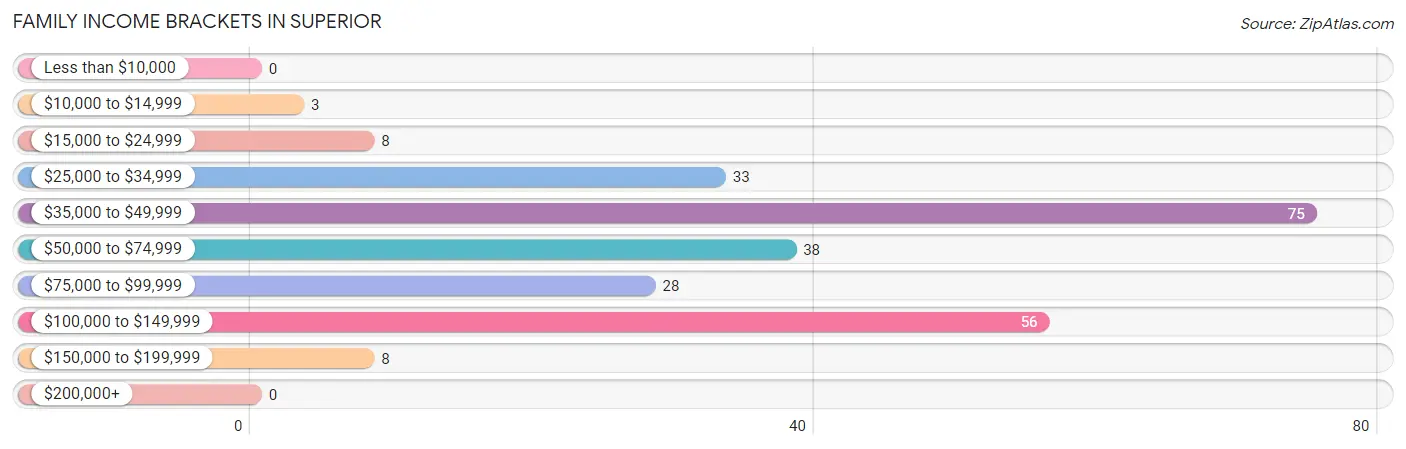
| Income Bracket | # Families | % Families |
| Less than $10,000 | 0 | 0.0% |
| $10,000 to $14,999 | 3 | 1.2% |
| $15,000 to $24,999 | 8 | 3.2% |
| $25,000 to $34,999 | 33 | 13.3% |
| $35,000 to $49,999 | 75 | 30.1% |
| $50,000 to $74,999 | 38 | 15.3% |
| $75,000 to $99,999 | 28 | 11.2% |
| $100,000 to $149,999 | 56 | 22.5% |
| $150,000 to $199,999 | 8 | 3.2% |
| $200,000+ | 0 | 0.0% |
Family Income by Famaliy Size in Superior
3-person families (50 | 20.1%) account for the highest median family income in Superior with $62,500 per family, while 2-person families (155 | 62.3%) have the highest median income of $24,297 per family member.
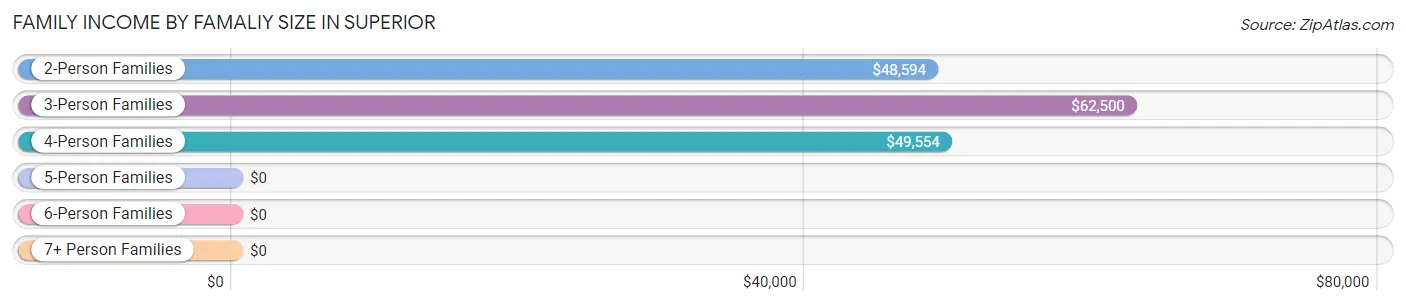
| Income Bracket | # Families | Median Income |
| 2-Person Families | 155 (62.3%) | $48,594 |
| 3-Person Families | 50 (20.1%) | $62,500 |
| 4-Person Families | 27 (10.8%) | $49,554 |
| 5-Person Families | 2 (0.8%) | $0 |
| 6-Person Families | 7 (2.8%) | $0 |
| 7+ Person Families | 8 (3.2%) | $0 |
| Total | 249 (100.0%) | $62,917 |
Family Income by Number of Earners in Superior
The median family income in Superior is $62,917, with families comprising 2 earners (80) having the highest median family income of $101,000, while families with no earners (100) have the lowest median family income of $40,536, accounting for 32.1% and 40.2% of families, respectively.
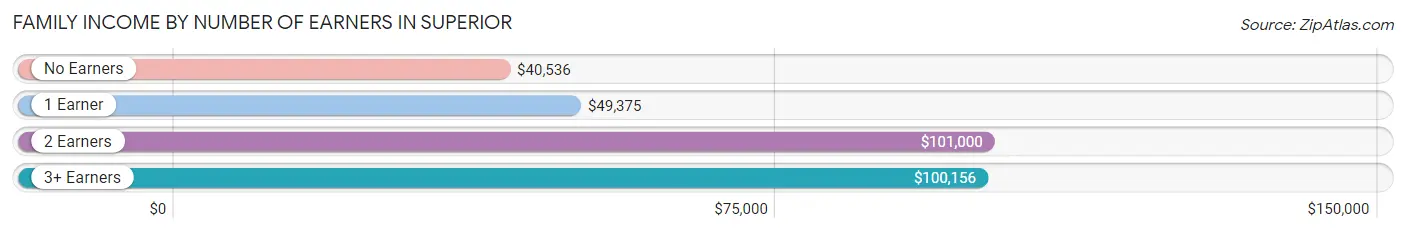
| Number of Earners | # Families | Median Income |
| No Earners | 100 (40.2%) | $40,536 |
| 1 Earner | 50 (20.1%) | $49,375 |
| 2 Earners | 80 (32.1%) | $101,000 |
| 3+ Earners | 19 (7.6%) | $100,156 |
| Total | 249 (100.0%) | $62,917 |
Household Income in Superior
Household Income Brackets in Superior
With 117 households falling in the category, the $35,000 to $49,999 income range is the most frequent in Superior, accounting for 27.9% of all households. In contrast, only 2 households (0.5%) fall into the $200,000+ income bracket, making it the least populous group.
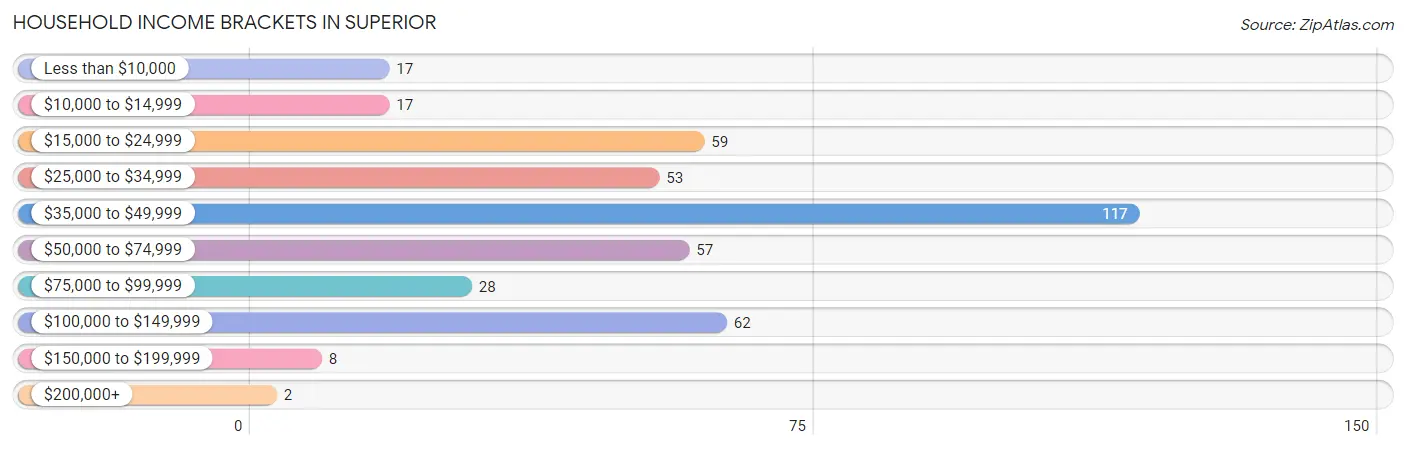
| Income Bracket | # Households | % Households |
| Less than $10,000 | 17 | 4.0% |
| $10,000 to $14,999 | 17 | 4.0% |
| $15,000 to $24,999 | 59 | 14.0% |
| $25,000 to $34,999 | 53 | 12.6% |
| $35,000 to $49,999 | 117 | 27.9% |
| $50,000 to $74,999 | 57 | 13.6% |
| $75,000 to $99,999 | 28 | 6.7% |
| $100,000 to $149,999 | 62 | 14.8% |
| $150,000 to $199,999 | 8 | 1.9% |
| $200,000+ | 2 | 0.5% |
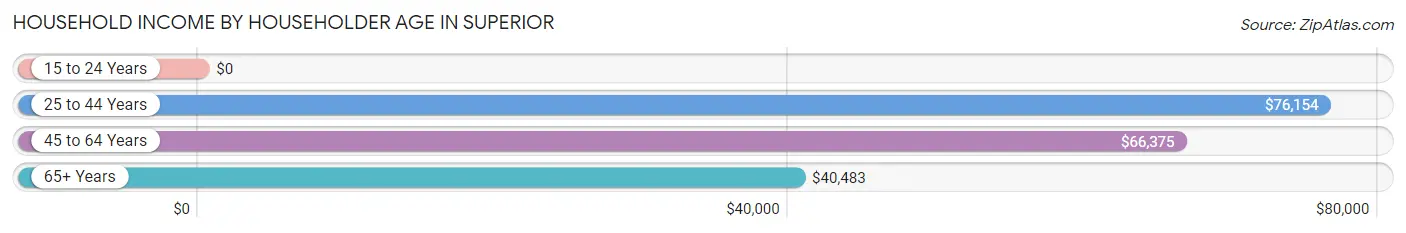
Household Income by Householder Age in Superior
The median household income in Superior is $42,632, with the highest median household income of $76,154 found in the 25 to 44 years age bracket for the primary householder. A total of 80 households (19.1%) fall into this category.
| Income Bracket | # Households | Median Income |
| 15 to 24 Years | 0 (0.0%) | $0 |
| 25 to 44 Years | 80 (19.1%) | $76,154 |
| 45 to 64 Years | 85 (20.2%) | $66,375 |
| 65+ Years | 255 (60.7%) | $40,483 |
| Total | 420 (100.0%) | $42,632 |
Poverty in Superior
Income Below Poverty by Sex and Age in Superior
With 4.4% poverty level for males and 13.1% for females among the residents of Superior, 25 to 34 year old males and 5 year old females are the most vulnerable to poverty, with 12 males (60.0%) and 2 females (100.0%) in their respective age groups living below the poverty level.
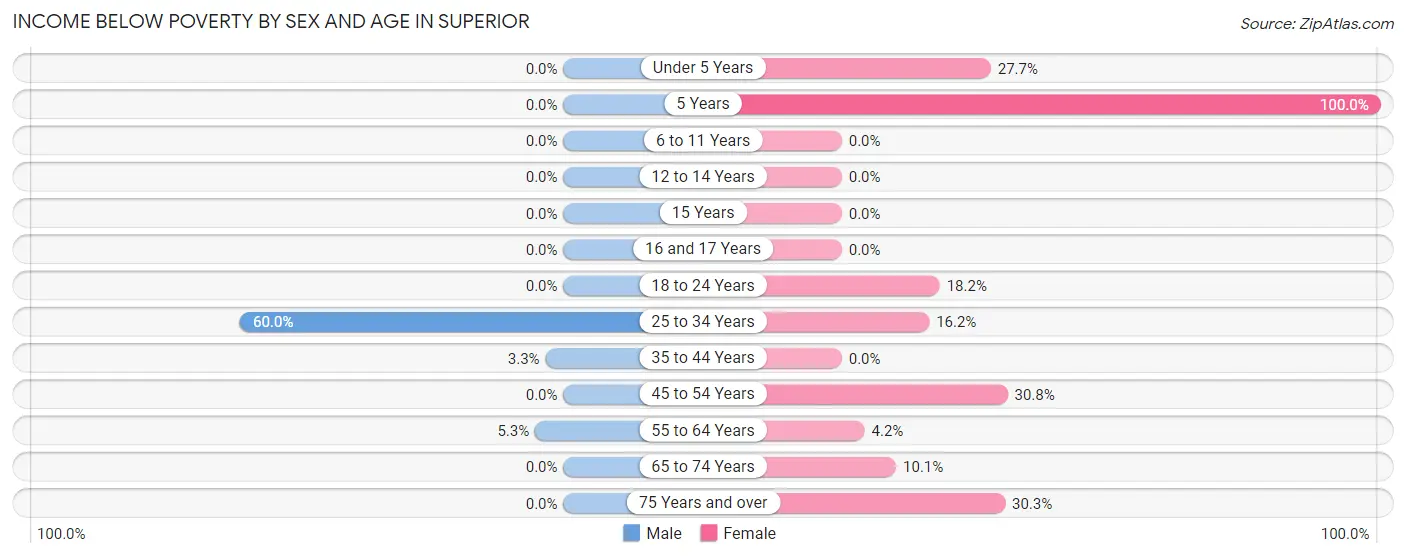
| Age Bracket | Male | Female |
| Under 5 Years | 0 (0.0%) | 13 (27.7%) |
| 5 Years | 0 (0.0%) | 2 (100.0%) |
| 6 to 11 Years | 0 (0.0%) | 0 (0.0%) |
| 12 to 14 Years | 0 (0.0%) | 0 (0.0%) |
| 15 Years | 0 (0.0%) | 0 (0.0%) |
| 16 and 17 Years | 0 (0.0%) | 0 (0.0%) |
| 18 to 24 Years | 0 (0.0%) | 4 (18.2%) |
| 25 to 34 Years | 12 (60.0%) | 6 (16.2%) |
| 35 to 44 Years | 1 (3.3%) | 0 (0.0%) |
| 45 to 54 Years | 0 (0.0%) | 8 (30.8%) |
| 55 to 64 Years | 4 (5.3%) | 3 (4.2%) |
| 65 to 74 Years | 0 (0.0%) | 12 (10.1%) |
| 75 Years and over | 0 (0.0%) | 10 (30.3%) |
| Total | 17 (4.4%) | 58 (13.1%) |
Income Above Poverty by Sex and Age in Superior
According to the poverty statistics in Superior, males aged under 5 years and females aged 6 to 11 years are the age groups that are most secure financially, with 100.0% of males and 100.0% of females in these age groups living above the poverty line.
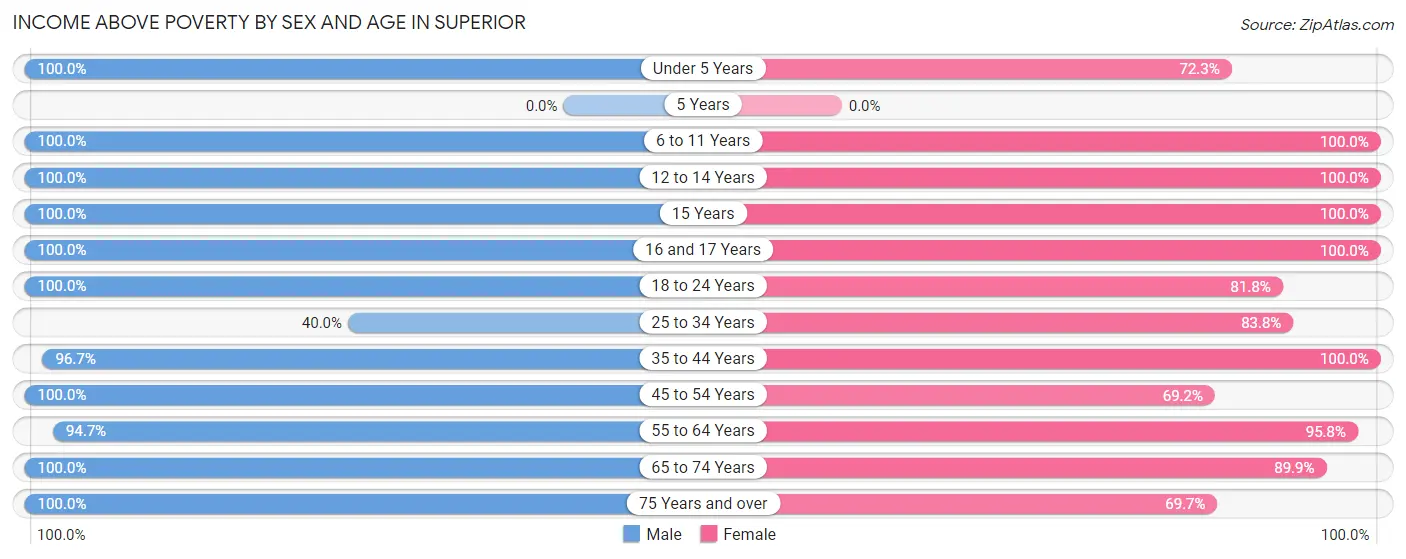
| Age Bracket | Male | Female |
| Under 5 Years | 7 (100.0%) | 34 (72.3%) |
| 5 Years | 0 (0.0%) | 0 (0.0%) |
| 6 to 11 Years | 5 (100.0%) | 21 (100.0%) |
| 12 to 14 Years | 22 (100.0%) | 14 (100.0%) |
| 15 Years | 6 (100.0%) | 2 (100.0%) |
| 16 and 17 Years | 1 (100.0%) | 13 (100.0%) |
| 18 to 24 Years | 19 (100.0%) | 18 (81.8%) |
| 25 to 34 Years | 8 (40.0%) | 31 (83.8%) |
| 35 to 44 Years | 29 (96.7%) | 36 (100.0%) |
| 45 to 54 Years | 24 (100.0%) | 18 (69.2%) |
| 55 to 64 Years | 72 (94.7%) | 68 (95.8%) |
| 65 to 74 Years | 100 (100.0%) | 107 (89.9%) |
| 75 Years and over | 80 (100.0%) | 23 (69.7%) |
| Total | 373 (95.6%) | 385 (86.9%) |
Income Below Poverty Among Married-Couple Families in Superior
The poverty statistics for married-couple families in Superior show that 6.0% or 13 of the total 216 families live below the poverty line. Families with 1 or 2 children have the highest poverty rate of 22.2%, comprising of 10 families. On the other hand, families with 3 or 4 children have the lowest poverty rate of 0.0%, which includes 0 families.
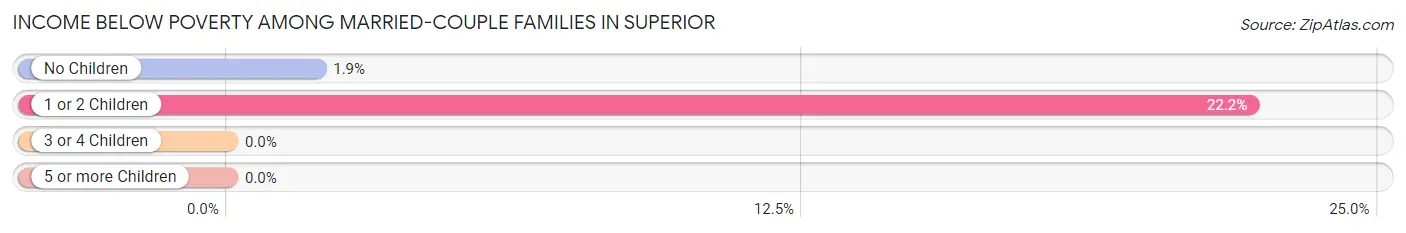
| Children | Above Poverty | Below Poverty |
| No Children | 153 (98.1%) | 3 (1.9%) |
| 1 or 2 Children | 35 (77.8%) | 10 (22.2%) |
| 3 or 4 Children | 15 (100.0%) | 0 (0.0%) |
| 5 or more Children | 0 (0.0%) | 0 (0.0%) |
| Total | 203 (94.0%) | 13 (6.0%) |
Income Below Poverty Among Single-Parent Households in Superior
| Children | Single Father | Single Mother |
| No Children | 0 (0.0%) | 0 (0.0%) |
| 1 or 2 Children | 0 (0.0%) | 0 (0.0%) |
| 3 or 4 Children | 0 (0.0%) | 0 (0.0%) |
| 5 or more Children | 0 (0.0%) | 0 (0.0%) |
| Total | 0 (0.0%) | 0 (0.0%) |
Income Below Poverty Among Married-Couple vs Single-Parent Households in Superior
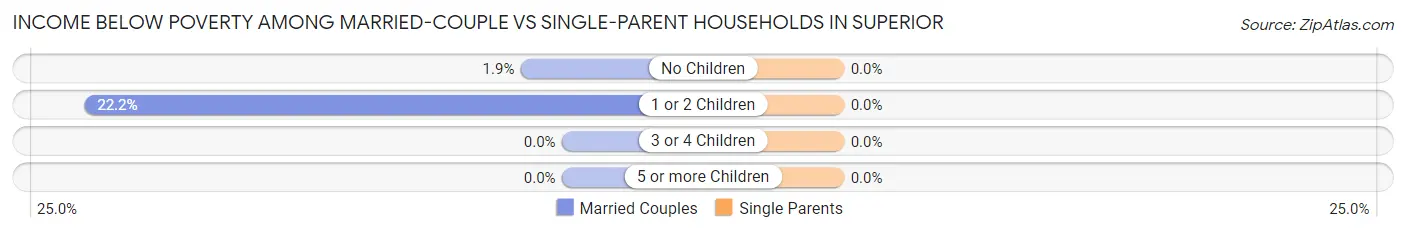
| Children | Married-Couple Families | Single-Parent Households |
| No Children | 3 (1.9%) | 0 (0.0%) |
| 1 or 2 Children | 10 (22.2%) | 0 (0.0%) |
| 3 or 4 Children | 0 (0.0%) | 0 (0.0%) |
| 5 or more Children | 0 (0.0%) | 0 (0.0%) |
| Total | 13 (6.0%) | 0 (0.0%) |
Race in Superior
The most populous races in Superior are White / Caucasian (809 | 92.8%), Two or more Races (60 | 6.9%), and Hispanic or Latino (11 | 1.3%).
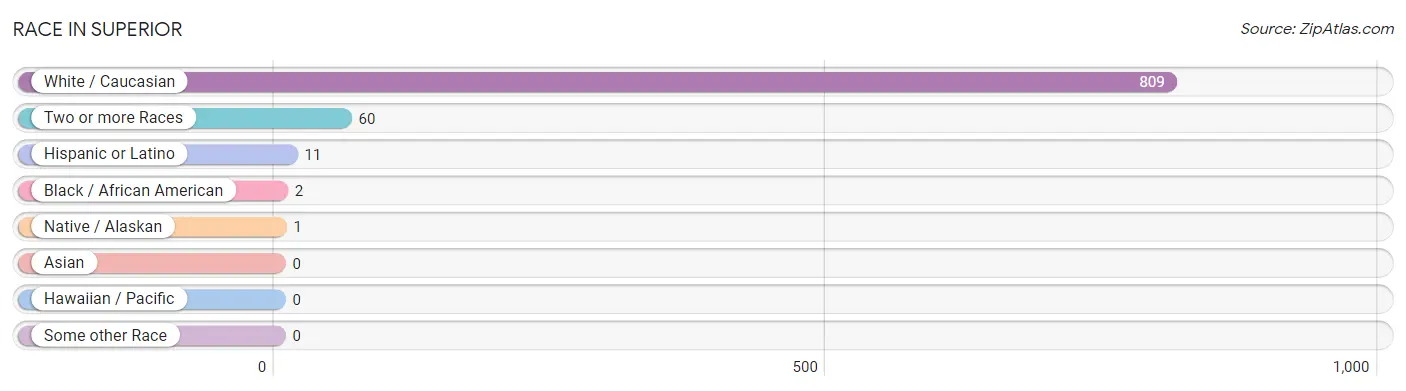
| Race | # Population | % Population |
| Asian | 0 | 0.0% |
| Black / African American | 2 | 0.2% |
| Hawaiian / Pacific | 0 | 0.0% |
| Hispanic or Latino | 11 | 1.3% |
| Native / Alaskan | 1 | 0.1% |
| White / Caucasian | 809 | 92.8% |
| Two or more Races | 60 | 6.9% |
| Some other Race | 0 | 0.0% |
| Total | 872 | 100.0% |
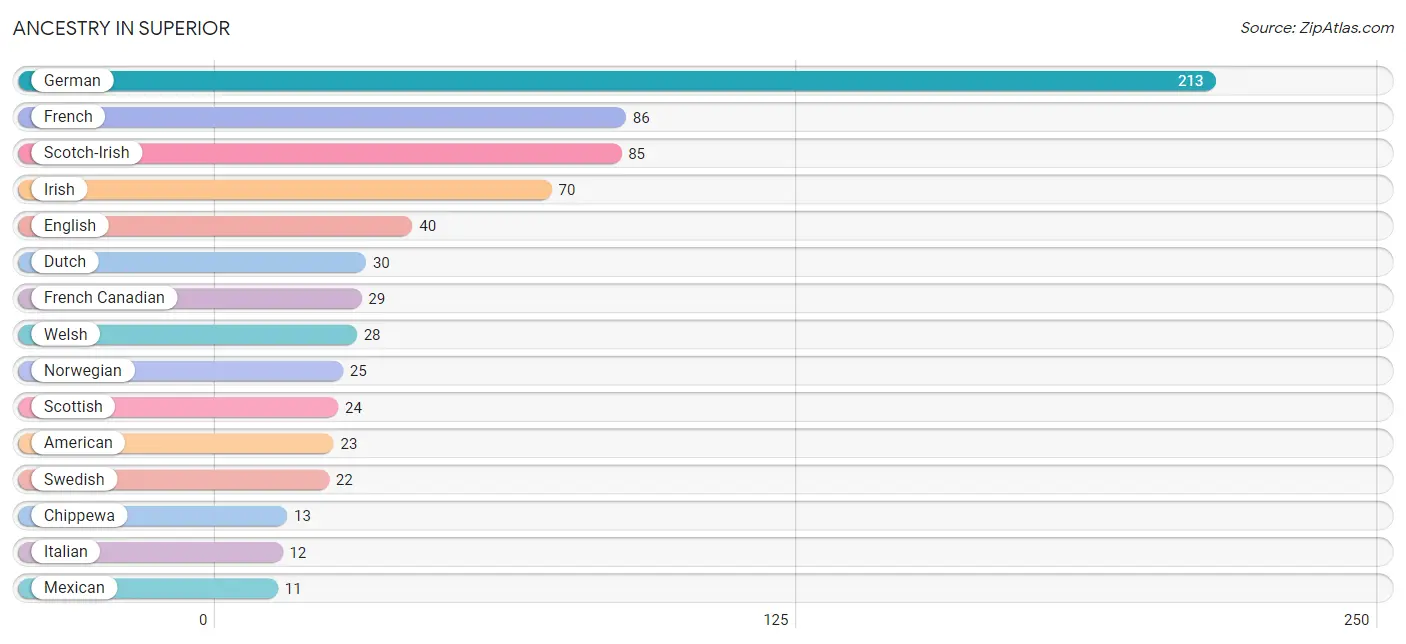
Ancestry in Superior
The most populous ancestries reported in Superior are German (213 | 24.4%), French (86 | 9.9%), Scotch-Irish (85 | 9.8%), Irish (70 | 8.0%), and English (40 | 4.6%), together accounting for 56.7% of all Superior residents.
| Ancestry | # Population | % Population |
| American | 23 | 2.6% |
| Brazilian | 9 | 1.0% |
| Canadian | 8 | 0.9% |
| Chippewa | 13 | 1.5% |
| Dutch | 30 | 3.4% |
| Eastern European | 4 | 0.5% |
| English | 40 | 4.6% |
| European | 6 | 0.7% |
| Finnish | 8 | 0.9% |
| French | 86 | 9.9% |
| French Canadian | 29 | 3.3% |
| German | 213 | 24.4% |
| Greek | 1 | 0.1% |
| Irish | 70 | 8.0% |
| Italian | 12 | 1.4% |
| Mexican | 11 | 1.3% |
| Native Hawaiian | 10 | 1.1% |
| Northern European | 3 | 0.3% |
| Norwegian | 25 | 2.9% |
| Romanian | 1 | 0.1% |
| Russian | 1 | 0.1% |
| Scandinavian | 7 | 0.8% |
| Scotch-Irish | 85 | 9.8% |
| Scottish | 24 | 2.8% |
| Swedish | 22 | 2.5% |
| Welsh | 28 | 3.2% | View All 26 Rows |
Immigrants in Superior
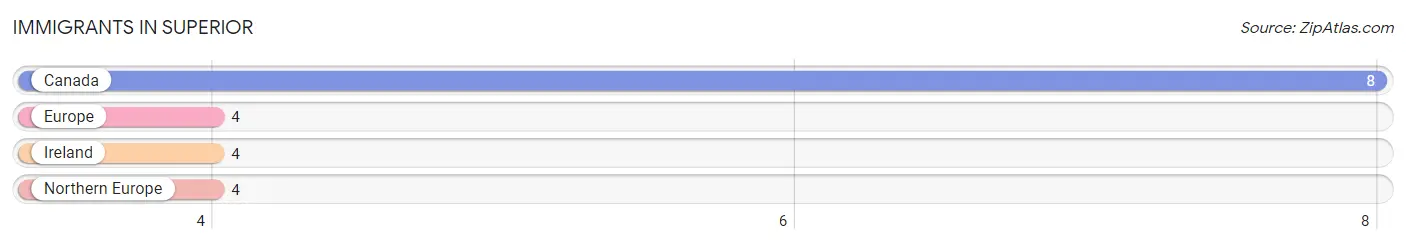
The most numerous immigrant groups reported in Superior came from Canada (8 | 0.9%), Europe (4 | 0.5%), Ireland (4 | 0.5%), and Northern Europe (4 | 0.5%), together accounting for 2.3% of all Superior residents.
| Immigration Origin | # Population | % Population |
| Canada | 8 | 0.9% |
| Europe | 4 | 0.5% |
| Ireland | 4 | 0.5% |
| Northern Europe | 4 | 0.5% | View All 4 Rows |
Sex and Age in Superior
Sex and Age in Superior
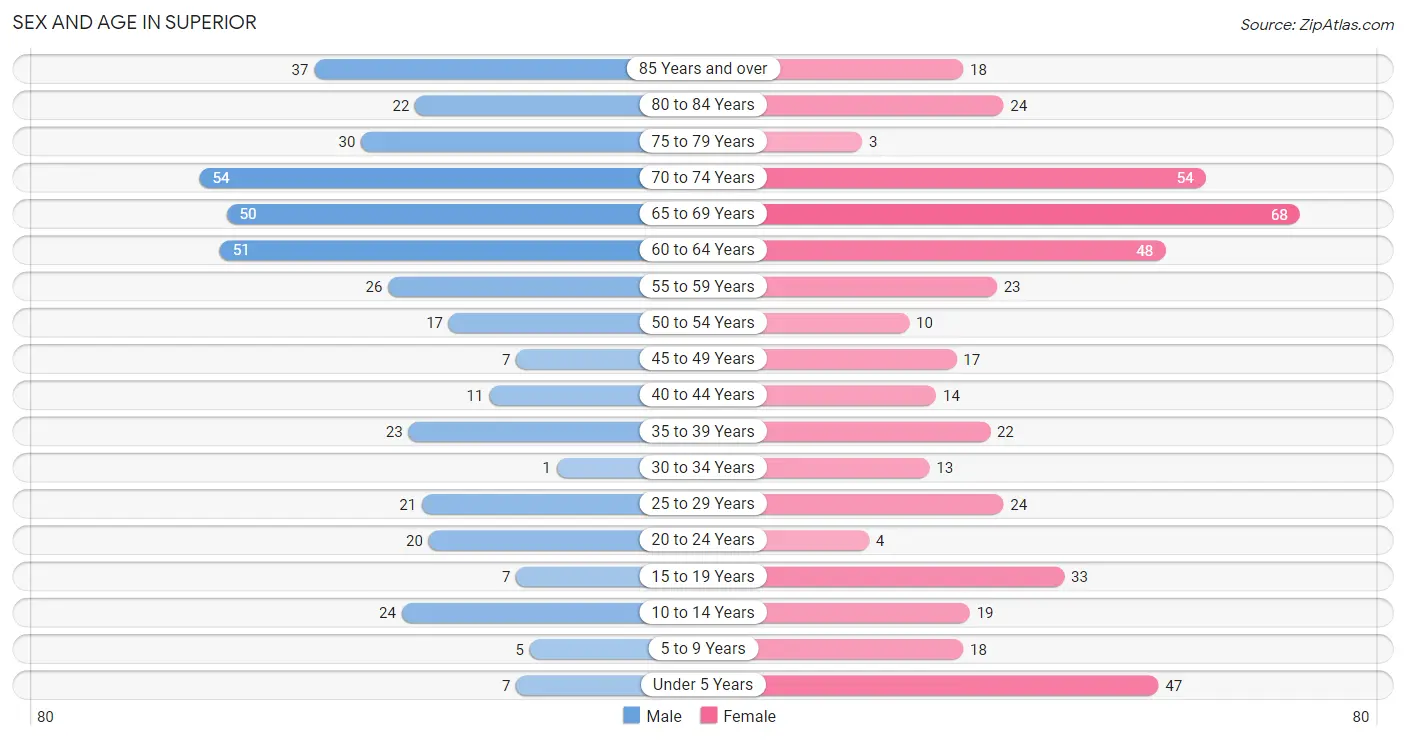
The most populous age groups in Superior are 70 to 74 Years (54 | 13.1%) for men and 65 to 69 Years (68 | 14.8%) for women.
| Age Bracket | Male | Female |
| Under 5 Years | 7 (1.7%) | 47 (10.2%) |
| 5 to 9 Years | 5 (1.2%) | 18 (3.9%) |
| 10 to 14 Years | 24 (5.8%) | 19 (4.1%) |
| 15 to 19 Years | 7 (1.7%) | 33 (7.2%) |
| 20 to 24 Years | 20 (4.8%) | 4 (0.9%) |
| 25 to 29 Years | 21 (5.1%) | 24 (5.2%) |
| 30 to 34 Years | 1 (0.2%) | 13 (2.8%) |
| 35 to 39 Years | 23 (5.6%) | 22 (4.8%) |
| 40 to 44 Years | 11 (2.7%) | 14 (3.0%) |
| 45 to 49 Years | 7 (1.7%) | 17 (3.7%) |
| 50 to 54 Years | 17 (4.1%) | 10 (2.2%) |
| 55 to 59 Years | 26 (6.3%) | 23 (5.0%) |
| 60 to 64 Years | 51 (12.3%) | 48 (10.5%) |
| 65 to 69 Years | 50 (12.1%) | 68 (14.8%) |
| 70 to 74 Years | 54 (13.1%) | 54 (11.8%) |
| 75 to 79 Years | 30 (7.3%) | 3 (0.6%) |
| 80 to 84 Years | 22 (5.3%) | 24 (5.2%) |
| 85 Years and over | 37 (9.0%) | 18 (3.9%) |
| Total | 413 (100.0%) | 459 (100.0%) |
Families and Households in Superior
Median Family Size in Superior
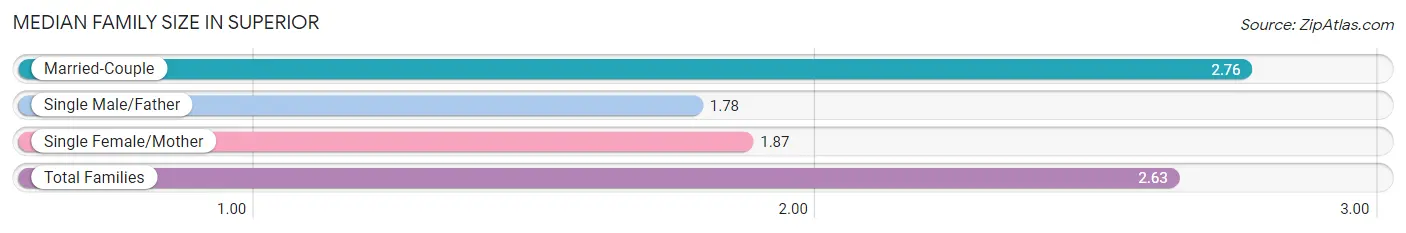
The median family size in Superior is 2.63 persons per family, with married-couple families (216 | 86.8%) accounting for the largest median family size of 2.76 persons per family. On the other hand, single male/father families (18 | 7.2%) represent the smallest median family size with 1.78 persons per family.
| Family Type | # Families | Family Size |
| Married-Couple | 216 (86.8%) | 2.76 |
| Single Male/Father | 18 (7.2%) | 1.78 |
| Single Female/Mother | 15 (6.0%) | 1.87 |
| Total Families | 249 (100.0%) | 2.63 |
Median Household Size in Superior
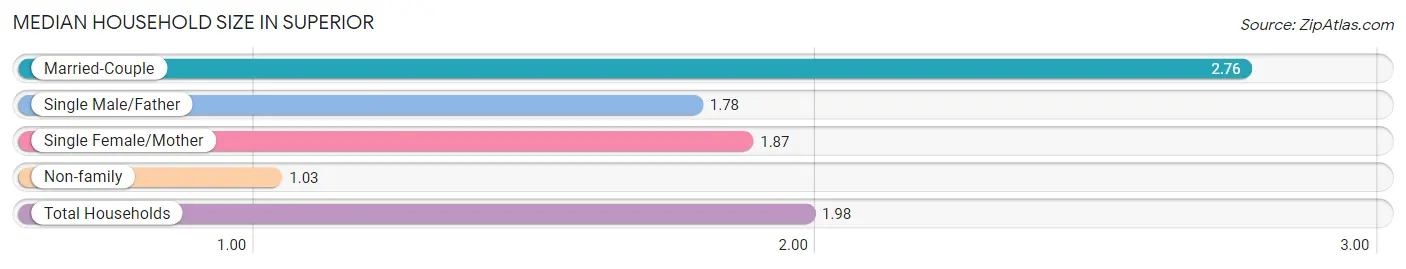
The median household size in Superior is 1.98 persons per household, with married-couple households (216 | 51.4%) accounting for the largest median household size of 2.76 persons per household. non-family households (171 | 40.7%) represent the smallest median household size with 1.03 persons per household.
| Household Type | # Households | Household Size |
| Married-Couple | 216 (51.4%) | 2.76 |
| Single Male/Father | 18 (4.3%) | 1.78 |
| Single Female/Mother | 15 (3.6%) | 1.87 |
| Non-family | 171 (40.7%) | 1.03 |
| Total Households | 420 (100.0%) | 1.98 |
Household Size by Marriage Status in Superior
Out of a total of 420 households in Superior, 249 (59.3%) are family households, while 171 (40.7%) are nonfamily households. The most numerous type of family households are 2-person households, comprising 155, and the most common type of nonfamily households are 1-person households, comprising 167.
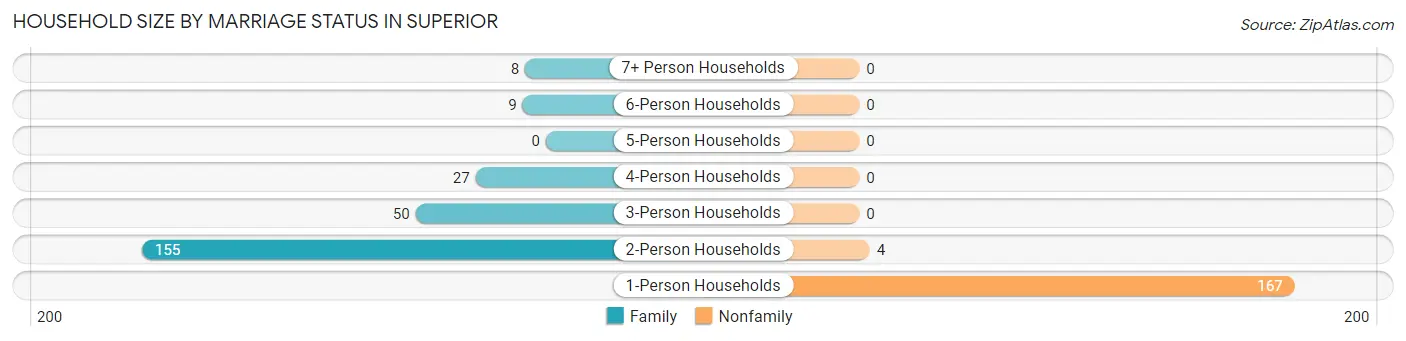
| Household Size | Family Households | Nonfamily Households |
| 1-Person Households | - | 167 (39.8%) |
| 2-Person Households | 155 (36.9%) | 4 (0.9%) |
| 3-Person Households | 50 (11.9%) | 0 (0.0%) |
| 4-Person Households | 27 (6.4%) | 0 (0.0%) |
| 5-Person Households | 0 (0.0%) | 0 (0.0%) |
| 6-Person Households | 9 (2.1%) | 0 (0.0%) |
| 7+ Person Households | 8 (1.9%) | 0 (0.0%) |
| Total | 249 (59.3%) | 171 (40.7%) |
Female Fertility in Superior
Fertility by Age in Superior
Average fertility rate in Superior is 23.0 births per 1,000 women. Women in the age bracket of 35 to 50 years have the highest fertility rate with 53.0 births per 1,000 women. Women in the age bracket of 35 to 50 years acount for 100.0% of all women with births.
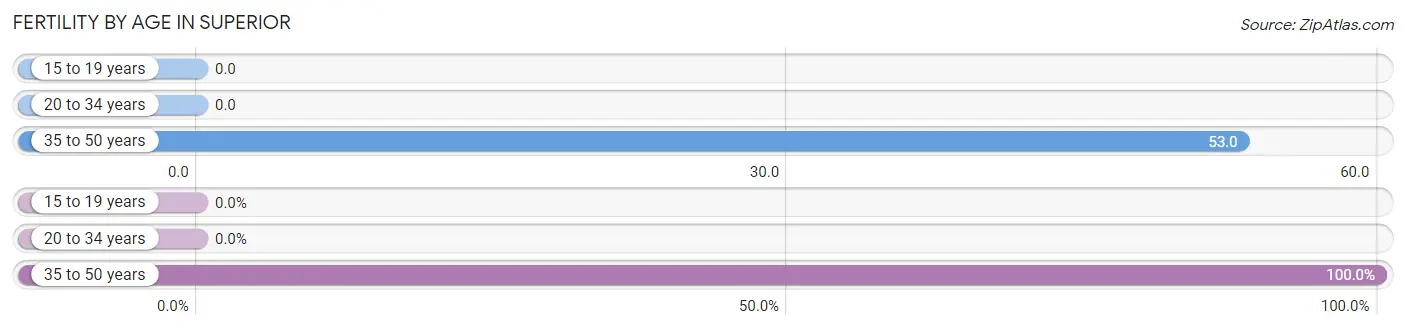
| Age Bracket | Women with Births | Births / 1,000 Women |
| 15 to 19 years | 0 (0.0%) | 0.0 |
| 20 to 34 years | 0 (0.0%) | 0.0 |
| 35 to 50 years | 3 (100.0%) | 53.0 |
| Total | 3 (100.0%) | 23.0 |
Fertility by Age by Marriage Status in Superior
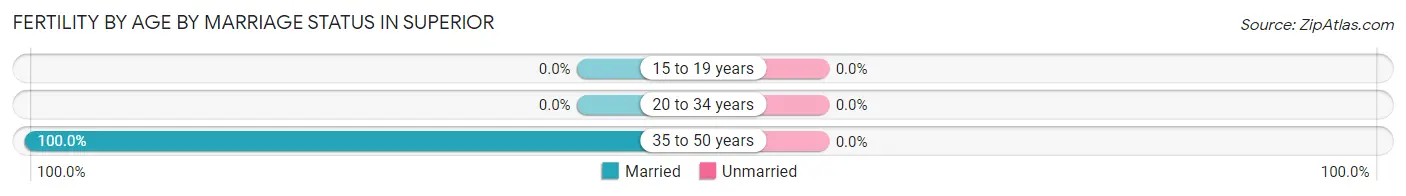
| Age Bracket | Married | Unmarried |
| 15 to 19 years | 0 (0.0%) | 0 (0.0%) |
| 20 to 34 years | 0 (0.0%) | 0 (0.0%) |
| 35 to 50 years | 3 (100.0%) | 0 (0.0%) |
| Total | 3 (100.0%) | 0 (0.0%) |
Fertility by Education in Superior
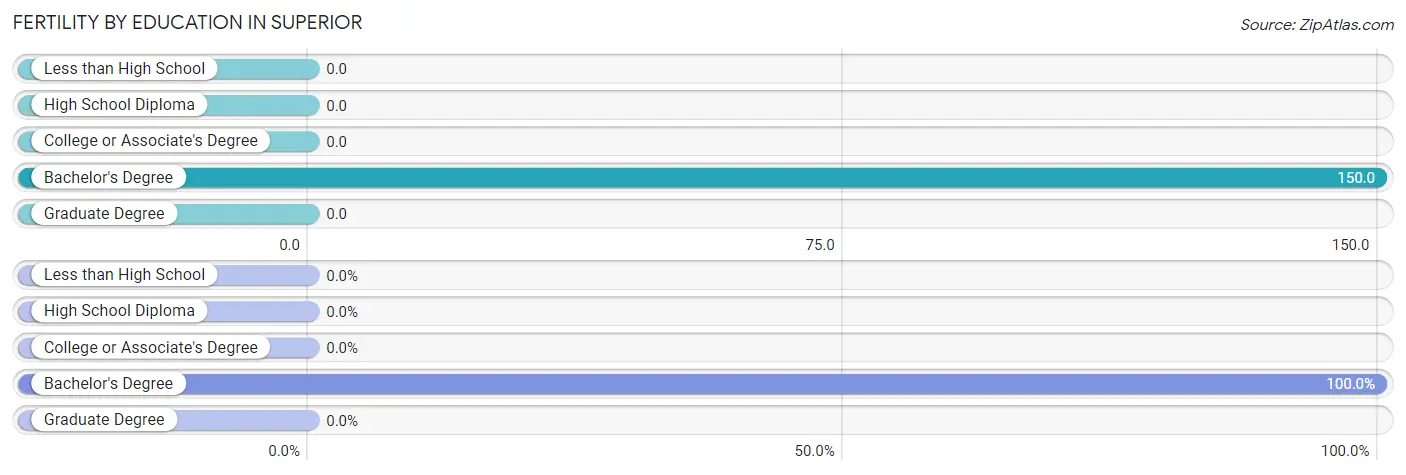
| Educational Attainment | Women with Births | Births / 1,000 Women |
| Less than High School | 0 (0.0%) | 0.0 |
| High School Diploma | 0 (0.0%) | 0.0 |
| College or Associate's Degree | 0 (0.0%) | 0.0 |
| Bachelor's Degree | 3 (100.0%) | 150.0 |
| Graduate Degree | 0 (0.0%) | 0.0 |
| Total | 3 (100.0%) | 23.0 |
Fertility by Education by Marriage Status in Superior
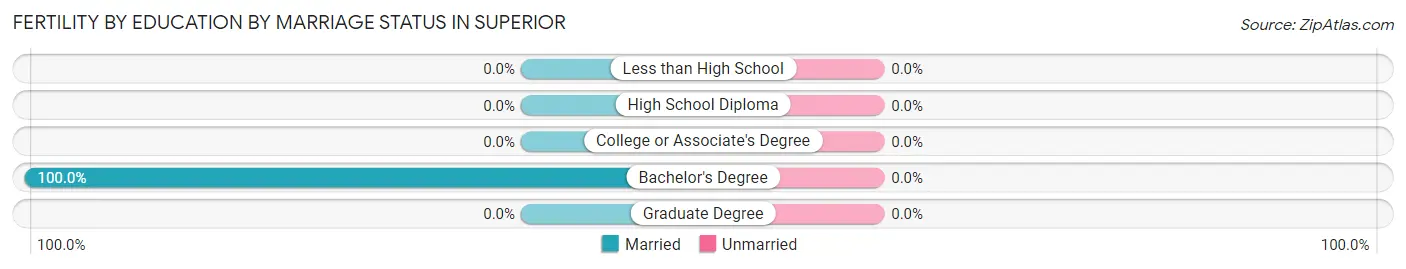
| Educational Attainment | Married | Unmarried |
| Less than High School | 0 (0.0%) | 0 (0.0%) |
| High School Diploma | 0 (0.0%) | 0 (0.0%) |
| College or Associate's Degree | 0 (0.0%) | 0 (0.0%) |
| Bachelor's Degree | 3 (100.0%) | 0 (0.0%) |
| Graduate Degree | 0 (0.0%) | 0 (0.0%) |
| Total | 3 (100.0%) | 0 (0.0%) |
Employment Characteristics in Superior
Employment by Class of Employer in Superior
Among the 287 employed individuals in Superior, private company employees (165 | 57.5%), local government employees (37 | 12.9%), and self-employed (not incorporated) (33 | 11.5%) make up the most common classes of employment.
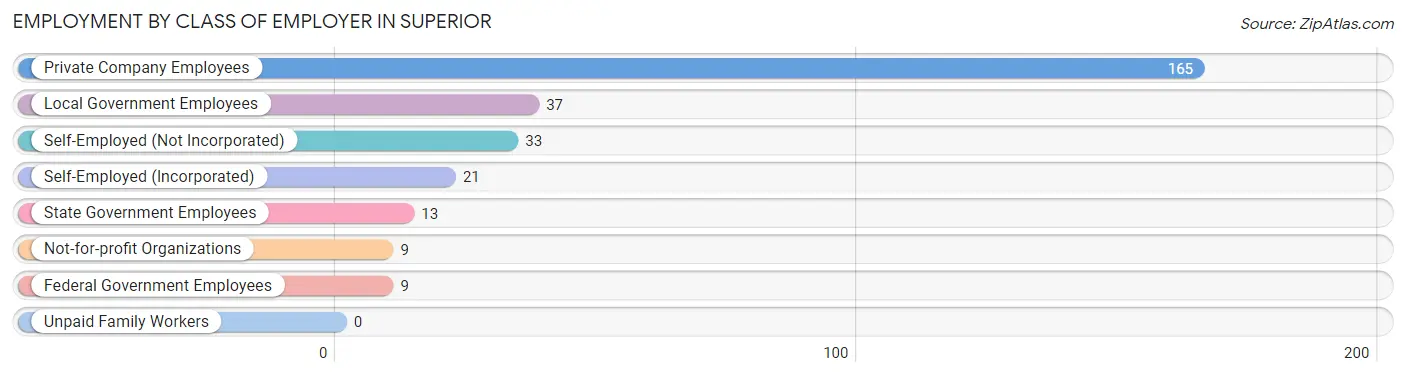
| Employer Class | # Employees | % Employees |
| Private Company Employees | 165 | 57.5% |
| Self-Employed (Incorporated) | 21 | 7.3% |
| Self-Employed (Not Incorporated) | 33 | 11.5% |
| Not-for-profit Organizations | 9 | 3.1% |
| Local Government Employees | 37 | 12.9% |
| State Government Employees | 13 | 4.5% |
| Federal Government Employees | 9 | 3.1% |
| Unpaid Family Workers | 0 | 0.0% |
| Total | 287 | 100.0% |
Employment Status by Age in Superior
According to the labor force statistics for Superior, out of the total population over 16 years of age (744), 41.3% or 307 individuals are in the labor force, with 6.5% or 20 of them unemployed. The age group with the highest labor force participation rate is 35 to 44 years, with 90.0% or 63 individuals in the labor force. Within the labor force, the 20 to 24 years age range has the highest percentage of unemployed individuals, with 100.0% or 19 of them being unemployed.
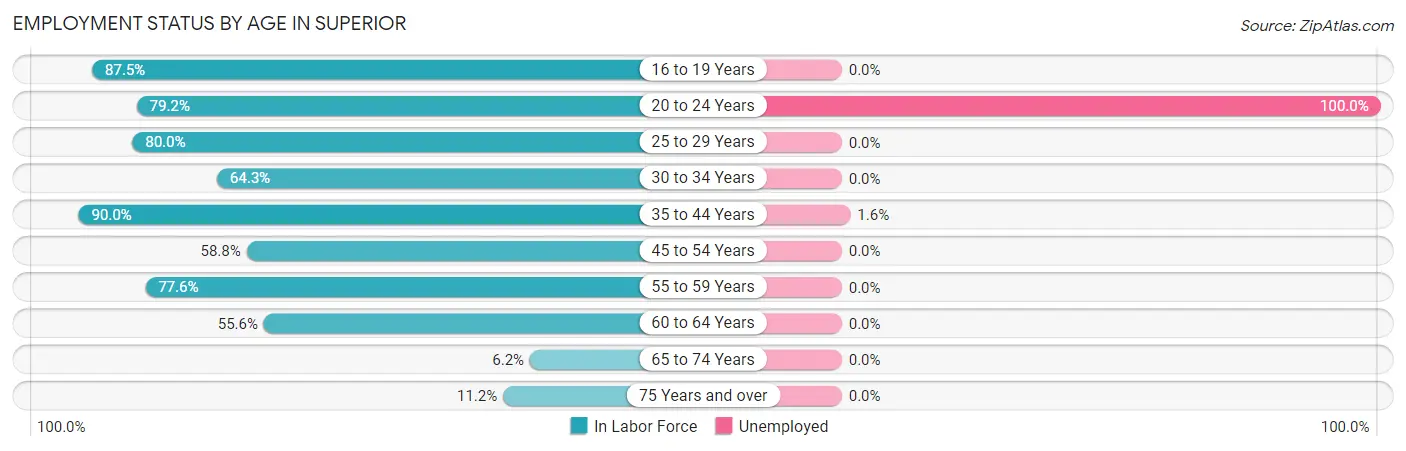
| Age Bracket | In Labor Force | Unemployed |
| 16 to 19 Years | 28 (87.5%) | 0 (0.0%) |
| 20 to 24 Years | 19 (79.2%) | 19 (100.0%) |
| 25 to 29 Years | 36 (80.0%) | 0 (0.0%) |
| 30 to 34 Years | 9 (64.3%) | 0 (0.0%) |
| 35 to 44 Years | 63 (90.0%) | 1 (1.6%) |
| 45 to 54 Years | 30 (58.8%) | 0 (0.0%) |
| 55 to 59 Years | 38 (77.6%) | 0 (0.0%) |
| 60 to 64 Years | 55 (55.6%) | 0 (0.0%) |
| 65 to 74 Years | 14 (6.2%) | 0 (0.0%) |
| 75 Years and over | 15 (11.2%) | 0 (0.0%) |
| Total | 307 (41.3%) | 20 (6.5%) |
Employment Status by Educational Attainment in Superior
According to labor force statistics for Superior, 70.4% of individuals (231) out of the total population between 25 and 64 years of age (328) are in the labor force, with 0.4% or 1 of them being unemployed. The group with the highest labor force participation rate are those with the educational attainment of bachelor's degree or higher, with 90.2% or 83 individuals in the labor force. Within the labor force, individuals with less than high school education have the highest percentage of unemployment, with 20.0% or 1 of them being unemployed.
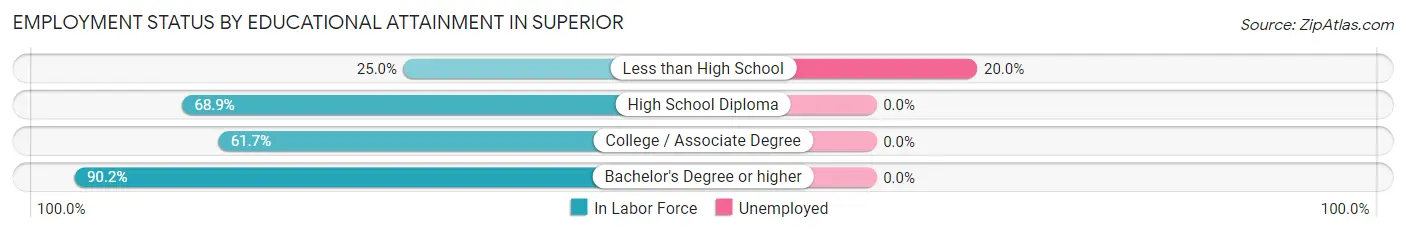
| Educational Attainment | In Labor Force | Unemployed |
| Less than High School | 5 (25.0%) | 4 (20.0%) |
| High School Diploma | 93 (68.9%) | 0 (0.0%) |
| College / Associate Degree | 50 (61.7%) | 0 (0.0%) |
| Bachelor's Degree or higher | 83 (90.2%) | 0 (0.0%) |
| Total | 231 (70.4%) | 1 (0.4%) |
Employment Occupations by Sex in Superior
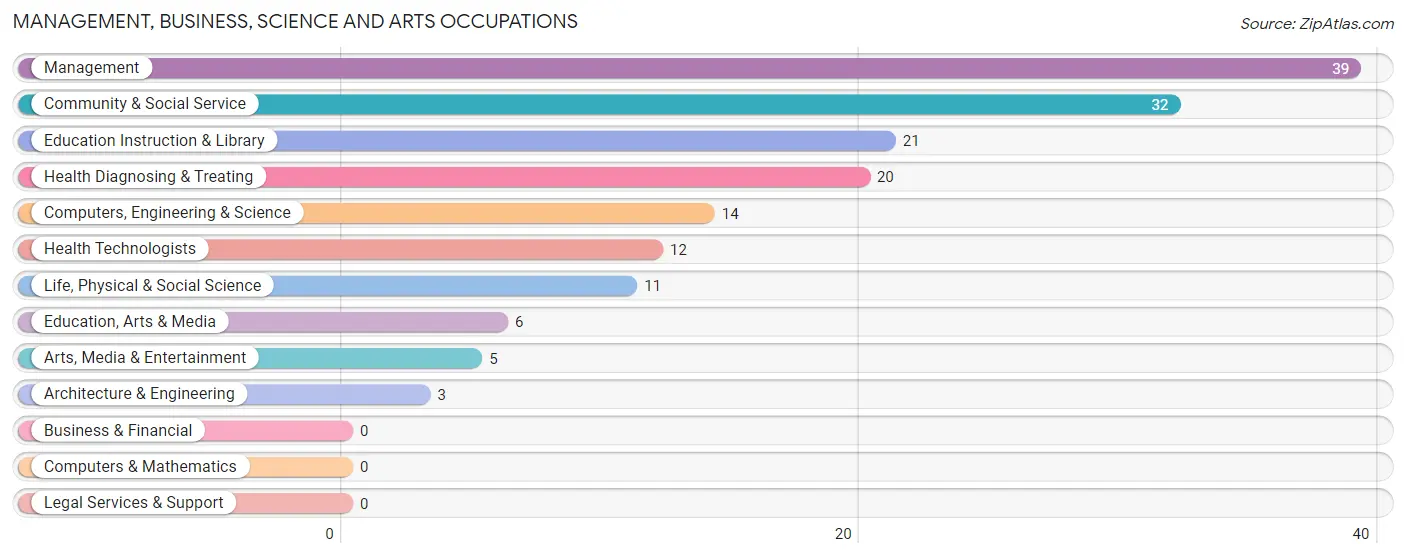
Management, Business, Science and Arts Occupations
The most common Management, Business, Science and Arts occupations in Superior are Management (39 | 13.6%), Community & Social Service (32 | 11.2%), Education Instruction & Library (21 | 7.3%), Health Diagnosing & Treating (20 | 7.0%), and Computers, Engineering & Science (14 | 4.9%).
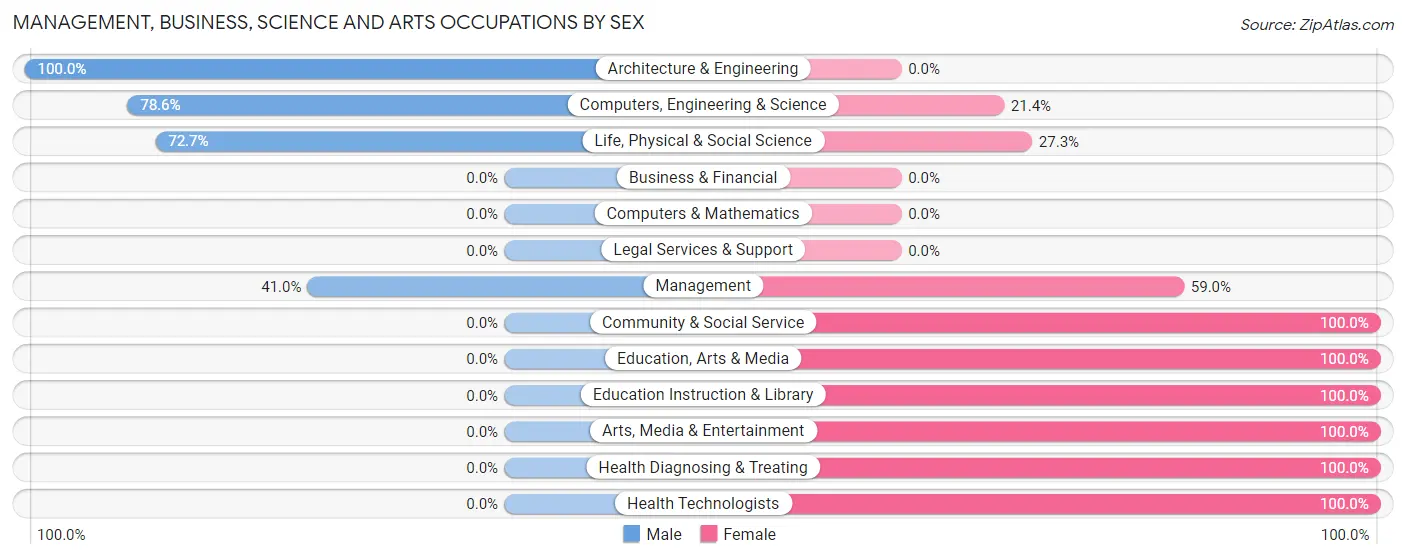
Management, Business, Science and Arts Occupations by Sex
Within the Management, Business, Science and Arts occupations in Superior, the most male-oriented occupations are Architecture & Engineering (100.0%), Computers, Engineering & Science (78.6%), and Life, Physical & Social Science (72.7%), while the most female-oriented occupations are Community & Social Service (100.0%), Education, Arts & Media (100.0%), and Education Instruction & Library (100.0%).
| Occupation | Male | Female |
| Management | 16 (41.0%) | 23 (59.0%) |
| Business & Financial | 0 (0.0%) | 0 (0.0%) |
| Computers, Engineering & Science | 11 (78.6%) | 3 (21.4%) |
| Computers & Mathematics | 0 (0.0%) | 0 (0.0%) |
| Architecture & Engineering | 3 (100.0%) | 0 (0.0%) |
| Life, Physical & Social Science | 8 (72.7%) | 3 (27.3%) |
| Community & Social Service | 0 (0.0%) | 32 (100.0%) |
| Education, Arts & Media | 0 (0.0%) | 6 (100.0%) |
| Legal Services & Support | 0 (0.0%) | 0 (0.0%) |
| Education Instruction & Library | 0 (0.0%) | 21 (100.0%) |
| Arts, Media & Entertainment | 0 (0.0%) | 5 (100.0%) |
| Health Diagnosing & Treating | 0 (0.0%) | 20 (100.0%) |
| Health Technologists | 0 (0.0%) | 12 (100.0%) |
| Total (Category) | 27 (25.7%) | 78 (74.3%) |
| Total (Overall) | 140 (48.8%) | 147 (51.2%) |
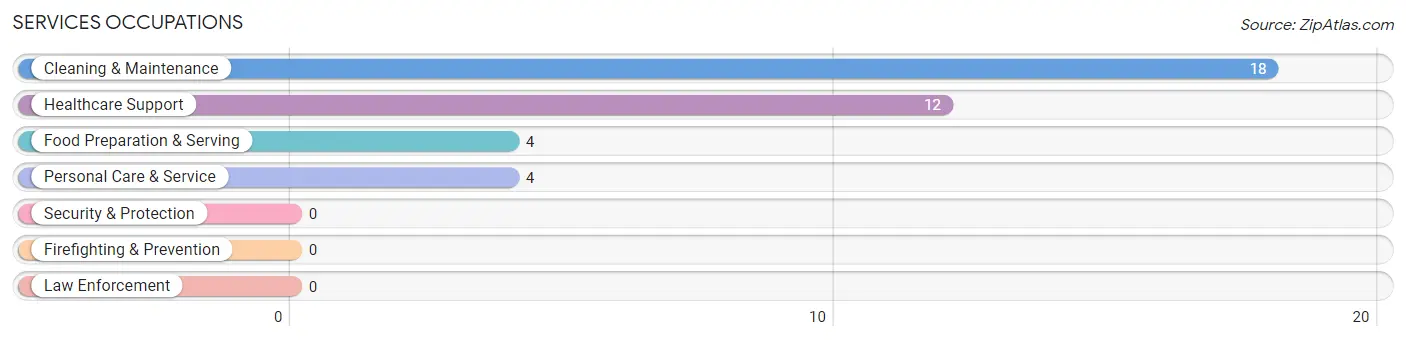
Services Occupations
The most common Services occupations in Superior are Cleaning & Maintenance (18 | 6.3%), Healthcare Support (12 | 4.2%), Food Preparation & Serving (4 | 1.4%), and Personal Care & Service (4 | 1.4%).
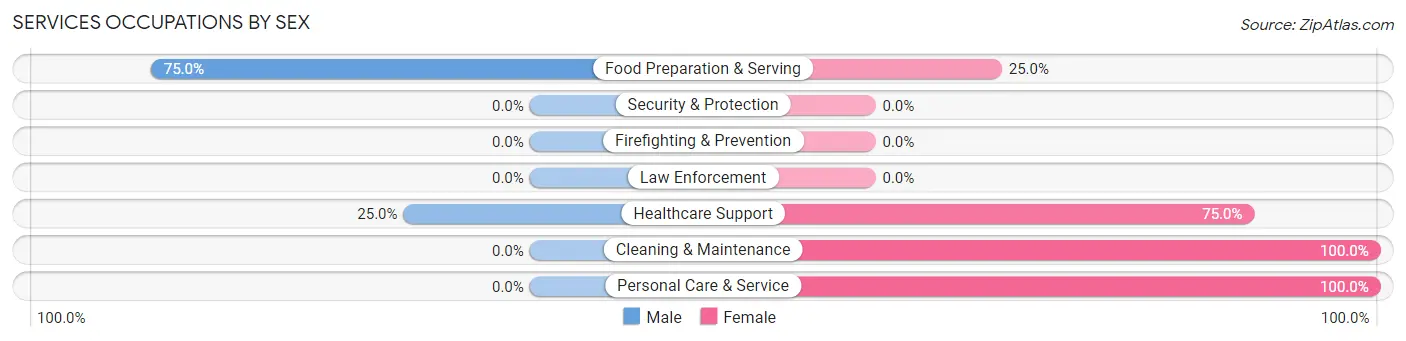
Services Occupations by Sex
Within the Services occupations in Superior, the most male-oriented occupations are Food Preparation & Serving (75.0%), and Healthcare Support (25.0%), while the most female-oriented occupations are Cleaning & Maintenance (100.0%), Personal Care & Service (100.0%), and Healthcare Support (75.0%).
| Occupation | Male | Female |
| Healthcare Support | 3 (25.0%) | 9 (75.0%) |
| Security & Protection | 0 (0.0%) | 0 (0.0%) |
| Firefighting & Prevention | 0 (0.0%) | 0 (0.0%) |
| Law Enforcement | 0 (0.0%) | 0 (0.0%) |
| Food Preparation & Serving | 3 (75.0%) | 1 (25.0%) |
| Cleaning & Maintenance | 0 (0.0%) | 18 (100.0%) |
| Personal Care & Service | 0 (0.0%) | 4 (100.0%) |
| Total (Category) | 6 (15.8%) | 32 (84.2%) |
| Total (Overall) | 140 (48.8%) | 147 (51.2%) |
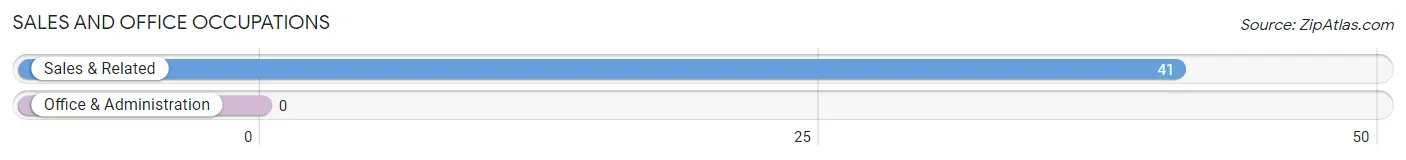
Sales and Office Occupations
The most common Sales and Office occupations in Superior are , and Sales & Related (41 | 14.3%).
Sales and Office Occupations by Sex
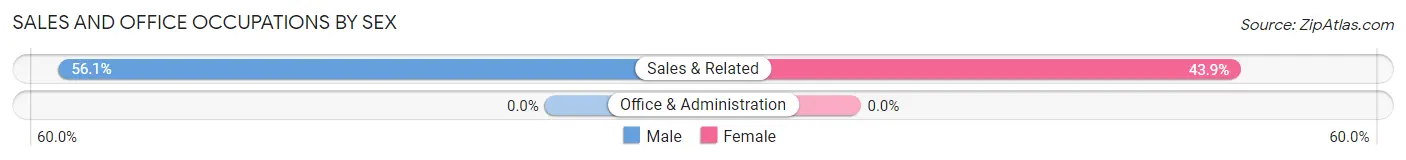
| Occupation | Male | Female |
| Sales & Related | 23 (56.1%) | 18 (43.9%) |
| Office & Administration | 0 (0.0%) | 0 (0.0%) |
| Total (Category) | 23 (56.1%) | 18 (43.9%) |
| Total (Overall) | 140 (48.8%) | 147 (51.2%) |
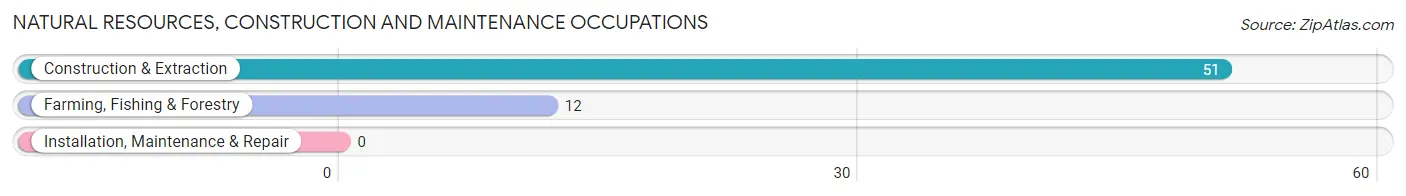
Natural Resources, Construction and Maintenance Occupations
The most common Natural Resources, Construction and Maintenance occupations in Superior are Construction & Extraction (51 | 17.8%), and Farming, Fishing & Forestry (12 | 4.2%).
Natural Resources, Construction and Maintenance Occupations by Sex
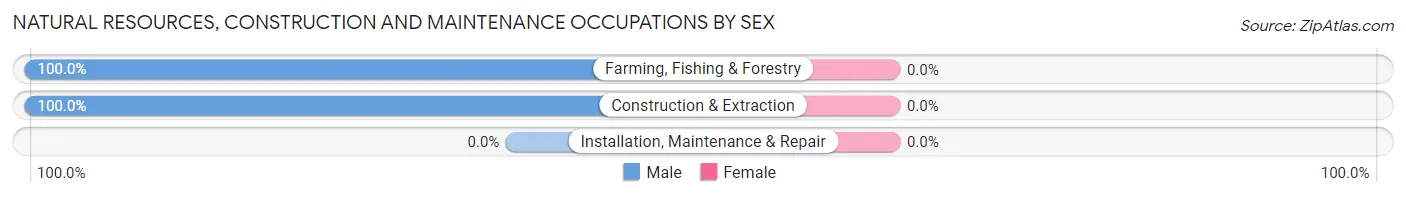
| Occupation | Male | Female |
| Farming, Fishing & Forestry | 12 (100.0%) | 0 (0.0%) |
| Construction & Extraction | 51 (100.0%) | 0 (0.0%) |
| Installation, Maintenance & Repair | 0 (0.0%) | 0 (0.0%) |
| Total (Category) | 63 (100.0%) | 0 (0.0%) |
| Total (Overall) | 140 (48.8%) | 147 (51.2%) |
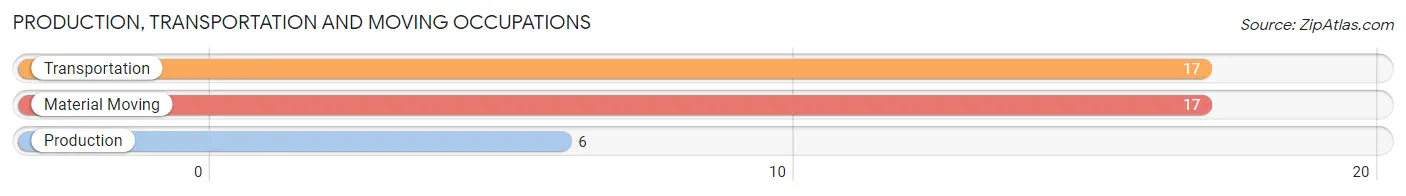
Production, Transportation and Moving Occupations
The most common Production, Transportation and Moving occupations in Superior are Transportation (17 | 5.9%), Material Moving (17 | 5.9%), and Production (6 | 2.1%).
Production, Transportation and Moving Occupations by Sex
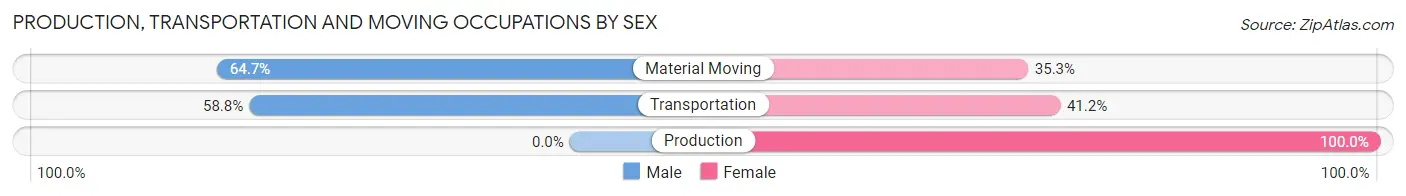
| Occupation | Male | Female |
| Production | 0 (0.0%) | 6 (100.0%) |
| Transportation | 10 (58.8%) | 7 (41.2%) |
| Material Moving | 11 (64.7%) | 6 (35.3%) |
| Total (Category) | 21 (52.5%) | 19 (47.5%) |
| Total (Overall) | 140 (48.8%) | 147 (51.2%) |
Employment Industries by Sex in Superior
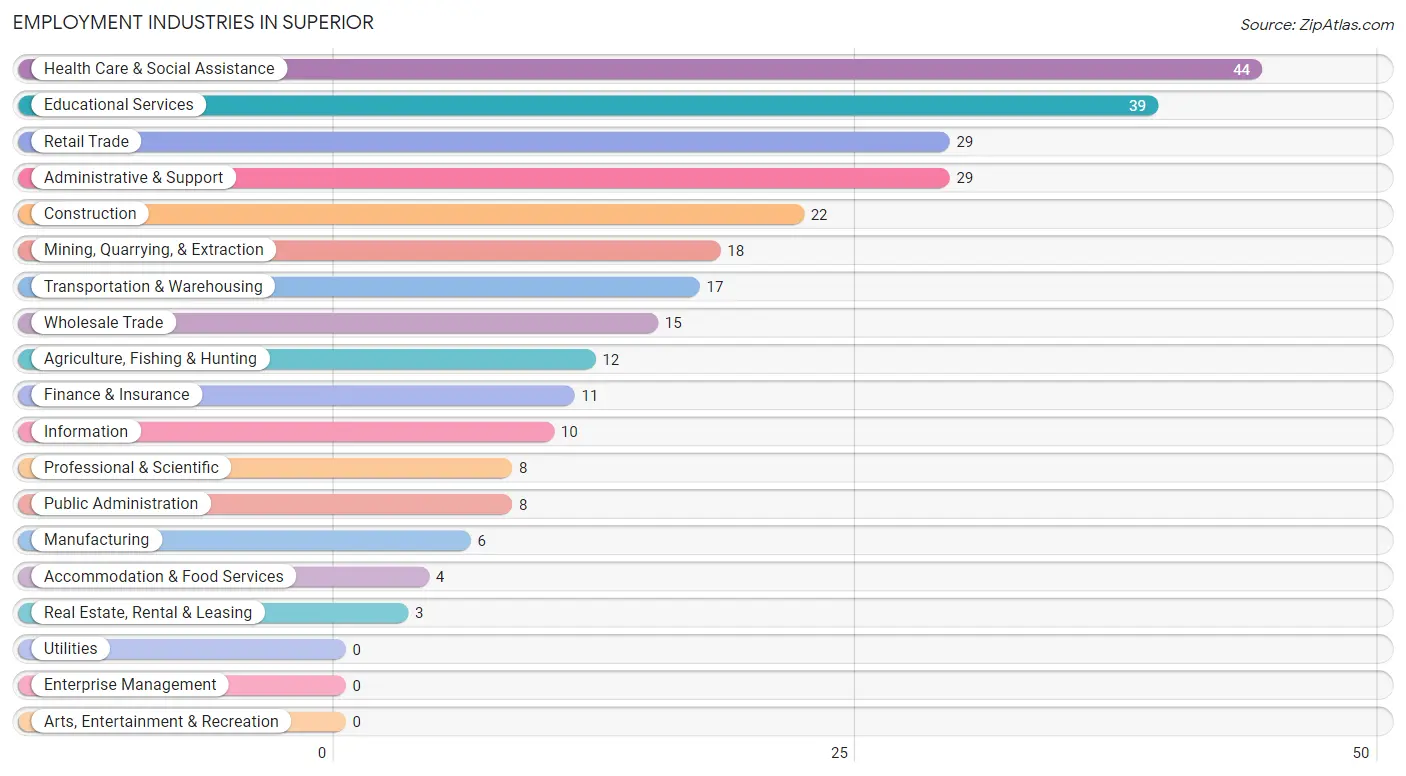
Employment Industries in Superior
The major employment industries in Superior include Health Care & Social Assistance (44 | 15.3%), Educational Services (39 | 13.6%), Retail Trade (29 | 10.1%), Administrative & Support (29 | 10.1%), and Construction (22 | 7.7%).
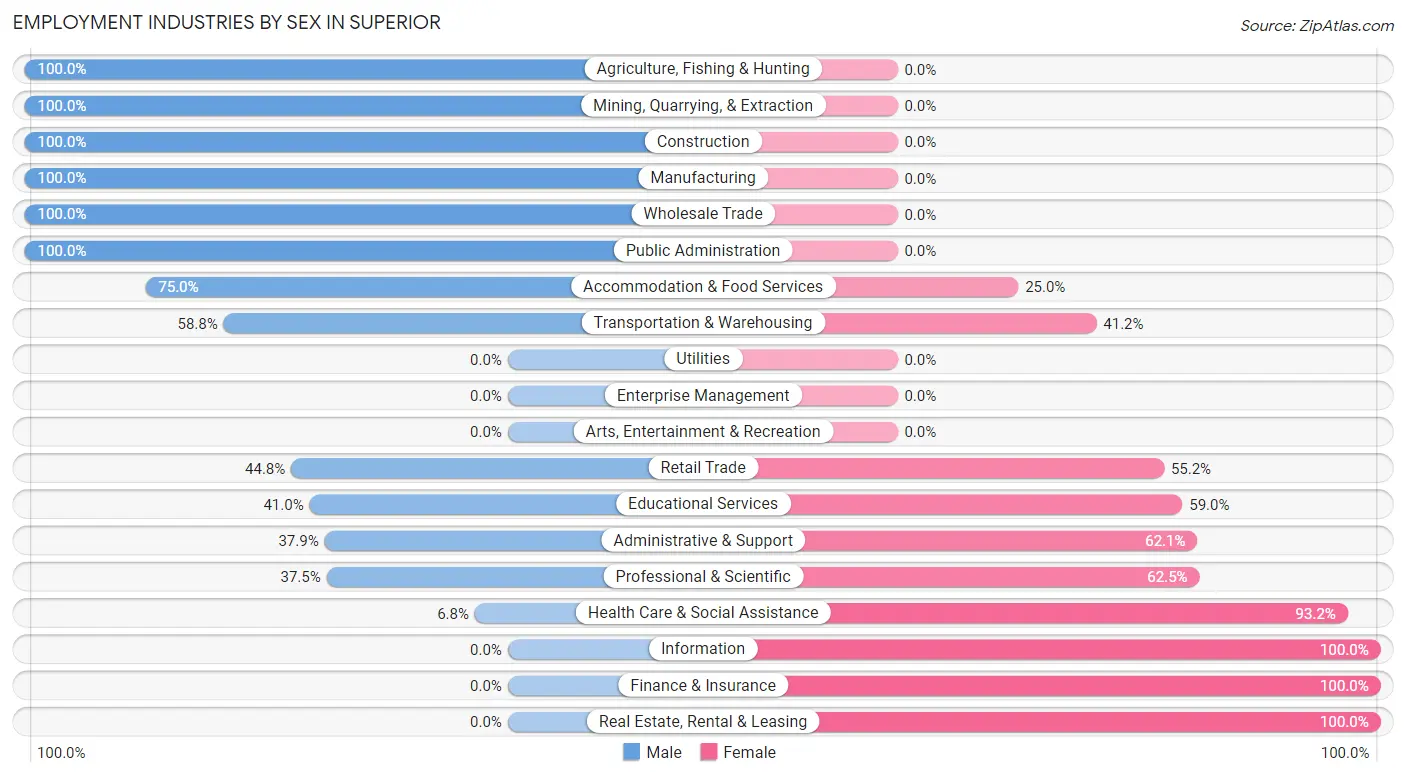
Employment Industries by Sex in Superior
The Superior industries that see more men than women are Agriculture, Fishing & Hunting (100.0%), Mining, Quarrying, & Extraction (100.0%), and Construction (100.0%), whereas the industries that tend to have a higher number of women are Information (100.0%), Finance & Insurance (100.0%), and Real Estate, Rental & Leasing (100.0%).
| Industry | Male | Female |
| Agriculture, Fishing & Hunting | 12 (100.0%) | 0 (0.0%) |
| Mining, Quarrying, & Extraction | 18 (100.0%) | 0 (0.0%) |
| Construction | 22 (100.0%) | 0 (0.0%) |
| Manufacturing | 6 (100.0%) | 0 (0.0%) |
| Wholesale Trade | 15 (100.0%) | 0 (0.0%) |
| Retail Trade | 13 (44.8%) | 16 (55.2%) |
| Transportation & Warehousing | 10 (58.8%) | 7 (41.2%) |
| Utilities | 0 (0.0%) | 0 (0.0%) |
| Information | 0 (0.0%) | 10 (100.0%) |
| Finance & Insurance | 0 (0.0%) | 11 (100.0%) |
| Real Estate, Rental & Leasing | 0 (0.0%) | 3 (100.0%) |
| Professional & Scientific | 3 (37.5%) | 5 (62.5%) |
| Enterprise Management | 0 (0.0%) | 0 (0.0%) |
| Administrative & Support | 11 (37.9%) | 18 (62.1%) |
| Educational Services | 16 (41.0%) | 23 (59.0%) |
| Health Care & Social Assistance | 3 (6.8%) | 41 (93.2%) |
| Arts, Entertainment & Recreation | 0 (0.0%) | 0 (0.0%) |
| Accommodation & Food Services | 3 (75.0%) | 1 (25.0%) |
| Public Administration | 8 (100.0%) | 0 (0.0%) |
| Total | 140 (48.8%) | 147 (51.2%) |
Education in Superior
School Enrollment in Superior
The most common levels of schooling among the 106 students in Superior are high school (35 | 33.0%), middle school (33 | 31.1%), and elementary school (28 | 26.4%).
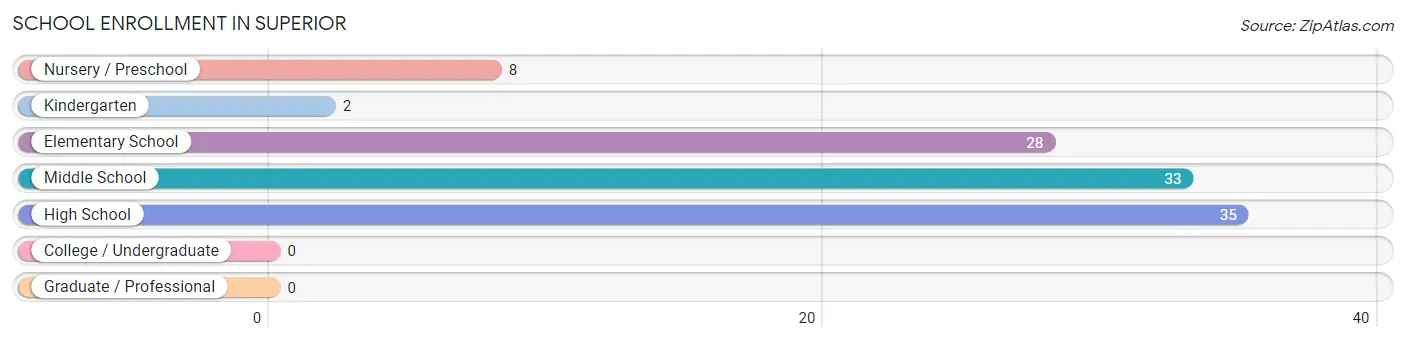
| School Level | # Students | % Students |
| Nursery / Preschool | 8 | 7.5% |
| Kindergarten | 2 | 1.9% |
| Elementary School | 28 | 26.4% |
| Middle School | 33 | 31.1% |
| High School | 35 | 33.0% |
| College / Undergraduate | 0 | 0.0% |
| Graduate / Professional | 0 | 0.0% |
| Total | 106 | 100.0% |
School Enrollment by Age by Funding Source in Superior
Out of a total of 106 students who are enrolled in schools in Superior, 26 (24.5%) attend a private institution, while the remaining 80 (75.5%) are enrolled in public schools. The age group of 3 to 4 year olds has the highest likelihood of being enrolled in private schools, with 8 (100.0% in the age bracket) enrolled. Conversely, the age group of 10 to 14 year olds has the lowest likelihood of being enrolled in a private school, with 43 (100.0% in the age bracket) attending a public institution.
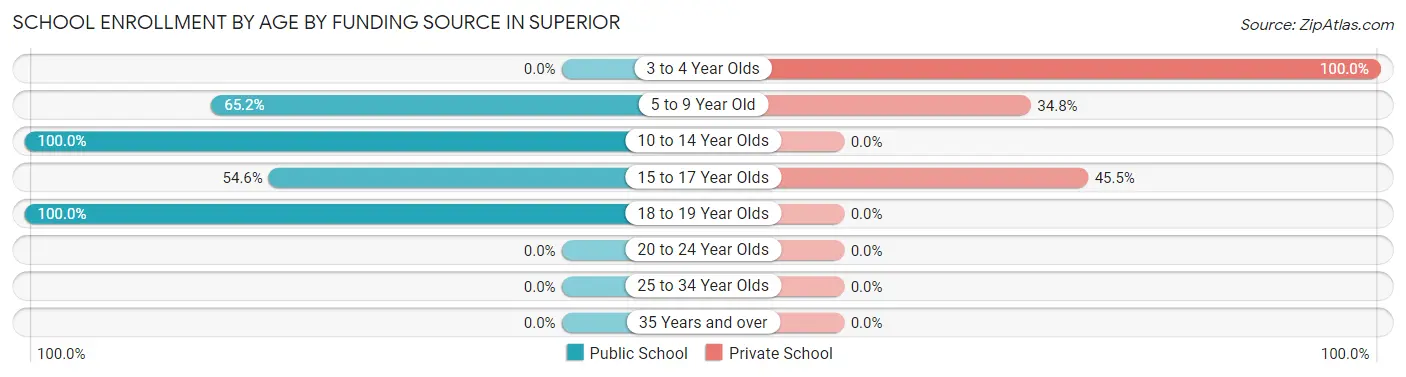
| Age Bracket | Public School | Private School |
| 3 to 4 Year Olds | 0 (0.0%) | 8 (100.0%) |
| 5 to 9 Year Old | 15 (65.2%) | 8 (34.8%) |
| 10 to 14 Year Olds | 43 (100.0%) | 0 (0.0%) |
| 15 to 17 Year Olds | 12 (54.5%) | 10 (45.5%) |
| 18 to 19 Year Olds | 10 (100.0%) | 0 (0.0%) |
| 20 to 24 Year Olds | 0 (0.0%) | 0 (0.0%) |
| 25 to 34 Year Olds | 0 (0.0%) | 0 (0.0%) |
| 35 Years and over | 0 (0.0%) | 0 (0.0%) |
| Total | 80 (75.5%) | 26 (24.5%) |
Educational Attainment by Field of Study in Superior
Education (37 | 26.6%), science & technology (30 | 21.6%), physical & health sciences (24 | 17.3%), business (18 | 13.0%), and liberal arts & history (12 | 8.6%) are the most common fields of study among 139 individuals in Superior who have obtained a bachelor's degree or higher.
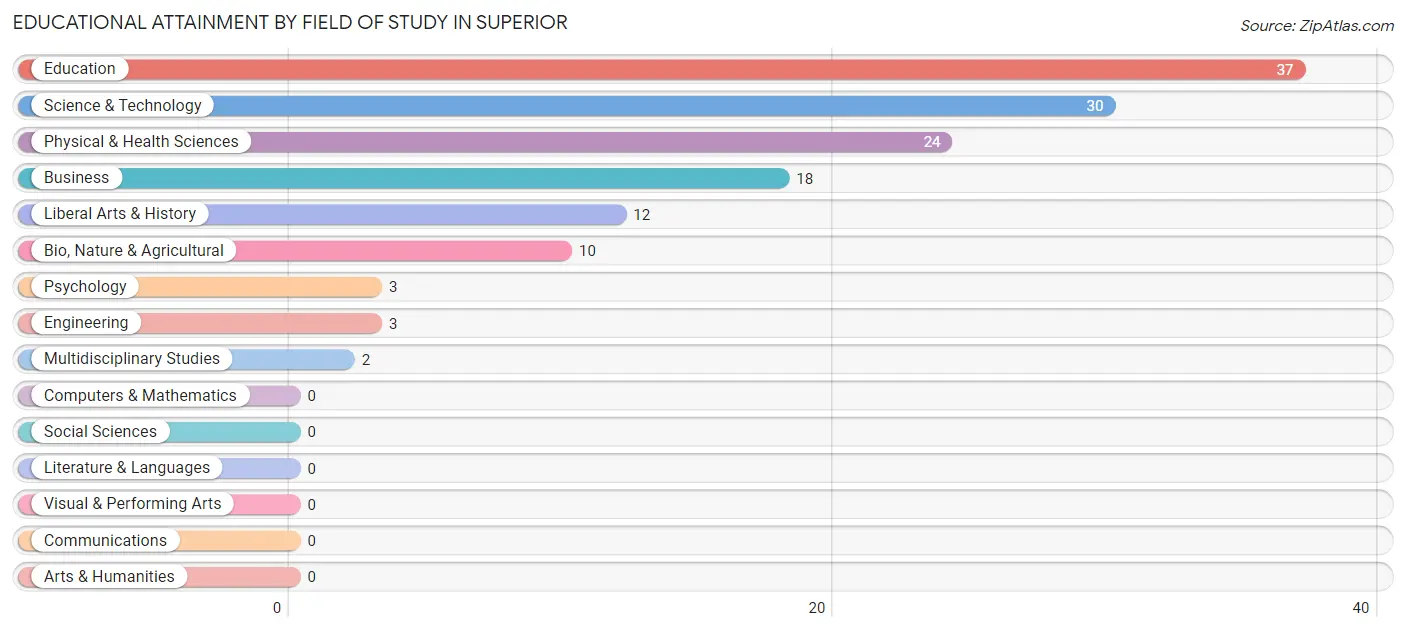
| Field of Study | # Graduates | % Graduates |
| Computers & Mathematics | 0 | 0.0% |
| Bio, Nature & Agricultural | 10 | 7.2% |
| Physical & Health Sciences | 24 | 17.3% |
| Psychology | 3 | 2.2% |
| Social Sciences | 0 | 0.0% |
| Engineering | 3 | 2.2% |
| Multidisciplinary Studies | 2 | 1.4% |
| Science & Technology | 30 | 21.6% |
| Business | 18 | 13.0% |
| Education | 37 | 26.6% |
| Literature & Languages | 0 | 0.0% |
| Liberal Arts & History | 12 | 8.6% |
| Visual & Performing Arts | 0 | 0.0% |
| Communications | 0 | 0.0% |
| Arts & Humanities | 0 | 0.0% |
| Total | 139 | 100.0% |
Transportation & Commute in Superior
Vehicle Availability by Sex in Superior
The most prevalent vehicle ownership categories in Superior are males with 2 vehicles (86, accounting for 61.4%) and females with 2 vehicles (74, making up 58.5%).
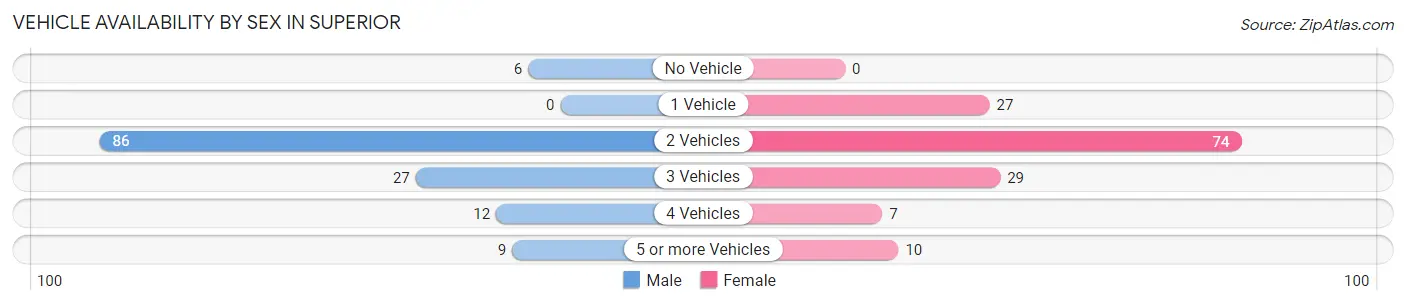
| Vehicles Available | Male | Female |
| No Vehicle | 6 (4.3%) | 0 (0.0%) |
| 1 Vehicle | 0 (0.0%) | 27 (18.4%) |
| 2 Vehicles | 86 (61.4%) | 74 (50.3%) |
| 3 Vehicles | 27 (19.3%) | 29 (19.7%) |
| 4 Vehicles | 12 (8.6%) | 7 (4.8%) |
| 5 or more Vehicles | 9 (6.4%) | 10 (6.8%) |
| Total | 140 (100.0%) | 147 (100.0%) |
Commute Time in Superior
The most frequently occuring commute durations in Superior are 10 to 14 minutes (56 commuters, 20.2%), 60 to 89 minutes (55 commuters, 19.9%), and 5 to 9 minutes (52 commuters, 18.8%).
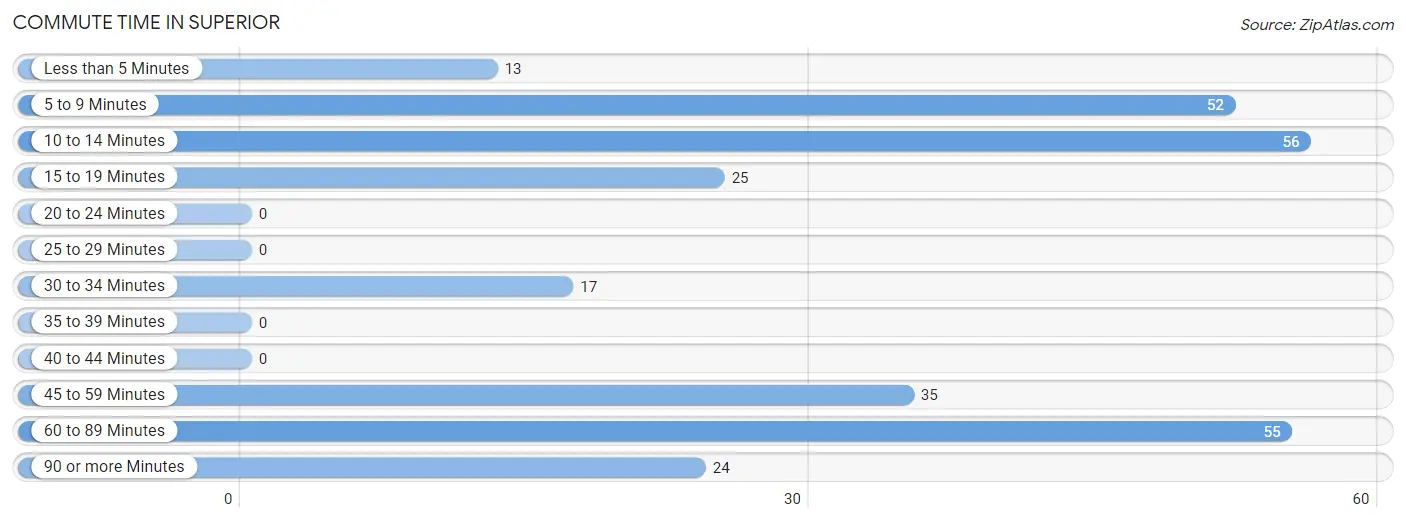
| Commute Time | # Commuters | % Commuters |
| Less than 5 Minutes | 13 | 4.7% |
| 5 to 9 Minutes | 52 | 18.8% |
| 10 to 14 Minutes | 56 | 20.2% |
| 15 to 19 Minutes | 25 | 9.0% |
| 20 to 24 Minutes | 0 | 0.0% |
| 25 to 29 Minutes | 0 | 0.0% |
| 30 to 34 Minutes | 17 | 6.1% |
| 35 to 39 Minutes | 0 | 0.0% |
| 40 to 44 Minutes | 0 | 0.0% |
| 45 to 59 Minutes | 35 | 12.6% |
| 60 to 89 Minutes | 55 | 19.9% |
| 90 or more Minutes | 24 | 8.7% |
Commute Time by Sex in Superior
The most common commute times in Superior are 60 to 89 minutes (36 commuters, 25.7%) for males and 5 to 9 minutes (43 commuters, 31.4%) for females.
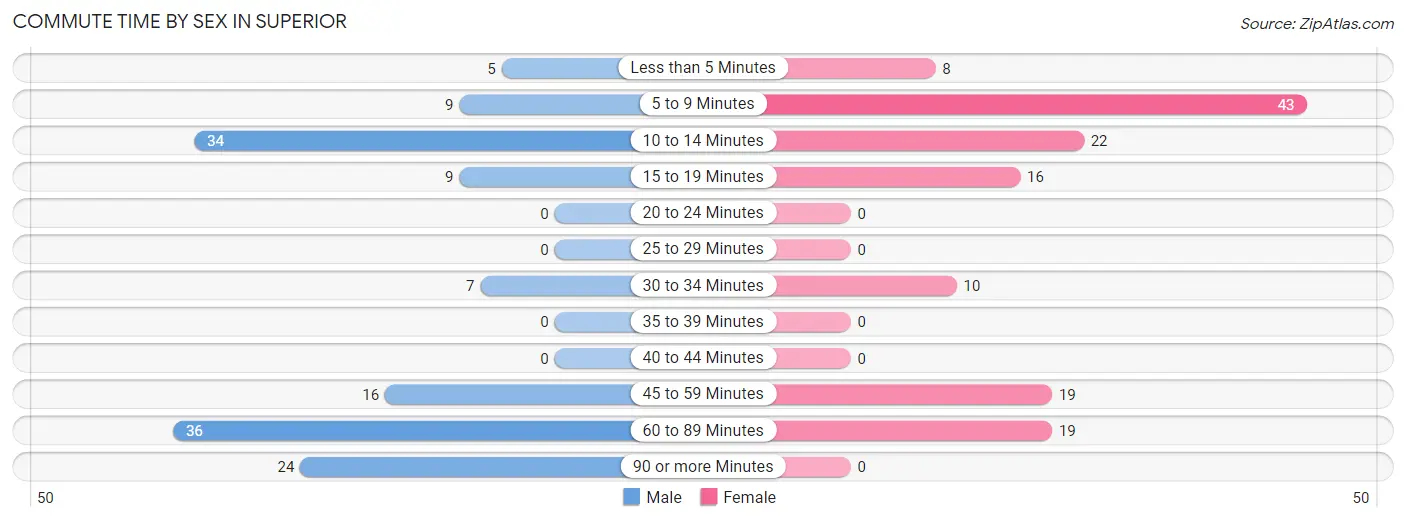
| Commute Time | Male | Female |
| Less than 5 Minutes | 5 (3.6%) | 8 (5.8%) |
| 5 to 9 Minutes | 9 (6.4%) | 43 (31.4%) |
| 10 to 14 Minutes | 34 (24.3%) | 22 (16.1%) |
| 15 to 19 Minutes | 9 (6.4%) | 16 (11.7%) |
| 20 to 24 Minutes | 0 (0.0%) | 0 (0.0%) |
| 25 to 29 Minutes | 0 (0.0%) | 0 (0.0%) |
| 30 to 34 Minutes | 7 (5.0%) | 10 (7.3%) |
| 35 to 39 Minutes | 0 (0.0%) | 0 (0.0%) |
| 40 to 44 Minutes | 0 (0.0%) | 0 (0.0%) |
| 45 to 59 Minutes | 16 (11.4%) | 19 (13.9%) |
| 60 to 89 Minutes | 36 (25.7%) | 19 (13.9%) |
| 90 or more Minutes | 24 (17.1%) | 0 (0.0%) |
Time of Departure to Work by Sex in Superior
The most frequent times of departure to work in Superior are 8:00 AM to 8:29 AM (28, 20.0%) for males and 6:30 AM to 6:59 AM (29, 21.2%) for females.
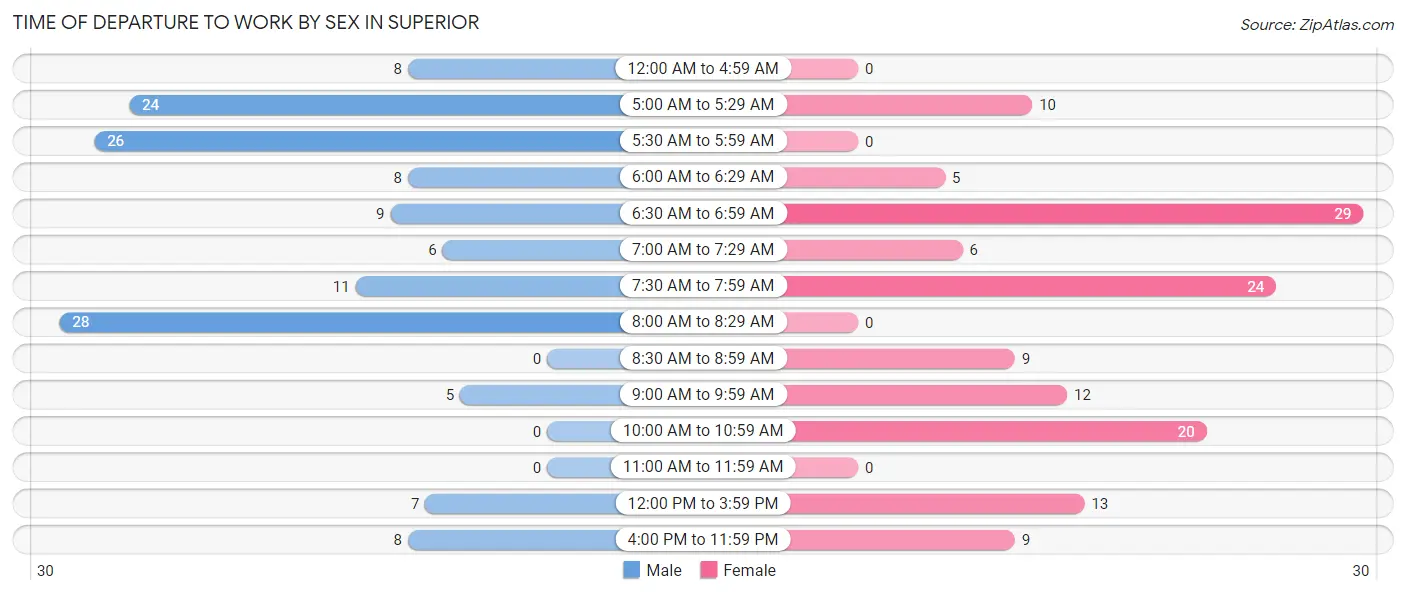
| Time of Departure | Male | Female |
| 12:00 AM to 4:59 AM | 8 (5.7%) | 0 (0.0%) |
| 5:00 AM to 5:29 AM | 24 (17.1%) | 10 (7.3%) |
| 5:30 AM to 5:59 AM | 26 (18.6%) | 0 (0.0%) |
| 6:00 AM to 6:29 AM | 8 (5.7%) | 5 (3.6%) |
| 6:30 AM to 6:59 AM | 9 (6.4%) | 29 (21.2%) |
| 7:00 AM to 7:29 AM | 6 (4.3%) | 6 (4.4%) |
| 7:30 AM to 7:59 AM | 11 (7.9%) | 24 (17.5%) |
| 8:00 AM to 8:29 AM | 28 (20.0%) | 0 (0.0%) |
| 8:30 AM to 8:59 AM | 0 (0.0%) | 9 (6.6%) |
| 9:00 AM to 9:59 AM | 5 (3.6%) | 12 (8.8%) |
| 10:00 AM to 10:59 AM | 0 (0.0%) | 20 (14.6%) |
| 11:00 AM to 11:59 AM | 0 (0.0%) | 0 (0.0%) |
| 12:00 PM to 3:59 PM | 7 (5.0%) | 13 (9.5%) |
| 4:00 PM to 11:59 PM | 8 (5.7%) | 9 (6.6%) |
| Total | 140 (100.0%) | 137 (100.0%) |
Housing Occupancy in Superior
Occupancy by Ownership in Superior
Of the total 420 dwellings in Superior, owner-occupied units account for 311 (74.1%), while renter-occupied units make up 109 (26.0%).
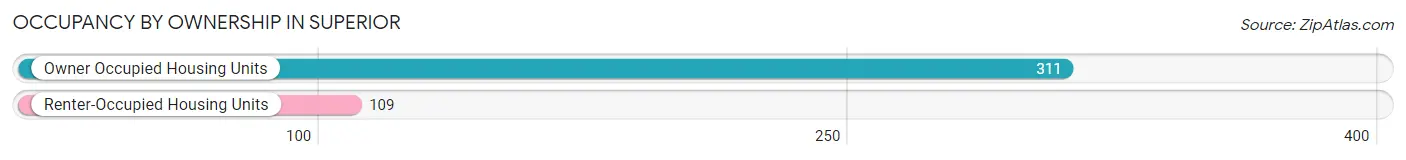
| Occupancy | # Housing Units | % Housing Units |
| Owner Occupied Housing Units | 311 | 74.1% |
| Renter-Occupied Housing Units | 109 | 26.0% |
| Total Occupied Housing Units | 420 | 100.0% |
Occupancy by Household Size in Superior
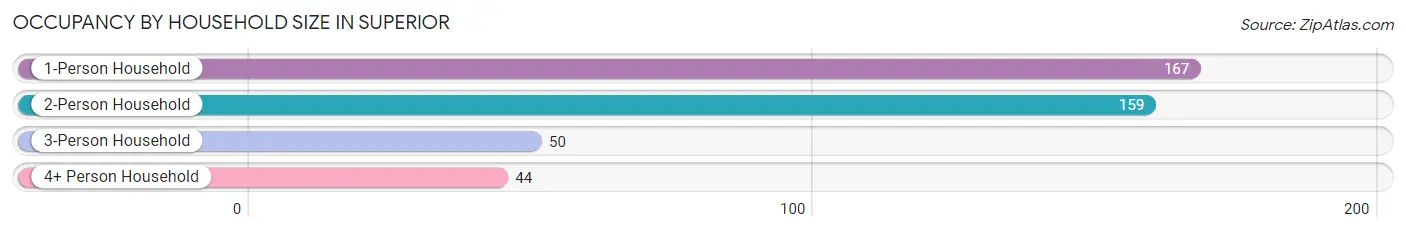
| Household Size | # Housing Units | % Housing Units |
| 1-Person Household | 167 | 39.8% |
| 2-Person Household | 159 | 37.9% |
| 3-Person Household | 50 | 11.9% |
| 4+ Person Household | 44 | 10.5% |
| Total Housing Units | 420 | 100.0% |
Occupancy by Ownership by Household Size in Superior
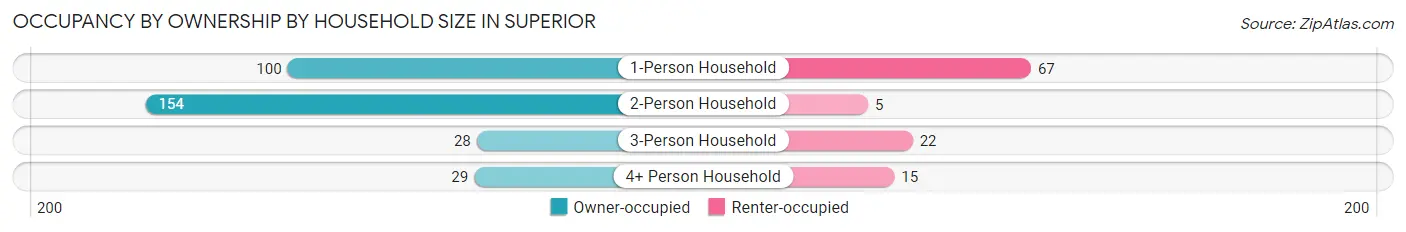
| Household Size | Owner-occupied | Renter-occupied |
| 1-Person Household | 100 (59.9%) | 67 (40.1%) |
| 2-Person Household | 154 (96.9%) | 5 (3.1%) |
| 3-Person Household | 28 (56.0%) | 22 (44.0%) |
| 4+ Person Household | 29 (65.9%) | 15 (34.1%) |
| Total Housing Units | 311 (74.1%) | 109 (26.0%) |
Occupancy by Educational Attainment in Superior
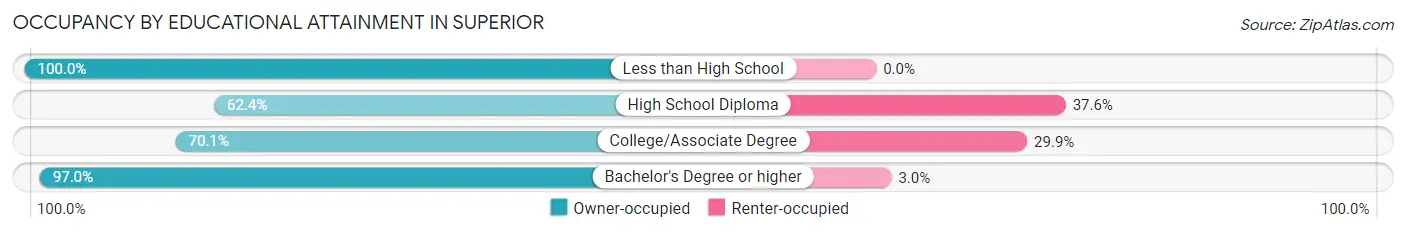
| Household Size | Owner-occupied | Renter-occupied |
| Less than High School | 7 (100.0%) | 0 (0.0%) |
| High School Diploma | 98 (62.4%) | 59 (37.6%) |
| College/Associate Degree | 110 (70.1%) | 47 (29.9%) |
| Bachelor's Degree or higher | 96 (97.0%) | 3 (3.0%) |
Occupancy by Age of Householder in Superior
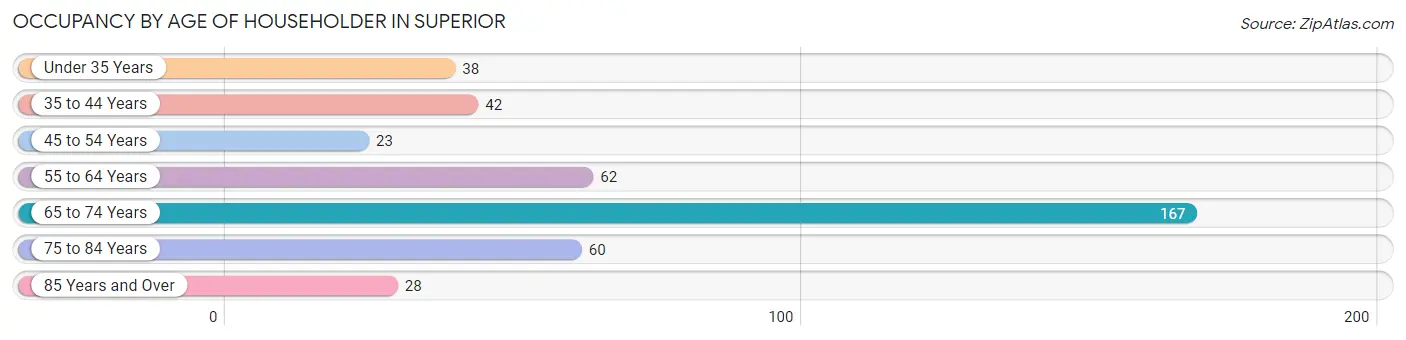
| Age Bracket | # Households | % Households |
| Under 35 Years | 38 | 9.0% |
| 35 to 44 Years | 42 | 10.0% |
| 45 to 54 Years | 23 | 5.5% |
| 55 to 64 Years | 62 | 14.8% |
| 65 to 74 Years | 167 | 39.8% |
| 75 to 84 Years | 60 | 14.3% |
| 85 Years and Over | 28 | 6.7% |
| Total | 420 | 100.0% |
Housing Finances in Superior
Median Income by Occupancy in Superior
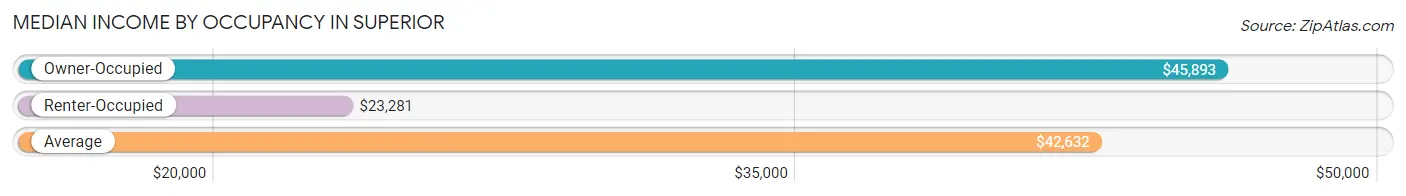
| Occupancy Type | # Households | Median Income |
| Owner-Occupied | 311 (74.1%) | $45,893 |
| Renter-Occupied | 109 (26.0%) | $23,281 |
| Average | 420 (100.0%) | $42,632 |
Occupancy by Householder Income Bracket in Superior
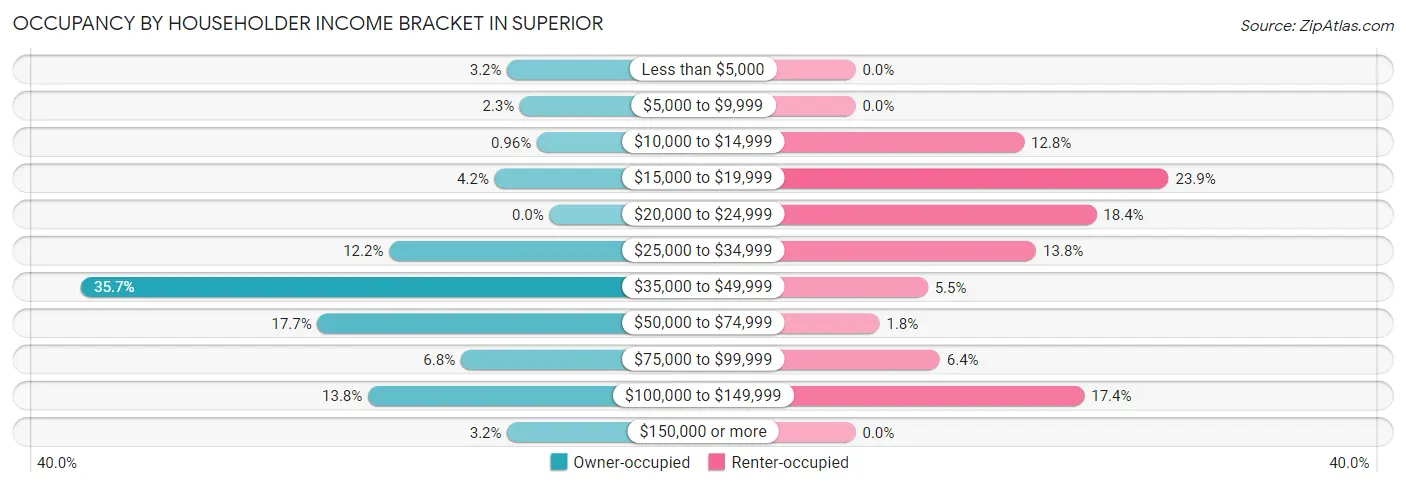
| Income Bracket | Owner-occupied | Renter-occupied |
| Less than $5,000 | 10 (3.2%) | 0 (0.0%) |
| $5,000 to $9,999 | 7 (2.2%) | 0 (0.0%) |
| $10,000 to $14,999 | 3 (1.0%) | 14 (12.8%) |
| $15,000 to $19,999 | 13 (4.2%) | 26 (23.8%) |
| $20,000 to $24,999 | 0 (0.0%) | 20 (18.3%) |
| $25,000 to $34,999 | 38 (12.2%) | 15 (13.8%) |
| $35,000 to $49,999 | 111 (35.7%) | 6 (5.5%) |
| $50,000 to $74,999 | 55 (17.7%) | 2 (1.8%) |
| $75,000 to $99,999 | 21 (6.8%) | 7 (6.4%) |
| $100,000 to $149,999 | 43 (13.8%) | 19 (17.4%) |
| $150,000 or more | 10 (3.2%) | 0 (0.0%) |
| Total | 311 (100.0%) | 109 (100.0%) |
Monthly Housing Cost Tiers in Superior
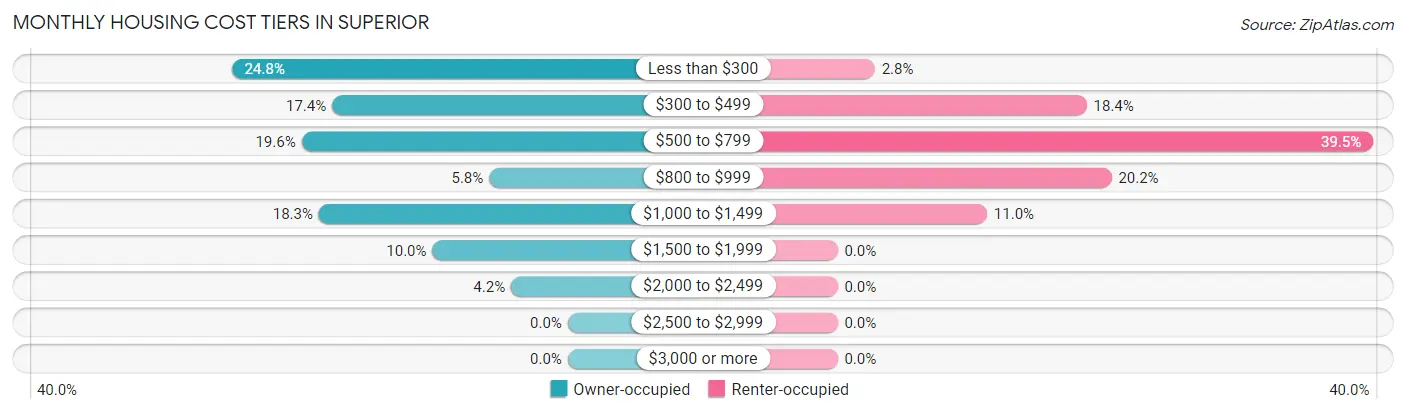
| Monthly Cost | Owner-occupied | Renter-occupied |
| Less than $300 | 77 (24.8%) | 3 (2.8%) |
| $300 to $499 | 54 (17.4%) | 20 (18.3%) |
| $500 to $799 | 61 (19.6%) | 43 (39.5%) |
| $800 to $999 | 18 (5.8%) | 22 (20.2%) |
| $1,000 to $1,499 | 57 (18.3%) | 12 (11.0%) |
| $1,500 to $1,999 | 31 (10.0%) | 0 (0.0%) |
| $2,000 to $2,499 | 13 (4.2%) | 0 (0.0%) |
| $2,500 to $2,999 | 0 (0.0%) | 0 (0.0%) |
| $3,000 or more | 0 (0.0%) | 0 (0.0%) |
| Total | 311 (100.0%) | 109 (100.0%) |
Physical Housing Characteristics in Superior
Housing Structures in Superior
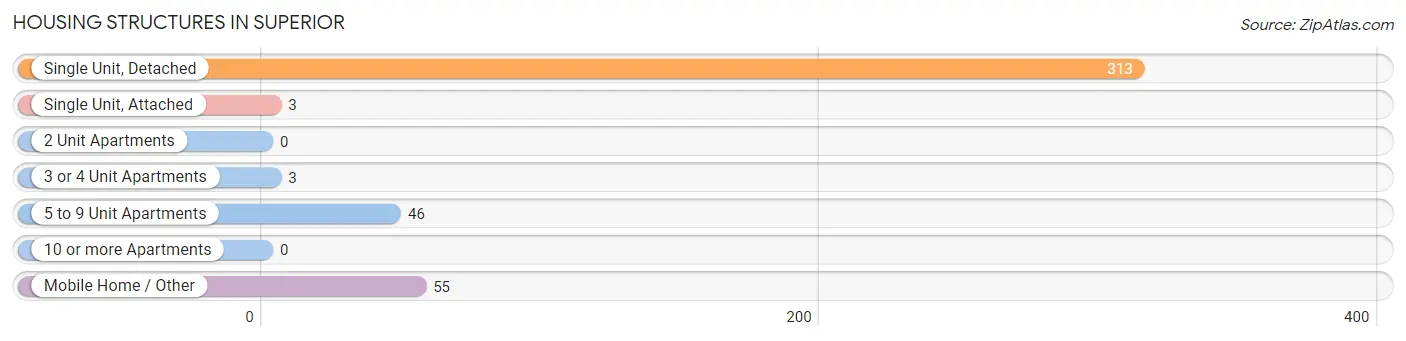
| Structure Type | # Housing Units | % Housing Units |
| Single Unit, Detached | 313 | 74.5% |
| Single Unit, Attached | 3 | 0.7% |
| 2 Unit Apartments | 0 | 0.0% |
| 3 or 4 Unit Apartments | 3 | 0.7% |
| 5 to 9 Unit Apartments | 46 | 11.0% |
| 10 or more Apartments | 0 | 0.0% |
| Mobile Home / Other | 55 | 13.1% |
| Total | 420 | 100.0% |
Housing Structures by Occupancy in Superior
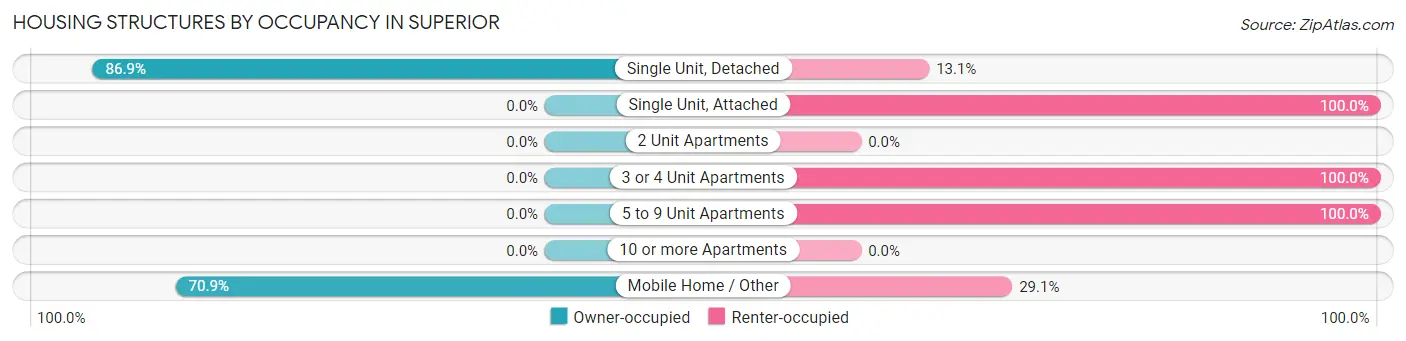
| Structure Type | Owner-occupied | Renter-occupied |
| Single Unit, Detached | 272 (86.9%) | 41 (13.1%) |
| Single Unit, Attached | 0 (0.0%) | 3 (100.0%) |
| 2 Unit Apartments | 0 (0.0%) | 0 (0.0%) |
| 3 or 4 Unit Apartments | 0 (0.0%) | 3 (100.0%) |
| 5 to 9 Unit Apartments | 0 (0.0%) | 46 (100.0%) |
| 10 or more Apartments | 0 (0.0%) | 0 (0.0%) |
| Mobile Home / Other | 39 (70.9%) | 16 (29.1%) |
| Total | 311 (74.1%) | 109 (26.0%) |
Housing Structures by Number of Rooms in Superior
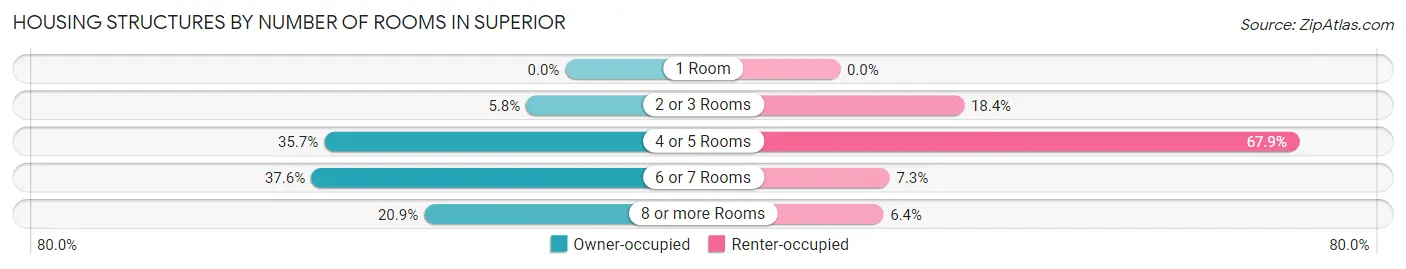
| Number of Rooms | Owner-occupied | Renter-occupied |
| 1 Room | 0 (0.0%) | 0 (0.0%) |
| 2 or 3 Rooms | 18 (5.8%) | 20 (18.3%) |
| 4 or 5 Rooms | 111 (35.7%) | 74 (67.9%) |
| 6 or 7 Rooms | 117 (37.6%) | 8 (7.3%) |
| 8 or more Rooms | 65 (20.9%) | 7 (6.4%) |
| Total | 311 (100.0%) | 109 (100.0%) |
Housing Structure by Heating Type in Superior
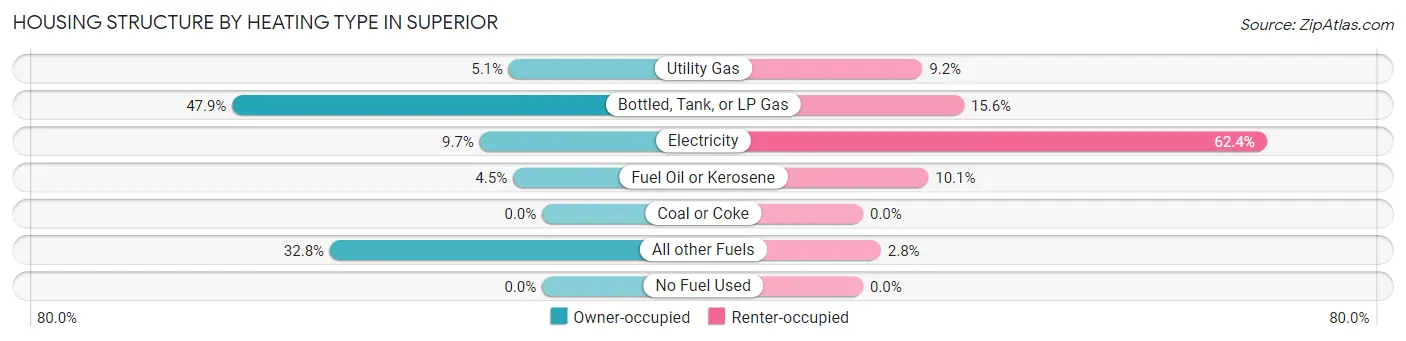
| Heating Type | Owner-occupied | Renter-occupied |
| Utility Gas | 16 (5.1%) | 10 (9.2%) |
| Bottled, Tank, or LP Gas | 149 (47.9%) | 17 (15.6%) |
| Electricity | 30 (9.7%) | 68 (62.4%) |
| Fuel Oil or Kerosene | 14 (4.5%) | 11 (10.1%) |
| Coal or Coke | 0 (0.0%) | 0 (0.0%) |
| All other Fuels | 102 (32.8%) | 3 (2.8%) |
| No Fuel Used | 0 (0.0%) | 0 (0.0%) |
| Total | 311 (100.0%) | 109 (100.0%) |
Household Vehicle Usage in Superior
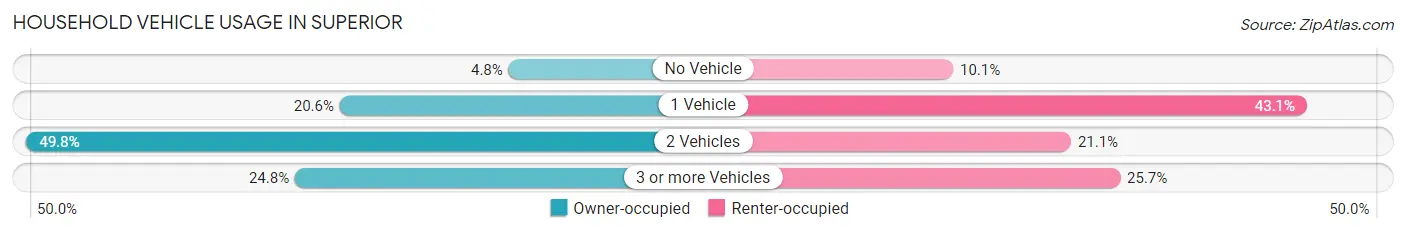
| Vehicles per Household | Owner-occupied | Renter-occupied |
| No Vehicle | 15 (4.8%) | 11 (10.1%) |
| 1 Vehicle | 64 (20.6%) | 47 (43.1%) |
| 2 Vehicles | 155 (49.8%) | 23 (21.1%) |
| 3 or more Vehicles | 77 (24.8%) | 28 (25.7%) |
| Total | 311 (100.0%) | 109 (100.0%) |
Real Estate & Mortgages in Superior
Real Estate and Mortgage Overview in Superior
| Characteristic | Without Mortgage | With Mortgage |
| Housing Units | 192 | 119 |
| Median Property Value | $155,400 | $271,700 |
| Median Household Income | $41,307 | $2 |
| Monthly Housing Costs | $343 | $0 |
| Real Estate Taxes | $1,114 | $4 |
Property Value by Mortgage Status in Superior
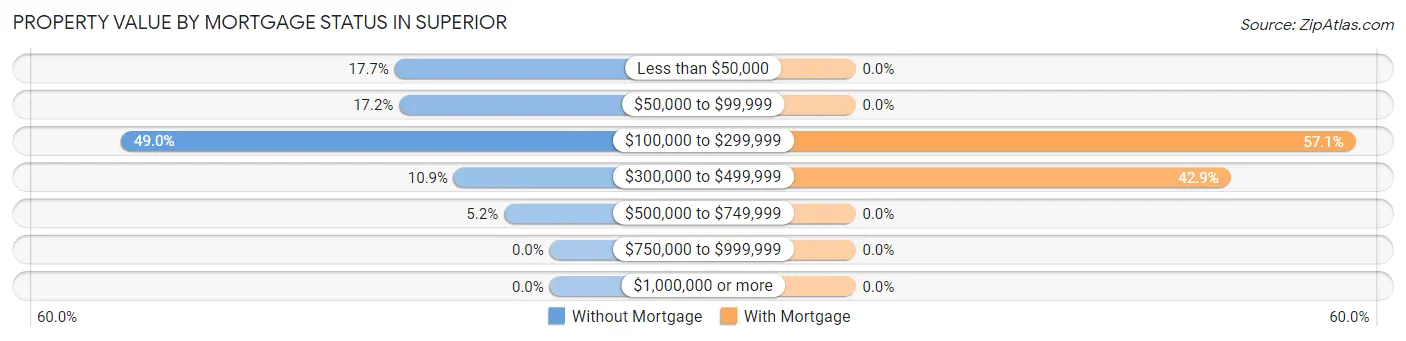
| Property Value | Without Mortgage | With Mortgage |
| Less than $50,000 | 34 (17.7%) | 0 (0.0%) |
| $50,000 to $99,999 | 33 (17.2%) | 0 (0.0%) |
| $100,000 to $299,999 | 94 (49.0%) | 68 (57.1%) |
| $300,000 to $499,999 | 21 (10.9%) | 51 (42.9%) |
| $500,000 to $749,999 | 10 (5.2%) | 0 (0.0%) |
| $750,000 to $999,999 | 0 (0.0%) | 0 (0.0%) |
| $1,000,000 or more | 0 (0.0%) | 0 (0.0%) |
| Total | 192 (100.0%) | 119 (100.0%) |
Household Income by Mortgage Status in Superior
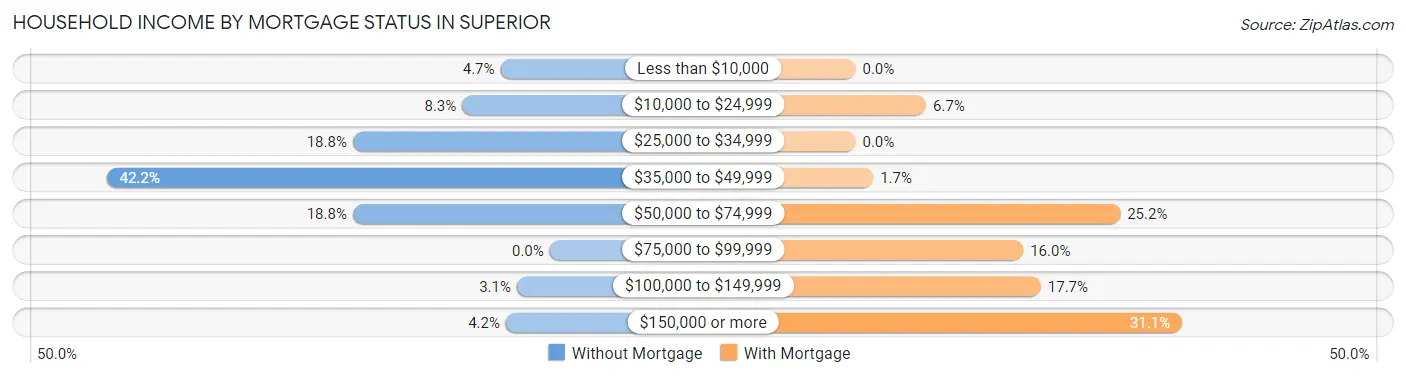
| Household Income | Without Mortgage | With Mortgage |
| Less than $10,000 | 9 (4.7%) | 0 (0.0%) |
| $10,000 to $24,999 | 16 (8.3%) | 8 (6.7%) |
| $25,000 to $34,999 | 36 (18.8%) | 0 (0.0%) |
| $35,000 to $49,999 | 81 (42.2%) | 2 (1.7%) |
| $50,000 to $74,999 | 36 (18.8%) | 30 (25.2%) |
| $75,000 to $99,999 | 0 (0.0%) | 19 (16.0%) |
| $100,000 to $149,999 | 6 (3.1%) | 21 (17.6%) |
| $150,000 or more | 8 (4.2%) | 37 (31.1%) |
| Total | 192 (100.0%) | 119 (100.0%) |
Property Value to Household Income Ratio in Superior
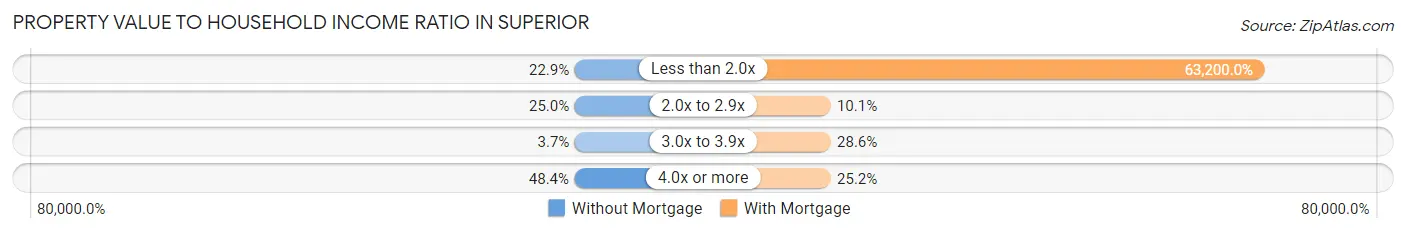
| Value-to-Income Ratio | Without Mortgage | With Mortgage |
| Less than 2.0x | 44 (22.9%) | 75,208 (63,200.0%) |
| 2.0x to 2.9x | 48 (25.0%) | 12 (10.1%) |
| 3.0x to 3.9x | 7 (3.6%) | 34 (28.6%) |
| 4.0x or more | 93 (48.4%) | 30 (25.2%) |
| Total | 192 (100.0%) | 119 (100.0%) |
Real Estate Taxes by Mortgage Status in Superior
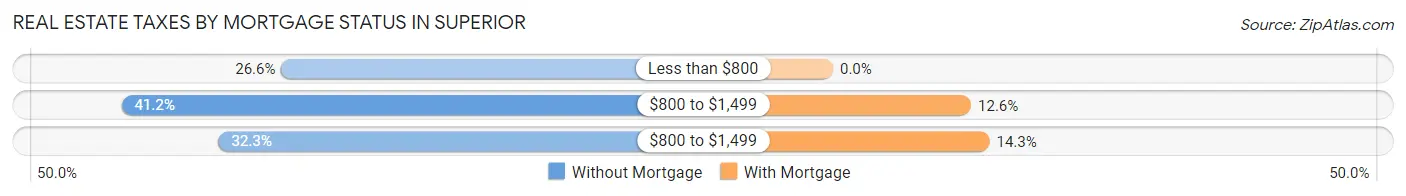
| Property Taxes | Without Mortgage | With Mortgage |
| Less than $800 | 51 (26.6%) | 0 (0.0%) |
| $800 to $1,499 | 79 (41.1%) | 15 (12.6%) |
| $800 to $1,499 | 62 (32.3%) | 17 (14.3%) |
| Total | 192 (100.0%) | 119 (100.0%) |
Health & Disability in Superior
Health Insurance Coverage by Age in Superior
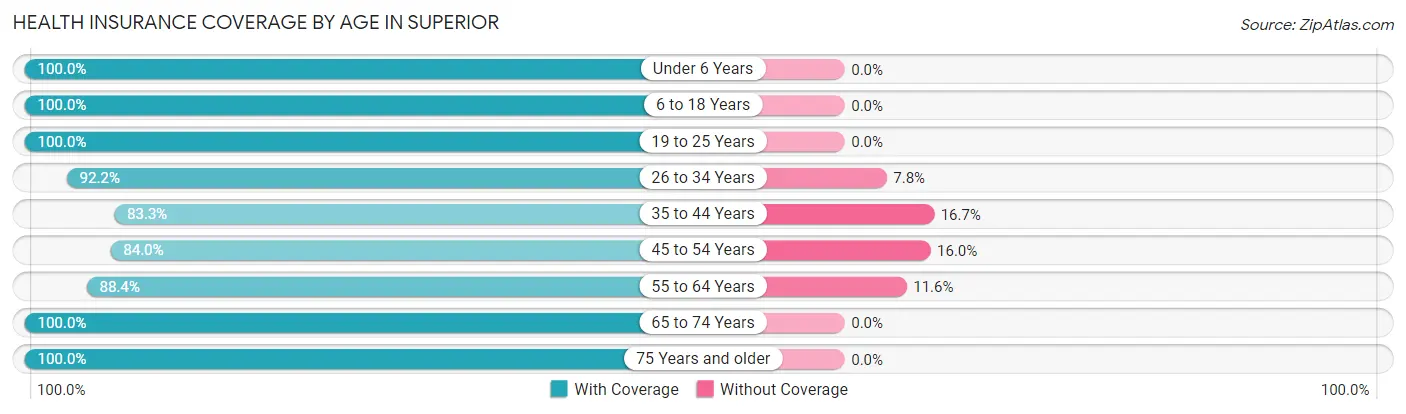
| Age Bracket | With Coverage | Without Coverage |
| Under 6 Years | 56 (100.0%) | 0 (0.0%) |
| 6 to 18 Years | 102 (100.0%) | 0 (0.0%) |
| 19 to 25 Years | 29 (100.0%) | 0 (0.0%) |
| 26 to 34 Years | 47 (92.2%) | 4 (7.8%) |
| 35 to 44 Years | 55 (83.3%) | 11 (16.7%) |
| 45 to 54 Years | 42 (84.0%) | 8 (16.0%) |
| 55 to 64 Years | 130 (88.4%) | 17 (11.6%) |
| 65 to 74 Years | 219 (100.0%) | 0 (0.0%) |
| 75 Years and older | 113 (100.0%) | 0 (0.0%) |
| Total | 793 (95.2%) | 40 (4.8%) |
Health Insurance Coverage by Citizenship Status in Superior
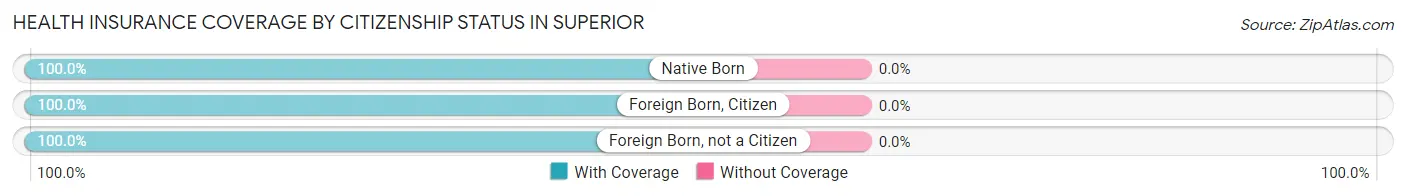
| Citizenship Status | With Coverage | Without Coverage |
| Native Born | 56 (100.0%) | 0 (0.0%) |
| Foreign Born, Citizen | 102 (100.0%) | 0 (0.0%) |
| Foreign Born, not a Citizen | 29 (100.0%) | 0 (0.0%) |
Health Insurance Coverage by Household Income in Superior
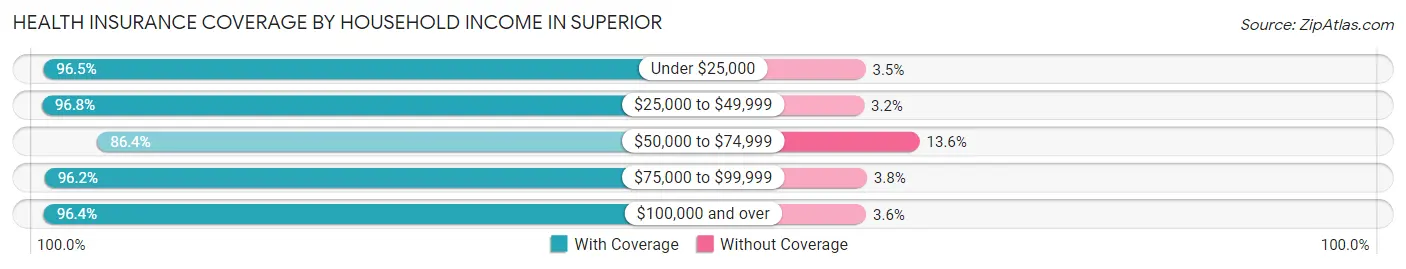
| Household Income | With Coverage | Without Coverage |
| Under $25,000 | 110 (96.5%) | 4 (3.5%) |
| $25,000 to $49,999 | 299 (96.8%) | 10 (3.2%) |
| $50,000 to $74,999 | 95 (86.4%) | 15 (13.6%) |
| $75,000 to $99,999 | 102 (96.2%) | 4 (3.8%) |
| $100,000 and over | 187 (96.4%) | 7 (3.6%) |
Public vs Private Health Insurance Coverage by Age in Superior
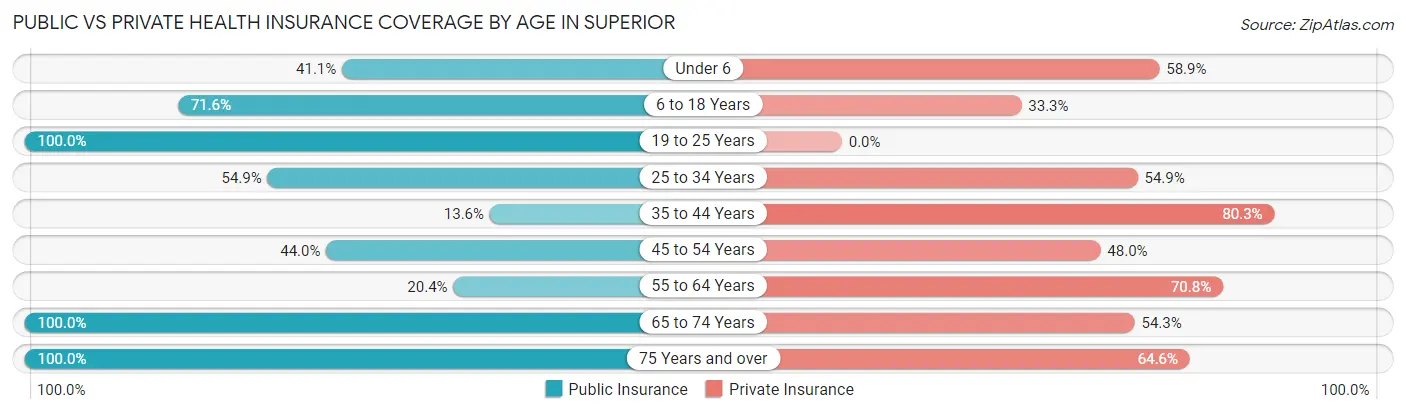
| Age Bracket | Public Insurance | Private Insurance |
| Under 6 | 23 (41.1%) | 33 (58.9%) |
| 6 to 18 Years | 73 (71.6%) | 34 (33.3%) |
| 19 to 25 Years | 29 (100.0%) | 0 (0.0%) |
| 25 to 34 Years | 28 (54.9%) | 28 (54.9%) |
| 35 to 44 Years | 9 (13.6%) | 53 (80.3%) |
| 45 to 54 Years | 22 (44.0%) | 24 (48.0%) |
| 55 to 64 Years | 30 (20.4%) | 104 (70.8%) |
| 65 to 74 Years | 219 (100.0%) | 119 (54.3%) |
| 75 Years and over | 113 (100.0%) | 73 (64.6%) |
| Total | 546 (65.5%) | 468 (56.2%) |
Disability Status by Sex by Age in Superior
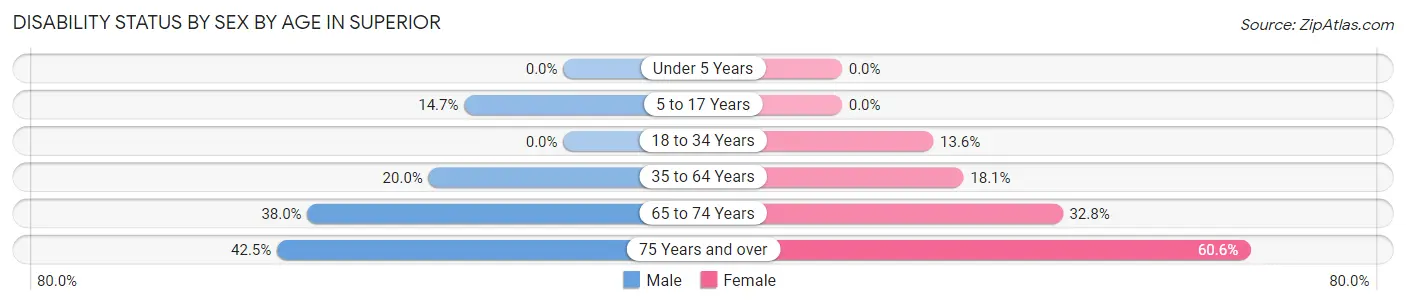
| Age Bracket | Male | Female |
| Under 5 Years | 0 (0.0%) | 0 (0.0%) |
| 5 to 17 Years | 5 (14.7%) | 0 (0.0%) |
| 18 to 34 Years | 0 (0.0%) | 8 (13.6%) |
| 35 to 64 Years | 26 (20.0%) | 24 (18.0%) |
| 65 to 74 Years | 38 (38.0%) | 39 (32.8%) |
| 75 Years and over | 34 (42.5%) | 20 (60.6%) |
Disability Class by Sex by Age in Superior
Disability Class: Hearing Difficulty
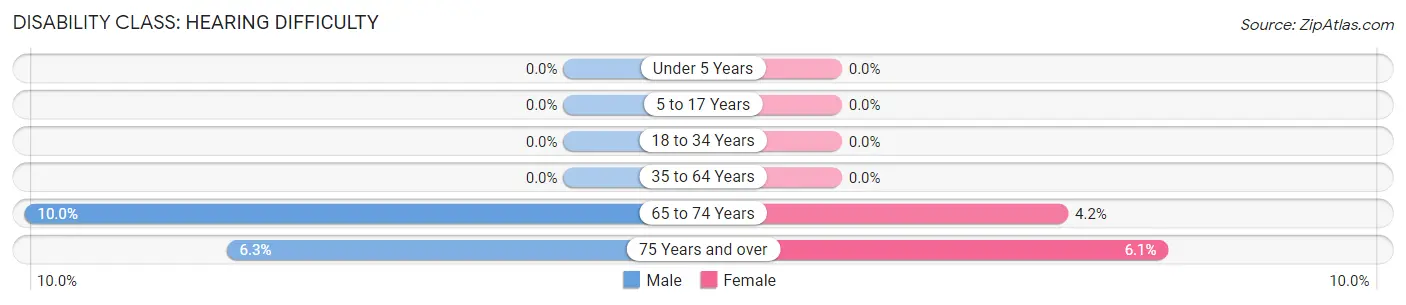
| Age Bracket | Male | Female |
| Under 5 Years | 0 (0.0%) | 0 (0.0%) |
| 5 to 17 Years | 0 (0.0%) | 0 (0.0%) |
| 18 to 34 Years | 0 (0.0%) | 0 (0.0%) |
| 35 to 64 Years | 0 (0.0%) | 0 (0.0%) |
| 65 to 74 Years | 10 (10.0%) | 5 (4.2%) |
| 75 Years and over | 5 (6.2%) | 2 (6.1%) |
Disability Class: Vision Difficulty
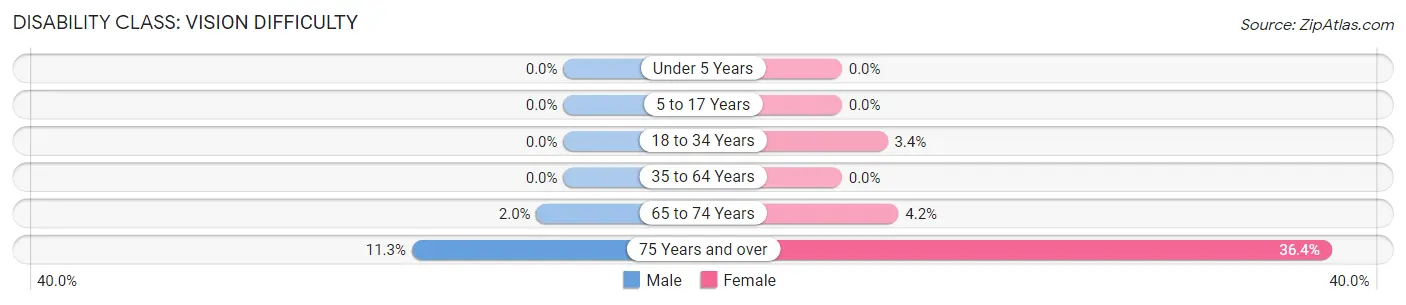
| Age Bracket | Male | Female |
| Under 5 Years | 0 (0.0%) | 0 (0.0%) |
| 5 to 17 Years | 0 (0.0%) | 0 (0.0%) |
| 18 to 34 Years | 0 (0.0%) | 2 (3.4%) |
| 35 to 64 Years | 0 (0.0%) | 0 (0.0%) |
| 65 to 74 Years | 2 (2.0%) | 5 (4.2%) |
| 75 Years and over | 9 (11.3%) | 12 (36.4%) |
Disability Class: Cognitive Difficulty
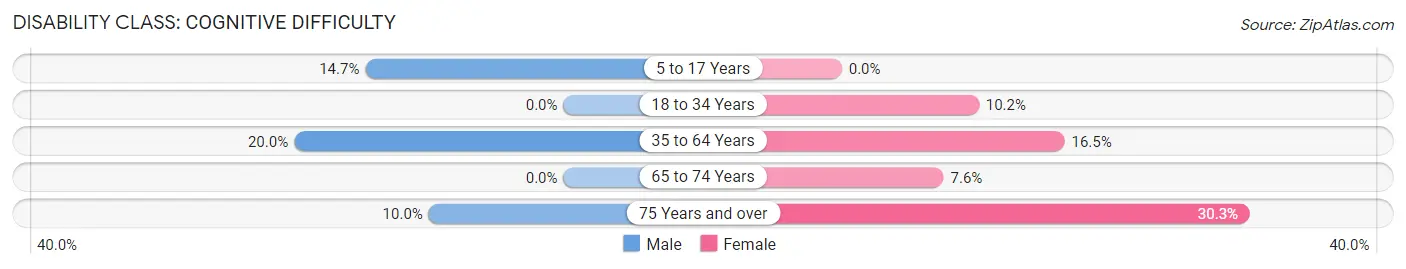
| Age Bracket | Male | Female |
| 5 to 17 Years | 5 (14.7%) | 0 (0.0%) |
| 18 to 34 Years | 0 (0.0%) | 6 (10.2%) |
| 35 to 64 Years | 26 (20.0%) | 22 (16.5%) |
| 65 to 74 Years | 0 (0.0%) | 9 (7.6%) |
| 75 Years and over | 8 (10.0%) | 10 (30.3%) |
Disability Class: Ambulatory Difficulty
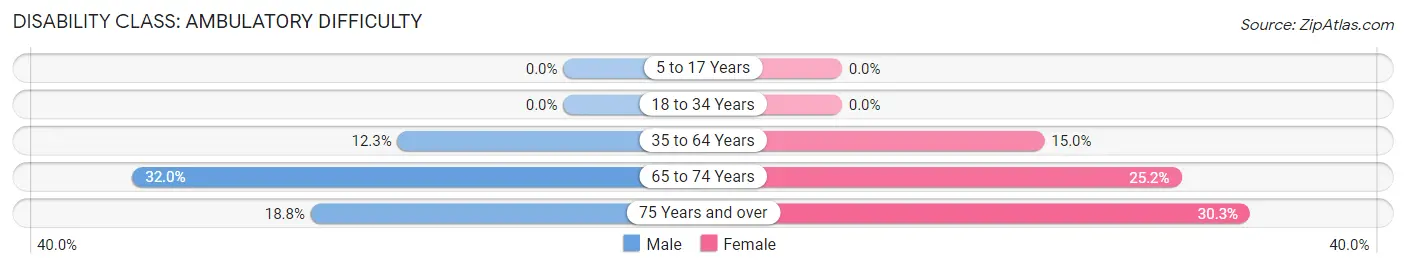
| Age Bracket | Male | Female |
| 5 to 17 Years | 0 (0.0%) | 0 (0.0%) |
| 18 to 34 Years | 0 (0.0%) | 0 (0.0%) |
| 35 to 64 Years | 16 (12.3%) | 20 (15.0%) |
| 65 to 74 Years | 32 (32.0%) | 30 (25.2%) |
| 75 Years and over | 15 (18.8%) | 10 (30.3%) |
Disability Class: Self-Care Difficulty
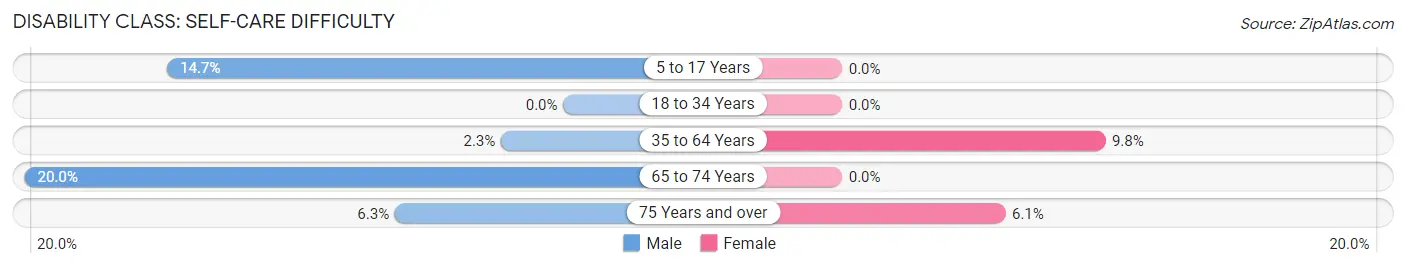
| Age Bracket | Male | Female |
| 5 to 17 Years | 5 (14.7%) | 0 (0.0%) |
| 18 to 34 Years | 0 (0.0%) | 0 (0.0%) |
| 35 to 64 Years | 3 (2.3%) | 13 (9.8%) |
| 65 to 74 Years | 20 (20.0%) | 0 (0.0%) |
| 75 Years and over | 5 (6.2%) | 2 (6.1%) |
Technology Access in Superior
Computing Device Access in Superior
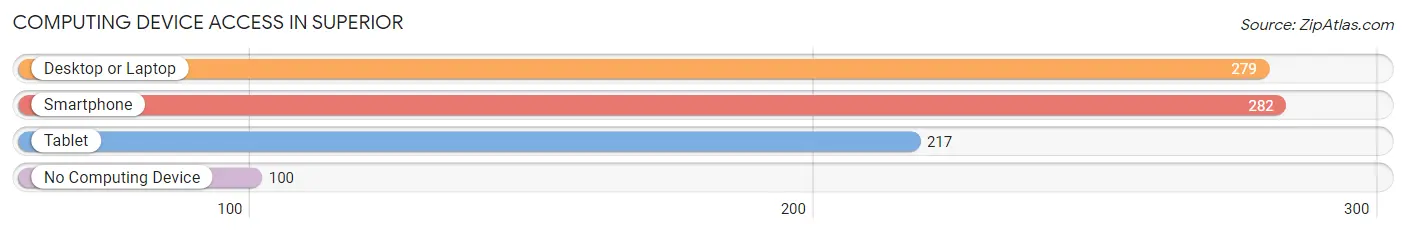
| Device Type | # Households | % Households |
| Desktop or Laptop | 279 | 66.4% |
| Smartphone | 282 | 67.1% |
| Tablet | 217 | 51.7% |
| No Computing Device | 100 | 23.8% |
| Total | 420 | 100.0% |
Internet Access in Superior
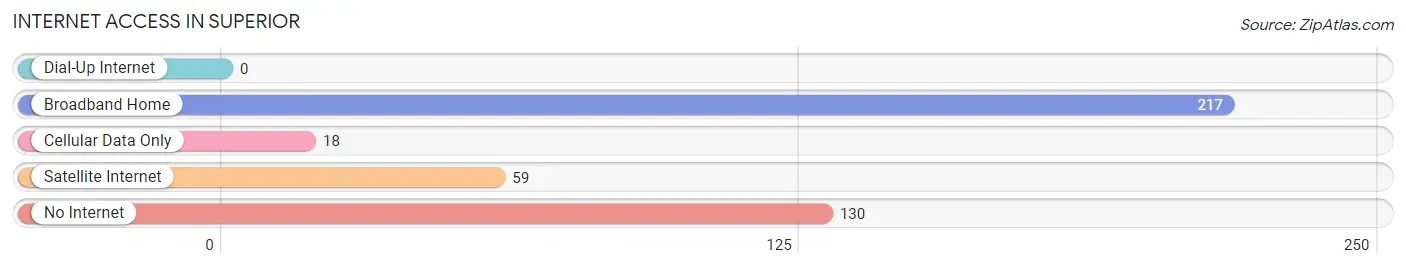
| Internet Type | # Households | % Households |
| Dial-Up Internet | 0 | 0.0% |
| Broadband Home | 217 | 51.7% |
| Cellular Data Only | 18 | 4.3% |
| Satellite Internet | 59 | 14.1% |
| No Internet | 130 | 30.9% |
| Total | 420 | 100.0% |
Superior Summary
History
Superior, Montana is a small town located in Mineral County, Montana. It is situated on the Clark Fork River, near the Idaho border. The town was founded in 1891 by the Superior Townsite Company, which was formed by a group of investors from Butte, Montana. The town was named after the nearby Superior Mine, which was discovered in 1887.
The town quickly grew, and by 1900, it had a population of over 1,000 people. The town was home to a variety of businesses, including a hotel, a bank, a newspaper, a sawmill, and a brewery. The town also had a school, a post office, and a variety of churches.
The town was a major hub for the mining industry in the area, and it was home to several large mines, including the Superior Mine, the Iron Mountain Mine, and the Montana Mine. The town was also home to a number of smelters, which processed ore from the nearby mines.
The town experienced a period of decline in the early 20th century, as the mining industry in the area began to decline. The population of the town dropped to just over 500 people by 1950.
Geography
Superior is located in Mineral County, Montana, near the Idaho border. The town is situated on the Clark Fork River, and is surrounded by the Cabinet Mountains and the Bitterroot Mountains. The town is located at an elevation of 3,400 feet, and has a total area of 1.2 square miles.
The climate in Superior is semi-arid, with hot summers and cold winters. The average annual temperature is 44 degrees Fahrenheit, and the average annual precipitation is 16 inches.
Economy
The economy of Superior is largely based on tourism and agriculture. The town is home to a number of tourist attractions, including the Superior Mine, the Iron Mountain Mine, and the Montana Mine. The town is also home to a number of small businesses, including restaurants, shops, and lodging.
The town is also home to a number of agricultural operations, including cattle ranches, hay farms, and vegetable farms. The town is also home to a number of logging operations, which harvest timber from the surrounding forests.
Demographics
As of the 2010 census, the population of Superior was 1,072. The racial makeup of the town was 95.3% White, 0.7% Native American, 0.3% Asian, 0.1% African American, and 3.6% from other races. The median household income in the town was $35,000, and the median family income was $41,000. The per capita income in the town was $17,000.
Common Questions
What is Per Capita Income in Superior?
Per Capita income in Superior is $25,957.
What is the Median Family Income in Superior?
Median Family Income in Superior is $62,917.
What is the Median Household income in Superior?
Median Household Income in Superior is $42,632.
What is Income or Wage Gap in Superior?
Income or Wage Gap in Superior is 26.0%.
Women in Superior earn 74.0 cents for every dollar earned by a man.
What is Family Income Deficit in Superior?
Family Income Deficit in Superior is $2,300.
Families that are below poverty line in Superior earn $2,300 less on average than the poverty threshold level.
What is Inequality or Gini Index in Superior?
Inequality or Gini Index in Superior is 0.36.
What is the Total Population of Superior?
Total Population of Superior is 872.
What is the Total Male Population of Superior?
Total Male Population of Superior is 413.
What is the Total Female Population of Superior?
Total Female Population of Superior is 459.
What is the Ratio of Males per 100 Females in Superior?
There are 89.98 Males per 100 Females in Superior.
What is the Ratio of Females per 100 Males in Superior?
There are 111.14 Females per 100 Males in Superior.
What is the Median Population Age in Superior?
Median Population Age in Superior is 60.7 Years.
What is the Average Family Size in Superior
Average Family Size in Superior is 2.6 People.
What is the Average Household Size in Superior
Average Household Size in Superior is 2.0 People.
How Large is the Labor Force in Superior?
There are 307 People in the Labor Forcein in Superior.
What is the Percentage of People in the Labor Force in Superior?
41.3% of People are in the Labor Force in Superior.
What is the Unemployment Rate in Superior?
Unemployment Rate in Superior is 6.5%.