Jordan, MT Map & Demographics
Jordan Map
Jordan Overview
$32,528
PER CAPITA INCOME
$88,750
AVG FAMILY INCOME
$44,250
AVG HOUSEHOLD INCOME
44.9%
WAGE / INCOME GAP [ % ]
55.1¢/ $1
WAGE / INCOME GAP [ $ ]
0.42
INEQUALITY / GINI INDEX
327
TOTAL POPULATION
154
MALE POPULATION
173
FEMALE POPULATION
89.02
MALES / 100 FEMALES
112.34
FEMALES / 100 MALES
47.1
MEDIAN AGE
2.9
AVG FAMILY SIZE
2.0
AVG HOUSEHOLD SIZE
184
LABOR FORCE [ PEOPLE ]
67.9%
PERCENT IN LABOR FORCE
Jordan Zip Codes
Jordan Area Codes
Income in Jordan
Income Overview in Jordan
Per Capita Income in Jordan is $32,528, while median incomes of families and households are $88,750 and $44,250 respectively.
| Characteristic | Number | Measure |
| Per Capita Income | 327 | $32,528 |
| Median Family Income | 80 | $88,750 |
| Mean Family Income | 80 | $90,398 |
| Median Household Income | 157 | $44,250 |
| Mean Household Income | 157 | $67,036 |
| Income Deficit | 80 | $0 |
| Wage / Income Gap (%) | 327 | 44.94% |
| Wage / Income Gap ($) | 327 | 55.06¢ per $1 |
| Gini / Inequality Index | 327 | 0.42 |
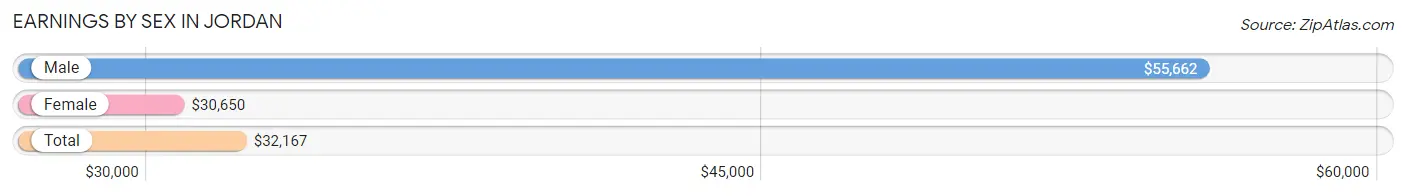
Earnings by Sex in Jordan
Average Earnings in Jordan are $32,167, $55,662 for men and $30,650 for women, a difference of 44.9%.
| Sex | Number | Average Earnings |
| Male | 83 (43.7%) | $55,662 |
| Female | 107 (56.3%) | $30,650 |
| Total | 190 (100.0%) | $32,167 |
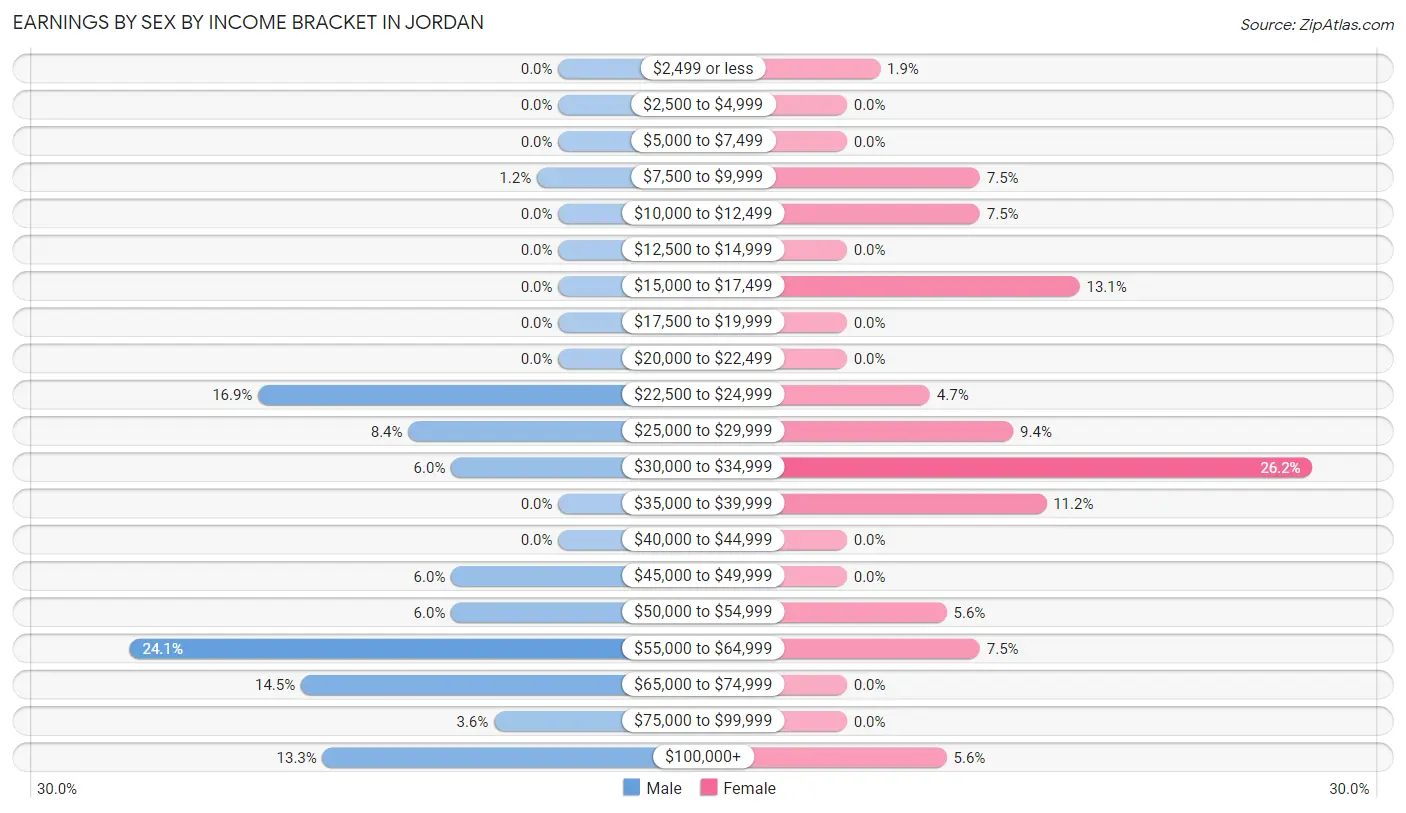
Earnings by Sex by Income Bracket in Jordan
The most common earnings brackets in Jordan are $55,000 to $64,999 for men (20 | 24.1%) and $30,000 to $34,999 for women (28 | 26.2%).
| Income | Male | Female |
| $2,499 or less | 0 (0.0%) | 2 (1.9%) |
| $2,500 to $4,999 | 0 (0.0%) | 0 (0.0%) |
| $5,000 to $7,499 | 0 (0.0%) | 0 (0.0%) |
| $7,500 to $9,999 | 1 (1.2%) | 8 (7.5%) |
| $10,000 to $12,499 | 0 (0.0%) | 8 (7.5%) |
| $12,500 to $14,999 | 0 (0.0%) | 0 (0.0%) |
| $15,000 to $17,499 | 0 (0.0%) | 14 (13.1%) |
| $17,500 to $19,999 | 0 (0.0%) | 0 (0.0%) |
| $20,000 to $22,499 | 0 (0.0%) | 0 (0.0%) |
| $22,500 to $24,999 | 14 (16.9%) | 5 (4.7%) |
| $25,000 to $29,999 | 7 (8.4%) | 10 (9.3%) |
| $30,000 to $34,999 | 5 (6.0%) | 28 (26.2%) |
| $35,000 to $39,999 | 0 (0.0%) | 12 (11.2%) |
| $40,000 to $44,999 | 0 (0.0%) | 0 (0.0%) |
| $45,000 to $49,999 | 5 (6.0%) | 0 (0.0%) |
| $50,000 to $54,999 | 5 (6.0%) | 6 (5.6%) |
| $55,000 to $64,999 | 20 (24.1%) | 8 (7.5%) |
| $65,000 to $74,999 | 12 (14.5%) | 0 (0.0%) |
| $75,000 to $99,999 | 3 (3.6%) | 0 (0.0%) |
| $100,000+ | 11 (13.3%) | 6 (5.6%) |
| Total | 83 (100.0%) | 107 (100.0%) |
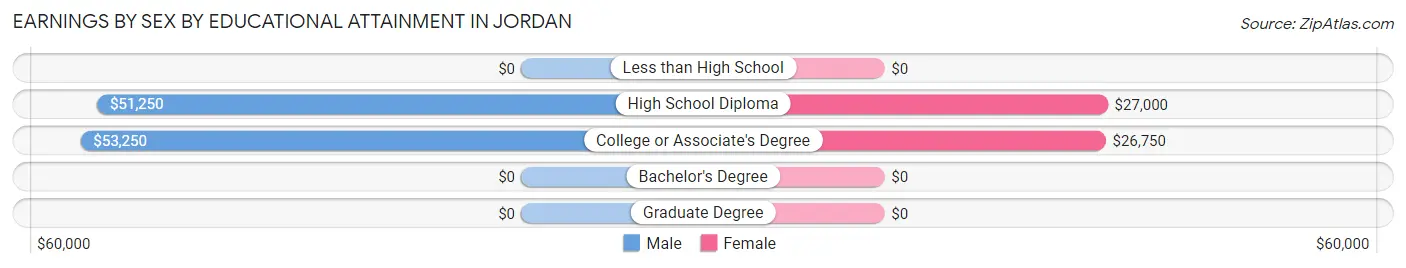
Earnings by Sex by Educational Attainment in Jordan
Average earnings in Jordan are $55,147 for men and $31,591 for women, a difference of 42.7%. Men with an educational attainment of college or associate's degree enjoy the highest average annual earnings of $53,250, while those with high school diploma education earn the least with $51,250. Women with an educational attainment of high school diploma earn the most with the average annual earnings of $27,000, while those with college or associate's degree education have the smallest earnings of $26,750.
| Educational Attainment | Male Income | Female Income |
| Less than High School | - | - |
| High School Diploma | $51,250 | $27,000 |
| College or Associate's Degree | $53,250 | $26,750 |
| Bachelor's Degree | - | - |
| Graduate Degree | - | - |
| Total | $55,147 | $31,591 |
Family Income in Jordan
Family Income Brackets in Jordan
According to the Jordan family income data, there are 22 families falling into the $100,000 to $149,999 income range, which is the most common income bracket and makes up 27.5% of all families.
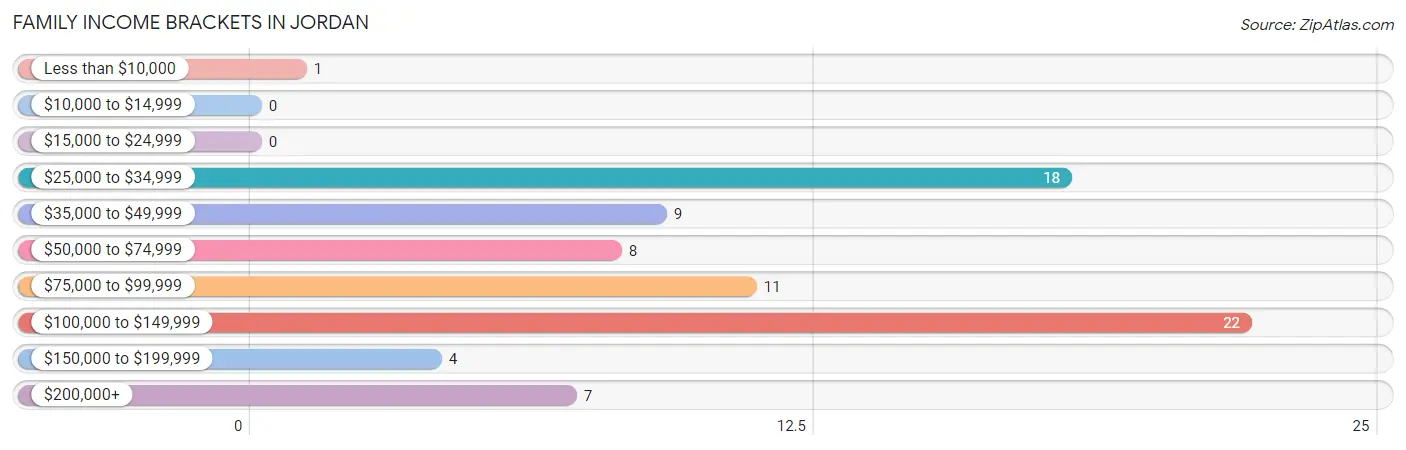
| Income Bracket | # Families | % Families |
| Less than $10,000 | 1 | 1.3% |
| $10,000 to $14,999 | 0 | 0.0% |
| $15,000 to $24,999 | 0 | 0.0% |
| $25,000 to $34,999 | 18 | 22.5% |
| $35,000 to $49,999 | 9 | 11.3% |
| $50,000 to $74,999 | 8 | 10.0% |
| $75,000 to $99,999 | 11 | 13.8% |
| $100,000 to $149,999 | 22 | 27.5% |
| $150,000 to $199,999 | 4 | 5.0% |
| $200,000+ | 7 | 8.8% |
Family Income by Famaliy Size in Jordan
3-person families (12 | 15.0%) account for the highest median family income in Jordan with $75,000 per family, while 3-person families (12 | 15.0%) have the highest median income of $25,000 per family member.
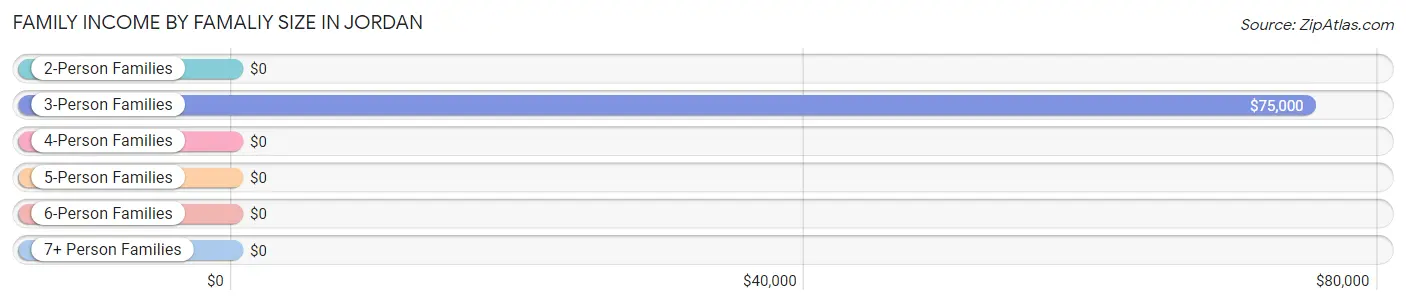
| Income Bracket | # Families | Median Income |
| 2-Person Families | 55 (68.8%) | $0 |
| 3-Person Families | 12 (15.0%) | $75,000 |
| 4-Person Families | 2 (2.5%) | $0 |
| 5-Person Families | 6 (7.5%) | $0 |
| 6-Person Families | 0 (0.0%) | $0 |
| 7+ Person Families | 5 (6.2%) | $0 |
| Total | 80 (100.0%) | $88,750 |
Family Income by Number of Earners in Jordan
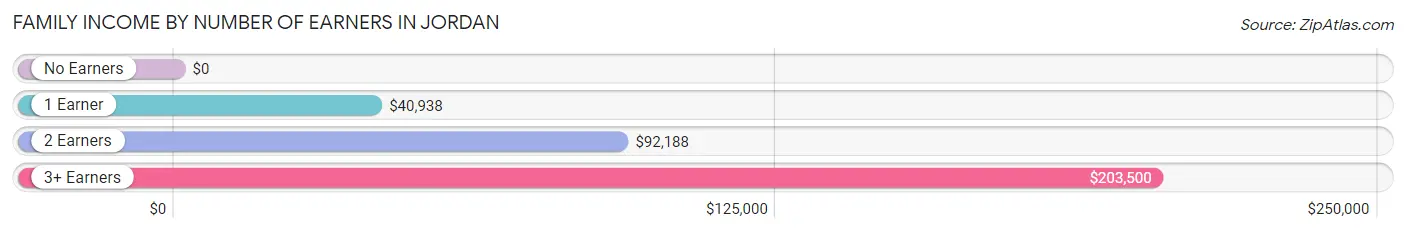
| Number of Earners | # Families | Median Income |
| No Earners | 22 (27.5%) | $0 |
| 1 Earner | 17 (21.2%) | $40,938 |
| 2 Earners | 31 (38.8%) | $92,188 |
| 3+ Earners | 10 (12.5%) | $203,500 |
| Total | 80 (100.0%) | $88,750 |
Household Income in Jordan
Household Income Brackets in Jordan
With 30 households falling in the category, the $25,000 to $34,999 income range is the most frequent in Jordan, accounting for 19.1% of all households. In contrast, only 1 households (0.6%) fall into the less than $10,000 income bracket, making it the least populous group.
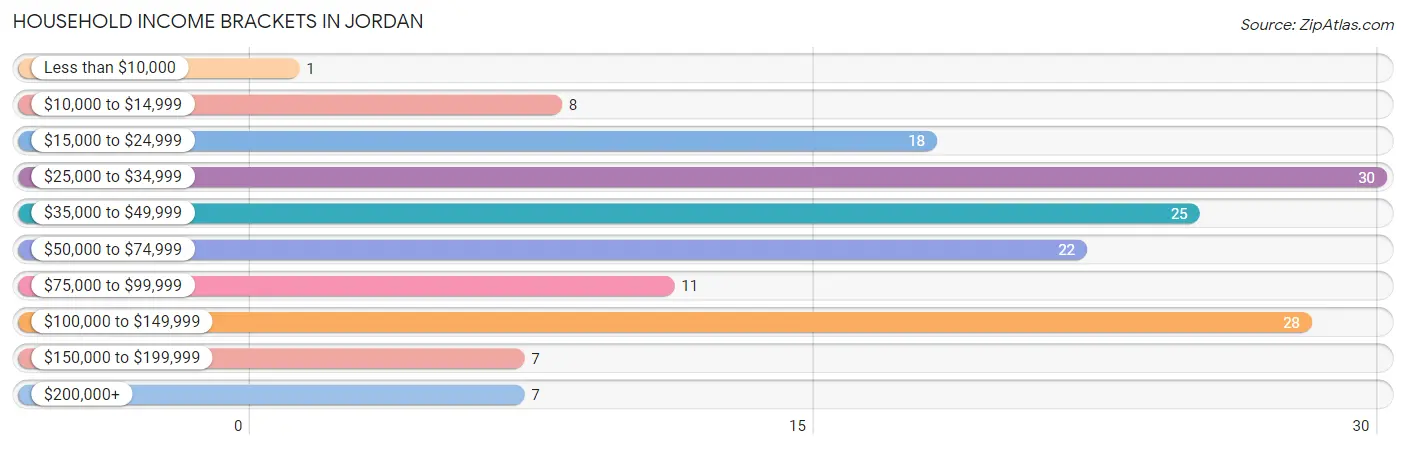
| Income Bracket | # Households | % Households |
| Less than $10,000 | 1 | 0.6% |
| $10,000 to $14,999 | 8 | 5.1% |
| $15,000 to $24,999 | 18 | 11.5% |
| $25,000 to $34,999 | 30 | 19.1% |
| $35,000 to $49,999 | 25 | 15.9% |
| $50,000 to $74,999 | 22 | 14.0% |
| $75,000 to $99,999 | 11 | 7.0% |
| $100,000 to $149,999 | 28 | 17.8% |
| $150,000 to $199,999 | 7 | 4.5% |
| $200,000+ | 7 | 4.5% |
Household Income by Householder Age in Jordan
The median household income in Jordan is $44,250, with the highest median household income of $54,167 found in the 45 to 64 years age bracket for the primary householder. A total of 30 households (19.1%) fall into this category. Meanwhile, the 15 to 24 years age bracket for the primary householder has the lowest median household income of $0, with 15 households (9.6%) in this group.
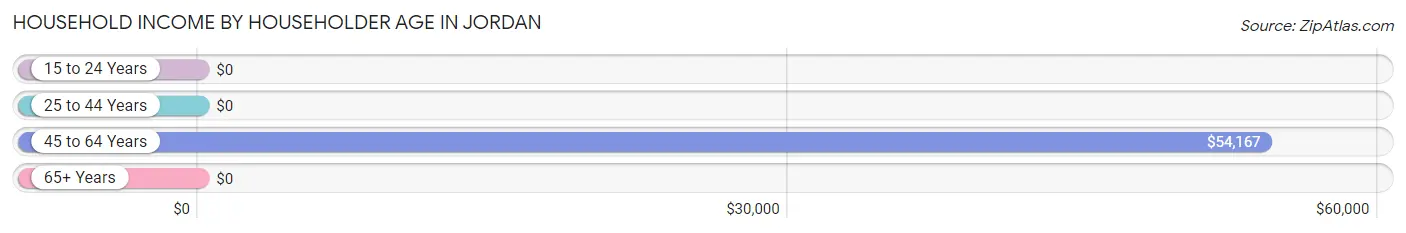
| Income Bracket | # Households | Median Income |
| 15 to 24 Years | 15 (9.6%) | $0 |
| 25 to 44 Years | 46 (29.3%) | $0 |
| 45 to 64 Years | 30 (19.1%) | $54,167 |
| 65+ Years | 66 (42.0%) | $0 |
| Total | 157 (100.0%) | $44,250 |
Poverty in Jordan
Income Below Poverty by Sex and Age in Jordan
With 0.7% poverty level for males and 5.4% for females among the residents of Jordan, 65 to 74 year old males and 18 to 24 year old females are the most vulnerable to poverty, with 1 males (5.0%) and 8 females (27.6%) in their respective age groups living below the poverty level.
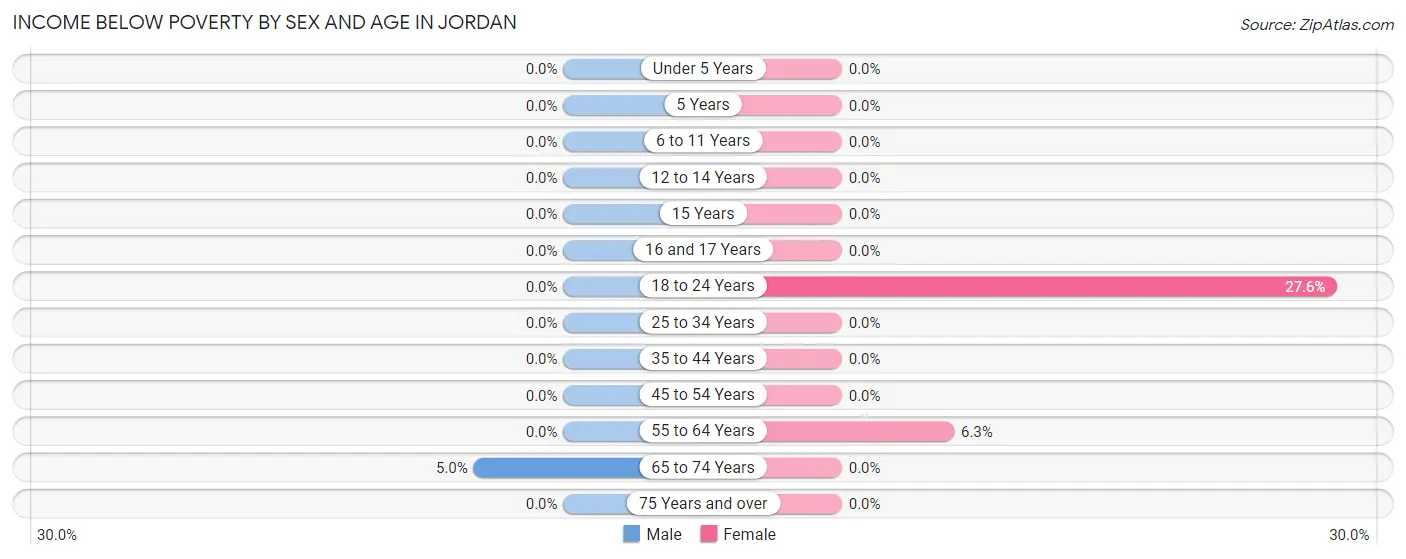
| Age Bracket | Male | Female |
| Under 5 Years | 0 (0.0%) | 0 (0.0%) |
| 5 Years | 0 (0.0%) | 0 (0.0%) |
| 6 to 11 Years | 0 (0.0%) | 0 (0.0%) |
| 12 to 14 Years | 0 (0.0%) | 0 (0.0%) |
| 15 Years | 0 (0.0%) | 0 (0.0%) |
| 16 and 17 Years | 0 (0.0%) | 0 (0.0%) |
| 18 to 24 Years | 0 (0.0%) | 8 (27.6%) |
| 25 to 34 Years | 0 (0.0%) | 0 (0.0%) |
| 35 to 44 Years | 0 (0.0%) | 0 (0.0%) |
| 45 to 54 Years | 0 (0.0%) | 0 (0.0%) |
| 55 to 64 Years | 0 (0.0%) | 1 (6.2%) |
| 65 to 74 Years | 1 (5.0%) | 0 (0.0%) |
| 75 Years and over | 0 (0.0%) | 0 (0.0%) |
| Total | 1 (0.7%) | 9 (5.4%) |
Income Above Poverty by Sex and Age in Jordan
According to the poverty statistics in Jordan, males aged under 5 years and females aged under 5 years are the age groups that are most secure financially, with 100.0% of males and 100.0% of females in these age groups living above the poverty line.
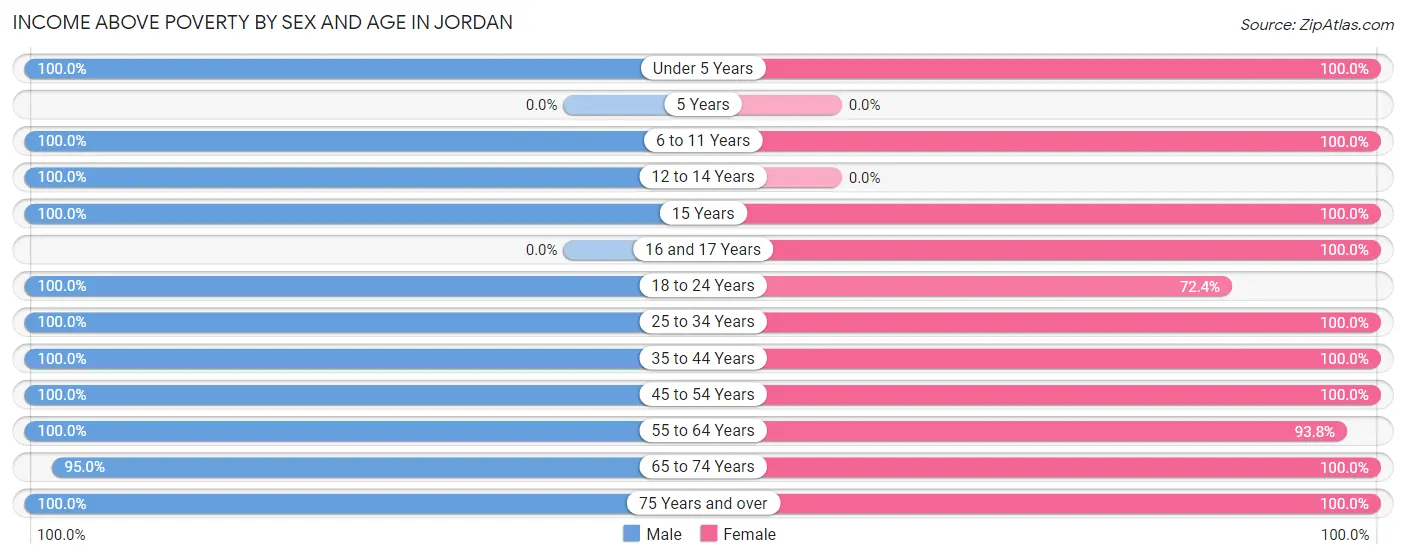
| Age Bracket | Male | Female |
| Under 5 Years | 8 (100.0%) | 1 (100.0%) |
| 5 Years | 0 (0.0%) | 0 (0.0%) |
| 6 to 11 Years | 24 (100.0%) | 13 (100.0%) |
| 12 to 14 Years | 1 (100.0%) | 0 (0.0%) |
| 15 Years | 8 (100.0%) | 1 (100.0%) |
| 16 and 17 Years | 0 (0.0%) | 1 (100.0%) |
| 18 to 24 Years | 7 (100.0%) | 21 (72.4%) |
| 25 to 34 Years | 17 (100.0%) | 14 (100.0%) |
| 35 to 44 Years | 12 (100.0%) | 25 (100.0%) |
| 45 to 54 Years | 18 (100.0%) | 17 (100.0%) |
| 55 to 64 Years | 12 (100.0%) | 15 (93.8%) |
| 65 to 74 Years | 19 (95.0%) | 11 (100.0%) |
| 75 Years and over | 23 (100.0%) | 39 (100.0%) |
| Total | 149 (99.3%) | 158 (94.6%) |
Income Below Poverty Among Married-Couple Families in Jordan
The poverty statistics for married-couple families in Jordan show that 1.5% or 1 of the total 67 families live below the poverty line. Families with no children have the highest poverty rate of 1.9%, comprising of 1 families. On the other hand, families with 1 or 2 children have the lowest poverty rate of 0.0%, which includes 0 families.
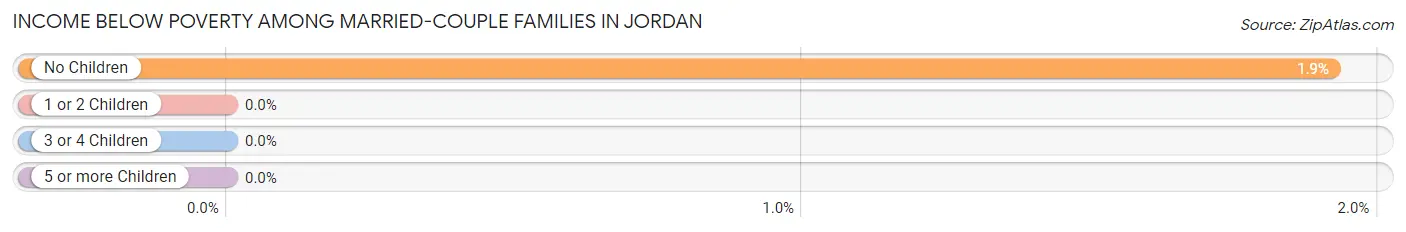
| Children | Above Poverty | Below Poverty |
| No Children | 51 (98.1%) | 1 (1.9%) |
| 1 or 2 Children | 7 (100.0%) | 0 (0.0%) |
| 3 or 4 Children | 8 (100.0%) | 0 (0.0%) |
| 5 or more Children | 0 (0.0%) | 0 (0.0%) |
| Total | 66 (98.5%) | 1 (1.5%) |
Income Below Poverty Among Single-Parent Households in Jordan
| Children | Single Father | Single Mother |
| No Children | 0 (0.0%) | 0 (0.0%) |
| 1 or 2 Children | 0 (0.0%) | 0 (0.0%) |
| 3 or 4 Children | 0 (0.0%) | 0 (0.0%) |
| 5 or more Children | 0 (0.0%) | 0 (0.0%) |
| Total | 0 (0.0%) | 0 (0.0%) |
Income Below Poverty Among Married-Couple vs Single-Parent Households in Jordan
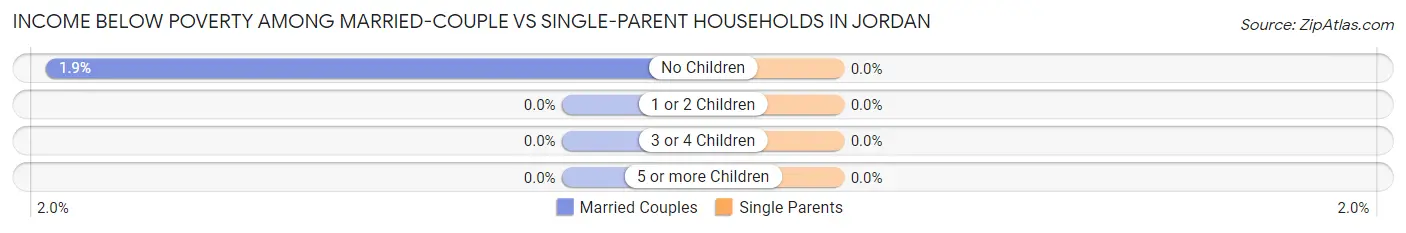
| Children | Married-Couple Families | Single-Parent Households |
| No Children | 1 (1.9%) | 0 (0.0%) |
| 1 or 2 Children | 0 (0.0%) | 0 (0.0%) |
| 3 or 4 Children | 0 (0.0%) | 0 (0.0%) |
| 5 or more Children | 0 (0.0%) | 0 (0.0%) |
| Total | 1 (1.5%) | 0 (0.0%) |
Race in Jordan
The most populous races in Jordan are White / Caucasian (313 | 95.7%), Black / African American (11 | 3.4%), and Native / Alaskan (3 | 0.9%).
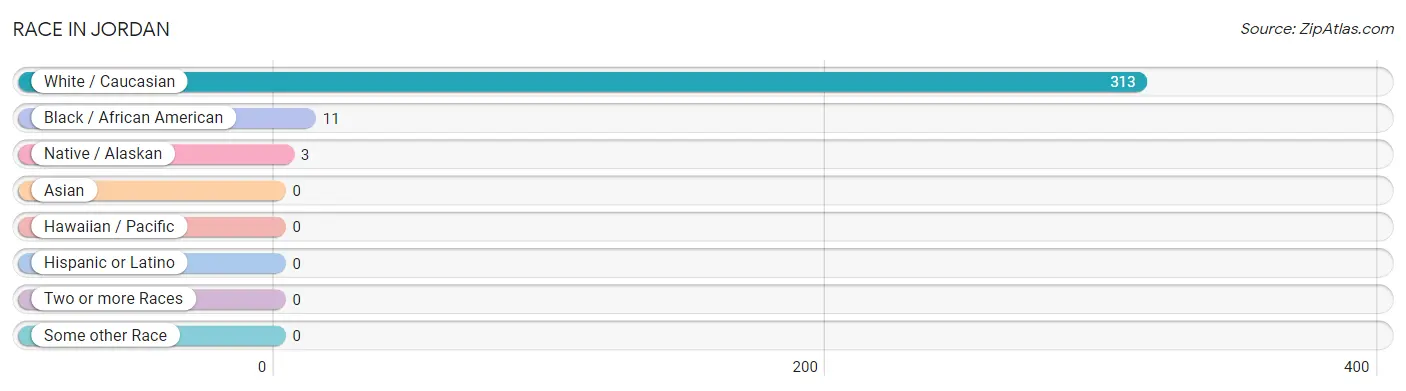
| Race | # Population | % Population |
| Asian | 0 | 0.0% |
| Black / African American | 11 | 3.4% |
| Hawaiian / Pacific | 0 | 0.0% |
| Hispanic or Latino | 0 | 0.0% |
| Native / Alaskan | 3 | 0.9% |
| White / Caucasian | 313 | 95.7% |
| Two or more Races | 0 | 0.0% |
| Some other Race | 0 | 0.0% |
| Total | 327 | 100.0% |
Ancestry in Jordan
The most populous ancestries reported in Jordan are American (163 | 49.8%), English (28 | 8.6%), Norwegian (26 | 8.0%), German (20 | 6.1%), and Irish (16 | 4.9%), together accounting for 77.4% of all Jordan residents.
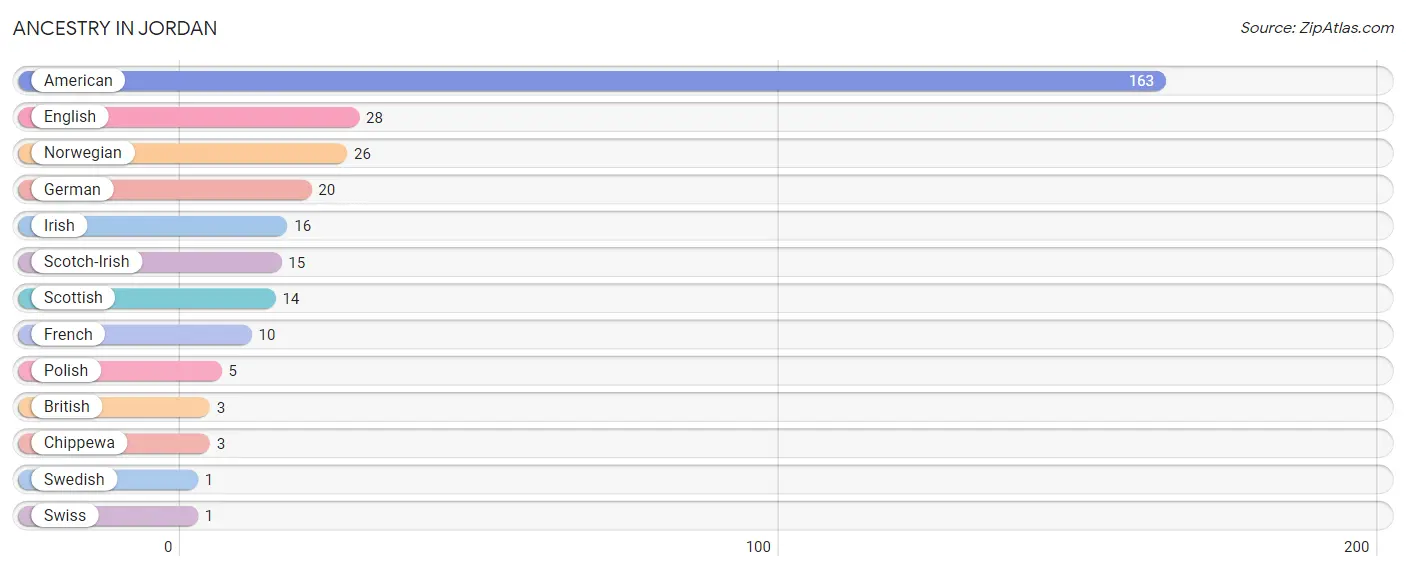
| Ancestry | # Population | % Population |
| American | 163 | 49.8% |
| British | 3 | 0.9% |
| Chippewa | 3 | 0.9% |
| English | 28 | 8.6% |
| French | 10 | 3.1% |
| German | 20 | 6.1% |
| Irish | 16 | 4.9% |
| Norwegian | 26 | 8.0% |
| Polish | 5 | 1.5% |
| Scotch-Irish | 15 | 4.6% |
| Scottish | 14 | 4.3% |
| Swedish | 1 | 0.3% |
| Swiss | 1 | 0.3% | View All 13 Rows |
Immigrants in Jordan

| Immigration Origin | # Population | % Population | View All 0 Rows |
Sex and Age in Jordan
Sex and Age in Jordan
The most populous age groups in Jordan are 5 to 9 Years (22 | 14.3%) for men and 75 to 79 Years (25 | 14.4%) for women.
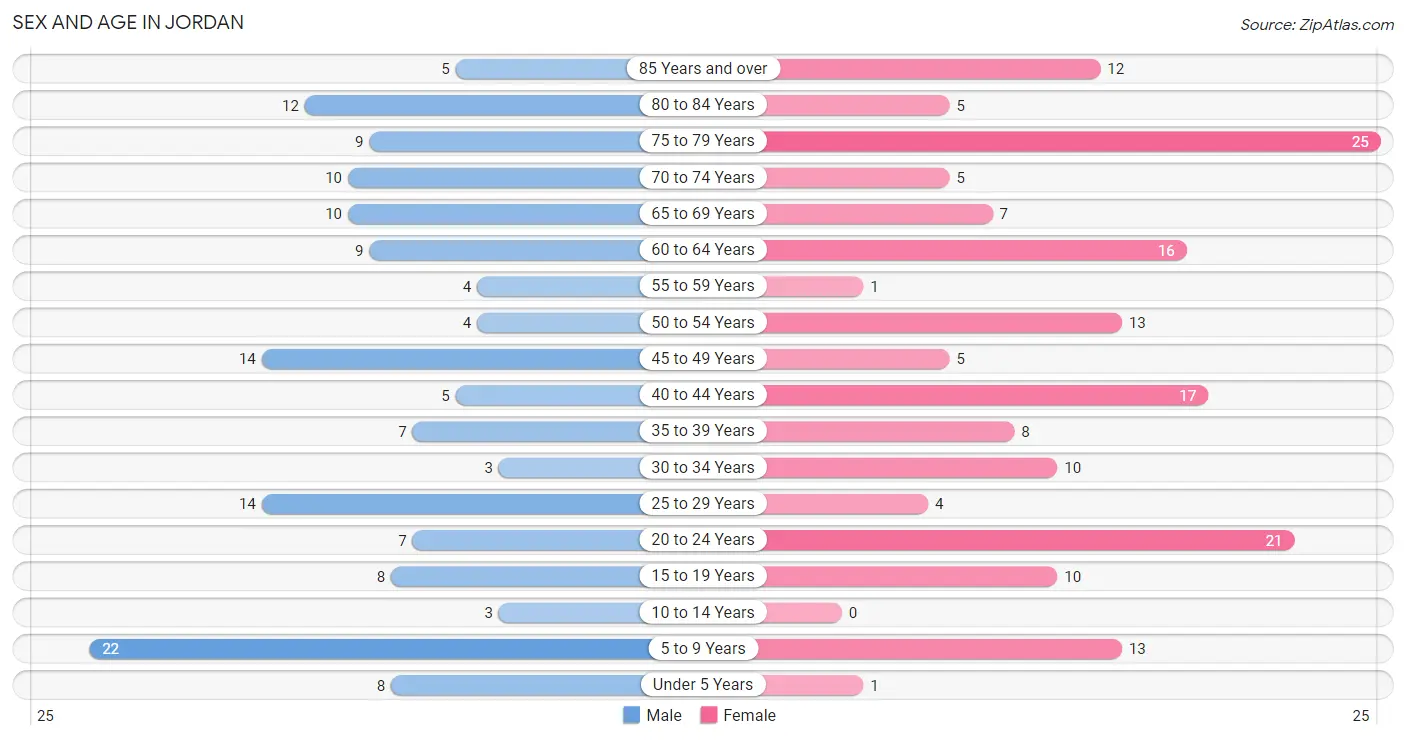
| Age Bracket | Male | Female |
| Under 5 Years | 8 (5.2%) | 1 (0.6%) |
| 5 to 9 Years | 22 (14.3%) | 13 (7.5%) |
| 10 to 14 Years | 3 (1.9%) | 0 (0.0%) |
| 15 to 19 Years | 8 (5.2%) | 10 (5.8%) |
| 20 to 24 Years | 7 (4.5%) | 21 (12.1%) |
| 25 to 29 Years | 14 (9.1%) | 4 (2.3%) |
| 30 to 34 Years | 3 (1.9%) | 10 (5.8%) |
| 35 to 39 Years | 7 (4.5%) | 8 (4.6%) |
| 40 to 44 Years | 5 (3.3%) | 17 (9.8%) |
| 45 to 49 Years | 14 (9.1%) | 5 (2.9%) |
| 50 to 54 Years | 4 (2.6%) | 13 (7.5%) |
| 55 to 59 Years | 4 (2.6%) | 1 (0.6%) |
| 60 to 64 Years | 9 (5.8%) | 16 (9.2%) |
| 65 to 69 Years | 10 (6.5%) | 7 (4.1%) |
| 70 to 74 Years | 10 (6.5%) | 5 (2.9%) |
| 75 to 79 Years | 9 (5.8%) | 25 (14.4%) |
| 80 to 84 Years | 12 (7.8%) | 5 (2.9%) |
| 85 Years and over | 5 (3.3%) | 12 (6.9%) |
| Total | 154 (100.0%) | 173 (100.0%) |
Families and Households in Jordan
Median Family Size in Jordan
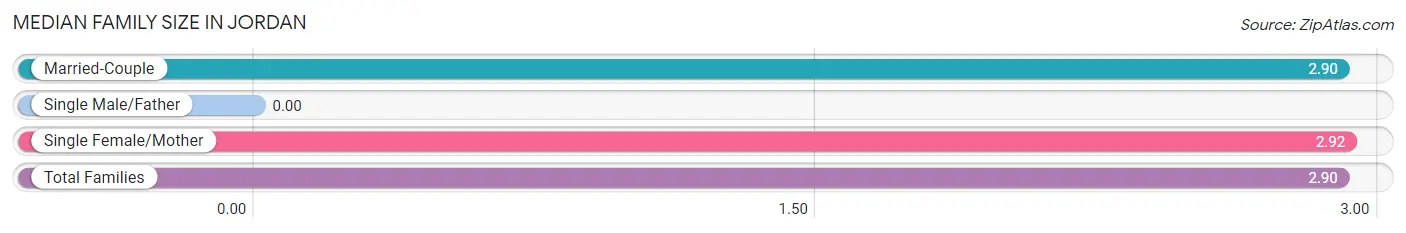
| Family Type | # Families | Family Size |
| Married-Couple | 67 (83.8%) | 2.90 |
| Single Male/Father | 0 (0.0%) | - |
| Single Female/Mother | 13 (16.3%) | 2.92 |
| Total Families | 80 (100.0%) | 2.90 |
Median Household Size in Jordan
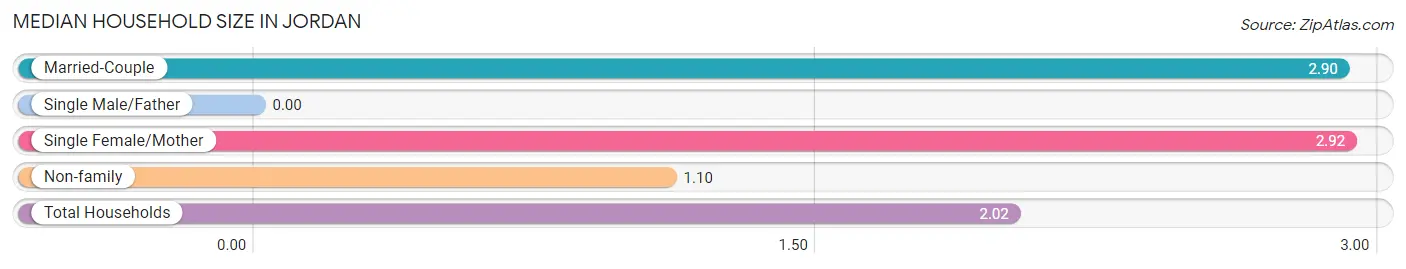
| Household Type | # Households | Household Size |
| Married-Couple | 67 (42.7%) | 2.90 |
| Single Male/Father | 0 (0.0%) | - |
| Single Female/Mother | 13 (8.3%) | 2.92 |
| Non-family | 77 (49.0%) | 1.10 |
| Total Households | 157 (100.0%) | 2.02 |
Household Size by Marriage Status in Jordan
Out of a total of 157 households in Jordan, 80 (51.0%) are family households, while 77 (49.0%) are nonfamily households. The most numerous type of family households are 2-person households, comprising 55, and the most common type of nonfamily households are 1-person households, comprising 63.
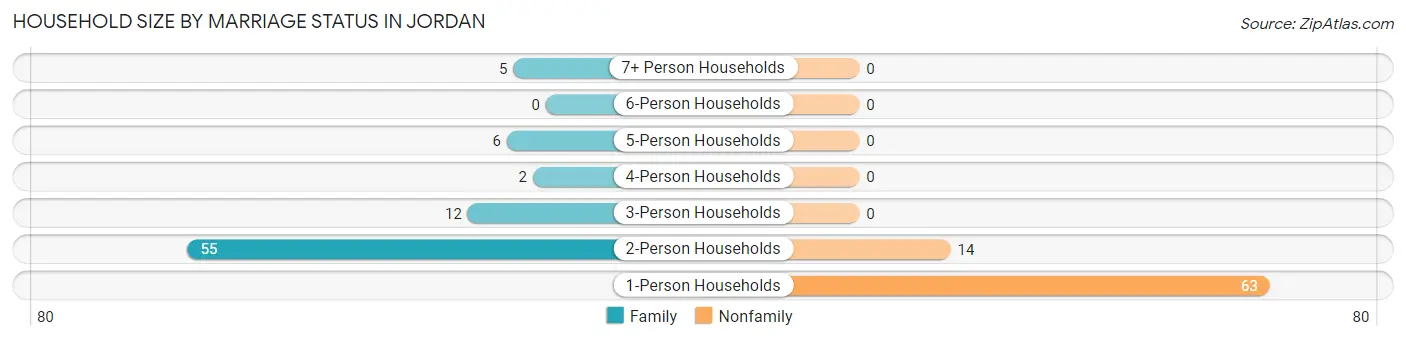
| Household Size | Family Households | Nonfamily Households |
| 1-Person Households | - | 63 (40.1%) |
| 2-Person Households | 55 (35.0%) | 14 (8.9%) |
| 3-Person Households | 12 (7.6%) | 0 (0.0%) |
| 4-Person Households | 2 (1.3%) | 0 (0.0%) |
| 5-Person Households | 6 (3.8%) | 0 (0.0%) |
| 6-Person Households | 0 (0.0%) | 0 (0.0%) |
| 7+ Person Households | 5 (3.2%) | 0 (0.0%) |
| Total | 80 (51.0%) | 77 (49.0%) |
Female Fertility in Jordan
Fertility by Age in Jordan
| Age Bracket | Women with Births | Births / 1,000 Women |
| 15 to 19 years | 0 (0.0%) | 0.0 |
| 20 to 34 years | 0 (0.0%) | 0.0 |
| 35 to 50 years | 0 (0.0%) | 0.0 |
| Total | 0 (0.0%) | 0.0 |
Fertility by Age by Marriage Status in Jordan
| Age Bracket | Married | Unmarried |
| 15 to 19 years | 0 (0.0%) | 0 (0.0%) |
| 20 to 34 years | 0 (0.0%) | 0 (0.0%) |
| 35 to 50 years | 0 (0.0%) | 0 (0.0%) |
| Total | 0 (0.0%) | 0 (0.0%) |
Fertility by Education in Jordan
| Educational Attainment | Women with Births | Births / 1,000 Women |
| Less than High School | 0 (0.0%) | 0.0 |
| High School Diploma | 0 (0.0%) | 0.0 |
| College or Associate's Degree | 0 (0.0%) | 0.0 |
| Bachelor's Degree | 0 (0.0%) | 0.0 |
| Graduate Degree | 0 (0.0%) | 0.0 |
| Total | 0 (0.0%) | 0.0 |
Fertility by Education by Marriage Status in Jordan
| Educational Attainment | Married | Unmarried |
| Less than High School | 0 (0.0%) | 0 (0.0%) |
| High School Diploma | 0 (0.0%) | 0 (0.0%) |
| College or Associate's Degree | 0 (0.0%) | 0 (0.0%) |
| Bachelor's Degree | 0 (0.0%) | 0 (0.0%) |
| Graduate Degree | 0 (0.0%) | 0 (0.0%) |
| Total | 0 (0.0%) | 0 (0.0%) |
Employment Characteristics in Jordan
Employment by Class of Employer in Jordan
Among the 184 employed individuals in Jordan, private company employees (86 | 46.7%), local government employees (46 | 25.0%), and self-employed (incorporated) (25 | 13.6%) make up the most common classes of employment.
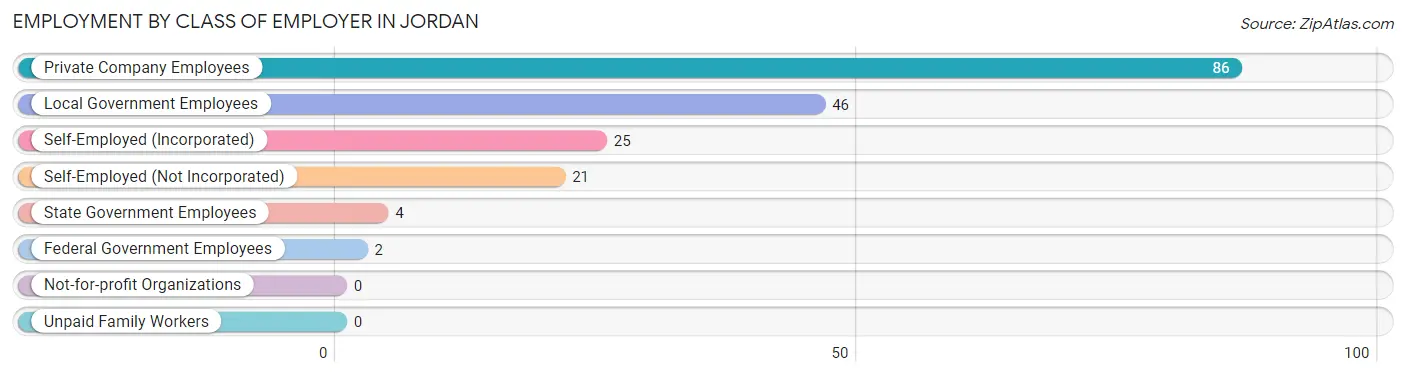
| Employer Class | # Employees | % Employees |
| Private Company Employees | 86 | 46.7% |
| Self-Employed (Incorporated) | 25 | 13.6% |
| Self-Employed (Not Incorporated) | 21 | 11.4% |
| Not-for-profit Organizations | 0 | 0.0% |
| Local Government Employees | 46 | 25.0% |
| State Government Employees | 4 | 2.2% |
| Federal Government Employees | 2 | 1.1% |
| Unpaid Family Workers | 0 | 0.0% |
| Total | 184 | 100.0% |
Employment Status by Age in Jordan
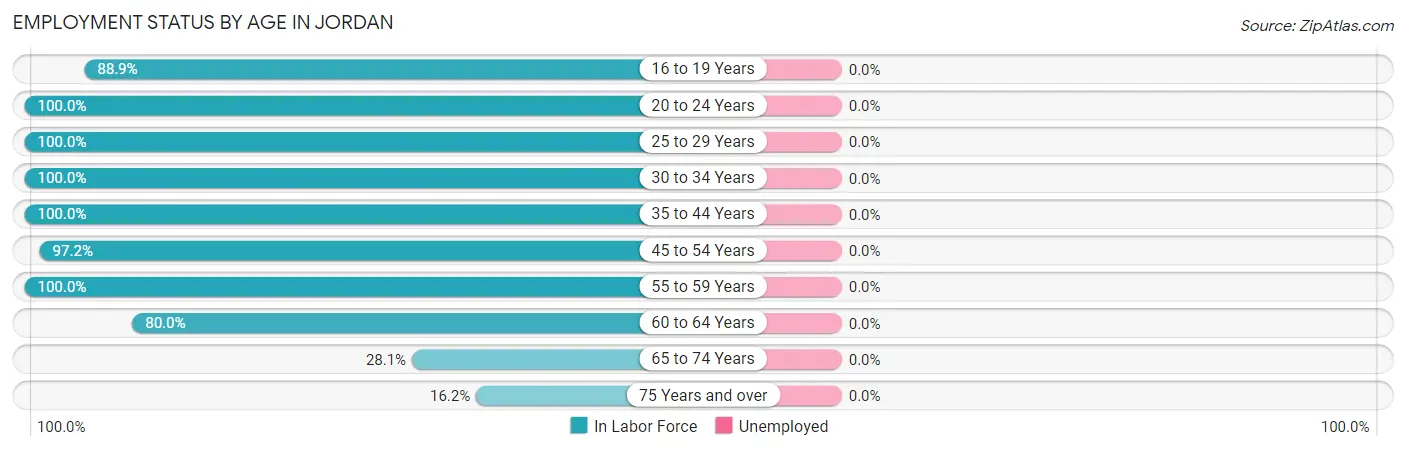
| Age Bracket | In Labor Force | Unemployed |
| 16 to 19 Years | 8 (88.9%) | 0 (0.0%) |
| 20 to 24 Years | 28 (100.0%) | 0 (0.0%) |
| 25 to 29 Years | 18 (100.0%) | 0 (0.0%) |
| 30 to 34 Years | 13 (100.0%) | 0 (0.0%) |
| 35 to 44 Years | 37 (100.0%) | 0 (0.0%) |
| 45 to 54 Years | 35 (97.2%) | 0 (0.0%) |
| 55 to 59 Years | 5 (100.0%) | 0 (0.0%) |
| 60 to 64 Years | 20 (80.0%) | 0 (0.0%) |
| 65 to 74 Years | 9 (28.1%) | 0 (0.0%) |
| 75 Years and over | 11 (16.2%) | 0 (0.0%) |
| Total | 184 (67.9%) | 0 (0.0%) |
Employment Status by Educational Attainment in Jordan
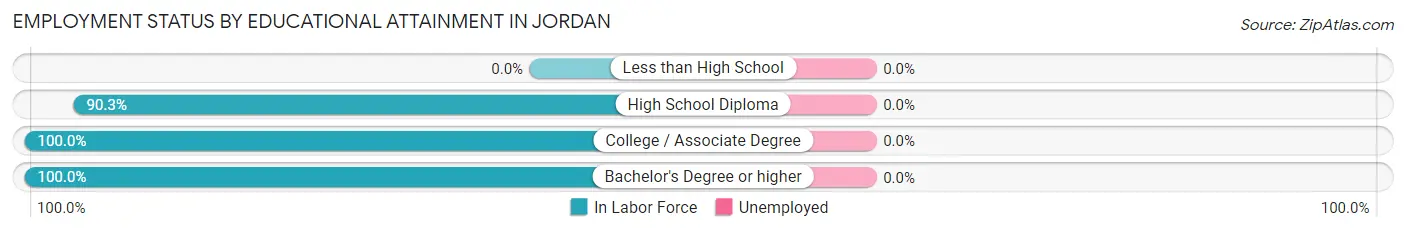
| Educational Attainment | In Labor Force | Unemployed |
| Less than High School | 0 (0.0%) | 0 (0.0%) |
| High School Diploma | 56 (90.3%) | 0 (0.0%) |
| College / Associate Degree | 49 (100.0%) | 0 (0.0%) |
| Bachelor's Degree or higher | 23 (100.0%) | 0 (0.0%) |
| Total | 128 (95.5%) | 0 (0.0%) |
Employment Occupations by Sex in Jordan
Management, Business, Science and Arts Occupations
The most common Management, Business, Science and Arts occupations in Jordan are Management (27 | 14.7%), Community & Social Service (22 | 12.0%), Education Instruction & Library (22 | 12.0%), Health Diagnosing & Treating (11 | 6.0%), and Health Technologists (11 | 6.0%).
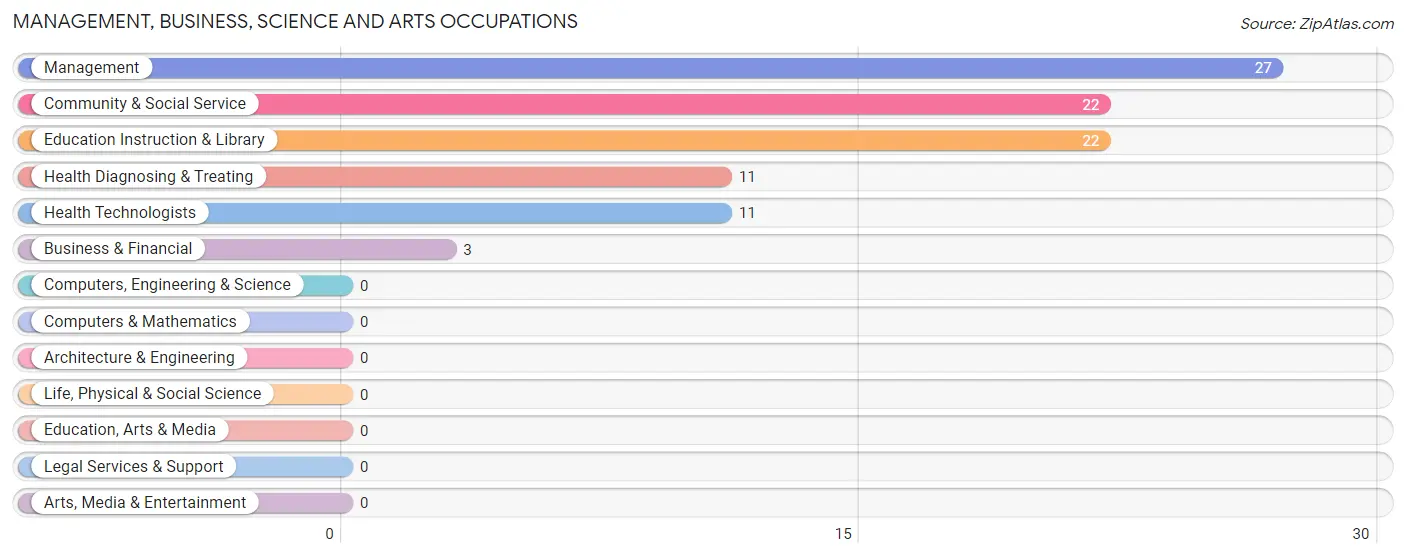
Management, Business, Science and Arts Occupations by Sex
Within the Management, Business, Science and Arts occupations in Jordan, the most male-oriented occupations are Business & Financial (100.0%), Management (55.6%), and Health Diagnosing & Treating (45.5%), while the most female-oriented occupations are Community & Social Service (100.0%), Education Instruction & Library (100.0%), and Health Diagnosing & Treating (54.5%).
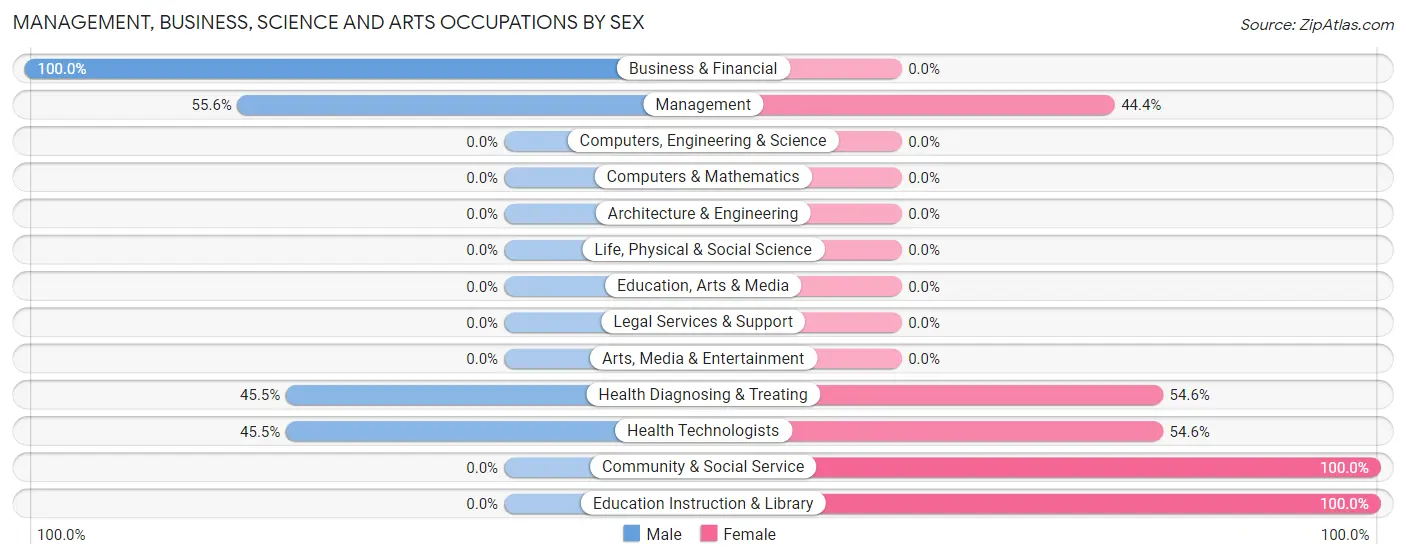
| Occupation | Male | Female |
| Management | 15 (55.6%) | 12 (44.4%) |
| Business & Financial | 3 (100.0%) | 0 (0.0%) |
| Computers, Engineering & Science | 0 (0.0%) | 0 (0.0%) |
| Computers & Mathematics | 0 (0.0%) | 0 (0.0%) |
| Architecture & Engineering | 0 (0.0%) | 0 (0.0%) |
| Life, Physical & Social Science | 0 (0.0%) | 0 (0.0%) |
| Community & Social Service | 0 (0.0%) | 22 (100.0%) |
| Education, Arts & Media | 0 (0.0%) | 0 (0.0%) |
| Legal Services & Support | 0 (0.0%) | 0 (0.0%) |
| Education Instruction & Library | 0 (0.0%) | 22 (100.0%) |
| Arts, Media & Entertainment | 0 (0.0%) | 0 (0.0%) |
| Health Diagnosing & Treating | 5 (45.5%) | 6 (54.5%) |
| Health Technologists | 5 (45.5%) | 6 (54.5%) |
| Total (Category) | 23 (36.5%) | 40 (63.5%) |
| Total (Overall) | 77 (41.8%) | 107 (58.2%) |
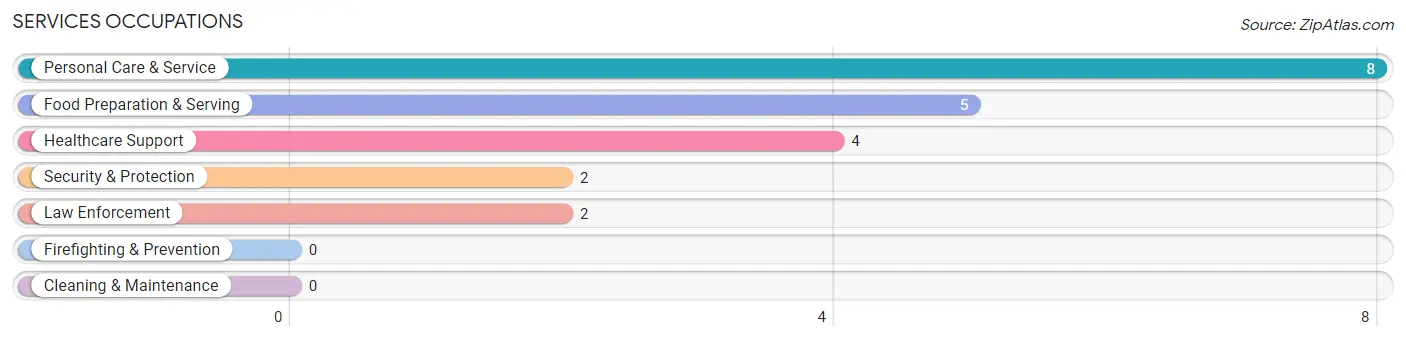
Services Occupations
The most common Services occupations in Jordan are Personal Care & Service (8 | 4.3%), Food Preparation & Serving (5 | 2.7%), Healthcare Support (4 | 2.2%), Security & Protection (2 | 1.1%), and Law Enforcement (2 | 1.1%).
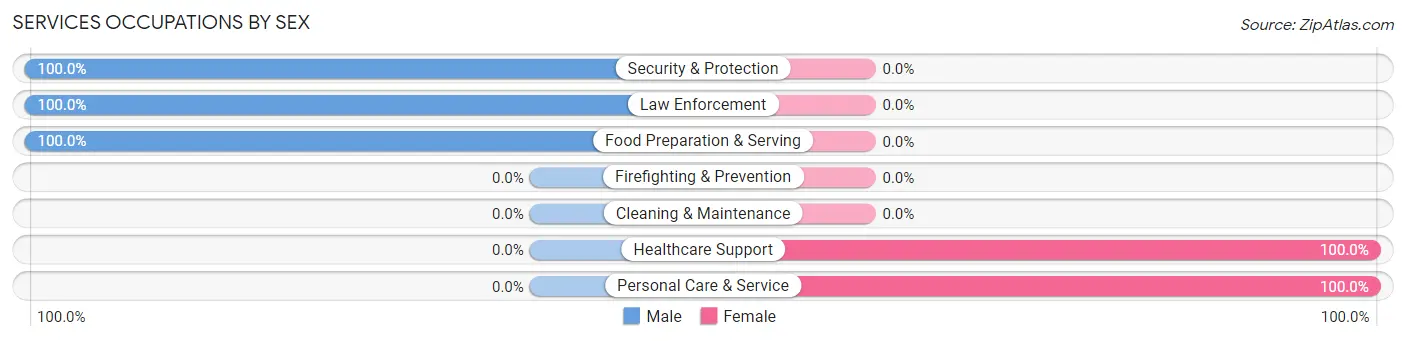
Services Occupations by Sex
Within the Services occupations in Jordan, the most male-oriented occupations are Security & Protection (100.0%), Law Enforcement (100.0%), and Food Preparation & Serving (100.0%), while the most female-oriented occupations are Healthcare Support (100.0%), and Personal Care & Service (100.0%).
| Occupation | Male | Female |
| Healthcare Support | 0 (0.0%) | 4 (100.0%) |
| Security & Protection | 2 (100.0%) | 0 (0.0%) |
| Firefighting & Prevention | 0 (0.0%) | 0 (0.0%) |
| Law Enforcement | 2 (100.0%) | 0 (0.0%) |
| Food Preparation & Serving | 5 (100.0%) | 0 (0.0%) |
| Cleaning & Maintenance | 0 (0.0%) | 0 (0.0%) |
| Personal Care & Service | 0 (0.0%) | 8 (100.0%) |
| Total (Category) | 7 (36.8%) | 12 (63.2%) |
| Total (Overall) | 77 (41.8%) | 107 (58.2%) |
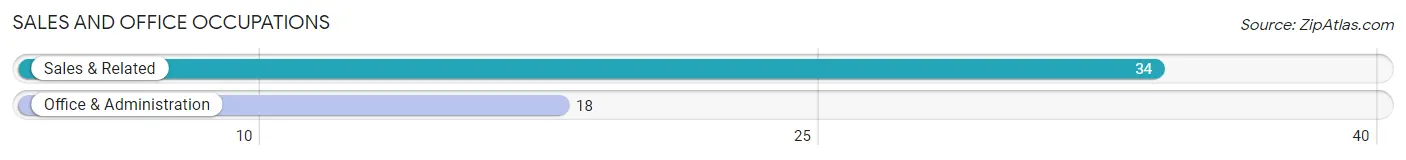
Sales and Office Occupations
The most common Sales and Office occupations in Jordan are Sales & Related (34 | 18.5%), and Office & Administration (18 | 9.8%).
Sales and Office Occupations by Sex
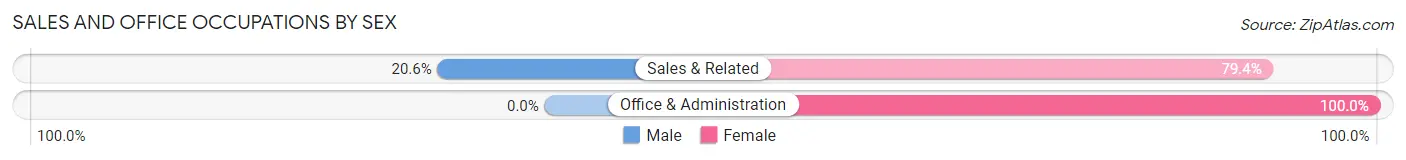
| Occupation | Male | Female |
| Sales & Related | 7 (20.6%) | 27 (79.4%) |
| Office & Administration | 0 (0.0%) | 18 (100.0%) |
| Total (Category) | 7 (13.5%) | 45 (86.5%) |
| Total (Overall) | 77 (41.8%) | 107 (58.2%) |
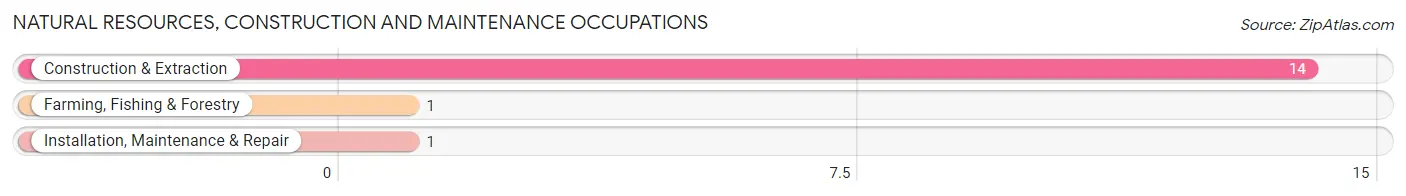
Natural Resources, Construction and Maintenance Occupations
The most common Natural Resources, Construction and Maintenance occupations in Jordan are Construction & Extraction (14 | 7.6%), Farming, Fishing & Forestry (1 | 0.5%), and Installation, Maintenance & Repair (1 | 0.5%).
Natural Resources, Construction and Maintenance Occupations by Sex
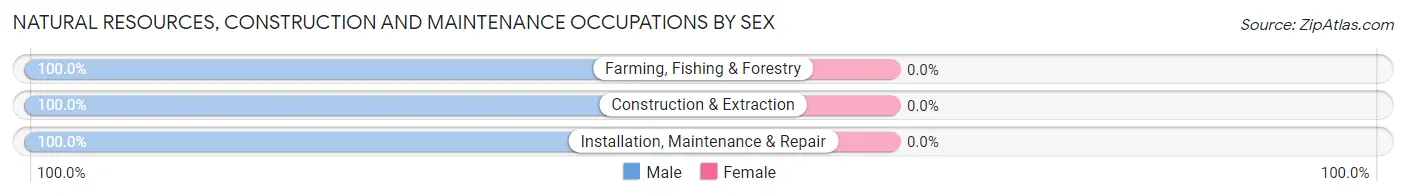
| Occupation | Male | Female |
| Farming, Fishing & Forestry | 1 (100.0%) | 0 (0.0%) |
| Construction & Extraction | 14 (100.0%) | 0 (0.0%) |
| Installation, Maintenance & Repair | 1 (100.0%) | 0 (0.0%) |
| Total (Category) | 16 (100.0%) | 0 (0.0%) |
| Total (Overall) | 77 (41.8%) | 107 (58.2%) |
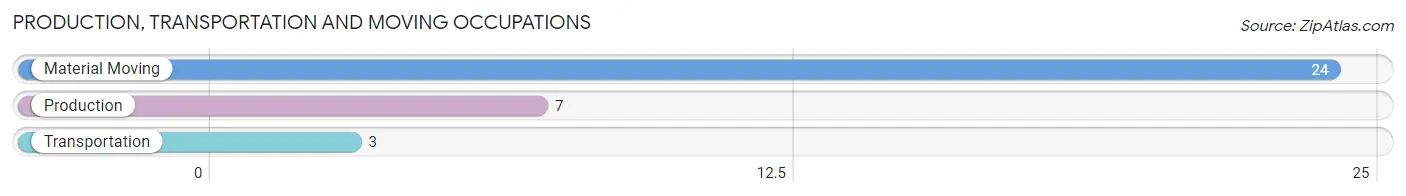
Production, Transportation and Moving Occupations
The most common Production, Transportation and Moving occupations in Jordan are Material Moving (24 | 13.0%), Production (7 | 3.8%), and Transportation (3 | 1.6%).
Production, Transportation and Moving Occupations by Sex
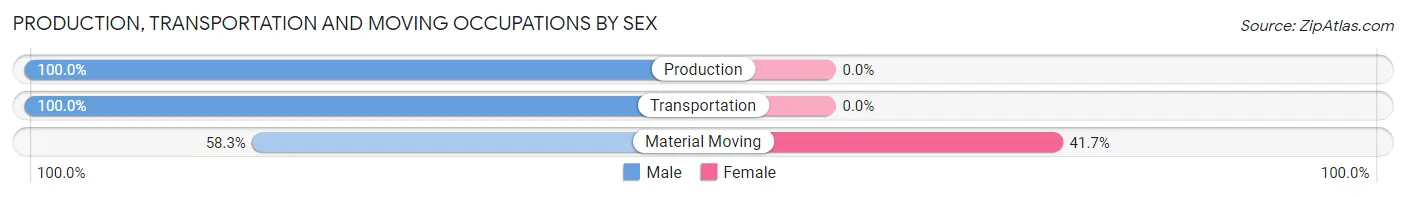
| Occupation | Male | Female |
| Production | 7 (100.0%) | 0 (0.0%) |
| Transportation | 3 (100.0%) | 0 (0.0%) |
| Material Moving | 14 (58.3%) | 10 (41.7%) |
| Total (Category) | 24 (70.6%) | 10 (29.4%) |
| Total (Overall) | 77 (41.8%) | 107 (58.2%) |
Employment Industries by Sex in Jordan
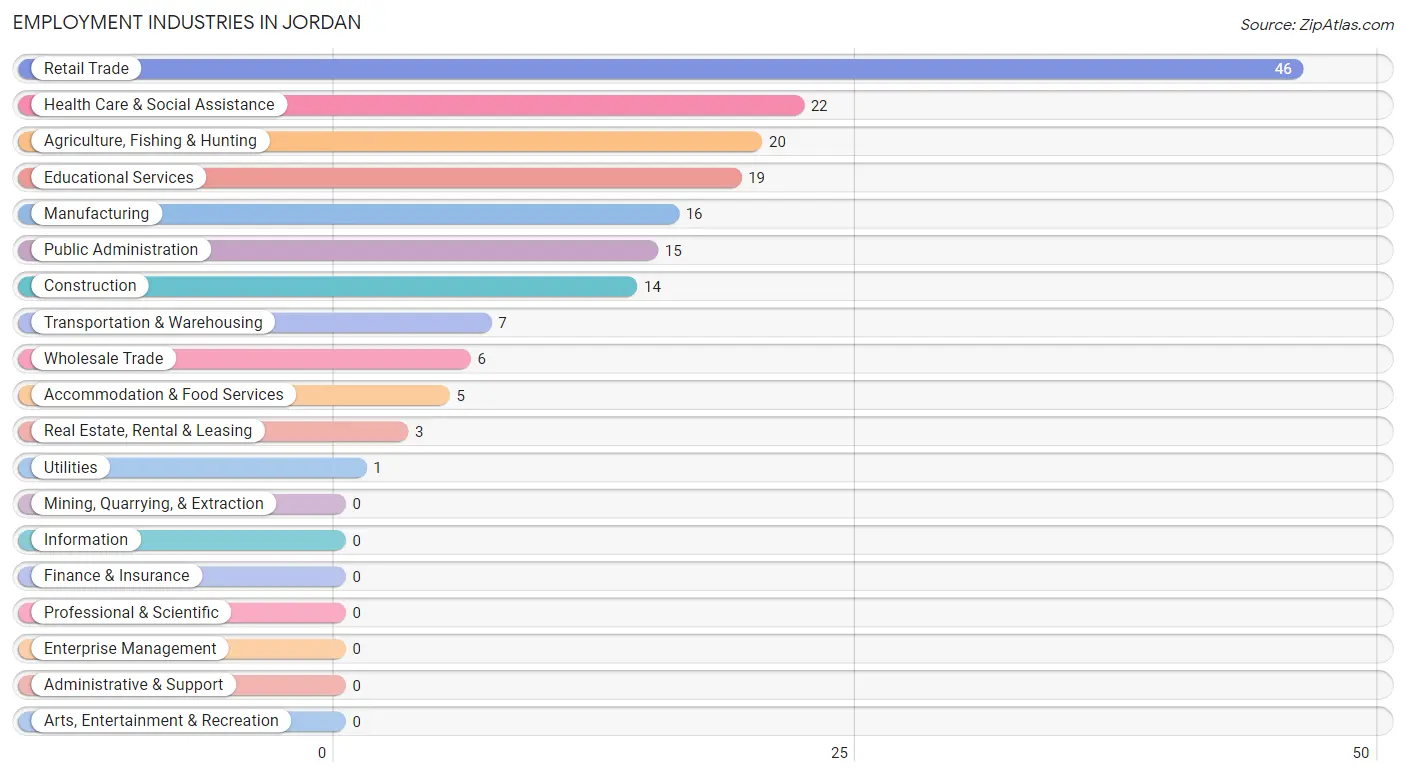
Employment Industries in Jordan
The major employment industries in Jordan include Retail Trade (46 | 25.0%), Health Care & Social Assistance (22 | 12.0%), Agriculture, Fishing & Hunting (20 | 10.9%), Educational Services (19 | 10.3%), and Manufacturing (16 | 8.7%).
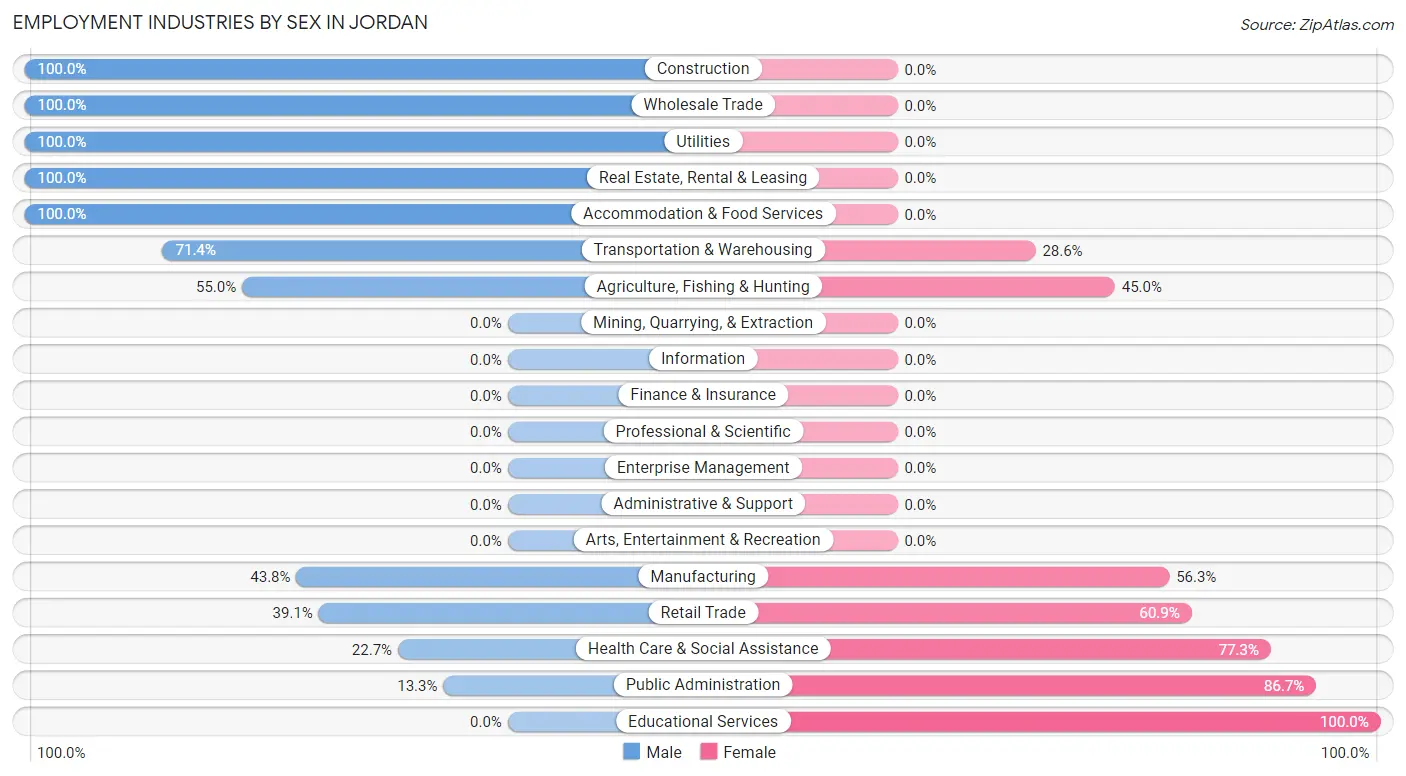
Employment Industries by Sex in Jordan
The Jordan industries that see more men than women are Construction (100.0%), Wholesale Trade (100.0%), and Utilities (100.0%), whereas the industries that tend to have a higher number of women are Educational Services (100.0%), Public Administration (86.7%), and Health Care & Social Assistance (77.3%).
| Industry | Male | Female |
| Agriculture, Fishing & Hunting | 11 (55.0%) | 9 (45.0%) |
| Mining, Quarrying, & Extraction | 0 (0.0%) | 0 (0.0%) |
| Construction | 14 (100.0%) | 0 (0.0%) |
| Manufacturing | 7 (43.8%) | 9 (56.2%) |
| Wholesale Trade | 6 (100.0%) | 0 (0.0%) |
| Retail Trade | 18 (39.1%) | 28 (60.9%) |
| Transportation & Warehousing | 5 (71.4%) | 2 (28.6%) |
| Utilities | 1 (100.0%) | 0 (0.0%) |
| Information | 0 (0.0%) | 0 (0.0%) |
| Finance & Insurance | 0 (0.0%) | 0 (0.0%) |
| Real Estate, Rental & Leasing | 3 (100.0%) | 0 (0.0%) |
| Professional & Scientific | 0 (0.0%) | 0 (0.0%) |
| Enterprise Management | 0 (0.0%) | 0 (0.0%) |
| Administrative & Support | 0 (0.0%) | 0 (0.0%) |
| Educational Services | 0 (0.0%) | 19 (100.0%) |
| Health Care & Social Assistance | 5 (22.7%) | 17 (77.3%) |
| Arts, Entertainment & Recreation | 0 (0.0%) | 0 (0.0%) |
| Accommodation & Food Services | 5 (100.0%) | 0 (0.0%) |
| Public Administration | 2 (13.3%) | 13 (86.7%) |
| Total | 77 (41.8%) | 107 (58.2%) |
Education in Jordan
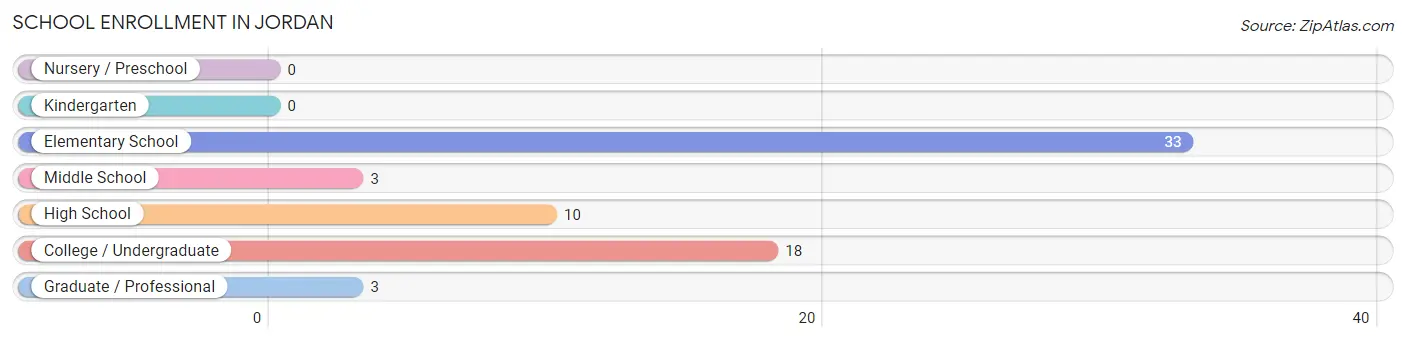
School Enrollment in Jordan
The most common levels of schooling among the 67 students in Jordan are elementary school (33 | 49.2%), college / undergraduate (18 | 26.9%), and high school (10 | 14.9%).
| School Level | # Students | % Students |
| Nursery / Preschool | 0 | 0.0% |
| Kindergarten | 0 | 0.0% |
| Elementary School | 33 | 49.2% |
| Middle School | 3 | 4.5% |
| High School | 10 | 14.9% |
| College / Undergraduate | 18 | 26.9% |
| Graduate / Professional | 3 | 4.5% |
| Total | 67 | 100.0% |
School Enrollment by Age by Funding Source in Jordan
Out of a total of 67 students who are enrolled in schools in Jordan, 1 (1.5%) attend a private institution, while the remaining 66 (98.5%) are enrolled in public schools. The age group of 15 to 17 year olds has the highest likelihood of being enrolled in private schools, with 1 (10.0% in the age bracket) enrolled. Conversely, the age group of 5 to 9 year old has the lowest likelihood of being enrolled in a private school, with 33 (100.0% in the age bracket) attending a public institution.
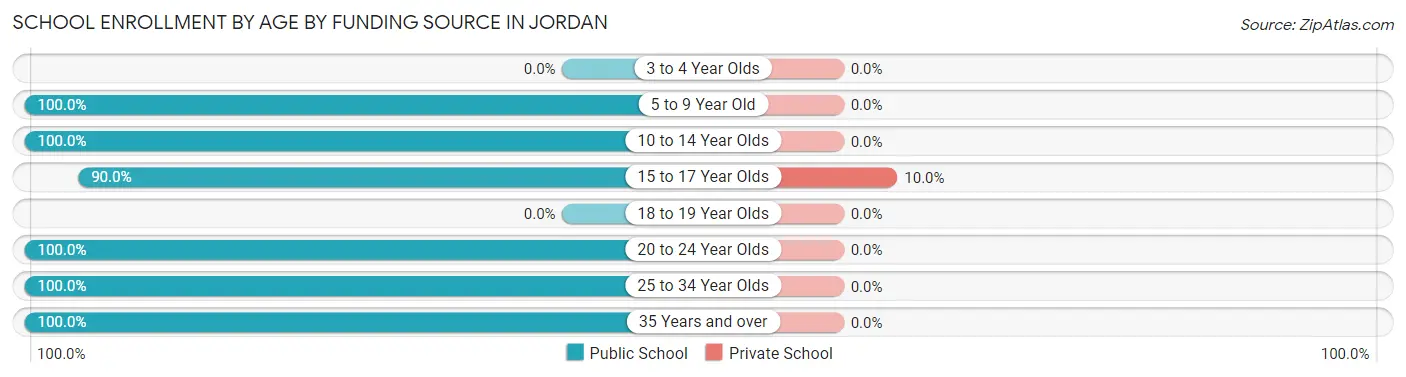
| Age Bracket | Public School | Private School |
| 3 to 4 Year Olds | 0 (0.0%) | 0 (0.0%) |
| 5 to 9 Year Old | 33 (100.0%) | 0 (0.0%) |
| 10 to 14 Year Olds | 3 (100.0%) | 0 (0.0%) |
| 15 to 17 Year Olds | 9 (90.0%) | 1 (10.0%) |
| 18 to 19 Year Olds | 0 (0.0%) | 0 (0.0%) |
| 20 to 24 Year Olds | 3 (100.0%) | 0 (0.0%) |
| 25 to 34 Year Olds | 15 (100.0%) | 0 (0.0%) |
| 35 Years and over | 3 (100.0%) | 0 (0.0%) |
| Total | 66 (98.5%) | 1 (1.5%) |
Educational Attainment by Field of Study in Jordan
Science & technology (16 | 48.5%), education (10 | 30.3%), arts & humanities (4 | 12.1%), and physical & health sciences (3 | 9.1%) are the most common fields of study among 33 individuals in Jordan who have obtained a bachelor's degree or higher.
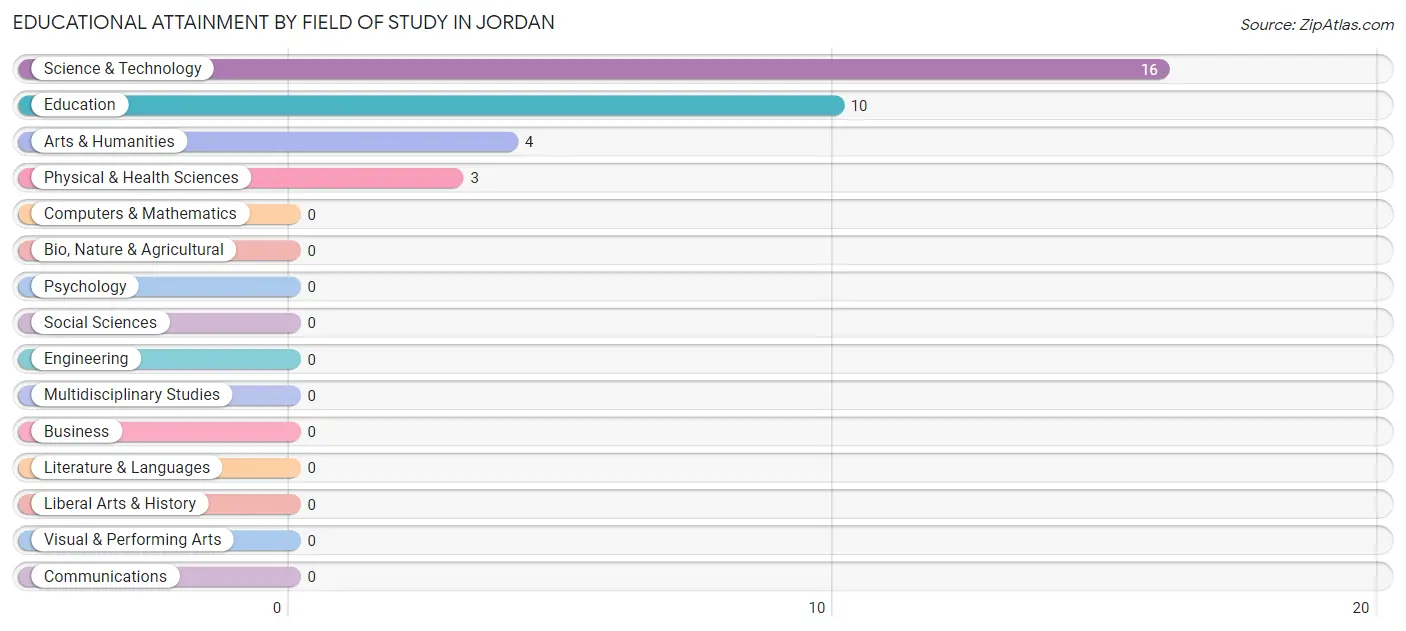
| Field of Study | # Graduates | % Graduates |
| Computers & Mathematics | 0 | 0.0% |
| Bio, Nature & Agricultural | 0 | 0.0% |
| Physical & Health Sciences | 3 | 9.1% |
| Psychology | 0 | 0.0% |
| Social Sciences | 0 | 0.0% |
| Engineering | 0 | 0.0% |
| Multidisciplinary Studies | 0 | 0.0% |
| Science & Technology | 16 | 48.5% |
| Business | 0 | 0.0% |
| Education | 10 | 30.3% |
| Literature & Languages | 0 | 0.0% |
| Liberal Arts & History | 0 | 0.0% |
| Visual & Performing Arts | 0 | 0.0% |
| Communications | 0 | 0.0% |
| Arts & Humanities | 4 | 12.1% |
| Total | 33 | 100.0% |
Transportation & Commute in Jordan
Vehicle Availability by Sex in Jordan
The most prevalent vehicle ownership categories in Jordan are males with 2 vehicles (29, accounting for 37.7%) and females with 2 vehicles (38, making up 27.1%).
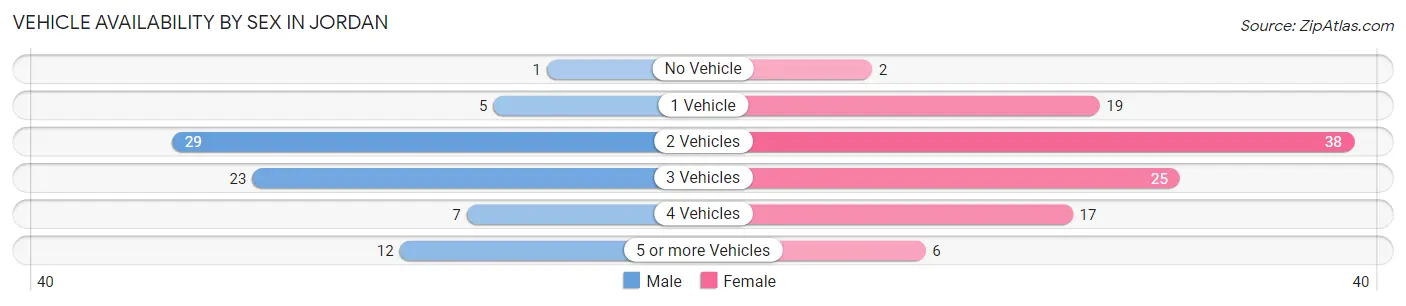
| Vehicles Available | Male | Female |
| No Vehicle | 1 (1.3%) | 2 (1.9%) |
| 1 Vehicle | 5 (6.5%) | 19 (17.8%) |
| 2 Vehicles | 29 (37.7%) | 38 (35.5%) |
| 3 Vehicles | 23 (29.9%) | 25 (23.4%) |
| 4 Vehicles | 7 (9.1%) | 17 (15.9%) |
| 5 or more Vehicles | 12 (15.6%) | 6 (5.6%) |
| Total | 77 (100.0%) | 107 (100.0%) |
Commute Time in Jordan
The most frequently occuring commute durations in Jordan are 5 to 9 minutes (106 commuters, 58.6%), less than 5 minutes (48 commuters, 26.5%), and 30 to 34 minutes (11 commuters, 6.1%).
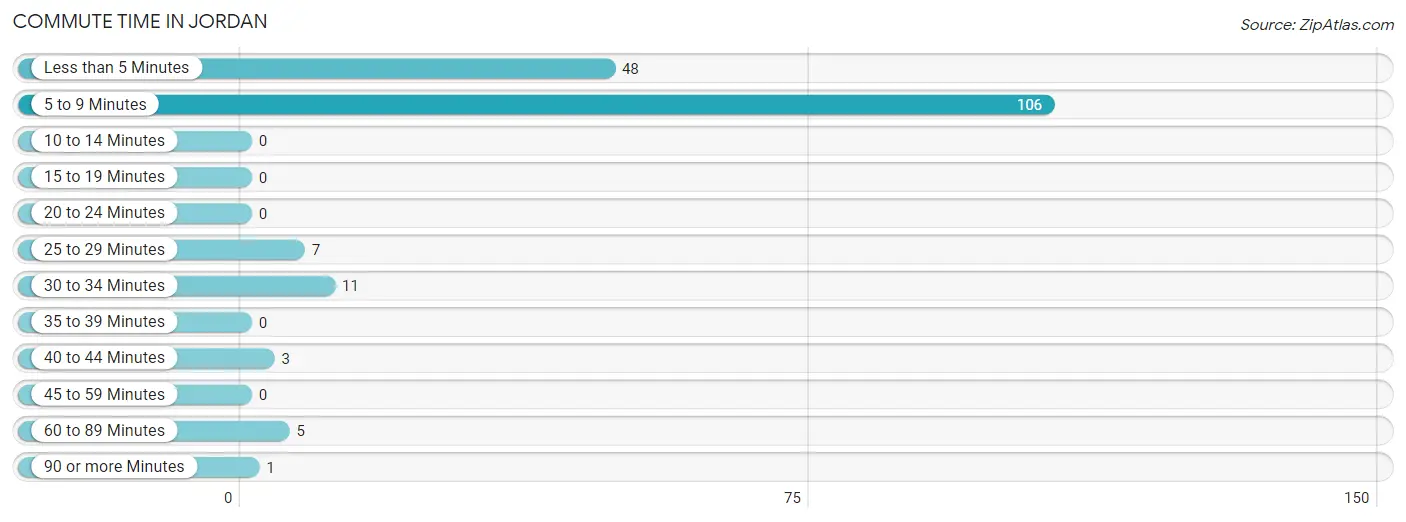
| Commute Time | # Commuters | % Commuters |
| Less than 5 Minutes | 48 | 26.5% |
| 5 to 9 Minutes | 106 | 58.6% |
| 10 to 14 Minutes | 0 | 0.0% |
| 15 to 19 Minutes | 0 | 0.0% |
| 20 to 24 Minutes | 0 | 0.0% |
| 25 to 29 Minutes | 7 | 3.9% |
| 30 to 34 Minutes | 11 | 6.1% |
| 35 to 39 Minutes | 0 | 0.0% |
| 40 to 44 Minutes | 3 | 1.7% |
| 45 to 59 Minutes | 0 | 0.0% |
| 60 to 89 Minutes | 5 | 2.8% |
| 90 or more Minutes | 1 | 0.5% |
Commute Time by Sex in Jordan
The most common commute times in Jordan are 5 to 9 minutes (50 commuters, 66.7%) for males and 5 to 9 minutes (56 commuters, 52.8%) for females.
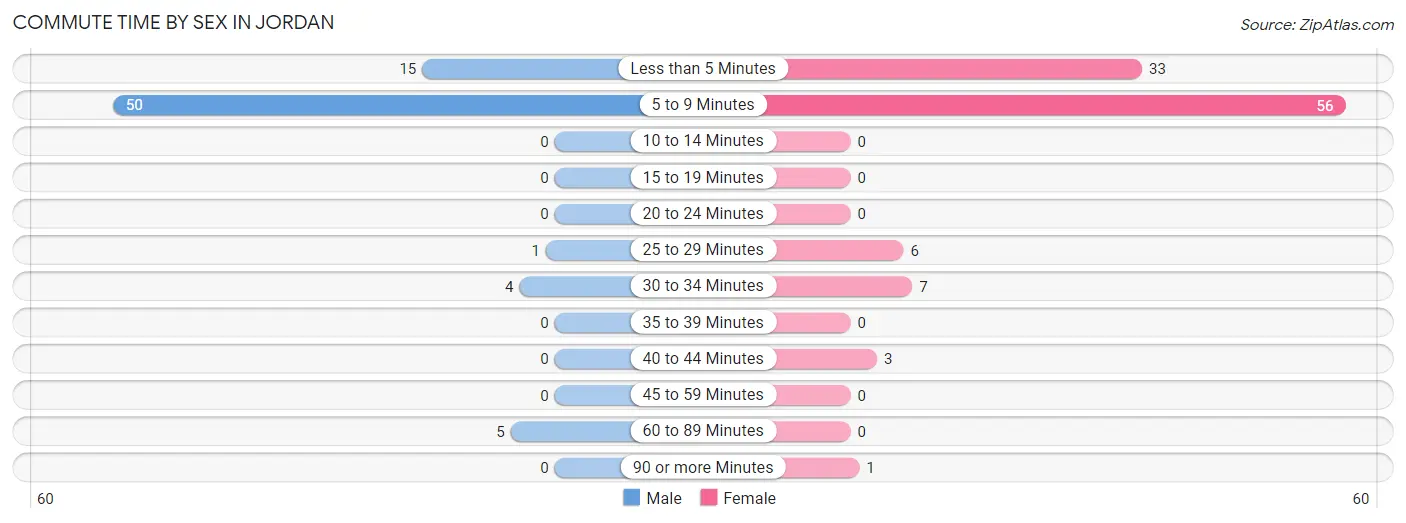
| Commute Time | Male | Female |
| Less than 5 Minutes | 15 (20.0%) | 33 (31.1%) |
| 5 to 9 Minutes | 50 (66.7%) | 56 (52.8%) |
| 10 to 14 Minutes | 0 (0.0%) | 0 (0.0%) |
| 15 to 19 Minutes | 0 (0.0%) | 0 (0.0%) |
| 20 to 24 Minutes | 0 (0.0%) | 0 (0.0%) |
| 25 to 29 Minutes | 1 (1.3%) | 6 (5.7%) |
| 30 to 34 Minutes | 4 (5.3%) | 7 (6.6%) |
| 35 to 39 Minutes | 0 (0.0%) | 0 (0.0%) |
| 40 to 44 Minutes | 0 (0.0%) | 3 (2.8%) |
| 45 to 59 Minutes | 0 (0.0%) | 0 (0.0%) |
| 60 to 89 Minutes | 5 (6.7%) | 0 (0.0%) |
| 90 or more Minutes | 0 (0.0%) | 1 (0.9%) |
Time of Departure to Work by Sex in Jordan
The most frequent times of departure to work in Jordan are 8:00 AM to 8:29 AM (20, 26.7%) for males and 7:30 AM to 7:59 AM (30, 28.3%) for females.
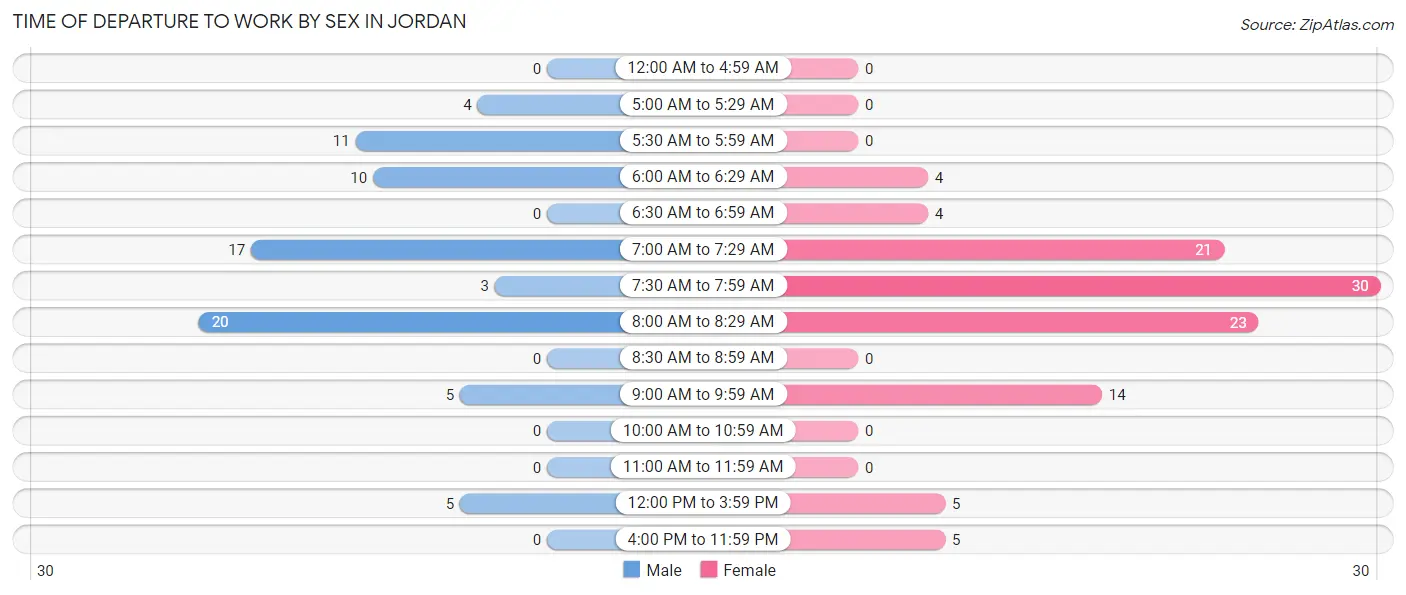
| Time of Departure | Male | Female |
| 12:00 AM to 4:59 AM | 0 (0.0%) | 0 (0.0%) |
| 5:00 AM to 5:29 AM | 4 (5.3%) | 0 (0.0%) |
| 5:30 AM to 5:59 AM | 11 (14.7%) | 0 (0.0%) |
| 6:00 AM to 6:29 AM | 10 (13.3%) | 4 (3.8%) |
| 6:30 AM to 6:59 AM | 0 (0.0%) | 4 (3.8%) |
| 7:00 AM to 7:29 AM | 17 (22.7%) | 21 (19.8%) |
| 7:30 AM to 7:59 AM | 3 (4.0%) | 30 (28.3%) |
| 8:00 AM to 8:29 AM | 20 (26.7%) | 23 (21.7%) |
| 8:30 AM to 8:59 AM | 0 (0.0%) | 0 (0.0%) |
| 9:00 AM to 9:59 AM | 5 (6.7%) | 14 (13.2%) |
| 10:00 AM to 10:59 AM | 0 (0.0%) | 0 (0.0%) |
| 11:00 AM to 11:59 AM | 0 (0.0%) | 0 (0.0%) |
| 12:00 PM to 3:59 PM | 5 (6.7%) | 5 (4.7%) |
| 4:00 PM to 11:59 PM | 0 (0.0%) | 5 (4.7%) |
| Total | 75 (100.0%) | 106 (100.0%) |
Housing Occupancy in Jordan
Occupancy by Ownership in Jordan
Of the total 157 dwellings in Jordan, owner-occupied units account for 99 (63.1%), while renter-occupied units make up 58 (36.9%).
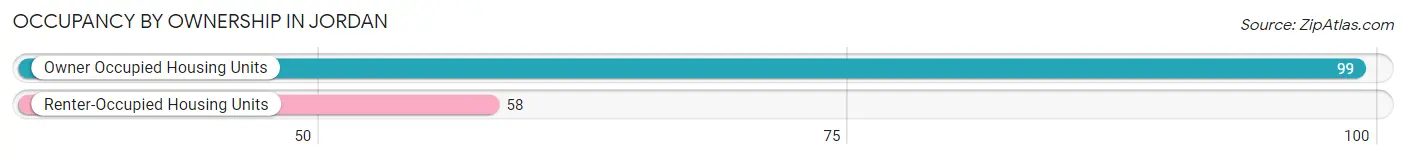
| Occupancy | # Housing Units | % Housing Units |
| Owner Occupied Housing Units | 99 | 63.1% |
| Renter-Occupied Housing Units | 58 | 36.9% |
| Total Occupied Housing Units | 157 | 100.0% |
Occupancy by Household Size in Jordan
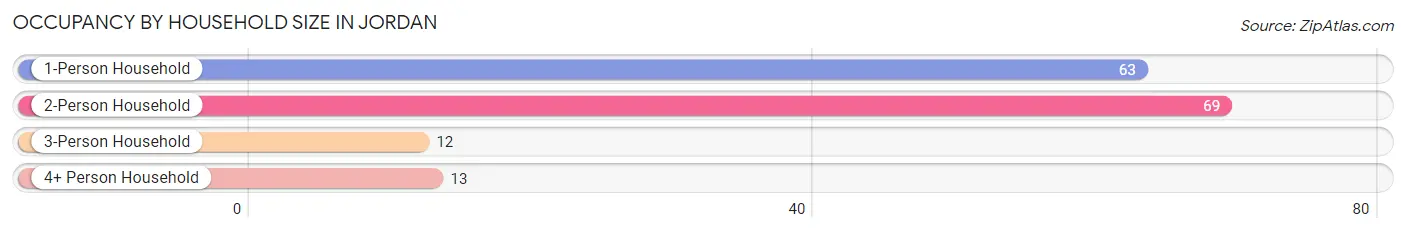
| Household Size | # Housing Units | % Housing Units |
| 1-Person Household | 63 | 40.1% |
| 2-Person Household | 69 | 44.0% |
| 3-Person Household | 12 | 7.6% |
| 4+ Person Household | 13 | 8.3% |
| Total Housing Units | 157 | 100.0% |
Occupancy by Ownership by Household Size in Jordan
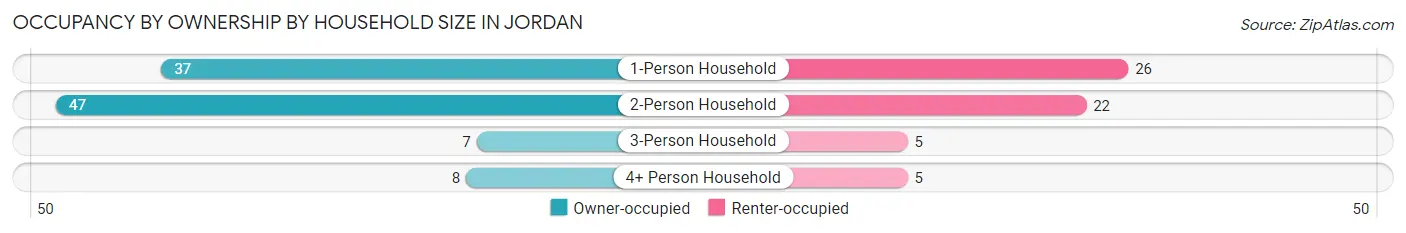
| Household Size | Owner-occupied | Renter-occupied |
| 1-Person Household | 37 (58.7%) | 26 (41.3%) |
| 2-Person Household | 47 (68.1%) | 22 (31.9%) |
| 3-Person Household | 7 (58.3%) | 5 (41.7%) |
| 4+ Person Household | 8 (61.5%) | 5 (38.5%) |
| Total Housing Units | 99 (63.1%) | 58 (36.9%) |
Occupancy by Educational Attainment in Jordan
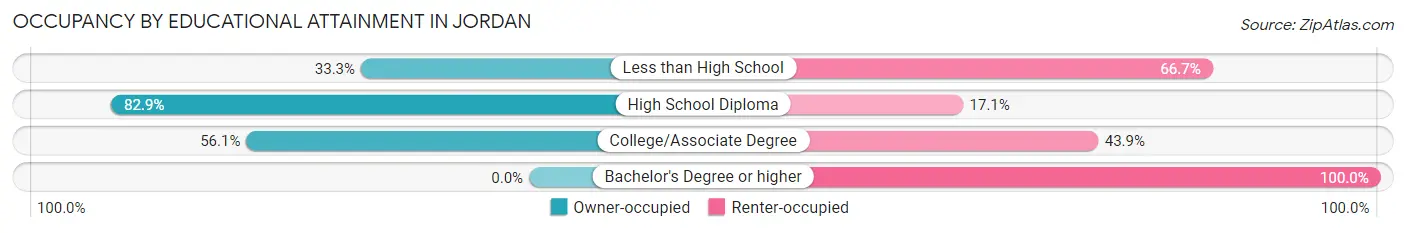
| Household Size | Owner-occupied | Renter-occupied |
| Less than High School | 4 (33.3%) | 8 (66.7%) |
| High School Diploma | 58 (82.9%) | 12 (17.1%) |
| College/Associate Degree | 37 (56.1%) | 29 (43.9%) |
| Bachelor's Degree or higher | 0 (0.0%) | 9 (100.0%) |
Occupancy by Age of Householder in Jordan
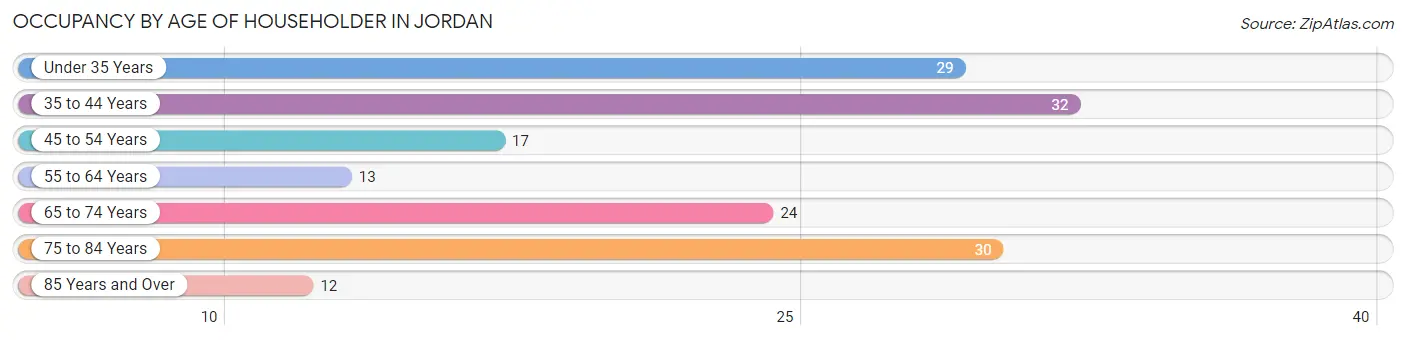
| Age Bracket | # Households | % Households |
| Under 35 Years | 29 | 18.5% |
| 35 to 44 Years | 32 | 20.4% |
| 45 to 54 Years | 17 | 10.8% |
| 55 to 64 Years | 13 | 8.3% |
| 65 to 74 Years | 24 | 15.3% |
| 75 to 84 Years | 30 | 19.1% |
| 85 Years and Over | 12 | 7.6% |
| Total | 157 | 100.0% |
Housing Finances in Jordan
Median Income by Occupancy in Jordan
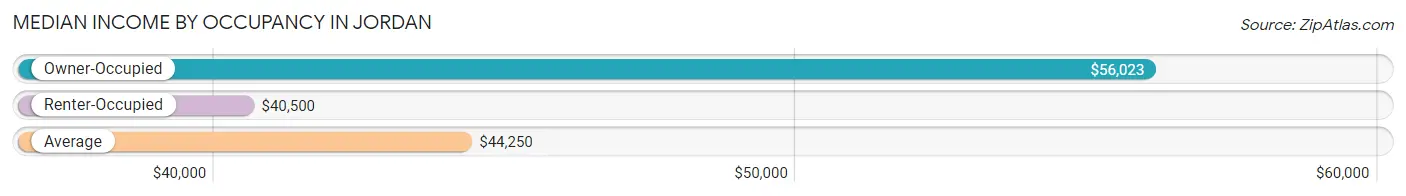
| Occupancy Type | # Households | Median Income |
| Owner-Occupied | 99 (63.1%) | $56,023 |
| Renter-Occupied | 58 (36.9%) | $40,500 |
| Average | 157 (100.0%) | $44,250 |
Occupancy by Householder Income Bracket in Jordan
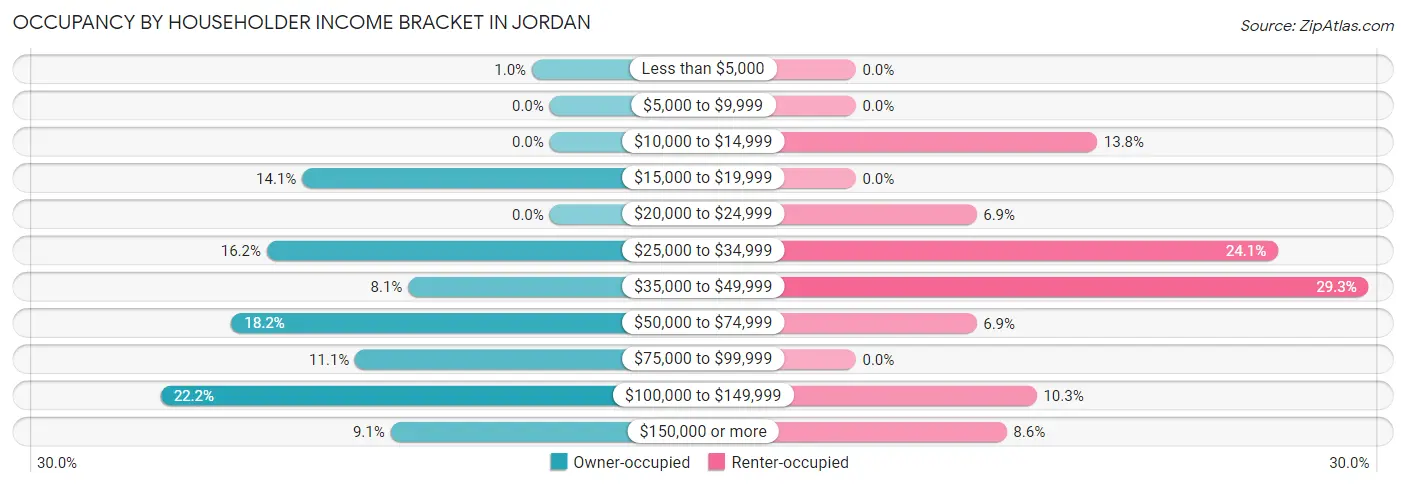
| Income Bracket | Owner-occupied | Renter-occupied |
| Less than $5,000 | 1 (1.0%) | 0 (0.0%) |
| $5,000 to $9,999 | 0 (0.0%) | 0 (0.0%) |
| $10,000 to $14,999 | 0 (0.0%) | 8 (13.8%) |
| $15,000 to $19,999 | 14 (14.1%) | 0 (0.0%) |
| $20,000 to $24,999 | 0 (0.0%) | 4 (6.9%) |
| $25,000 to $34,999 | 16 (16.2%) | 14 (24.1%) |
| $35,000 to $49,999 | 8 (8.1%) | 17 (29.3%) |
| $50,000 to $74,999 | 18 (18.2%) | 4 (6.9%) |
| $75,000 to $99,999 | 11 (11.1%) | 0 (0.0%) |
| $100,000 to $149,999 | 22 (22.2%) | 6 (10.3%) |
| $150,000 or more | 9 (9.1%) | 5 (8.6%) |
| Total | 99 (100.0%) | 58 (100.0%) |
Monthly Housing Cost Tiers in Jordan
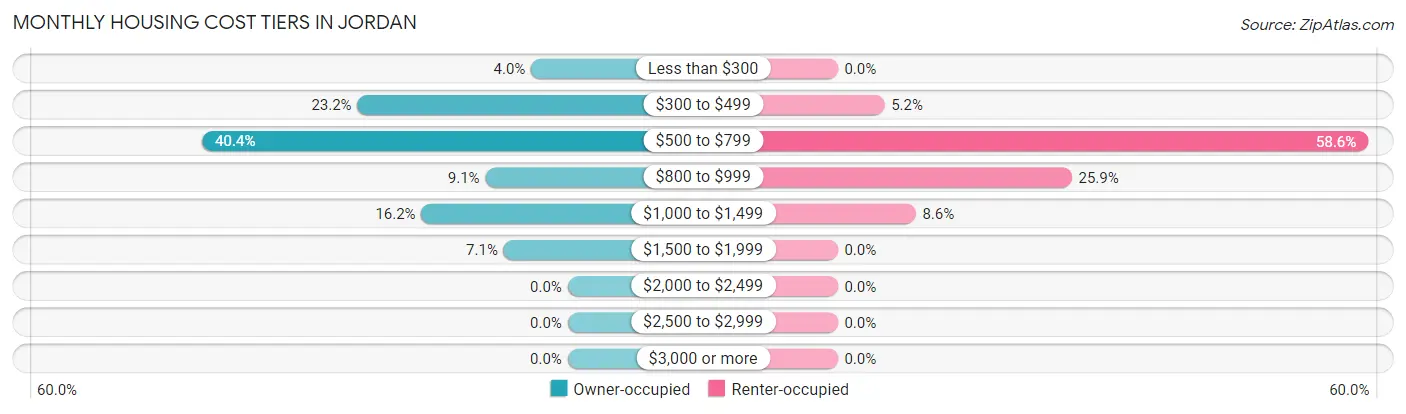
| Monthly Cost | Owner-occupied | Renter-occupied |
| Less than $300 | 4 (4.0%) | 0 (0.0%) |
| $300 to $499 | 23 (23.2%) | 3 (5.2%) |
| $500 to $799 | 40 (40.4%) | 34 (58.6%) |
| $800 to $999 | 9 (9.1%) | 15 (25.9%) |
| $1,000 to $1,499 | 16 (16.2%) | 5 (8.6%) |
| $1,500 to $1,999 | 7 (7.1%) | 0 (0.0%) |
| $2,000 to $2,499 | 0 (0.0%) | 0 (0.0%) |
| $2,500 to $2,999 | 0 (0.0%) | 0 (0.0%) |
| $3,000 or more | 0 (0.0%) | 0 (0.0%) |
| Total | 99 (100.0%) | 58 (100.0%) |
Physical Housing Characteristics in Jordan
Housing Structures in Jordan
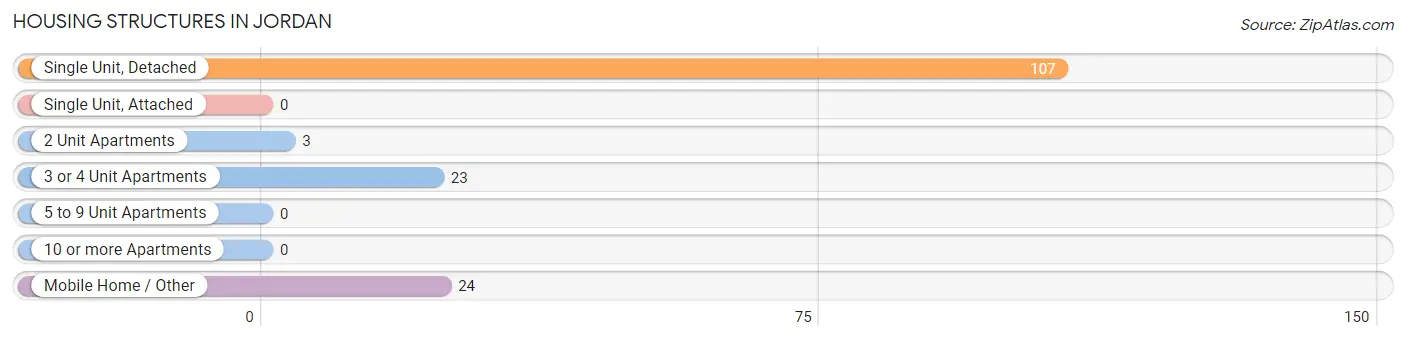
| Structure Type | # Housing Units | % Housing Units |
| Single Unit, Detached | 107 | 68.1% |
| Single Unit, Attached | 0 | 0.0% |
| 2 Unit Apartments | 3 | 1.9% |
| 3 or 4 Unit Apartments | 23 | 14.6% |
| 5 to 9 Unit Apartments | 0 | 0.0% |
| 10 or more Apartments | 0 | 0.0% |
| Mobile Home / Other | 24 | 15.3% |
| Total | 157 | 100.0% |
Housing Structures by Occupancy in Jordan
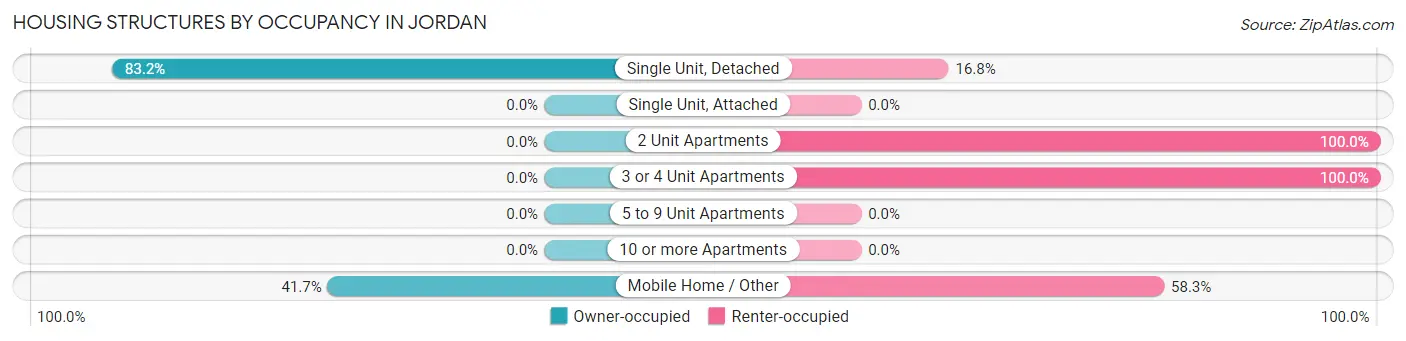
| Structure Type | Owner-occupied | Renter-occupied |
| Single Unit, Detached | 89 (83.2%) | 18 (16.8%) |
| Single Unit, Attached | 0 (0.0%) | 0 (0.0%) |
| 2 Unit Apartments | 0 (0.0%) | 3 (100.0%) |
| 3 or 4 Unit Apartments | 0 (0.0%) | 23 (100.0%) |
| 5 to 9 Unit Apartments | 0 (0.0%) | 0 (0.0%) |
| 10 or more Apartments | 0 (0.0%) | 0 (0.0%) |
| Mobile Home / Other | 10 (41.7%) | 14 (58.3%) |
| Total | 99 (63.1%) | 58 (36.9%) |
Housing Structures by Number of Rooms in Jordan
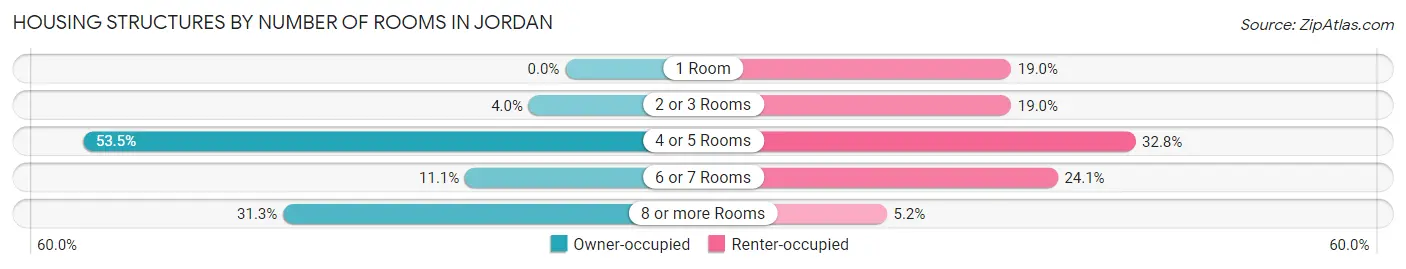
| Number of Rooms | Owner-occupied | Renter-occupied |
| 1 Room | 0 (0.0%) | 11 (19.0%) |
| 2 or 3 Rooms | 4 (4.0%) | 11 (19.0%) |
| 4 or 5 Rooms | 53 (53.5%) | 19 (32.8%) |
| 6 or 7 Rooms | 11 (11.1%) | 14 (24.1%) |
| 8 or more Rooms | 31 (31.3%) | 3 (5.2%) |
| Total | 99 (100.0%) | 58 (100.0%) |
Housing Structure by Heating Type in Jordan
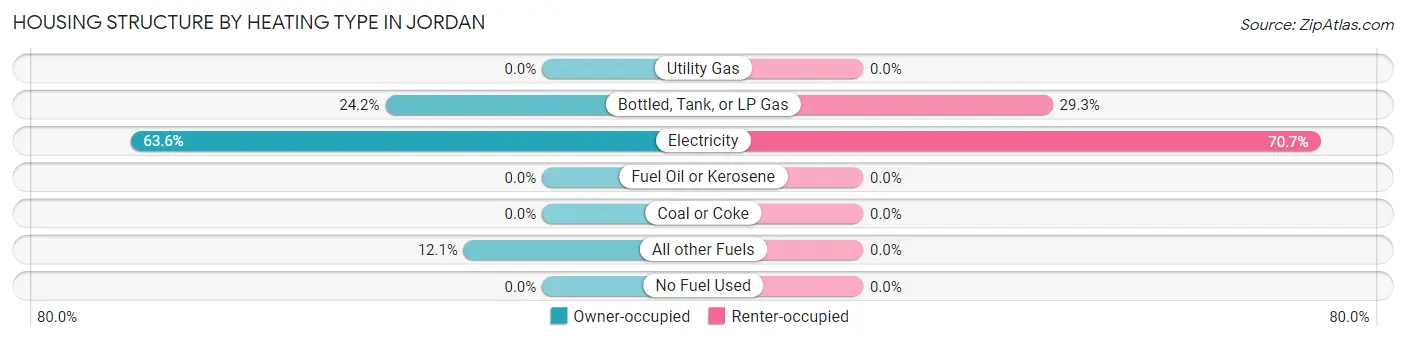
| Heating Type | Owner-occupied | Renter-occupied |
| Utility Gas | 0 (0.0%) | 0 (0.0%) |
| Bottled, Tank, or LP Gas | 24 (24.2%) | 17 (29.3%) |
| Electricity | 63 (63.6%) | 41 (70.7%) |
| Fuel Oil or Kerosene | 0 (0.0%) | 0 (0.0%) |
| Coal or Coke | 0 (0.0%) | 0 (0.0%) |
| All other Fuels | 12 (12.1%) | 0 (0.0%) |
| No Fuel Used | 0 (0.0%) | 0 (0.0%) |
| Total | 99 (100.0%) | 58 (100.0%) |
Household Vehicle Usage in Jordan
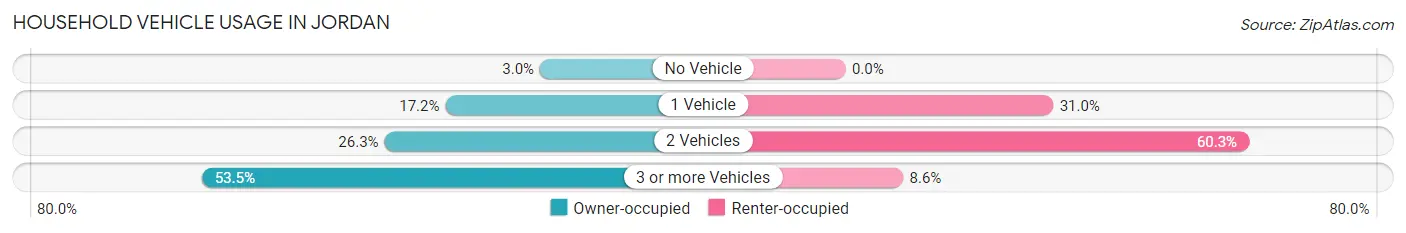
| Vehicles per Household | Owner-occupied | Renter-occupied |
| No Vehicle | 3 (3.0%) | 0 (0.0%) |
| 1 Vehicle | 17 (17.2%) | 18 (31.0%) |
| 2 Vehicles | 26 (26.3%) | 35 (60.3%) |
| 3 or more Vehicles | 53 (53.5%) | 5 (8.6%) |
| Total | 99 (100.0%) | 58 (100.0%) |
Real Estate & Mortgages in Jordan
Real Estate and Mortgage Overview in Jordan
| Characteristic | Without Mortgage | With Mortgage |
| Housing Units | 70 | 29 |
| Median Property Value | $153,400 | $156,300 |
| Median Household Income | $55,682 | $0 |
| Monthly Housing Costs | $557 | $0 |
| Real Estate Taxes | $1,385 | $0 |
Property Value by Mortgage Status in Jordan
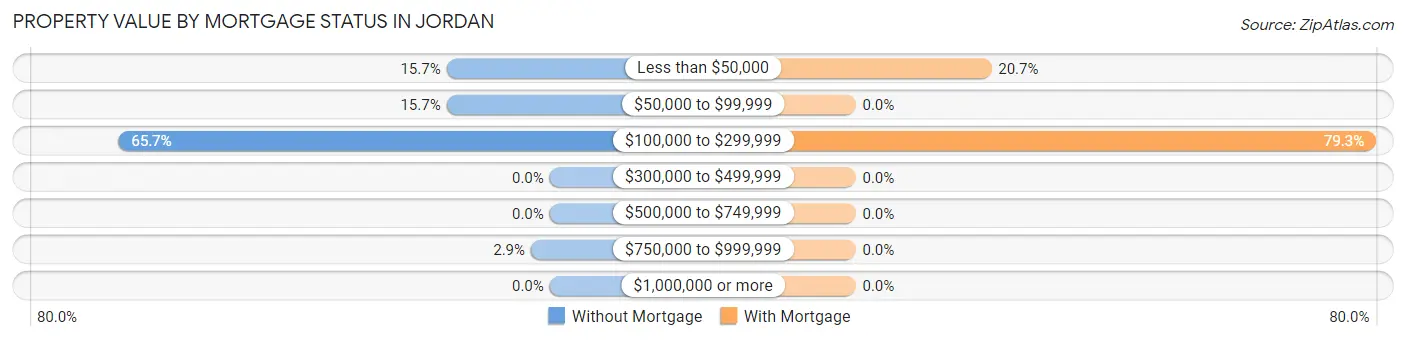
| Property Value | Without Mortgage | With Mortgage |
| Less than $50,000 | 11 (15.7%) | 6 (20.7%) |
| $50,000 to $99,999 | 11 (15.7%) | 0 (0.0%) |
| $100,000 to $299,999 | 46 (65.7%) | 23 (79.3%) |
| $300,000 to $499,999 | 0 (0.0%) | 0 (0.0%) |
| $500,000 to $749,999 | 0 (0.0%) | 0 (0.0%) |
| $750,000 to $999,999 | 2 (2.9%) | 0 (0.0%) |
| $1,000,000 or more | 0 (0.0%) | 0 (0.0%) |
| Total | 70 (100.0%) | 29 (100.0%) |
Household Income by Mortgage Status in Jordan
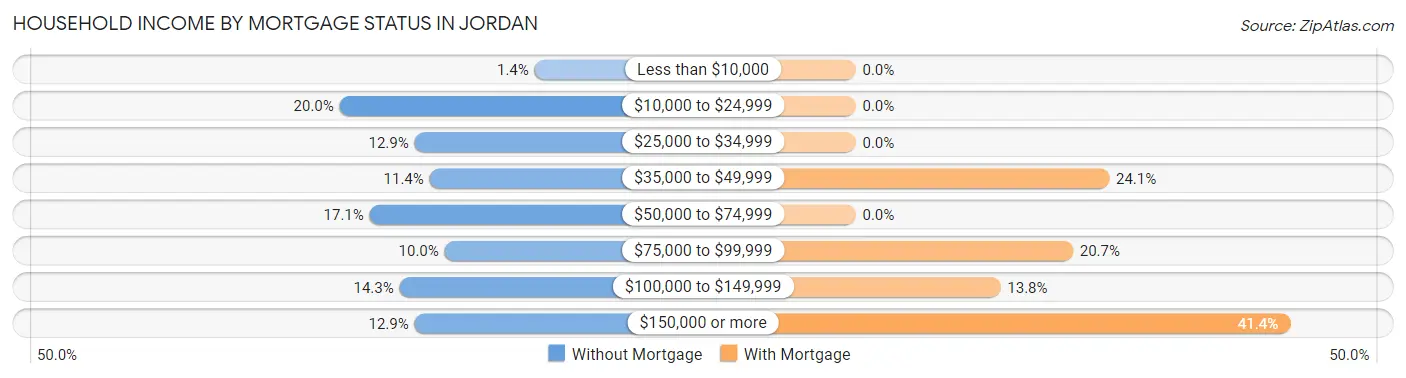
| Household Income | Without Mortgage | With Mortgage |
| Less than $10,000 | 1 (1.4%) | 0 (0.0%) |
| $10,000 to $24,999 | 14 (20.0%) | 0 (0.0%) |
| $25,000 to $34,999 | 9 (12.9%) | 0 (0.0%) |
| $35,000 to $49,999 | 8 (11.4%) | 7 (24.1%) |
| $50,000 to $74,999 | 12 (17.1%) | 0 (0.0%) |
| $75,000 to $99,999 | 7 (10.0%) | 6 (20.7%) |
| $100,000 to $149,999 | 10 (14.3%) | 4 (13.8%) |
| $150,000 or more | 9 (12.9%) | 12 (41.4%) |
| Total | 70 (100.0%) | 29 (100.0%) |
Property Value to Household Income Ratio in Jordan
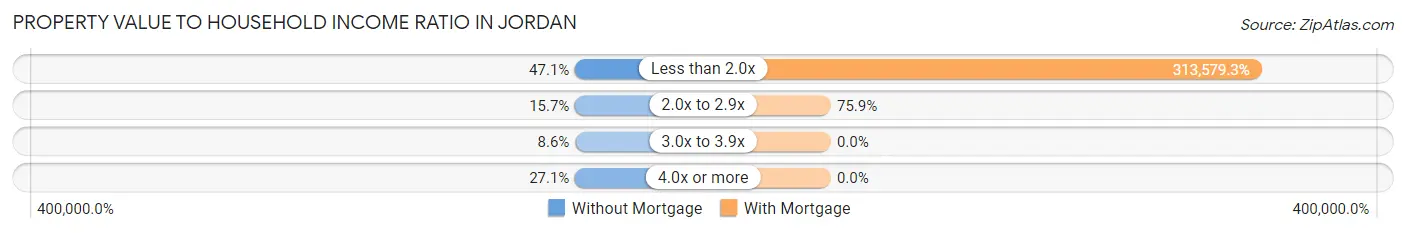
| Value-to-Income Ratio | Without Mortgage | With Mortgage |
| Less than 2.0x | 33 (47.1%) | 90,938 (313,579.3%) |
| 2.0x to 2.9x | 11 (15.7%) | 22 (75.9%) |
| 3.0x to 3.9x | 6 (8.6%) | 0 (0.0%) |
| 4.0x or more | 19 (27.1%) | 0 (0.0%) |
| Total | 70 (100.0%) | 29 (100.0%) |
Real Estate Taxes by Mortgage Status in Jordan
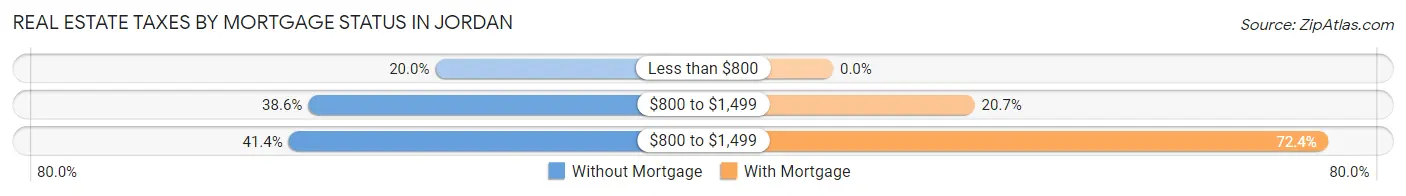
| Property Taxes | Without Mortgage | With Mortgage |
| Less than $800 | 14 (20.0%) | 0 (0.0%) |
| $800 to $1,499 | 27 (38.6%) | 6 (20.7%) |
| $800 to $1,499 | 29 (41.4%) | 21 (72.4%) |
| Total | 70 (100.0%) | 29 (100.0%) |
Health & Disability in Jordan
Health Insurance Coverage by Age in Jordan
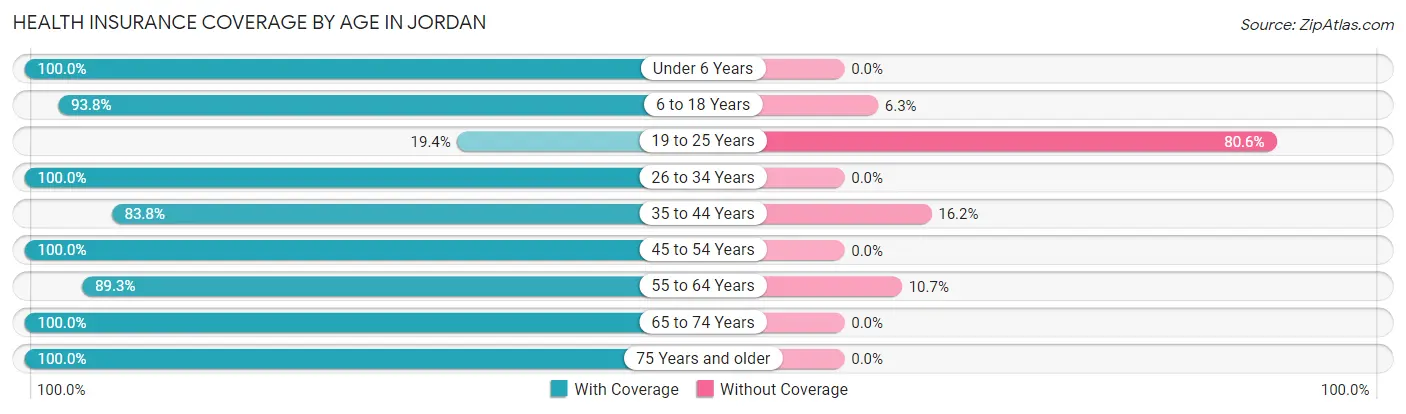
| Age Bracket | With Coverage | Without Coverage |
| Under 6 Years | 9 (100.0%) | 0 (0.0%) |
| 6 to 18 Years | 45 (93.8%) | 3 (6.2%) |
| 19 to 25 Years | 7 (19.4%) | 29 (80.6%) |
| 26 to 34 Years | 31 (100.0%) | 0 (0.0%) |
| 35 to 44 Years | 31 (83.8%) | 6 (16.2%) |
| 45 to 54 Years | 35 (100.0%) | 0 (0.0%) |
| 55 to 64 Years | 25 (89.3%) | 3 (10.7%) |
| 65 to 74 Years | 31 (100.0%) | 0 (0.0%) |
| 75 Years and older | 62 (100.0%) | 0 (0.0%) |
| Total | 276 (87.1%) | 41 (12.9%) |
Health Insurance Coverage by Citizenship Status in Jordan
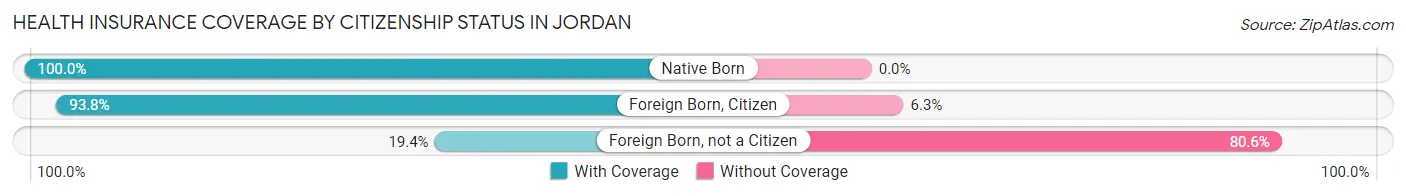
| Citizenship Status | With Coverage | Without Coverage |
| Native Born | 9 (100.0%) | 0 (0.0%) |
| Foreign Born, Citizen | 45 (93.8%) | 3 (6.2%) |
| Foreign Born, not a Citizen | 7 (19.4%) | 29 (80.6%) |
Health Insurance Coverage by Household Income in Jordan
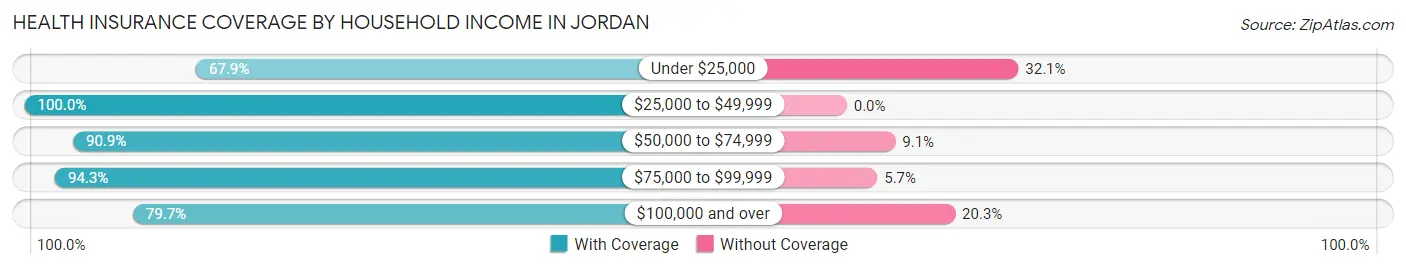
| Household Income | With Coverage | Without Coverage |
| Under $25,000 | 19 (67.9%) | 9 (32.1%) |
| $25,000 to $49,999 | 88 (100.0%) | 0 (0.0%) |
| $50,000 to $74,999 | 30 (90.9%) | 3 (9.1%) |
| $75,000 to $99,999 | 33 (94.3%) | 2 (5.7%) |
| $100,000 and over | 106 (79.7%) | 27 (20.3%) |
Public vs Private Health Insurance Coverage by Age in Jordan
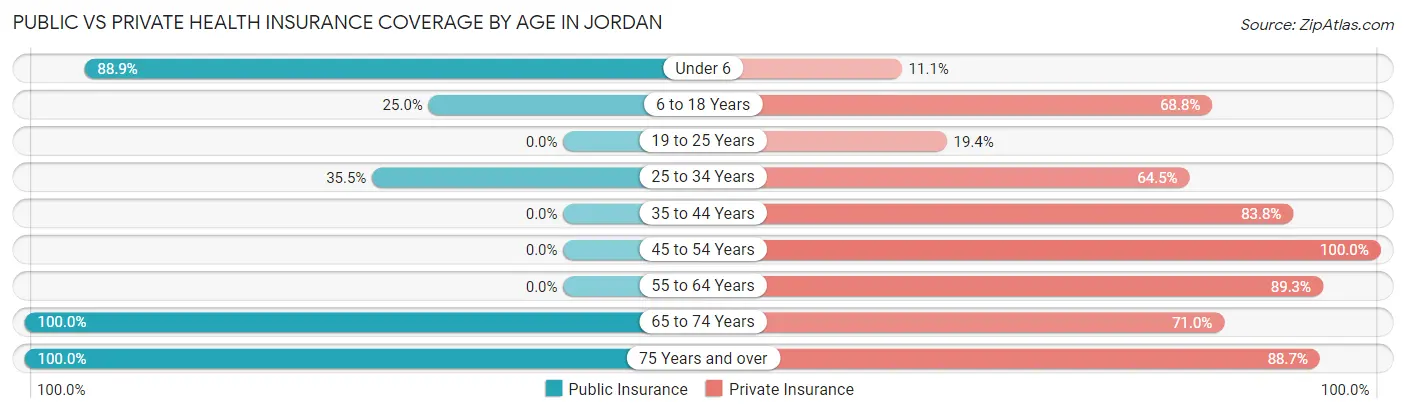
| Age Bracket | Public Insurance | Private Insurance |
| Under 6 | 8 (88.9%) | 1 (11.1%) |
| 6 to 18 Years | 12 (25.0%) | 33 (68.8%) |
| 19 to 25 Years | 0 (0.0%) | 7 (19.4%) |
| 25 to 34 Years | 11 (35.5%) | 20 (64.5%) |
| 35 to 44 Years | 0 (0.0%) | 31 (83.8%) |
| 45 to 54 Years | 0 (0.0%) | 35 (100.0%) |
| 55 to 64 Years | 0 (0.0%) | 25 (89.3%) |
| 65 to 74 Years | 31 (100.0%) | 22 (71.0%) |
| 75 Years and over | 62 (100.0%) | 55 (88.7%) |
| Total | 124 (39.1%) | 229 (72.2%) |
Disability Status by Sex by Age in Jordan
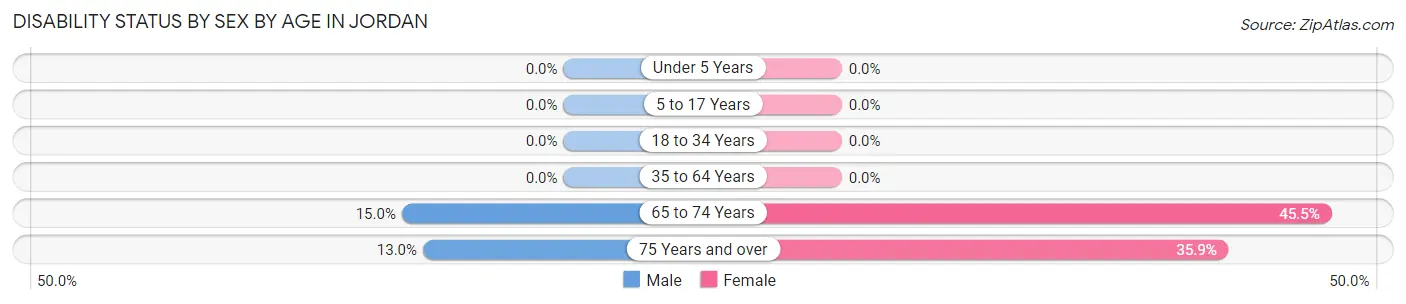
| Age Bracket | Male | Female |
| Under 5 Years | 0 (0.0%) | 0 (0.0%) |
| 5 to 17 Years | 0 (0.0%) | 0 (0.0%) |
| 18 to 34 Years | 0 (0.0%) | 0 (0.0%) |
| 35 to 64 Years | 0 (0.0%) | 0 (0.0%) |
| 65 to 74 Years | 3 (15.0%) | 5 (45.5%) |
| 75 Years and over | 3 (13.0%) | 14 (35.9%) |
Disability Class by Sex by Age in Jordan
Disability Class: Hearing Difficulty
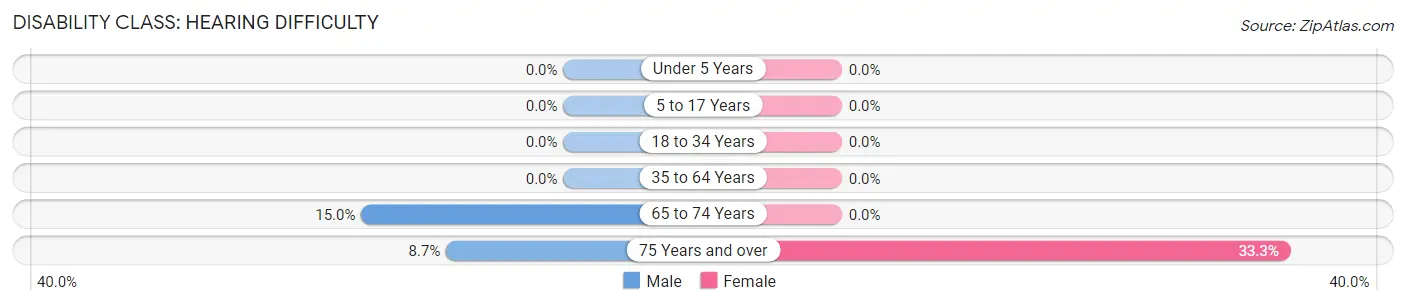
| Age Bracket | Male | Female |
| Under 5 Years | 0 (0.0%) | 0 (0.0%) |
| 5 to 17 Years | 0 (0.0%) | 0 (0.0%) |
| 18 to 34 Years | 0 (0.0%) | 0 (0.0%) |
| 35 to 64 Years | 0 (0.0%) | 0 (0.0%) |
| 65 to 74 Years | 3 (15.0%) | 0 (0.0%) |
| 75 Years and over | 2 (8.7%) | 13 (33.3%) |
Disability Class: Vision Difficulty
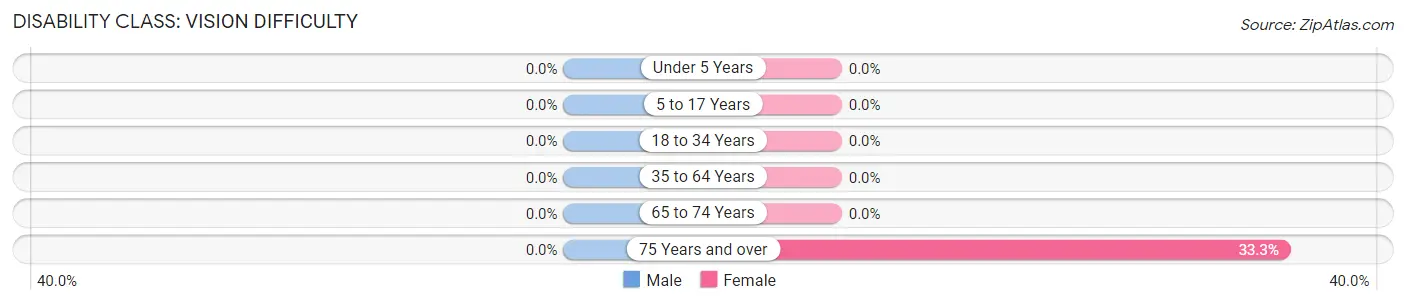
| Age Bracket | Male | Female |
| Under 5 Years | 0 (0.0%) | 0 (0.0%) |
| 5 to 17 Years | 0 (0.0%) | 0 (0.0%) |
| 18 to 34 Years | 0 (0.0%) | 0 (0.0%) |
| 35 to 64 Years | 0 (0.0%) | 0 (0.0%) |
| 65 to 74 Years | 0 (0.0%) | 0 (0.0%) |
| 75 Years and over | 0 (0.0%) | 13 (33.3%) |
Disability Class: Cognitive Difficulty
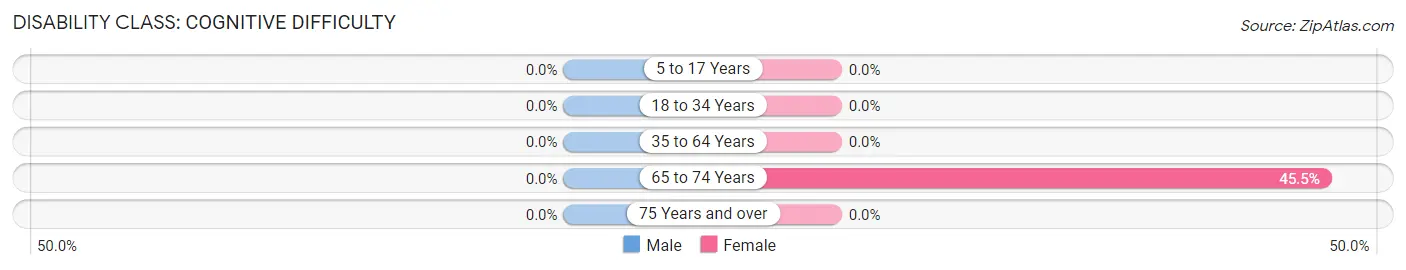
| Age Bracket | Male | Female |
| 5 to 17 Years | 0 (0.0%) | 0 (0.0%) |
| 18 to 34 Years | 0 (0.0%) | 0 (0.0%) |
| 35 to 64 Years | 0 (0.0%) | 0 (0.0%) |
| 65 to 74 Years | 0 (0.0%) | 5 (45.5%) |
| 75 Years and over | 0 (0.0%) | 0 (0.0%) |
Disability Class: Ambulatory Difficulty
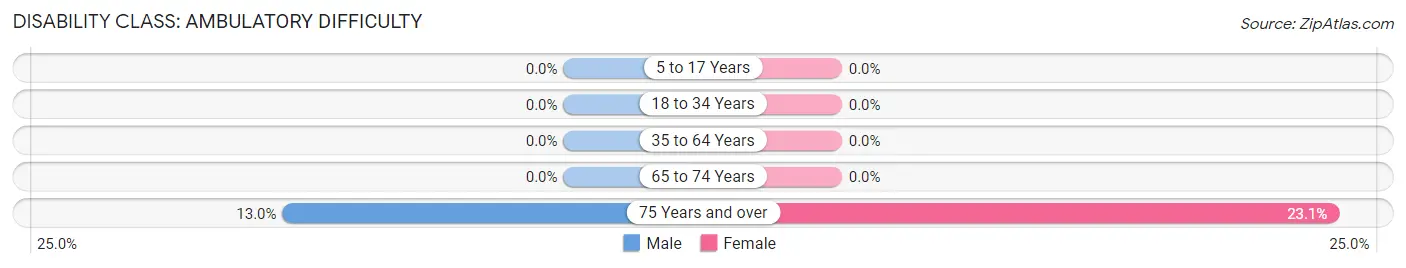
| Age Bracket | Male | Female |
| 5 to 17 Years | 0 (0.0%) | 0 (0.0%) |
| 18 to 34 Years | 0 (0.0%) | 0 (0.0%) |
| 35 to 64 Years | 0 (0.0%) | 0 (0.0%) |
| 65 to 74 Years | 0 (0.0%) | 0 (0.0%) |
| 75 Years and over | 3 (13.0%) | 9 (23.1%) |
Disability Class: Self-Care Difficulty
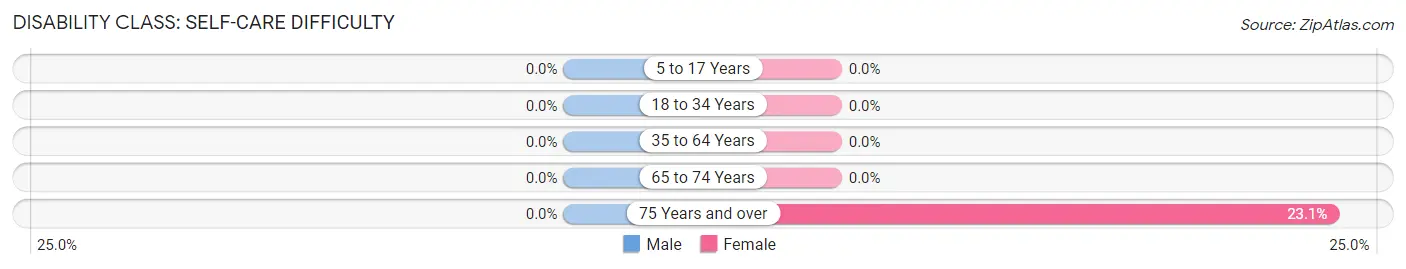
| Age Bracket | Male | Female |
| 5 to 17 Years | 0 (0.0%) | 0 (0.0%) |
| 18 to 34 Years | 0 (0.0%) | 0 (0.0%) |
| 35 to 64 Years | 0 (0.0%) | 0 (0.0%) |
| 65 to 74 Years | 0 (0.0%) | 0 (0.0%) |
| 75 Years and over | 0 (0.0%) | 9 (23.1%) |
Technology Access in Jordan
Computing Device Access in Jordan
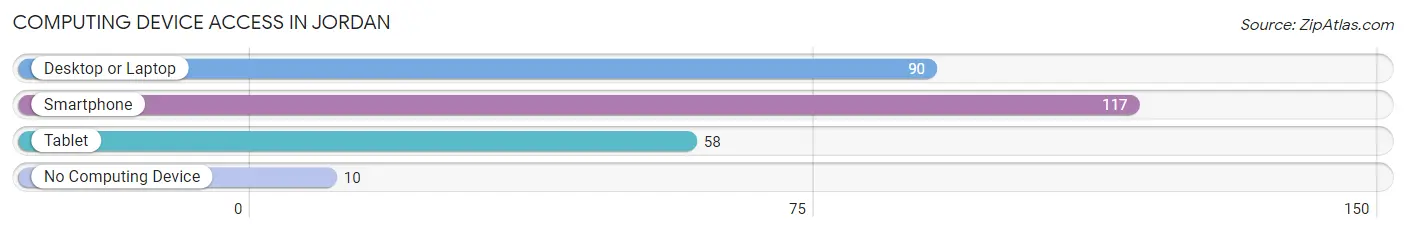
| Device Type | # Households | % Households |
| Desktop or Laptop | 90 | 57.3% |
| Smartphone | 117 | 74.5% |
| Tablet | 58 | 36.9% |
| No Computing Device | 10 | 6.4% |
| Total | 157 | 100.0% |
Internet Access in Jordan
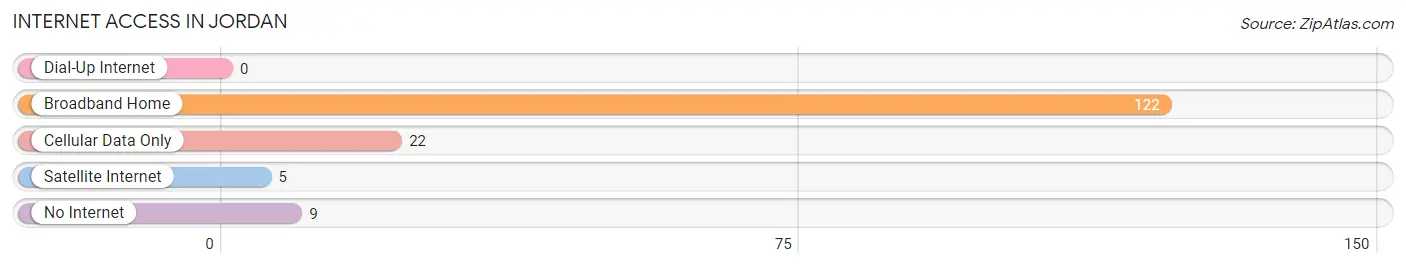
| Internet Type | # Households | % Households |
| Dial-Up Internet | 0 | 0.0% |
| Broadband Home | 122 | 77.7% |
| Cellular Data Only | 22 | 14.0% |
| Satellite Internet | 5 | 3.2% |
| No Internet | 9 | 5.7% |
| Total | 157 | 100.0% |
Jordan Summary
Jordan, Montana is a small town located in Garfield County in the northeastern part of the state. It is situated on the banks of the Missouri River, and is home to a population of just over 500 people. The town was founded in 1882 and has a rich history of ranching, farming, and mining.
Geography
Jordan is located in the Missouri River Valley, which is part of the Great Plains region of the United States. The town is situated on the banks of the Missouri River, and is surrounded by rolling hills and prairies. The town is located at an elevation of 3,000 feet, and the surrounding area is mostly flat. The climate in Jordan is semi-arid, with hot summers and cold winters.
Economy
The economy of Jordan is largely based on agriculture and ranching. The town is home to several large ranches, and the surrounding area is used for cattle and sheep grazing. The town also has a small manufacturing sector, which produces a variety of products, including furniture, clothing, and food products.
Demographics
As of the 2010 census, the population of Jordan was 514. The racial makeup of the town was 97.3% White, 0.2% African American, 0.4% Native American, 0.2% Asian, 0.2% from other races, and 1.9% from two or more races. The median household income in Jordan was $37,500, and the median family income was $41,250.
History
Jordan was founded in 1882 by a group of settlers from the Midwest. The town was named after the nearby Jordan River, which was named after the biblical river of the same name. The town quickly grew, and by the early 1900s, it had become a bustling center of commerce and industry. The town was home to several large ranches, and the surrounding area was used for cattle and sheep grazing. The town also had a thriving mining industry, and several mines were located in the area.
In the late 19th century, Jordan was a popular destination for tourists, and the town was home to several hotels and resorts. The town also had a thriving entertainment industry, and several theaters and dance halls were located in the area.
In the early 20th century, the town began to decline, and by the 1950s, the population had dropped to just over 500 people. The town has since seen a resurgence in population, and as of the 2010 census, the population was 514.
Today, Jordan is a small, rural town with a population of just over 500 people. The town is home to several large ranches, and the surrounding area is used for cattle and sheep grazing. The town also has a small manufacturing sector, which produces a variety of products, including furniture, clothing, and food products. The town is also home to several tourist attractions, including the Jordan Historical Museum and the Jordan River Valley Museum.
Common Questions
What is Per Capita Income in Jordan?
Per Capita income in Jordan is $32,528.
What is the Median Family Income in Jordan?
Median Family Income in Jordan is $88,750.
What is the Median Household income in Jordan?
Median Household Income in Jordan is $44,250.
What is Income or Wage Gap in Jordan?
Income or Wage Gap in Jordan is 44.9%.
Women in Jordan earn 55.1 cents for every dollar earned by a man.
What is Inequality or Gini Index in Jordan?
Inequality or Gini Index in Jordan is 0.42.
What is the Total Population of Jordan?
Total Population of Jordan is 327.
What is the Total Male Population of Jordan?
Total Male Population of Jordan is 154.
What is the Total Female Population of Jordan?
Total Female Population of Jordan is 173.
What is the Ratio of Males per 100 Females in Jordan?
There are 89.02 Males per 100 Females in Jordan.
What is the Ratio of Females per 100 Males in Jordan?
There are 112.34 Females per 100 Males in Jordan.
What is the Median Population Age in Jordan?
Median Population Age in Jordan is 47.1 Years.
What is the Average Family Size in Jordan
Average Family Size in Jordan is 2.9 People.
What is the Average Household Size in Jordan
Average Household Size in Jordan is 2.0 People.
How Large is the Labor Force in Jordan?
There are 184 People in the Labor Forcein in Jordan.
What is the Percentage of People in the Labor Force in Jordan?
67.9% of People are in the Labor Force in Jordan.