Bigfork, MT Map & Demographics
Bigfork Map
Bigfork Overview
$41,326
PER CAPITA INCOME
$90,417
AVG FAMILY INCOME
$73,443
AVG HOUSEHOLD INCOME
50.0%
WAGE / INCOME GAP [ % ]
50.0¢/ $1
WAGE / INCOME GAP [ $ ]
0.39
INEQUALITY / GINI INDEX
4,953
TOTAL POPULATION
2,423
MALE POPULATION
2,530
FEMALE POPULATION
95.77
MALES / 100 FEMALES
104.42
FEMALES / 100 MALES
54.2
MEDIAN AGE
3.0
AVG FAMILY SIZE
2.2
AVG HOUSEHOLD SIZE
1,972
LABOR FORCE [ PEOPLE ]
45.9%
PERCENT IN LABOR FORCE
3.5%
UNEMPLOYMENT RATE
Bigfork Zip Codes
Bigfork Area Codes
Income in Bigfork
Income Overview in Bigfork
Per Capita Income in Bigfork is $41,326, while median incomes of families and households are $90,417 and $73,443 respectively.
| Characteristic | Number | Measure |
| Per Capita Income | 4,953 | $41,326 |
| Median Family Income | 1,262 | $90,417 |
| Mean Family Income | 1,262 | $99,889 |
| Median Household Income | 2,236 | $73,443 |
| Mean Household Income | 2,236 | $88,188 |
| Income Deficit | 1,262 | $0 |
| Wage / Income Gap (%) | 4,953 | 49.96% |
| Wage / Income Gap ($) | 4,953 | 50.04¢ per $1 |
| Gini / Inequality Index | 4,953 | 0.39 |
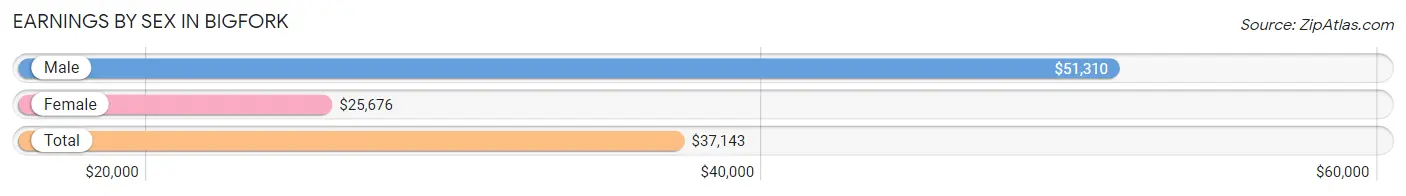
Earnings by Sex in Bigfork
Average Earnings in Bigfork are $37,143, $51,310 for men and $25,676 for women, a difference of 50.0%.
| Sex | Number | Average Earnings |
| Male | 1,288 (57.5%) | $51,310 |
| Female | 954 (42.5%) | $25,676 |
| Total | 2,242 (100.0%) | $37,143 |
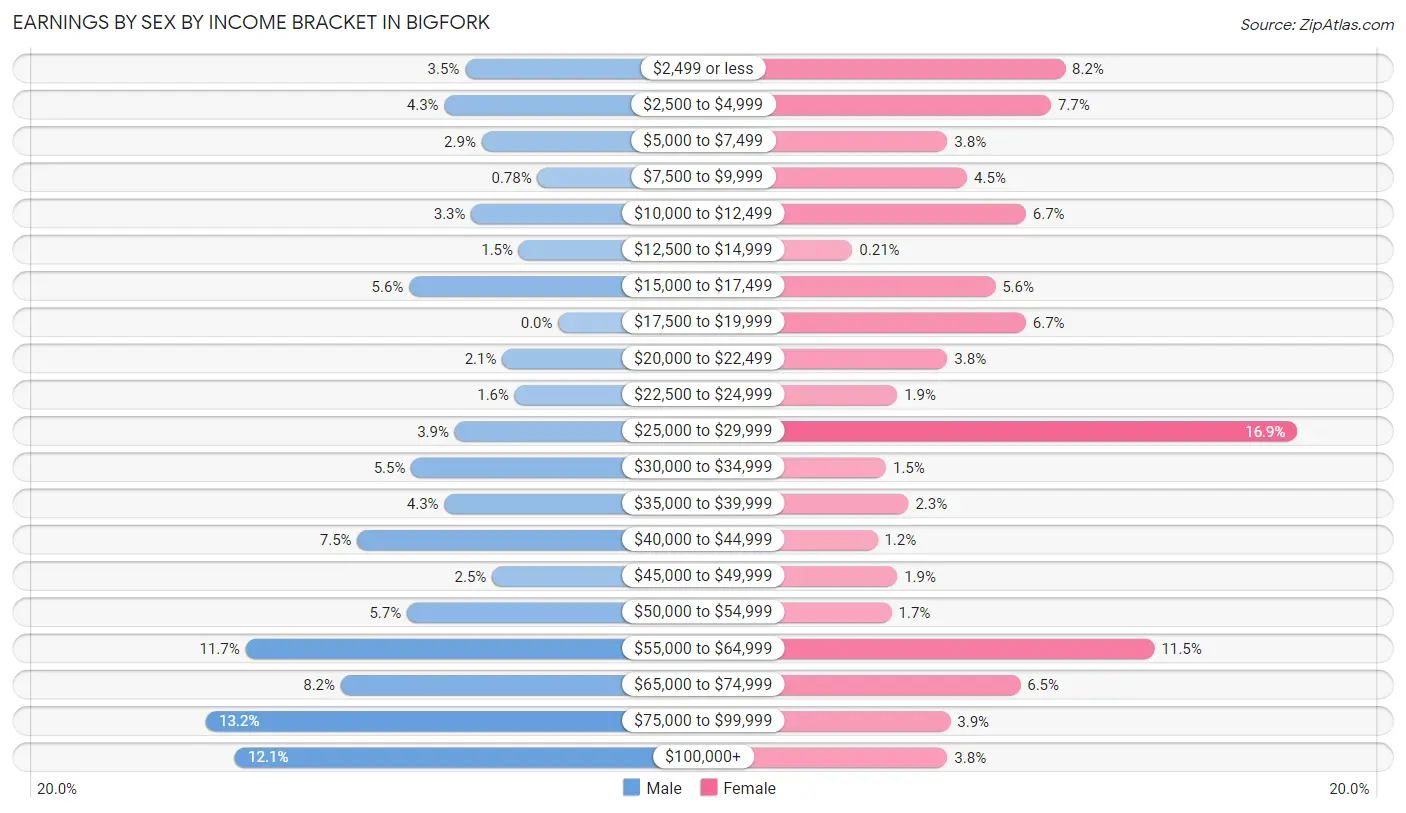
Earnings by Sex by Income Bracket in Bigfork
The most common earnings brackets in Bigfork are $75,000 to $99,999 for men (170 | 13.2%) and $25,000 to $29,999 for women (161 | 16.9%).
| Income | Male | Female |
| $2,499 or less | 45 (3.5%) | 78 (8.2%) |
| $2,500 to $4,999 | 55 (4.3%) | 73 (7.6%) |
| $5,000 to $7,499 | 37 (2.9%) | 36 (3.8%) |
| $7,500 to $9,999 | 10 (0.8%) | 43 (4.5%) |
| $10,000 to $12,499 | 42 (3.3%) | 64 (6.7%) |
| $12,500 to $14,999 | 19 (1.5%) | 2 (0.2%) |
| $15,000 to $17,499 | 72 (5.6%) | 53 (5.6%) |
| $17,500 to $19,999 | 0 (0.0%) | 64 (6.7%) |
| $20,000 to $22,499 | 27 (2.1%) | 36 (3.8%) |
| $22,500 to $24,999 | 21 (1.6%) | 18 (1.9%) |
| $25,000 to $29,999 | 50 (3.9%) | 161 (16.9%) |
| $30,000 to $34,999 | 71 (5.5%) | 14 (1.5%) |
| $35,000 to $39,999 | 55 (4.3%) | 22 (2.3%) |
| $40,000 to $44,999 | 97 (7.5%) | 11 (1.1%) |
| $45,000 to $49,999 | 32 (2.5%) | 18 (1.9%) |
| $50,000 to $54,999 | 73 (5.7%) | 16 (1.7%) |
| $55,000 to $64,999 | 151 (11.7%) | 110 (11.5%) |
| $65,000 to $74,999 | 105 (8.2%) | 62 (6.5%) |
| $75,000 to $99,999 | 170 (13.2%) | 37 (3.9%) |
| $100,000+ | 156 (12.1%) | 36 (3.8%) |
| Total | 1,288 (100.0%) | 954 (100.0%) |
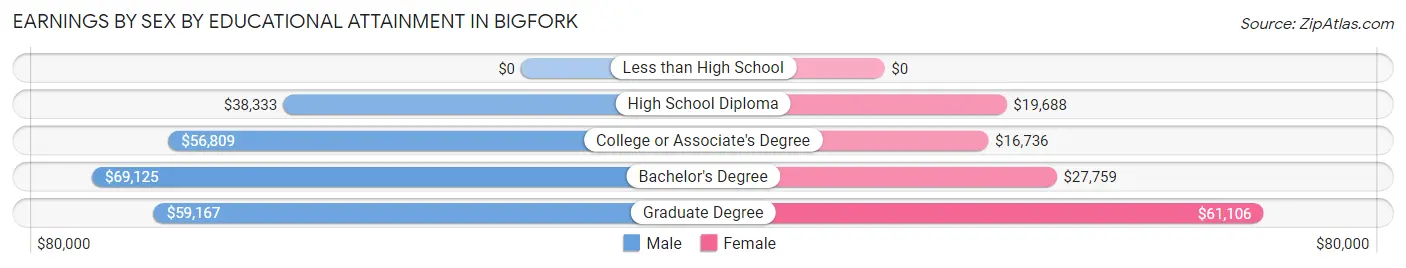
Earnings by Sex by Educational Attainment in Bigfork
Average earnings in Bigfork are $55,833 for men and $26,892 for women, a difference of 51.8%. Men with an educational attainment of bachelor's degree enjoy the highest average annual earnings of $69,125, while those with high school diploma education earn the least with $38,333. Women with an educational attainment of graduate degree earn the most with the average annual earnings of $61,106, while those with college or associate's degree education have the smallest earnings of $16,736.
| Educational Attainment | Male Income | Female Income |
| Less than High School | - | - |
| High School Diploma | $38,333 | $19,688 |
| College or Associate's Degree | $56,809 | $16,736 |
| Bachelor's Degree | $69,125 | $27,759 |
| Graduate Degree | $59,167 | $61,106 |
| Total | $55,833 | $26,892 |
Family Income in Bigfork
Family Income Brackets in Bigfork
According to the Bigfork family income data, there are 329 families falling into the $100,000 to $149,999 income range, which is the most common income bracket and makes up 26.1% of all families. Conversely, the $10,000 to $14,999 income bracket is the least frequent group with only 10 families (0.8%) belonging to this category.
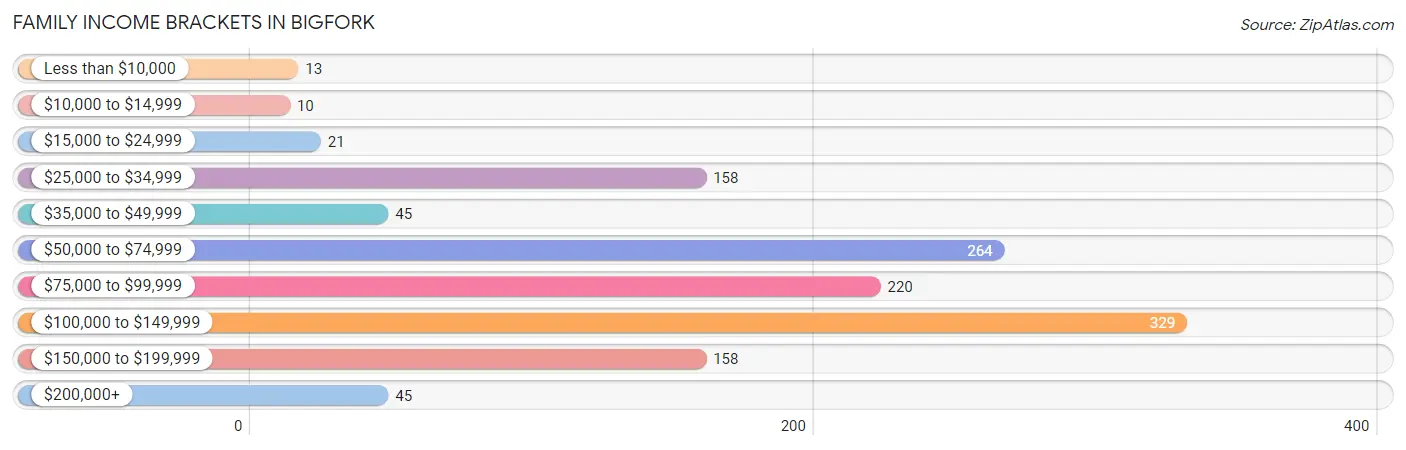
| Income Bracket | # Families | % Families |
| Less than $10,000 | 13 | 1.0% |
| $10,000 to $14,999 | 10 | 0.8% |
| $15,000 to $24,999 | 21 | 1.7% |
| $25,000 to $34,999 | 158 | 12.5% |
| $35,000 to $49,999 | 45 | 3.6% |
| $50,000 to $74,999 | 264 | 20.9% |
| $75,000 to $99,999 | 220 | 17.4% |
| $100,000 to $149,999 | 329 | 26.1% |
| $150,000 to $199,999 | 158 | 12.5% |
| $200,000+ | 45 | 3.6% |
Family Income by Famaliy Size in Bigfork
2-person families (821 | 65.1%) account for the highest median family income in Bigfork with $90,885 per family, while 2-person families (821 | 65.1%) have the highest median income of $45,442 per family member.
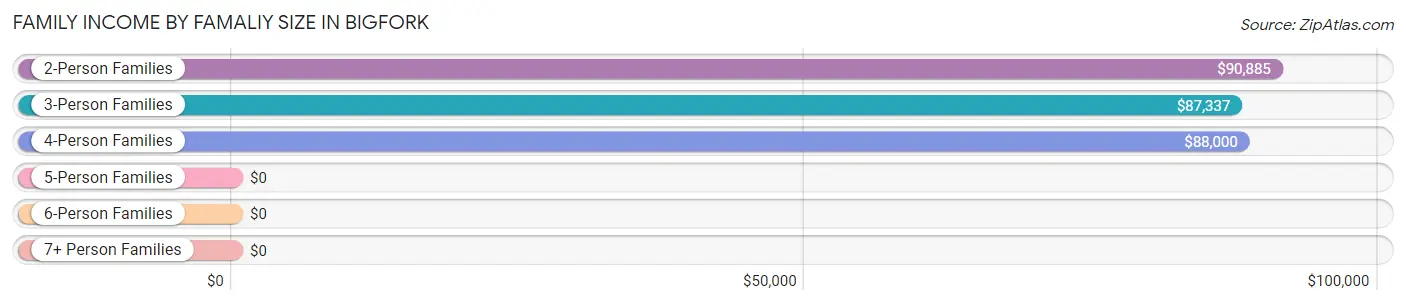
| Income Bracket | # Families | Median Income |
| 2-Person Families | 821 (65.1%) | $90,885 |
| 3-Person Families | 169 (13.4%) | $87,337 |
| 4-Person Families | 210 (16.6%) | $88,000 |
| 5-Person Families | 33 (2.6%) | $0 |
| 6-Person Families | 24 (1.9%) | $0 |
| 7+ Person Families | 5 (0.4%) | $0 |
| Total | 1,262 (100.0%) | $90,417 |
Family Income by Number of Earners in Bigfork
The median family income in Bigfork is $90,417, with families comprising 3+ earners (87) having the highest median family income of $131,125, while families with 1 earner (392) have the lowest median family income of $62,917, accounting for 6.9% and 31.1% of families, respectively.
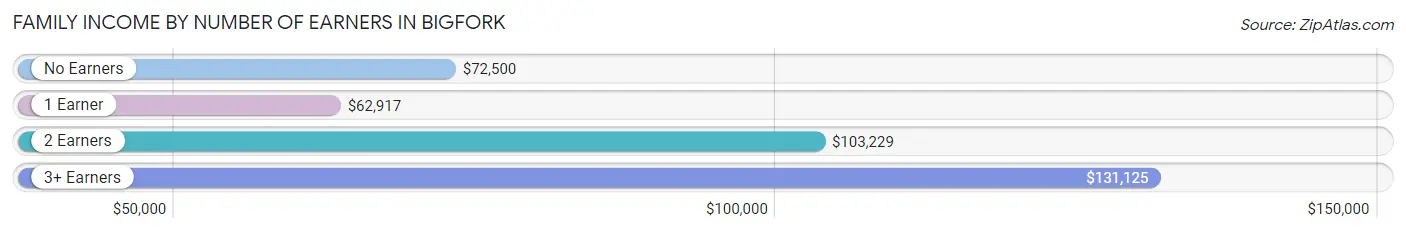
| Number of Earners | # Families | Median Income |
| No Earners | 366 (29.0%) | $72,500 |
| 1 Earner | 392 (31.1%) | $62,917 |
| 2 Earners | 417 (33.0%) | $103,229 |
| 3+ Earners | 87 (6.9%) | $131,125 |
| Total | 1,262 (100.0%) | $90,417 |
Household Income in Bigfork
Household Income Brackets in Bigfork
With 519 households falling in the category, the $100,000 to $149,999 income range is the most frequent in Bigfork, accounting for 23.2% of all households. In contrast, only 34 households (1.5%) fall into the less than $10,000 income bracket, making it the least populous group.
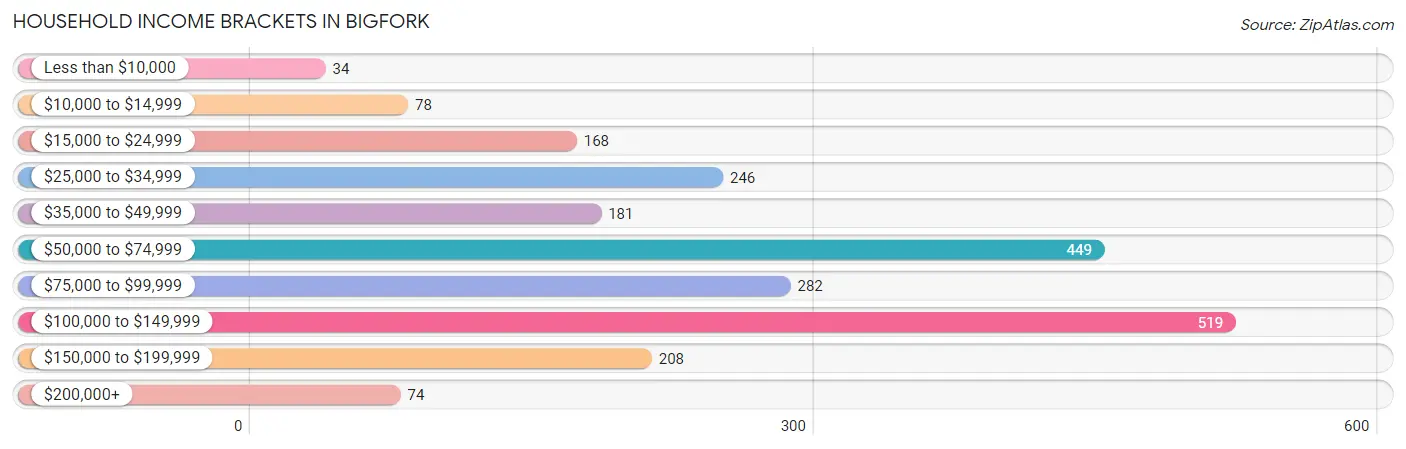
| Income Bracket | # Households | % Households |
| Less than $10,000 | 34 | 1.5% |
| $10,000 to $14,999 | 78 | 3.5% |
| $15,000 to $24,999 | 168 | 7.5% |
| $25,000 to $34,999 | 246 | 11.0% |
| $35,000 to $49,999 | 181 | 8.1% |
| $50,000 to $74,999 | 449 | 20.1% |
| $75,000 to $99,999 | 282 | 12.6% |
| $100,000 to $149,999 | 519 | 23.2% |
| $150,000 to $199,999 | 208 | 9.3% |
| $200,000+ | 74 | 3.3% |
Household Income by Householder Age in Bigfork
The median household income in Bigfork is $73,443, with the highest median household income of $86,042 found in the 45 to 64 years age bracket for the primary householder. A total of 740 households (33.1%) fall into this category.
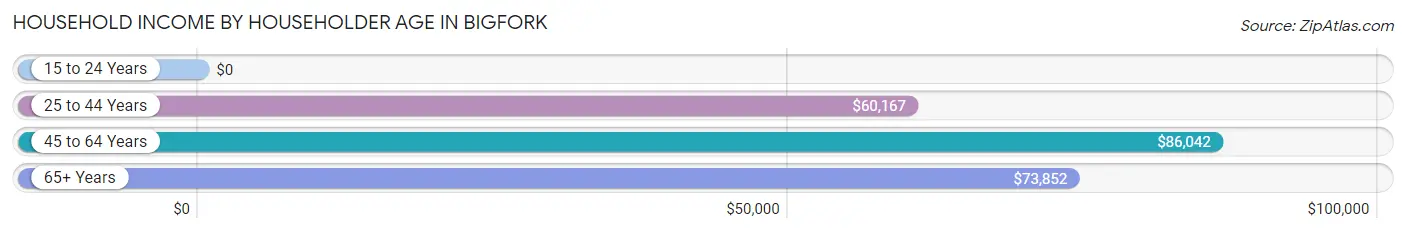
| Income Bracket | # Households | Median Income |
| 15 to 24 Years | 0 (0.0%) | $0 |
| 25 to 44 Years | 452 (20.2%) | $60,167 |
| 45 to 64 Years | 740 (33.1%) | $86,042 |
| 65+ Years | 1,044 (46.7%) | $73,852 |
| Total | 2,236 (100.0%) | $73,443 |
Poverty in Bigfork
Income Below Poverty by Sex and Age in Bigfork
With 3.6% poverty level for males and 6.6% for females among the residents of Bigfork, under 5 year old males and 16 and 17 year old females are the most vulnerable to poverty, with 8 males (11.0%) and 10 females (52.6%) in their respective age groups living below the poverty level.
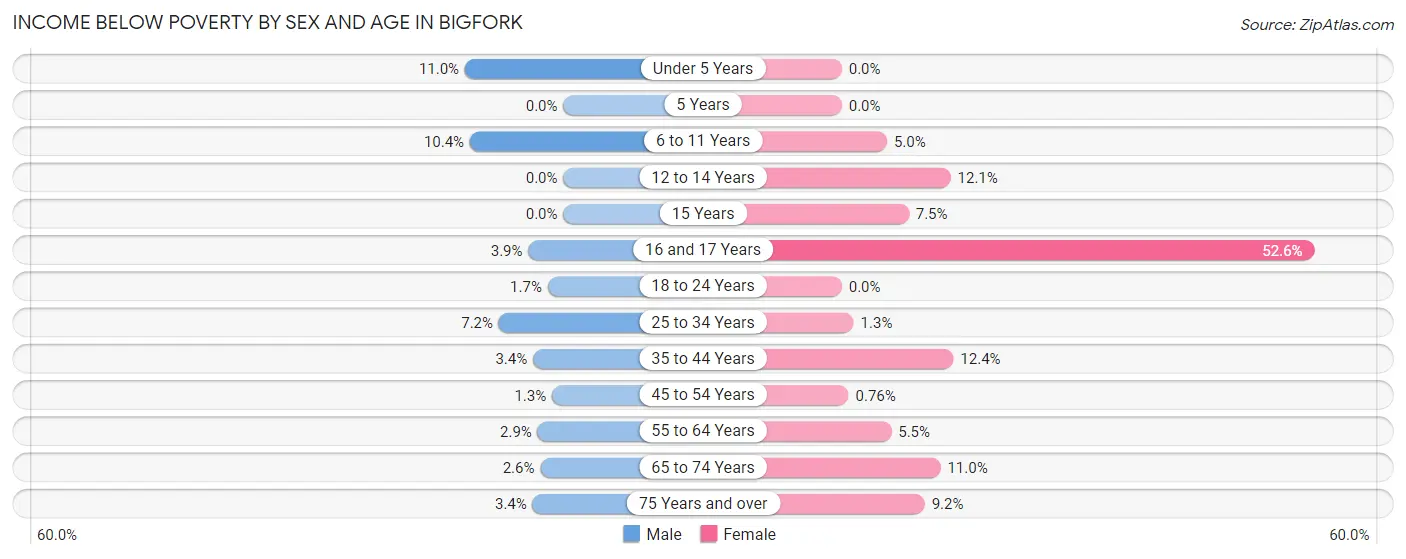
| Age Bracket | Male | Female |
| Under 5 Years | 8 (11.0%) | 0 (0.0%) |
| 5 Years | 0 (0.0%) | 0 (0.0%) |
| 6 to 11 Years | 13 (10.4%) | 8 (5.0%) |
| 12 to 14 Years | 0 (0.0%) | 12 (12.1%) |
| 15 Years | 0 (0.0%) | 5 (7.5%) |
| 16 and 17 Years | 3 (3.9%) | 10 (52.6%) |
| 18 to 24 Years | 3 (1.7%) | 0 (0.0%) |
| 25 to 34 Years | 15 (7.2%) | 3 (1.3%) |
| 35 to 44 Years | 9 (3.4%) | 22 (12.4%) |
| 45 to 54 Years | 3 (1.3%) | 2 (0.8%) |
| 55 to 64 Years | 12 (2.9%) | 25 (5.5%) |
| 65 to 74 Years | 11 (2.6%) | 42 (11.0%) |
| 75 Years and over | 10 (3.4%) | 34 (9.2%) |
| Total | 87 (3.6%) | 163 (6.6%) |
Income Above Poverty by Sex and Age in Bigfork
According to the poverty statistics in Bigfork, males aged 5 years and females aged under 5 years are the age groups that are most secure financially, with 100.0% of males and 100.0% of females in these age groups living above the poverty line.
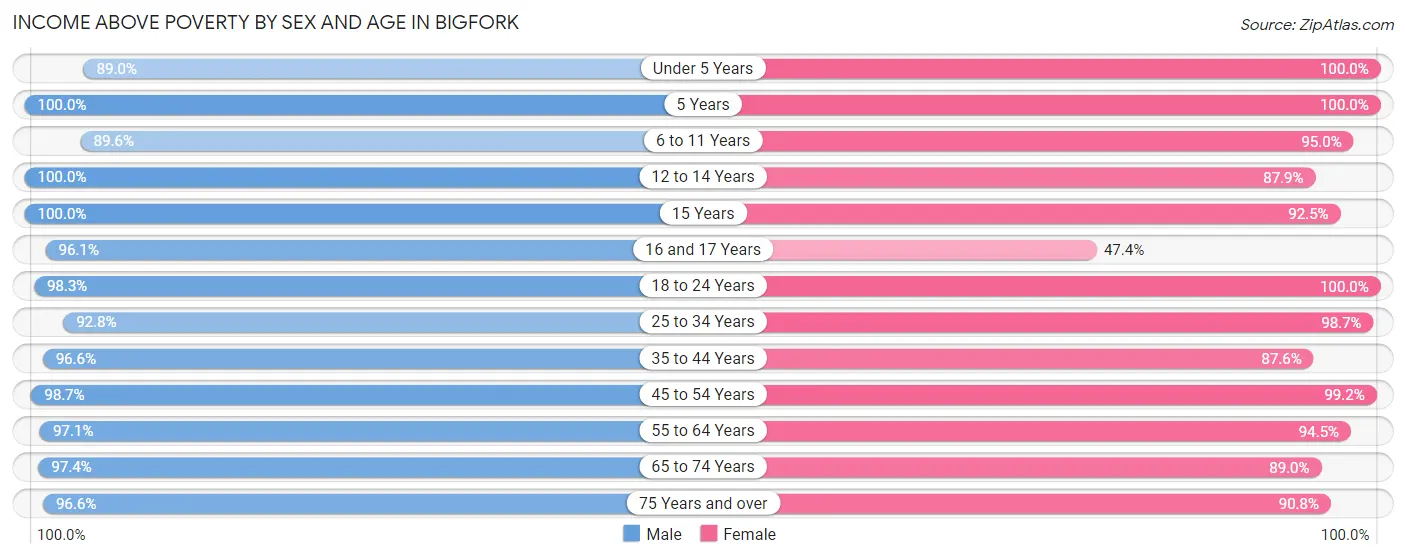
| Age Bracket | Male | Female |
| Under 5 Years | 65 (89.0%) | 3 (100.0%) |
| 5 Years | 9 (100.0%) | 25 (100.0%) |
| 6 to 11 Years | 112 (89.6%) | 151 (95.0%) |
| 12 to 14 Years | 57 (100.0%) | 87 (87.9%) |
| 15 Years | 40 (100.0%) | 62 (92.5%) |
| 16 and 17 Years | 74 (96.1%) | 9 (47.4%) |
| 18 to 24 Years | 169 (98.3%) | 239 (100.0%) |
| 25 to 34 Years | 194 (92.8%) | 225 (98.7%) |
| 35 to 44 Years | 258 (96.6%) | 155 (87.6%) |
| 45 to 54 Years | 235 (98.7%) | 262 (99.2%) |
| 55 to 64 Years | 407 (97.1%) | 429 (94.5%) |
| 65 to 74 Years | 417 (97.4%) | 340 (89.0%) |
| 75 Years and over | 282 (96.6%) | 334 (90.8%) |
| Total | 2,319 (96.4%) | 2,321 (93.4%) |
Income Below Poverty Among Married-Couple Families in Bigfork
The poverty statistics for married-couple families in Bigfork show that 2.9% or 32 of the total 1,091 families live below the poverty line. Families with 5 or more children have the highest poverty rate of 100.0%, comprising of 5 families. On the other hand, families with 1 or 2 children have the lowest poverty rate of 0.0%, which includes 0 families.
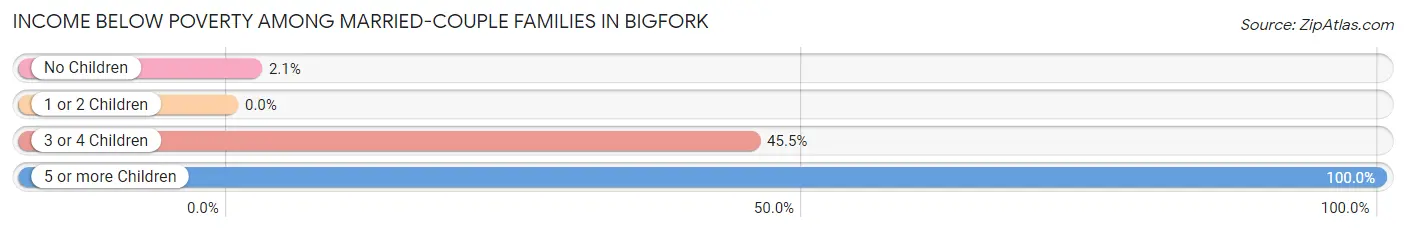
| Children | Above Poverty | Below Poverty |
| No Children | 800 (97.9%) | 17 (2.1%) |
| 1 or 2 Children | 247 (100.0%) | 0 (0.0%) |
| 3 or 4 Children | 12 (54.5%) | 10 (45.5%) |
| 5 or more Children | 0 (0.0%) | 5 (100.0%) |
| Total | 1,059 (97.1%) | 32 (2.9%) |
Income Below Poverty Among Single-Parent Households in Bigfork
According to the poverty data in Bigfork, 1.1% or 1 single-father households and 6.2% or 5 single-mother households are living below the poverty line. Among single-father households, those with 3 or 4 children have the highest poverty rate, with 1 households (100.0%) experiencing poverty. Likewise, among single-mother households, those with 3 or 4 children have the highest poverty rate, with 3 households (100.0%) falling below the poverty line.
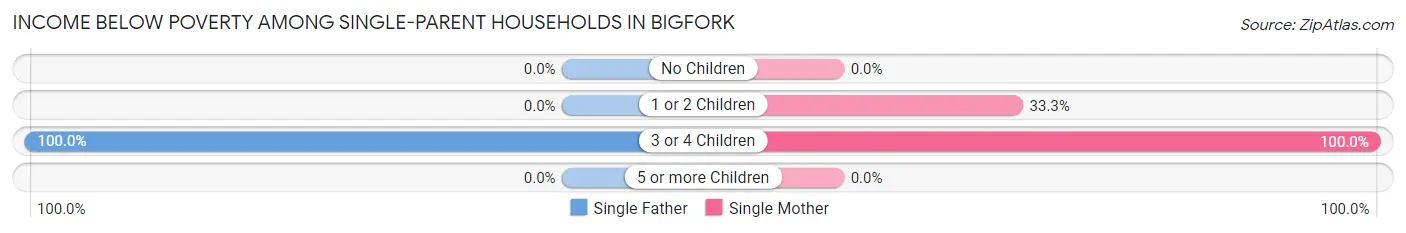
| Children | Single Father | Single Mother |
| No Children | 0 (0.0%) | 0 (0.0%) |
| 1 or 2 Children | 0 (0.0%) | 2 (33.3%) |
| 3 or 4 Children | 1 (100.0%) | 3 (100.0%) |
| 5 or more Children | 0 (0.0%) | 0 (0.0%) |
| Total | 1 (1.1%) | 5 (6.2%) |
Income Below Poverty Among Married-Couple vs Single-Parent Households in Bigfork
The poverty data for Bigfork shows that 32 of the married-couple family households (2.9%) and 6 of the single-parent households (3.5%) are living below the poverty level. Within the married-couple family households, those with 5 or more children have the highest poverty rate, with 5 households (100.0%) falling below the poverty line. Among the single-parent households, those with 3 or 4 children have the highest poverty rate, with 4 household (100.0%) living below poverty.
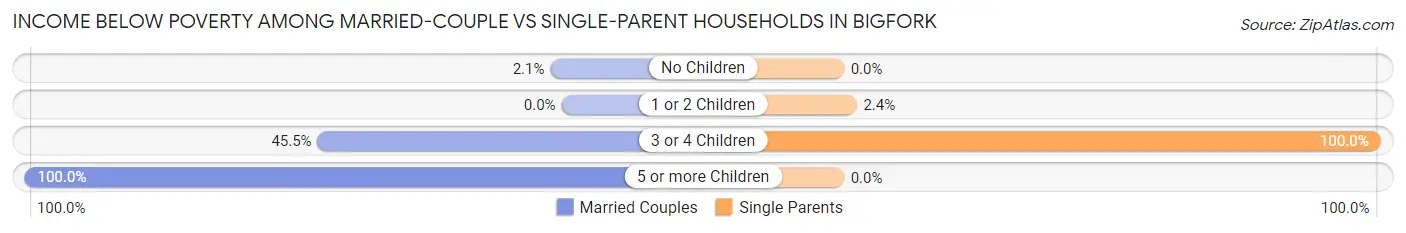
| Children | Married-Couple Families | Single-Parent Households |
| No Children | 17 (2.1%) | 0 (0.0%) |
| 1 or 2 Children | 0 (0.0%) | 2 (2.4%) |
| 3 or 4 Children | 10 (45.5%) | 4 (100.0%) |
| 5 or more Children | 5 (100.0%) | 0 (0.0%) |
| Total | 32 (2.9%) | 6 (3.5%) |
Race in Bigfork
The most populous races in Bigfork are White / Caucasian (4,294 | 86.7%), Two or more Races (462 | 9.3%), and Hispanic or Latino (452 | 9.1%).
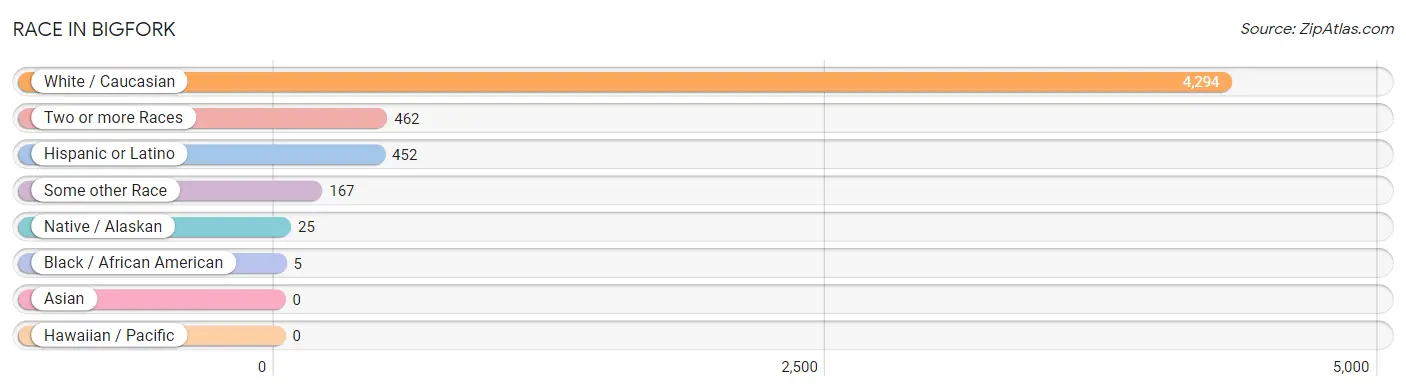
| Race | # Population | % Population |
| Asian | 0 | 0.0% |
| Black / African American | 5 | 0.1% |
| Hawaiian / Pacific | 0 | 0.0% |
| Hispanic or Latino | 452 | 9.1% |
| Native / Alaskan | 25 | 0.5% |
| White / Caucasian | 4,294 | 86.7% |
| Two or more Races | 462 | 9.3% |
| Some other Race | 167 | 3.4% |
| Total | 4,953 | 100.0% |
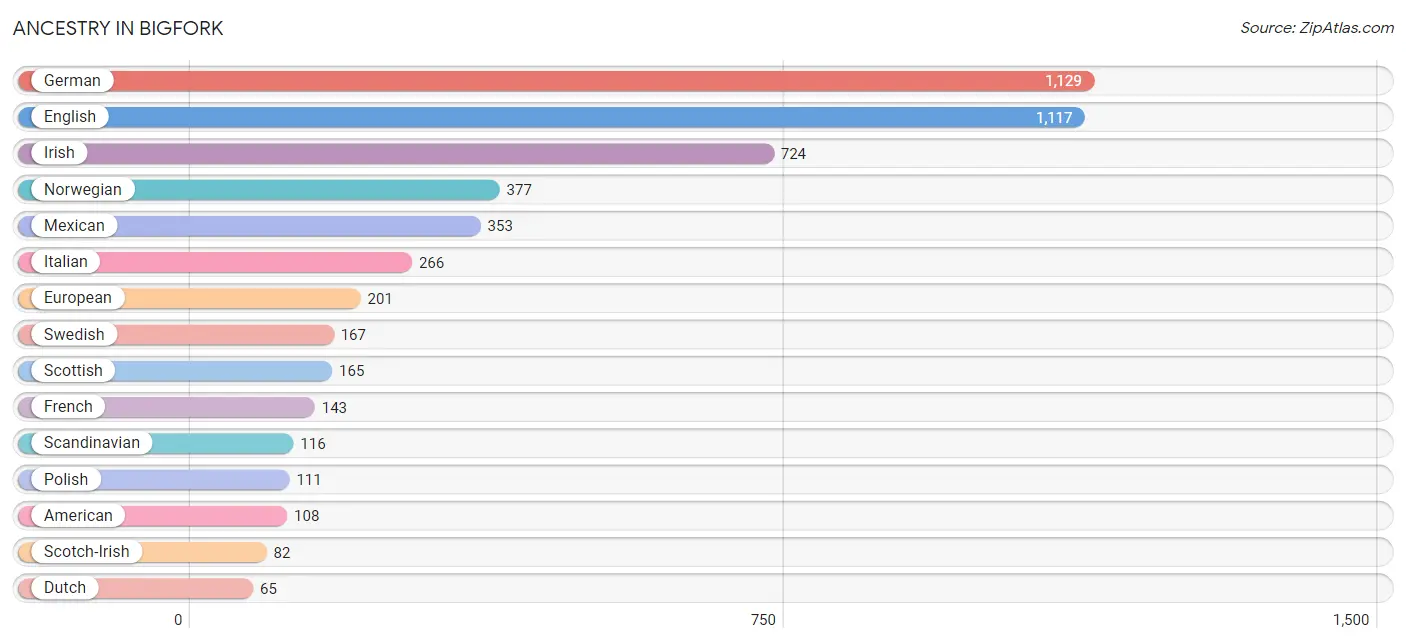
Ancestry in Bigfork
The most populous ancestries reported in Bigfork are German (1,129 | 22.8%), English (1,117 | 22.6%), Irish (724 | 14.6%), Norwegian (377 | 7.6%), and Mexican (353 | 7.1%), together accounting for 74.7% of all Bigfork residents.
| Ancestry | # Population | % Population |
| American | 108 | 2.2% |
| Apache | 28 | 0.6% |
| Arab | 26 | 0.5% |
| Austrian | 27 | 0.5% |
| Bhutanese | 5 | 0.1% |
| Blackfeet | 3 | 0.1% |
| British | 23 | 0.5% |
| Celtic | 12 | 0.2% |
| Cherokee | 5 | 0.1% |
| Cheyenne | 16 | 0.3% |
| Chilean | 29 | 0.6% |
| Chippewa | 30 | 0.6% |
| Choctaw | 9 | 0.2% |
| Czech | 7 | 0.1% |
| Czechoslovakian | 11 | 0.2% |
| Danish | 51 | 1.0% |
| Dutch | 65 | 1.3% |
| Eastern European | 11 | 0.2% |
| English | 1,117 | 22.6% |
| European | 201 | 4.1% |
| Finnish | 5 | 0.1% |
| French | 143 | 2.9% |
| French Canadian | 50 | 1.0% |
| German | 1,129 | 22.8% |
| Hungarian | 21 | 0.4% |
| Inupiat | 12 | 0.2% |
| Irish | 724 | 14.6% |
| Italian | 266 | 5.4% |
| Lebanese | 26 | 0.5% |
| Mexican | 353 | 7.1% |
| Native Hawaiian | 3 | 0.1% |
| Norwegian | 377 | 7.6% |
| Pennsylvania German | 3 | 0.1% |
| Polish | 111 | 2.2% |
| Portuguese | 62 | 1.3% |
| Russian | 28 | 0.6% |
| Scandinavian | 116 | 2.3% |
| Scotch-Irish | 82 | 1.7% |
| Scottish | 165 | 3.3% |
| Seminole | 10 | 0.2% |
| Serbian | 9 | 0.2% |
| Slovak | 26 | 0.5% |
| Slovene | 13 | 0.3% |
| South American | 29 | 0.6% |
| South American Indian | 19 | 0.4% |
| Spaniard | 65 | 1.3% |
| Spanish | 2 | 0.0% |
| Swedish | 167 | 3.4% |
| Swiss | 18 | 0.4% |
| Ukrainian | 39 | 0.8% |
| Welsh | 60 | 1.2% | View All 51 Rows |
Immigrants in Bigfork
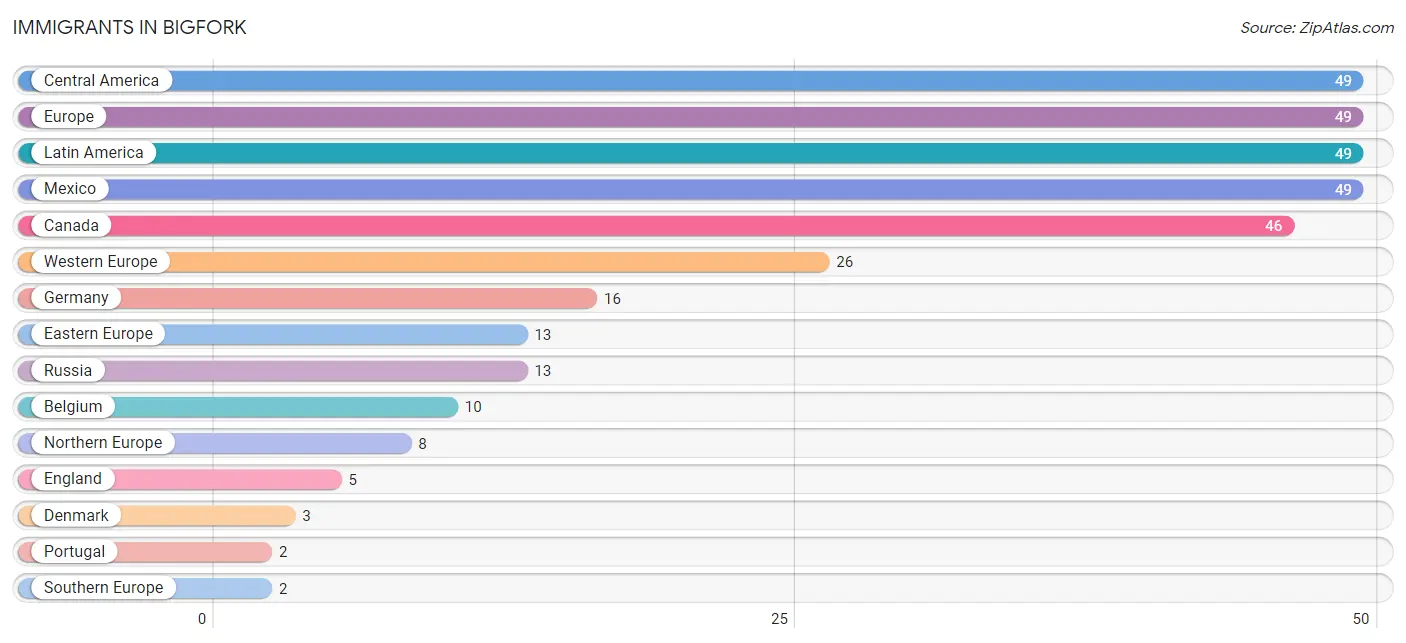
The most numerous immigrant groups reported in Bigfork came from Central America (49 | 1.0%), Europe (49 | 1.0%), Latin America (49 | 1.0%), Mexico (49 | 1.0%), and Canada (46 | 0.9%), together accounting for 4.9% of all Bigfork residents.
| Immigration Origin | # Population | % Population |
| Belgium | 10 | 0.2% |
| Canada | 46 | 0.9% |
| Central America | 49 | 1.0% |
| Denmark | 3 | 0.1% |
| Eastern Europe | 13 | 0.3% |
| England | 5 | 0.1% |
| Europe | 49 | 1.0% |
| Germany | 16 | 0.3% |
| Latin America | 49 | 1.0% |
| Mexico | 49 | 1.0% |
| Northern Europe | 8 | 0.2% |
| Portugal | 2 | 0.0% |
| Russia | 13 | 0.3% |
| Southern Europe | 2 | 0.0% |
| Western Europe | 26 | 0.5% | View All 15 Rows |
Sex and Age in Bigfork
Sex and Age in Bigfork
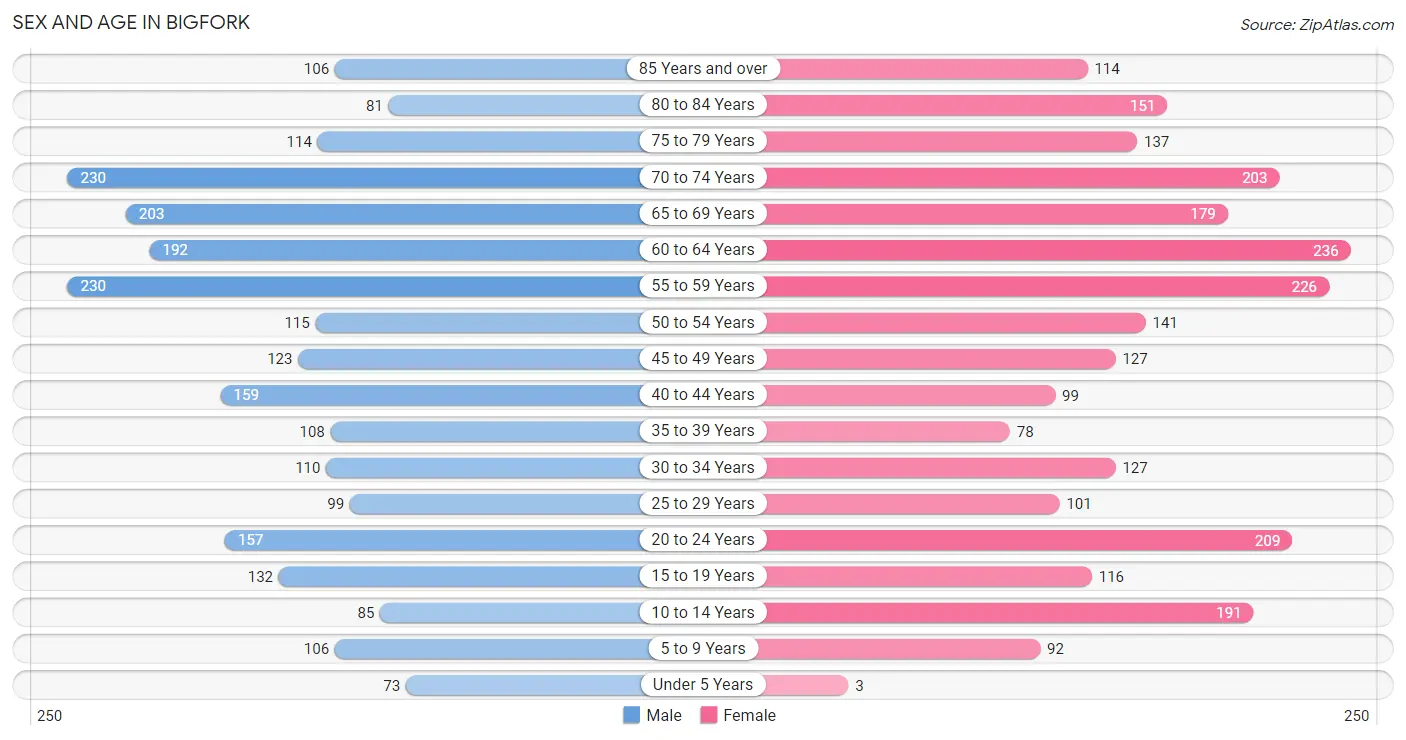
The most populous age groups in Bigfork are 55 to 59 Years (230 | 9.5%) for men and 60 to 64 Years (236 | 9.3%) for women.
| Age Bracket | Male | Female |
| Under 5 Years | 73 (3.0%) | 3 (0.1%) |
| 5 to 9 Years | 106 (4.4%) | 92 (3.6%) |
| 10 to 14 Years | 85 (3.5%) | 191 (7.5%) |
| 15 to 19 Years | 132 (5.4%) | 116 (4.6%) |
| 20 to 24 Years | 157 (6.5%) | 209 (8.3%) |
| 25 to 29 Years | 99 (4.1%) | 101 (4.0%) |
| 30 to 34 Years | 110 (4.5%) | 127 (5.0%) |
| 35 to 39 Years | 108 (4.5%) | 78 (3.1%) |
| 40 to 44 Years | 159 (6.6%) | 99 (3.9%) |
| 45 to 49 Years | 123 (5.1%) | 127 (5.0%) |
| 50 to 54 Years | 115 (4.8%) | 141 (5.6%) |
| 55 to 59 Years | 230 (9.5%) | 226 (8.9%) |
| 60 to 64 Years | 192 (7.9%) | 236 (9.3%) |
| 65 to 69 Years | 203 (8.4%) | 179 (7.1%) |
| 70 to 74 Years | 230 (9.5%) | 203 (8.0%) |
| 75 to 79 Years | 114 (4.7%) | 137 (5.4%) |
| 80 to 84 Years | 81 (3.3%) | 151 (6.0%) |
| 85 Years and over | 106 (4.4%) | 114 (4.5%) |
| Total | 2,423 (100.0%) | 2,530 (100.0%) |
Families and Households in Bigfork
Median Family Size in Bigfork
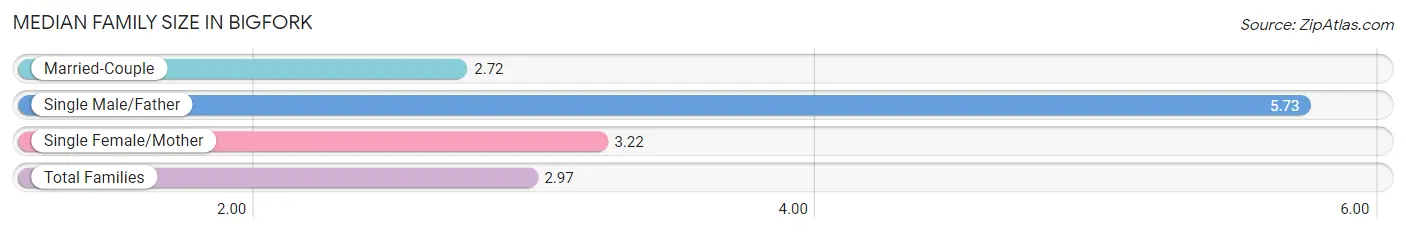
The median family size in Bigfork is 2.97 persons per family, with single male/father families (90 | 7.1%) accounting for the largest median family size of 5.73 persons per family. On the other hand, married-couple families (1,091 | 86.5%) represent the smallest median family size with 2.72 persons per family.
| Family Type | # Families | Family Size |
| Married-Couple | 1,091 (86.5%) | 2.72 |
| Single Male/Father | 90 (7.1%) | 5.73 |
| Single Female/Mother | 81 (6.4%) | 3.22 |
| Total Families | 1,262 (100.0%) | 2.97 |
Median Household Size in Bigfork
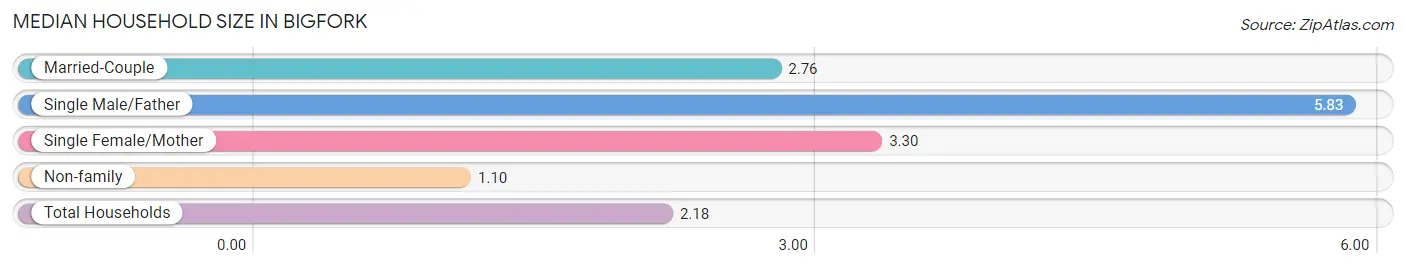
The median household size in Bigfork is 2.18 persons per household, with single male/father households (90 | 4.0%) accounting for the largest median household size of 5.83 persons per household. non-family households (974 | 43.6%) represent the smallest median household size with 1.10 persons per household.
| Household Type | # Households | Household Size |
| Married-Couple | 1,091 (48.8%) | 2.76 |
| Single Male/Father | 90 (4.0%) | 5.83 |
| Single Female/Mother | 81 (3.6%) | 3.30 |
| Non-family | 974 (43.6%) | 1.10 |
| Total Households | 2,236 (100.0%) | 2.18 |
Household Size by Marriage Status in Bigfork
Out of a total of 2,236 households in Bigfork, 1,262 (56.4%) are family households, while 974 (43.6%) are nonfamily households. The most numerous type of family households are 2-person households, comprising 811, and the most common type of nonfamily households are 1-person households, comprising 890.
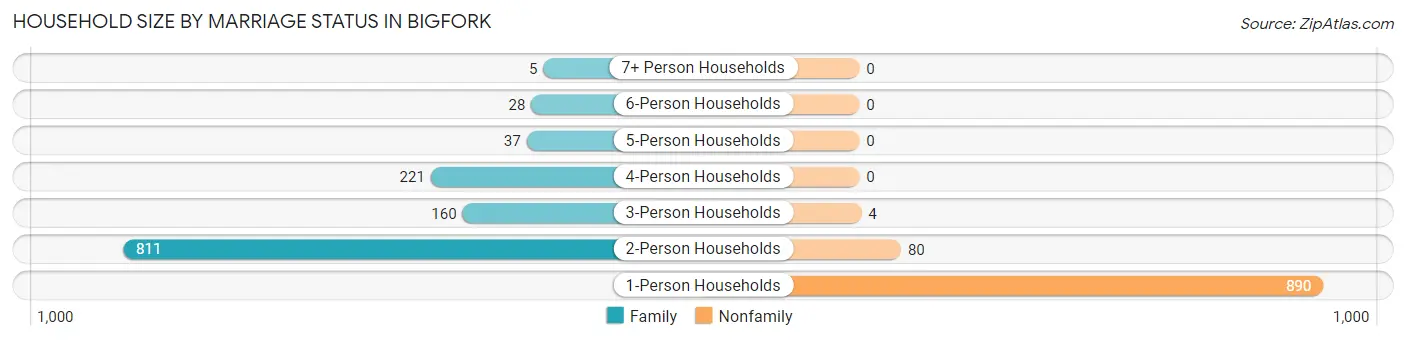
| Household Size | Family Households | Nonfamily Households |
| 1-Person Households | - | 890 (39.8%) |
| 2-Person Households | 811 (36.3%) | 80 (3.6%) |
| 3-Person Households | 160 (7.2%) | 4 (0.2%) |
| 4-Person Households | 221 (9.9%) | 0 (0.0%) |
| 5-Person Households | 37 (1.7%) | 0 (0.0%) |
| 6-Person Households | 28 (1.3%) | 0 (0.0%) |
| 7+ Person Households | 5 (0.2%) | 0 (0.0%) |
| Total | 1,262 (56.4%) | 974 (43.6%) |
Female Fertility in Bigfork
Fertility by Age in Bigfork
Average fertility rate in Bigfork is 10.0 births per 1,000 women. Women in the age bracket of 20 to 34 years have the highest fertility rate with 16.0 births per 1,000 women. Women in the age bracket of 20 to 34 years acount for 77.8% of all women with births.
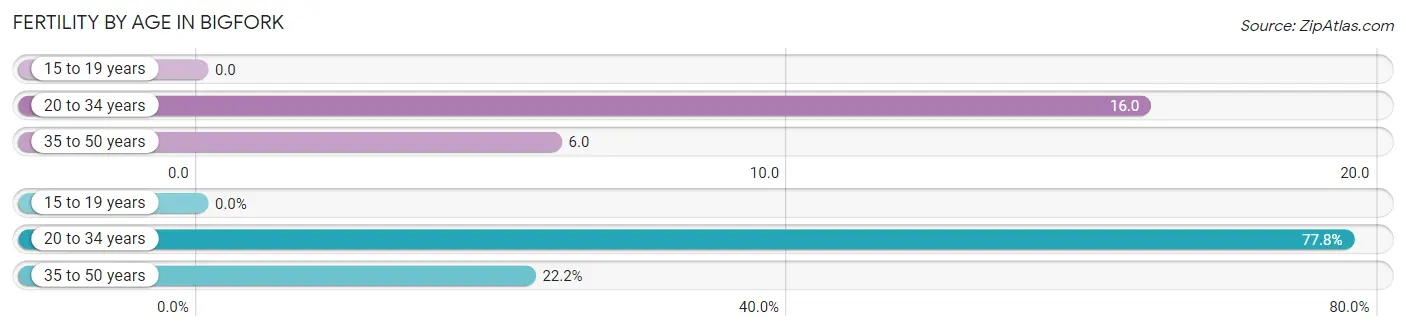
| Age Bracket | Women with Births | Births / 1,000 Women |
| 15 to 19 years | 0 (0.0%) | 0.0 |
| 20 to 34 years | 7 (77.8%) | 16.0 |
| 35 to 50 years | 2 (22.2%) | 6.0 |
| Total | 9 (100.0%) | 10.0 |
Fertility by Age by Marriage Status in Bigfork
66.7% of women with births (9) in Bigfork are married. The highest percentage of unmarried women with births falls into 20 to 34 years age bracket with 42.9% of them unmarried at the time of birth, while the lowest percentage of unmarried women with births belong to 35 to 50 years age bracket with 0.0% of them unmarried.
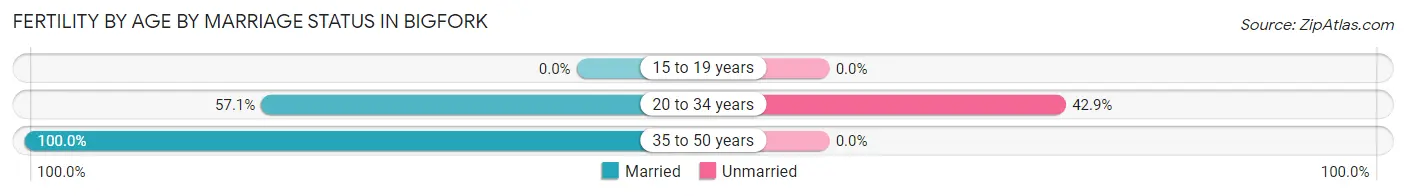
| Age Bracket | Married | Unmarried |
| 15 to 19 years | 0 (0.0%) | 0 (0.0%) |
| 20 to 34 years | 4 (57.1%) | 3 (42.9%) |
| 35 to 50 years | 2 (100.0%) | 0 (0.0%) |
| Total | 6 (66.7%) | 3 (33.3%) |
Fertility by Education in Bigfork
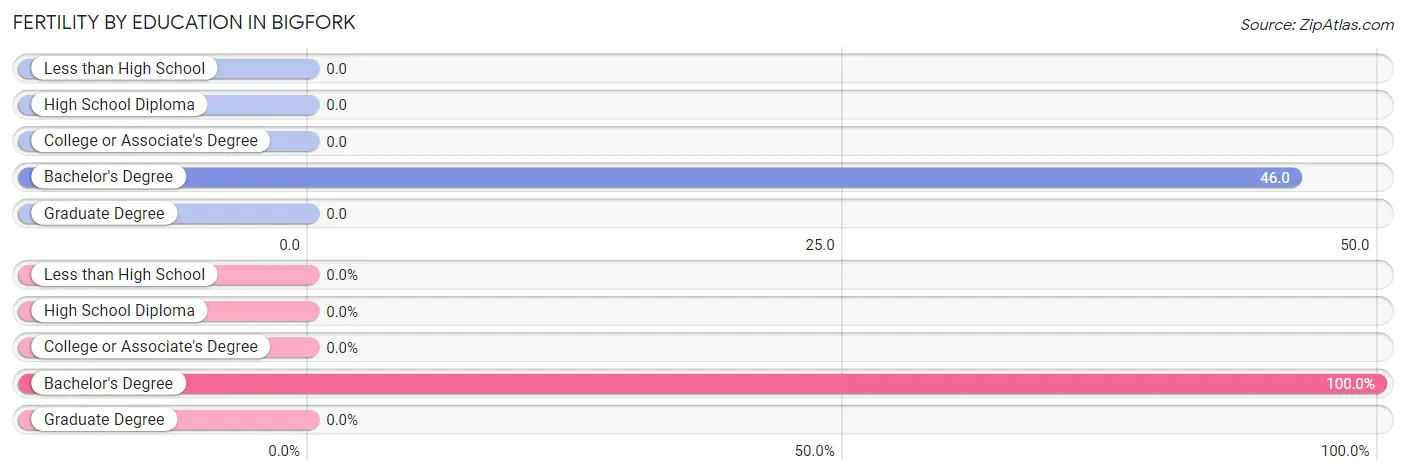
| Educational Attainment | Women with Births | Births / 1,000 Women |
| Less than High School | 0 (0.0%) | 0.0 |
| High School Diploma | 0 (0.0%) | 0.0 |
| College or Associate's Degree | 0 (0.0%) | 0.0 |
| Bachelor's Degree | 9 (100.0%) | 46.0 |
| Graduate Degree | 0 (0.0%) | 0.0 |
| Total | 9 (100.0%) | 10.0 |
Fertility by Education by Marriage Status in Bigfork
33.3% of women with births in Bigfork are unmarried. Women with the educational attainment of bachelor's degree are most likely to be married with 66.7% of them married at childbirth, while women with the educational attainment of bachelor's degree are least likely to be married with 33.3% of them unmarried at childbirth.
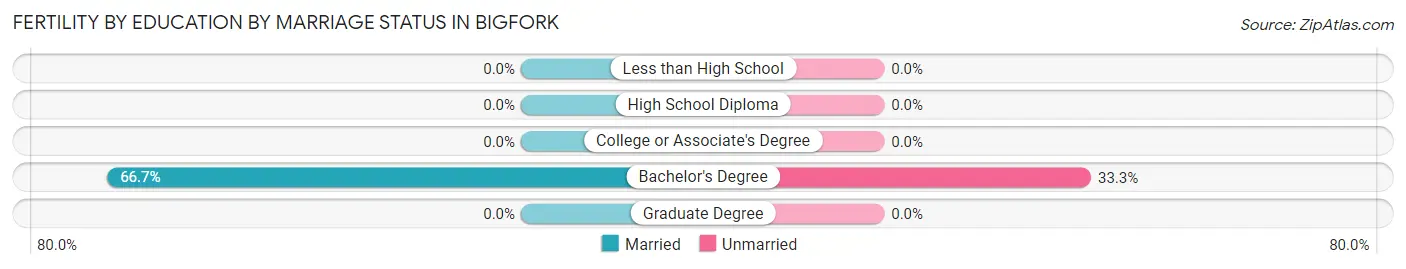
| Educational Attainment | Married | Unmarried |
| Less than High School | 0 (0.0%) | 0 (0.0%) |
| High School Diploma | 0 (0.0%) | 0 (0.0%) |
| College or Associate's Degree | 0 (0.0%) | 0 (0.0%) |
| Bachelor's Degree | 6 (66.7%) | 3 (33.3%) |
| Graduate Degree | 0 (0.0%) | 0 (0.0%) |
| Total | 6 (66.7%) | 3 (33.3%) |
Employment Characteristics in Bigfork
Employment by Class of Employer in Bigfork
Among the 1,876 employed individuals in Bigfork, private company employees (1,014 | 54.0%), self-employed (not incorporated) (231 | 12.3%), and self-employed (incorporated) (213 | 11.4%) make up the most common classes of employment.
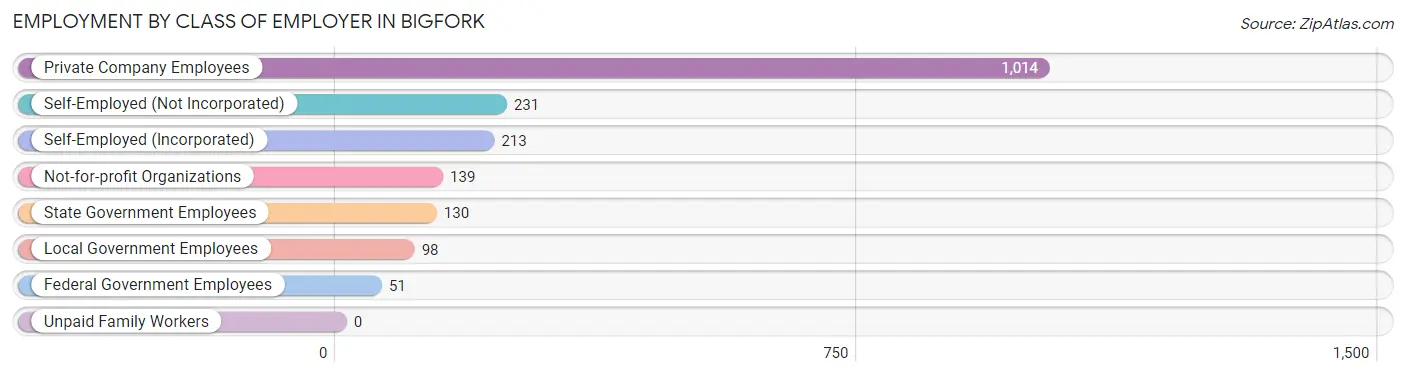
| Employer Class | # Employees | % Employees |
| Private Company Employees | 1,014 | 54.0% |
| Self-Employed (Incorporated) | 213 | 11.4% |
| Self-Employed (Not Incorporated) | 231 | 12.3% |
| Not-for-profit Organizations | 139 | 7.4% |
| Local Government Employees | 98 | 5.2% |
| State Government Employees | 130 | 6.9% |
| Federal Government Employees | 51 | 2.7% |
| Unpaid Family Workers | 0 | 0.0% |
| Total | 1,876 | 100.0% |
Employment Status by Age in Bigfork
According to the labor force statistics for Bigfork, out of the total population over 16 years of age (4,296), 45.9% or 1,972 individuals are in the labor force, with 3.5% or 69 of them unemployed. The age group with the highest labor force participation rate is 30 to 34 years, with 94.9% or 225 individuals in the labor force. Within the labor force, the 60 to 64 years age range has the highest percentage of unemployed individuals, with 18.9% or 36 of them being unemployed.
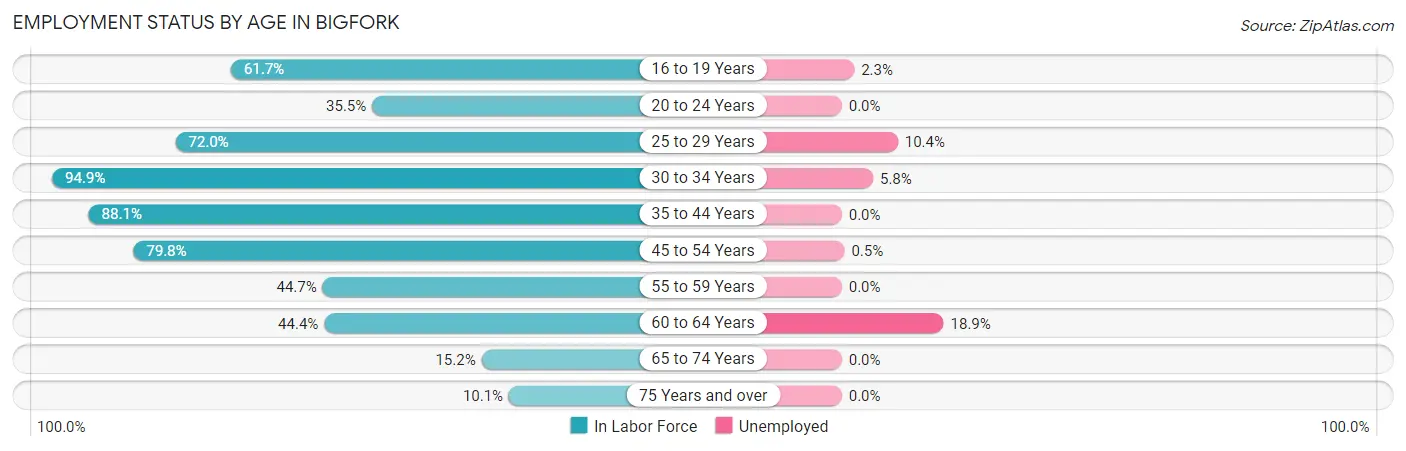
| Age Bracket | In Labor Force | Unemployed |
| 16 to 19 Years | 87 (61.7%) | 2 (2.3%) |
| 20 to 24 Years | 130 (35.5%) | 0 (0.0%) |
| 25 to 29 Years | 144 (72.0%) | 15 (10.4%) |
| 30 to 34 Years | 225 (94.9%) | 13 (5.8%) |
| 35 to 44 Years | 391 (88.1%) | 0 (0.0%) |
| 45 to 54 Years | 404 (79.8%) | 2 (0.5%) |
| 55 to 59 Years | 204 (44.7%) | 0 (0.0%) |
| 60 to 64 Years | 190 (44.4%) | 36 (18.9%) |
| 65 to 74 Years | 124 (15.2%) | 0 (0.0%) |
| 75 Years and over | 71 (10.1%) | 0 (0.0%) |
| Total | 1,972 (45.9%) | 69 (3.5%) |
Employment Status by Educational Attainment in Bigfork
According to labor force statistics for Bigfork, 68.6% of individuals (1,558) out of the total population between 25 and 64 years of age (2,271) are in the labor force, with 4.2% or 65 of them being unemployed. The group with the highest labor force participation rate are those with the educational attainment of high school diploma, with 80.5% or 310 individuals in the labor force. Within the labor force, individuals with college / associate degree education have the highest percentage of unemployment, with 10.4% or 51 of them being unemployed.
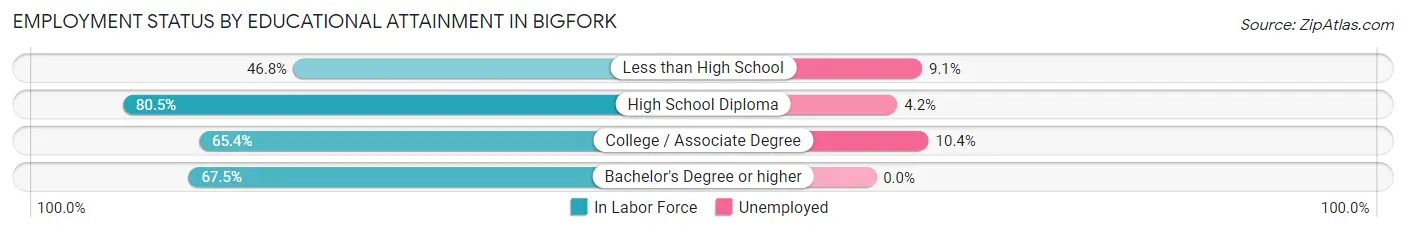
| Educational Attainment | In Labor Force | Unemployed |
| Less than High School | 22 (46.8%) | 4 (9.1%) |
| High School Diploma | 310 (80.5%) | 16 (4.2%) |
| College / Associate Degree | 492 (65.4%) | 78 (10.4%) |
| Bachelor's Degree or higher | 734 (67.5%) | 0 (0.0%) |
| Total | 1,558 (68.6%) | 95 (4.2%) |
Employment Occupations by Sex in Bigfork
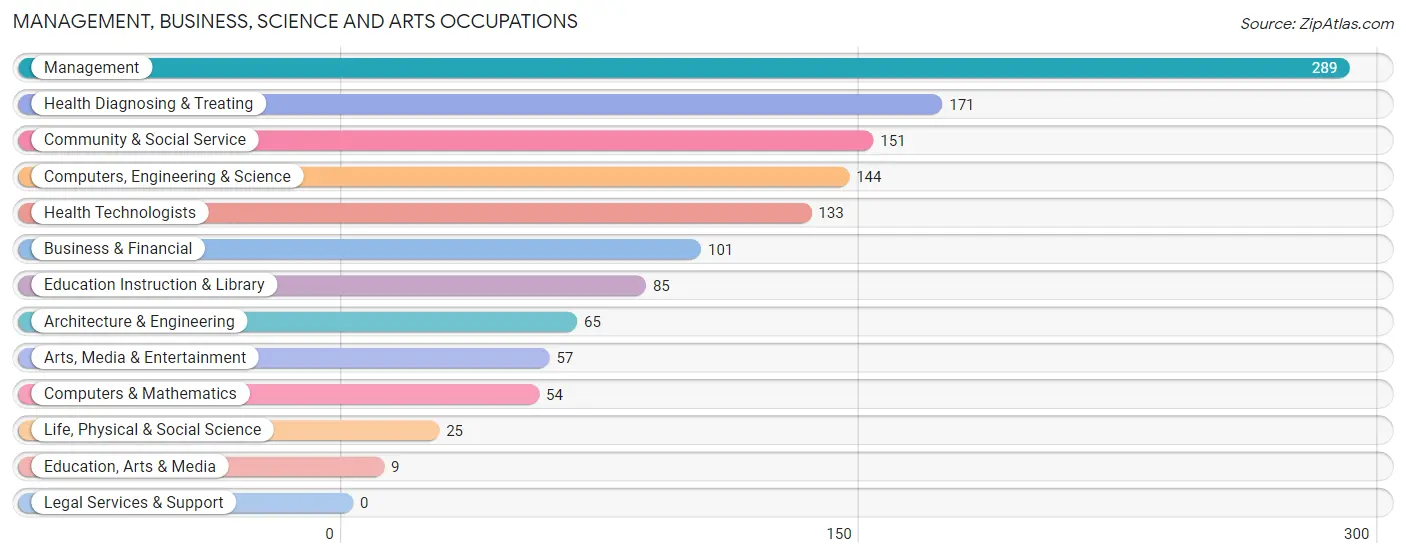
Management, Business, Science and Arts Occupations
The most common Management, Business, Science and Arts occupations in Bigfork are Management (289 | 15.2%), Health Diagnosing & Treating (171 | 9.0%), Community & Social Service (151 | 7.9%), Computers, Engineering & Science (144 | 7.6%), and Health Technologists (133 | 7.0%).
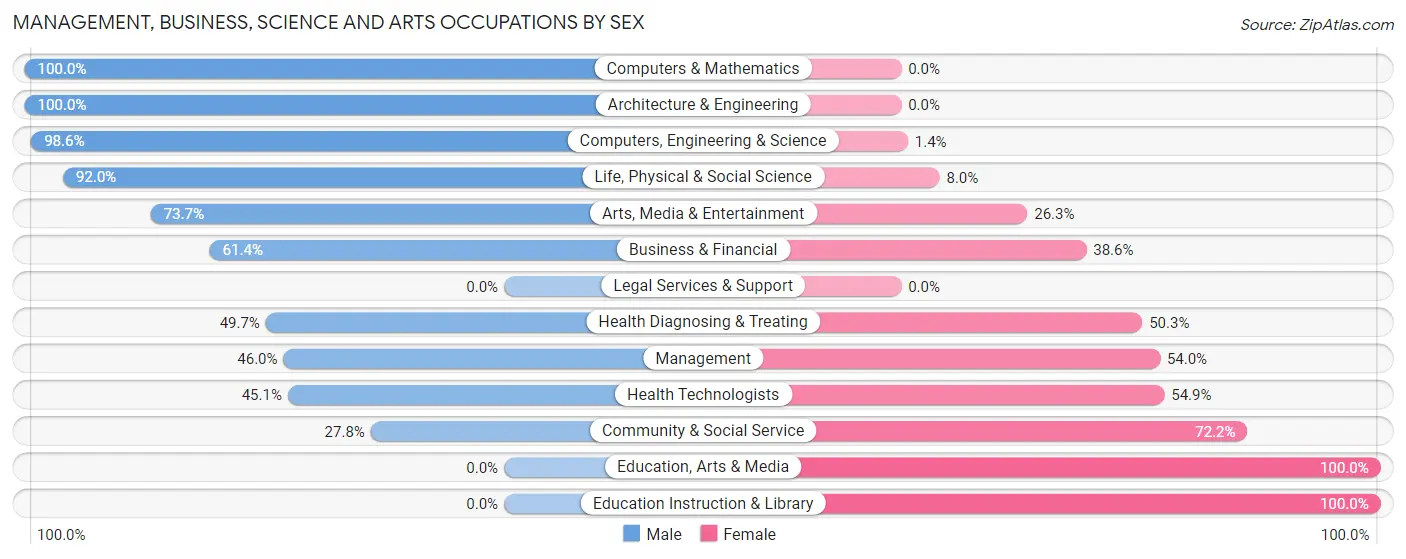
Management, Business, Science and Arts Occupations by Sex
Within the Management, Business, Science and Arts occupations in Bigfork, the most male-oriented occupations are Computers & Mathematics (100.0%), Architecture & Engineering (100.0%), and Computers, Engineering & Science (98.6%), while the most female-oriented occupations are Education, Arts & Media (100.0%), Education Instruction & Library (100.0%), and Community & Social Service (72.2%).
| Occupation | Male | Female |
| Management | 133 (46.0%) | 156 (54.0%) |
| Business & Financial | 62 (61.4%) | 39 (38.6%) |
| Computers, Engineering & Science | 142 (98.6%) | 2 (1.4%) |
| Computers & Mathematics | 54 (100.0%) | 0 (0.0%) |
| Architecture & Engineering | 65 (100.0%) | 0 (0.0%) |
| Life, Physical & Social Science | 23 (92.0%) | 2 (8.0%) |
| Community & Social Service | 42 (27.8%) | 109 (72.2%) |
| Education, Arts & Media | 0 (0.0%) | 9 (100.0%) |
| Legal Services & Support | 0 (0.0%) | 0 (0.0%) |
| Education Instruction & Library | 0 (0.0%) | 85 (100.0%) |
| Arts, Media & Entertainment | 42 (73.7%) | 15 (26.3%) |
| Health Diagnosing & Treating | 85 (49.7%) | 86 (50.3%) |
| Health Technologists | 60 (45.1%) | 73 (54.9%) |
| Total (Category) | 464 (54.2%) | 392 (45.8%) |
| Total (Overall) | 1,122 (59.0%) | 780 (41.0%) |
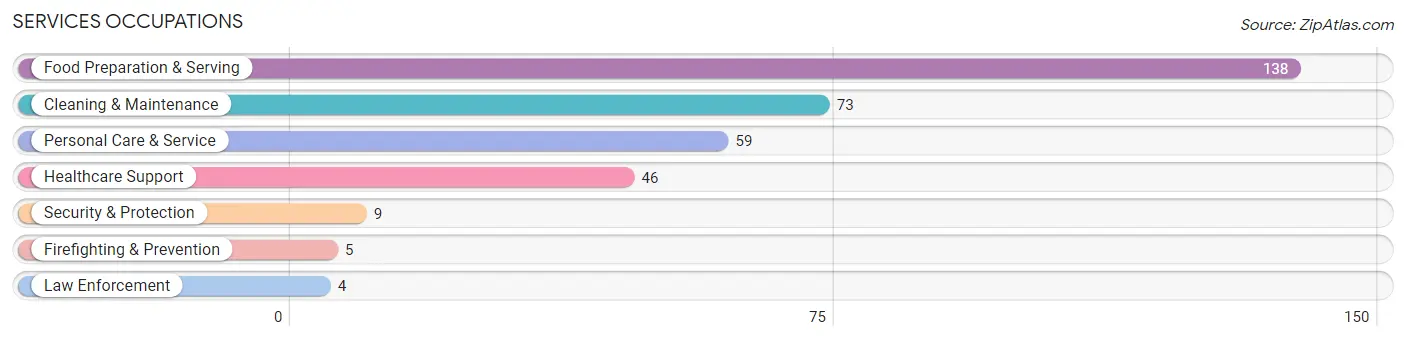
Services Occupations
The most common Services occupations in Bigfork are Food Preparation & Serving (138 | 7.3%), Cleaning & Maintenance (73 | 3.8%), Personal Care & Service (59 | 3.1%), Healthcare Support (46 | 2.4%), and Security & Protection (9 | 0.5%).
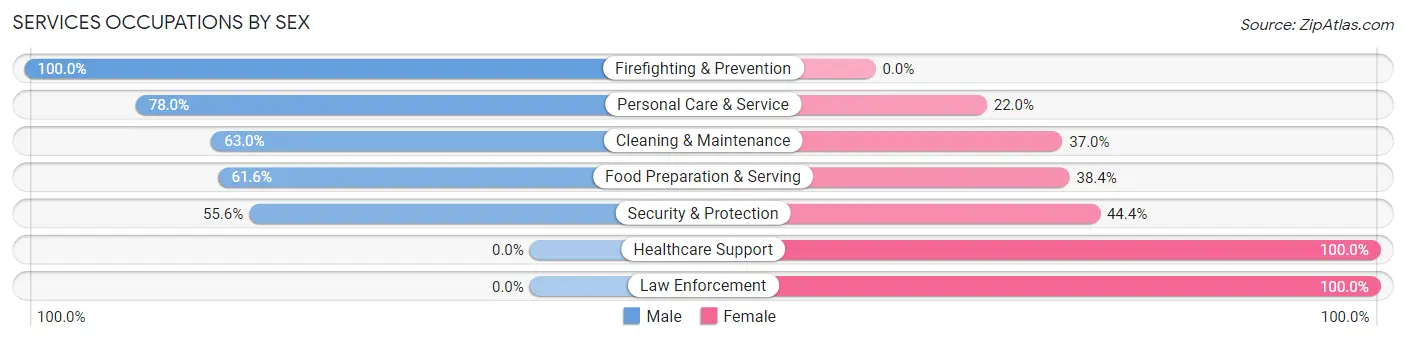
Services Occupations by Sex
Within the Services occupations in Bigfork, the most male-oriented occupations are Firefighting & Prevention (100.0%), Personal Care & Service (78.0%), and Cleaning & Maintenance (63.0%), while the most female-oriented occupations are Healthcare Support (100.0%), Law Enforcement (100.0%), and Security & Protection (44.4%).
| Occupation | Male | Female |
| Healthcare Support | 0 (0.0%) | 46 (100.0%) |
| Security & Protection | 5 (55.6%) | 4 (44.4%) |
| Firefighting & Prevention | 5 (100.0%) | 0 (0.0%) |
| Law Enforcement | 0 (0.0%) | 4 (100.0%) |
| Food Preparation & Serving | 85 (61.6%) | 53 (38.4%) |
| Cleaning & Maintenance | 46 (63.0%) | 27 (37.0%) |
| Personal Care & Service | 46 (78.0%) | 13 (22.0%) |
| Total (Category) | 182 (56.0%) | 143 (44.0%) |
| Total (Overall) | 1,122 (59.0%) | 780 (41.0%) |
Sales and Office Occupations
The most common Sales and Office occupations in Bigfork are Sales & Related (253 | 13.3%), and Office & Administration (127 | 6.7%).
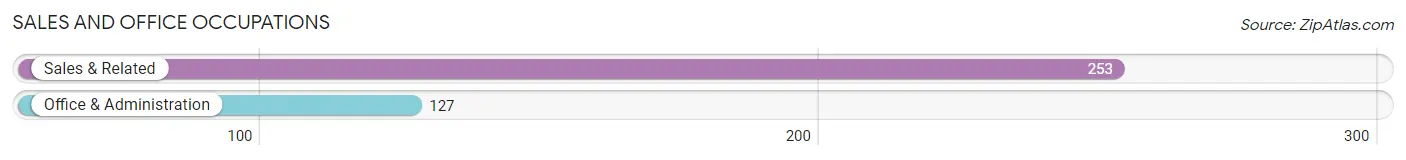
Sales and Office Occupations by Sex
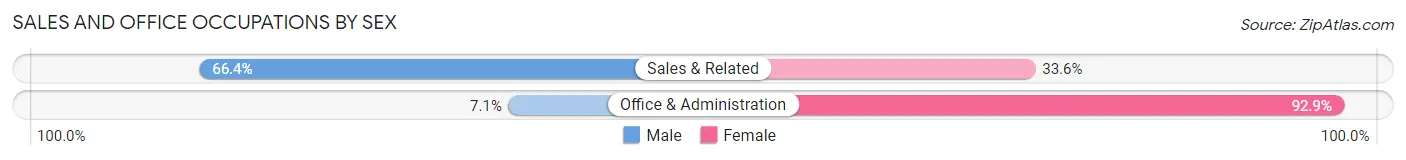
| Occupation | Male | Female |
| Sales & Related | 168 (66.4%) | 85 (33.6%) |
| Office & Administration | 9 (7.1%) | 118 (92.9%) |
| Total (Category) | 177 (46.6%) | 203 (53.4%) |
| Total (Overall) | 1,122 (59.0%) | 780 (41.0%) |
Natural Resources, Construction and Maintenance Occupations
The most common Natural Resources, Construction and Maintenance occupations in Bigfork are Construction & Extraction (148 | 7.8%), Installation, Maintenance & Repair (49 | 2.6%), and Farming, Fishing & Forestry (30 | 1.6%).
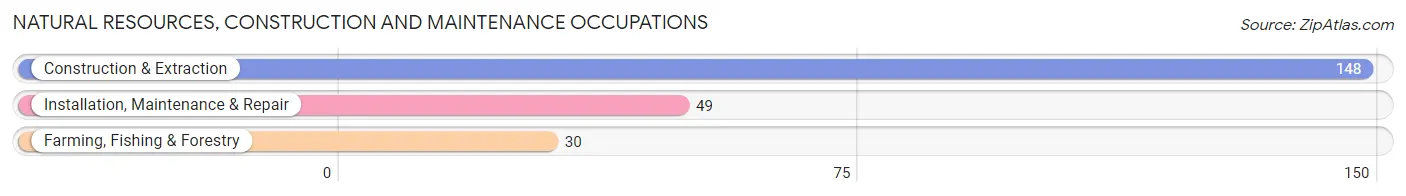
Natural Resources, Construction and Maintenance Occupations by Sex
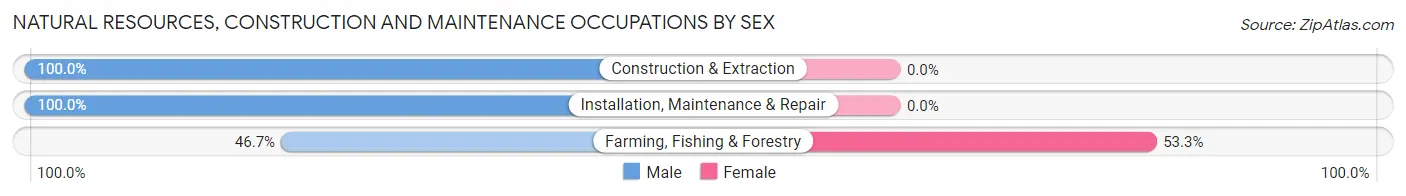
| Occupation | Male | Female |
| Farming, Fishing & Forestry | 14 (46.7%) | 16 (53.3%) |
| Construction & Extraction | 148 (100.0%) | 0 (0.0%) |
| Installation, Maintenance & Repair | 49 (100.0%) | 0 (0.0%) |
| Total (Category) | 211 (92.9%) | 16 (7.0%) |
| Total (Overall) | 1,122 (59.0%) | 780 (41.0%) |
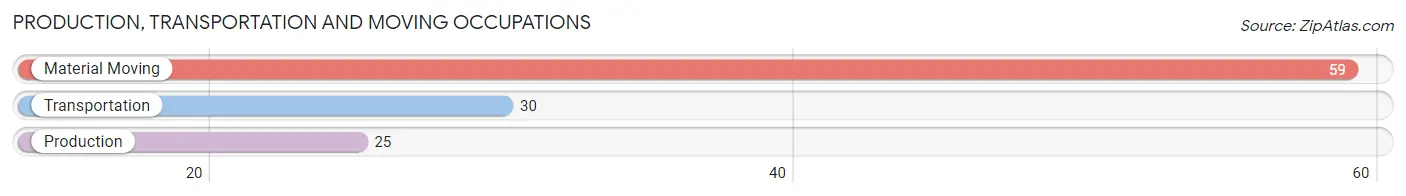
Production, Transportation and Moving Occupations
The most common Production, Transportation and Moving occupations in Bigfork are Material Moving (59 | 3.1%), Transportation (30 | 1.6%), and Production (25 | 1.3%).
Production, Transportation and Moving Occupations by Sex
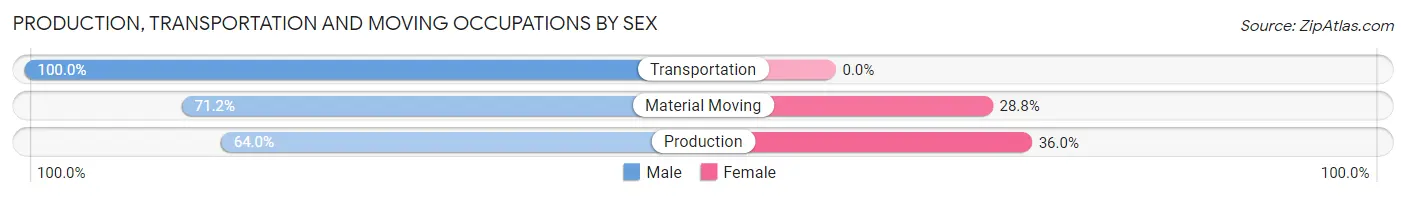
| Occupation | Male | Female |
| Production | 16 (64.0%) | 9 (36.0%) |
| Transportation | 30 (100.0%) | 0 (0.0%) |
| Material Moving | 42 (71.2%) | 17 (28.8%) |
| Total (Category) | 88 (77.2%) | 26 (22.8%) |
| Total (Overall) | 1,122 (59.0%) | 780 (41.0%) |
Employment Industries by Sex in Bigfork
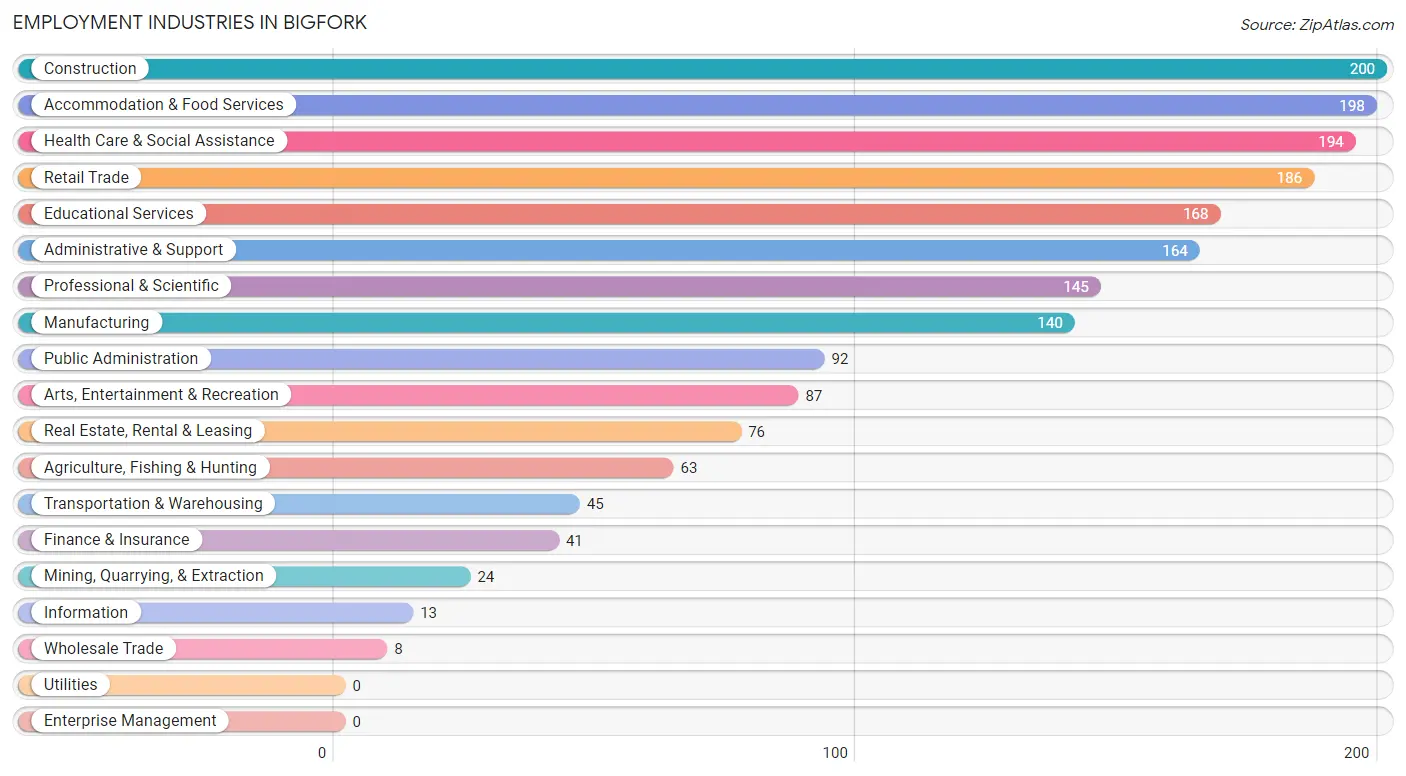
Employment Industries in Bigfork
The major employment industries in Bigfork include Construction (200 | 10.5%), Accommodation & Food Services (198 | 10.4%), Health Care & Social Assistance (194 | 10.2%), Retail Trade (186 | 9.8%), and Educational Services (168 | 8.8%).
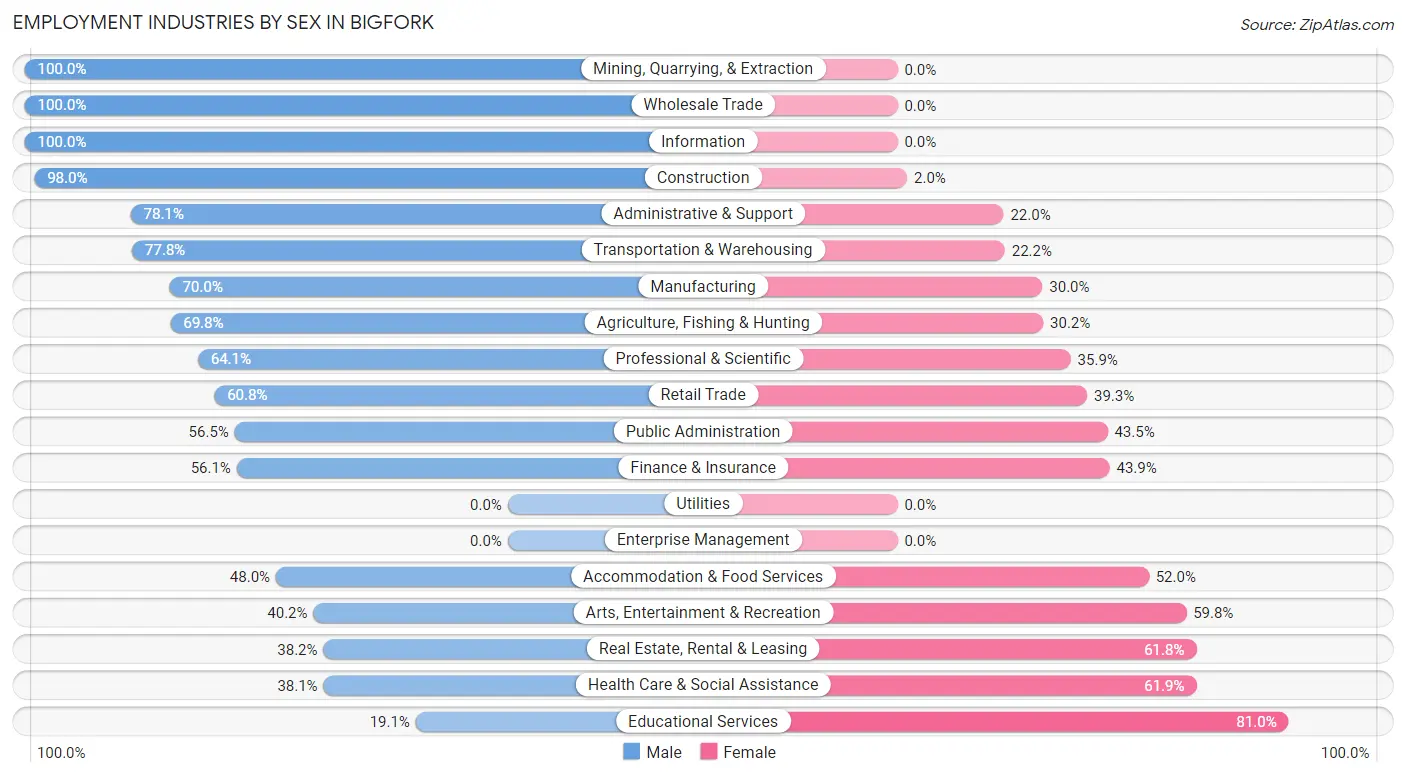
Employment Industries by Sex in Bigfork
The Bigfork industries that see more men than women are Mining, Quarrying, & Extraction (100.0%), Wholesale Trade (100.0%), and Information (100.0%), whereas the industries that tend to have a higher number of women are Educational Services (80.9%), Health Care & Social Assistance (61.9%), and Real Estate, Rental & Leasing (61.8%).
| Industry | Male | Female |
| Agriculture, Fishing & Hunting | 44 (69.8%) | 19 (30.2%) |
| Mining, Quarrying, & Extraction | 24 (100.0%) | 0 (0.0%) |
| Construction | 196 (98.0%) | 4 (2.0%) |
| Manufacturing | 98 (70.0%) | 42 (30.0%) |
| Wholesale Trade | 8 (100.0%) | 0 (0.0%) |
| Retail Trade | 113 (60.8%) | 73 (39.3%) |
| Transportation & Warehousing | 35 (77.8%) | 10 (22.2%) |
| Utilities | 0 (0.0%) | 0 (0.0%) |
| Information | 13 (100.0%) | 0 (0.0%) |
| Finance & Insurance | 23 (56.1%) | 18 (43.9%) |
| Real Estate, Rental & Leasing | 29 (38.2%) | 47 (61.8%) |
| Professional & Scientific | 93 (64.1%) | 52 (35.9%) |
| Enterprise Management | 0 (0.0%) | 0 (0.0%) |
| Administrative & Support | 128 (78.0%) | 36 (22.0%) |
| Educational Services | 32 (19.1%) | 136 (80.9%) |
| Health Care & Social Assistance | 74 (38.1%) | 120 (61.9%) |
| Arts, Entertainment & Recreation | 35 (40.2%) | 52 (59.8%) |
| Accommodation & Food Services | 95 (48.0%) | 103 (52.0%) |
| Public Administration | 52 (56.5%) | 40 (43.5%) |
| Total | 1,122 (59.0%) | 780 (41.0%) |
Education in Bigfork
School Enrollment in Bigfork
The most common levels of schooling among the 917 students in Bigfork are high school (251 | 27.4%), middle school (237 | 25.9%), and elementary school (157 | 17.1%).
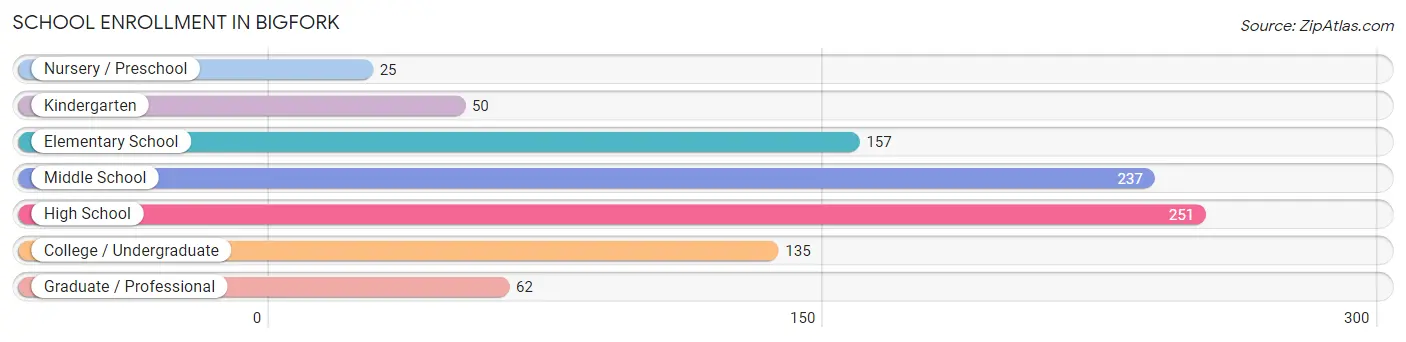
| School Level | # Students | % Students |
| Nursery / Preschool | 25 | 2.7% |
| Kindergarten | 50 | 5.4% |
| Elementary School | 157 | 17.1% |
| Middle School | 237 | 25.9% |
| High School | 251 | 27.4% |
| College / Undergraduate | 135 | 14.7% |
| Graduate / Professional | 62 | 6.8% |
| Total | 917 | 100.0% |
School Enrollment by Age by Funding Source in Bigfork
Out of a total of 917 students who are enrolled in schools in Bigfork, 117 (12.8%) attend a private institution, while the remaining 800 (87.2%) are enrolled in public schools. The age group of 25 to 34 year olds has the highest likelihood of being enrolled in private schools, with 30 (47.6% in the age bracket) enrolled. Conversely, the age group of 20 to 24 year olds has the lowest likelihood of being enrolled in a private school, with 87 (100.0% in the age bracket) attending a public institution.
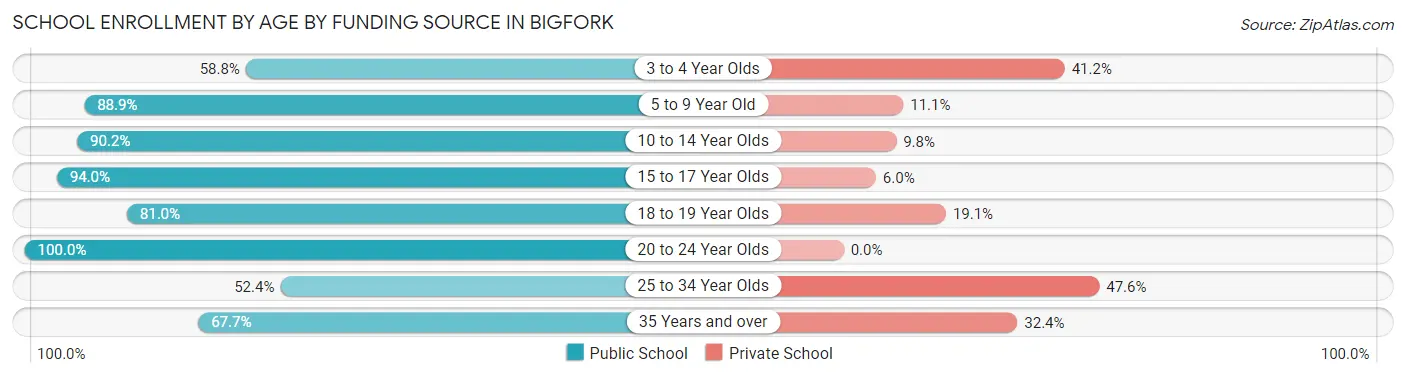
| Age Bracket | Public School | Private School |
| 3 to 4 Year Olds | 10 (58.8%) | 7 (41.2%) |
| 5 to 9 Year Old | 176 (88.9%) | 22 (11.1%) |
| 10 to 14 Year Olds | 249 (90.2%) | 27 (9.8%) |
| 15 to 17 Year Olds | 188 (94.0%) | 12 (6.0%) |
| 18 to 19 Year Olds | 34 (80.9%) | 8 (19.1%) |
| 20 to 24 Year Olds | 87 (100.0%) | 0 (0.0%) |
| 25 to 34 Year Olds | 33 (52.4%) | 30 (47.6%) |
| 35 Years and over | 23 (67.6%) | 11 (32.4%) |
| Total | 800 (87.2%) | 117 (12.8%) |
Educational Attainment by Field of Study in Bigfork
Business (305 | 14.9%), education (284 | 13.9%), psychology (208 | 10.2%), science & technology (169 | 8.3%), and arts & humanities (149 | 7.3%) are the most common fields of study among 2,041 individuals in Bigfork who have obtained a bachelor's degree or higher.
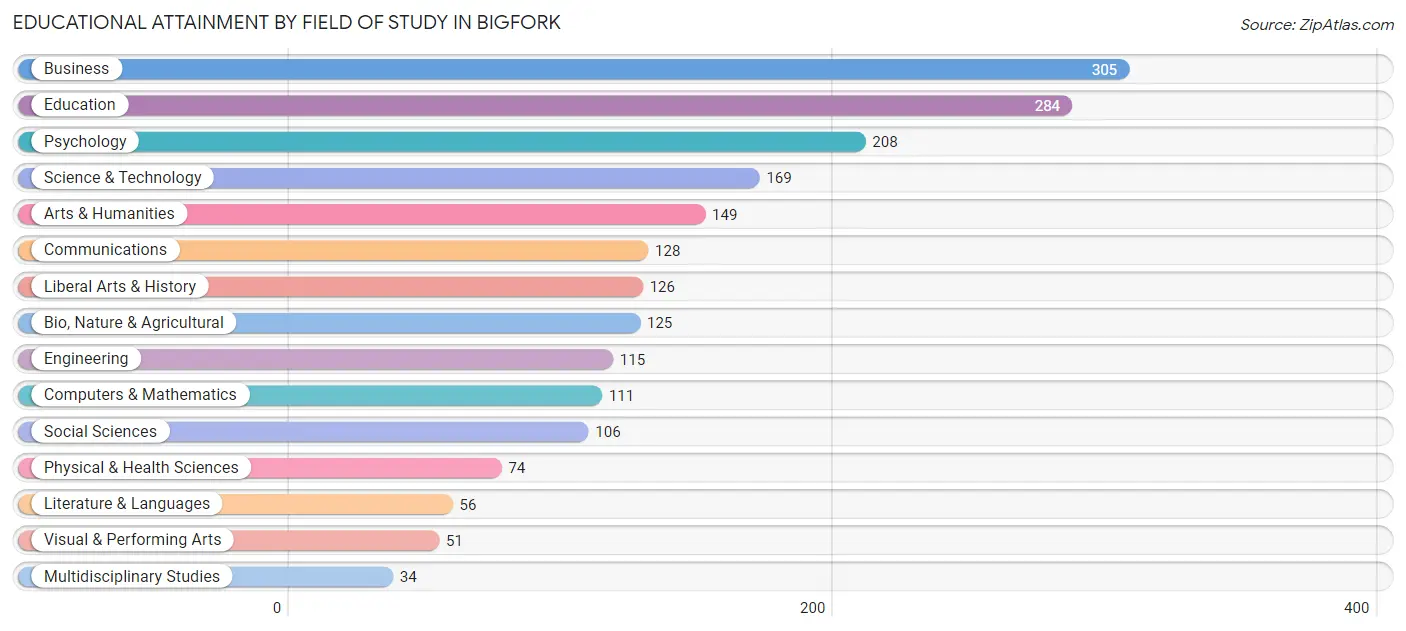
| Field of Study | # Graduates | % Graduates |
| Computers & Mathematics | 111 | 5.4% |
| Bio, Nature & Agricultural | 125 | 6.1% |
| Physical & Health Sciences | 74 | 3.6% |
| Psychology | 208 | 10.2% |
| Social Sciences | 106 | 5.2% |
| Engineering | 115 | 5.6% |
| Multidisciplinary Studies | 34 | 1.7% |
| Science & Technology | 169 | 8.3% |
| Business | 305 | 14.9% |
| Education | 284 | 13.9% |
| Literature & Languages | 56 | 2.7% |
| Liberal Arts & History | 126 | 6.2% |
| Visual & Performing Arts | 51 | 2.5% |
| Communications | 128 | 6.3% |
| Arts & Humanities | 149 | 7.3% |
| Total | 2,041 | 100.0% |
Transportation & Commute in Bigfork
Vehicle Availability by Sex in Bigfork
The most prevalent vehicle ownership categories in Bigfork are males with 2 vehicles (389, accounting for 35.7%) and females with 2 vehicles (341, making up 50.7%).
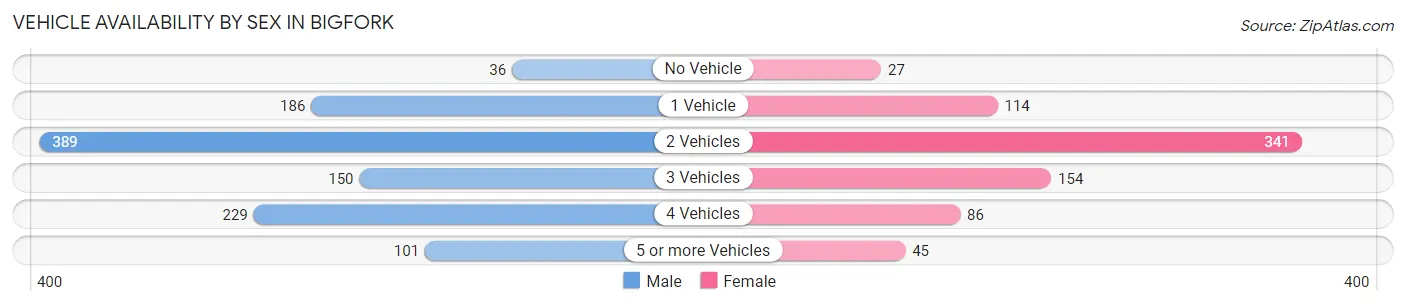
| Vehicles Available | Male | Female |
| No Vehicle | 36 (3.3%) | 27 (3.5%) |
| 1 Vehicle | 186 (17.1%) | 114 (14.9%) |
| 2 Vehicles | 389 (35.7%) | 341 (44.5%) |
| 3 Vehicles | 150 (13.8%) | 154 (20.1%) |
| 4 Vehicles | 229 (21.0%) | 86 (11.2%) |
| 5 or more Vehicles | 101 (9.3%) | 45 (5.9%) |
| Total | 1,091 (100.0%) | 767 (100.0%) |
Commute Time in Bigfork
The most frequently occuring commute durations in Bigfork are 10 to 14 minutes (309 commuters, 19.8%), 15 to 19 minutes (299 commuters, 19.2%), and 30 to 34 minutes (229 commuters, 14.7%).
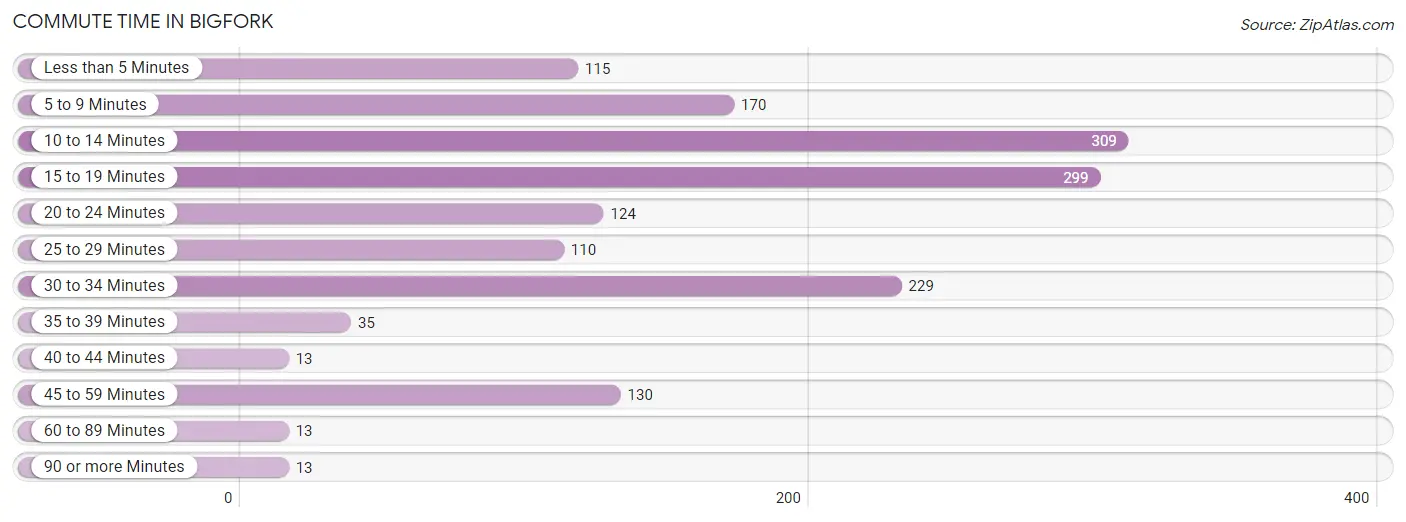
| Commute Time | # Commuters | % Commuters |
| Less than 5 Minutes | 115 | 7.4% |
| 5 to 9 Minutes | 170 | 10.9% |
| 10 to 14 Minutes | 309 | 19.8% |
| 15 to 19 Minutes | 299 | 19.2% |
| 20 to 24 Minutes | 124 | 8.0% |
| 25 to 29 Minutes | 110 | 7.0% |
| 30 to 34 Minutes | 229 | 14.7% |
| 35 to 39 Minutes | 35 | 2.2% |
| 40 to 44 Minutes | 13 | 0.8% |
| 45 to 59 Minutes | 130 | 8.3% |
| 60 to 89 Minutes | 13 | 0.8% |
| 90 or more Minutes | 13 | 0.8% |
Commute Time by Sex in Bigfork
The most common commute times in Bigfork are 15 to 19 minutes (178 commuters, 20.1%) for males and 10 to 14 minutes (197 commuters, 29.3%) for females.
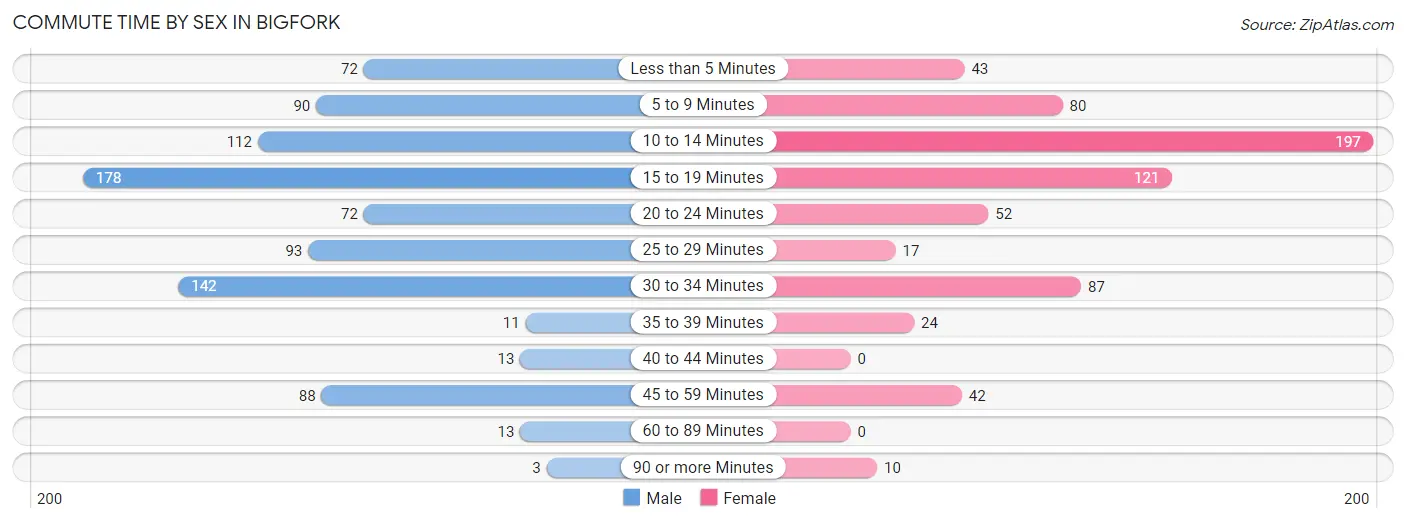
| Commute Time | Male | Female |
| Less than 5 Minutes | 72 (8.1%) | 43 (6.4%) |
| 5 to 9 Minutes | 90 (10.2%) | 80 (11.9%) |
| 10 to 14 Minutes | 112 (12.6%) | 197 (29.3%) |
| 15 to 19 Minutes | 178 (20.1%) | 121 (18.0%) |
| 20 to 24 Minutes | 72 (8.1%) | 52 (7.7%) |
| 25 to 29 Minutes | 93 (10.5%) | 17 (2.5%) |
| 30 to 34 Minutes | 142 (16.0%) | 87 (12.9%) |
| 35 to 39 Minutes | 11 (1.2%) | 24 (3.6%) |
| 40 to 44 Minutes | 13 (1.5%) | 0 (0.0%) |
| 45 to 59 Minutes | 88 (9.9%) | 42 (6.2%) |
| 60 to 89 Minutes | 13 (1.5%) | 0 (0.0%) |
| 90 or more Minutes | 3 (0.3%) | 10 (1.5%) |
Time of Departure to Work by Sex in Bigfork
The most frequent times of departure to work in Bigfork are 7:30 AM to 7:59 AM (173, 19.5%) for males and 7:30 AM to 7:59 AM (112, 16.6%) for females.
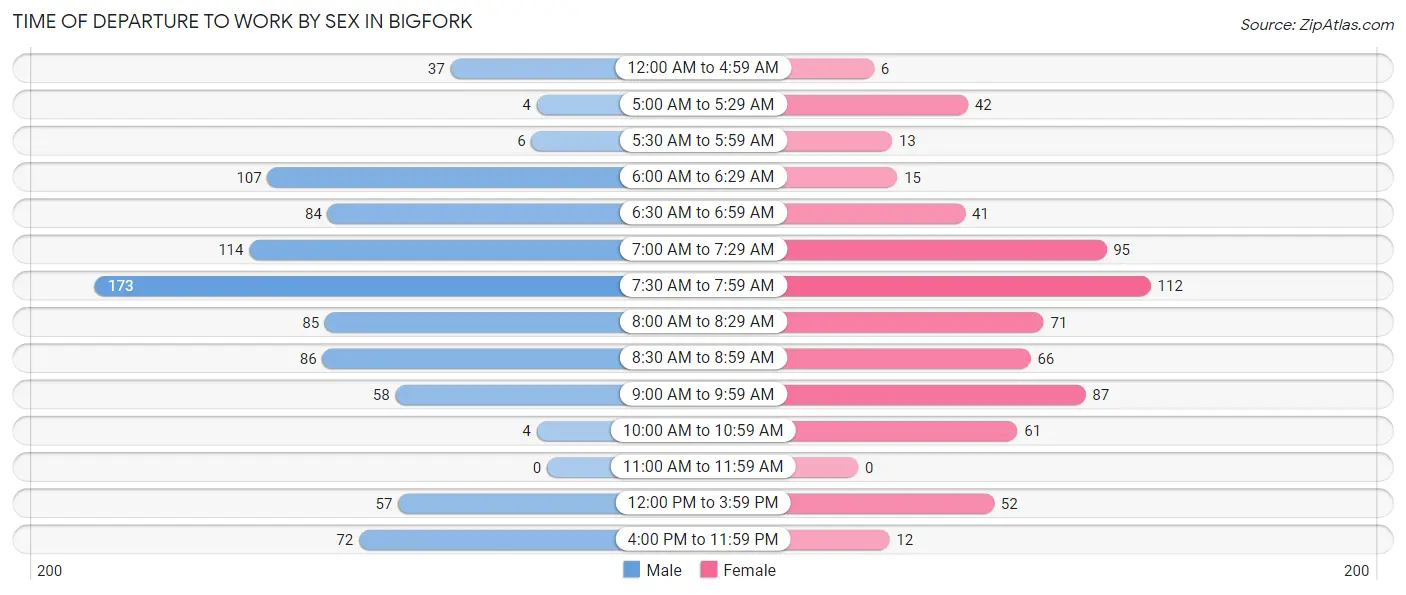
| Time of Departure | Male | Female |
| 12:00 AM to 4:59 AM | 37 (4.2%) | 6 (0.9%) |
| 5:00 AM to 5:29 AM | 4 (0.4%) | 42 (6.2%) |
| 5:30 AM to 5:59 AM | 6 (0.7%) | 13 (1.9%) |
| 6:00 AM to 6:29 AM | 107 (12.1%) | 15 (2.2%) |
| 6:30 AM to 6:59 AM | 84 (9.5%) | 41 (6.1%) |
| 7:00 AM to 7:29 AM | 114 (12.9%) | 95 (14.1%) |
| 7:30 AM to 7:59 AM | 173 (19.5%) | 112 (16.6%) |
| 8:00 AM to 8:29 AM | 85 (9.6%) | 71 (10.5%) |
| 8:30 AM to 8:59 AM | 86 (9.7%) | 66 (9.8%) |
| 9:00 AM to 9:59 AM | 58 (6.5%) | 87 (12.9%) |
| 10:00 AM to 10:59 AM | 4 (0.4%) | 61 (9.1%) |
| 11:00 AM to 11:59 AM | 0 (0.0%) | 0 (0.0%) |
| 12:00 PM to 3:59 PM | 57 (6.4%) | 52 (7.7%) |
| 4:00 PM to 11:59 PM | 72 (8.1%) | 12 (1.8%) |
| Total | 887 (100.0%) | 673 (100.0%) |
Housing Occupancy in Bigfork
Occupancy by Ownership in Bigfork
Of the total 2,236 dwellings in Bigfork, owner-occupied units account for 1,705 (76.2%), while renter-occupied units make up 531 (23.7%).
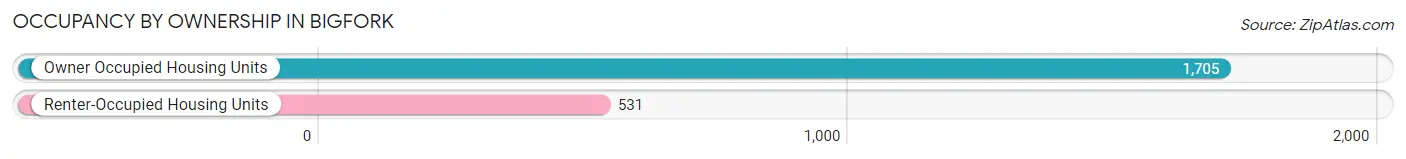
| Occupancy | # Housing Units | % Housing Units |
| Owner Occupied Housing Units | 1,705 | 76.2% |
| Renter-Occupied Housing Units | 531 | 23.7% |
| Total Occupied Housing Units | 2,236 | 100.0% |
Occupancy by Household Size in Bigfork
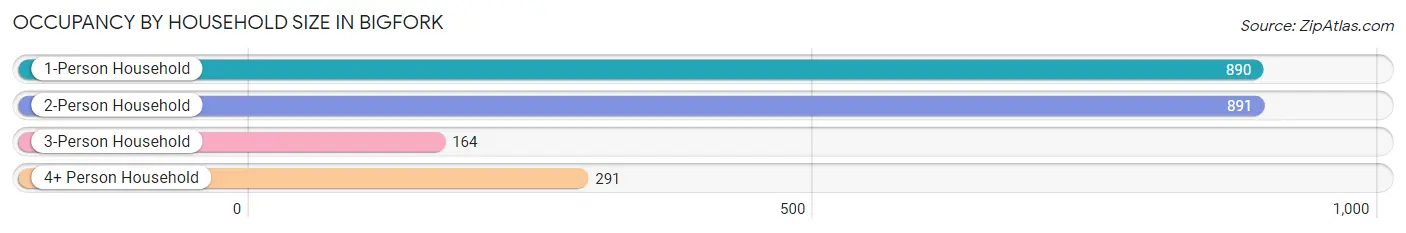
| Household Size | # Housing Units | % Housing Units |
| 1-Person Household | 890 | 39.8% |
| 2-Person Household | 891 | 39.9% |
| 3-Person Household | 164 | 7.3% |
| 4+ Person Household | 291 | 13.0% |
| Total Housing Units | 2,236 | 100.0% |
Occupancy by Ownership by Household Size in Bigfork
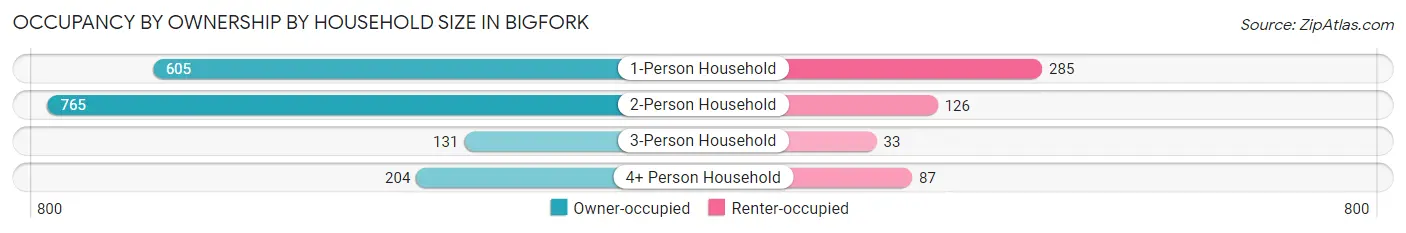
| Household Size | Owner-occupied | Renter-occupied |
| 1-Person Household | 605 (68.0%) | 285 (32.0%) |
| 2-Person Household | 765 (85.9%) | 126 (14.1%) |
| 3-Person Household | 131 (79.9%) | 33 (20.1%) |
| 4+ Person Household | 204 (70.1%) | 87 (29.9%) |
| Total Housing Units | 1,705 (76.2%) | 531 (23.7%) |
Occupancy by Educational Attainment in Bigfork
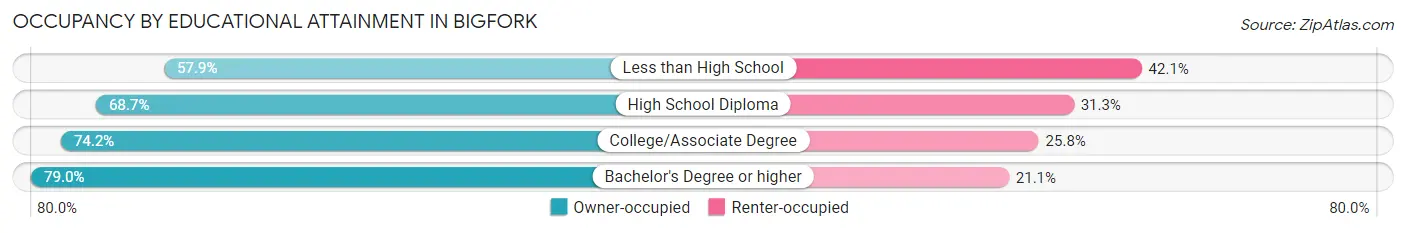
| Household Size | Owner-occupied | Renter-occupied |
| Less than High School | 11 (57.9%) | 8 (42.1%) |
| High School Diploma | 171 (68.7%) | 78 (31.3%) |
| College/Associate Degree | 484 (74.2%) | 168 (25.8%) |
| Bachelor's Degree or higher | 1,039 (78.9%) | 277 (21.0%) |
Occupancy by Age of Householder in Bigfork
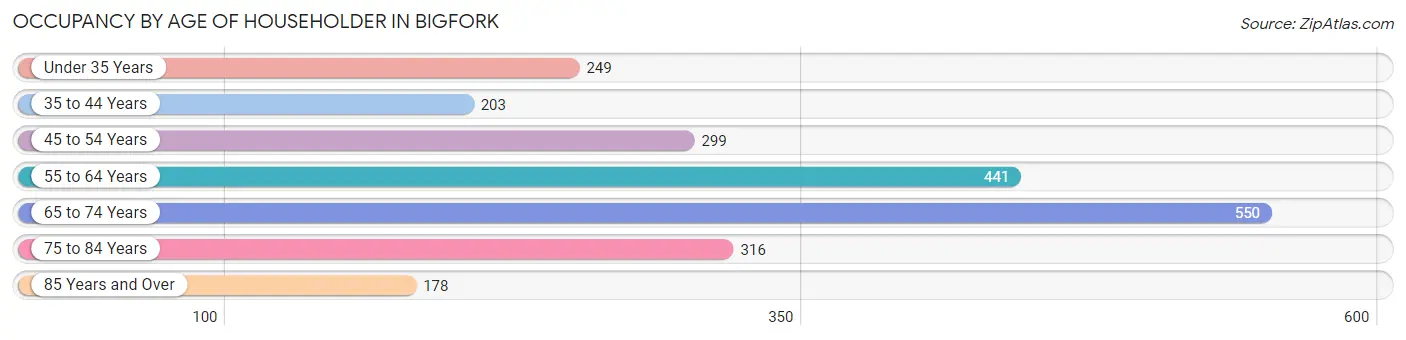
| Age Bracket | # Households | % Households |
| Under 35 Years | 249 | 11.1% |
| 35 to 44 Years | 203 | 9.1% |
| 45 to 54 Years | 299 | 13.4% |
| 55 to 64 Years | 441 | 19.7% |
| 65 to 74 Years | 550 | 24.6% |
| 75 to 84 Years | 316 | 14.1% |
| 85 Years and Over | 178 | 8.0% |
| Total | 2,236 | 100.0% |
Housing Finances in Bigfork
Median Income by Occupancy in Bigfork
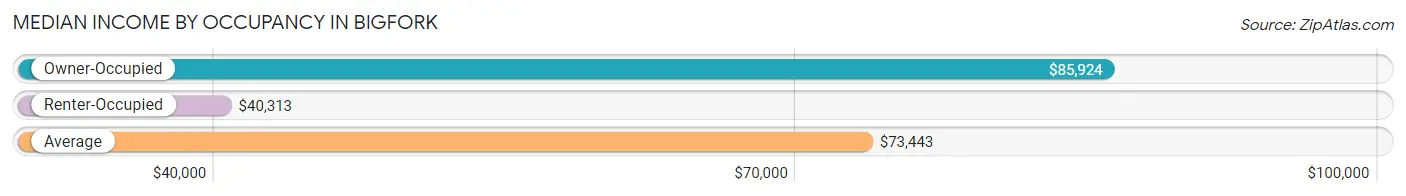
| Occupancy Type | # Households | Median Income |
| Owner-Occupied | 1,705 (76.2%) | $85,924 |
| Renter-Occupied | 531 (23.7%) | $40,313 |
| Average | 2,236 (100.0%) | $73,443 |
Occupancy by Householder Income Bracket in Bigfork
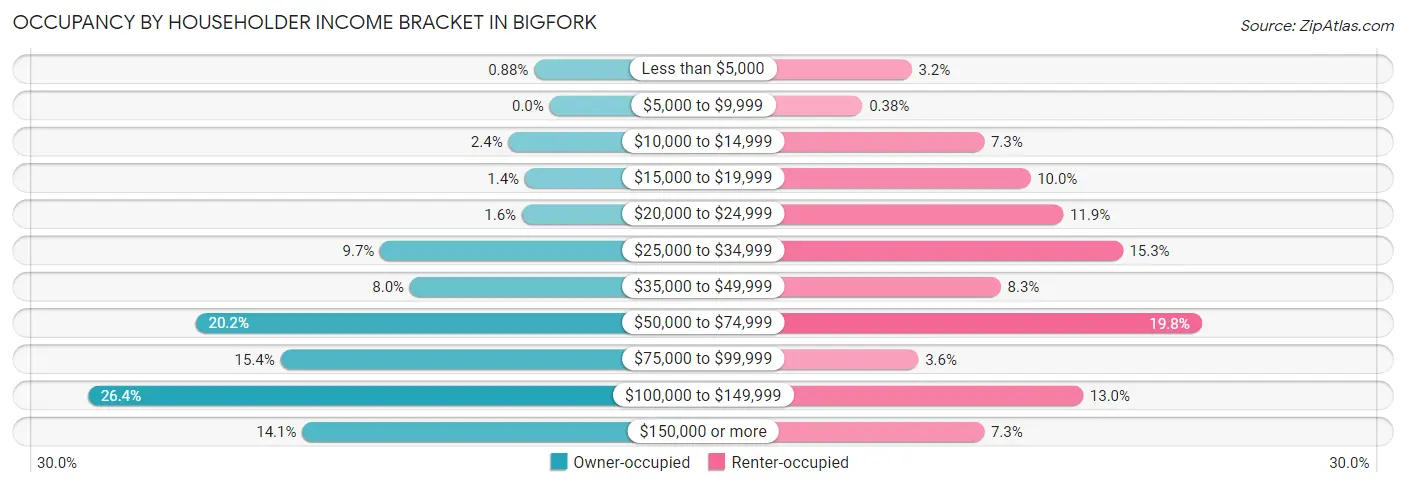
| Income Bracket | Owner-occupied | Renter-occupied |
| Less than $5,000 | 15 (0.9%) | 17 (3.2%) |
| $5,000 to $9,999 | 0 (0.0%) | 2 (0.4%) |
| $10,000 to $14,999 | 40 (2.4%) | 39 (7.3%) |
| $15,000 to $19,999 | 24 (1.4%) | 53 (10.0%) |
| $20,000 to $24,999 | 27 (1.6%) | 63 (11.9%) |
| $25,000 to $34,999 | 165 (9.7%) | 81 (15.2%) |
| $35,000 to $49,999 | 136 (8.0%) | 44 (8.3%) |
| $50,000 to $74,999 | 345 (20.2%) | 105 (19.8%) |
| $75,000 to $99,999 | 262 (15.4%) | 19 (3.6%) |
| $100,000 to $149,999 | 450 (26.4%) | 69 (13.0%) |
| $150,000 or more | 241 (14.1%) | 39 (7.3%) |
| Total | 1,705 (100.0%) | 531 (100.0%) |
Monthly Housing Cost Tiers in Bigfork
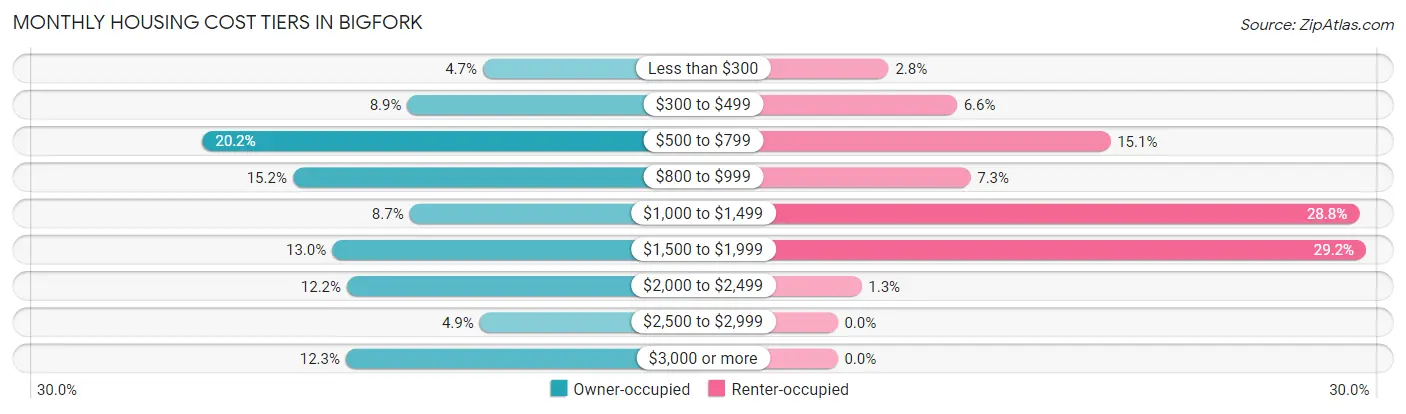
| Monthly Cost | Owner-occupied | Renter-occupied |
| Less than $300 | 80 (4.7%) | 15 (2.8%) |
| $300 to $499 | 151 (8.9%) | 35 (6.6%) |
| $500 to $799 | 344 (20.2%) | 80 (15.1%) |
| $800 to $999 | 259 (15.2%) | 39 (7.3%) |
| $1,000 to $1,499 | 149 (8.7%) | 153 (28.8%) |
| $1,500 to $1,999 | 222 (13.0%) | 155 (29.2%) |
| $2,000 to $2,499 | 208 (12.2%) | 7 (1.3%) |
| $2,500 to $2,999 | 83 (4.9%) | 0 (0.0%) |
| $3,000 or more | 209 (12.3%) | 0 (0.0%) |
| Total | 1,705 (100.0%) | 531 (100.0%) |
Physical Housing Characteristics in Bigfork
Housing Structures in Bigfork
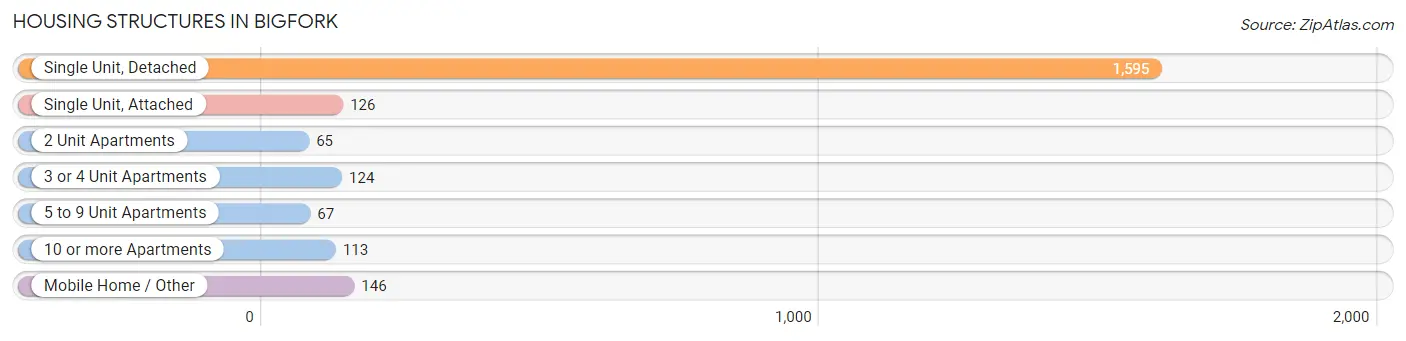
| Structure Type | # Housing Units | % Housing Units |
| Single Unit, Detached | 1,595 | 71.3% |
| Single Unit, Attached | 126 | 5.6% |
| 2 Unit Apartments | 65 | 2.9% |
| 3 or 4 Unit Apartments | 124 | 5.6% |
| 5 to 9 Unit Apartments | 67 | 3.0% |
| 10 or more Apartments | 113 | 5.1% |
| Mobile Home / Other | 146 | 6.5% |
| Total | 2,236 | 100.0% |
Housing Structures by Occupancy in Bigfork
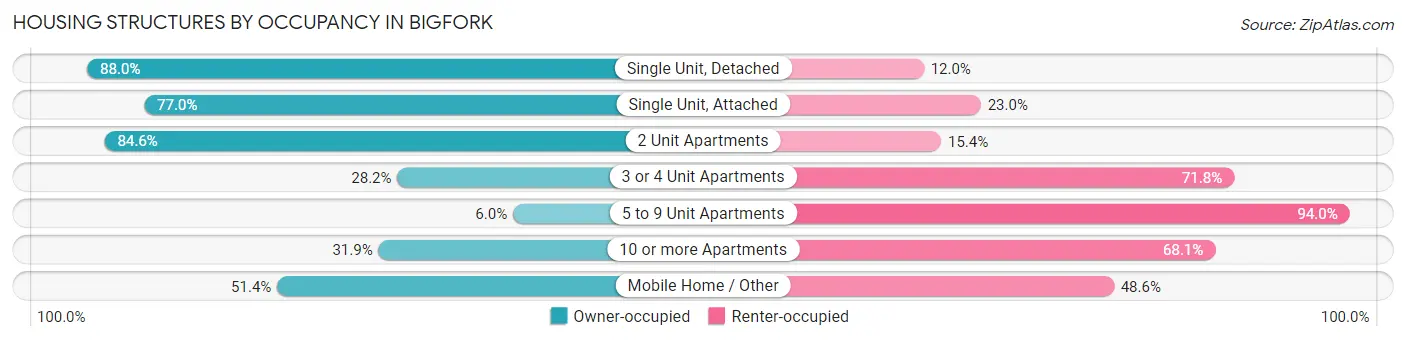
| Structure Type | Owner-occupied | Renter-occupied |
| Single Unit, Detached | 1,403 (88.0%) | 192 (12.0%) |
| Single Unit, Attached | 97 (77.0%) | 29 (23.0%) |
| 2 Unit Apartments | 55 (84.6%) | 10 (15.4%) |
| 3 or 4 Unit Apartments | 35 (28.2%) | 89 (71.8%) |
| 5 to 9 Unit Apartments | 4 (6.0%) | 63 (94.0%) |
| 10 or more Apartments | 36 (31.9%) | 77 (68.1%) |
| Mobile Home / Other | 75 (51.4%) | 71 (48.6%) |
| Total | 1,705 (76.2%) | 531 (23.7%) |
Housing Structures by Number of Rooms in Bigfork
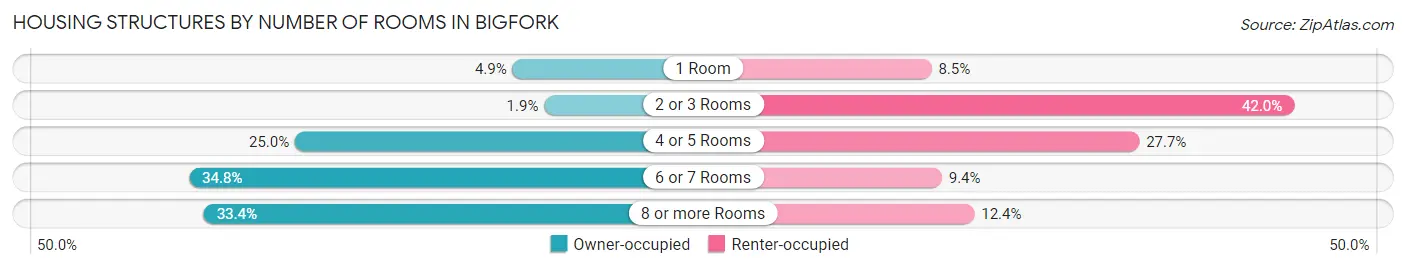
| Number of Rooms | Owner-occupied | Renter-occupied |
| 1 Room | 83 (4.9%) | 45 (8.5%) |
| 2 or 3 Rooms | 33 (1.9%) | 223 (42.0%) |
| 4 or 5 Rooms | 426 (25.0%) | 147 (27.7%) |
| 6 or 7 Rooms | 593 (34.8%) | 50 (9.4%) |
| 8 or more Rooms | 570 (33.4%) | 66 (12.4%) |
| Total | 1,705 (100.0%) | 531 (100.0%) |
Housing Structure by Heating Type in Bigfork
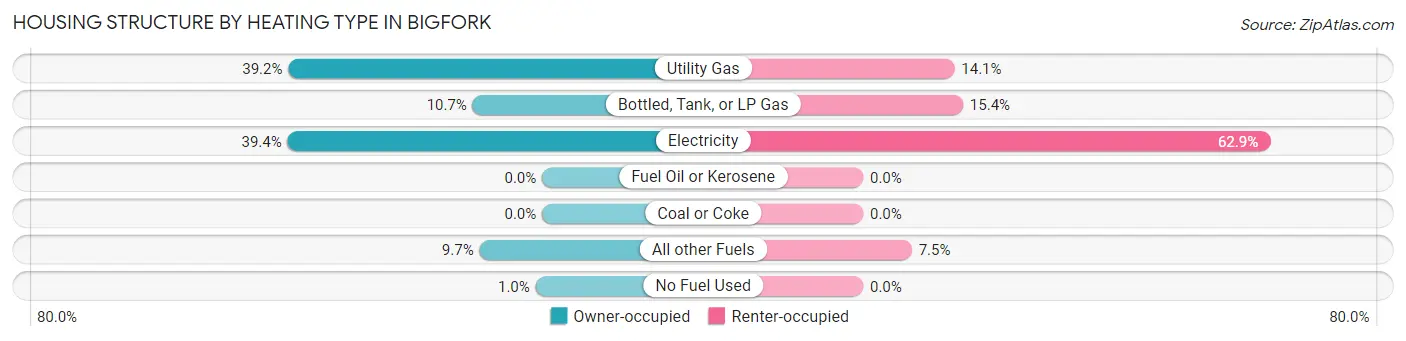
| Heating Type | Owner-occupied | Renter-occupied |
| Utility Gas | 669 (39.2%) | 75 (14.1%) |
| Bottled, Tank, or LP Gas | 183 (10.7%) | 82 (15.4%) |
| Electricity | 671 (39.4%) | 334 (62.9%) |
| Fuel Oil or Kerosene | 0 (0.0%) | 0 (0.0%) |
| Coal or Coke | 0 (0.0%) | 0 (0.0%) |
| All other Fuels | 165 (9.7%) | 40 (7.5%) |
| No Fuel Used | 17 (1.0%) | 0 (0.0%) |
| Total | 1,705 (100.0%) | 531 (100.0%) |
Household Vehicle Usage in Bigfork
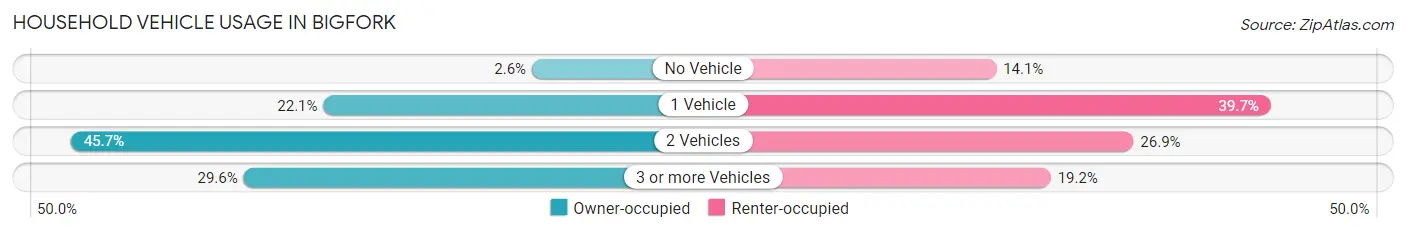
| Vehicles per Household | Owner-occupied | Renter-occupied |
| No Vehicle | 45 (2.6%) | 75 (14.1%) |
| 1 Vehicle | 377 (22.1%) | 211 (39.7%) |
| 2 Vehicles | 779 (45.7%) | 143 (26.9%) |
| 3 or more Vehicles | 504 (29.6%) | 102 (19.2%) |
| Total | 1,705 (100.0%) | 531 (100.0%) |
Real Estate & Mortgages in Bigfork
Real Estate and Mortgage Overview in Bigfork
| Characteristic | Without Mortgage | With Mortgage |
| Housing Units | 847 | 858 |
| Median Property Value | $579,000 | $590,200 |
| Median Household Income | $74,665 | $160 |
| Monthly Housing Costs | $619 | $209 |
| Real Estate Taxes | $3,704 | $0 |
Property Value by Mortgage Status in Bigfork
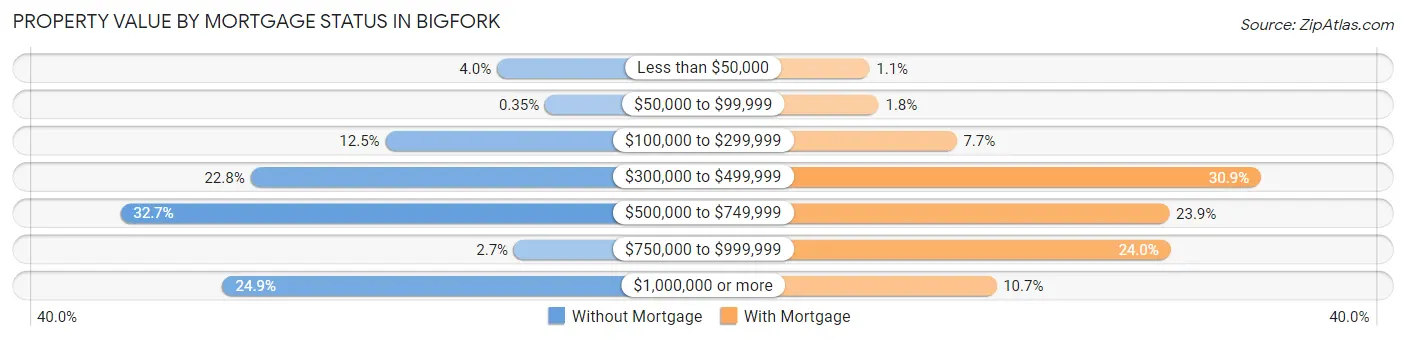
| Property Value | Without Mortgage | With Mortgage |
| Less than $50,000 | 34 (4.0%) | 9 (1.1%) |
| $50,000 to $99,999 | 3 (0.4%) | 15 (1.8%) |
| $100,000 to $299,999 | 106 (12.5%) | 66 (7.7%) |
| $300,000 to $499,999 | 193 (22.8%) | 265 (30.9%) |
| $500,000 to $749,999 | 277 (32.7%) | 205 (23.9%) |
| $750,000 to $999,999 | 23 (2.7%) | 206 (24.0%) |
| $1,000,000 or more | 211 (24.9%) | 92 (10.7%) |
| Total | 847 (100.0%) | 858 (100.0%) |
Household Income by Mortgage Status in Bigfork
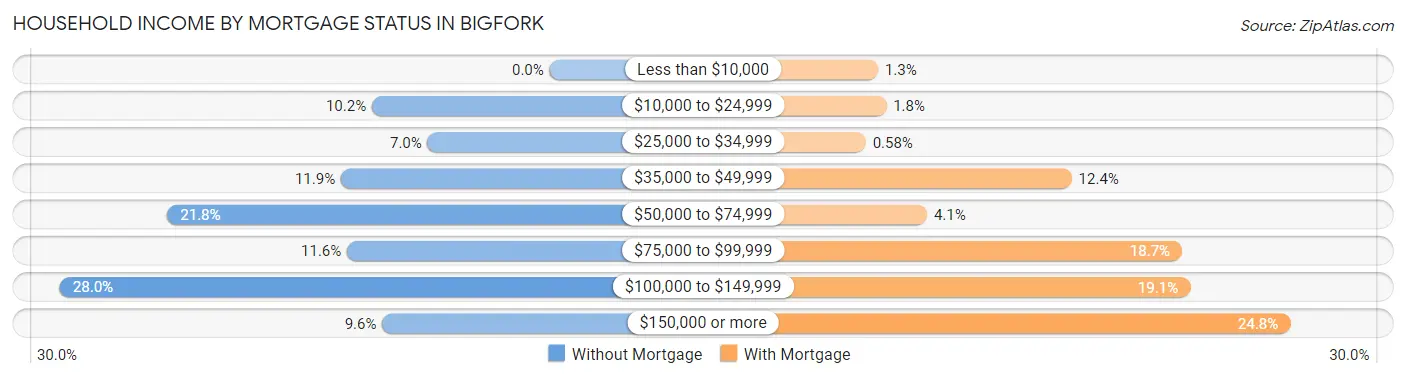
| Household Income | Without Mortgage | With Mortgage |
| Less than $10,000 | 0 (0.0%) | 11 (1.3%) |
| $10,000 to $24,999 | 86 (10.2%) | 15 (1.8%) |
| $25,000 to $34,999 | 59 (7.0%) | 5 (0.6%) |
| $35,000 to $49,999 | 101 (11.9%) | 106 (12.3%) |
| $50,000 to $74,999 | 185 (21.8%) | 35 (4.1%) |
| $75,000 to $99,999 | 98 (11.6%) | 160 (18.6%) |
| $100,000 to $149,999 | 237 (28.0%) | 164 (19.1%) |
| $150,000 or more | 81 (9.6%) | 213 (24.8%) |
| Total | 847 (100.0%) | 858 (100.0%) |
Property Value to Household Income Ratio in Bigfork
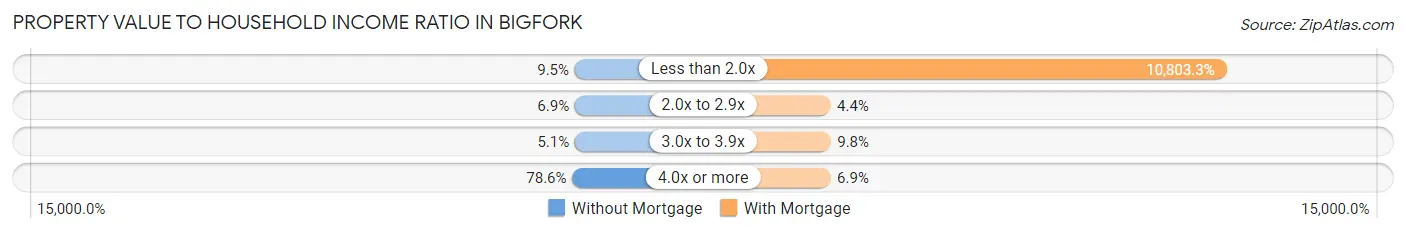
| Value-to-Income Ratio | Without Mortgage | With Mortgage |
| Less than 2.0x | 80 (9.5%) | 92,692 (10,803.3%) |
| 2.0x to 2.9x | 58 (6.9%) | 38 (4.4%) |
| 3.0x to 3.9x | 43 (5.1%) | 84 (9.8%) |
| 4.0x or more | 666 (78.6%) | 59 (6.9%) |
| Total | 847 (100.0%) | 858 (100.0%) |
Real Estate Taxes by Mortgage Status in Bigfork
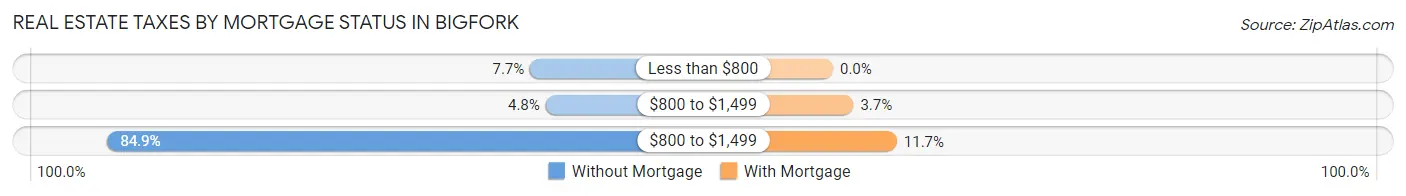
| Property Taxes | Without Mortgage | With Mortgage |
| Less than $800 | 65 (7.7%) | 0 (0.0%) |
| $800 to $1,499 | 41 (4.8%) | 32 (3.7%) |
| $800 to $1,499 | 719 (84.9%) | 100 (11.7%) |
| Total | 847 (100.0%) | 858 (100.0%) |
Health & Disability in Bigfork
Health Insurance Coverage by Age in Bigfork
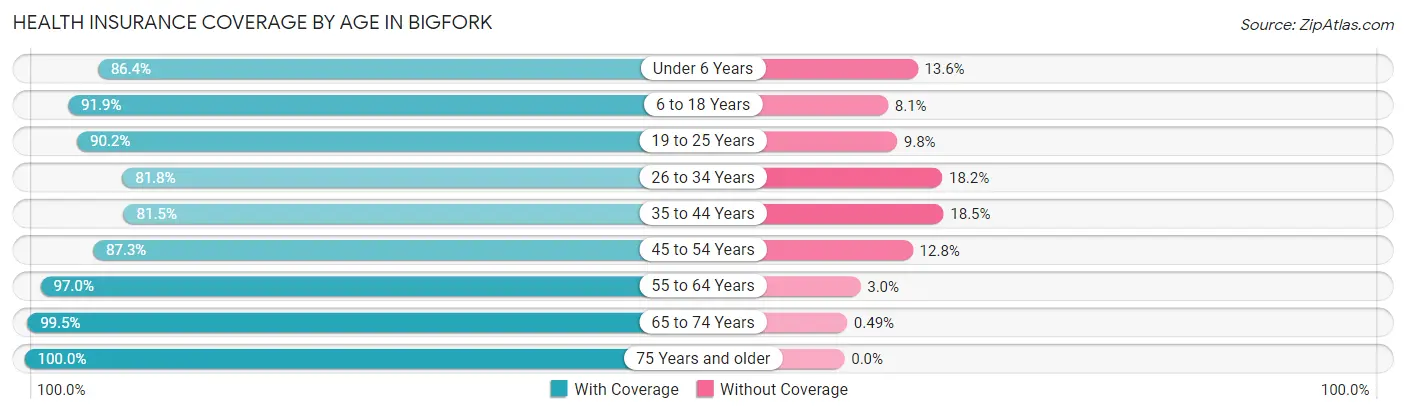
| Age Bracket | With Coverage | Without Coverage |
| Under 6 Years | 95 (86.4%) | 15 (13.6%) |
| 6 to 18 Years | 622 (91.9%) | 55 (8.1%) |
| 19 to 25 Years | 368 (90.2%) | 40 (9.8%) |
| 26 to 34 Years | 332 (81.8%) | 74 (18.2%) |
| 35 to 44 Years | 362 (81.5%) | 82 (18.5%) |
| 45 to 54 Years | 438 (87.3%) | 64 (12.8%) |
| 55 to 64 Years | 847 (97.0%) | 26 (3.0%) |
| 65 to 74 Years | 806 (99.5%) | 4 (0.5%) |
| 75 Years and older | 660 (100.0%) | 0 (0.0%) |
| Total | 4,530 (92.6%) | 360 (7.4%) |
Health Insurance Coverage by Citizenship Status in Bigfork
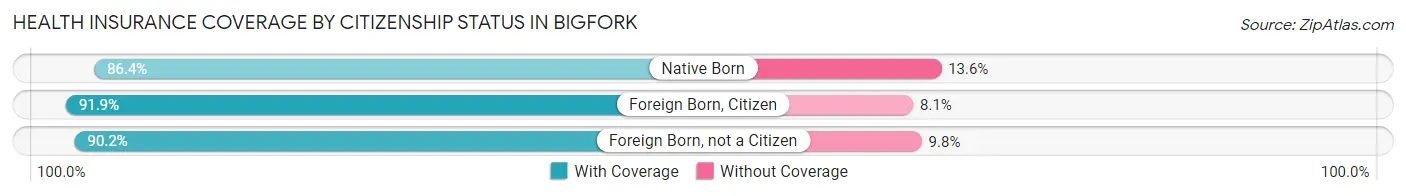
| Citizenship Status | With Coverage | Without Coverage |
| Native Born | 95 (86.4%) | 15 (13.6%) |
| Foreign Born, Citizen | 622 (91.9%) | 55 (8.1%) |
| Foreign Born, not a Citizen | 368 (90.2%) | 40 (9.8%) |
Health Insurance Coverage by Household Income in Bigfork
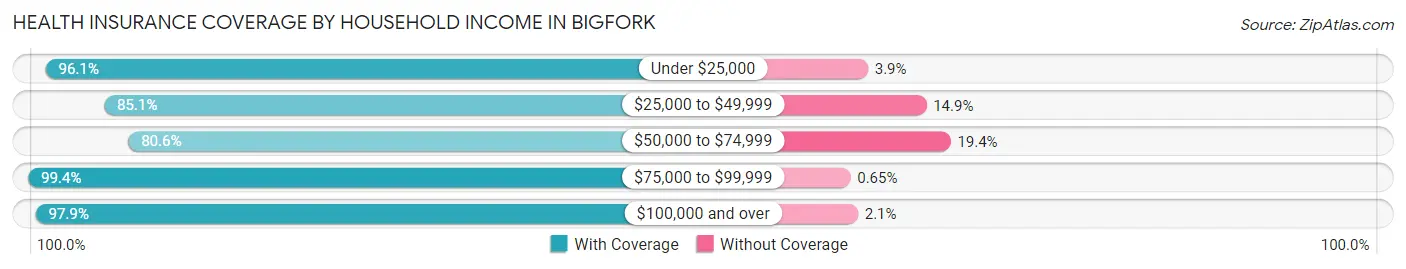
| Household Income | With Coverage | Without Coverage |
| Under $25,000 | 342 (96.1%) | 14 (3.9%) |
| $25,000 to $49,999 | 681 (85.1%) | 119 (14.9%) |
| $50,000 to $74,999 | 726 (80.6%) | 175 (19.4%) |
| $75,000 to $99,999 | 919 (99.4%) | 6 (0.6%) |
| $100,000 and over | 1,851 (97.9%) | 39 (2.1%) |
Public vs Private Health Insurance Coverage by Age in Bigfork
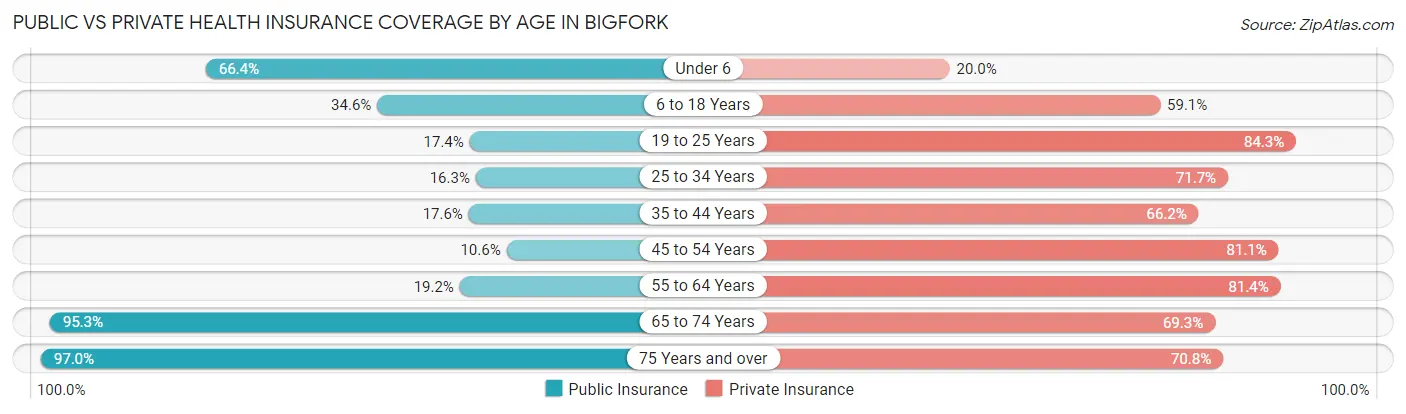
| Age Bracket | Public Insurance | Private Insurance |
| Under 6 | 73 (66.4%) | 22 (20.0%) |
| 6 to 18 Years | 234 (34.6%) | 400 (59.1%) |
| 19 to 25 Years | 71 (17.4%) | 344 (84.3%) |
| 25 to 34 Years | 66 (16.3%) | 291 (71.7%) |
| 35 to 44 Years | 78 (17.6%) | 294 (66.2%) |
| 45 to 54 Years | 53 (10.6%) | 407 (81.1%) |
| 55 to 64 Years | 168 (19.2%) | 711 (81.4%) |
| 65 to 74 Years | 772 (95.3%) | 561 (69.3%) |
| 75 Years and over | 640 (97.0%) | 467 (70.8%) |
| Total | 2,155 (44.1%) | 3,497 (71.5%) |
Disability Status by Sex by Age in Bigfork
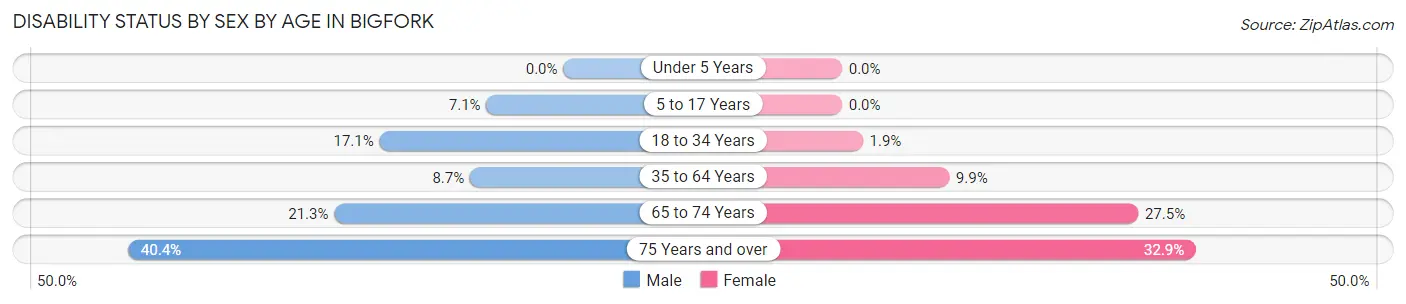
| Age Bracket | Male | Female |
| Under 5 Years | 0 (0.0%) | 0 (0.0%) |
| 5 to 17 Years | 22 (7.1%) | 0 (0.0%) |
| 18 to 34 Years | 65 (17.1%) | 9 (1.9%) |
| 35 to 64 Years | 80 (8.7%) | 89 (9.9%) |
| 65 to 74 Years | 91 (21.3%) | 105 (27.5%) |
| 75 Years and over | 118 (40.4%) | 121 (32.9%) |
Disability Class by Sex by Age in Bigfork
Disability Class: Hearing Difficulty
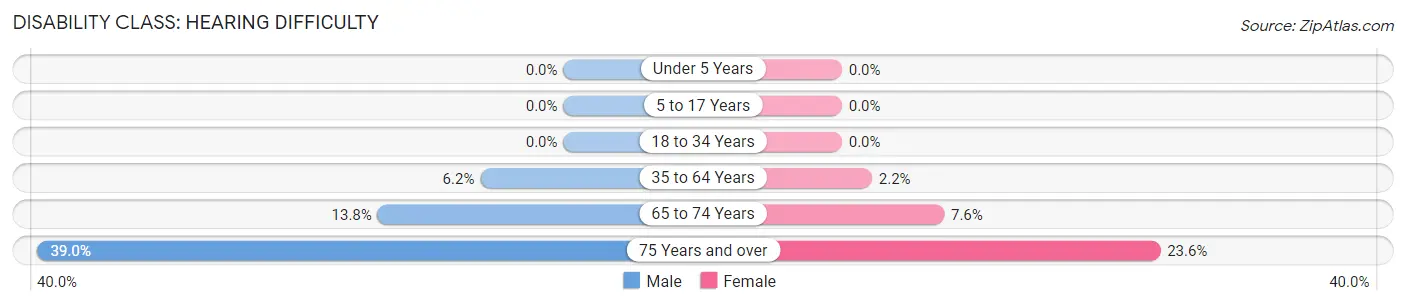
| Age Bracket | Male | Female |
| Under 5 Years | 0 (0.0%) | 0 (0.0%) |
| 5 to 17 Years | 0 (0.0%) | 0 (0.0%) |
| 18 to 34 Years | 0 (0.0%) | 0 (0.0%) |
| 35 to 64 Years | 57 (6.2%) | 20 (2.2%) |
| 65 to 74 Years | 59 (13.8%) | 29 (7.6%) |
| 75 Years and over | 114 (39.0%) | 87 (23.6%) |
Disability Class: Vision Difficulty
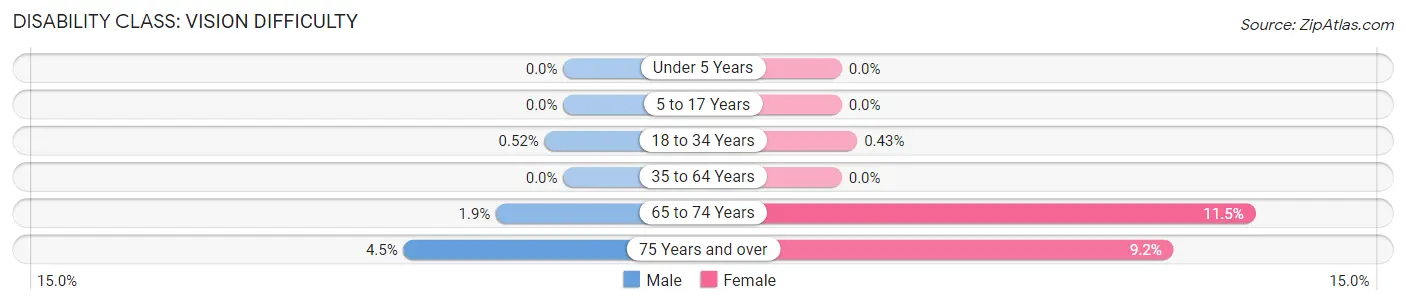
| Age Bracket | Male | Female |
| Under 5 Years | 0 (0.0%) | 0 (0.0%) |
| 5 to 17 Years | 0 (0.0%) | 0 (0.0%) |
| 18 to 34 Years | 2 (0.5%) | 2 (0.4%) |
| 35 to 64 Years | 0 (0.0%) | 0 (0.0%) |
| 65 to 74 Years | 8 (1.9%) | 44 (11.5%) |
| 75 Years and over | 13 (4.4%) | 34 (9.2%) |
Disability Class: Cognitive Difficulty
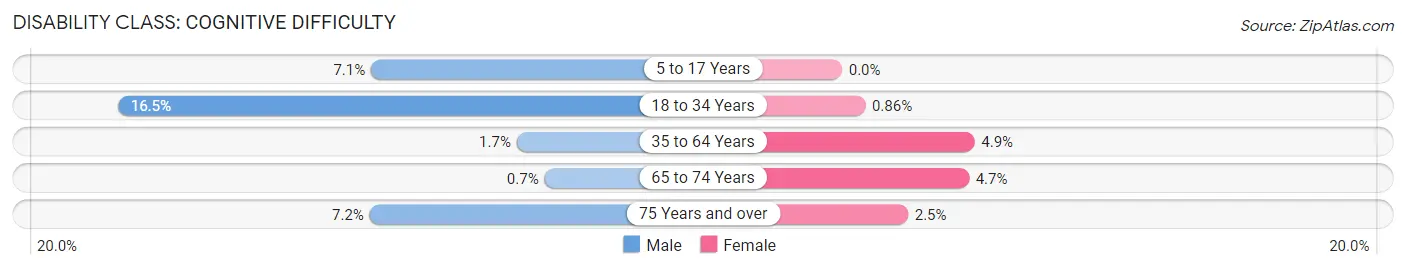
| Age Bracket | Male | Female |
| 5 to 17 Years | 22 (7.1%) | 0 (0.0%) |
| 18 to 34 Years | 63 (16.5%) | 4 (0.9%) |
| 35 to 64 Years | 16 (1.7%) | 44 (4.9%) |
| 65 to 74 Years | 3 (0.7%) | 18 (4.7%) |
| 75 Years and over | 21 (7.2%) | 9 (2.5%) |
Disability Class: Ambulatory Difficulty
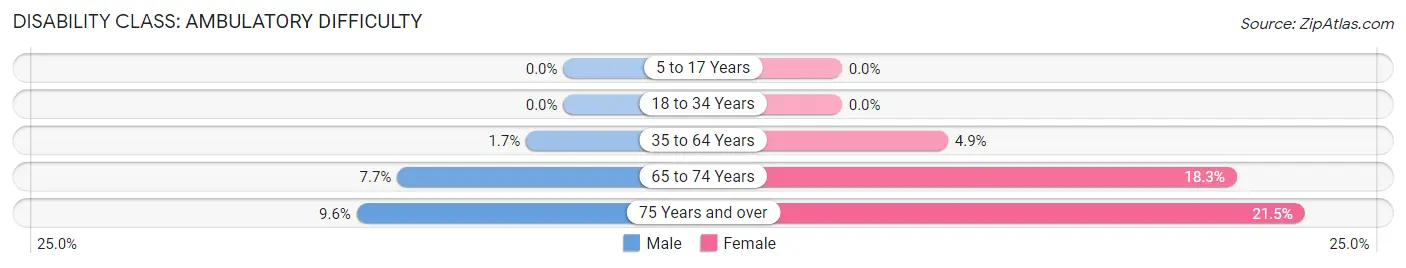
| Age Bracket | Male | Female |
| 5 to 17 Years | 0 (0.0%) | 0 (0.0%) |
| 18 to 34 Years | 0 (0.0%) | 0 (0.0%) |
| 35 to 64 Years | 16 (1.7%) | 44 (4.9%) |
| 65 to 74 Years | 33 (7.7%) | 70 (18.3%) |
| 75 Years and over | 28 (9.6%) | 79 (21.5%) |
Disability Class: Self-Care Difficulty
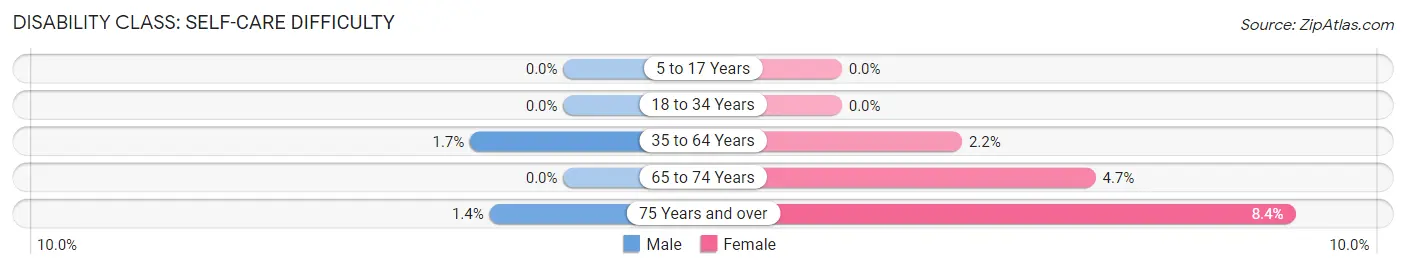
| Age Bracket | Male | Female |
| 5 to 17 Years | 0 (0.0%) | 0 (0.0%) |
| 18 to 34 Years | 0 (0.0%) | 0 (0.0%) |
| 35 to 64 Years | 16 (1.7%) | 20 (2.2%) |
| 65 to 74 Years | 0 (0.0%) | 18 (4.7%) |
| 75 Years and over | 4 (1.4%) | 31 (8.4%) |
Technology Access in Bigfork
Computing Device Access in Bigfork
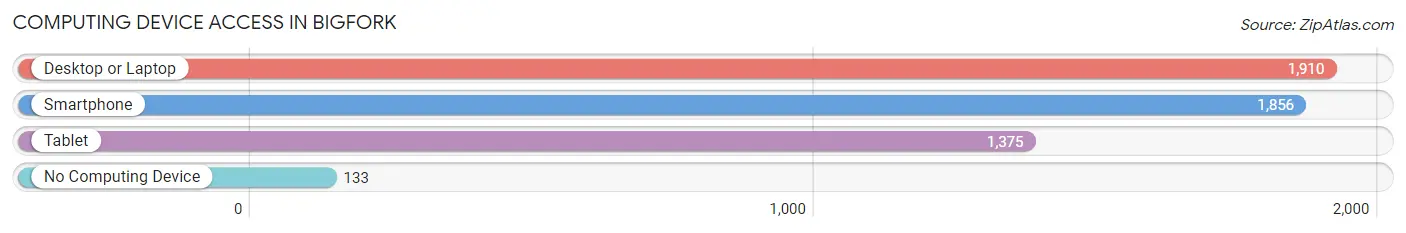
| Device Type | # Households | % Households |
| Desktop or Laptop | 1,910 | 85.4% |
| Smartphone | 1,856 | 83.0% |
| Tablet | 1,375 | 61.5% |
| No Computing Device | 133 | 5.9% |
| Total | 2,236 | 100.0% |
Internet Access in Bigfork
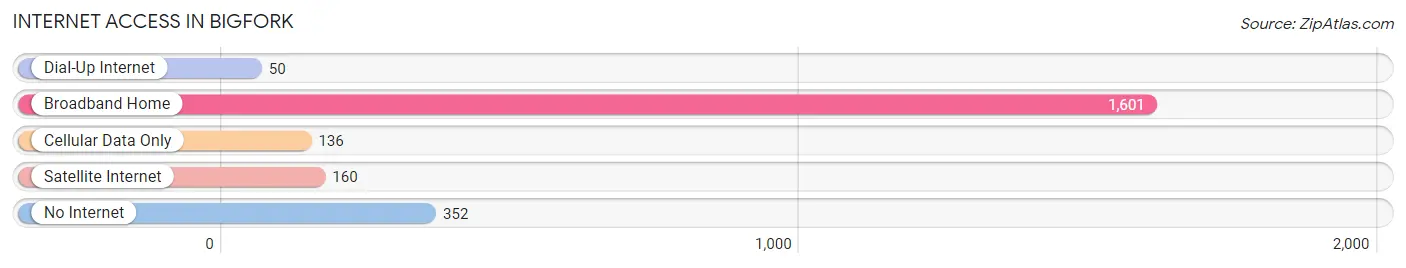
| Internet Type | # Households | % Households |
| Dial-Up Internet | 50 | 2.2% |
| Broadband Home | 1,601 | 71.6% |
| Cellular Data Only | 136 | 6.1% |
| Satellite Internet | 160 | 7.2% |
| No Internet | 352 | 15.7% |
| Total | 2,236 | 100.0% |
Bigfork Summary
Bigfork, Montana is a small town located in the Flathead Valley of northwestern Montana. It is situated on the eastern shore of Flathead Lake, the largest natural freshwater lake in the western United States. The town is surrounded by the Swan and Mission mountain ranges, and is home to a population of just over 1,000 people.
History
Bigfork was first settled in the late 1800s by homesteaders and loggers. The town was officially incorporated in 1909, and was named after the nearby Bigfork River. The town quickly grew as a logging and agricultural center, and by the 1920s, it had become a popular tourist destination.
In the 1950s, Bigfork began to experience a period of growth and development. The town was connected to the rest of the state by the completion of the Flathead Valley Highway in 1954, and the Bigfork Airport was built in 1956. The town also saw the construction of a number of new businesses, including a lumber mill, a sawmill, and a cannery.
Geography
Bigfork is located in the Flathead Valley of northwestern Montana. The town is situated on the eastern shore of Flathead Lake, the largest natural freshwater lake in the western United States. The lake is surrounded by the Swan and Mission mountain ranges, and is home to a variety of wildlife, including bald eagles, ospreys, and trumpeter swans.
The town is located at an elevation of 2,845 feet, and has a total area of 1.3 square miles. The climate is characterized by warm summers and cold winters, with an average annual temperature of 44.3 degrees Fahrenheit.
Economy
Bigfork’s economy is largely based on tourism and recreation. The town is home to a number of resorts, restaurants, and other businesses that cater to visitors. The town is also home to a number of art galleries, antique stores, and other specialty shops.
The town is also home to a number of manufacturing and service-based businesses. These include a lumber mill, a sawmill, and a cannery. The town is also home to a number of technology-based businesses, including a software development company and a web design firm.
Demographics
As of the 2010 census, Bigfork had a population of 1,072 people. The racial makeup of the town was 95.2% White, 0.7% Native American, 0.3% Asian, 0.2% African American, 0.1% Pacific Islander, and 3.5% from other races. The median household income was $41,250, and the median family income was $50,000.
Bigfork is home to a number of churches, including the Bigfork United Methodist Church, the Bigfork Presbyterian Church, and the Bigfork Baptist Church. The town is also home to a number of schools, including Bigfork Elementary School, Bigfork Middle School, and Bigfork High School.
Conclusion
Bigfork, Montana is a small town located in the Flathead Valley of northwestern Montana. It is situated on the eastern shore of Flathead Lake, the largest natural freshwater lake in the western United States. The town is surrounded by the Swan and Mission mountain ranges, and is home to a population of just over 1,000 people. The town’s economy is largely based on tourism and recreation, and it is home to a number of manufacturing and service-based businesses. The town is also home to a number of churches and schools.
Common Questions
What is Per Capita Income in Bigfork?
Per Capita income in Bigfork is $41,326.
What is the Median Family Income in Bigfork?
Median Family Income in Bigfork is $90,417.
What is the Median Household income in Bigfork?
Median Household Income in Bigfork is $73,443.
What is Income or Wage Gap in Bigfork?
Income or Wage Gap in Bigfork is 50.0%.
Women in Bigfork earn 50.0 cents for every dollar earned by a man.
What is Inequality or Gini Index in Bigfork?
Inequality or Gini Index in Bigfork is 0.39.
What is the Total Population of Bigfork?
Total Population of Bigfork is 4,953.
What is the Total Male Population of Bigfork?
Total Male Population of Bigfork is 2,423.
What is the Total Female Population of Bigfork?
Total Female Population of Bigfork is 2,530.
What is the Ratio of Males per 100 Females in Bigfork?
There are 95.77 Males per 100 Females in Bigfork.
What is the Ratio of Females per 100 Males in Bigfork?
There are 104.42 Females per 100 Males in Bigfork.
What is the Median Population Age in Bigfork?
Median Population Age in Bigfork is 54.2 Years.
What is the Average Family Size in Bigfork
Average Family Size in Bigfork is 3.0 People.
What is the Average Household Size in Bigfork
Average Household Size in Bigfork is 2.2 People.
How Large is the Labor Force in Bigfork?
There are 1,972 People in the Labor Forcein in Bigfork.
What is the Percentage of People in the Labor Force in Bigfork?
45.9% of People are in the Labor Force in Bigfork.
What is the Unemployment Rate in Bigfork?
Unemployment Rate in Bigfork is 3.5%.