North Browning, MT Map & Demographics
North Browning Map
North Browning Overview
$16,997
PER CAPITA INCOME
$40,568
AVG FAMILY INCOME
$38,462
AVG HOUSEHOLD INCOME
1.1%
WAGE / INCOME GAP [ % ]
98.9¢/ $1
WAGE / INCOME GAP [ $ ]
0.47
INEQUALITY / GINI INDEX
3,001
TOTAL POPULATION
1,455
MALE POPULATION
1,546
FEMALE POPULATION
94.11
MALES / 100 FEMALES
106.25
FEMALES / 100 MALES
26.7
MEDIAN AGE
4.5
AVG FAMILY SIZE
3.8
AVG HOUSEHOLD SIZE
1,029
LABOR FORCE [ PEOPLE ]
49.9%
PERCENT IN LABOR FORCE
11.6%
UNEMPLOYMENT RATE
Income in North Browning
Income Overview in North Browning
Per Capita Income in North Browning is $16,997, while median incomes of families and households are $40,568 and $38,462 respectively.
| Characteristic | Number | Measure |
| Per Capita Income | 3,001 | $16,997 |
| Median Family Income | 556 | $40,568 |
| Mean Family Income | 556 | $50,274 |
| Median Household Income | 772 | $38,462 |
| Mean Household Income | 772 | $56,636 |
| Income Deficit | 556 | $0 |
| Wage / Income Gap (%) | 3,001 | 1.10% |
| Wage / Income Gap ($) | 3,001 | 98.90¢ per $1 |
| Gini / Inequality Index | 3,001 | 0.47 |
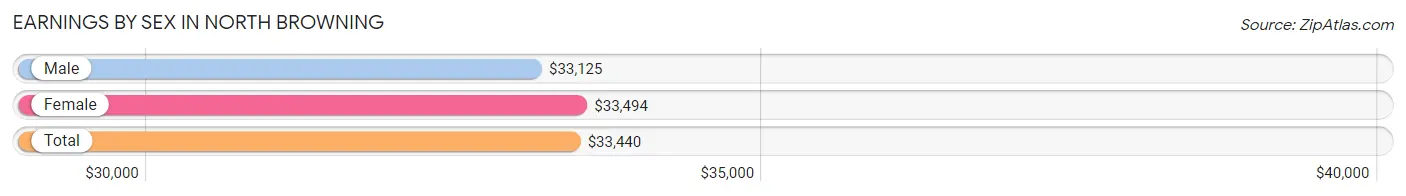
Earnings by Sex in North Browning
Average Earnings in North Browning are $33,440, $33,125 for men and $33,494 for women, a difference of 1.1%.
| Sex | Number | Average Earnings |
| Male | 522 (52.4%) | $33,125 |
| Female | 475 (47.6%) | $33,494 |
| Total | 997 (100.0%) | $33,440 |
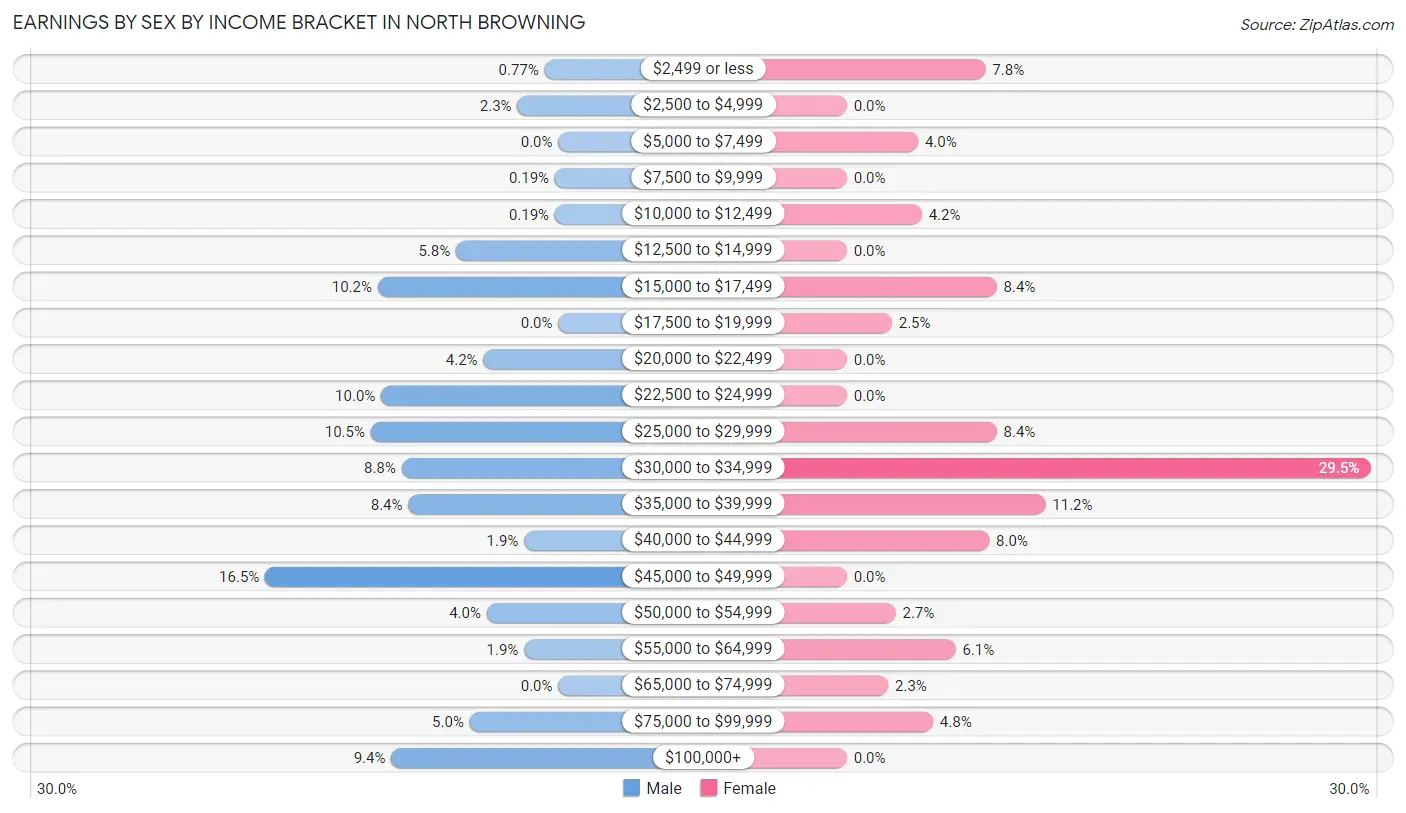
Earnings by Sex by Income Bracket in North Browning
The most common earnings brackets in North Browning are $45,000 to $49,999 for men (86 | 16.5%) and $30,000 to $34,999 for women (140 | 29.5%).
| Income | Male | Female |
| $2,499 or less | 4 (0.8%) | 37 (7.8%) |
| $2,500 to $4,999 | 12 (2.3%) | 0 (0.0%) |
| $5,000 to $7,499 | 0 (0.0%) | 19 (4.0%) |
| $7,500 to $9,999 | 1 (0.2%) | 0 (0.0%) |
| $10,000 to $12,499 | 1 (0.2%) | 20 (4.2%) |
| $12,500 to $14,999 | 30 (5.8%) | 0 (0.0%) |
| $15,000 to $17,499 | 53 (10.2%) | 40 (8.4%) |
| $17,500 to $19,999 | 0 (0.0%) | 12 (2.5%) |
| $20,000 to $22,499 | 22 (4.2%) | 0 (0.0%) |
| $22,500 to $24,999 | 52 (10.0%) | 0 (0.0%) |
| $25,000 to $29,999 | 55 (10.5%) | 40 (8.4%) |
| $30,000 to $34,999 | 46 (8.8%) | 140 (29.5%) |
| $35,000 to $39,999 | 44 (8.4%) | 53 (11.2%) |
| $40,000 to $44,999 | 10 (1.9%) | 38 (8.0%) |
| $45,000 to $49,999 | 86 (16.5%) | 0 (0.0%) |
| $50,000 to $54,999 | 21 (4.0%) | 13 (2.7%) |
| $55,000 to $64,999 | 10 (1.9%) | 29 (6.1%) |
| $65,000 to $74,999 | 0 (0.0%) | 11 (2.3%) |
| $75,000 to $99,999 | 26 (5.0%) | 23 (4.8%) |
| $100,000+ | 49 (9.4%) | 0 (0.0%) |
| Total | 522 (100.0%) | 475 (100.0%) |
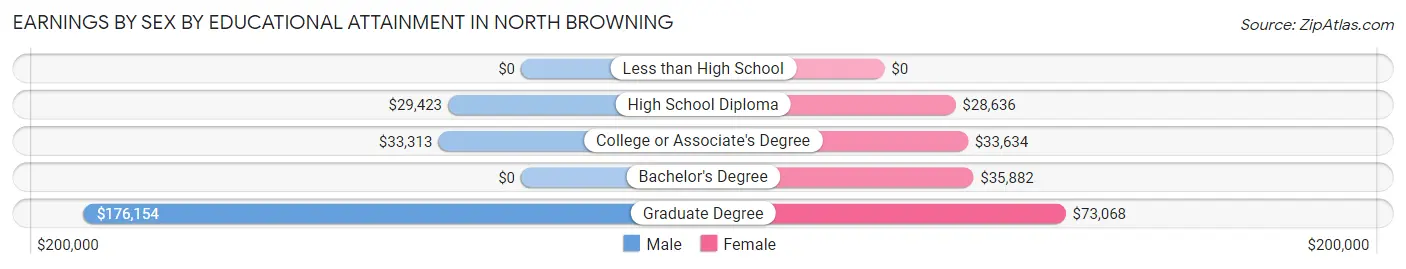
Earnings by Sex by Educational Attainment in North Browning
Average earnings in North Browning are $33,500 for men and $33,835 for women, a difference of 1.0%. Men with an educational attainment of graduate degree enjoy the highest average annual earnings of $176,154, while those with high school diploma education earn the least with $29,423. Women with an educational attainment of graduate degree earn the most with the average annual earnings of $73,068, while those with high school diploma education have the smallest earnings of $28,636.
| Educational Attainment | Male Income | Female Income |
| Less than High School | - | - |
| High School Diploma | $29,423 | $28,636 |
| College or Associate's Degree | $33,313 | $33,634 |
| Bachelor's Degree | - | - |
| Graduate Degree | $176,154 | $73,068 |
| Total | $33,500 | $33,835 |
Family Income in North Browning
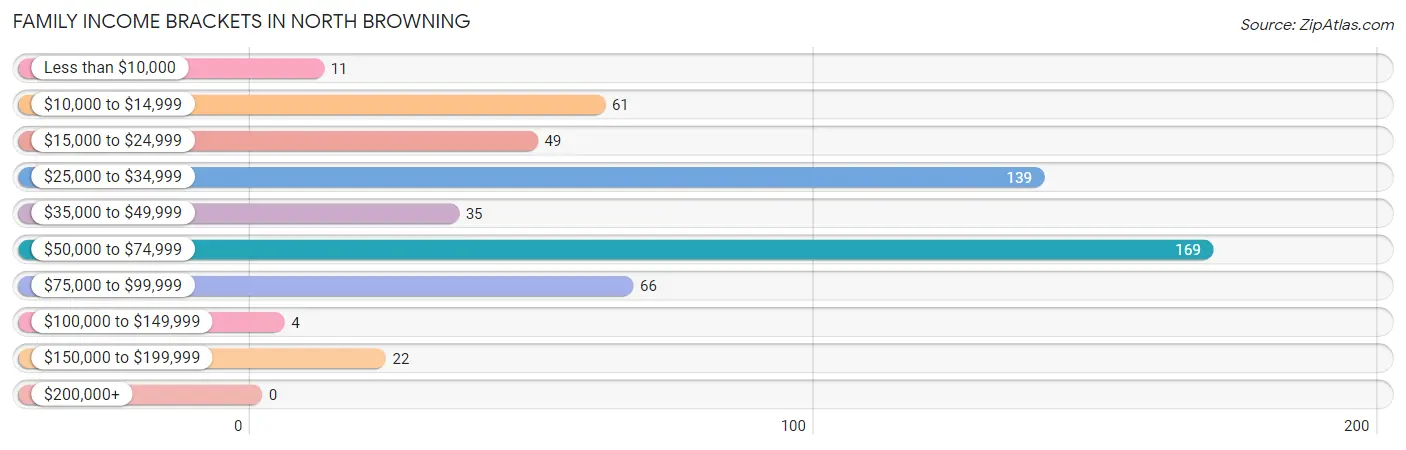
Family Income Brackets in North Browning
According to the North Browning family income data, there are 169 families falling into the $50,000 to $74,999 income range, which is the most common income bracket and makes up 30.4% of all families.
| Income Bracket | # Families | % Families |
| Less than $10,000 | 11 | 2.0% |
| $10,000 to $14,999 | 61 | 11.0% |
| $15,000 to $24,999 | 49 | 8.8% |
| $25,000 to $34,999 | 139 | 25.0% |
| $35,000 to $49,999 | 35 | 6.3% |
| $50,000 to $74,999 | 169 | 30.4% |
| $75,000 to $99,999 | 66 | 11.9% |
| $100,000 to $149,999 | 4 | 0.7% |
| $150,000 to $199,999 | 22 | 4.0% |
| $200,000+ | 0 | 0.0% |
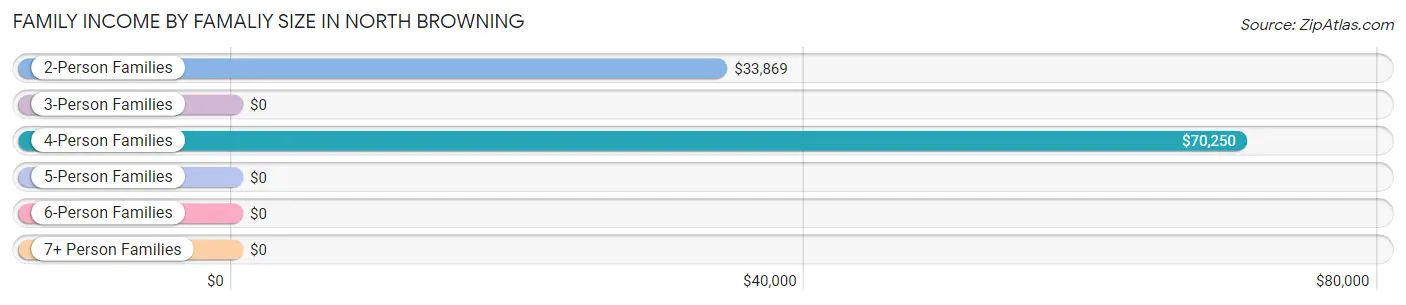
Family Income by Famaliy Size in North Browning
4-person families (156 | 28.1%) account for the highest median family income in North Browning with $70,250 per family, while 4-person families (156 | 28.1%) have the highest median income of $17,562 per family member.
| Income Bracket | # Families | Median Income |
| 2-Person Families | 227 (40.8%) | $33,869 |
| 3-Person Families | 34 (6.1%) | $0 |
| 4-Person Families | 156 (28.1%) | $70,250 |
| 5-Person Families | 51 (9.2%) | $0 |
| 6-Person Families | 49 (8.8%) | $0 |
| 7+ Person Families | 39 (7.0%) | $0 |
| Total | 556 (100.0%) | $40,568 |
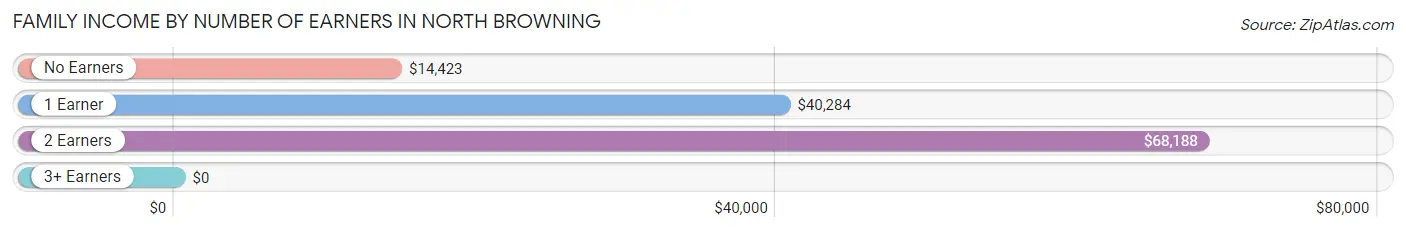
Family Income by Number of Earners in North Browning
| Number of Earners | # Families | Median Income |
| No Earners | 106 (19.1%) | $14,423 |
| 1 Earner | 291 (52.3%) | $40,284 |
| 2 Earners | 149 (26.8%) | $68,188 |
| 3+ Earners | 10 (1.8%) | $0 |
| Total | 556 (100.0%) | $40,568 |
Household Income in North Browning
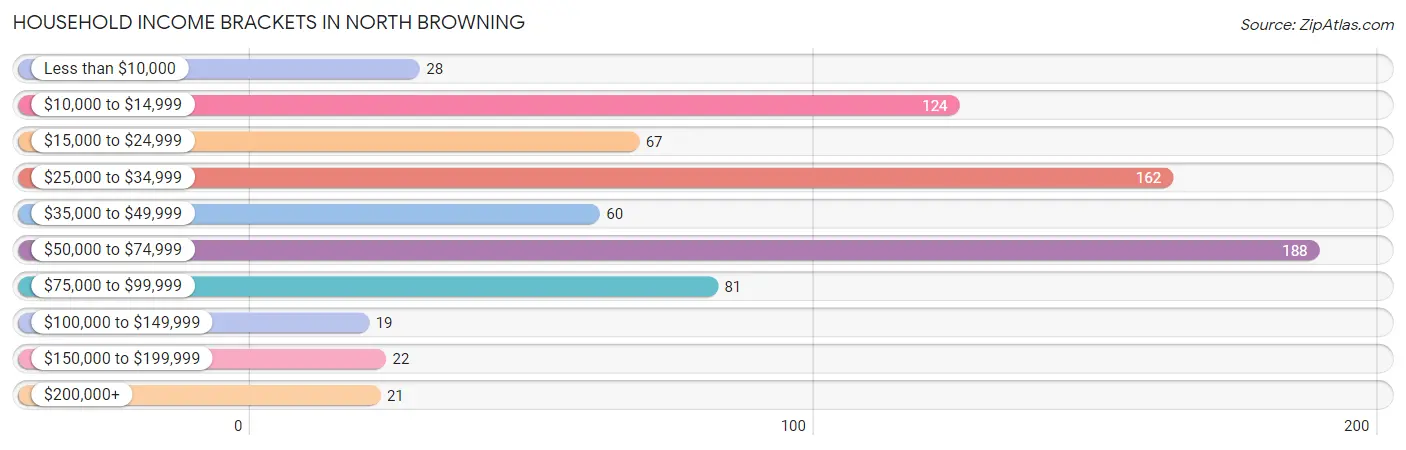
Household Income Brackets in North Browning
With 188 households falling in the category, the $50,000 to $74,999 income range is the most frequent in North Browning, accounting for 24.3% of all households. In contrast, only 19 households (2.5%) fall into the $100,000 to $149,999 income bracket, making it the least populous group.
| Income Bracket | # Households | % Households |
| Less than $10,000 | 28 | 3.6% |
| $10,000 to $14,999 | 124 | 16.1% |
| $15,000 to $24,999 | 67 | 8.7% |
| $25,000 to $34,999 | 162 | 21.0% |
| $35,000 to $49,999 | 60 | 7.8% |
| $50,000 to $74,999 | 188 | 24.4% |
| $75,000 to $99,999 | 81 | 10.5% |
| $100,000 to $149,999 | 19 | 2.5% |
| $150,000 to $199,999 | 22 | 2.8% |
| $200,000+ | 21 | 2.7% |
Household Income by Householder Age in North Browning
The median household income in North Browning is $38,462, with the highest median household income of $51,250 found in the 25 to 44 years age bracket for the primary householder. A total of 302 households (39.1%) fall into this category. Meanwhile, the 15 to 24 years age bracket for the primary householder has the lowest median household income of $0, with 22 households (2.9%) in this group.
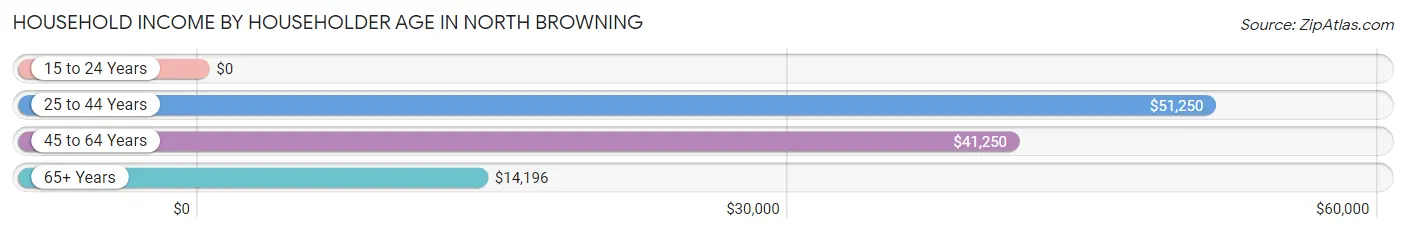
| Income Bracket | # Households | Median Income |
| 15 to 24 Years | 22 (2.9%) | $0 |
| 25 to 44 Years | 302 (39.1%) | $51,250 |
| 45 to 64 Years | 257 (33.3%) | $41,250 |
| 65+ Years | 191 (24.7%) | $14,196 |
| Total | 772 (100.0%) | $38,462 |
Poverty in North Browning
Income Below Poverty by Sex and Age in North Browning
With 32.4% poverty level for males and 38.8% for females among the residents of North Browning, 15 year old males and 65 to 74 year old females are the most vulnerable to poverty, with 11 males (100.0%) and 62 females (69.7%) in their respective age groups living below the poverty level.
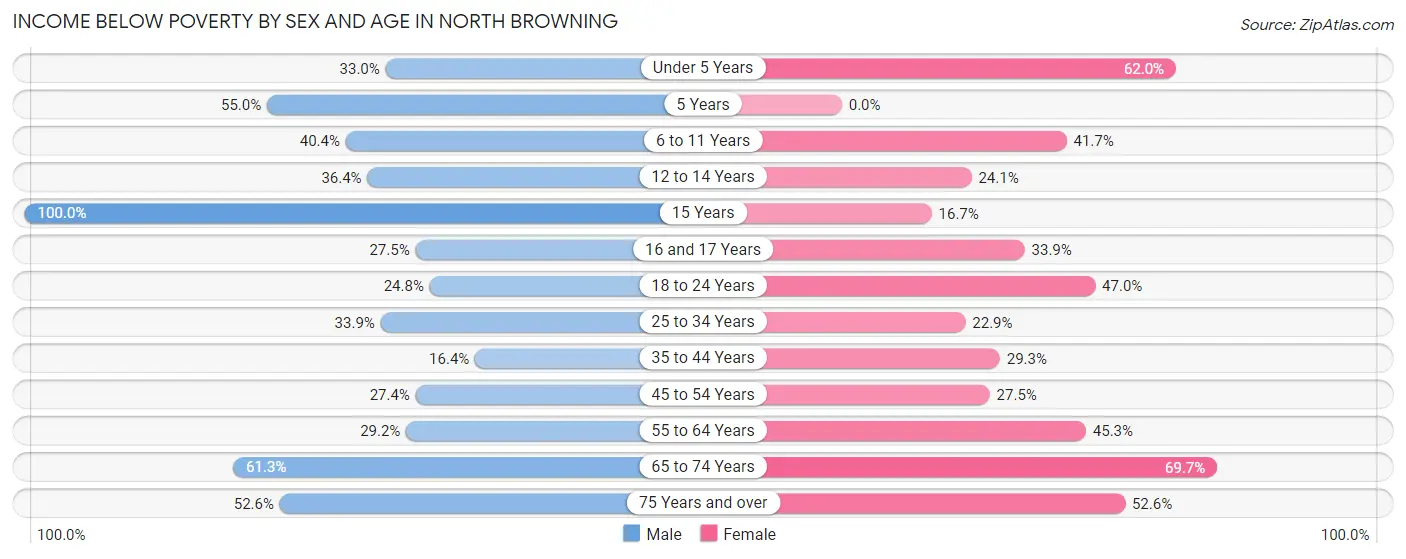
| Age Bracket | Male | Female |
| Under 5 Years | 32 (33.0%) | 80 (62.0%) |
| 5 Years | 11 (55.0%) | 0 (0.0%) |
| 6 to 11 Years | 84 (40.4%) | 73 (41.7%) |
| 12 to 14 Years | 44 (36.4%) | 13 (24.1%) |
| 15 Years | 11 (100.0%) | 9 (16.7%) |
| 16 and 17 Years | 14 (27.5%) | 19 (33.9%) |
| 18 to 24 Years | 31 (24.8%) | 87 (47.0%) |
| 25 to 34 Years | 78 (33.9%) | 36 (22.9%) |
| 35 to 44 Years | 37 (16.4%) | 66 (29.3%) |
| 45 to 54 Years | 37 (27.4%) | 42 (27.5%) |
| 55 to 64 Years | 35 (29.2%) | 53 (45.3%) |
| 65 to 74 Years | 38 (61.3%) | 62 (69.7%) |
| 75 Years and over | 10 (52.6%) | 41 (52.6%) |
| Total | 462 (32.4%) | 581 (38.8%) |
Income Above Poverty by Sex and Age in North Browning
According to the poverty statistics in North Browning, males aged 35 to 44 years and females aged 5 years are the age groups that are most secure financially, with 83.6% of males and 100.0% of females in these age groups living above the poverty line.
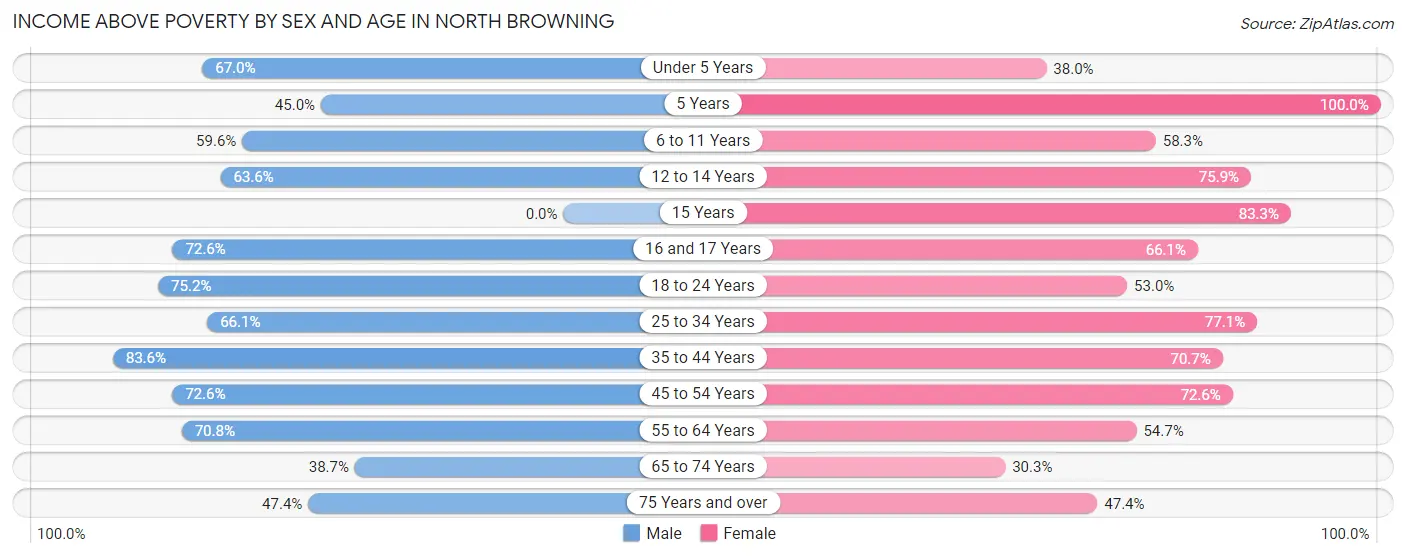
| Age Bracket | Male | Female |
| Under 5 Years | 65 (67.0%) | 49 (38.0%) |
| 5 Years | 9 (45.0%) | 27 (100.0%) |
| 6 to 11 Years | 124 (59.6%) | 102 (58.3%) |
| 12 to 14 Years | 77 (63.6%) | 41 (75.9%) |
| 15 Years | 0 (0.0%) | 45 (83.3%) |
| 16 and 17 Years | 37 (72.6%) | 37 (66.1%) |
| 18 to 24 Years | 94 (75.2%) | 98 (53.0%) |
| 25 to 34 Years | 152 (66.1%) | 121 (77.1%) |
| 35 to 44 Years | 189 (83.6%) | 159 (70.7%) |
| 45 to 54 Years | 98 (72.6%) | 111 (72.6%) |
| 55 to 64 Years | 85 (70.8%) | 64 (54.7%) |
| 65 to 74 Years | 24 (38.7%) | 27 (30.3%) |
| 75 Years and over | 9 (47.4%) | 37 (47.4%) |
| Total | 963 (67.6%) | 918 (61.2%) |
Income Below Poverty Among Married-Couple Families in North Browning
The poverty statistics for married-couple families in North Browning show that 22.7% or 56 of the total 247 families live below the poverty line. Families with 5 or more children have the highest poverty rate of 100.0%, comprising of 11 families. On the other hand, families with 1 or 2 children have the lowest poverty rate of 0.0%, which includes 0 families.
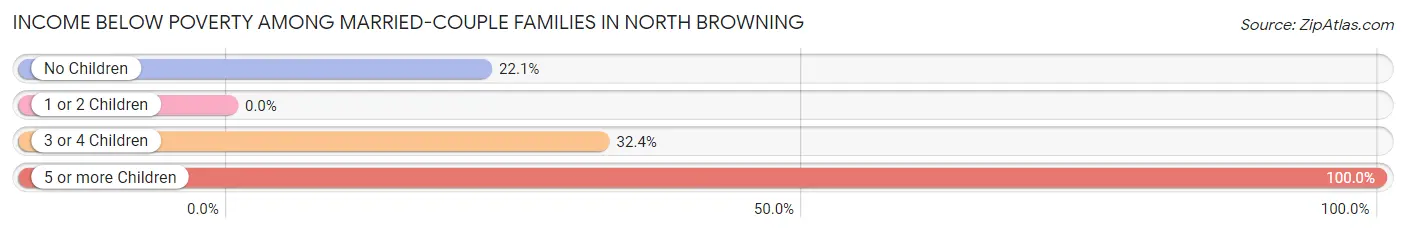
| Children | Above Poverty | Below Poverty |
| No Children | 81 (77.9%) | 23 (22.1%) |
| 1 or 2 Children | 64 (100.0%) | 0 (0.0%) |
| 3 or 4 Children | 46 (67.6%) | 22 (32.4%) |
| 5 or more Children | 0 (0.0%) | 11 (100.0%) |
| Total | 191 (77.3%) | 56 (22.7%) |
Income Below Poverty Among Single-Parent Households in North Browning
According to the poverty data in North Browning, 10.3% or 12 single-father households and 35.7% or 69 single-mother households are living below the poverty line. Among single-father households, those with 5 or more children have the highest poverty rate, with 12 households (100.0%) experiencing poverty. Likewise, among single-mother households, those with 1 or 2 children have the highest poverty rate, with 69 households (61.6%) falling below the poverty line.
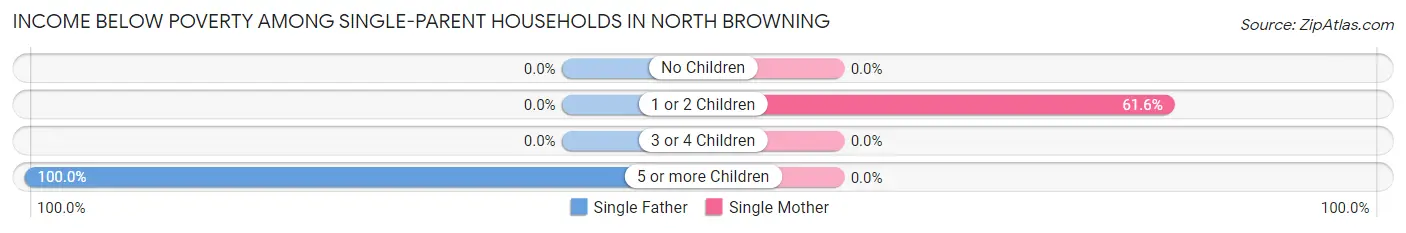
| Children | Single Father | Single Mother |
| No Children | 0 (0.0%) | 0 (0.0%) |
| 1 or 2 Children | 0 (0.0%) | 69 (61.6%) |
| 3 or 4 Children | 0 (0.0%) | 0 (0.0%) |
| 5 or more Children | 12 (100.0%) | 0 (0.0%) |
| Total | 12 (10.3%) | 69 (35.7%) |
Income Below Poverty Among Married-Couple vs Single-Parent Households in North Browning
The poverty data for North Browning shows that 56 of the married-couple family households (22.7%) and 81 of the single-parent households (26.2%) are living below the poverty level. Within the married-couple family households, those with 5 or more children have the highest poverty rate, with 11 households (100.0%) falling below the poverty line. Among the single-parent households, those with 5 or more children have the highest poverty rate, with 12 household (100.0%) living below poverty.
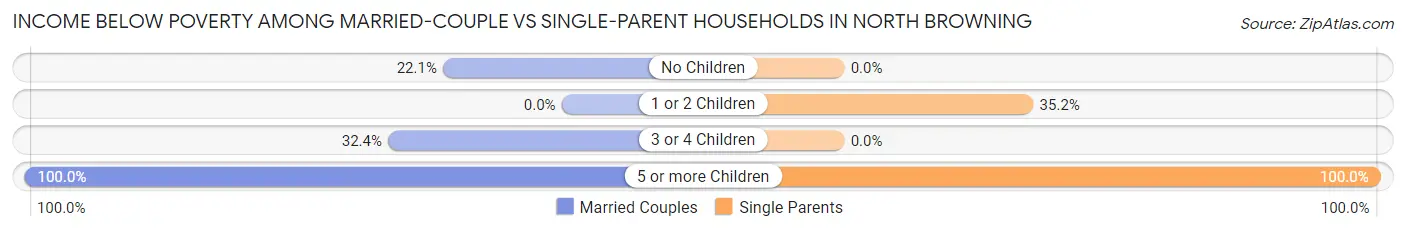
| Children | Married-Couple Families | Single-Parent Households |
| No Children | 23 (22.1%) | 0 (0.0%) |
| 1 or 2 Children | 0 (0.0%) | 69 (35.2%) |
| 3 or 4 Children | 22 (32.4%) | 0 (0.0%) |
| 5 or more Children | 11 (100.0%) | 12 (100.0%) |
| Total | 56 (22.7%) | 81 (26.2%) |
Race in North Browning
The most populous races in North Browning are Native / Alaskan (2,821 | 94.0%), Some other Race (81 | 2.7%), and White / Caucasian (56 | 1.9%).
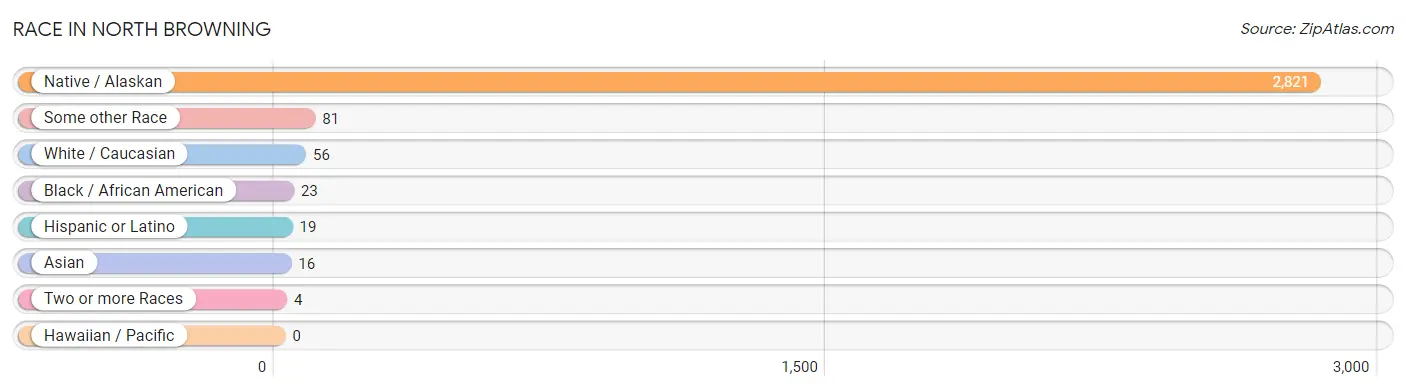
| Race | # Population | % Population |
| Asian | 16 | 0.5% |
| Black / African American | 23 | 0.8% |
| Hawaiian / Pacific | 0 | 0.0% |
| Hispanic or Latino | 19 | 0.6% |
| Native / Alaskan | 2,821 | 94.0% |
| White / Caucasian | 56 | 1.9% |
| Two or more Races | 4 | 0.1% |
| Some other Race | 81 | 2.7% |
| Total | 3,001 | 100.0% |
Ancestry in North Browning
The most populous ancestries reported in North Browning are Blackfeet (2,651 | 88.3%), English (30 | 1.0%), African (17 | 0.6%), Subsaharan African (17 | 0.6%), and German (15 | 0.5%), together accounting for 91.0% of all North Browning residents.
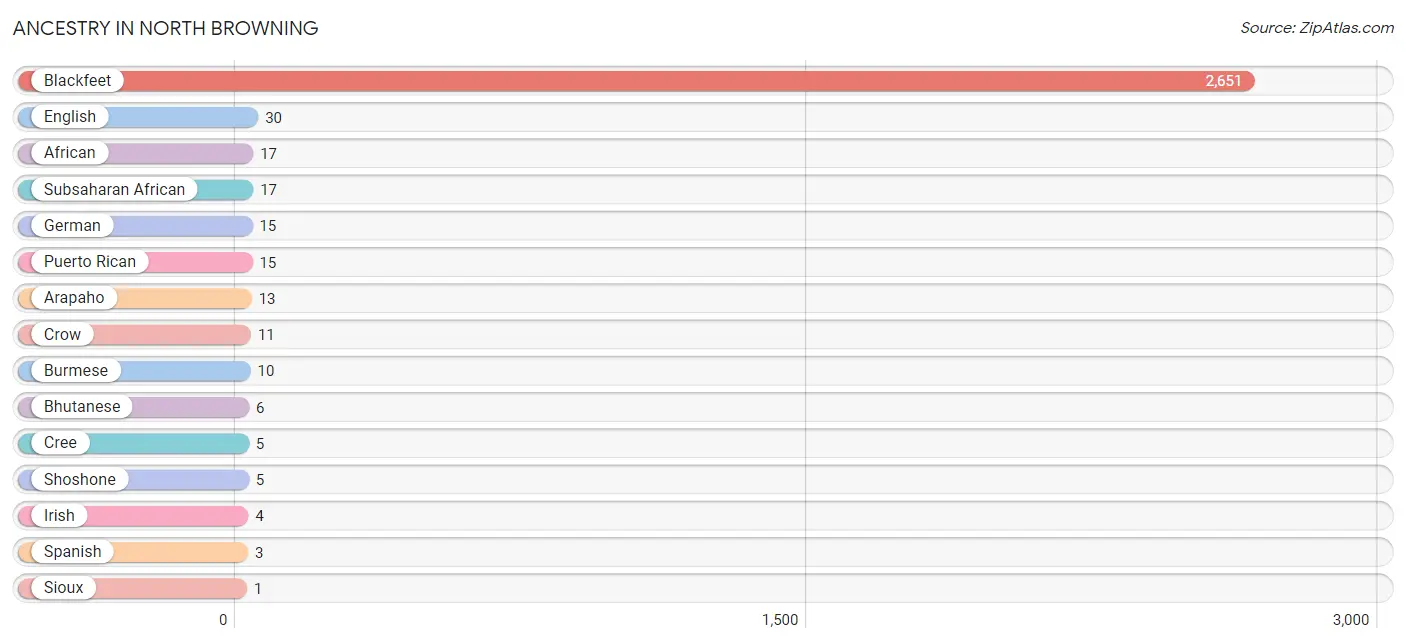
| Ancestry | # Population | % Population |
| African | 17 | 0.6% |
| Arapaho | 13 | 0.4% |
| Bhutanese | 6 | 0.2% |
| Blackfeet | 2,651 | 88.3% |
| Burmese | 10 | 0.3% |
| Cree | 5 | 0.2% |
| Crow | 11 | 0.4% |
| English | 30 | 1.0% |
| German | 15 | 0.5% |
| Irish | 4 | 0.1% |
| Puerto Rican | 15 | 0.5% |
| Shoshone | 5 | 0.2% |
| Sioux | 1 | 0.0% |
| Spaniard | 1 | 0.0% |
| Spanish | 3 | 0.1% |
| Subsaharan African | 17 | 0.6% | View All 16 Rows |
Immigrants in North Browning

| Immigration Origin | # Population | % Population | View All 0 Rows |
Sex and Age in North Browning
Sex and Age in North Browning
The most populous age groups in North Browning are 10 to 14 Years (197 | 13.5%) for men and 5 to 9 Years (189 | 12.2%) for women.
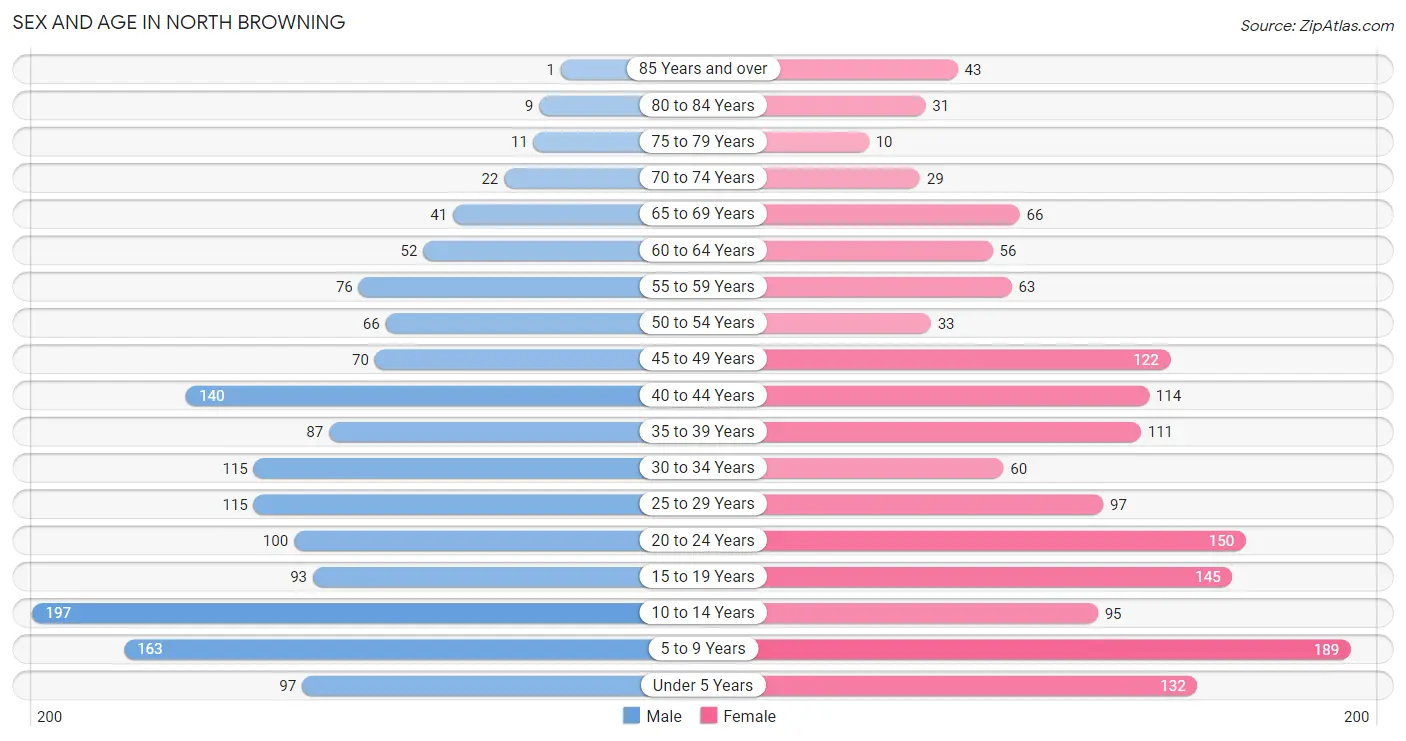
| Age Bracket | Male | Female |
| Under 5 Years | 97 (6.7%) | 132 (8.5%) |
| 5 to 9 Years | 163 (11.2%) | 189 (12.2%) |
| 10 to 14 Years | 197 (13.5%) | 95 (6.1%) |
| 15 to 19 Years | 93 (6.4%) | 145 (9.4%) |
| 20 to 24 Years | 100 (6.9%) | 150 (9.7%) |
| 25 to 29 Years | 115 (7.9%) | 97 (6.3%) |
| 30 to 34 Years | 115 (7.9%) | 60 (3.9%) |
| 35 to 39 Years | 87 (6.0%) | 111 (7.2%) |
| 40 to 44 Years | 140 (9.6%) | 114 (7.4%) |
| 45 to 49 Years | 70 (4.8%) | 122 (7.9%) |
| 50 to 54 Years | 66 (4.5%) | 33 (2.1%) |
| 55 to 59 Years | 76 (5.2%) | 63 (4.1%) |
| 60 to 64 Years | 52 (3.6%) | 56 (3.6%) |
| 65 to 69 Years | 41 (2.8%) | 66 (4.3%) |
| 70 to 74 Years | 22 (1.5%) | 29 (1.9%) |
| 75 to 79 Years | 11 (0.8%) | 10 (0.6%) |
| 80 to 84 Years | 9 (0.6%) | 31 (2.0%) |
| 85 Years and over | 1 (0.1%) | 43 (2.8%) |
| Total | 1,455 (100.0%) | 1,546 (100.0%) |
Families and Households in North Browning
Median Family Size in North Browning
The median family size in North Browning is 4.53 persons per family, with married-couple families (247 | 44.4%) accounting for the largest median family size of 4.78 persons per family. On the other hand, single female/mother families (193 | 34.7%) represent the smallest median family size with 4.12 persons per family.
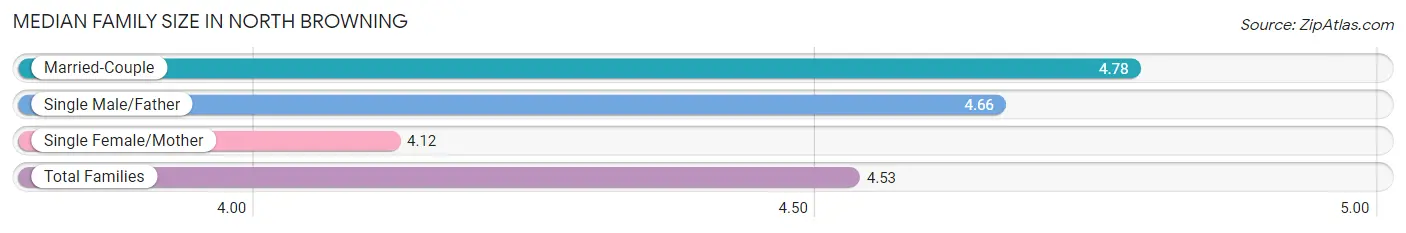
| Family Type | # Families | Family Size |
| Married-Couple | 247 (44.4%) | 4.78 |
| Single Male/Father | 116 (20.9%) | 4.66 |
| Single Female/Mother | 193 (34.7%) | 4.12 |
| Total Families | 556 (100.0%) | 4.53 |
Median Household Size in North Browning
The median household size in North Browning is 3.76 persons per household, with single male/father households (116 | 15.0%) accounting for the largest median household size of 5.34 persons per household. non-family households (216 | 28.0%) represent the smallest median household size with 1.09 persons per household.
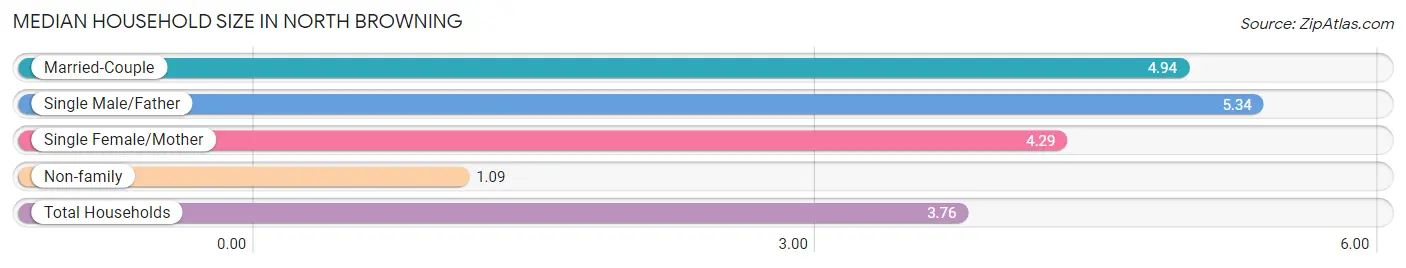
| Household Type | # Households | Household Size |
| Married-Couple | 247 (32.0%) | 4.94 |
| Single Male/Father | 116 (15.0%) | 5.34 |
| Single Female/Mother | 193 (25.0%) | 4.29 |
| Non-family | 216 (28.0%) | 1.09 |
| Total Households | 772 (100.0%) | 3.76 |
Household Size by Marriage Status in North Browning
Out of a total of 772 households in North Browning, 556 (72.0%) are family households, while 216 (28.0%) are nonfamily households. The most numerous type of family households are 2-person households, comprising 184, and the most common type of nonfamily households are 1-person households, comprising 192.
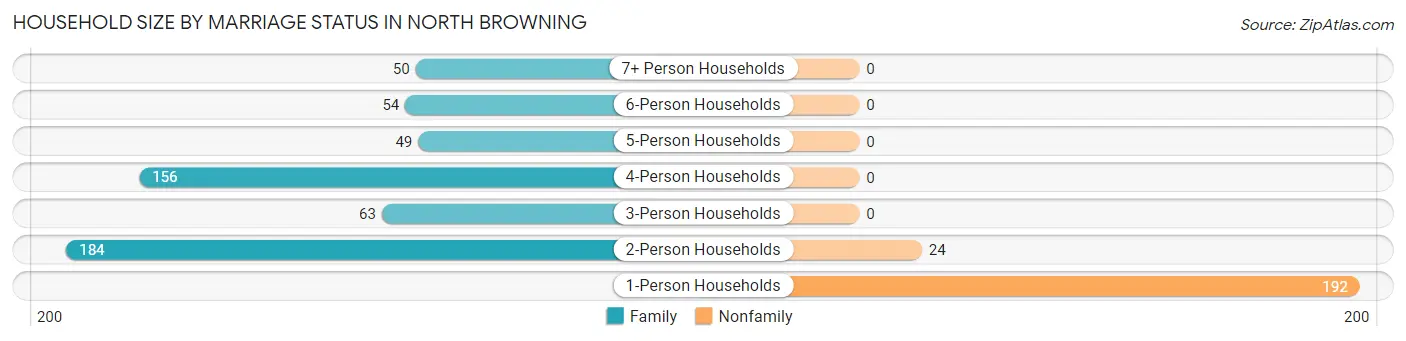
| Household Size | Family Households | Nonfamily Households |
| 1-Person Households | - | 192 (24.9%) |
| 2-Person Households | 184 (23.8%) | 24 (3.1%) |
| 3-Person Households | 63 (8.2%) | 0 (0.0%) |
| 4-Person Households | 156 (20.2%) | 0 (0.0%) |
| 5-Person Households | 49 (6.4%) | 0 (0.0%) |
| 6-Person Households | 54 (7.0%) | 0 (0.0%) |
| 7+ Person Households | 50 (6.5%) | 0 (0.0%) |
| Total | 556 (72.0%) | 216 (28.0%) |
Female Fertility in North Browning
Fertility by Age in North Browning
| Age Bracket | Women with Births | Births / 1,000 Women |
| 15 to 19 years | 0 (0.0%) | 0.0 |
| 20 to 34 years | 0 (0.0%) | 0.0 |
| 35 to 50 years | 0 (0.0%) | 0.0 |
| Total | 0 (0.0%) | 0.0 |
Fertility by Age by Marriage Status in North Browning
| Age Bracket | Married | Unmarried |
| 15 to 19 years | 0 (0.0%) | 0 (0.0%) |
| 20 to 34 years | 0 (0.0%) | 0 (0.0%) |
| 35 to 50 years | 0 (0.0%) | 0 (0.0%) |
| Total | 0 (0.0%) | 0 (0.0%) |
Fertility by Education in North Browning
| Educational Attainment | Women with Births | Births / 1,000 Women |
| Less than High School | 0 (0.0%) | 0.0 |
| High School Diploma | 0 (0.0%) | 0.0 |
| College or Associate's Degree | 0 (0.0%) | 0.0 |
| Bachelor's Degree | 0 (0.0%) | 0.0 |
| Graduate Degree | 0 (0.0%) | 0.0 |
| Total | 0 (0.0%) | 0.0 |
Fertility by Education by Marriage Status in North Browning
| Educational Attainment | Married | Unmarried |
| Less than High School | 0 (0.0%) | 0 (0.0%) |
| High School Diploma | 0 (0.0%) | 0 (0.0%) |
| College or Associate's Degree | 0 (0.0%) | 0 (0.0%) |
| Bachelor's Degree | 0 (0.0%) | 0 (0.0%) |
| Graduate Degree | 0 (0.0%) | 0 (0.0%) |
| Total | 0 (0.0%) | 0 (0.0%) |
Employment Characteristics in North Browning
Employment by Class of Employer in North Browning
Among the 892 employed individuals in North Browning, federal government employees (431 | 48.3%), private company employees (222 | 24.9%), and local government employees (139 | 15.6%) make up the most common classes of employment.
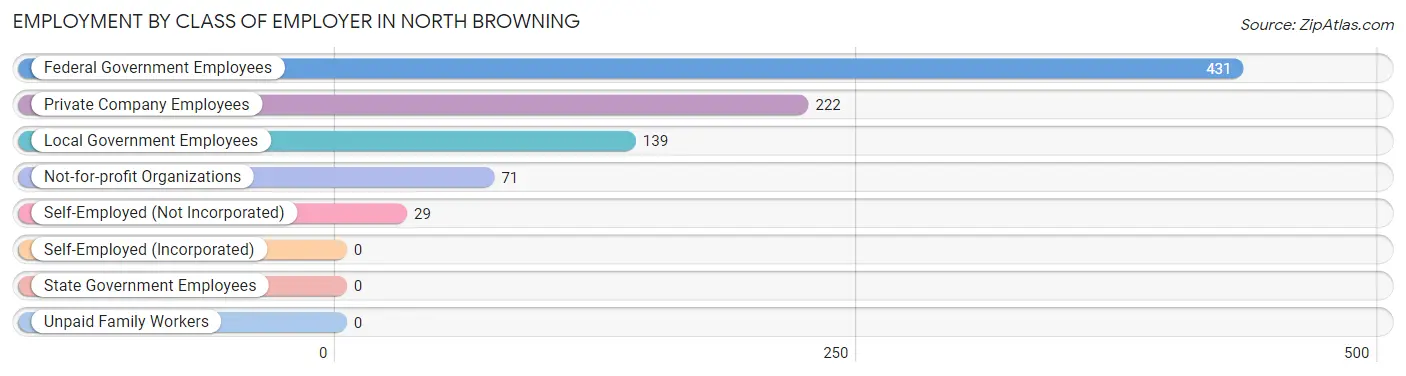
| Employer Class | # Employees | % Employees |
| Private Company Employees | 222 | 24.9% |
| Self-Employed (Incorporated) | 0 | 0.0% |
| Self-Employed (Not Incorporated) | 29 | 3.3% |
| Not-for-profit Organizations | 71 | 8.0% |
| Local Government Employees | 139 | 15.6% |
| State Government Employees | 0 | 0.0% |
| Federal Government Employees | 431 | 48.3% |
| Unpaid Family Workers | 0 | 0.0% |
| Total | 892 | 100.0% |
Employment Status by Age in North Browning
According to the labor force statistics for North Browning, out of the total population over 16 years of age (2,063), 49.9% or 1,029 individuals are in the labor force, with 11.6% or 119 of them unemployed. The age group with the highest labor force participation rate is 35 to 44 years, with 75.4% or 341 individuals in the labor force. Within the labor force, the 16 to 19 years age range has the highest percentage of unemployed individuals, with 100.0% or 5 of them being unemployed.
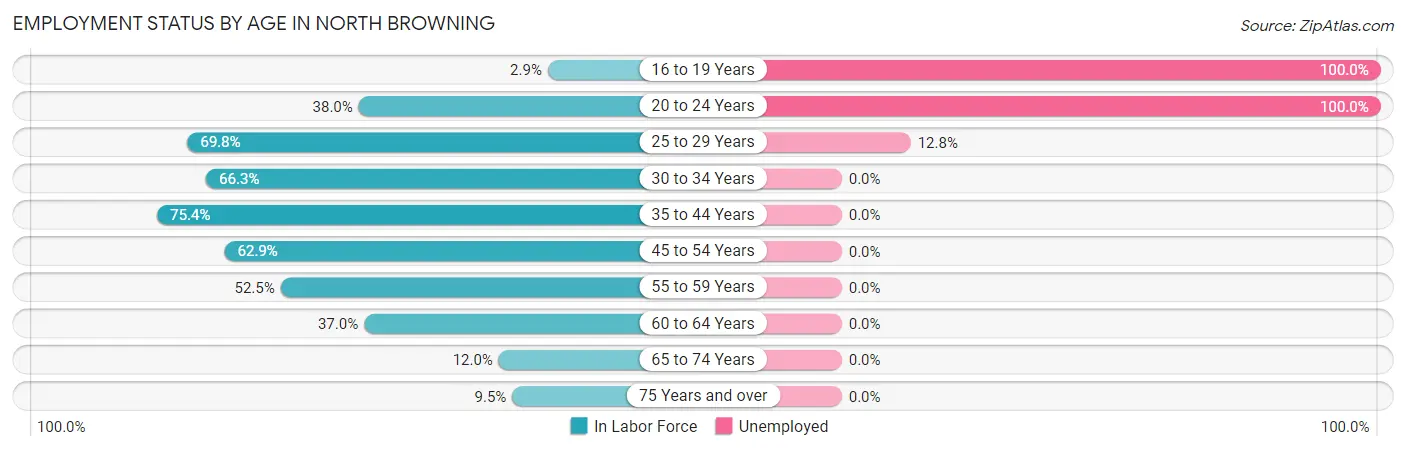
| Age Bracket | In Labor Force | Unemployed |
| 16 to 19 Years | 5 (2.9%) | 5 (100.0%) |
| 20 to 24 Years | 95 (38.0%) | 95 (100.0%) |
| 25 to 29 Years | 148 (69.8%) | 19 (12.8%) |
| 30 to 34 Years | 116 (66.3%) | 0 (0.0%) |
| 35 to 44 Years | 341 (75.4%) | 0 (0.0%) |
| 45 to 54 Years | 183 (62.9%) | 0 (0.0%) |
| 55 to 59 Years | 73 (52.5%) | 0 (0.0%) |
| 60 to 64 Years | 40 (37.0%) | 0 (0.0%) |
| 65 to 74 Years | 19 (12.0%) | 0 (0.0%) |
| 75 Years and over | 10 (9.5%) | 0 (0.0%) |
| Total | 1,029 (49.9%) | 119 (11.6%) |
Employment Status by Educational Attainment in North Browning
According to labor force statistics for North Browning, 65.4% of individuals (901) out of the total population between 25 and 64 years of age (1,377) are in the labor force, with 2.1% or 19 of them being unemployed. The group with the highest labor force participation rate are those with the educational attainment of bachelor's degree or higher, with 85.9% or 281 individuals in the labor force. Within the labor force, individuals with less than high school education have the highest percentage of unemployment, with 26.4% or 19 of them being unemployed.
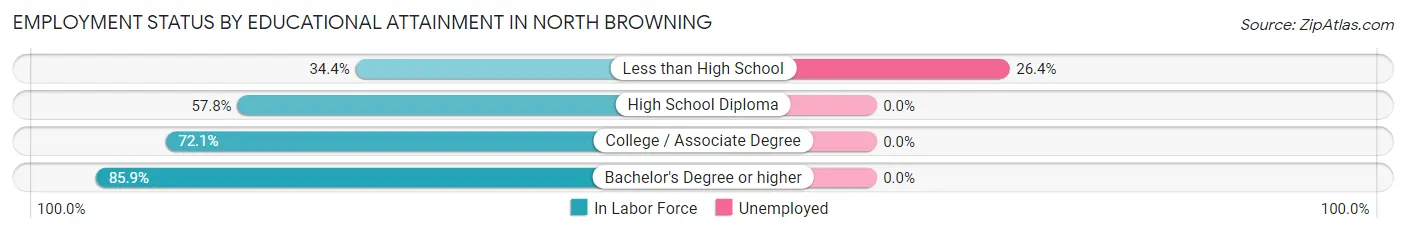
| Educational Attainment | In Labor Force | Unemployed |
| Less than High School | 72 (34.4%) | 55 (26.4%) |
| High School Diploma | 236 (57.8%) | 0 (0.0%) |
| College / Associate Degree | 312 (72.1%) | 0 (0.0%) |
| Bachelor's Degree or higher | 281 (85.9%) | 0 (0.0%) |
| Total | 901 (65.4%) | 29 (2.1%) |
Employment Occupations by Sex in North Browning
Management, Business, Science and Arts Occupations
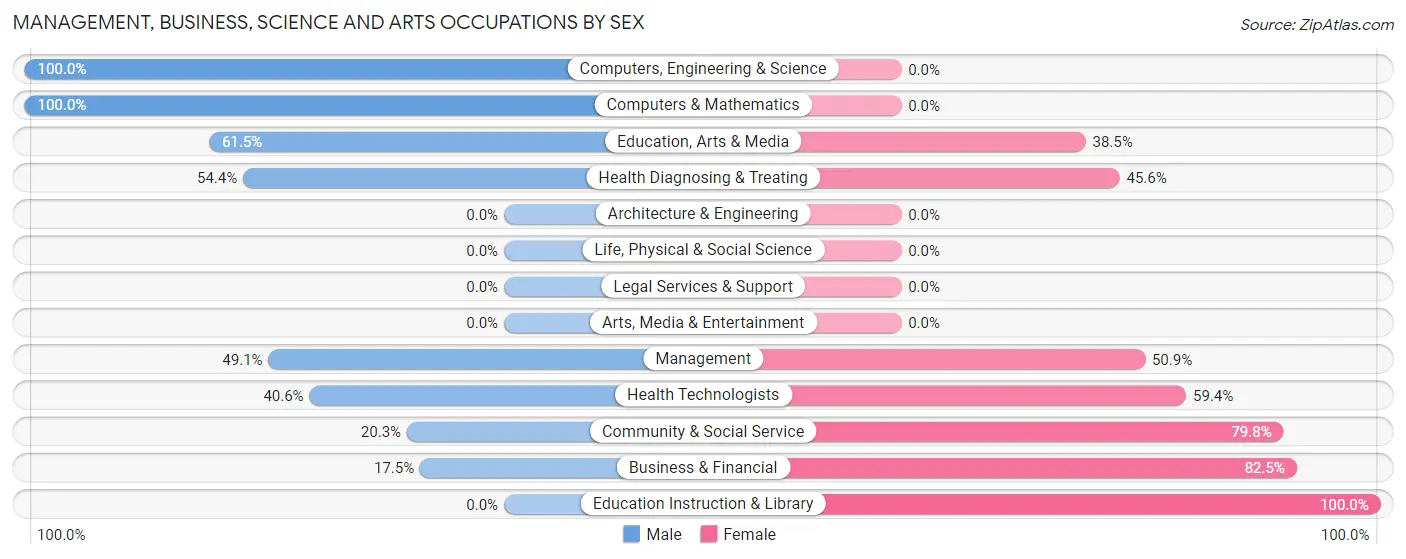
The most common Management, Business, Science and Arts occupations in North Browning are Management (116 | 12.7%), Health Diagnosing & Treating (90 | 9.9%), Community & Social Service (79 | 8.7%), Health Technologists (69 | 7.6%), and Education Instruction & Library (53 | 5.8%).
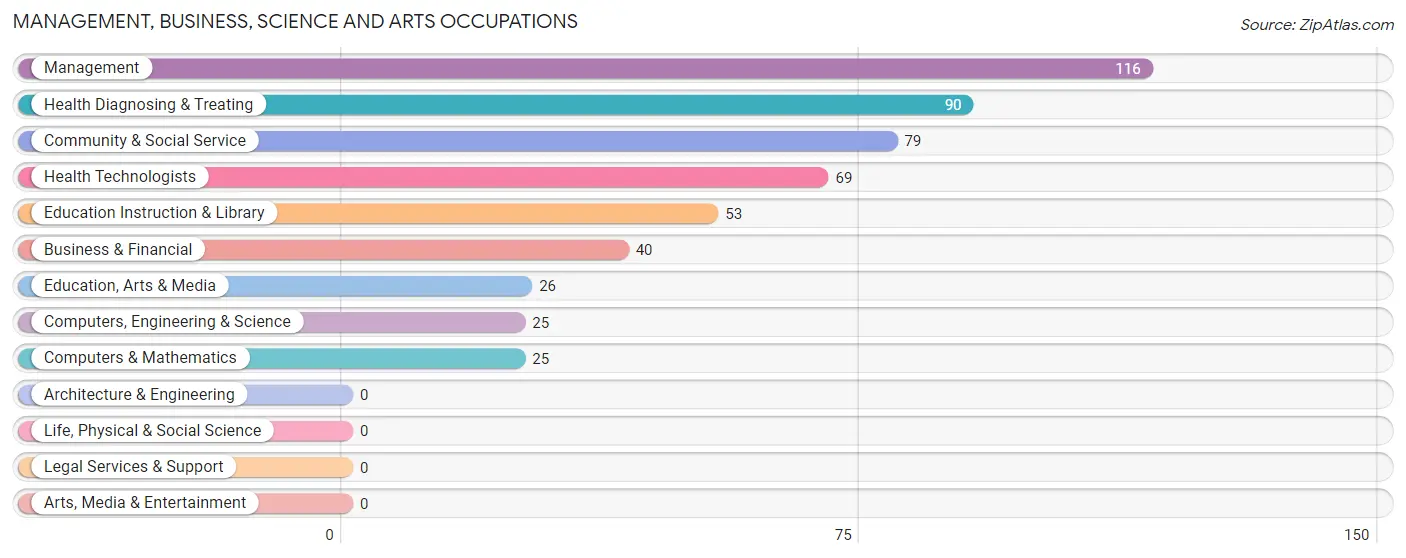
Management, Business, Science and Arts Occupations by Sex
Within the Management, Business, Science and Arts occupations in North Browning, the most male-oriented occupations are Computers, Engineering & Science (100.0%), Computers & Mathematics (100.0%), and Education, Arts & Media (61.5%), while the most female-oriented occupations are Education Instruction & Library (100.0%), Business & Financial (82.5%), and Community & Social Service (79.7%).
| Occupation | Male | Female |
| Management | 57 (49.1%) | 59 (50.9%) |
| Business & Financial | 7 (17.5%) | 33 (82.5%) |
| Computers, Engineering & Science | 25 (100.0%) | 0 (0.0%) |
| Computers & Mathematics | 25 (100.0%) | 0 (0.0%) |
| Architecture & Engineering | 0 (0.0%) | 0 (0.0%) |
| Life, Physical & Social Science | 0 (0.0%) | 0 (0.0%) |
| Community & Social Service | 16 (20.3%) | 63 (79.7%) |
| Education, Arts & Media | 16 (61.5%) | 10 (38.5%) |
| Legal Services & Support | 0 (0.0%) | 0 (0.0%) |
| Education Instruction & Library | 0 (0.0%) | 53 (100.0%) |
| Arts, Media & Entertainment | 0 (0.0%) | 0 (0.0%) |
| Health Diagnosing & Treating | 49 (54.4%) | 41 (45.6%) |
| Health Technologists | 28 (40.6%) | 41 (59.4%) |
| Total (Category) | 154 (44.0%) | 196 (56.0%) |
| Total (Overall) | 468 (51.4%) | 443 (48.6%) |
Services Occupations
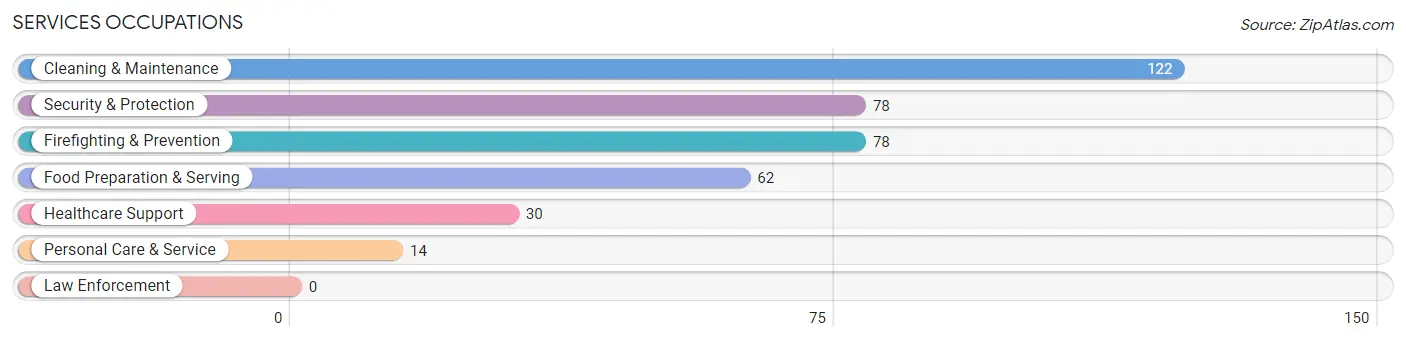
The most common Services occupations in North Browning are Cleaning & Maintenance (122 | 13.4%), Security & Protection (78 | 8.6%), Firefighting & Prevention (78 | 8.6%), Food Preparation & Serving (62 | 6.8%), and Healthcare Support (30 | 3.3%).
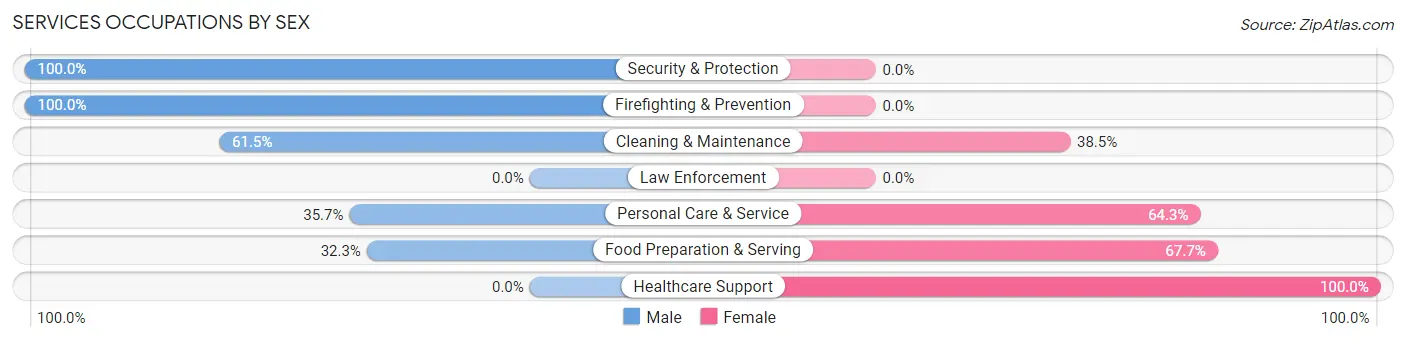
Services Occupations by Sex
Within the Services occupations in North Browning, the most male-oriented occupations are Security & Protection (100.0%), Firefighting & Prevention (100.0%), and Cleaning & Maintenance (61.5%), while the most female-oriented occupations are Healthcare Support (100.0%), Food Preparation & Serving (67.7%), and Personal Care & Service (64.3%).
| Occupation | Male | Female |
| Healthcare Support | 0 (0.0%) | 30 (100.0%) |
| Security & Protection | 78 (100.0%) | 0 (0.0%) |
| Firefighting & Prevention | 78 (100.0%) | 0 (0.0%) |
| Law Enforcement | 0 (0.0%) | 0 (0.0%) |
| Food Preparation & Serving | 20 (32.3%) | 42 (67.7%) |
| Cleaning & Maintenance | 75 (61.5%) | 47 (38.5%) |
| Personal Care & Service | 5 (35.7%) | 9 (64.3%) |
| Total (Category) | 178 (58.2%) | 128 (41.8%) |
| Total (Overall) | 468 (51.4%) | 443 (48.6%) |
Sales and Office Occupations
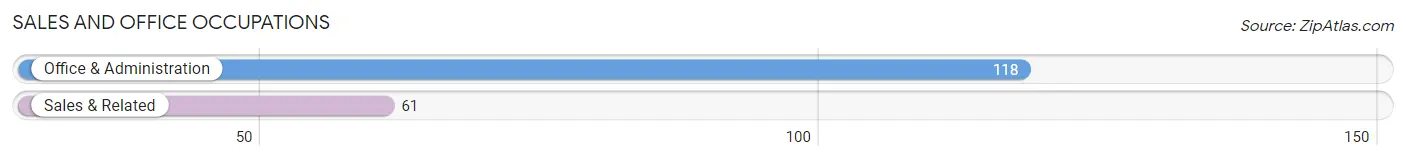
The most common Sales and Office occupations in North Browning are Office & Administration (118 | 13.0%), and Sales & Related (61 | 6.7%).
Sales and Office Occupations by Sex
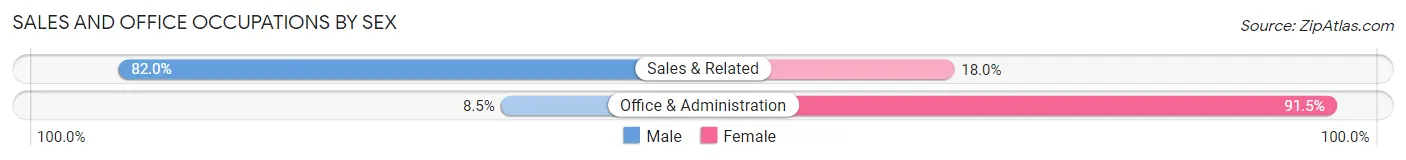
| Occupation | Male | Female |
| Sales & Related | 50 (82.0%) | 11 (18.0%) |
| Office & Administration | 10 (8.5%) | 108 (91.5%) |
| Total (Category) | 60 (33.5%) | 119 (66.5%) |
| Total (Overall) | 468 (51.4%) | 443 (48.6%) |
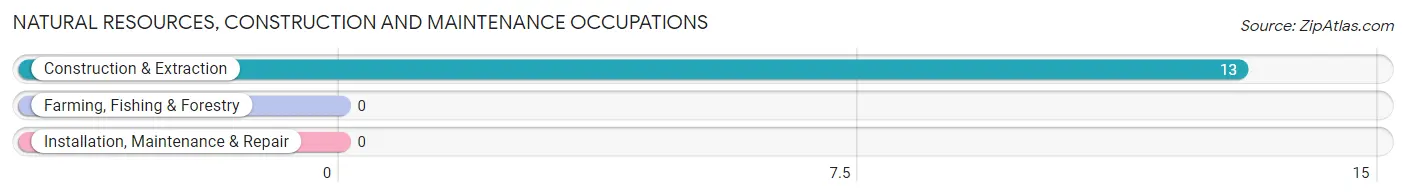
Natural Resources, Construction and Maintenance Occupations
The most common Natural Resources, Construction and Maintenance occupations in North Browning are , and Construction & Extraction (13 | 1.4%).
Natural Resources, Construction and Maintenance Occupations by Sex
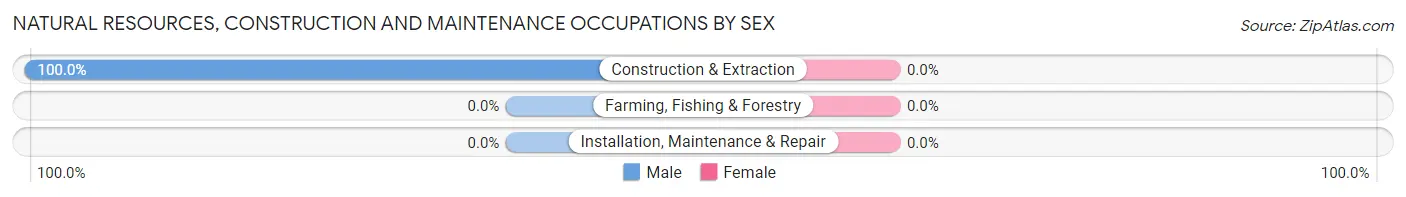
| Occupation | Male | Female |
| Farming, Fishing & Forestry | 0 (0.0%) | 0 (0.0%) |
| Construction & Extraction | 13 (100.0%) | 0 (0.0%) |
| Installation, Maintenance & Repair | 0 (0.0%) | 0 (0.0%) |
| Total (Category) | 13 (100.0%) | 0 (0.0%) |
| Total (Overall) | 468 (51.4%) | 443 (48.6%) |
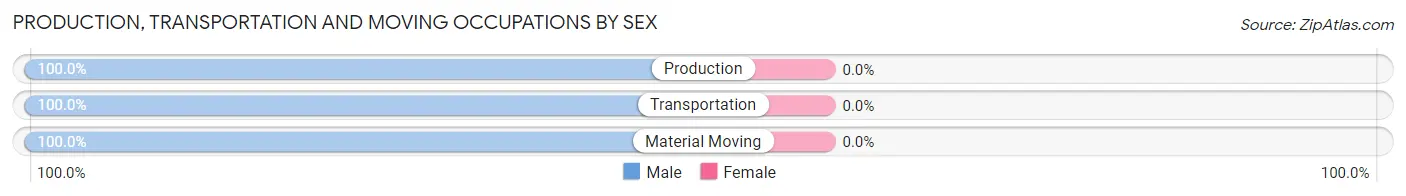
Production, Transportation and Moving Occupations
The most common Production, Transportation and Moving occupations in North Browning are Transportation (27 | 3.0%), Material Moving (24 | 2.6%), and Production (12 | 1.3%).
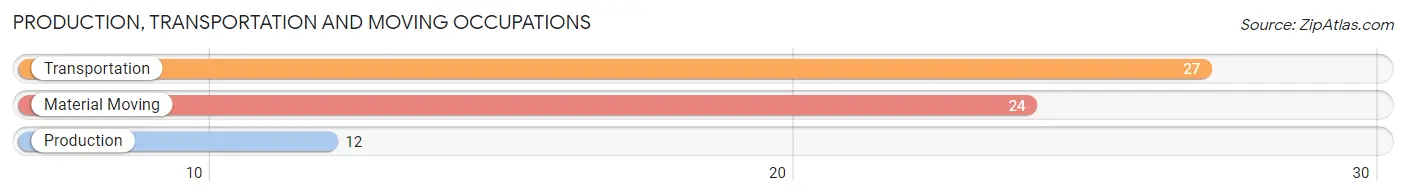
Production, Transportation and Moving Occupations by Sex
| Occupation | Male | Female |
| Production | 12 (100.0%) | 0 (0.0%) |
| Transportation | 27 (100.0%) | 0 (0.0%) |
| Material Moving | 24 (100.0%) | 0 (0.0%) |
| Total (Category) | 63 (100.0%) | 0 (0.0%) |
| Total (Overall) | 468 (51.4%) | 443 (48.6%) |
Employment Industries by Sex in North Browning
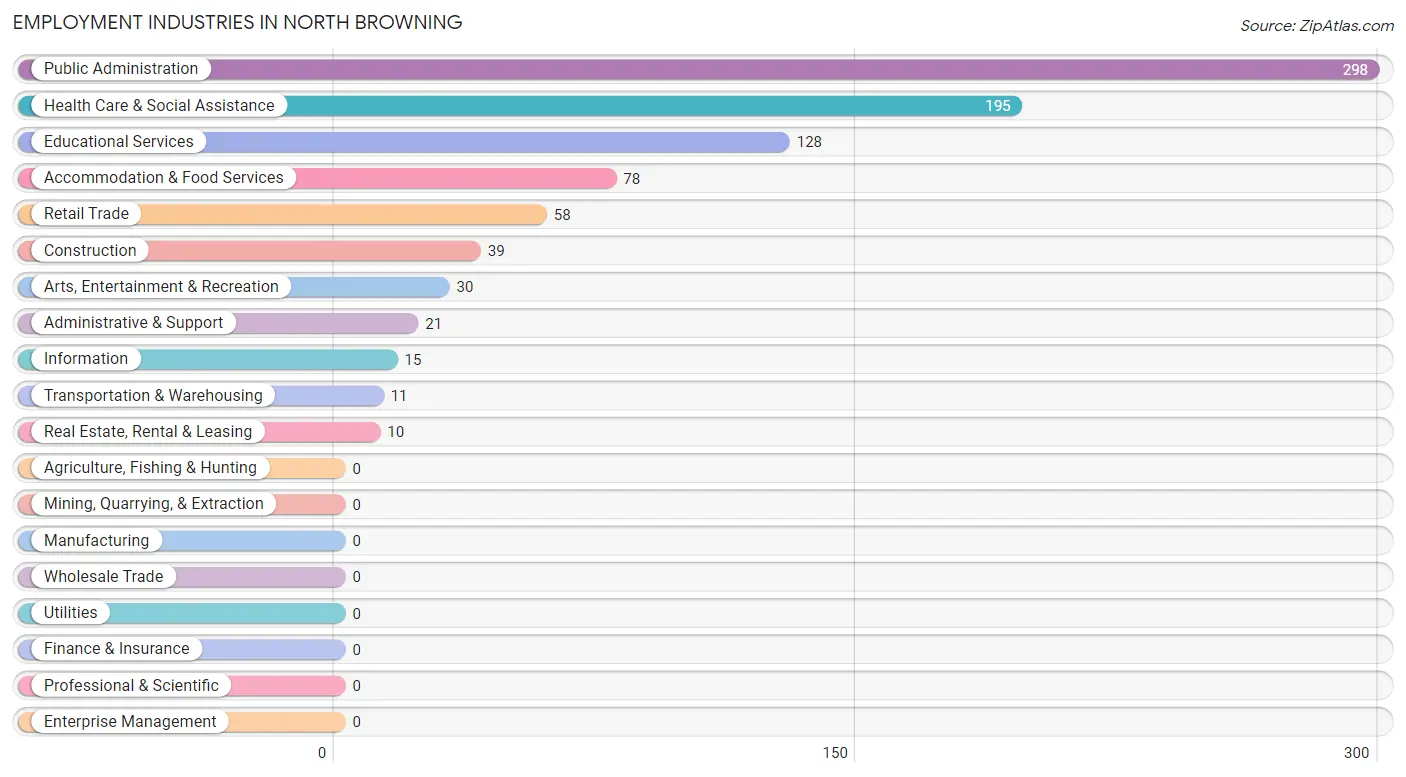
Employment Industries in North Browning
The major employment industries in North Browning include Public Administration (298 | 32.7%), Health Care & Social Assistance (195 | 21.4%), Educational Services (128 | 14.1%), Accommodation & Food Services (78 | 8.6%), and Retail Trade (58 | 6.4%).
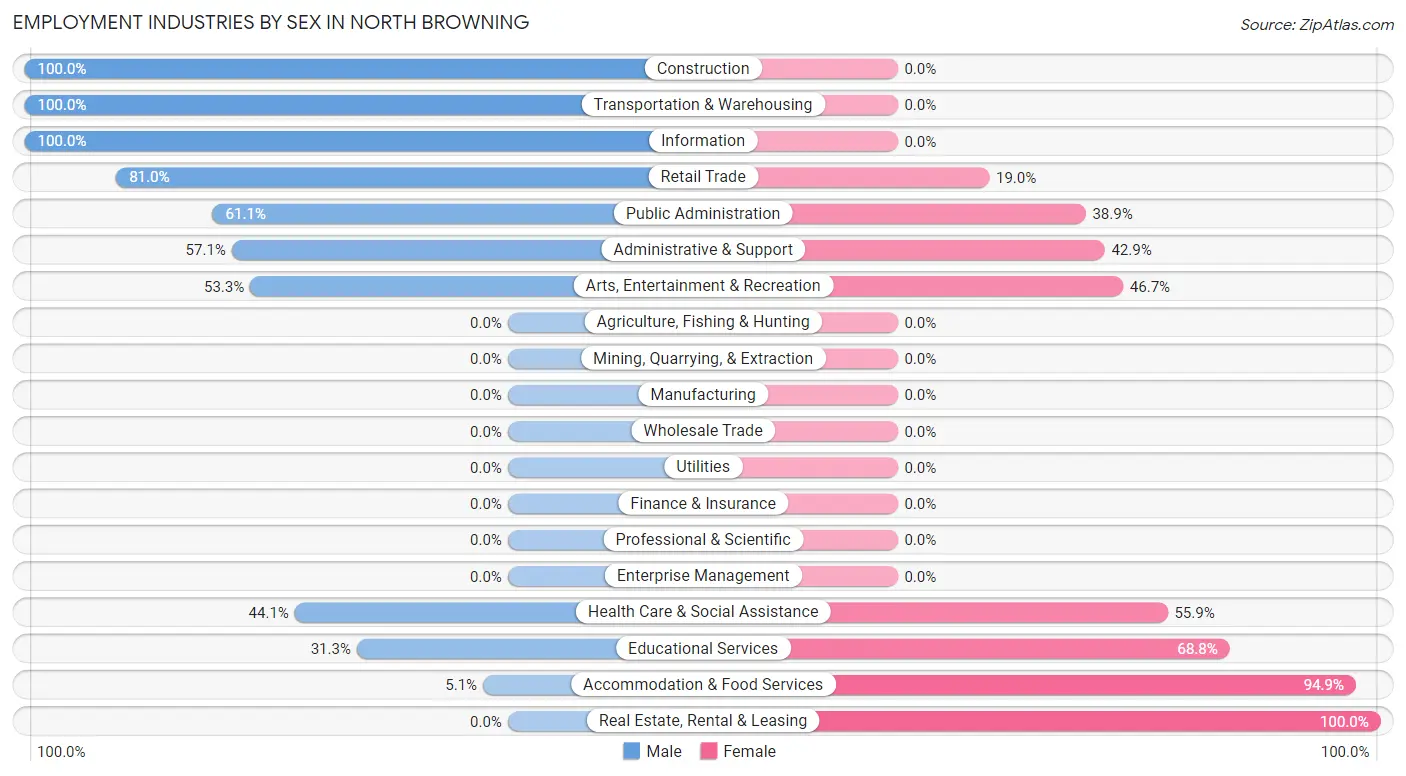
Employment Industries by Sex in North Browning
The North Browning industries that see more men than women are Construction (100.0%), Transportation & Warehousing (100.0%), and Information (100.0%), whereas the industries that tend to have a higher number of women are Real Estate, Rental & Leasing (100.0%), Accommodation & Food Services (94.9%), and Educational Services (68.8%).
| Industry | Male | Female |
| Agriculture, Fishing & Hunting | 0 (0.0%) | 0 (0.0%) |
| Mining, Quarrying, & Extraction | 0 (0.0%) | 0 (0.0%) |
| Construction | 39 (100.0%) | 0 (0.0%) |
| Manufacturing | 0 (0.0%) | 0 (0.0%) |
| Wholesale Trade | 0 (0.0%) | 0 (0.0%) |
| Retail Trade | 47 (81.0%) | 11 (19.0%) |
| Transportation & Warehousing | 11 (100.0%) | 0 (0.0%) |
| Utilities | 0 (0.0%) | 0 (0.0%) |
| Information | 15 (100.0%) | 0 (0.0%) |
| Finance & Insurance | 0 (0.0%) | 0 (0.0%) |
| Real Estate, Rental & Leasing | 0 (0.0%) | 10 (100.0%) |
| Professional & Scientific | 0 (0.0%) | 0 (0.0%) |
| Enterprise Management | 0 (0.0%) | 0 (0.0%) |
| Administrative & Support | 12 (57.1%) | 9 (42.9%) |
| Educational Services | 40 (31.2%) | 88 (68.8%) |
| Health Care & Social Assistance | 86 (44.1%) | 109 (55.9%) |
| Arts, Entertainment & Recreation | 16 (53.3%) | 14 (46.7%) |
| Accommodation & Food Services | 4 (5.1%) | 74 (94.9%) |
| Public Administration | 182 (61.1%) | 116 (38.9%) |
| Total | 468 (51.4%) | 443 (48.6%) |
Education in North Browning
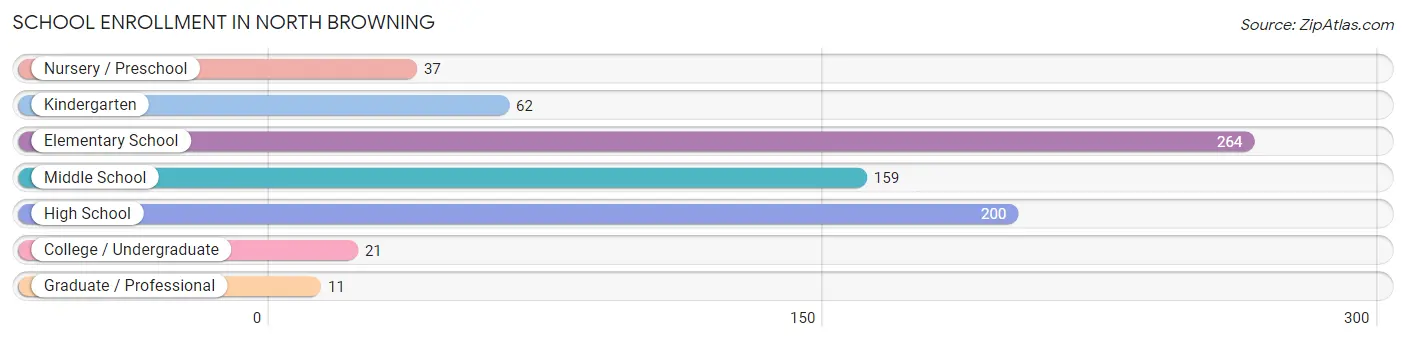
School Enrollment in North Browning
The most common levels of schooling among the 754 students in North Browning are elementary school (264 | 35.0%), high school (200 | 26.5%), and middle school (159 | 21.1%).
| School Level | # Students | % Students |
| Nursery / Preschool | 37 | 4.9% |
| Kindergarten | 62 | 8.2% |
| Elementary School | 264 | 35.0% |
| Middle School | 159 | 21.1% |
| High School | 200 | 26.5% |
| College / Undergraduate | 21 | 2.8% |
| Graduate / Professional | 11 | 1.5% |
| Total | 754 | 100.0% |
School Enrollment by Age by Funding Source in North Browning
Out of a total of 754 students who are enrolled in schools in North Browning, 12 (1.6%) attend a private institution, while the remaining 742 (98.4%) are enrolled in public schools. The age group of 10 to 14 year olds has the highest likelihood of being enrolled in private schools, with 12 (5.3% in the age bracket) enrolled. Conversely, the age group of 3 to 4 year olds has the lowest likelihood of being enrolled in a private school, with 41 (100.0% in the age bracket) attending a public institution.
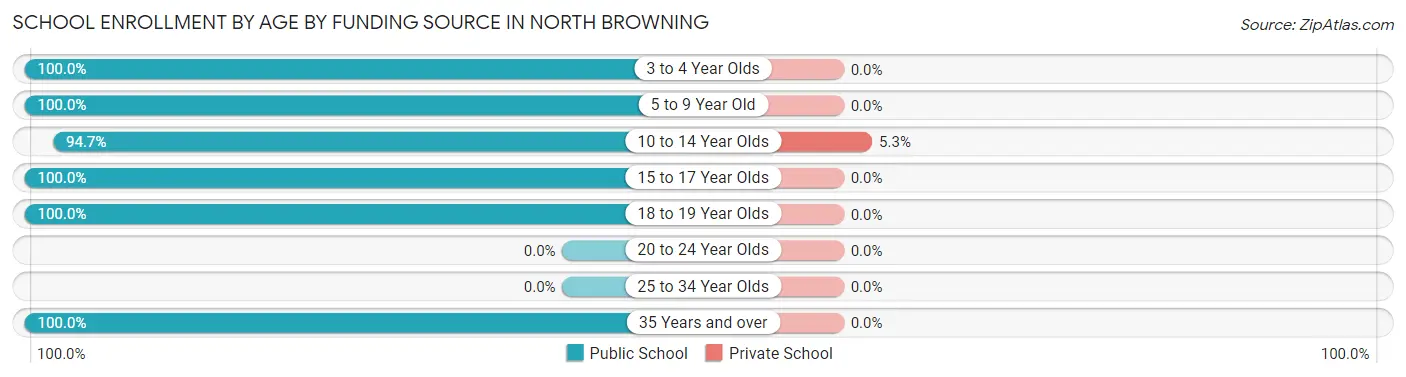
| Age Bracket | Public School | Private School |
| 3 to 4 Year Olds | 41 (100.0%) | 0 (0.0%) |
| 5 to 9 Year Old | 285 (100.0%) | 0 (0.0%) |
| 10 to 14 Year Olds | 214 (94.7%) | 12 (5.3%) |
| 15 to 17 Year Olds | 151 (100.0%) | 0 (0.0%) |
| 18 to 19 Year Olds | 19 (100.0%) | 0 (0.0%) |
| 20 to 24 Year Olds | 0 (0.0%) | 0 (0.0%) |
| 25 to 34 Year Olds | 0 (0.0%) | 0 (0.0%) |
| 35 Years and over | 32 (100.0%) | 0 (0.0%) |
| Total | 742 (98.4%) | 12 (1.6%) |
Educational Attainment by Field of Study in North Browning
Education (102 | 27.8%), science & technology (78 | 21.2%), bio, nature & agricultural (68 | 18.5%), business (24 | 6.5%), and liberal arts & history (23 | 6.3%) are the most common fields of study among 367 individuals in North Browning who have obtained a bachelor's degree or higher.
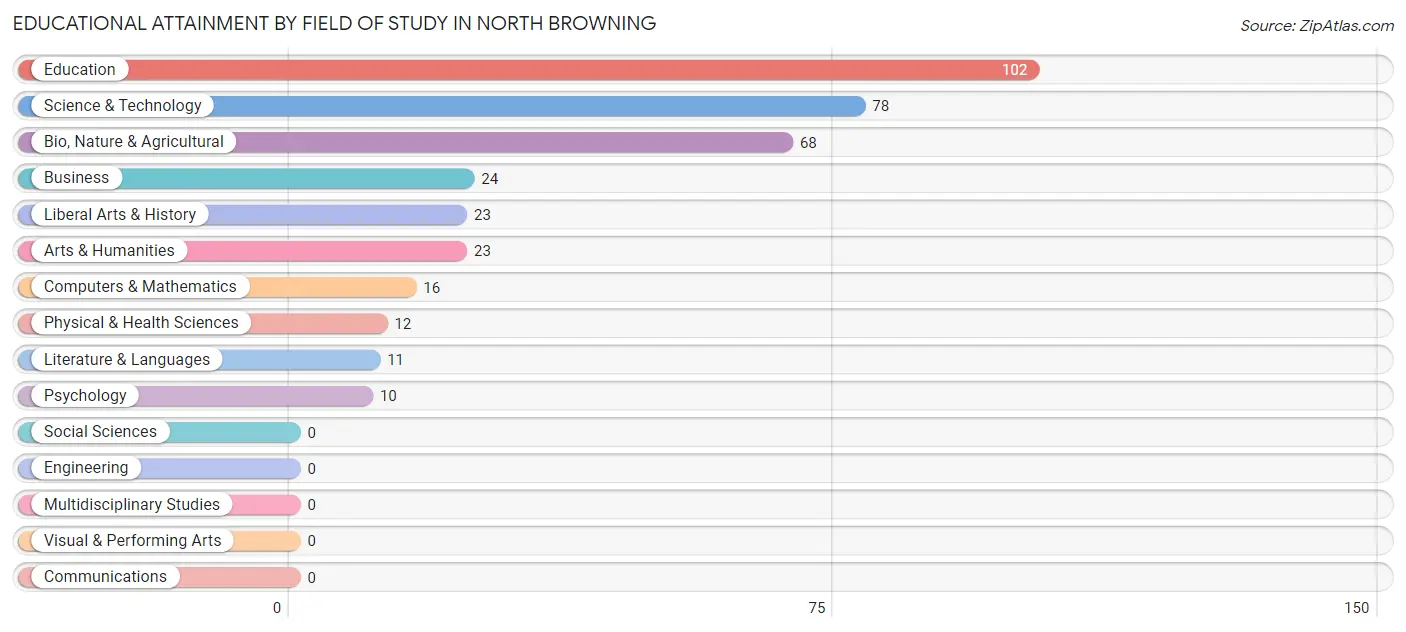
| Field of Study | # Graduates | % Graduates |
| Computers & Mathematics | 16 | 4.4% |
| Bio, Nature & Agricultural | 68 | 18.5% |
| Physical & Health Sciences | 12 | 3.3% |
| Psychology | 10 | 2.7% |
| Social Sciences | 0 | 0.0% |
| Engineering | 0 | 0.0% |
| Multidisciplinary Studies | 0 | 0.0% |
| Science & Technology | 78 | 21.2% |
| Business | 24 | 6.5% |
| Education | 102 | 27.8% |
| Literature & Languages | 11 | 3.0% |
| Liberal Arts & History | 23 | 6.3% |
| Visual & Performing Arts | 0 | 0.0% |
| Communications | 0 | 0.0% |
| Arts & Humanities | 23 | 6.3% |
| Total | 367 | 100.0% |
Transportation & Commute in North Browning
Vehicle Availability by Sex in North Browning
The most prevalent vehicle ownership categories in North Browning are males with 2 vehicles (233, accounting for 51.9%) and females with 2 vehicles (156, making up 55.5%).
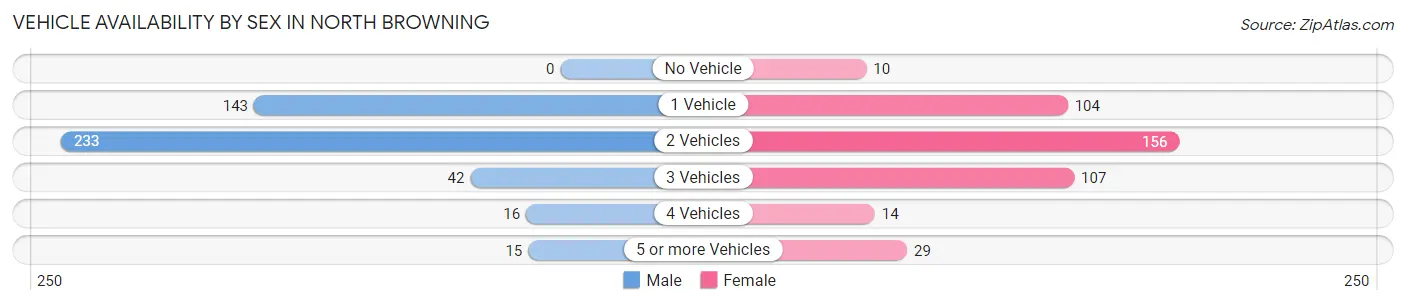
| Vehicles Available | Male | Female |
| No Vehicle | 0 (0.0%) | 10 (2.4%) |
| 1 Vehicle | 143 (31.9%) | 104 (24.8%) |
| 2 Vehicles | 233 (51.9%) | 156 (37.1%) |
| 3 Vehicles | 42 (9.3%) | 107 (25.5%) |
| 4 Vehicles | 16 (3.6%) | 14 (3.3%) |
| 5 or more Vehicles | 15 (3.3%) | 29 (6.9%) |
| Total | 449 (100.0%) | 420 (100.0%) |
Commute Time in North Browning
The most frequently occuring commute durations in North Browning are 15 to 19 minutes (332 commuters, 38.7%), 10 to 14 minutes (228 commuters, 26.6%), and 5 to 9 minutes (140 commuters, 16.3%).
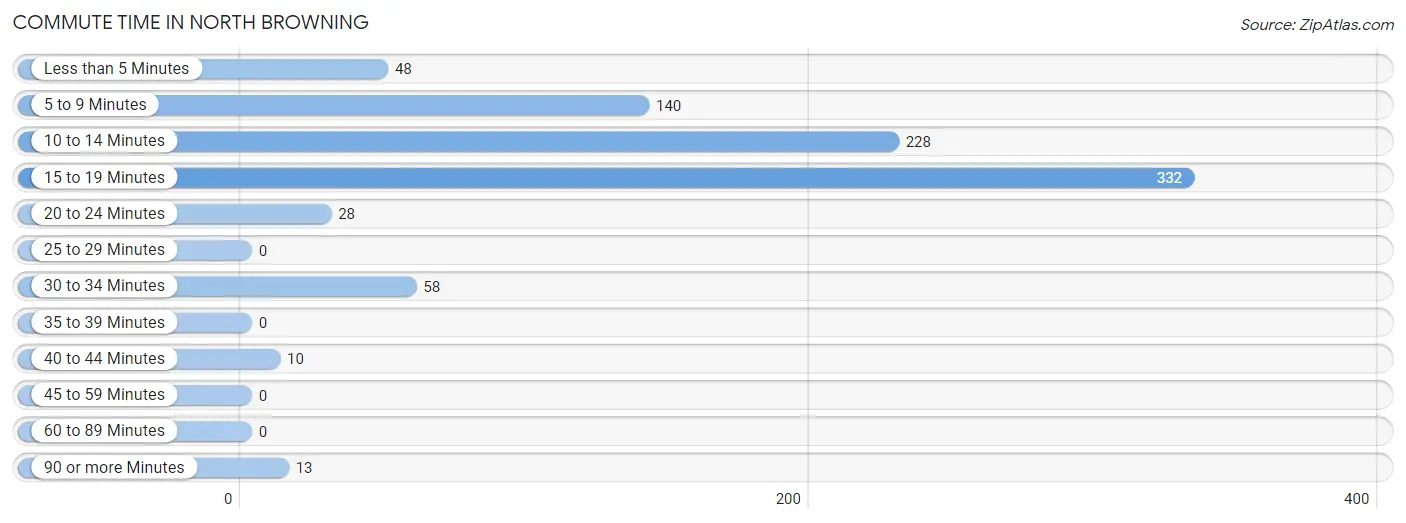
| Commute Time | # Commuters | % Commuters |
| Less than 5 Minutes | 48 | 5.6% |
| 5 to 9 Minutes | 140 | 16.3% |
| 10 to 14 Minutes | 228 | 26.6% |
| 15 to 19 Minutes | 332 | 38.7% |
| 20 to 24 Minutes | 28 | 3.3% |
| 25 to 29 Minutes | 0 | 0.0% |
| 30 to 34 Minutes | 58 | 6.8% |
| 35 to 39 Minutes | 0 | 0.0% |
| 40 to 44 Minutes | 10 | 1.2% |
| 45 to 59 Minutes | 0 | 0.0% |
| 60 to 89 Minutes | 0 | 0.0% |
| 90 or more Minutes | 13 | 1.5% |
Commute Time by Sex in North Browning
The most common commute times in North Browning are 15 to 19 minutes (200 commuters, 44.2%) for males and 15 to 19 minutes (132 commuters, 32.7%) for females.
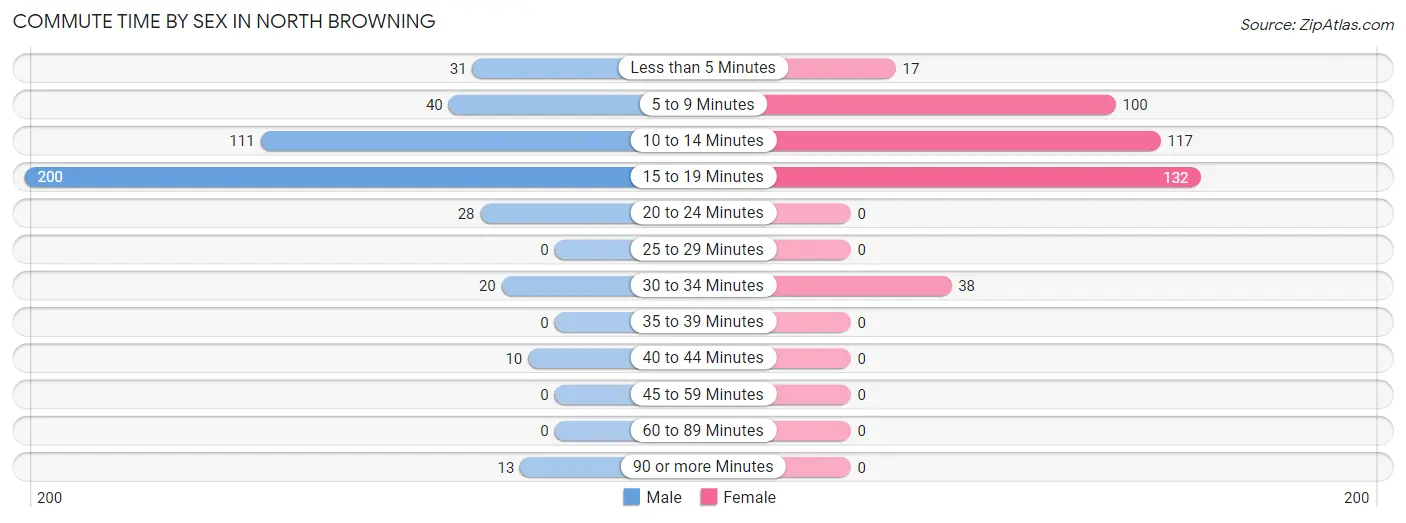
| Commute Time | Male | Female |
| Less than 5 Minutes | 31 (6.8%) | 17 (4.2%) |
| 5 to 9 Minutes | 40 (8.8%) | 100 (24.7%) |
| 10 to 14 Minutes | 111 (24.5%) | 117 (29.0%) |
| 15 to 19 Minutes | 200 (44.2%) | 132 (32.7%) |
| 20 to 24 Minutes | 28 (6.2%) | 0 (0.0%) |
| 25 to 29 Minutes | 0 (0.0%) | 0 (0.0%) |
| 30 to 34 Minutes | 20 (4.4%) | 38 (9.4%) |
| 35 to 39 Minutes | 0 (0.0%) | 0 (0.0%) |
| 40 to 44 Minutes | 10 (2.2%) | 0 (0.0%) |
| 45 to 59 Minutes | 0 (0.0%) | 0 (0.0%) |
| 60 to 89 Minutes | 0 (0.0%) | 0 (0.0%) |
| 90 or more Minutes | 13 (2.9%) | 0 (0.0%) |
Time of Departure to Work by Sex in North Browning
The most frequent times of departure to work in North Browning are 8:00 AM to 8:29 AM (121, 26.7%) for males and 7:00 AM to 7:29 AM (116, 28.7%) for females.
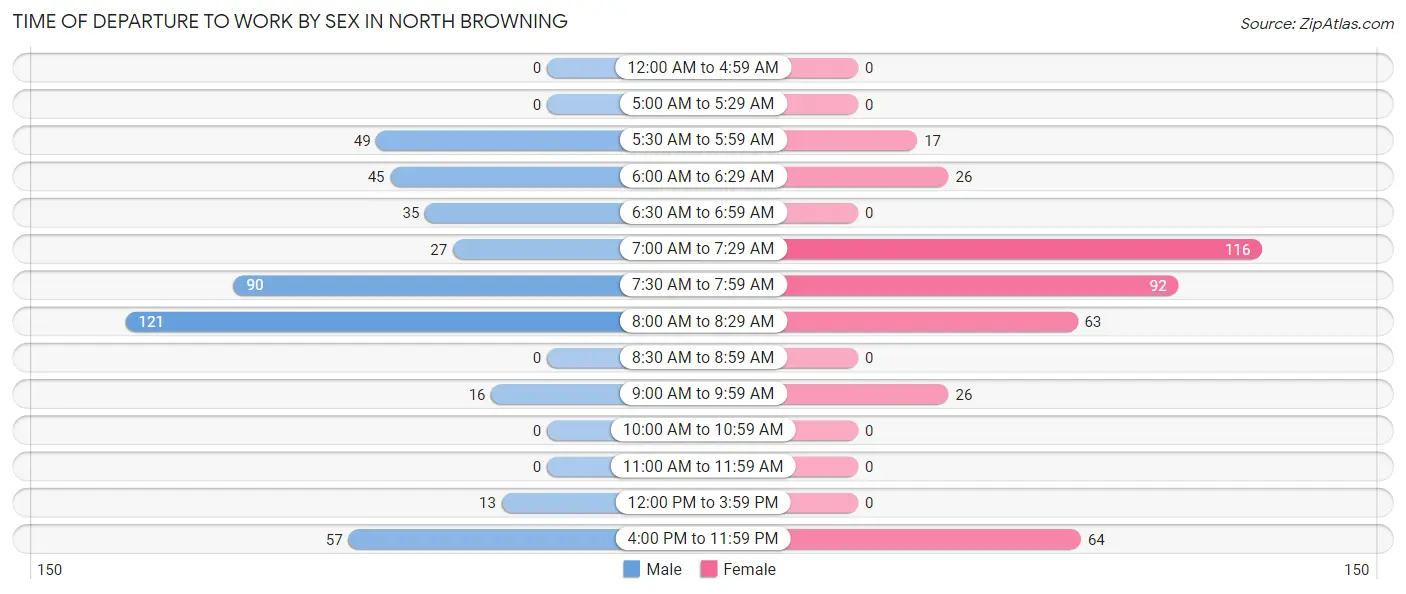
| Time of Departure | Male | Female |
| 12:00 AM to 4:59 AM | 0 (0.0%) | 0 (0.0%) |
| 5:00 AM to 5:29 AM | 0 (0.0%) | 0 (0.0%) |
| 5:30 AM to 5:59 AM | 49 (10.8%) | 17 (4.2%) |
| 6:00 AM to 6:29 AM | 45 (9.9%) | 26 (6.4%) |
| 6:30 AM to 6:59 AM | 35 (7.7%) | 0 (0.0%) |
| 7:00 AM to 7:29 AM | 27 (6.0%) | 116 (28.7%) |
| 7:30 AM to 7:59 AM | 90 (19.9%) | 92 (22.8%) |
| 8:00 AM to 8:29 AM | 121 (26.7%) | 63 (15.6%) |
| 8:30 AM to 8:59 AM | 0 (0.0%) | 0 (0.0%) |
| 9:00 AM to 9:59 AM | 16 (3.5%) | 26 (6.4%) |
| 10:00 AM to 10:59 AM | 0 (0.0%) | 0 (0.0%) |
| 11:00 AM to 11:59 AM | 0 (0.0%) | 0 (0.0%) |
| 12:00 PM to 3:59 PM | 13 (2.9%) | 0 (0.0%) |
| 4:00 PM to 11:59 PM | 57 (12.6%) | 64 (15.8%) |
| Total | 453 (100.0%) | 404 (100.0%) |
Housing Occupancy in North Browning
Occupancy by Ownership in North Browning
Of the total 772 dwellings in North Browning, owner-occupied units account for 377 (48.8%), while renter-occupied units make up 395 (51.2%).
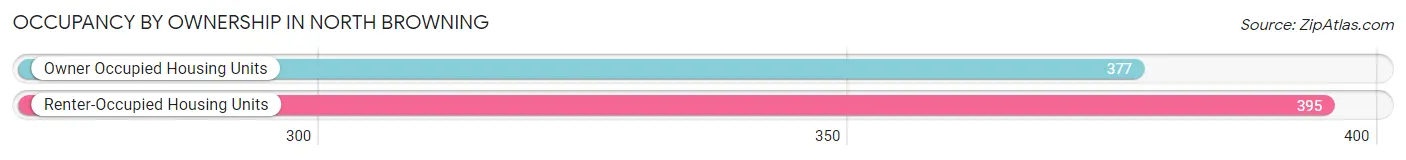
| Occupancy | # Housing Units | % Housing Units |
| Owner Occupied Housing Units | 377 | 48.8% |
| Renter-Occupied Housing Units | 395 | 51.2% |
| Total Occupied Housing Units | 772 | 100.0% |
Occupancy by Household Size in North Browning
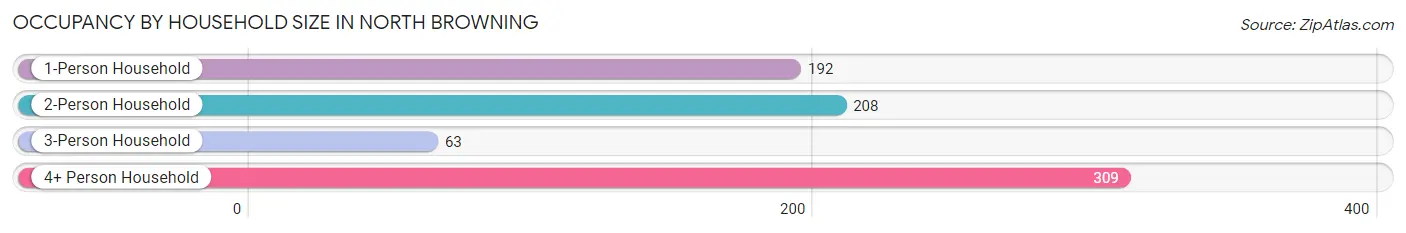
| Household Size | # Housing Units | % Housing Units |
| 1-Person Household | 192 | 24.9% |
| 2-Person Household | 208 | 26.9% |
| 3-Person Household | 63 | 8.2% |
| 4+ Person Household | 309 | 40.0% |
| Total Housing Units | 772 | 100.0% |
Occupancy by Ownership by Household Size in North Browning
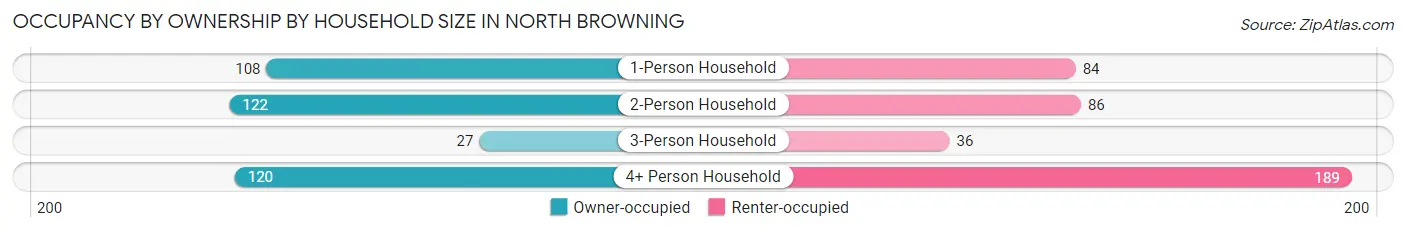
| Household Size | Owner-occupied | Renter-occupied |
| 1-Person Household | 108 (56.2%) | 84 (43.8%) |
| 2-Person Household | 122 (58.7%) | 86 (41.3%) |
| 3-Person Household | 27 (42.9%) | 36 (57.1%) |
| 4+ Person Household | 120 (38.8%) | 189 (61.2%) |
| Total Housing Units | 377 (48.8%) | 395 (51.2%) |
Occupancy by Educational Attainment in North Browning
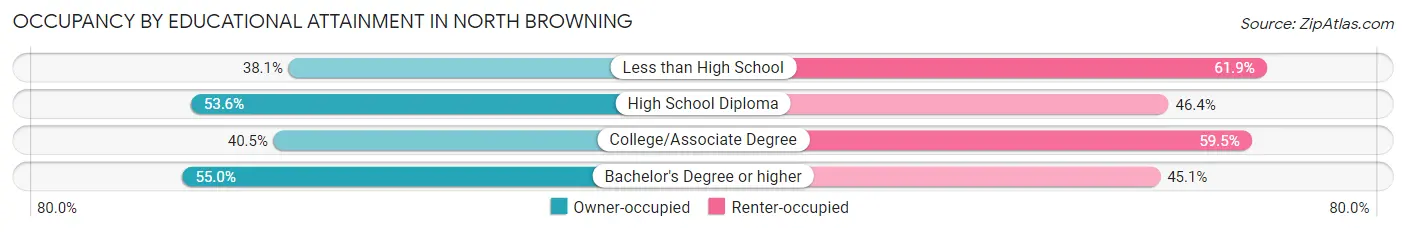
| Household Size | Owner-occupied | Renter-occupied |
| Less than High School | 16 (38.1%) | 26 (61.9%) |
| High School Diploma | 148 (53.6%) | 128 (46.4%) |
| College/Associate Degree | 102 (40.5%) | 150 (59.5%) |
| Bachelor's Degree or higher | 111 (54.9%) | 91 (45.1%) |
Occupancy by Age of Householder in North Browning
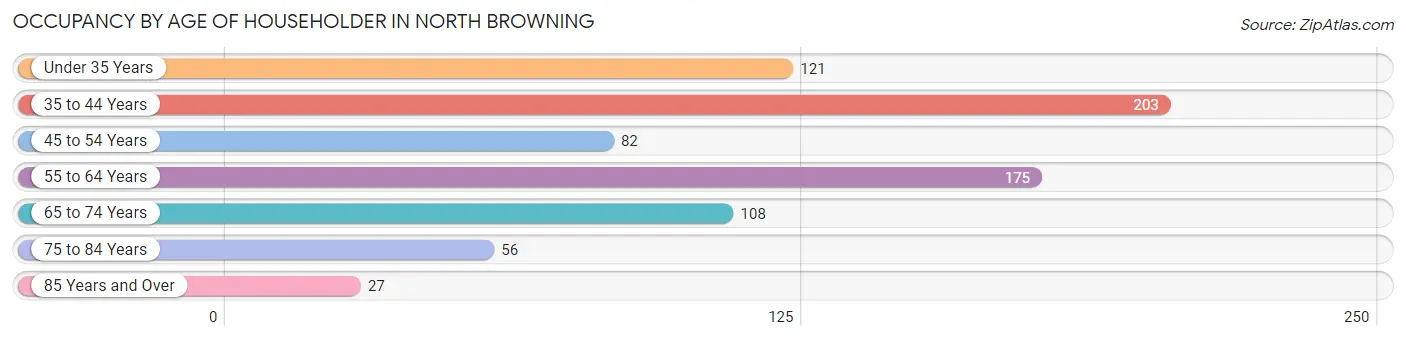
| Age Bracket | # Households | % Households |
| Under 35 Years | 121 | 15.7% |
| 35 to 44 Years | 203 | 26.3% |
| 45 to 54 Years | 82 | 10.6% |
| 55 to 64 Years | 175 | 22.7% |
| 65 to 74 Years | 108 | 14.0% |
| 75 to 84 Years | 56 | 7.2% |
| 85 Years and Over | 27 | 3.5% |
| Total | 772 | 100.0% |
Housing Finances in North Browning
Median Income by Occupancy in North Browning
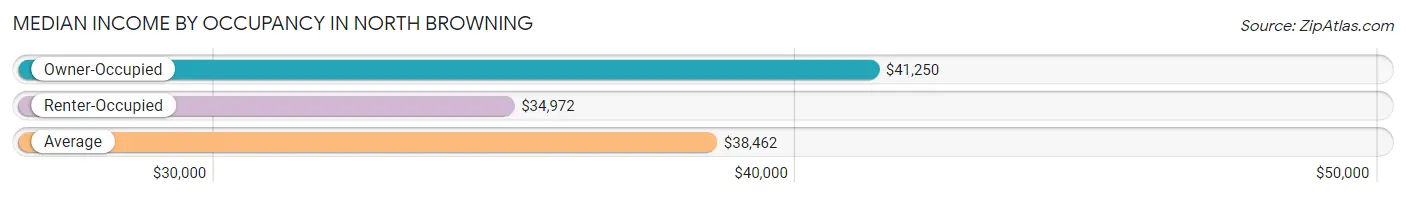
| Occupancy Type | # Households | Median Income |
| Owner-Occupied | 377 (48.8%) | $41,250 |
| Renter-Occupied | 395 (51.2%) | $34,972 |
| Average | 772 (100.0%) | $38,462 |
Occupancy by Householder Income Bracket in North Browning
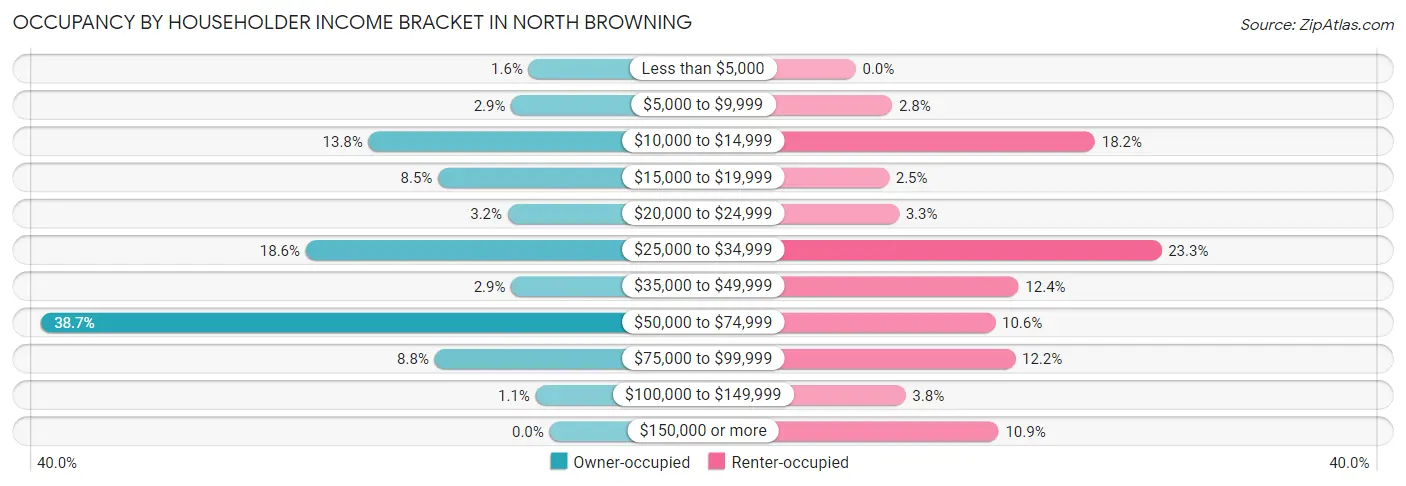
| Income Bracket | Owner-occupied | Renter-occupied |
| Less than $5,000 | 6 (1.6%) | 0 (0.0%) |
| $5,000 to $9,999 | 11 (2.9%) | 11 (2.8%) |
| $10,000 to $14,999 | 52 (13.8%) | 72 (18.2%) |
| $15,000 to $19,999 | 32 (8.5%) | 10 (2.5%) |
| $20,000 to $24,999 | 12 (3.2%) | 13 (3.3%) |
| $25,000 to $34,999 | 70 (18.6%) | 92 (23.3%) |
| $35,000 to $49,999 | 11 (2.9%) | 49 (12.4%) |
| $50,000 to $74,999 | 146 (38.7%) | 42 (10.6%) |
| $75,000 to $99,999 | 33 (8.7%) | 48 (12.1%) |
| $100,000 to $149,999 | 4 (1.1%) | 15 (3.8%) |
| $150,000 or more | 0 (0.0%) | 43 (10.9%) |
| Total | 377 (100.0%) | 395 (100.0%) |
Monthly Housing Cost Tiers in North Browning
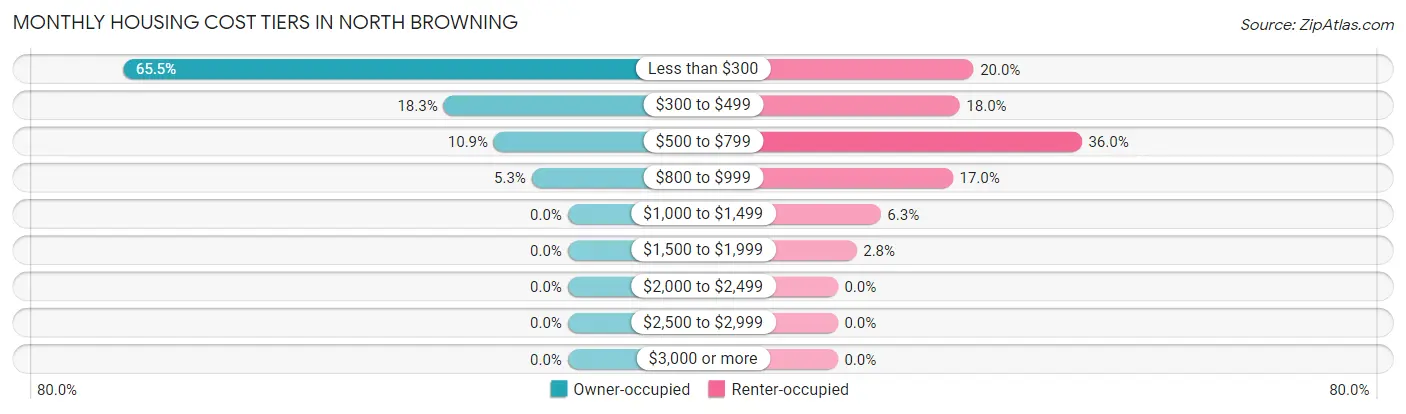
| Monthly Cost | Owner-occupied | Renter-occupied |
| Less than $300 | 247 (65.5%) | 79 (20.0%) |
| $300 to $499 | 69 (18.3%) | 71 (18.0%) |
| $500 to $799 | 41 (10.9%) | 142 (35.9%) |
| $800 to $999 | 20 (5.3%) | 67 (17.0%) |
| $1,000 to $1,499 | 0 (0.0%) | 25 (6.3%) |
| $1,500 to $1,999 | 0 (0.0%) | 11 (2.8%) |
| $2,000 to $2,499 | 0 (0.0%) | 0 (0.0%) |
| $2,500 to $2,999 | 0 (0.0%) | 0 (0.0%) |
| $3,000 or more | 0 (0.0%) | 0 (0.0%) |
| Total | 377 (100.0%) | 395 (100.0%) |
Physical Housing Characteristics in North Browning
Housing Structures in North Browning
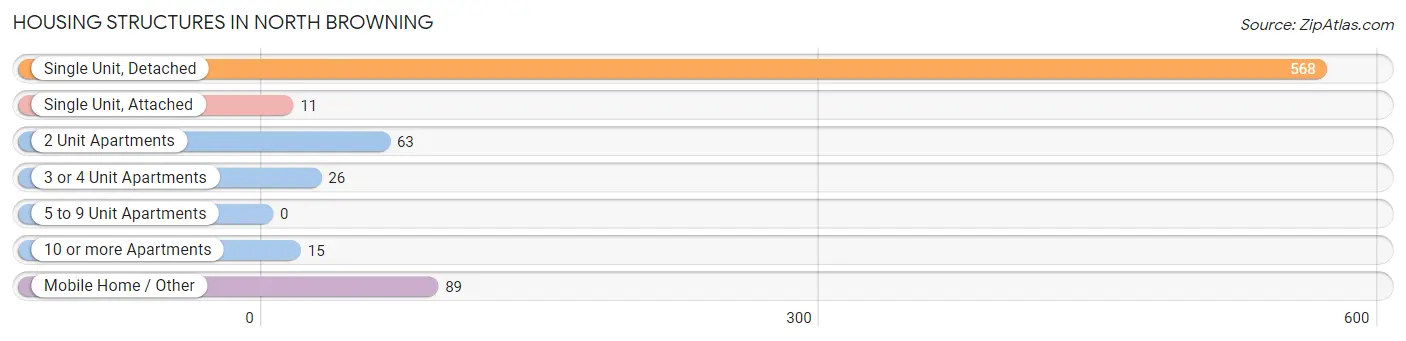
| Structure Type | # Housing Units | % Housing Units |
| Single Unit, Detached | 568 | 73.6% |
| Single Unit, Attached | 11 | 1.4% |
| 2 Unit Apartments | 63 | 8.2% |
| 3 or 4 Unit Apartments | 26 | 3.4% |
| 5 to 9 Unit Apartments | 0 | 0.0% |
| 10 or more Apartments | 15 | 1.9% |
| Mobile Home / Other | 89 | 11.5% |
| Total | 772 | 100.0% |
Housing Structures by Occupancy in North Browning
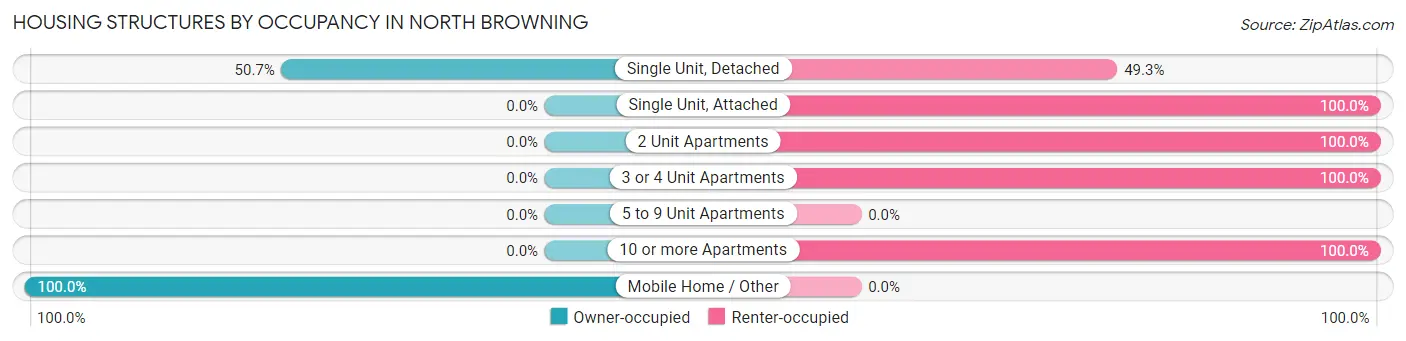
| Structure Type | Owner-occupied | Renter-occupied |
| Single Unit, Detached | 288 (50.7%) | 280 (49.3%) |
| Single Unit, Attached | 0 (0.0%) | 11 (100.0%) |
| 2 Unit Apartments | 0 (0.0%) | 63 (100.0%) |
| 3 or 4 Unit Apartments | 0 (0.0%) | 26 (100.0%) |
| 5 to 9 Unit Apartments | 0 (0.0%) | 0 (0.0%) |
| 10 or more Apartments | 0 (0.0%) | 15 (100.0%) |
| Mobile Home / Other | 89 (100.0%) | 0 (0.0%) |
| Total | 377 (48.8%) | 395 (51.2%) |
Housing Structures by Number of Rooms in North Browning
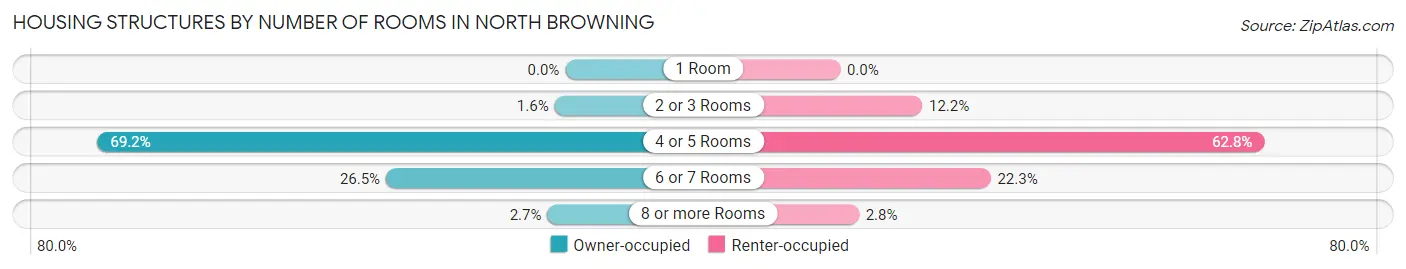
| Number of Rooms | Owner-occupied | Renter-occupied |
| 1 Room | 0 (0.0%) | 0 (0.0%) |
| 2 or 3 Rooms | 6 (1.6%) | 48 (12.1%) |
| 4 or 5 Rooms | 261 (69.2%) | 248 (62.8%) |
| 6 or 7 Rooms | 100 (26.5%) | 88 (22.3%) |
| 8 or more Rooms | 10 (2.6%) | 11 (2.8%) |
| Total | 377 (100.0%) | 395 (100.0%) |
Housing Structure by Heating Type in North Browning
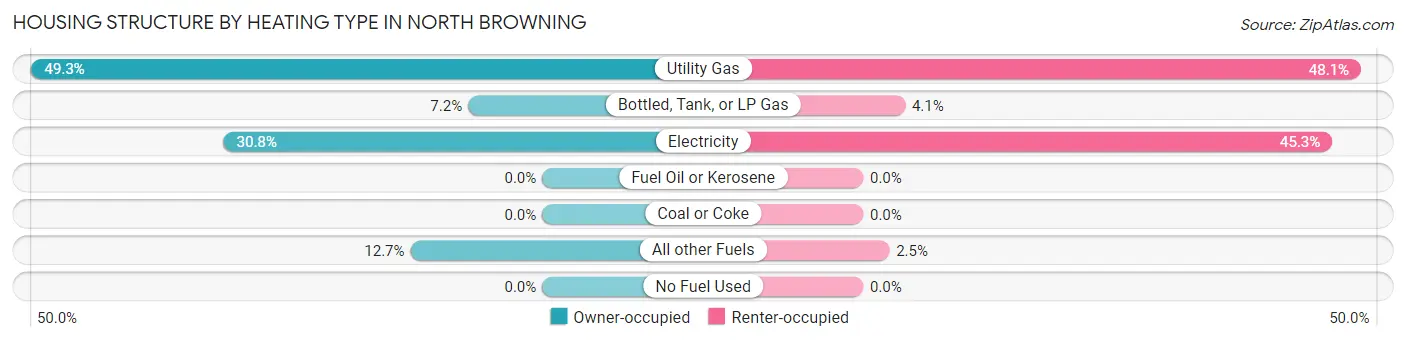
| Heating Type | Owner-occupied | Renter-occupied |
| Utility Gas | 186 (49.3%) | 190 (48.1%) |
| Bottled, Tank, or LP Gas | 27 (7.2%) | 16 (4.1%) |
| Electricity | 116 (30.8%) | 179 (45.3%) |
| Fuel Oil or Kerosene | 0 (0.0%) | 0 (0.0%) |
| Coal or Coke | 0 (0.0%) | 0 (0.0%) |
| All other Fuels | 48 (12.7%) | 10 (2.5%) |
| No Fuel Used | 0 (0.0%) | 0 (0.0%) |
| Total | 377 (100.0%) | 395 (100.0%) |
Household Vehicle Usage in North Browning
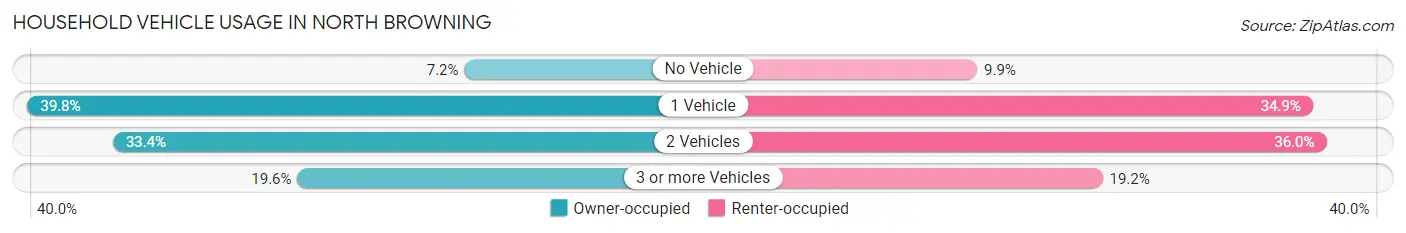
| Vehicles per Household | Owner-occupied | Renter-occupied |
| No Vehicle | 27 (7.2%) | 39 (9.9%) |
| 1 Vehicle | 150 (39.8%) | 138 (34.9%) |
| 2 Vehicles | 126 (33.4%) | 142 (35.9%) |
| 3 or more Vehicles | 74 (19.6%) | 76 (19.2%) |
| Total | 377 (100.0%) | 395 (100.0%) |
Real Estate & Mortgages in North Browning
Real Estate and Mortgage Overview in North Browning
| Characteristic | Without Mortgage | With Mortgage |
| Housing Units | 316 | 61 |
| Median Property Value | $173,500 | $104,800 |
| Median Household Income | - | - |
| Monthly Housing Costs | $225 | $0 |
| Real Estate Taxes | $199 | $61 |
Property Value by Mortgage Status in North Browning
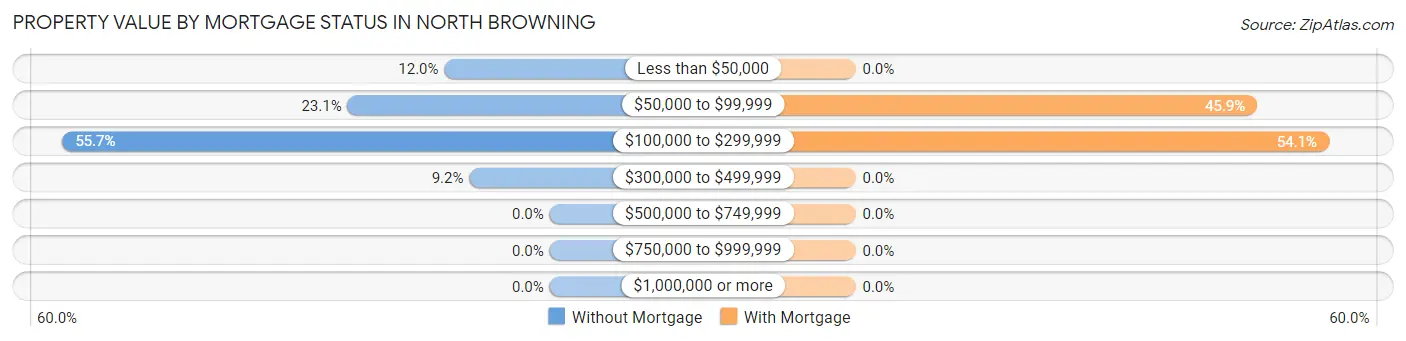
| Property Value | Without Mortgage | With Mortgage |
| Less than $50,000 | 38 (12.0%) | 0 (0.0%) |
| $50,000 to $99,999 | 73 (23.1%) | 28 (45.9%) |
| $100,000 to $299,999 | 176 (55.7%) | 33 (54.1%) |
| $300,000 to $499,999 | 29 (9.2%) | 0 (0.0%) |
| $500,000 to $749,999 | 0 (0.0%) | 0 (0.0%) |
| $750,000 to $999,999 | 0 (0.0%) | 0 (0.0%) |
| $1,000,000 or more | 0 (0.0%) | 0 (0.0%) |
| Total | 316 (100.0%) | 61 (100.0%) |
Household Income by Mortgage Status in North Browning
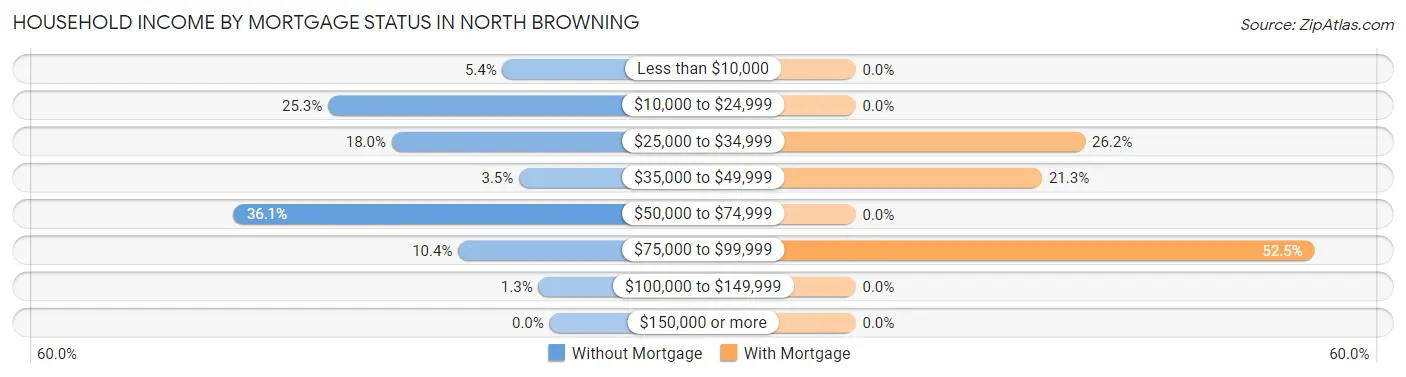
| Household Income | Without Mortgage | With Mortgage |
| Less than $10,000 | 17 (5.4%) | 0 (0.0%) |
| $10,000 to $24,999 | 80 (25.3%) | 0 (0.0%) |
| $25,000 to $34,999 | 57 (18.0%) | 16 (26.2%) |
| $35,000 to $49,999 | 11 (3.5%) | 13 (21.3%) |
| $50,000 to $74,999 | 114 (36.1%) | 0 (0.0%) |
| $75,000 to $99,999 | 33 (10.4%) | 32 (52.5%) |
| $100,000 to $149,999 | 4 (1.3%) | 0 (0.0%) |
| $150,000 or more | 0 (0.0%) | 0 (0.0%) |
| Total | 316 (100.0%) | 61 (100.0%) |
Property Value to Household Income Ratio in North Browning
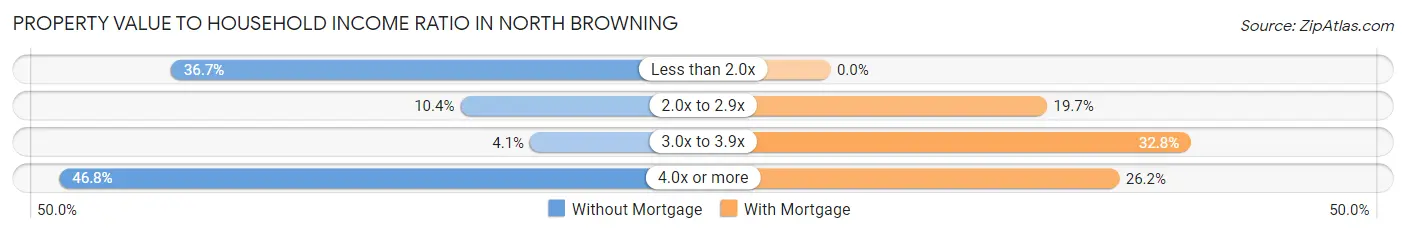
| Value-to-Income Ratio | Without Mortgage | With Mortgage |
| Less than 2.0x | 116 (36.7%) | 0 (0.0%) |
| 2.0x to 2.9x | 33 (10.4%) | 12 (19.7%) |
| 3.0x to 3.9x | 13 (4.1%) | 20 (32.8%) |
| 4.0x or more | 148 (46.8%) | 16 (26.2%) |
| Total | 316 (100.0%) | 61 (100.0%) |
Real Estate Taxes by Mortgage Status in North Browning
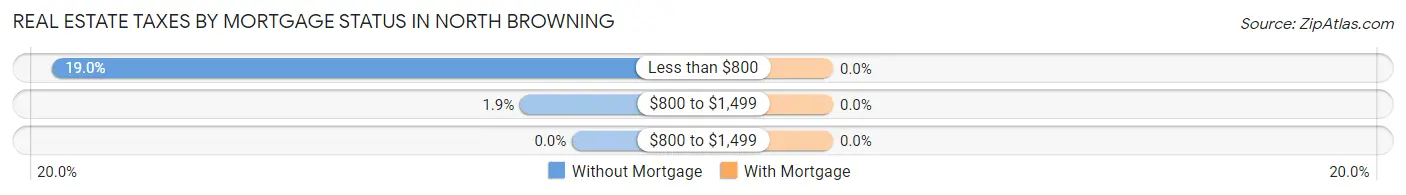
| Property Taxes | Without Mortgage | With Mortgage |
| Less than $800 | 60 (19.0%) | 0 (0.0%) |
| $800 to $1,499 | 6 (1.9%) | 0 (0.0%) |
| $800 to $1,499 | 0 (0.0%) | 0 (0.0%) |
| Total | 316 (100.0%) | 61 (100.0%) |
Health & Disability in North Browning
Health Insurance Coverage by Age in North Browning
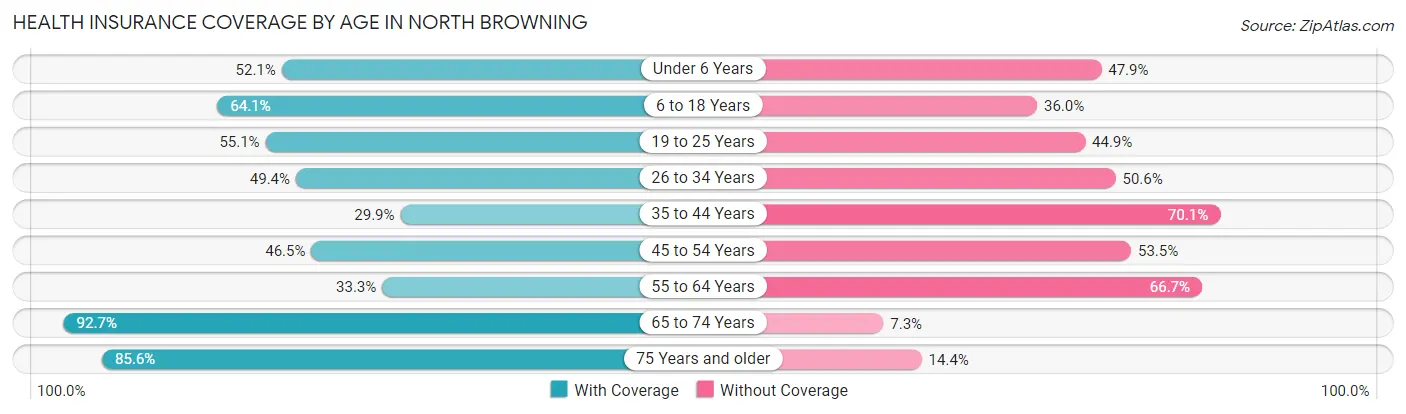
| Age Bracket | With Coverage | Without Coverage |
| Under 6 Years | 151 (52.1%) | 139 (47.9%) |
| 6 to 18 Years | 497 (64.0%) | 279 (35.9%) |
| 19 to 25 Years | 184 (55.1%) | 150 (44.9%) |
| 26 to 34 Years | 169 (49.4%) | 173 (50.6%) |
| 35 to 44 Years | 135 (29.9%) | 316 (70.1%) |
| 45 to 54 Years | 134 (46.5%) | 154 (53.5%) |
| 55 to 64 Years | 79 (33.3%) | 158 (66.7%) |
| 65 to 74 Years | 140 (92.7%) | 11 (7.3%) |
| 75 Years and older | 83 (85.6%) | 14 (14.4%) |
| Total | 1,572 (53.0%) | 1,394 (47.0%) |
Health Insurance Coverage by Citizenship Status in North Browning
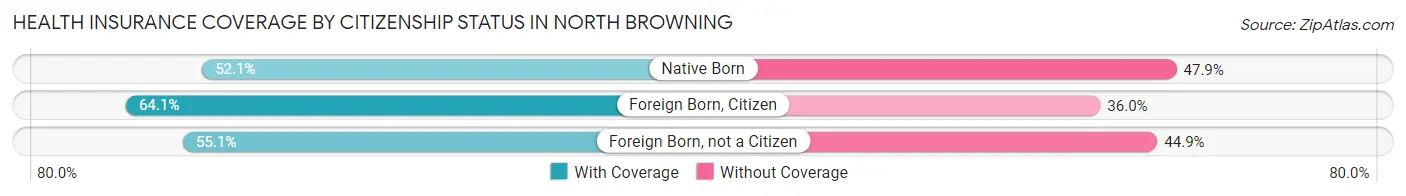
| Citizenship Status | With Coverage | Without Coverage |
| Native Born | 151 (52.1%) | 139 (47.9%) |
| Foreign Born, Citizen | 497 (64.0%) | 279 (35.9%) |
| Foreign Born, not a Citizen | 184 (55.1%) | 150 (44.9%) |
Health Insurance Coverage by Household Income in North Browning
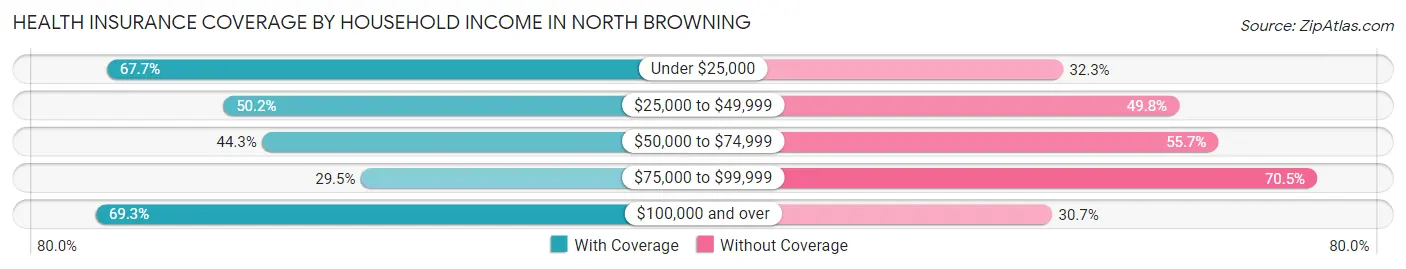
| Household Income | With Coverage | Without Coverage |
| Under $25,000 | 488 (67.7%) | 233 (32.3%) |
| $25,000 to $49,999 | 443 (50.2%) | 439 (49.8%) |
| $50,000 to $74,999 | 368 (44.3%) | 462 (55.7%) |
| $75,000 to $99,999 | 83 (29.5%) | 198 (70.5%) |
| $100,000 and over | 131 (69.3%) | 58 (30.7%) |
Public vs Private Health Insurance Coverage by Age in North Browning
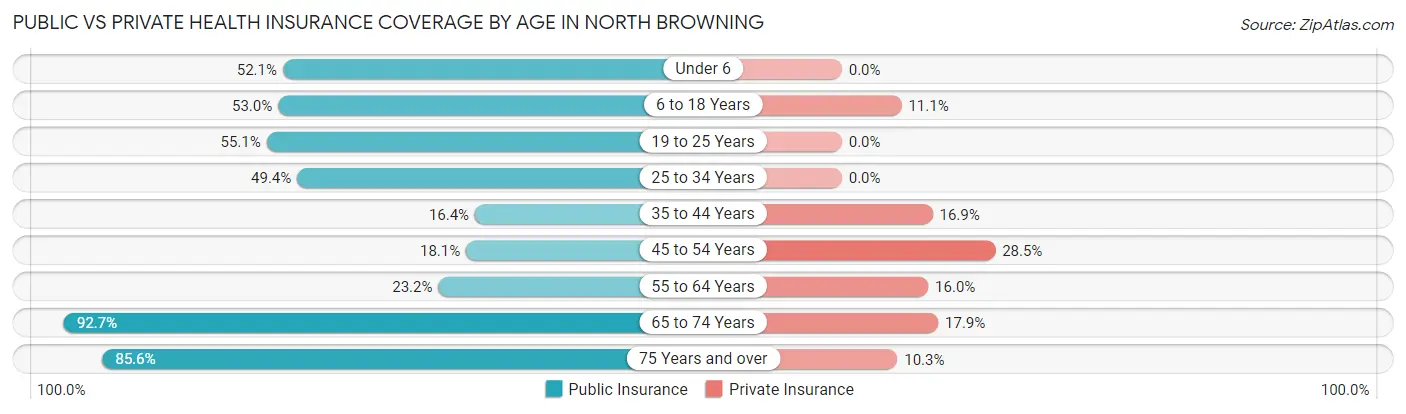
| Age Bracket | Public Insurance | Private Insurance |
| Under 6 | 151 (52.1%) | 0 (0.0%) |
| 6 to 18 Years | 411 (53.0%) | 86 (11.1%) |
| 19 to 25 Years | 184 (55.1%) | 0 (0.0%) |
| 25 to 34 Years | 169 (49.4%) | 0 (0.0%) |
| 35 to 44 Years | 74 (16.4%) | 76 (16.9%) |
| 45 to 54 Years | 52 (18.1%) | 82 (28.5%) |
| 55 to 64 Years | 55 (23.2%) | 38 (16.0%) |
| 65 to 74 Years | 140 (92.7%) | 27 (17.9%) |
| 75 Years and over | 83 (85.6%) | 10 (10.3%) |
| Total | 1,319 (44.5%) | 319 (10.8%) |
Disability Status by Sex by Age in North Browning
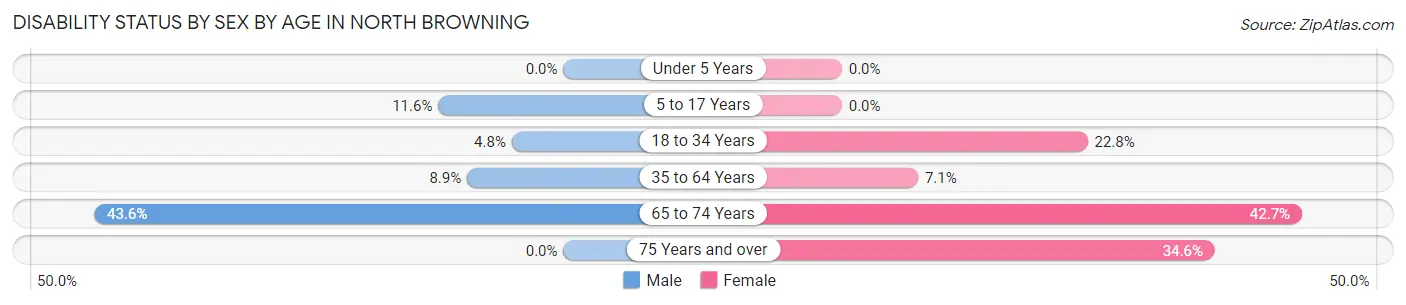
| Age Bracket | Male | Female |
| Under 5 Years | 0 (0.0%) | 0 (0.0%) |
| 5 to 17 Years | 49 (11.6%) | 0 (0.0%) |
| 18 to 34 Years | 17 (4.8%) | 78 (22.8%) |
| 35 to 64 Years | 43 (8.9%) | 35 (7.1%) |
| 65 to 74 Years | 27 (43.5%) | 38 (42.7%) |
| 75 Years and over | 0 (0.0%) | 27 (34.6%) |
Disability Class by Sex by Age in North Browning
Disability Class: Hearing Difficulty
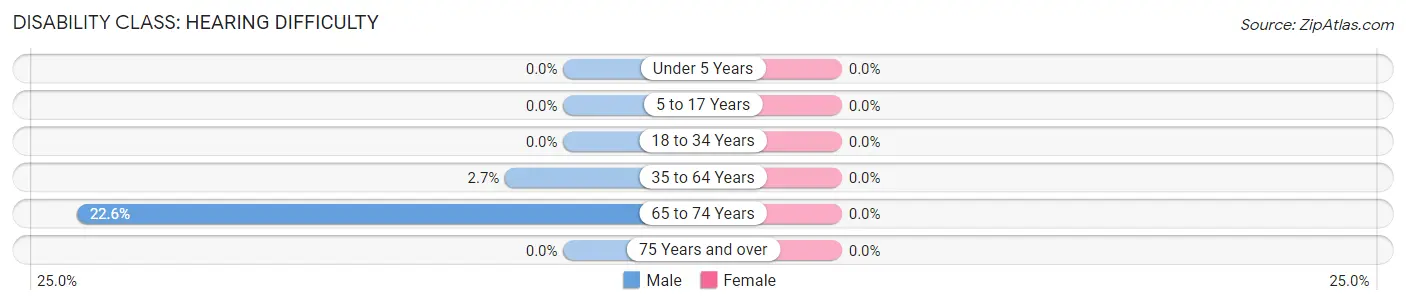
| Age Bracket | Male | Female |
| Under 5 Years | 0 (0.0%) | 0 (0.0%) |
| 5 to 17 Years | 0 (0.0%) | 0 (0.0%) |
| 18 to 34 Years | 0 (0.0%) | 0 (0.0%) |
| 35 to 64 Years | 13 (2.7%) | 0 (0.0%) |
| 65 to 74 Years | 14 (22.6%) | 0 (0.0%) |
| 75 Years and over | 0 (0.0%) | 0 (0.0%) |
Disability Class: Vision Difficulty
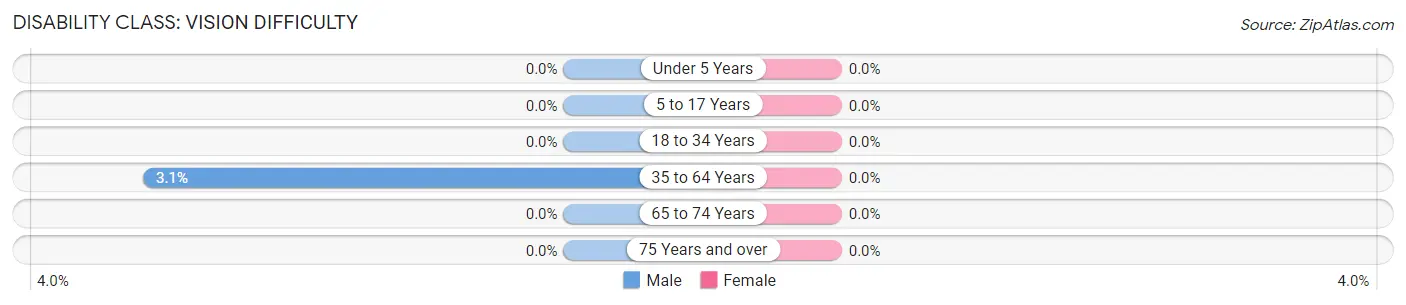
| Age Bracket | Male | Female |
| Under 5 Years | 0 (0.0%) | 0 (0.0%) |
| 5 to 17 Years | 0 (0.0%) | 0 (0.0%) |
| 18 to 34 Years | 0 (0.0%) | 0 (0.0%) |
| 35 to 64 Years | 15 (3.1%) | 0 (0.0%) |
| 65 to 74 Years | 0 (0.0%) | 0 (0.0%) |
| 75 Years and over | 0 (0.0%) | 0 (0.0%) |
Disability Class: Cognitive Difficulty
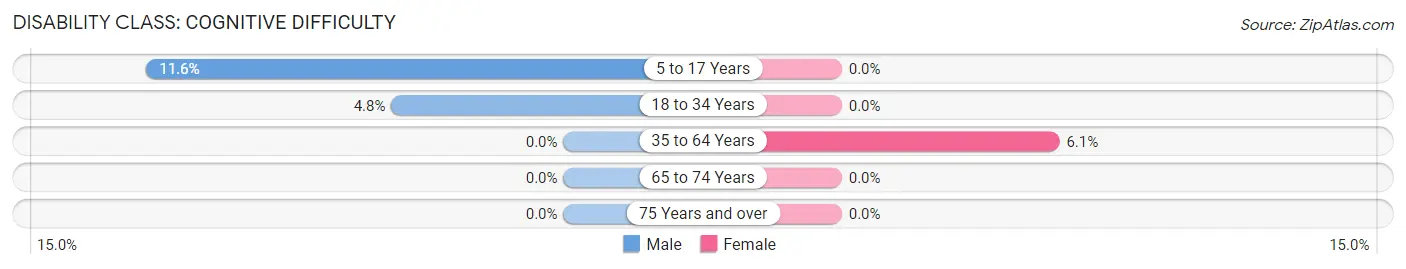
| Age Bracket | Male | Female |
| 5 to 17 Years | 49 (11.6%) | 0 (0.0%) |
| 18 to 34 Years | 17 (4.8%) | 0 (0.0%) |
| 35 to 64 Years | 0 (0.0%) | 30 (6.1%) |
| 65 to 74 Years | 0 (0.0%) | 0 (0.0%) |
| 75 Years and over | 0 (0.0%) | 0 (0.0%) |
Disability Class: Ambulatory Difficulty
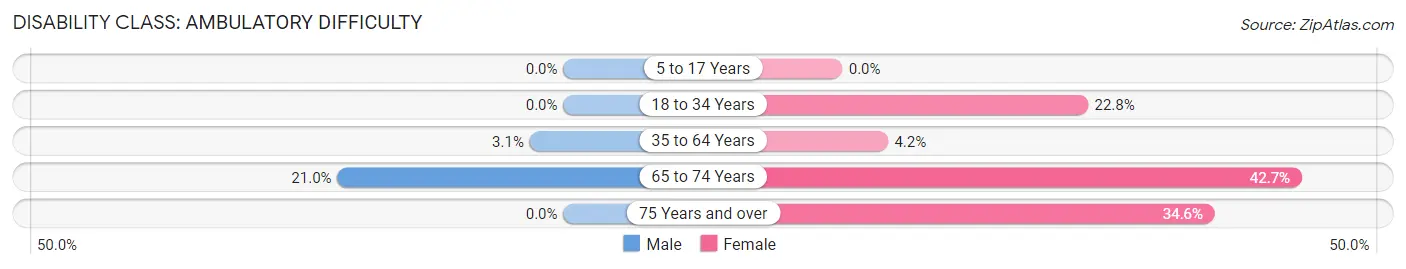
| Age Bracket | Male | Female |
| 5 to 17 Years | 0 (0.0%) | 0 (0.0%) |
| 18 to 34 Years | 0 (0.0%) | 78 (22.8%) |
| 35 to 64 Years | 15 (3.1%) | 21 (4.2%) |
| 65 to 74 Years | 13 (21.0%) | 38 (42.7%) |
| 75 Years and over | 0 (0.0%) | 27 (34.6%) |
Disability Class: Self-Care Difficulty
| Age Bracket | Male | Female |
| 5 to 17 Years | 0 (0.0%) | 0 (0.0%) |
| 18 to 34 Years | 0 (0.0%) | 0 (0.0%) |
| 35 to 64 Years | 0 (0.0%) | 0 (0.0%) |
| 65 to 74 Years | 0 (0.0%) | 0 (0.0%) |
| 75 Years and over | 0 (0.0%) | 0 (0.0%) |
Technology Access in North Browning
Computing Device Access in North Browning
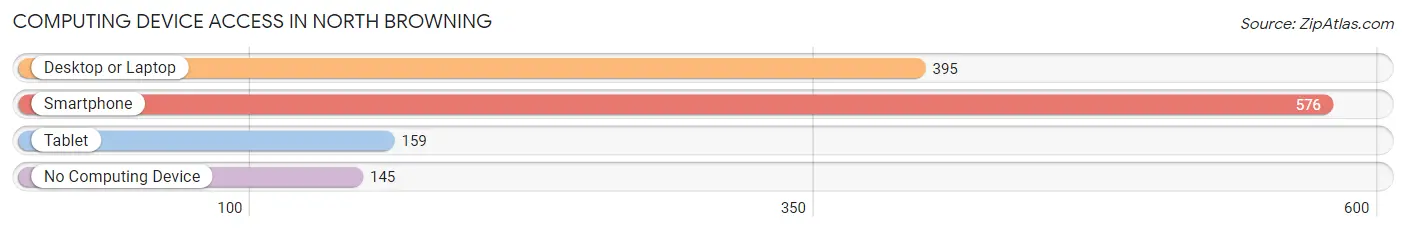
| Device Type | # Households | % Households |
| Desktop or Laptop | 395 | 51.2% |
| Smartphone | 576 | 74.6% |
| Tablet | 159 | 20.6% |
| No Computing Device | 145 | 18.8% |
| Total | 772 | 100.0% |
Internet Access in North Browning
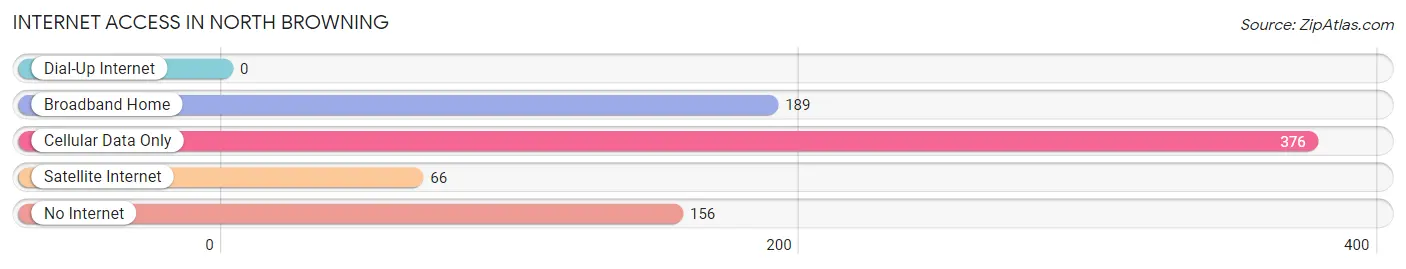
| Internet Type | # Households | % Households |
| Dial-Up Internet | 0 | 0.0% |
| Broadband Home | 189 | 24.5% |
| Cellular Data Only | 376 | 48.7% |
| Satellite Internet | 66 | 8.6% |
| No Internet | 156 | 20.2% |
| Total | 772 | 100.0% |
North Browning Summary
Browning, Montana is a small town located in the Blackfeet Indian Reservation in Glacier County. It is the county seat of Glacier County and is the largest town in the reservation. The town is located on the eastern side of the Rocky Mountains, near the border of Canada. The town is situated at an elevation of 4,200 feet and has a population of 1,832 people as of the 2010 census.
History
The area around Browning was first inhabited by the Blackfeet Indians, who had lived in the area for centuries. The town was founded in 1887 by the Great Northern Railway, which built a station in the area. The town was named after the Blackfeet chief, Chief Browning. The town quickly grew and became a center of commerce for the Blackfeet Indians.
In the early 1900s, the town was a major hub for the cattle industry. The town was also home to a number of businesses, including a hotel, a bank, a newspaper, and a school.
In the 1920s, the town was the site of a major oil boom. The oil boom brought a large influx of people to the area, and the population of the town grew rapidly. The town was also the site of a major gold rush in the 1930s.
Geography
Browning is located in the Blackfeet Indian Reservation in Glacier County, Montana. The town is situated at an elevation of 4,200 feet and is located on the eastern side of the Rocky Mountains, near the border of Canada. The town is located on the Blackfeet Indian Reservation, which covers an area of 1.5 million acres.
The town is located in a semi-arid climate, with hot summers and cold winters. The average annual temperature is around 45 degrees Fahrenheit. The town receives an average of 16 inches of precipitation per year.
Economy
The economy of Browning is largely based on tourism and the oil and gas industry. The town is home to a number of tourist attractions, including the Blackfeet Heritage Center, the Museum of the Plains Indian, and the Glacier National Park. The town is also home to a number of oil and gas companies, including ExxonMobil, Chevron, and ConocoPhillips.
The town is also home to a number of businesses, including restaurants, hotels, and retail stores. The town is also home to a number of government offices, including the Blackfeet Tribal Council and the Glacier County Courthouse.
Demographics
As of the 2010 census, the population of Browning was 1,832 people. The racial makeup of the town was 94.3% Native American, 4.2% White, 0.2% African American, 0.1% Asian, and 0.2% from other races. The median household income in the town was $25,000, and the median family income was $30,000. The per capita income in the town was $14,000.
Conclusion
Browning, Montana is a small town located in the Blackfeet Indian Reservation in Glacier County. The town is situated at an elevation of 4,200 feet and has a population of 1,832 people as of the 2010 census. The economy of the town is largely based on tourism and the oil and gas industry. The racial makeup of the town is 94.3% Native American, 4.2% White, 0.2% African American, 0.1% Asian, and 0.2% from other races. The median household income in the town was $25,000, and the median family income was $30,000.
Common Questions
What is Per Capita Income in North Browning?
Per Capita income in North Browning is $16,997.
What is the Median Family Income in North Browning?
Median Family Income in North Browning is $40,568.
What is the Median Household income in North Browning?
Median Household Income in North Browning is $38,462.
What is Income or Wage Gap in North Browning?
Income or Wage Gap in North Browning is 1.1%.
Women in North Browning earn 98.9 cents for every dollar earned by a man.
What is Inequality or Gini Index in North Browning?
Inequality or Gini Index in North Browning is 0.47.
What is the Total Population of North Browning?
Total Population of North Browning is 3,001.
What is the Total Male Population of North Browning?
Total Male Population of North Browning is 1,455.
What is the Total Female Population of North Browning?
Total Female Population of North Browning is 1,546.
What is the Ratio of Males per 100 Females in North Browning?
There are 94.11 Males per 100 Females in North Browning.
What is the Ratio of Females per 100 Males in North Browning?
There are 106.25 Females per 100 Males in North Browning.
What is the Median Population Age in North Browning?
Median Population Age in North Browning is 26.7 Years.
What is the Average Family Size in North Browning
Average Family Size in North Browning is 4.5 People.
What is the Average Household Size in North Browning
Average Household Size in North Browning is 3.8 People.
How Large is the Labor Force in North Browning?
There are 1,029 People in the Labor Forcein in North Browning.
What is the Percentage of People in the Labor Force in North Browning?
49.9% of People are in the Labor Force in North Browning.
What is the Unemployment Rate in North Browning?
Unemployment Rate in North Browning is 11.6%.