Frenchtown, MT Map & Demographics
Frenchtown Map
Frenchtown Overview
$35,182
PER CAPITA INCOME
$88,561
AVG FAMILY INCOME
$86,184
AVG HOUSEHOLD INCOME
38.0%
WAGE / INCOME GAP [ % ]
62.0¢/ $1
WAGE / INCOME GAP [ $ ]
0.30
INEQUALITY / GINI INDEX
1,570
TOTAL POPULATION
822
MALE POPULATION
748
FEMALE POPULATION
109.89
MALES / 100 FEMALES
91.00
FEMALES / 100 MALES
42.4
MEDIAN AGE
2.8
AVG FAMILY SIZE
2.6
AVG HOUSEHOLD SIZE
658
LABOR FORCE [ PEOPLE ]
59.7%
PERCENT IN LABOR FORCE
3.6%
UNEMPLOYMENT RATE
Frenchtown Zip Codes
Frenchtown Area Codes
Income in Frenchtown
Income Overview in Frenchtown
Per Capita Income in Frenchtown is $35,182, while median incomes of families and households are $88,561 and $86,184 respectively.
| Characteristic | Number | Measure |
| Per Capita Income | 1,570 | $35,182 |
| Median Family Income | 530 | $88,561 |
| Mean Family Income | 530 | $98,985 |
| Median Household Income | 606 | $86,184 |
| Mean Household Income | 606 | $93,431 |
| Income Deficit | 530 | $0 |
| Wage / Income Gap (%) | 1,570 | 38.04% |
| Wage / Income Gap ($) | 1,570 | 61.96¢ per $1 |
| Gini / Inequality Index | 1,570 | 0.30 |
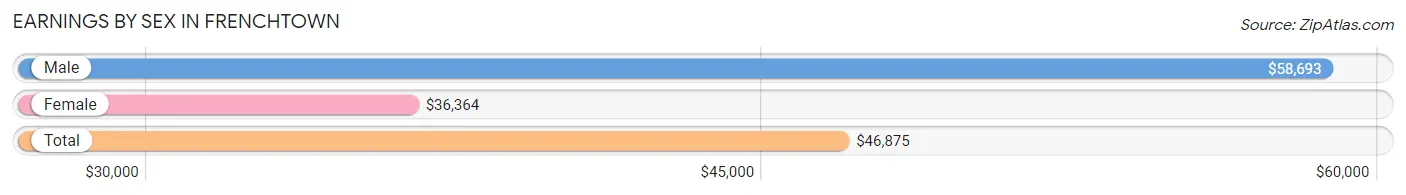
Earnings by Sex in Frenchtown
Average Earnings in Frenchtown are $46,875, $58,693 for men and $36,364 for women, a difference of 38.0%.
| Sex | Number | Average Earnings |
| Male | 384 (53.9%) | $58,693 |
| Female | 328 (46.1%) | $36,364 |
| Total | 712 (100.0%) | $46,875 |
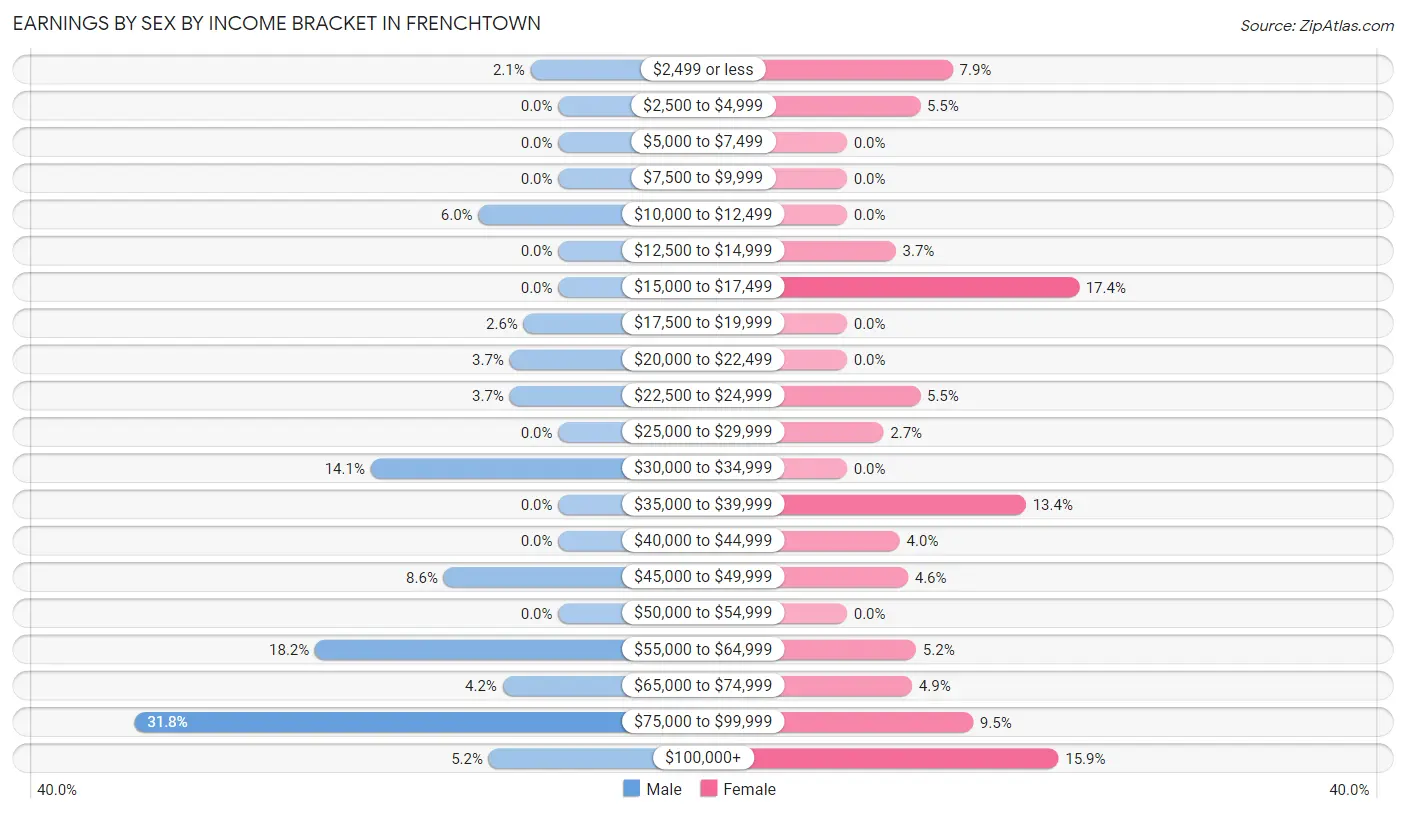
Earnings by Sex by Income Bracket in Frenchtown
The most common earnings brackets in Frenchtown are $75,000 to $99,999 for men (122 | 31.8%) and $15,000 to $17,499 for women (57 | 17.4%).
| Income | Male | Female |
| $2,499 or less | 8 (2.1%) | 26 (7.9%) |
| $2,500 to $4,999 | 0 (0.0%) | 18 (5.5%) |
| $5,000 to $7,499 | 0 (0.0%) | 0 (0.0%) |
| $7,500 to $9,999 | 0 (0.0%) | 0 (0.0%) |
| $10,000 to $12,499 | 23 (6.0%) | 0 (0.0%) |
| $12,500 to $14,999 | 0 (0.0%) | 12 (3.7%) |
| $15,000 to $17,499 | 0 (0.0%) | 57 (17.4%) |
| $17,500 to $19,999 | 10 (2.6%) | 0 (0.0%) |
| $20,000 to $22,499 | 14 (3.6%) | 0 (0.0%) |
| $22,500 to $24,999 | 14 (3.6%) | 18 (5.5%) |
| $25,000 to $29,999 | 0 (0.0%) | 9 (2.7%) |
| $30,000 to $34,999 | 54 (14.1%) | 0 (0.0%) |
| $35,000 to $39,999 | 0 (0.0%) | 44 (13.4%) |
| $40,000 to $44,999 | 0 (0.0%) | 13 (4.0%) |
| $45,000 to $49,999 | 33 (8.6%) | 15 (4.6%) |
| $50,000 to $54,999 | 0 (0.0%) | 0 (0.0%) |
| $55,000 to $64,999 | 70 (18.2%) | 17 (5.2%) |
| $65,000 to $74,999 | 16 (4.2%) | 16 (4.9%) |
| $75,000 to $99,999 | 122 (31.8%) | 31 (9.5%) |
| $100,000+ | 20 (5.2%) | 52 (15.9%) |
| Total | 384 (100.0%) | 328 (100.0%) |
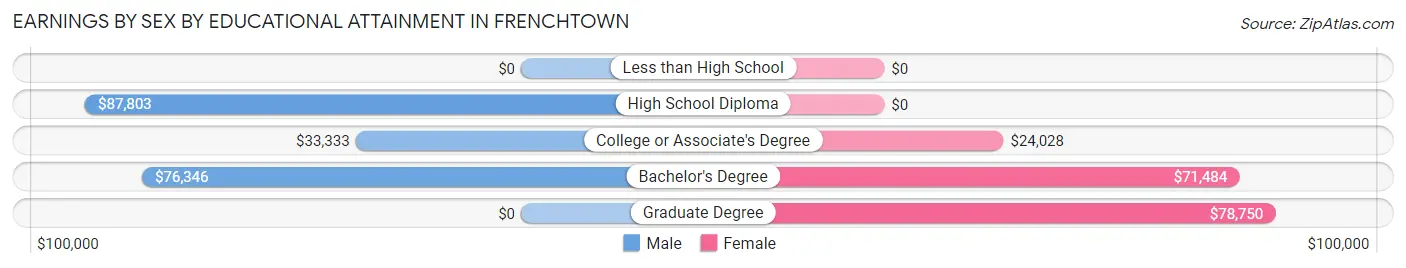
Earnings by Sex by Educational Attainment in Frenchtown
Average earnings in Frenchtown are $58,693 for men and $37,102 for women, a difference of 36.8%. Men with an educational attainment of high school diploma enjoy the highest average annual earnings of $87,803, while those with college or associate's degree education earn the least with $33,333. Women with an educational attainment of graduate degree earn the most with the average annual earnings of $78,750, while those with college or associate's degree education have the smallest earnings of $24,028.
| Educational Attainment | Male Income | Female Income |
| Less than High School | - | - |
| High School Diploma | $87,803 | $0 |
| College or Associate's Degree | $33,333 | $24,028 |
| Bachelor's Degree | $76,346 | $71,484 |
| Graduate Degree | - | - |
| Total | $58,693 | $37,102 |
Family Income in Frenchtown
Family Income Brackets in Frenchtown
According to the Frenchtown family income data, there are 159 families falling into the $75,000 to $99,999 income range, which is the most common income bracket and makes up 30.0% of all families.
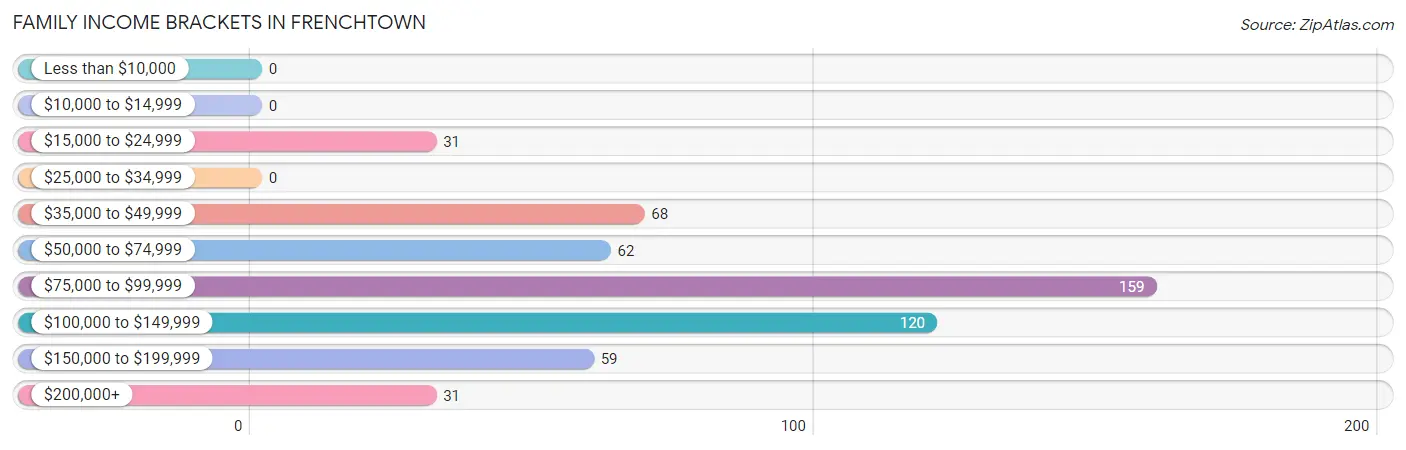
| Income Bracket | # Families | % Families |
| Less than $10,000 | 0 | 0.0% |
| $10,000 to $14,999 | 0 | 0.0% |
| $15,000 to $24,999 | 31 | 5.8% |
| $25,000 to $34,999 | 0 | 0.0% |
| $35,000 to $49,999 | 68 | 12.8% |
| $50,000 to $74,999 | 62 | 11.7% |
| $75,000 to $99,999 | 159 | 30.0% |
| $100,000 to $149,999 | 120 | 22.6% |
| $150,000 to $199,999 | 59 | 11.1% |
| $200,000+ | 31 | 5.8% |
Family Income by Famaliy Size in Frenchtown
5-person families (67 | 12.6%) account for the highest median family income in Frenchtown with $123,207 per family, while 2-person families (214 | 40.4%) have the highest median income of $49,559 per family member.
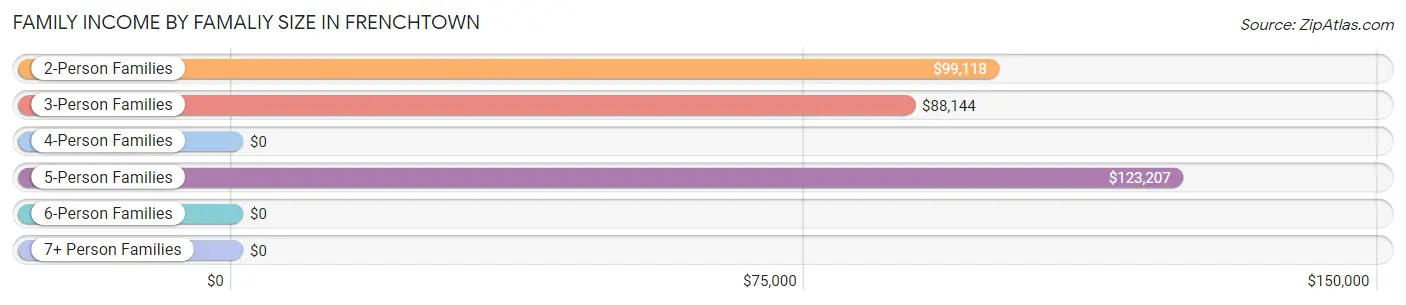
| Income Bracket | # Families | Median Income |
| 2-Person Families | 214 (40.4%) | $99,118 |
| 3-Person Families | 126 (23.8%) | $88,144 |
| 4-Person Families | 107 (20.2%) | $0 |
| 5-Person Families | 67 (12.6%) | $123,207 |
| 6-Person Families | 16 (3.0%) | $0 |
| 7+ Person Families | 0 (0.0%) | $0 |
| Total | 530 (100.0%) | $88,561 |
Family Income by Number of Earners in Frenchtown
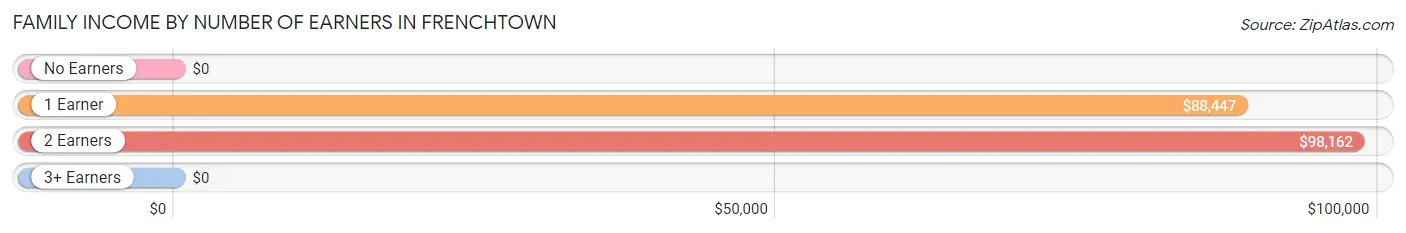
| Number of Earners | # Families | Median Income |
| No Earners | 123 (23.2%) | $0 |
| 1 Earner | 176 (33.2%) | $88,447 |
| 2 Earners | 199 (37.6%) | $98,162 |
| 3+ Earners | 32 (6.0%) | $0 |
| Total | 530 (100.0%) | $88,561 |
Household Income in Frenchtown
Household Income Brackets in Frenchtown
With 170 households falling in the category, the $75,000 to $99,999 income range is the most frequent in Frenchtown, accounting for 28.1% of all households.
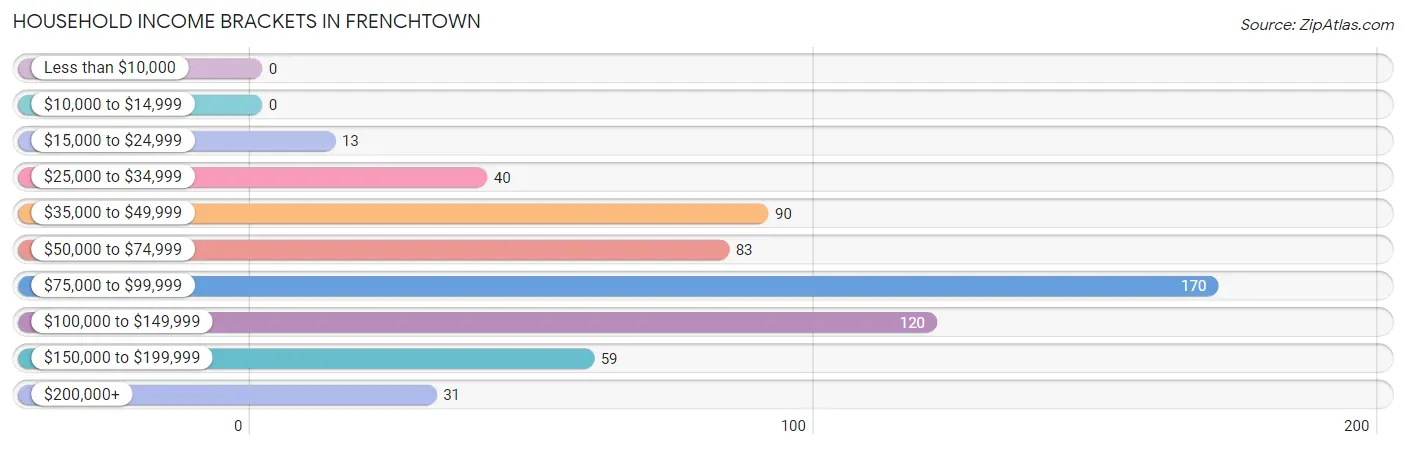
| Income Bracket | # Households | % Households |
| Less than $10,000 | 0 | 0.0% |
| $10,000 to $14,999 | 0 | 0.0% |
| $15,000 to $24,999 | 13 | 2.1% |
| $25,000 to $34,999 | 40 | 6.6% |
| $35,000 to $49,999 | 90 | 14.9% |
| $50,000 to $74,999 | 83 | 13.7% |
| $75,000 to $99,999 | 170 | 28.1% |
| $100,000 to $149,999 | 120 | 19.8% |
| $150,000 to $199,999 | 59 | 9.7% |
| $200,000+ | 31 | 5.1% |
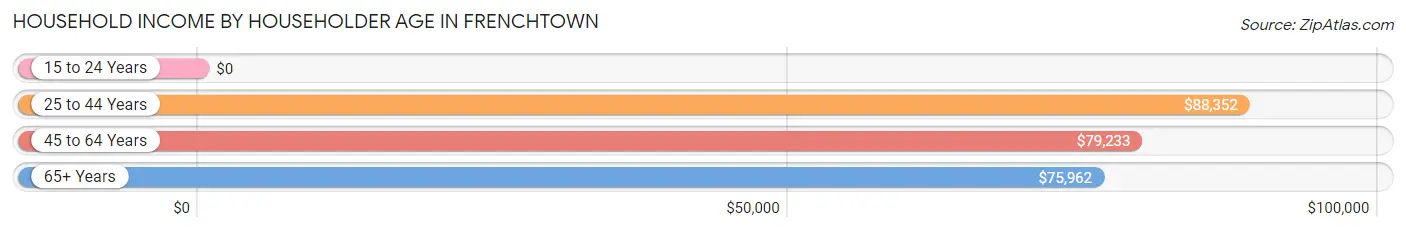
Household Income by Householder Age in Frenchtown
The median household income in Frenchtown is $86,184, with the highest median household income of $88,352 found in the 25 to 44 years age bracket for the primary householder. A total of 197 households (32.5%) fall into this category.
| Income Bracket | # Households | Median Income |
| 15 to 24 Years | 0 (0.0%) | $0 |
| 25 to 44 Years | 197 (32.5%) | $88,352 |
| 45 to 64 Years | 199 (32.8%) | $79,233 |
| 65+ Years | 210 (34.6%) | $75,962 |
| Total | 606 (100.0%) | $86,184 |
Poverty in Frenchtown
Income Below Poverty by Sex and Age in Frenchtown
With 5.2% poverty level for males and 7.6% for females among the residents of Frenchtown, 55 to 64 year old males and 6 to 11 year old females are the most vulnerable to poverty, with 10 males (15.4%) and 26 females (30.2%) in their respective age groups living below the poverty level.
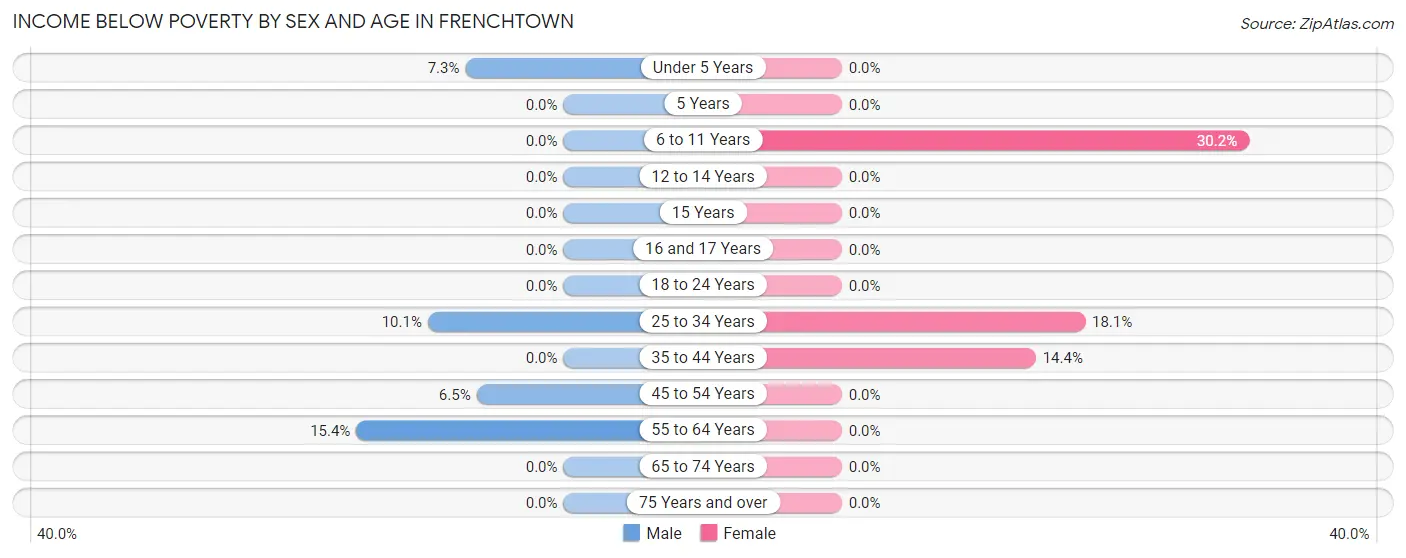
| Age Bracket | Male | Female |
| Under 5 Years | 11 (7.3%) | 0 (0.0%) |
| 5 Years | 0 (0.0%) | 0 (0.0%) |
| 6 to 11 Years | 0 (0.0%) | 26 (30.2%) |
| 12 to 14 Years | 0 (0.0%) | 0 (0.0%) |
| 15 Years | 0 (0.0%) | 0 (0.0%) |
| 16 and 17 Years | 0 (0.0%) | 0 (0.0%) |
| 18 to 24 Years | 0 (0.0%) | 0 (0.0%) |
| 25 to 34 Years | 14 (10.1%) | 13 (18.1%) |
| 35 to 44 Years | 0 (0.0%) | 18 (14.4%) |
| 45 to 54 Years | 8 (6.5%) | 0 (0.0%) |
| 55 to 64 Years | 10 (15.4%) | 0 (0.0%) |
| 65 to 74 Years | 0 (0.0%) | 0 (0.0%) |
| 75 Years and over | 0 (0.0%) | 0 (0.0%) |
| Total | 43 (5.2%) | 57 (7.6%) |
Income Above Poverty by Sex and Age in Frenchtown
According to the poverty statistics in Frenchtown, males aged 6 to 11 years and females aged under 5 years are the age groups that are most secure financially, with 100.0% of males and 100.0% of females in these age groups living above the poverty line.
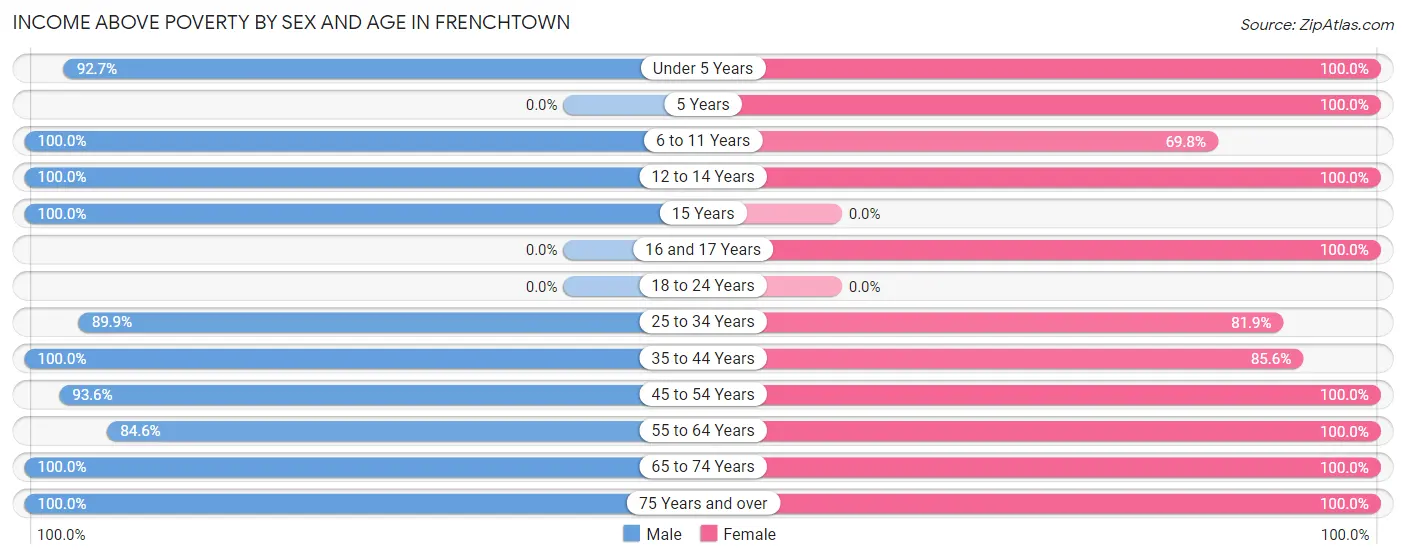
| Age Bracket | Male | Female |
| Under 5 Years | 140 (92.7%) | 44 (100.0%) |
| 5 Years | 0 (0.0%) | 14 (100.0%) |
| 6 to 11 Years | 64 (100.0%) | 60 (69.8%) |
| 12 to 14 Years | 39 (100.0%) | 54 (100.0%) |
| 15 Years | 16 (100.0%) | 0 (0.0%) |
| 16 and 17 Years | 0 (0.0%) | 26 (100.0%) |
| 18 to 24 Years | 0 (0.0%) | 0 (0.0%) |
| 25 to 34 Years | 125 (89.9%) | 59 (81.9%) |
| 35 to 44 Years | 14 (100.0%) | 107 (85.6%) |
| 45 to 54 Years | 116 (93.5%) | 98 (100.0%) |
| 55 to 64 Years | 55 (84.6%) | 46 (100.0%) |
| 65 to 74 Years | 81 (100.0%) | 129 (100.0%) |
| 75 Years and over | 129 (100.0%) | 54 (100.0%) |
| Total | 779 (94.8%) | 691 (92.4%) |
Income Below Poverty Among Married-Couple Families in Frenchtown
The poverty statistics for married-couple families in Frenchtown show that 3.1% or 13 of the total 417 families live below the poverty line. Families with 3 or 4 children have the highest poverty rate of 21.7%, comprising of 13 families. On the other hand, families with no children have the lowest poverty rate of 0.0%, which includes 0 families.
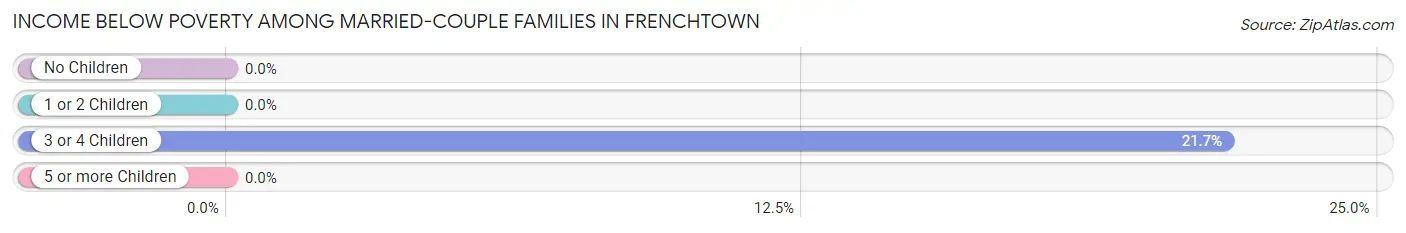
| Children | Above Poverty | Below Poverty |
| No Children | 196 (100.0%) | 0 (0.0%) |
| 1 or 2 Children | 161 (100.0%) | 0 (0.0%) |
| 3 or 4 Children | 47 (78.3%) | 13 (21.7%) |
| 5 or more Children | 0 (0.0%) | 0 (0.0%) |
| Total | 404 (96.9%) | 13 (3.1%) |
Income Below Poverty Among Single-Parent Households in Frenchtown
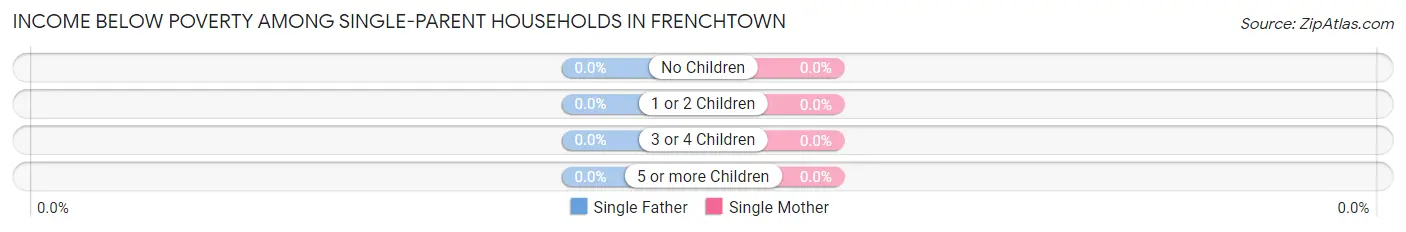
| Children | Single Father | Single Mother |
| No Children | 0 (0.0%) | 0 (0.0%) |
| 1 or 2 Children | 0 (0.0%) | 0 (0.0%) |
| 3 or 4 Children | 0 (0.0%) | 0 (0.0%) |
| 5 or more Children | 0 (0.0%) | 0 (0.0%) |
| Total | 0 (0.0%) | 0 (0.0%) |
Income Below Poverty Among Married-Couple vs Single-Parent Households in Frenchtown
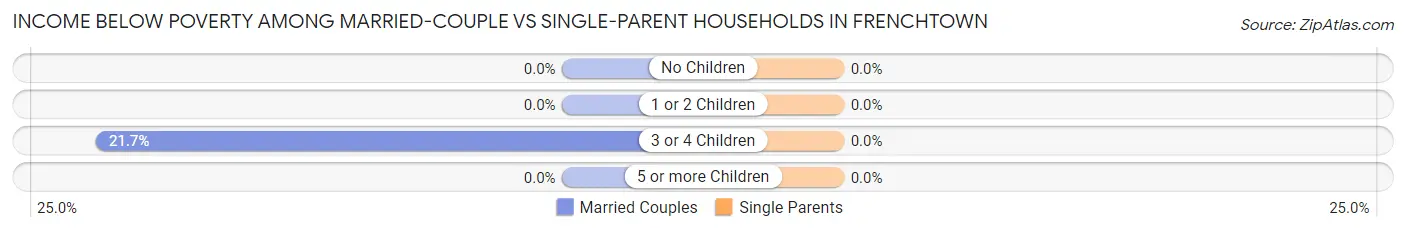
| Children | Married-Couple Families | Single-Parent Households |
| No Children | 0 (0.0%) | 0 (0.0%) |
| 1 or 2 Children | 0 (0.0%) | 0 (0.0%) |
| 3 or 4 Children | 13 (21.7%) | 0 (0.0%) |
| 5 or more Children | 0 (0.0%) | 0 (0.0%) |
| Total | 13 (3.1%) | 0 (0.0%) |
Race in Frenchtown
The most populous races in Frenchtown are White / Caucasian (1,312 | 83.6%), Black / African American (137 | 8.7%), and Some other Race (63 | 4.0%).
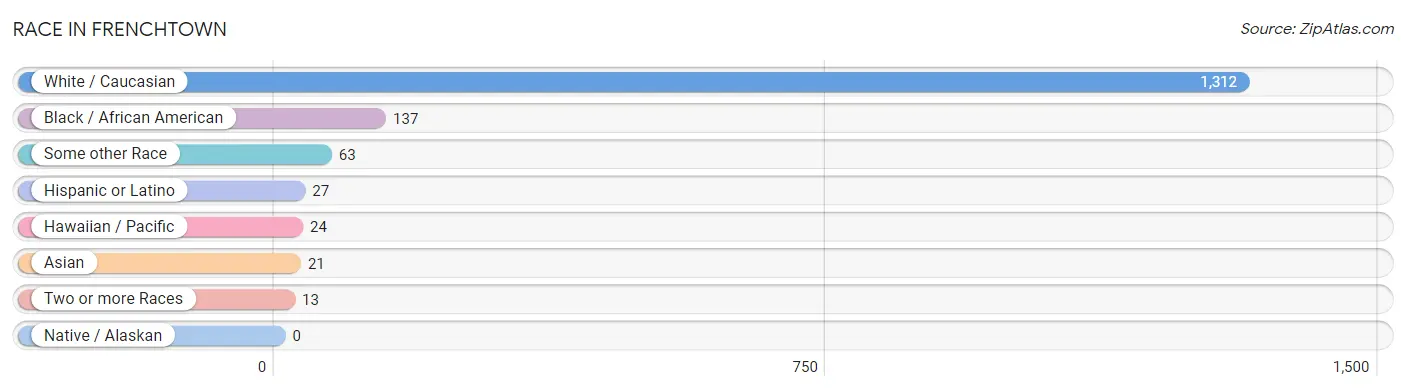
| Race | # Population | % Population |
| Asian | 21 | 1.3% |
| Black / African American | 137 | 8.7% |
| Hawaiian / Pacific | 24 | 1.5% |
| Hispanic or Latino | 27 | 1.7% |
| Native / Alaskan | 0 | 0.0% |
| White / Caucasian | 1,312 | 83.6% |
| Two or more Races | 13 | 0.8% |
| Some other Race | 63 | 4.0% |
| Total | 1,570 | 100.0% |
Ancestry in Frenchtown
The most populous ancestries reported in Frenchtown are Irish (338 | 21.5%), German (290 | 18.5%), English (282 | 18.0%), American (191 | 12.2%), and French (72 | 4.6%), together accounting for 74.7% of all Frenchtown residents.
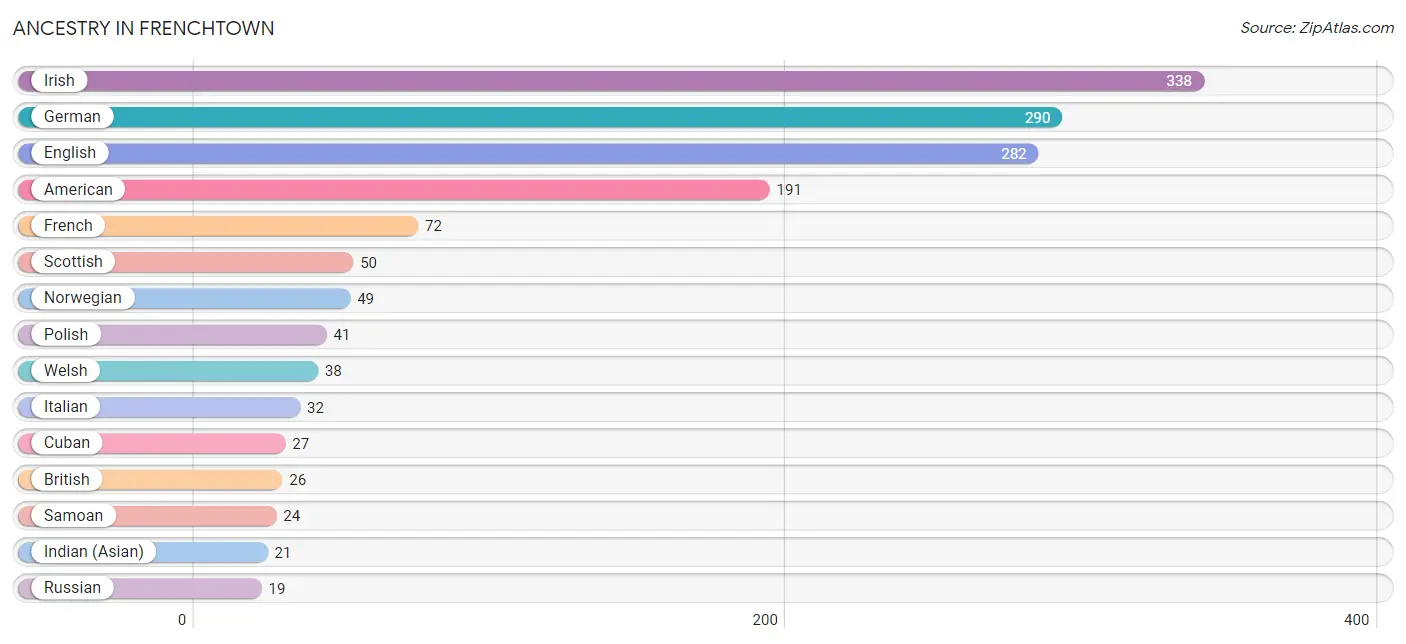
| Ancestry | # Population | % Population |
| African | 13 | 0.8% |
| American | 191 | 12.2% |
| British | 26 | 1.7% |
| Celtic | 11 | 0.7% |
| Cuban | 27 | 1.7% |
| Czech | 11 | 0.7% |
| English | 282 | 18.0% |
| Finnish | 13 | 0.8% |
| French | 72 | 4.6% |
| German | 290 | 18.5% |
| Indian (Asian) | 21 | 1.3% |
| Irish | 338 | 21.5% |
| Italian | 32 | 2.0% |
| Norwegian | 49 | 3.1% |
| Pennsylvania German | 11 | 0.7% |
| Polish | 41 | 2.6% |
| Russian | 19 | 1.2% |
| Samoan | 24 | 1.5% |
| Scotch-Irish | 13 | 0.8% |
| Scottish | 50 | 3.2% |
| Subsaharan African | 13 | 0.8% |
| Swedish | 18 | 1.1% |
| Welsh | 38 | 2.4% | View All 23 Rows |
Immigrants in Frenchtown
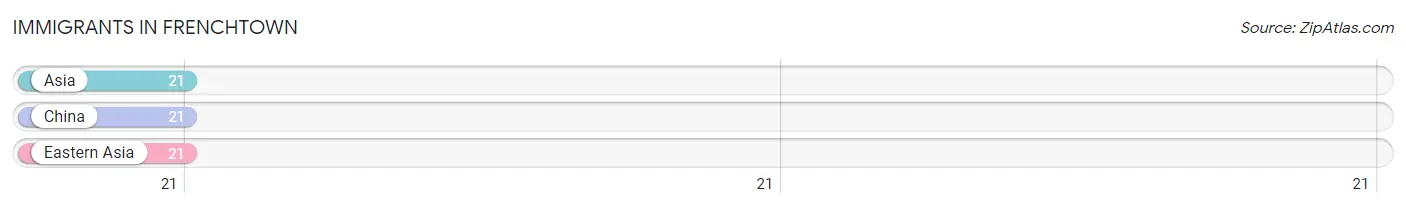
The most numerous immigrant groups reported in Frenchtown came from Asia (21 | 1.3%), China (21 | 1.3%), and Eastern Asia (21 | 1.3%), together accounting for 4.0% of all Frenchtown residents.
| Immigration Origin | # Population | % Population |
| Asia | 21 | 1.3% |
| China | 21 | 1.3% |
| Eastern Asia | 21 | 1.3% | View All 3 Rows |
Sex and Age in Frenchtown
Sex and Age in Frenchtown
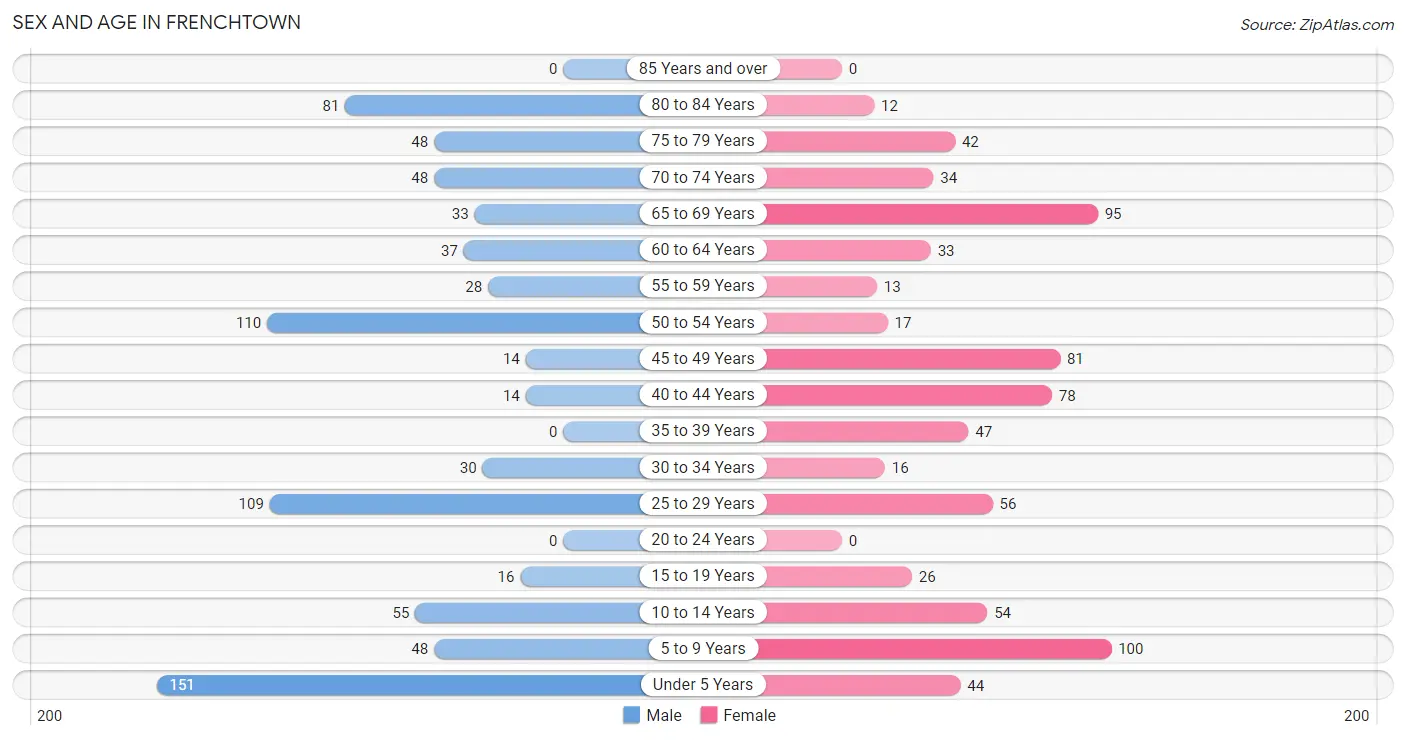
The most populous age groups in Frenchtown are Under 5 Years (151 | 18.4%) for men and 5 to 9 Years (100 | 13.4%) for women.
| Age Bracket | Male | Female |
| Under 5 Years | 151 (18.4%) | 44 (5.9%) |
| 5 to 9 Years | 48 (5.8%) | 100 (13.4%) |
| 10 to 14 Years | 55 (6.7%) | 54 (7.2%) |
| 15 to 19 Years | 16 (1.9%) | 26 (3.5%) |
| 20 to 24 Years | 0 (0.0%) | 0 (0.0%) |
| 25 to 29 Years | 109 (13.3%) | 56 (7.5%) |
| 30 to 34 Years | 30 (3.6%) | 16 (2.1%) |
| 35 to 39 Years | 0 (0.0%) | 47 (6.3%) |
| 40 to 44 Years | 14 (1.7%) | 78 (10.4%) |
| 45 to 49 Years | 14 (1.7%) | 81 (10.8%) |
| 50 to 54 Years | 110 (13.4%) | 17 (2.3%) |
| 55 to 59 Years | 28 (3.4%) | 13 (1.7%) |
| 60 to 64 Years | 37 (4.5%) | 33 (4.4%) |
| 65 to 69 Years | 33 (4.0%) | 95 (12.7%) |
| 70 to 74 Years | 48 (5.8%) | 34 (4.5%) |
| 75 to 79 Years | 48 (5.8%) | 42 (5.6%) |
| 80 to 84 Years | 81 (9.9%) | 12 (1.6%) |
| 85 Years and over | 0 (0.0%) | 0 (0.0%) |
| Total | 822 (100.0%) | 748 (100.0%) |
Families and Households in Frenchtown
Median Family Size in Frenchtown
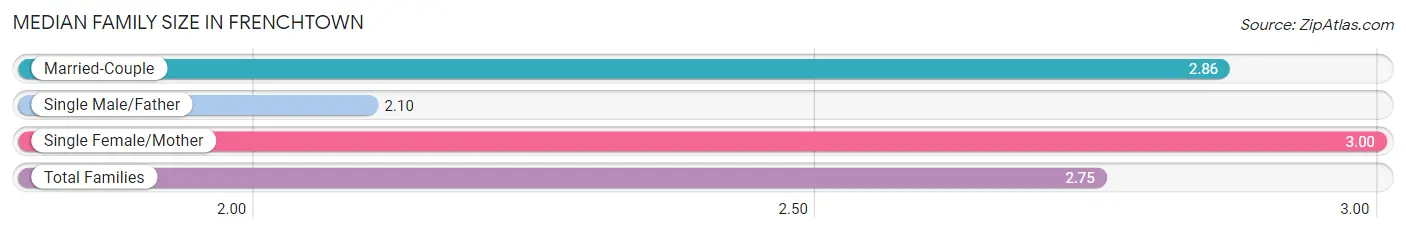
The median family size in Frenchtown is 2.75 persons per family, with single female/mother families (32 | 6.0%) accounting for the largest median family size of 3 persons per family. On the other hand, single male/father families (81 | 15.3%) represent the smallest median family size with 2.10 persons per family.
| Family Type | # Families | Family Size |
| Married-Couple | 417 (78.7%) | 2.86 |
| Single Male/Father | 81 (15.3%) | 2.10 |
| Single Female/Mother | 32 (6.0%) | 3.00 |
| Total Families | 530 (100.0%) | 2.75 |
Median Household Size in Frenchtown
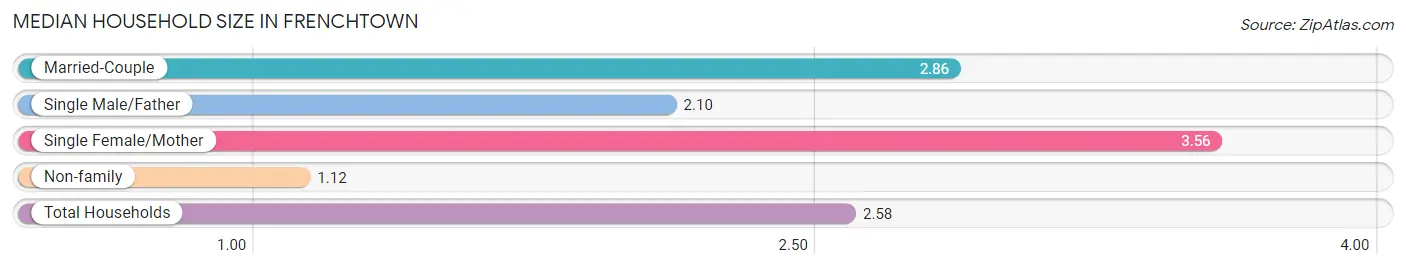
The median household size in Frenchtown is 2.58 persons per household, with single female/mother households (32 | 5.3%) accounting for the largest median household size of 3.56 persons per household. non-family households (76 | 12.5%) represent the smallest median household size with 1.12 persons per household.
| Household Type | # Households | Household Size |
| Married-Couple | 417 (68.8%) | 2.86 |
| Single Male/Father | 81 (13.4%) | 2.10 |
| Single Female/Mother | 32 (5.3%) | 3.56 |
| Non-family | 76 (12.5%) | 1.12 |
| Total Households | 606 (100.0%) | 2.58 |
Household Size by Marriage Status in Frenchtown
Out of a total of 606 households in Frenchtown, 530 (87.5%) are family households, while 76 (12.5%) are nonfamily households. The most numerous type of family households are 2-person households, comprising 196, and the most common type of nonfamily households are 1-person households, comprising 66.
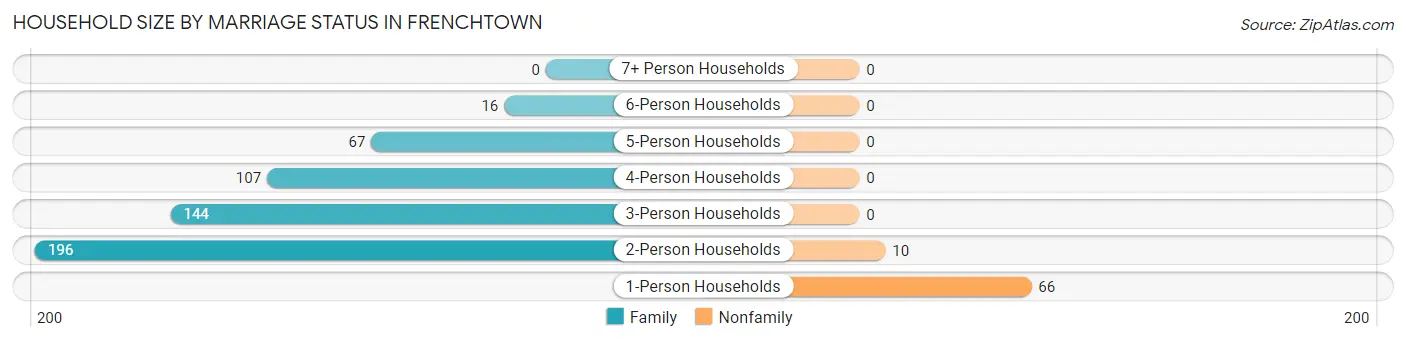
| Household Size | Family Households | Nonfamily Households |
| 1-Person Households | - | 66 (10.9%) |
| 2-Person Households | 196 (32.3%) | 10 (1.7%) |
| 3-Person Households | 144 (23.8%) | 0 (0.0%) |
| 4-Person Households | 107 (17.7%) | 0 (0.0%) |
| 5-Person Households | 67 (11.1%) | 0 (0.0%) |
| 6-Person Households | 16 (2.6%) | 0 (0.0%) |
| 7+ Person Households | 0 (0.0%) | 0 (0.0%) |
| Total | 530 (87.5%) | 76 (12.5%) |
Female Fertility in Frenchtown
Fertility by Age in Frenchtown
| Age Bracket | Women with Births | Births / 1,000 Women |
| 15 to 19 years | 0 (0.0%) | 0.0 |
| 20 to 34 years | 0 (0.0%) | 0.0 |
| 35 to 50 years | 0 (0.0%) | 0.0 |
| Total | 0 (0.0%) | 0.0 |
Fertility by Age by Marriage Status in Frenchtown
| Age Bracket | Married | Unmarried |
| 15 to 19 years | 0 (0.0%) | 0 (0.0%) |
| 20 to 34 years | 0 (0.0%) | 0 (0.0%) |
| 35 to 50 years | 0 (0.0%) | 0 (0.0%) |
| Total | 0 (0.0%) | 0 (0.0%) |
Fertility by Education in Frenchtown
| Educational Attainment | Women with Births | Births / 1,000 Women |
| Less than High School | 0 (0.0%) | 0.0 |
| High School Diploma | 0 (0.0%) | 0.0 |
| College or Associate's Degree | 0 (0.0%) | 0.0 |
| Bachelor's Degree | 0 (0.0%) | 0.0 |
| Graduate Degree | 0 (0.0%) | 0.0 |
| Total | 0 (0.0%) | 0.0 |
Fertility by Education by Marriage Status in Frenchtown
| Educational Attainment | Married | Unmarried |
| Less than High School | 0 (0.0%) | 0 (0.0%) |
| High School Diploma | 0 (0.0%) | 0 (0.0%) |
| College or Associate's Degree | 0 (0.0%) | 0 (0.0%) |
| Bachelor's Degree | 0 (0.0%) | 0 (0.0%) |
| Graduate Degree | 0 (0.0%) | 0 (0.0%) |
| Total | 0 (0.0%) | 0 (0.0%) |
Employment Characteristics in Frenchtown
Employment by Class of Employer in Frenchtown
Among the 593 employed individuals in Frenchtown, private company employees (383 | 64.6%), self-employed (incorporated) (95 | 16.0%), and self-employed (not incorporated) (37 | 6.2%) make up the most common classes of employment.
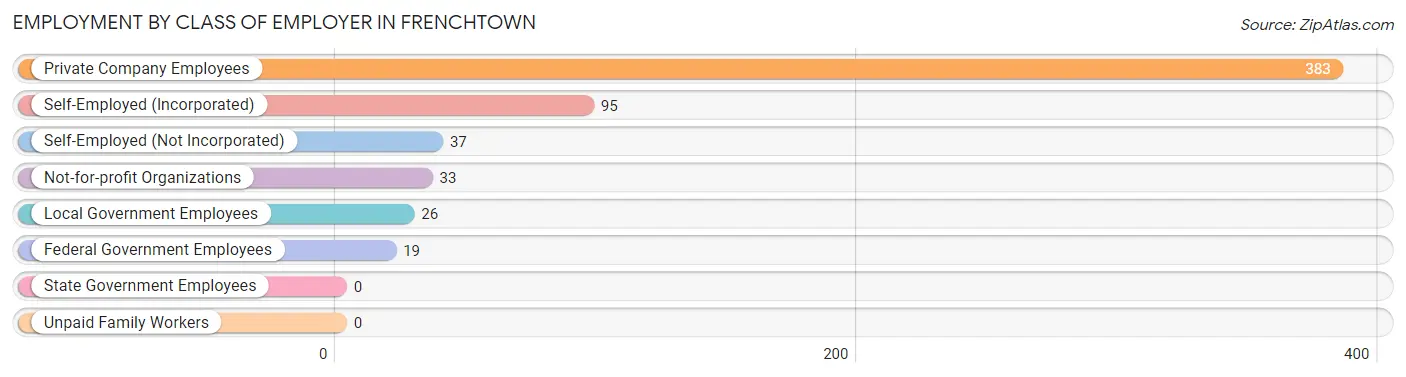
| Employer Class | # Employees | % Employees |
| Private Company Employees | 383 | 64.6% |
| Self-Employed (Incorporated) | 95 | 16.0% |
| Self-Employed (Not Incorporated) | 37 | 6.2% |
| Not-for-profit Organizations | 33 | 5.6% |
| Local Government Employees | 26 | 4.4% |
| State Government Employees | 0 | 0.0% |
| Federal Government Employees | 19 | 3.2% |
| Unpaid Family Workers | 0 | 0.0% |
| Total | 593 | 100.0% |
Employment Status by Age in Frenchtown
According to the labor force statistics for Frenchtown, out of the total population over 16 years of age (1,102), 59.7% or 658 individuals are in the labor force, with 3.6% or 24 of them unemployed. The age group with the highest labor force participation rate is 16 to 19 years, with 100.0% or 26 individuals in the labor force. Within the labor force, the 65 to 74 years age range has the highest percentage of unemployed individuals, with 34.5% or 10 of them being unemployed.
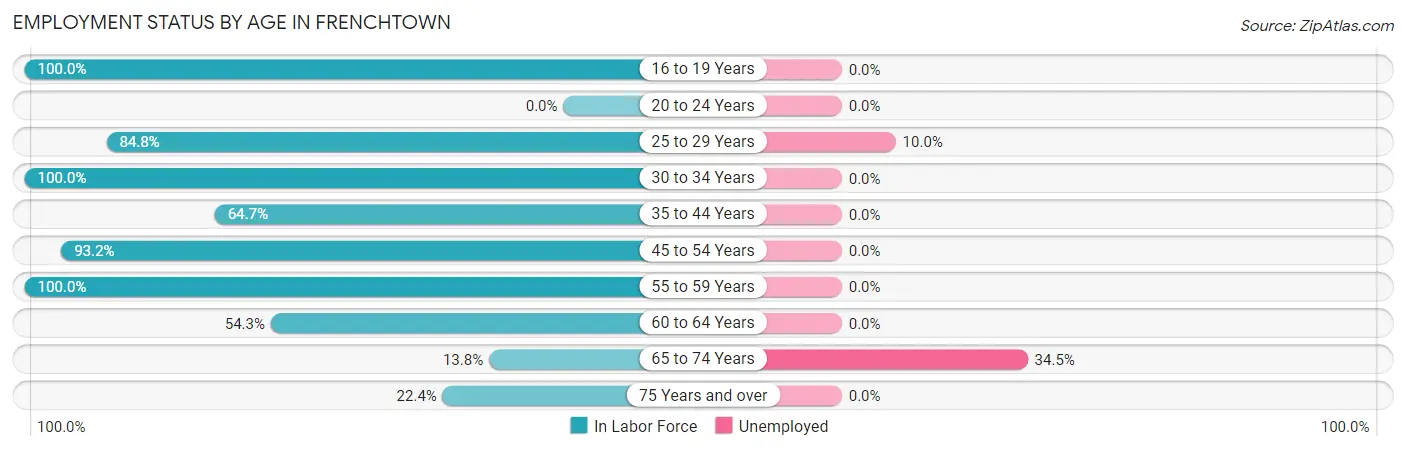
| Age Bracket | In Labor Force | Unemployed |
| 16 to 19 Years | 26 (100.0%) | 0 (0.0%) |
| 20 to 24 Years | 0 (0.0%) | 0 (0.0%) |
| 25 to 29 Years | 140 (84.8%) | 14 (10.0%) |
| 30 to 34 Years | 46 (100.0%) | 0 (0.0%) |
| 35 to 44 Years | 90 (64.7%) | 0 (0.0%) |
| 45 to 54 Years | 207 (93.2%) | 0 (0.0%) |
| 55 to 59 Years | 41 (100.0%) | 0 (0.0%) |
| 60 to 64 Years | 38 (54.3%) | 0 (0.0%) |
| 65 to 74 Years | 29 (13.8%) | 10 (34.5%) |
| 75 Years and over | 41 (22.4%) | 0 (0.0%) |
| Total | 658 (59.7%) | 24 (3.6%) |
Employment Status by Educational Attainment in Frenchtown
According to labor force statistics for Frenchtown, 82.3% of individuals (562) out of the total population between 25 and 64 years of age (683) are in the labor force, with 2.5% or 14 of them being unemployed. The group with the highest labor force participation rate are those with the educational attainment of less than high school, with 100.0% or 60 individuals in the labor force. Within the labor force, individuals with college / associate degree education have the highest percentage of unemployment, with 6.4% or 14 of them being unemployed.
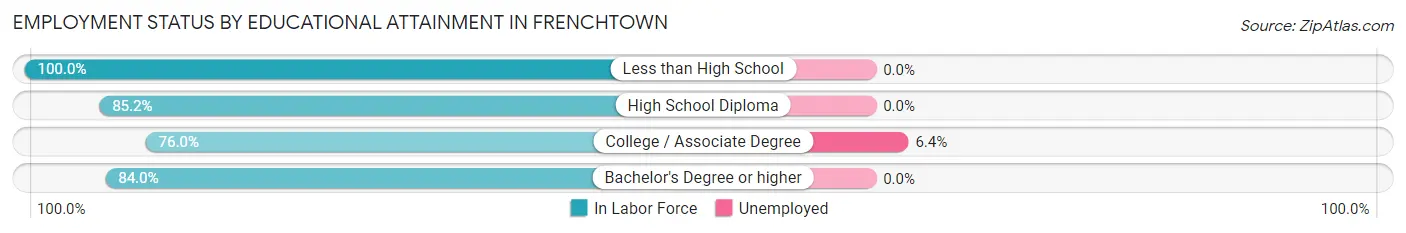
| Educational Attainment | In Labor Force | Unemployed |
| Less than High School | 60 (100.0%) | 0 (0.0%) |
| High School Diploma | 121 (85.2%) | 0 (0.0%) |
| College / Associate Degree | 218 (76.0%) | 18 (6.4%) |
| Bachelor's Degree or higher | 163 (84.0%) | 0 (0.0%) |
| Total | 562 (82.3%) | 17 (2.5%) |
Employment Occupations by Sex in Frenchtown
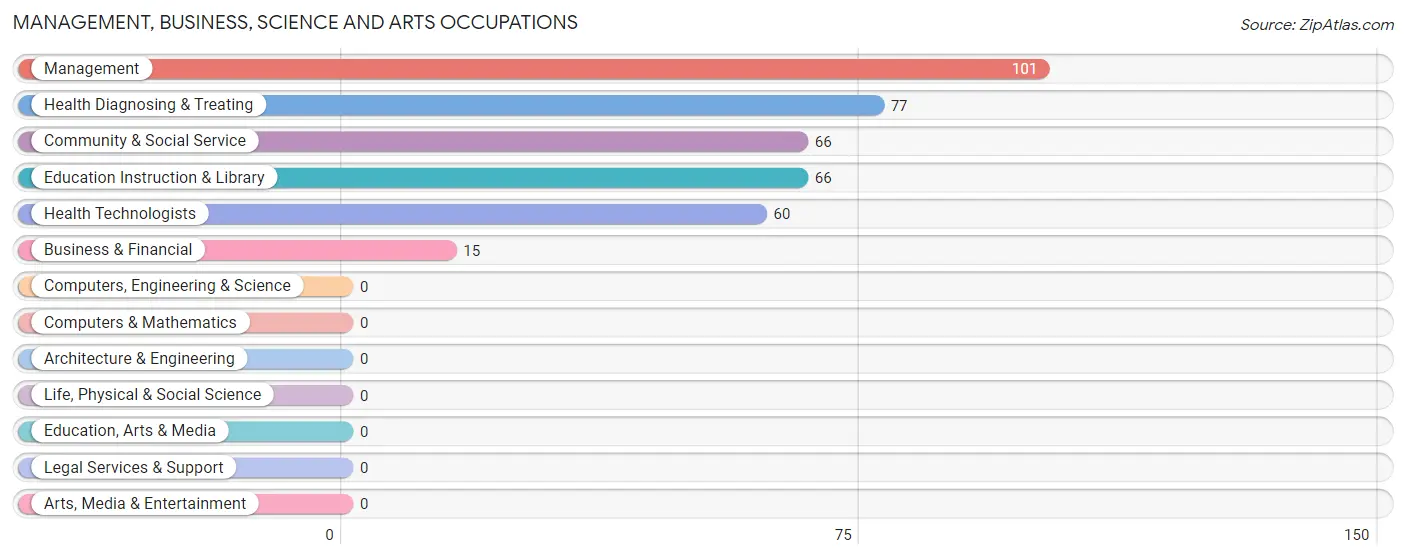
Management, Business, Science and Arts Occupations
The most common Management, Business, Science and Arts occupations in Frenchtown are Management (101 | 15.9%), Health Diagnosing & Treating (77 | 12.1%), Community & Social Service (66 | 10.4%), Education Instruction & Library (66 | 10.4%), and Health Technologists (60 | 9.5%).
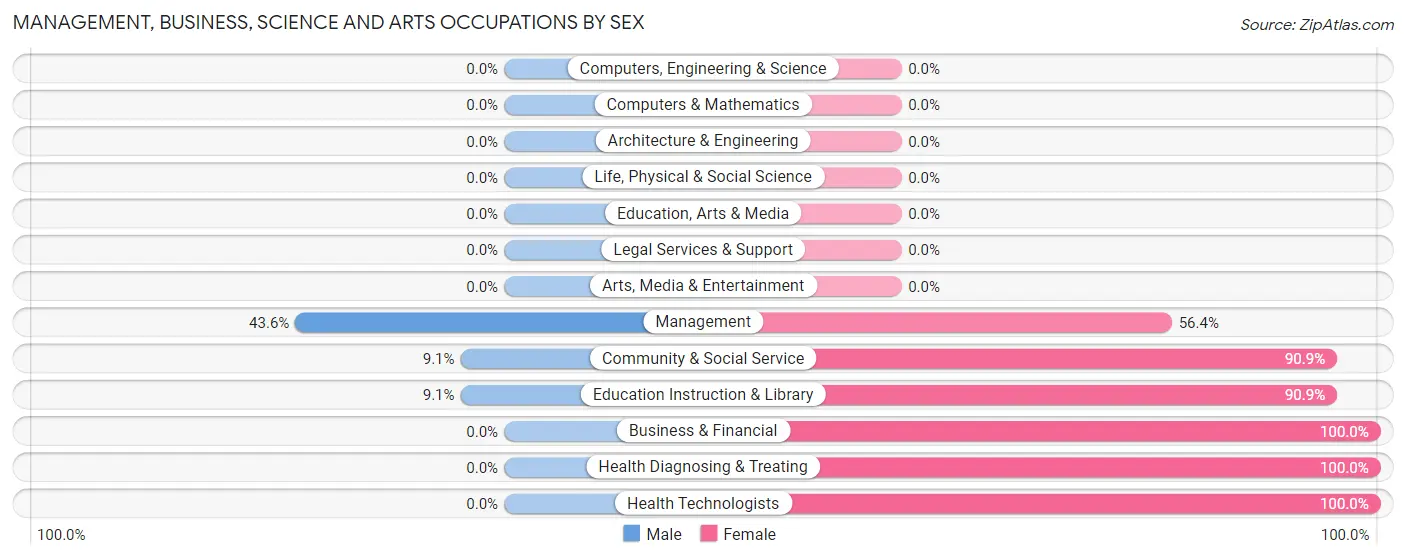
Management, Business, Science and Arts Occupations by Sex
Within the Management, Business, Science and Arts occupations in Frenchtown, the most male-oriented occupations are Management (43.6%), Community & Social Service (9.1%), and Education Instruction & Library (9.1%), while the most female-oriented occupations are Business & Financial (100.0%), Health Diagnosing & Treating (100.0%), and Health Technologists (100.0%).
| Occupation | Male | Female |
| Management | 44 (43.6%) | 57 (56.4%) |
| Business & Financial | 0 (0.0%) | 15 (100.0%) |
| Computers, Engineering & Science | 0 (0.0%) | 0 (0.0%) |
| Computers & Mathematics | 0 (0.0%) | 0 (0.0%) |
| Architecture & Engineering | 0 (0.0%) | 0 (0.0%) |
| Life, Physical & Social Science | 0 (0.0%) | 0 (0.0%) |
| Community & Social Service | 6 (9.1%) | 60 (90.9%) |
| Education, Arts & Media | 0 (0.0%) | 0 (0.0%) |
| Legal Services & Support | 0 (0.0%) | 0 (0.0%) |
| Education Instruction & Library | 6 (9.1%) | 60 (90.9%) |
| Arts, Media & Entertainment | 0 (0.0%) | 0 (0.0%) |
| Health Diagnosing & Treating | 0 (0.0%) | 77 (100.0%) |
| Health Technologists | 0 (0.0%) | 60 (100.0%) |
| Total (Category) | 50 (19.3%) | 209 (80.7%) |
| Total (Overall) | 349 (55.0%) | 285 (45.0%) |
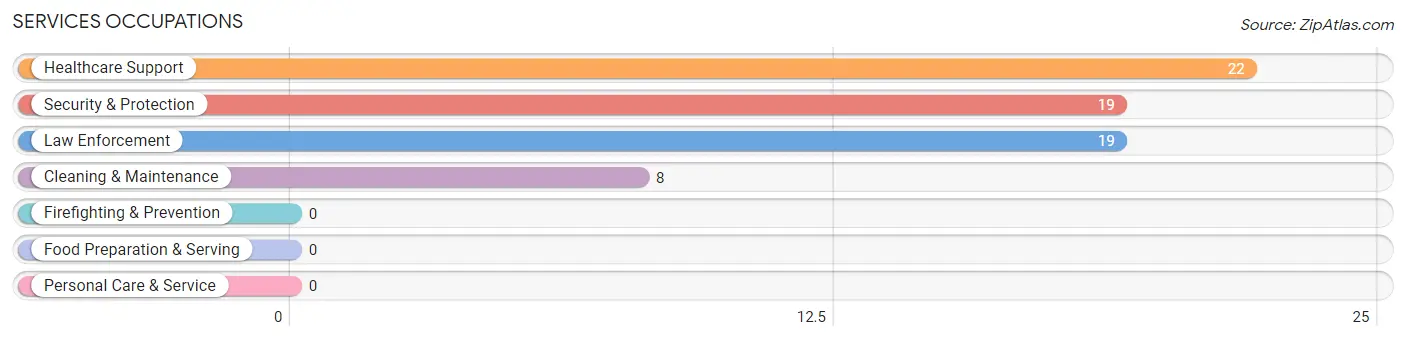
Services Occupations
The most common Services occupations in Frenchtown are Healthcare Support (22 | 3.5%), Security & Protection (19 | 3.0%), Law Enforcement (19 | 3.0%), and Cleaning & Maintenance (8 | 1.3%).
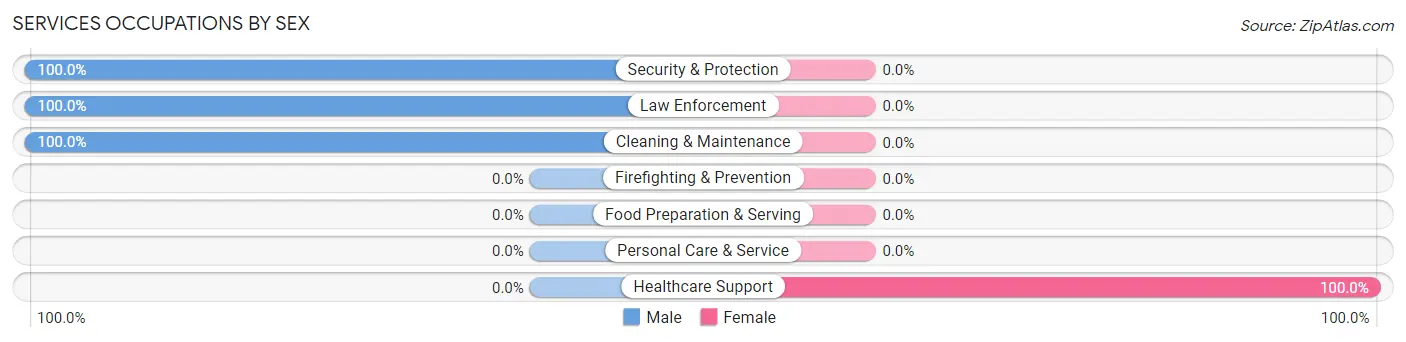
Services Occupations by Sex
| Occupation | Male | Female |
| Healthcare Support | 0 (0.0%) | 22 (100.0%) |
| Security & Protection | 19 (100.0%) | 0 (0.0%) |
| Firefighting & Prevention | 0 (0.0%) | 0 (0.0%) |
| Law Enforcement | 19 (100.0%) | 0 (0.0%) |
| Food Preparation & Serving | 0 (0.0%) | 0 (0.0%) |
| Cleaning & Maintenance | 8 (100.0%) | 0 (0.0%) |
| Personal Care & Service | 0 (0.0%) | 0 (0.0%) |
| Total (Category) | 27 (55.1%) | 22 (44.9%) |
| Total (Overall) | 349 (55.0%) | 285 (45.0%) |
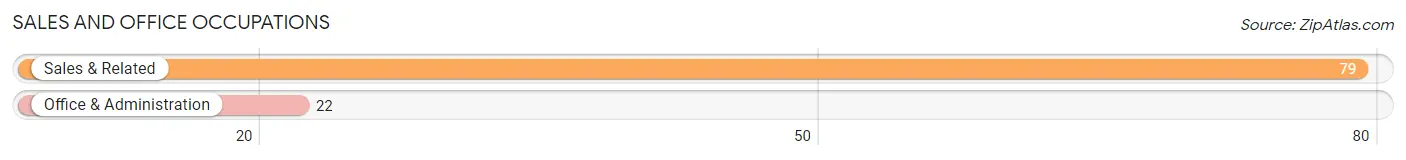
Sales and Office Occupations
The most common Sales and Office occupations in Frenchtown are Sales & Related (79 | 12.5%), and Office & Administration (22 | 3.5%).
Sales and Office Occupations by Sex
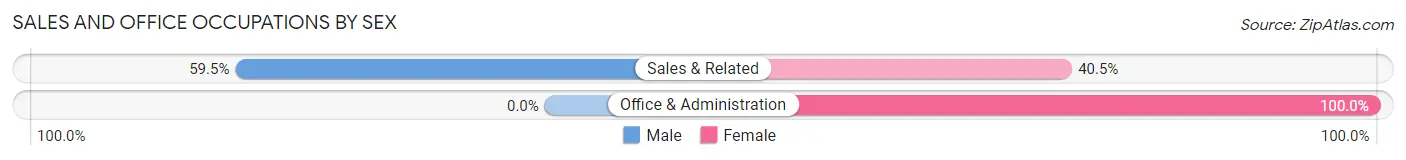
| Occupation | Male | Female |
| Sales & Related | 47 (59.5%) | 32 (40.5%) |
| Office & Administration | 0 (0.0%) | 22 (100.0%) |
| Total (Category) | 47 (46.5%) | 54 (53.5%) |
| Total (Overall) | 349 (55.0%) | 285 (45.0%) |
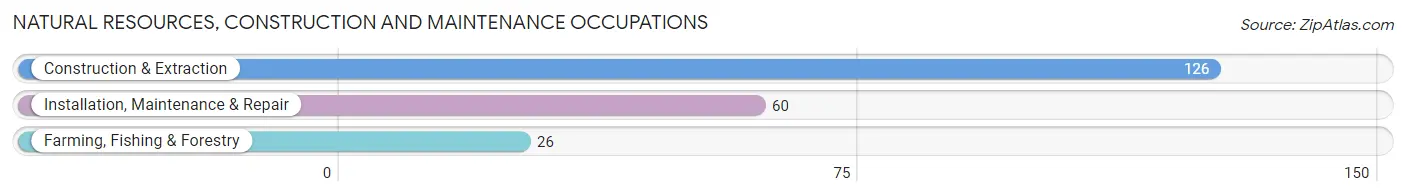
Natural Resources, Construction and Maintenance Occupations
The most common Natural Resources, Construction and Maintenance occupations in Frenchtown are Construction & Extraction (126 | 19.9%), Installation, Maintenance & Repair (60 | 9.5%), and Farming, Fishing & Forestry (26 | 4.1%).
Natural Resources, Construction and Maintenance Occupations by Sex
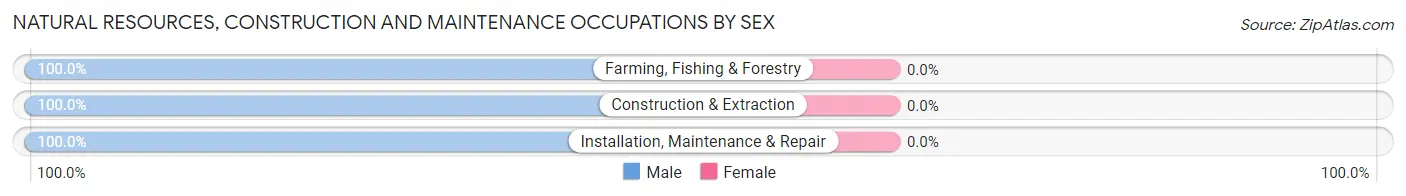
| Occupation | Male | Female |
| Farming, Fishing & Forestry | 26 (100.0%) | 0 (0.0%) |
| Construction & Extraction | 126 (100.0%) | 0 (0.0%) |
| Installation, Maintenance & Repair | 60 (100.0%) | 0 (0.0%) |
| Total (Category) | 212 (100.0%) | 0 (0.0%) |
| Total (Overall) | 349 (55.0%) | 285 (45.0%) |
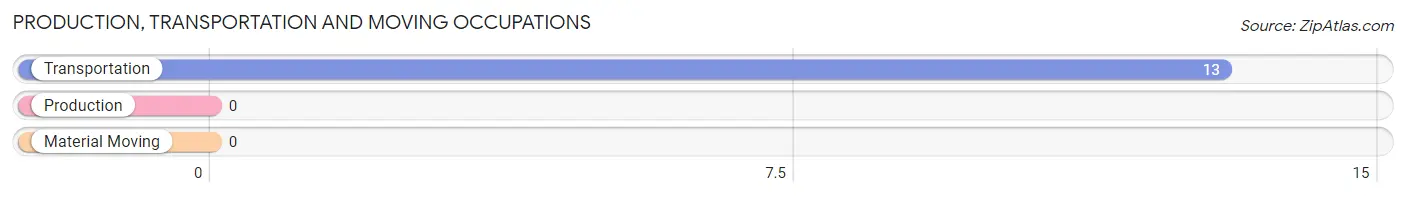
Production, Transportation and Moving Occupations
The most common Production, Transportation and Moving occupations in Frenchtown are , and Transportation (13 | 2.1%).
Production, Transportation and Moving Occupations by Sex
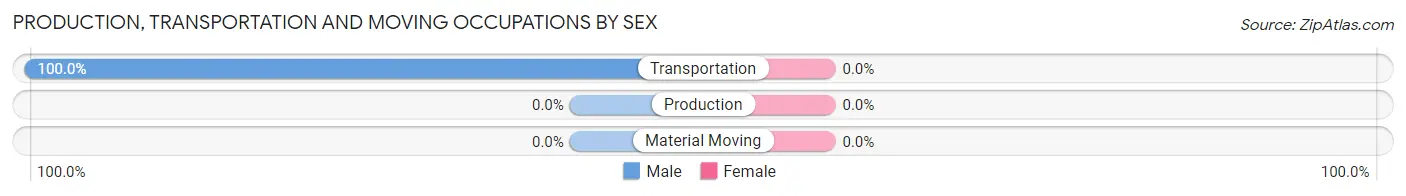
| Occupation | Male | Female |
| Production | 0 (0.0%) | 0 (0.0%) |
| Transportation | 13 (100.0%) | 0 (0.0%) |
| Material Moving | 0 (0.0%) | 0 (0.0%) |
| Total (Category) | 13 (100.0%) | 0 (0.0%) |
| Total (Overall) | 349 (55.0%) | 285 (45.0%) |
Employment Industries by Sex in Frenchtown
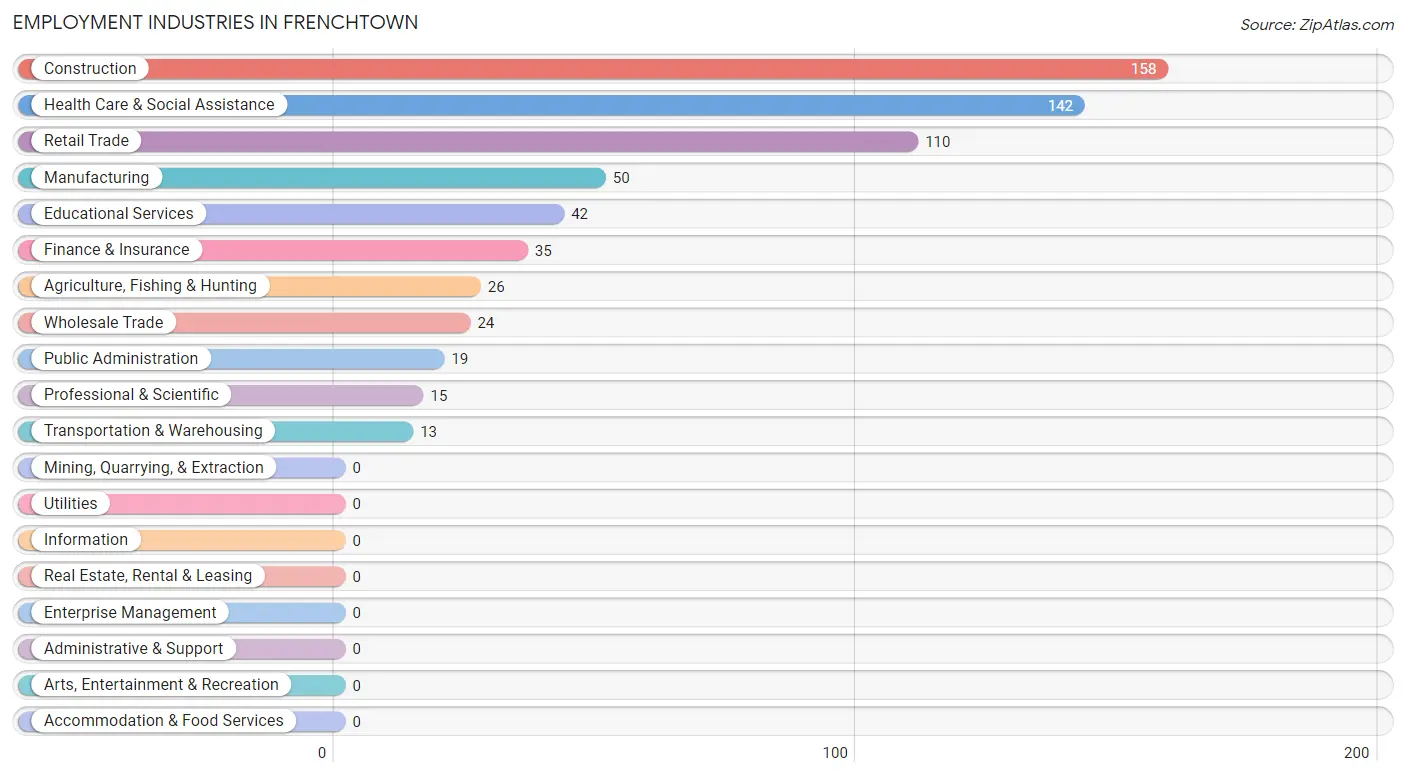
Employment Industries in Frenchtown
The major employment industries in Frenchtown include Construction (158 | 24.9%), Health Care & Social Assistance (142 | 22.4%), Retail Trade (110 | 17.3%), Manufacturing (50 | 7.9%), and Educational Services (42 | 6.6%).
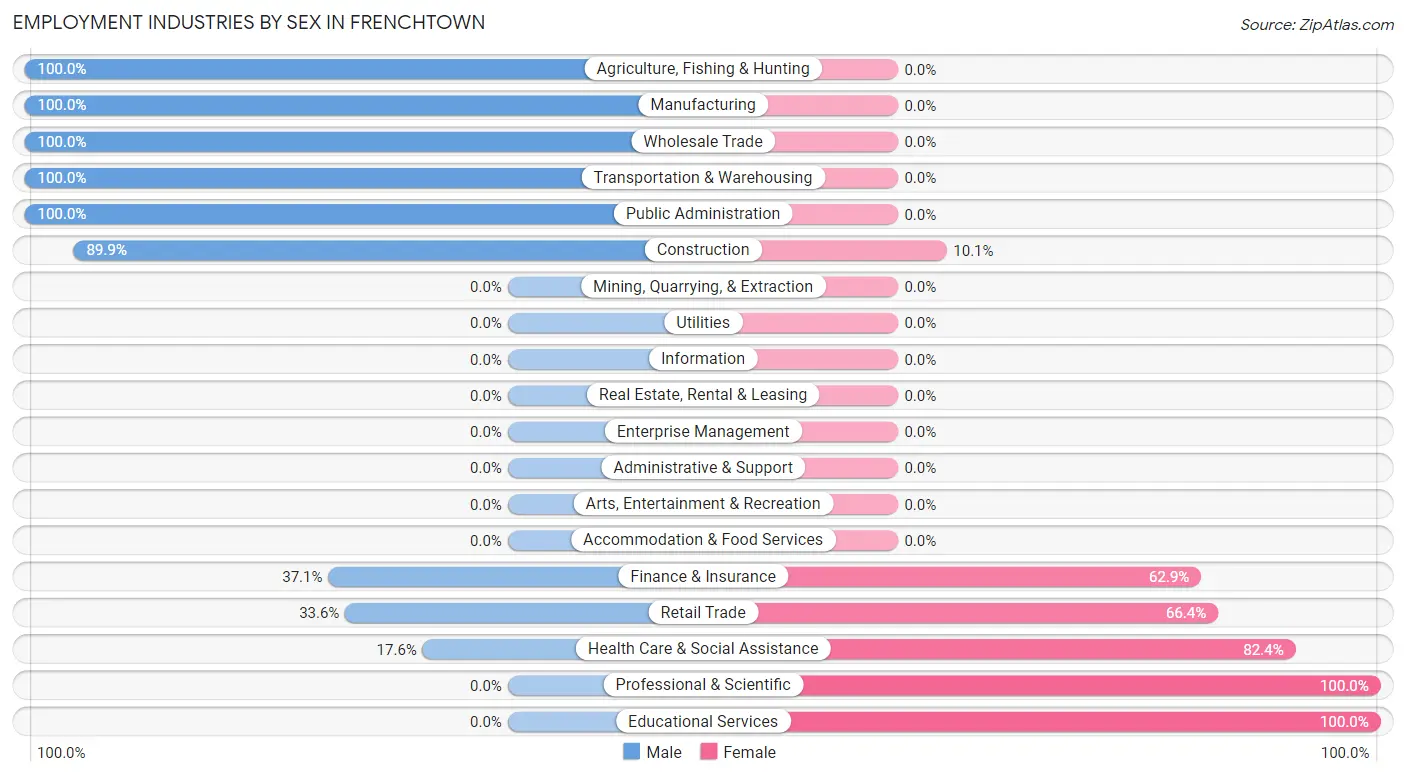
Employment Industries by Sex in Frenchtown
The Frenchtown industries that see more men than women are Agriculture, Fishing & Hunting (100.0%), Manufacturing (100.0%), and Wholesale Trade (100.0%), whereas the industries that tend to have a higher number of women are Professional & Scientific (100.0%), Educational Services (100.0%), and Health Care & Social Assistance (82.4%).
| Industry | Male | Female |
| Agriculture, Fishing & Hunting | 26 (100.0%) | 0 (0.0%) |
| Mining, Quarrying, & Extraction | 0 (0.0%) | 0 (0.0%) |
| Construction | 142 (89.9%) | 16 (10.1%) |
| Manufacturing | 50 (100.0%) | 0 (0.0%) |
| Wholesale Trade | 24 (100.0%) | 0 (0.0%) |
| Retail Trade | 37 (33.6%) | 73 (66.4%) |
| Transportation & Warehousing | 13 (100.0%) | 0 (0.0%) |
| Utilities | 0 (0.0%) | 0 (0.0%) |
| Information | 0 (0.0%) | 0 (0.0%) |
| Finance & Insurance | 13 (37.1%) | 22 (62.9%) |
| Real Estate, Rental & Leasing | 0 (0.0%) | 0 (0.0%) |
| Professional & Scientific | 0 (0.0%) | 15 (100.0%) |
| Enterprise Management | 0 (0.0%) | 0 (0.0%) |
| Administrative & Support | 0 (0.0%) | 0 (0.0%) |
| Educational Services | 0 (0.0%) | 42 (100.0%) |
| Health Care & Social Assistance | 25 (17.6%) | 117 (82.4%) |
| Arts, Entertainment & Recreation | 0 (0.0%) | 0 (0.0%) |
| Accommodation & Food Services | 0 (0.0%) | 0 (0.0%) |
| Public Administration | 19 (100.0%) | 0 (0.0%) |
| Total | 349 (55.0%) | 285 (45.0%) |
Education in Frenchtown
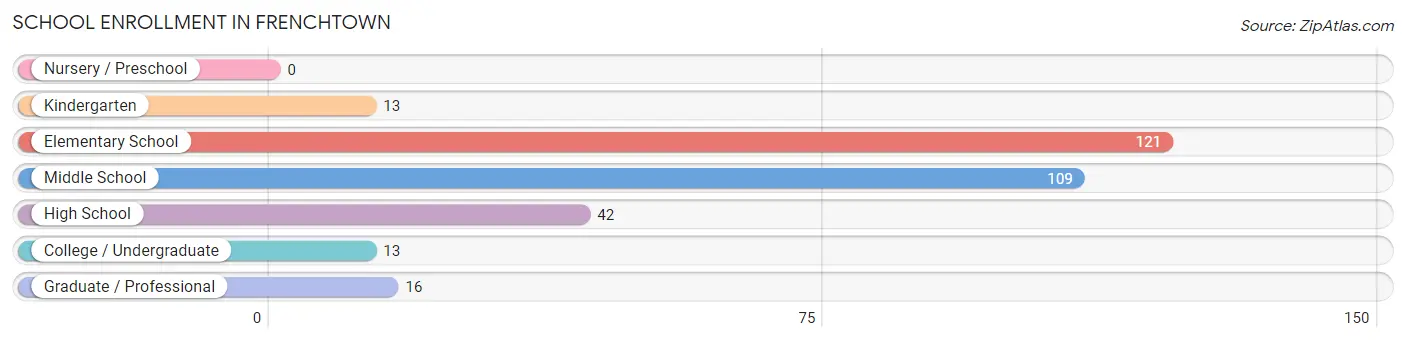
School Enrollment in Frenchtown
The most common levels of schooling among the 314 students in Frenchtown are elementary school (121 | 38.5%), middle school (109 | 34.7%), and high school (42 | 13.4%).
| School Level | # Students | % Students |
| Nursery / Preschool | 0 | 0.0% |
| Kindergarten | 13 | 4.1% |
| Elementary School | 121 | 38.5% |
| Middle School | 109 | 34.7% |
| High School | 42 | 13.4% |
| College / Undergraduate | 13 | 4.1% |
| Graduate / Professional | 16 | 5.1% |
| Total | 314 | 100.0% |
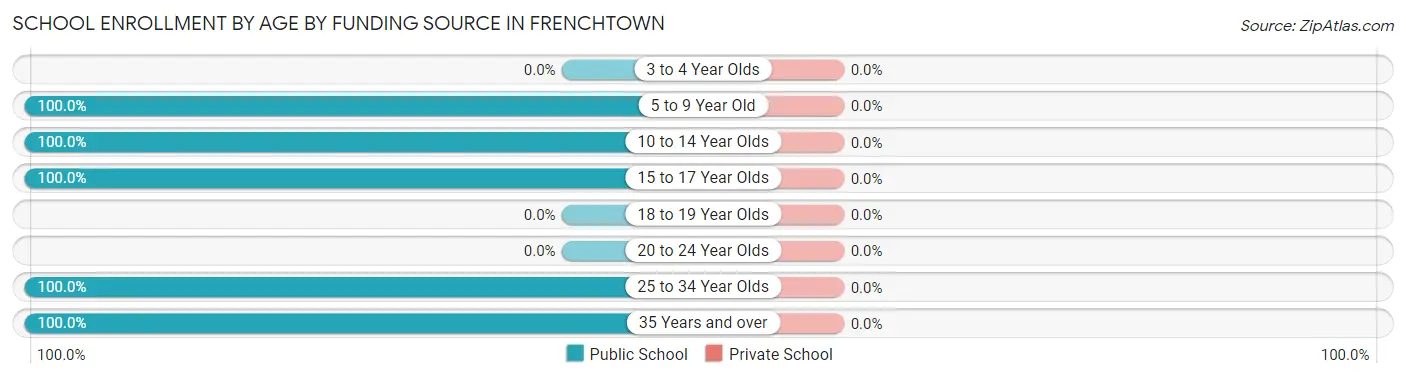
School Enrollment by Age by Funding Source in Frenchtown
| Age Bracket | Public School | Private School |
| 3 to 4 Year Olds | 0 (0.0%) | 0 (0.0%) |
| 5 to 9 Year Old | 134 (100.0%) | 0 (0.0%) |
| 10 to 14 Year Olds | 109 (100.0%) | 0 (0.0%) |
| 15 to 17 Year Olds | 42 (100.0%) | 0 (0.0%) |
| 18 to 19 Year Olds | 0 (0.0%) | 0 (0.0%) |
| 20 to 24 Year Olds | 0 (0.0%) | 0 (0.0%) |
| 25 to 34 Year Olds | 13 (100.0%) | 0 (0.0%) |
| 35 Years and over | 16 (100.0%) | 0 (0.0%) |
| Total | 314 (100.0%) | 0 (0.0%) |
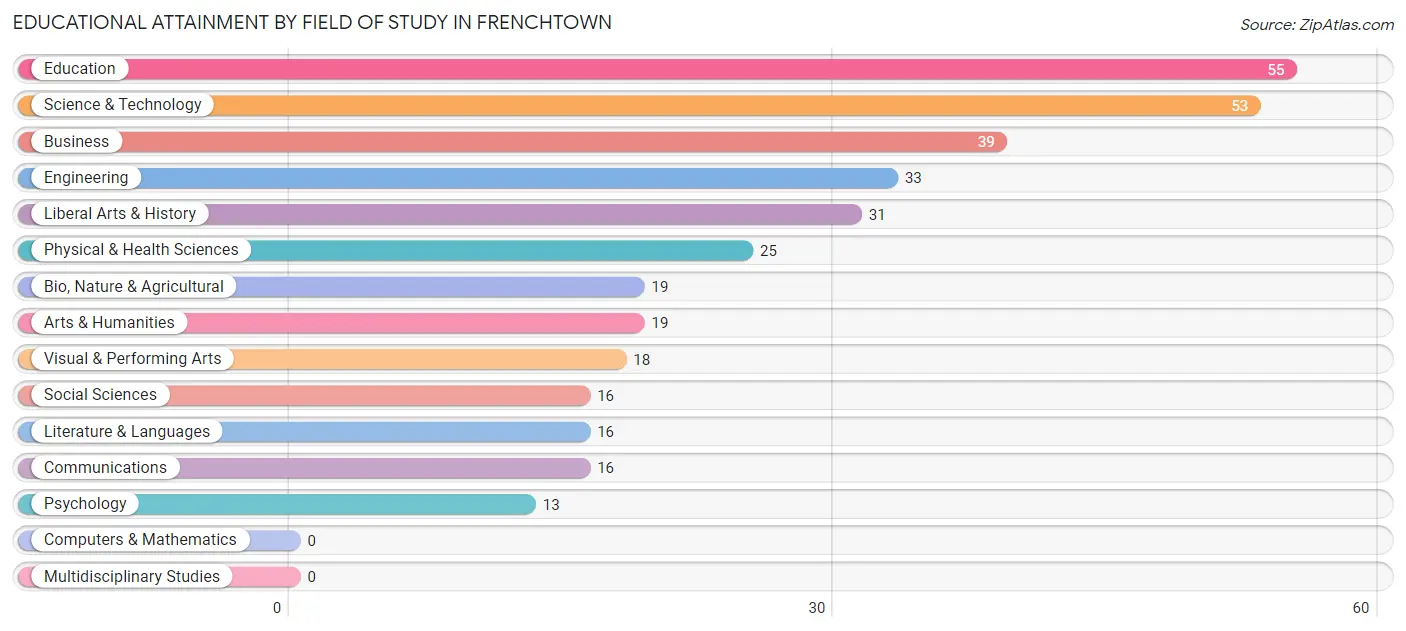
Educational Attainment by Field of Study in Frenchtown
Education (55 | 15.6%), science & technology (53 | 15.0%), business (39 | 11.1%), engineering (33 | 9.3%), and liberal arts & history (31 | 8.8%) are the most common fields of study among 353 individuals in Frenchtown who have obtained a bachelor's degree or higher.
| Field of Study | # Graduates | % Graduates |
| Computers & Mathematics | 0 | 0.0% |
| Bio, Nature & Agricultural | 19 | 5.4% |
| Physical & Health Sciences | 25 | 7.1% |
| Psychology | 13 | 3.7% |
| Social Sciences | 16 | 4.5% |
| Engineering | 33 | 9.3% |
| Multidisciplinary Studies | 0 | 0.0% |
| Science & Technology | 53 | 15.0% |
| Business | 39 | 11.1% |
| Education | 55 | 15.6% |
| Literature & Languages | 16 | 4.5% |
| Liberal Arts & History | 31 | 8.8% |
| Visual & Performing Arts | 18 | 5.1% |
| Communications | 16 | 4.5% |
| Arts & Humanities | 19 | 5.4% |
| Total | 353 | 100.0% |
Transportation & Commute in Frenchtown
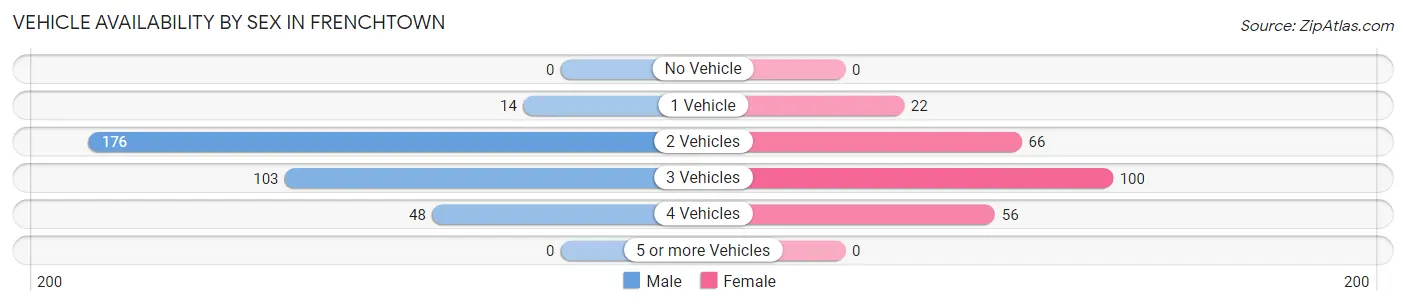
Vehicle Availability by Sex in Frenchtown
The most prevalent vehicle ownership categories in Frenchtown are males with 2 vehicles (176, accounting for 51.6%) and females with 2 vehicles (66, making up 72.1%).
| Vehicles Available | Male | Female |
| No Vehicle | 0 (0.0%) | 0 (0.0%) |
| 1 Vehicle | 14 (4.1%) | 22 (9.0%) |
| 2 Vehicles | 176 (51.6%) | 66 (27.1%) |
| 3 Vehicles | 103 (30.2%) | 100 (41.0%) |
| 4 Vehicles | 48 (14.1%) | 56 (23.0%) |
| 5 or more Vehicles | 0 (0.0%) | 0 (0.0%) |
| Total | 341 (100.0%) | 244 (100.0%) |
Commute Time in Frenchtown
The most frequently occuring commute durations in Frenchtown are 30 to 34 minutes (206 commuters, 34.7%), 20 to 24 minutes (94 commuters, 15.9%), and 15 to 19 minutes (64 commuters, 10.8%).
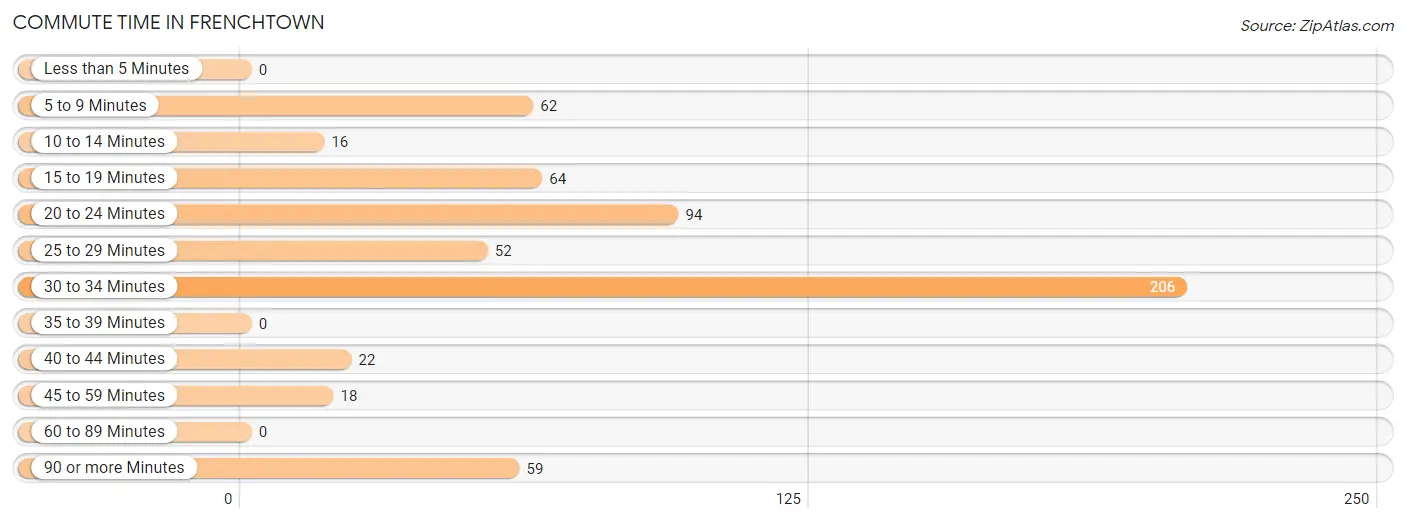
| Commute Time | # Commuters | % Commuters |
| Less than 5 Minutes | 0 | 0.0% |
| 5 to 9 Minutes | 62 | 10.5% |
| 10 to 14 Minutes | 16 | 2.7% |
| 15 to 19 Minutes | 64 | 10.8% |
| 20 to 24 Minutes | 94 | 15.9% |
| 25 to 29 Minutes | 52 | 8.8% |
| 30 to 34 Minutes | 206 | 34.7% |
| 35 to 39 Minutes | 0 | 0.0% |
| 40 to 44 Minutes | 22 | 3.7% |
| 45 to 59 Minutes | 18 | 3.0% |
| 60 to 89 Minutes | 0 | 0.0% |
| 90 or more Minutes | 59 | 10.0% |
Commute Time by Sex in Frenchtown
The most common commute times in Frenchtown are 30 to 34 minutes (130 commuters, 37.2%) for males and 30 to 34 minutes (76 commuters, 31.1%) for females.
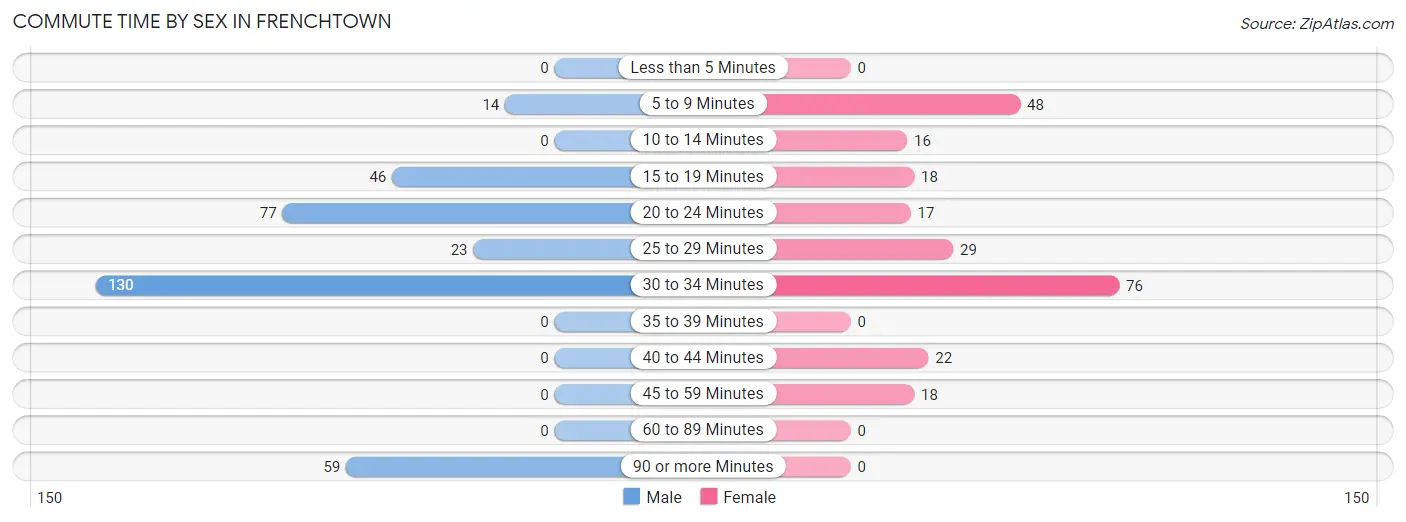
| Commute Time | Male | Female |
| Less than 5 Minutes | 0 (0.0%) | 0 (0.0%) |
| 5 to 9 Minutes | 14 (4.0%) | 48 (19.7%) |
| 10 to 14 Minutes | 0 (0.0%) | 16 (6.6%) |
| 15 to 19 Minutes | 46 (13.2%) | 18 (7.4%) |
| 20 to 24 Minutes | 77 (22.1%) | 17 (7.0%) |
| 25 to 29 Minutes | 23 (6.6%) | 29 (11.9%) |
| 30 to 34 Minutes | 130 (37.2%) | 76 (31.1%) |
| 35 to 39 Minutes | 0 (0.0%) | 0 (0.0%) |
| 40 to 44 Minutes | 0 (0.0%) | 22 (9.0%) |
| 45 to 59 Minutes | 0 (0.0%) | 18 (7.4%) |
| 60 to 89 Minutes | 0 (0.0%) | 0 (0.0%) |
| 90 or more Minutes | 59 (16.9%) | 0 (0.0%) |
Time of Departure to Work by Sex in Frenchtown
The most frequent times of departure to work in Frenchtown are 7:00 AM to 7:29 AM (87, 24.9%) for males and 7:00 AM to 7:29 AM (55, 22.5%) for females.
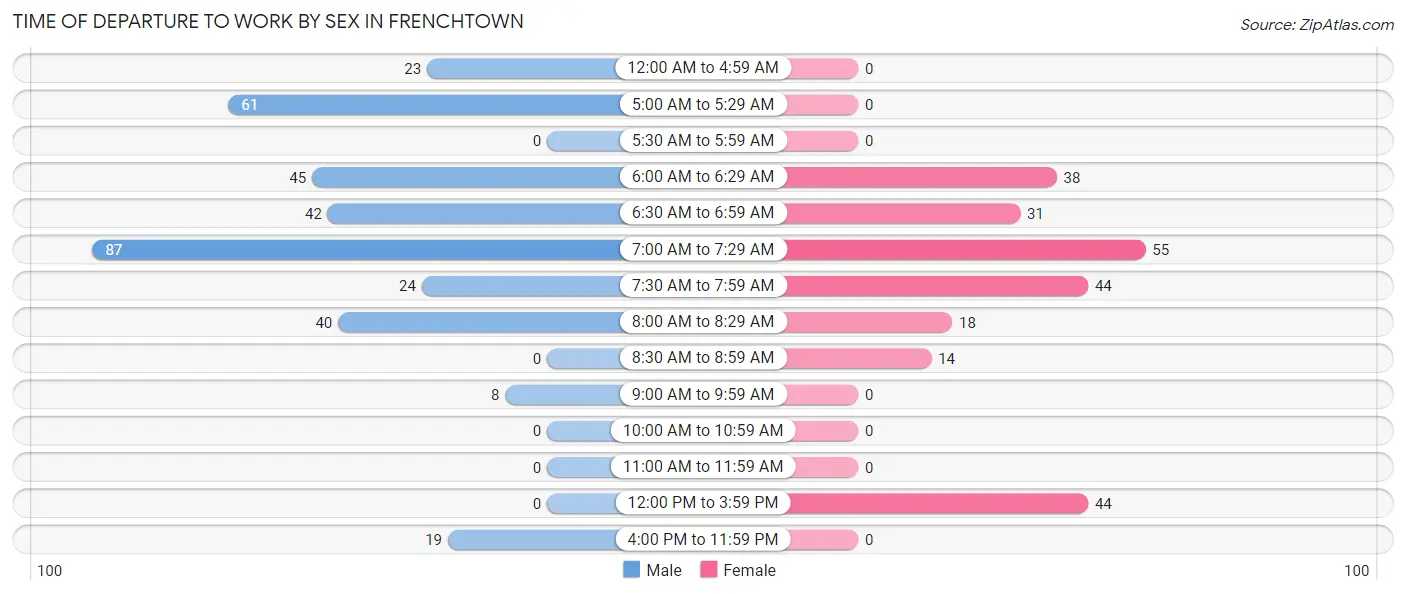
| Time of Departure | Male | Female |
| 12:00 AM to 4:59 AM | 23 (6.6%) | 0 (0.0%) |
| 5:00 AM to 5:29 AM | 61 (17.5%) | 0 (0.0%) |
| 5:30 AM to 5:59 AM | 0 (0.0%) | 0 (0.0%) |
| 6:00 AM to 6:29 AM | 45 (12.9%) | 38 (15.6%) |
| 6:30 AM to 6:59 AM | 42 (12.0%) | 31 (12.7%) |
| 7:00 AM to 7:29 AM | 87 (24.9%) | 55 (22.5%) |
| 7:30 AM to 7:59 AM | 24 (6.9%) | 44 (18.0%) |
| 8:00 AM to 8:29 AM | 40 (11.5%) | 18 (7.4%) |
| 8:30 AM to 8:59 AM | 0 (0.0%) | 14 (5.7%) |
| 9:00 AM to 9:59 AM | 8 (2.3%) | 0 (0.0%) |
| 10:00 AM to 10:59 AM | 0 (0.0%) | 0 (0.0%) |
| 11:00 AM to 11:59 AM | 0 (0.0%) | 0 (0.0%) |
| 12:00 PM to 3:59 PM | 0 (0.0%) | 44 (18.0%) |
| 4:00 PM to 11:59 PM | 19 (5.4%) | 0 (0.0%) |
| Total | 349 (100.0%) | 244 (100.0%) |
Housing Occupancy in Frenchtown
Occupancy by Ownership in Frenchtown
Of the total 606 dwellings in Frenchtown, owner-occupied units account for 485 (80.0%), while renter-occupied units make up 121 (20.0%).
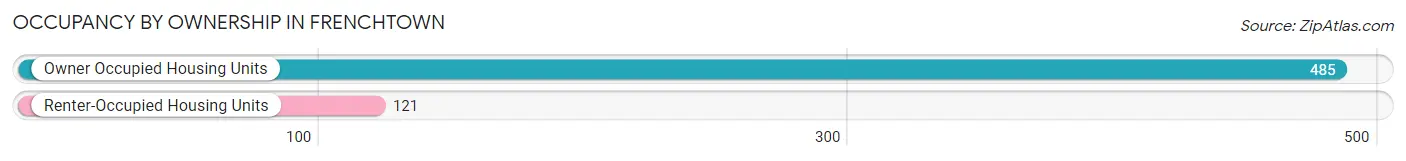
| Occupancy | # Housing Units | % Housing Units |
| Owner Occupied Housing Units | 485 | 80.0% |
| Renter-Occupied Housing Units | 121 | 20.0% |
| Total Occupied Housing Units | 606 | 100.0% |
Occupancy by Household Size in Frenchtown
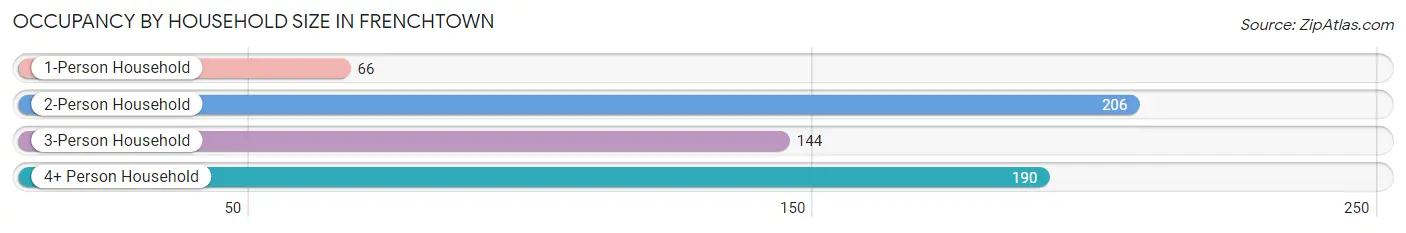
| Household Size | # Housing Units | % Housing Units |
| 1-Person Household | 66 | 10.9% |
| 2-Person Household | 206 | 34.0% |
| 3-Person Household | 144 | 23.8% |
| 4+ Person Household | 190 | 31.4% |
| Total Housing Units | 606 | 100.0% |
Occupancy by Ownership by Household Size in Frenchtown
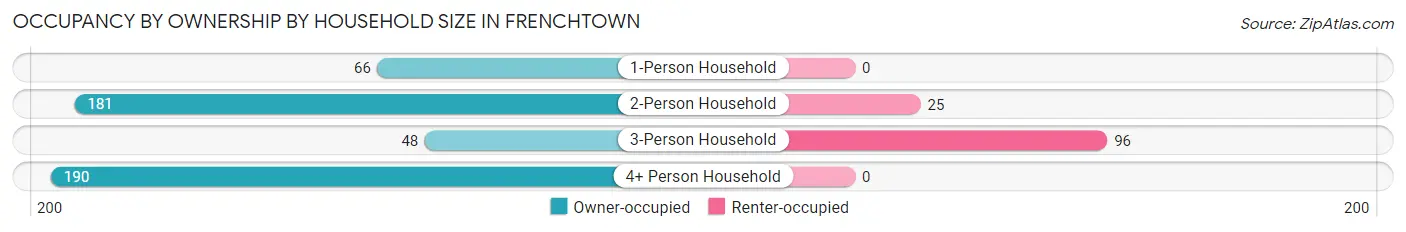
| Household Size | Owner-occupied | Renter-occupied |
| 1-Person Household | 66 (100.0%) | 0 (0.0%) |
| 2-Person Household | 181 (87.9%) | 25 (12.1%) |
| 3-Person Household | 48 (33.3%) | 96 (66.7%) |
| 4+ Person Household | 190 (100.0%) | 0 (0.0%) |
| Total Housing Units | 485 (80.0%) | 121 (20.0%) |
Occupancy by Educational Attainment in Frenchtown
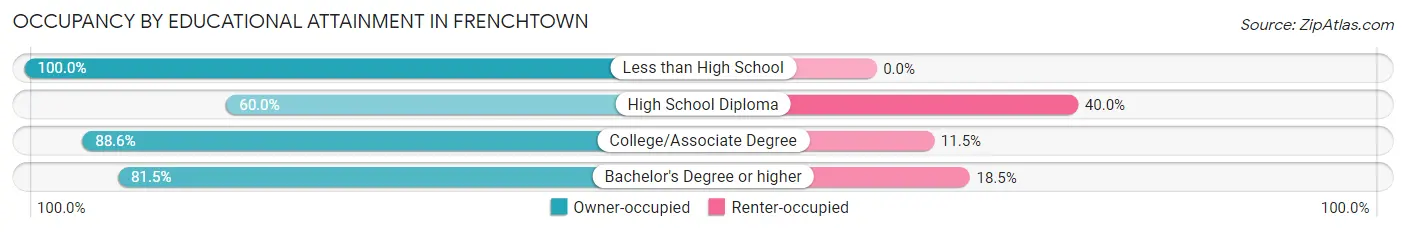
| Household Size | Owner-occupied | Renter-occupied |
| Less than High School | 44 (100.0%) | 0 (0.0%) |
| High School Diploma | 99 (60.0%) | 66 (40.0%) |
| College/Associate Degree | 232 (88.5%) | 30 (11.5%) |
| Bachelor's Degree or higher | 110 (81.5%) | 25 (18.5%) |
Occupancy by Age of Householder in Frenchtown
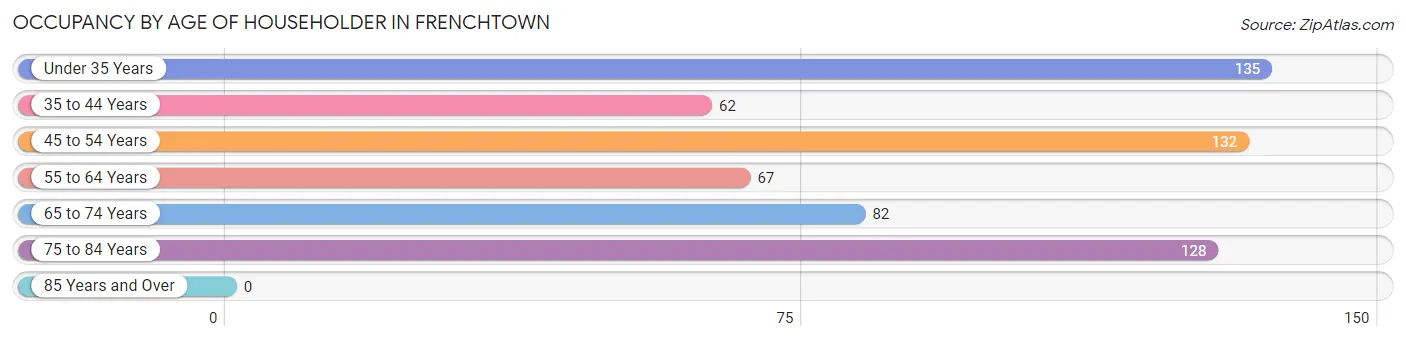
| Age Bracket | # Households | % Households |
| Under 35 Years | 135 | 22.3% |
| 35 to 44 Years | 62 | 10.2% |
| 45 to 54 Years | 132 | 21.8% |
| 55 to 64 Years | 67 | 11.1% |
| 65 to 74 Years | 82 | 13.5% |
| 75 to 84 Years | 128 | 21.1% |
| 85 Years and Over | 0 | 0.0% |
| Total | 606 | 100.0% |
Housing Finances in Frenchtown
Median Income by Occupancy in Frenchtown
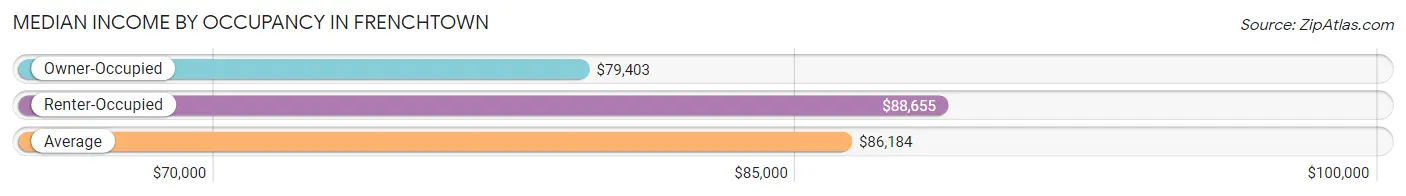
| Occupancy Type | # Households | Median Income |
| Owner-Occupied | 485 (80.0%) | $79,403 |
| Renter-Occupied | 121 (20.0%) | $88,655 |
| Average | 606 (100.0%) | $86,184 |
Occupancy by Householder Income Bracket in Frenchtown
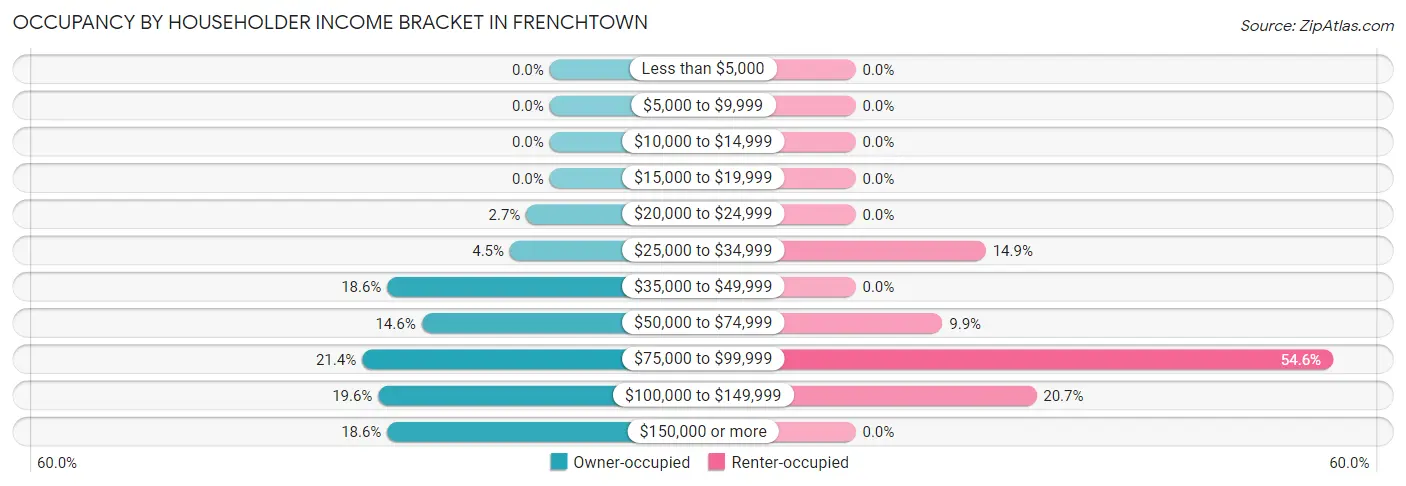
| Income Bracket | Owner-occupied | Renter-occupied |
| Less than $5,000 | 0 (0.0%) | 0 (0.0%) |
| $5,000 to $9,999 | 0 (0.0%) | 0 (0.0%) |
| $10,000 to $14,999 | 0 (0.0%) | 0 (0.0%) |
| $15,000 to $19,999 | 0 (0.0%) | 0 (0.0%) |
| $20,000 to $24,999 | 13 (2.7%) | 0 (0.0%) |
| $25,000 to $34,999 | 22 (4.5%) | 18 (14.9%) |
| $35,000 to $49,999 | 90 (18.6%) | 0 (0.0%) |
| $50,000 to $74,999 | 71 (14.6%) | 12 (9.9%) |
| $75,000 to $99,999 | 104 (21.4%) | 66 (54.5%) |
| $100,000 to $149,999 | 95 (19.6%) | 25 (20.7%) |
| $150,000 or more | 90 (18.6%) | 0 (0.0%) |
| Total | 485 (100.0%) | 121 (100.0%) |
Monthly Housing Cost Tiers in Frenchtown
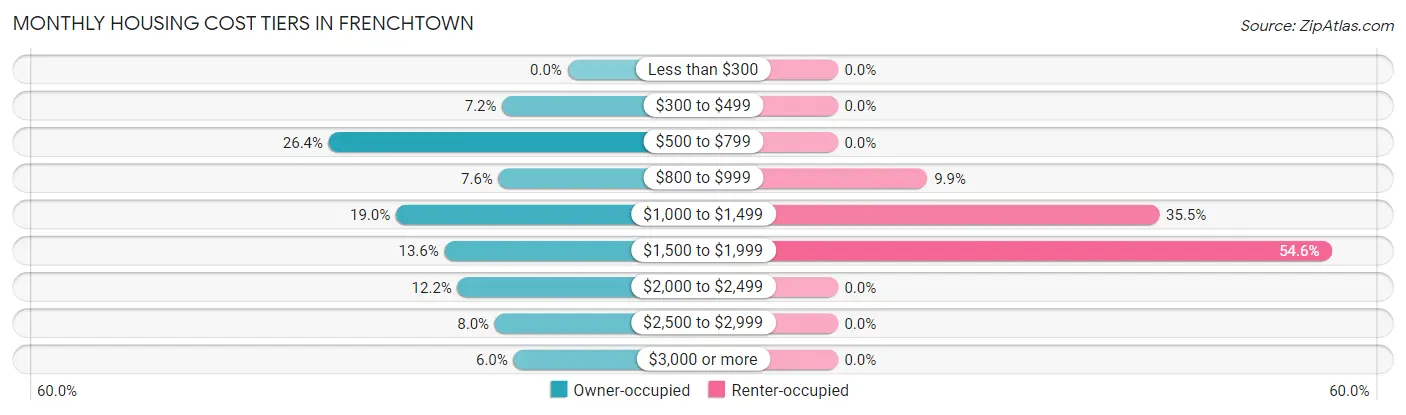
| Monthly Cost | Owner-occupied | Renter-occupied |
| Less than $300 | 0 (0.0%) | 0 (0.0%) |
| $300 to $499 | 35 (7.2%) | 0 (0.0%) |
| $500 to $799 | 128 (26.4%) | 0 (0.0%) |
| $800 to $999 | 37 (7.6%) | 12 (9.9%) |
| $1,000 to $1,499 | 92 (19.0%) | 43 (35.5%) |
| $1,500 to $1,999 | 66 (13.6%) | 66 (54.5%) |
| $2,000 to $2,499 | 59 (12.2%) | 0 (0.0%) |
| $2,500 to $2,999 | 39 (8.0%) | 0 (0.0%) |
| $3,000 or more | 29 (6.0%) | 0 (0.0%) |
| Total | 485 (100.0%) | 121 (100.0%) |
Physical Housing Characteristics in Frenchtown
Housing Structures in Frenchtown
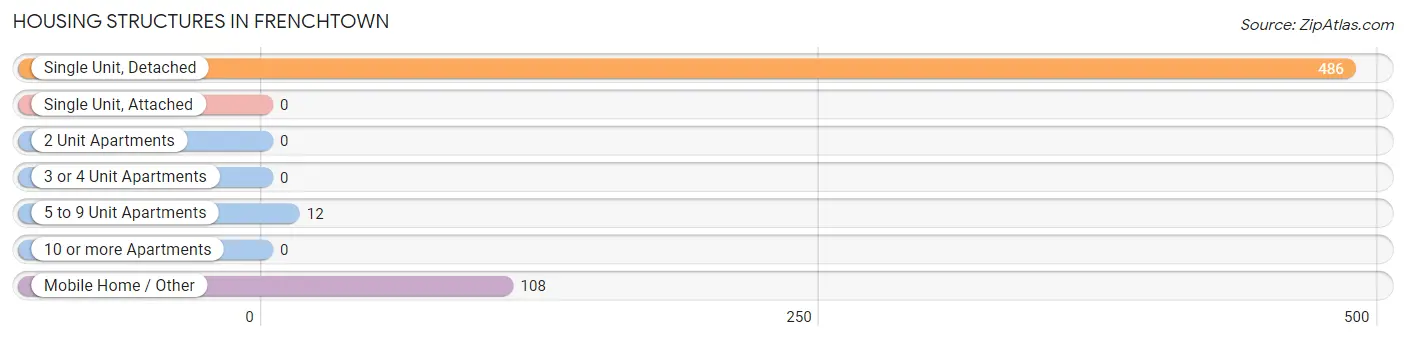
| Structure Type | # Housing Units | % Housing Units |
| Single Unit, Detached | 486 | 80.2% |
| Single Unit, Attached | 0 | 0.0% |
| 2 Unit Apartments | 0 | 0.0% |
| 3 or 4 Unit Apartments | 0 | 0.0% |
| 5 to 9 Unit Apartments | 12 | 2.0% |
| 10 or more Apartments | 0 | 0.0% |
| Mobile Home / Other | 108 | 17.8% |
| Total | 606 | 100.0% |
Housing Structures by Occupancy in Frenchtown
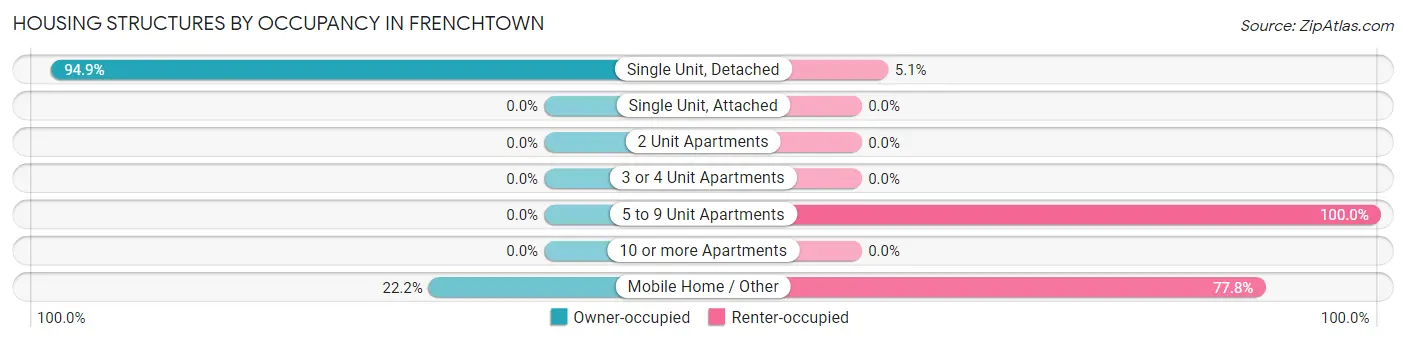
| Structure Type | Owner-occupied | Renter-occupied |
| Single Unit, Detached | 461 (94.9%) | 25 (5.1%) |
| Single Unit, Attached | 0 (0.0%) | 0 (0.0%) |
| 2 Unit Apartments | 0 (0.0%) | 0 (0.0%) |
| 3 or 4 Unit Apartments | 0 (0.0%) | 0 (0.0%) |
| 5 to 9 Unit Apartments | 0 (0.0%) | 12 (100.0%) |
| 10 or more Apartments | 0 (0.0%) | 0 (0.0%) |
| Mobile Home / Other | 24 (22.2%) | 84 (77.8%) |
| Total | 485 (80.0%) | 121 (20.0%) |
Housing Structures by Number of Rooms in Frenchtown
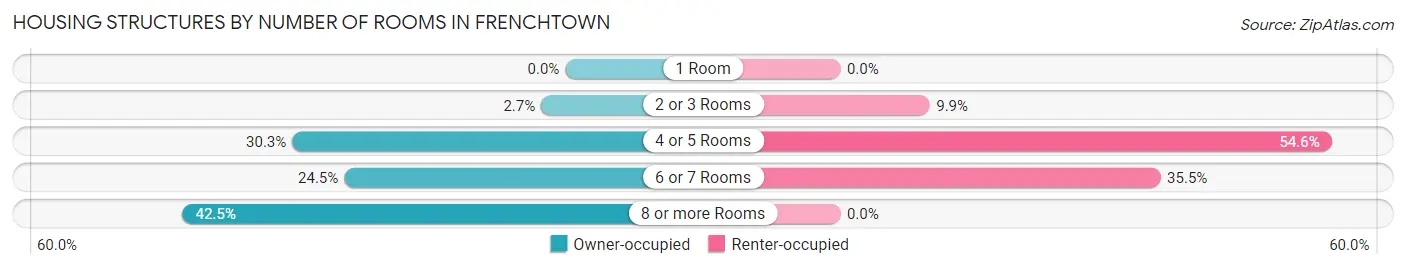
| Number of Rooms | Owner-occupied | Renter-occupied |
| 1 Room | 0 (0.0%) | 0 (0.0%) |
| 2 or 3 Rooms | 13 (2.7%) | 12 (9.9%) |
| 4 or 5 Rooms | 147 (30.3%) | 66 (54.5%) |
| 6 or 7 Rooms | 119 (24.5%) | 43 (35.5%) |
| 8 or more Rooms | 206 (42.5%) | 0 (0.0%) |
| Total | 485 (100.0%) | 121 (100.0%) |
Housing Structure by Heating Type in Frenchtown
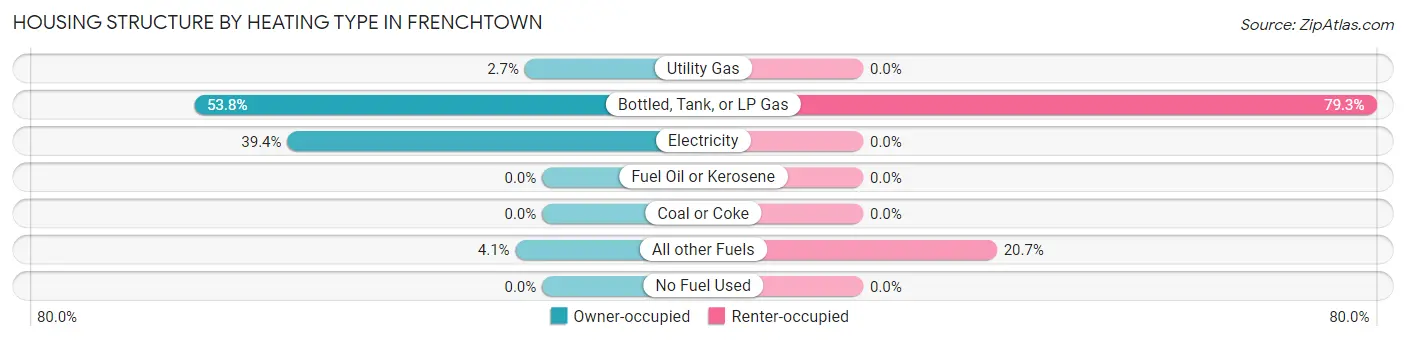
| Heating Type | Owner-occupied | Renter-occupied |
| Utility Gas | 13 (2.7%) | 0 (0.0%) |
| Bottled, Tank, or LP Gas | 261 (53.8%) | 96 (79.3%) |
| Electricity | 191 (39.4%) | 0 (0.0%) |
| Fuel Oil or Kerosene | 0 (0.0%) | 0 (0.0%) |
| Coal or Coke | 0 (0.0%) | 0 (0.0%) |
| All other Fuels | 20 (4.1%) | 25 (20.7%) |
| No Fuel Used | 0 (0.0%) | 0 (0.0%) |
| Total | 485 (100.0%) | 121 (100.0%) |
Household Vehicle Usage in Frenchtown
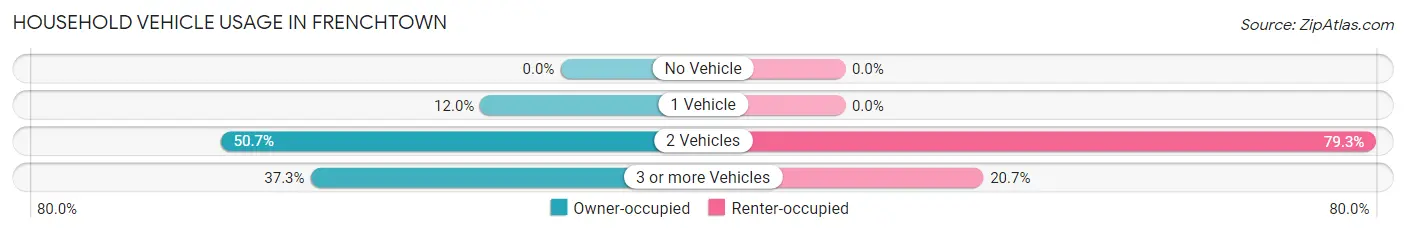
| Vehicles per Household | Owner-occupied | Renter-occupied |
| No Vehicle | 0 (0.0%) | 0 (0.0%) |
| 1 Vehicle | 58 (12.0%) | 0 (0.0%) |
| 2 Vehicles | 246 (50.7%) | 96 (79.3%) |
| 3 or more Vehicles | 181 (37.3%) | 25 (20.7%) |
| Total | 485 (100.0%) | 121 (100.0%) |
Real Estate & Mortgages in Frenchtown
Real Estate and Mortgage Overview in Frenchtown
| Characteristic | Without Mortgage | With Mortgage |
| Housing Units | 220 | 265 |
| Median Property Value | $247,700 | $416,400 |
| Median Household Income | $64,750 | $66 |
| Monthly Housing Costs | $749 | $29 |
| Real Estate Taxes | $3,259 | $0 |
Property Value by Mortgage Status in Frenchtown
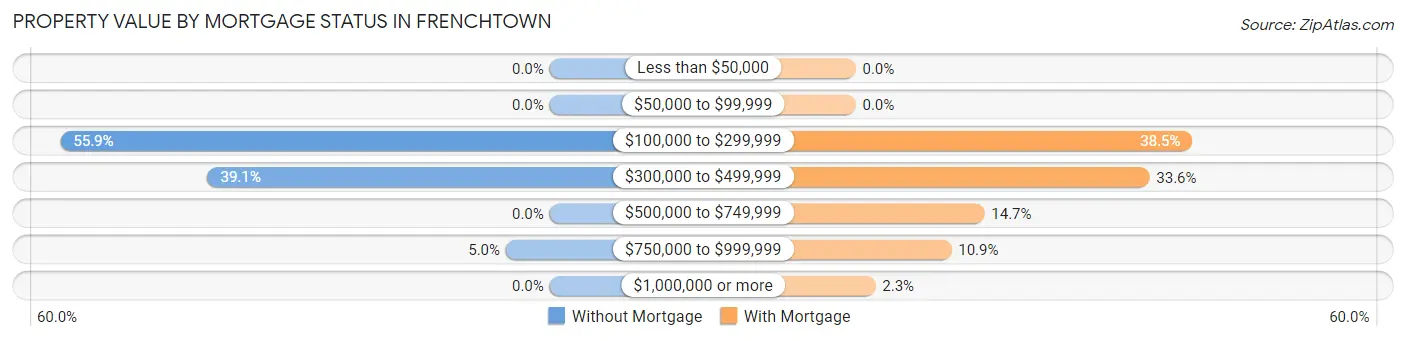
| Property Value | Without Mortgage | With Mortgage |
| Less than $50,000 | 0 (0.0%) | 0 (0.0%) |
| $50,000 to $99,999 | 0 (0.0%) | 0 (0.0%) |
| $100,000 to $299,999 | 123 (55.9%) | 102 (38.5%) |
| $300,000 to $499,999 | 86 (39.1%) | 89 (33.6%) |
| $500,000 to $749,999 | 0 (0.0%) | 39 (14.7%) |
| $750,000 to $999,999 | 11 (5.0%) | 29 (10.9%) |
| $1,000,000 or more | 0 (0.0%) | 6 (2.3%) |
| Total | 220 (100.0%) | 265 (100.0%) |
Household Income by Mortgage Status in Frenchtown
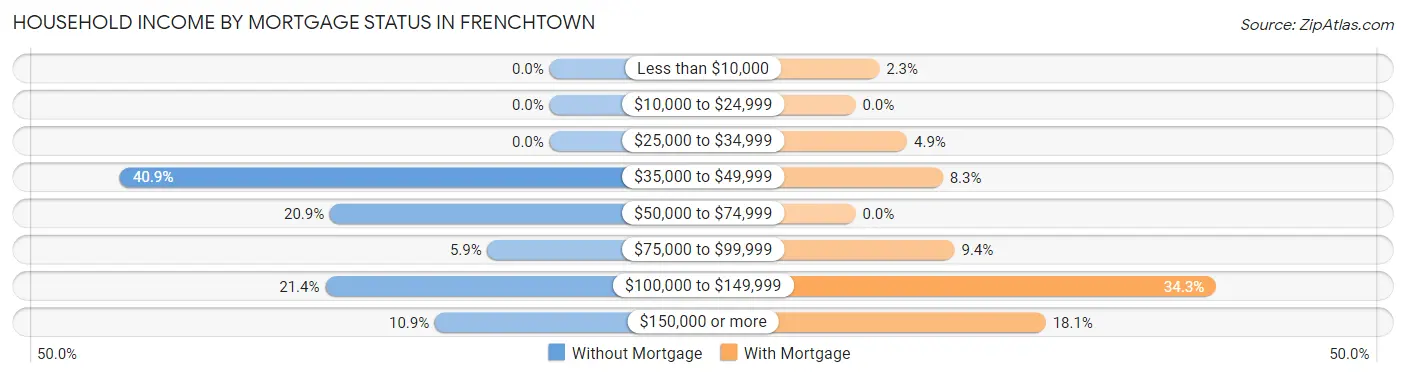
| Household Income | Without Mortgage | With Mortgage |
| Less than $10,000 | 0 (0.0%) | 6 (2.3%) |
| $10,000 to $24,999 | 0 (0.0%) | 0 (0.0%) |
| $25,000 to $34,999 | 0 (0.0%) | 13 (4.9%) |
| $35,000 to $49,999 | 90 (40.9%) | 22 (8.3%) |
| $50,000 to $74,999 | 46 (20.9%) | 0 (0.0%) |
| $75,000 to $99,999 | 13 (5.9%) | 25 (9.4%) |
| $100,000 to $149,999 | 47 (21.4%) | 91 (34.3%) |
| $150,000 or more | 24 (10.9%) | 48 (18.1%) |
| Total | 220 (100.0%) | 265 (100.0%) |
Property Value to Household Income Ratio in Frenchtown
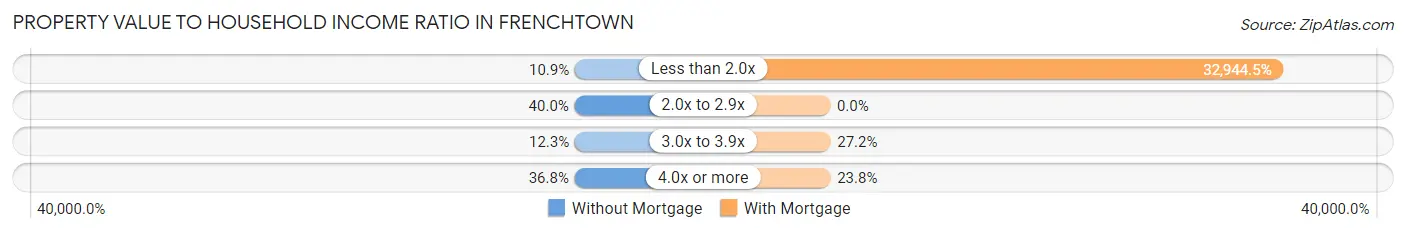
| Value-to-Income Ratio | Without Mortgage | With Mortgage |
| Less than 2.0x | 24 (10.9%) | 87,303 (32,944.5%) |
| 2.0x to 2.9x | 88 (40.0%) | 0 (0.0%) |
| 3.0x to 3.9x | 27 (12.3%) | 72 (27.2%) |
| 4.0x or more | 81 (36.8%) | 63 (23.8%) |
| Total | 220 (100.0%) | 265 (100.0%) |
Real Estate Taxes by Mortgage Status in Frenchtown
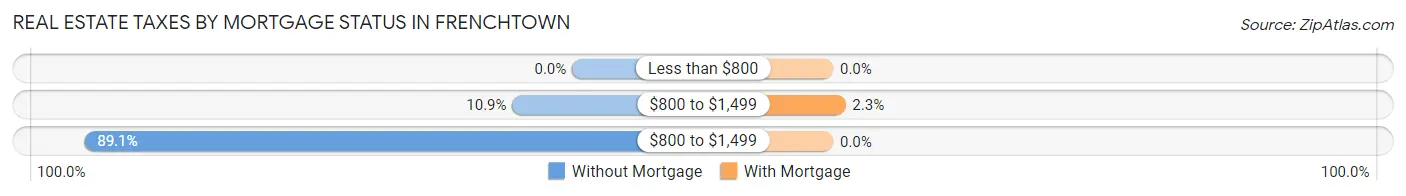
| Property Taxes | Without Mortgage | With Mortgage |
| Less than $800 | 0 (0.0%) | 0 (0.0%) |
| $800 to $1,499 | 24 (10.9%) | 6 (2.3%) |
| $800 to $1,499 | 196 (89.1%) | 0 (0.0%) |
| Total | 220 (100.0%) | 265 (100.0%) |
Health & Disability in Frenchtown
Health Insurance Coverage by Age in Frenchtown
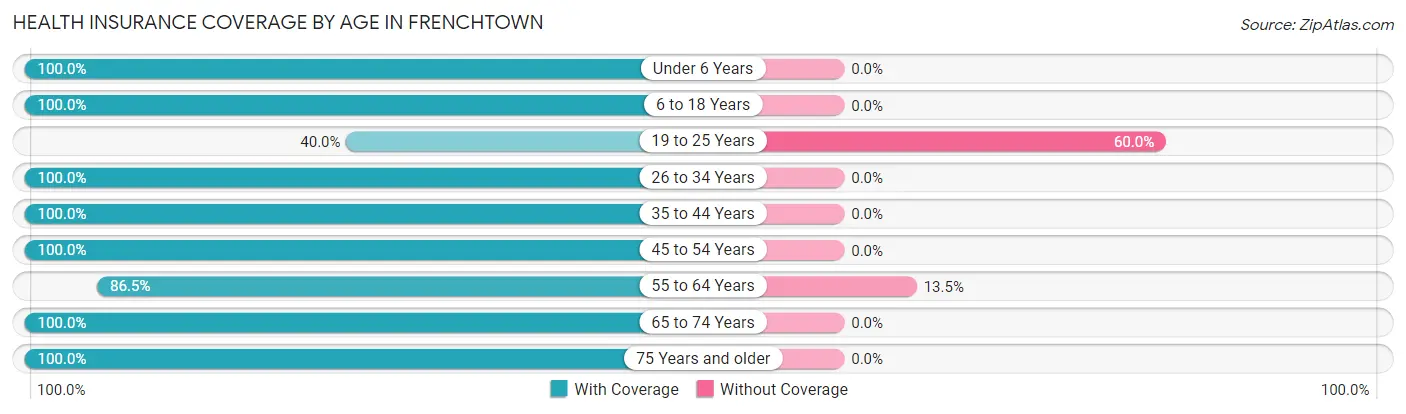
| Age Bracket | With Coverage | Without Coverage |
| Under 6 Years | 209 (100.0%) | 0 (0.0%) |
| 6 to 18 Years | 285 (100.0%) | 0 (0.0%) |
| 19 to 25 Years | 44 (40.0%) | 66 (60.0%) |
| 26 to 34 Years | 101 (100.0%) | 0 (0.0%) |
| 35 to 44 Years | 139 (100.0%) | 0 (0.0%) |
| 45 to 54 Years | 222 (100.0%) | 0 (0.0%) |
| 55 to 64 Years | 96 (86.5%) | 15 (13.5%) |
| 65 to 74 Years | 210 (100.0%) | 0 (0.0%) |
| 75 Years and older | 183 (100.0%) | 0 (0.0%) |
| Total | 1,489 (94.8%) | 81 (5.2%) |
Health Insurance Coverage by Citizenship Status in Frenchtown
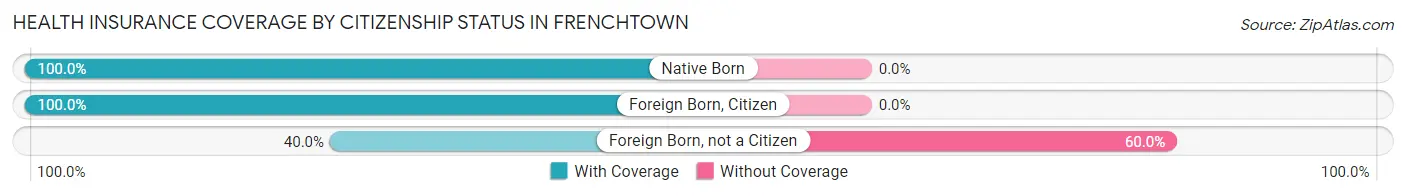
| Citizenship Status | With Coverage | Without Coverage |
| Native Born | 209 (100.0%) | 0 (0.0%) |
| Foreign Born, Citizen | 285 (100.0%) | 0 (0.0%) |
| Foreign Born, not a Citizen | 44 (40.0%) | 66 (60.0%) |
Health Insurance Coverage by Household Income in Frenchtown
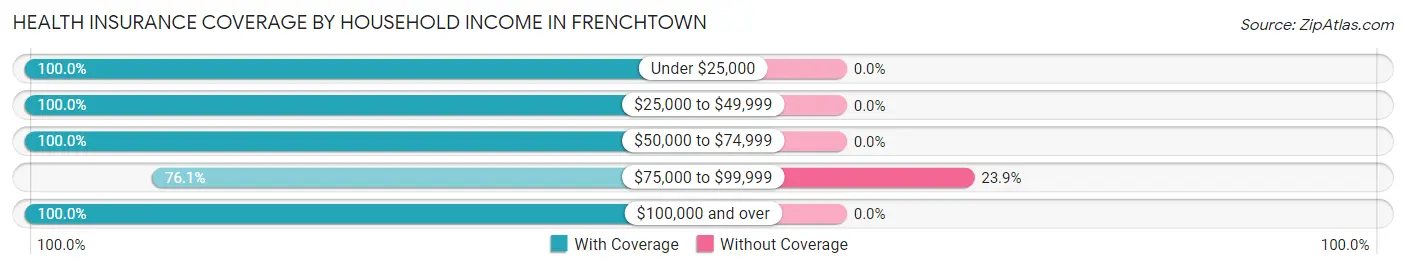
| Household Income | With Coverage | Without Coverage |
| Under $25,000 | 64 (100.0%) | 0 (0.0%) |
| $25,000 to $49,999 | 273 (100.0%) | 0 (0.0%) |
| $50,000 to $74,999 | 217 (100.0%) | 0 (0.0%) |
| $75,000 to $99,999 | 258 (76.1%) | 81 (23.9%) |
| $100,000 and over | 669 (100.0%) | 0 (0.0%) |
Public vs Private Health Insurance Coverage by Age in Frenchtown
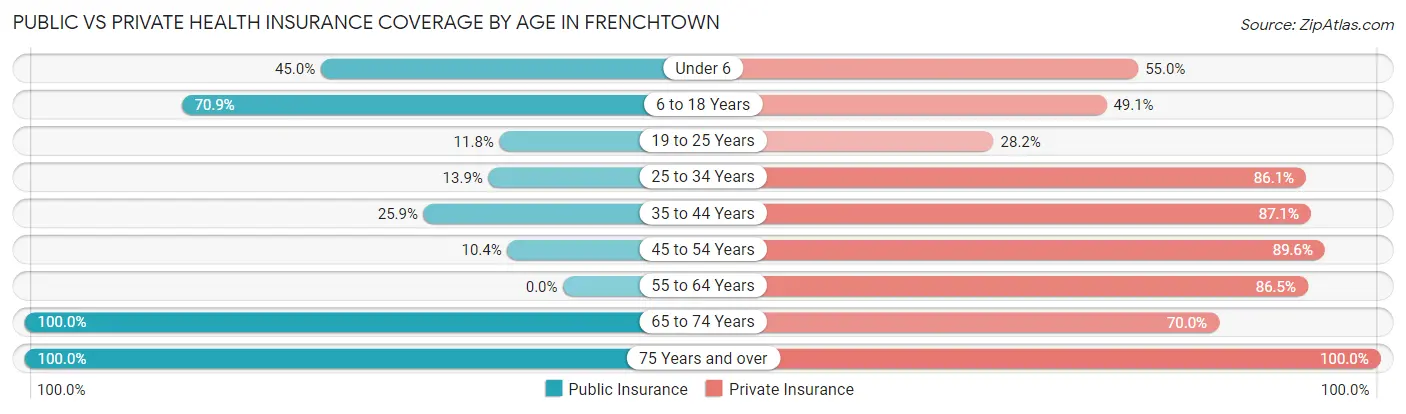
| Age Bracket | Public Insurance | Private Insurance |
| Under 6 | 94 (45.0%) | 115 (55.0%) |
| 6 to 18 Years | 202 (70.9%) | 140 (49.1%) |
| 19 to 25 Years | 13 (11.8%) | 31 (28.2%) |
| 25 to 34 Years | 14 (13.9%) | 87 (86.1%) |
| 35 to 44 Years | 36 (25.9%) | 121 (87.1%) |
| 45 to 54 Years | 23 (10.4%) | 199 (89.6%) |
| 55 to 64 Years | 0 (0.0%) | 96 (86.5%) |
| 65 to 74 Years | 210 (100.0%) | 147 (70.0%) |
| 75 Years and over | 183 (100.0%) | 183 (100.0%) |
| Total | 775 (49.4%) | 1,119 (71.3%) |
Disability Status by Sex by Age in Frenchtown
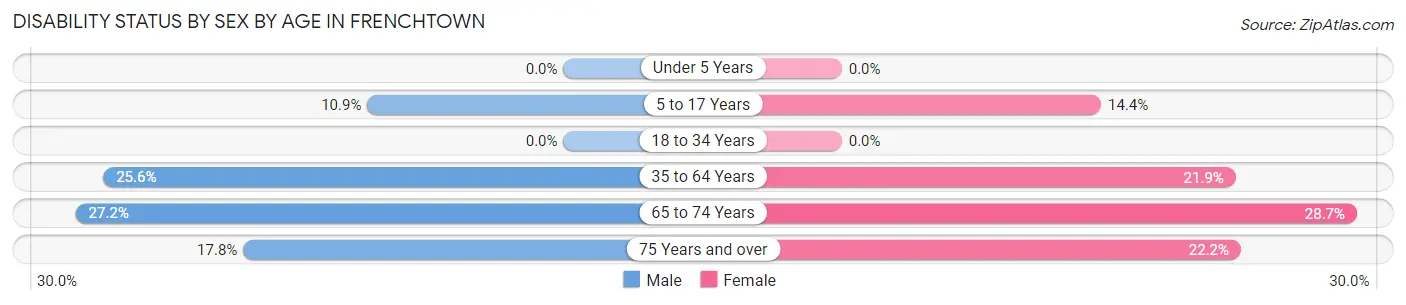
| Age Bracket | Male | Female |
| Under 5 Years | 0 (0.0%) | 0 (0.0%) |
| 5 to 17 Years | 13 (10.9%) | 26 (14.4%) |
| 18 to 34 Years | 0 (0.0%) | 0 (0.0%) |
| 35 to 64 Years | 52 (25.6%) | 59 (21.9%) |
| 65 to 74 Years | 22 (27.2%) | 37 (28.7%) |
| 75 Years and over | 23 (17.8%) | 12 (22.2%) |
Disability Class by Sex by Age in Frenchtown
Disability Class: Hearing Difficulty
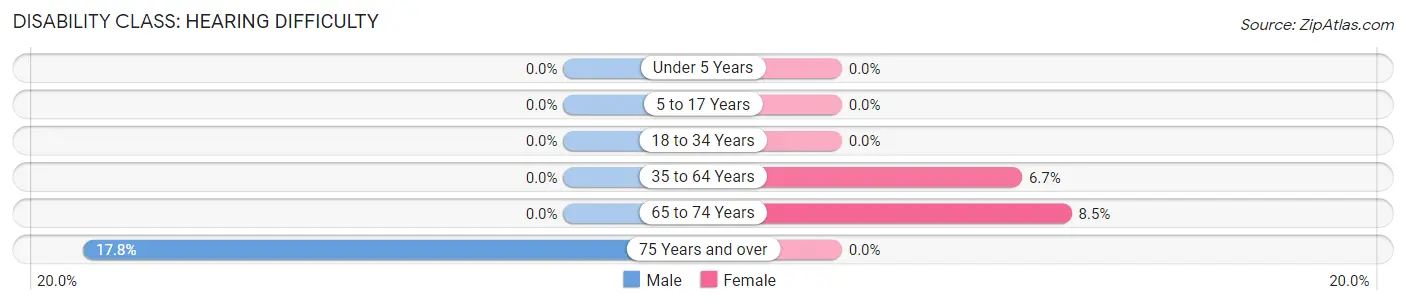
| Age Bracket | Male | Female |
| Under 5 Years | 0 (0.0%) | 0 (0.0%) |
| 5 to 17 Years | 0 (0.0%) | 0 (0.0%) |
| 18 to 34 Years | 0 (0.0%) | 0 (0.0%) |
| 35 to 64 Years | 0 (0.0%) | 18 (6.7%) |
| 65 to 74 Years | 0 (0.0%) | 11 (8.5%) |
| 75 Years and over | 23 (17.8%) | 0 (0.0%) |
Disability Class: Vision Difficulty
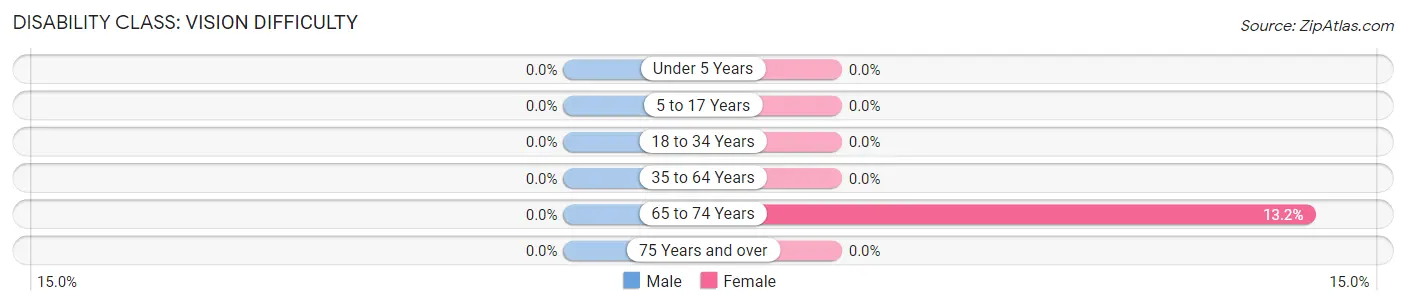
| Age Bracket | Male | Female |
| Under 5 Years | 0 (0.0%) | 0 (0.0%) |
| 5 to 17 Years | 0 (0.0%) | 0 (0.0%) |
| 18 to 34 Years | 0 (0.0%) | 0 (0.0%) |
| 35 to 64 Years | 0 (0.0%) | 0 (0.0%) |
| 65 to 74 Years | 0 (0.0%) | 17 (13.2%) |
| 75 Years and over | 0 (0.0%) | 0 (0.0%) |
Disability Class: Cognitive Difficulty
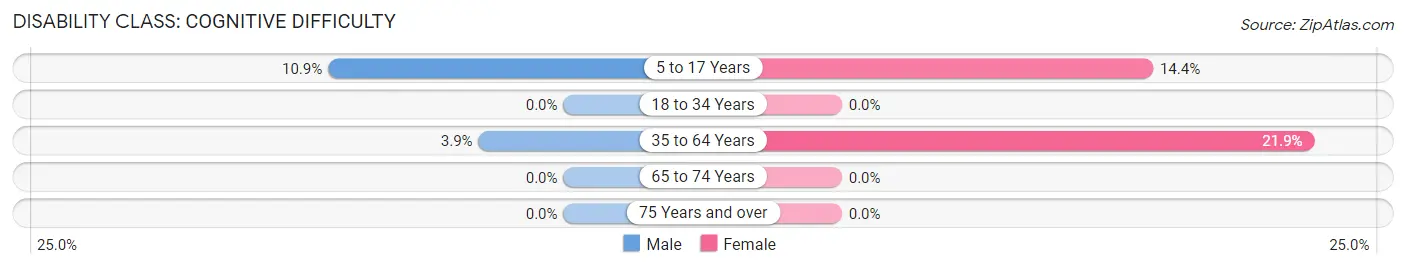
| Age Bracket | Male | Female |
| 5 to 17 Years | 13 (10.9%) | 26 (14.4%) |
| 18 to 34 Years | 0 (0.0%) | 0 (0.0%) |
| 35 to 64 Years | 8 (3.9%) | 59 (21.9%) |
| 65 to 74 Years | 0 (0.0%) | 0 (0.0%) |
| 75 Years and over | 0 (0.0%) | 0 (0.0%) |
Disability Class: Ambulatory Difficulty
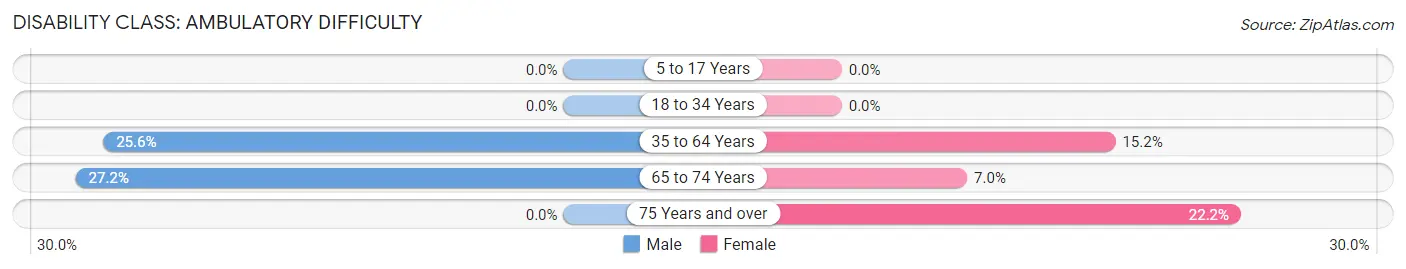
| Age Bracket | Male | Female |
| 5 to 17 Years | 0 (0.0%) | 0 (0.0%) |
| 18 to 34 Years | 0 (0.0%) | 0 (0.0%) |
| 35 to 64 Years | 52 (25.6%) | 41 (15.2%) |
| 65 to 74 Years | 22 (27.2%) | 9 (7.0%) |
| 75 Years and over | 0 (0.0%) | 12 (22.2%) |
Disability Class: Self-Care Difficulty
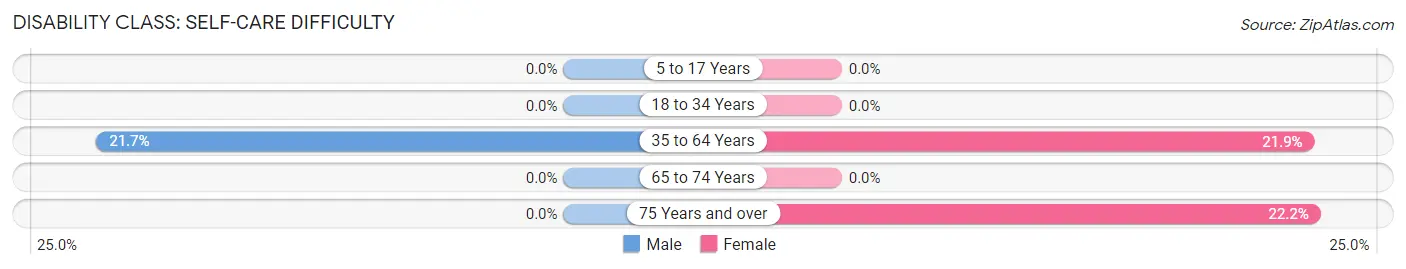
| Age Bracket | Male | Female |
| 5 to 17 Years | 0 (0.0%) | 0 (0.0%) |
| 18 to 34 Years | 0 (0.0%) | 0 (0.0%) |
| 35 to 64 Years | 44 (21.7%) | 59 (21.9%) |
| 65 to 74 Years | 0 (0.0%) | 0 (0.0%) |
| 75 Years and over | 0 (0.0%) | 12 (22.2%) |
Technology Access in Frenchtown
Computing Device Access in Frenchtown
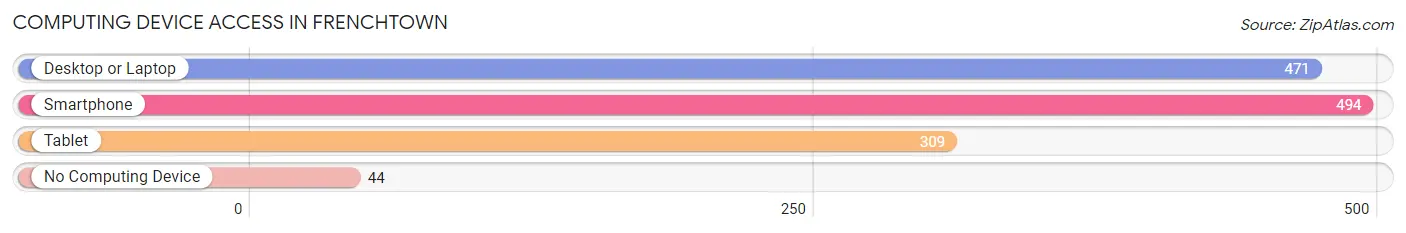
| Device Type | # Households | % Households |
| Desktop or Laptop | 471 | 77.7% |
| Smartphone | 494 | 81.5% |
| Tablet | 309 | 51.0% |
| No Computing Device | 44 | 7.3% |
| Total | 606 | 100.0% |
Internet Access in Frenchtown
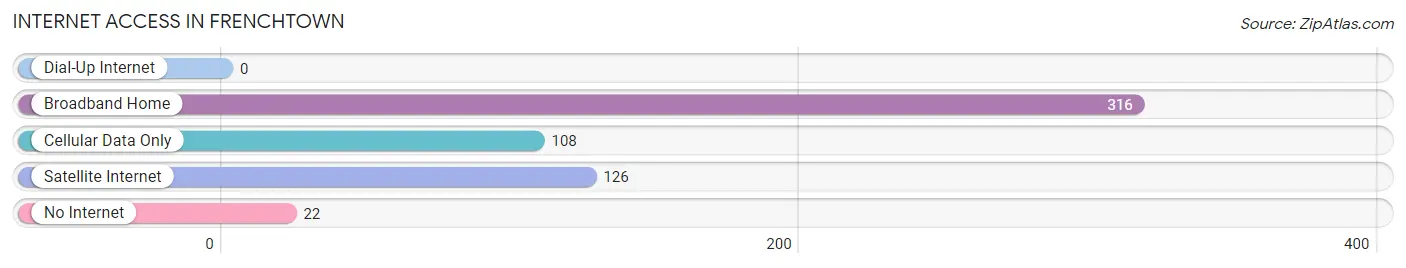
| Internet Type | # Households | % Households |
| Dial-Up Internet | 0 | 0.0% |
| Broadband Home | 316 | 52.1% |
| Cellular Data Only | 108 | 17.8% |
| Satellite Internet | 126 | 20.8% |
| No Internet | 22 | 3.6% |
| Total | 606 | 100.0% |
Frenchtown Summary
Frenchtown is a census-designated place (CDP) located in Missoula County, Montana, United States. The population was 4,917 at the 2010 census. It is part of the Missoula, Montana Metropolitan Statistical Area.
History
The area that is now Frenchtown was first settled in the late 1800s by French-Canadian immigrants. The town was originally known as Frenchtown, but the name was changed to Frenchtown in the early 1900s. The town was officially incorporated in 1909.
The town was originally a farming and ranching community, but in the 1950s, the economy shifted to logging and sawmills. The town was also home to a number of small businesses, including a grocery store, a hardware store, and a gas station.
In the late 1970s, the town began to experience a population decline as people moved away to larger cities. However, in the late 1990s, the population began to increase again as people moved back to the area.
Geography
Frenchtown is located in western Montana, about 10 miles west of Missoula. The town is situated in the Bitterroot Valley, which is surrounded by the Bitterroot Mountains to the east and the Sapphire Mountains to the west. The Clark Fork River runs through the town.
The town has a total area of 4 2 square miles all of which is land
Economy
The economy of Frenchtown is largely based on agriculture and forestry. The town is home to several farms and ranches, as well as a number of sawmills and logging operations.
The town is also home to a number of small businesses, including restaurants, retail stores, and service providers.
Demographics
As of the 2010 census, there were 4,917 people, 1,945 households, and 1,323 families residing in the town. The population density was 1,179.3 people per square mile. The racial makeup of the town was 94.2% White, 0.7% African American, 1.2% Native American, 0.5% Asian, 0.1% Pacific Islander, 1.2% from other races, and 2.2% from two or more races. Hispanic or Latino of any race were 3.3% of the population.
The median income for a household in the town was $41,944, and the median income for a family was $50,938. The per capita income for the town was $20,945. About 8.2% of families and 11.2% of the population were below the poverty line, including 15.2% of those under age 18 and 6.2% of those age 65 or over.
Common Questions
What is Per Capita Income in Frenchtown?
Per Capita income in Frenchtown is $35,182.
What is the Median Family Income in Frenchtown?
Median Family Income in Frenchtown is $88,561.
What is the Median Household income in Frenchtown?
Median Household Income in Frenchtown is $86,184.
What is Income or Wage Gap in Frenchtown?
Income or Wage Gap in Frenchtown is 38.0%.
Women in Frenchtown earn 62.0 cents for every dollar earned by a man.
What is Inequality or Gini Index in Frenchtown?
Inequality or Gini Index in Frenchtown is 0.30.
What is the Total Population of Frenchtown?
Total Population of Frenchtown is 1,570.
What is the Total Male Population of Frenchtown?
Total Male Population of Frenchtown is 822.
What is the Total Female Population of Frenchtown?
Total Female Population of Frenchtown is 748.
What is the Ratio of Males per 100 Females in Frenchtown?
There are 109.89 Males per 100 Females in Frenchtown.
What is the Ratio of Females per 100 Males in Frenchtown?
There are 91.00 Females per 100 Males in Frenchtown.
What is the Median Population Age in Frenchtown?
Median Population Age in Frenchtown is 42.4 Years.
What is the Average Family Size in Frenchtown
Average Family Size in Frenchtown is 2.8 People.
What is the Average Household Size in Frenchtown
Average Household Size in Frenchtown is 2.6 People.
How Large is the Labor Force in Frenchtown?
There are 658 People in the Labor Forcein in Frenchtown.
What is the Percentage of People in the Labor Force in Frenchtown?
59.7% of People are in the Labor Force in Frenchtown.
What is the Unemployment Rate in Frenchtown?
Unemployment Rate in Frenchtown is 3.6%.