Hot Springs, MT Map & Demographics
Hot Springs Map
Hot Springs Overview
$20,113
PER CAPITA INCOME
$36,250
AVG FAMILY INCOME
$21,806
AVG HOUSEHOLD INCOME
18.9%
WAGE / INCOME GAP [ % ]
81.1¢/ $1
WAGE / INCOME GAP [ $ ]
0.49
INEQUALITY / GINI INDEX
613
TOTAL POPULATION
347
MALE POPULATION
266
FEMALE POPULATION
130.45
MALES / 100 FEMALES
76.66
FEMALES / 100 MALES
52.7
MEDIAN AGE
3.1
AVG FAMILY SIZE
2.0
AVG HOUSEHOLD SIZE
200
LABOR FORCE [ PEOPLE ]
35.0%
PERCENT IN LABOR FORCE
9.5%
UNEMPLOYMENT RATE
Hot Springs Zip Codes
Hot Springs Area Codes
Income in Hot Springs
Income Overview in Hot Springs
Per Capita Income in Hot Springs is $20,113, while median incomes of families and households are $36,250 and $21,806 respectively.
| Characteristic | Number | Measure |
| Per Capita Income | 613 | $20,113 |
| Median Family Income | 114 | $36,250 |
| Mean Family Income | 114 | $53,617 |
| Median Household Income | 294 | $21,806 |
| Mean Household Income | 294 | $36,740 |
| Income Deficit | 114 | $0 |
| Wage / Income Gap (%) | 613 | 18.89% |
| Wage / Income Gap ($) | 613 | 81.11¢ per $1 |
| Gini / Inequality Index | 613 | 0.49 |
Earnings by Sex in Hot Springs
Average Earnings in Hot Springs are $17,273, $18,750 for men and $15,208 for women, a difference of 18.9%.
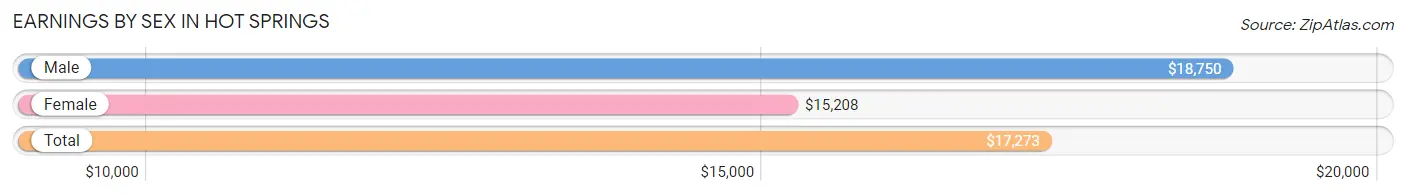
| Sex | Number | Average Earnings |
| Male | 117 (48.3%) | $18,750 |
| Female | 125 (51.6%) | $15,208 |
| Total | 242 (100.0%) | $17,273 |
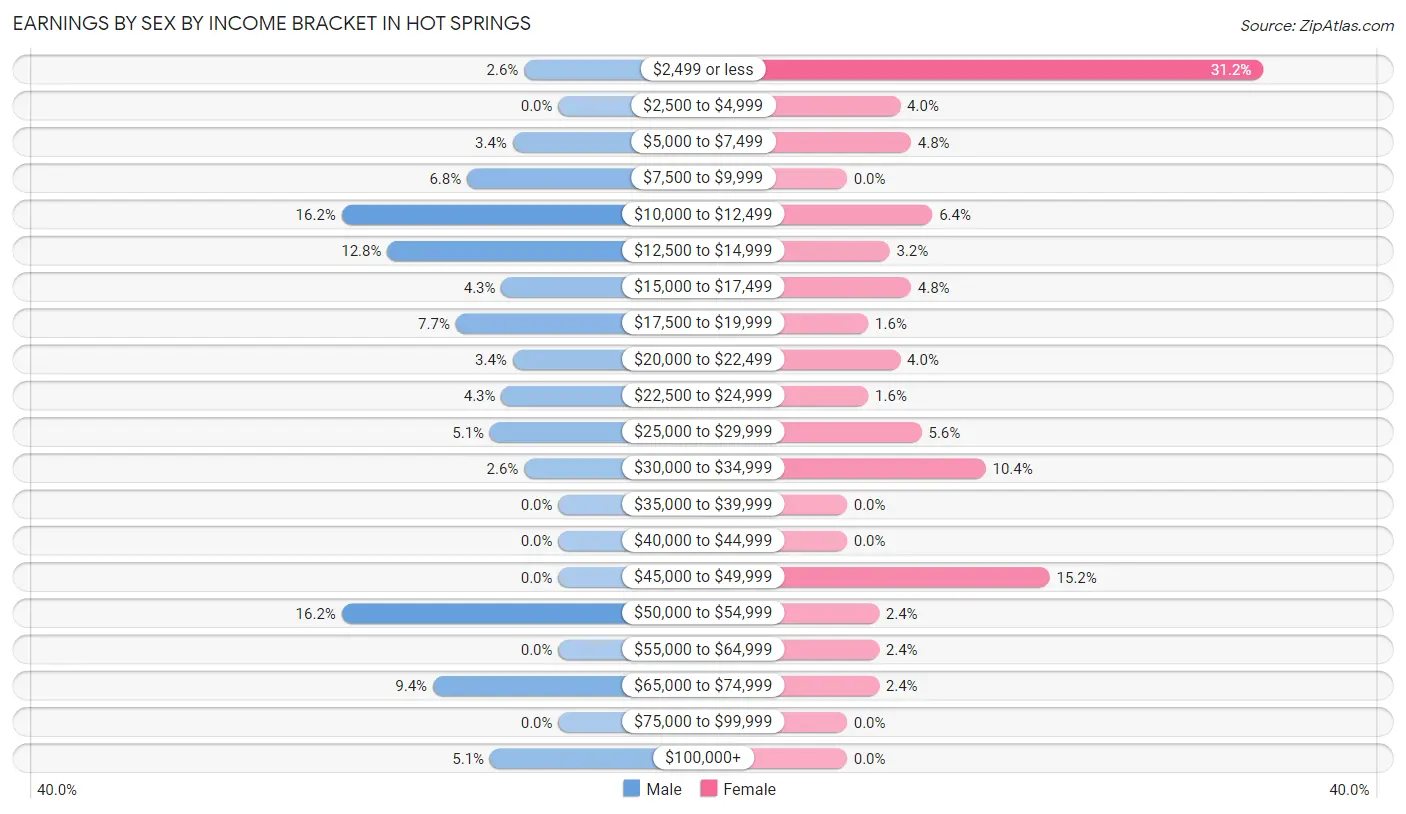
Earnings by Sex by Income Bracket in Hot Springs
The most common earnings brackets in Hot Springs are $10,000 to $12,499 for men (19 | 16.2%) and $2,499 or less for women (39 | 31.2%).
| Income | Male | Female |
| $2,499 or less | 3 (2.6%) | 39 (31.2%) |
| $2,500 to $4,999 | 0 (0.0%) | 5 (4.0%) |
| $5,000 to $7,499 | 4 (3.4%) | 6 (4.8%) |
| $7,500 to $9,999 | 8 (6.8%) | 0 (0.0%) |
| $10,000 to $12,499 | 19 (16.2%) | 8 (6.4%) |
| $12,500 to $14,999 | 15 (12.8%) | 4 (3.2%) |
| $15,000 to $17,499 | 5 (4.3%) | 6 (4.8%) |
| $17,500 to $19,999 | 9 (7.7%) | 2 (1.6%) |
| $20,000 to $22,499 | 4 (3.4%) | 5 (4.0%) |
| $22,500 to $24,999 | 5 (4.3%) | 2 (1.6%) |
| $25,000 to $29,999 | 6 (5.1%) | 7 (5.6%) |
| $30,000 to $34,999 | 3 (2.6%) | 13 (10.4%) |
| $35,000 to $39,999 | 0 (0.0%) | 0 (0.0%) |
| $40,000 to $44,999 | 0 (0.0%) | 0 (0.0%) |
| $45,000 to $49,999 | 0 (0.0%) | 19 (15.2%) |
| $50,000 to $54,999 | 19 (16.2%) | 3 (2.4%) |
| $55,000 to $64,999 | 0 (0.0%) | 3 (2.4%) |
| $65,000 to $74,999 | 11 (9.4%) | 3 (2.4%) |
| $75,000 to $99,999 | 0 (0.0%) | 0 (0.0%) |
| $100,000+ | 6 (5.1%) | 0 (0.0%) |
| Total | 117 (100.0%) | 125 (100.0%) |
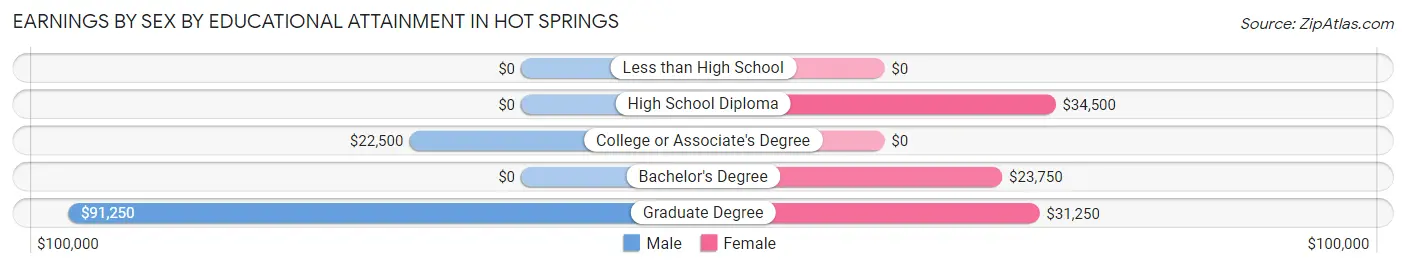
Earnings by Sex by Educational Attainment in Hot Springs
Average earnings in Hot Springs are $21,875 for men and $23,750 for women, a difference of 7.9%. Men with an educational attainment of graduate degree enjoy the highest average annual earnings of $91,250, while those with college or associate's degree education earn the least with $22,500. Women with an educational attainment of high school diploma earn the most with the average annual earnings of $34,500, while those with bachelor's degree education have the smallest earnings of $23,750.
| Educational Attainment | Male Income | Female Income |
| Less than High School | - | - |
| High School Diploma | - | - |
| College or Associate's Degree | $22,500 | $0 |
| Bachelor's Degree | - | - |
| Graduate Degree | $91,250 | $31,250 |
| Total | $21,875 | $23,750 |
Family Income in Hot Springs
Family Income Brackets in Hot Springs
According to the Hot Springs family income data, there are 21 families falling into the $75,000 to $99,999 income range, which is the most common income bracket and makes up 18.4% of all families.
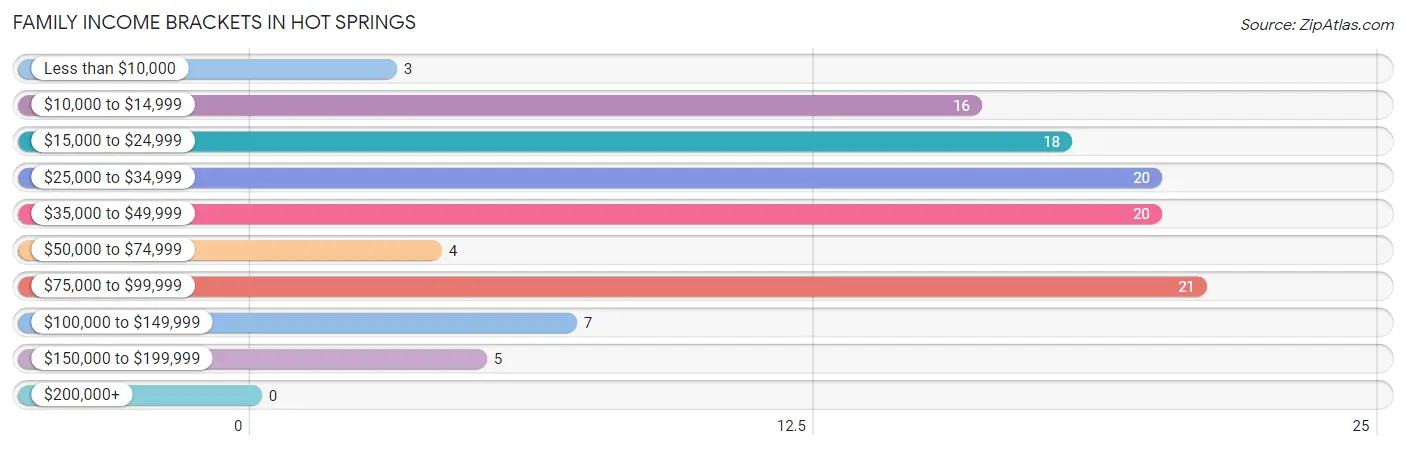
| Income Bracket | # Families | % Families |
| Less than $10,000 | 3 | 2.6% |
| $10,000 to $14,999 | 16 | 14.0% |
| $15,000 to $24,999 | 18 | 15.8% |
| $25,000 to $34,999 | 20 | 17.5% |
| $35,000 to $49,999 | 20 | 17.5% |
| $50,000 to $74,999 | 4 | 3.5% |
| $75,000 to $99,999 | 21 | 18.4% |
| $100,000 to $149,999 | 7 | 6.1% |
| $150,000 to $199,999 | 5 | 4.4% |
| $200,000+ | 0 | 0.0% |
Family Income by Famaliy Size in Hot Springs
4-person families (25 | 21.9%) account for the highest median family income in Hot Springs with $98,047 per family, while 4-person families (25 | 21.9%) have the highest median income of $24,512 per family member.
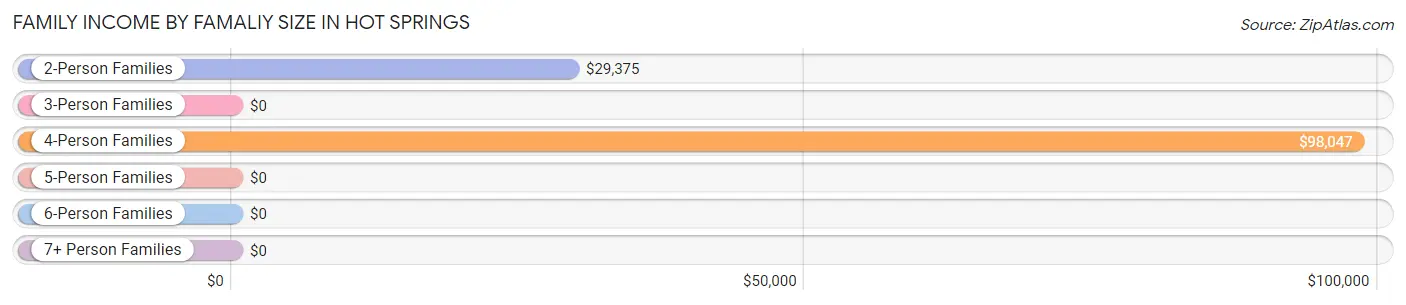
| Income Bracket | # Families | Median Income |
| 2-Person Families | 83 (72.8%) | $29,375 |
| 3-Person Families | 2 (1.8%) | $0 |
| 4-Person Families | 25 (21.9%) | $98,047 |
| 5-Person Families | 4 (3.5%) | $0 |
| 6-Person Families | 0 (0.0%) | $0 |
| 7+ Person Families | 0 (0.0%) | $0 |
| Total | 114 (100.0%) | $36,250 |
Family Income by Number of Earners in Hot Springs
The median family income in Hot Springs is $36,250, with families comprising 3+ earners (19) having the highest median family income of $98,681, while families with no earners (29) have the lowest median family income of $23,958, accounting for 16.7% and 25.4% of families, respectively.
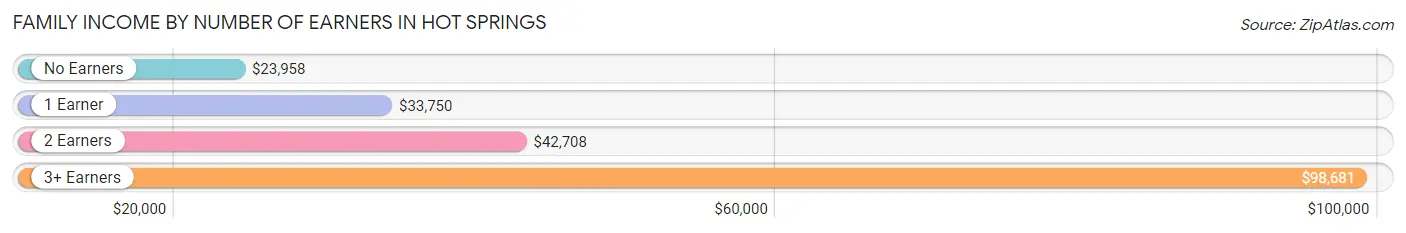
| Number of Earners | # Families | Median Income |
| No Earners | 29 (25.4%) | $23,958 |
| 1 Earner | 43 (37.7%) | $33,750 |
| 2 Earners | 23 (20.2%) | $42,708 |
| 3+ Earners | 19 (16.7%) | $98,681 |
| Total | 114 (100.0%) | $36,250 |
Household Income in Hot Springs
Household Income Brackets in Hot Springs
With 68 households falling in the category, the $10,000 to $14,999 income range is the most frequent in Hot Springs, accounting for 23.1% of all households.
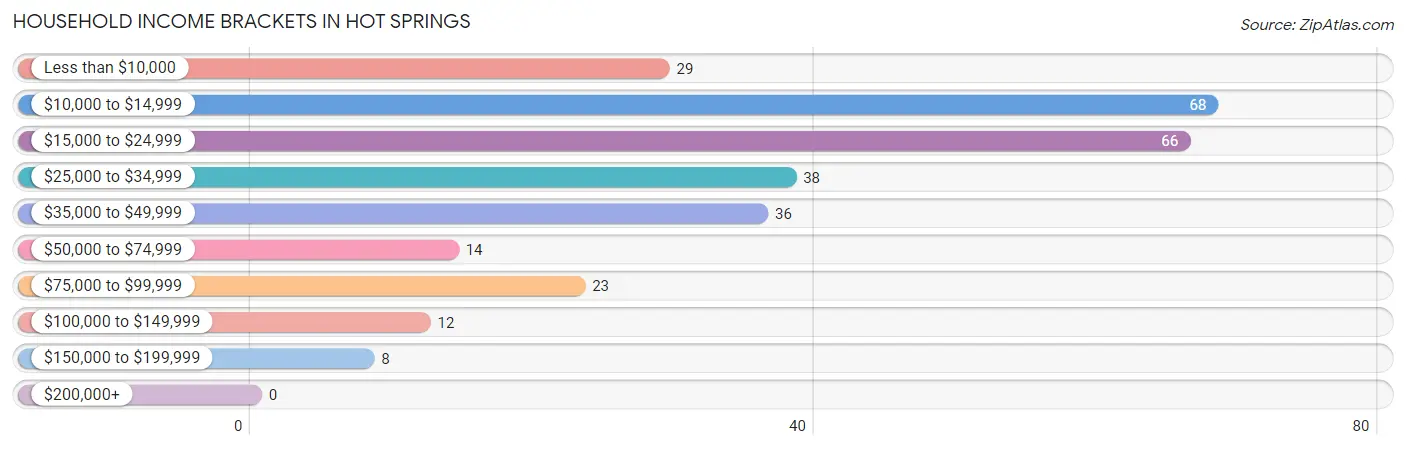
| Income Bracket | # Households | % Households |
| Less than $10,000 | 29 | 9.9% |
| $10,000 to $14,999 | 68 | 23.1% |
| $15,000 to $24,999 | 66 | 22.4% |
| $25,000 to $34,999 | 38 | 12.9% |
| $35,000 to $49,999 | 36 | 12.2% |
| $50,000 to $74,999 | 14 | 4.8% |
| $75,000 to $99,999 | 23 | 7.8% |
| $100,000 to $149,999 | 12 | 4.1% |
| $150,000 to $199,999 | 8 | 2.7% |
| $200,000+ | 0 | 0.0% |
Household Income by Householder Age in Hot Springs
The median household income in Hot Springs is $21,806, with the highest median household income of $25,417 found in the 25 to 44 years age bracket for the primary householder. A total of 27 households (9.2%) fall into this category. Meanwhile, the 15 to 24 years age bracket for the primary householder has the lowest median household income of $0, with 11 households (3.7%) in this group.
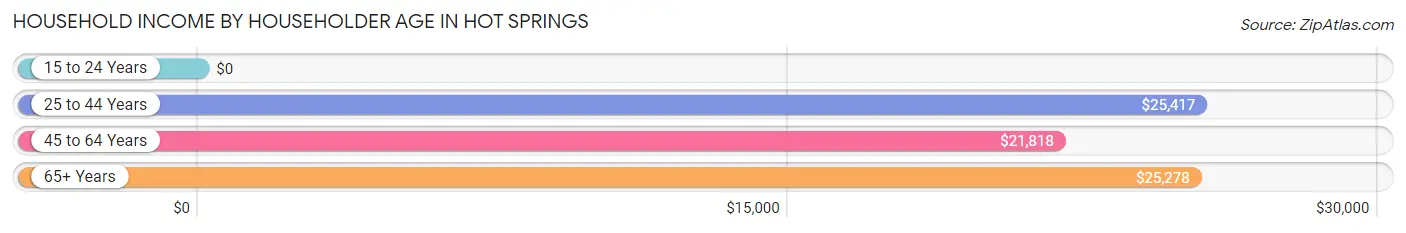
| Income Bracket | # Households | Median Income |
| 15 to 24 Years | 11 (3.7%) | $0 |
| 25 to 44 Years | 27 (9.2%) | $25,417 |
| 45 to 64 Years | 140 (47.6%) | $21,818 |
| 65+ Years | 116 (39.5%) | $25,278 |
| Total | 294 (100.0%) | $21,806 |
Poverty in Hot Springs
Income Below Poverty by Sex and Age in Hot Springs
With 25.2% poverty level for males and 30.4% for females among the residents of Hot Springs, 6 to 11 year old males and under 5 year old females are the most vulnerable to poverty, with 12 males (66.7%) and 4 females (100.0%) in their respective age groups living below the poverty level.
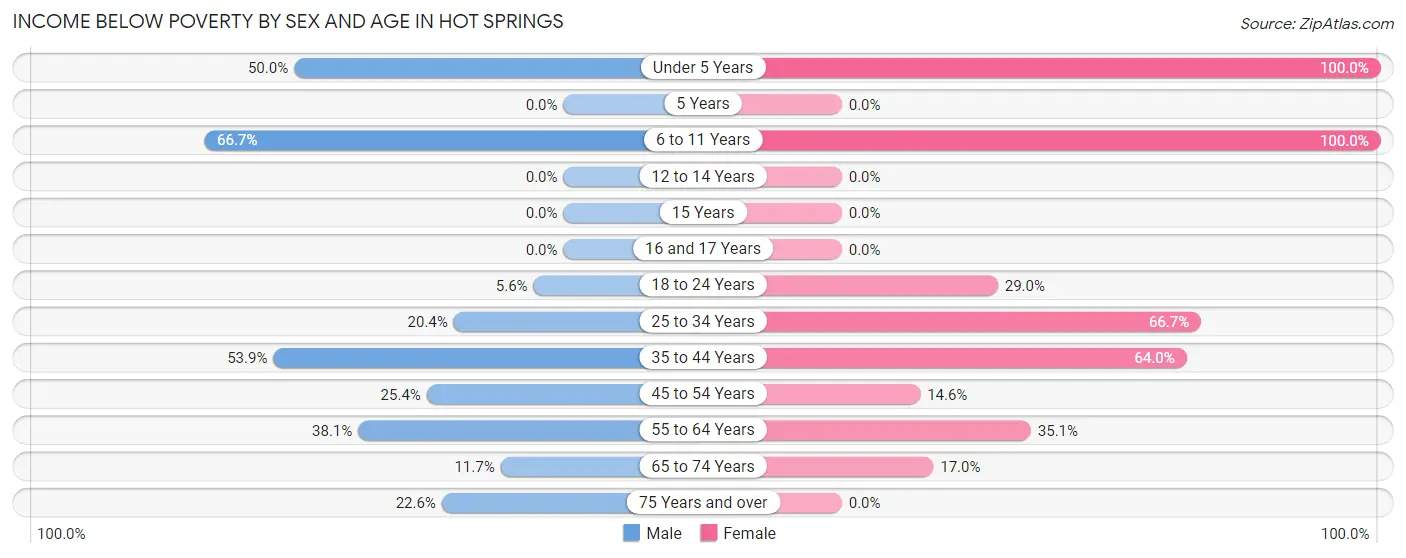
| Age Bracket | Male | Female |
| Under 5 Years | 3 (50.0%) | 4 (100.0%) |
| 5 Years | 0 (0.0%) | 0 (0.0%) |
| 6 to 11 Years | 12 (66.7%) | 7 (100.0%) |
| 12 to 14 Years | 0 (0.0%) | 0 (0.0%) |
| 15 Years | 0 (0.0%) | 0 (0.0%) |
| 16 and 17 Years | 0 (0.0%) | 0 (0.0%) |
| 18 to 24 Years | 1 (5.6%) | 11 (28.9%) |
| 25 to 34 Years | 11 (20.4%) | 4 (66.7%) |
| 35 to 44 Years | 7 (53.8%) | 16 (64.0%) |
| 45 to 54 Years | 17 (25.4%) | 8 (14.5%) |
| 55 to 64 Years | 16 (38.1%) | 20 (35.1%) |
| 65 to 74 Years | 7 (11.7%) | 9 (17.0%) |
| 75 Years and over | 7 (22.6%) | 0 (0.0%) |
| Total | 81 (25.2%) | 79 (30.4%) |
Income Above Poverty by Sex and Age in Hot Springs
According to the poverty statistics in Hot Springs, males aged 12 to 14 years and females aged 75 years and over are the age groups that are most secure financially, with 100.0% of males and 100.0% of females in these age groups living above the poverty line.
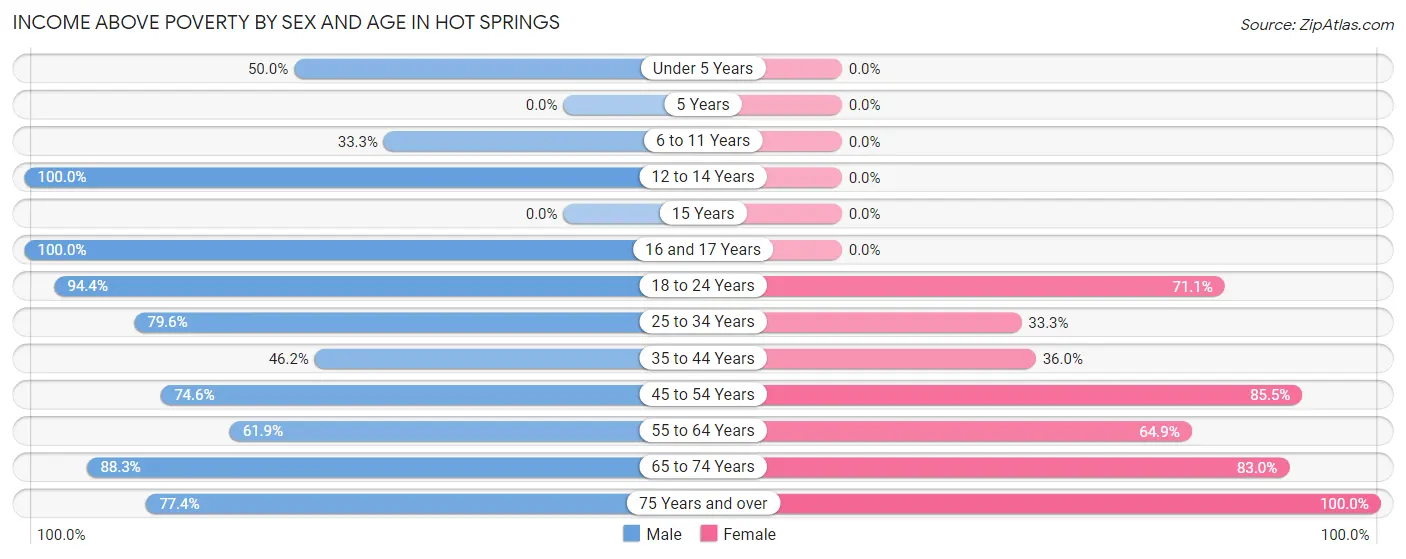
| Age Bracket | Male | Female |
| Under 5 Years | 3 (50.0%) | 0 (0.0%) |
| 5 Years | 0 (0.0%) | 0 (0.0%) |
| 6 to 11 Years | 6 (33.3%) | 0 (0.0%) |
| 12 to 14 Years | 6 (100.0%) | 0 (0.0%) |
| 15 Years | 0 (0.0%) | 0 (0.0%) |
| 16 and 17 Years | 7 (100.0%) | 0 (0.0%) |
| 18 to 24 Years | 17 (94.4%) | 27 (71.1%) |
| 25 to 34 Years | 43 (79.6%) | 2 (33.3%) |
| 35 to 44 Years | 6 (46.2%) | 9 (36.0%) |
| 45 to 54 Years | 50 (74.6%) | 47 (85.5%) |
| 55 to 64 Years | 26 (61.9%) | 37 (64.9%) |
| 65 to 74 Years | 53 (88.3%) | 44 (83.0%) |
| 75 Years and over | 24 (77.4%) | 15 (100.0%) |
| Total | 241 (74.8%) | 181 (69.6%) |
Income Below Poverty Among Married-Couple Families in Hot Springs
The poverty statistics for married-couple families in Hot Springs show that 9.5% or 8 of the total 84 families live below the poverty line. Families with no children have the highest poverty rate of 10.4%, comprising of 8 families. On the other hand, families with 1 or 2 children have the lowest poverty rate of 0.0%, which includes 0 families.
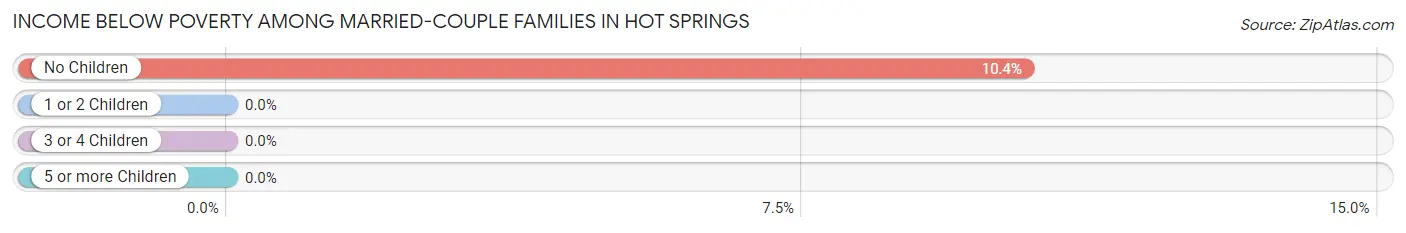
| Children | Above Poverty | Below Poverty |
| No Children | 69 (89.6%) | 8 (10.4%) |
| 1 or 2 Children | 5 (100.0%) | 0 (0.0%) |
| 3 or 4 Children | 2 (100.0%) | 0 (0.0%) |
| 5 or more Children | 0 (0.0%) | 0 (0.0%) |
| Total | 76 (90.5%) | 8 (9.5%) |
Income Below Poverty Among Single-Parent Households in Hot Springs
According to the poverty data in Hot Springs, 55.0% or 11 single-father households and 50.0% or 5 single-mother households are living below the poverty line. Among single-father households, those with 1 or 2 children have the highest poverty rate, with 3 households (100.0%) experiencing poverty. Likewise, among single-mother households, those with 3 or 4 children have the highest poverty rate, with 5 households (100.0%) falling below the poverty line.
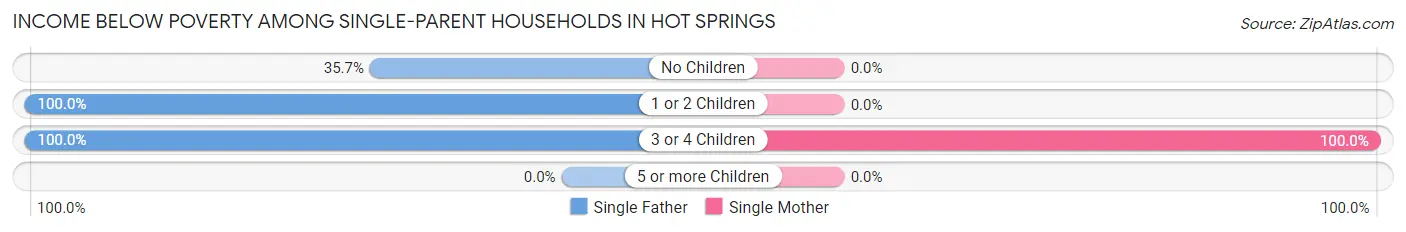
| Children | Single Father | Single Mother |
| No Children | 5 (35.7%) | 0 (0.0%) |
| 1 or 2 Children | 3 (100.0%) | 0 (0.0%) |
| 3 or 4 Children | 3 (100.0%) | 5 (100.0%) |
| 5 or more Children | 0 (0.0%) | 0 (0.0%) |
| Total | 11 (55.0%) | 5 (50.0%) |
Income Below Poverty Among Married-Couple vs Single-Parent Households in Hot Springs
The poverty data for Hot Springs shows that 8 of the married-couple family households (9.5%) and 16 of the single-parent households (53.3%) are living below the poverty level. Within the married-couple family households, those with no children have the highest poverty rate, with 8 households (10.4%) falling below the poverty line. Among the single-parent households, those with 1 or 2 children have the highest poverty rate, with 3 household (100.0%) living below poverty.
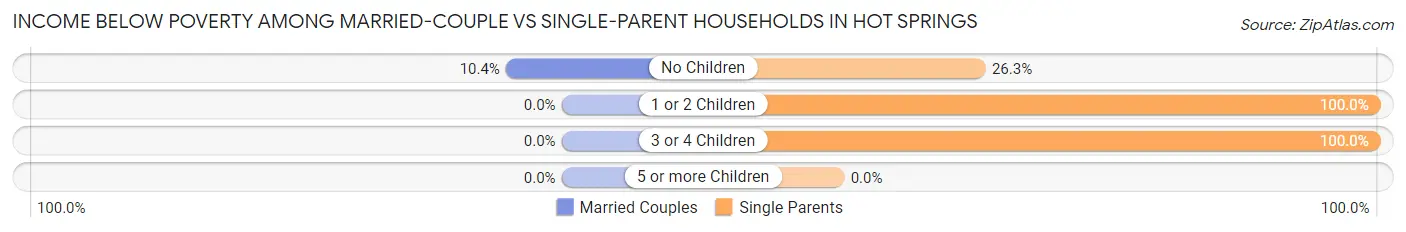
| Children | Married-Couple Families | Single-Parent Households |
| No Children | 8 (10.4%) | 5 (26.3%) |
| 1 or 2 Children | 0 (0.0%) | 3 (100.0%) |
| 3 or 4 Children | 0 (0.0%) | 8 (100.0%) |
| 5 or more Children | 0 (0.0%) | 0 (0.0%) |
| Total | 8 (9.5%) | 16 (53.3%) |
Race in Hot Springs
The most populous races in Hot Springs are White / Caucasian (546 | 89.1%), Two or more Races (37 | 6.0%), and Native / Alaskan (27 | 4.4%).
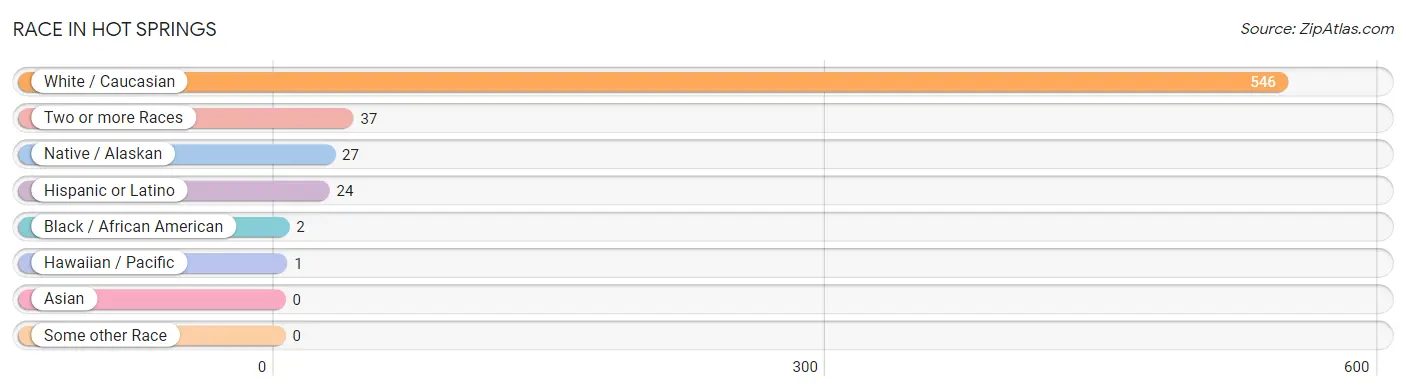
| Race | # Population | % Population |
| Asian | 0 | 0.0% |
| Black / African American | 2 | 0.3% |
| Hawaiian / Pacific | 1 | 0.2% |
| Hispanic or Latino | 24 | 3.9% |
| Native / Alaskan | 27 | 4.4% |
| White / Caucasian | 546 | 89.1% |
| Two or more Races | 37 | 6.0% |
| Some other Race | 0 | 0.0% |
| Total | 613 | 100.0% |
Ancestry in Hot Springs
The most populous ancestries reported in Hot Springs are German (121 | 19.7%), English (68 | 11.1%), American (42 | 6.9%), French (42 | 6.9%), and Irish (33 | 5.4%), together accounting for 49.9% of all Hot Springs residents.
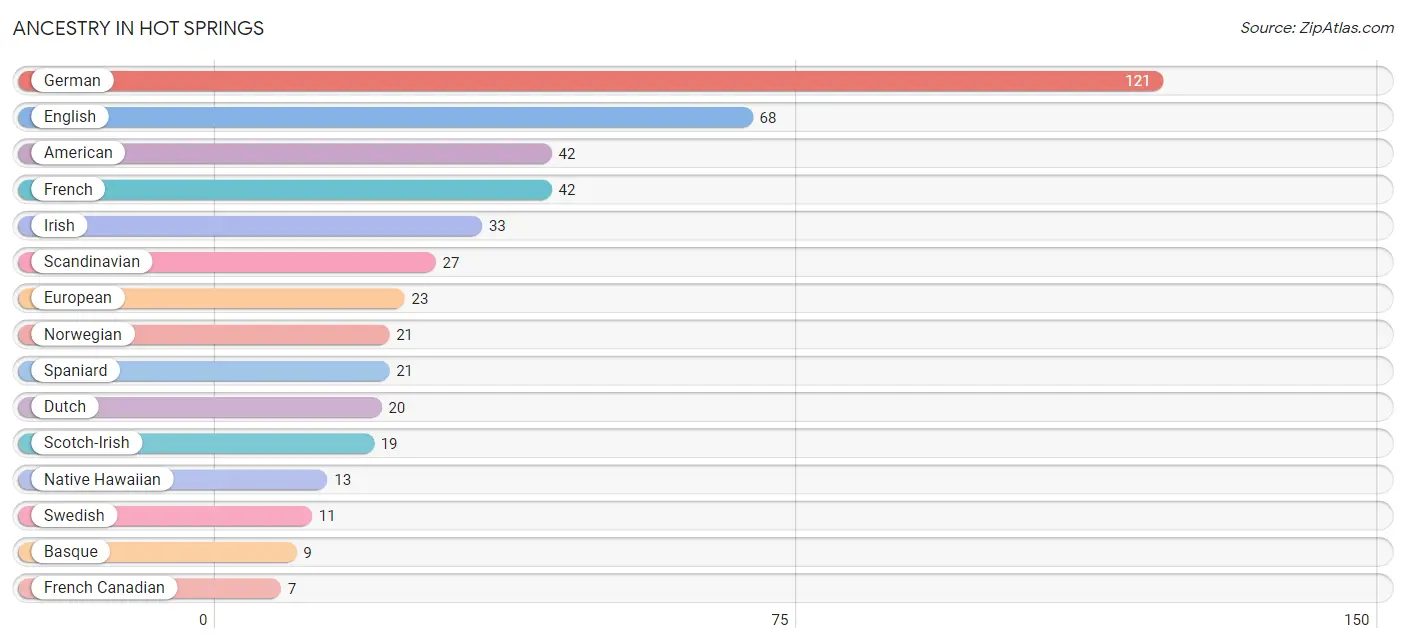
| Ancestry | # Population | % Population |
| American | 42 | 6.9% |
| Austrian | 3 | 0.5% |
| Basque | 9 | 1.5% |
| Blackfeet | 3 | 0.5% |
| British | 6 | 1.0% |
| Canadian | 6 | 1.0% |
| Chippewa | 3 | 0.5% |
| Croatian | 3 | 0.5% |
| Danish | 5 | 0.8% |
| Dutch | 20 | 3.3% |
| Eastern European | 3 | 0.5% |
| English | 68 | 11.1% |
| European | 23 | 3.7% |
| Finnish | 6 | 1.0% |
| French | 42 | 6.9% |
| French Canadian | 7 | 1.1% |
| German | 121 | 19.7% |
| Hungarian | 2 | 0.3% |
| Irish | 33 | 5.4% |
| Italian | 7 | 1.1% |
| Mexican | 3 | 0.5% |
| Native Hawaiian | 13 | 2.1% |
| Norwegian | 21 | 3.4% |
| Russian | 5 | 0.8% |
| Scandinavian | 27 | 4.4% |
| Scotch-Irish | 19 | 3.1% |
| Scottish | 3 | 0.5% |
| Spaniard | 21 | 3.4% |
| Swedish | 11 | 1.8% |
| Welsh | 3 | 0.5% | View All 30 Rows |
Immigrants in Hot Springs
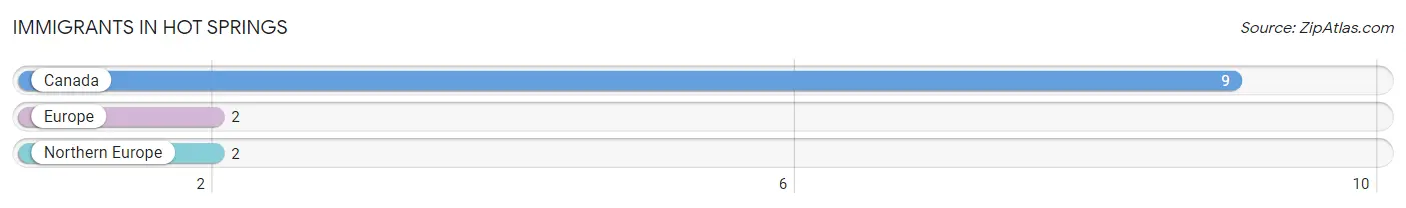
The most numerous immigrant groups reported in Hot Springs came from Canada (9 | 1.5%), Europe (2 | 0.3%), and Northern Europe (2 | 0.3%), together accounting for 2.1% of all Hot Springs residents.
| Immigration Origin | # Population | % Population |
| Canada | 9 | 1.5% |
| Europe | 2 | 0.3% |
| Northern Europe | 2 | 0.3% | View All 3 Rows |
Sex and Age in Hot Springs
Sex and Age in Hot Springs
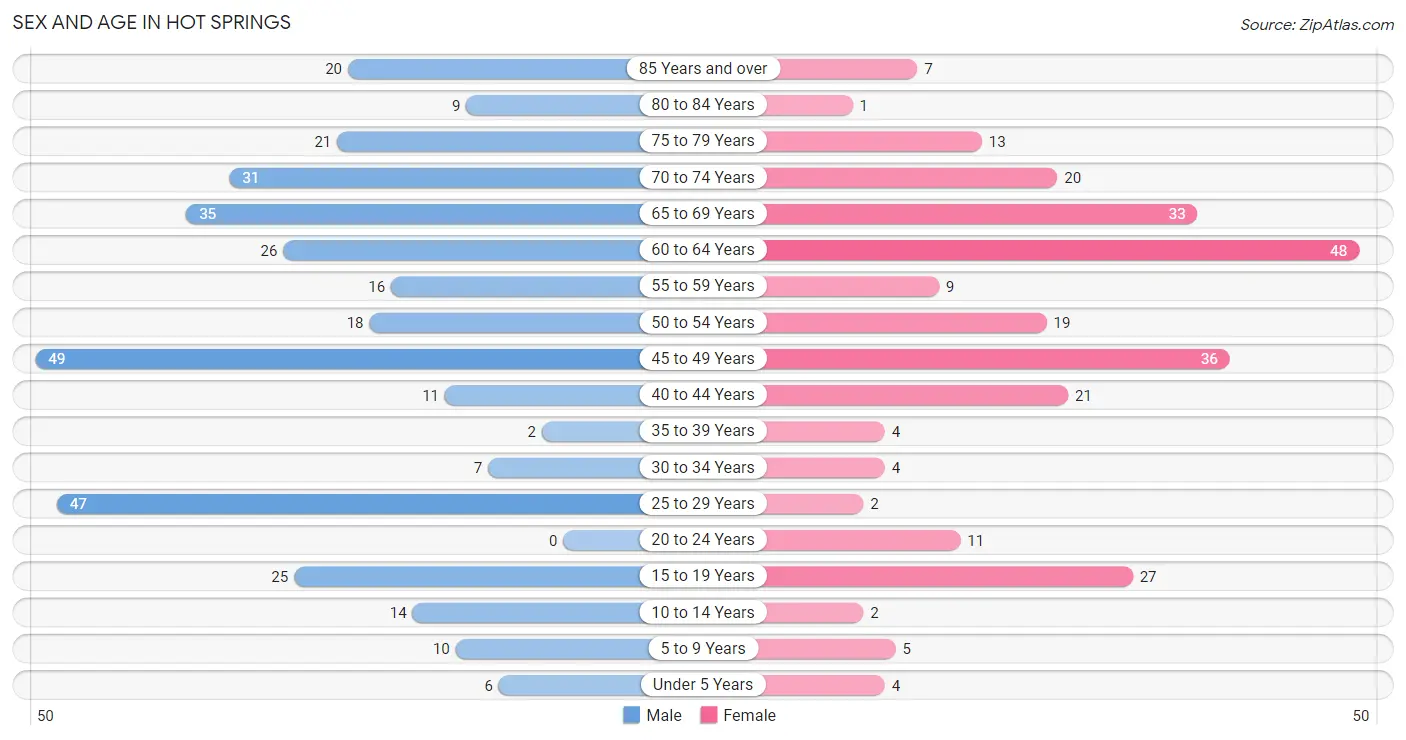
The most populous age groups in Hot Springs are 45 to 49 Years (49 | 14.1%) for men and 60 to 64 Years (48 | 18.0%) for women.
| Age Bracket | Male | Female |
| Under 5 Years | 6 (1.7%) | 4 (1.5%) |
| 5 to 9 Years | 10 (2.9%) | 5 (1.9%) |
| 10 to 14 Years | 14 (4.0%) | 2 (0.7%) |
| 15 to 19 Years | 25 (7.2%) | 27 (10.2%) |
| 20 to 24 Years | 0 (0.0%) | 11 (4.1%) |
| 25 to 29 Years | 47 (13.5%) | 2 (0.7%) |
| 30 to 34 Years | 7 (2.0%) | 4 (1.5%) |
| 35 to 39 Years | 2 (0.6%) | 4 (1.5%) |
| 40 to 44 Years | 11 (3.2%) | 21 (7.9%) |
| 45 to 49 Years | 49 (14.1%) | 36 (13.5%) |
| 50 to 54 Years | 18 (5.2%) | 19 (7.1%) |
| 55 to 59 Years | 16 (4.6%) | 9 (3.4%) |
| 60 to 64 Years | 26 (7.5%) | 48 (18.0%) |
| 65 to 69 Years | 35 (10.1%) | 33 (12.4%) |
| 70 to 74 Years | 31 (8.9%) | 20 (7.5%) |
| 75 to 79 Years | 21 (6.0%) | 13 (4.9%) |
| 80 to 84 Years | 9 (2.6%) | 1 (0.4%) |
| 85 Years and over | 20 (5.8%) | 7 (2.6%) |
| Total | 347 (100.0%) | 266 (100.0%) |
Families and Households in Hot Springs
Median Family Size in Hot Springs
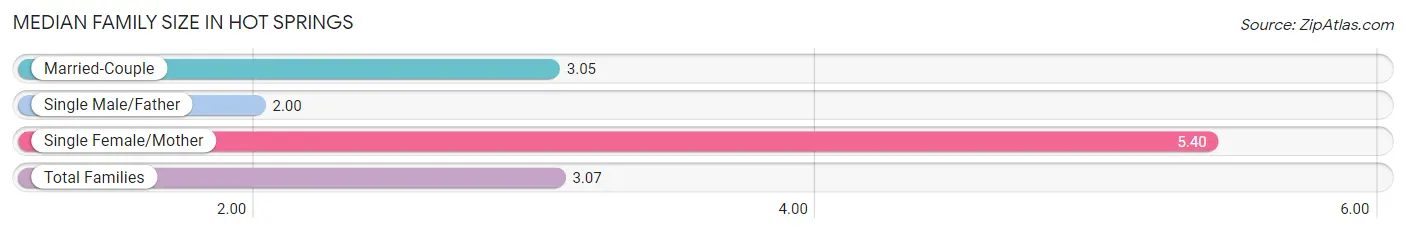
The median family size in Hot Springs is 3.07 persons per family, with single female/mother families (10 | 8.8%) accounting for the largest median family size of 5.4 persons per family. On the other hand, single male/father families (20 | 17.5%) represent the smallest median family size with 2.00 persons per family.
| Family Type | # Families | Family Size |
| Married-Couple | 84 (73.7%) | 3.05 |
| Single Male/Father | 20 (17.5%) | 2.00 |
| Single Female/Mother | 10 (8.8%) | 5.40 |
| Total Families | 114 (100.0%) | 3.07 |
Median Household Size in Hot Springs
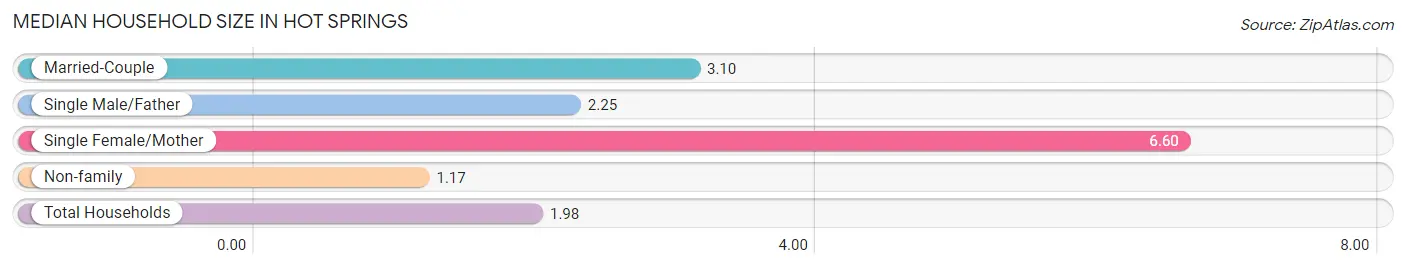
The median household size in Hot Springs is 1.98 persons per household, with single female/mother households (10 | 3.4%) accounting for the largest median household size of 6.6 persons per household. non-family households (180 | 61.2%) represent the smallest median household size with 1.17 persons per household.
| Household Type | # Households | Household Size |
| Married-Couple | 84 (28.6%) | 3.10 |
| Single Male/Father | 20 (6.8%) | 2.25 |
| Single Female/Mother | 10 (3.4%) | 6.60 |
| Non-family | 180 (61.2%) | 1.17 |
| Total Households | 294 (100.0%) | 1.98 |
Household Size by Marriage Status in Hot Springs
Out of a total of 294 households in Hot Springs, 114 (38.8%) are family households, while 180 (61.2%) are nonfamily households. The most numerous type of family households are 2-person households, comprising 75, and the most common type of nonfamily households are 1-person households, comprising 162.
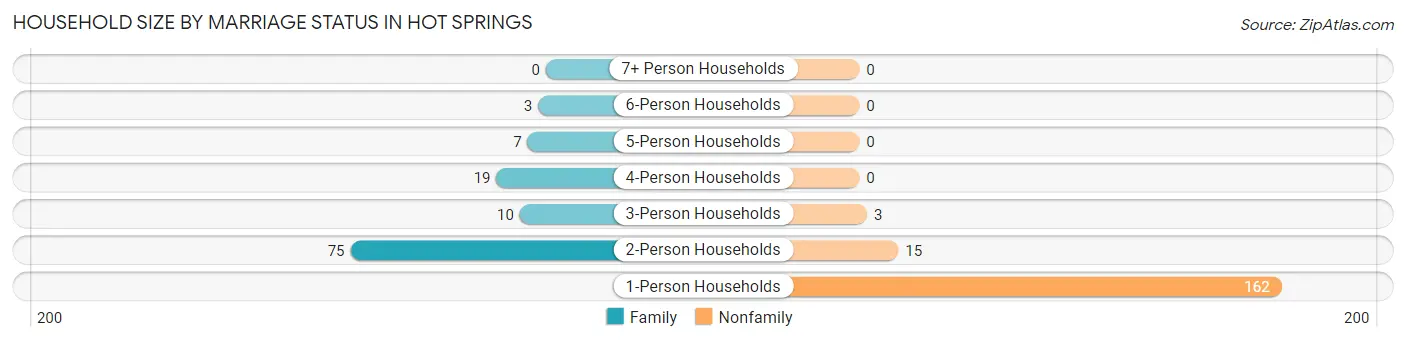
| Household Size | Family Households | Nonfamily Households |
| 1-Person Households | - | 162 (55.1%) |
| 2-Person Households | 75 (25.5%) | 15 (5.1%) |
| 3-Person Households | 10 (3.4%) | 3 (1.0%) |
| 4-Person Households | 19 (6.5%) | 0 (0.0%) |
| 5-Person Households | 7 (2.4%) | 0 (0.0%) |
| 6-Person Households | 3 (1.0%) | 0 (0.0%) |
| 7+ Person Households | 0 (0.0%) | 0 (0.0%) |
| Total | 114 (38.8%) | 180 (61.2%) |
Female Fertility in Hot Springs
Fertility by Age in Hot Springs
Average fertility rate in Hot Springs is 93.0 births per 1,000 women. Women in the age bracket of 20 to 34 years have the highest fertility rate with 588.0 births per 1,000 women. Women in the age bracket of 20 to 34 years acount for 100.0% of all women with births.
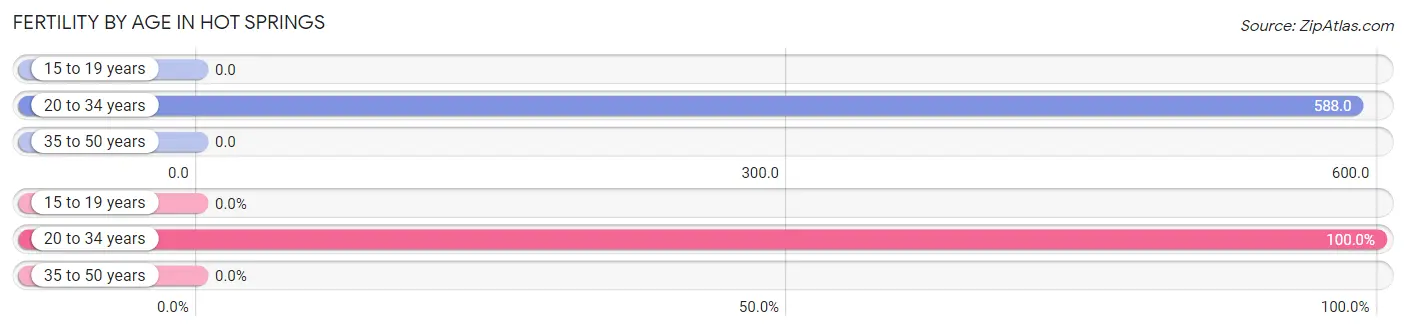
| Age Bracket | Women with Births | Births / 1,000 Women |
| 15 to 19 years | 0 (0.0%) | 0.0 |
| 20 to 34 years | 10 (100.0%) | 588.0 |
| 35 to 50 years | 0 (0.0%) | 0.0 |
| Total | 10 (100.0%) | 93.0 |
Fertility by Age by Marriage Status in Hot Springs
80.0% of women with births (10) in Hot Springs are married. The highest percentage of unmarried women with births falls into 20 to 34 years age bracket with 20.0% of them unmarried at the time of birth, while the lowest percentage of unmarried women with births belong to 20 to 34 years age bracket with 20.0% of them unmarried.
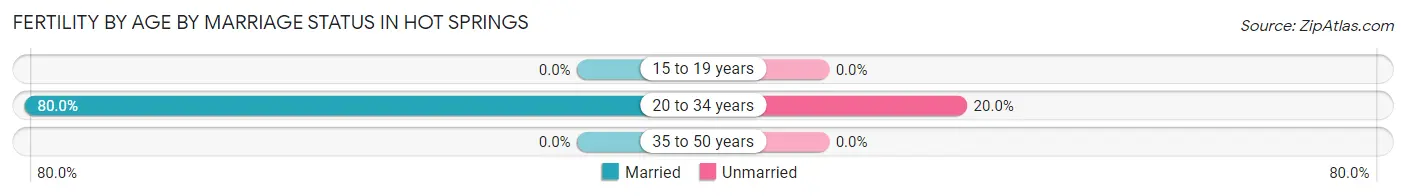
| Age Bracket | Married | Unmarried |
| 15 to 19 years | 0 (0.0%) | 0 (0.0%) |
| 20 to 34 years | 8 (80.0%) | 2 (20.0%) |
| 35 to 50 years | 0 (0.0%) | 0 (0.0%) |
| Total | 8 (80.0%) | 2 (20.0%) |
Fertility by Education in Hot Springs
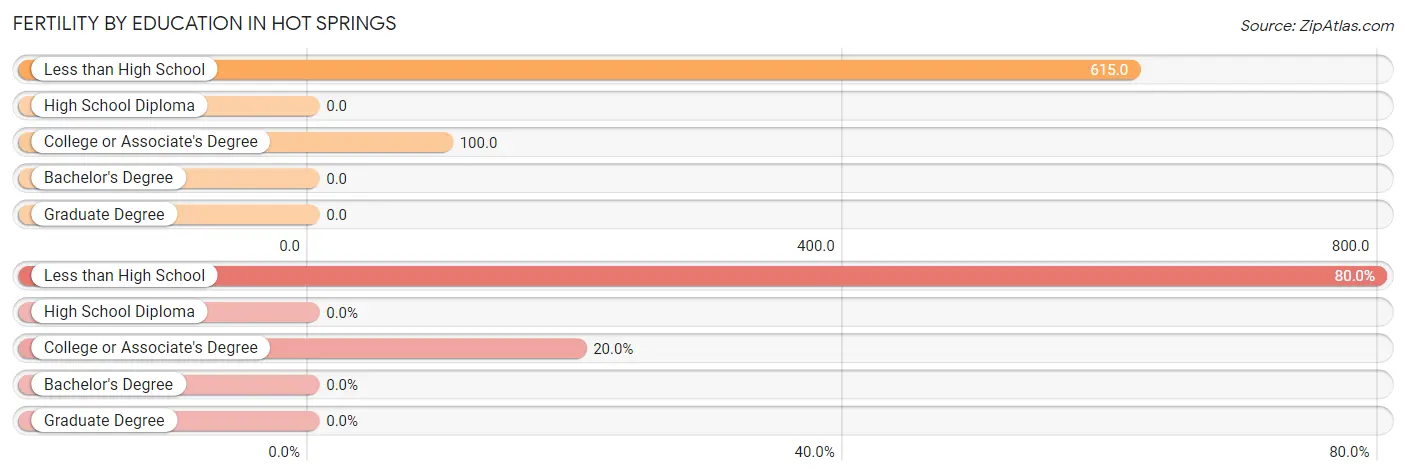
| Educational Attainment | Women with Births | Births / 1,000 Women |
| Less than High School | 8 (80.0%) | 615.0 |
| High School Diploma | 0 (0.0%) | 0.0 |
| College or Associate's Degree | 2 (20.0%) | 100.0 |
| Bachelor's Degree | 0 (0.0%) | 0.0 |
| Graduate Degree | 0 (0.0%) | 0.0 |
| Total | 10 (100.0%) | 93.0 |
Fertility by Education by Marriage Status in Hot Springs
20.0% of women with births in Hot Springs are unmarried. Women with the educational attainment of less than high school are most likely to be married with 100.0% of them married at childbirth, while women with the educational attainment of college or associate's degree are least likely to be married with 100.0% of them unmarried at childbirth.
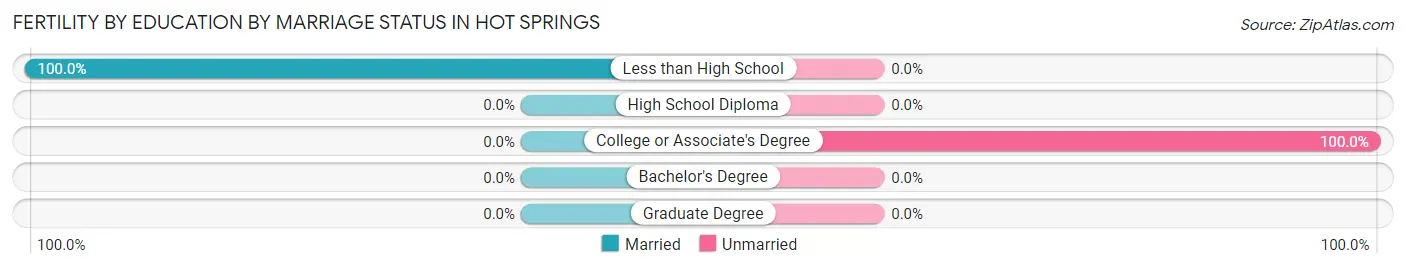
| Educational Attainment | Married | Unmarried |
| Less than High School | 8 (100.0%) | 0 (0.0%) |
| High School Diploma | 0 (0.0%) | 0 (0.0%) |
| College or Associate's Degree | 0 (0.0%) | 2 (100.0%) |
| Bachelor's Degree | 0 (0.0%) | 0 (0.0%) |
| Graduate Degree | 0 (0.0%) | 0 (0.0%) |
| Total | 8 (80.0%) | 2 (20.0%) |
Employment Characteristics in Hot Springs
Employment by Class of Employer in Hot Springs
Among the 181 employed individuals in Hot Springs, private company employees (131 | 72.4%), local government employees (20 | 11.1%), and self-employed (not incorporated) (16 | 8.8%) make up the most common classes of employment.
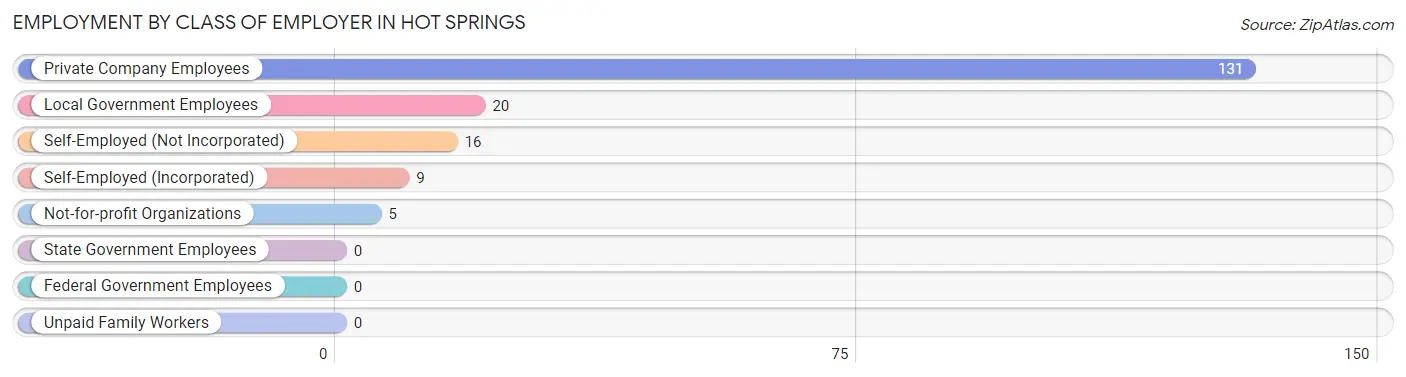
| Employer Class | # Employees | % Employees |
| Private Company Employees | 131 | 72.4% |
| Self-Employed (Incorporated) | 9 | 5.0% |
| Self-Employed (Not Incorporated) | 16 | 8.8% |
| Not-for-profit Organizations | 5 | 2.8% |
| Local Government Employees | 20 | 11.1% |
| State Government Employees | 0 | 0.0% |
| Federal Government Employees | 0 | 0.0% |
| Unpaid Family Workers | 0 | 0.0% |
| Total | 181 | 100.0% |
Employment Status by Age in Hot Springs
According to the labor force statistics for Hot Springs, out of the total population over 16 years of age (572), 35.0% or 200 individuals are in the labor force, with 9.5% or 19 of them unemployed. The age group with the highest labor force participation rate is 55 to 59 years, with 88.0% or 22 individuals in the labor force. Within the labor force, the 25 to 29 years age range has the highest percentage of unemployed individuals, with 47.1% or 8 of them being unemployed.
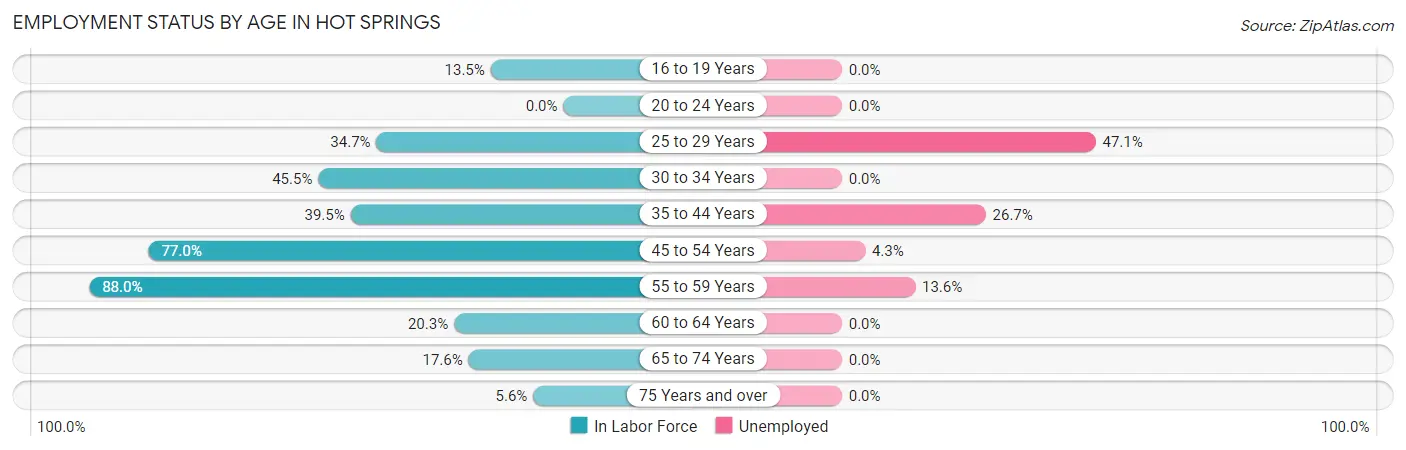
| Age Bracket | In Labor Force | Unemployed |
| 16 to 19 Years | 7 (13.5%) | 0 (0.0%) |
| 20 to 24 Years | 0 (0.0%) | 0 (0.0%) |
| 25 to 29 Years | 17 (34.7%) | 8 (47.1%) |
| 30 to 34 Years | 5 (45.5%) | 0 (0.0%) |
| 35 to 44 Years | 15 (39.5%) | 4 (26.7%) |
| 45 to 54 Years | 94 (77.0%) | 4 (4.3%) |
| 55 to 59 Years | 22 (88.0%) | 3 (13.6%) |
| 60 to 64 Years | 15 (20.3%) | 0 (0.0%) |
| 65 to 74 Years | 21 (17.6%) | 0 (0.0%) |
| 75 Years and over | 4 (5.6%) | 0 (0.0%) |
| Total | 200 (35.0%) | 19 (9.5%) |
Employment Status by Educational Attainment in Hot Springs
According to labor force statistics for Hot Springs, 52.7% of individuals (168) out of the total population between 25 and 64 years of age (319) are in the labor force, with 11.3% or 19 of them being unemployed. The group with the highest labor force participation rate are those with the educational attainment of bachelor's degree or higher, with 71.4% or 35 individuals in the labor force. Within the labor force, individuals with college / associate degree education have the highest percentage of unemployment, with 21.9% or 7 of them being unemployed.
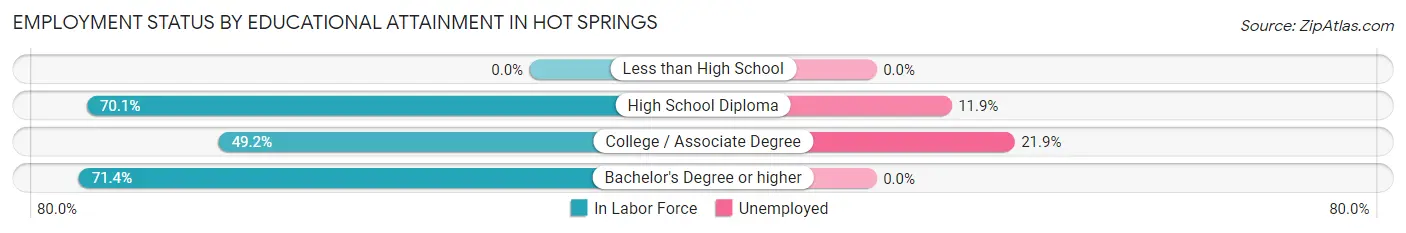
| Educational Attainment | In Labor Force | Unemployed |
| Less than High School | 0 (0.0%) | 0 (0.0%) |
| High School Diploma | 101 (70.1%) | 17 (11.9%) |
| College / Associate Degree | 32 (49.2%) | 14 (21.9%) |
| Bachelor's Degree or higher | 35 (71.4%) | 0 (0.0%) |
| Total | 168 (52.7%) | 36 (11.3%) |
Employment Occupations by Sex in Hot Springs
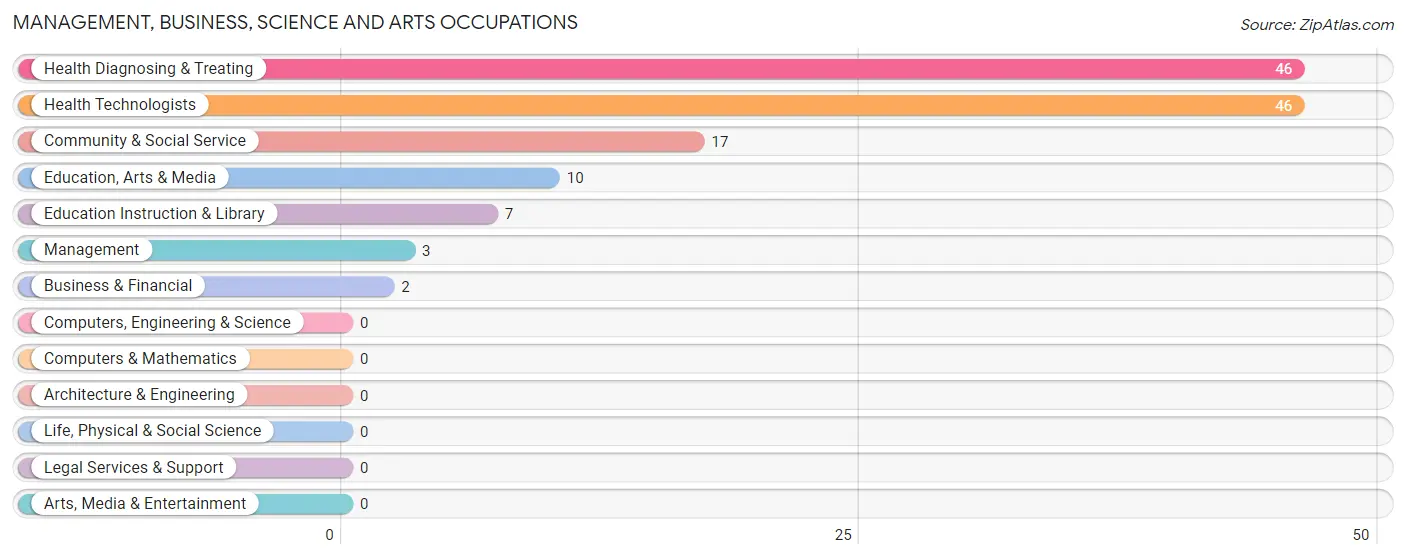
Management, Business, Science and Arts Occupations
The most common Management, Business, Science and Arts occupations in Hot Springs are Health Diagnosing & Treating (46 | 25.4%), Health Technologists (46 | 25.4%), Community & Social Service (17 | 9.4%), Education, Arts & Media (10 | 5.5%), and Education Instruction & Library (7 | 3.9%).
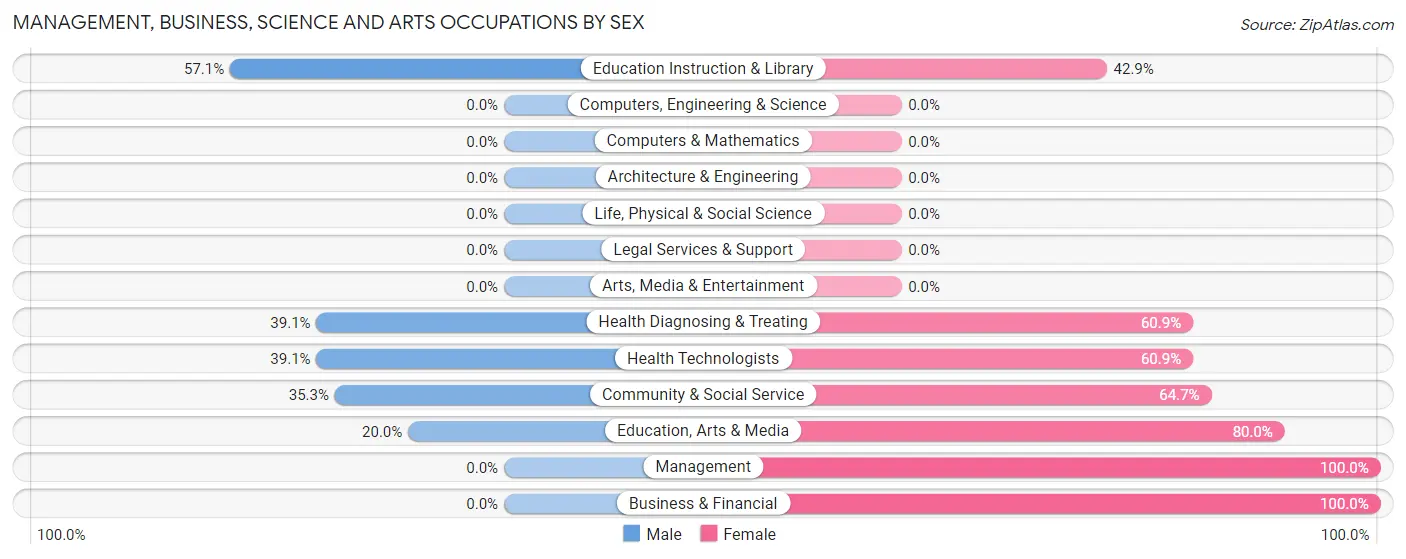
Management, Business, Science and Arts Occupations by Sex
Within the Management, Business, Science and Arts occupations in Hot Springs, the most male-oriented occupations are Education Instruction & Library (57.1%), Health Diagnosing & Treating (39.1%), and Health Technologists (39.1%), while the most female-oriented occupations are Management (100.0%), Business & Financial (100.0%), and Education, Arts & Media (80.0%).
| Occupation | Male | Female |
| Management | 0 (0.0%) | 3 (100.0%) |
| Business & Financial | 0 (0.0%) | 2 (100.0%) |
| Computers, Engineering & Science | 0 (0.0%) | 0 (0.0%) |
| Computers & Mathematics | 0 (0.0%) | 0 (0.0%) |
| Architecture & Engineering | 0 (0.0%) | 0 (0.0%) |
| Life, Physical & Social Science | 0 (0.0%) | 0 (0.0%) |
| Community & Social Service | 6 (35.3%) | 11 (64.7%) |
| Education, Arts & Media | 2 (20.0%) | 8 (80.0%) |
| Legal Services & Support | 0 (0.0%) | 0 (0.0%) |
| Education Instruction & Library | 4 (57.1%) | 3 (42.9%) |
| Arts, Media & Entertainment | 0 (0.0%) | 0 (0.0%) |
| Health Diagnosing & Treating | 18 (39.1%) | 28 (60.9%) |
| Health Technologists | 18 (39.1%) | 28 (60.9%) |
| Total (Category) | 24 (35.3%) | 44 (64.7%) |
| Total (Overall) | 95 (52.5%) | 86 (47.5%) |
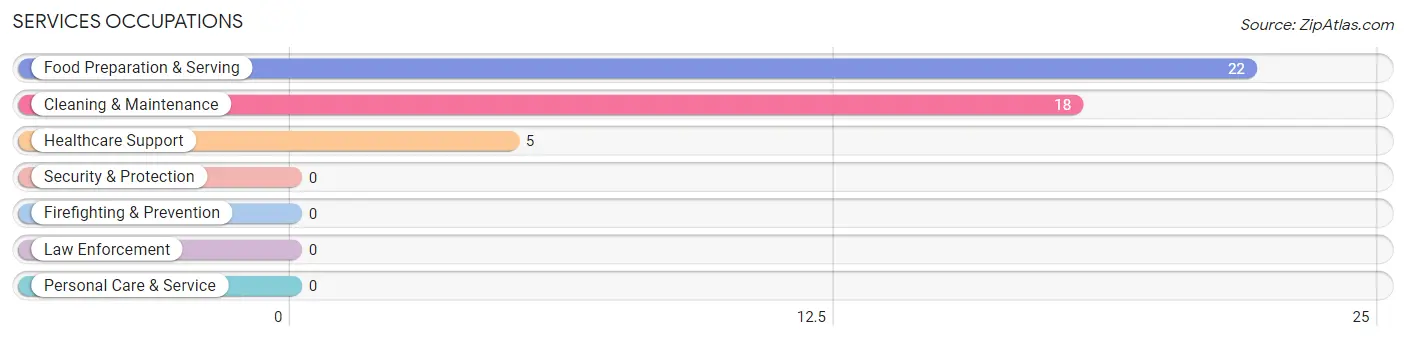
Services Occupations
The most common Services occupations in Hot Springs are Food Preparation & Serving (22 | 12.1%), Cleaning & Maintenance (18 | 9.9%), and Healthcare Support (5 | 2.8%).
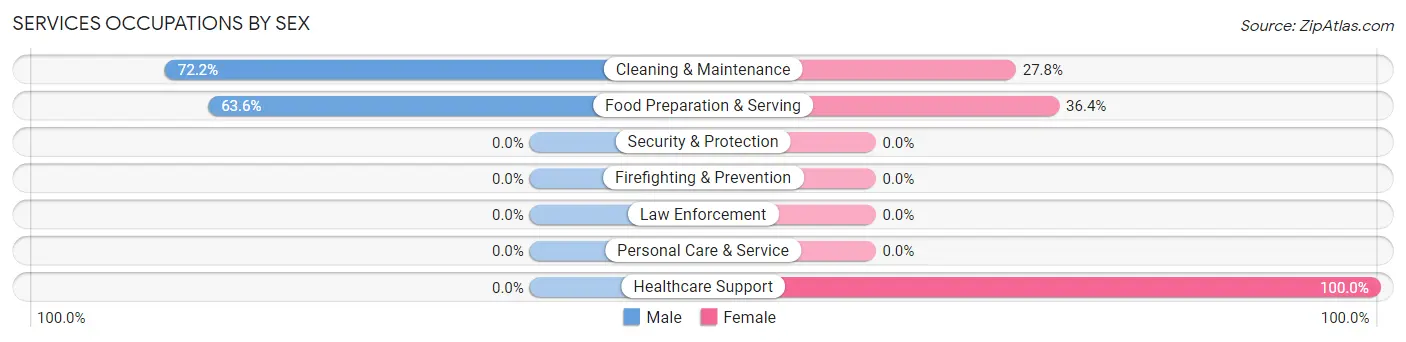
Services Occupations by Sex
Within the Services occupations in Hot Springs, the most male-oriented occupations are Cleaning & Maintenance (72.2%), and Food Preparation & Serving (63.6%), while the most female-oriented occupations are Healthcare Support (100.0%), Food Preparation & Serving (36.4%), and Cleaning & Maintenance (27.8%).
| Occupation | Male | Female |
| Healthcare Support | 0 (0.0%) | 5 (100.0%) |
| Security & Protection | 0 (0.0%) | 0 (0.0%) |
| Firefighting & Prevention | 0 (0.0%) | 0 (0.0%) |
| Law Enforcement | 0 (0.0%) | 0 (0.0%) |
| Food Preparation & Serving | 14 (63.6%) | 8 (36.4%) |
| Cleaning & Maintenance | 13 (72.2%) | 5 (27.8%) |
| Personal Care & Service | 0 (0.0%) | 0 (0.0%) |
| Total (Category) | 27 (60.0%) | 18 (40.0%) |
| Total (Overall) | 95 (52.5%) | 86 (47.5%) |
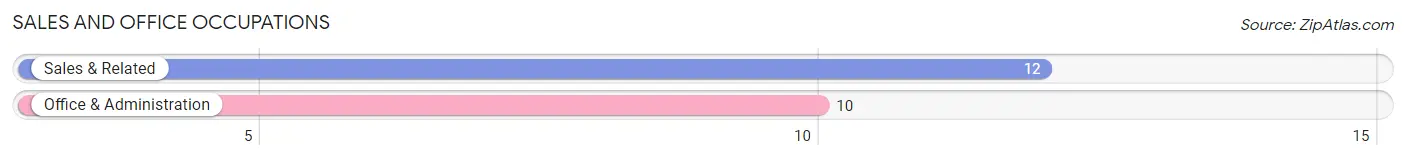
Sales and Office Occupations
The most common Sales and Office occupations in Hot Springs are Sales & Related (12 | 6.6%), and Office & Administration (10 | 5.5%).
Sales and Office Occupations by Sex
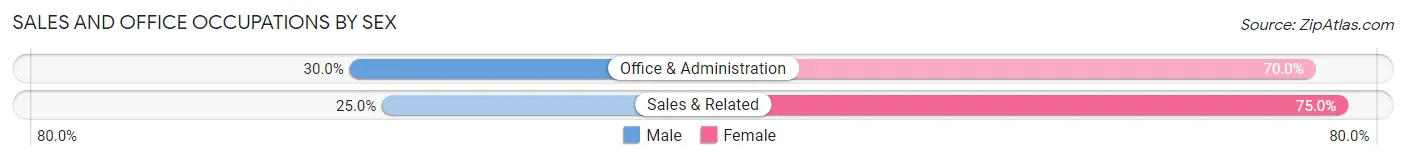
| Occupation | Male | Female |
| Sales & Related | 3 (25.0%) | 9 (75.0%) |
| Office & Administration | 3 (30.0%) | 7 (70.0%) |
| Total (Category) | 6 (27.3%) | 16 (72.7%) |
| Total (Overall) | 95 (52.5%) | 86 (47.5%) |
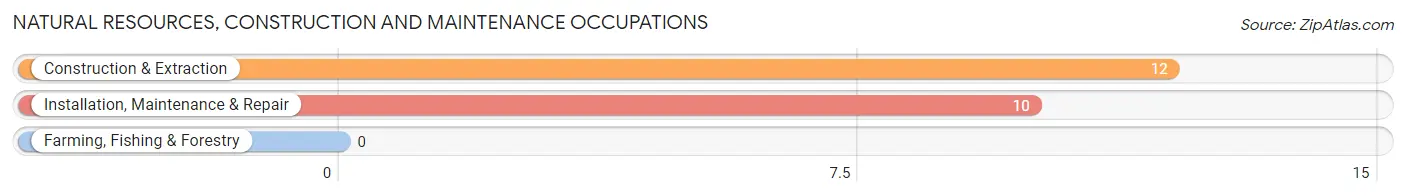
Natural Resources, Construction and Maintenance Occupations
The most common Natural Resources, Construction and Maintenance occupations in Hot Springs are Construction & Extraction (12 | 6.6%), and Installation, Maintenance & Repair (10 | 5.5%).
Natural Resources, Construction and Maintenance Occupations by Sex
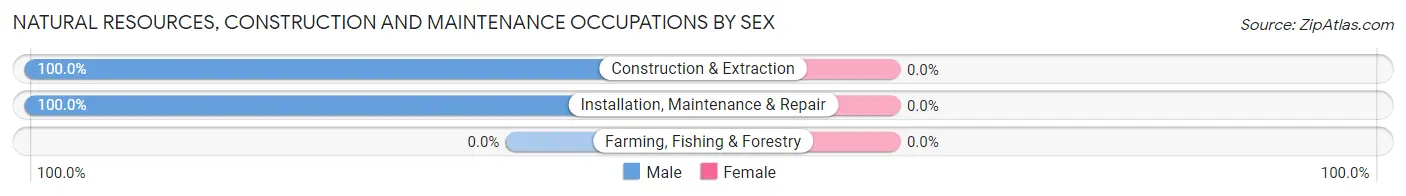
| Occupation | Male | Female |
| Farming, Fishing & Forestry | 0 (0.0%) | 0 (0.0%) |
| Construction & Extraction | 12 (100.0%) | 0 (0.0%) |
| Installation, Maintenance & Repair | 10 (100.0%) | 0 (0.0%) |
| Total (Category) | 22 (100.0%) | 0 (0.0%) |
| Total (Overall) | 95 (52.5%) | 86 (47.5%) |
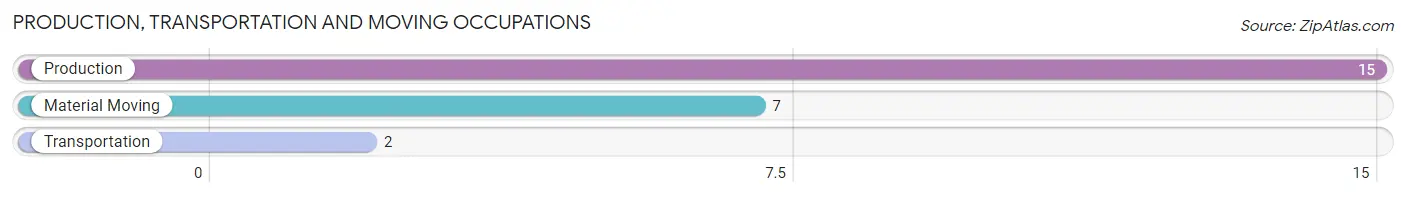
Production, Transportation and Moving Occupations
The most common Production, Transportation and Moving occupations in Hot Springs are Production (15 | 8.3%), Material Moving (7 | 3.9%), and Transportation (2 | 1.1%).
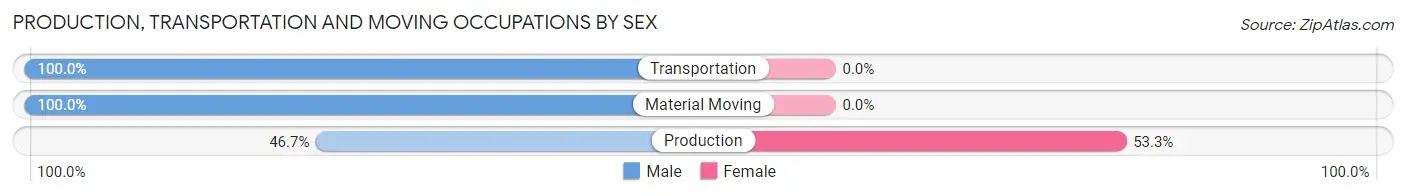
Production, Transportation and Moving Occupations by Sex
| Occupation | Male | Female |
| Production | 7 (46.7%) | 8 (53.3%) |
| Transportation | 2 (100.0%) | 0 (0.0%) |
| Material Moving | 7 (100.0%) | 0 (0.0%) |
| Total (Category) | 16 (66.7%) | 8 (33.3%) |
| Total (Overall) | 95 (52.5%) | 86 (47.5%) |
Employment Industries by Sex in Hot Springs
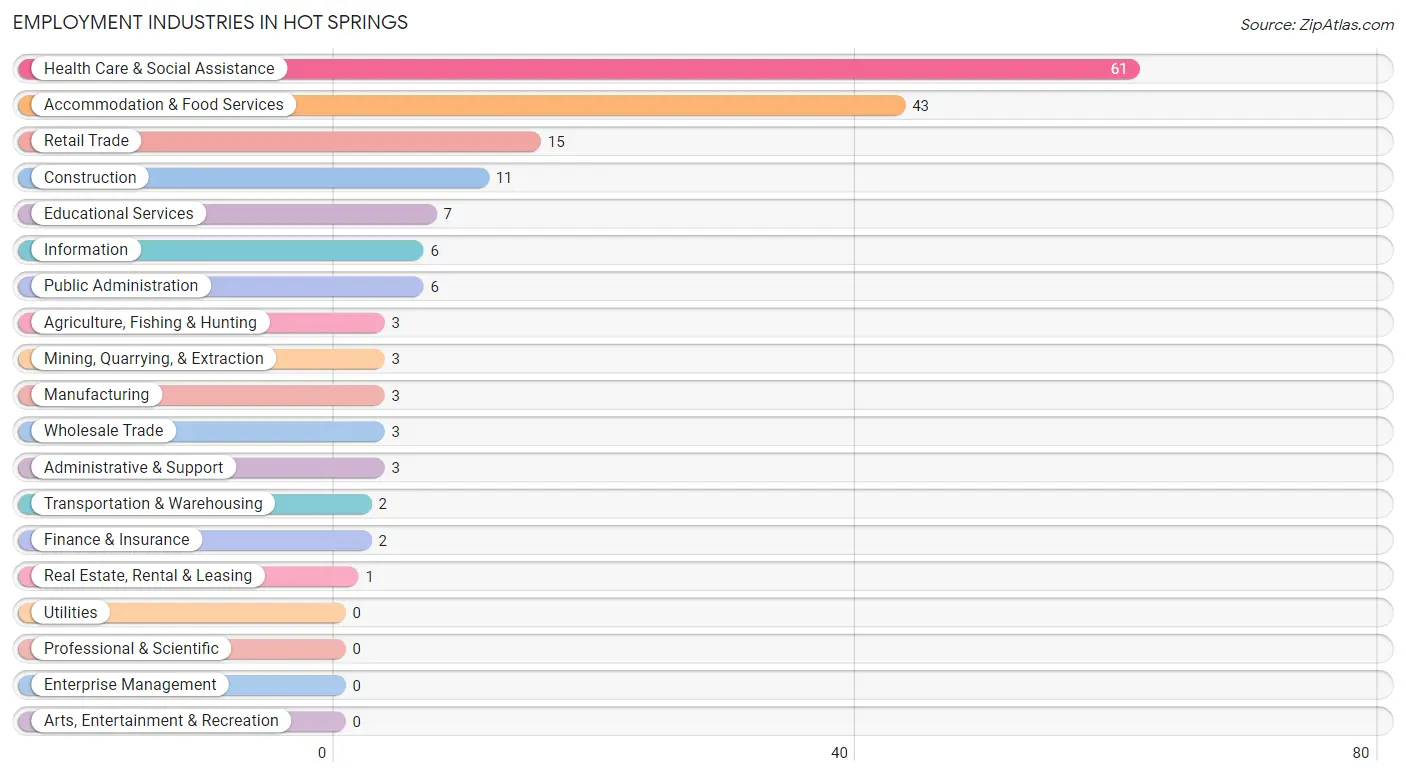
Employment Industries in Hot Springs
The major employment industries in Hot Springs include Health Care & Social Assistance (61 | 33.7%), Accommodation & Food Services (43 | 23.8%), Retail Trade (15 | 8.3%), Construction (11 | 6.1%), and Educational Services (7 | 3.9%).
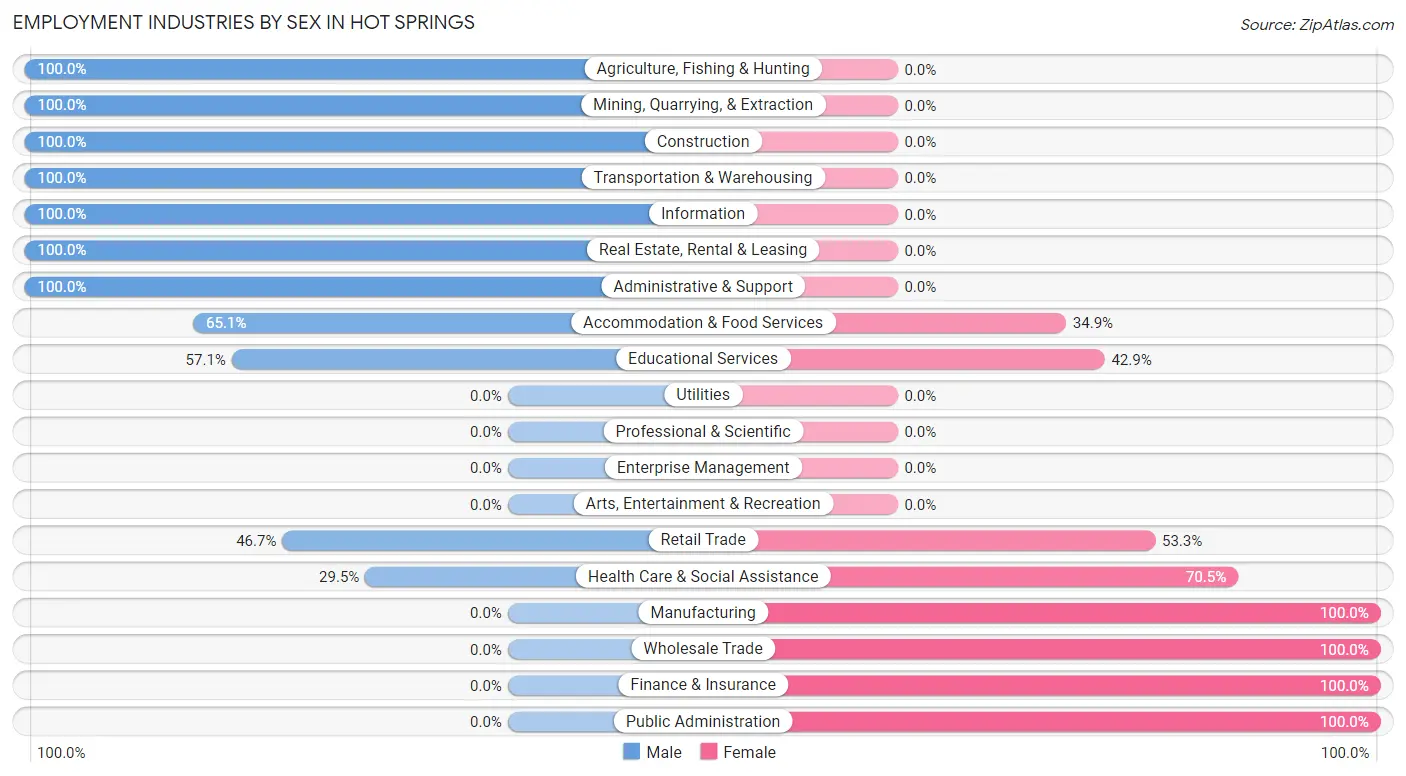
Employment Industries by Sex in Hot Springs
The Hot Springs industries that see more men than women are Agriculture, Fishing & Hunting (100.0%), Mining, Quarrying, & Extraction (100.0%), and Construction (100.0%), whereas the industries that tend to have a higher number of women are Manufacturing (100.0%), Wholesale Trade (100.0%), and Finance & Insurance (100.0%).
| Industry | Male | Female |
| Agriculture, Fishing & Hunting | 3 (100.0%) | 0 (0.0%) |
| Mining, Quarrying, & Extraction | 3 (100.0%) | 0 (0.0%) |
| Construction | 11 (100.0%) | 0 (0.0%) |
| Manufacturing | 0 (0.0%) | 3 (100.0%) |
| Wholesale Trade | 0 (0.0%) | 3 (100.0%) |
| Retail Trade | 7 (46.7%) | 8 (53.3%) |
| Transportation & Warehousing | 2 (100.0%) | 0 (0.0%) |
| Utilities | 0 (0.0%) | 0 (0.0%) |
| Information | 6 (100.0%) | 0 (0.0%) |
| Finance & Insurance | 0 (0.0%) | 2 (100.0%) |
| Real Estate, Rental & Leasing | 1 (100.0%) | 0 (0.0%) |
| Professional & Scientific | 0 (0.0%) | 0 (0.0%) |
| Enterprise Management | 0 (0.0%) | 0 (0.0%) |
| Administrative & Support | 3 (100.0%) | 0 (0.0%) |
| Educational Services | 4 (57.1%) | 3 (42.9%) |
| Health Care & Social Assistance | 18 (29.5%) | 43 (70.5%) |
| Arts, Entertainment & Recreation | 0 (0.0%) | 0 (0.0%) |
| Accommodation & Food Services | 28 (65.1%) | 15 (34.9%) |
| Public Administration | 0 (0.0%) | 6 (100.0%) |
| Total | 95 (52.5%) | 86 (47.5%) |
Education in Hot Springs
School Enrollment in Hot Springs
The most common levels of schooling among the 88 students in Hot Springs are high school (35 | 39.8%), college / undergraduate (19 | 21.6%), and elementary school (18 | 20.4%).
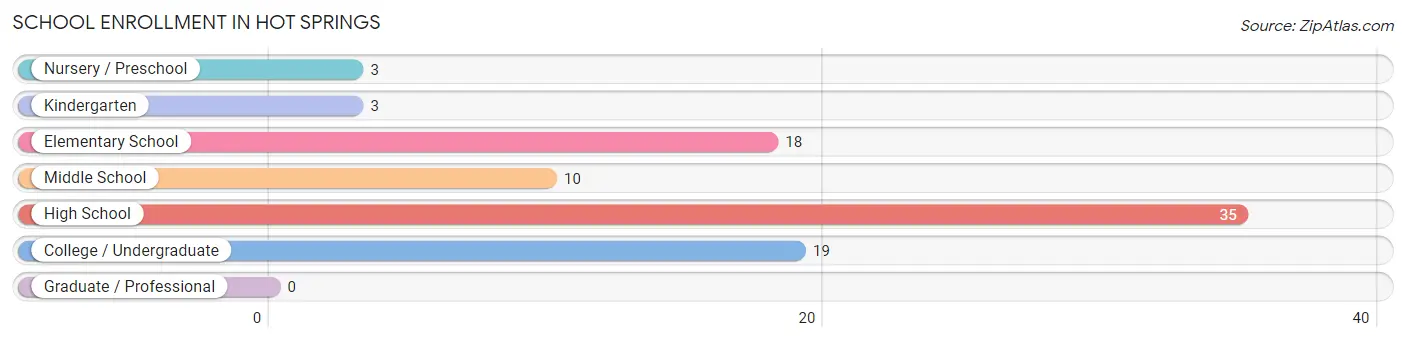
| School Level | # Students | % Students |
| Nursery / Preschool | 3 | 3.4% |
| Kindergarten | 3 | 3.4% |
| Elementary School | 18 | 20.4% |
| Middle School | 10 | 11.4% |
| High School | 35 | 39.8% |
| College / Undergraduate | 19 | 21.6% |
| Graduate / Professional | 0 | 0.0% |
| Total | 88 | 100.0% |
School Enrollment by Age by Funding Source in Hot Springs
Out of a total of 88 students who are enrolled in schools in Hot Springs, 13 (14.8%) attend a private institution, while the remaining 75 (85.2%) are enrolled in public schools. The age group of 10 to 14 year olds has the highest likelihood of being enrolled in private schools, with 4 (25.0% in the age bracket) enrolled. Conversely, the age group of 3 to 4 year olds has the lowest likelihood of being enrolled in a private school, with 3 (100.0% in the age bracket) attending a public institution.
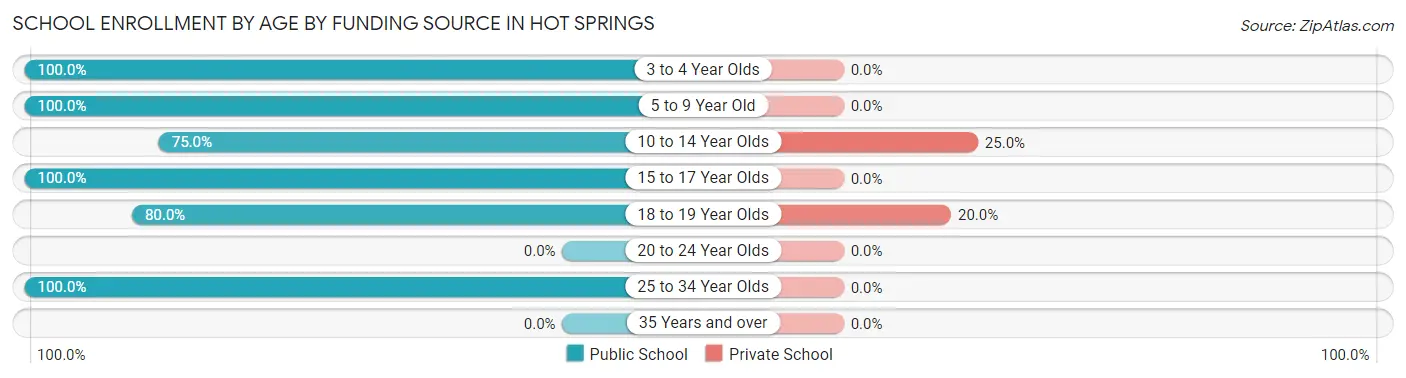
| Age Bracket | Public School | Private School |
| 3 to 4 Year Olds | 3 (100.0%) | 0 (0.0%) |
| 5 to 9 Year Old | 15 (100.0%) | 0 (0.0%) |
| 10 to 14 Year Olds | 12 (75.0%) | 4 (25.0%) |
| 15 to 17 Year Olds | 7 (100.0%) | 0 (0.0%) |
| 18 to 19 Year Olds | 36 (80.0%) | 9 (20.0%) |
| 20 to 24 Year Olds | 0 (0.0%) | 0 (0.0%) |
| 25 to 34 Year Olds | 2 (100.0%) | 0 (0.0%) |
| 35 Years and over | 0 (0.0%) | 0 (0.0%) |
| Total | 75 (85.2%) | 13 (14.8%) |
Educational Attainment by Field of Study in Hot Springs
Science & technology (16 | 19.5%), education (16 | 19.5%), social sciences (12 | 14.6%), business (7 | 8.5%), and communications (7 | 8.5%) are the most common fields of study among 82 individuals in Hot Springs who have obtained a bachelor's degree or higher.
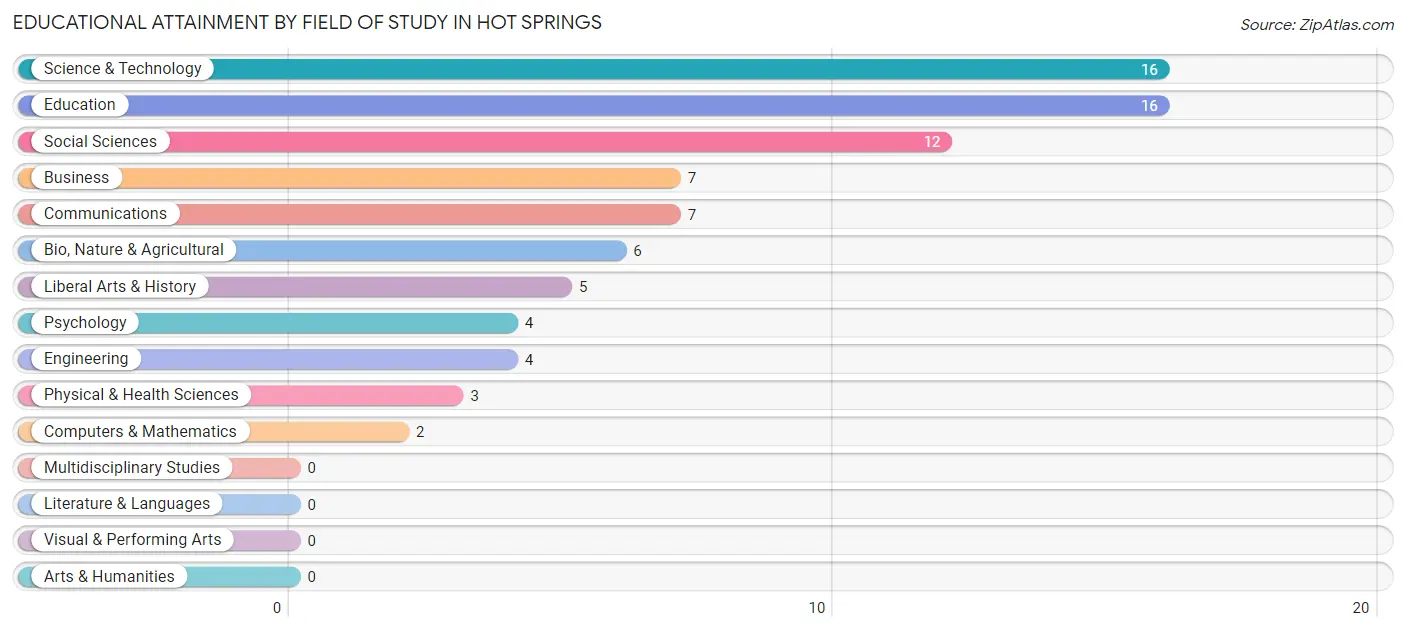
| Field of Study | # Graduates | % Graduates |
| Computers & Mathematics | 2 | 2.4% |
| Bio, Nature & Agricultural | 6 | 7.3% |
| Physical & Health Sciences | 3 | 3.7% |
| Psychology | 4 | 4.9% |
| Social Sciences | 12 | 14.6% |
| Engineering | 4 | 4.9% |
| Multidisciplinary Studies | 0 | 0.0% |
| Science & Technology | 16 | 19.5% |
| Business | 7 | 8.5% |
| Education | 16 | 19.5% |
| Literature & Languages | 0 | 0.0% |
| Liberal Arts & History | 5 | 6.1% |
| Visual & Performing Arts | 0 | 0.0% |
| Communications | 7 | 8.5% |
| Arts & Humanities | 0 | 0.0% |
| Total | 82 | 100.0% |
Transportation & Commute in Hot Springs
Vehicle Availability by Sex in Hot Springs
The most prevalent vehicle ownership categories in Hot Springs are males with 4 vehicles (29, accounting for 30.5%) and females with 4 vehicles (21, making up 33.7%).
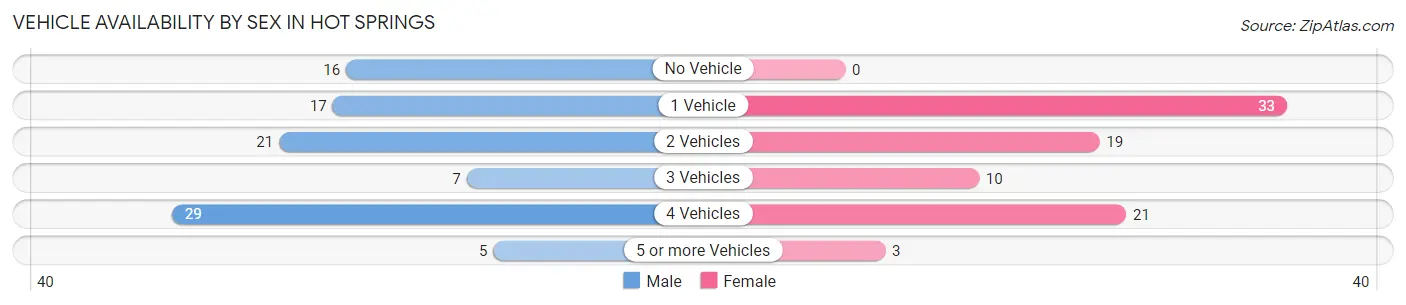
| Vehicles Available | Male | Female |
| No Vehicle | 16 (16.8%) | 0 (0.0%) |
| 1 Vehicle | 17 (17.9%) | 33 (38.4%) |
| 2 Vehicles | 21 (22.1%) | 19 (22.1%) |
| 3 Vehicles | 7 (7.4%) | 10 (11.6%) |
| 4 Vehicles | 29 (30.5%) | 21 (24.4%) |
| 5 or more Vehicles | 5 (5.3%) | 3 (3.5%) |
| Total | 95 (100.0%) | 86 (100.0%) |
Commute Time in Hot Springs
The most frequently occuring commute durations in Hot Springs are 5 to 9 minutes (56 commuters, 35.0%), less than 5 minutes (36 commuters, 22.5%), and 10 to 14 minutes (30 commuters, 18.8%).
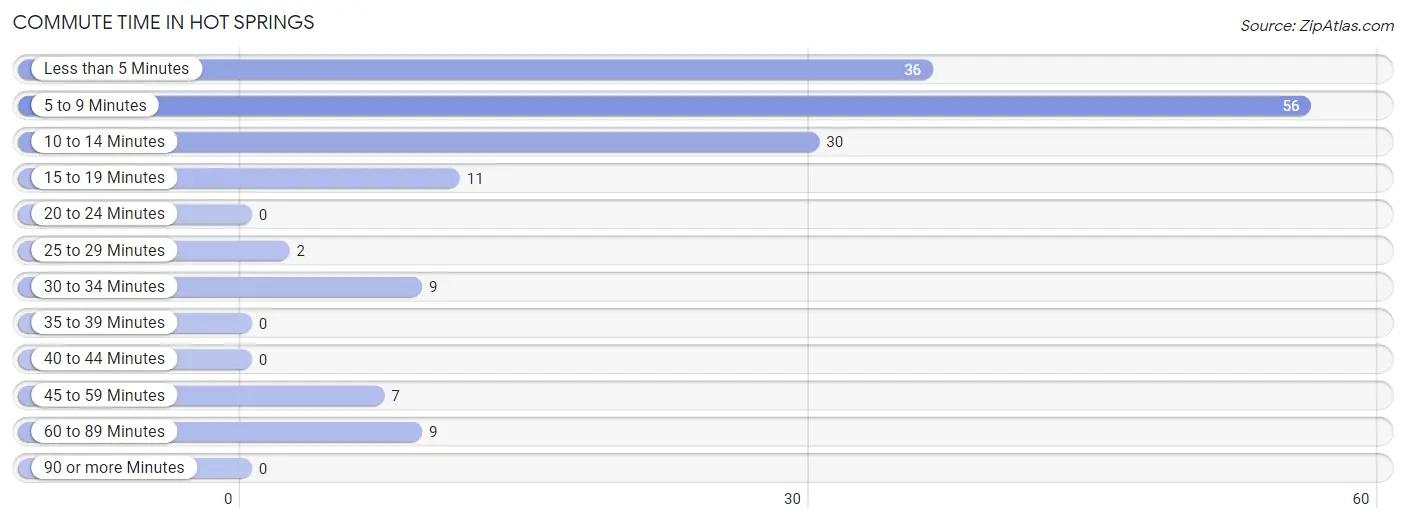
| Commute Time | # Commuters | % Commuters |
| Less than 5 Minutes | 36 | 22.5% |
| 5 to 9 Minutes | 56 | 35.0% |
| 10 to 14 Minutes | 30 | 18.8% |
| 15 to 19 Minutes | 11 | 6.9% |
| 20 to 24 Minutes | 0 | 0.0% |
| 25 to 29 Minutes | 2 | 1.3% |
| 30 to 34 Minutes | 9 | 5.6% |
| 35 to 39 Minutes | 0 | 0.0% |
| 40 to 44 Minutes | 0 | 0.0% |
| 45 to 59 Minutes | 7 | 4.4% |
| 60 to 89 Minutes | 9 | 5.6% |
| 90 or more Minutes | 0 | 0.0% |
Commute Time by Sex in Hot Springs
The most common commute times in Hot Springs are 5 to 9 minutes (26 commuters, 28.6%) for males and 5 to 9 minutes (30 commuters, 43.5%) for females.
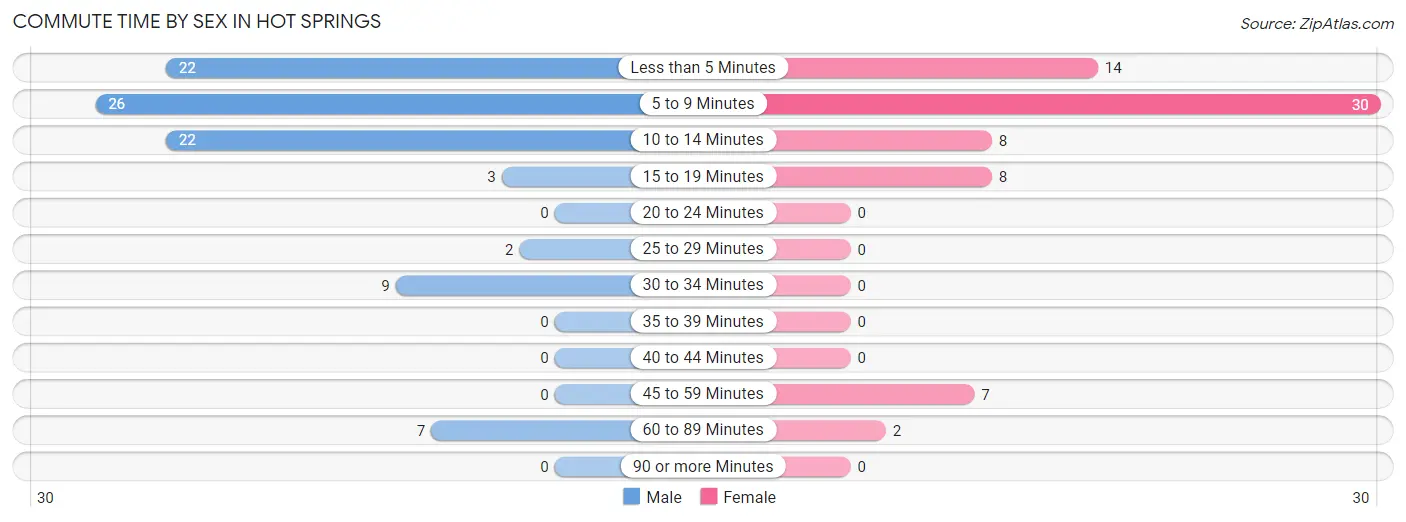
| Commute Time | Male | Female |
| Less than 5 Minutes | 22 (24.2%) | 14 (20.3%) |
| 5 to 9 Minutes | 26 (28.6%) | 30 (43.5%) |
| 10 to 14 Minutes | 22 (24.2%) | 8 (11.6%) |
| 15 to 19 Minutes | 3 (3.3%) | 8 (11.6%) |
| 20 to 24 Minutes | 0 (0.0%) | 0 (0.0%) |
| 25 to 29 Minutes | 2 (2.2%) | 0 (0.0%) |
| 30 to 34 Minutes | 9 (9.9%) | 0 (0.0%) |
| 35 to 39 Minutes | 0 (0.0%) | 0 (0.0%) |
| 40 to 44 Minutes | 0 (0.0%) | 0 (0.0%) |
| 45 to 59 Minutes | 0 (0.0%) | 7 (10.1%) |
| 60 to 89 Minutes | 7 (7.7%) | 2 (2.9%) |
| 90 or more Minutes | 0 (0.0%) | 0 (0.0%) |
Time of Departure to Work by Sex in Hot Springs
The most frequent times of departure to work in Hot Springs are 5:30 AM to 5:59 AM (24, 26.4%) for males and 5:30 AM to 5:59 AM (19, 27.5%) for females.
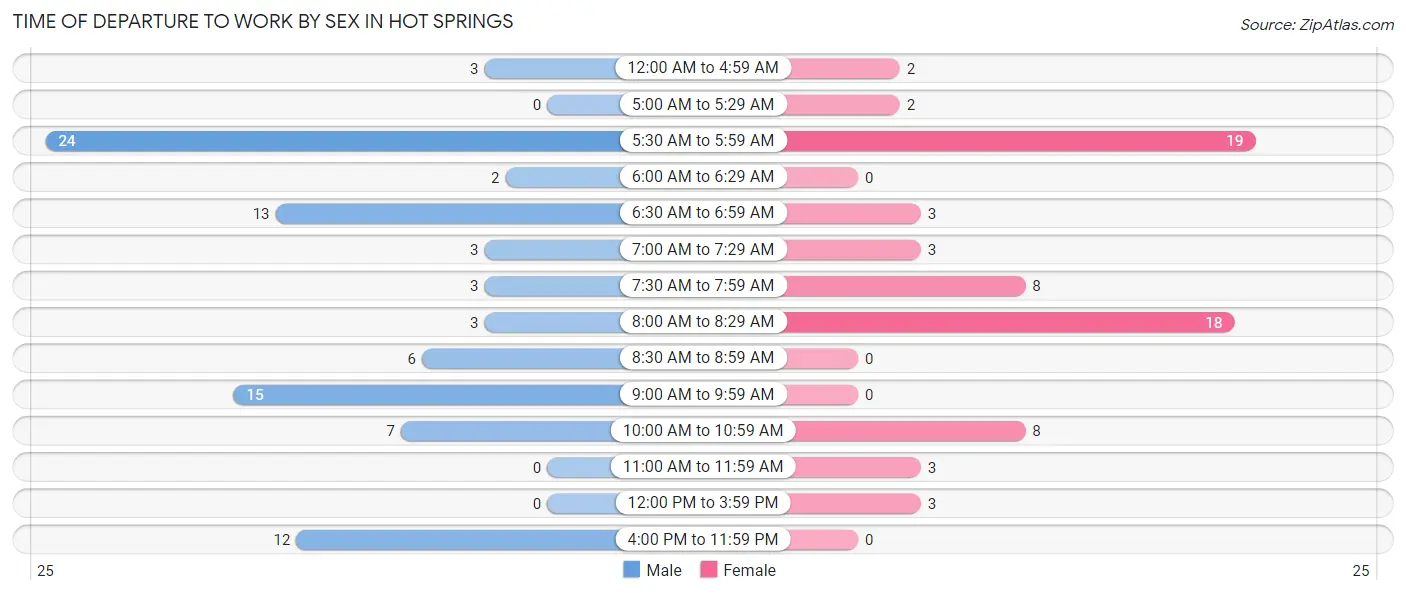
| Time of Departure | Male | Female |
| 12:00 AM to 4:59 AM | 3 (3.3%) | 2 (2.9%) |
| 5:00 AM to 5:29 AM | 0 (0.0%) | 2 (2.9%) |
| 5:30 AM to 5:59 AM | 24 (26.4%) | 19 (27.5%) |
| 6:00 AM to 6:29 AM | 2 (2.2%) | 0 (0.0%) |
| 6:30 AM to 6:59 AM | 13 (14.3%) | 3 (4.3%) |
| 7:00 AM to 7:29 AM | 3 (3.3%) | 3 (4.3%) |
| 7:30 AM to 7:59 AM | 3 (3.3%) | 8 (11.6%) |
| 8:00 AM to 8:29 AM | 3 (3.3%) | 18 (26.1%) |
| 8:30 AM to 8:59 AM | 6 (6.6%) | 0 (0.0%) |
| 9:00 AM to 9:59 AM | 15 (16.5%) | 0 (0.0%) |
| 10:00 AM to 10:59 AM | 7 (7.7%) | 8 (11.6%) |
| 11:00 AM to 11:59 AM | 0 (0.0%) | 3 (4.3%) |
| 12:00 PM to 3:59 PM | 0 (0.0%) | 3 (4.3%) |
| 4:00 PM to 11:59 PM | 12 (13.2%) | 0 (0.0%) |
| Total | 91 (100.0%) | 69 (100.0%) |
Housing Occupancy in Hot Springs
Occupancy by Ownership in Hot Springs
Of the total 294 dwellings in Hot Springs, owner-occupied units account for 163 (55.4%), while renter-occupied units make up 131 (44.6%).
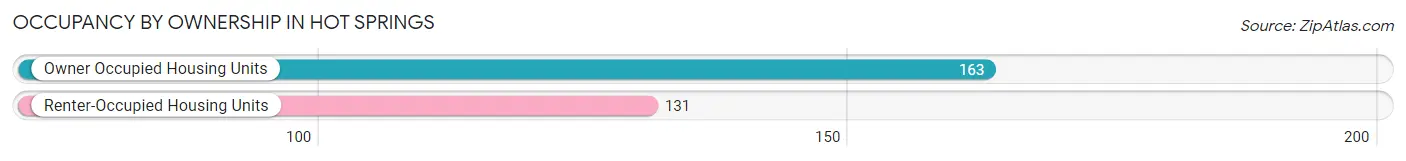
| Occupancy | # Housing Units | % Housing Units |
| Owner Occupied Housing Units | 163 | 55.4% |
| Renter-Occupied Housing Units | 131 | 44.6% |
| Total Occupied Housing Units | 294 | 100.0% |
Occupancy by Household Size in Hot Springs
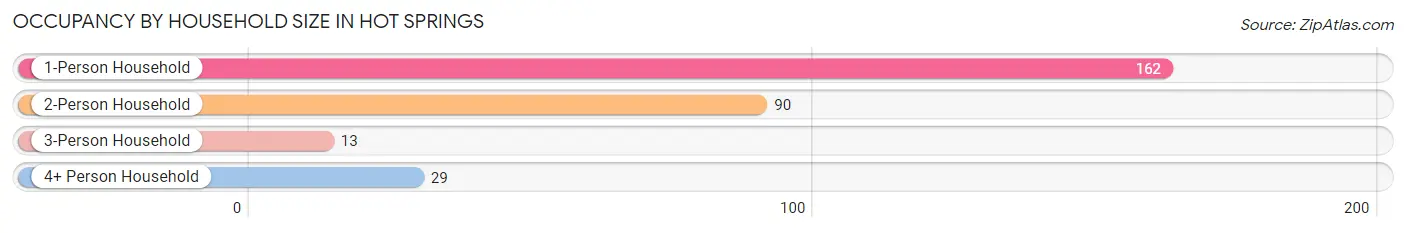
| Household Size | # Housing Units | % Housing Units |
| 1-Person Household | 162 | 55.1% |
| 2-Person Household | 90 | 30.6% |
| 3-Person Household | 13 | 4.4% |
| 4+ Person Household | 29 | 9.9% |
| Total Housing Units | 294 | 100.0% |
Occupancy by Ownership by Household Size in Hot Springs
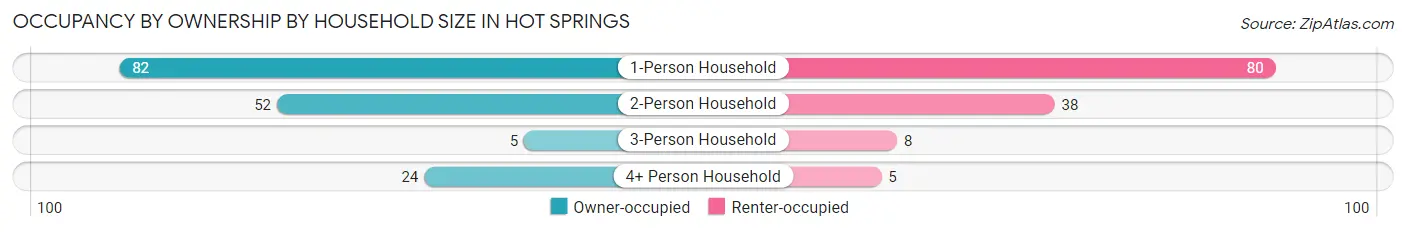
| Household Size | Owner-occupied | Renter-occupied |
| 1-Person Household | 82 (50.6%) | 80 (49.4%) |
| 2-Person Household | 52 (57.8%) | 38 (42.2%) |
| 3-Person Household | 5 (38.5%) | 8 (61.5%) |
| 4+ Person Household | 24 (82.8%) | 5 (17.2%) |
| Total Housing Units | 163 (55.4%) | 131 (44.6%) |
Occupancy by Educational Attainment in Hot Springs
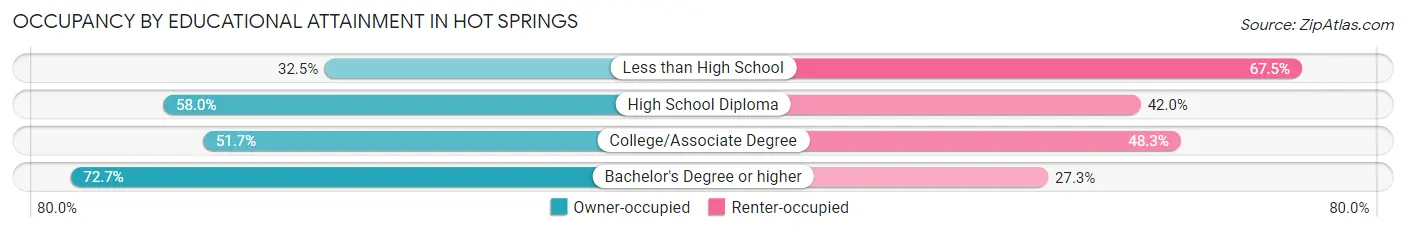
| Household Size | Owner-occupied | Renter-occupied |
| Less than High School | 13 (32.5%) | 27 (67.5%) |
| High School Diploma | 65 (58.0%) | 47 (42.0%) |
| College/Associate Degree | 45 (51.7%) | 42 (48.3%) |
| Bachelor's Degree or higher | 40 (72.7%) | 15 (27.3%) |
Occupancy by Age of Householder in Hot Springs
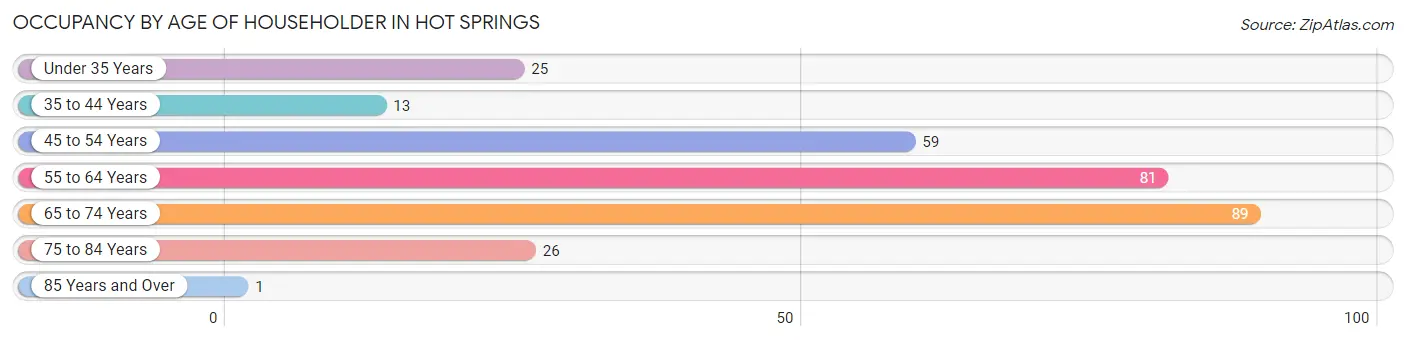
| Age Bracket | # Households | % Households |
| Under 35 Years | 25 | 8.5% |
| 35 to 44 Years | 13 | 4.4% |
| 45 to 54 Years | 59 | 20.1% |
| 55 to 64 Years | 81 | 27.6% |
| 65 to 74 Years | 89 | 30.3% |
| 75 to 84 Years | 26 | 8.8% |
| 85 Years and Over | 1 | 0.3% |
| Total | 294 | 100.0% |
Housing Finances in Hot Springs
Median Income by Occupancy in Hot Springs
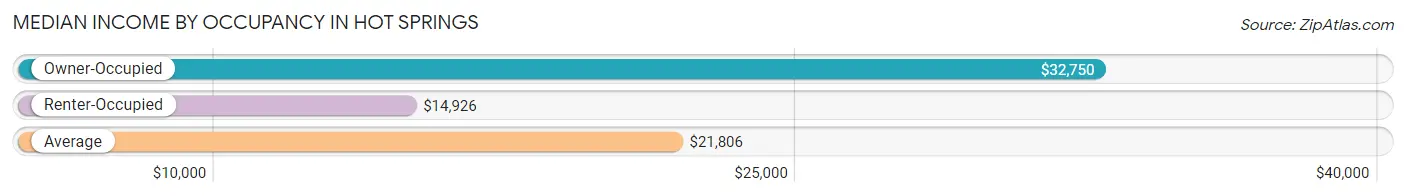
| Occupancy Type | # Households | Median Income |
| Owner-Occupied | 163 (55.4%) | $32,750 |
| Renter-Occupied | 131 (44.6%) | $14,926 |
| Average | 294 (100.0%) | $21,806 |
Occupancy by Householder Income Bracket in Hot Springs
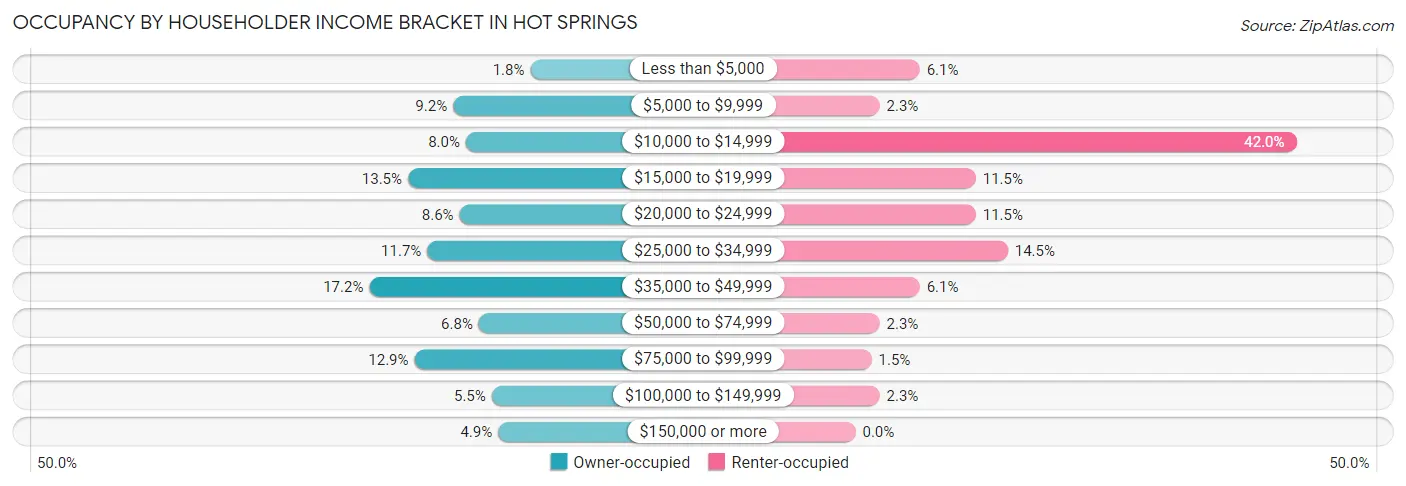
| Income Bracket | Owner-occupied | Renter-occupied |
| Less than $5,000 | 3 (1.8%) | 8 (6.1%) |
| $5,000 to $9,999 | 15 (9.2%) | 3 (2.3%) |
| $10,000 to $14,999 | 13 (8.0%) | 55 (42.0%) |
| $15,000 to $19,999 | 22 (13.5%) | 15 (11.5%) |
| $20,000 to $24,999 | 14 (8.6%) | 15 (11.5%) |
| $25,000 to $34,999 | 19 (11.7%) | 19 (14.5%) |
| $35,000 to $49,999 | 28 (17.2%) | 8 (6.1%) |
| $50,000 to $74,999 | 11 (6.8%) | 3 (2.3%) |
| $75,000 to $99,999 | 21 (12.9%) | 2 (1.5%) |
| $100,000 to $149,999 | 9 (5.5%) | 3 (2.3%) |
| $150,000 or more | 8 (4.9%) | 0 (0.0%) |
| Total | 163 (100.0%) | 131 (100.0%) |
Monthly Housing Cost Tiers in Hot Springs
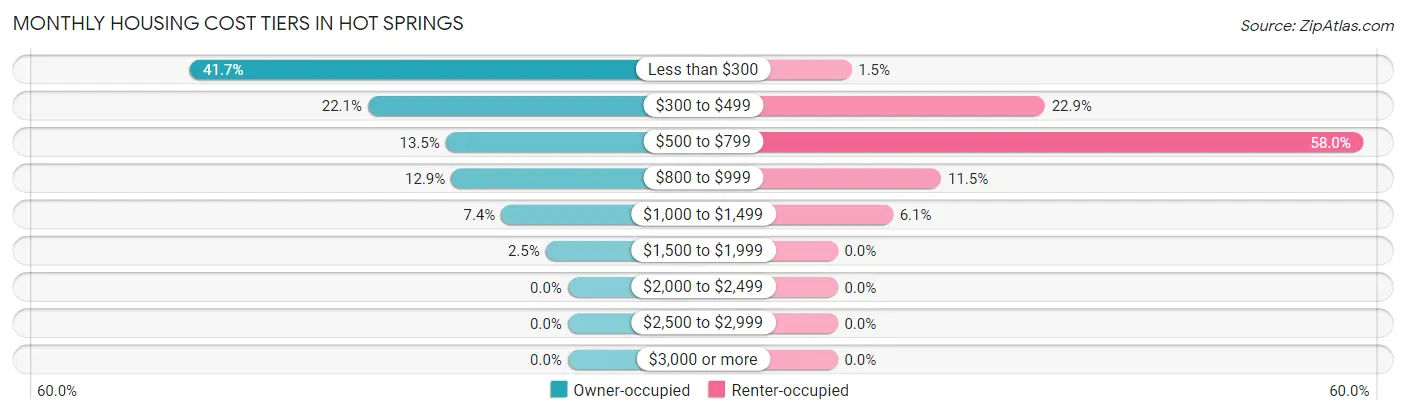
| Monthly Cost | Owner-occupied | Renter-occupied |
| Less than $300 | 68 (41.7%) | 2 (1.5%) |
| $300 to $499 | 36 (22.1%) | 30 (22.9%) |
| $500 to $799 | 22 (13.5%) | 76 (58.0%) |
| $800 to $999 | 21 (12.9%) | 15 (11.5%) |
| $1,000 to $1,499 | 12 (7.4%) | 8 (6.1%) |
| $1,500 to $1,999 | 4 (2.5%) | 0 (0.0%) |
| $2,000 to $2,499 | 0 (0.0%) | 0 (0.0%) |
| $2,500 to $2,999 | 0 (0.0%) | 0 (0.0%) |
| $3,000 or more | 0 (0.0%) | 0 (0.0%) |
| Total | 163 (100.0%) | 131 (100.0%) |
Physical Housing Characteristics in Hot Springs
Housing Structures in Hot Springs
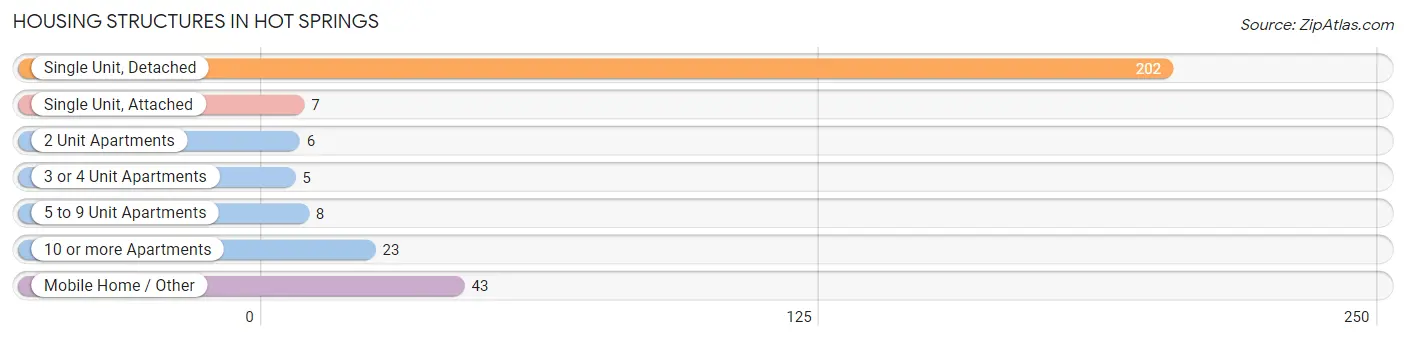
| Structure Type | # Housing Units | % Housing Units |
| Single Unit, Detached | 202 | 68.7% |
| Single Unit, Attached | 7 | 2.4% |
| 2 Unit Apartments | 6 | 2.0% |
| 3 or 4 Unit Apartments | 5 | 1.7% |
| 5 to 9 Unit Apartments | 8 | 2.7% |
| 10 or more Apartments | 23 | 7.8% |
| Mobile Home / Other | 43 | 14.6% |
| Total | 294 | 100.0% |
Housing Structures by Occupancy in Hot Springs
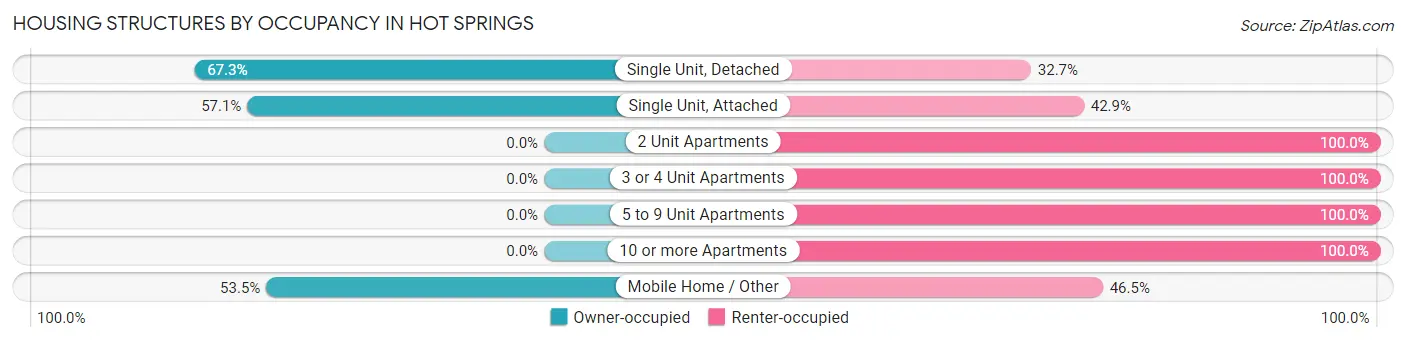
| Structure Type | Owner-occupied | Renter-occupied |
| Single Unit, Detached | 136 (67.3%) | 66 (32.7%) |
| Single Unit, Attached | 4 (57.1%) | 3 (42.9%) |
| 2 Unit Apartments | 0 (0.0%) | 6 (100.0%) |
| 3 or 4 Unit Apartments | 0 (0.0%) | 5 (100.0%) |
| 5 to 9 Unit Apartments | 0 (0.0%) | 8 (100.0%) |
| 10 or more Apartments | 0 (0.0%) | 23 (100.0%) |
| Mobile Home / Other | 23 (53.5%) | 20 (46.5%) |
| Total | 163 (55.4%) | 131 (44.6%) |
Housing Structures by Number of Rooms in Hot Springs
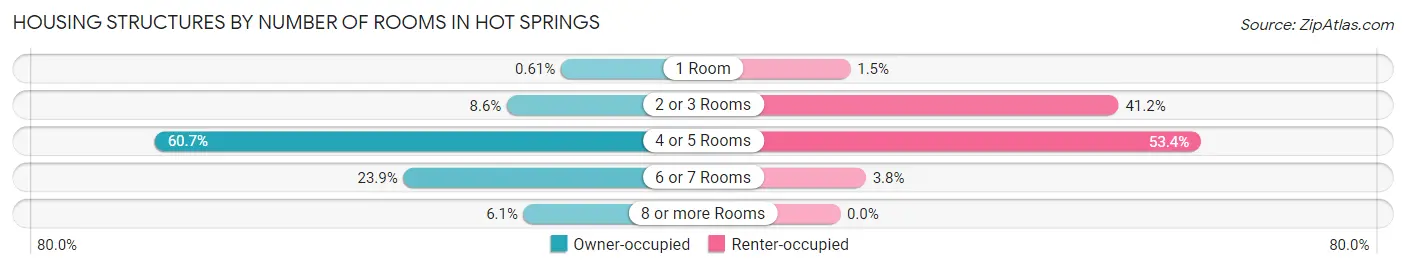
| Number of Rooms | Owner-occupied | Renter-occupied |
| 1 Room | 1 (0.6%) | 2 (1.5%) |
| 2 or 3 Rooms | 14 (8.6%) | 54 (41.2%) |
| 4 or 5 Rooms | 99 (60.7%) | 70 (53.4%) |
| 6 or 7 Rooms | 39 (23.9%) | 5 (3.8%) |
| 8 or more Rooms | 10 (6.1%) | 0 (0.0%) |
| Total | 163 (100.0%) | 131 (100.0%) |
Housing Structure by Heating Type in Hot Springs
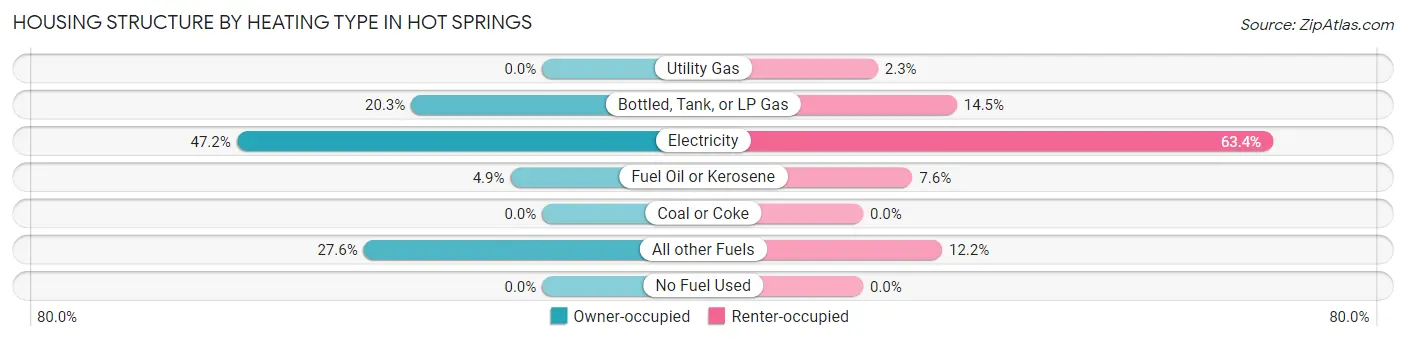
| Heating Type | Owner-occupied | Renter-occupied |
| Utility Gas | 0 (0.0%) | 3 (2.3%) |
| Bottled, Tank, or LP Gas | 33 (20.3%) | 19 (14.5%) |
| Electricity | 77 (47.2%) | 83 (63.4%) |
| Fuel Oil or Kerosene | 8 (4.9%) | 10 (7.6%) |
| Coal or Coke | 0 (0.0%) | 0 (0.0%) |
| All other Fuels | 45 (27.6%) | 16 (12.2%) |
| No Fuel Used | 0 (0.0%) | 0 (0.0%) |
| Total | 163 (100.0%) | 131 (100.0%) |
Household Vehicle Usage in Hot Springs
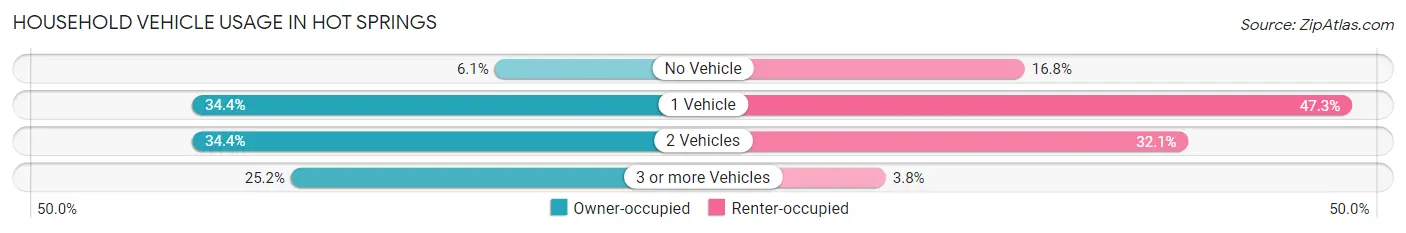
| Vehicles per Household | Owner-occupied | Renter-occupied |
| No Vehicle | 10 (6.1%) | 22 (16.8%) |
| 1 Vehicle | 56 (34.4%) | 62 (47.3%) |
| 2 Vehicles | 56 (34.4%) | 42 (32.1%) |
| 3 or more Vehicles | 41 (25.2%) | 5 (3.8%) |
| Total | 163 (100.0%) | 131 (100.0%) |
Real Estate & Mortgages in Hot Springs
Real Estate and Mortgage Overview in Hot Springs
| Characteristic | Without Mortgage | With Mortgage |
| Housing Units | 108 | 55 |
| Median Property Value | $82,500 | $155,700 |
| Median Household Income | $25,000 | $3 |
| Monthly Housing Costs | $283 | $0 |
| Real Estate Taxes | $912 | $0 |
Property Value by Mortgage Status in Hot Springs
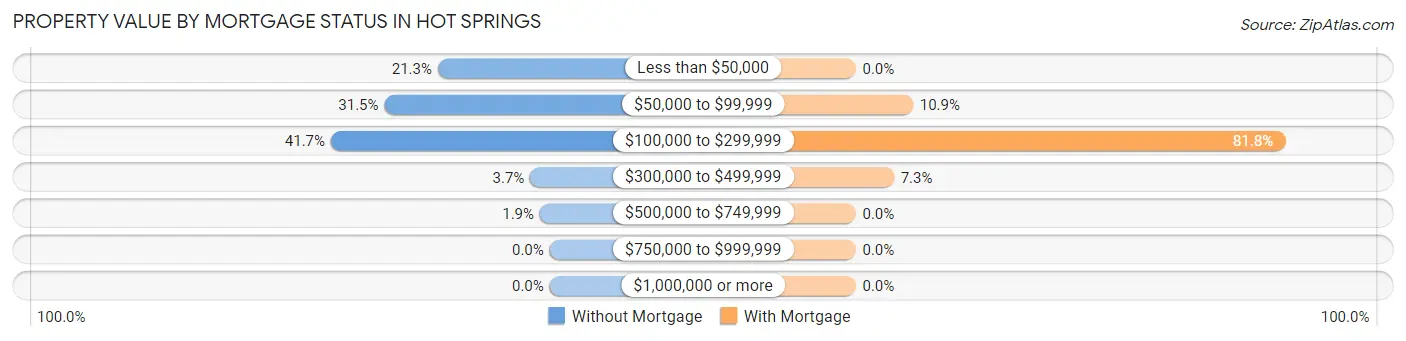
| Property Value | Without Mortgage | With Mortgage |
| Less than $50,000 | 23 (21.3%) | 0 (0.0%) |
| $50,000 to $99,999 | 34 (31.5%) | 6 (10.9%) |
| $100,000 to $299,999 | 45 (41.7%) | 45 (81.8%) |
| $300,000 to $499,999 | 4 (3.7%) | 4 (7.3%) |
| $500,000 to $749,999 | 2 (1.8%) | 0 (0.0%) |
| $750,000 to $999,999 | 0 (0.0%) | 0 (0.0%) |
| $1,000,000 or more | 0 (0.0%) | 0 (0.0%) |
| Total | 108 (100.0%) | 55 (100.0%) |
Household Income by Mortgage Status in Hot Springs
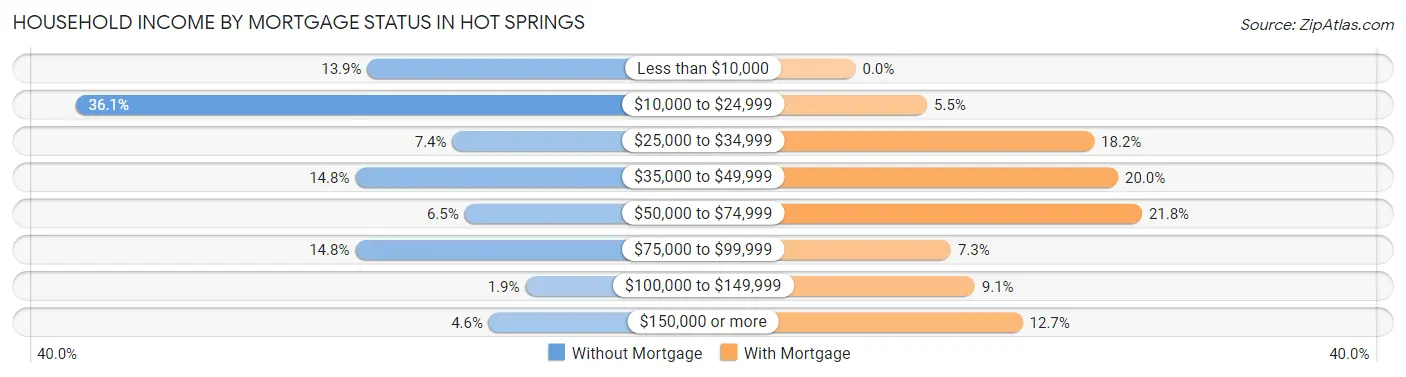
| Household Income | Without Mortgage | With Mortgage |
| Less than $10,000 | 15 (13.9%) | 0 (0.0%) |
| $10,000 to $24,999 | 39 (36.1%) | 3 (5.4%) |
| $25,000 to $34,999 | 8 (7.4%) | 10 (18.2%) |
| $35,000 to $49,999 | 16 (14.8%) | 11 (20.0%) |
| $50,000 to $74,999 | 7 (6.5%) | 12 (21.8%) |
| $75,000 to $99,999 | 16 (14.8%) | 4 (7.3%) |
| $100,000 to $149,999 | 2 (1.8%) | 5 (9.1%) |
| $150,000 or more | 5 (4.6%) | 7 (12.7%) |
| Total | 108 (100.0%) | 55 (100.0%) |
Property Value to Household Income Ratio in Hot Springs
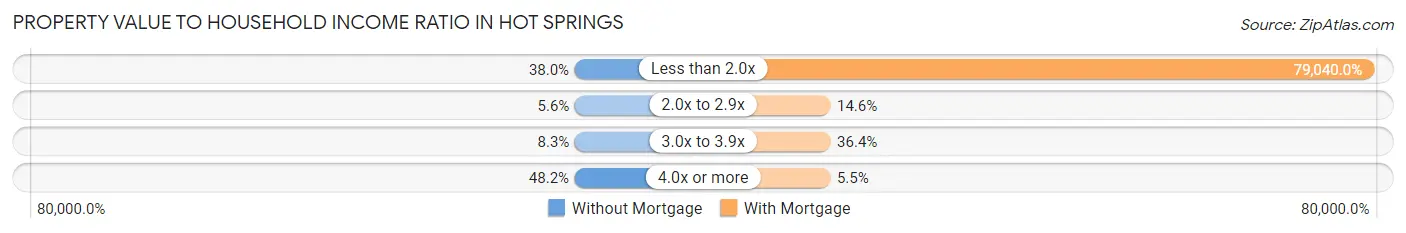
| Value-to-Income Ratio | Without Mortgage | With Mortgage |
| Less than 2.0x | 41 (38.0%) | 43,472 (79,040.0%) |
| 2.0x to 2.9x | 6 (5.6%) | 8 (14.5%) |
| 3.0x to 3.9x | 9 (8.3%) | 20 (36.4%) |
| 4.0x or more | 52 (48.1%) | 3 (5.4%) |
| Total | 108 (100.0%) | 55 (100.0%) |
Real Estate Taxes by Mortgage Status in Hot Springs
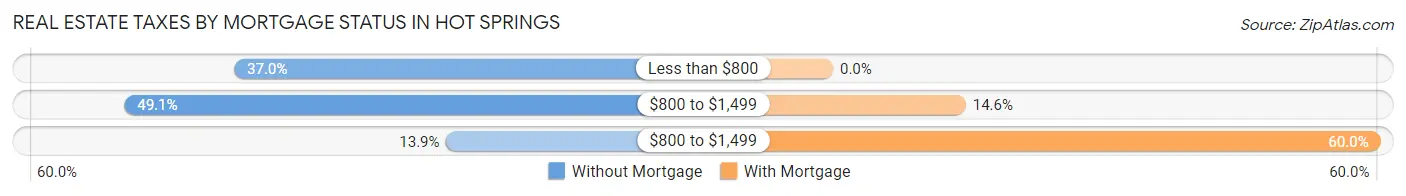
| Property Taxes | Without Mortgage | With Mortgage |
| Less than $800 | 40 (37.0%) | 0 (0.0%) |
| $800 to $1,499 | 53 (49.1%) | 8 (14.5%) |
| $800 to $1,499 | 15 (13.9%) | 33 (60.0%) |
| Total | 108 (100.0%) | 55 (100.0%) |
Health & Disability in Hot Springs
Health Insurance Coverage by Age in Hot Springs
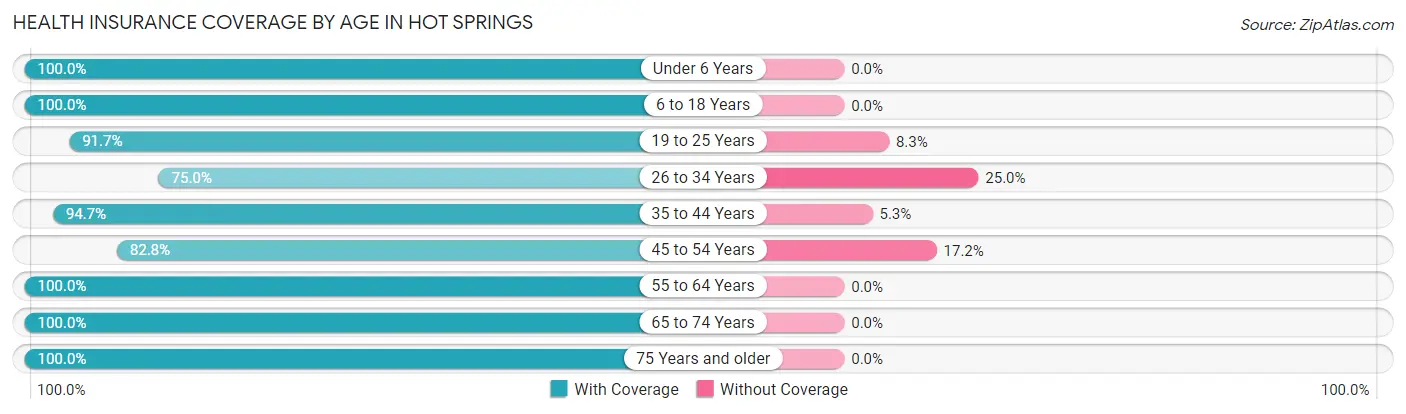
| Age Bracket | With Coverage | Without Coverage |
| Under 6 Years | 10 (100.0%) | 0 (0.0%) |
| 6 to 18 Years | 66 (100.0%) | 0 (0.0%) |
| 19 to 25 Years | 33 (91.7%) | 3 (8.3%) |
| 26 to 34 Years | 39 (75.0%) | 13 (25.0%) |
| 35 to 44 Years | 36 (94.7%) | 2 (5.3%) |
| 45 to 54 Years | 101 (82.8%) | 21 (17.2%) |
| 55 to 64 Years | 99 (100.0%) | 0 (0.0%) |
| 65 to 74 Years | 113 (100.0%) | 0 (0.0%) |
| 75 Years and older | 46 (100.0%) | 0 (0.0%) |
| Total | 543 (93.3%) | 39 (6.7%) |
Health Insurance Coverage by Citizenship Status in Hot Springs
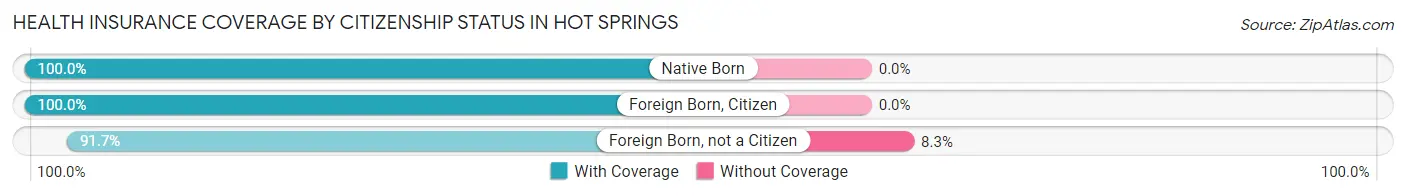
| Citizenship Status | With Coverage | Without Coverage |
| Native Born | 10 (100.0%) | 0 (0.0%) |
| Foreign Born, Citizen | 66 (100.0%) | 0 (0.0%) |
| Foreign Born, not a Citizen | 33 (91.7%) | 3 (8.3%) |
Health Insurance Coverage by Household Income in Hot Springs
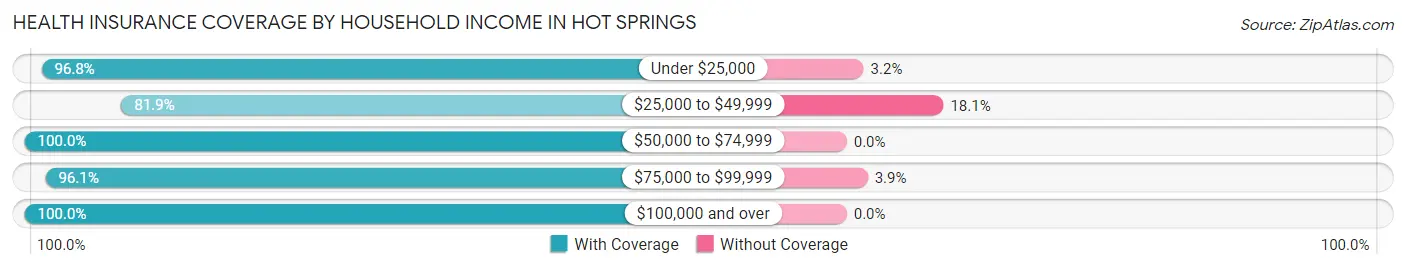
| Household Income | With Coverage | Without Coverage |
| Under $25,000 | 245 (96.8%) | 8 (3.2%) |
| $25,000 to $49,999 | 122 (81.9%) | 27 (18.1%) |
| $50,000 to $74,999 | 37 (100.0%) | 0 (0.0%) |
| $75,000 to $99,999 | 98 (96.1%) | 4 (3.9%) |
| $100,000 and over | 41 (100.0%) | 0 (0.0%) |
Public vs Private Health Insurance Coverage by Age in Hot Springs
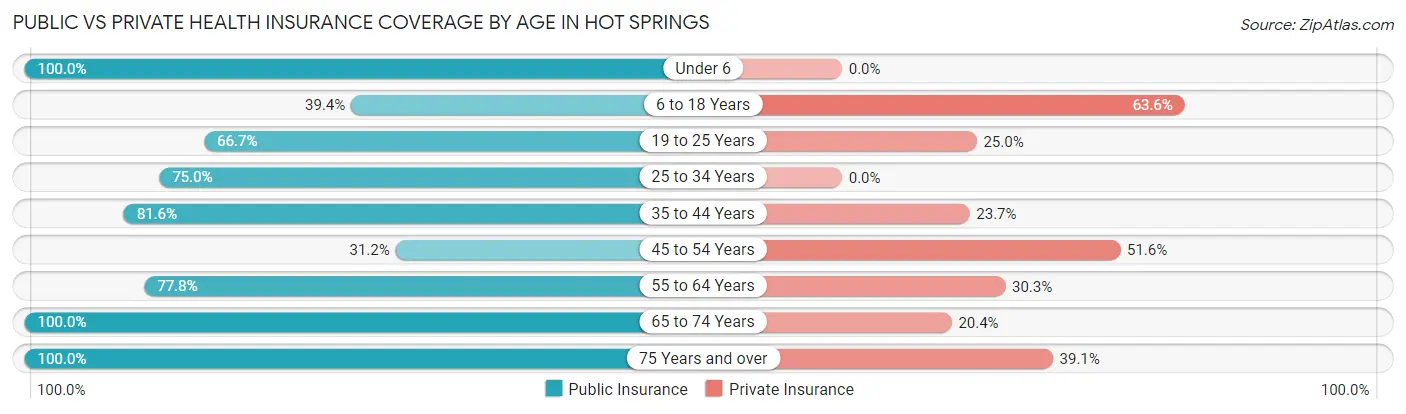
| Age Bracket | Public Insurance | Private Insurance |
| Under 6 | 10 (100.0%) | 0 (0.0%) |
| 6 to 18 Years | 26 (39.4%) | 42 (63.6%) |
| 19 to 25 Years | 24 (66.7%) | 9 (25.0%) |
| 25 to 34 Years | 39 (75.0%) | 0 (0.0%) |
| 35 to 44 Years | 31 (81.6%) | 9 (23.7%) |
| 45 to 54 Years | 38 (31.1%) | 63 (51.6%) |
| 55 to 64 Years | 77 (77.8%) | 30 (30.3%) |
| 65 to 74 Years | 113 (100.0%) | 23 (20.3%) |
| 75 Years and over | 46 (100.0%) | 18 (39.1%) |
| Total | 404 (69.4%) | 194 (33.3%) |
Disability Status by Sex by Age in Hot Springs
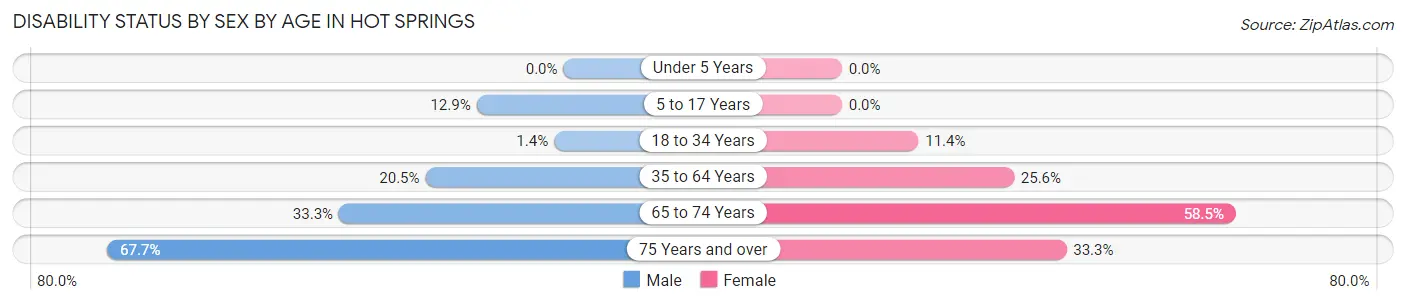
| Age Bracket | Male | Female |
| Under 5 Years | 0 (0.0%) | 0 (0.0%) |
| 5 to 17 Years | 4 (12.9%) | 0 (0.0%) |
| 18 to 34 Years | 1 (1.4%) | 5 (11.4%) |
| 35 to 64 Years | 25 (20.5%) | 35 (25.6%) |
| 65 to 74 Years | 20 (33.3%) | 31 (58.5%) |
| 75 Years and over | 21 (67.7%) | 5 (33.3%) |
Disability Class by Sex by Age in Hot Springs
Disability Class: Hearing Difficulty
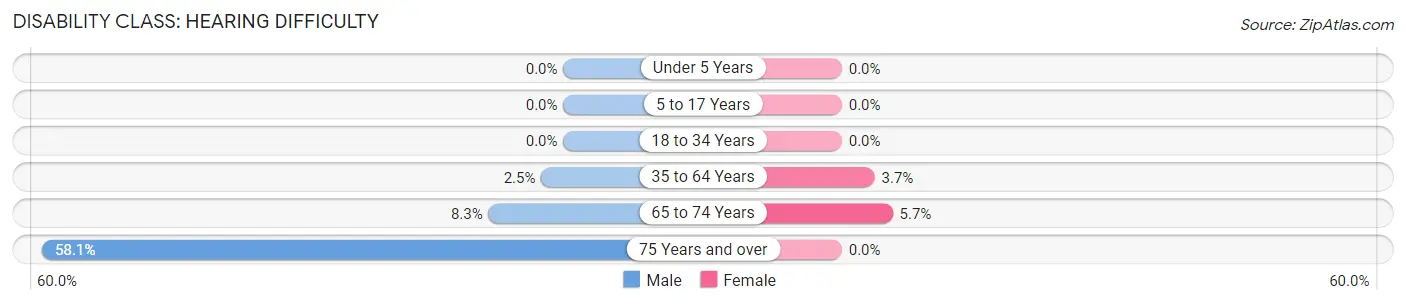
| Age Bracket | Male | Female |
| Under 5 Years | 0 (0.0%) | 0 (0.0%) |
| 5 to 17 Years | 0 (0.0%) | 0 (0.0%) |
| 18 to 34 Years | 0 (0.0%) | 0 (0.0%) |
| 35 to 64 Years | 3 (2.5%) | 5 (3.6%) |
| 65 to 74 Years | 5 (8.3%) | 3 (5.7%) |
| 75 Years and over | 18 (58.1%) | 0 (0.0%) |
Disability Class: Vision Difficulty
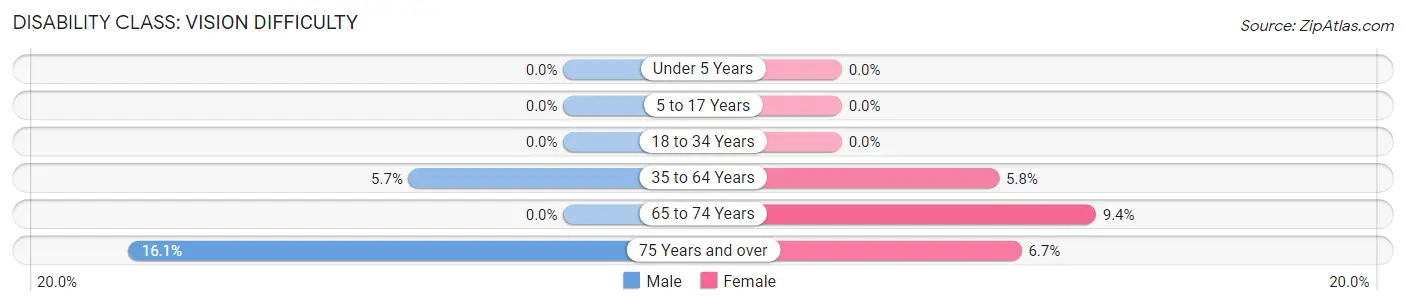
| Age Bracket | Male | Female |
| Under 5 Years | 0 (0.0%) | 0 (0.0%) |
| 5 to 17 Years | 0 (0.0%) | 0 (0.0%) |
| 18 to 34 Years | 0 (0.0%) | 0 (0.0%) |
| 35 to 64 Years | 7 (5.7%) | 8 (5.8%) |
| 65 to 74 Years | 0 (0.0%) | 5 (9.4%) |
| 75 Years and over | 5 (16.1%) | 1 (6.7%) |
Disability Class: Cognitive Difficulty
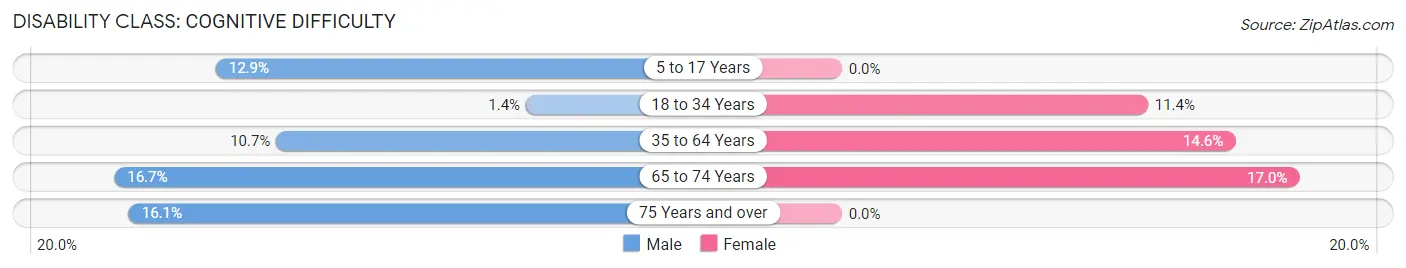
| Age Bracket | Male | Female |
| 5 to 17 Years | 4 (12.9%) | 0 (0.0%) |
| 18 to 34 Years | 1 (1.4%) | 5 (11.4%) |
| 35 to 64 Years | 13 (10.7%) | 20 (14.6%) |
| 65 to 74 Years | 10 (16.7%) | 9 (17.0%) |
| 75 Years and over | 5 (16.1%) | 0 (0.0%) |
Disability Class: Ambulatory Difficulty
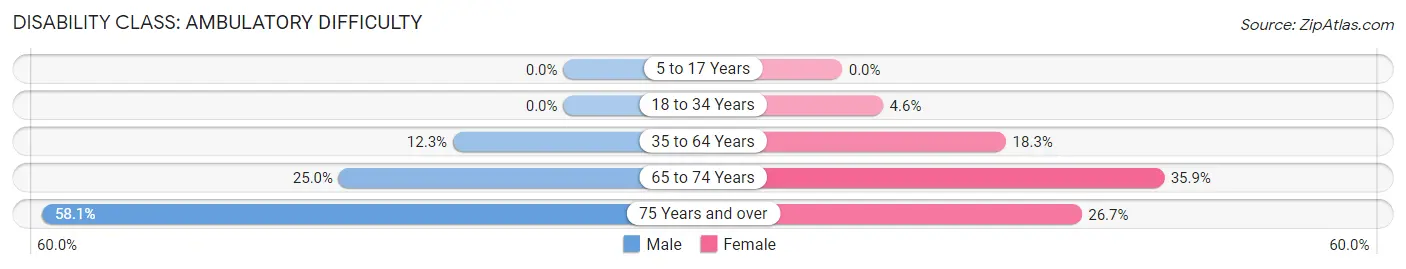
| Age Bracket | Male | Female |
| 5 to 17 Years | 0 (0.0%) | 0 (0.0%) |
| 18 to 34 Years | 0 (0.0%) | 2 (4.5%) |
| 35 to 64 Years | 15 (12.3%) | 25 (18.2%) |
| 65 to 74 Years | 15 (25.0%) | 19 (35.8%) |
| 75 Years and over | 18 (58.1%) | 4 (26.7%) |
Disability Class: Self-Care Difficulty
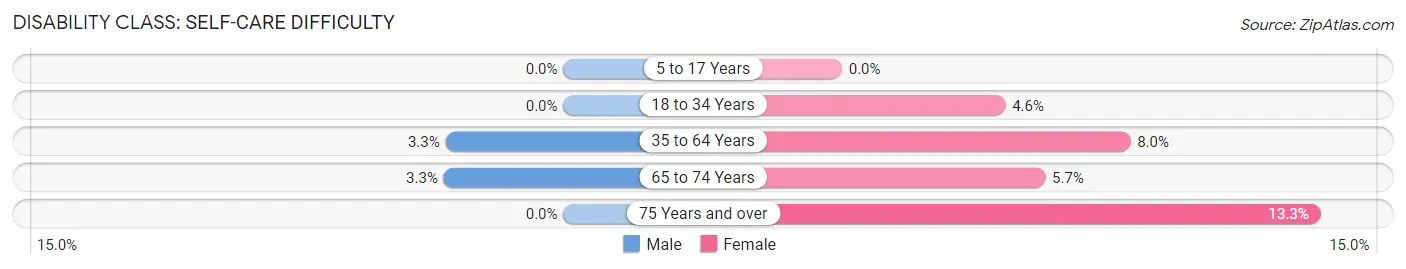
| Age Bracket | Male | Female |
| 5 to 17 Years | 0 (0.0%) | 0 (0.0%) |
| 18 to 34 Years | 0 (0.0%) | 2 (4.5%) |
| 35 to 64 Years | 4 (3.3%) | 11 (8.0%) |
| 65 to 74 Years | 2 (3.3%) | 3 (5.7%) |
| 75 Years and over | 0 (0.0%) | 2 (13.3%) |
Technology Access in Hot Springs
Computing Device Access in Hot Springs
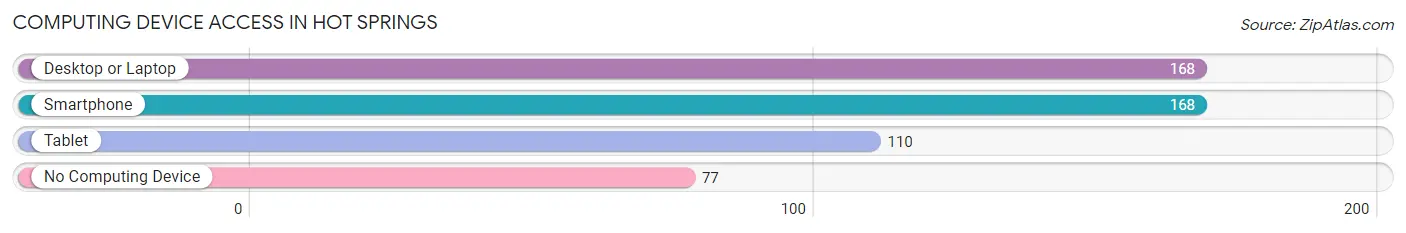
| Device Type | # Households | % Households |
| Desktop or Laptop | 168 | 57.1% |
| Smartphone | 168 | 57.1% |
| Tablet | 110 | 37.4% |
| No Computing Device | 77 | 26.2% |
| Total | 294 | 100.0% |
Internet Access in Hot Springs
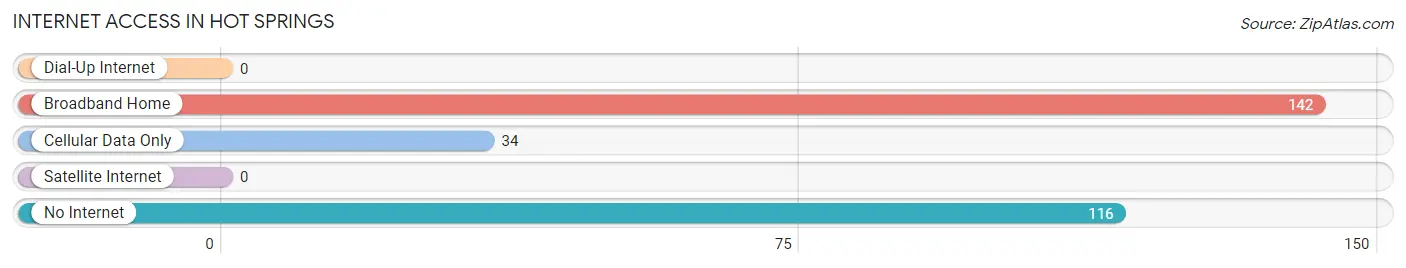
| Internet Type | # Households | % Households |
| Dial-Up Internet | 0 | 0.0% |
| Broadband Home | 142 | 48.3% |
| Cellular Data Only | 34 | 11.6% |
| Satellite Internet | 0 | 0.0% |
| No Internet | 116 | 39.5% |
| Total | 294 | 100.0% |
Hot Springs Summary
History
Hot Springs, Montana is a small town located in the southwestern corner of the state, near the Idaho border. It was founded in 1883 by a group of settlers who were looking for a place to settle and build a community. The town was named after the hot springs that were discovered nearby. The hot springs were believed to have healing properties and were used by the Native Americans for centuries.
The town grew quickly and soon became a popular destination for tourists. Hotels, restaurants, and other businesses were built to accommodate the influx of visitors. The town also became a popular destination for health seekers, as the hot springs were believed to have healing properties.
In the early 1900s, the town was a popular destination for celebrities and politicians. President Theodore Roosevelt visited the town in 1903 and was so impressed with the hot springs that he declared them a national monument.
The town continued to grow and prosper until the Great Depression hit in the 1930s. Many businesses closed and the population declined. The town was able to survive the depression, however, and continued to thrive.
In the 1950s, the town began to experience a resurgence in popularity. Hotels and restaurants were built to accommodate the influx of tourists. The town also became a popular destination for health seekers, as the hot springs were believed to have healing properties.
In the 1970s, the town experienced a decline in popularity as the hot springs were no longer believed to have healing properties. The town was able to survive, however, and continued to thrive.
Today, Hot Springs is a small town with a population of just over 1,000 people. It is a popular destination for tourists, as the hot springs are still believed to have healing properties. The town also has a variety of restaurants, shops, and other businesses.
Geography
Hot Springs is located in the southwestern corner of Montana, near the Idaho border. It is situated in the Rocky Mountains, at an elevation of 4,800 feet. The town is surrounded by mountains and forests, and is home to a variety of wildlife.
The climate in Hot Springs is generally mild, with temperatures ranging from the low 30s in the winter to the high 80s in the summer. The town receives an average of 18 inches of precipitation per year.
Economy
The economy of Hot Springs is largely based on tourism. The town is a popular destination for tourists, as the hot springs are still believed to have healing properties. The town also has a variety of restaurants, shops, and other businesses.
The town is also home to a variety of industries, including logging, mining, and ranching. The town is also home to a number of small businesses, such as art galleries, antique stores, and gift shops.
Demographics
As of the 2010 census, the population of Hot Springs was 1,072. The town is predominantly white, with a small percentage of African Americans, Native Americans, and other races. The median household income is $37,500, and the median age is 44.
Conclusion
Hot Springs, Montana is a small town located in the southwestern corner of the state, near the Idaho border. It was founded in 1883 by a group of settlers who were looking for a place to settle and build a community. The town is a popular destination for tourists, as the hot springs are still believed to have healing properties. The town also has a variety of restaurants, shops, and other businesses. The economy of Hot Springs is largely based on tourism, and the town is predominantly white, with a small percentage of African Americans, Native Americans, and other races.
Common Questions
What is Per Capita Income in Hot Springs?
Per Capita income in Hot Springs is $20,113.
What is the Median Family Income in Hot Springs?
Median Family Income in Hot Springs is $36,250.
What is the Median Household income in Hot Springs?
Median Household Income in Hot Springs is $21,806.
What is Income or Wage Gap in Hot Springs?
Income or Wage Gap in Hot Springs is 18.9%.
Women in Hot Springs earn 81.1 cents for every dollar earned by a man.
What is Inequality or Gini Index in Hot Springs?
Inequality or Gini Index in Hot Springs is 0.49.
What is the Total Population of Hot Springs?
Total Population of Hot Springs is 613.
What is the Total Male Population of Hot Springs?
Total Male Population of Hot Springs is 347.
What is the Total Female Population of Hot Springs?
Total Female Population of Hot Springs is 266.
What is the Ratio of Males per 100 Females in Hot Springs?
There are 130.45 Males per 100 Females in Hot Springs.
What is the Ratio of Females per 100 Males in Hot Springs?
There are 76.66 Females per 100 Males in Hot Springs.
What is the Median Population Age in Hot Springs?
Median Population Age in Hot Springs is 52.7 Years.
What is the Average Family Size in Hot Springs
Average Family Size in Hot Springs is 3.1 People.
What is the Average Household Size in Hot Springs
Average Household Size in Hot Springs is 2.0 People.
How Large is the Labor Force in Hot Springs?
There are 200 People in the Labor Forcein in Hot Springs.
What is the Percentage of People in the Labor Force in Hot Springs?
35.0% of People are in the Labor Force in Hot Springs.
What is the Unemployment Rate in Hot Springs?
Unemployment Rate in Hot Springs is 9.5%.