Reed Point, MT Map & Demographics
Reed Point Map
Reed Point Overview
$34,358
PER CAPITA INCOME
$84,038
AVG FAMILY INCOME
$61,250
AVG HOUSEHOLD INCOME
6.1%
WAGE / INCOME GAP [ % ]
93.9¢/ $1
WAGE / INCOME GAP [ $ ]
0.49
INEQUALITY / GINI INDEX
175
TOTAL POPULATION
87
MALE POPULATION
88
FEMALE POPULATION
98.86
MALES / 100 FEMALES
101.15
FEMALES / 100 MALES
53.8
MEDIAN AGE
2.9
AVG FAMILY SIZE
2.2
AVG HOUSEHOLD SIZE
86
LABOR FORCE [ PEOPLE ]
54.1%
PERCENT IN LABOR FORCE
Reed Point Zip Codes
Reed Point Area Codes
Income in Reed Point
Income Overview in Reed Point
Per Capita Income in Reed Point is $34,358, while median incomes of families and households are $84,038 and $61,250 respectively.
| Characteristic | Number | Measure |
| Per Capita Income | 175 | $34,358 |
| Median Family Income | 50 | $84,038 |
| Mean Family Income | 50 | $97,140 |
| Median Household Income | 78 | $61,250 |
| Mean Household Income | 78 | $72,421 |
| Income Deficit | 50 | $0 |
| Wage / Income Gap (%) | 175 | 6.10% |
| Wage / Income Gap ($) | 175 | 93.90¢ per $1 |
| Gini / Inequality Index | 175 | 0.49 |
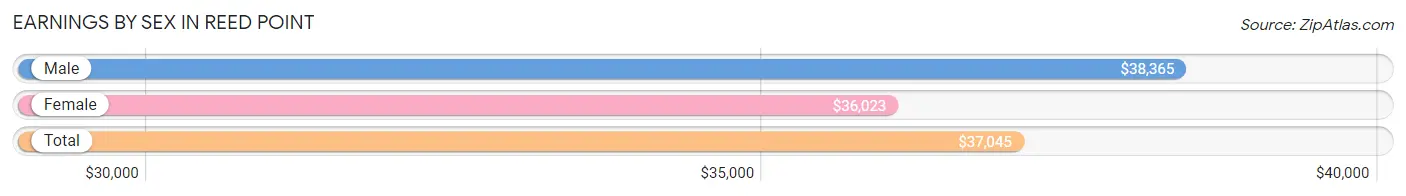
Earnings by Sex in Reed Point
Average Earnings in Reed Point are $37,045, $38,365 for men and $36,023 for women, a difference of 6.1%.
| Sex | Number | Average Earnings |
| Male | 51 (53.1%) | $38,365 |
| Female | 45 (46.9%) | $36,023 |
| Total | 96 (100.0%) | $37,045 |
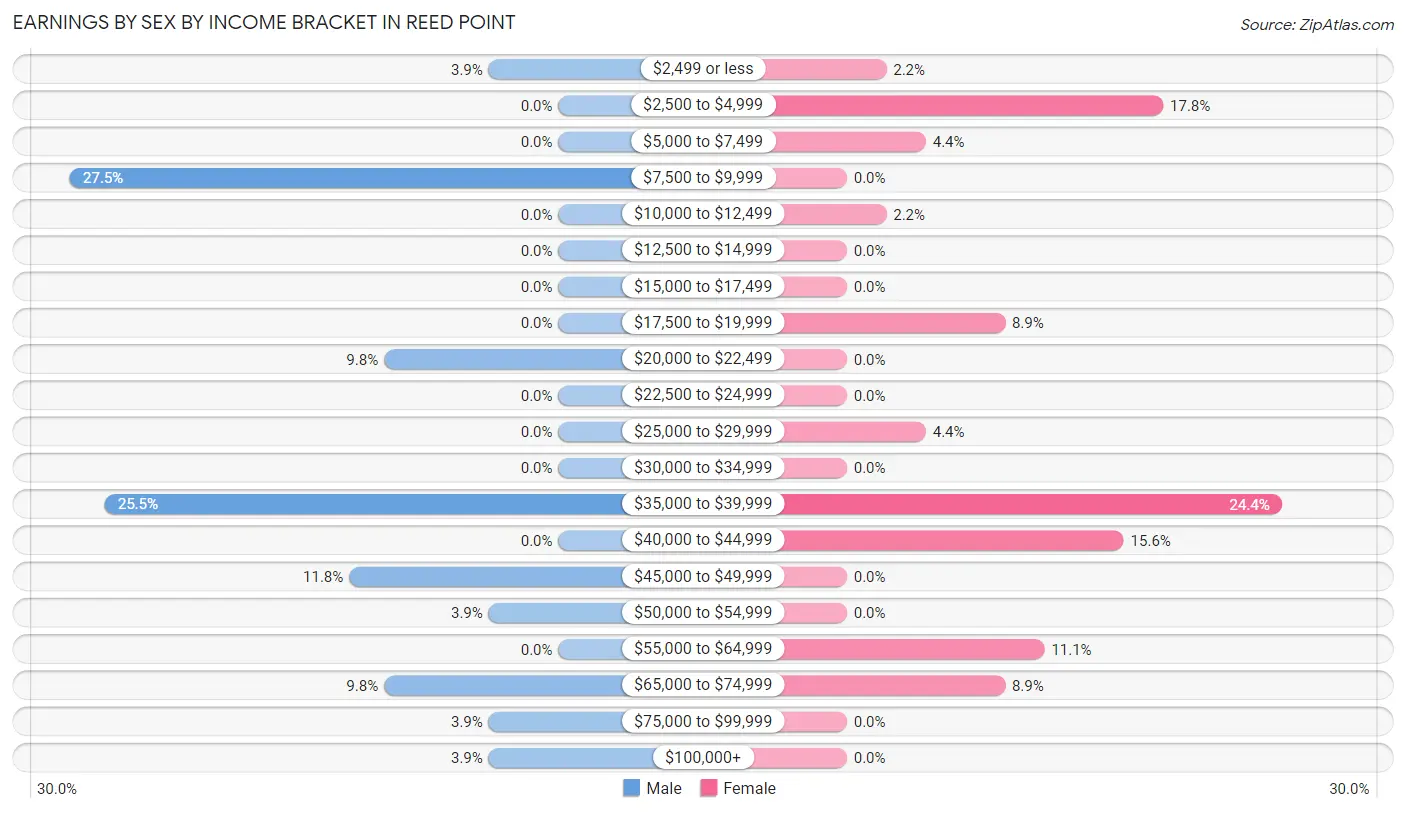
Earnings by Sex by Income Bracket in Reed Point
The most common earnings brackets in Reed Point are $7,500 to $9,999 for men (14 | 27.5%) and $35,000 to $39,999 for women (11 | 24.4%).
| Income | Male | Female |
| $2,499 or less | 2 (3.9%) | 1 (2.2%) |
| $2,500 to $4,999 | 0 (0.0%) | 8 (17.8%) |
| $5,000 to $7,499 | 0 (0.0%) | 2 (4.4%) |
| $7,500 to $9,999 | 14 (27.5%) | 0 (0.0%) |
| $10,000 to $12,499 | 0 (0.0%) | 1 (2.2%) |
| $12,500 to $14,999 | 0 (0.0%) | 0 (0.0%) |
| $15,000 to $17,499 | 0 (0.0%) | 0 (0.0%) |
| $17,500 to $19,999 | 0 (0.0%) | 4 (8.9%) |
| $20,000 to $22,499 | 5 (9.8%) | 0 (0.0%) |
| $22,500 to $24,999 | 0 (0.0%) | 0 (0.0%) |
| $25,000 to $29,999 | 0 (0.0%) | 2 (4.4%) |
| $30,000 to $34,999 | 0 (0.0%) | 0 (0.0%) |
| $35,000 to $39,999 | 13 (25.5%) | 11 (24.4%) |
| $40,000 to $44,999 | 0 (0.0%) | 7 (15.6%) |
| $45,000 to $49,999 | 6 (11.8%) | 0 (0.0%) |
| $50,000 to $54,999 | 2 (3.9%) | 0 (0.0%) |
| $55,000 to $64,999 | 0 (0.0%) | 5 (11.1%) |
| $65,000 to $74,999 | 5 (9.8%) | 4 (8.9%) |
| $75,000 to $99,999 | 2 (3.9%) | 0 (0.0%) |
| $100,000+ | 2 (3.9%) | 0 (0.0%) |
| Total | 51 (100.0%) | 45 (100.0%) |
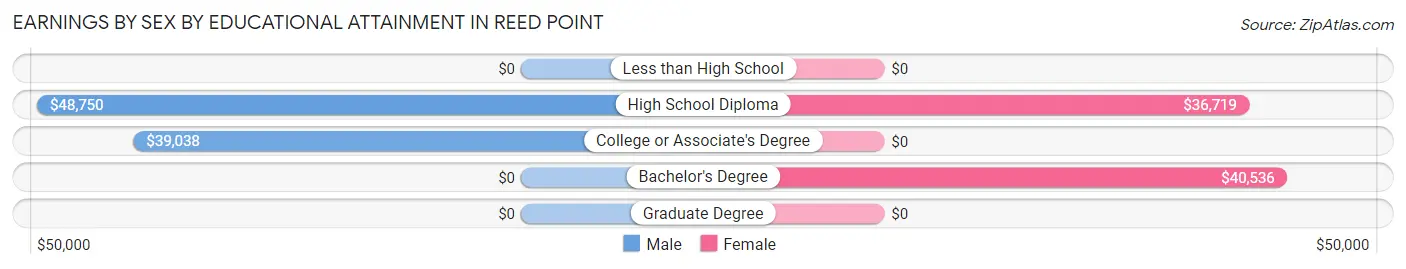
Earnings by Sex by Educational Attainment in Reed Point
Average earnings in Reed Point are $39,712 for men and $36,477 for women, a difference of 8.2%. Men with an educational attainment of high school diploma enjoy the highest average annual earnings of $48,750, while those with college or associate's degree education earn the least with $39,038. Women with an educational attainment of bachelor's degree earn the most with the average annual earnings of $40,536, while those with high school diploma education have the smallest earnings of $36,719.
| Educational Attainment | Male Income | Female Income |
| Less than High School | - | - |
| High School Diploma | $48,750 | $36,719 |
| College or Associate's Degree | $39,038 | $0 |
| Bachelor's Degree | - | - |
| Graduate Degree | - | - |
| Total | $39,712 | $36,477 |
Family Income in Reed Point
Family Income Brackets in Reed Point
According to the Reed Point family income data, there are 17 families falling into the $75,000 to $99,999 income range, which is the most common income bracket and makes up 34.0% of all families.
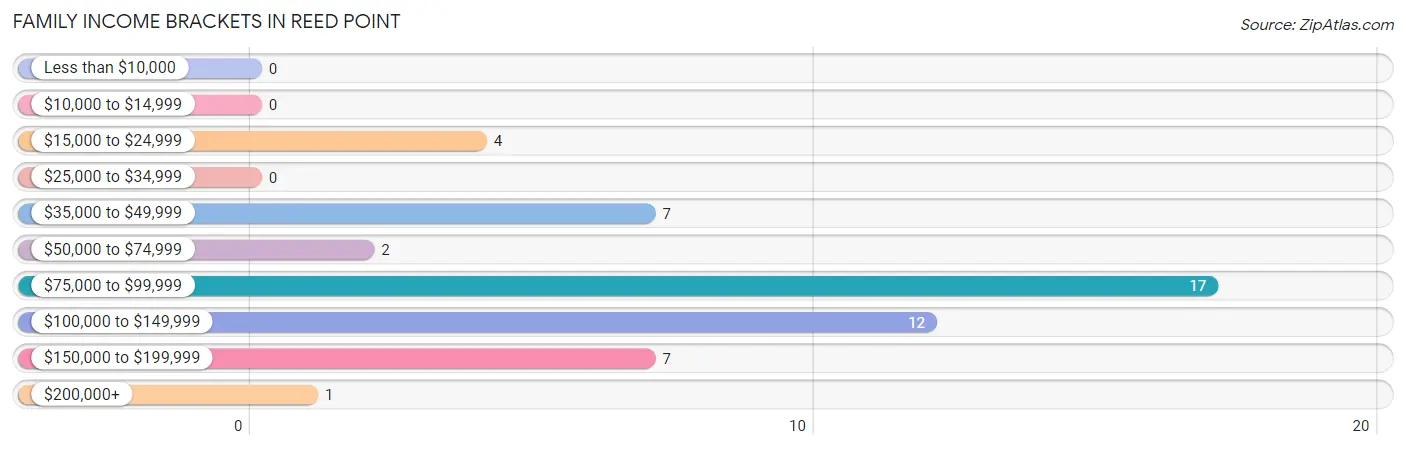
| Income Bracket | # Families | % Families |
| Less than $10,000 | 0 | 0.0% |
| $10,000 to $14,999 | 0 | 0.0% |
| $15,000 to $24,999 | 4 | 8.0% |
| $25,000 to $34,999 | 0 | 0.0% |
| $35,000 to $49,999 | 7 | 14.0% |
| $50,000 to $74,999 | 2 | 4.0% |
| $75,000 to $99,999 | 17 | 34.0% |
| $100,000 to $149,999 | 12 | 24.0% |
| $150,000 to $199,999 | 7 | 14.0% |
| $200,000+ | 1 | 2.0% |
Family Income by Famaliy Size in Reed Point
2-person families (29 | 58.0%) account for the highest median family income in Reed Point with $100,625 per family, while 2-person families (29 | 58.0%) have the highest median income of $50,312 per family member.
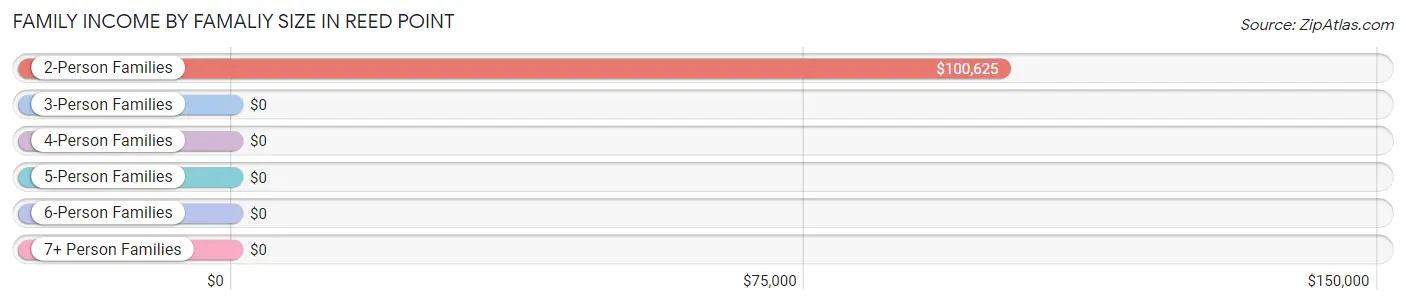
| Income Bracket | # Families | Median Income |
| 2-Person Families | 29 (58.0%) | $100,625 |
| 3-Person Families | 6 (12.0%) | $0 |
| 4-Person Families | 13 (26.0%) | $0 |
| 5-Person Families | 1 (2.0%) | $0 |
| 6-Person Families | 1 (2.0%) | $0 |
| 7+ Person Families | 0 (0.0%) | $0 |
| Total | 50 (100.0%) | $84,038 |
Family Income by Number of Earners in Reed Point
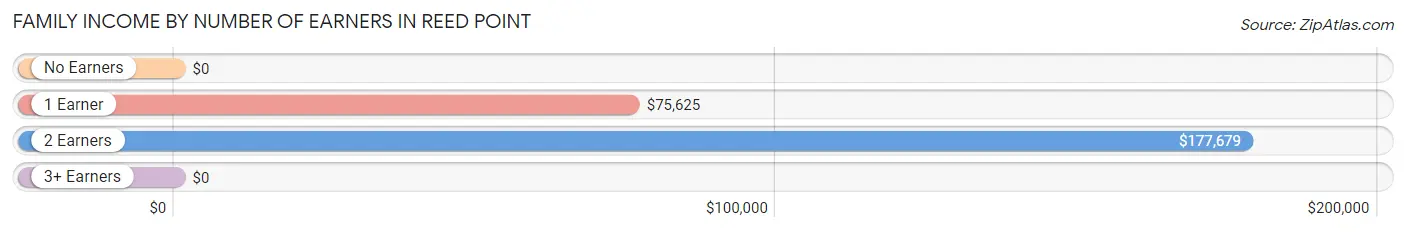
| Number of Earners | # Families | Median Income |
| No Earners | 16 (32.0%) | $0 |
| 1 Earner | 8 (16.0%) | $75,625 |
| 2 Earners | 13 (26.0%) | $177,679 |
| 3+ Earners | 13 (26.0%) | $0 |
| Total | 50 (100.0%) | $84,038 |
Household Income in Reed Point
Household Income Brackets in Reed Point
With 17 households falling in the category, the $10,000 to $14,999 income range is the most frequent in Reed Point, accounting for 21.8% of all households. In contrast, only 2 households (2.6%) fall into the $50,000 to $74,999 income bracket, making it the least populous group.
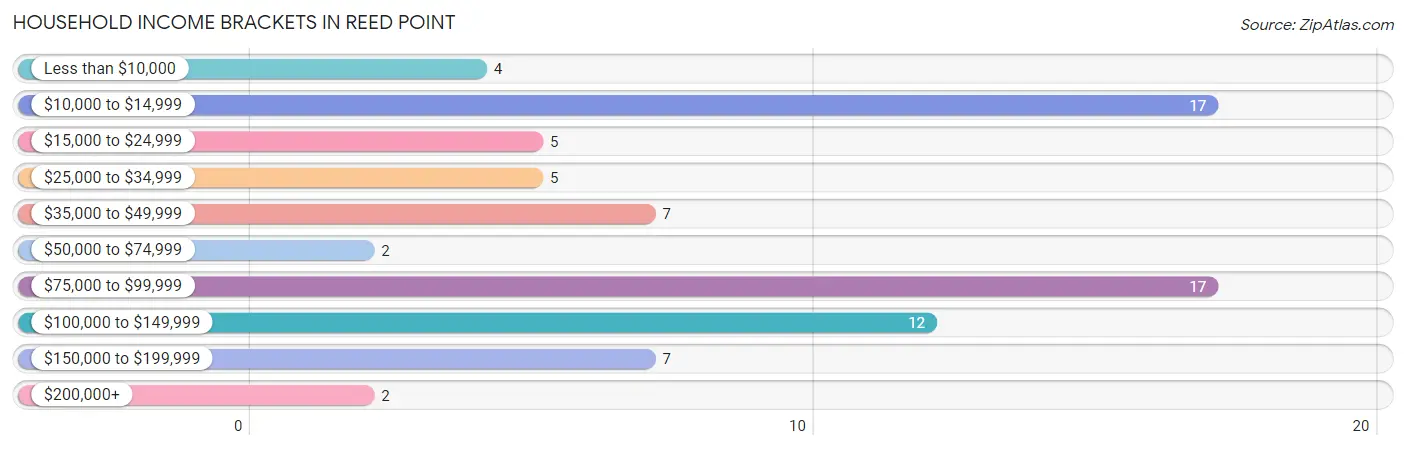
| Income Bracket | # Households | % Households |
| Less than $10,000 | 4 | 5.1% |
| $10,000 to $14,999 | 17 | 21.8% |
| $15,000 to $24,999 | 5 | 6.4% |
| $25,000 to $34,999 | 5 | 6.4% |
| $35,000 to $49,999 | 7 | 9.0% |
| $50,000 to $74,999 | 2 | 2.6% |
| $75,000 to $99,999 | 17 | 21.8% |
| $100,000 to $149,999 | 12 | 15.4% |
| $150,000 to $199,999 | 7 | 9.0% |
| $200,000+ | 2 | 2.6% |
Household Income by Householder Age in Reed Point
The median household income in Reed Point is $61,250, with the highest median household income of $83,365 found in the 45 to 64 years age bracket for the primary householder. A total of 43 households (55.1%) fall into this category.
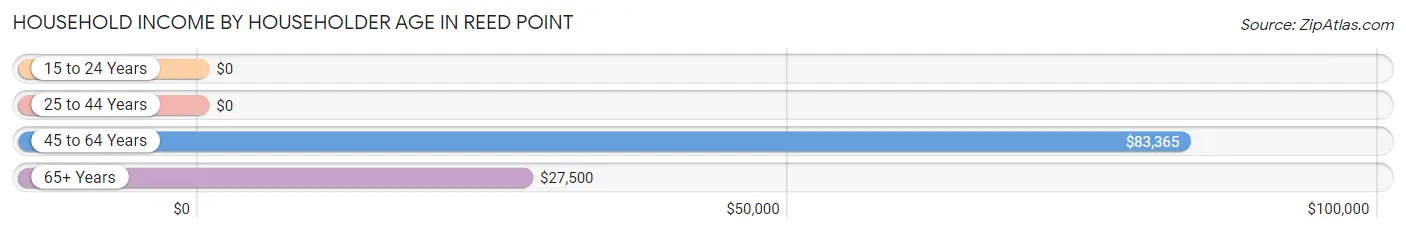
| Income Bracket | # Households | Median Income |
| 15 to 24 Years | 0 (0.0%) | $0 |
| 25 to 44 Years | 3 (3.8%) | $0 |
| 45 to 64 Years | 43 (55.1%) | $83,365 |
| 65+ Years | 32 (41.0%) | $27,500 |
| Total | 78 (100.0%) | $61,250 |
Poverty in Reed Point
Income Below Poverty by Sex and Age in Reed Point
With 2.4% poverty level for males and 22.7% for females among the residents of Reed Point, 75 year old and over males and 75 year old and over females are the most vulnerable to poverty, with 2 males (22.2%) and 5 females (62.5%) in their respective age groups living below the poverty level.
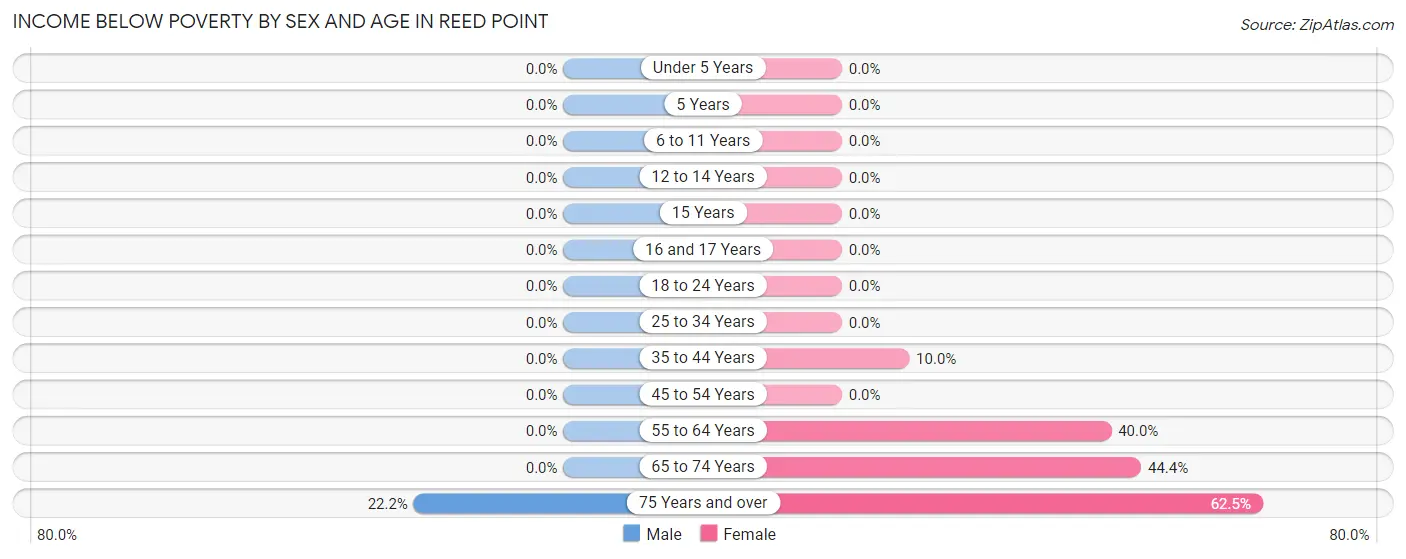
| Age Bracket | Male | Female |
| Under 5 Years | 0 (0.0%) | 0 (0.0%) |
| 5 Years | 0 (0.0%) | 0 (0.0%) |
| 6 to 11 Years | 0 (0.0%) | 0 (0.0%) |
| 12 to 14 Years | 0 (0.0%) | 0 (0.0%) |
| 15 Years | 0 (0.0%) | 0 (0.0%) |
| 16 and 17 Years | 0 (0.0%) | 0 (0.0%) |
| 18 to 24 Years | 0 (0.0%) | 0 (0.0%) |
| 25 to 34 Years | 0 (0.0%) | 0 (0.0%) |
| 35 to 44 Years | 0 (0.0%) | 1 (10.0%) |
| 45 to 54 Years | 0 (0.0%) | 0 (0.0%) |
| 55 to 64 Years | 0 (0.0%) | 10 (40.0%) |
| 65 to 74 Years | 0 (0.0%) | 4 (44.4%) |
| 75 Years and over | 2 (22.2%) | 5 (62.5%) |
| Total | 2 (2.4%) | 20 (22.7%) |
Income Above Poverty by Sex and Age in Reed Point
According to the poverty statistics in Reed Point, males aged under 5 years and females aged under 5 years are the age groups that are most secure financially, with 100.0% of males and 100.0% of females in these age groups living above the poverty line.
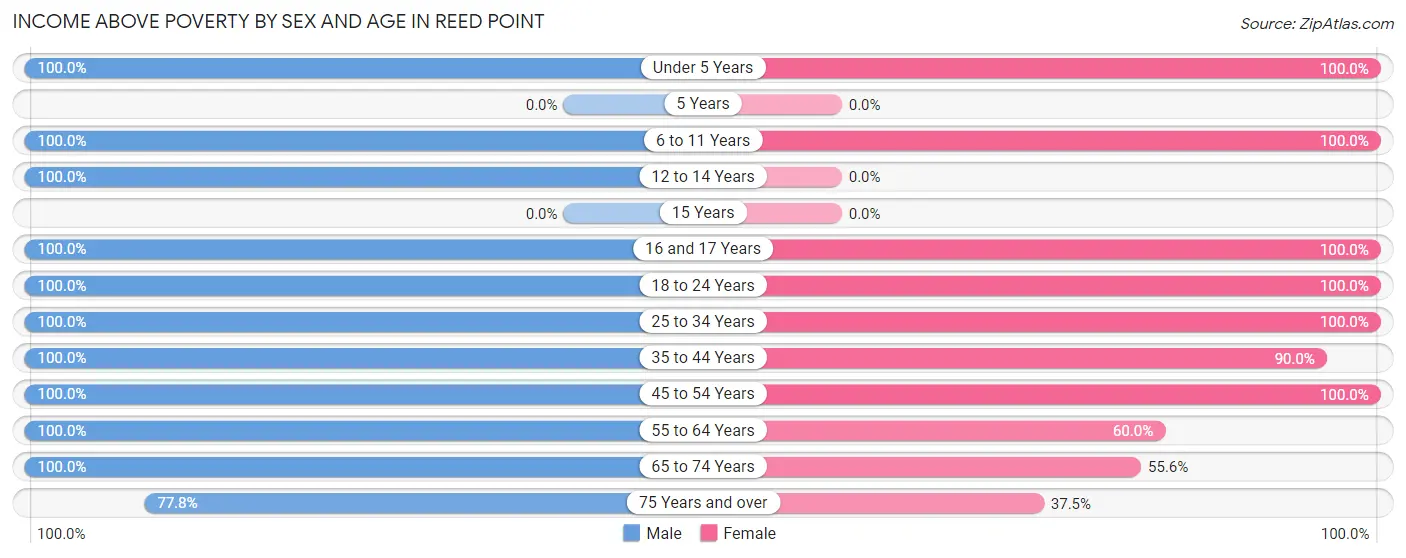
| Age Bracket | Male | Female |
| Under 5 Years | 2 (100.0%) | 3 (100.0%) |
| 5 Years | 0 (0.0%) | 0 (0.0%) |
| 6 to 11 Years | 1 (100.0%) | 4 (100.0%) |
| 12 to 14 Years | 4 (100.0%) | 0 (0.0%) |
| 15 Years | 0 (0.0%) | 0 (0.0%) |
| 16 and 17 Years | 3 (100.0%) | 8 (100.0%) |
| 18 to 24 Years | 14 (100.0%) | 4 (100.0%) |
| 25 to 34 Years | 5 (100.0%) | 6 (100.0%) |
| 35 to 44 Years | 2 (100.0%) | 9 (90.0%) |
| 45 to 54 Years | 15 (100.0%) | 11 (100.0%) |
| 55 to 64 Years | 15 (100.0%) | 15 (60.0%) |
| 65 to 74 Years | 15 (100.0%) | 5 (55.6%) |
| 75 Years and over | 7 (77.8%) | 3 (37.5%) |
| Total | 83 (97.7%) | 68 (77.3%) |
Income Below Poverty Among Married-Couple Families in Reed Point
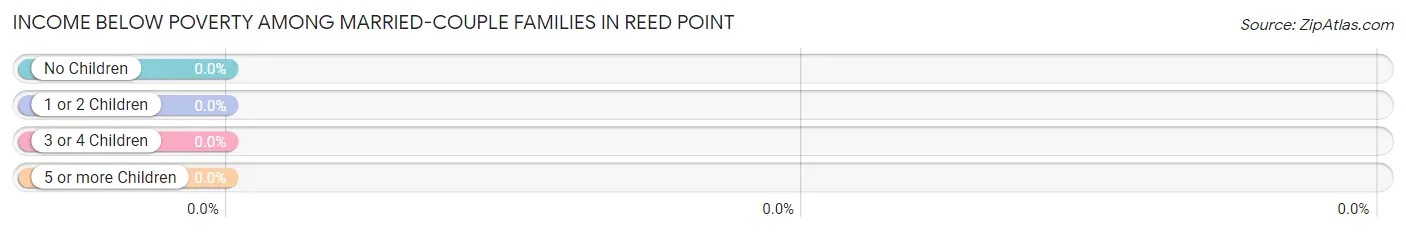
| Children | Above Poverty | Below Poverty |
| No Children | 27 (100.0%) | 0 (0.0%) |
| 1 or 2 Children | 16 (100.0%) | 0 (0.0%) |
| 3 or 4 Children | 1 (100.0%) | 0 (0.0%) |
| 5 or more Children | 0 (0.0%) | 0 (0.0%) |
| Total | 44 (100.0%) | 0 (0.0%) |
Income Below Poverty Among Single-Parent Households in Reed Point
| Children | Single Father | Single Mother |
| No Children | 0 (0.0%) | 0 (0.0%) |
| 1 or 2 Children | 0 (0.0%) | 0 (0.0%) |
| 3 or 4 Children | 0 (0.0%) | 0 (0.0%) |
| 5 or more Children | 0 (0.0%) | 0 (0.0%) |
| Total | 0 (0.0%) | 0 (0.0%) |
Income Below Poverty Among Married-Couple vs Single-Parent Households in Reed Point
| Children | Married-Couple Families | Single-Parent Households |
| No Children | 0 (0.0%) | 0 (0.0%) |
| 1 or 2 Children | 0 (0.0%) | 0 (0.0%) |
| 3 or 4 Children | 0 (0.0%) | 0 (0.0%) |
| 5 or more Children | 0 (0.0%) | 0 (0.0%) |
| Total | 0 (0.0%) | 0 (0.0%) |
Race in Reed Point
The most populous races in Reed Point are White / Caucasian (162 | 92.6%), Two or more Races (8 | 4.6%), and Native / Alaskan (5 | 2.9%).
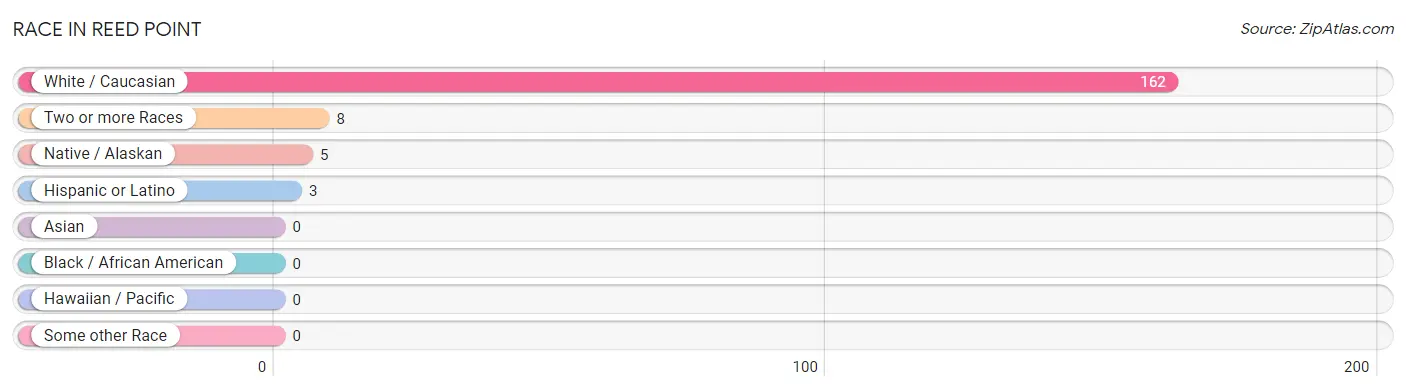
| Race | # Population | % Population |
| Asian | 0 | 0.0% |
| Black / African American | 0 | 0.0% |
| Hawaiian / Pacific | 0 | 0.0% |
| Hispanic or Latino | 3 | 1.7% |
| Native / Alaskan | 5 | 2.9% |
| White / Caucasian | 162 | 92.6% |
| Two or more Races | 8 | 4.6% |
| Some other Race | 0 | 0.0% |
| Total | 175 | 100.0% |
Ancestry in Reed Point
The most populous ancestries reported in Reed Point are German (53 | 30.3%), American (36 | 20.6%), Norwegian (26 | 14.9%), Irish (22 | 12.6%), and Scottish (21 | 12.0%), together accounting for 90.3% of all Reed Point residents.
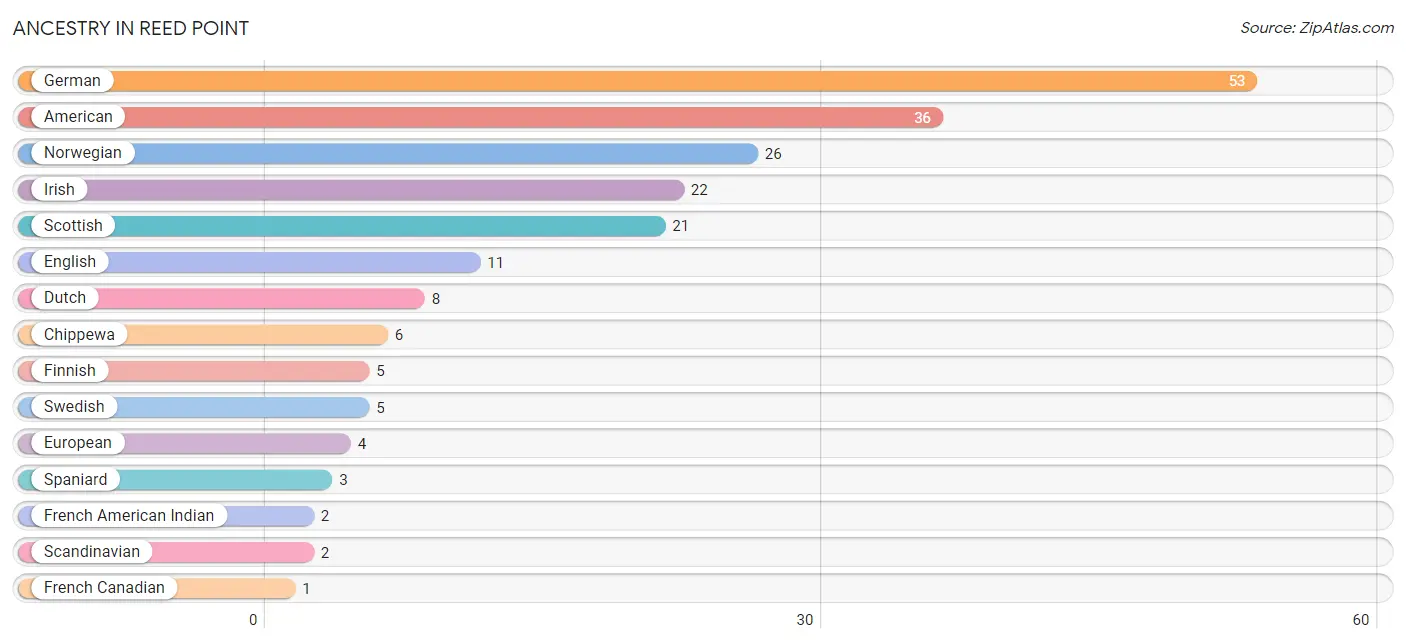
| Ancestry | # Population | % Population |
| American | 36 | 20.6% |
| Chippewa | 6 | 3.4% |
| Dutch | 8 | 4.6% |
| English | 11 | 6.3% |
| European | 4 | 2.3% |
| Finnish | 5 | 2.9% |
| French American Indian | 2 | 1.1% |
| French Canadian | 1 | 0.6% |
| German | 53 | 30.3% |
| Irish | 22 | 12.6% |
| Norwegian | 26 | 14.9% |
| Portuguese | 1 | 0.6% |
| Scandinavian | 2 | 1.1% |
| Scottish | 21 | 12.0% |
| Spaniard | 3 | 1.7% |
| Swedish | 5 | 2.9% | View All 16 Rows |
Immigrants in Reed Point

| Immigration Origin | # Population | % Population | View All 0 Rows |
Sex and Age in Reed Point
Sex and Age in Reed Point
The most populous age groups in Reed Point are 20 to 24 Years (14 | 16.1%) for men and 60 to 64 Years (22 | 25.0%) for women.
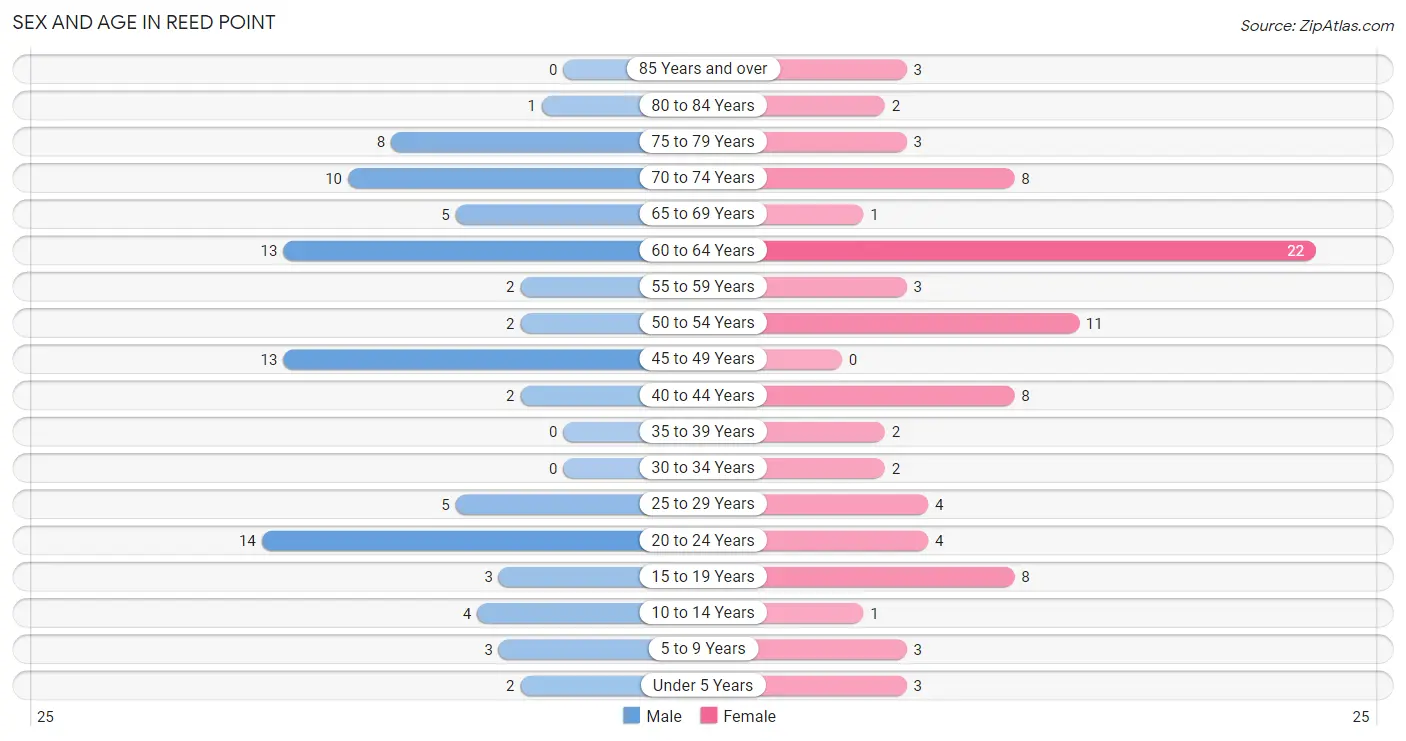
| Age Bracket | Male | Female |
| Under 5 Years | 2 (2.3%) | 3 (3.4%) |
| 5 to 9 Years | 3 (3.5%) | 3 (3.4%) |
| 10 to 14 Years | 4 (4.6%) | 1 (1.1%) |
| 15 to 19 Years | 3 (3.5%) | 8 (9.1%) |
| 20 to 24 Years | 14 (16.1%) | 4 (4.5%) |
| 25 to 29 Years | 5 (5.8%) | 4 (4.5%) |
| 30 to 34 Years | 0 (0.0%) | 2 (2.3%) |
| 35 to 39 Years | 0 (0.0%) | 2 (2.3%) |
| 40 to 44 Years | 2 (2.3%) | 8 (9.1%) |
| 45 to 49 Years | 13 (14.9%) | 0 (0.0%) |
| 50 to 54 Years | 2 (2.3%) | 11 (12.5%) |
| 55 to 59 Years | 2 (2.3%) | 3 (3.4%) |
| 60 to 64 Years | 13 (14.9%) | 22 (25.0%) |
| 65 to 69 Years | 5 (5.8%) | 1 (1.1%) |
| 70 to 74 Years | 10 (11.5%) | 8 (9.1%) |
| 75 to 79 Years | 8 (9.2%) | 3 (3.4%) |
| 80 to 84 Years | 1 (1.1%) | 2 (2.3%) |
| 85 Years and over | 0 (0.0%) | 3 (3.4%) |
| Total | 87 (100.0%) | 88 (100.0%) |
Families and Households in Reed Point
Median Family Size in Reed Point
The median family size in Reed Point is 2.88 persons per family, with single female/mother families (3 | 6.0%) accounting for the largest median family size of 3.33 persons per family. On the other hand, single male/father families (3 | 6.0%) represent the smallest median family size with 2.00 persons per family.
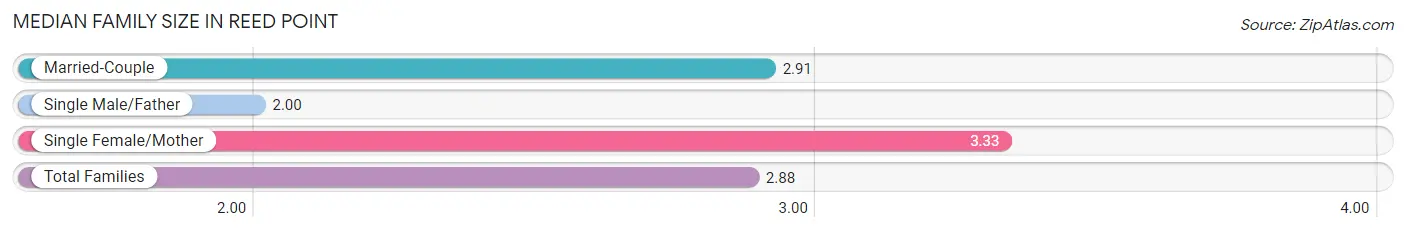
| Family Type | # Families | Family Size |
| Married-Couple | 44 (88.0%) | 2.91 |
| Single Male/Father | 3 (6.0%) | 2.00 |
| Single Female/Mother | 3 (6.0%) | 3.33 |
| Total Families | 50 (100.0%) | 2.88 |
Median Household Size in Reed Point
The median household size in Reed Point is 2.24 persons per household, with single female/mother households (3 | 3.8%) accounting for the largest median household size of 3.33 persons per household. non-family households (28 | 35.9%) represent the smallest median household size with 1.11 persons per household.
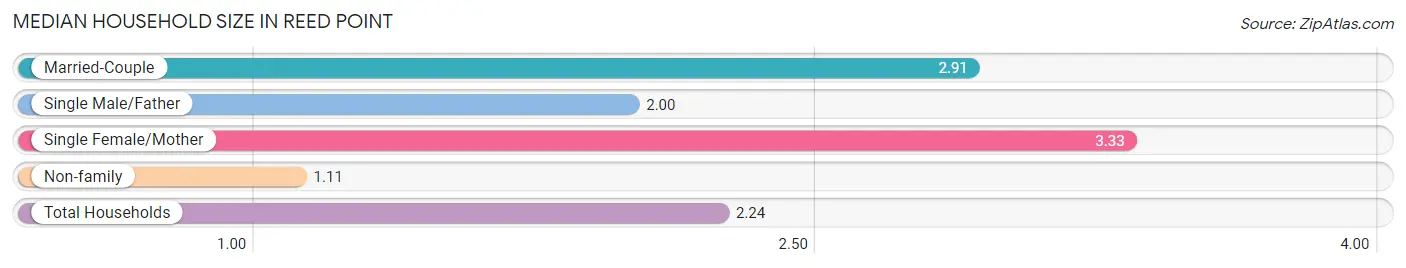
| Household Type | # Households | Household Size |
| Married-Couple | 44 (56.4%) | 2.91 |
| Single Male/Father | 3 (3.8%) | 2.00 |
| Single Female/Mother | 3 (3.8%) | 3.33 |
| Non-family | 28 (35.9%) | 1.11 |
| Total Households | 78 (100.0%) | 2.24 |
Household Size by Marriage Status in Reed Point
Out of a total of 78 households in Reed Point, 50 (64.1%) are family households, while 28 (35.9%) are nonfamily households. The most numerous type of family households are 2-person households, comprising 29, and the most common type of nonfamily households are 1-person households, comprising 27.
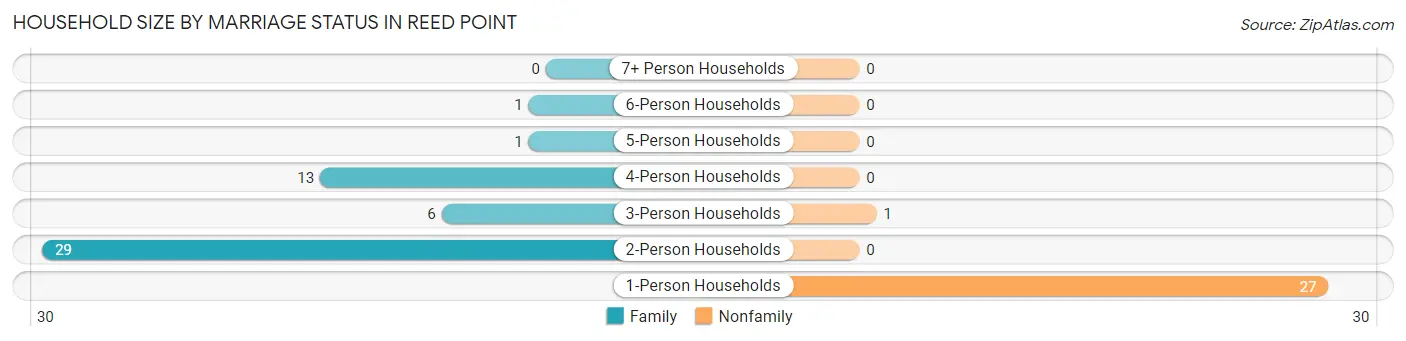
| Household Size | Family Households | Nonfamily Households |
| 1-Person Households | - | 27 (34.6%) |
| 2-Person Households | 29 (37.2%) | 0 (0.0%) |
| 3-Person Households | 6 (7.7%) | 1 (1.3%) |
| 4-Person Households | 13 (16.7%) | 0 (0.0%) |
| 5-Person Households | 1 (1.3%) | 0 (0.0%) |
| 6-Person Households | 1 (1.3%) | 0 (0.0%) |
| 7+ Person Households | 0 (0.0%) | 0 (0.0%) |
| Total | 50 (64.1%) | 28 (35.9%) |
Female Fertility in Reed Point
Fertility by Age in Reed Point
Average fertility rate in Reed Point is 69.0 births per 1,000 women. Women in the age bracket of 20 to 34 years have the highest fertility rate with 200.0 births per 1,000 women. Women in the age bracket of 20 to 34 years acount for 100.0% of all women with births.
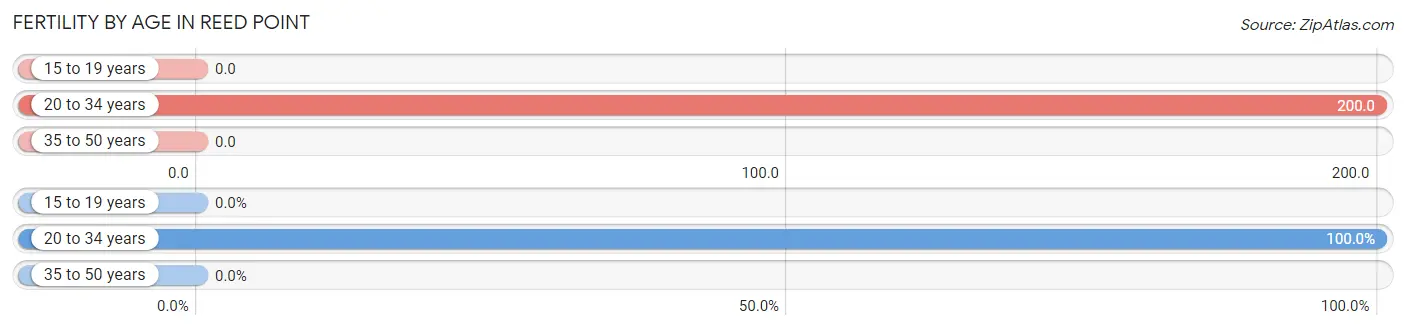
| Age Bracket | Women with Births | Births / 1,000 Women |
| 15 to 19 years | 0 (0.0%) | 0.0 |
| 20 to 34 years | 2 (100.0%) | 200.0 |
| 35 to 50 years | 0 (0.0%) | 0.0 |
| Total | 2 (100.0%) | 69.0 |
Fertility by Age by Marriage Status in Reed Point
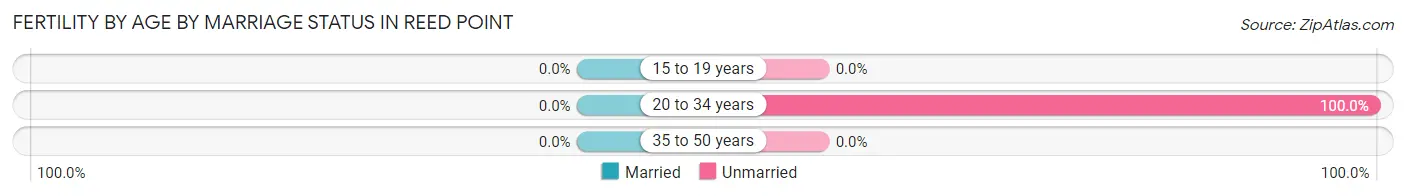
| Age Bracket | Married | Unmarried |
| 15 to 19 years | 0 (0.0%) | 0 (0.0%) |
| 20 to 34 years | 0 (0.0%) | 2 (100.0%) |
| 35 to 50 years | 0 (0.0%) | 0 (0.0%) |
| Total | 0 (0.0%) | 2 (100.0%) |
Fertility by Education in Reed Point
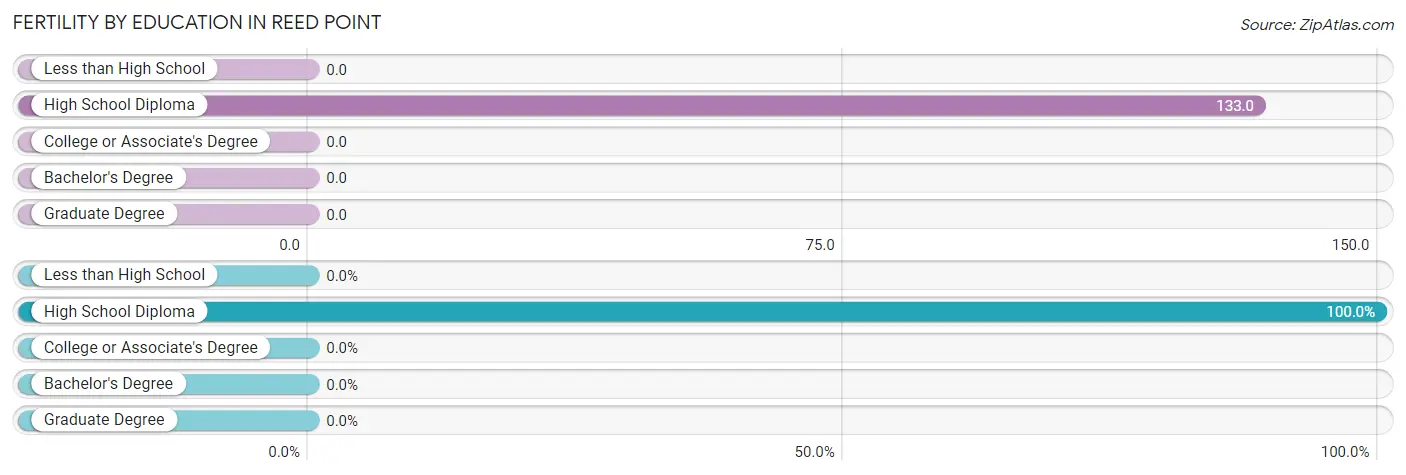
| Educational Attainment | Women with Births | Births / 1,000 Women |
| Less than High School | 0 (0.0%) | 0.0 |
| High School Diploma | 2 (100.0%) | 133.0 |
| College or Associate's Degree | 0 (0.0%) | 0.0 |
| Bachelor's Degree | 0 (0.0%) | 0.0 |
| Graduate Degree | 0 (0.0%) | 0.0 |
| Total | 2 (100.0%) | 69.0 |
Fertility by Education by Marriage Status in Reed Point
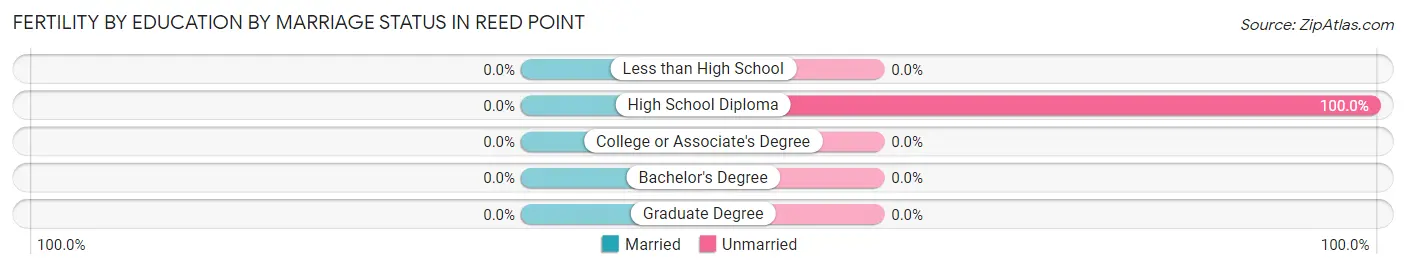
| Educational Attainment | Married | Unmarried |
| Less than High School | 0 (0.0%) | 0 (0.0%) |
| High School Diploma | 0 (0.0%) | 2 (100.0%) |
| College or Associate's Degree | 0 (0.0%) | 0 (0.0%) |
| Bachelor's Degree | 0 (0.0%) | 0 (0.0%) |
| Graduate Degree | 0 (0.0%) | 0 (0.0%) |
| Total | 0 (0.0%) | 2 (100.0%) |
Employment Characteristics in Reed Point
Employment by Class of Employer in Reed Point
Among the 86 employed individuals in Reed Point, private company employees (44 | 51.2%), state government employees (14 | 16.3%), and self-employed (not incorporated) (10 | 11.6%) make up the most common classes of employment.
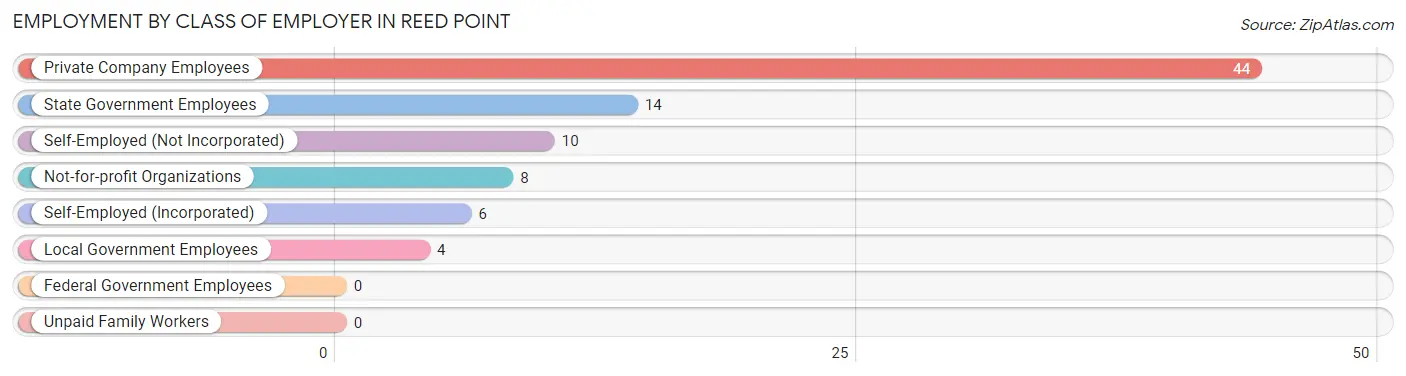
| Employer Class | # Employees | % Employees |
| Private Company Employees | 44 | 51.2% |
| Self-Employed (Incorporated) | 6 | 7.0% |
| Self-Employed (Not Incorporated) | 10 | 11.6% |
| Not-for-profit Organizations | 8 | 9.3% |
| Local Government Employees | 4 | 4.6% |
| State Government Employees | 14 | 16.3% |
| Federal Government Employees | 0 | 0.0% |
| Unpaid Family Workers | 0 | 0.0% |
| Total | 86 | 100.0% |
Employment Status by Age in Reed Point
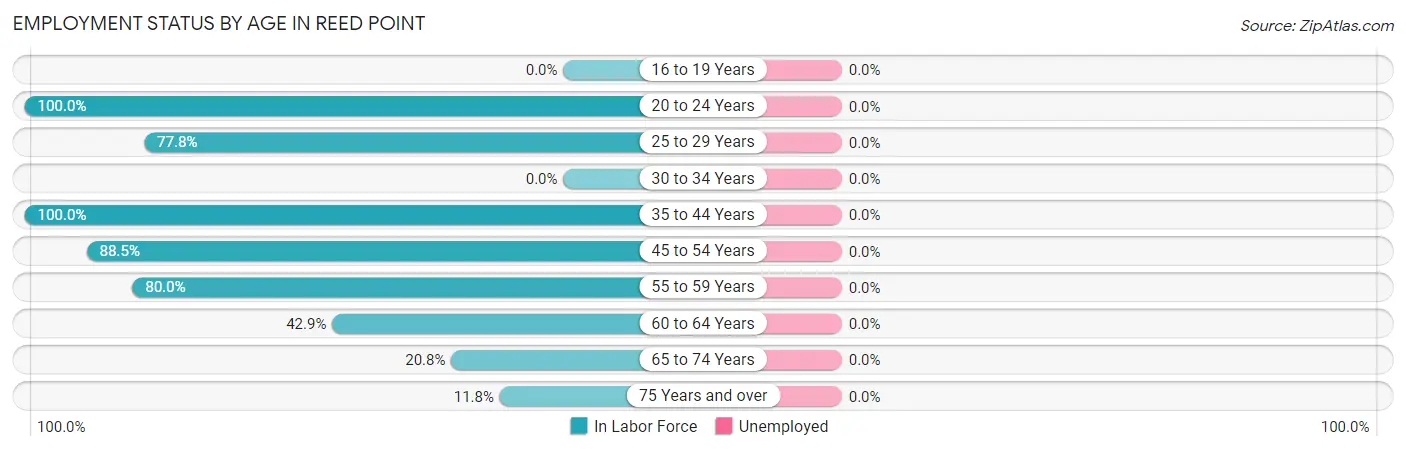
| Age Bracket | In Labor Force | Unemployed |
| 16 to 19 Years | 0 (0.0%) | 0 (0.0%) |
| 20 to 24 Years | 18 (100.0%) | 0 (0.0%) |
| 25 to 29 Years | 7 (77.8%) | 0 (0.0%) |
| 30 to 34 Years | 0 (0.0%) | 0 (0.0%) |
| 35 to 44 Years | 12 (100.0%) | 0 (0.0%) |
| 45 to 54 Years | 23 (88.5%) | 0 (0.0%) |
| 55 to 59 Years | 4 (80.0%) | 0 (0.0%) |
| 60 to 64 Years | 15 (42.9%) | 0 (0.0%) |
| 65 to 74 Years | 5 (20.8%) | 0 (0.0%) |
| 75 Years and over | 2 (11.8%) | 0 (0.0%) |
| Total | 86 (54.1%) | 0 (0.0%) |
Employment Status by Educational Attainment in Reed Point
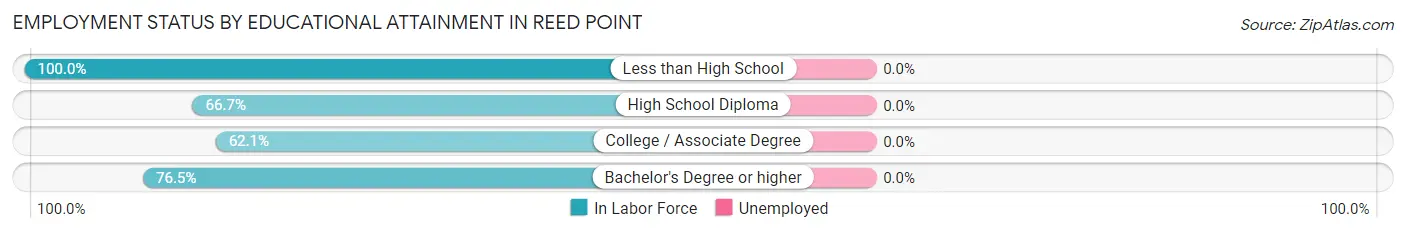
| Educational Attainment | In Labor Force | Unemployed |
| Less than High School | 4 (100.0%) | 0 (0.0%) |
| High School Diploma | 26 (66.7%) | 0 (0.0%) |
| College / Associate Degree | 18 (62.1%) | 0 (0.0%) |
| Bachelor's Degree or higher | 13 (76.5%) | 0 (0.0%) |
| Total | 61 (68.5%) | 0 (0.0%) |
Employment Occupations by Sex in Reed Point
Management, Business, Science and Arts Occupations
The most common Management, Business, Science and Arts occupations in Reed Point are Management (11 | 12.8%), Health Diagnosing & Treating (7 | 8.1%), Health Technologists (7 | 8.1%), Community & Social Service (1 | 1.2%), and Education Instruction & Library (1 | 1.2%).
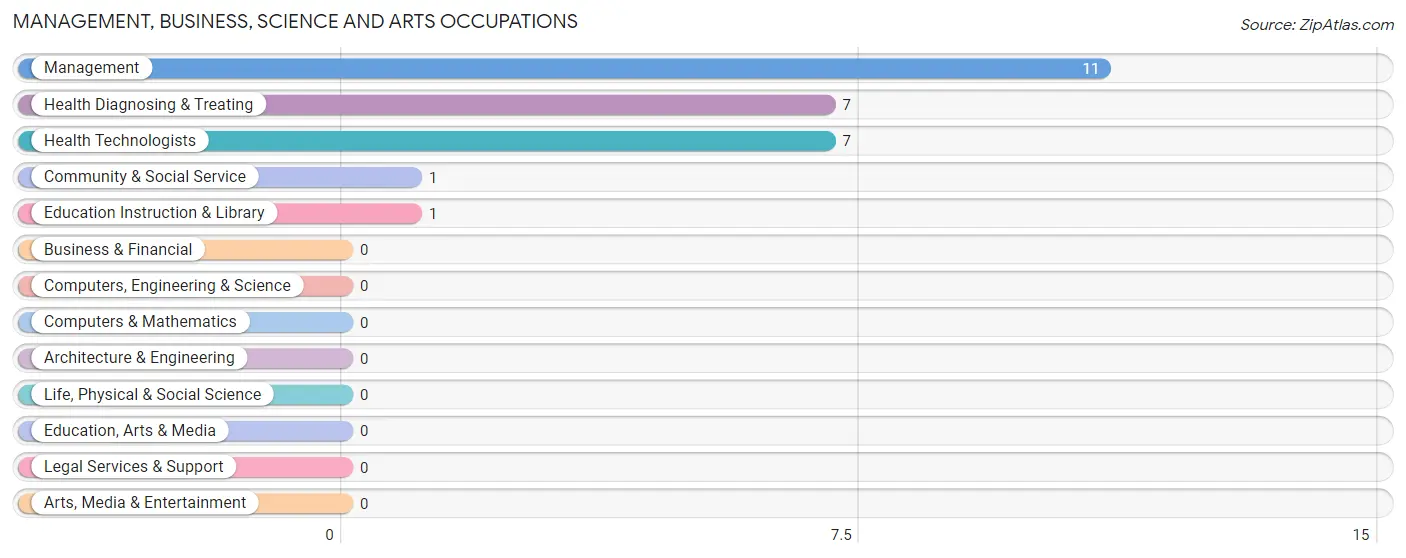
Management, Business, Science and Arts Occupations by Sex
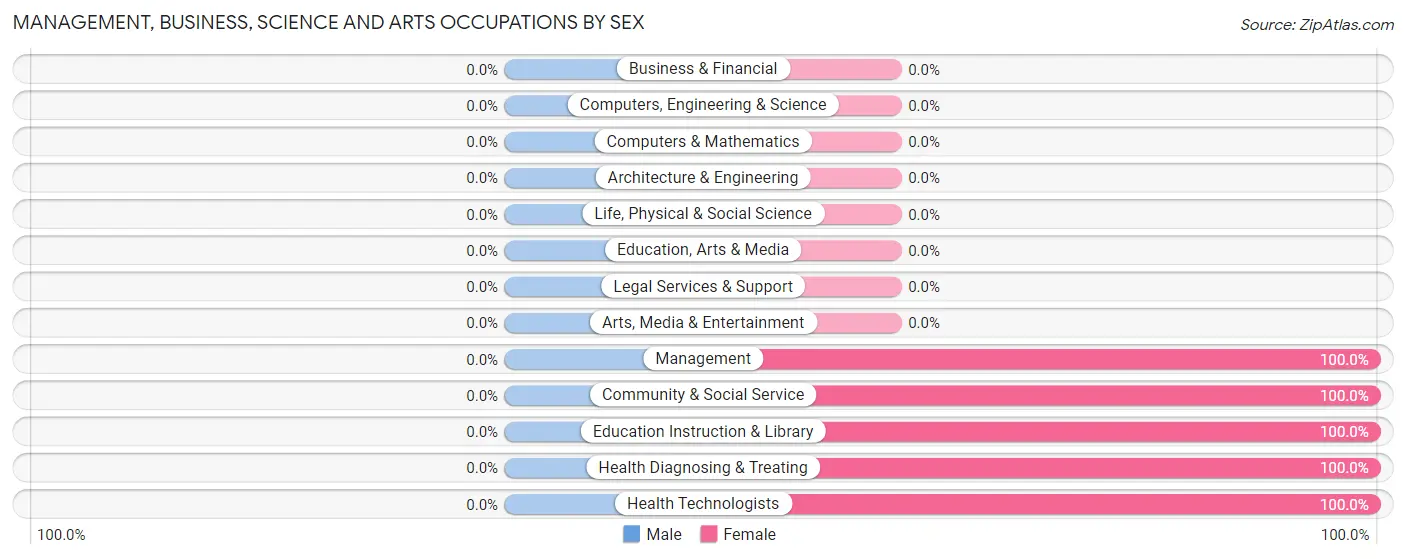
| Occupation | Male | Female |
| Management | 0 (0.0%) | 11 (100.0%) |
| Business & Financial | 0 (0.0%) | 0 (0.0%) |
| Computers, Engineering & Science | 0 (0.0%) | 0 (0.0%) |
| Computers & Mathematics | 0 (0.0%) | 0 (0.0%) |
| Architecture & Engineering | 0 (0.0%) | 0 (0.0%) |
| Life, Physical & Social Science | 0 (0.0%) | 0 (0.0%) |
| Community & Social Service | 0 (0.0%) | 1 (100.0%) |
| Education, Arts & Media | 0 (0.0%) | 0 (0.0%) |
| Legal Services & Support | 0 (0.0%) | 0 (0.0%) |
| Education Instruction & Library | 0 (0.0%) | 1 (100.0%) |
| Arts, Media & Entertainment | 0 (0.0%) | 0 (0.0%) |
| Health Diagnosing & Treating | 0 (0.0%) | 7 (100.0%) |
| Health Technologists | 0 (0.0%) | 7 (100.0%) |
| Total (Category) | 0 (0.0%) | 19 (100.0%) |
| Total (Overall) | 51 (59.3%) | 35 (40.7%) |
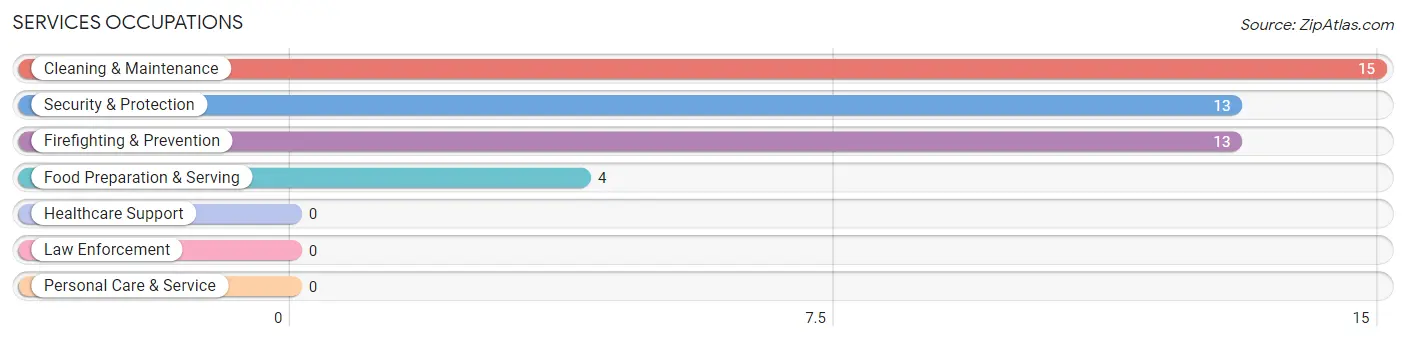
Services Occupations
The most common Services occupations in Reed Point are Cleaning & Maintenance (15 | 17.4%), Security & Protection (13 | 15.1%), Firefighting & Prevention (13 | 15.1%), and Food Preparation & Serving (4 | 4.6%).
Services Occupations by Sex
Within the Services occupations in Reed Point, the most male-oriented occupations are Security & Protection (100.0%), Firefighting & Prevention (100.0%), and Cleaning & Maintenance (93.3%), while the most female-oriented occupations are Food Preparation & Serving (100.0%), and Cleaning & Maintenance (6.7%).
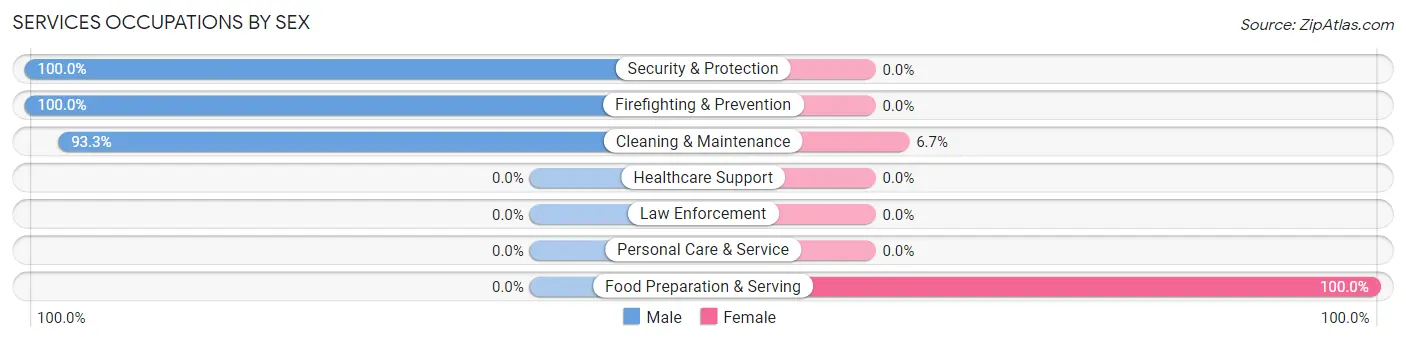
| Occupation | Male | Female |
| Healthcare Support | 0 (0.0%) | 0 (0.0%) |
| Security & Protection | 13 (100.0%) | 0 (0.0%) |
| Firefighting & Prevention | 13 (100.0%) | 0 (0.0%) |
| Law Enforcement | 0 (0.0%) | 0 (0.0%) |
| Food Preparation & Serving | 0 (0.0%) | 4 (100.0%) |
| Cleaning & Maintenance | 14 (93.3%) | 1 (6.7%) |
| Personal Care & Service | 0 (0.0%) | 0 (0.0%) |
| Total (Category) | 27 (84.4%) | 5 (15.6%) |
| Total (Overall) | 51 (59.3%) | 35 (40.7%) |
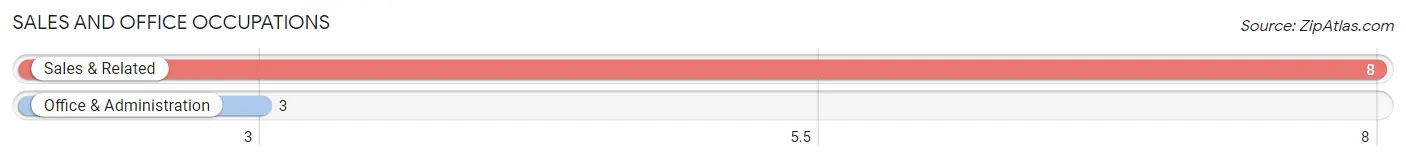
Sales and Office Occupations
The most common Sales and Office occupations in Reed Point are Sales & Related (8 | 9.3%), and Office & Administration (3 | 3.5%).
Sales and Office Occupations by Sex
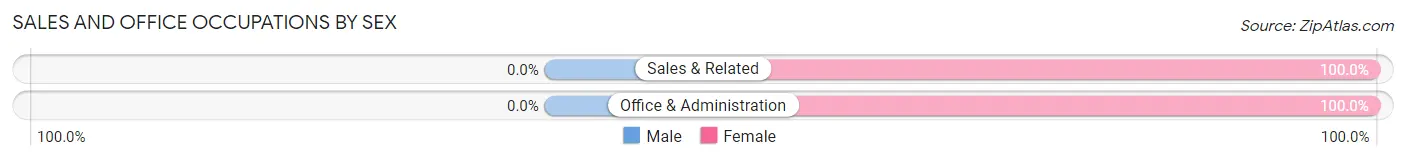
| Occupation | Male | Female |
| Sales & Related | 0 (0.0%) | 8 (100.0%) |
| Office & Administration | 0 (0.0%) | 3 (100.0%) |
| Total (Category) | 0 (0.0%) | 11 (100.0%) |
| Total (Overall) | 51 (59.3%) | 35 (40.7%) |
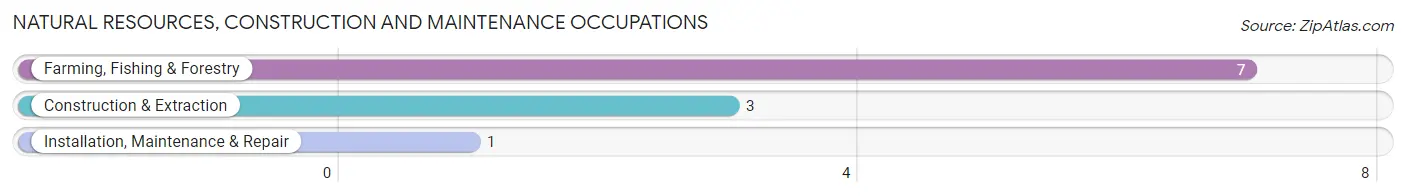
Natural Resources, Construction and Maintenance Occupations
The most common Natural Resources, Construction and Maintenance occupations in Reed Point are Farming, Fishing & Forestry (7 | 8.1%), Construction & Extraction (3 | 3.5%), and Installation, Maintenance & Repair (1 | 1.2%).
Natural Resources, Construction and Maintenance Occupations by Sex
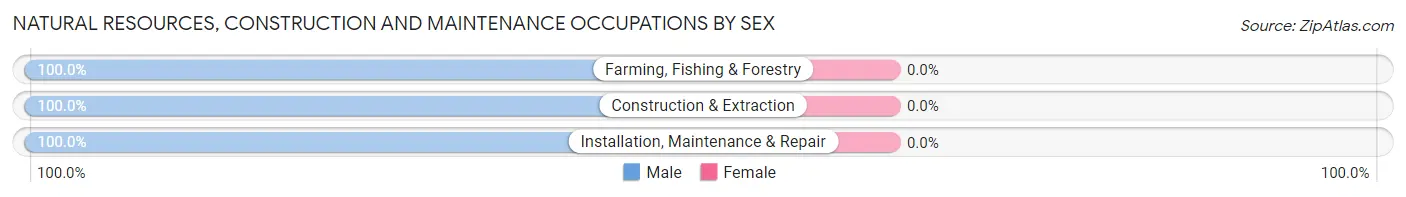
| Occupation | Male | Female |
| Farming, Fishing & Forestry | 7 (100.0%) | 0 (0.0%) |
| Construction & Extraction | 3 (100.0%) | 0 (0.0%) |
| Installation, Maintenance & Repair | 1 (100.0%) | 0 (0.0%) |
| Total (Category) | 11 (100.0%) | 0 (0.0%) |
| Total (Overall) | 51 (59.3%) | 35 (40.7%) |
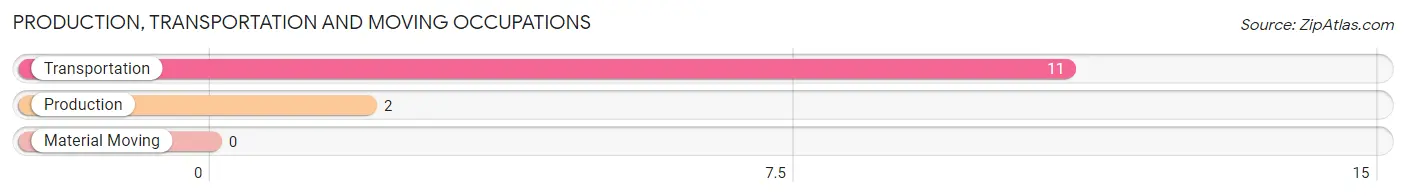
Production, Transportation and Moving Occupations
The most common Production, Transportation and Moving occupations in Reed Point are Transportation (11 | 12.8%), and Production (2 | 2.3%).
Production, Transportation and Moving Occupations by Sex
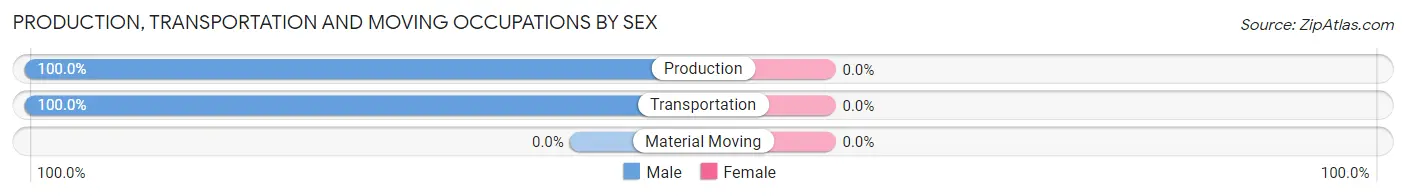
| Occupation | Male | Female |
| Production | 2 (100.0%) | 0 (0.0%) |
| Transportation | 11 (100.0%) | 0 (0.0%) |
| Material Moving | 0 (0.0%) | 0 (0.0%) |
| Total (Category) | 13 (100.0%) | 0 (0.0%) |
| Total (Overall) | 51 (59.3%) | 35 (40.7%) |
Employment Industries by Sex in Reed Point
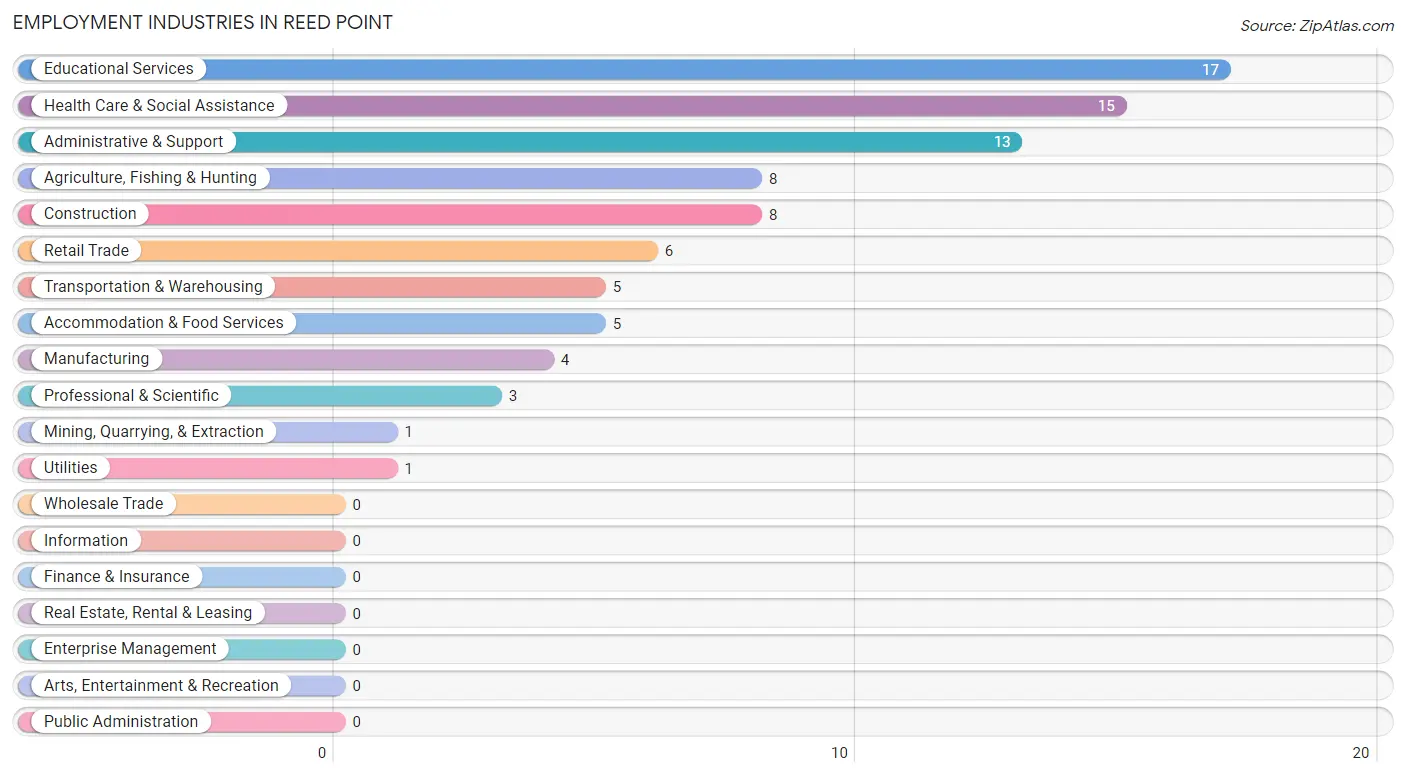
Employment Industries in Reed Point
The major employment industries in Reed Point include Educational Services (17 | 19.8%), Health Care & Social Assistance (15 | 17.4%), Administrative & Support (13 | 15.1%), Agriculture, Fishing & Hunting (8 | 9.3%), and Construction (8 | 9.3%).
Employment Industries by Sex in Reed Point
The Reed Point industries that see more men than women are Mining, Quarrying, & Extraction (100.0%), Construction (100.0%), and Transportation & Warehousing (100.0%), whereas the industries that tend to have a higher number of women are Retail Trade (100.0%), Professional & Scientific (100.0%), and Health Care & Social Assistance (100.0%).
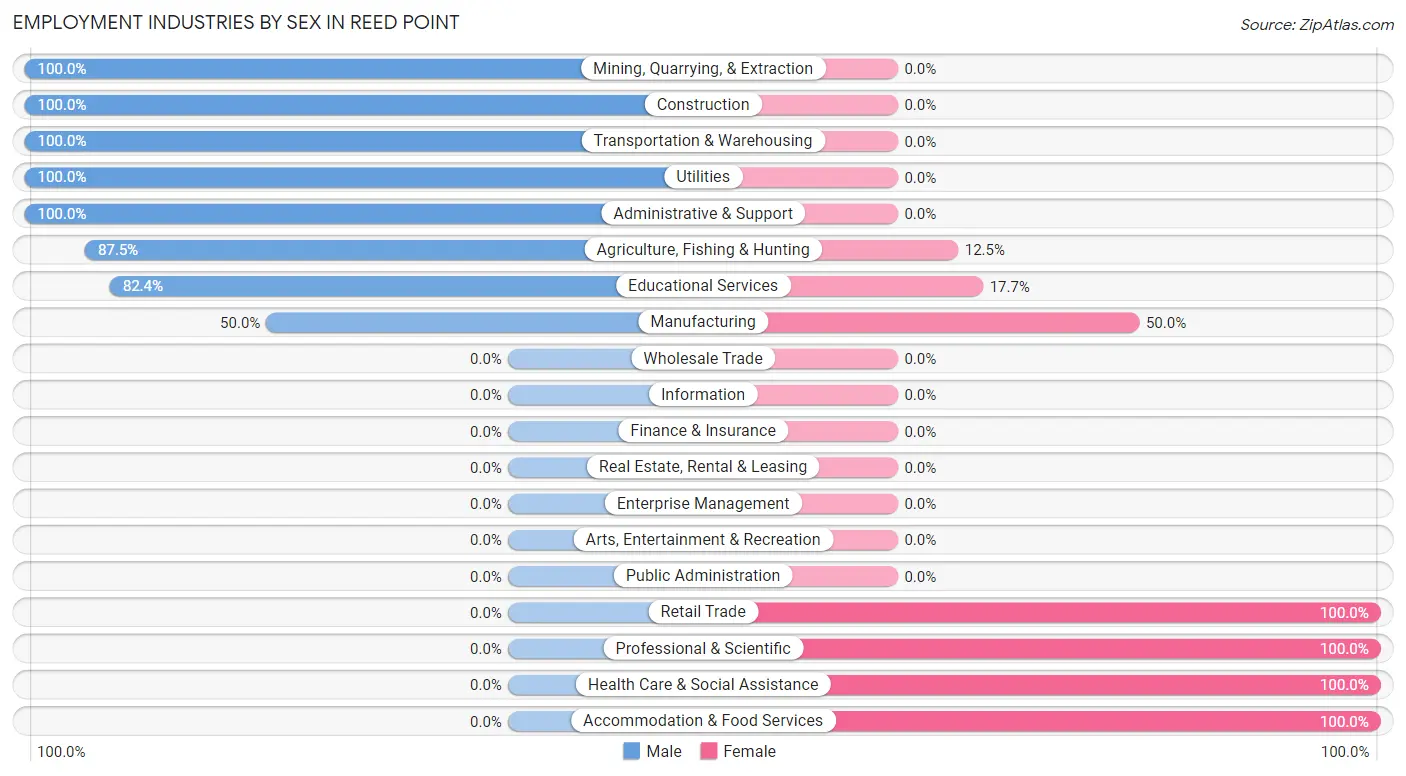
| Industry | Male | Female |
| Agriculture, Fishing & Hunting | 7 (87.5%) | 1 (12.5%) |
| Mining, Quarrying, & Extraction | 1 (100.0%) | 0 (0.0%) |
| Construction | 8 (100.0%) | 0 (0.0%) |
| Manufacturing | 2 (50.0%) | 2 (50.0%) |
| Wholesale Trade | 0 (0.0%) | 0 (0.0%) |
| Retail Trade | 0 (0.0%) | 6 (100.0%) |
| Transportation & Warehousing | 5 (100.0%) | 0 (0.0%) |
| Utilities | 1 (100.0%) | 0 (0.0%) |
| Information | 0 (0.0%) | 0 (0.0%) |
| Finance & Insurance | 0 (0.0%) | 0 (0.0%) |
| Real Estate, Rental & Leasing | 0 (0.0%) | 0 (0.0%) |
| Professional & Scientific | 0 (0.0%) | 3 (100.0%) |
| Enterprise Management | 0 (0.0%) | 0 (0.0%) |
| Administrative & Support | 13 (100.0%) | 0 (0.0%) |
| Educational Services | 14 (82.4%) | 3 (17.6%) |
| Health Care & Social Assistance | 0 (0.0%) | 15 (100.0%) |
| Arts, Entertainment & Recreation | 0 (0.0%) | 0 (0.0%) |
| Accommodation & Food Services | 0 (0.0%) | 5 (100.0%) |
| Public Administration | 0 (0.0%) | 0 (0.0%) |
| Total | 51 (59.3%) | 35 (40.7%) |
Education in Reed Point
School Enrollment in Reed Point
The most common levels of schooling among the 37 students in Reed Point are college / undergraduate (14 | 37.8%), high school (11 | 29.7%), and elementary school (5 | 13.5%).
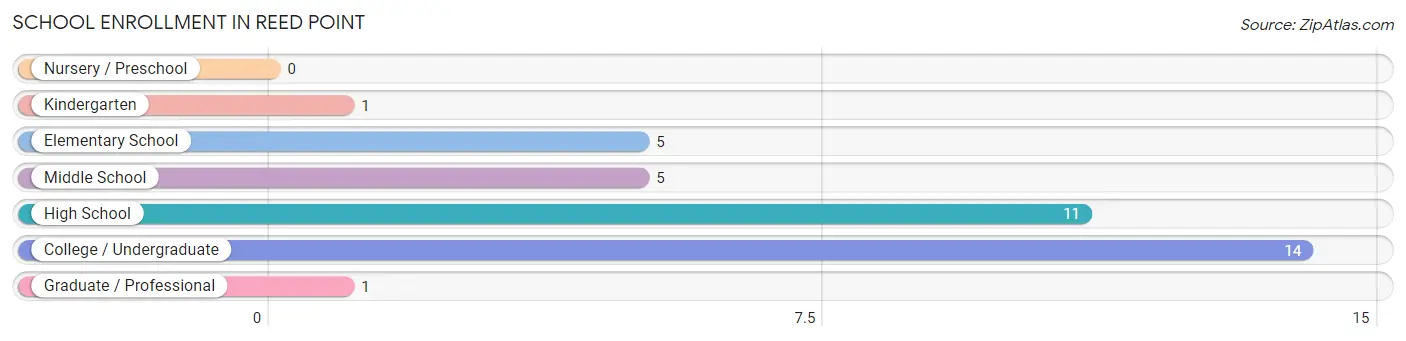
| School Level | # Students | % Students |
| Nursery / Preschool | 0 | 0.0% |
| Kindergarten | 1 | 2.7% |
| Elementary School | 5 | 13.5% |
| Middle School | 5 | 13.5% |
| High School | 11 | 29.7% |
| College / Undergraduate | 14 | 37.8% |
| Graduate / Professional | 1 | 2.7% |
| Total | 37 | 100.0% |
School Enrollment by Age by Funding Source in Reed Point
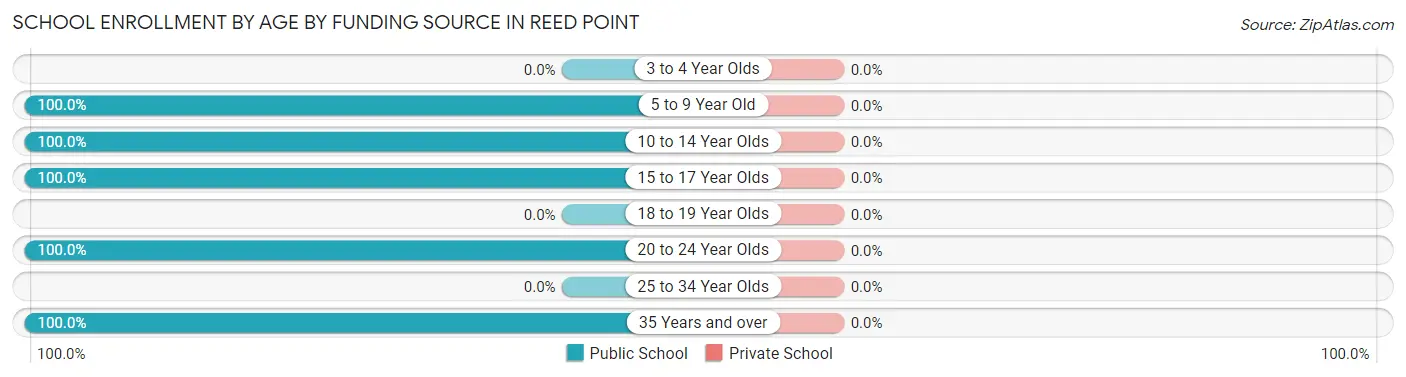
| Age Bracket | Public School | Private School |
| 3 to 4 Year Olds | 0 (0.0%) | 0 (0.0%) |
| 5 to 9 Year Old | 6 (100.0%) | 0 (0.0%) |
| 10 to 14 Year Olds | 5 (100.0%) | 0 (0.0%) |
| 15 to 17 Year Olds | 11 (100.0%) | 0 (0.0%) |
| 18 to 19 Year Olds | 0 (0.0%) | 0 (0.0%) |
| 20 to 24 Year Olds | 14 (100.0%) | 0 (0.0%) |
| 25 to 34 Year Olds | 0 (0.0%) | 0 (0.0%) |
| 35 Years and over | 1 (100.0%) | 0 (0.0%) |
| Total | 37 (100.0%) | 0 (0.0%) |
Educational Attainment by Field of Study in Reed Point
Science & technology (9 | 47.4%), education (5 | 26.3%), business (3 | 15.8%), and literature & languages (2 | 10.5%) are the most common fields of study among 19 individuals in Reed Point who have obtained a bachelor's degree or higher.
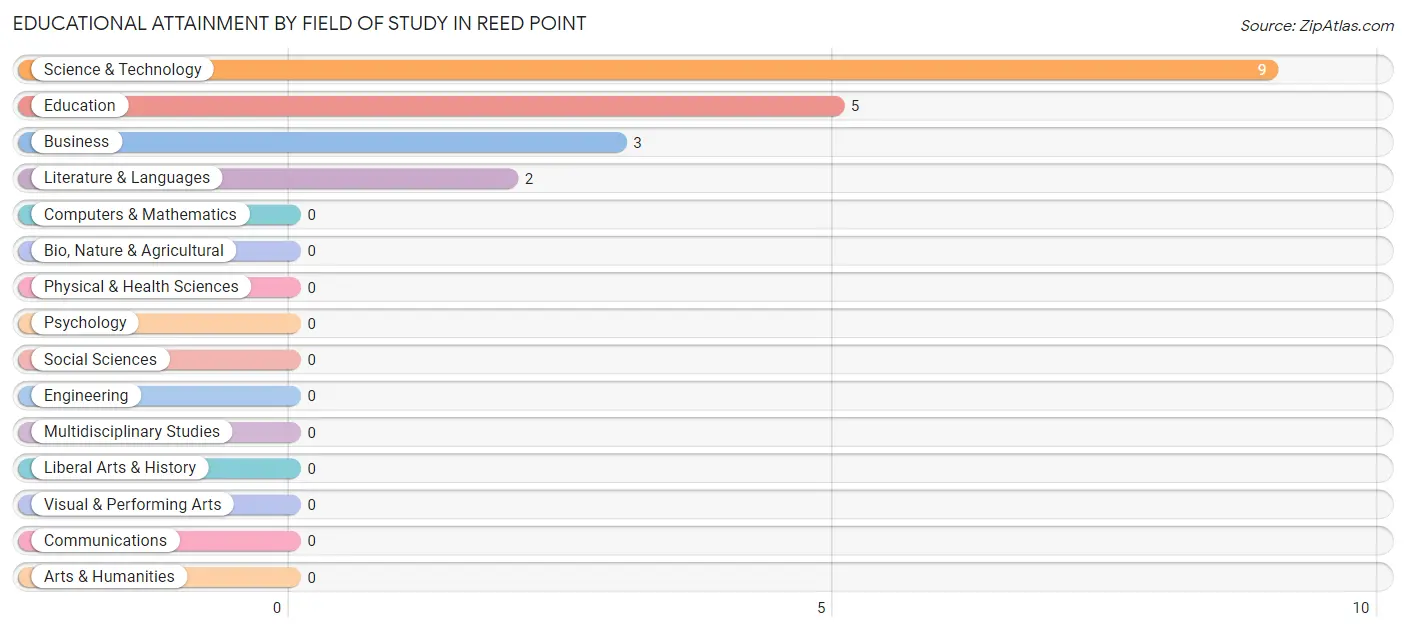
| Field of Study | # Graduates | % Graduates |
| Computers & Mathematics | 0 | 0.0% |
| Bio, Nature & Agricultural | 0 | 0.0% |
| Physical & Health Sciences | 0 | 0.0% |
| Psychology | 0 | 0.0% |
| Social Sciences | 0 | 0.0% |
| Engineering | 0 | 0.0% |
| Multidisciplinary Studies | 0 | 0.0% |
| Science & Technology | 9 | 47.4% |
| Business | 3 | 15.8% |
| Education | 5 | 26.3% |
| Literature & Languages | 2 | 10.5% |
| Liberal Arts & History | 0 | 0.0% |
| Visual & Performing Arts | 0 | 0.0% |
| Communications | 0 | 0.0% |
| Arts & Humanities | 0 | 0.0% |
| Total | 19 | 100.0% |
Transportation & Commute in Reed Point
Vehicle Availability by Sex in Reed Point
The most prevalent vehicle ownership categories in Reed Point are males with 3 vehicles (40, accounting for 78.4%) and females with 3 vehicles (22, making up 114.3%).
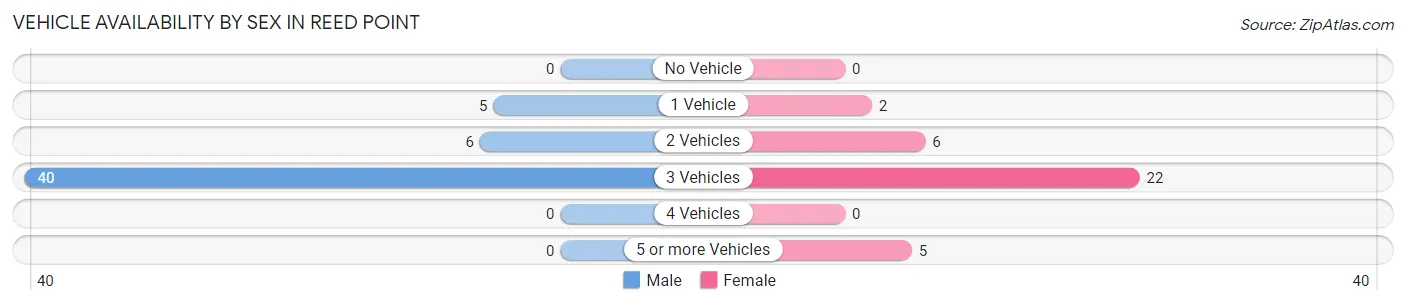
| Vehicles Available | Male | Female |
| No Vehicle | 0 (0.0%) | 0 (0.0%) |
| 1 Vehicle | 5 (9.8%) | 2 (5.7%) |
| 2 Vehicles | 6 (11.8%) | 6 (17.1%) |
| 3 Vehicles | 40 (78.4%) | 22 (62.9%) |
| 4 Vehicles | 0 (0.0%) | 0 (0.0%) |
| 5 or more Vehicles | 0 (0.0%) | 5 (14.3%) |
| Total | 51 (100.0%) | 35 (100.0%) |
Commute Time in Reed Point
The most frequently occuring commute durations in Reed Point are 30 to 34 minutes (26 commuters, 32.9%), 20 to 24 minutes (18 commuters, 22.8%), and 10 to 14 minutes (14 commuters, 17.7%).
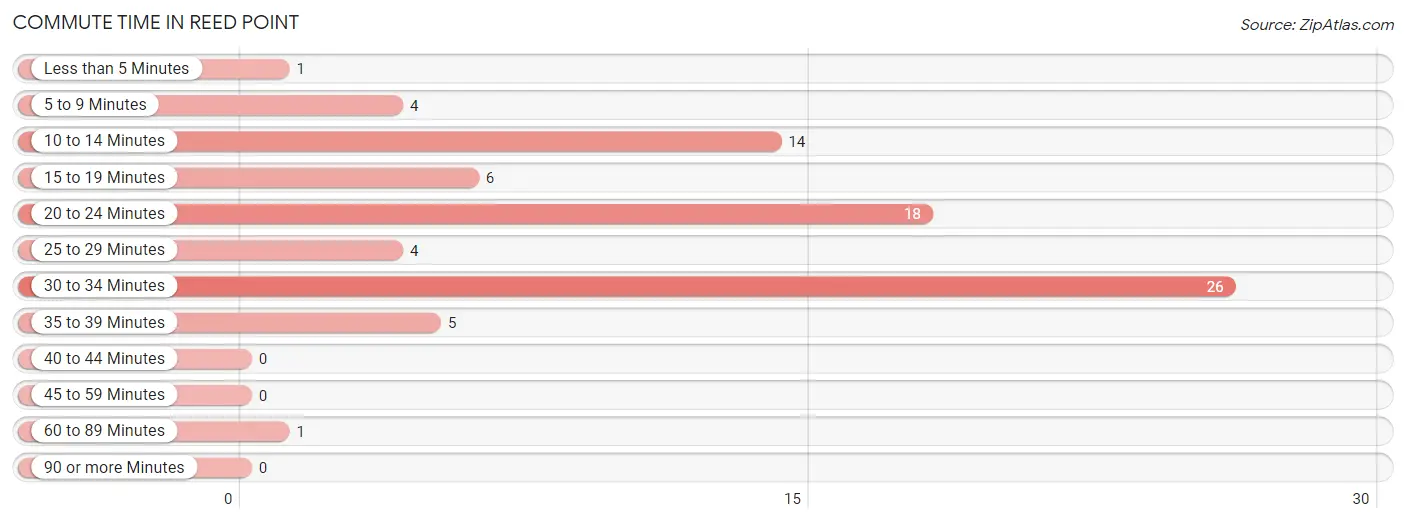
| Commute Time | # Commuters | % Commuters |
| Less than 5 Minutes | 1 | 1.3% |
| 5 to 9 Minutes | 4 | 5.1% |
| 10 to 14 Minutes | 14 | 17.7% |
| 15 to 19 Minutes | 6 | 7.6% |
| 20 to 24 Minutes | 18 | 22.8% |
| 25 to 29 Minutes | 4 | 5.1% |
| 30 to 34 Minutes | 26 | 32.9% |
| 35 to 39 Minutes | 5 | 6.3% |
| 40 to 44 Minutes | 0 | 0.0% |
| 45 to 59 Minutes | 0 | 0.0% |
| 60 to 89 Minutes | 1 | 1.3% |
| 90 or more Minutes | 0 | 0.0% |
Commute Time by Sex in Reed Point
The most common commute times in Reed Point are 30 to 34 minutes (15 commuters, 32.6%) for males and 30 to 34 minutes (11 commuters, 33.3%) for females.
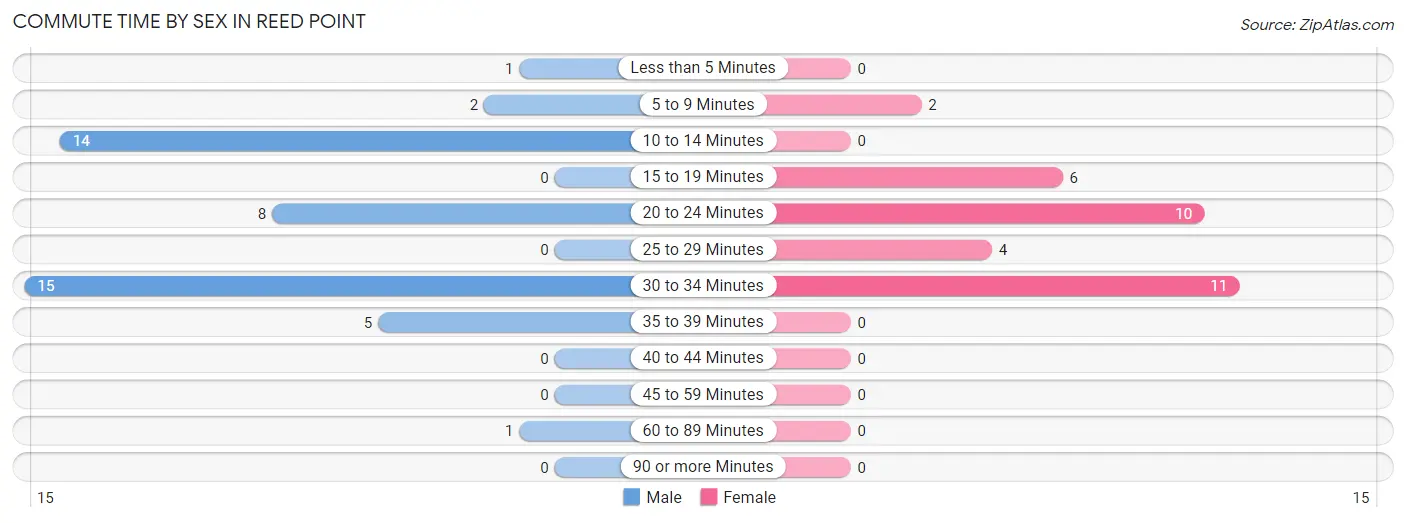
| Commute Time | Male | Female |
| Less than 5 Minutes | 1 (2.2%) | 0 (0.0%) |
| 5 to 9 Minutes | 2 (4.3%) | 2 (6.1%) |
| 10 to 14 Minutes | 14 (30.4%) | 0 (0.0%) |
| 15 to 19 Minutes | 0 (0.0%) | 6 (18.2%) |
| 20 to 24 Minutes | 8 (17.4%) | 10 (30.3%) |
| 25 to 29 Minutes | 0 (0.0%) | 4 (12.1%) |
| 30 to 34 Minutes | 15 (32.6%) | 11 (33.3%) |
| 35 to 39 Minutes | 5 (10.9%) | 0 (0.0%) |
| 40 to 44 Minutes | 0 (0.0%) | 0 (0.0%) |
| 45 to 59 Minutes | 0 (0.0%) | 0 (0.0%) |
| 60 to 89 Minutes | 1 (2.2%) | 0 (0.0%) |
| 90 or more Minutes | 0 (0.0%) | 0 (0.0%) |
Time of Departure to Work by Sex in Reed Point
The most frequent times of departure to work in Reed Point are 6:30 AM to 6:59 AM (14, 30.4%) for males and 7:00 AM to 7:29 AM (11, 33.3%) for females.
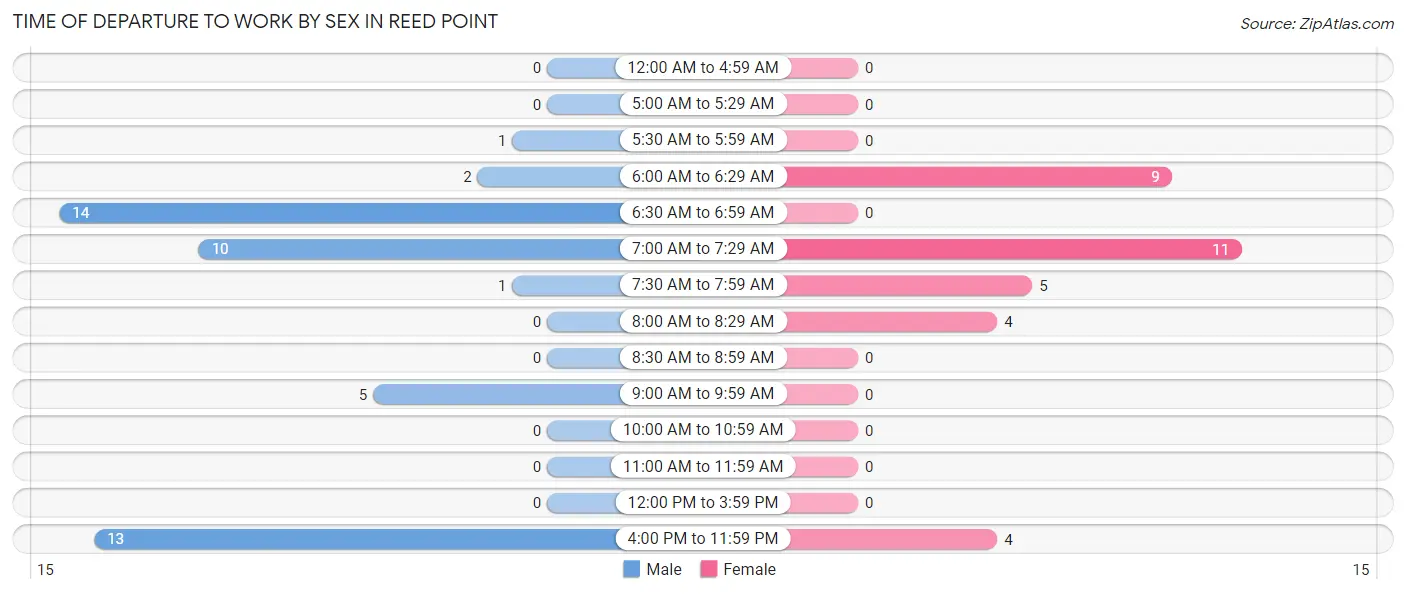
| Time of Departure | Male | Female |
| 12:00 AM to 4:59 AM | 0 (0.0%) | 0 (0.0%) |
| 5:00 AM to 5:29 AM | 0 (0.0%) | 0 (0.0%) |
| 5:30 AM to 5:59 AM | 1 (2.2%) | 0 (0.0%) |
| 6:00 AM to 6:29 AM | 2 (4.3%) | 9 (27.3%) |
| 6:30 AM to 6:59 AM | 14 (30.4%) | 0 (0.0%) |
| 7:00 AM to 7:29 AM | 10 (21.7%) | 11 (33.3%) |
| 7:30 AM to 7:59 AM | 1 (2.2%) | 5 (15.1%) |
| 8:00 AM to 8:29 AM | 0 (0.0%) | 4 (12.1%) |
| 8:30 AM to 8:59 AM | 0 (0.0%) | 0 (0.0%) |
| 9:00 AM to 9:59 AM | 5 (10.9%) | 0 (0.0%) |
| 10:00 AM to 10:59 AM | 0 (0.0%) | 0 (0.0%) |
| 11:00 AM to 11:59 AM | 0 (0.0%) | 0 (0.0%) |
| 12:00 PM to 3:59 PM | 0 (0.0%) | 0 (0.0%) |
| 4:00 PM to 11:59 PM | 13 (28.3%) | 4 (12.1%) |
| Total | 46 (100.0%) | 33 (100.0%) |
Housing Occupancy in Reed Point
Occupancy by Ownership in Reed Point
Of the total 78 dwellings in Reed Point, owner-occupied units account for 75 (96.2%), while renter-occupied units make up 3 (3.8%).
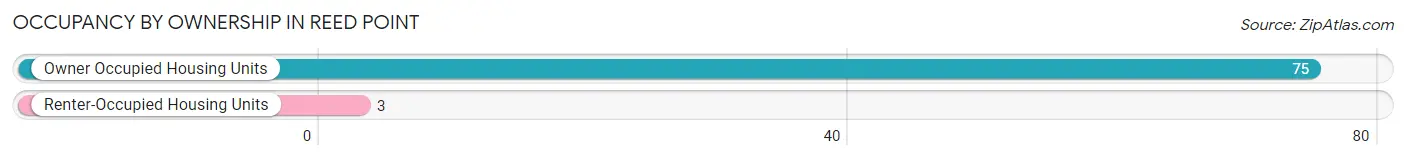
| Occupancy | # Housing Units | % Housing Units |
| Owner Occupied Housing Units | 75 | 96.2% |
| Renter-Occupied Housing Units | 3 | 3.8% |
| Total Occupied Housing Units | 78 | 100.0% |
Occupancy by Household Size in Reed Point
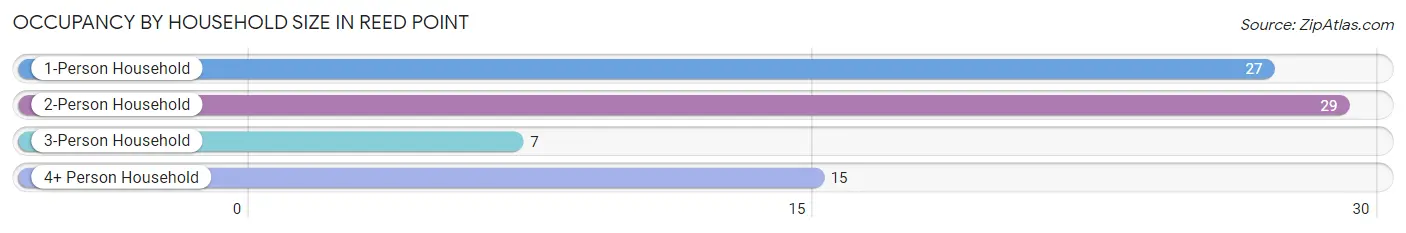
| Household Size | # Housing Units | % Housing Units |
| 1-Person Household | 27 | 34.6% |
| 2-Person Household | 29 | 37.2% |
| 3-Person Household | 7 | 9.0% |
| 4+ Person Household | 15 | 19.2% |
| Total Housing Units | 78 | 100.0% |
Occupancy by Ownership by Household Size in Reed Point
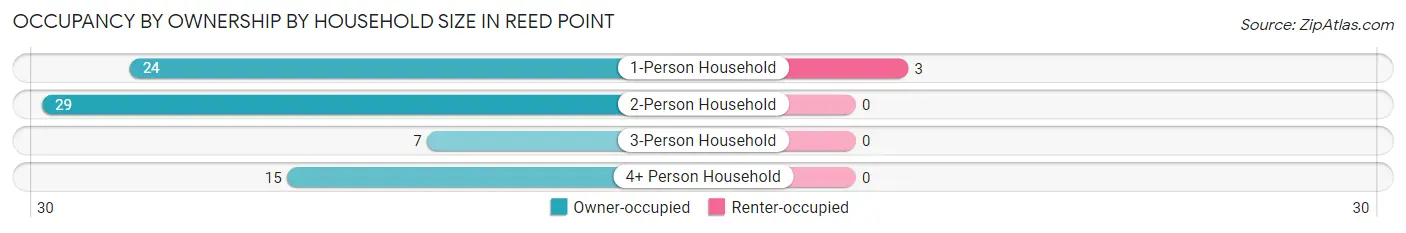
| Household Size | Owner-occupied | Renter-occupied |
| 1-Person Household | 24 (88.9%) | 3 (11.1%) |
| 2-Person Household | 29 (100.0%) | 0 (0.0%) |
| 3-Person Household | 7 (100.0%) | 0 (0.0%) |
| 4+ Person Household | 15 (100.0%) | 0 (0.0%) |
| Total Housing Units | 75 (96.2%) | 3 (3.8%) |
Occupancy by Educational Attainment in Reed Point
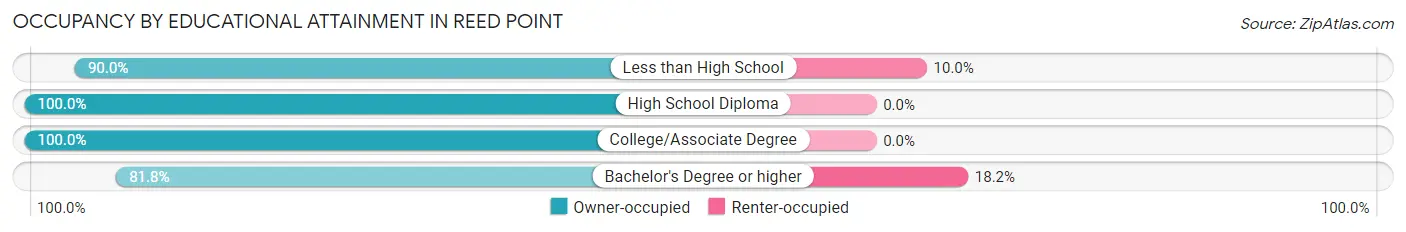
| Household Size | Owner-occupied | Renter-occupied |
| Less than High School | 9 (90.0%) | 1 (10.0%) |
| High School Diploma | 25 (100.0%) | 0 (0.0%) |
| College/Associate Degree | 32 (100.0%) | 0 (0.0%) |
| Bachelor's Degree or higher | 9 (81.8%) | 2 (18.2%) |
Occupancy by Age of Householder in Reed Point
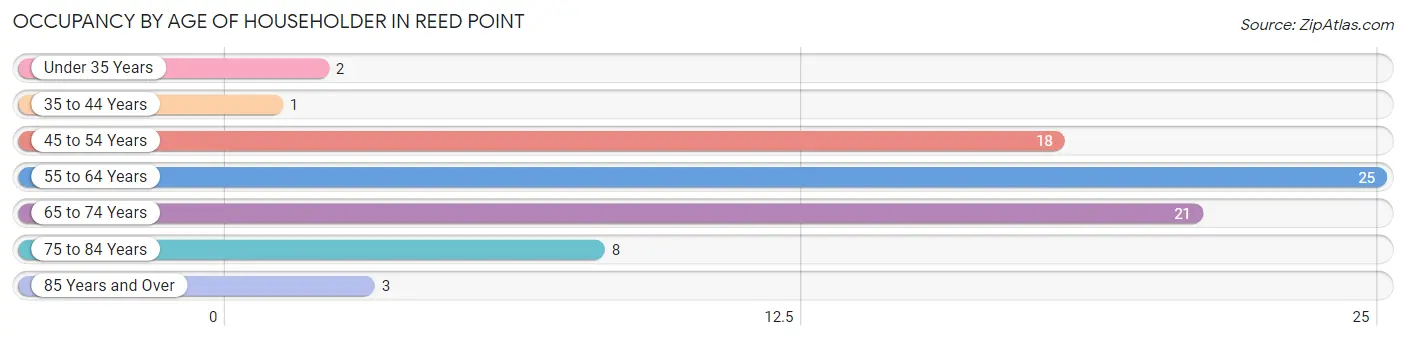
| Age Bracket | # Households | % Households |
| Under 35 Years | 2 | 2.6% |
| 35 to 44 Years | 1 | 1.3% |
| 45 to 54 Years | 18 | 23.1% |
| 55 to 64 Years | 25 | 32.1% |
| 65 to 74 Years | 21 | 26.9% |
| 75 to 84 Years | 8 | 10.3% |
| 85 Years and Over | 3 | 3.8% |
| Total | 78 | 100.0% |
Housing Finances in Reed Point
Median Income by Occupancy in Reed Point
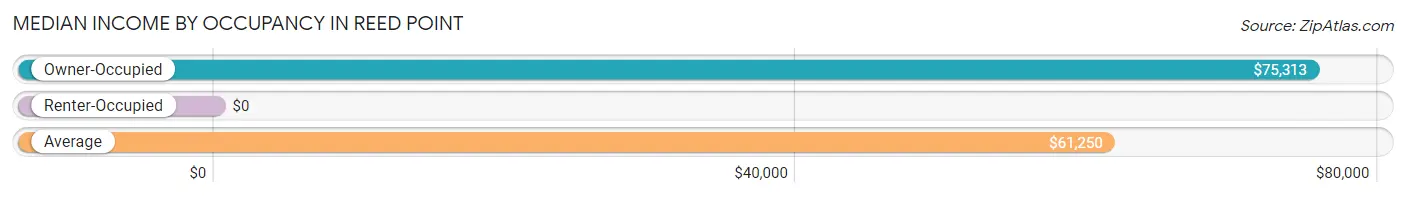
| Occupancy Type | # Households | Median Income |
| Owner-Occupied | 75 (96.2%) | $75,313 |
| Renter-Occupied | 3 (3.8%) | $0 |
| Average | 78 (100.0%) | $61,250 |
Occupancy by Householder Income Bracket in Reed Point
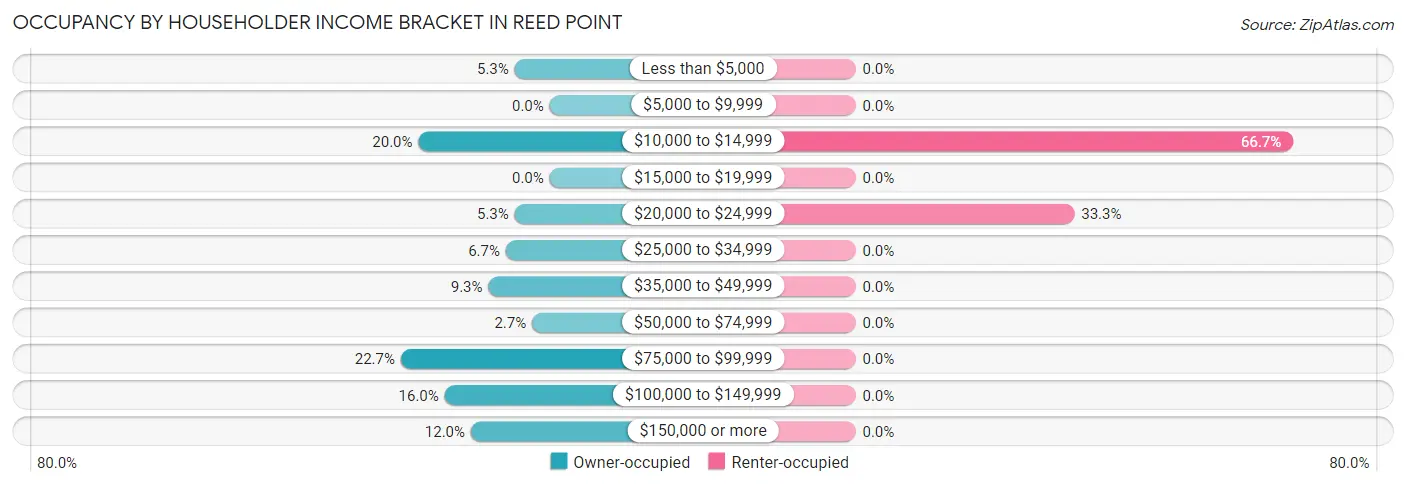
| Income Bracket | Owner-occupied | Renter-occupied |
| Less than $5,000 | 4 (5.3%) | 0 (0.0%) |
| $5,000 to $9,999 | 0 (0.0%) | 0 (0.0%) |
| $10,000 to $14,999 | 15 (20.0%) | 2 (66.7%) |
| $15,000 to $19,999 | 0 (0.0%) | 0 (0.0%) |
| $20,000 to $24,999 | 4 (5.3%) | 1 (33.3%) |
| $25,000 to $34,999 | 5 (6.7%) | 0 (0.0%) |
| $35,000 to $49,999 | 7 (9.3%) | 0 (0.0%) |
| $50,000 to $74,999 | 2 (2.7%) | 0 (0.0%) |
| $75,000 to $99,999 | 17 (22.7%) | 0 (0.0%) |
| $100,000 to $149,999 | 12 (16.0%) | 0 (0.0%) |
| $150,000 or more | 9 (12.0%) | 0 (0.0%) |
| Total | 75 (100.0%) | 3 (100.0%) |
Monthly Housing Cost Tiers in Reed Point
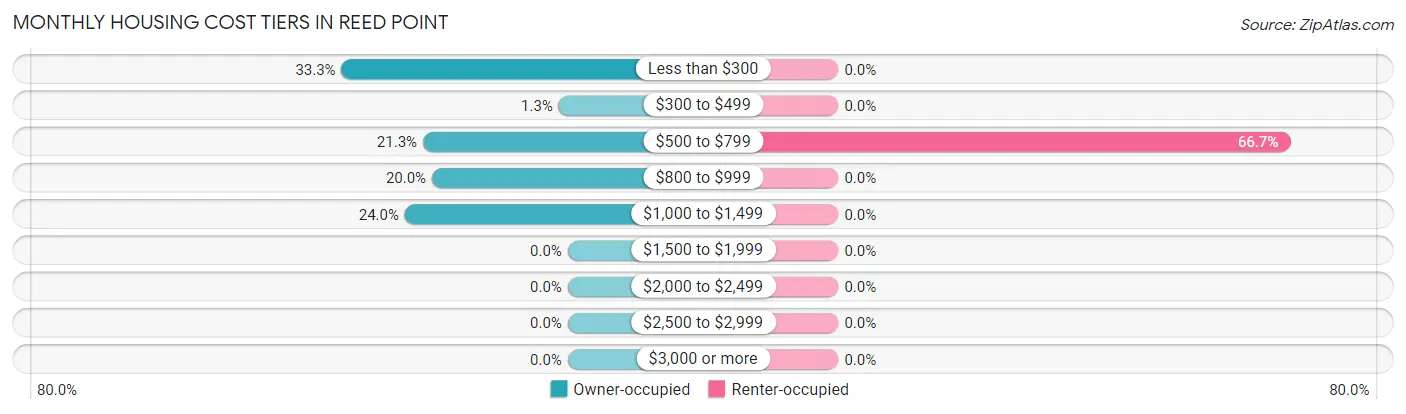
| Monthly Cost | Owner-occupied | Renter-occupied |
| Less than $300 | 25 (33.3%) | 0 (0.0%) |
| $300 to $499 | 1 (1.3%) | 0 (0.0%) |
| $500 to $799 | 16 (21.3%) | 2 (66.7%) |
| $800 to $999 | 15 (20.0%) | 0 (0.0%) |
| $1,000 to $1,499 | 18 (24.0%) | 0 (0.0%) |
| $1,500 to $1,999 | 0 (0.0%) | 0 (0.0%) |
| $2,000 to $2,499 | 0 (0.0%) | 0 (0.0%) |
| $2,500 to $2,999 | 0 (0.0%) | 0 (0.0%) |
| $3,000 or more | 0 (0.0%) | 0 (0.0%) |
| Total | 75 (100.0%) | 3 (100.0%) |
Physical Housing Characteristics in Reed Point
Housing Structures in Reed Point
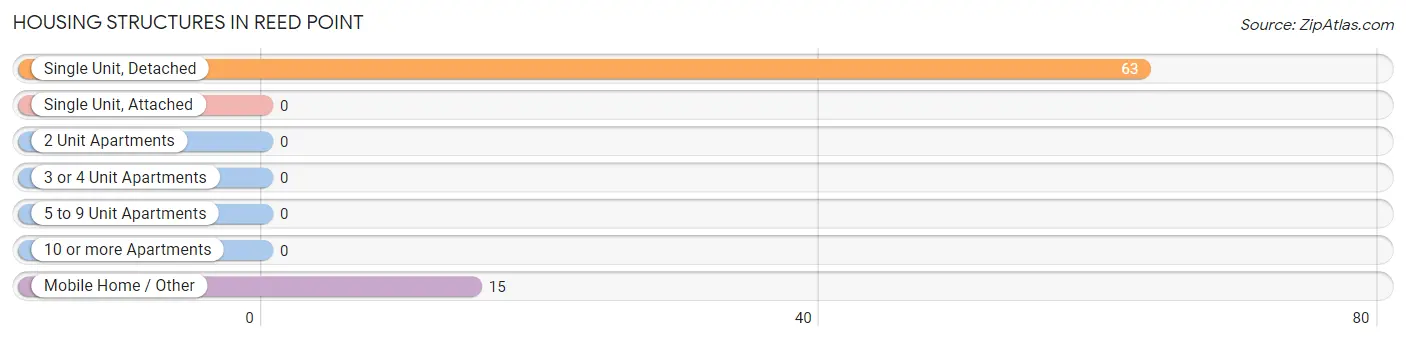
| Structure Type | # Housing Units | % Housing Units |
| Single Unit, Detached | 63 | 80.8% |
| Single Unit, Attached | 0 | 0.0% |
| 2 Unit Apartments | 0 | 0.0% |
| 3 or 4 Unit Apartments | 0 | 0.0% |
| 5 to 9 Unit Apartments | 0 | 0.0% |
| 10 or more Apartments | 0 | 0.0% |
| Mobile Home / Other | 15 | 19.2% |
| Total | 78 | 100.0% |
Housing Structures by Occupancy in Reed Point
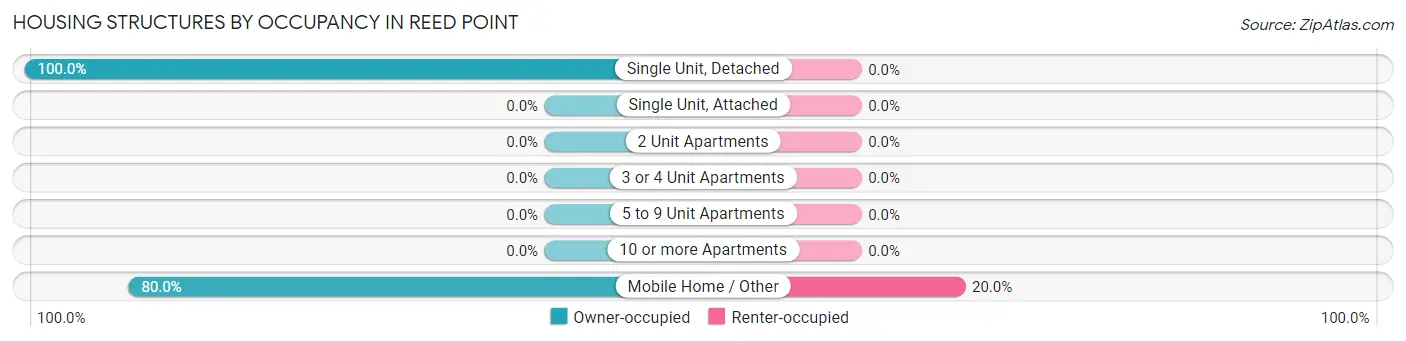
| Structure Type | Owner-occupied | Renter-occupied |
| Single Unit, Detached | 63 (100.0%) | 0 (0.0%) |
| Single Unit, Attached | 0 (0.0%) | 0 (0.0%) |
| 2 Unit Apartments | 0 (0.0%) | 0 (0.0%) |
| 3 or 4 Unit Apartments | 0 (0.0%) | 0 (0.0%) |
| 5 to 9 Unit Apartments | 0 (0.0%) | 0 (0.0%) |
| 10 or more Apartments | 0 (0.0%) | 0 (0.0%) |
| Mobile Home / Other | 12 (80.0%) | 3 (20.0%) |
| Total | 75 (96.2%) | 3 (3.8%) |
Housing Structures by Number of Rooms in Reed Point
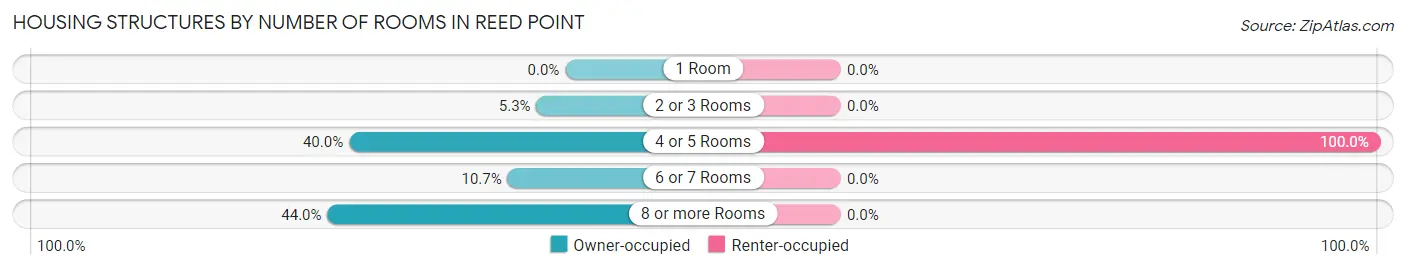
| Number of Rooms | Owner-occupied | Renter-occupied |
| 1 Room | 0 (0.0%) | 0 (0.0%) |
| 2 or 3 Rooms | 4 (5.3%) | 0 (0.0%) |
| 4 or 5 Rooms | 30 (40.0%) | 3 (100.0%) |
| 6 or 7 Rooms | 8 (10.7%) | 0 (0.0%) |
| 8 or more Rooms | 33 (44.0%) | 0 (0.0%) |
| Total | 75 (100.0%) | 3 (100.0%) |
Housing Structure by Heating Type in Reed Point
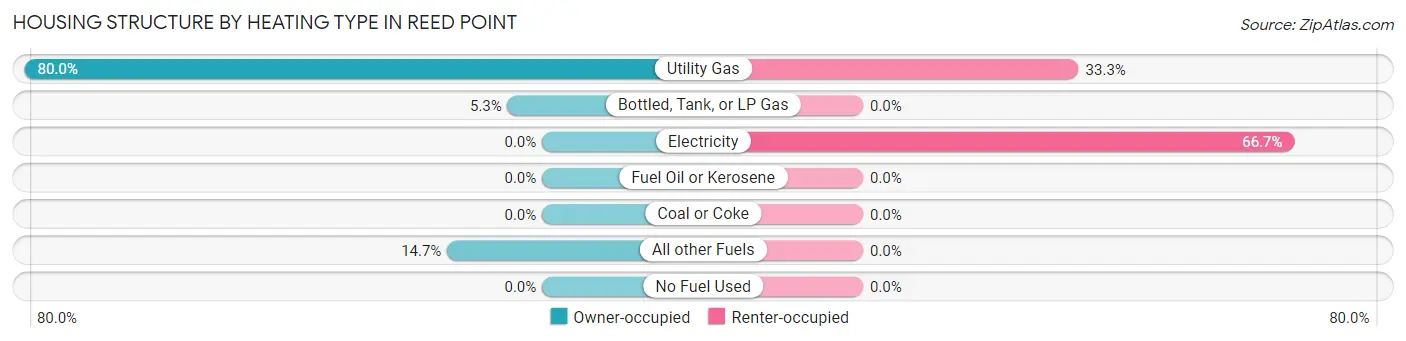
| Heating Type | Owner-occupied | Renter-occupied |
| Utility Gas | 60 (80.0%) | 1 (33.3%) |
| Bottled, Tank, or LP Gas | 4 (5.3%) | 0 (0.0%) |
| Electricity | 0 (0.0%) | 2 (66.7%) |
| Fuel Oil or Kerosene | 0 (0.0%) | 0 (0.0%) |
| Coal or Coke | 0 (0.0%) | 0 (0.0%) |
| All other Fuels | 11 (14.7%) | 0 (0.0%) |
| No Fuel Used | 0 (0.0%) | 0 (0.0%) |
| Total | 75 (100.0%) | 3 (100.0%) |
Household Vehicle Usage in Reed Point
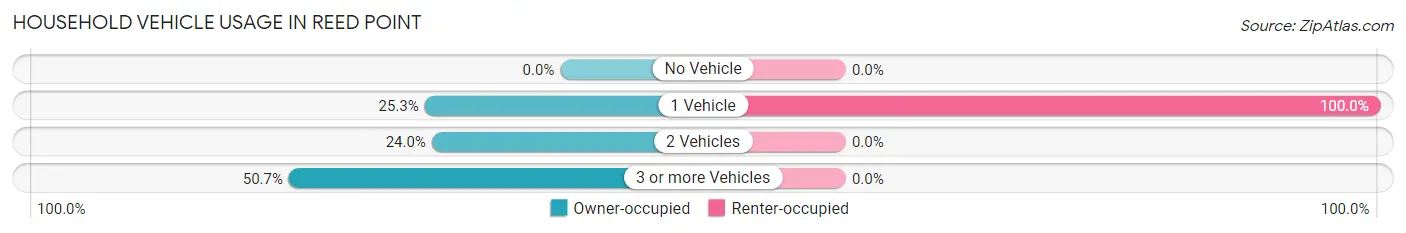
| Vehicles per Household | Owner-occupied | Renter-occupied |
| No Vehicle | 0 (0.0%) | 0 (0.0%) |
| 1 Vehicle | 19 (25.3%) | 3 (100.0%) |
| 2 Vehicles | 18 (24.0%) | 0 (0.0%) |
| 3 or more Vehicles | 38 (50.7%) | 0 (0.0%) |
| Total | 75 (100.0%) | 3 (100.0%) |
Real Estate & Mortgages in Reed Point
Real Estate and Mortgage Overview in Reed Point
| Characteristic | Without Mortgage | With Mortgage |
| Housing Units | 34 | 41 |
| Median Property Value | $104,200 | $95,800 |
| Median Household Income | - | - |
| Monthly Housing Costs | $267 | $0 |
| Real Estate Taxes | $1,154 | $0 |
Property Value by Mortgage Status in Reed Point
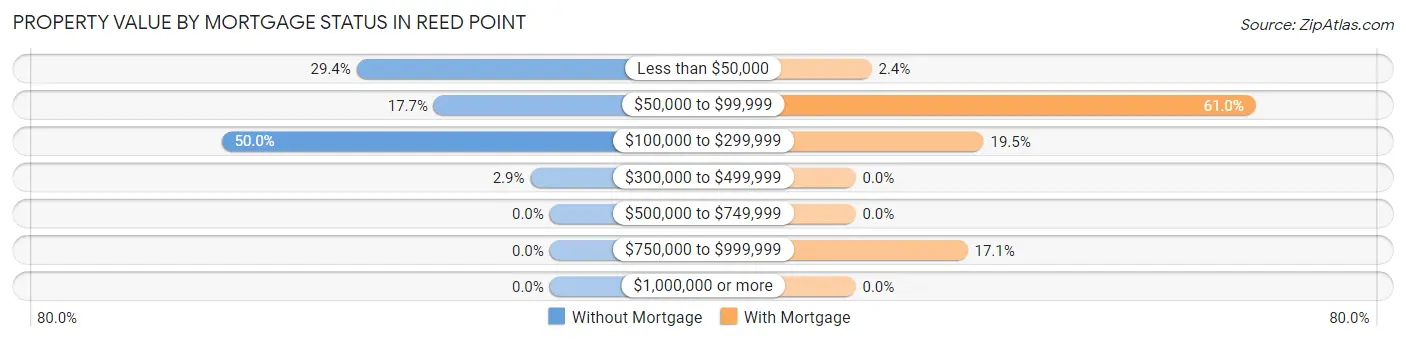
| Property Value | Without Mortgage | With Mortgage |
| Less than $50,000 | 10 (29.4%) | 1 (2.4%) |
| $50,000 to $99,999 | 6 (17.6%) | 25 (61.0%) |
| $100,000 to $299,999 | 17 (50.0%) | 8 (19.5%) |
| $300,000 to $499,999 | 1 (2.9%) | 0 (0.0%) |
| $500,000 to $749,999 | 0 (0.0%) | 0 (0.0%) |
| $750,000 to $999,999 | 0 (0.0%) | 7 (17.1%) |
| $1,000,000 or more | 0 (0.0%) | 0 (0.0%) |
| Total | 34 (100.0%) | 41 (100.0%) |
Household Income by Mortgage Status in Reed Point
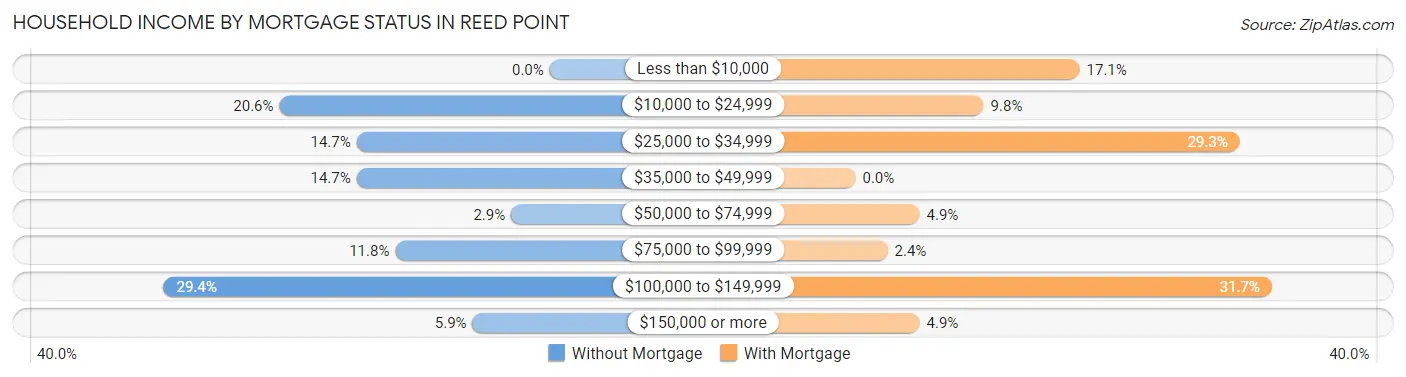
| Household Income | Without Mortgage | With Mortgage |
| Less than $10,000 | 0 (0.0%) | 7 (17.1%) |
| $10,000 to $24,999 | 7 (20.6%) | 4 (9.8%) |
| $25,000 to $34,999 | 5 (14.7%) | 12 (29.3%) |
| $35,000 to $49,999 | 5 (14.7%) | 0 (0.0%) |
| $50,000 to $74,999 | 1 (2.9%) | 2 (4.9%) |
| $75,000 to $99,999 | 4 (11.8%) | 1 (2.4%) |
| $100,000 to $149,999 | 10 (29.4%) | 13 (31.7%) |
| $150,000 or more | 2 (5.9%) | 2 (4.9%) |
| Total | 34 (100.0%) | 41 (100.0%) |
Property Value to Household Income Ratio in Reed Point
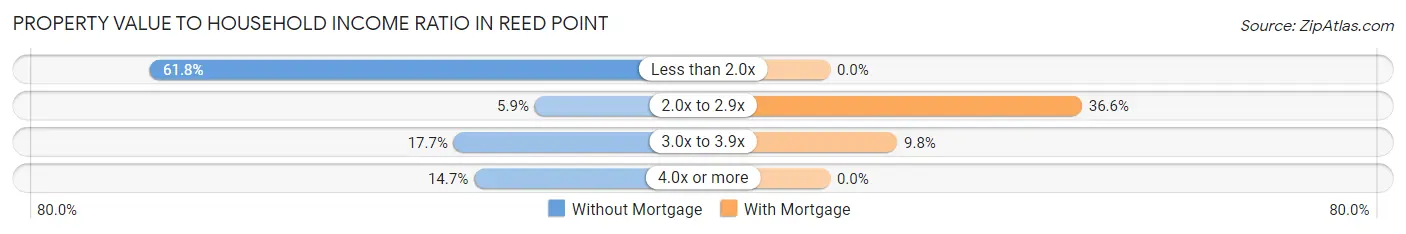
| Value-to-Income Ratio | Without Mortgage | With Mortgage |
| Less than 2.0x | 21 (61.8%) | 0 (0.0%) |
| 2.0x to 2.9x | 2 (5.9%) | 15 (36.6%) |
| 3.0x to 3.9x | 6 (17.6%) | 4 (9.8%) |
| 4.0x or more | 5 (14.7%) | 0 (0.0%) |
| Total | 34 (100.0%) | 41 (100.0%) |
Real Estate Taxes by Mortgage Status in Reed Point
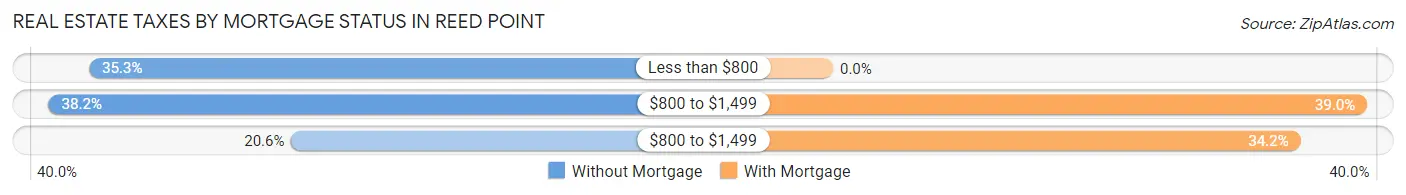
| Property Taxes | Without Mortgage | With Mortgage |
| Less than $800 | 12 (35.3%) | 0 (0.0%) |
| $800 to $1,499 | 13 (38.2%) | 16 (39.0%) |
| $800 to $1,499 | 7 (20.6%) | 14 (34.2%) |
| Total | 34 (100.0%) | 41 (100.0%) |
Health & Disability in Reed Point
Health Insurance Coverage by Age in Reed Point
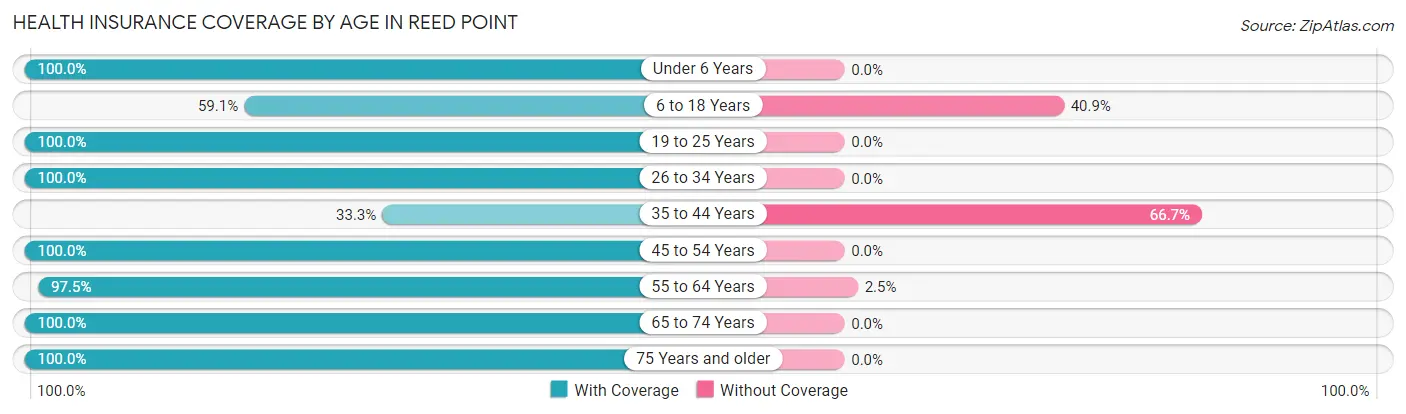
| Age Bracket | With Coverage | Without Coverage |
| Under 6 Years | 5 (100.0%) | 0 (0.0%) |
| 6 to 18 Years | 13 (59.1%) | 9 (40.9%) |
| 19 to 25 Years | 20 (100.0%) | 0 (0.0%) |
| 26 to 34 Years | 9 (100.0%) | 0 (0.0%) |
| 35 to 44 Years | 4 (33.3%) | 8 (66.7%) |
| 45 to 54 Years | 26 (100.0%) | 0 (0.0%) |
| 55 to 64 Years | 39 (97.5%) | 1 (2.5%) |
| 65 to 74 Years | 24 (100.0%) | 0 (0.0%) |
| 75 Years and older | 17 (100.0%) | 0 (0.0%) |
| Total | 157 (89.7%) | 18 (10.3%) |
Health Insurance Coverage by Citizenship Status in Reed Point
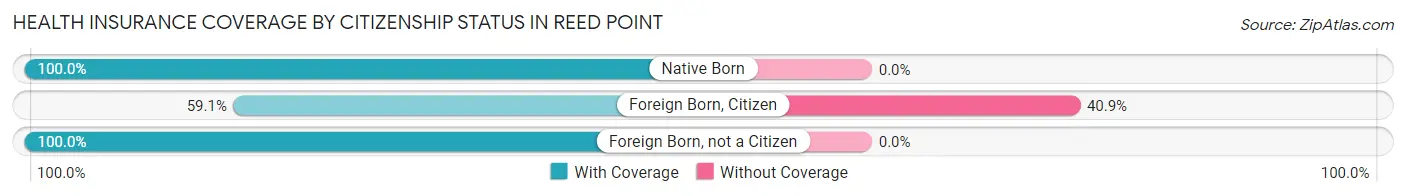
| Citizenship Status | With Coverage | Without Coverage |
| Native Born | 5 (100.0%) | 0 (0.0%) |
| Foreign Born, Citizen | 13 (59.1%) | 9 (40.9%) |
| Foreign Born, not a Citizen | 20 (100.0%) | 0 (0.0%) |
Health Insurance Coverage by Household Income in Reed Point
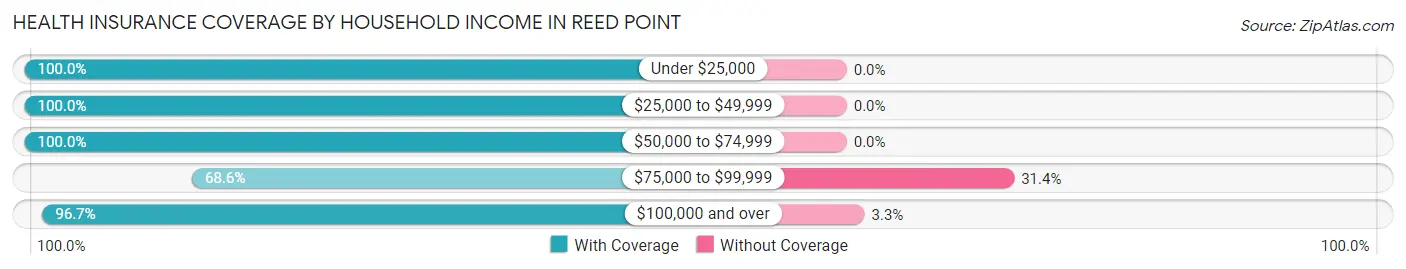
| Household Income | With Coverage | Without Coverage |
| Under $25,000 | 30 (100.0%) | 0 (0.0%) |
| $25,000 to $49,999 | 22 (100.0%) | 0 (0.0%) |
| $50,000 to $74,999 | 12 (100.0%) | 0 (0.0%) |
| $75,000 to $99,999 | 35 (68.6%) | 16 (31.4%) |
| $100,000 and over | 58 (96.7%) | 2 (3.3%) |
Public vs Private Health Insurance Coverage by Age in Reed Point
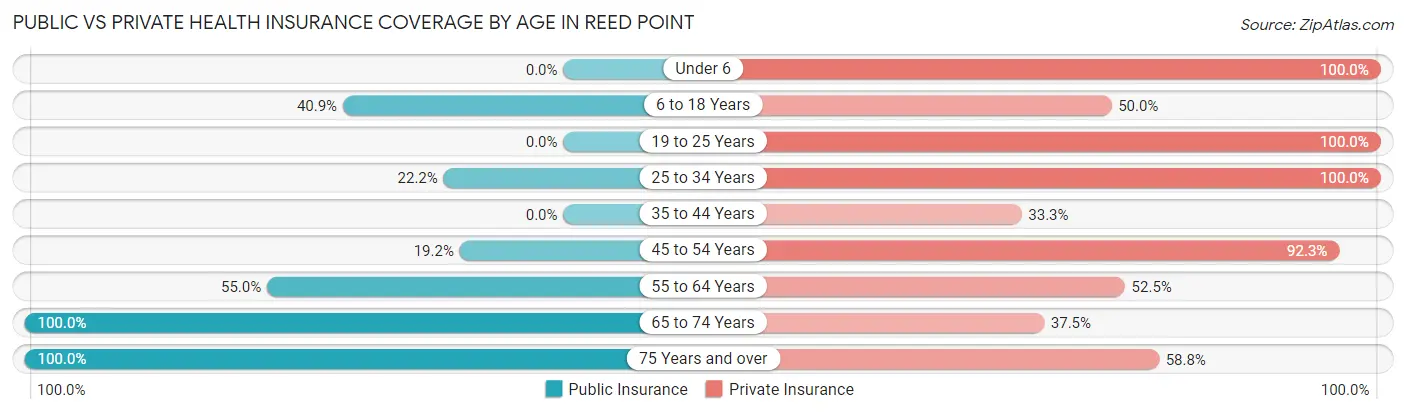
| Age Bracket | Public Insurance | Private Insurance |
| Under 6 | 0 (0.0%) | 5 (100.0%) |
| 6 to 18 Years | 9 (40.9%) | 11 (50.0%) |
| 19 to 25 Years | 0 (0.0%) | 20 (100.0%) |
| 25 to 34 Years | 2 (22.2%) | 9 (100.0%) |
| 35 to 44 Years | 0 (0.0%) | 4 (33.3%) |
| 45 to 54 Years | 5 (19.2%) | 24 (92.3%) |
| 55 to 64 Years | 22 (55.0%) | 21 (52.5%) |
| 65 to 74 Years | 24 (100.0%) | 9 (37.5%) |
| 75 Years and over | 17 (100.0%) | 10 (58.8%) |
| Total | 79 (45.1%) | 113 (64.6%) |
Disability Status by Sex by Age in Reed Point
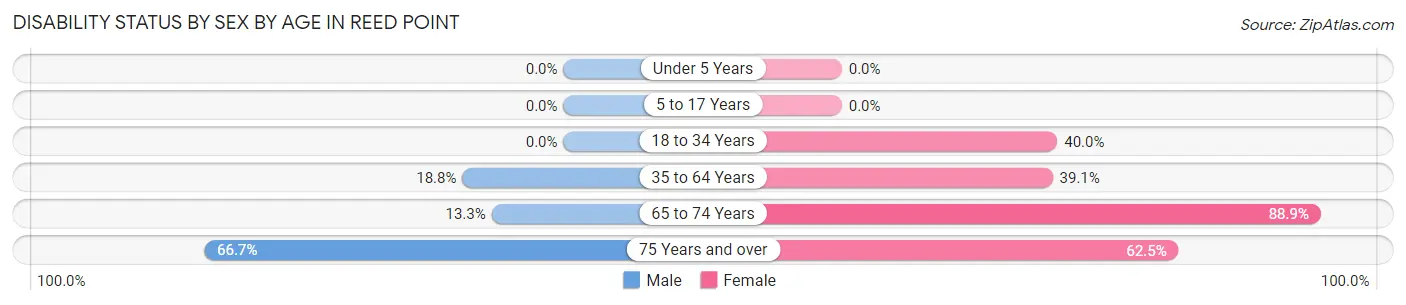
| Age Bracket | Male | Female |
| Under 5 Years | 0 (0.0%) | 0 (0.0%) |
| 5 to 17 Years | 0 (0.0%) | 0 (0.0%) |
| 18 to 34 Years | 0 (0.0%) | 4 (40.0%) |
| 35 to 64 Years | 6 (18.8%) | 18 (39.1%) |
| 65 to 74 Years | 2 (13.3%) | 8 (88.9%) |
| 75 Years and over | 6 (66.7%) | 5 (62.5%) |
Disability Class by Sex by Age in Reed Point
Disability Class: Hearing Difficulty
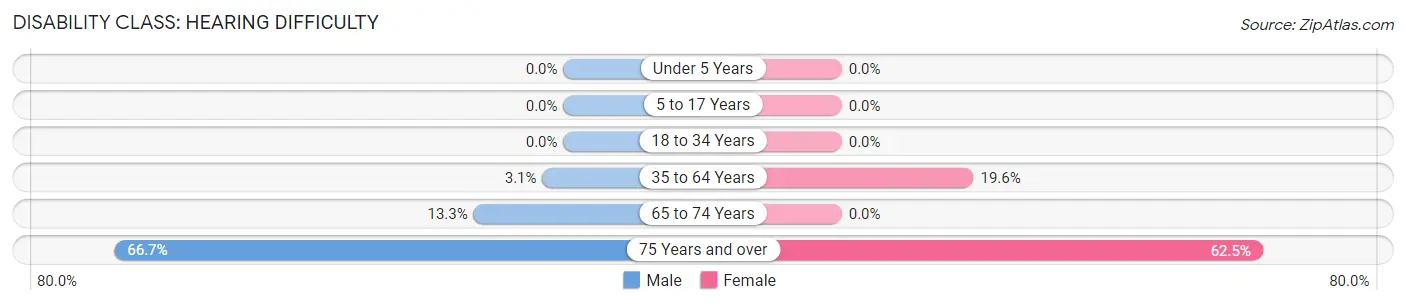
| Age Bracket | Male | Female |
| Under 5 Years | 0 (0.0%) | 0 (0.0%) |
| 5 to 17 Years | 0 (0.0%) | 0 (0.0%) |
| 18 to 34 Years | 0 (0.0%) | 0 (0.0%) |
| 35 to 64 Years | 1 (3.1%) | 9 (19.6%) |
| 65 to 74 Years | 2 (13.3%) | 0 (0.0%) |
| 75 Years and over | 6 (66.7%) | 5 (62.5%) |
Disability Class: Vision Difficulty
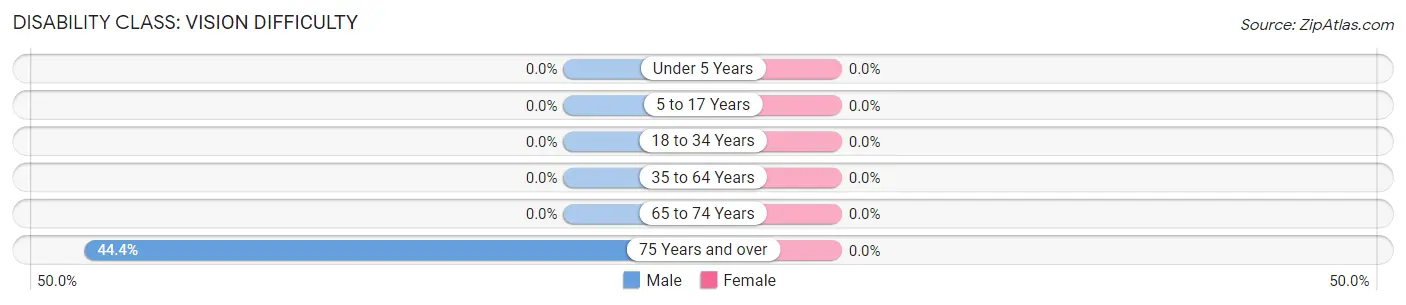
| Age Bracket | Male | Female |
| Under 5 Years | 0 (0.0%) | 0 (0.0%) |
| 5 to 17 Years | 0 (0.0%) | 0 (0.0%) |
| 18 to 34 Years | 0 (0.0%) | 0 (0.0%) |
| 35 to 64 Years | 0 (0.0%) | 0 (0.0%) |
| 65 to 74 Years | 0 (0.0%) | 0 (0.0%) |
| 75 Years and over | 4 (44.4%) | 0 (0.0%) |
Disability Class: Cognitive Difficulty
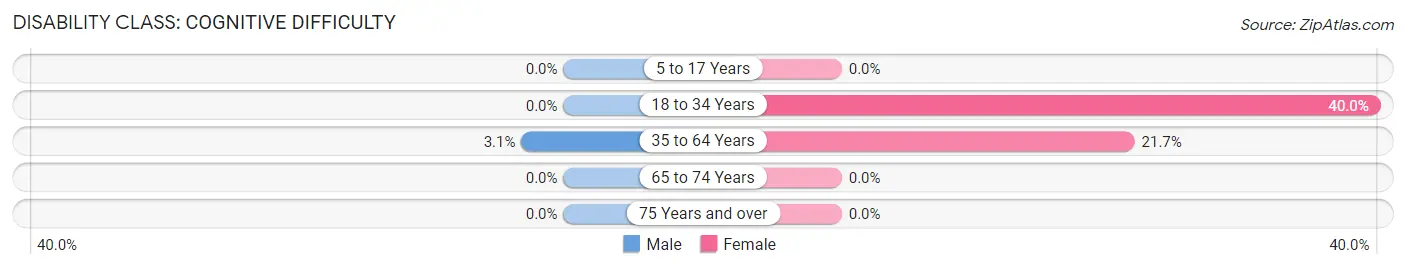
| Age Bracket | Male | Female |
| 5 to 17 Years | 0 (0.0%) | 0 (0.0%) |
| 18 to 34 Years | 0 (0.0%) | 4 (40.0%) |
| 35 to 64 Years | 1 (3.1%) | 10 (21.7%) |
| 65 to 74 Years | 0 (0.0%) | 0 (0.0%) |
| 75 Years and over | 0 (0.0%) | 0 (0.0%) |
Disability Class: Ambulatory Difficulty
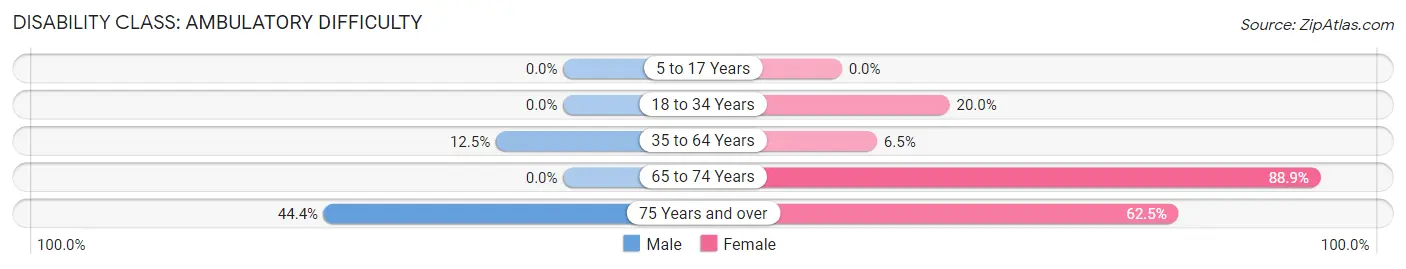
| Age Bracket | Male | Female |
| 5 to 17 Years | 0 (0.0%) | 0 (0.0%) |
| 18 to 34 Years | 0 (0.0%) | 2 (20.0%) |
| 35 to 64 Years | 4 (12.5%) | 3 (6.5%) |
| 65 to 74 Years | 0 (0.0%) | 8 (88.9%) |
| 75 Years and over | 4 (44.4%) | 5 (62.5%) |
Disability Class: Self-Care Difficulty
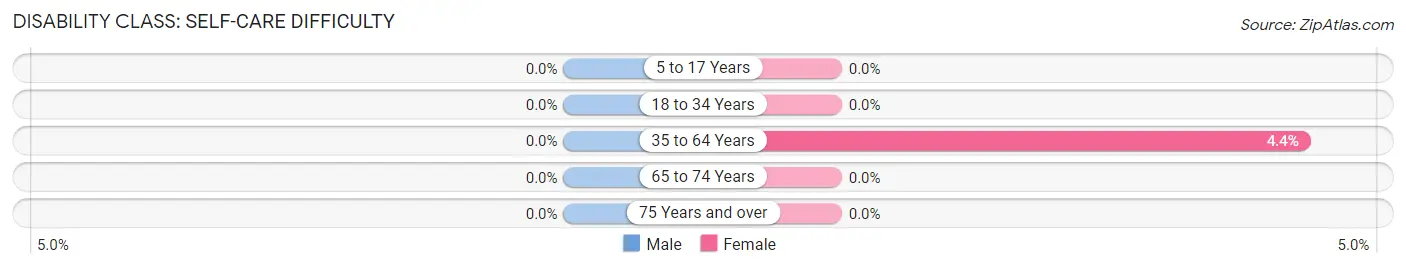
| Age Bracket | Male | Female |
| 5 to 17 Years | 0 (0.0%) | 0 (0.0%) |
| 18 to 34 Years | 0 (0.0%) | 0 (0.0%) |
| 35 to 64 Years | 0 (0.0%) | 2 (4.3%) |
| 65 to 74 Years | 0 (0.0%) | 0 (0.0%) |
| 75 Years and over | 0 (0.0%) | 0 (0.0%) |
Technology Access in Reed Point
Computing Device Access in Reed Point
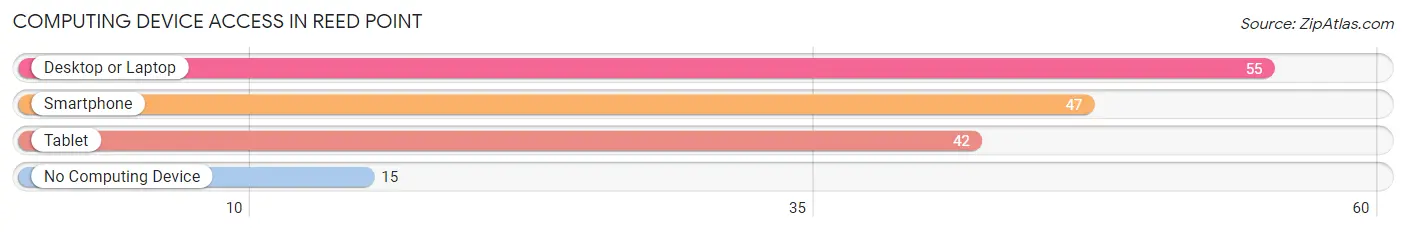
| Device Type | # Households | % Households |
| Desktop or Laptop | 55 | 70.5% |
| Smartphone | 47 | 60.3% |
| Tablet | 42 | 53.8% |
| No Computing Device | 15 | 19.2% |
| Total | 78 | 100.0% |
Internet Access in Reed Point
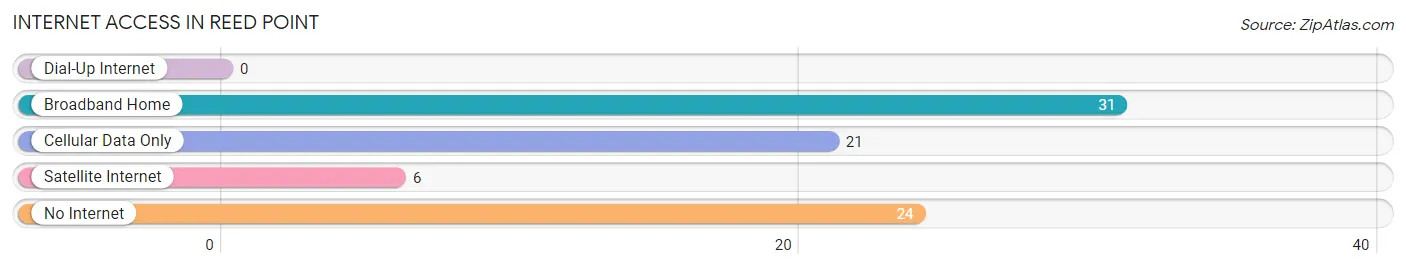
| Internet Type | # Households | % Households |
| Dial-Up Internet | 0 | 0.0% |
| Broadband Home | 31 | 39.7% |
| Cellular Data Only | 21 | 26.9% |
| Satellite Internet | 6 | 7.7% |
| No Internet | 24 | 30.8% |
| Total | 78 | 100.0% |
Reed Point Summary
Reed Point, Montana is a small town located in the south-central part of the state, about 25 miles east of the city of Bozeman. It is situated in the foothills of the Bridger Mountains, and is part of the larger Yellowstone Valley region. The town has a population of just over 500 people, and is known for its rural charm and small-town atmosphere.
History
Reed Point was founded in 1882 by a group of settlers from the Midwest. The town was named after the Reed family, who were among the first settlers in the area. The town was originally a farming and ranching community, and the local economy was largely based on agriculture. In the early 1900s, the town began to grow and develop, and by the 1920s it had become a popular tourist destination.
In the 1950s, the town began to experience a decline in population, as many of the younger residents moved away in search of better job opportunities. However, in the late 1970s, the town experienced a resurgence in population, as people began to move back to the area in search of a more rural lifestyle.
Geography
Reed Point is located in the south-central part of Montana, about 25 miles east of the city of Bozeman. It is situated in the foothills of the Bridger Mountains, and is part of the larger Yellowstone Valley region. The town is located at an elevation of 4,400 feet, and is surrounded by rolling hills and grasslands. The town is located near several rivers, including the Yellowstone River, the Madison River, and the Gallatin River.
Economy
Reed Point’s economy is largely based on agriculture and tourism. The town is home to several small farms and ranches, and the local economy is supported by the sale of livestock, hay, and other agricultural products. The town is also a popular tourist destination, and many visitors come to the area to enjoy the rural atmosphere and outdoor activities.
Demographics
As of the 2010 census, Reed Point had a population of 517 people. The racial makeup of the town was 95.3% White, 0.6% Native American, 0.2% Asian, 0.2% from other races, and 3.7% from two or more races. The median household income was $37,500, and the median age was 44.5 years.
Conclusion
Reed Point, Montana is a small town located in the south-central part of the state, about 25 miles east of the city of Bozeman. It is situated in the foothills of the Bridger Mountains, and is part of the larger Yellowstone Valley region. The town has a population of just over 500 people, and is known for its rural charm and small-town atmosphere. The local economy is largely based on agriculture and tourism, and the town is a popular destination for visitors looking to enjoy the rural atmosphere and outdoor activities.
Common Questions
What is Per Capita Income in Reed Point?
Per Capita income in Reed Point is $34,358.
What is the Median Family Income in Reed Point?
Median Family Income in Reed Point is $84,038.
What is the Median Household income in Reed Point?
Median Household Income in Reed Point is $61,250.
What is Income or Wage Gap in Reed Point?
Income or Wage Gap in Reed Point is 6.1%.
Women in Reed Point earn 93.9 cents for every dollar earned by a man.
What is Inequality or Gini Index in Reed Point?
Inequality or Gini Index in Reed Point is 0.49.
What is the Total Population of Reed Point?
Total Population of Reed Point is 175.
What is the Total Male Population of Reed Point?
Total Male Population of Reed Point is 87.
What is the Total Female Population of Reed Point?
Total Female Population of Reed Point is 88.
What is the Ratio of Males per 100 Females in Reed Point?
There are 98.86 Males per 100 Females in Reed Point.
What is the Ratio of Females per 100 Males in Reed Point?
There are 101.15 Females per 100 Males in Reed Point.
What is the Median Population Age in Reed Point?
Median Population Age in Reed Point is 53.8 Years.
What is the Average Family Size in Reed Point
Average Family Size in Reed Point is 2.9 People.
What is the Average Household Size in Reed Point
Average Household Size in Reed Point is 2.2 People.
How Large is the Labor Force in Reed Point?
There are 86 People in the Labor Forcein in Reed Point.
What is the Percentage of People in the Labor Force in Reed Point?
54.1% of People are in the Labor Force in Reed Point.