Eton, GA Map & Demographics
Eton Map
Eton Overview
$22,706
PER CAPITA INCOME
$87,904
AVG FAMILY INCOME
$85,313
AVG HOUSEHOLD INCOME
37.1%
WAGE / INCOME GAP [ % ]
62.9¢/ $1
WAGE / INCOME GAP [ $ ]
0.31
INEQUALITY / GINI INDEX
1,574
TOTAL POPULATION
828
MALE POPULATION
746
FEMALE POPULATION
110.99
MALES / 100 FEMALES
90.10
FEMALES / 100 MALES
31.8
MEDIAN AGE
3.8
AVG FAMILY SIZE
3.8
AVG HOUSEHOLD SIZE
710
LABOR FORCE [ PEOPLE ]
66.5%
PERCENT IN LABOR FORCE
2.7%
UNEMPLOYMENT RATE
Eton Zip Codes
Eton Area Codes
Income in Eton
Income Overview in Eton
Per Capita Income in Eton is $22,706, while median incomes of families and households are $87,904 and $85,313 respectively.
| Characteristic | Number | Measure |
| Per Capita Income | 1,574 | $22,706 |
| Median Family Income | 361 | $87,904 |
| Mean Family Income | 361 | $86,621 |
| Median Household Income | 412 | $85,313 |
| Mean Household Income | 412 | $88,374 |
| Income Deficit | 361 | $0 |
| Wage / Income Gap (%) | 1,574 | 37.14% |
| Wage / Income Gap ($) | 1,574 | 62.86¢ per $1 |
| Gini / Inequality Index | 1,574 | 0.31 |
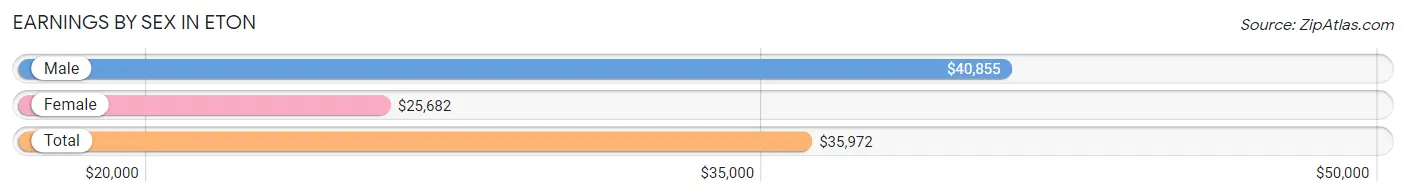
Earnings by Sex in Eton
Average Earnings in Eton are $35,972, $40,855 for men and $25,682 for women, a difference of 37.1%.
| Sex | Number | Average Earnings |
| Male | 431 (57.5%) | $40,855 |
| Female | 318 (42.5%) | $25,682 |
| Total | 749 (100.0%) | $35,972 |
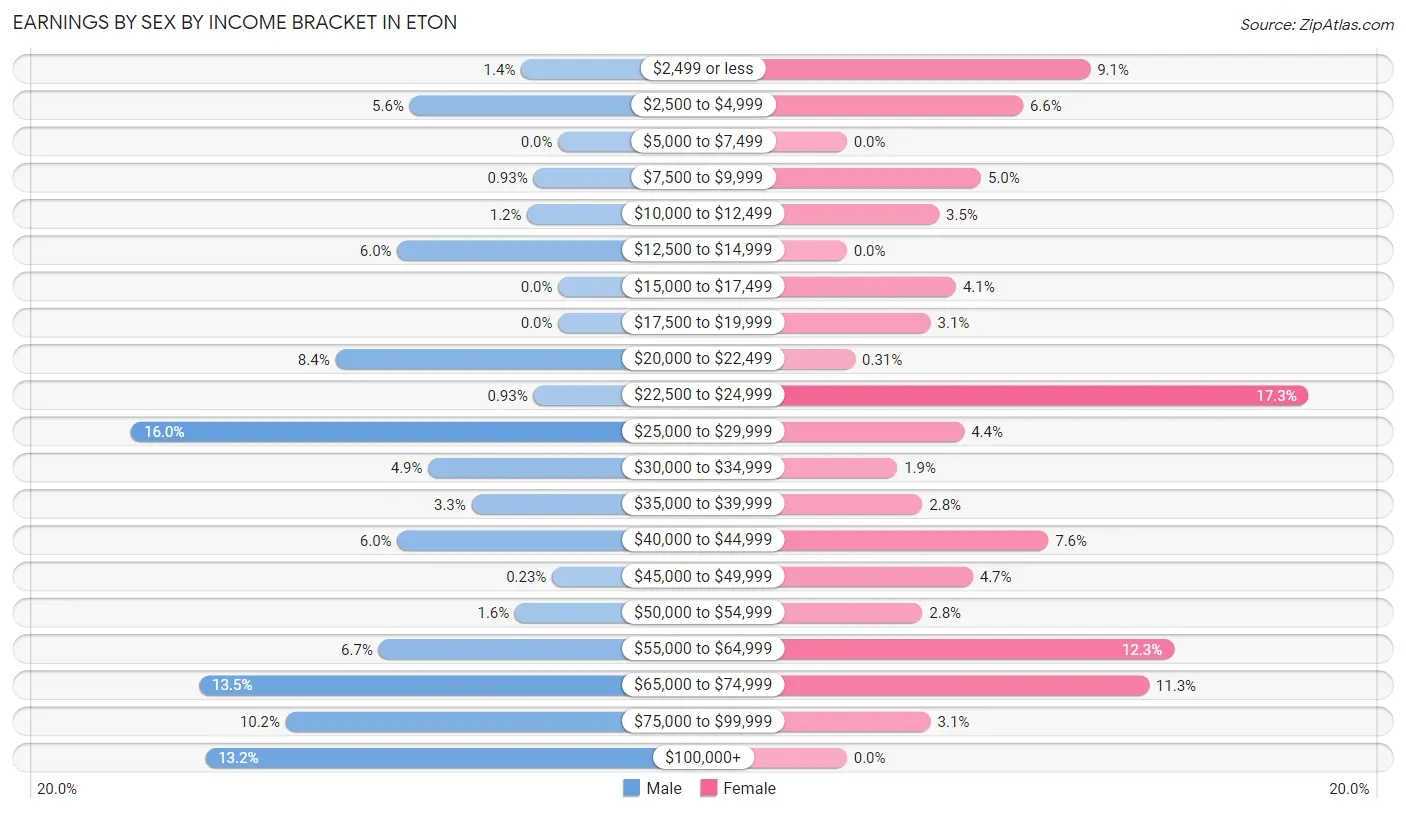
Earnings by Sex by Income Bracket in Eton
The most common earnings brackets in Eton are $25,000 to $29,999 for men (69 | 16.0%) and $22,500 to $24,999 for women (55 | 17.3%).
| Income | Male | Female |
| $2,499 or less | 6 (1.4%) | 29 (9.1%) |
| $2,500 to $4,999 | 24 (5.6%) | 21 (6.6%) |
| $5,000 to $7,499 | 0 (0.0%) | 0 (0.0%) |
| $7,500 to $9,999 | 4 (0.9%) | 16 (5.0%) |
| $10,000 to $12,499 | 5 (1.2%) | 11 (3.5%) |
| $12,500 to $14,999 | 26 (6.0%) | 0 (0.0%) |
| $15,000 to $17,499 | 0 (0.0%) | 13 (4.1%) |
| $17,500 to $19,999 | 0 (0.0%) | 10 (3.1%) |
| $20,000 to $22,499 | 36 (8.4%) | 1 (0.3%) |
| $22,500 to $24,999 | 4 (0.9%) | 55 (17.3%) |
| $25,000 to $29,999 | 69 (16.0%) | 14 (4.4%) |
| $30,000 to $34,999 | 21 (4.9%) | 6 (1.9%) |
| $35,000 to $39,999 | 14 (3.3%) | 9 (2.8%) |
| $40,000 to $44,999 | 26 (6.0%) | 24 (7.5%) |
| $45,000 to $49,999 | 1 (0.2%) | 15 (4.7%) |
| $50,000 to $54,999 | 7 (1.6%) | 9 (2.8%) |
| $55,000 to $64,999 | 29 (6.7%) | 39 (12.3%) |
| $65,000 to $74,999 | 58 (13.5%) | 36 (11.3%) |
| $75,000 to $99,999 | 44 (10.2%) | 10 (3.1%) |
| $100,000+ | 57 (13.2%) | 0 (0.0%) |
| Total | 431 (100.0%) | 318 (100.0%) |
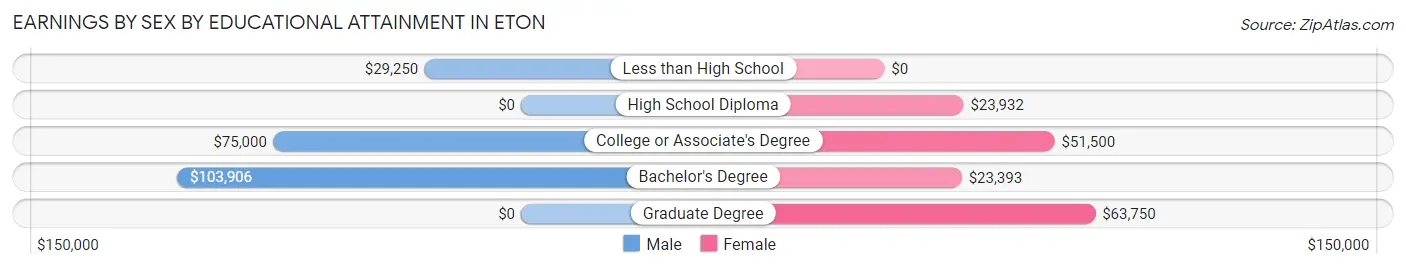
Earnings by Sex by Educational Attainment in Eton
Average earnings in Eton are $51,250 for men and $25,625 for women, a difference of 50.0%. Men with an educational attainment of bachelor's degree enjoy the highest average annual earnings of $103,906, while those with less than high school education earn the least with $29,250. Women with an educational attainment of graduate degree earn the most with the average annual earnings of $63,750, while those with bachelor's degree education have the smallest earnings of $23,393.
| Educational Attainment | Male Income | Female Income |
| Less than High School | $29,250 | $0 |
| High School Diploma | - | - |
| College or Associate's Degree | $75,000 | $51,500 |
| Bachelor's Degree | $103,906 | $23,393 |
| Graduate Degree | - | - |
| Total | $51,250 | $25,625 |
Family Income in Eton
Family Income Brackets in Eton
According to the Eton family income data, there are 80 families falling into the $75,000 to $99,999 income range, which is the most common income bracket and makes up 22.2% of all families.
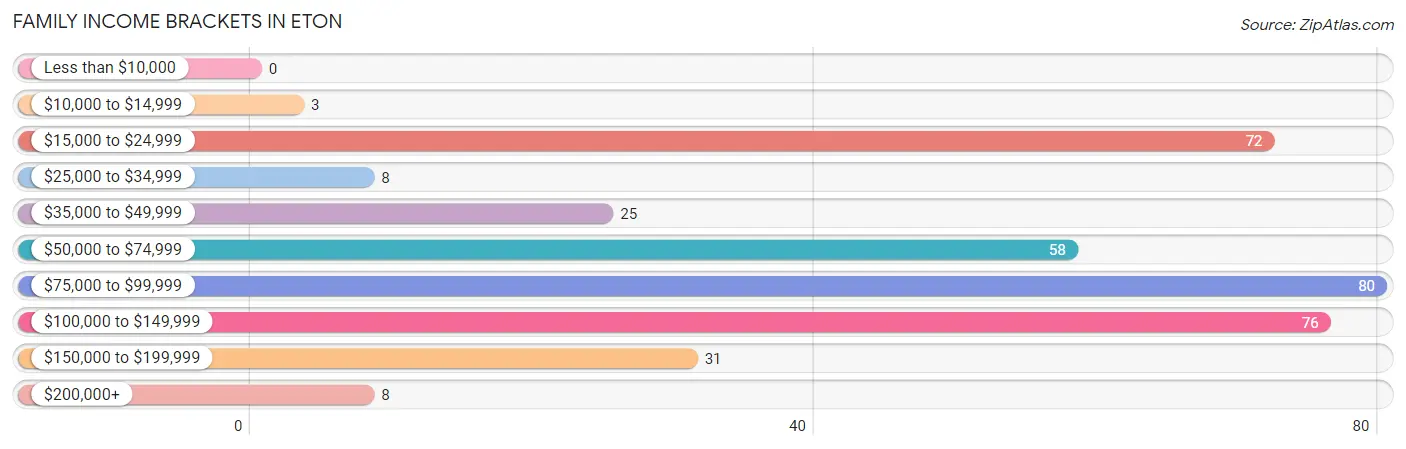
| Income Bracket | # Families | % Families |
| Less than $10,000 | 0 | 0.0% |
| $10,000 to $14,999 | 3 | 0.8% |
| $15,000 to $24,999 | 72 | 19.9% |
| $25,000 to $34,999 | 8 | 2.2% |
| $35,000 to $49,999 | 25 | 6.9% |
| $50,000 to $74,999 | 58 | 16.1% |
| $75,000 to $99,999 | 80 | 22.2% |
| $100,000 to $149,999 | 76 | 21.1% |
| $150,000 to $199,999 | 31 | 8.6% |
| $200,000+ | 8 | 2.2% |
Family Income by Famaliy Size in Eton
5-person families (8 | 2.2%) account for the highest median family income in Eton with $98,750 per family, while 4-person families (144 | 39.9%) have the highest median income of $22,408 per family member.
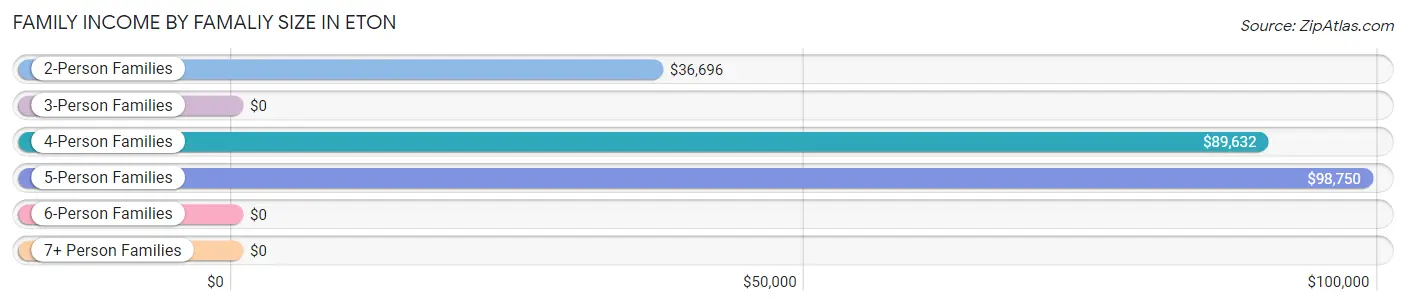
| Income Bracket | # Families | Median Income |
| 2-Person Families | 77 (21.3%) | $36,696 |
| 3-Person Families | 107 (29.6%) | $0 |
| 4-Person Families | 144 (39.9%) | $89,632 |
| 5-Person Families | 8 (2.2%) | $98,750 |
| 6-Person Families | 15 (4.2%) | $0 |
| 7+ Person Families | 10 (2.8%) | $0 |
| Total | 361 (100.0%) | $87,904 |
Family Income by Number of Earners in Eton
The median family income in Eton is $87,904, with families comprising 3+ earners (87) having the highest median family income of $133,692, while families with 1 earner (138) have the lowest median family income of $24,625, accounting for 24.1% and 38.2% of families, respectively.
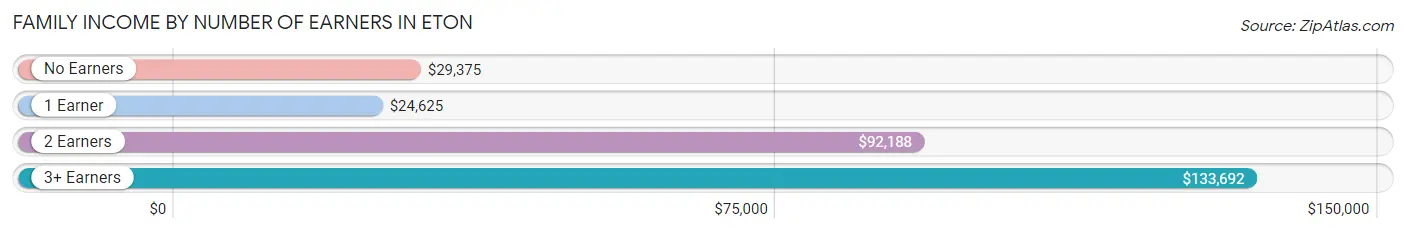
| Number of Earners | # Families | Median Income |
| No Earners | 9 (2.5%) | $29,375 |
| 1 Earner | 138 (38.2%) | $24,625 |
| 2 Earners | 127 (35.2%) | $92,188 |
| 3+ Earners | 87 (24.1%) | $133,692 |
| Total | 361 (100.0%) | $87,904 |
Household Income in Eton
Household Income Brackets in Eton
With 104 households falling in the category, the $50,000 to $74,999 income range is the most frequent in Eton, accounting for 25.2% of all households. In contrast, only 3 households (0.7%) fall into the $10,000 to $14,999 income bracket, making it the least populous group.
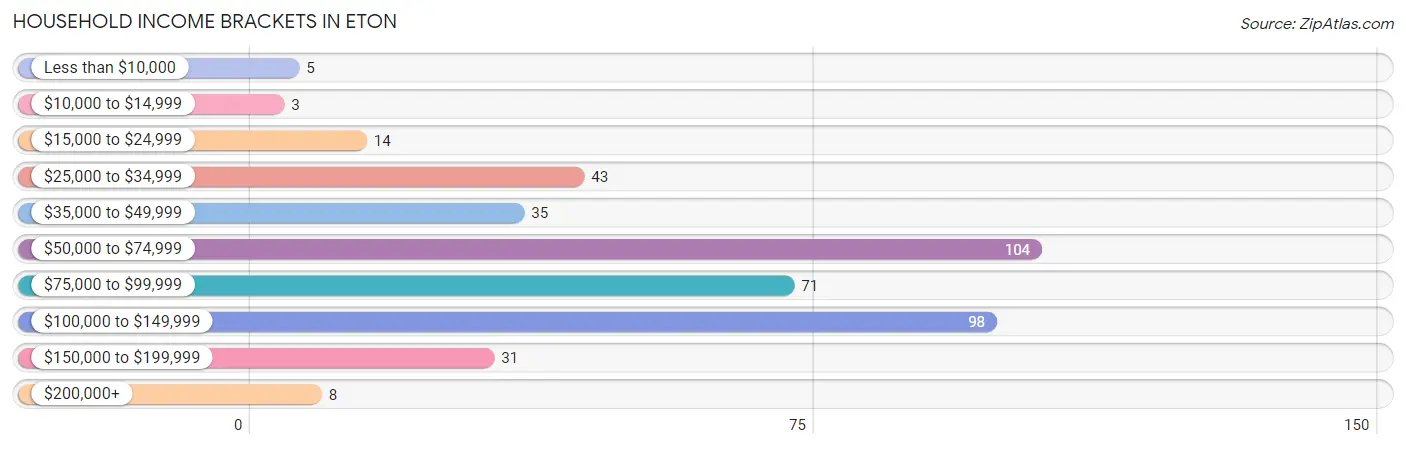
| Income Bracket | # Households | % Households |
| Less than $10,000 | 5 | 1.2% |
| $10,000 to $14,999 | 3 | 0.7% |
| $15,000 to $24,999 | 14 | 3.4% |
| $25,000 to $34,999 | 43 | 10.4% |
| $35,000 to $49,999 | 35 | 8.5% |
| $50,000 to $74,999 | 104 | 25.2% |
| $75,000 to $99,999 | 71 | 17.2% |
| $100,000 to $149,999 | 98 | 23.8% |
| $150,000 to $199,999 | 31 | 7.5% |
| $200,000+ | 8 | 1.9% |
Household Income by Householder Age in Eton
The median household income in Eton is $85,313, with the highest median household income of $90,208 found in the 45 to 64 years age bracket for the primary householder. A total of 124 households (30.1%) fall into this category. Meanwhile, the 15 to 24 years age bracket for the primary householder has the lowest median household income of $0, with 1 households (0.2%) in this group.
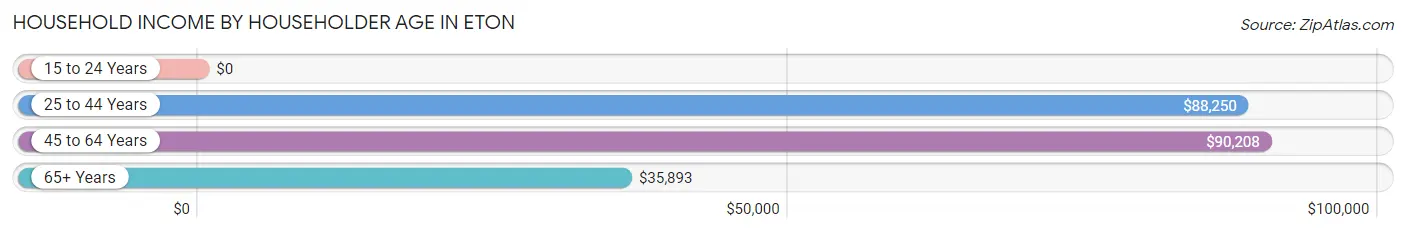
| Income Bracket | # Households | Median Income |
| 15 to 24 Years | 1 (0.2%) | $0 |
| 25 to 44 Years | 241 (58.5%) | $88,250 |
| 45 to 64 Years | 124 (30.1%) | $90,208 |
| 65+ Years | 46 (11.2%) | $35,893 |
| Total | 412 (100.0%) | $85,313 |
Poverty in Eton
Income Below Poverty by Sex and Age in Eton
With 19.3% poverty level for males and 20.8% for females among the residents of Eton, under 5 year old males and 5 year old females are the most vulnerable to poverty, with 15 males (53.6%) and 6 females (100.0%) in their respective age groups living below the poverty level.
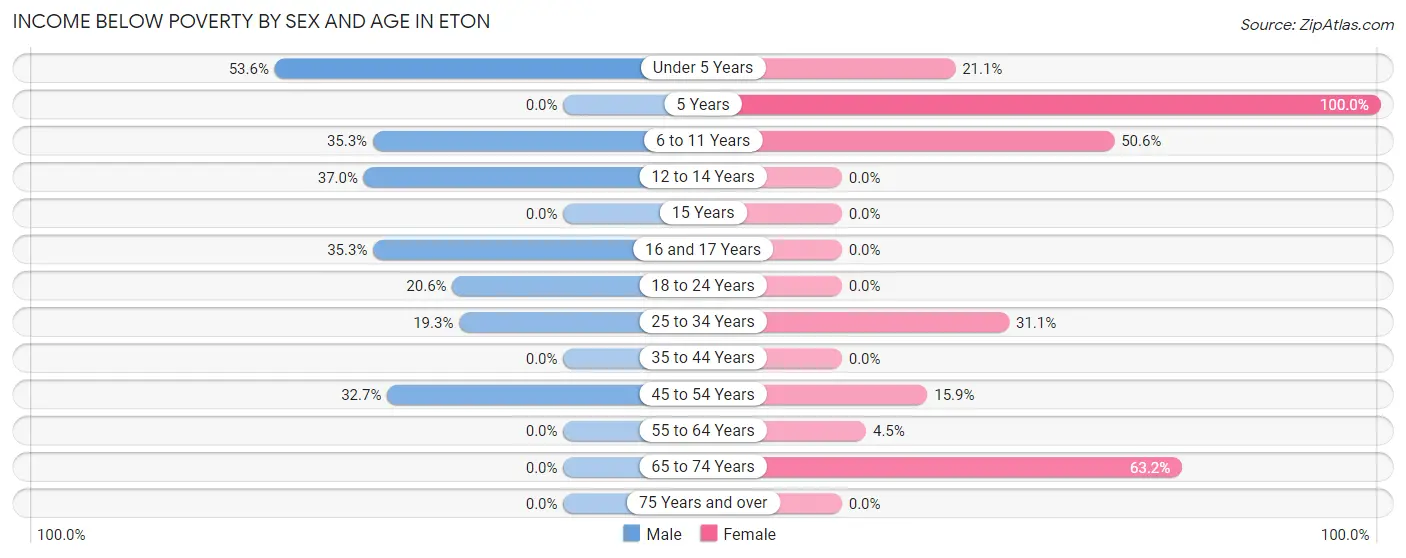
| Age Bracket | Male | Female |
| Under 5 Years | 15 (53.6%) | 12 (21.0%) |
| 5 Years | 0 (0.0%) | 6 (100.0%) |
| 6 to 11 Years | 41 (35.3%) | 45 (50.6%) |
| 12 to 14 Years | 20 (37.0%) | 0 (0.0%) |
| 15 Years | 0 (0.0%) | 0 (0.0%) |
| 16 and 17 Years | 6 (35.3%) | 0 (0.0%) |
| 18 to 24 Years | 14 (20.6%) | 0 (0.0%) |
| 25 to 34 Years | 23 (19.3%) | 59 (31.0%) |
| 35 to 44 Years | 0 (0.0%) | 0 (0.0%) |
| 45 to 54 Years | 34 (32.7%) | 10 (15.9%) |
| 55 to 64 Years | 0 (0.0%) | 9 (4.5%) |
| 65 to 74 Years | 0 (0.0%) | 12 (63.2%) |
| 75 Years and over | 0 (0.0%) | 0 (0.0%) |
| Total | 153 (19.3%) | 153 (20.8%) |
Income Above Poverty by Sex and Age in Eton
According to the poverty statistics in Eton, males aged 5 years and females aged 12 to 14 years are the age groups that are most secure financially, with 100.0% of males and 100.0% of females in these age groups living above the poverty line.
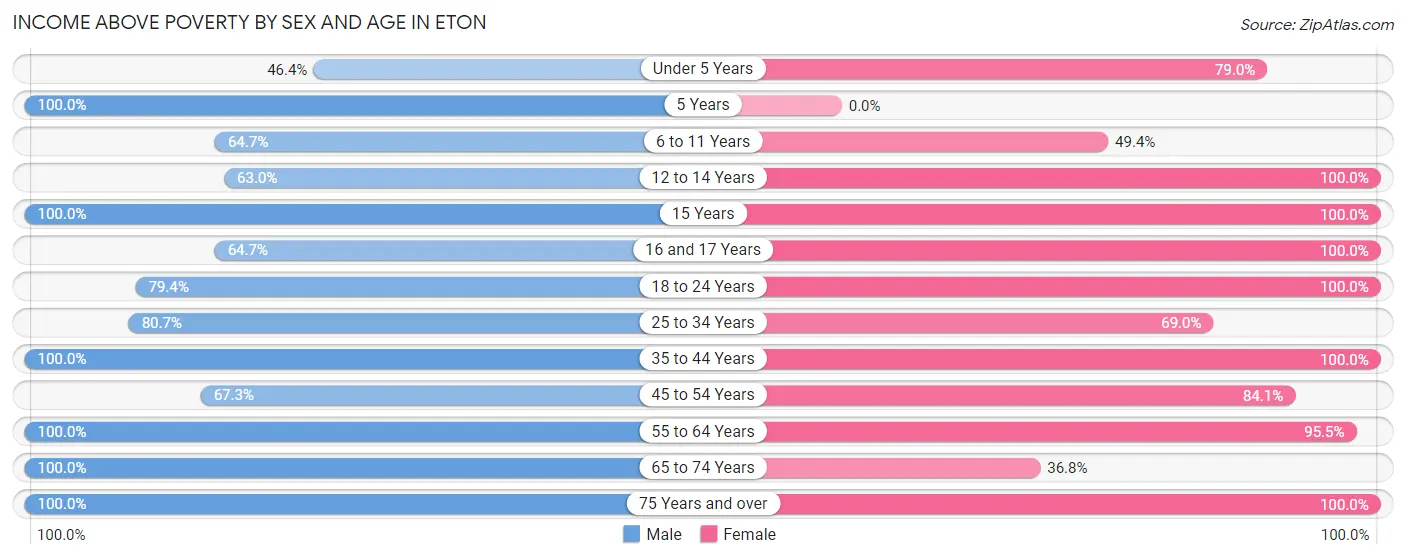
| Age Bracket | Male | Female |
| Under 5 Years | 13 (46.4%) | 45 (78.9%) |
| 5 Years | 39 (100.0%) | 0 (0.0%) |
| 6 to 11 Years | 75 (64.7%) | 44 (49.4%) |
| 12 to 14 Years | 34 (63.0%) | 13 (100.0%) |
| 15 Years | 48 (100.0%) | 8 (100.0%) |
| 16 and 17 Years | 11 (64.7%) | 3 (100.0%) |
| 18 to 24 Years | 54 (79.4%) | 30 (100.0%) |
| 25 to 34 Years | 96 (80.7%) | 131 (69.0%) |
| 35 to 44 Years | 90 (100.0%) | 46 (100.0%) |
| 45 to 54 Years | 70 (67.3%) | 53 (84.1%) |
| 55 to 64 Years | 7 (100.0%) | 191 (95.5%) |
| 65 to 74 Years | 99 (100.0%) | 7 (36.8%) |
| 75 Years and over | 2 (100.0%) | 11 (100.0%) |
| Total | 638 (80.7%) | 582 (79.2%) |
Income Below Poverty Among Married-Couple Families in Eton
The poverty statistics for married-couple families in Eton show that 2.1% or 5 of the total 241 families live below the poverty line. Families with 5 or more children have the highest poverty rate of 50.0%, comprising of 5 families. On the other hand, families with no children have the lowest poverty rate of 0.0%, which includes 0 families.
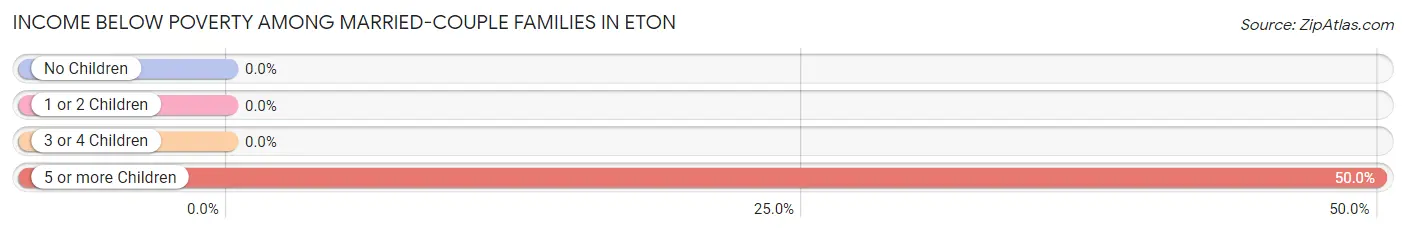
| Children | Above Poverty | Below Poverty |
| No Children | 115 (100.0%) | 0 (0.0%) |
| 1 or 2 Children | 109 (100.0%) | 0 (0.0%) |
| 3 or 4 Children | 7 (100.0%) | 0 (0.0%) |
| 5 or more Children | 5 (50.0%) | 5 (50.0%) |
| Total | 236 (97.9%) | 5 (2.1%) |
Income Below Poverty Among Single-Parent Households in Eton
According to the poverty data in Eton, 60.7% or 17 single-father households and 51.1% or 47 single-mother households are living below the poverty line. Among single-father households, those with 1 or 2 children have the highest poverty rate, with 17 households (60.7%) experiencing poverty. Likewise, among single-mother households, those with no children have the highest poverty rate, with 10 households (76.9%) falling below the poverty line.
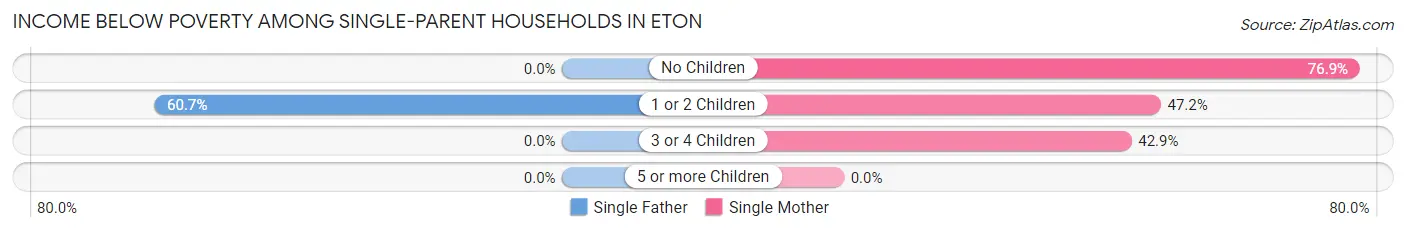
| Children | Single Father | Single Mother |
| No Children | 0 (0.0%) | 10 (76.9%) |
| 1 or 2 Children | 17 (60.7%) | 34 (47.2%) |
| 3 or 4 Children | 0 (0.0%) | 3 (42.9%) |
| 5 or more Children | 0 (0.0%) | 0 (0.0%) |
| Total | 17 (60.7%) | 47 (51.1%) |
Income Below Poverty Among Married-Couple vs Single-Parent Households in Eton
The poverty data for Eton shows that 5 of the married-couple family households (2.1%) and 64 of the single-parent households (53.3%) are living below the poverty level. Within the married-couple family households, those with 5 or more children have the highest poverty rate, with 5 households (50.0%) falling below the poverty line. Among the single-parent households, those with no children have the highest poverty rate, with 10 household (76.9%) living below poverty.
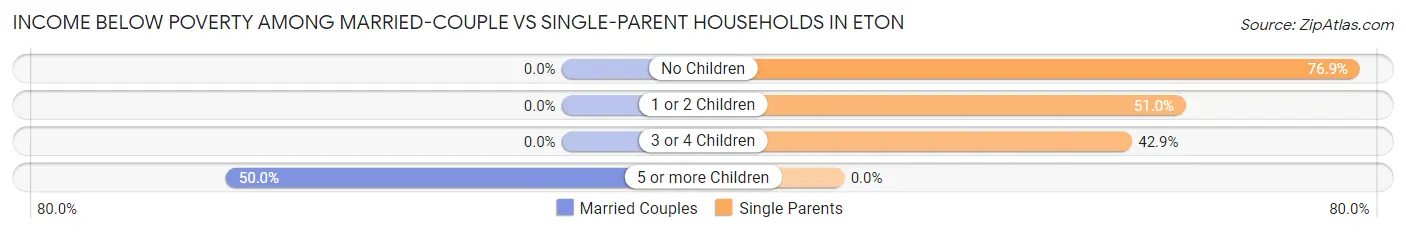
| Children | Married-Couple Families | Single-Parent Households |
| No Children | 0 (0.0%) | 10 (76.9%) |
| 1 or 2 Children | 0 (0.0%) | 51 (51.0%) |
| 3 or 4 Children | 0 (0.0%) | 3 (42.9%) |
| 5 or more Children | 5 (50.0%) | 0 (0.0%) |
| Total | 5 (2.1%) | 64 (53.3%) |
Race in Eton
The most populous races in Eton are White / Caucasian (1,399 | 88.9%), Hispanic or Latino (691 | 43.9%), and Black / African American (106 | 6.7%).
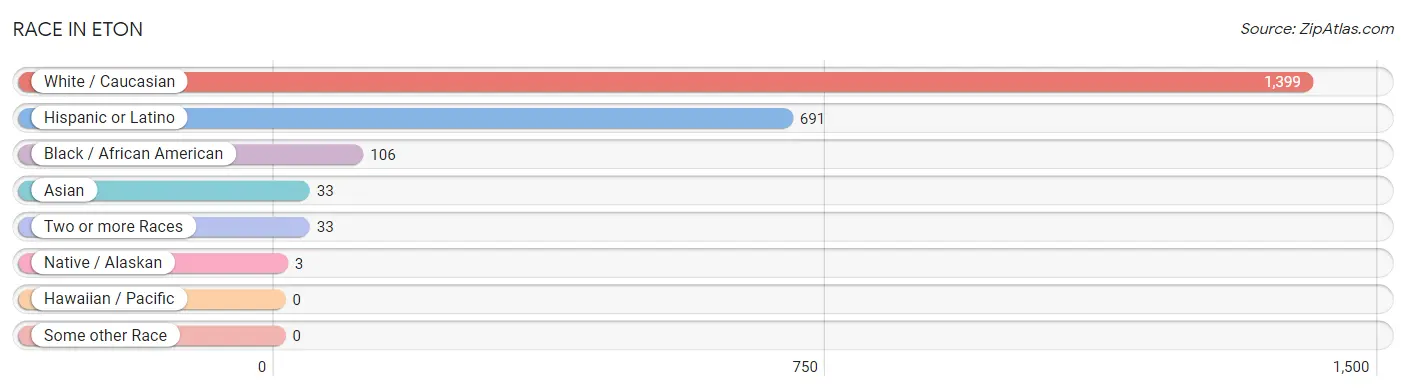
| Race | # Population | % Population |
| Asian | 33 | 2.1% |
| Black / African American | 106 | 6.7% |
| Hawaiian / Pacific | 0 | 0.0% |
| Hispanic or Latino | 691 | 43.9% |
| Native / Alaskan | 3 | 0.2% |
| White / Caucasian | 1,399 | 88.9% |
| Two or more Races | 33 | 2.1% |
| Some other Race | 0 | 0.0% |
| Total | 1,574 | 100.0% |
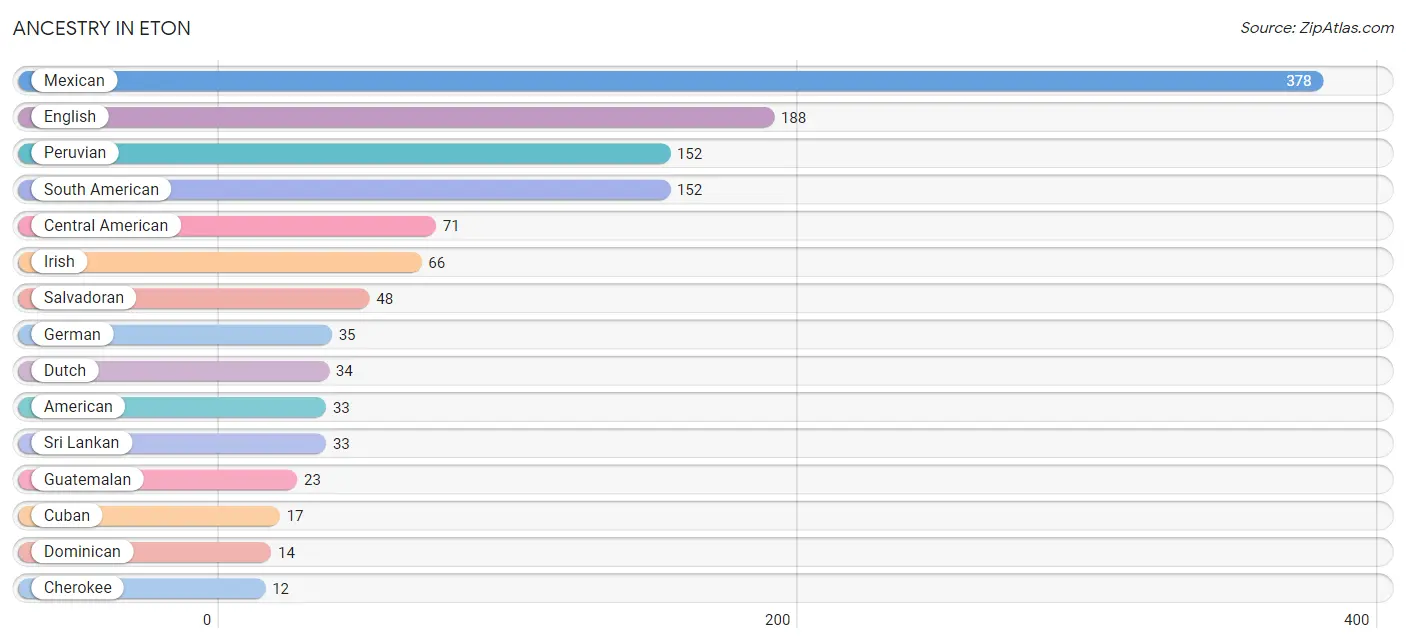
Ancestry in Eton
The most populous ancestries reported in Eton are Mexican (378 | 24.0%), English (188 | 11.9%), Peruvian (152 | 9.7%), South American (152 | 9.7%), and Central American (71 | 4.5%), together accounting for 59.8% of all Eton residents.
| Ancestry | # Population | % Population |
| American | 33 | 2.1% |
| Austrian | 5 | 0.3% |
| British | 8 | 0.5% |
| Central American | 71 | 4.5% |
| Central American Indian | 3 | 0.2% |
| Cherokee | 12 | 0.8% |
| Cuban | 17 | 1.1% |
| Dominican | 14 | 0.9% |
| Dutch | 34 | 2.2% |
| English | 188 | 11.9% |
| European | 12 | 0.8% |
| French | 7 | 0.4% |
| German | 35 | 2.2% |
| Guatemalan | 23 | 1.5% |
| Irish | 66 | 4.2% |
| Italian | 8 | 0.5% |
| Mexican | 378 | 24.0% |
| Peruvian | 152 | 9.7% |
| Polish | 8 | 0.5% |
| Puerto Rican | 11 | 0.7% |
| Salvadoran | 48 | 3.0% |
| Scotch-Irish | 4 | 0.3% |
| Scottish | 4 | 0.3% |
| Shoshone | 4 | 0.3% |
| South American | 152 | 9.7% |
| Sri Lankan | 33 | 2.1% |
| Swedish | 6 | 0.4% | View All 27 Rows |
Immigrants in Eton
The most numerous immigrant groups reported in Eton came from Latin America (394 | 25.0%), Peru (195 | 12.4%), South America (195 | 12.4%), Central America (168 | 10.7%), and Mexico (157 | 10.0%), together accounting for 70.5% of all Eton residents.
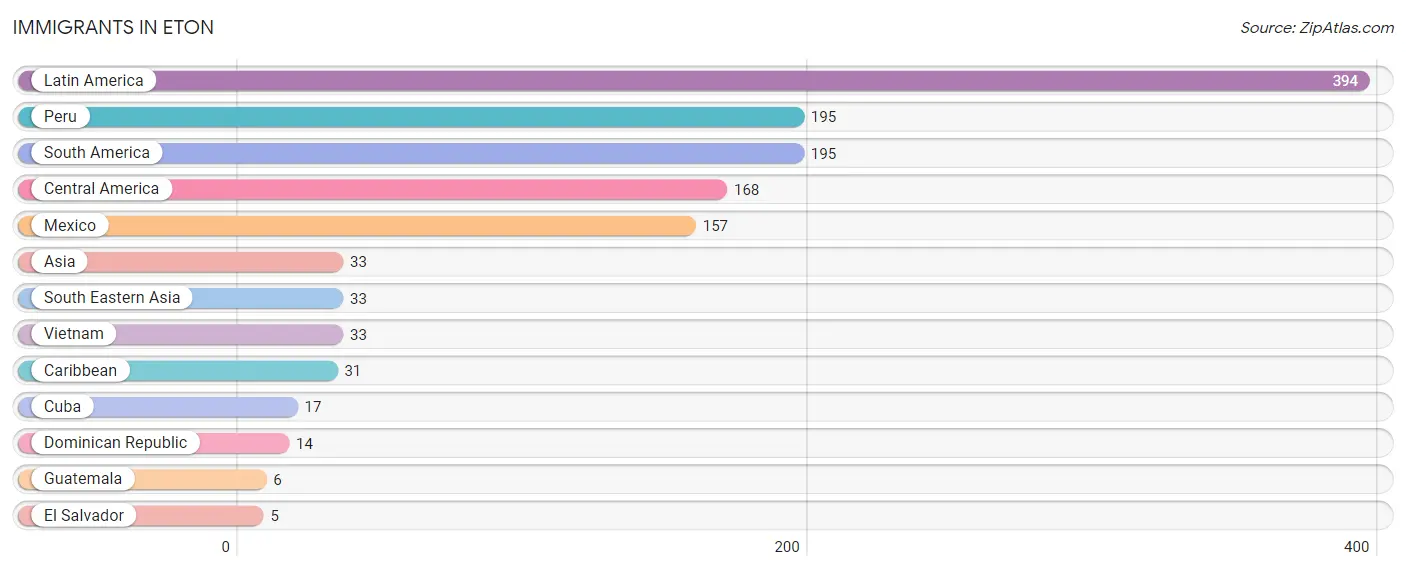
| Immigration Origin | # Population | % Population |
| Asia | 33 | 2.1% |
| Caribbean | 31 | 2.0% |
| Central America | 168 | 10.7% |
| Cuba | 17 | 1.1% |
| Dominican Republic | 14 | 0.9% |
| El Salvador | 5 | 0.3% |
| Guatemala | 6 | 0.4% |
| Latin America | 394 | 25.0% |
| Mexico | 157 | 10.0% |
| Peru | 195 | 12.4% |
| South America | 195 | 12.4% |
| South Eastern Asia | 33 | 2.1% |
| Vietnam | 33 | 2.1% | View All 13 Rows |
Sex and Age in Eton
Sex and Age in Eton
The most populous age groups in Eton are 10 to 14 Years (118 | 14.2%) for men and 60 to 64 Years (178 | 23.9%) for women.
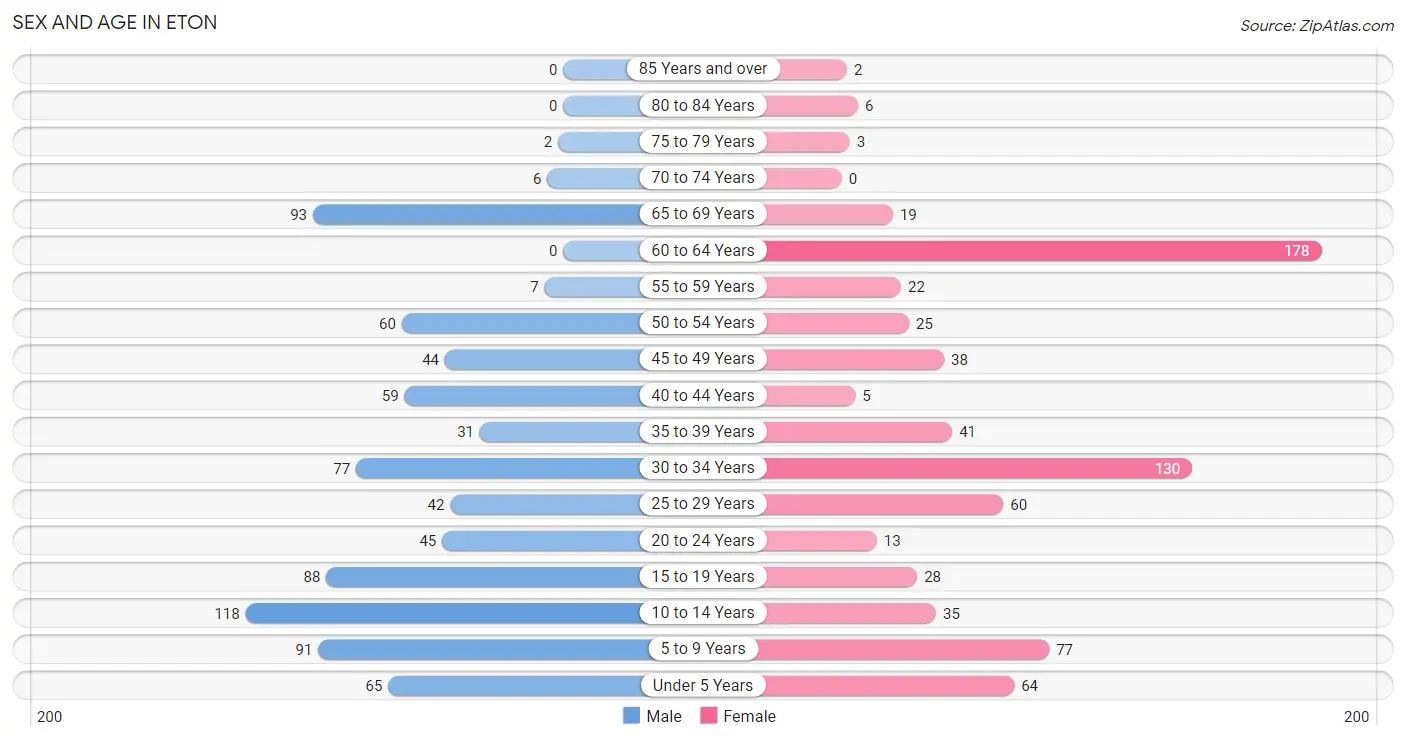
| Age Bracket | Male | Female |
| Under 5 Years | 65 (7.9%) | 64 (8.6%) |
| 5 to 9 Years | 91 (11.0%) | 77 (10.3%) |
| 10 to 14 Years | 118 (14.2%) | 35 (4.7%) |
| 15 to 19 Years | 88 (10.6%) | 28 (3.7%) |
| 20 to 24 Years | 45 (5.4%) | 13 (1.7%) |
| 25 to 29 Years | 42 (5.1%) | 60 (8.0%) |
| 30 to 34 Years | 77 (9.3%) | 130 (17.4%) |
| 35 to 39 Years | 31 (3.7%) | 41 (5.5%) |
| 40 to 44 Years | 59 (7.1%) | 5 (0.7%) |
| 45 to 49 Years | 44 (5.3%) | 38 (5.1%) |
| 50 to 54 Years | 60 (7.2%) | 25 (3.4%) |
| 55 to 59 Years | 7 (0.9%) | 22 (2.9%) |
| 60 to 64 Years | 0 (0.0%) | 178 (23.9%) |
| 65 to 69 Years | 93 (11.2%) | 19 (2.5%) |
| 70 to 74 Years | 6 (0.7%) | 0 (0.0%) |
| 75 to 79 Years | 2 (0.2%) | 3 (0.4%) |
| 80 to 84 Years | 0 (0.0%) | 6 (0.8%) |
| 85 Years and over | 0 (0.0%) | 2 (0.3%) |
| Total | 828 (100.0%) | 746 (100.0%) |
Families and Households in Eton
Median Family Size in Eton
The median family size in Eton is 3.75 persons per family, with single female/mother families (92 | 25.5%) accounting for the largest median family size of 3.95 persons per family. On the other hand, single male/father families (28 | 7.8%) represent the smallest median family size with 2.54 persons per family.
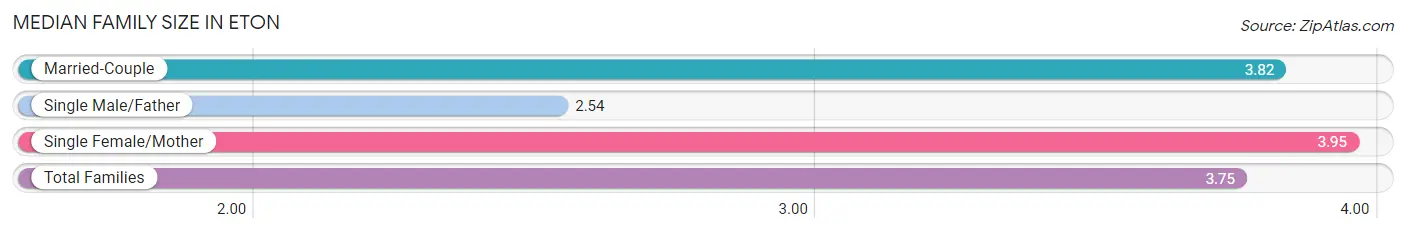
| Family Type | # Families | Family Size |
| Married-Couple | 241 (66.8%) | 3.82 |
| Single Male/Father | 28 (7.8%) | 2.54 |
| Single Female/Mother | 92 (25.5%) | 3.95 |
| Total Families | 361 (100.0%) | 3.75 |
Median Household Size in Eton
The median household size in Eton is 3.82 persons per household, with single female/mother households (92 | 22.3%) accounting for the largest median household size of 4.63 persons per household. non-family households (51 | 12.4%) represent the smallest median household size with 2.16 persons per household.
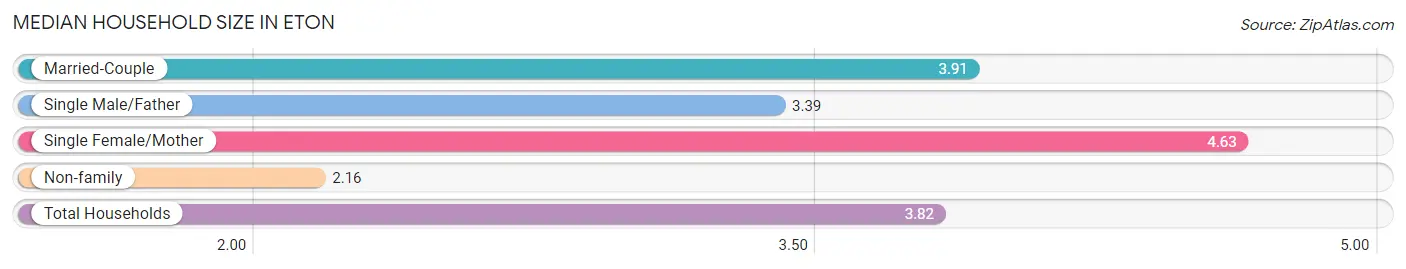
| Household Type | # Households | Household Size |
| Married-Couple | 241 (58.5%) | 3.91 |
| Single Male/Father | 28 (6.8%) | 3.39 |
| Single Female/Mother | 92 (22.3%) | 4.63 |
| Non-family | 51 (12.4%) | 2.16 |
| Total Households | 412 (100.0%) | 3.82 |
Household Size by Marriage Status in Eton
Out of a total of 412 households in Eton, 361 (87.6%) are family households, while 51 (12.4%) are nonfamily households. The most numerous type of family households are 4-person households, comprising 161, and the most common type of nonfamily households are 2-person households, comprising 33.
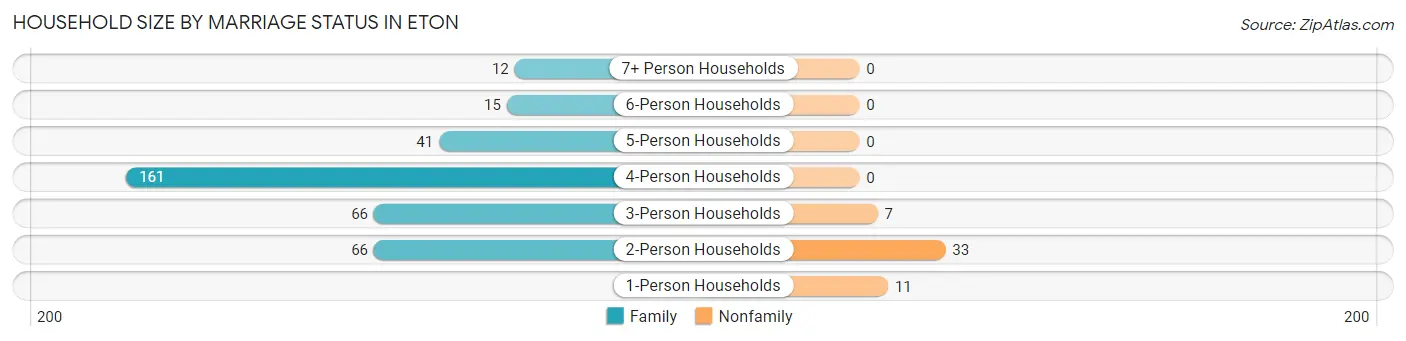
| Household Size | Family Households | Nonfamily Households |
| 1-Person Households | - | 11 (2.7%) |
| 2-Person Households | 66 (16.0%) | 33 (8.0%) |
| 3-Person Households | 66 (16.0%) | 7 (1.7%) |
| 4-Person Households | 161 (39.1%) | 0 (0.0%) |
| 5-Person Households | 41 (10.0%) | 0 (0.0%) |
| 6-Person Households | 15 (3.6%) | 0 (0.0%) |
| 7+ Person Households | 12 (2.9%) | 0 (0.0%) |
| Total | 361 (87.6%) | 51 (12.4%) |
Female Fertility in Eton
Fertility by Age in Eton
Average fertility rate in Eton is 122.0 births per 1,000 women. Women in the age bracket of 20 to 34 years have the highest fertility rate with 192.0 births per 1,000 women. Women in the age bracket of 20 to 34 years acount for 100.0% of all women with births.
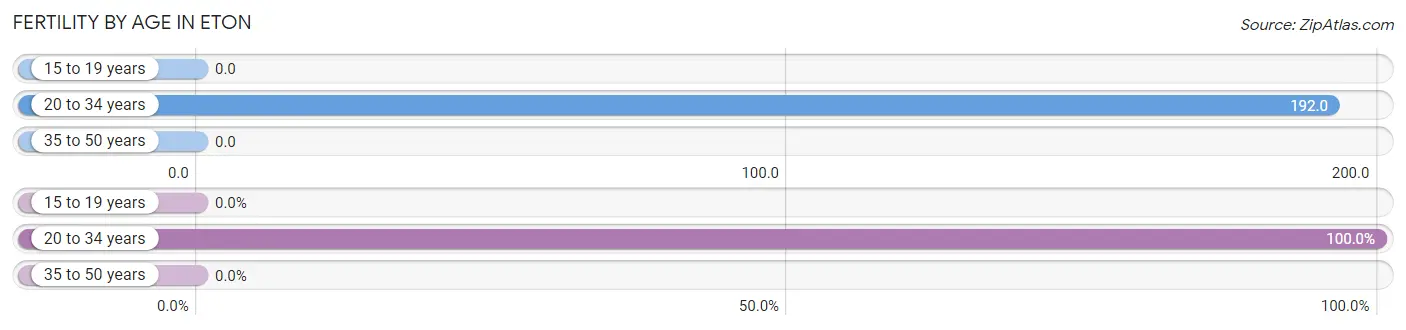
| Age Bracket | Women with Births | Births / 1,000 Women |
| 15 to 19 years | 0 (0.0%) | 0.0 |
| 20 to 34 years | 39 (100.0%) | 192.0 |
| 35 to 50 years | 0 (0.0%) | 0.0 |
| Total | 39 (100.0%) | 122.0 |
Fertility by Age by Marriage Status in Eton
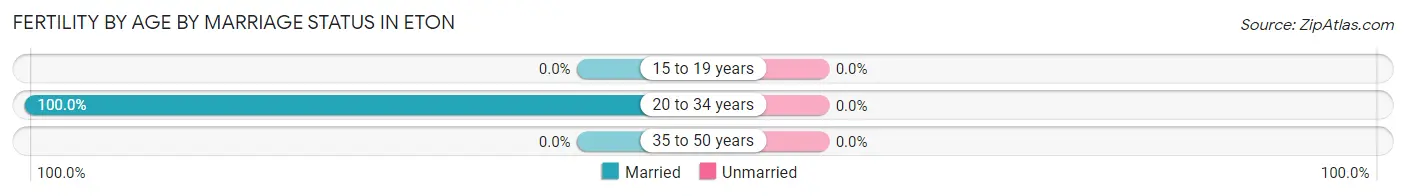
| Age Bracket | Married | Unmarried |
| 15 to 19 years | 0 (0.0%) | 0 (0.0%) |
| 20 to 34 years | 39 (100.0%) | 0 (0.0%) |
| 35 to 50 years | 0 (0.0%) | 0 (0.0%) |
| Total | 39 (100.0%) | 0 (0.0%) |
Fertility by Education in Eton
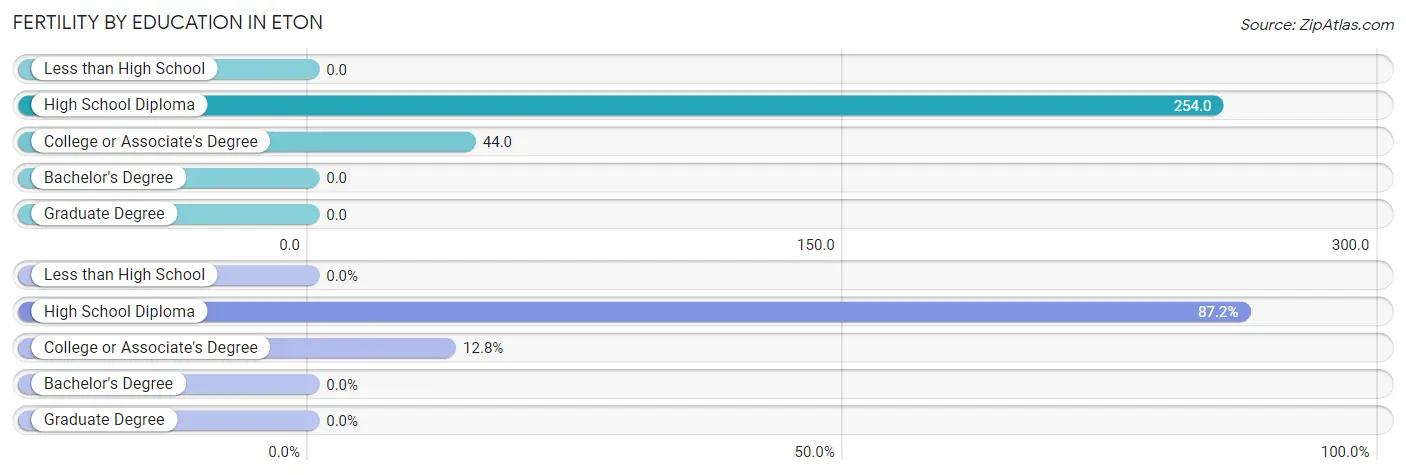
| Educational Attainment | Women with Births | Births / 1,000 Women |
| Less than High School | 0 (0.0%) | 0.0 |
| High School Diploma | 34 (87.2%) | 254.0 |
| College or Associate's Degree | 5 (12.8%) | 44.0 |
| Bachelor's Degree | 0 (0.0%) | 0.0 |
| Graduate Degree | 0 (0.0%) | 0.0 |
| Total | 39 (100.0%) | 122.0 |
Fertility by Education by Marriage Status in Eton
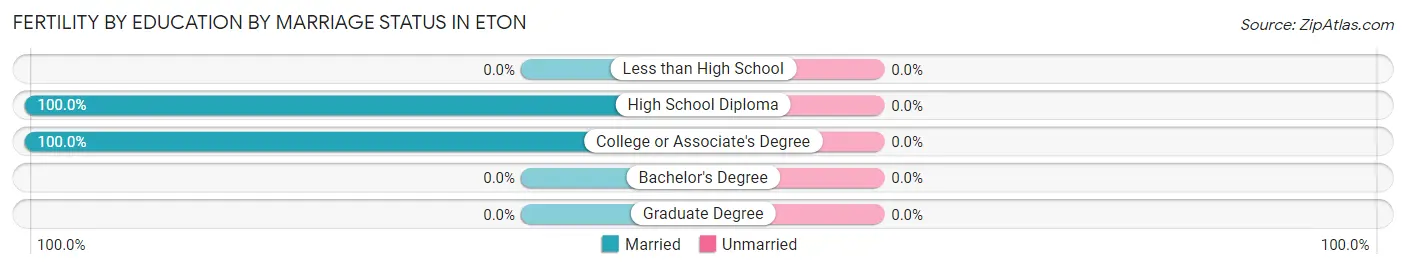
| Educational Attainment | Married | Unmarried |
| Less than High School | 0 (0.0%) | 0 (0.0%) |
| High School Diploma | 34 (100.0%) | 0 (0.0%) |
| College or Associate's Degree | 5 (100.0%) | 0 (0.0%) |
| Bachelor's Degree | 0 (0.0%) | 0 (0.0%) |
| Graduate Degree | 0 (0.0%) | 0 (0.0%) |
| Total | 39 (100.0%) | 0 (0.0%) |
Employment Characteristics in Eton
Employment by Class of Employer in Eton
Among the 679 employed individuals in Eton, private company employees (538 | 79.2%), local government employees (74 | 10.9%), and federal government employees (35 | 5.1%) make up the most common classes of employment.
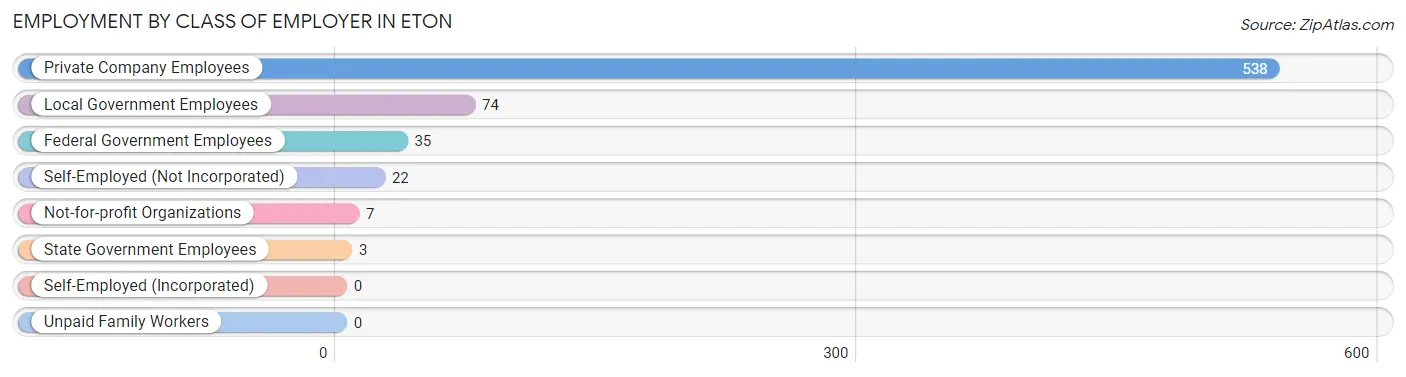
| Employer Class | # Employees | % Employees |
| Private Company Employees | 538 | 79.2% |
| Self-Employed (Incorporated) | 0 | 0.0% |
| Self-Employed (Not Incorporated) | 22 | 3.2% |
| Not-for-profit Organizations | 7 | 1.0% |
| Local Government Employees | 74 | 10.9% |
| State Government Employees | 3 | 0.4% |
| Federal Government Employees | 35 | 5.1% |
| Unpaid Family Workers | 0 | 0.0% |
| Total | 679 | 100.0% |
Employment Status by Age in Eton
According to the labor force statistics for Eton, out of the total population over 16 years of age (1,068), 66.5% or 710 individuals are in the labor force, with 2.7% or 19 of them unemployed. The age group with the highest labor force participation rate is 35 to 44 years, with 94.9% or 129 individuals in the labor force. Within the labor force, the 25 to 29 years age range has the highest percentage of unemployed individuals, with 17.0% or 16 of them being unemployed.
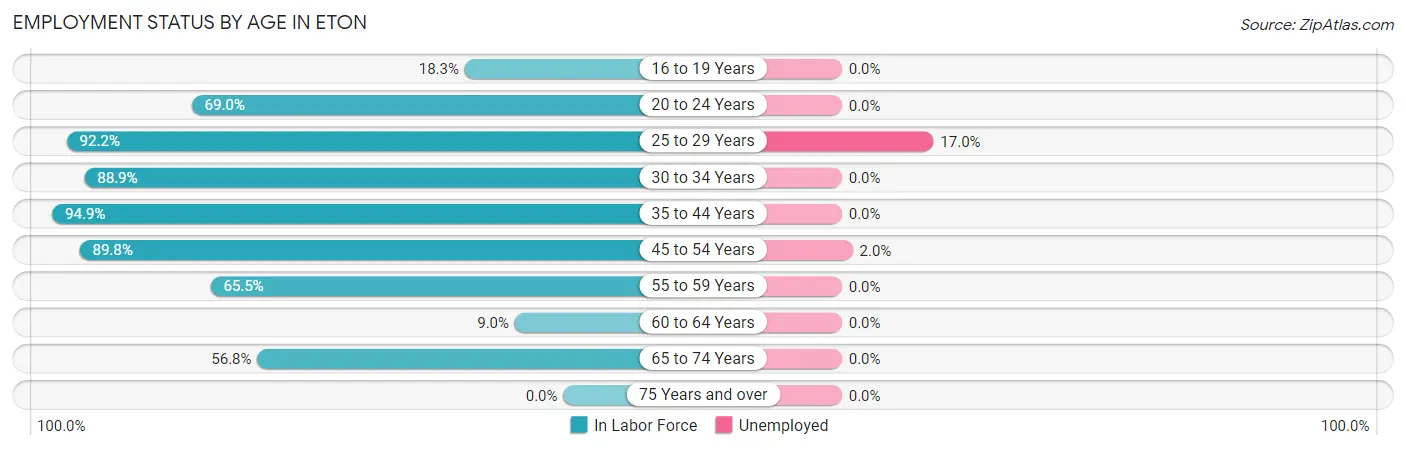
| Age Bracket | In Labor Force | Unemployed |
| 16 to 19 Years | 11 (18.3%) | 0 (0.0%) |
| 20 to 24 Years | 40 (69.0%) | 0 (0.0%) |
| 25 to 29 Years | 94 (92.2%) | 16 (17.0%) |
| 30 to 34 Years | 184 (88.9%) | 0 (0.0%) |
| 35 to 44 Years | 129 (94.9%) | 0 (0.0%) |
| 45 to 54 Years | 150 (89.8%) | 3 (2.0%) |
| 55 to 59 Years | 19 (65.5%) | 0 (0.0%) |
| 60 to 64 Years | 16 (9.0%) | 0 (0.0%) |
| 65 to 74 Years | 67 (56.8%) | 0 (0.0%) |
| 75 Years and over | 0 (0.0%) | 0 (0.0%) |
| Total | 710 (66.5%) | 19 (2.7%) |
Employment Status by Educational Attainment in Eton
According to labor force statistics for Eton, 72.3% of individuals (592) out of the total population between 25 and 64 years of age (819) are in the labor force, with 3.2% or 19 of them being unemployed. The group with the highest labor force participation rate are those with the educational attainment of bachelor's degree or higher, with 94.6% or 88 individuals in the labor force. Within the labor force, individuals with high school diploma education have the highest percentage of unemployment, with 5.0% or 14 of them being unemployed.
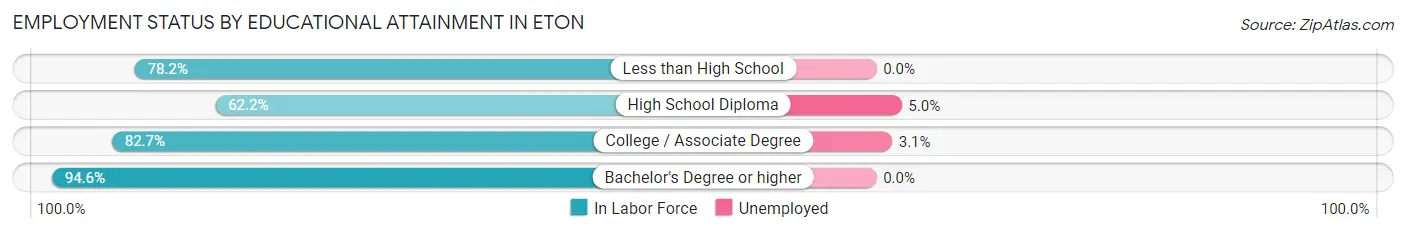
| Educational Attainment | In Labor Force | Unemployed |
| Less than High School | 61 (78.2%) | 0 (0.0%) |
| High School Diploma | 281 (62.2%) | 23 (5.0%) |
| College / Associate Degree | 162 (82.7%) | 6 (3.1%) |
| Bachelor's Degree or higher | 88 (94.6%) | 0 (0.0%) |
| Total | 592 (72.3%) | 26 (3.2%) |
Employment Occupations by Sex in Eton
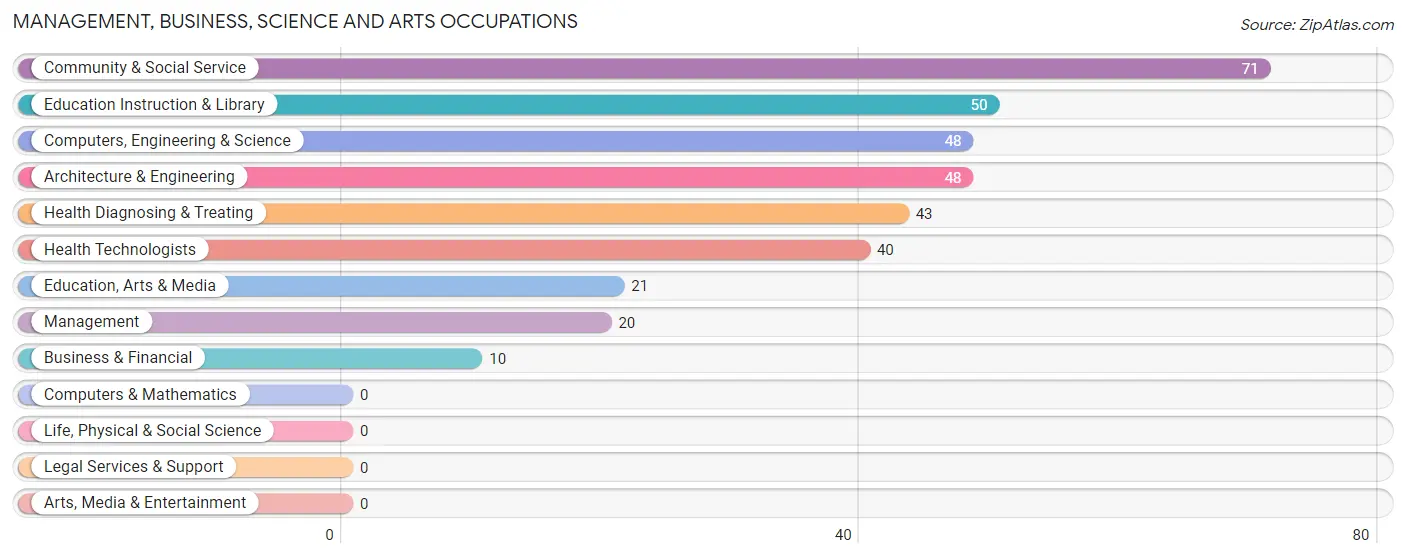
Management, Business, Science and Arts Occupations
The most common Management, Business, Science and Arts occupations in Eton are Community & Social Service (71 | 10.3%), Education Instruction & Library (50 | 7.2%), Computers, Engineering & Science (48 | 7.0%), Architecture & Engineering (48 | 7.0%), and Health Diagnosing & Treating (43 | 6.2%).
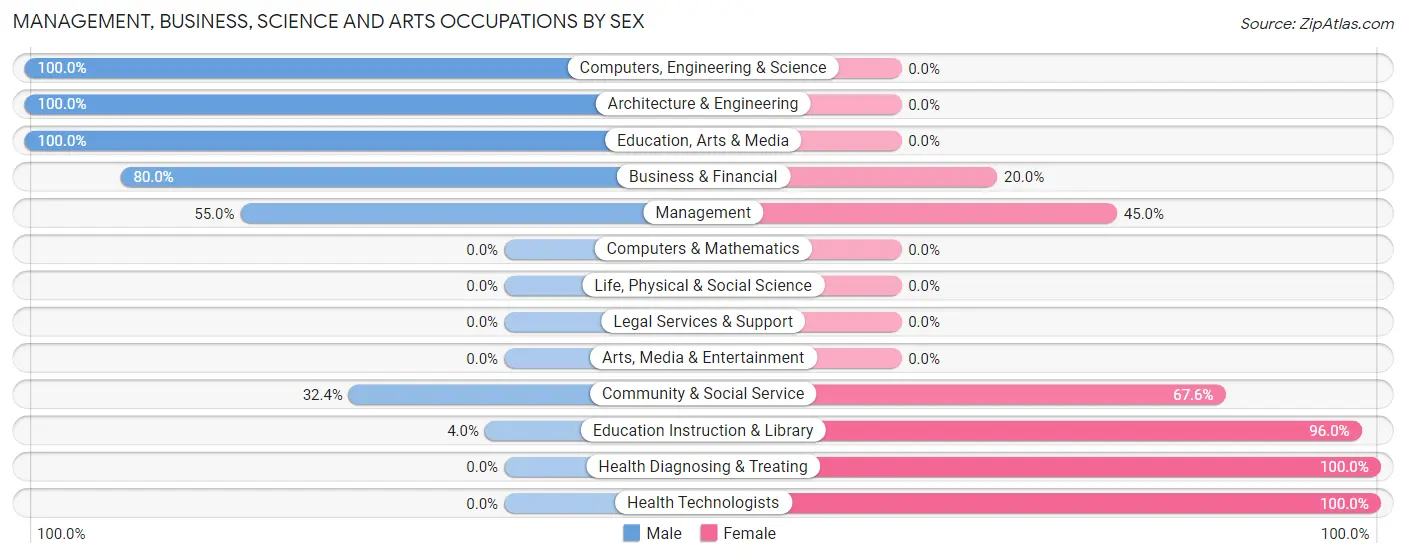
Management, Business, Science and Arts Occupations by Sex
Within the Management, Business, Science and Arts occupations in Eton, the most male-oriented occupations are Computers, Engineering & Science (100.0%), Architecture & Engineering (100.0%), and Education, Arts & Media (100.0%), while the most female-oriented occupations are Health Diagnosing & Treating (100.0%), Health Technologists (100.0%), and Education Instruction & Library (96.0%).
| Occupation | Male | Female |
| Management | 11 (55.0%) | 9 (45.0%) |
| Business & Financial | 8 (80.0%) | 2 (20.0%) |
| Computers, Engineering & Science | 48 (100.0%) | 0 (0.0%) |
| Computers & Mathematics | 0 (0.0%) | 0 (0.0%) |
| Architecture & Engineering | 48 (100.0%) | 0 (0.0%) |
| Life, Physical & Social Science | 0 (0.0%) | 0 (0.0%) |
| Community & Social Service | 23 (32.4%) | 48 (67.6%) |
| Education, Arts & Media | 21 (100.0%) | 0 (0.0%) |
| Legal Services & Support | 0 (0.0%) | 0 (0.0%) |
| Education Instruction & Library | 2 (4.0%) | 48 (96.0%) |
| Arts, Media & Entertainment | 0 (0.0%) | 0 (0.0%) |
| Health Diagnosing & Treating | 0 (0.0%) | 43 (100.0%) |
| Health Technologists | 0 (0.0%) | 40 (100.0%) |
| Total (Category) | 90 (46.9%) | 102 (53.1%) |
| Total (Overall) | 411 (59.5%) | 280 (40.5%) |
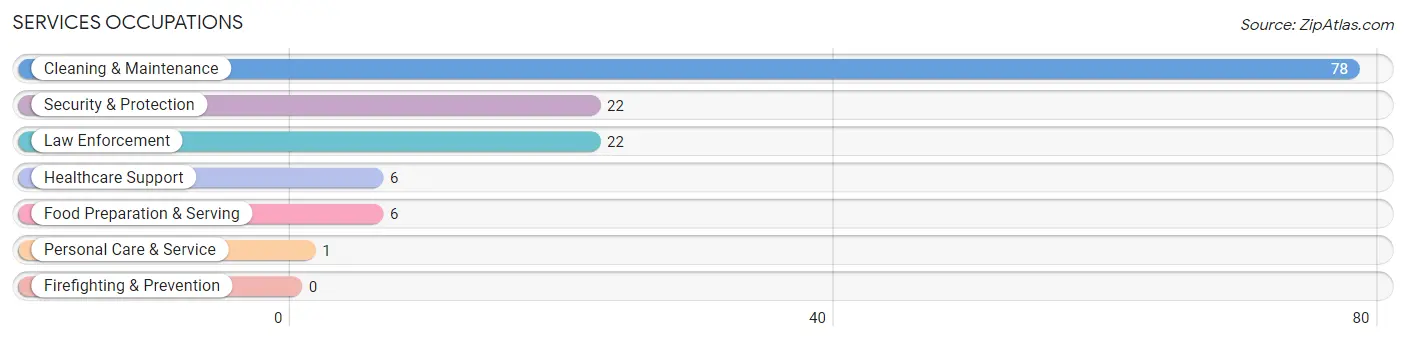
Services Occupations
The most common Services occupations in Eton are Cleaning & Maintenance (78 | 11.3%), Security & Protection (22 | 3.2%), Law Enforcement (22 | 3.2%), Healthcare Support (6 | 0.9%), and Food Preparation & Serving (6 | 0.9%).
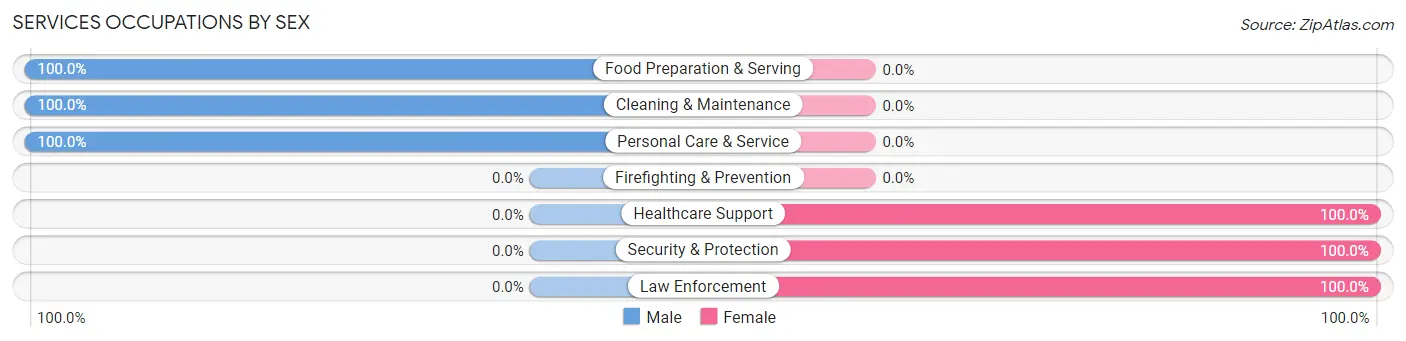
Services Occupations by Sex
Within the Services occupations in Eton, the most male-oriented occupations are Food Preparation & Serving (100.0%), Cleaning & Maintenance (100.0%), and Personal Care & Service (100.0%), while the most female-oriented occupations are Healthcare Support (100.0%), Security & Protection (100.0%), and Law Enforcement (100.0%).
| Occupation | Male | Female |
| Healthcare Support | 0 (0.0%) | 6 (100.0%) |
| Security & Protection | 0 (0.0%) | 22 (100.0%) |
| Firefighting & Prevention | 0 (0.0%) | 0 (0.0%) |
| Law Enforcement | 0 (0.0%) | 22 (100.0%) |
| Food Preparation & Serving | 6 (100.0%) | 0 (0.0%) |
| Cleaning & Maintenance | 78 (100.0%) | 0 (0.0%) |
| Personal Care & Service | 1 (100.0%) | 0 (0.0%) |
| Total (Category) | 85 (75.2%) | 28 (24.8%) |
| Total (Overall) | 411 (59.5%) | 280 (40.5%) |
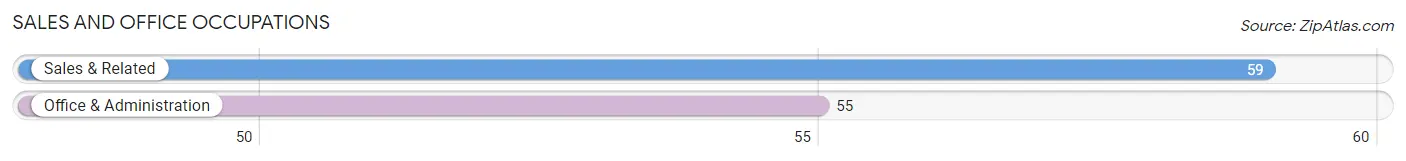
Sales and Office Occupations
The most common Sales and Office occupations in Eton are Sales & Related (59 | 8.5%), and Office & Administration (55 | 8.0%).
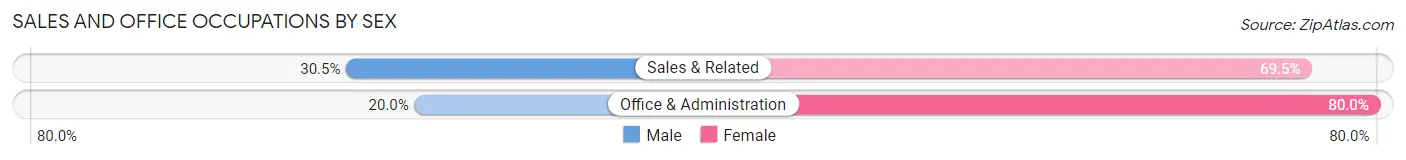
Sales and Office Occupations by Sex
| Occupation | Male | Female |
| Sales & Related | 18 (30.5%) | 41 (69.5%) |
| Office & Administration | 11 (20.0%) | 44 (80.0%) |
| Total (Category) | 29 (25.4%) | 85 (74.6%) |
| Total (Overall) | 411 (59.5%) | 280 (40.5%) |
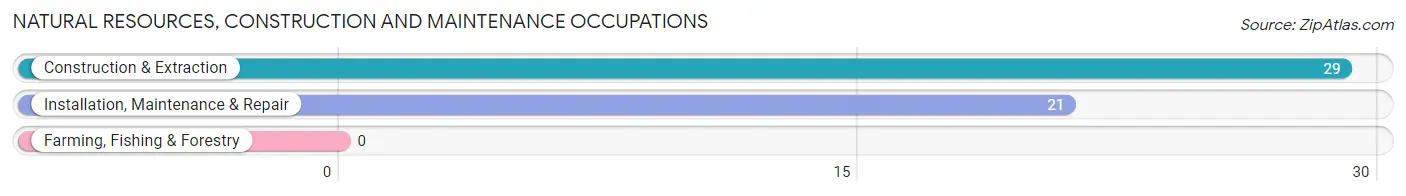
Natural Resources, Construction and Maintenance Occupations
The most common Natural Resources, Construction and Maintenance occupations in Eton are Construction & Extraction (29 | 4.2%), and Installation, Maintenance & Repair (21 | 3.0%).
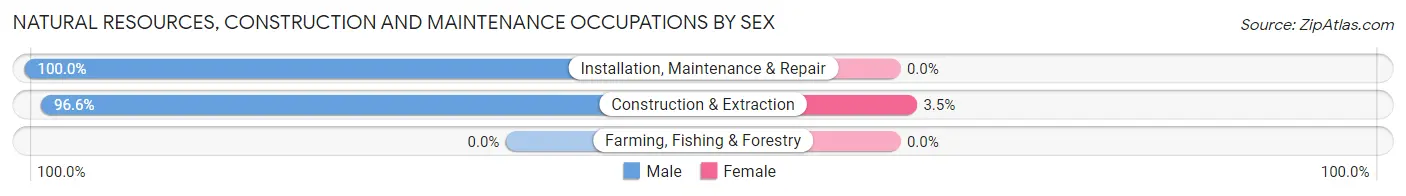
Natural Resources, Construction and Maintenance Occupations by Sex
| Occupation | Male | Female |
| Farming, Fishing & Forestry | 0 (0.0%) | 0 (0.0%) |
| Construction & Extraction | 28 (96.6%) | 1 (3.5%) |
| Installation, Maintenance & Repair | 21 (100.0%) | 0 (0.0%) |
| Total (Category) | 49 (98.0%) | 1 (2.0%) |
| Total (Overall) | 411 (59.5%) | 280 (40.5%) |
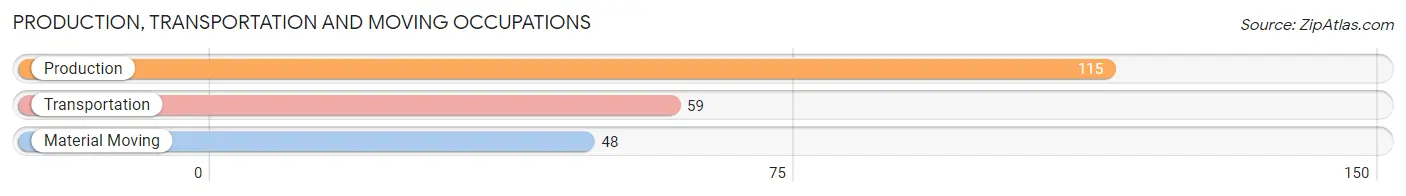
Production, Transportation and Moving Occupations
The most common Production, Transportation and Moving occupations in Eton are Production (115 | 16.6%), Transportation (59 | 8.5%), and Material Moving (48 | 7.0%).
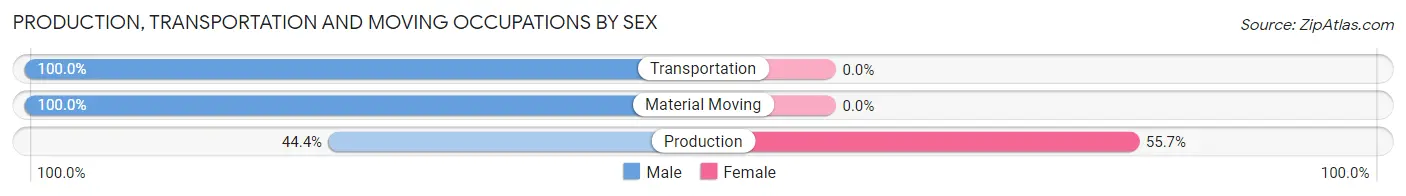
Production, Transportation and Moving Occupations by Sex
| Occupation | Male | Female |
| Production | 51 (44.4%) | 64 (55.6%) |
| Transportation | 59 (100.0%) | 0 (0.0%) |
| Material Moving | 48 (100.0%) | 0 (0.0%) |
| Total (Category) | 158 (71.2%) | 64 (28.8%) |
| Total (Overall) | 411 (59.5%) | 280 (40.5%) |
Employment Industries by Sex in Eton
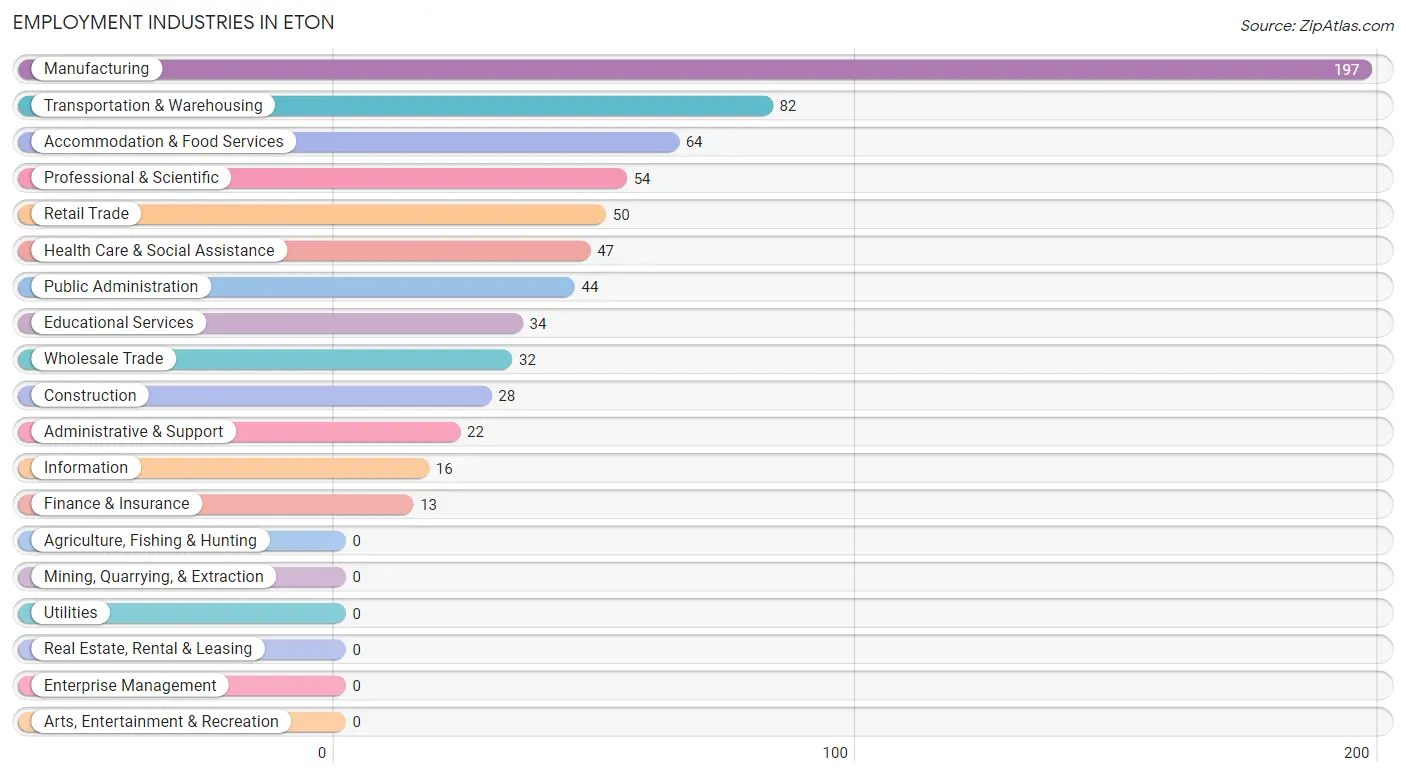
Employment Industries in Eton
The major employment industries in Eton include Manufacturing (197 | 28.5%), Transportation & Warehousing (82 | 11.9%), Accommodation & Food Services (64 | 9.3%), Professional & Scientific (54 | 7.8%), and Retail Trade (50 | 7.2%).
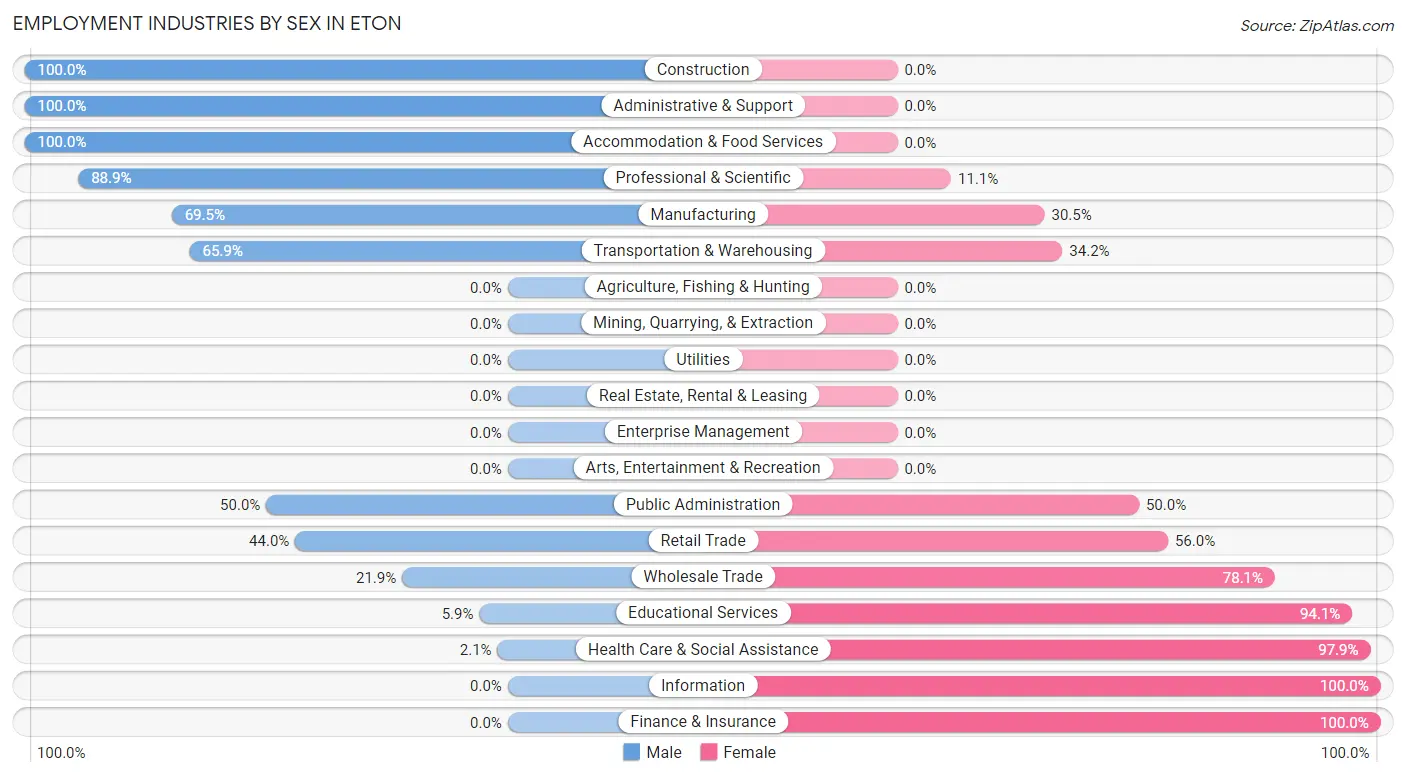
Employment Industries by Sex in Eton
The Eton industries that see more men than women are Construction (100.0%), Administrative & Support (100.0%), and Accommodation & Food Services (100.0%), whereas the industries that tend to have a higher number of women are Information (100.0%), Finance & Insurance (100.0%), and Health Care & Social Assistance (97.9%).
| Industry | Male | Female |
| Agriculture, Fishing & Hunting | 0 (0.0%) | 0 (0.0%) |
| Mining, Quarrying, & Extraction | 0 (0.0%) | 0 (0.0%) |
| Construction | 28 (100.0%) | 0 (0.0%) |
| Manufacturing | 137 (69.5%) | 60 (30.5%) |
| Wholesale Trade | 7 (21.9%) | 25 (78.1%) |
| Retail Trade | 22 (44.0%) | 28 (56.0%) |
| Transportation & Warehousing | 54 (65.8%) | 28 (34.2%) |
| Utilities | 0 (0.0%) | 0 (0.0%) |
| Information | 0 (0.0%) | 16 (100.0%) |
| Finance & Insurance | 0 (0.0%) | 13 (100.0%) |
| Real Estate, Rental & Leasing | 0 (0.0%) | 0 (0.0%) |
| Professional & Scientific | 48 (88.9%) | 6 (11.1%) |
| Enterprise Management | 0 (0.0%) | 0 (0.0%) |
| Administrative & Support | 22 (100.0%) | 0 (0.0%) |
| Educational Services | 2 (5.9%) | 32 (94.1%) |
| Health Care & Social Assistance | 1 (2.1%) | 46 (97.9%) |
| Arts, Entertainment & Recreation | 0 (0.0%) | 0 (0.0%) |
| Accommodation & Food Services | 64 (100.0%) | 0 (0.0%) |
| Public Administration | 22 (50.0%) | 22 (50.0%) |
| Total | 411 (59.5%) | 280 (40.5%) |
Education in Eton
School Enrollment in Eton
The most common levels of schooling among the 475 students in Eton are middle school (123 | 25.9%), elementary school (92 | 19.4%), and high school (88 | 18.5%).
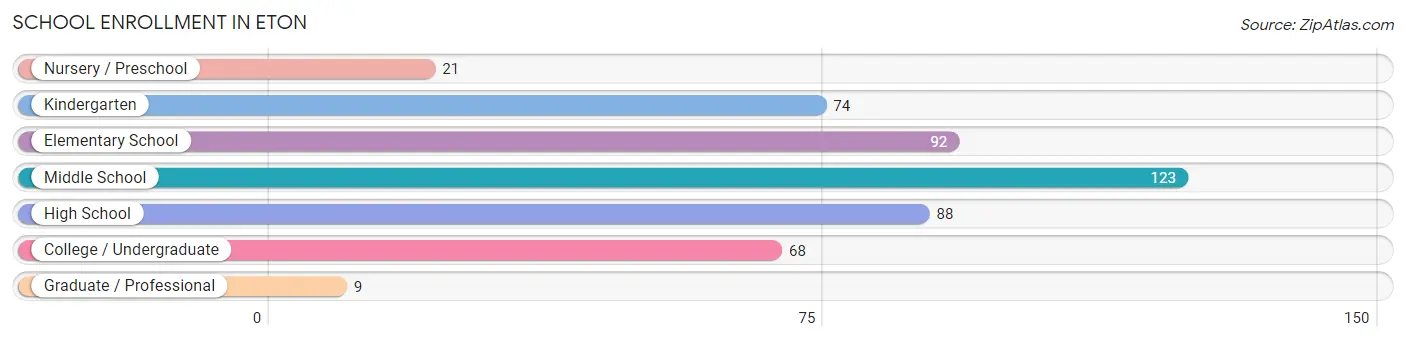
| School Level | # Students | % Students |
| Nursery / Preschool | 21 | 4.4% |
| Kindergarten | 74 | 15.6% |
| Elementary School | 92 | 19.4% |
| Middle School | 123 | 25.9% |
| High School | 88 | 18.5% |
| College / Undergraduate | 68 | 14.3% |
| Graduate / Professional | 9 | 1.9% |
| Total | 475 | 100.0% |
School Enrollment by Age by Funding Source in Eton
Out of a total of 475 students who are enrolled in schools in Eton, 32 (6.7%) attend a private institution, while the remaining 443 (93.3%) are enrolled in public schools. The age group of 25 to 34 year olds has the highest likelihood of being enrolled in private schools, with 6 (33.3% in the age bracket) enrolled. Conversely, the age group of 3 to 4 year olds has the lowest likelihood of being enrolled in a private school, with 17 (100.0% in the age bracket) attending a public institution.
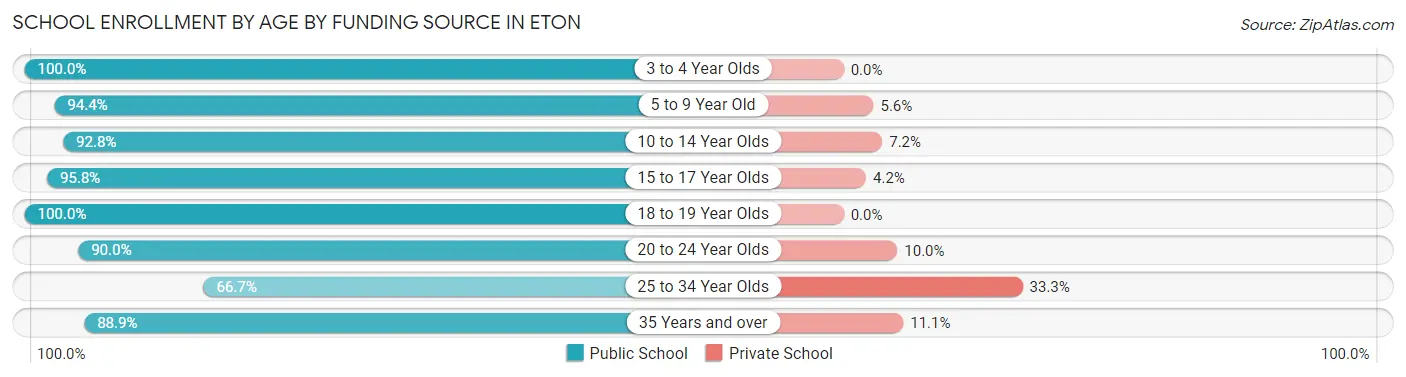
| Age Bracket | Public School | Private School |
| 3 to 4 Year Olds | 17 (100.0%) | 0 (0.0%) |
| 5 to 9 Year Old | 153 (94.4%) | 9 (5.6%) |
| 10 to 14 Year Olds | 142 (92.8%) | 11 (7.2%) |
| 15 to 17 Year Olds | 46 (95.8%) | 2 (4.2%) |
| 18 to 19 Year Olds | 40 (100.0%) | 0 (0.0%) |
| 20 to 24 Year Olds | 9 (90.0%) | 1 (10.0%) |
| 25 to 34 Year Olds | 12 (66.7%) | 6 (33.3%) |
| 35 Years and over | 24 (88.9%) | 3 (11.1%) |
| Total | 443 (93.3%) | 32 (6.7%) |
Educational Attainment by Field of Study in Eton
Business (32 | 32.7%), education (29 | 29.6%), visual & performing arts (16 | 16.3%), science & technology (15 | 15.3%), and liberal arts & history (4 | 4.1%) are the most common fields of study among 98 individuals in Eton who have obtained a bachelor's degree or higher.
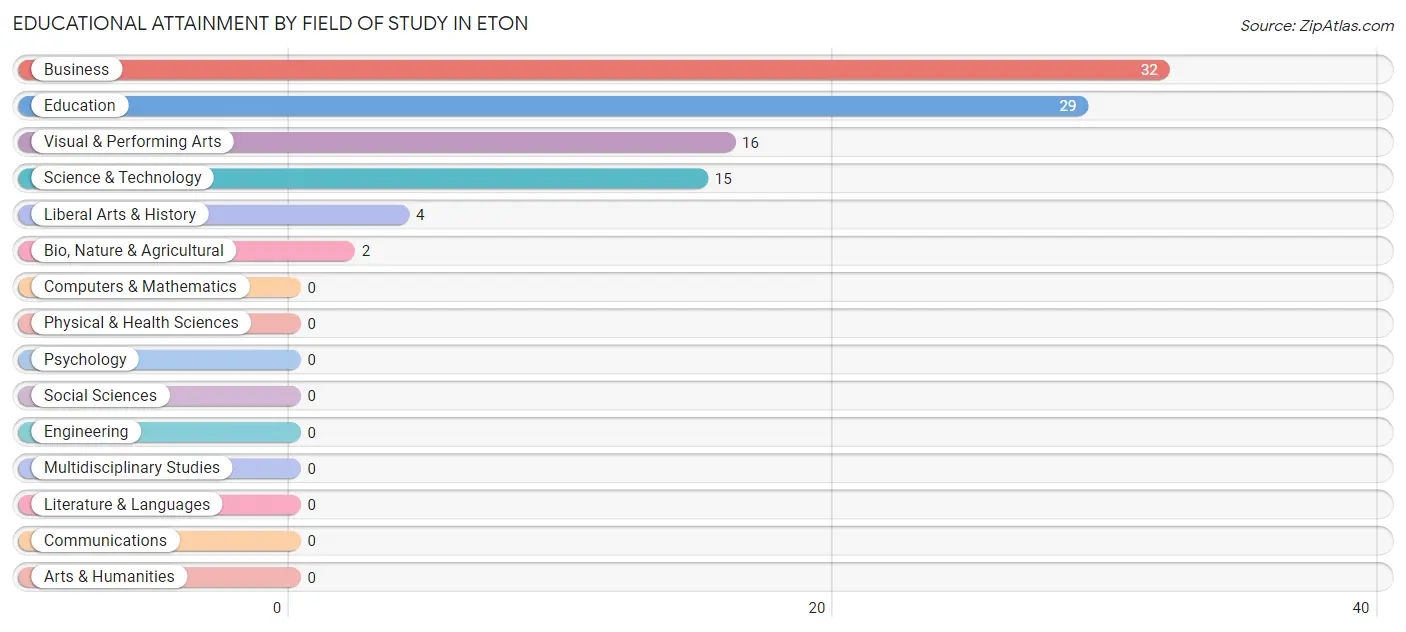
| Field of Study | # Graduates | % Graduates |
| Computers & Mathematics | 0 | 0.0% |
| Bio, Nature & Agricultural | 2 | 2.0% |
| Physical & Health Sciences | 0 | 0.0% |
| Psychology | 0 | 0.0% |
| Social Sciences | 0 | 0.0% |
| Engineering | 0 | 0.0% |
| Multidisciplinary Studies | 0 | 0.0% |
| Science & Technology | 15 | 15.3% |
| Business | 32 | 32.7% |
| Education | 29 | 29.6% |
| Literature & Languages | 0 | 0.0% |
| Liberal Arts & History | 4 | 4.1% |
| Visual & Performing Arts | 16 | 16.3% |
| Communications | 0 | 0.0% |
| Arts & Humanities | 0 | 0.0% |
| Total | 98 | 100.0% |
Transportation & Commute in Eton
Vehicle Availability by Sex in Eton
The most prevalent vehicle ownership categories in Eton are males with 2 vehicles (209, accounting for 50.8%) and females with 2 vehicles (152, making up 78.0%).
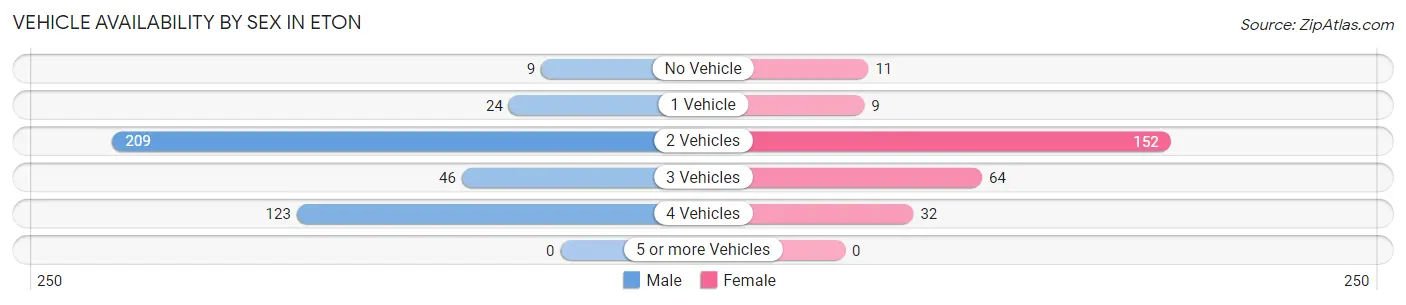
| Vehicles Available | Male | Female |
| No Vehicle | 9 (2.2%) | 11 (4.1%) |
| 1 Vehicle | 24 (5.8%) | 9 (3.4%) |
| 2 Vehicles | 209 (50.8%) | 152 (56.7%) |
| 3 Vehicles | 46 (11.2%) | 64 (23.9%) |
| 4 Vehicles | 123 (29.9%) | 32 (11.9%) |
| 5 or more Vehicles | 0 (0.0%) | 0 (0.0%) |
| Total | 411 (100.0%) | 268 (100.0%) |
Commute Time in Eton
The most frequently occuring commute durations in Eton are 30 to 34 minutes (161 commuters, 26.2%), 20 to 24 minutes (109 commuters, 17.7%), and 10 to 14 minutes (93 commuters, 15.1%).
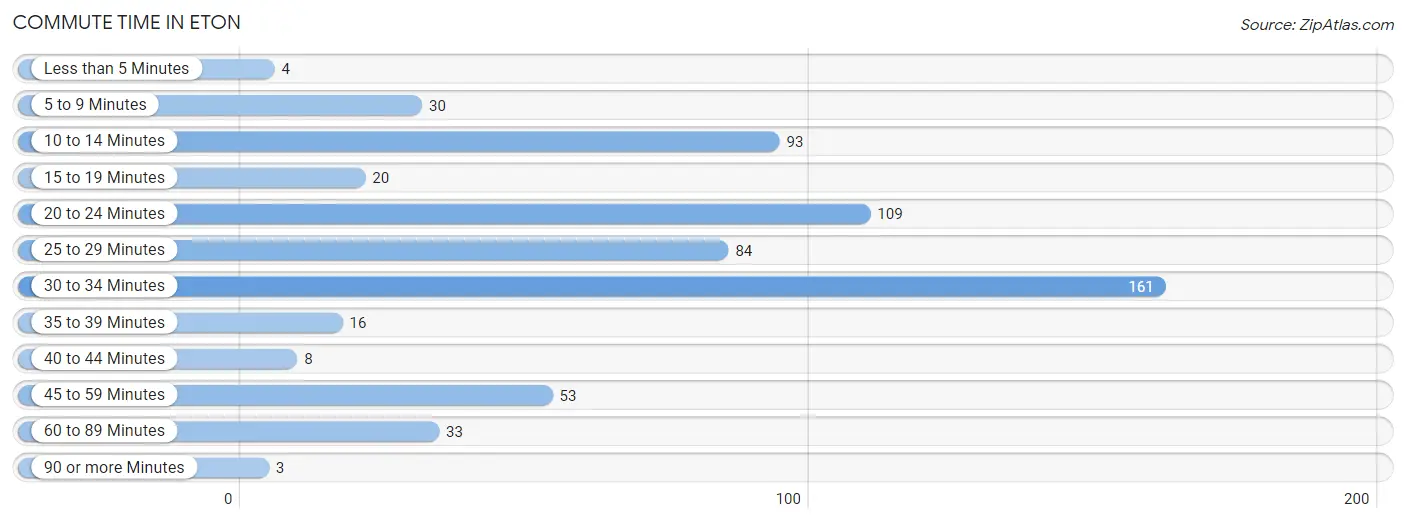
| Commute Time | # Commuters | % Commuters |
| Less than 5 Minutes | 4 | 0.6% |
| 5 to 9 Minutes | 30 | 4.9% |
| 10 to 14 Minutes | 93 | 15.1% |
| 15 to 19 Minutes | 20 | 3.3% |
| 20 to 24 Minutes | 109 | 17.7% |
| 25 to 29 Minutes | 84 | 13.7% |
| 30 to 34 Minutes | 161 | 26.2% |
| 35 to 39 Minutes | 16 | 2.6% |
| 40 to 44 Minutes | 8 | 1.3% |
| 45 to 59 Minutes | 53 | 8.6% |
| 60 to 89 Minutes | 33 | 5.4% |
| 90 or more Minutes | 3 | 0.5% |
Commute Time by Sex in Eton
The most common commute times in Eton are 30 to 34 minutes (131 commuters, 33.7%) for males and 25 to 29 minutes (68 commuters, 30.2%) for females.
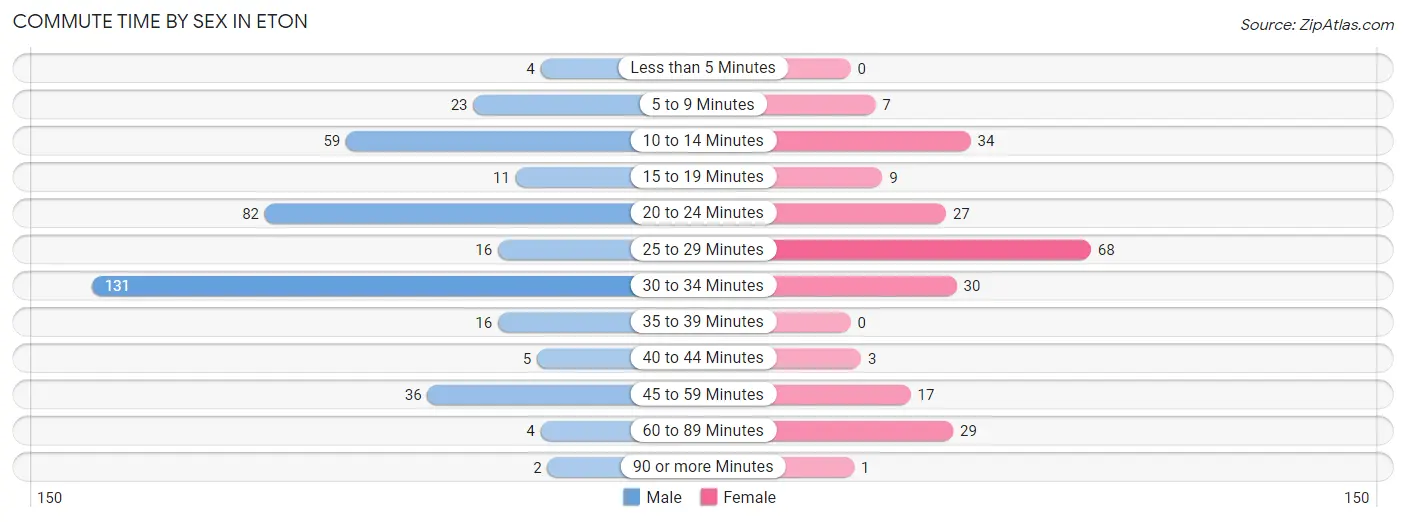
| Commute Time | Male | Female |
| Less than 5 Minutes | 4 (1.0%) | 0 (0.0%) |
| 5 to 9 Minutes | 23 (5.9%) | 7 (3.1%) |
| 10 to 14 Minutes | 59 (15.2%) | 34 (15.1%) |
| 15 to 19 Minutes | 11 (2.8%) | 9 (4.0%) |
| 20 to 24 Minutes | 82 (21.1%) | 27 (12.0%) |
| 25 to 29 Minutes | 16 (4.1%) | 68 (30.2%) |
| 30 to 34 Minutes | 131 (33.7%) | 30 (13.3%) |
| 35 to 39 Minutes | 16 (4.1%) | 0 (0.0%) |
| 40 to 44 Minutes | 5 (1.3%) | 3 (1.3%) |
| 45 to 59 Minutes | 36 (9.2%) | 17 (7.6%) |
| 60 to 89 Minutes | 4 (1.0%) | 29 (12.9%) |
| 90 or more Minutes | 2 (0.5%) | 1 (0.4%) |
Time of Departure to Work by Sex in Eton
The most frequent times of departure to work in Eton are 8:00 AM to 8:29 AM (105, 27.0%) for males and 6:00 AM to 6:29 AM (52, 23.1%) for females.
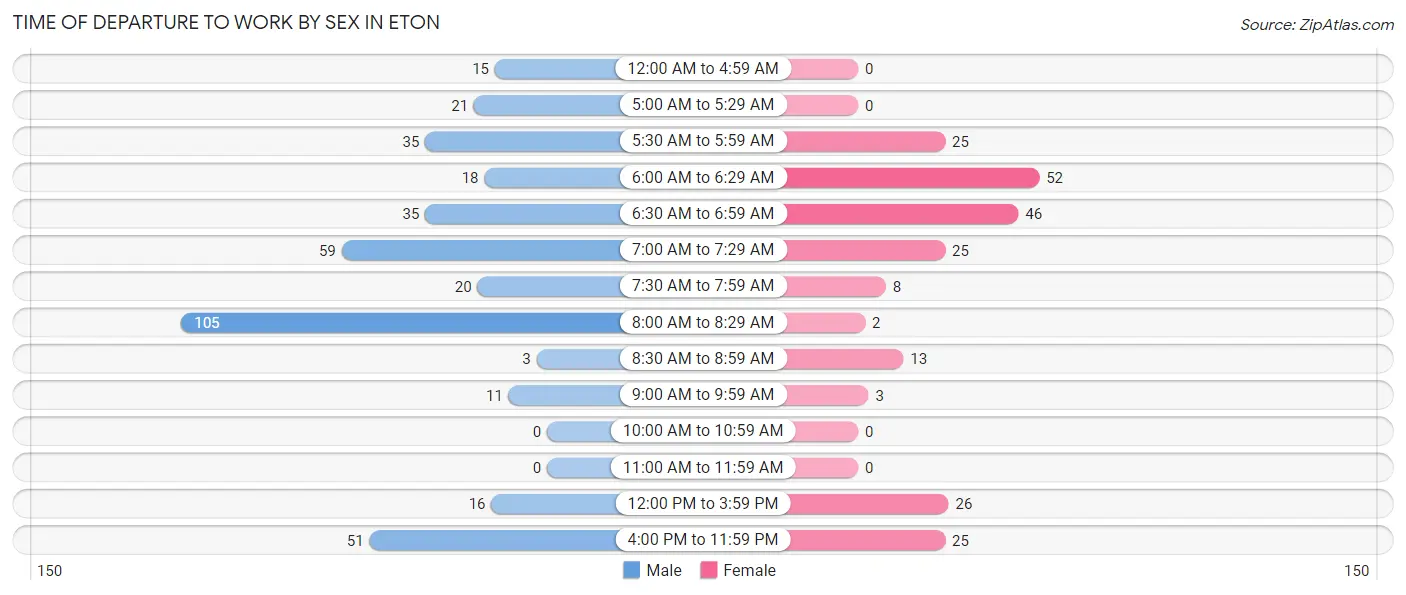
| Time of Departure | Male | Female |
| 12:00 AM to 4:59 AM | 15 (3.9%) | 0 (0.0%) |
| 5:00 AM to 5:29 AM | 21 (5.4%) | 0 (0.0%) |
| 5:30 AM to 5:59 AM | 35 (9.0%) | 25 (11.1%) |
| 6:00 AM to 6:29 AM | 18 (4.6%) | 52 (23.1%) |
| 6:30 AM to 6:59 AM | 35 (9.0%) | 46 (20.4%) |
| 7:00 AM to 7:29 AM | 59 (15.2%) | 25 (11.1%) |
| 7:30 AM to 7:59 AM | 20 (5.1%) | 8 (3.6%) |
| 8:00 AM to 8:29 AM | 105 (27.0%) | 2 (0.9%) |
| 8:30 AM to 8:59 AM | 3 (0.8%) | 13 (5.8%) |
| 9:00 AM to 9:59 AM | 11 (2.8%) | 3 (1.3%) |
| 10:00 AM to 10:59 AM | 0 (0.0%) | 0 (0.0%) |
| 11:00 AM to 11:59 AM | 0 (0.0%) | 0 (0.0%) |
| 12:00 PM to 3:59 PM | 16 (4.1%) | 26 (11.6%) |
| 4:00 PM to 11:59 PM | 51 (13.1%) | 25 (11.1%) |
| Total | 389 (100.0%) | 225 (100.0%) |
Housing Occupancy in Eton
Occupancy by Ownership in Eton
Of the total 412 dwellings in Eton, owner-occupied units account for 364 (88.3%), while renter-occupied units make up 48 (11.7%).
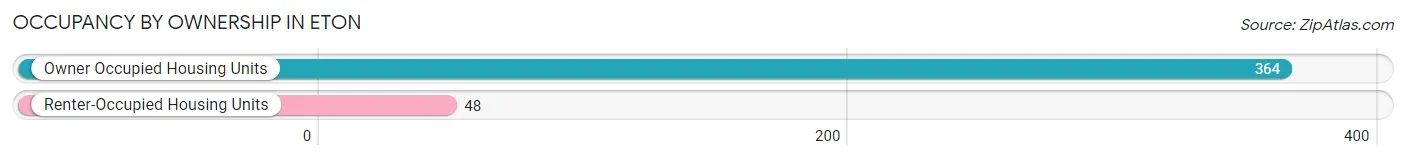
| Occupancy | # Housing Units | % Housing Units |
| Owner Occupied Housing Units | 364 | 88.3% |
| Renter-Occupied Housing Units | 48 | 11.7% |
| Total Occupied Housing Units | 412 | 100.0% |
Occupancy by Household Size in Eton
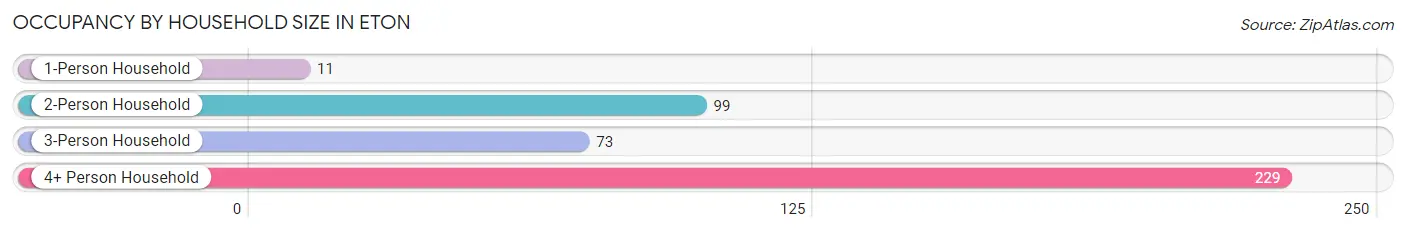
| Household Size | # Housing Units | % Housing Units |
| 1-Person Household | 11 | 2.7% |
| 2-Person Household | 99 | 24.0% |
| 3-Person Household | 73 | 17.7% |
| 4+ Person Household | 229 | 55.6% |
| Total Housing Units | 412 | 100.0% |
Occupancy by Ownership by Household Size in Eton
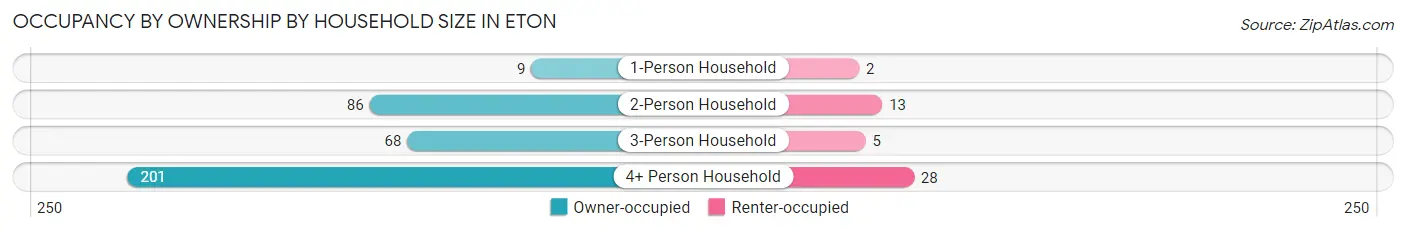
| Household Size | Owner-occupied | Renter-occupied |
| 1-Person Household | 9 (81.8%) | 2 (18.2%) |
| 2-Person Household | 86 (86.9%) | 13 (13.1%) |
| 3-Person Household | 68 (93.1%) | 5 (6.9%) |
| 4+ Person Household | 201 (87.8%) | 28 (12.2%) |
| Total Housing Units | 364 (88.3%) | 48 (11.7%) |
Occupancy by Educational Attainment in Eton
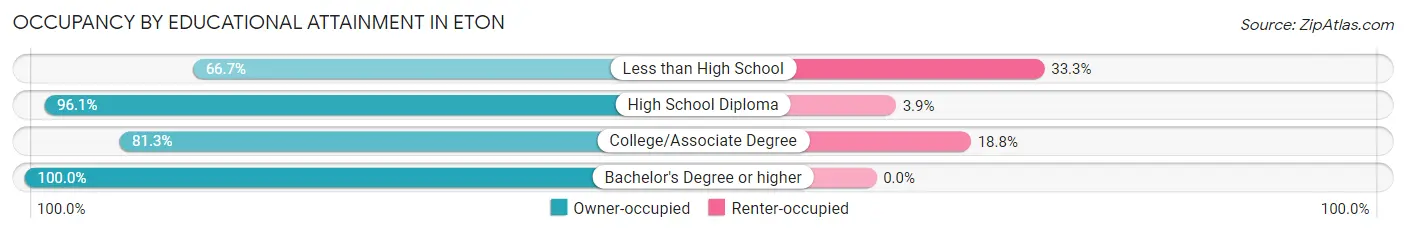
| Household Size | Owner-occupied | Renter-occupied |
| Less than High School | 22 (66.7%) | 11 (33.3%) |
| High School Diploma | 174 (96.1%) | 7 (3.9%) |
| College/Associate Degree | 130 (81.2%) | 30 (18.8%) |
| Bachelor's Degree or higher | 38 (100.0%) | 0 (0.0%) |
Occupancy by Age of Householder in Eton
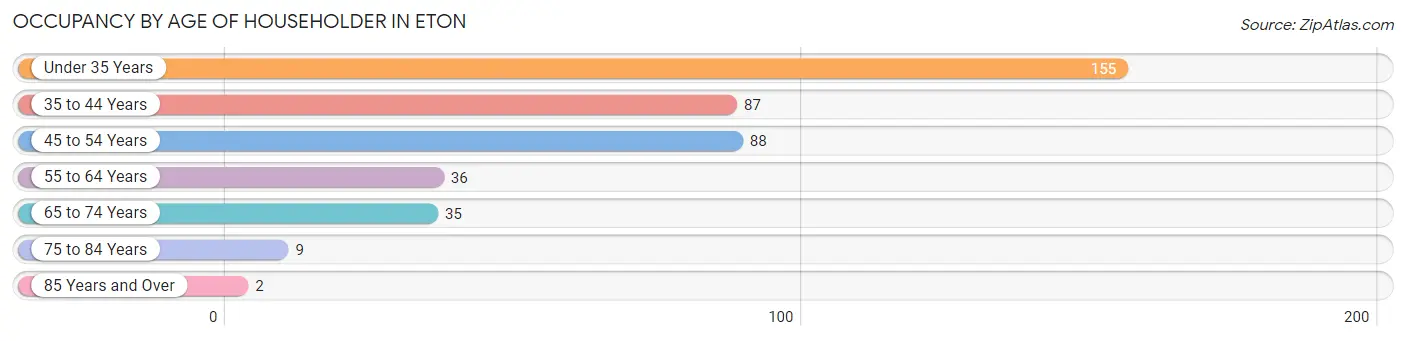
| Age Bracket | # Households | % Households |
| Under 35 Years | 155 | 37.6% |
| 35 to 44 Years | 87 | 21.1% |
| 45 to 54 Years | 88 | 21.4% |
| 55 to 64 Years | 36 | 8.7% |
| 65 to 74 Years | 35 | 8.5% |
| 75 to 84 Years | 9 | 2.2% |
| 85 Years and Over | 2 | 0.5% |
| Total | 412 | 100.0% |
Housing Finances in Eton
Median Income by Occupancy in Eton
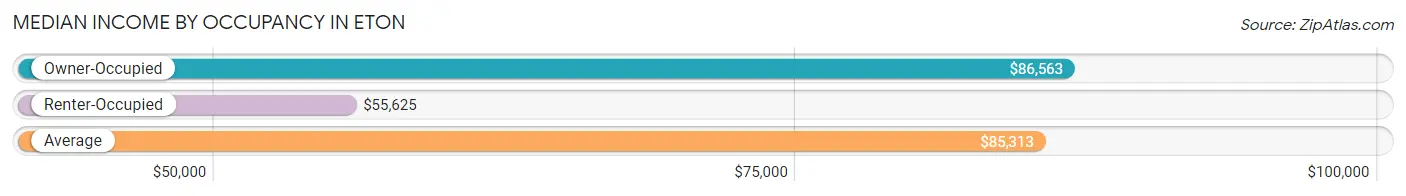
| Occupancy Type | # Households | Median Income |
| Owner-Occupied | 364 (88.3%) | $86,563 |
| Renter-Occupied | 48 (11.7%) | $55,625 |
| Average | 412 (100.0%) | $85,313 |
Occupancy by Householder Income Bracket in Eton
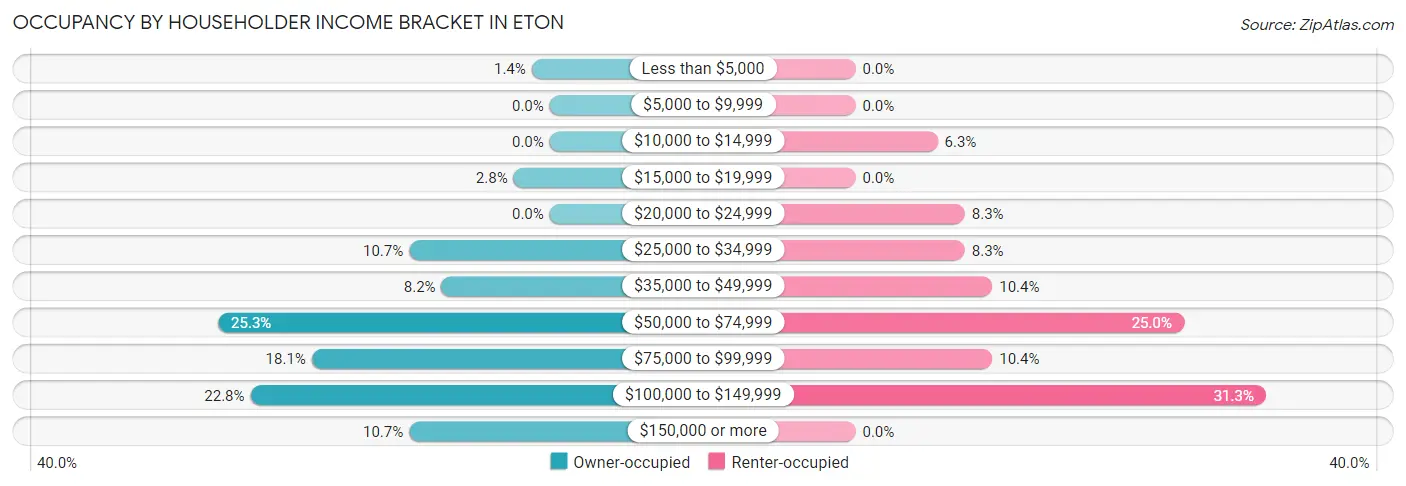
| Income Bracket | Owner-occupied | Renter-occupied |
| Less than $5,000 | 5 (1.4%) | 0 (0.0%) |
| $5,000 to $9,999 | 0 (0.0%) | 0 (0.0%) |
| $10,000 to $14,999 | 0 (0.0%) | 3 (6.2%) |
| $15,000 to $19,999 | 10 (2.8%) | 0 (0.0%) |
| $20,000 to $24,999 | 0 (0.0%) | 4 (8.3%) |
| $25,000 to $34,999 | 39 (10.7%) | 4 (8.3%) |
| $35,000 to $49,999 | 30 (8.2%) | 5 (10.4%) |
| $50,000 to $74,999 | 92 (25.3%) | 12 (25.0%) |
| $75,000 to $99,999 | 66 (18.1%) | 5 (10.4%) |
| $100,000 to $149,999 | 83 (22.8%) | 15 (31.2%) |
| $150,000 or more | 39 (10.7%) | 0 (0.0%) |
| Total | 364 (100.0%) | 48 (100.0%) |
Monthly Housing Cost Tiers in Eton
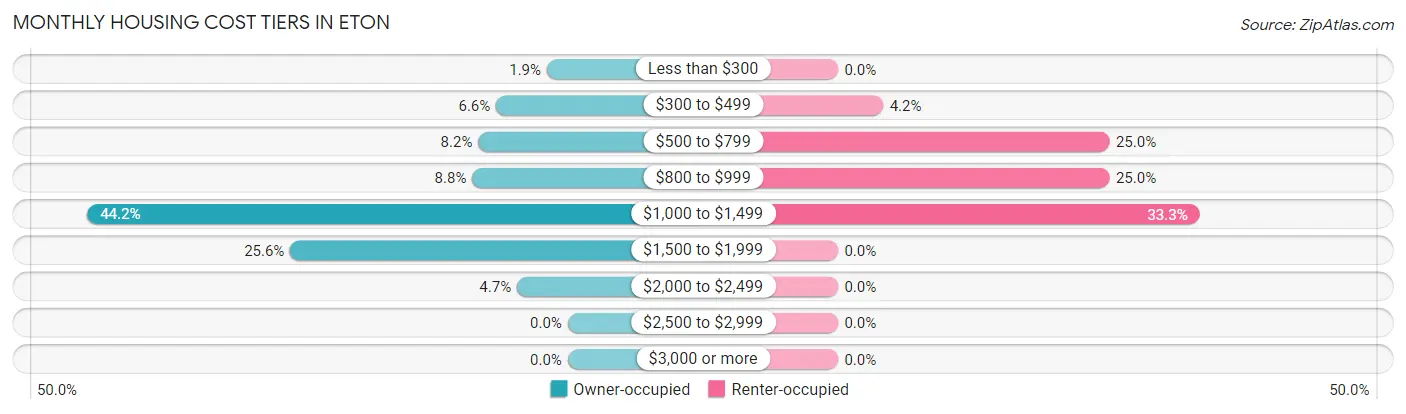
| Monthly Cost | Owner-occupied | Renter-occupied |
| Less than $300 | 7 (1.9%) | 0 (0.0%) |
| $300 to $499 | 24 (6.6%) | 2 (4.2%) |
| $500 to $799 | 30 (8.2%) | 12 (25.0%) |
| $800 to $999 | 32 (8.8%) | 12 (25.0%) |
| $1,000 to $1,499 | 161 (44.2%) | 16 (33.3%) |
| $1,500 to $1,999 | 93 (25.6%) | 0 (0.0%) |
| $2,000 to $2,499 | 17 (4.7%) | 0 (0.0%) |
| $2,500 to $2,999 | 0 (0.0%) | 0 (0.0%) |
| $3,000 or more | 0 (0.0%) | 0 (0.0%) |
| Total | 364 (100.0%) | 48 (100.0%) |
Physical Housing Characteristics in Eton
Housing Structures in Eton
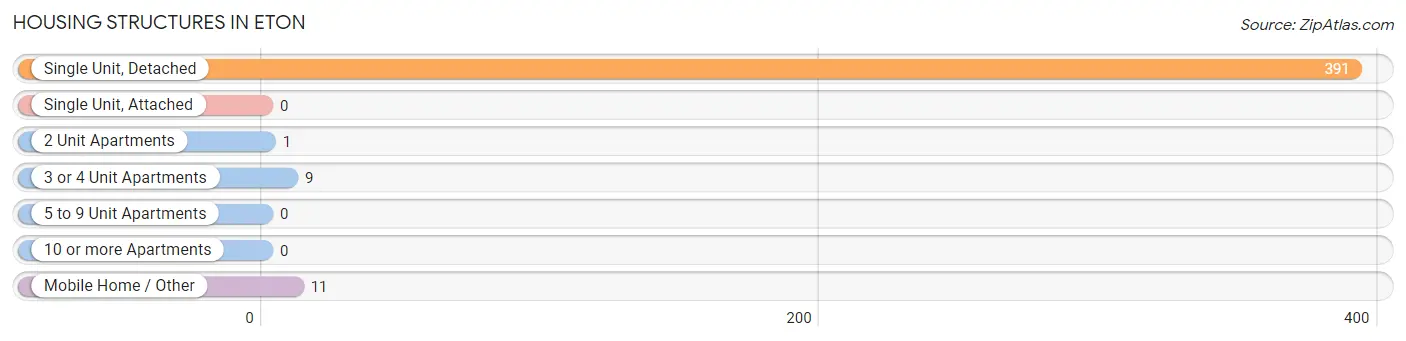
| Structure Type | # Housing Units | % Housing Units |
| Single Unit, Detached | 391 | 94.9% |
| Single Unit, Attached | 0 | 0.0% |
| 2 Unit Apartments | 1 | 0.2% |
| 3 or 4 Unit Apartments | 9 | 2.2% |
| 5 to 9 Unit Apartments | 0 | 0.0% |
| 10 or more Apartments | 0 | 0.0% |
| Mobile Home / Other | 11 | 2.7% |
| Total | 412 | 100.0% |
Housing Structures by Occupancy in Eton
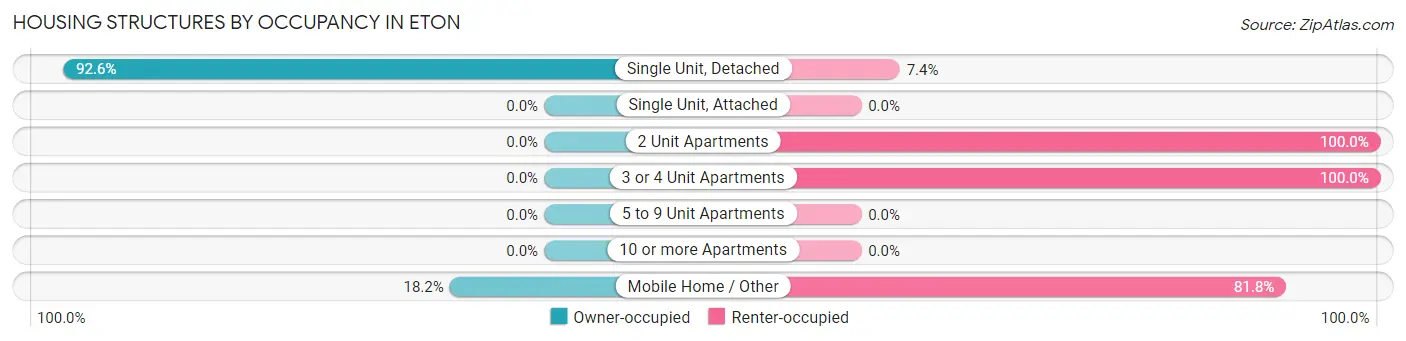
| Structure Type | Owner-occupied | Renter-occupied |
| Single Unit, Detached | 362 (92.6%) | 29 (7.4%) |
| Single Unit, Attached | 0 (0.0%) | 0 (0.0%) |
| 2 Unit Apartments | 0 (0.0%) | 1 (100.0%) |
| 3 or 4 Unit Apartments | 0 (0.0%) | 9 (100.0%) |
| 5 to 9 Unit Apartments | 0 (0.0%) | 0 (0.0%) |
| 10 or more Apartments | 0 (0.0%) | 0 (0.0%) |
| Mobile Home / Other | 2 (18.2%) | 9 (81.8%) |
| Total | 364 (88.3%) | 48 (11.7%) |
Housing Structures by Number of Rooms in Eton
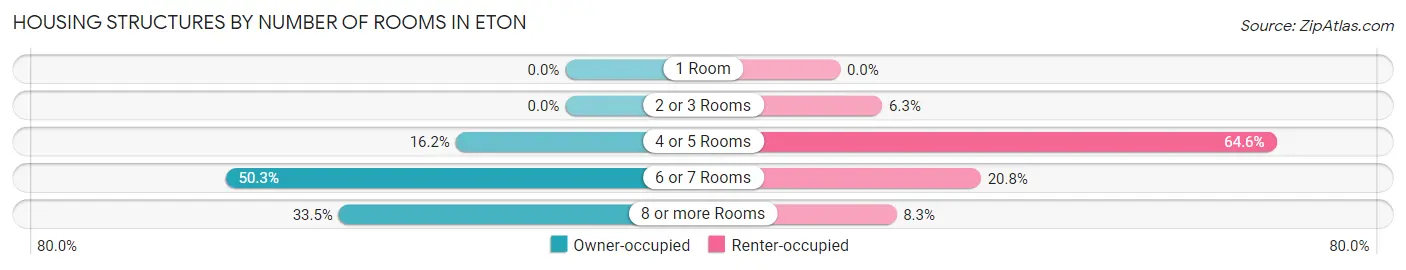
| Number of Rooms | Owner-occupied | Renter-occupied |
| 1 Room | 0 (0.0%) | 0 (0.0%) |
| 2 or 3 Rooms | 0 (0.0%) | 3 (6.2%) |
| 4 or 5 Rooms | 59 (16.2%) | 31 (64.6%) |
| 6 or 7 Rooms | 183 (50.3%) | 10 (20.8%) |
| 8 or more Rooms | 122 (33.5%) | 4 (8.3%) |
| Total | 364 (100.0%) | 48 (100.0%) |
Housing Structure by Heating Type in Eton
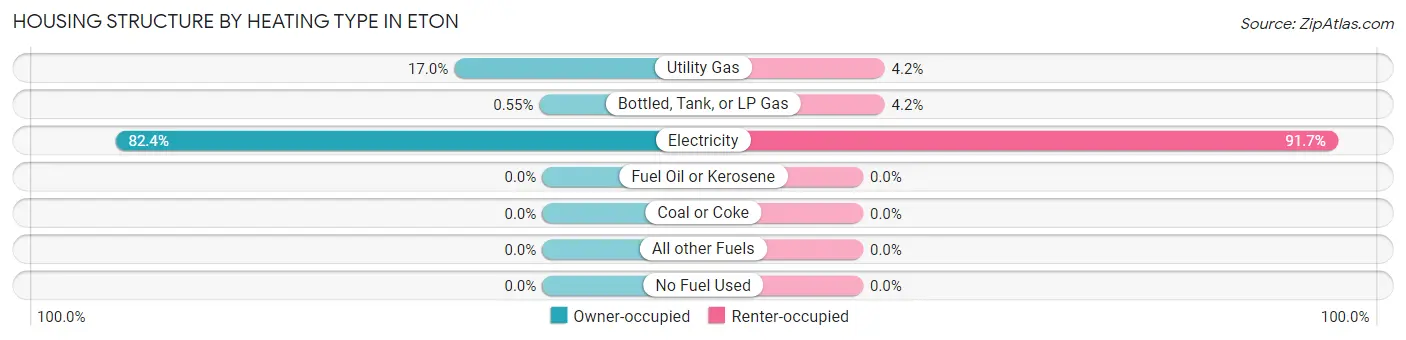
| Heating Type | Owner-occupied | Renter-occupied |
| Utility Gas | 62 (17.0%) | 2 (4.2%) |
| Bottled, Tank, or LP Gas | 2 (0.5%) | 2 (4.2%) |
| Electricity | 300 (82.4%) | 44 (91.7%) |
| Fuel Oil or Kerosene | 0 (0.0%) | 0 (0.0%) |
| Coal or Coke | 0 (0.0%) | 0 (0.0%) |
| All other Fuels | 0 (0.0%) | 0 (0.0%) |
| No Fuel Used | 0 (0.0%) | 0 (0.0%) |
| Total | 364 (100.0%) | 48 (100.0%) |
Household Vehicle Usage in Eton
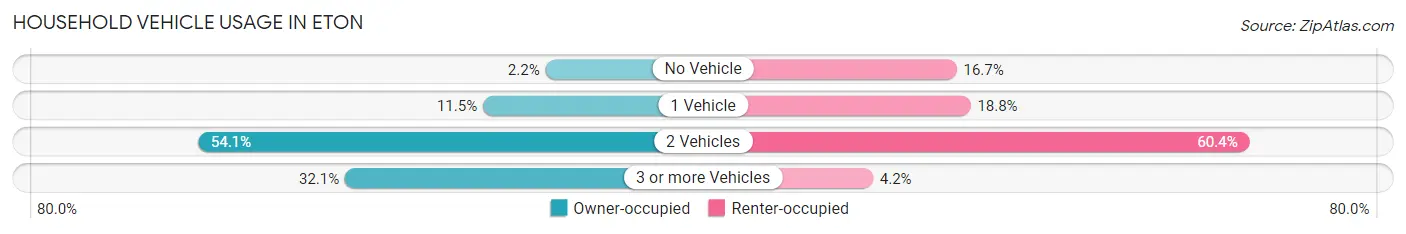
| Vehicles per Household | Owner-occupied | Renter-occupied |
| No Vehicle | 8 (2.2%) | 8 (16.7%) |
| 1 Vehicle | 42 (11.5%) | 9 (18.8%) |
| 2 Vehicles | 197 (54.1%) | 29 (60.4%) |
| 3 or more Vehicles | 117 (32.1%) | 2 (4.2%) |
| Total | 364 (100.0%) | 48 (100.0%) |
Real Estate & Mortgages in Eton
Real Estate and Mortgage Overview in Eton
| Characteristic | Without Mortgage | With Mortgage |
| Housing Units | 59 | 305 |
| Median Property Value | $217,500 | $183,300 |
| Median Household Income | $44,750 | $34 |
| Monthly Housing Costs | $397 | $0 |
| Real Estate Taxes | $1,583 | $0 |
Property Value by Mortgage Status in Eton
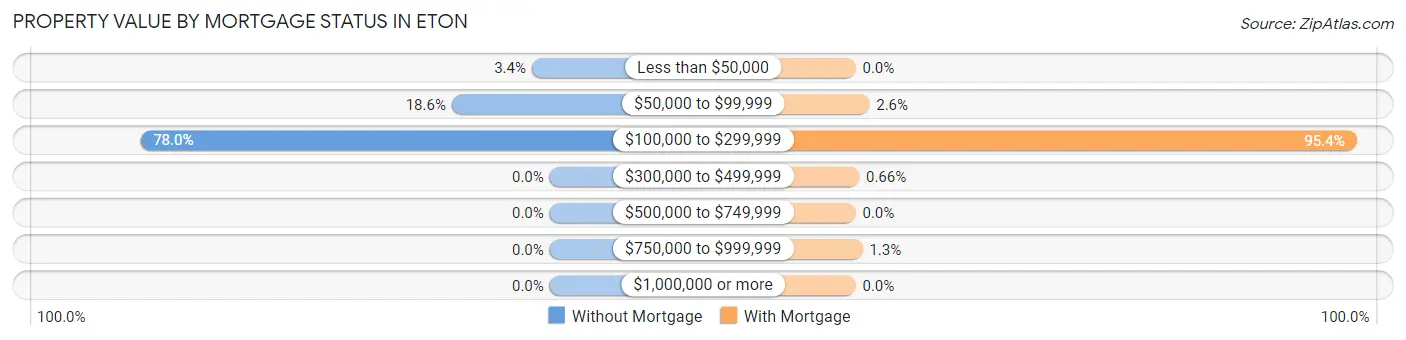
| Property Value | Without Mortgage | With Mortgage |
| Less than $50,000 | 2 (3.4%) | 0 (0.0%) |
| $50,000 to $99,999 | 11 (18.6%) | 8 (2.6%) |
| $100,000 to $299,999 | 46 (78.0%) | 291 (95.4%) |
| $300,000 to $499,999 | 0 (0.0%) | 2 (0.7%) |
| $500,000 to $749,999 | 0 (0.0%) | 0 (0.0%) |
| $750,000 to $999,999 | 0 (0.0%) | 4 (1.3%) |
| $1,000,000 or more | 0 (0.0%) | 0 (0.0%) |
| Total | 59 (100.0%) | 305 (100.0%) |
Household Income by Mortgage Status in Eton
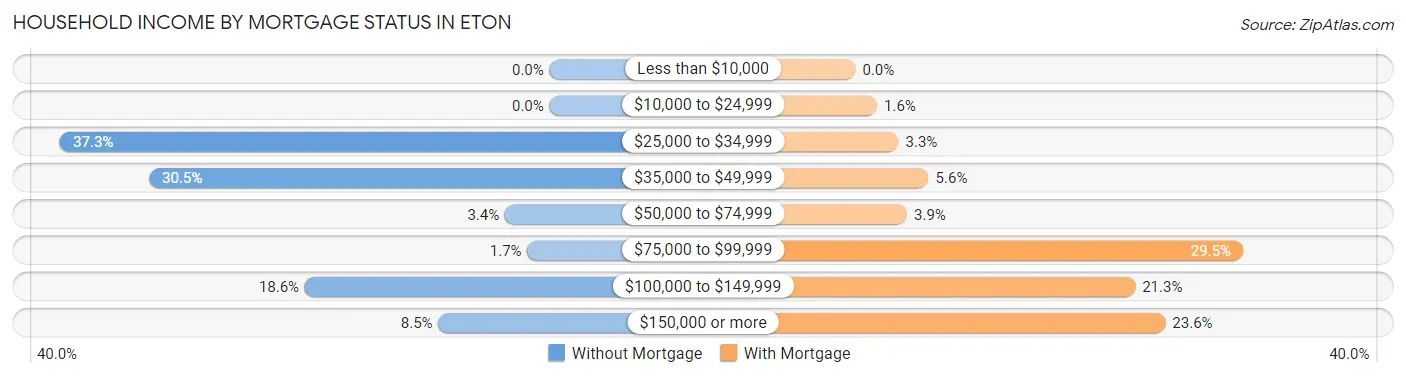
| Household Income | Without Mortgage | With Mortgage |
| Less than $10,000 | 0 (0.0%) | 0 (0.0%) |
| $10,000 to $24,999 | 0 (0.0%) | 5 (1.6%) |
| $25,000 to $34,999 | 22 (37.3%) | 10 (3.3%) |
| $35,000 to $49,999 | 18 (30.5%) | 17 (5.6%) |
| $50,000 to $74,999 | 2 (3.4%) | 12 (3.9%) |
| $75,000 to $99,999 | 1 (1.7%) | 90 (29.5%) |
| $100,000 to $149,999 | 11 (18.6%) | 65 (21.3%) |
| $150,000 or more | 5 (8.5%) | 72 (23.6%) |
| Total | 59 (100.0%) | 305 (100.0%) |
Property Value to Household Income Ratio in Eton
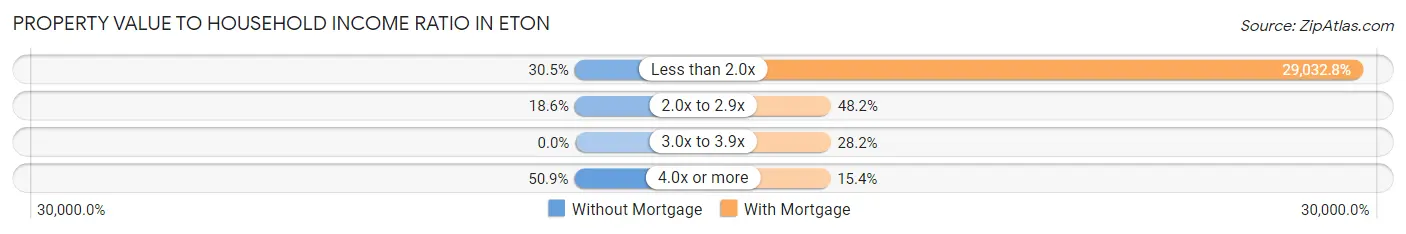
| Value-to-Income Ratio | Without Mortgage | With Mortgage |
| Less than 2.0x | 18 (30.5%) | 88,550 (29,032.8%) |
| 2.0x to 2.9x | 11 (18.6%) | 147 (48.2%) |
| 3.0x to 3.9x | 0 (0.0%) | 86 (28.2%) |
| 4.0x or more | 30 (50.8%) | 47 (15.4%) |
| Total | 59 (100.0%) | 305 (100.0%) |
Real Estate Taxes by Mortgage Status in Eton
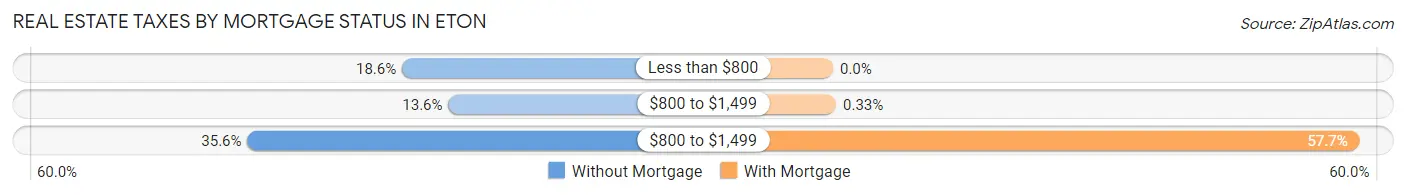
| Property Taxes | Without Mortgage | With Mortgage |
| Less than $800 | 11 (18.6%) | 0 (0.0%) |
| $800 to $1,499 | 8 (13.6%) | 1 (0.3%) |
| $800 to $1,499 | 21 (35.6%) | 176 (57.7%) |
| Total | 59 (100.0%) | 305 (100.0%) |
Health & Disability in Eton
Health Insurance Coverage by Age in Eton
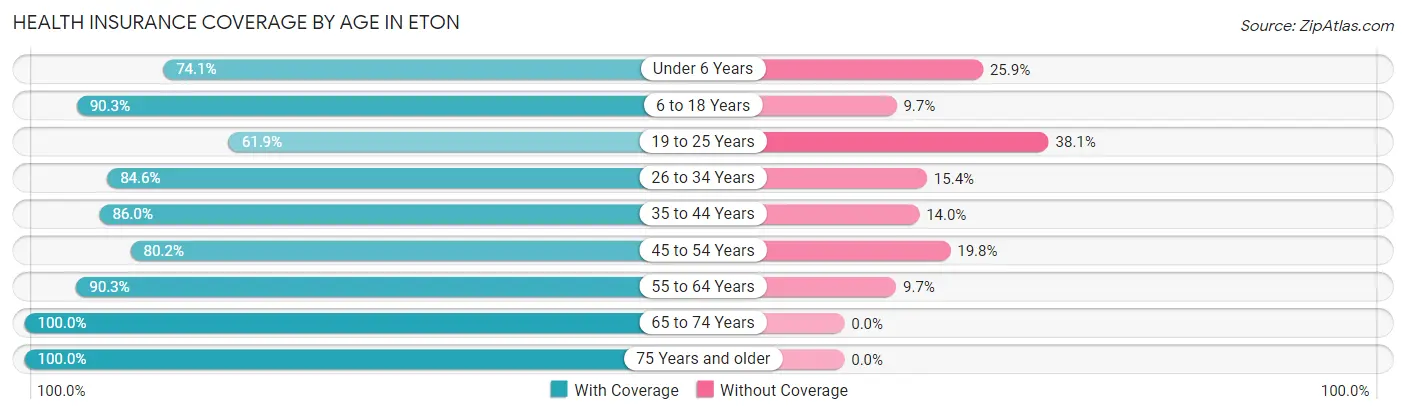
| Age Bracket | With Coverage | Without Coverage |
| Under 6 Years | 129 (74.1%) | 45 (25.9%) |
| 6 to 18 Years | 334 (90.3%) | 36 (9.7%) |
| 19 to 25 Years | 52 (61.9%) | 32 (38.1%) |
| 26 to 34 Years | 258 (84.6%) | 47 (15.4%) |
| 35 to 44 Years | 117 (86.0%) | 19 (14.0%) |
| 45 to 54 Years | 134 (80.2%) | 33 (19.8%) |
| 55 to 64 Years | 187 (90.3%) | 20 (9.7%) |
| 65 to 74 Years | 118 (100.0%) | 0 (0.0%) |
| 75 Years and older | 13 (100.0%) | 0 (0.0%) |
| Total | 1,342 (85.3%) | 232 (14.7%) |
Health Insurance Coverage by Citizenship Status in Eton
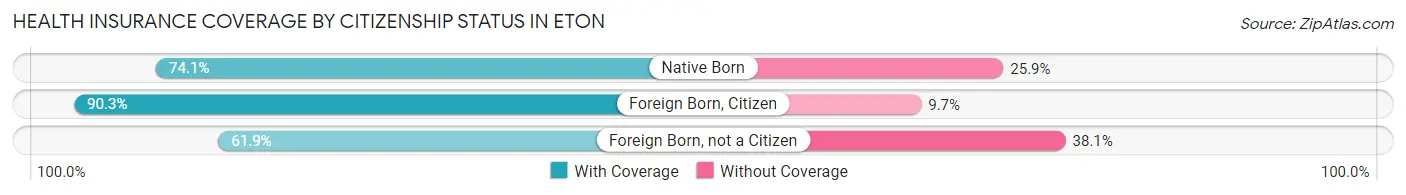
| Citizenship Status | With Coverage | Without Coverage |
| Native Born | 129 (74.1%) | 45 (25.9%) |
| Foreign Born, Citizen | 334 (90.3%) | 36 (9.7%) |
| Foreign Born, not a Citizen | 52 (61.9%) | 32 (38.1%) |
Health Insurance Coverage by Household Income in Eton
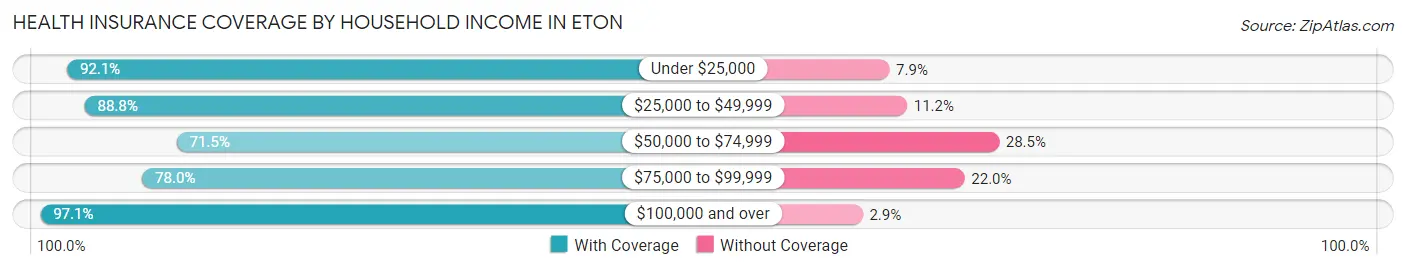
| Household Income | With Coverage | Without Coverage |
| Under $25,000 | 58 (92.1%) | 5 (7.9%) |
| $25,000 to $49,999 | 229 (88.8%) | 29 (11.2%) |
| $50,000 to $74,999 | 294 (71.5%) | 117 (28.5%) |
| $75,000 to $99,999 | 230 (78.0%) | 65 (22.0%) |
| $100,000 and over | 531 (97.1%) | 16 (2.9%) |
Public vs Private Health Insurance Coverage by Age in Eton
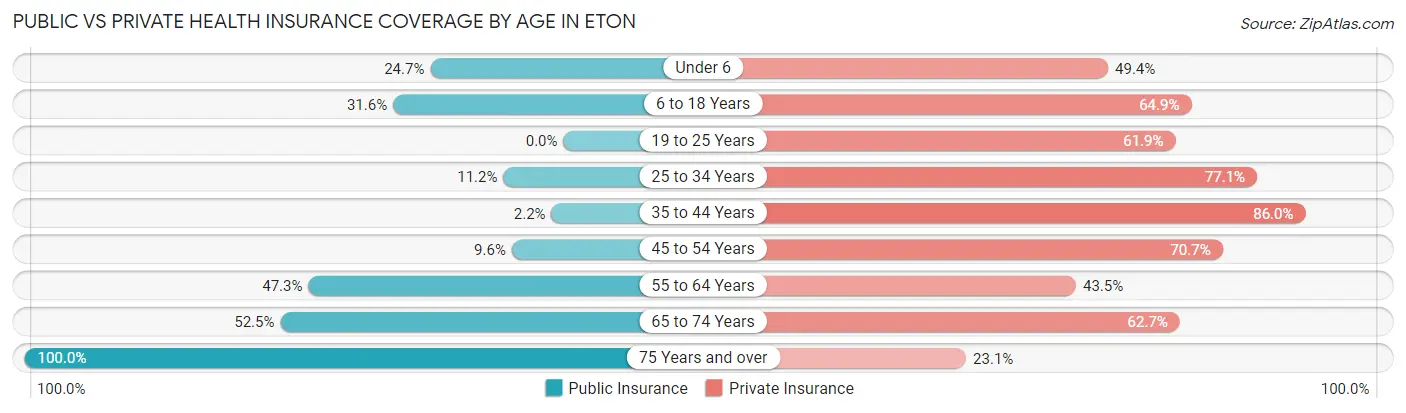
| Age Bracket | Public Insurance | Private Insurance |
| Under 6 | 43 (24.7%) | 86 (49.4%) |
| 6 to 18 Years | 117 (31.6%) | 240 (64.9%) |
| 19 to 25 Years | 0 (0.0%) | 52 (61.9%) |
| 25 to 34 Years | 34 (11.2%) | 235 (77.0%) |
| 35 to 44 Years | 3 (2.2%) | 117 (86.0%) |
| 45 to 54 Years | 16 (9.6%) | 118 (70.7%) |
| 55 to 64 Years | 98 (47.3%) | 90 (43.5%) |
| 65 to 74 Years | 62 (52.5%) | 74 (62.7%) |
| 75 Years and over | 13 (100.0%) | 3 (23.1%) |
| Total | 386 (24.5%) | 1,015 (64.5%) |
Disability Status by Sex by Age in Eton
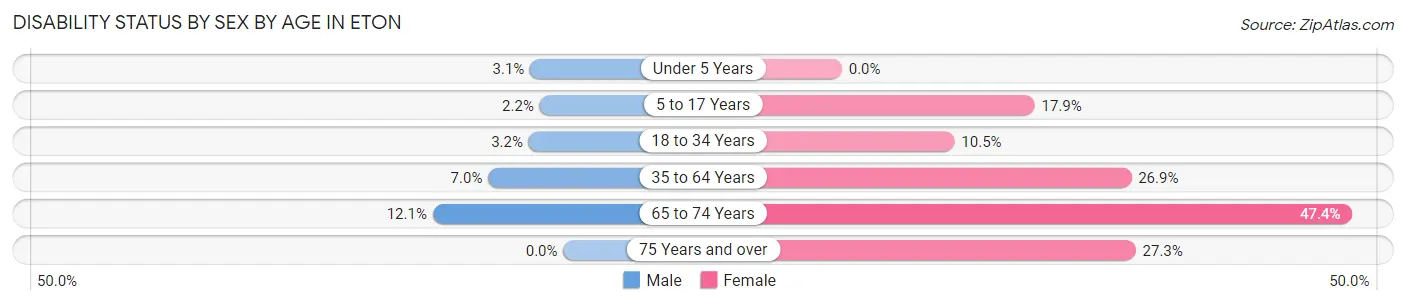
| Age Bracket | Male | Female |
| Under 5 Years | 2 (3.1%) | 0 (0.0%) |
| 5 to 17 Years | 6 (2.2%) | 22 (17.9%) |
| 18 to 34 Years | 6 (3.2%) | 23 (10.4%) |
| 35 to 64 Years | 14 (7.0%) | 83 (26.9%) |
| 65 to 74 Years | 12 (12.1%) | 9 (47.4%) |
| 75 Years and over | 0 (0.0%) | 3 (27.3%) |
Disability Class by Sex by Age in Eton
Disability Class: Hearing Difficulty
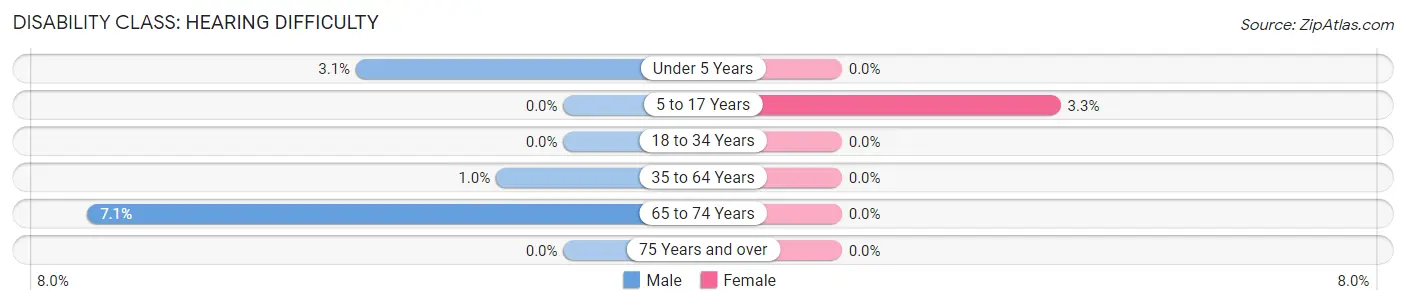
| Age Bracket | Male | Female |
| Under 5 Years | 2 (3.1%) | 0 (0.0%) |
| 5 to 17 Years | 0 (0.0%) | 4 (3.3%) |
| 18 to 34 Years | 0 (0.0%) | 0 (0.0%) |
| 35 to 64 Years | 2 (1.0%) | 0 (0.0%) |
| 65 to 74 Years | 7 (7.1%) | 0 (0.0%) |
| 75 Years and over | 0 (0.0%) | 0 (0.0%) |
Disability Class: Vision Difficulty
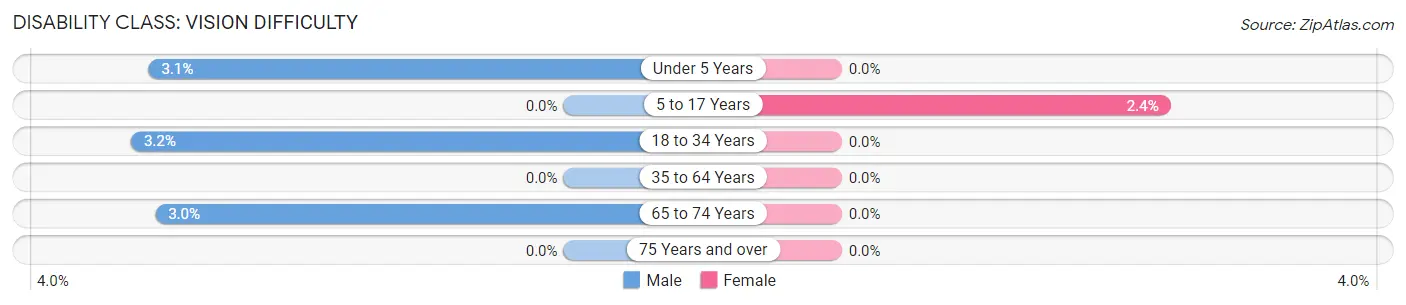
| Age Bracket | Male | Female |
| Under 5 Years | 2 (3.1%) | 0 (0.0%) |
| 5 to 17 Years | 0 (0.0%) | 3 (2.4%) |
| 18 to 34 Years | 6 (3.2%) | 0 (0.0%) |
| 35 to 64 Years | 0 (0.0%) | 0 (0.0%) |
| 65 to 74 Years | 3 (3.0%) | 0 (0.0%) |
| 75 Years and over | 0 (0.0%) | 0 (0.0%) |
Disability Class: Cognitive Difficulty
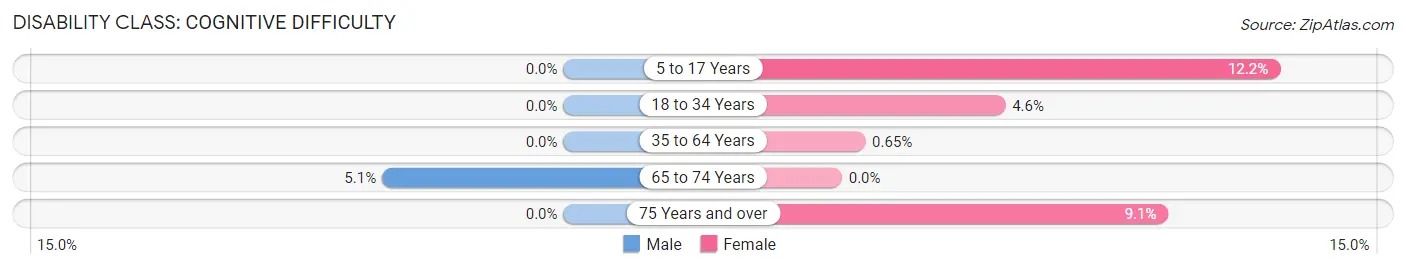
| Age Bracket | Male | Female |
| 5 to 17 Years | 0 (0.0%) | 15 (12.2%) |
| 18 to 34 Years | 0 (0.0%) | 10 (4.5%) |
| 35 to 64 Years | 0 (0.0%) | 2 (0.6%) |
| 65 to 74 Years | 5 (5.1%) | 0 (0.0%) |
| 75 Years and over | 0 (0.0%) | 1 (9.1%) |
Disability Class: Ambulatory Difficulty
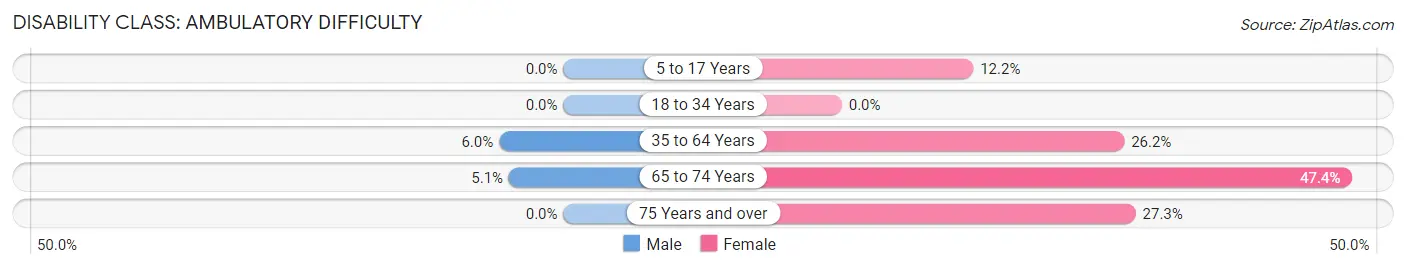
| Age Bracket | Male | Female |
| 5 to 17 Years | 0 (0.0%) | 15 (12.2%) |
| 18 to 34 Years | 0 (0.0%) | 0 (0.0%) |
| 35 to 64 Years | 12 (6.0%) | 81 (26.2%) |
| 65 to 74 Years | 5 (5.1%) | 9 (47.4%) |
| 75 Years and over | 0 (0.0%) | 3 (27.3%) |
Disability Class: Self-Care Difficulty
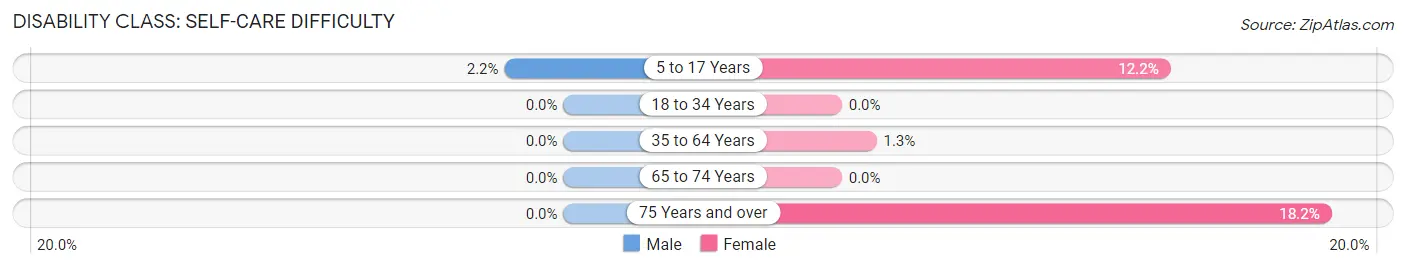
| Age Bracket | Male | Female |
| 5 to 17 Years | 6 (2.2%) | 15 (12.2%) |
| 18 to 34 Years | 0 (0.0%) | 0 (0.0%) |
| 35 to 64 Years | 0 (0.0%) | 4 (1.3%) |
| 65 to 74 Years | 0 (0.0%) | 0 (0.0%) |
| 75 Years and over | 0 (0.0%) | 2 (18.2%) |
Technology Access in Eton
Computing Device Access in Eton
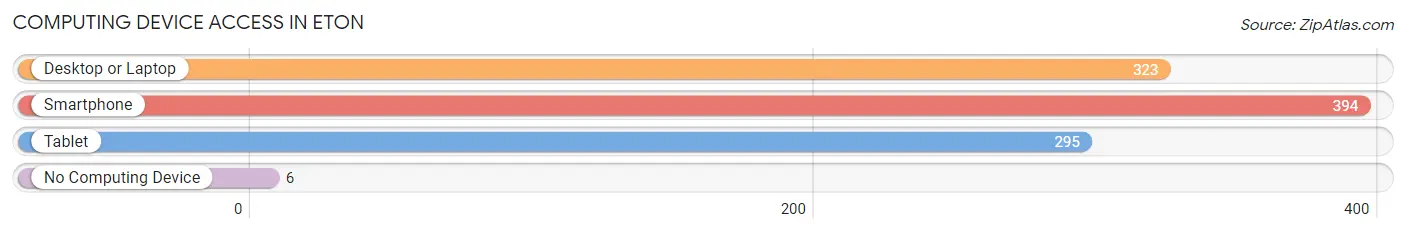
| Device Type | # Households | % Households |
| Desktop or Laptop | 323 | 78.4% |
| Smartphone | 394 | 95.6% |
| Tablet | 295 | 71.6% |
| No Computing Device | 6 | 1.5% |
| Total | 412 | 100.0% |
Internet Access in Eton
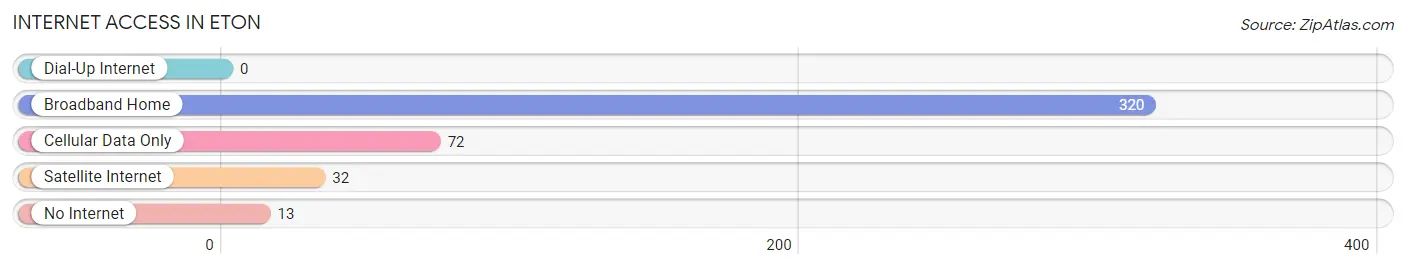
| Internet Type | # Households | % Households |
| Dial-Up Internet | 0 | 0.0% |
| Broadband Home | 320 | 77.7% |
| Cellular Data Only | 72 | 17.5% |
| Satellite Internet | 32 | 7.8% |
| No Internet | 13 | 3.2% |
| Total | 412 | 100.0% |
Eton Summary
Eton is a small town located in the northwest corner of Georgia in the United States. It is situated in the foothills of the Appalachian Mountains and is part of the Chattanooga, TN-GA Metropolitan Statistical Area. The town has a population of approximately 1,000 people and is known for its rural charm and friendly atmosphere.
Geography
Eton is located in the northwest corner of Georgia, in the foothills of the Appalachian Mountains. It is situated in the Chattahoochee National Forest and is bordered by the Tennessee state line to the north and the Georgia state line to the south. The town is located at an elevation of 1,000 feet and is approximately 30 miles from Chattanooga, TN. The town is situated on the banks of the Conasauga River, which is a tributary of the Coosa River.
Climate
Eton has a humid subtropical climate, with hot summers and mild winters. The average annual temperature is around 64°F, with an average high of around 86°F in the summer and an average low of around 42°F in the winter. The town receives an average of 48 inches of precipitation per year, with most of it falling in the spring and summer months.
Demographics
As of the 2010 census, the population of Eton was 1,000 people. The racial makeup of the town was 95.2% White, 0.7% African American, 0.3% Native American, 0.2% Asian, 0.1% Pacific Islander, and 3.5% from other races. The median household income was $30,000, and the median age was 40 years.
Economy
Eton’s economy is largely based on agriculture and tourism. The town is home to several farms, which produce a variety of crops, including corn, soybeans, and hay. The town is also home to several small businesses, including restaurants, shops, and a few manufacturing plants. Tourism is also an important part of the local economy, as the town is a popular destination for outdoor activities such as fishing, camping, and hiking.
History
Eton was founded in 1837 by a group of settlers from North Carolina. The town was named after the English town of Eton, which was the birthplace of one of the settlers. The town quickly grew and became an important stop on the stagecoach route between Chattanooga and Atlanta. The town was also an important stop on the Western and Atlantic Railroad, which connected Chattanooga to Atlanta.
In the late 19th century, Eton was a popular destination for wealthy tourists from the North. The town was home to several large resorts, which attracted visitors from all over the country. The town also became a popular destination for outdoor activities such as fishing, hunting, and camping.
In the early 20th century, Eton began to decline as the railroad and stagecoach routes were replaced by automobiles. The town’s economy shifted to agriculture and tourism, and the population began to decline. The town has remained relatively small and rural, and has retained its rural charm and friendly atmosphere.
Common Questions
What is Per Capita Income in Eton?
Per Capita income in Eton is $22,706.
What is the Median Family Income in Eton?
Median Family Income in Eton is $87,904.
What is the Median Household income in Eton?
Median Household Income in Eton is $85,313.
What is Income or Wage Gap in Eton?
Income or Wage Gap in Eton is 37.1%.
Women in Eton earn 62.9 cents for every dollar earned by a man.
What is Inequality or Gini Index in Eton?
Inequality or Gini Index in Eton is 0.31.
What is the Total Population of Eton?
Total Population of Eton is 1,574.
What is the Total Male Population of Eton?
Total Male Population of Eton is 828.
What is the Total Female Population of Eton?
Total Female Population of Eton is 746.
What is the Ratio of Males per 100 Females in Eton?
There are 110.99 Males per 100 Females in Eton.
What is the Ratio of Females per 100 Males in Eton?
There are 90.10 Females per 100 Males in Eton.
What is the Median Population Age in Eton?
Median Population Age in Eton is 31.8 Years.
What is the Average Family Size in Eton
Average Family Size in Eton is 3.8 People.
What is the Average Household Size in Eton
Average Household Size in Eton is 3.8 People.
How Large is the Labor Force in Eton?
There are 710 People in the Labor Forcein in Eton.
What is the Percentage of People in the Labor Force in Eton?
66.5% of People are in the Labor Force in Eton.
What is the Unemployment Rate in Eton?
Unemployment Rate in Eton is 2.7%.