Emerson, GA Map & Demographics
Emerson Map
Emerson Overview
$41,857
PER CAPITA INCOME
$82,500
AVG FAMILY INCOME
$74,432
AVG HOUSEHOLD INCOME
14.3%
WAGE / INCOME GAP [ % ]
85.7¢/ $1
WAGE / INCOME GAP [ $ ]
0.52
INEQUALITY / GINI INDEX
1,594
TOTAL POPULATION
809
MALE POPULATION
785
FEMALE POPULATION
103.06
MALES / 100 FEMALES
97.03
FEMALES / 100 MALES
40.0
MEDIAN AGE
3.2
AVG FAMILY SIZE
2.6
AVG HOUSEHOLD SIZE
815
LABOR FORCE [ PEOPLE ]
64.7%
PERCENT IN LABOR FORCE
6.5%
UNEMPLOYMENT RATE
Emerson Zip Codes
Income in Emerson
Income Overview in Emerson
Per Capita Income in Emerson is $41,857, while median incomes of families and households are $82,500 and $74,432 respectively.
| Characteristic | Number | Measure |
| Per Capita Income | 1,594 | $41,857 |
| Median Family Income | 422 | $82,500 |
| Mean Family Income | 422 | $130,986 |
| Median Household Income | 610 | $74,432 |
| Mean Household Income | 610 | $105,872 |
| Income Deficit | 422 | $0 |
| Wage / Income Gap (%) | 1,594 | 14.32% |
| Wage / Income Gap ($) | 1,594 | 85.68¢ per $1 |
| Gini / Inequality Index | 1,594 | 0.52 |
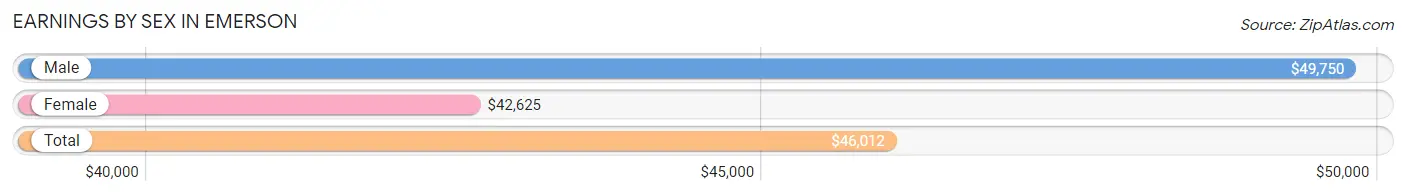
Earnings by Sex in Emerson
Average Earnings in Emerson are $46,012, $49,750 for men and $42,625 for women, a difference of 14.3%.
| Sex | Number | Average Earnings |
| Male | 403 (47.6%) | $49,750 |
| Female | 443 (52.4%) | $42,625 |
| Total | 846 (100.0%) | $46,012 |
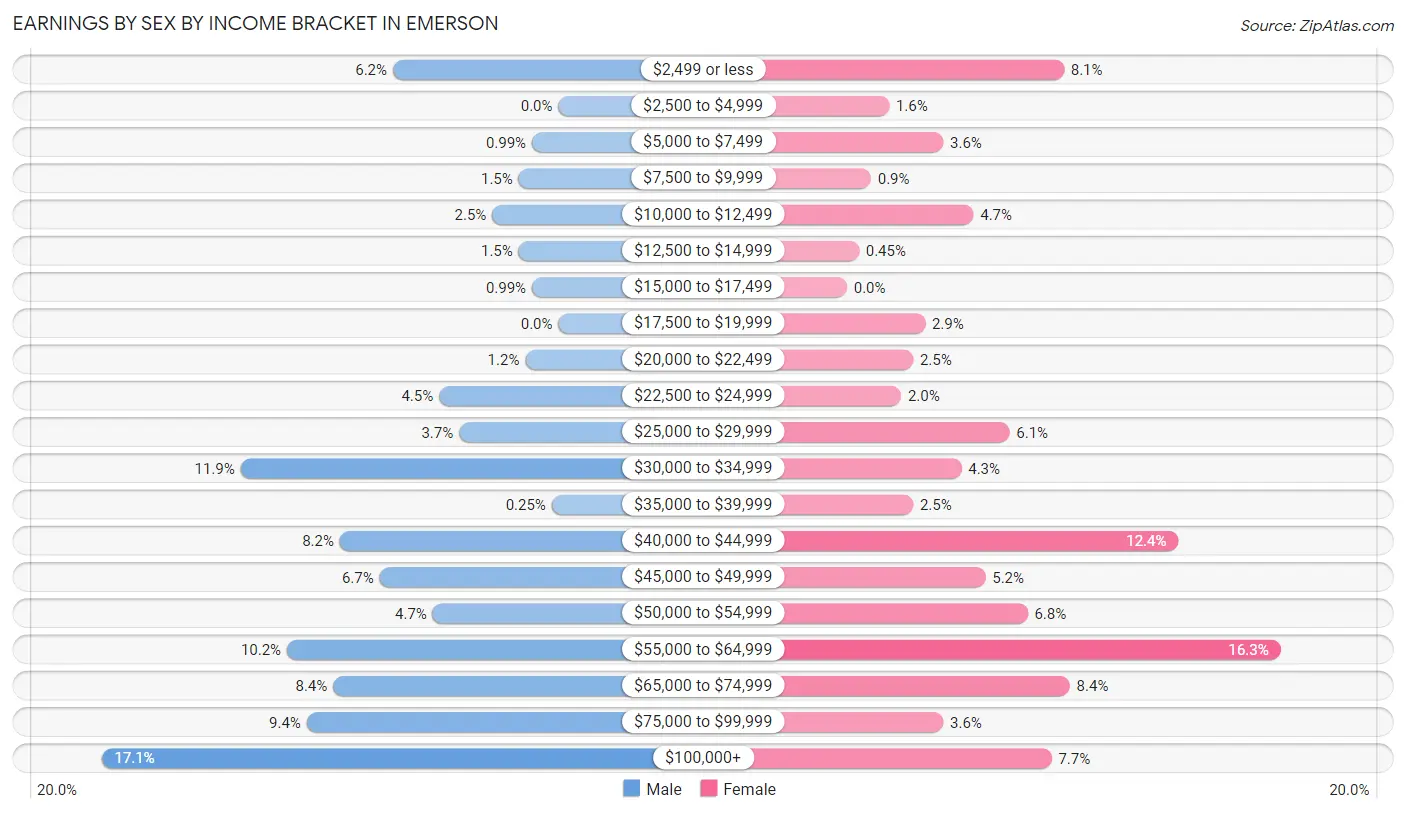
Earnings by Sex by Income Bracket in Emerson
The most common earnings brackets in Emerson are $100,000+ for men (69 | 17.1%) and $55,000 to $64,999 for women (72 | 16.3%).
| Income | Male | Female |
| $2,499 or less | 25 (6.2%) | 36 (8.1%) |
| $2,500 to $4,999 | 0 (0.0%) | 7 (1.6%) |
| $5,000 to $7,499 | 4 (1.0%) | 16 (3.6%) |
| $7,500 to $9,999 | 6 (1.5%) | 4 (0.9%) |
| $10,000 to $12,499 | 10 (2.5%) | 21 (4.7%) |
| $12,500 to $14,999 | 6 (1.5%) | 2 (0.4%) |
| $15,000 to $17,499 | 4 (1.0%) | 0 (0.0%) |
| $17,500 to $19,999 | 0 (0.0%) | 13 (2.9%) |
| $20,000 to $22,499 | 5 (1.2%) | 11 (2.5%) |
| $22,500 to $24,999 | 18 (4.5%) | 9 (2.0%) |
| $25,000 to $29,999 | 15 (3.7%) | 27 (6.1%) |
| $30,000 to $34,999 | 48 (11.9%) | 19 (4.3%) |
| $35,000 to $39,999 | 1 (0.3%) | 11 (2.5%) |
| $40,000 to $44,999 | 33 (8.2%) | 55 (12.4%) |
| $45,000 to $49,999 | 27 (6.7%) | 23 (5.2%) |
| $50,000 to $54,999 | 19 (4.7%) | 30 (6.8%) |
| $55,000 to $64,999 | 41 (10.2%) | 72 (16.3%) |
| $65,000 to $74,999 | 34 (8.4%) | 37 (8.4%) |
| $75,000 to $99,999 | 38 (9.4%) | 16 (3.6%) |
| $100,000+ | 69 (17.1%) | 34 (7.7%) |
| Total | 403 (100.0%) | 443 (100.0%) |
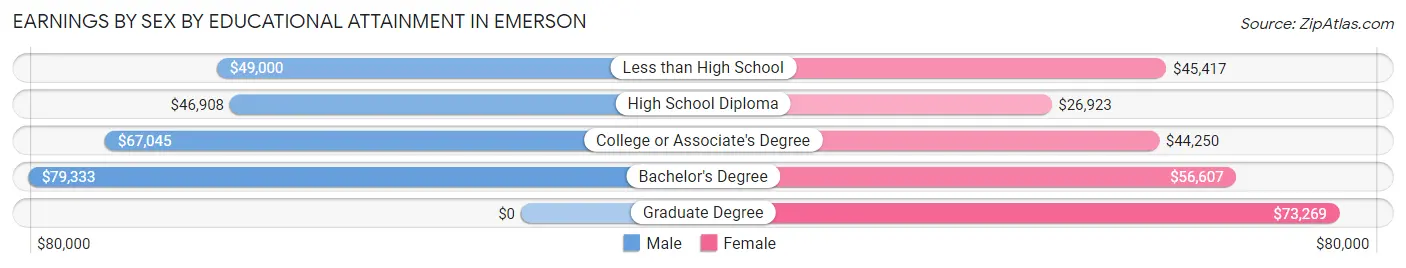
Earnings by Sex by Educational Attainment in Emerson
Average earnings in Emerson are $60,469 for men and $46,063 for women, a difference of 23.8%. Men with an educational attainment of bachelor's degree enjoy the highest average annual earnings of $79,333, while those with high school diploma education earn the least with $46,908. Women with an educational attainment of graduate degree earn the most with the average annual earnings of $73,269, while those with high school diploma education have the smallest earnings of $26,923.
| Educational Attainment | Male Income | Female Income |
| Less than High School | $49,000 | $45,417 |
| High School Diploma | $46,908 | $26,923 |
| College or Associate's Degree | $67,045 | $44,250 |
| Bachelor's Degree | $79,333 | $56,607 |
| Graduate Degree | - | - |
| Total | $60,469 | $46,063 |
Family Income in Emerson
Family Income Brackets in Emerson
According to the Emerson family income data, there are 73 families falling into the $100,000 to $149,999 income range, which is the most common income bracket and makes up 17.3% of all families. Conversely, the $10,000 to $14,999 income bracket is the least frequent group with only 5 families (1.2%) belonging to this category.
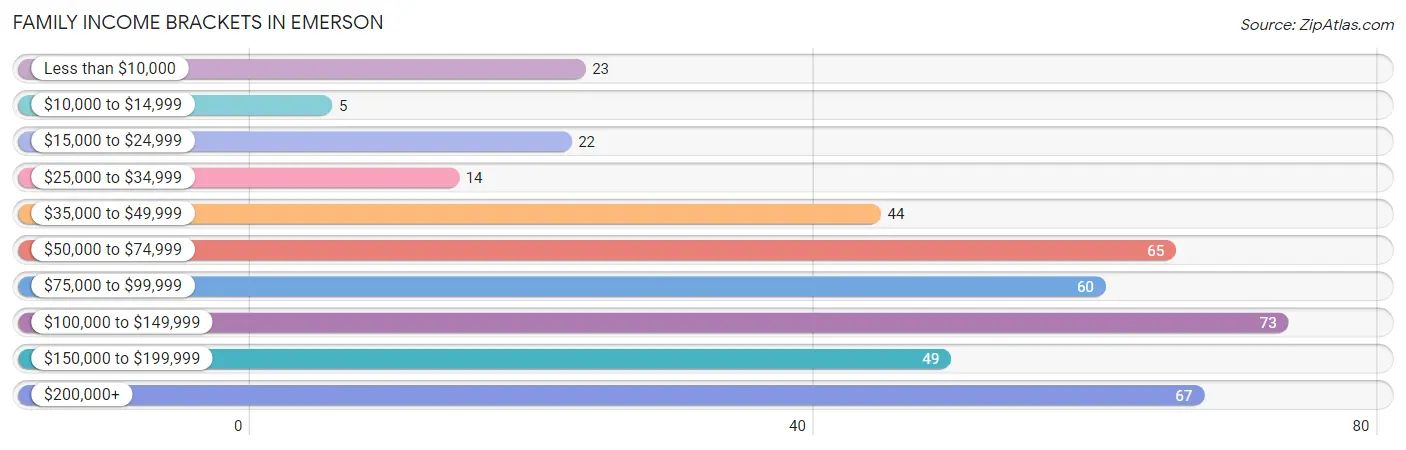
| Income Bracket | # Families | % Families |
| Less than $10,000 | 23 | 5.5% |
| $10,000 to $14,999 | 5 | 1.2% |
| $15,000 to $24,999 | 22 | 5.2% |
| $25,000 to $34,999 | 14 | 3.3% |
| $35,000 to $49,999 | 44 | 10.4% |
| $50,000 to $74,999 | 65 | 15.4% |
| $75,000 to $99,999 | 60 | 14.2% |
| $100,000 to $149,999 | 73 | 17.3% |
| $150,000 to $199,999 | 49 | 11.6% |
| $200,000+ | 67 | 15.9% |
Family Income by Famaliy Size in Emerson
3-person families (96 | 22.8%) account for the highest median family income in Emerson with $117,500 per family, while 2-person families (192 | 45.5%) have the highest median income of $45,357 per family member.
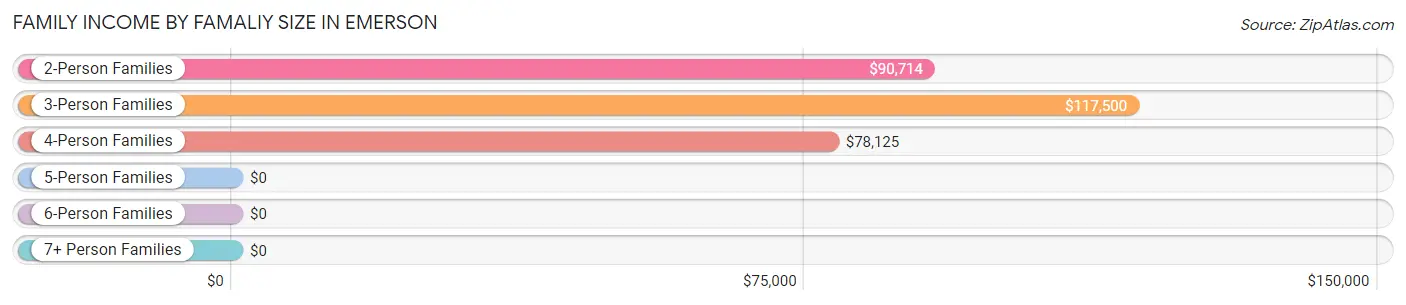
| Income Bracket | # Families | Median Income |
| 2-Person Families | 192 (45.5%) | $90,714 |
| 3-Person Families | 96 (22.8%) | $117,500 |
| 4-Person Families | 117 (27.7%) | $78,125 |
| 5-Person Families | 7 (1.7%) | $0 |
| 6-Person Families | 10 (2.4%) | $0 |
| 7+ Person Families | 0 (0.0%) | $0 |
| Total | 422 (100.0%) | $82,500 |
Family Income by Number of Earners in Emerson
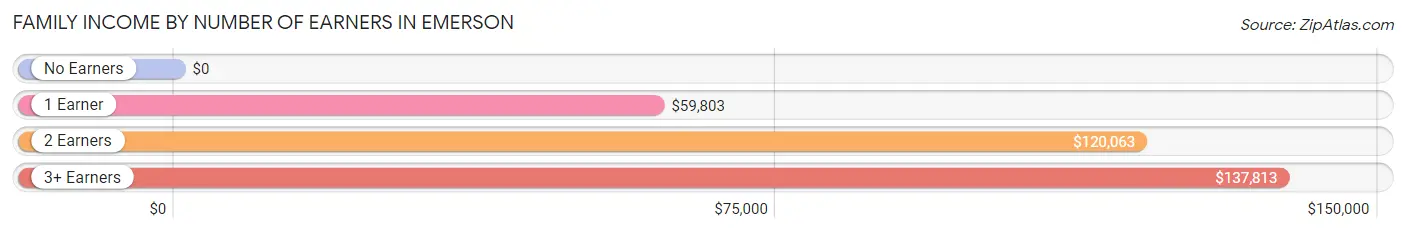
| Number of Earners | # Families | Median Income |
| No Earners | 79 (18.7%) | $0 |
| 1 Earner | 111 (26.3%) | $59,803 |
| 2 Earners | 161 (38.2%) | $120,063 |
| 3+ Earners | 71 (16.8%) | $137,813 |
| Total | 422 (100.0%) | $82,500 |
Household Income in Emerson
Household Income Brackets in Emerson
With 109 households falling in the category, the $50,000 to $74,999 income range is the most frequent in Emerson, accounting for 17.9% of all households. In contrast, only 14 households (2.3%) fall into the $10,000 to $14,999 income bracket, making it the least populous group.
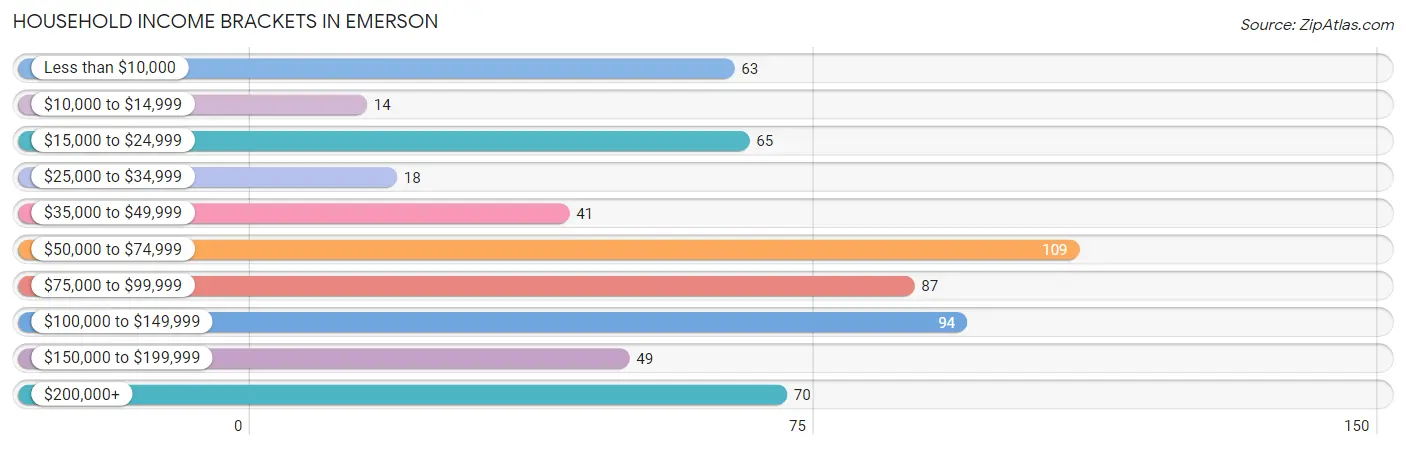
| Income Bracket | # Households | % Households |
| Less than $10,000 | 63 | 10.3% |
| $10,000 to $14,999 | 14 | 2.3% |
| $15,000 to $24,999 | 65 | 10.7% |
| $25,000 to $34,999 | 18 | 3.0% |
| $35,000 to $49,999 | 41 | 6.7% |
| $50,000 to $74,999 | 109 | 17.9% |
| $75,000 to $99,999 | 87 | 14.3% |
| $100,000 to $149,999 | 94 | 15.4% |
| $150,000 to $199,999 | 49 | 8.0% |
| $200,000+ | 70 | 11.5% |
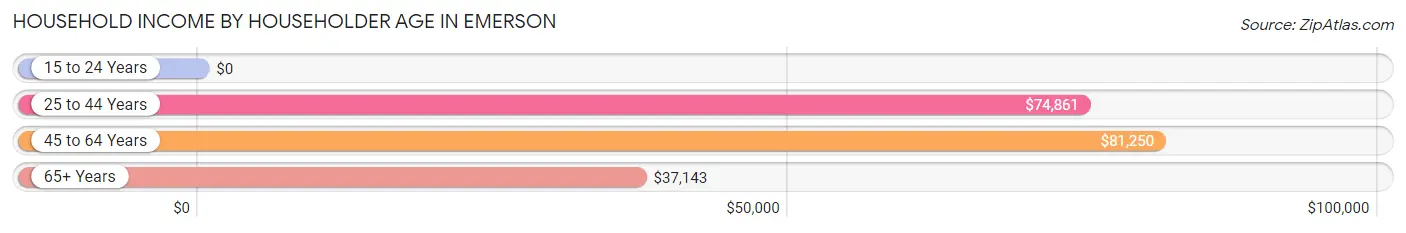
Household Income by Householder Age in Emerson
The median household income in Emerson is $74,432, with the highest median household income of $81,250 found in the 45 to 64 years age bracket for the primary householder. A total of 208 households (34.1%) fall into this category. Meanwhile, the 15 to 24 years age bracket for the primary householder has the lowest median household income of $0, with 16 households (2.6%) in this group.
| Income Bracket | # Households | Median Income |
| 15 to 24 Years | 16 (2.6%) | $0 |
| 25 to 44 Years | 198 (32.5%) | $74,861 |
| 45 to 64 Years | 208 (34.1%) | $81,250 |
| 65+ Years | 188 (30.8%) | $37,143 |
| Total | 610 (100.0%) | $74,432 |
Poverty in Emerson
Income Below Poverty by Sex and Age in Emerson
With 10.2% poverty level for males and 10.0% for females among the residents of Emerson, 75 year old and over males and 12 to 14 year old females are the most vulnerable to poverty, with 14 males (43.8%) and 23 females (56.1%) in their respective age groups living below the poverty level.
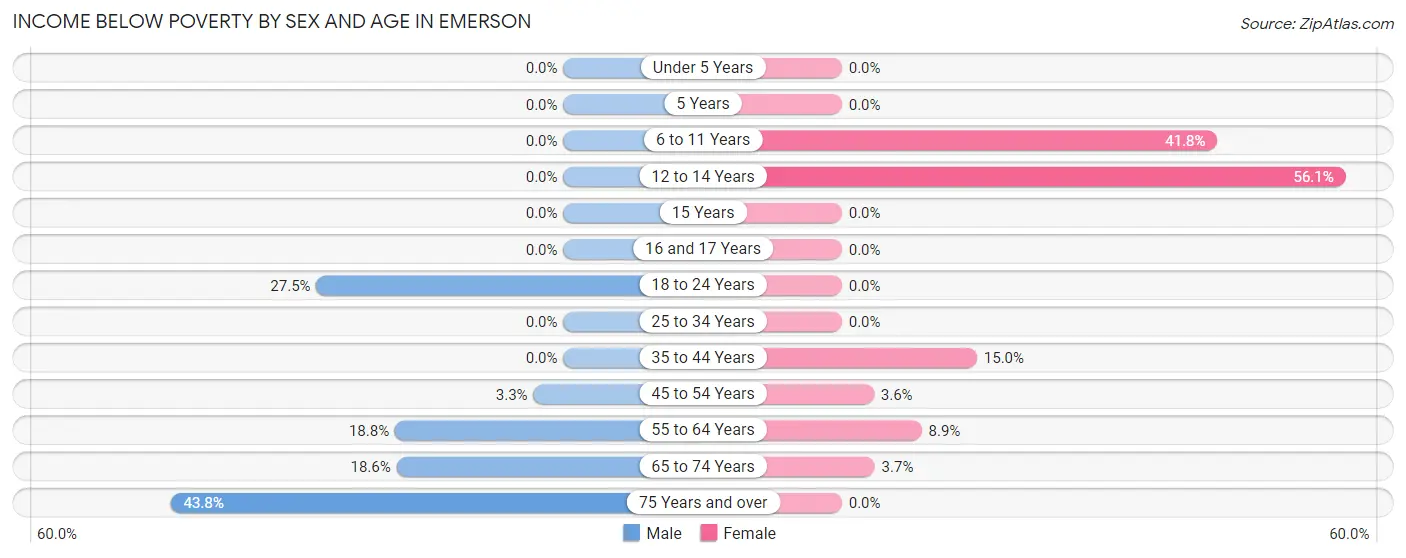
| Age Bracket | Male | Female |
| Under 5 Years | 0 (0.0%) | 0 (0.0%) |
| 5 Years | 0 (0.0%) | 0 (0.0%) |
| 6 to 11 Years | 0 (0.0%) | 23 (41.8%) |
| 12 to 14 Years | 0 (0.0%) | 23 (56.1%) |
| 15 Years | 0 (0.0%) | 0 (0.0%) |
| 16 and 17 Years | 0 (0.0%) | 0 (0.0%) |
| 18 to 24 Years | 22 (27.5%) | 0 (0.0%) |
| 25 to 34 Years | 0 (0.0%) | 0 (0.0%) |
| 35 to 44 Years | 0 (0.0%) | 17 (15.0%) |
| 45 to 54 Years | 4 (3.3%) | 4 (3.6%) |
| 55 to 64 Years | 21 (18.8%) | 8 (8.9%) |
| 65 to 74 Years | 21 (18.6%) | 3 (3.7%) |
| 75 Years and over | 14 (43.8%) | 0 (0.0%) |
| Total | 82 (10.2%) | 78 (10.0%) |
Income Above Poverty by Sex and Age in Emerson
According to the poverty statistics in Emerson, males aged under 5 years and females aged under 5 years are the age groups that are most secure financially, with 100.0% of males and 100.0% of females in these age groups living above the poverty line.
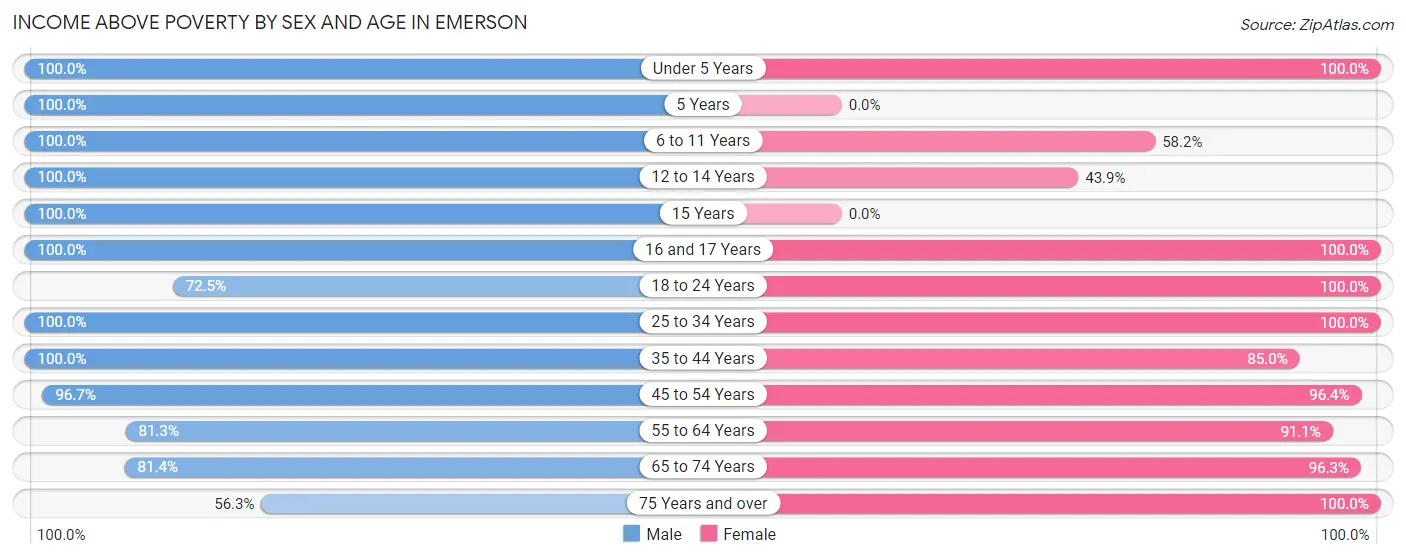
| Age Bracket | Male | Female |
| Under 5 Years | 56 (100.0%) | 40 (100.0%) |
| 5 Years | 13 (100.0%) | 0 (0.0%) |
| 6 to 11 Years | 59 (100.0%) | 32 (58.2%) |
| 12 to 14 Years | 59 (100.0%) | 18 (43.9%) |
| 15 Years | 5 (100.0%) | 0 (0.0%) |
| 16 and 17 Years | 15 (100.0%) | 11 (100.0%) |
| 18 to 24 Years | 58 (72.5%) | 88 (100.0%) |
| 25 to 34 Years | 82 (100.0%) | 112 (100.0%) |
| 35 to 44 Years | 57 (100.0%) | 96 (85.0%) |
| 45 to 54 Years | 116 (96.7%) | 108 (96.4%) |
| 55 to 64 Years | 91 (81.2%) | 82 (91.1%) |
| 65 to 74 Years | 92 (81.4%) | 79 (96.3%) |
| 75 Years and over | 18 (56.2%) | 39 (100.0%) |
| Total | 721 (89.8%) | 705 (90.0%) |
Income Below Poverty Among Married-Couple Families in Emerson
The poverty statistics for married-couple families in Emerson show that 3.4% or 11 of the total 326 families live below the poverty line. Families with no children have the highest poverty rate of 5.4%, comprising of 11 families. On the other hand, families with 1 or 2 children have the lowest poverty rate of 0.0%, which includes 0 families.
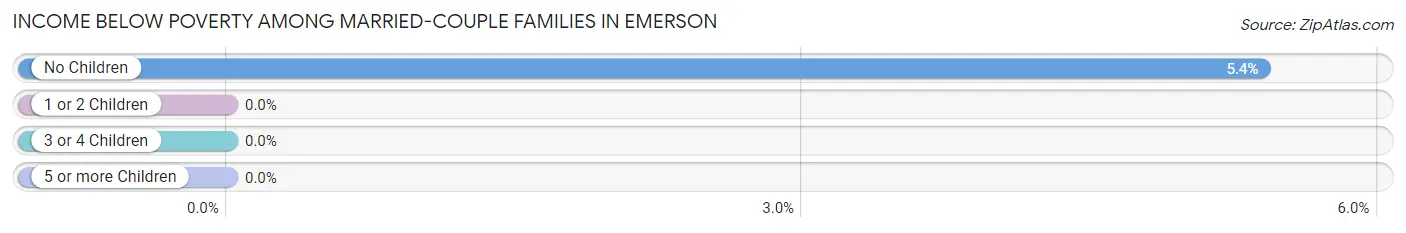
| Children | Above Poverty | Below Poverty |
| No Children | 193 (94.6%) | 11 (5.4%) |
| 1 or 2 Children | 117 (100.0%) | 0 (0.0%) |
| 3 or 4 Children | 5 (100.0%) | 0 (0.0%) |
| 5 or more Children | 0 (0.0%) | 0 (0.0%) |
| Total | 315 (96.6%) | 11 (3.4%) |
Income Below Poverty Among Single-Parent Households in Emerson
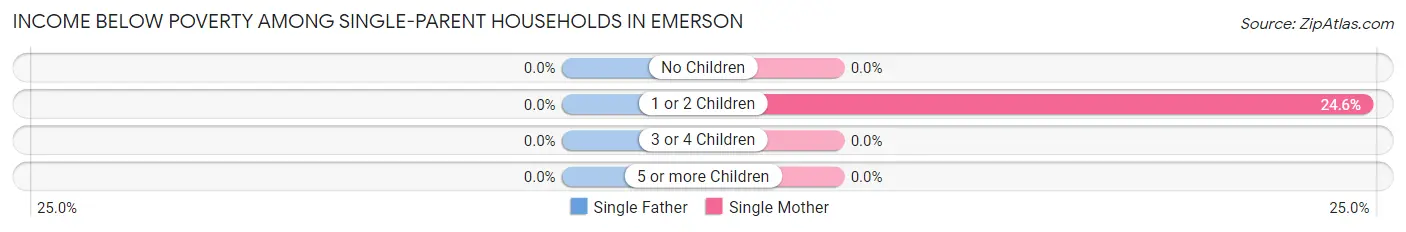
| Children | Single Father | Single Mother |
| No Children | 0 (0.0%) | 0 (0.0%) |
| 1 or 2 Children | 0 (0.0%) | 17 (24.6%) |
| 3 or 4 Children | 0 (0.0%) | 0 (0.0%) |
| 5 or more Children | 0 (0.0%) | 0 (0.0%) |
| Total | 0 (0.0%) | 17 (20.0%) |
Income Below Poverty Among Married-Couple vs Single-Parent Households in Emerson
The poverty data for Emerson shows that 11 of the married-couple family households (3.4%) and 17 of the single-parent households (17.7%) are living below the poverty level. Within the married-couple family households, those with no children have the highest poverty rate, with 11 households (5.4%) falling below the poverty line. Among the single-parent households, those with 1 or 2 children have the highest poverty rate, with 17 household (24.6%) living below poverty.
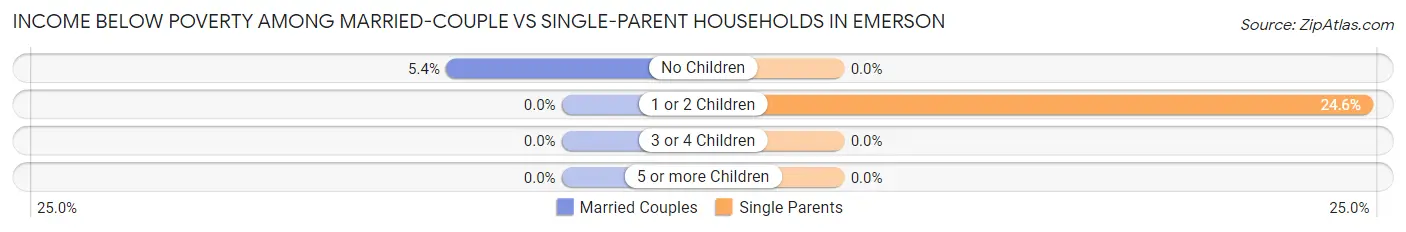
| Children | Married-Couple Families | Single-Parent Households |
| No Children | 11 (5.4%) | 0 (0.0%) |
| 1 or 2 Children | 0 (0.0%) | 17 (24.6%) |
| 3 or 4 Children | 0 (0.0%) | 0 (0.0%) |
| 5 or more Children | 0 (0.0%) | 0 (0.0%) |
| Total | 11 (3.4%) | 17 (17.7%) |
Race in Emerson
The most populous races in Emerson are White / Caucasian (1,289 | 80.9%), Black / African American (195 | 12.2%), and Hispanic or Latino (146 | 9.2%).
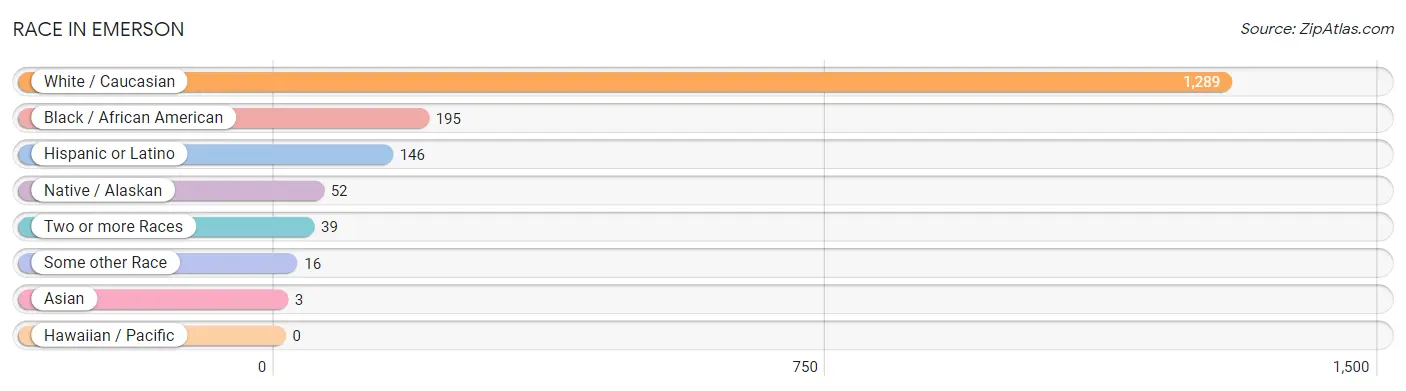
| Race | # Population | % Population |
| Asian | 3 | 0.2% |
| Black / African American | 195 | 12.2% |
| Hawaiian / Pacific | 0 | 0.0% |
| Hispanic or Latino | 146 | 9.2% |
| Native / Alaskan | 52 | 3.3% |
| White / Caucasian | 1,289 | 80.9% |
| Two or more Races | 39 | 2.5% |
| Some other Race | 16 | 1.0% |
| Total | 1,594 | 100.0% |
Ancestry in Emerson
The most populous ancestries reported in Emerson are American (207 | 13.0%), German (189 | 11.9%), English (178 | 11.2%), Irish (161 | 10.1%), and Central American (100 | 6.3%), together accounting for 52.4% of all Emerson residents.
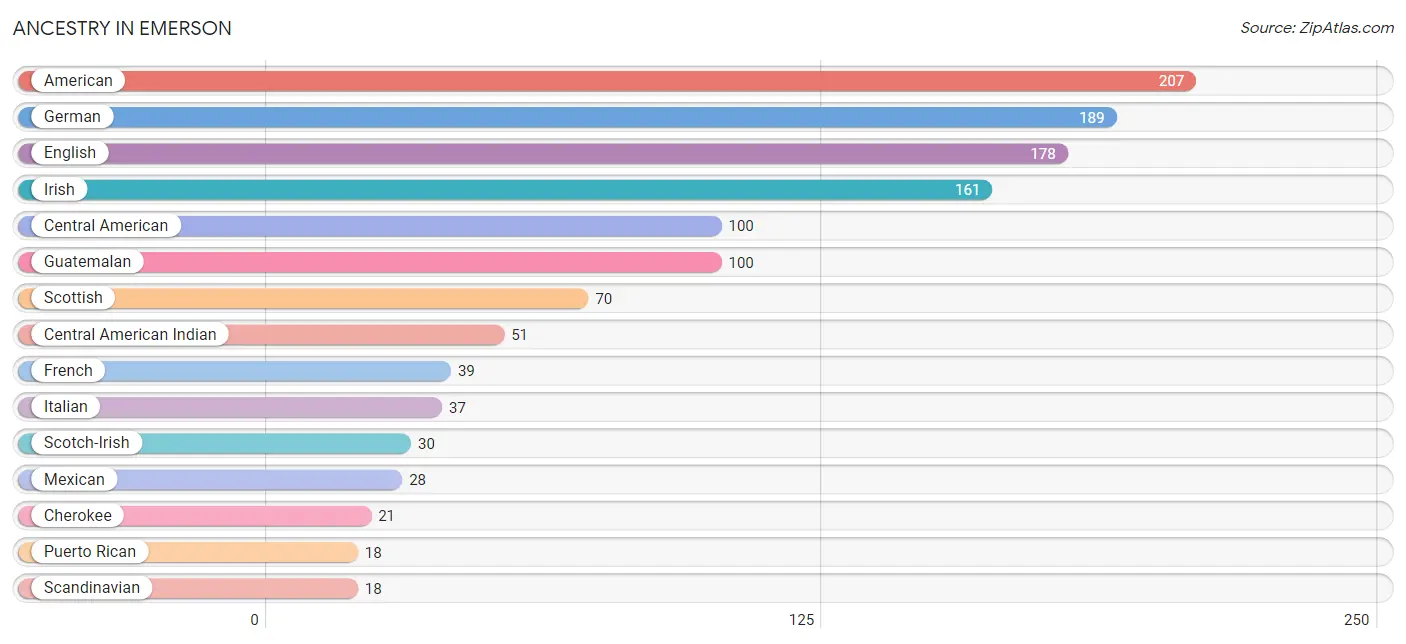
| Ancestry | # Population | % Population |
| American | 207 | 13.0% |
| British | 15 | 0.9% |
| Central American | 100 | 6.3% |
| Central American Indian | 51 | 3.2% |
| Cherokee | 21 | 1.3% |
| Danish | 7 | 0.4% |
| Dutch | 3 | 0.2% |
| English | 178 | 11.2% |
| European | 8 | 0.5% |
| French | 39 | 2.5% |
| French Canadian | 3 | 0.2% |
| German | 189 | 11.9% |
| Guatemalan | 100 | 6.3% |
| Irish | 161 | 10.1% |
| Iroquois | 1 | 0.1% |
| Italian | 37 | 2.3% |
| Korean | 6 | 0.4% |
| Mexican | 28 | 1.8% |
| Norwegian | 3 | 0.2% |
| Puerto Rican | 18 | 1.1% |
| Russian | 6 | 0.4% |
| Scandinavian | 18 | 1.1% |
| Scotch-Irish | 30 | 1.9% |
| Scottish | 70 | 4.4% |
| Swedish | 9 | 0.6% |
| Swiss | 3 | 0.2% | View All 26 Rows |
Immigrants in Emerson
The most numerous immigrant groups reported in Emerson came from Central America (65 | 4.1%), Latin America (65 | 4.1%), Guatemala (40 | 2.5%), Mexico (21 | 1.3%), and El Salvador (4 | 0.3%), together accounting for 12.2% of all Emerson residents.
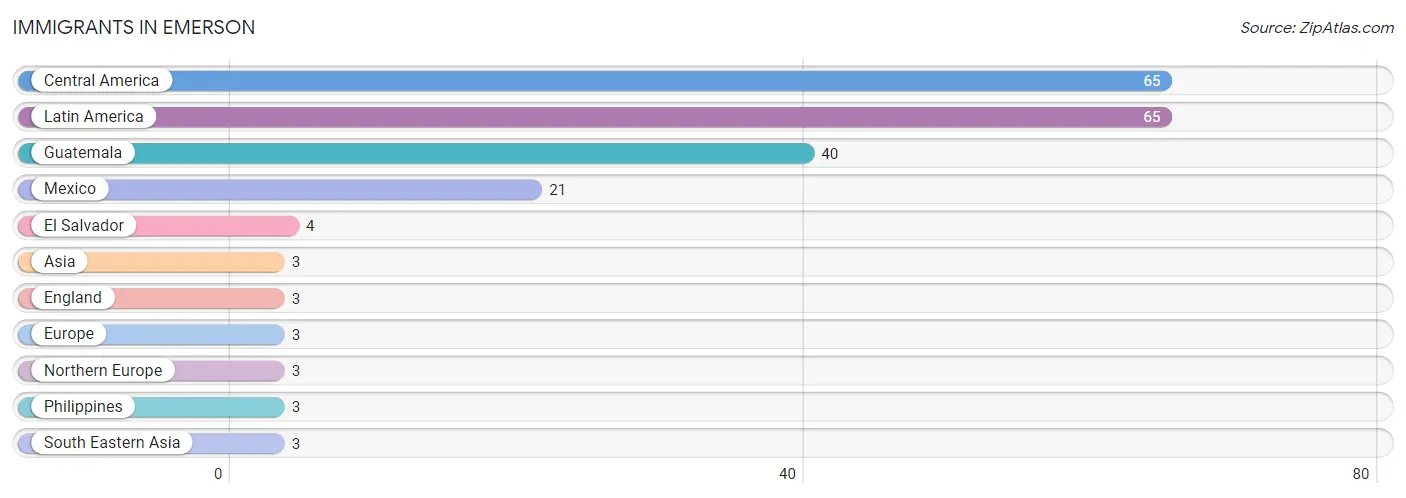
| Immigration Origin | # Population | % Population |
| Asia | 3 | 0.2% |
| Central America | 65 | 4.1% |
| El Salvador | 4 | 0.3% |
| England | 3 | 0.2% |
| Europe | 3 | 0.2% |
| Guatemala | 40 | 2.5% |
| Latin America | 65 | 4.1% |
| Mexico | 21 | 1.3% |
| Northern Europe | 3 | 0.2% |
| Philippines | 3 | 0.2% |
| South Eastern Asia | 3 | 0.2% | View All 11 Rows |
Sex and Age in Emerson
Sex and Age in Emerson
The most populous age groups in Emerson are 10 to 14 Years (90 | 11.1%) for men and 20 to 24 Years (84 | 10.7%) for women.
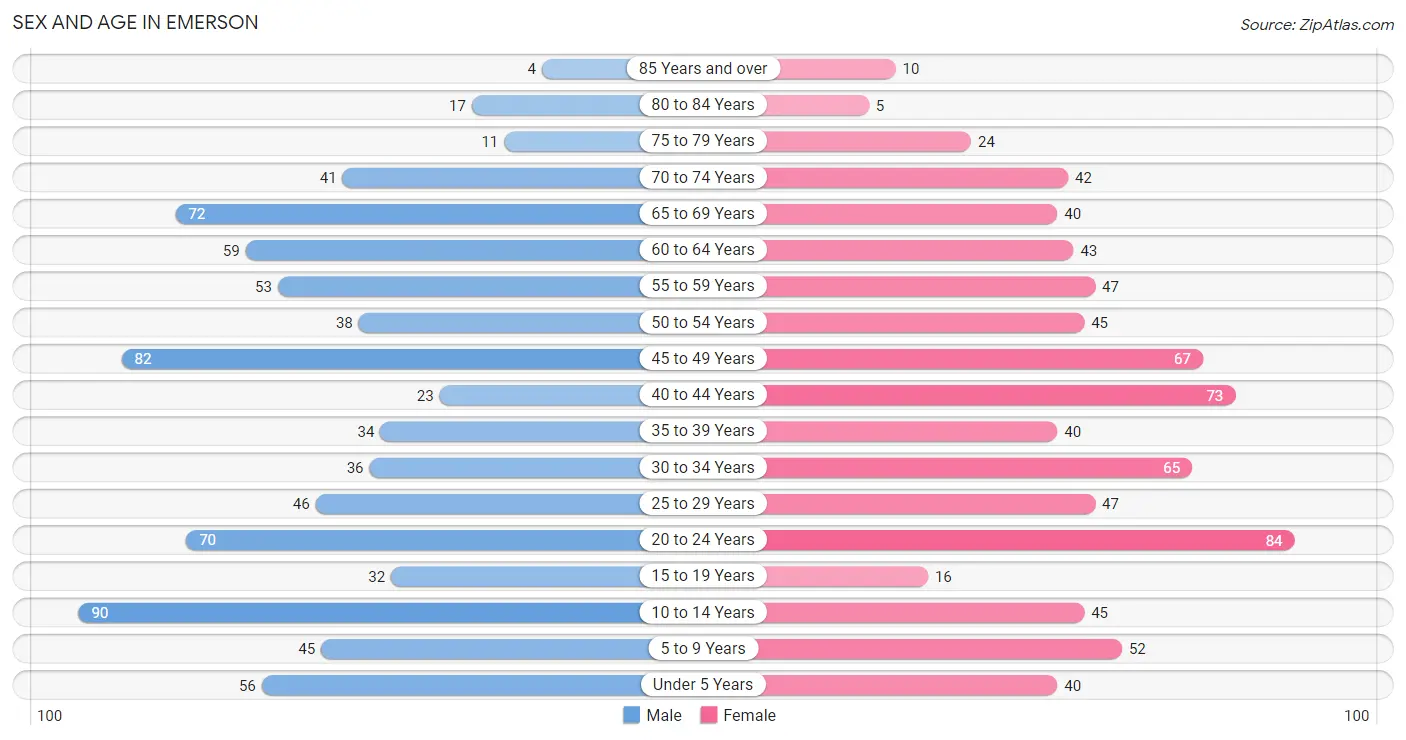
| Age Bracket | Male | Female |
| Under 5 Years | 56 (6.9%) | 40 (5.1%) |
| 5 to 9 Years | 45 (5.6%) | 52 (6.6%) |
| 10 to 14 Years | 90 (11.1%) | 45 (5.7%) |
| 15 to 19 Years | 32 (4.0%) | 16 (2.0%) |
| 20 to 24 Years | 70 (8.6%) | 84 (10.7%) |
| 25 to 29 Years | 46 (5.7%) | 47 (6.0%) |
| 30 to 34 Years | 36 (4.4%) | 65 (8.3%) |
| 35 to 39 Years | 34 (4.2%) | 40 (5.1%) |
| 40 to 44 Years | 23 (2.8%) | 73 (9.3%) |
| 45 to 49 Years | 82 (10.1%) | 67 (8.5%) |
| 50 to 54 Years | 38 (4.7%) | 45 (5.7%) |
| 55 to 59 Years | 53 (6.6%) | 47 (6.0%) |
| 60 to 64 Years | 59 (7.3%) | 43 (5.5%) |
| 65 to 69 Years | 72 (8.9%) | 40 (5.1%) |
| 70 to 74 Years | 41 (5.1%) | 42 (5.3%) |
| 75 to 79 Years | 11 (1.4%) | 24 (3.1%) |
| 80 to 84 Years | 17 (2.1%) | 5 (0.6%) |
| 85 Years and over | 4 (0.5%) | 10 (1.3%) |
| Total | 809 (100.0%) | 785 (100.0%) |
Families and Households in Emerson
Median Family Size in Emerson
The median family size in Emerson is 3.19 persons per family, with single female/mother families (85 | 20.1%) accounting for the largest median family size of 4.09 persons per family. On the other hand, single male/father families (11 | 2.6%) represent the smallest median family size with 2.73 persons per family.
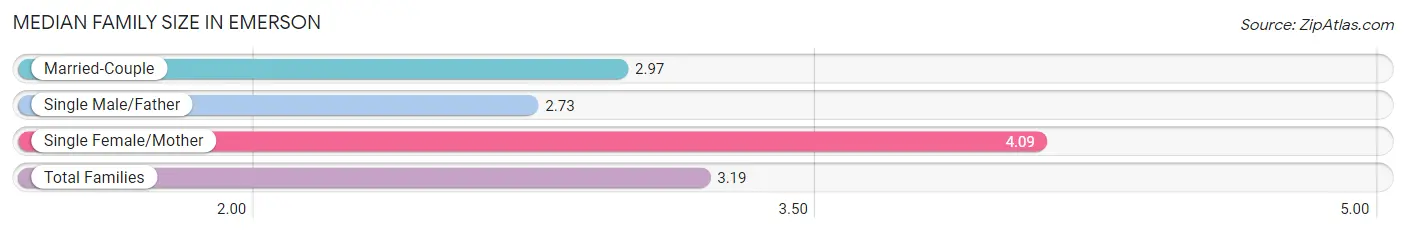
| Family Type | # Families | Family Size |
| Married-Couple | 326 (77.2%) | 2.97 |
| Single Male/Father | 11 (2.6%) | 2.73 |
| Single Female/Mother | 85 (20.1%) | 4.09 |
| Total Families | 422 (100.0%) | 3.19 |
Median Household Size in Emerson
The median household size in Emerson is 2.60 persons per household, with single female/mother households (85 | 13.9%) accounting for the largest median household size of 4.28 persons per household. non-family households (188 | 30.8%) represent the smallest median household size with 1.07 persons per household.
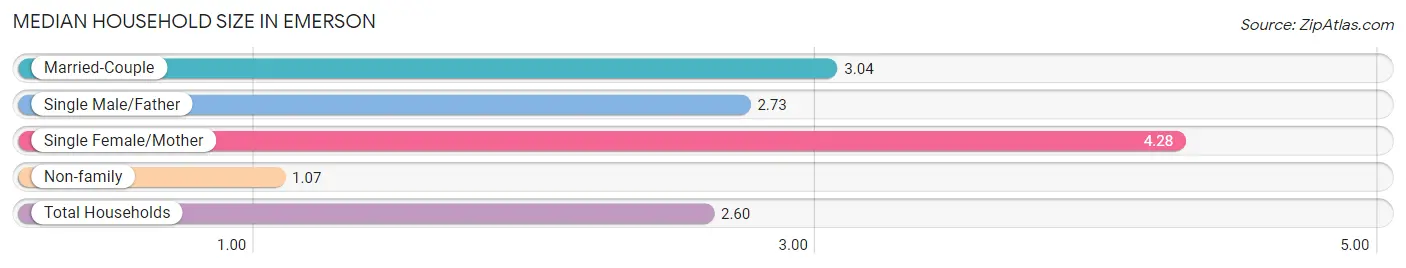
| Household Type | # Households | Household Size |
| Married-Couple | 326 (53.4%) | 3.04 |
| Single Male/Father | 11 (1.8%) | 2.73 |
| Single Female/Mother | 85 (13.9%) | 4.28 |
| Non-family | 188 (30.8%) | 1.07 |
| Total Households | 610 (100.0%) | 2.60 |
Household Size by Marriage Status in Emerson
Out of a total of 610 households in Emerson, 422 (69.2%) are family households, while 188 (30.8%) are nonfamily households. The most numerous type of family households are 2-person households, comprising 186, and the most common type of nonfamily households are 1-person households, comprising 176.
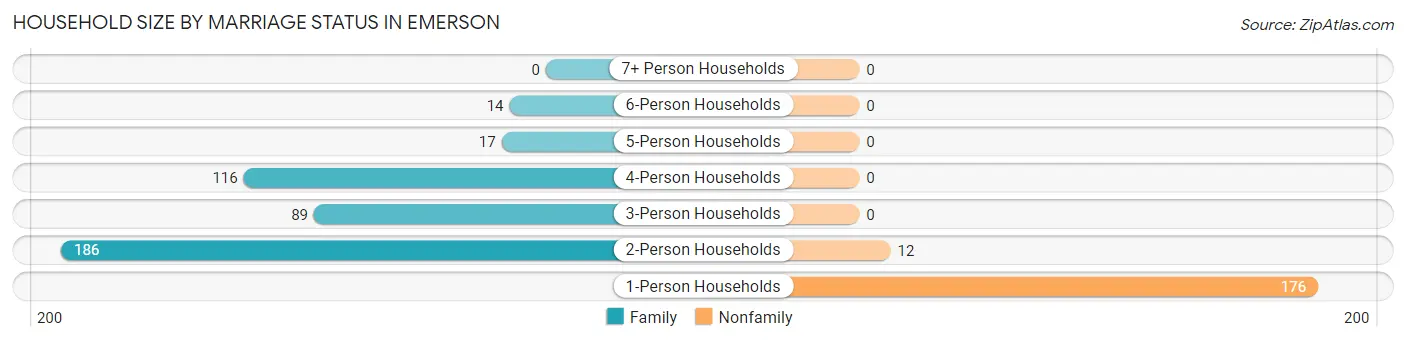
| Household Size | Family Households | Nonfamily Households |
| 1-Person Households | - | 176 (28.8%) |
| 2-Person Households | 186 (30.5%) | 12 (2.0%) |
| 3-Person Households | 89 (14.6%) | 0 (0.0%) |
| 4-Person Households | 116 (19.0%) | 0 (0.0%) |
| 5-Person Households | 17 (2.8%) | 0 (0.0%) |
| 6-Person Households | 14 (2.3%) | 0 (0.0%) |
| 7+ Person Households | 0 (0.0%) | 0 (0.0%) |
| Total | 422 (69.2%) | 188 (30.8%) |
Female Fertility in Emerson
Fertility by Age in Emerson
Average fertility rate in Emerson is 97.0 births per 1,000 women. Women in the age bracket of 20 to 34 years have the highest fertility rate with 194.0 births per 1,000 women. Women in the age bracket of 20 to 34 years acount for 100.0% of all women with births.
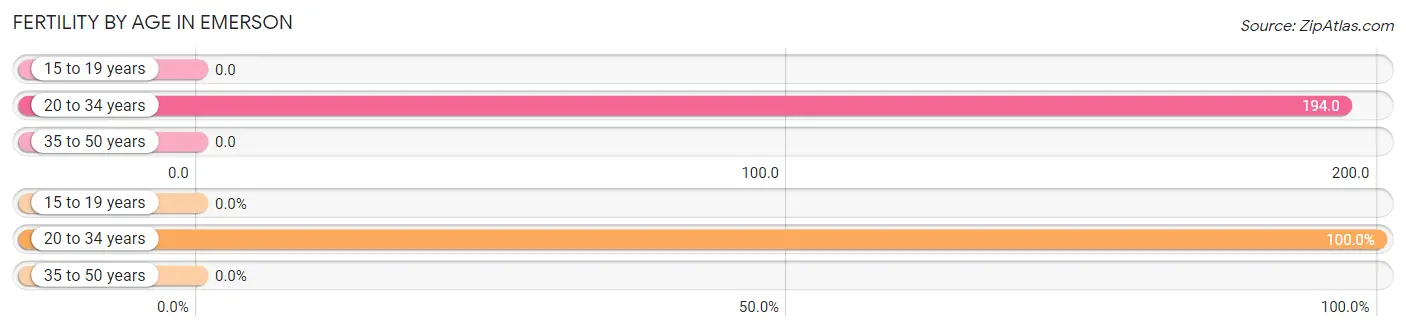
| Age Bracket | Women with Births | Births / 1,000 Women |
| 15 to 19 years | 0 (0.0%) | 0.0 |
| 20 to 34 years | 38 (100.0%) | 194.0 |
| 35 to 50 years | 0 (0.0%) | 0.0 |
| Total | 38 (100.0%) | 97.0 |
Fertility by Age by Marriage Status in Emerson
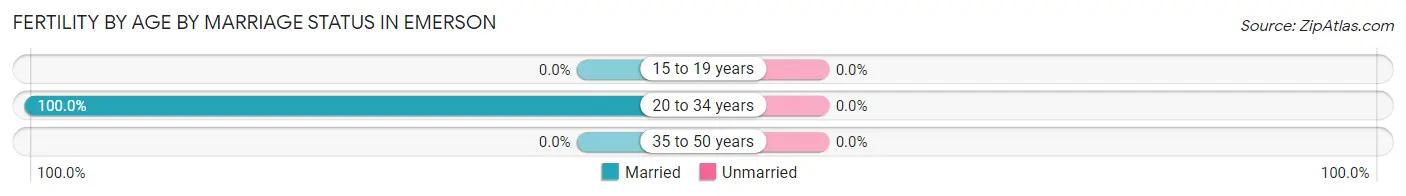
| Age Bracket | Married | Unmarried |
| 15 to 19 years | 0 (0.0%) | 0 (0.0%) |
| 20 to 34 years | 38 (100.0%) | 0 (0.0%) |
| 35 to 50 years | 0 (0.0%) | 0 (0.0%) |
| Total | 38 (100.0%) | 0 (0.0%) |
Fertility by Education in Emerson
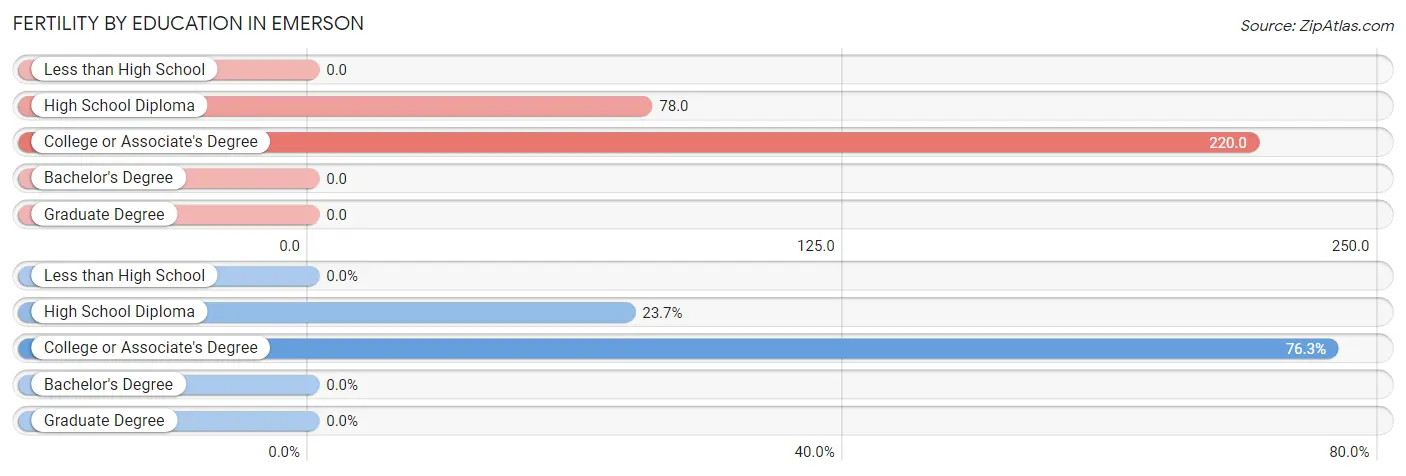
| Educational Attainment | Women with Births | Births / 1,000 Women |
| Less than High School | 0 (0.0%) | 0.0 |
| High School Diploma | 9 (23.7%) | 78.0 |
| College or Associate's Degree | 29 (76.3%) | 220.0 |
| Bachelor's Degree | 0 (0.0%) | 0.0 |
| Graduate Degree | 0 (0.0%) | 0.0 |
| Total | 38 (100.0%) | 97.0 |
Fertility by Education by Marriage Status in Emerson
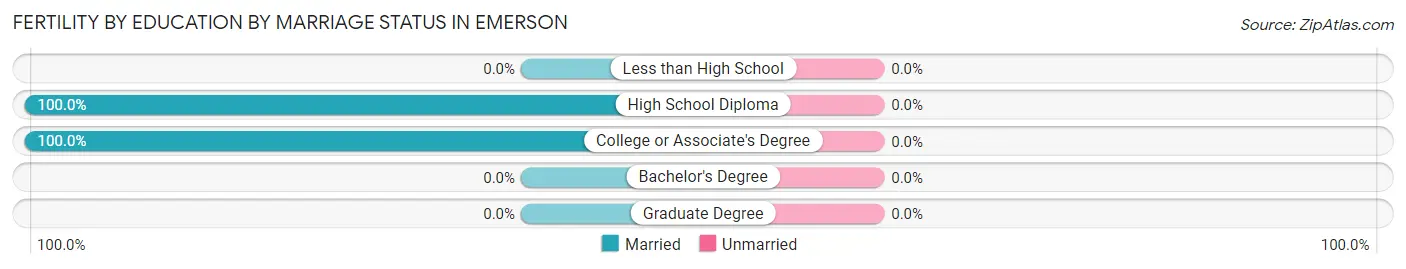
| Educational Attainment | Married | Unmarried |
| Less than High School | 0 (0.0%) | 0 (0.0%) |
| High School Diploma | 9 (100.0%) | 0 (0.0%) |
| College or Associate's Degree | 29 (100.0%) | 0 (0.0%) |
| Bachelor's Degree | 0 (0.0%) | 0 (0.0%) |
| Graduate Degree | 0 (0.0%) | 0 (0.0%) |
| Total | 38 (100.0%) | 0 (0.0%) |
Employment Characteristics in Emerson
Employment by Class of Employer in Emerson
Among the 744 employed individuals in Emerson, private company employees (531 | 71.4%), self-employed (not incorporated) (65 | 8.7%), and not-for-profit organizations (48 | 6.5%) make up the most common classes of employment.
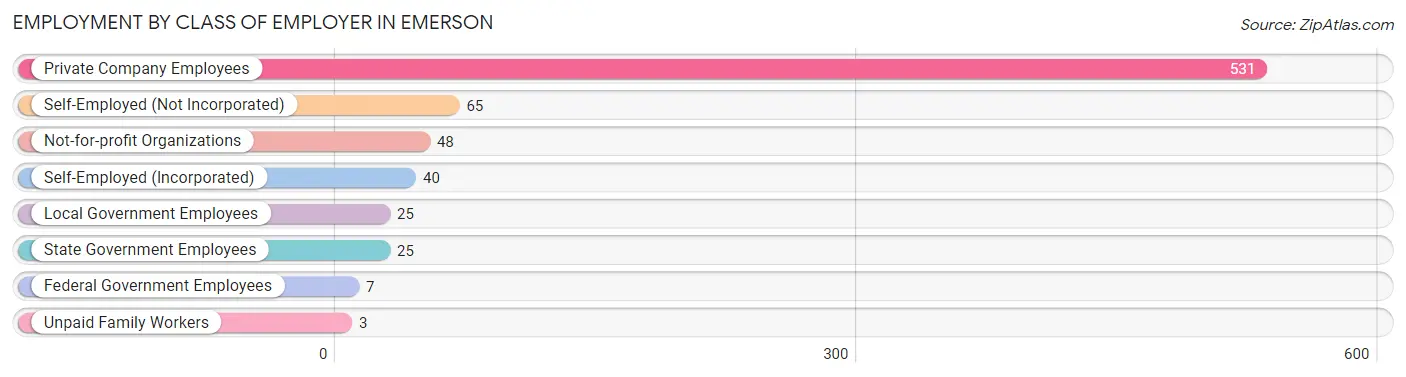
| Employer Class | # Employees | % Employees |
| Private Company Employees | 531 | 71.4% |
| Self-Employed (Incorporated) | 40 | 5.4% |
| Self-Employed (Not Incorporated) | 65 | 8.7% |
| Not-for-profit Organizations | 48 | 6.5% |
| Local Government Employees | 25 | 3.4% |
| State Government Employees | 25 | 3.4% |
| Federal Government Employees | 7 | 0.9% |
| Unpaid Family Workers | 3 | 0.4% |
| Total | 744 | 100.0% |
Employment Status by Age in Emerson
According to the labor force statistics for Emerson, out of the total population over 16 years of age (1,260), 64.7% or 815 individuals are in the labor force, with 6.5% or 53 of them unemployed. The age group with the highest labor force participation rate is 20 to 24 years, with 92.2% or 142 individuals in the labor force. Within the labor force, the 16 to 19 years age range has the highest percentage of unemployed individuals, with 30.8% or 4 of them being unemployed.
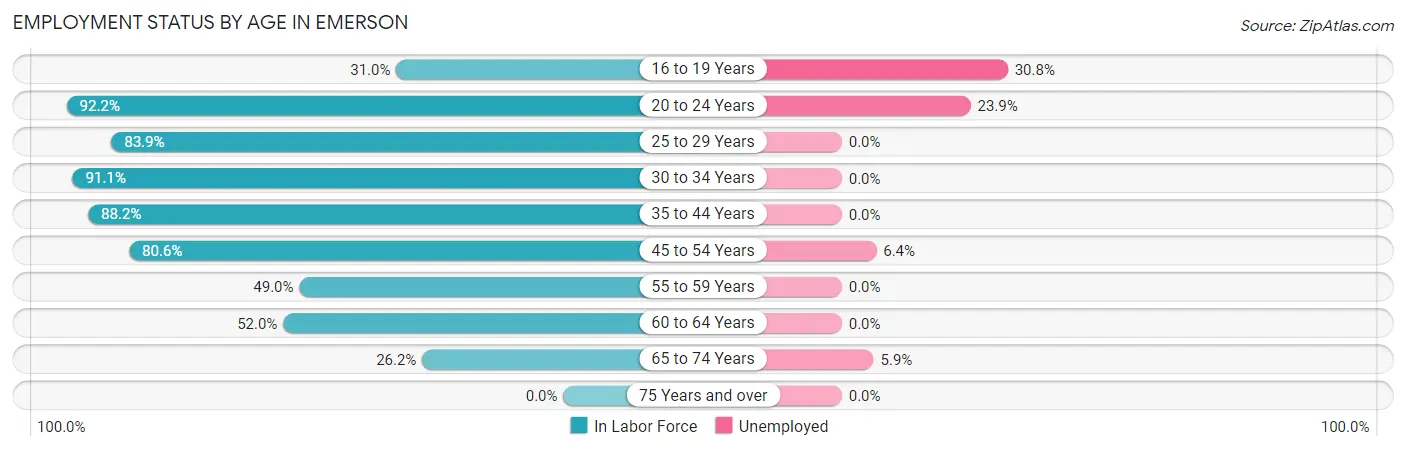
| Age Bracket | In Labor Force | Unemployed |
| 16 to 19 Years | 13 (31.0%) | 4 (30.8%) |
| 20 to 24 Years | 142 (92.2%) | 34 (23.9%) |
| 25 to 29 Years | 78 (83.9%) | 0 (0.0%) |
| 30 to 34 Years | 92 (91.1%) | 0 (0.0%) |
| 35 to 44 Years | 150 (88.2%) | 0 (0.0%) |
| 45 to 54 Years | 187 (80.6%) | 12 (6.4%) |
| 55 to 59 Years | 49 (49.0%) | 0 (0.0%) |
| 60 to 64 Years | 53 (52.0%) | 0 (0.0%) |
| 65 to 74 Years | 51 (26.2%) | 3 (5.9%) |
| 75 Years and over | 0 (0.0%) | 0 (0.0%) |
| Total | 815 (64.7%) | 53 (6.5%) |
Employment Status by Educational Attainment in Emerson
According to labor force statistics for Emerson, 76.3% of individuals (609) out of the total population between 25 and 64 years of age (798) are in the labor force, with 2.0% or 12 of them being unemployed. The group with the highest labor force participation rate are those with the educational attainment of bachelor's degree or higher, with 85.5% or 242 individuals in the labor force. Within the labor force, individuals with less than high school education have the highest percentage of unemployment, with 6.9% or 4 of them being unemployed.
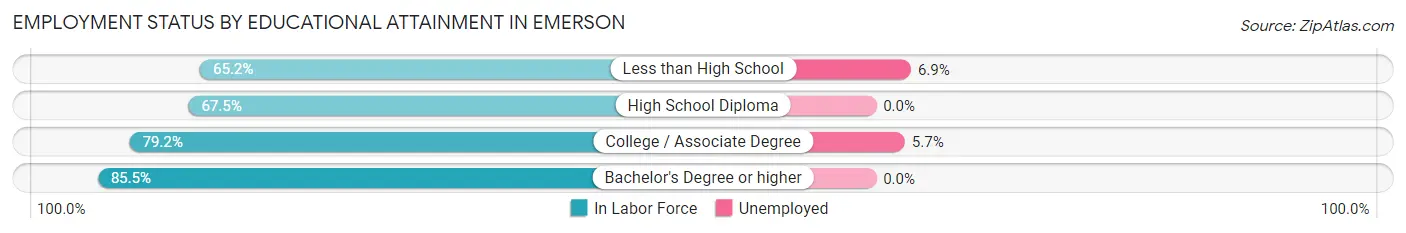
| Educational Attainment | In Labor Force | Unemployed |
| Less than High School | 58 (65.2%) | 6 (6.9%) |
| High School Diploma | 164 (67.5%) | 0 (0.0%) |
| College / Associate Degree | 145 (79.2%) | 10 (5.7%) |
| Bachelor's Degree or higher | 242 (85.5%) | 0 (0.0%) |
| Total | 609 (76.3%) | 16 (2.0%) |
Employment Occupations by Sex in Emerson
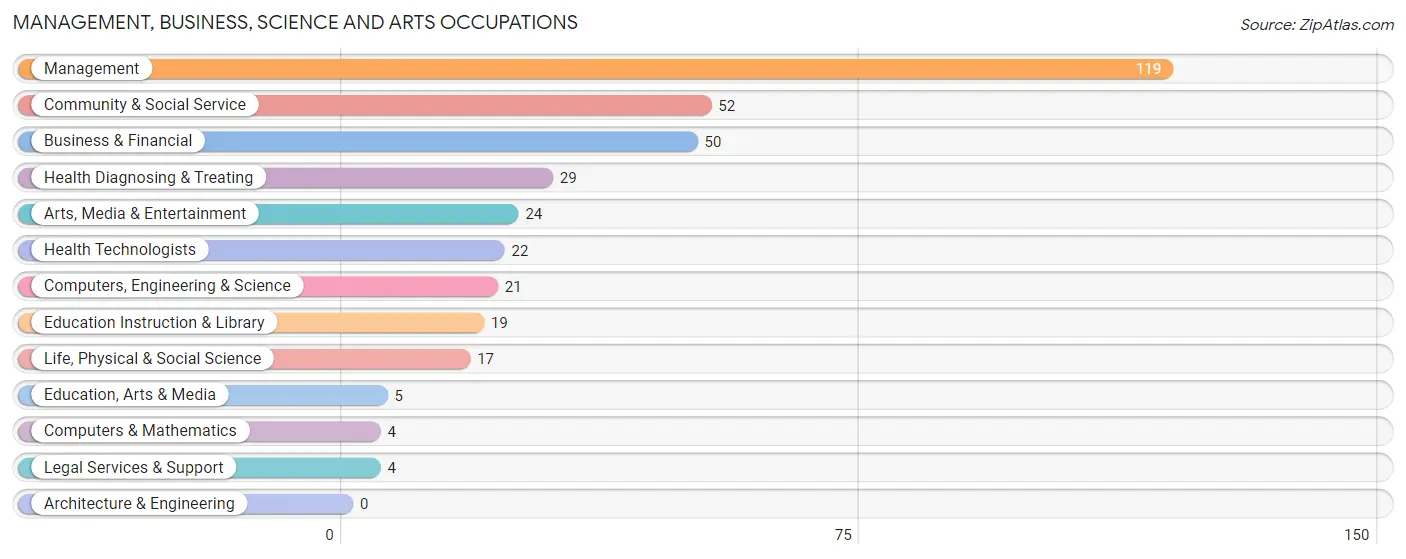
Management, Business, Science and Arts Occupations
The most common Management, Business, Science and Arts occupations in Emerson are Management (119 | 15.7%), Community & Social Service (52 | 6.9%), Business & Financial (50 | 6.6%), Health Diagnosing & Treating (29 | 3.8%), and Arts, Media & Entertainment (24 | 3.2%).
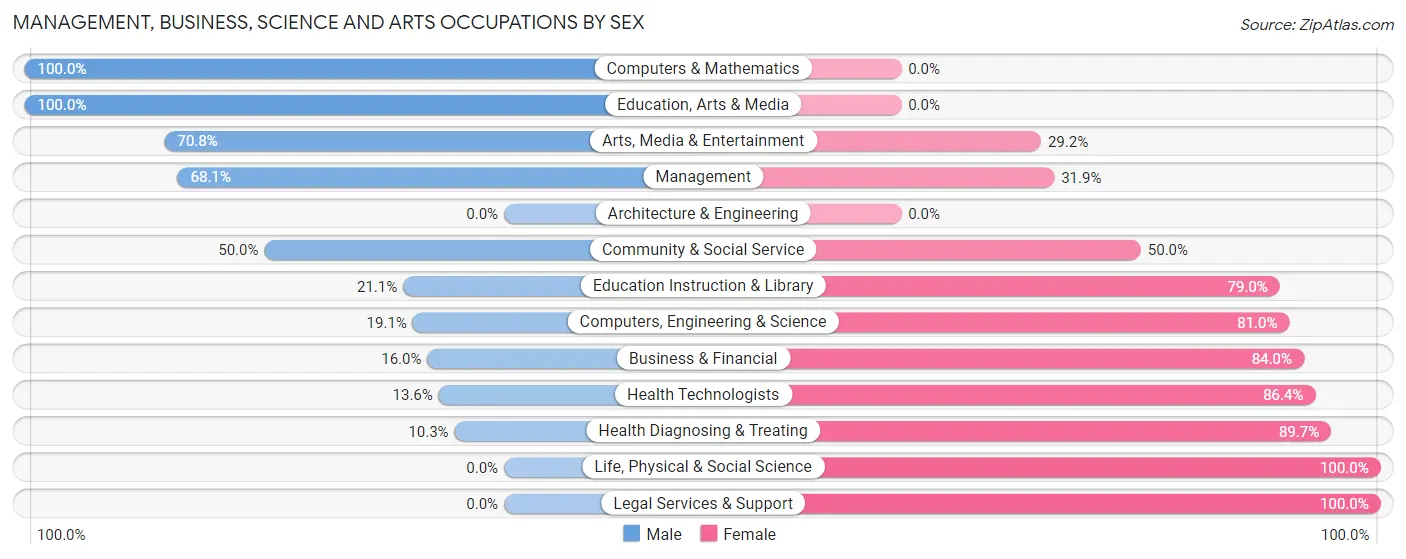
Management, Business, Science and Arts Occupations by Sex
Within the Management, Business, Science and Arts occupations in Emerson, the most male-oriented occupations are Computers & Mathematics (100.0%), Education, Arts & Media (100.0%), and Arts, Media & Entertainment (70.8%), while the most female-oriented occupations are Life, Physical & Social Science (100.0%), Legal Services & Support (100.0%), and Health Diagnosing & Treating (89.7%).
| Occupation | Male | Female |
| Management | 81 (68.1%) | 38 (31.9%) |
| Business & Financial | 8 (16.0%) | 42 (84.0%) |
| Computers, Engineering & Science | 4 (19.1%) | 17 (80.9%) |
| Computers & Mathematics | 4 (100.0%) | 0 (0.0%) |
| Architecture & Engineering | 0 (0.0%) | 0 (0.0%) |
| Life, Physical & Social Science | 0 (0.0%) | 17 (100.0%) |
| Community & Social Service | 26 (50.0%) | 26 (50.0%) |
| Education, Arts & Media | 5 (100.0%) | 0 (0.0%) |
| Legal Services & Support | 0 (0.0%) | 4 (100.0%) |
| Education Instruction & Library | 4 (21.0%) | 15 (78.9%) |
| Arts, Media & Entertainment | 17 (70.8%) | 7 (29.2%) |
| Health Diagnosing & Treating | 3 (10.3%) | 26 (89.7%) |
| Health Technologists | 3 (13.6%) | 19 (86.4%) |
| Total (Category) | 122 (45.0%) | 149 (55.0%) |
| Total (Overall) | 352 (46.5%) | 405 (53.5%) |
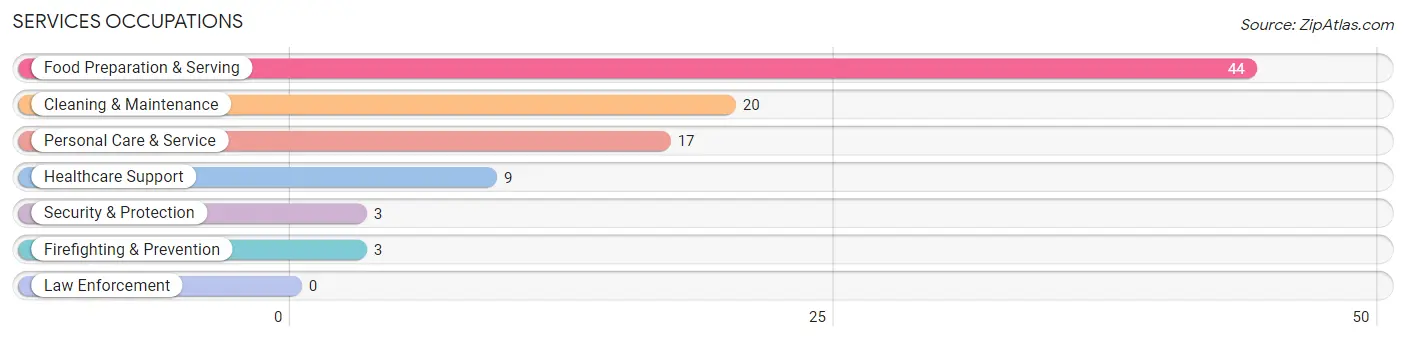
Services Occupations
The most common Services occupations in Emerson are Food Preparation & Serving (44 | 5.8%), Cleaning & Maintenance (20 | 2.6%), Personal Care & Service (17 | 2.2%), Healthcare Support (9 | 1.2%), and Security & Protection (3 | 0.4%).
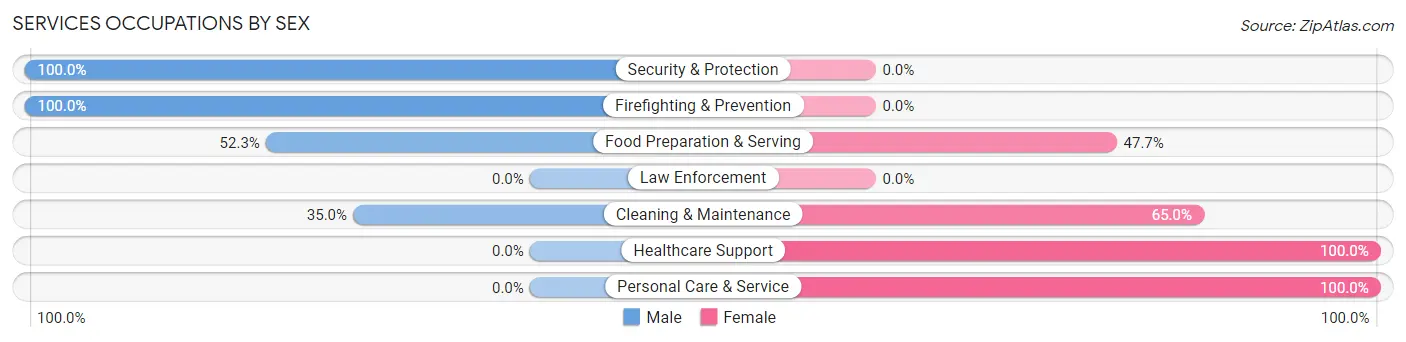
Services Occupations by Sex
Within the Services occupations in Emerson, the most male-oriented occupations are Security & Protection (100.0%), Firefighting & Prevention (100.0%), and Food Preparation & Serving (52.3%), while the most female-oriented occupations are Healthcare Support (100.0%), Personal Care & Service (100.0%), and Cleaning & Maintenance (65.0%).
| Occupation | Male | Female |
| Healthcare Support | 0 (0.0%) | 9 (100.0%) |
| Security & Protection | 3 (100.0%) | 0 (0.0%) |
| Firefighting & Prevention | 3 (100.0%) | 0 (0.0%) |
| Law Enforcement | 0 (0.0%) | 0 (0.0%) |
| Food Preparation & Serving | 23 (52.3%) | 21 (47.7%) |
| Cleaning & Maintenance | 7 (35.0%) | 13 (65.0%) |
| Personal Care & Service | 0 (0.0%) | 17 (100.0%) |
| Total (Category) | 33 (35.5%) | 60 (64.5%) |
| Total (Overall) | 352 (46.5%) | 405 (53.5%) |
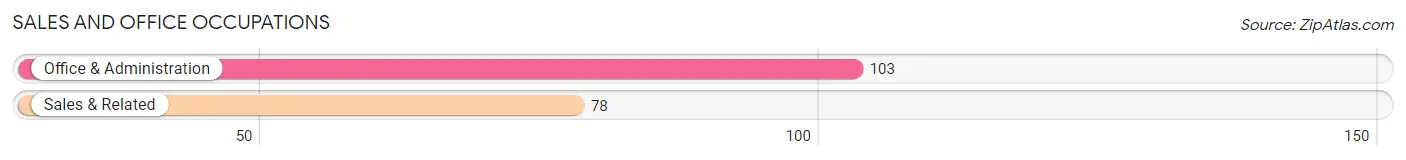
Sales and Office Occupations
The most common Sales and Office occupations in Emerson are Office & Administration (103 | 13.6%), and Sales & Related (78 | 10.3%).
Sales and Office Occupations by Sex
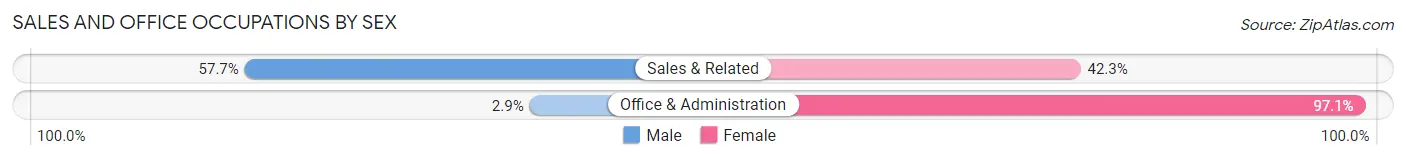
| Occupation | Male | Female |
| Sales & Related | 45 (57.7%) | 33 (42.3%) |
| Office & Administration | 3 (2.9%) | 100 (97.1%) |
| Total (Category) | 48 (26.5%) | 133 (73.5%) |
| Total (Overall) | 352 (46.5%) | 405 (53.5%) |
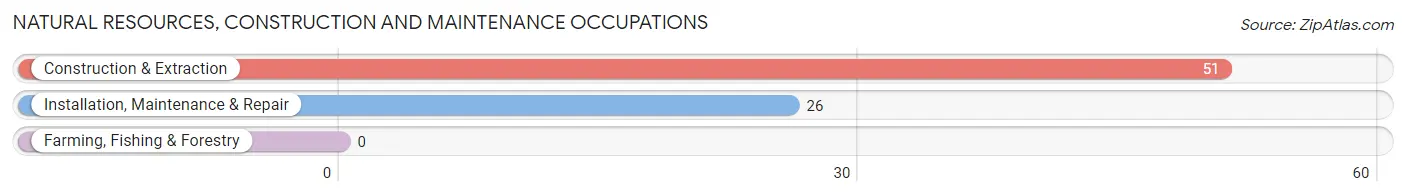
Natural Resources, Construction and Maintenance Occupations
The most common Natural Resources, Construction and Maintenance occupations in Emerson are Construction & Extraction (51 | 6.7%), and Installation, Maintenance & Repair (26 | 3.4%).
Natural Resources, Construction and Maintenance Occupations by Sex
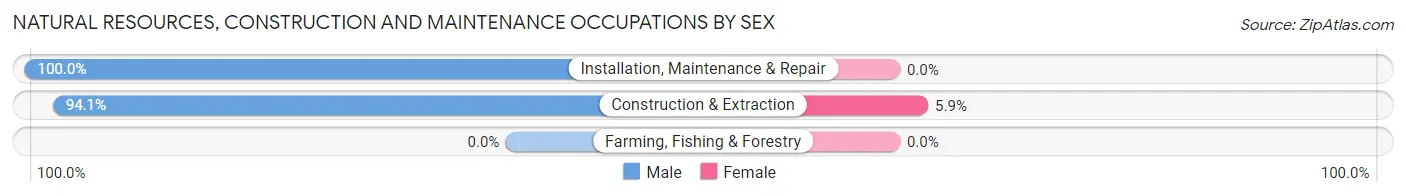
| Occupation | Male | Female |
| Farming, Fishing & Forestry | 0 (0.0%) | 0 (0.0%) |
| Construction & Extraction | 48 (94.1%) | 3 (5.9%) |
| Installation, Maintenance & Repair | 26 (100.0%) | 0 (0.0%) |
| Total (Category) | 74 (96.1%) | 3 (3.9%) |
| Total (Overall) | 352 (46.5%) | 405 (53.5%) |
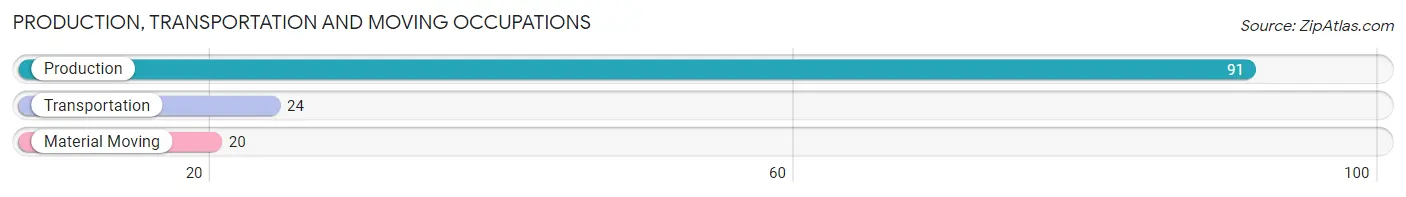
Production, Transportation and Moving Occupations
The most common Production, Transportation and Moving occupations in Emerson are Production (91 | 12.0%), Transportation (24 | 3.2%), and Material Moving (20 | 2.6%).
Production, Transportation and Moving Occupations by Sex
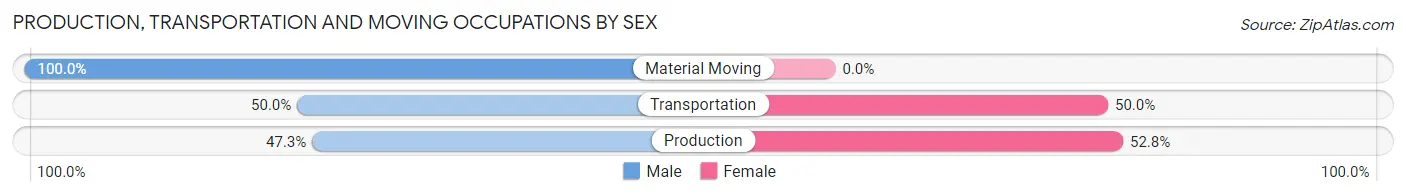
| Occupation | Male | Female |
| Production | 43 (47.2%) | 48 (52.7%) |
| Transportation | 12 (50.0%) | 12 (50.0%) |
| Material Moving | 20 (100.0%) | 0 (0.0%) |
| Total (Category) | 75 (55.6%) | 60 (44.4%) |
| Total (Overall) | 352 (46.5%) | 405 (53.5%) |
Employment Industries by Sex in Emerson
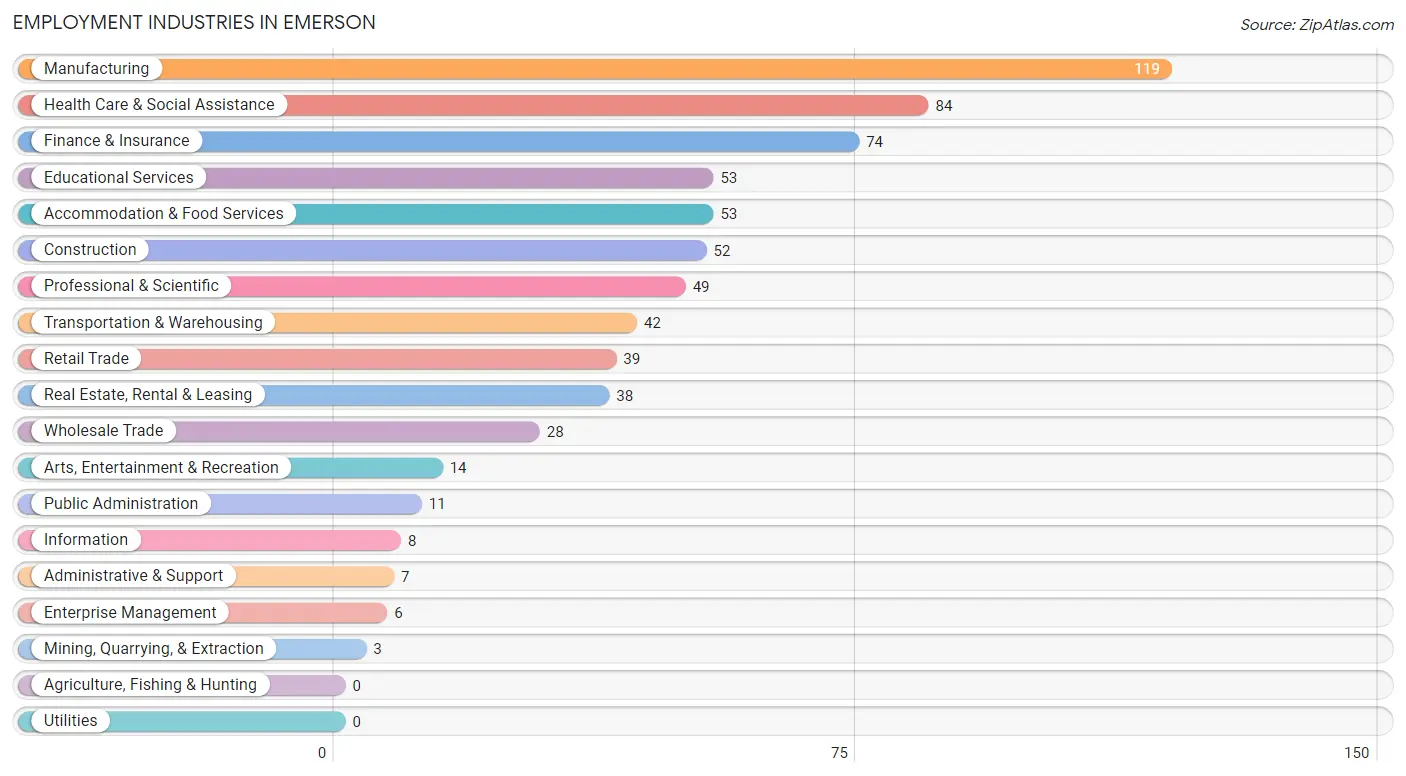
Employment Industries in Emerson
The major employment industries in Emerson include Manufacturing (119 | 15.7%), Health Care & Social Assistance (84 | 11.1%), Finance & Insurance (74 | 9.8%), Educational Services (53 | 7.0%), and Accommodation & Food Services (53 | 7.0%).
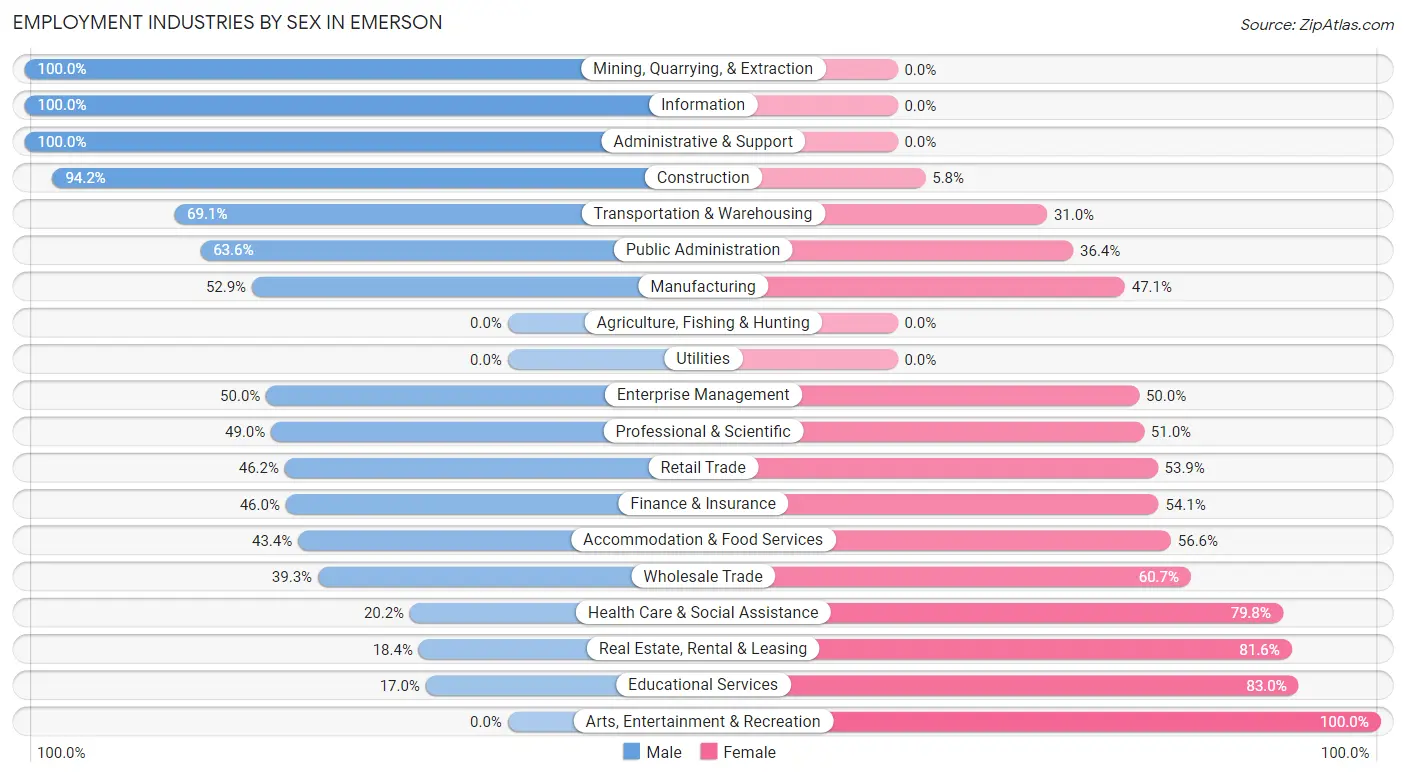
Employment Industries by Sex in Emerson
The Emerson industries that see more men than women are Mining, Quarrying, & Extraction (100.0%), Information (100.0%), and Administrative & Support (100.0%), whereas the industries that tend to have a higher number of women are Arts, Entertainment & Recreation (100.0%), Educational Services (83.0%), and Real Estate, Rental & Leasing (81.6%).
| Industry | Male | Female |
| Agriculture, Fishing & Hunting | 0 (0.0%) | 0 (0.0%) |
| Mining, Quarrying, & Extraction | 3 (100.0%) | 0 (0.0%) |
| Construction | 49 (94.2%) | 3 (5.8%) |
| Manufacturing | 63 (52.9%) | 56 (47.1%) |
| Wholesale Trade | 11 (39.3%) | 17 (60.7%) |
| Retail Trade | 18 (46.2%) | 21 (53.8%) |
| Transportation & Warehousing | 29 (69.1%) | 13 (30.9%) |
| Utilities | 0 (0.0%) | 0 (0.0%) |
| Information | 8 (100.0%) | 0 (0.0%) |
| Finance & Insurance | 34 (46.0%) | 40 (54.0%) |
| Real Estate, Rental & Leasing | 7 (18.4%) | 31 (81.6%) |
| Professional & Scientific | 24 (49.0%) | 25 (51.0%) |
| Enterprise Management | 3 (50.0%) | 3 (50.0%) |
| Administrative & Support | 7 (100.0%) | 0 (0.0%) |
| Educational Services | 9 (17.0%) | 44 (83.0%) |
| Health Care & Social Assistance | 17 (20.2%) | 67 (79.8%) |
| Arts, Entertainment & Recreation | 0 (0.0%) | 14 (100.0%) |
| Accommodation & Food Services | 23 (43.4%) | 30 (56.6%) |
| Public Administration | 7 (63.6%) | 4 (36.4%) |
| Total | 352 (46.5%) | 405 (53.5%) |
Education in Emerson
School Enrollment in Emerson
The most common levels of schooling among the 340 students in Emerson are middle school (113 | 33.2%), elementary school (79 | 23.2%), and high school (69 | 20.3%).
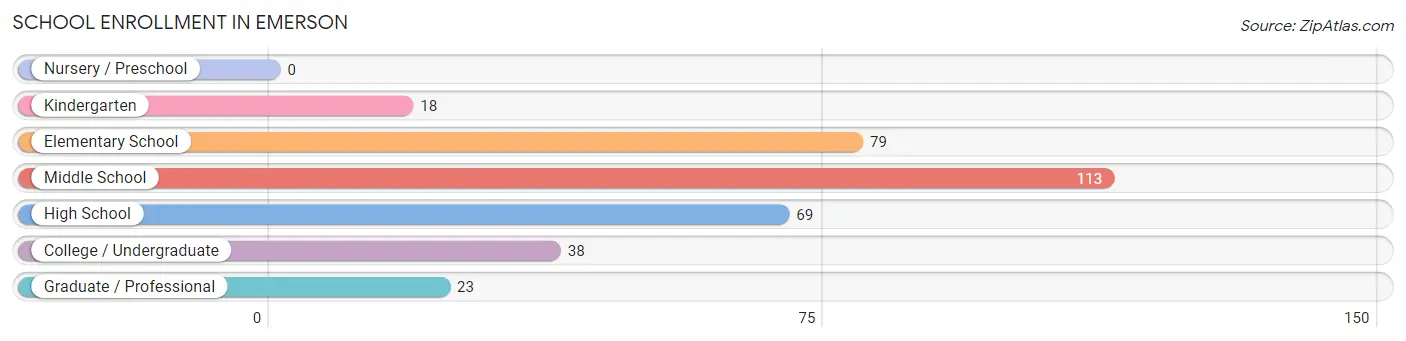
| School Level | # Students | % Students |
| Nursery / Preschool | 0 | 0.0% |
| Kindergarten | 18 | 5.3% |
| Elementary School | 79 | 23.2% |
| Middle School | 113 | 33.2% |
| High School | 69 | 20.3% |
| College / Undergraduate | 38 | 11.2% |
| Graduate / Professional | 23 | 6.8% |
| Total | 340 | 100.0% |
School Enrollment by Age by Funding Source in Emerson
Out of a total of 340 students who are enrolled in schools in Emerson, 9 (2.6%) attend a private institution, while the remaining 331 (97.4%) are enrolled in public schools. The age group of 35 years and over has the highest likelihood of being enrolled in private schools, with 3 (11.5% in the age bracket) enrolled. Conversely, the age group of 10 to 14 year olds has the lowest likelihood of being enrolled in a private school, with 135 (100.0% in the age bracket) attending a public institution.
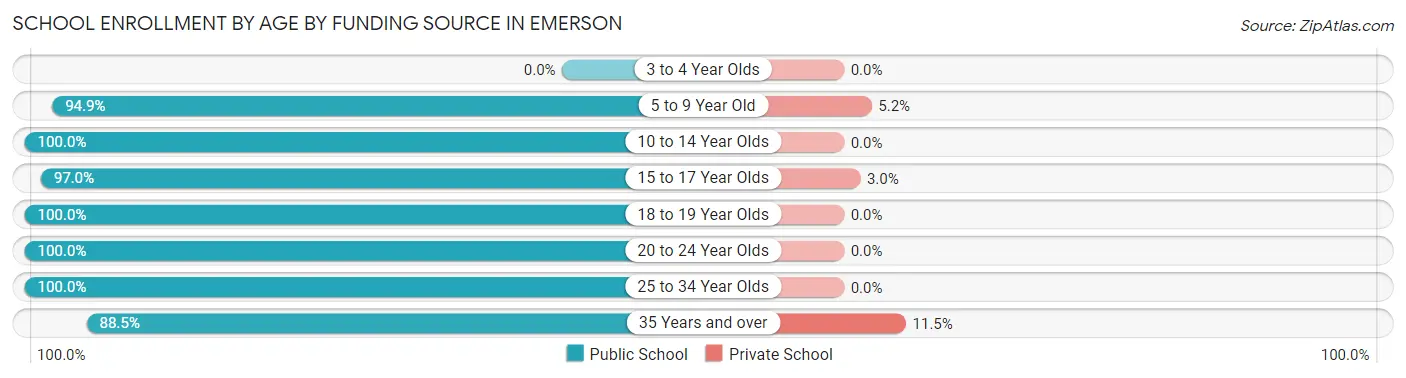
| Age Bracket | Public School | Private School |
| 3 to 4 Year Olds | 0 (0.0%) | 0 (0.0%) |
| 5 to 9 Year Old | 92 (94.9%) | 5 (5.1%) |
| 10 to 14 Year Olds | 135 (100.0%) | 0 (0.0%) |
| 15 to 17 Year Olds | 32 (97.0%) | 1 (3.0%) |
| 18 to 19 Year Olds | 14 (100.0%) | 0 (0.0%) |
| 20 to 24 Year Olds | 20 (100.0%) | 0 (0.0%) |
| 25 to 34 Year Olds | 15 (100.0%) | 0 (0.0%) |
| 35 Years and over | 23 (88.5%) | 3 (11.5%) |
| Total | 331 (97.4%) | 9 (2.6%) |
Educational Attainment by Field of Study in Emerson
Business (115 | 30.6%), science & technology (44 | 11.7%), social sciences (40 | 10.6%), liberal arts & history (28 | 7.4%), and engineering (27 | 7.2%) are the most common fields of study among 376 individuals in Emerson who have obtained a bachelor's degree or higher.
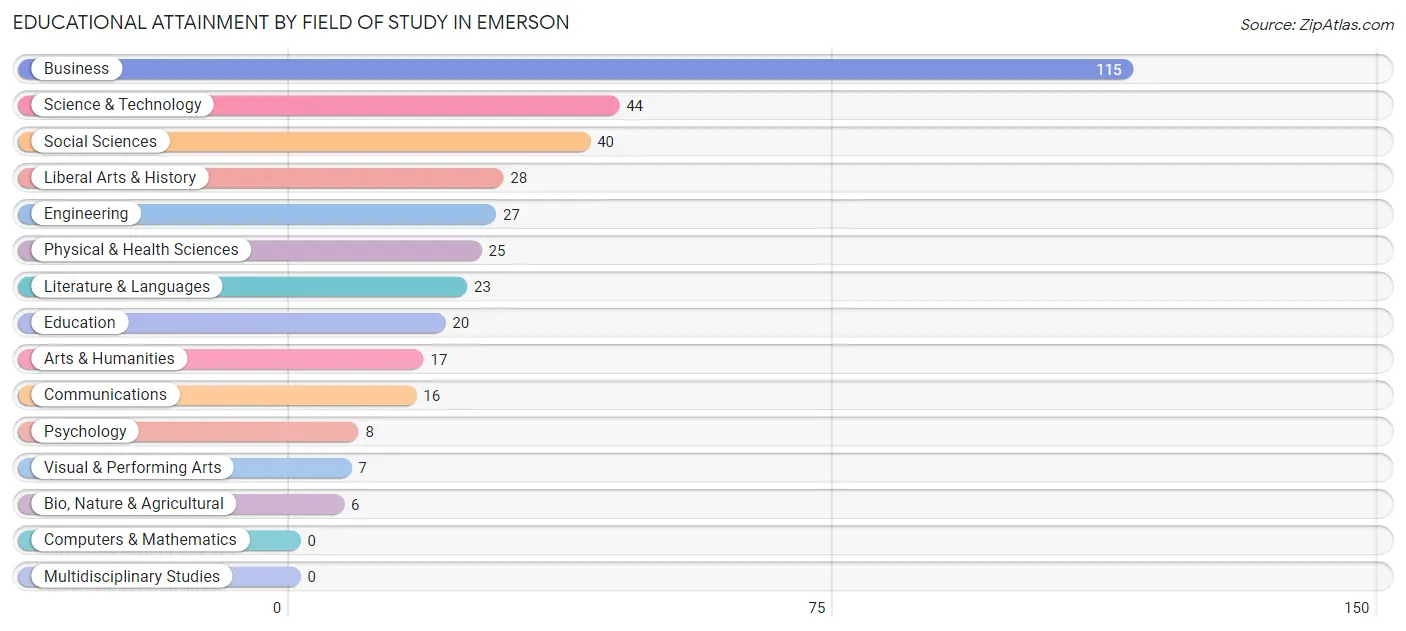
| Field of Study | # Graduates | % Graduates |
| Computers & Mathematics | 0 | 0.0% |
| Bio, Nature & Agricultural | 6 | 1.6% |
| Physical & Health Sciences | 25 | 6.7% |
| Psychology | 8 | 2.1% |
| Social Sciences | 40 | 10.6% |
| Engineering | 27 | 7.2% |
| Multidisciplinary Studies | 0 | 0.0% |
| Science & Technology | 44 | 11.7% |
| Business | 115 | 30.6% |
| Education | 20 | 5.3% |
| Literature & Languages | 23 | 6.1% |
| Liberal Arts & History | 28 | 7.4% |
| Visual & Performing Arts | 7 | 1.9% |
| Communications | 16 | 4.3% |
| Arts & Humanities | 17 | 4.5% |
| Total | 376 | 100.0% |
Transportation & Commute in Emerson
Vehicle Availability by Sex in Emerson
The most prevalent vehicle ownership categories in Emerson are males with 2 vehicles (127, accounting for 35.6%) and females with 2 vehicles (121, making up 32.8%).
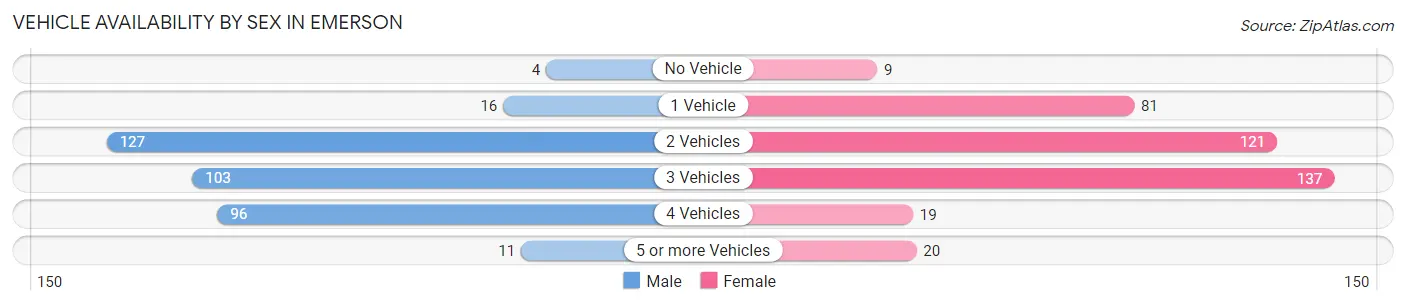
| Vehicles Available | Male | Female |
| No Vehicle | 4 (1.1%) | 9 (2.3%) |
| 1 Vehicle | 16 (4.5%) | 81 (20.9%) |
| 2 Vehicles | 127 (35.6%) | 121 (31.3%) |
| 3 Vehicles | 103 (28.8%) | 137 (35.4%) |
| 4 Vehicles | 96 (26.9%) | 19 (4.9%) |
| 5 or more Vehicles | 11 (3.1%) | 20 (5.2%) |
| Total | 357 (100.0%) | 387 (100.0%) |
Commute Time in Emerson
The most frequently occuring commute durations in Emerson are 15 to 19 minutes (137 commuters, 20.8%), 20 to 24 minutes (101 commuters, 15.3%), and 60 to 89 minutes (79 commuters, 12.0%).
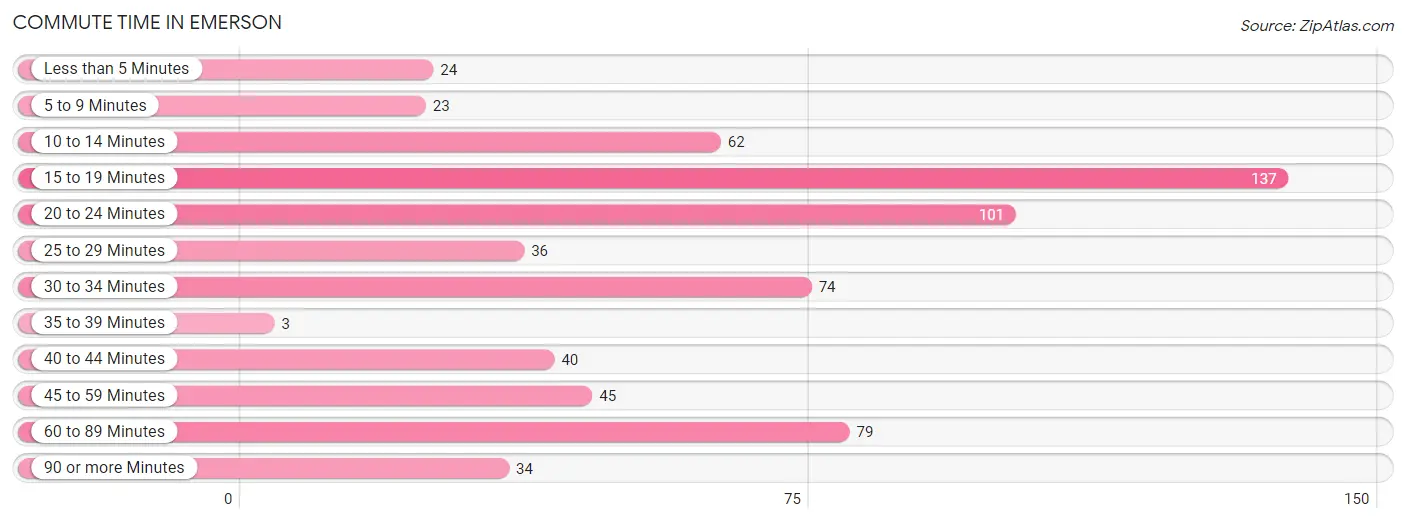
| Commute Time | # Commuters | % Commuters |
| Less than 5 Minutes | 24 | 3.6% |
| 5 to 9 Minutes | 23 | 3.5% |
| 10 to 14 Minutes | 62 | 9.4% |
| 15 to 19 Minutes | 137 | 20.8% |
| 20 to 24 Minutes | 101 | 15.3% |
| 25 to 29 Minutes | 36 | 5.5% |
| 30 to 34 Minutes | 74 | 11.3% |
| 35 to 39 Minutes | 3 | 0.5% |
| 40 to 44 Minutes | 40 | 6.1% |
| 45 to 59 Minutes | 45 | 6.8% |
| 60 to 89 Minutes | 79 | 12.0% |
| 90 or more Minutes | 34 | 5.2% |
Commute Time by Sex in Emerson
The most common commute times in Emerson are 20 to 24 minutes (78 commuters, 25.6%) for males and 15 to 19 minutes (89 commuters, 25.2%) for females.
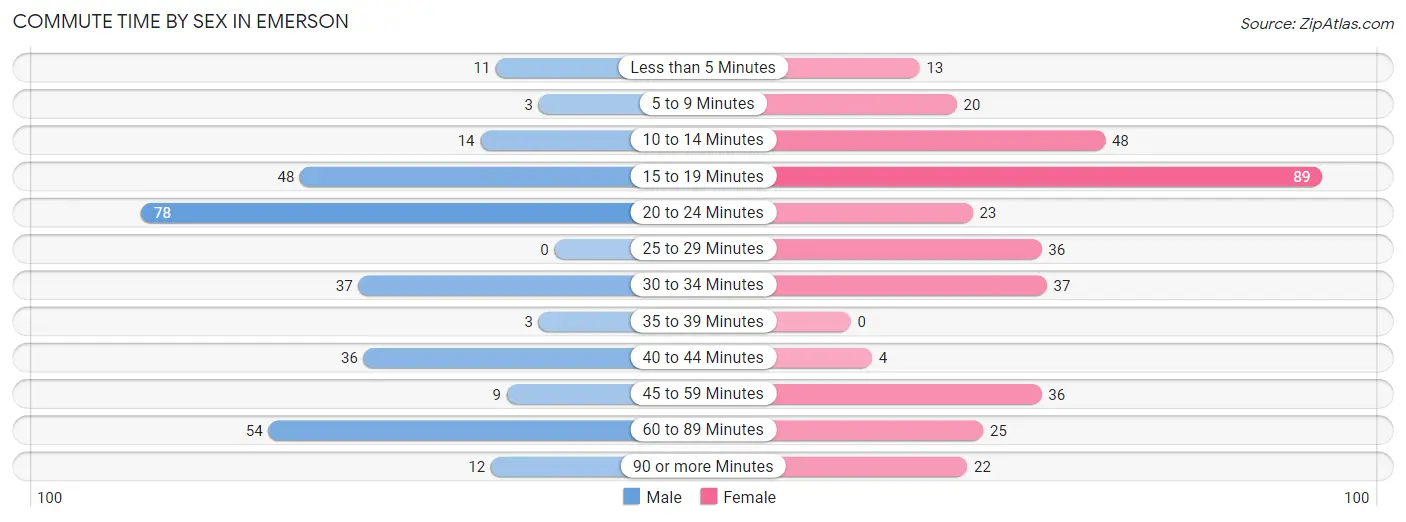
| Commute Time | Male | Female |
| Less than 5 Minutes | 11 (3.6%) | 13 (3.7%) |
| 5 to 9 Minutes | 3 (1.0%) | 20 (5.7%) |
| 10 to 14 Minutes | 14 (4.6%) | 48 (13.6%) |
| 15 to 19 Minutes | 48 (15.7%) | 89 (25.2%) |
| 20 to 24 Minutes | 78 (25.6%) | 23 (6.5%) |
| 25 to 29 Minutes | 0 (0.0%) | 36 (10.2%) |
| 30 to 34 Minutes | 37 (12.1%) | 37 (10.5%) |
| 35 to 39 Minutes | 3 (1.0%) | 0 (0.0%) |
| 40 to 44 Minutes | 36 (11.8%) | 4 (1.1%) |
| 45 to 59 Minutes | 9 (2.9%) | 36 (10.2%) |
| 60 to 89 Minutes | 54 (17.7%) | 25 (7.1%) |
| 90 or more Minutes | 12 (3.9%) | 22 (6.2%) |
Time of Departure to Work by Sex in Emerson
The most frequent times of departure to work in Emerson are 6:00 AM to 6:29 AM (59, 19.3%) for males and 12:00 PM to 3:59 PM (67, 19.0%) for females.
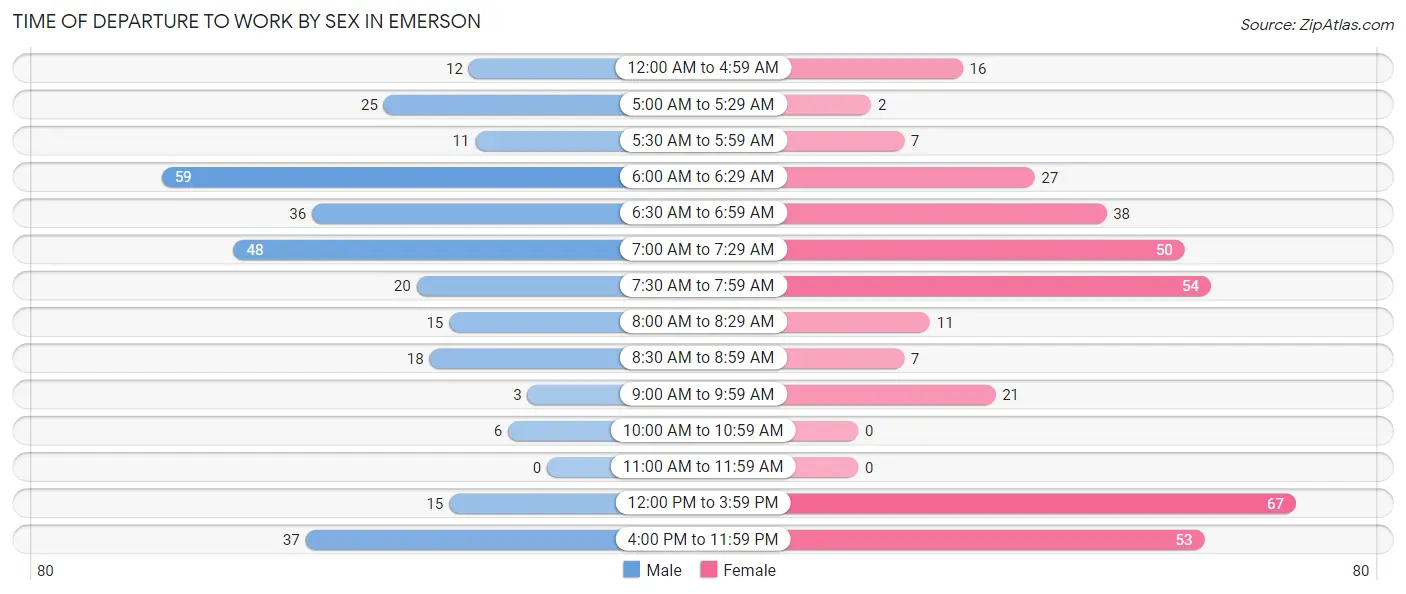
| Time of Departure | Male | Female |
| 12:00 AM to 4:59 AM | 12 (3.9%) | 16 (4.5%) |
| 5:00 AM to 5:29 AM | 25 (8.2%) | 2 (0.6%) |
| 5:30 AM to 5:59 AM | 11 (3.6%) | 7 (2.0%) |
| 6:00 AM to 6:29 AM | 59 (19.3%) | 27 (7.6%) |
| 6:30 AM to 6:59 AM | 36 (11.8%) | 38 (10.8%) |
| 7:00 AM to 7:29 AM | 48 (15.7%) | 50 (14.2%) |
| 7:30 AM to 7:59 AM | 20 (6.6%) | 54 (15.3%) |
| 8:00 AM to 8:29 AM | 15 (4.9%) | 11 (3.1%) |
| 8:30 AM to 8:59 AM | 18 (5.9%) | 7 (2.0%) |
| 9:00 AM to 9:59 AM | 3 (1.0%) | 21 (5.9%) |
| 10:00 AM to 10:59 AM | 6 (2.0%) | 0 (0.0%) |
| 11:00 AM to 11:59 AM | 0 (0.0%) | 0 (0.0%) |
| 12:00 PM to 3:59 PM | 15 (4.9%) | 67 (19.0%) |
| 4:00 PM to 11:59 PM | 37 (12.1%) | 53 (15.0%) |
| Total | 305 (100.0%) | 353 (100.0%) |
Housing Occupancy in Emerson
Occupancy by Ownership in Emerson
Of the total 610 dwellings in Emerson, owner-occupied units account for 415 (68.0%), while renter-occupied units make up 195 (32.0%).
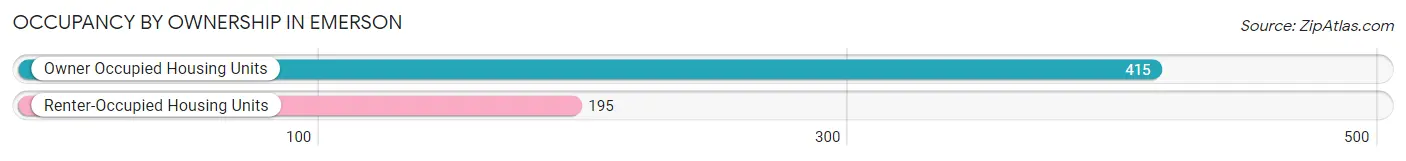
| Occupancy | # Housing Units | % Housing Units |
| Owner Occupied Housing Units | 415 | 68.0% |
| Renter-Occupied Housing Units | 195 | 32.0% |
| Total Occupied Housing Units | 610 | 100.0% |
Occupancy by Household Size in Emerson
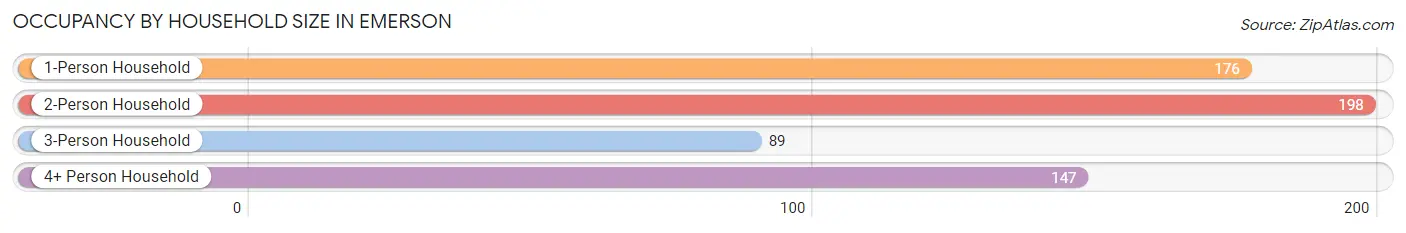
| Household Size | # Housing Units | % Housing Units |
| 1-Person Household | 176 | 28.8% |
| 2-Person Household | 198 | 32.5% |
| 3-Person Household | 89 | 14.6% |
| 4+ Person Household | 147 | 24.1% |
| Total Housing Units | 610 | 100.0% |
Occupancy by Ownership by Household Size in Emerson
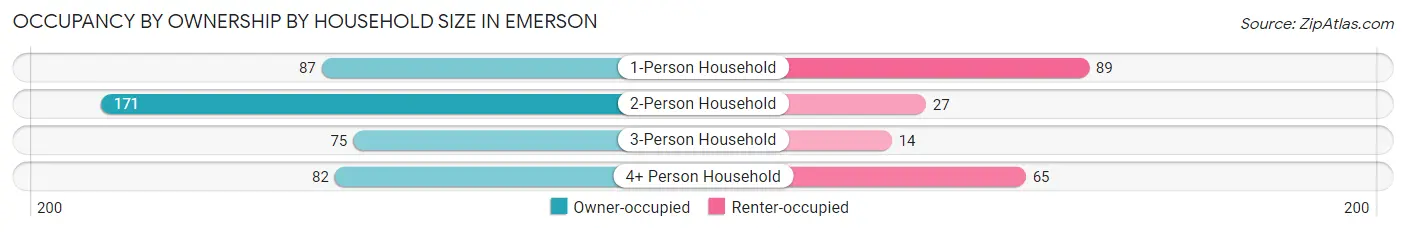
| Household Size | Owner-occupied | Renter-occupied |
| 1-Person Household | 87 (49.4%) | 89 (50.6%) |
| 2-Person Household | 171 (86.4%) | 27 (13.6%) |
| 3-Person Household | 75 (84.3%) | 14 (15.7%) |
| 4+ Person Household | 82 (55.8%) | 65 (44.2%) |
| Total Housing Units | 415 (68.0%) | 195 (32.0%) |
Occupancy by Educational Attainment in Emerson
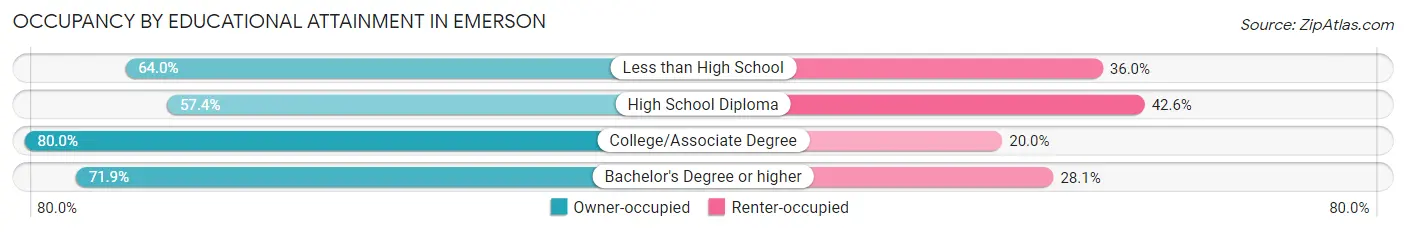
| Household Size | Owner-occupied | Renter-occupied |
| Less than High School | 73 (64.0%) | 41 (36.0%) |
| High School Diploma | 93 (57.4%) | 69 (42.6%) |
| College/Associate Degree | 88 (80.0%) | 22 (20.0%) |
| Bachelor's Degree or higher | 161 (71.9%) | 63 (28.1%) |
Occupancy by Age of Householder in Emerson
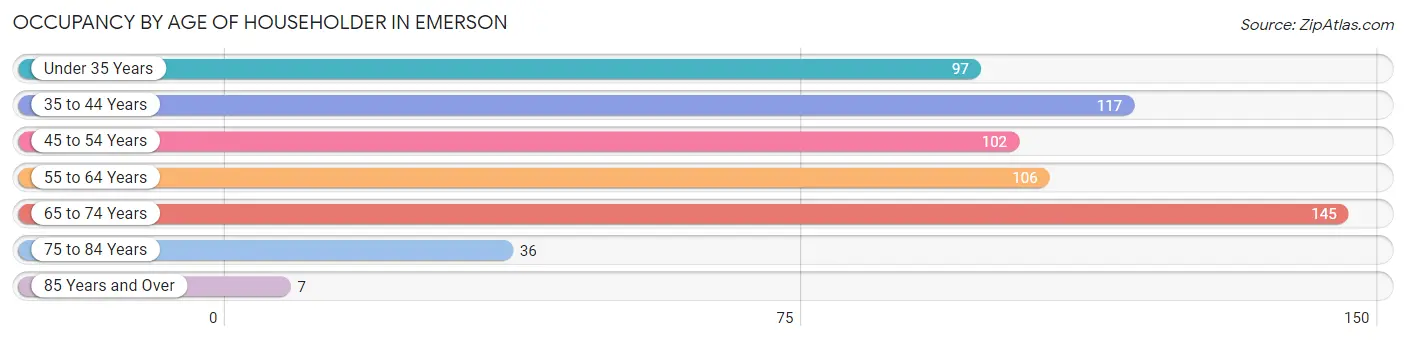
| Age Bracket | # Households | % Households |
| Under 35 Years | 97 | 15.9% |
| 35 to 44 Years | 117 | 19.2% |
| 45 to 54 Years | 102 | 16.7% |
| 55 to 64 Years | 106 | 17.4% |
| 65 to 74 Years | 145 | 23.8% |
| 75 to 84 Years | 36 | 5.9% |
| 85 Years and Over | 7 | 1.1% |
| Total | 610 | 100.0% |
Housing Finances in Emerson
Median Income by Occupancy in Emerson
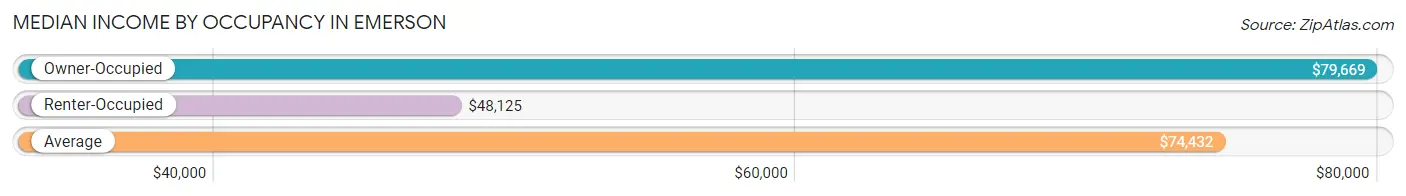
| Occupancy Type | # Households | Median Income |
| Owner-Occupied | 415 (68.0%) | $79,669 |
| Renter-Occupied | 195 (32.0%) | $48,125 |
| Average | 610 (100.0%) | $74,432 |
Occupancy by Householder Income Bracket in Emerson
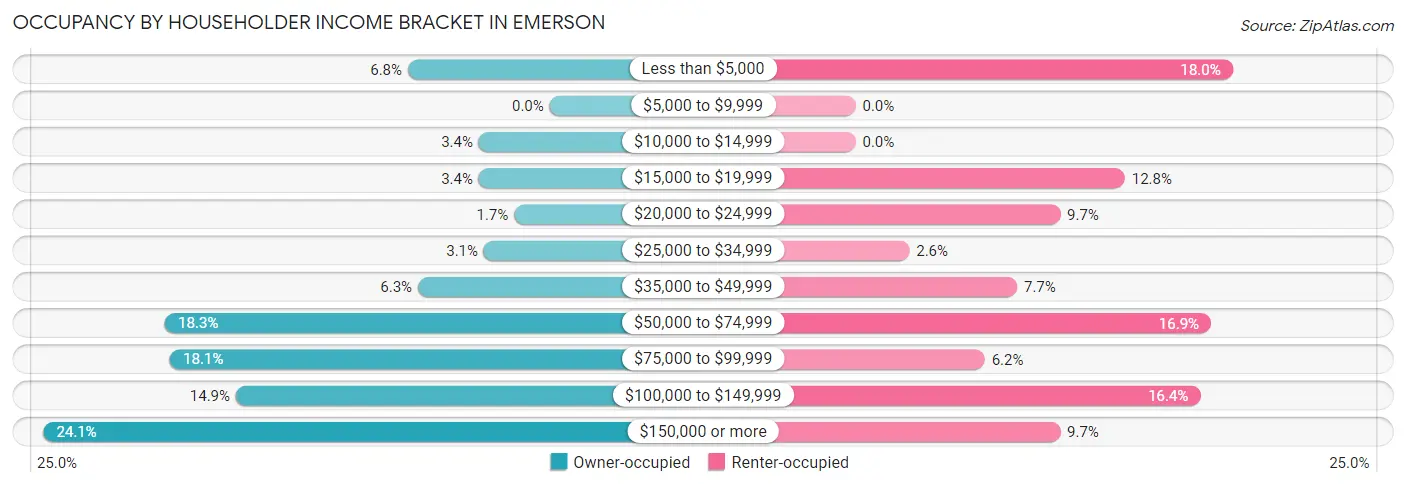
| Income Bracket | Owner-occupied | Renter-occupied |
| Less than $5,000 | 28 (6.8%) | 35 (17.9%) |
| $5,000 to $9,999 | 0 (0.0%) | 0 (0.0%) |
| $10,000 to $14,999 | 14 (3.4%) | 0 (0.0%) |
| $15,000 to $19,999 | 14 (3.4%) | 25 (12.8%) |
| $20,000 to $24,999 | 7 (1.7%) | 19 (9.7%) |
| $25,000 to $34,999 | 13 (3.1%) | 5 (2.6%) |
| $35,000 to $49,999 | 26 (6.3%) | 15 (7.7%) |
| $50,000 to $74,999 | 76 (18.3%) | 33 (16.9%) |
| $75,000 to $99,999 | 75 (18.1%) | 12 (6.1%) |
| $100,000 to $149,999 | 62 (14.9%) | 32 (16.4%) |
| $150,000 or more | 100 (24.1%) | 19 (9.7%) |
| Total | 415 (100.0%) | 195 (100.0%) |
Monthly Housing Cost Tiers in Emerson
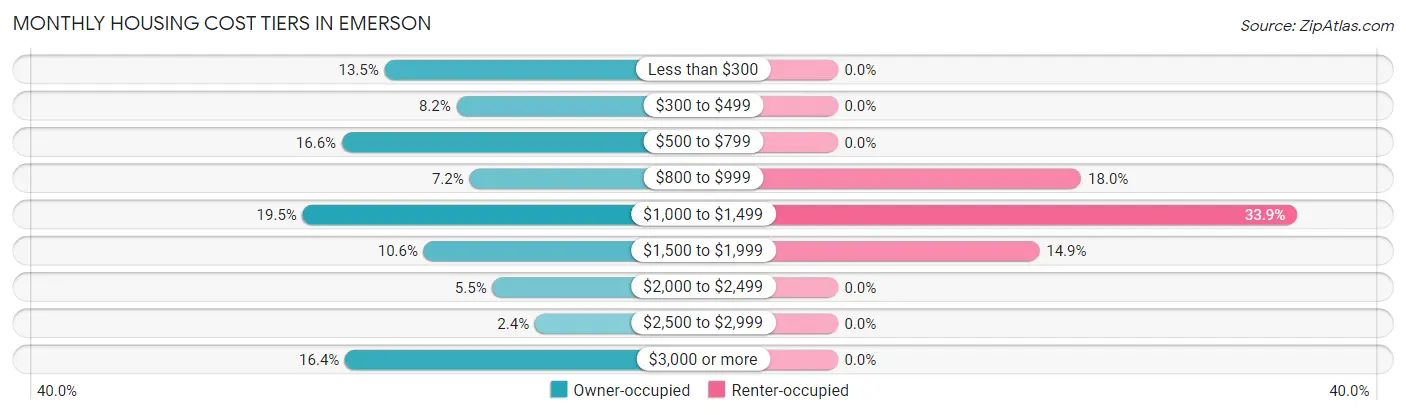
| Monthly Cost | Owner-occupied | Renter-occupied |
| Less than $300 | 56 (13.5%) | 0 (0.0%) |
| $300 to $499 | 34 (8.2%) | 0 (0.0%) |
| $500 to $799 | 69 (16.6%) | 0 (0.0%) |
| $800 to $999 | 30 (7.2%) | 35 (17.9%) |
| $1,000 to $1,499 | 81 (19.5%) | 66 (33.9%) |
| $1,500 to $1,999 | 44 (10.6%) | 29 (14.9%) |
| $2,000 to $2,499 | 23 (5.5%) | 0 (0.0%) |
| $2,500 to $2,999 | 10 (2.4%) | 0 (0.0%) |
| $3,000 or more | 68 (16.4%) | 0 (0.0%) |
| Total | 415 (100.0%) | 195 (100.0%) |
Physical Housing Characteristics in Emerson
Housing Structures in Emerson
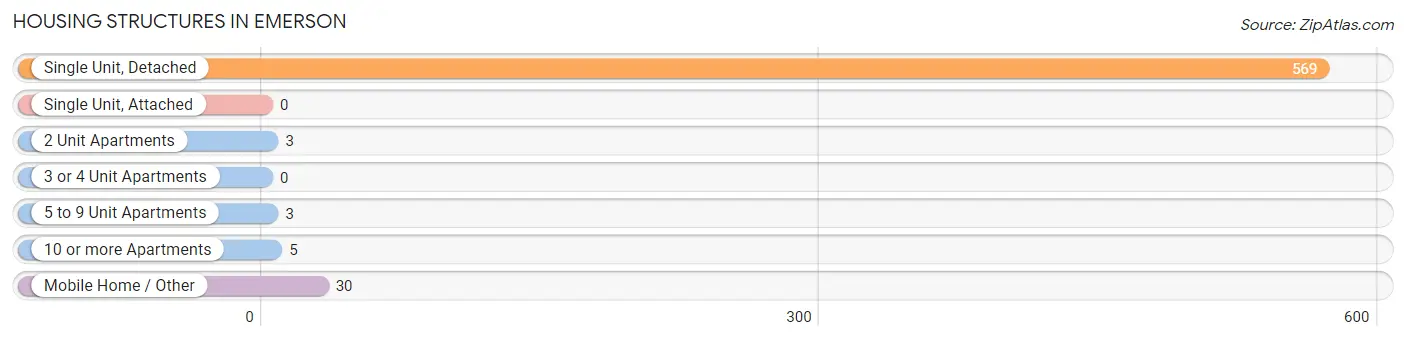
| Structure Type | # Housing Units | % Housing Units |
| Single Unit, Detached | 569 | 93.3% |
| Single Unit, Attached | 0 | 0.0% |
| 2 Unit Apartments | 3 | 0.5% |
| 3 or 4 Unit Apartments | 0 | 0.0% |
| 5 to 9 Unit Apartments | 3 | 0.5% |
| 10 or more Apartments | 5 | 0.8% |
| Mobile Home / Other | 30 | 4.9% |
| Total | 610 | 100.0% |
Housing Structures by Occupancy in Emerson
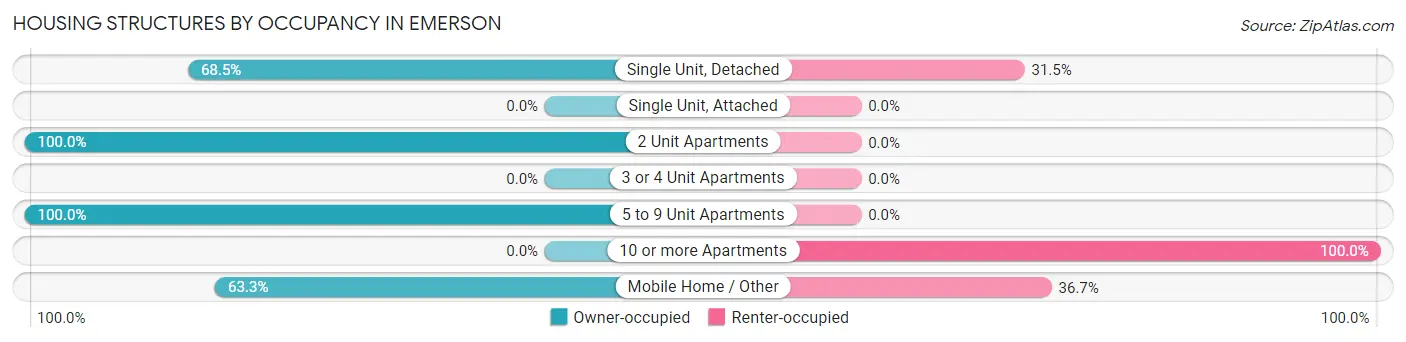
| Structure Type | Owner-occupied | Renter-occupied |
| Single Unit, Detached | 390 (68.5%) | 179 (31.5%) |
| Single Unit, Attached | 0 (0.0%) | 0 (0.0%) |
| 2 Unit Apartments | 3 (100.0%) | 0 (0.0%) |
| 3 or 4 Unit Apartments | 0 (0.0%) | 0 (0.0%) |
| 5 to 9 Unit Apartments | 3 (100.0%) | 0 (0.0%) |
| 10 or more Apartments | 0 (0.0%) | 5 (100.0%) |
| Mobile Home / Other | 19 (63.3%) | 11 (36.7%) |
| Total | 415 (68.0%) | 195 (32.0%) |
Housing Structures by Number of Rooms in Emerson
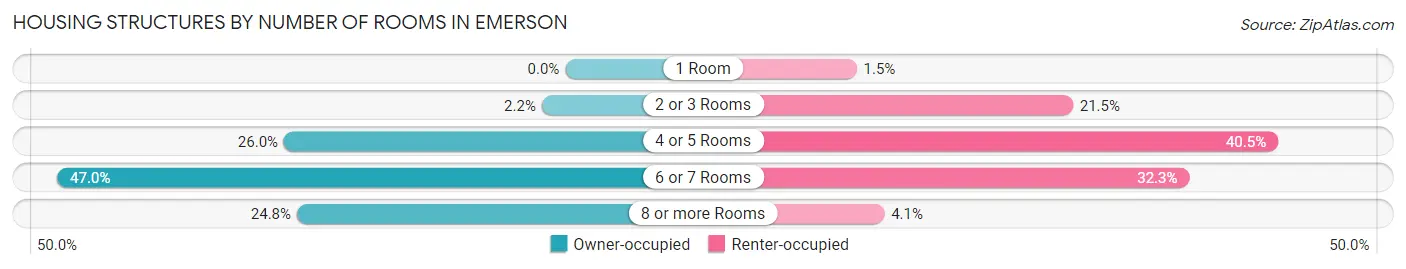
| Number of Rooms | Owner-occupied | Renter-occupied |
| 1 Room | 0 (0.0%) | 3 (1.5%) |
| 2 or 3 Rooms | 9 (2.2%) | 42 (21.5%) |
| 4 or 5 Rooms | 108 (26.0%) | 79 (40.5%) |
| 6 or 7 Rooms | 195 (47.0%) | 63 (32.3%) |
| 8 or more Rooms | 103 (24.8%) | 8 (4.1%) |
| Total | 415 (100.0%) | 195 (100.0%) |
Housing Structure by Heating Type in Emerson
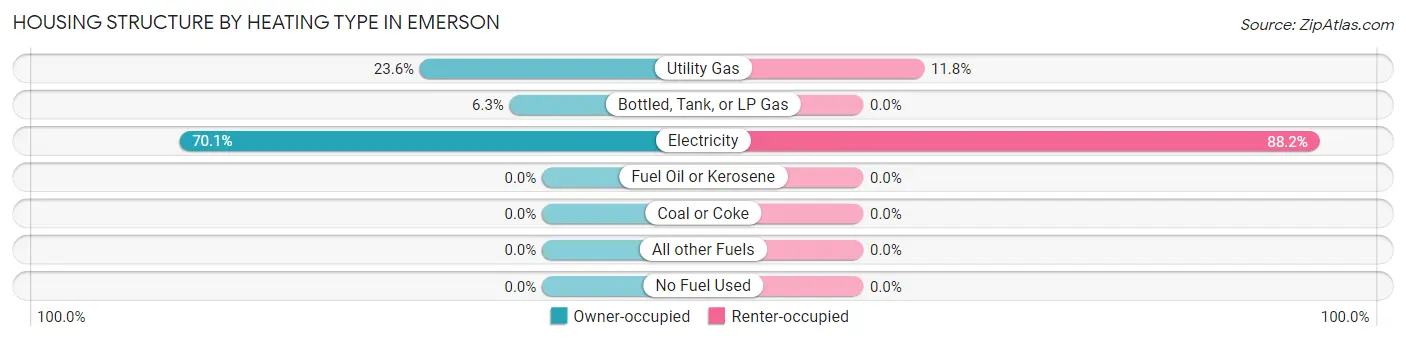
| Heating Type | Owner-occupied | Renter-occupied |
| Utility Gas | 98 (23.6%) | 23 (11.8%) |
| Bottled, Tank, or LP Gas | 26 (6.3%) | 0 (0.0%) |
| Electricity | 291 (70.1%) | 172 (88.2%) |
| Fuel Oil or Kerosene | 0 (0.0%) | 0 (0.0%) |
| Coal or Coke | 0 (0.0%) | 0 (0.0%) |
| All other Fuels | 0 (0.0%) | 0 (0.0%) |
| No Fuel Used | 0 (0.0%) | 0 (0.0%) |
| Total | 415 (100.0%) | 195 (100.0%) |
Household Vehicle Usage in Emerson
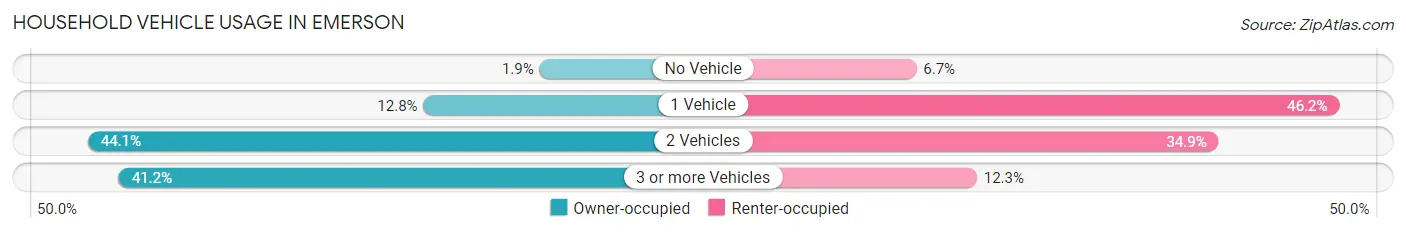
| Vehicles per Household | Owner-occupied | Renter-occupied |
| No Vehicle | 8 (1.9%) | 13 (6.7%) |
| 1 Vehicle | 53 (12.8%) | 90 (46.2%) |
| 2 Vehicles | 183 (44.1%) | 68 (34.9%) |
| 3 or more Vehicles | 171 (41.2%) | 24 (12.3%) |
| Total | 415 (100.0%) | 195 (100.0%) |
Real Estate & Mortgages in Emerson
Real Estate and Mortgage Overview in Emerson
| Characteristic | Without Mortgage | With Mortgage |
| Housing Units | 173 | 242 |
| Median Property Value | $132,800 | $216,000 |
| Median Household Income | $58,047 | $87 |
| Monthly Housing Costs | $487 | $68 |
| Real Estate Taxes | $1,147 | $0 |
Property Value by Mortgage Status in Emerson
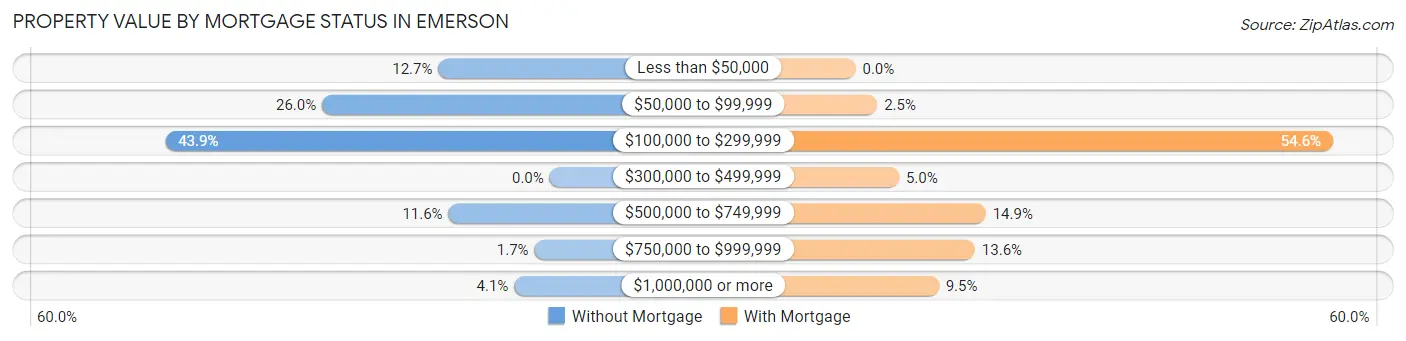
| Property Value | Without Mortgage | With Mortgage |
| Less than $50,000 | 22 (12.7%) | 0 (0.0%) |
| $50,000 to $99,999 | 45 (26.0%) | 6 (2.5%) |
| $100,000 to $299,999 | 76 (43.9%) | 132 (54.5%) |
| $300,000 to $499,999 | 0 (0.0%) | 12 (5.0%) |
| $500,000 to $749,999 | 20 (11.6%) | 36 (14.9%) |
| $750,000 to $999,999 | 3 (1.7%) | 33 (13.6%) |
| $1,000,000 or more | 7 (4.1%) | 23 (9.5%) |
| Total | 173 (100.0%) | 242 (100.0%) |
Household Income by Mortgage Status in Emerson
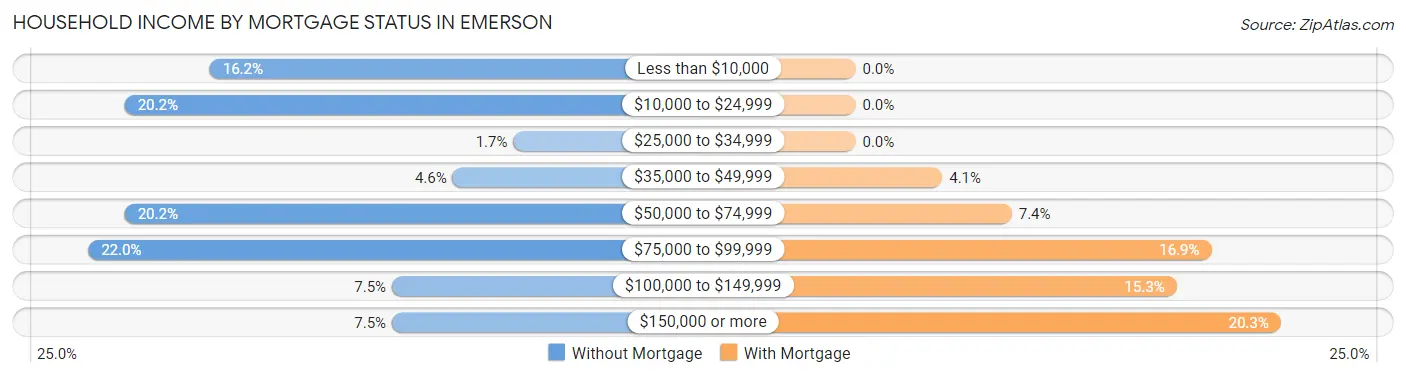
| Household Income | Without Mortgage | With Mortgage |
| Less than $10,000 | 28 (16.2%) | 0 (0.0%) |
| $10,000 to $24,999 | 35 (20.2%) | 0 (0.0%) |
| $25,000 to $34,999 | 3 (1.7%) | 0 (0.0%) |
| $35,000 to $49,999 | 8 (4.6%) | 10 (4.1%) |
| $50,000 to $74,999 | 35 (20.2%) | 18 (7.4%) |
| $75,000 to $99,999 | 38 (22.0%) | 41 (16.9%) |
| $100,000 to $149,999 | 13 (7.5%) | 37 (15.3%) |
| $150,000 or more | 13 (7.5%) | 49 (20.3%) |
| Total | 173 (100.0%) | 242 (100.0%) |
Property Value to Household Income Ratio in Emerson
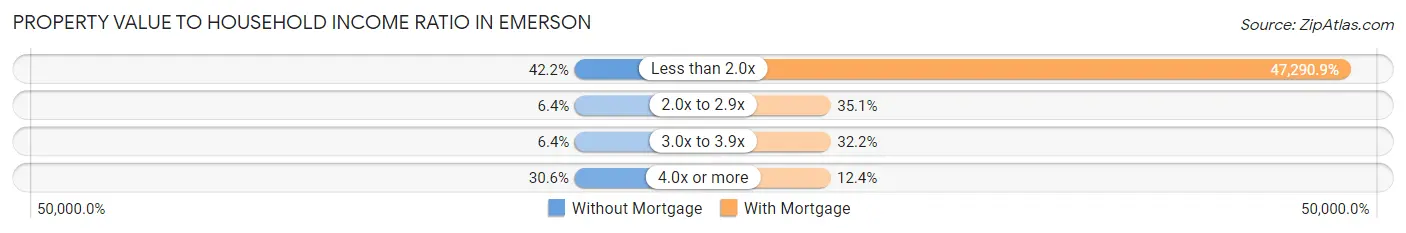
| Value-to-Income Ratio | Without Mortgage | With Mortgage |
| Less than 2.0x | 73 (42.2%) | 114,444 (47,290.9%) |
| 2.0x to 2.9x | 11 (6.4%) | 85 (35.1%) |
| 3.0x to 3.9x | 11 (6.4%) | 78 (32.2%) |
| 4.0x or more | 53 (30.6%) | 30 (12.4%) |
| Total | 173 (100.0%) | 242 (100.0%) |
Real Estate Taxes by Mortgage Status in Emerson
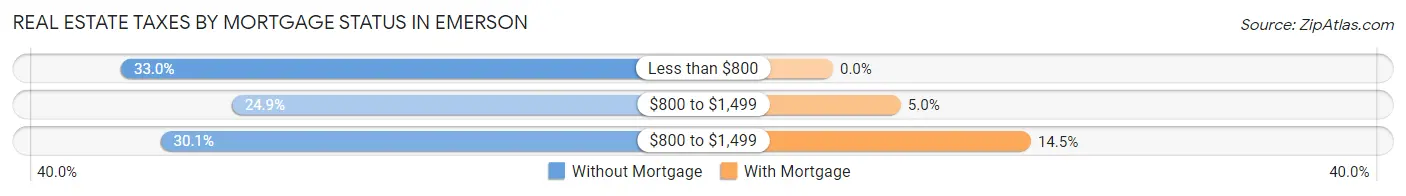
| Property Taxes | Without Mortgage | With Mortgage |
| Less than $800 | 57 (33.0%) | 0 (0.0%) |
| $800 to $1,499 | 43 (24.9%) | 12 (5.0%) |
| $800 to $1,499 | 52 (30.1%) | 35 (14.5%) |
| Total | 173 (100.0%) | 242 (100.0%) |
Health & Disability in Emerson
Health Insurance Coverage by Age in Emerson
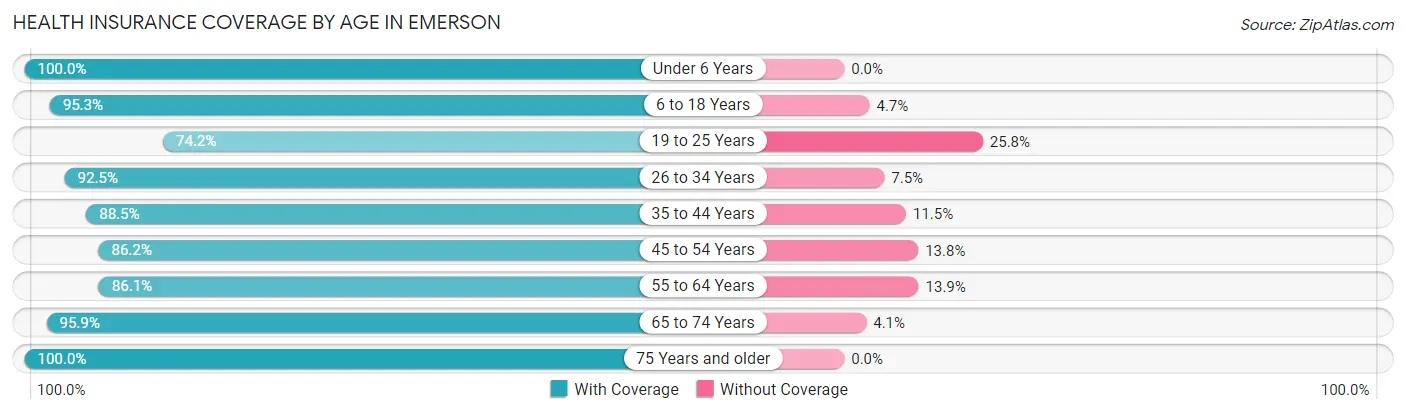
| Age Bracket | With Coverage | Without Coverage |
| Under 6 Years | 109 (100.0%) | 0 (0.0%) |
| 6 to 18 Years | 243 (95.3%) | 12 (4.7%) |
| 19 to 25 Years | 132 (74.2%) | 46 (25.8%) |
| 26 to 34 Years | 161 (92.5%) | 13 (7.5%) |
| 35 to 44 Years | 146 (88.5%) | 19 (11.5%) |
| 45 to 54 Years | 200 (86.2%) | 32 (13.8%) |
| 55 to 64 Years | 174 (86.1%) | 28 (13.9%) |
| 65 to 74 Years | 187 (95.9%) | 8 (4.1%) |
| 75 Years and older | 71 (100.0%) | 0 (0.0%) |
| Total | 1,423 (90.0%) | 158 (10.0%) |
Health Insurance Coverage by Citizenship Status in Emerson
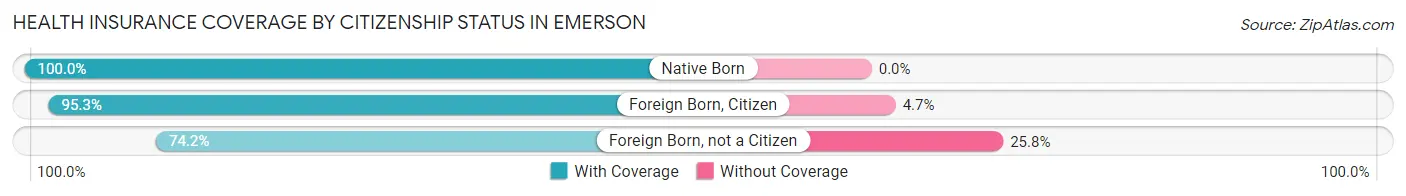
| Citizenship Status | With Coverage | Without Coverage |
| Native Born | 109 (100.0%) | 0 (0.0%) |
| Foreign Born, Citizen | 243 (95.3%) | 12 (4.7%) |
| Foreign Born, not a Citizen | 132 (74.2%) | 46 (25.8%) |
Health Insurance Coverage by Household Income in Emerson
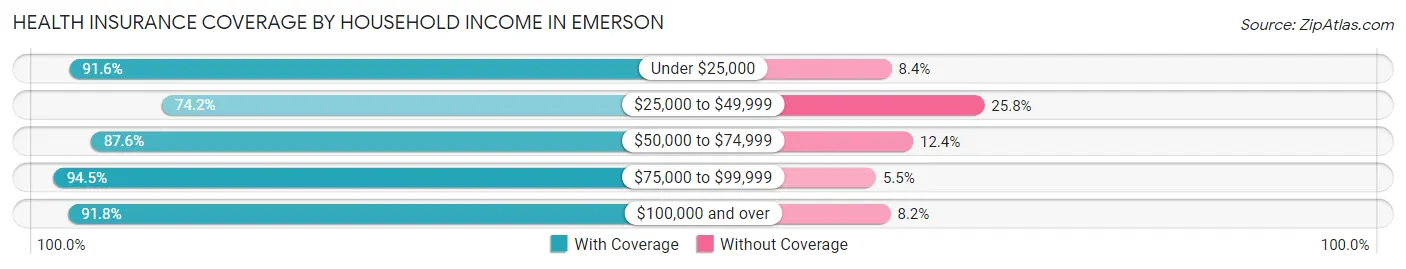
| Household Income | With Coverage | Without Coverage |
| Under $25,000 | 251 (91.6%) | 23 (8.4%) |
| $25,000 to $49,999 | 95 (74.2%) | 33 (25.8%) |
| $50,000 to $74,999 | 247 (87.6%) | 35 (12.4%) |
| $75,000 to $99,999 | 225 (94.5%) | 13 (5.5%) |
| $100,000 and over | 605 (91.8%) | 54 (8.2%) |
Public vs Private Health Insurance Coverage by Age in Emerson
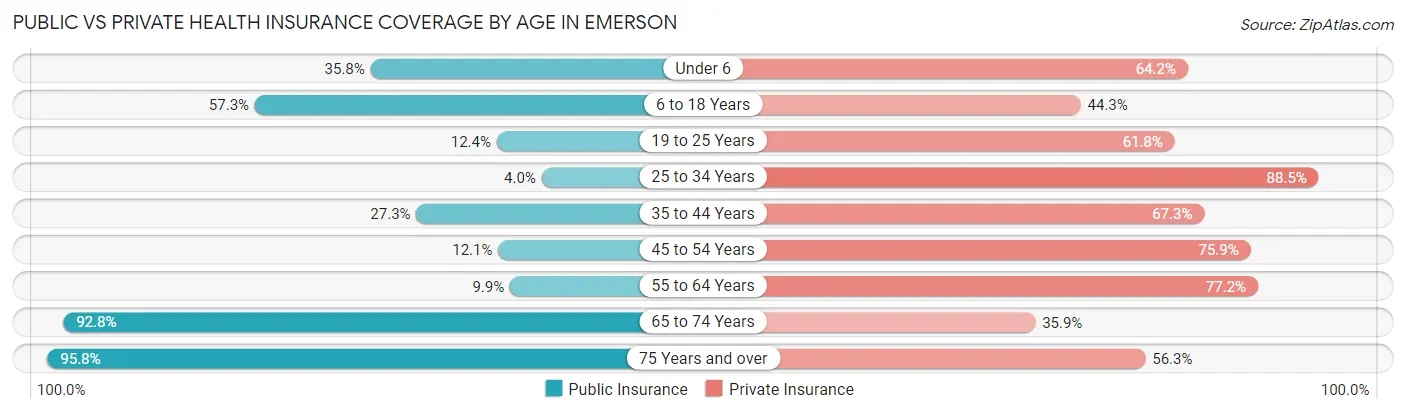
| Age Bracket | Public Insurance | Private Insurance |
| Under 6 | 39 (35.8%) | 70 (64.2%) |
| 6 to 18 Years | 146 (57.3%) | 113 (44.3%) |
| 19 to 25 Years | 22 (12.4%) | 110 (61.8%) |
| 25 to 34 Years | 7 (4.0%) | 154 (88.5%) |
| 35 to 44 Years | 45 (27.3%) | 111 (67.3%) |
| 45 to 54 Years | 28 (12.1%) | 176 (75.9%) |
| 55 to 64 Years | 20 (9.9%) | 156 (77.2%) |
| 65 to 74 Years | 181 (92.8%) | 70 (35.9%) |
| 75 Years and over | 68 (95.8%) | 40 (56.3%) |
| Total | 556 (35.2%) | 1,000 (63.2%) |
Disability Status by Sex by Age in Emerson
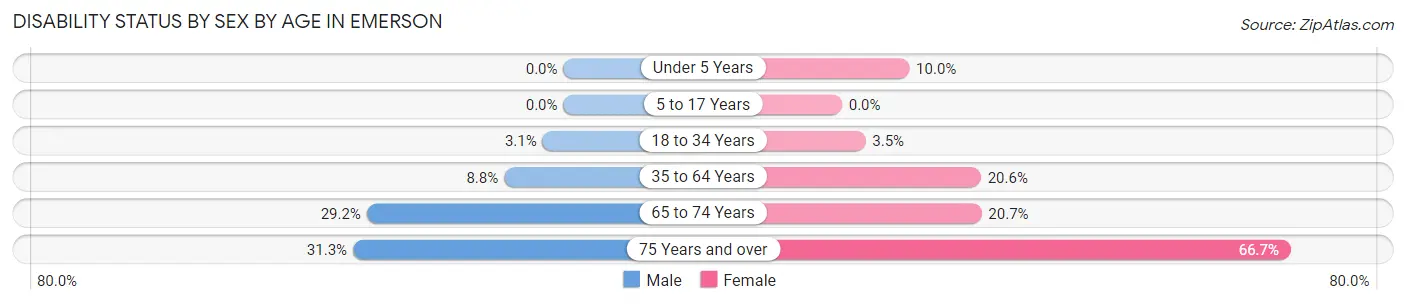
| Age Bracket | Male | Female |
| Under 5 Years | 0 (0.0%) | 4 (10.0%) |
| 5 to 17 Years | 0 (0.0%) | 0 (0.0%) |
| 18 to 34 Years | 5 (3.1%) | 7 (3.5%) |
| 35 to 64 Years | 25 (8.8%) | 65 (20.6%) |
| 65 to 74 Years | 33 (29.2%) | 17 (20.7%) |
| 75 Years and over | 10 (31.2%) | 26 (66.7%) |
Disability Class by Sex by Age in Emerson
Disability Class: Hearing Difficulty
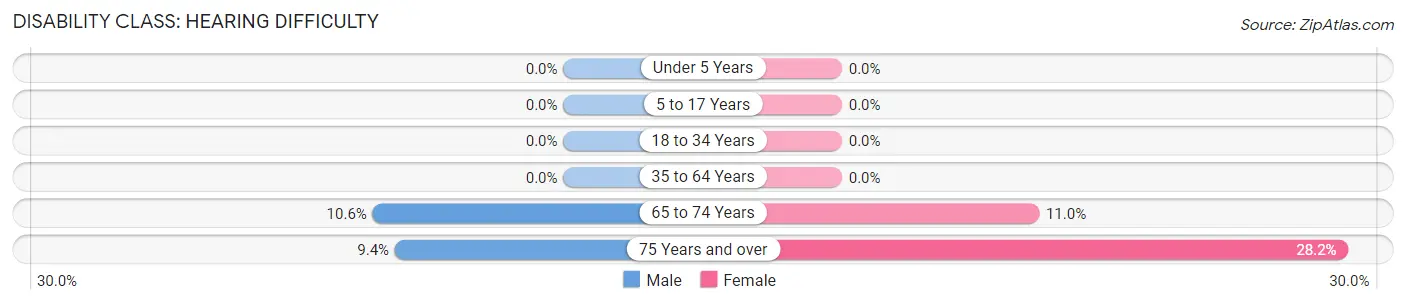
| Age Bracket | Male | Female |
| Under 5 Years | 0 (0.0%) | 0 (0.0%) |
| 5 to 17 Years | 0 (0.0%) | 0 (0.0%) |
| 18 to 34 Years | 0 (0.0%) | 0 (0.0%) |
| 35 to 64 Years | 0 (0.0%) | 0 (0.0%) |
| 65 to 74 Years | 12 (10.6%) | 9 (11.0%) |
| 75 Years and over | 3 (9.4%) | 11 (28.2%) |
Disability Class: Vision Difficulty
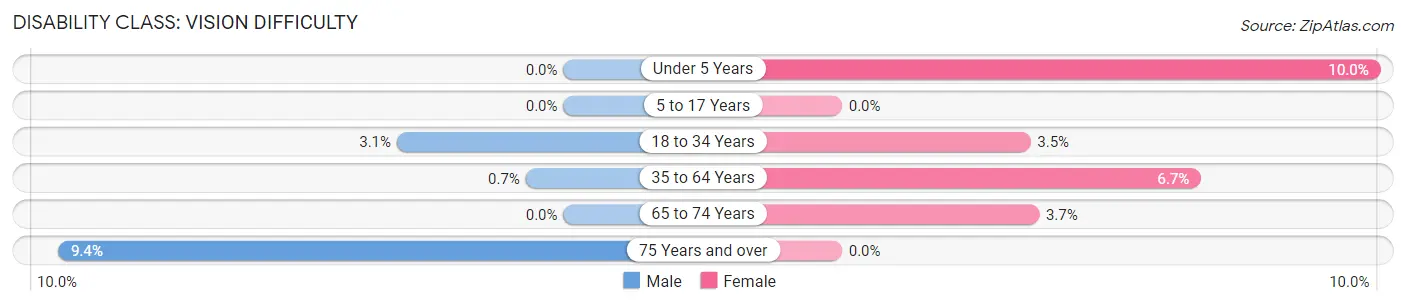
| Age Bracket | Male | Female |
| Under 5 Years | 0 (0.0%) | 4 (10.0%) |
| 5 to 17 Years | 0 (0.0%) | 0 (0.0%) |
| 18 to 34 Years | 5 (3.1%) | 7 (3.5%) |
| 35 to 64 Years | 2 (0.7%) | 21 (6.7%) |
| 65 to 74 Years | 0 (0.0%) | 3 (3.7%) |
| 75 Years and over | 3 (9.4%) | 0 (0.0%) |
Disability Class: Cognitive Difficulty
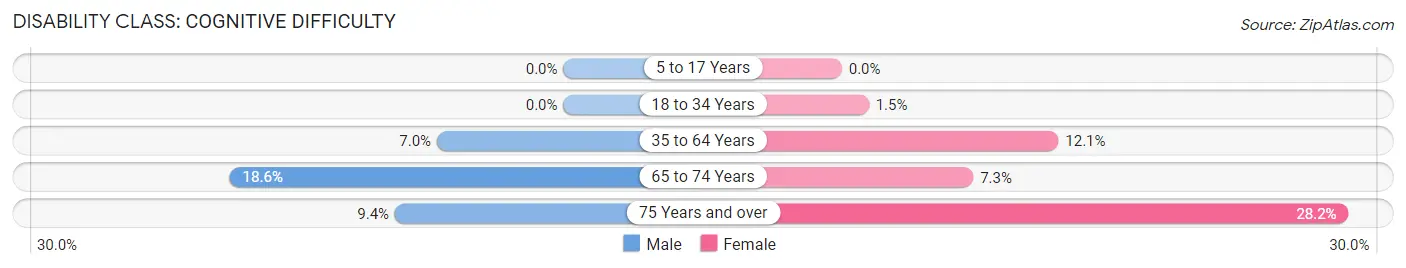
| Age Bracket | Male | Female |
| 5 to 17 Years | 0 (0.0%) | 0 (0.0%) |
| 18 to 34 Years | 0 (0.0%) | 3 (1.5%) |
| 35 to 64 Years | 20 (7.0%) | 38 (12.1%) |
| 65 to 74 Years | 21 (18.6%) | 6 (7.3%) |
| 75 Years and over | 3 (9.4%) | 11 (28.2%) |
Disability Class: Ambulatory Difficulty
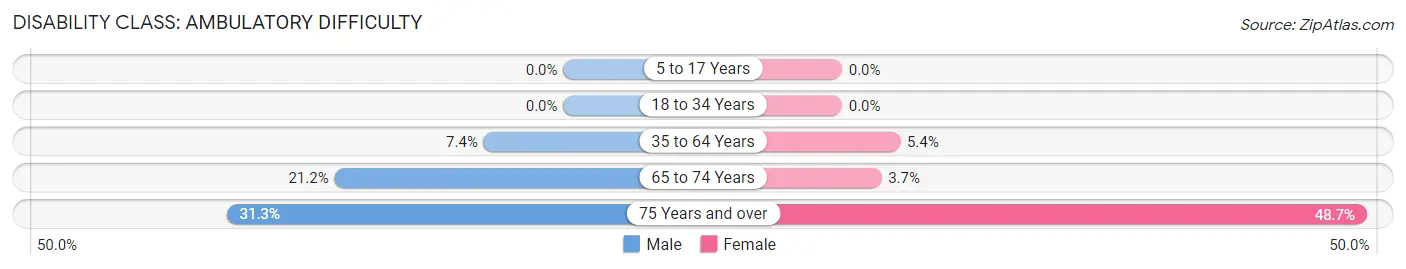
| Age Bracket | Male | Female |
| 5 to 17 Years | 0 (0.0%) | 0 (0.0%) |
| 18 to 34 Years | 0 (0.0%) | 0 (0.0%) |
| 35 to 64 Years | 21 (7.4%) | 17 (5.4%) |
| 65 to 74 Years | 24 (21.2%) | 3 (3.7%) |
| 75 Years and over | 10 (31.2%) | 19 (48.7%) |
Disability Class: Self-Care Difficulty
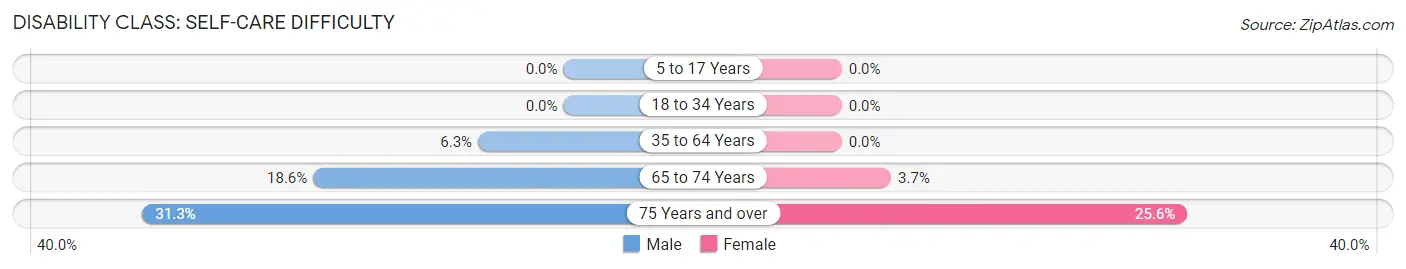
| Age Bracket | Male | Female |
| 5 to 17 Years | 0 (0.0%) | 0 (0.0%) |
| 18 to 34 Years | 0 (0.0%) | 0 (0.0%) |
| 35 to 64 Years | 18 (6.3%) | 0 (0.0%) |
| 65 to 74 Years | 21 (18.6%) | 3 (3.7%) |
| 75 Years and over | 10 (31.2%) | 10 (25.6%) |
Technology Access in Emerson
Computing Device Access in Emerson
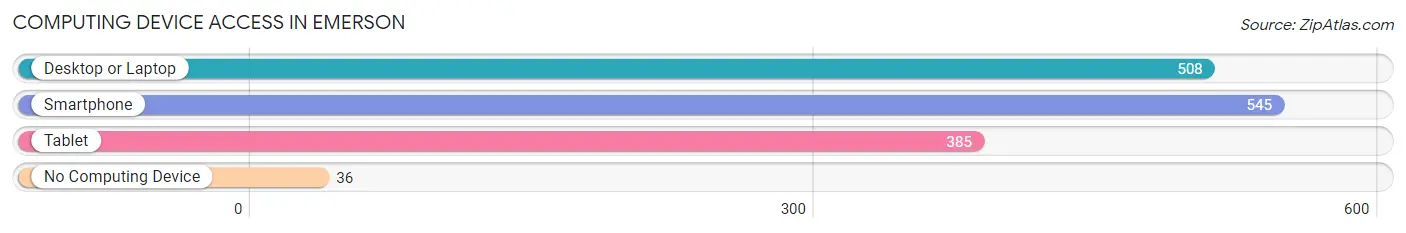
| Device Type | # Households | % Households |
| Desktop or Laptop | 508 | 83.3% |
| Smartphone | 545 | 89.3% |
| Tablet | 385 | 63.1% |
| No Computing Device | 36 | 5.9% |
| Total | 610 | 100.0% |
Internet Access in Emerson
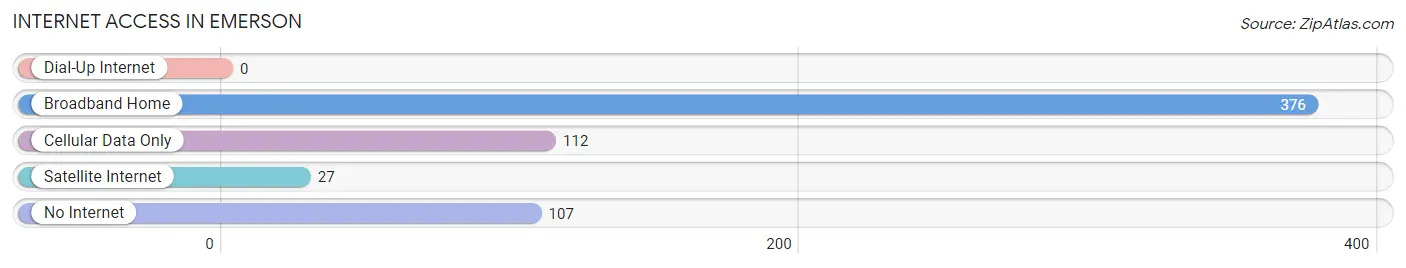
| Internet Type | # Households | % Households |
| Dial-Up Internet | 0 | 0.0% |
| Broadband Home | 376 | 61.6% |
| Cellular Data Only | 112 | 18.4% |
| Satellite Internet | 27 | 4.4% |
| No Internet | 107 | 17.5% |
| Total | 610 | 100.0% |
Emerson Summary
Emerson, Georgia is a small city located in Bartow County, Georgia, United States. It is part of the Atlanta metropolitan area and is located about 40 miles northwest of downtown Atlanta. The city has a population of approximately 1,500 people and is known for its small-town charm and friendly atmosphere.
History
The area that is now Emerson was first settled in the early 1800s by settlers from North Carolina. The town was originally known as “Crossroads” due to its location at the intersection of two major roads. In 1882, the town was renamed Emerson after a local doctor, Dr. John Emerson.
The town was incorporated in 1883 and quickly grew to become a thriving community. The town was home to several businesses, including a cotton gin, a grist mill, a sawmill, and a blacksmith shop. The town also had a post office, a bank, and a hotel.
In the early 1900s, the town began to decline as the railroad bypassed it and the local economy shifted away from agriculture. The town was nearly abandoned by the 1950s, but was revitalized in the 1970s when the city was designated as a historic district.
Geography
Emerson is located in the foothills of the Appalachian Mountains in northwest Georgia. The city is situated at the intersection of two major highways, US 41 and GA 140. The city is surrounded by the cities of Cartersville, Acworth, and Kennesaw.
The city has a total area of 1.2 square miles, all of which is land. The terrain is mostly flat with some rolling hills. The city is located at an elevation of 890 feet above sea level.
Economy
The economy of Emerson is largely based on tourism and retail. The city is home to several antique stores, art galleries, and specialty shops. The city also has several restaurants and bars.
The city is also home to several manufacturing companies, including Emerson Electric, which produces electrical components and systems. The city is also home to several small businesses, including a printing company, a furniture store, and a bakery.
Demographics
As of the 2010 census, the population of Emerson was 1,500. The racial makeup of the city was 87.3% White, 8.3% African American, 0.7% Native American, 0.7% Asian, 0.3% from other races, and 2.7% from two or more races. Hispanic or Latino of any race were 1.3% of the population.
The median income for a household in the city was $41,250, and the median income for a family was $50,000. The per capita income for the city was $20,945. About 11.3% of families and 14.3% of the population were below the poverty line, including 18.2% of those under age 18 and 8.3% of those age 65 or over.
Common Questions
What is Per Capita Income in Emerson?
Per Capita income in Emerson is $41,857.
What is the Median Family Income in Emerson?
Median Family Income in Emerson is $82,500.
What is the Median Household income in Emerson?
Median Household Income in Emerson is $74,432.
What is Income or Wage Gap in Emerson?
Income or Wage Gap in Emerson is 14.3%.
Women in Emerson earn 85.7 cents for every dollar earned by a man.
What is Inequality or Gini Index in Emerson?
Inequality or Gini Index in Emerson is 0.52.
What is the Total Population of Emerson?
Total Population of Emerson is 1,594.
What is the Total Male Population of Emerson?
Total Male Population of Emerson is 809.
What is the Total Female Population of Emerson?
Total Female Population of Emerson is 785.
What is the Ratio of Males per 100 Females in Emerson?
There are 103.06 Males per 100 Females in Emerson.
What is the Ratio of Females per 100 Males in Emerson?
There are 97.03 Females per 100 Males in Emerson.
What is the Median Population Age in Emerson?
Median Population Age in Emerson is 40.0 Years.
What is the Average Family Size in Emerson
Average Family Size in Emerson is 3.2 People.
What is the Average Household Size in Emerson
Average Household Size in Emerson is 2.6 People.
How Large is the Labor Force in Emerson?
There are 815 People in the Labor Forcein in Emerson.
What is the Percentage of People in the Labor Force in Emerson?
64.7% of People are in the Labor Force in Emerson.
What is the Unemployment Rate in Emerson?
Unemployment Rate in Emerson is 6.5%.