Fort Stewart, GA Map & Demographics
Fort Stewart Map
Fort Stewart Overview
$18,963
PER CAPITA INCOME
$48,452
AVG FAMILY INCOME
$48,538
AVG HOUSEHOLD INCOME
29.4%
WAGE / INCOME GAP [ % ]
70.6¢/ $1
WAGE / INCOME GAP [ $ ]
$17,442
FAMILY INCOME DEFICIT
0.34
INEQUALITY / GINI INDEX
9,324
TOTAL POPULATION
5,034
MALE POPULATION
4,290
FEMALE POPULATION
117.34
MALES / 100 FEMALES
85.22
FEMALES / 100 MALES
21.6
MEDIAN AGE
3.7
AVG FAMILY SIZE
3.3
AVG HOUSEHOLD SIZE
4,852
LABOR FORCE [ PEOPLE ]
82.5%
PERCENT IN LABOR FORCE
13.5%
UNEMPLOYMENT RATE
Fort Stewart Area Codes
Income in Fort Stewart
Income Overview in Fort Stewart
Per Capita Income in Fort Stewart is $18,963, while median incomes of families and households are $48,452 and $48,538 respectively.
| Characteristic | Number | Measure |
| Per Capita Income | 9,324 | $18,963 |
| Median Family Income | 1,950 | $48,452 |
| Mean Family Income | 1,950 | $53,150 |
| Median Household Income | 2,390 | $48,538 |
| Mean Household Income | 2,390 | $54,238 |
| Income Deficit | 1,950 | $17,442 |
| Wage / Income Gap (%) | 9,324 | 29.38% |
| Wage / Income Gap ($) | 9,324 | 70.62¢ per $1 |
| Gini / Inequality Index | 9,324 | 0.34 |
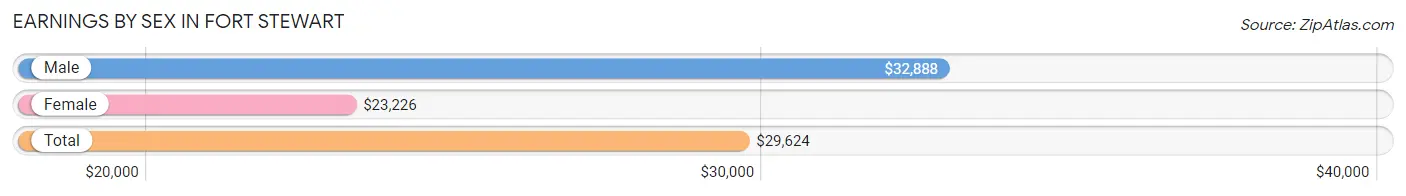
Earnings by Sex in Fort Stewart
Average Earnings in Fort Stewart are $29,624, $32,888 for men and $23,226 for women, a difference of 29.4%.
| Sex | Number | Average Earnings |
| Male | 3,346 (66.8%) | $32,888 |
| Female | 1,660 (33.2%) | $23,226 |
| Total | 5,006 (100.0%) | $29,624 |
Earnings by Sex by Income Bracket in Fort Stewart
The most common earnings brackets in Fort Stewart are $25,000 to $29,999 for men (711 | 21.2%) and $25,000 to $29,999 for women (210 | 12.7%).
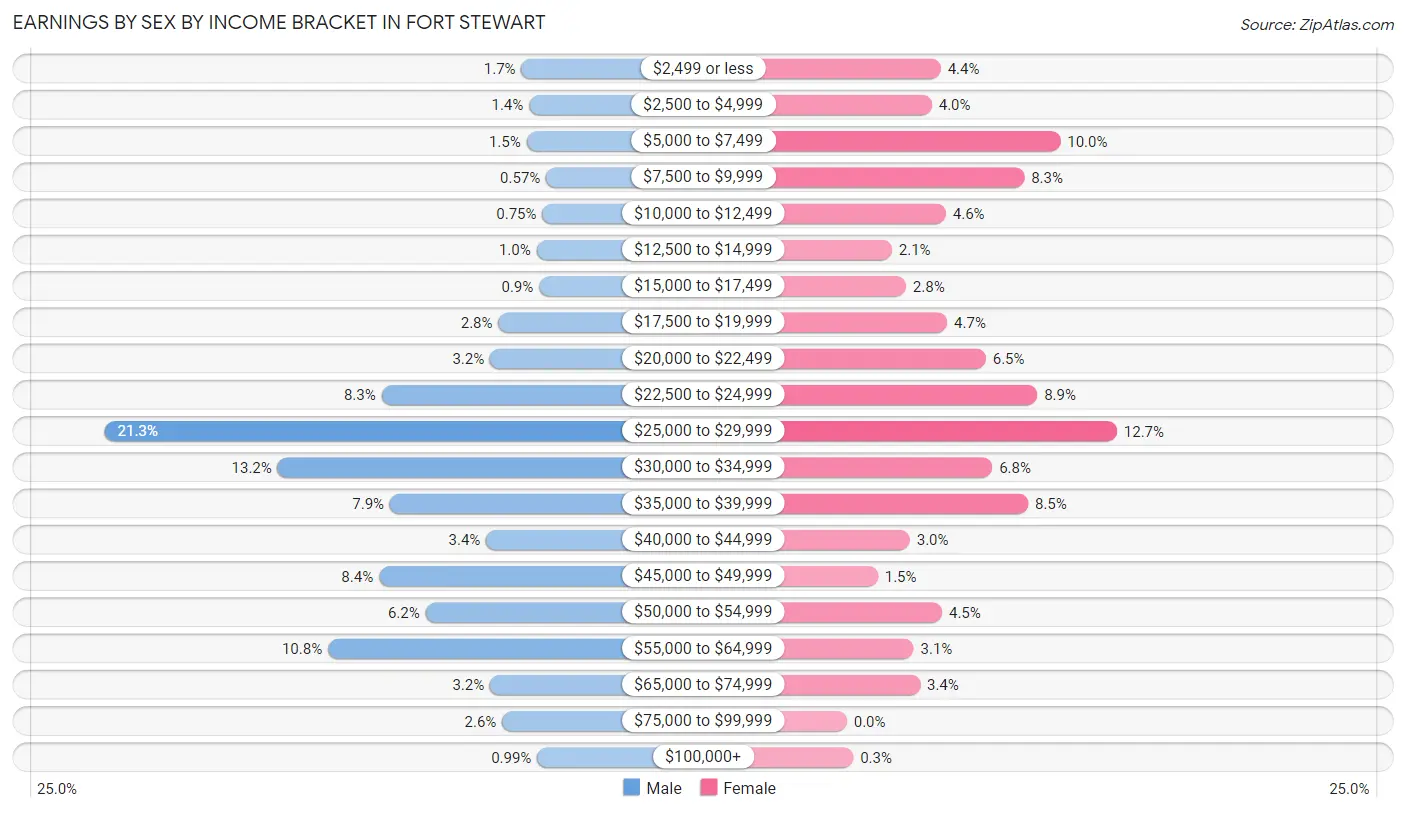
| Income | Male | Female |
| $2,499 or less | 58 (1.7%) | 73 (4.4%) |
| $2,500 to $4,999 | 46 (1.4%) | 66 (4.0%) |
| $5,000 to $7,499 | 50 (1.5%) | 166 (10.0%) |
| $7,500 to $9,999 | 19 (0.6%) | 138 (8.3%) |
| $10,000 to $12,499 | 25 (0.7%) | 77 (4.6%) |
| $12,500 to $14,999 | 34 (1.0%) | 35 (2.1%) |
| $15,000 to $17,499 | 30 (0.9%) | 46 (2.8%) |
| $17,500 to $19,999 | 94 (2.8%) | 78 (4.7%) |
| $20,000 to $22,499 | 107 (3.2%) | 108 (6.5%) |
| $22,500 to $24,999 | 277 (8.3%) | 148 (8.9%) |
| $25,000 to $29,999 | 711 (21.2%) | 210 (12.7%) |
| $30,000 to $34,999 | 440 (13.2%) | 113 (6.8%) |
| $35,000 to $39,999 | 264 (7.9%) | 141 (8.5%) |
| $40,000 to $44,999 | 113 (3.4%) | 49 (2.9%) |
| $45,000 to $49,999 | 281 (8.4%) | 24 (1.5%) |
| $50,000 to $54,999 | 208 (6.2%) | 74 (4.5%) |
| $55,000 to $64,999 | 361 (10.8%) | 52 (3.1%) |
| $65,000 to $74,999 | 107 (3.2%) | 57 (3.4%) |
| $75,000 to $99,999 | 88 (2.6%) | 0 (0.0%) |
| $100,000+ | 33 (1.0%) | 5 (0.3%) |
| Total | 3,346 (100.0%) | 1,660 (100.0%) |
Earnings by Sex by Educational Attainment in Fort Stewart
Average earnings in Fort Stewart are $45,560 for men and $26,483 for women, a difference of 41.9%. Men with an educational attainment of bachelor's degree enjoy the highest average annual earnings of $52,031, while those with high school diploma education earn the least with $37,065. Women with an educational attainment of graduate degree earn the most with the average annual earnings of $38,534, while those with less than high school education have the smallest earnings of $18,633.
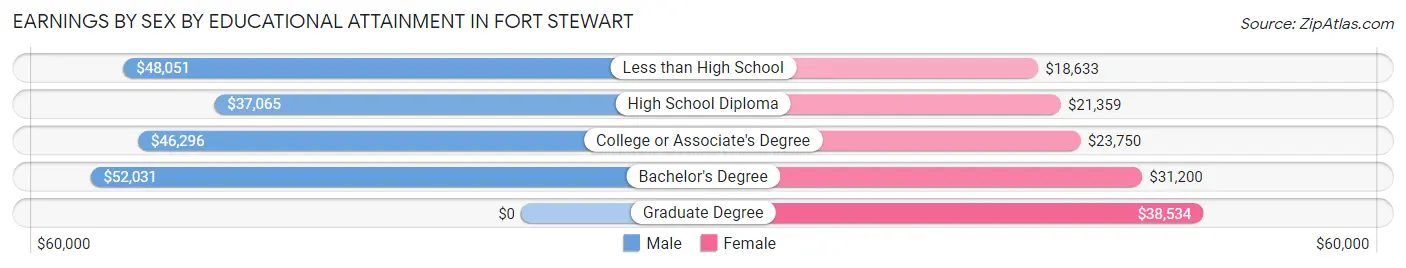
| Educational Attainment | Male Income | Female Income |
| Less than High School | $48,051 | $18,633 |
| High School Diploma | $37,065 | $21,359 |
| College or Associate's Degree | $46,296 | $23,750 |
| Bachelor's Degree | $52,031 | $31,200 |
| Graduate Degree | - | - |
| Total | $45,560 | $26,483 |
Family Income in Fort Stewart
Family Income Brackets in Fort Stewart
According to the Fort Stewart family income data, there are 566 families falling into the $35,000 to $49,999 income range, which is the most common income bracket and makes up 29.0% of all families. Conversely, the $200,000+ income bracket is the least frequent group with only 4 families (0.2%) belonging to this category.
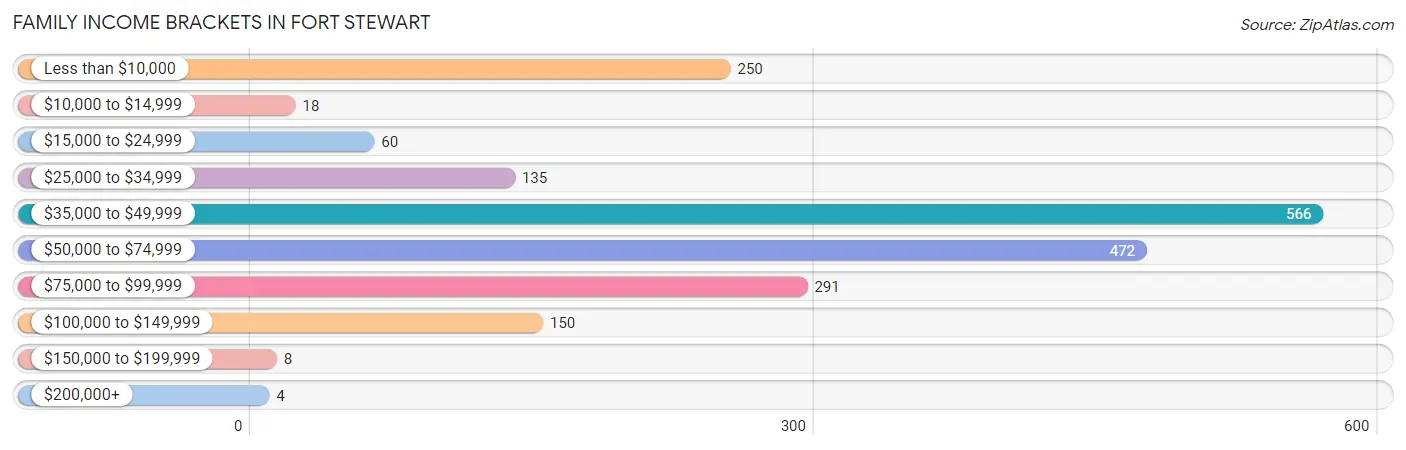
| Income Bracket | # Families | % Families |
| Less than $10,000 | 250 | 12.8% |
| $10,000 to $14,999 | 18 | 0.9% |
| $15,000 to $24,999 | 60 | 3.1% |
| $25,000 to $34,999 | 135 | 6.9% |
| $35,000 to $49,999 | 566 | 29.0% |
| $50,000 to $74,999 | 472 | 24.2% |
| $75,000 to $99,999 | 291 | 14.9% |
| $100,000 to $149,999 | 150 | 7.7% |
| $150,000 to $199,999 | 8 | 0.4% |
| $200,000+ | 4 | 0.2% |
Family Income by Famaliy Size in Fort Stewart
7+ person families (45 | 2.3%) account for the highest median family income in Fort Stewart with $72,891 per family, while 2-person families (493 | 25.3%) have the highest median income of $22,062 per family member.
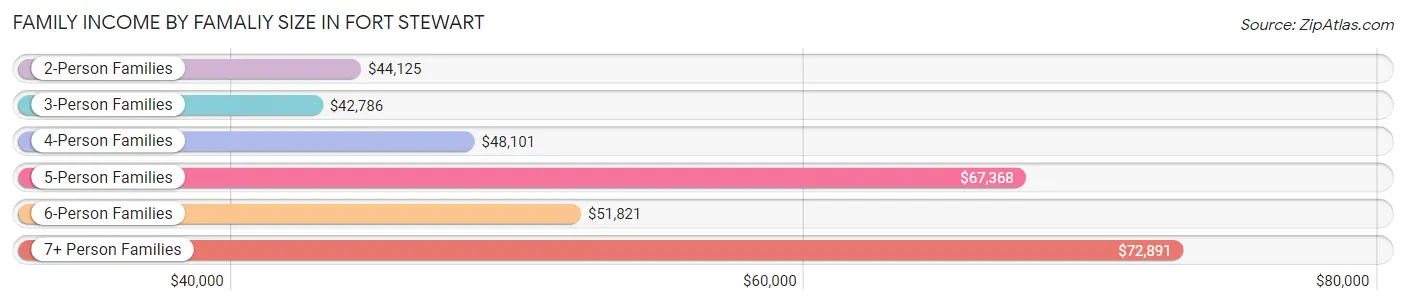
| Income Bracket | # Families | Median Income |
| 2-Person Families | 493 (25.3%) | $44,125 |
| 3-Person Families | 532 (27.3%) | $42,786 |
| 4-Person Families | 527 (27.0%) | $48,101 |
| 5-Person Families | 234 (12.0%) | $67,368 |
| 6-Person Families | 119 (6.1%) | $51,821 |
| 7+ Person Families | 45 (2.3%) | $72,891 |
| Total | 1,950 (100.0%) | $48,452 |
Family Income by Number of Earners in Fort Stewart
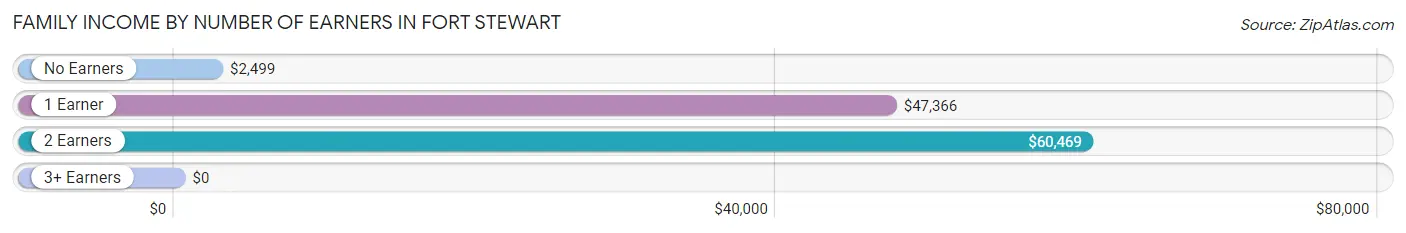
| Number of Earners | # Families | Median Income |
| No Earners | 197 (10.1%) | $2,499 |
| 1 Earner | 590 (30.3%) | $47,366 |
| 2 Earners | 1,157 (59.3%) | $60,469 |
| 3+ Earners | 6 (0.3%) | $0 |
| Total | 1,950 (100.0%) | $48,452 |
Household Income in Fort Stewart
Household Income Brackets in Fort Stewart
With 686 households falling in the category, the $35,000 to $49,999 income range is the most frequent in Fort Stewart, accounting for 28.7% of all households. In contrast, only 7 households (0.3%) fall into the $150,000 to $199,999 income bracket, making it the least populous group.
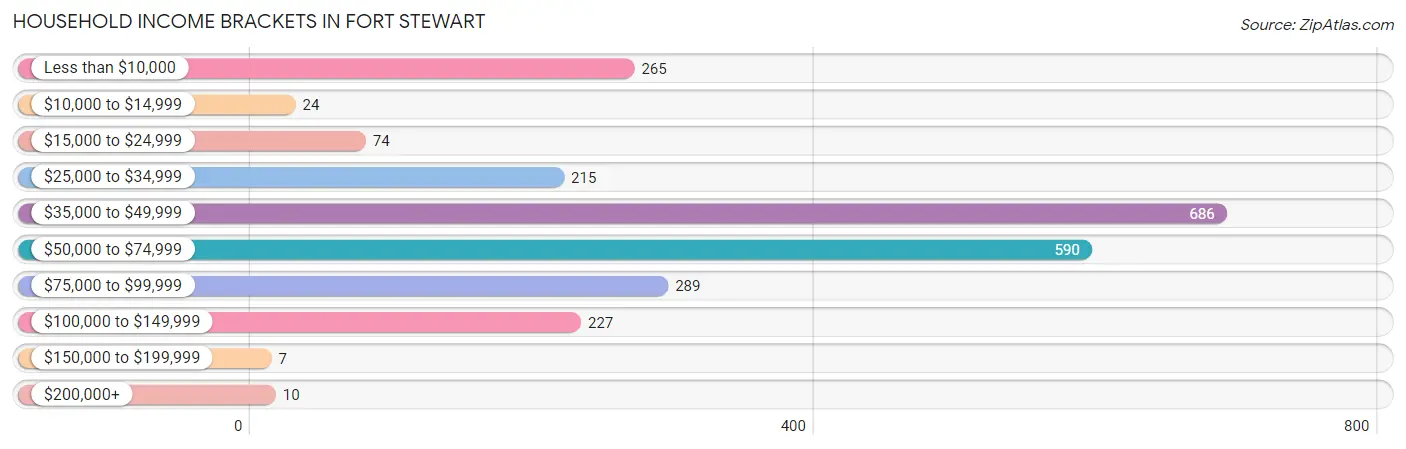
| Income Bracket | # Households | % Households |
| Less than $10,000 | 265 | 11.1% |
| $10,000 to $14,999 | 24 | 1.0% |
| $15,000 to $24,999 | 74 | 3.1% |
| $25,000 to $34,999 | 215 | 9.0% |
| $35,000 to $49,999 | 686 | 28.7% |
| $50,000 to $74,999 | 590 | 24.7% |
| $75,000 to $99,999 | 289 | 12.1% |
| $100,000 to $149,999 | 227 | 9.5% |
| $150,000 to $199,999 | 7 | 0.3% |
| $200,000+ | 10 | 0.4% |
Household Income by Householder Age in Fort Stewart
The median household income in Fort Stewart is $48,538, with the highest median household income of $50,868 found in the 25 to 44 years age bracket for the primary householder. A total of 1,572 households (65.8%) fall into this category. Meanwhile, the 45 to 64 years age bracket for the primary householder has the lowest median household income of $0, with 170 households (7.1%) in this group.
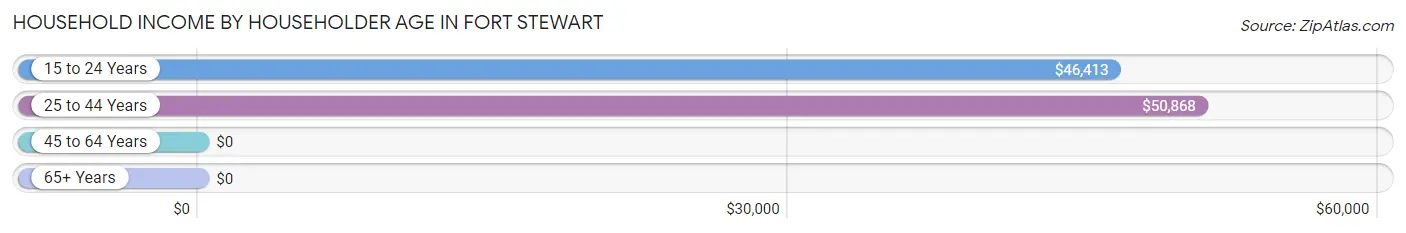
| Income Bracket | # Households | Median Income |
| 15 to 24 Years | 642 (26.9%) | $46,413 |
| 25 to 44 Years | 1,572 (65.8%) | $50,868 |
| 45 to 64 Years | 170 (7.1%) | $0 |
| 65+ Years | 6 (0.3%) | $0 |
| Total | 2,390 (100.0%) | $48,538 |
Poverty in Fort Stewart
Income Below Poverty by Sex and Age in Fort Stewart
With 10.2% poverty level for males and 19.9% for females among the residents of Fort Stewart, under 5 year old males and 6 to 11 year old females are the most vulnerable to poverty, with 165 males (19.4%) and 286 females (36.6%) in their respective age groups living below the poverty level.
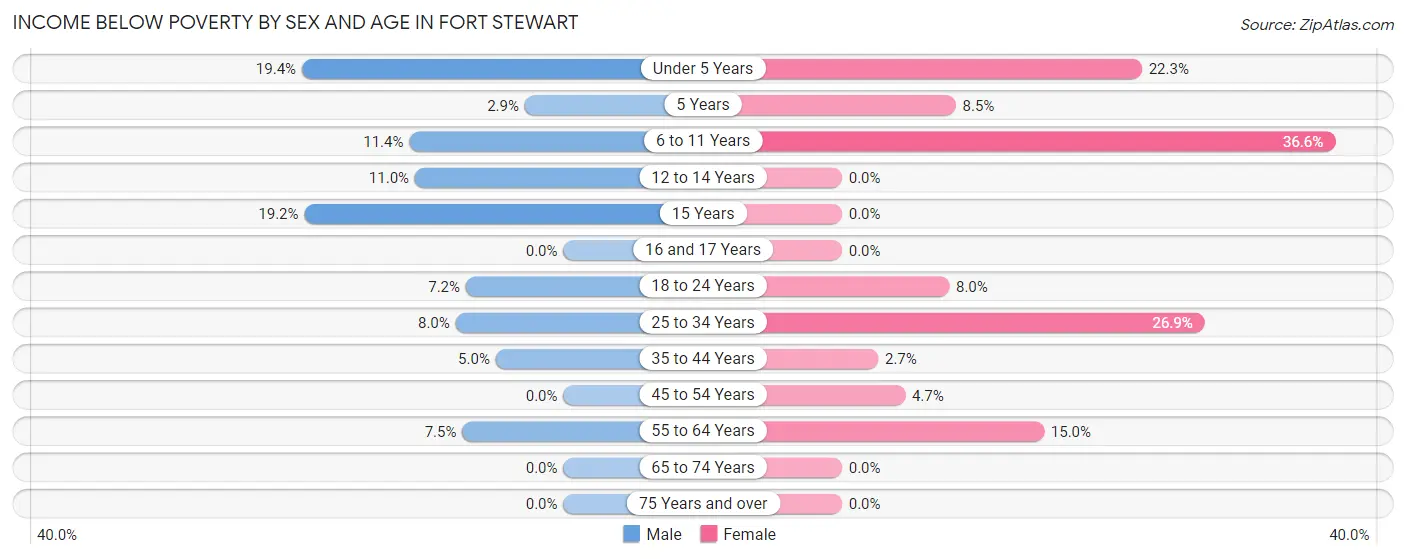
| Age Bracket | Male | Female |
| Under 5 Years | 165 (19.4%) | 165 (22.3%) |
| 5 Years | 3 (2.9%) | 12 (8.5%) |
| 6 to 11 Years | 58 (11.4%) | 286 (36.6%) |
| 12 to 14 Years | 13 (11.0%) | 0 (0.0%) |
| 15 Years | 5 (19.2%) | 0 (0.0%) |
| 16 and 17 Years | 0 (0.0%) | 0 (0.0%) |
| 18 to 24 Years | 49 (7.2%) | 58 (8.0%) |
| 25 to 34 Years | 72 (8.0%) | 247 (26.9%) |
| 35 to 44 Years | 21 (5.0%) | 9 (2.7%) |
| 45 to 54 Years | 0 (0.0%) | 3 (4.7%) |
| 55 to 64 Years | 3 (7.5%) | 12 (15.0%) |
| 65 to 74 Years | 0 (0.0%) | 0 (0.0%) |
| 75 Years and over | 0 (0.0%) | 0 (0.0%) |
| Total | 389 (10.2%) | 792 (19.9%) |
Income Above Poverty by Sex and Age in Fort Stewart
According to the poverty statistics in Fort Stewart, males aged 16 and 17 years and females aged 12 to 14 years are the age groups that are most secure financially, with 100.0% of males and 100.0% of females in these age groups living above the poverty line.
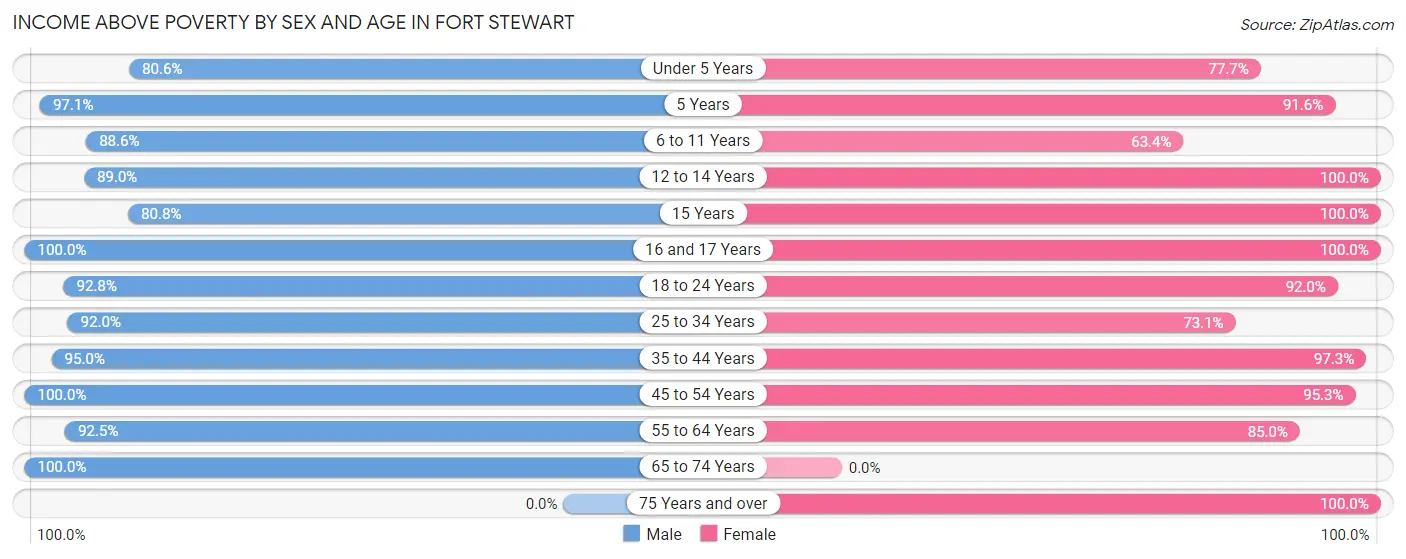
| Age Bracket | Male | Female |
| Under 5 Years | 685 (80.6%) | 576 (77.7%) |
| 5 Years | 102 (97.1%) | 130 (91.5%) |
| 6 to 11 Years | 449 (88.6%) | 495 (63.4%) |
| 12 to 14 Years | 105 (89.0%) | 141 (100.0%) |
| 15 Years | 21 (80.8%) | 32 (100.0%) |
| 16 and 17 Years | 82 (100.0%) | 15 (100.0%) |
| 18 to 24 Years | 628 (92.8%) | 671 (92.0%) |
| 25 to 34 Years | 828 (92.0%) | 670 (73.1%) |
| 35 to 44 Years | 397 (95.0%) | 326 (97.3%) |
| 45 to 54 Years | 80 (100.0%) | 61 (95.3%) |
| 55 to 64 Years | 37 (92.5%) | 68 (85.0%) |
| 65 to 74 Years | 6 (100.0%) | 0 (0.0%) |
| 75 Years and over | 0 (0.0%) | 3 (100.0%) |
| Total | 3,420 (89.8%) | 3,188 (80.1%) |
Income Below Poverty Among Married-Couple Families in Fort Stewart
The poverty statistics for married-couple families in Fort Stewart show that 5.9% or 96 of the total 1,620 families live below the poverty line. Families with 3 or 4 children have the highest poverty rate of 9.8%, comprising of 33 families. On the other hand, families with 5 or more children have the lowest poverty rate of 0.0%, which includes 0 families.
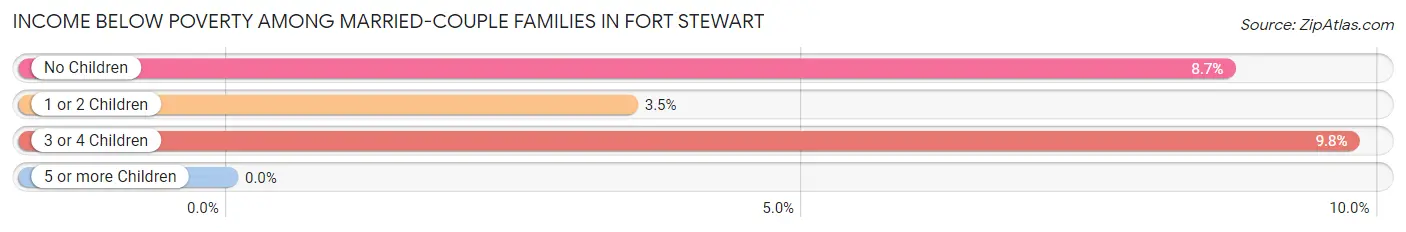
| Children | Above Poverty | Below Poverty |
| No Children | 347 (91.3%) | 33 (8.7%) |
| 1 or 2 Children | 833 (96.5%) | 30 (3.5%) |
| 3 or 4 Children | 305 (90.2%) | 33 (9.8%) |
| 5 or more Children | 39 (100.0%) | 0 (0.0%) |
| Total | 1,524 (94.1%) | 96 (5.9%) |
Income Below Poverty Among Single-Parent Households in Fort Stewart
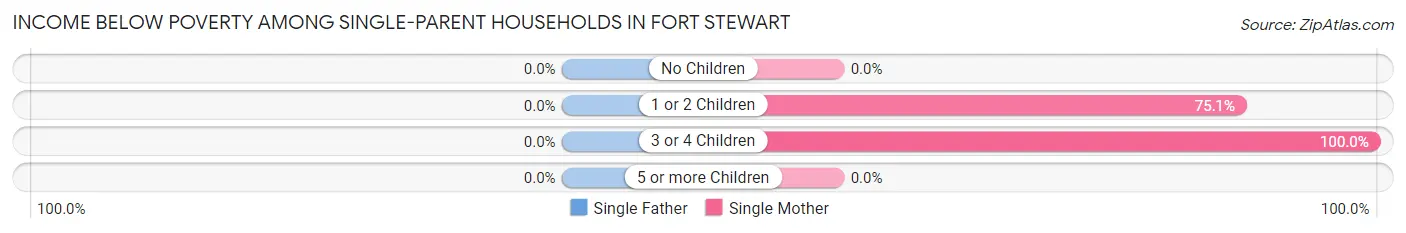
| Children | Single Father | Single Mother |
| No Children | 0 (0.0%) | 0 (0.0%) |
| 1 or 2 Children | 0 (0.0%) | 205 (75.1%) |
| 3 or 4 Children | 0 (0.0%) | 23 (100.0%) |
| 5 or more Children | 0 (0.0%) | 0 (0.0%) |
| Total | 0 (0.0%) | 228 (72.6%) |
Income Below Poverty Among Married-Couple vs Single-Parent Households in Fort Stewart
The poverty data for Fort Stewart shows that 96 of the married-couple family households (5.9%) and 228 of the single-parent households (69.1%) are living below the poverty level. Within the married-couple family households, those with 3 or 4 children have the highest poverty rate, with 33 households (9.8%) falling below the poverty line. Among the single-parent households, those with 3 or 4 children have the highest poverty rate, with 23 household (100.0%) living below poverty.
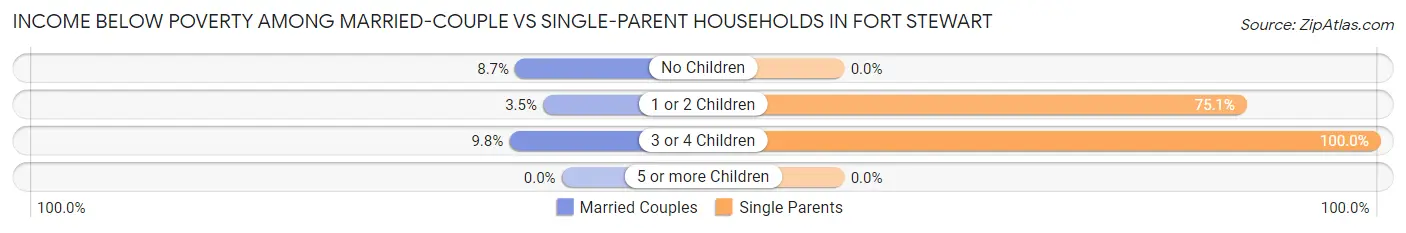
| Children | Married-Couple Families | Single-Parent Households |
| No Children | 33 (8.7%) | 0 (0.0%) |
| 1 or 2 Children | 30 (3.5%) | 205 (75.1%) |
| 3 or 4 Children | 33 (9.8%) | 23 (100.0%) |
| 5 or more Children | 0 (0.0%) | 0 (0.0%) |
| Total | 96 (5.9%) | 228 (69.1%) |
Race in Fort Stewart
The most populous races in Fort Stewart are White / Caucasian (4,829 | 51.8%), Hispanic or Latino (2,247 | 24.1%), and Black / African American (1,807 | 19.4%).
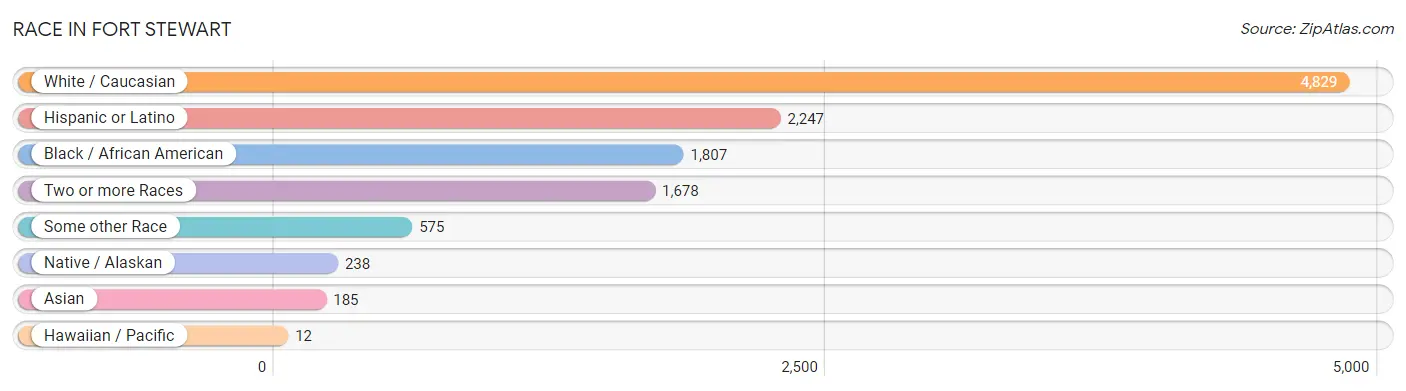
| Race | # Population | % Population |
| Asian | 185 | 2.0% |
| Black / African American | 1,807 | 19.4% |
| Hawaiian / Pacific | 12 | 0.1% |
| Hispanic or Latino | 2,247 | 24.1% |
| Native / Alaskan | 238 | 2.5% |
| White / Caucasian | 4,829 | 51.8% |
| Two or more Races | 1,678 | 18.0% |
| Some other Race | 575 | 6.2% |
| Total | 9,324 | 100.0% |
Ancestry in Fort Stewart
The most populous ancestries reported in Fort Stewart are Mexican (1,093 | 11.7%), German (647 | 6.9%), American (548 | 5.9%), Irish (441 | 4.7%), and Puerto Rican (358 | 3.8%), together accounting for 33.1% of all Fort Stewart residents.
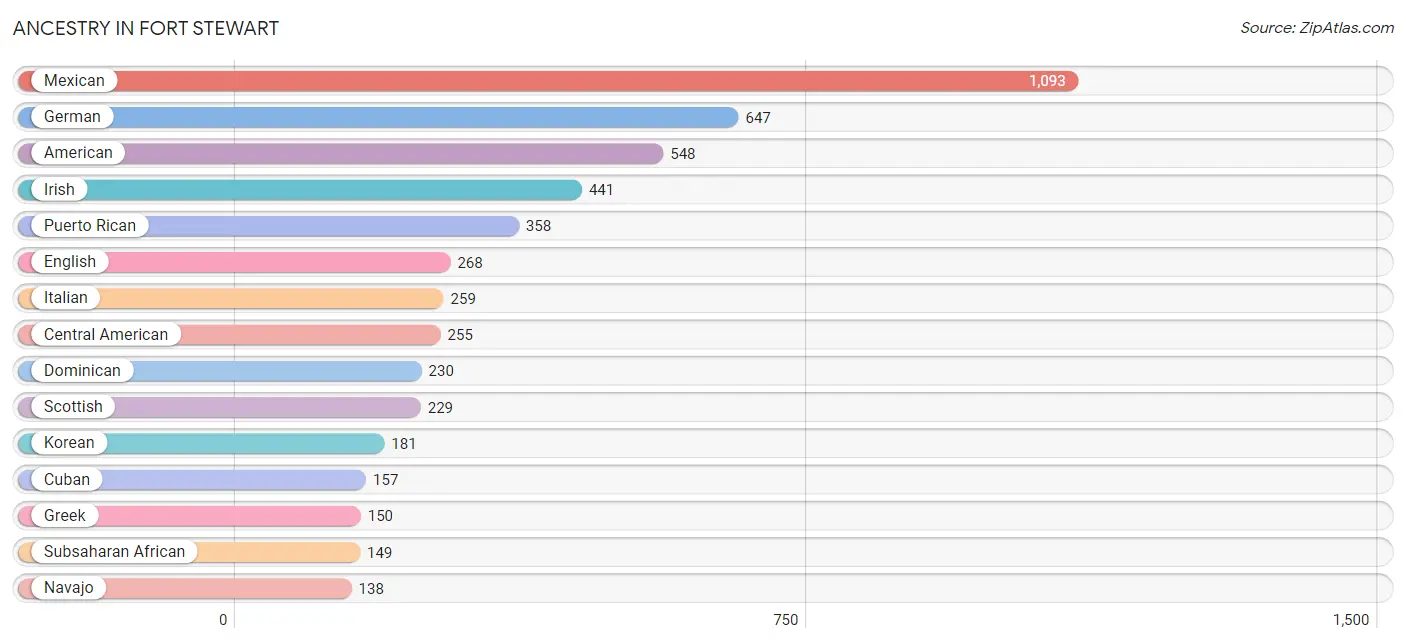
| Ancestry | # Population | % Population |
| African | 100 | 1.1% |
| American | 548 | 5.9% |
| Armenian | 3 | 0.0% |
| Bhutanese | 6 | 0.1% |
| British | 58 | 0.6% |
| Central American | 255 | 2.7% |
| Central American Indian | 137 | 1.5% |
| Cherokee | 54 | 0.6% |
| Colombian | 51 | 0.5% |
| Cuban | 157 | 1.7% |
| Czech | 12 | 0.1% |
| Dominican | 230 | 2.5% |
| Dutch | 13 | 0.1% |
| Eastern European | 22 | 0.2% |
| English | 268 | 2.9% |
| European | 123 | 1.3% |
| Finnish | 92 | 1.0% |
| French | 119 | 1.3% |
| French Canadian | 8 | 0.1% |
| German | 647 | 6.9% |
| Greek | 150 | 1.6% |
| Guamanian / Chamorro | 8 | 0.1% |
| Guatemalan | 111 | 1.2% |
| Haitian | 41 | 0.4% |
| Indian (Asian) | 52 | 0.6% |
| Irish | 441 | 4.7% |
| Israeli | 69 | 0.7% |
| Italian | 259 | 2.8% |
| Jamaican | 44 | 0.5% |
| Korean | 181 | 1.9% |
| Lithuanian | 8 | 0.1% |
| Mexican | 1,093 | 11.7% |
| Native Hawaiian | 21 | 0.2% |
| Navajo | 138 | 1.5% |
| Nicaraguan | 50 | 0.5% |
| Nigerian | 9 | 0.1% |
| Northern European | 11 | 0.1% |
| Norwegian | 3 | 0.0% |
| Panamanian | 67 | 0.7% |
| Peruvian | 26 | 0.3% |
| Polish | 43 | 0.5% |
| Puerto Rican | 358 | 3.8% |
| Romanian | 8 | 0.1% |
| Russian | 15 | 0.2% |
| Salvadoran | 27 | 0.3% |
| Scotch-Irish | 57 | 0.6% |
| Scottish | 229 | 2.5% |
| Seminole | 4 | 0.0% |
| South American | 77 | 0.8% |
| Spaniard | 67 | 0.7% |
| Sri Lankan | 20 | 0.2% |
| Subsaharan African | 149 | 1.6% |
| Sudanese | 5 | 0.1% |
| Swedish | 13 | 0.1% |
| Trinidadian and Tobagonian | 9 | 0.1% |
| West Indian | 18 | 0.2% | View All 56 Rows |
Immigrants in Fort Stewart
The most numerous immigrant groups reported in Fort Stewart came from Latin America (539 | 5.8%), Central America (271 | 2.9%), Caribbean (263 | 2.8%), Dominican Republic (205 | 2.2%), and Mexico (161 | 1.7%), together accounting for 15.4% of all Fort Stewart residents.
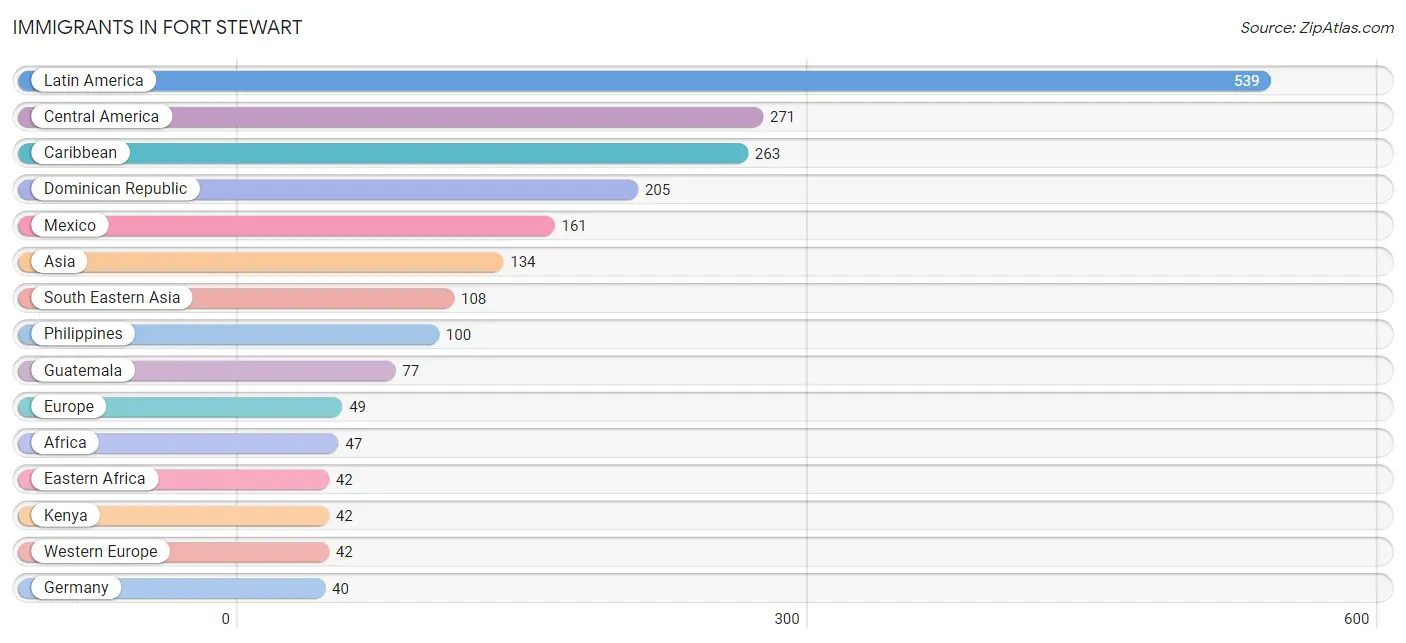
| Immigration Origin | # Population | % Population |
| Africa | 47 | 0.5% |
| Asia | 134 | 1.4% |
| Caribbean | 263 | 2.8% |
| Central America | 271 | 2.9% |
| China | 19 | 0.2% |
| Colombia | 5 | 0.1% |
| Cuba | 29 | 0.3% |
| Dominican Republic | 205 | 2.2% |
| Eastern Africa | 42 | 0.4% |
| Eastern Asia | 19 | 0.2% |
| Europe | 49 | 0.5% |
| France | 2 | 0.0% |
| Germany | 40 | 0.4% |
| Guatemala | 77 | 0.8% |
| Jamaica | 20 | 0.2% |
| Kenya | 42 | 0.4% |
| Latin America | 539 | 5.8% |
| Mexico | 161 | 1.7% |
| Nicaragua | 22 | 0.2% |
| Northern Africa | 5 | 0.1% |
| Northern Europe | 7 | 0.1% |
| Oceania | 5 | 0.1% |
| Panama | 11 | 0.1% |
| Philippines | 100 | 1.1% |
| South America | 5 | 0.1% |
| South Central Asia | 7 | 0.1% |
| South Eastern Asia | 108 | 1.2% |
| Sudan | 5 | 0.1% |
| Trinidad and Tobago | 9 | 0.1% |
| Uzbekistan | 7 | 0.1% |
| Vietnam | 8 | 0.1% |
| Western Europe | 42 | 0.4% | View All 32 Rows |
Sex and Age in Fort Stewart
Sex and Age in Fort Stewart
The most populous age groups in Fort Stewart are 20 to 24 Years (1,395 | 27.7%) for men and 20 to 24 Years (891 | 20.8%) for women.
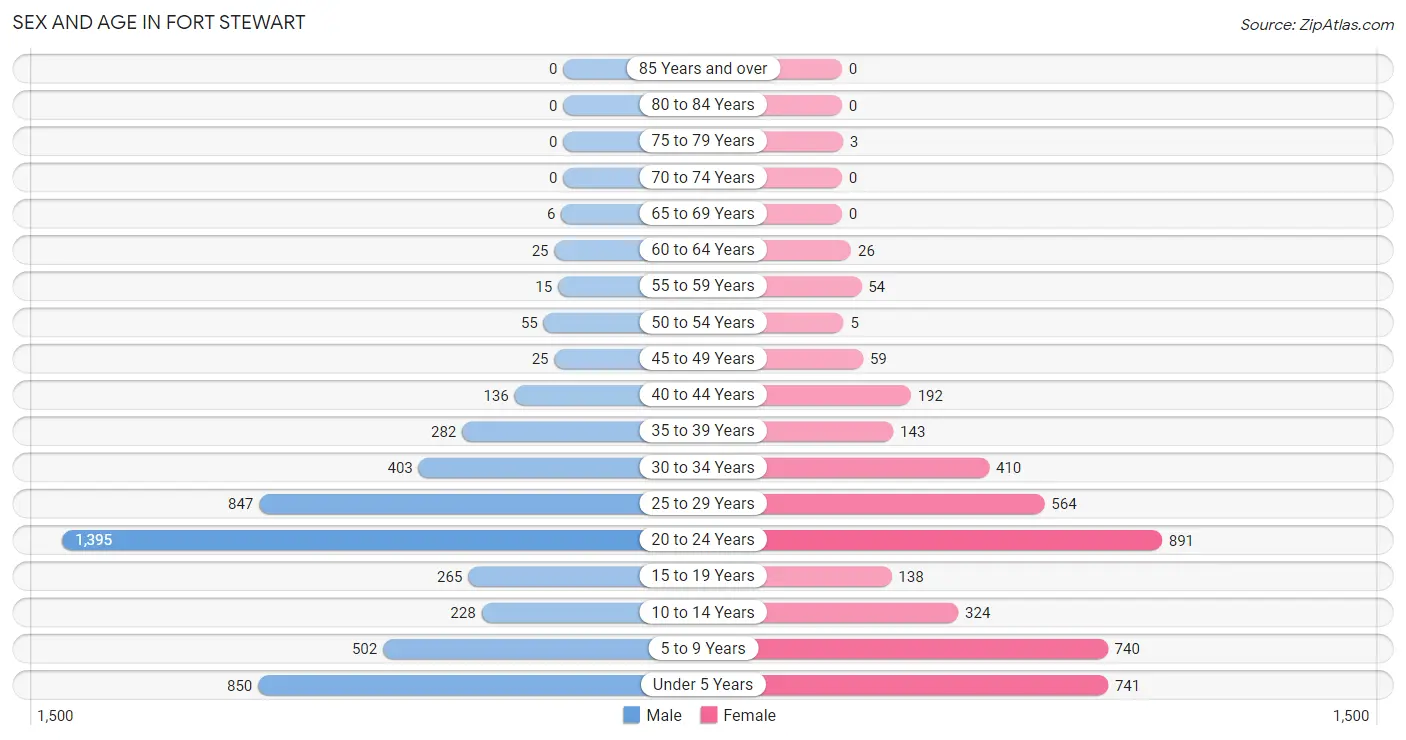
| Age Bracket | Male | Female |
| Under 5 Years | 850 (16.9%) | 741 (17.3%) |
| 5 to 9 Years | 502 (10.0%) | 740 (17.2%) |
| 10 to 14 Years | 228 (4.5%) | 324 (7.5%) |
| 15 to 19 Years | 265 (5.3%) | 138 (3.2%) |
| 20 to 24 Years | 1,395 (27.7%) | 891 (20.8%) |
| 25 to 29 Years | 847 (16.8%) | 564 (13.2%) |
| 30 to 34 Years | 403 (8.0%) | 410 (9.6%) |
| 35 to 39 Years | 282 (5.6%) | 143 (3.3%) |
| 40 to 44 Years | 136 (2.7%) | 192 (4.5%) |
| 45 to 49 Years | 25 (0.5%) | 59 (1.4%) |
| 50 to 54 Years | 55 (1.1%) | 5 (0.1%) |
| 55 to 59 Years | 15 (0.3%) | 54 (1.3%) |
| 60 to 64 Years | 25 (0.5%) | 26 (0.6%) |
| 65 to 69 Years | 6 (0.1%) | 0 (0.0%) |
| 70 to 74 Years | 0 (0.0%) | 0 (0.0%) |
| 75 to 79 Years | 0 (0.0%) | 3 (0.1%) |
| 80 to 84 Years | 0 (0.0%) | 0 (0.0%) |
| 85 Years and over | 0 (0.0%) | 0 (0.0%) |
| Total | 5,034 (100.0%) | 4,290 (100.0%) |
Families and Households in Fort Stewart
Median Family Size in Fort Stewart
The median family size in Fort Stewart is 3.73 persons per family, with married-couple families (1,620 | 83.1%) accounting for the largest median family size of 3.8 persons per family. On the other hand, single male/father families (16 | 0.8%) represent the smallest median family size with 1.88 persons per family.
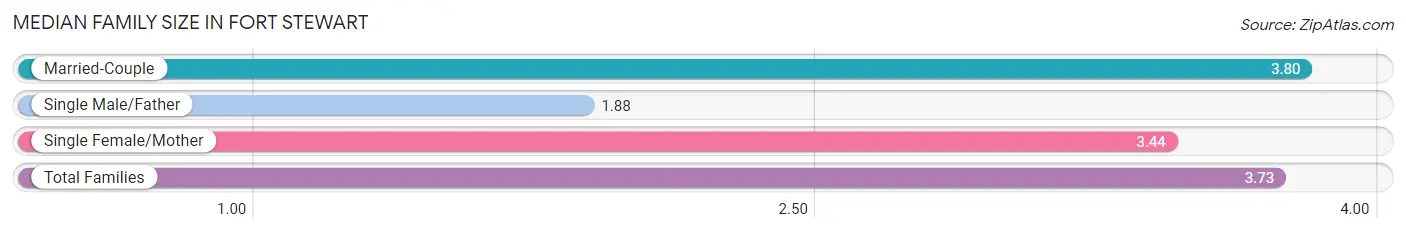
| Family Type | # Families | Family Size |
| Married-Couple | 1,620 (83.1%) | 3.80 |
| Single Male/Father | 16 (0.8%) | 1.88 |
| Single Female/Mother | 314 (16.1%) | 3.44 |
| Total Families | 1,950 (100.0%) | 3.73 |
Median Household Size in Fort Stewart
The median household size in Fort Stewart is 3.26 persons per household, with married-couple households (1,620 | 67.8%) accounting for the largest median household size of 3.8 persons per household. non-family households (440 | 18.4%) represent the smallest median household size with 1.09 persons per household.
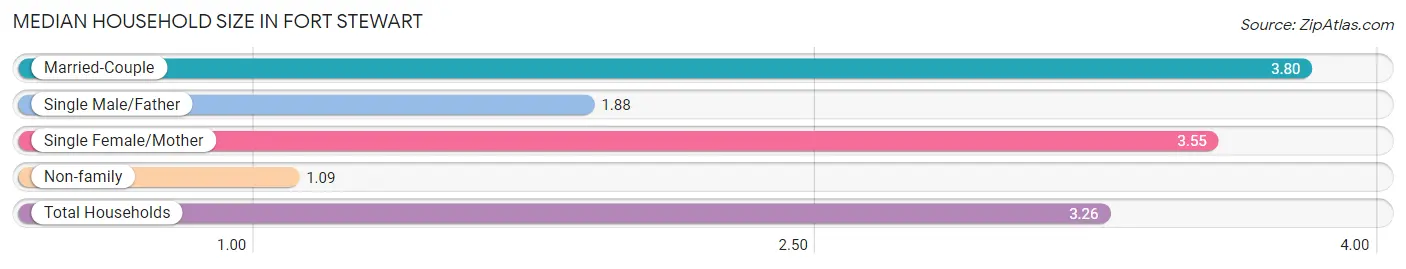
| Household Type | # Households | Household Size |
| Married-Couple | 1,620 (67.8%) | 3.80 |
| Single Male/Father | 16 (0.7%) | 1.88 |
| Single Female/Mother | 314 (13.1%) | 3.55 |
| Non-family | 440 (18.4%) | 1.09 |
| Total Households | 2,390 (100.0%) | 3.26 |
Household Size by Marriage Status in Fort Stewart
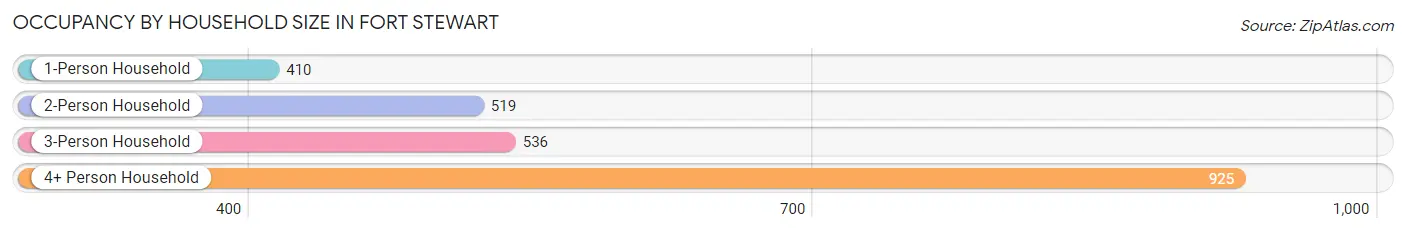
Out of a total of 2,390 households in Fort Stewart, 1,950 (81.6%) are family households, while 440 (18.4%) are nonfamily households. The most numerous type of family households are 3-person households, comprising 536, and the most common type of nonfamily households are 1-person households, comprising 410.
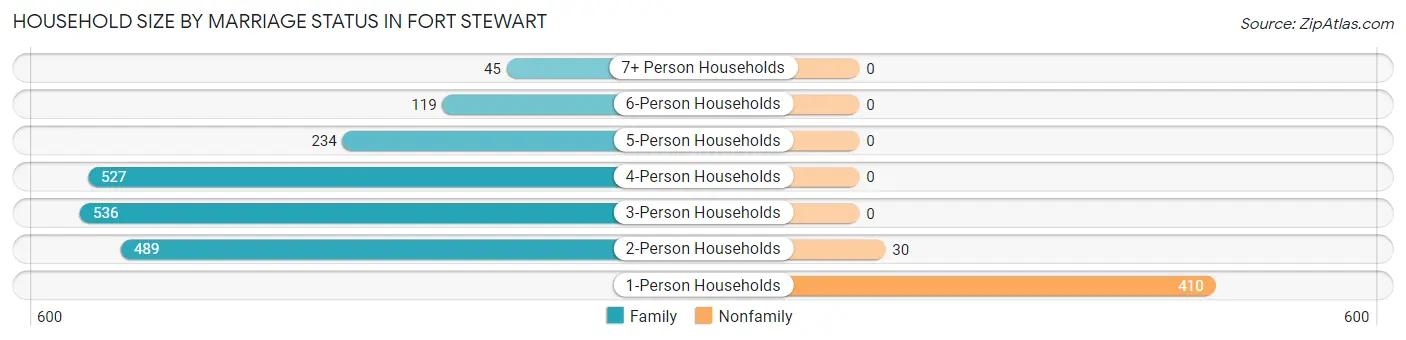
| Household Size | Family Households | Nonfamily Households |
| 1-Person Households | - | 410 (17.2%) |
| 2-Person Households | 489 (20.5%) | 30 (1.3%) |
| 3-Person Households | 536 (22.4%) | 0 (0.0%) |
| 4-Person Households | 527 (22.1%) | 0 (0.0%) |
| 5-Person Households | 234 (9.8%) | 0 (0.0%) |
| 6-Person Households | 119 (5.0%) | 0 (0.0%) |
| 7+ Person Households | 45 (1.9%) | 0 (0.0%) |
| Total | 1,950 (81.6%) | 440 (18.4%) |
Female Fertility in Fort Stewart
Fertility by Age in Fort Stewart
Average fertility rate in Fort Stewart is 151.0 births per 1,000 women. Women in the age bracket of 20 to 34 years have the highest fertility rate with 164.0 births per 1,000 women. Women in the age bracket of 20 to 34 years acount for 84.5% of all women with births.
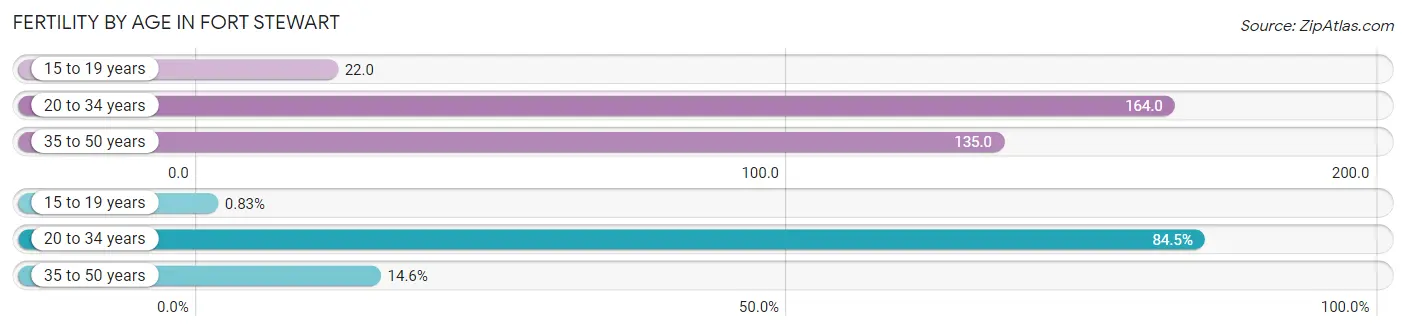
| Age Bracket | Women with Births | Births / 1,000 Women |
| 15 to 19 years | 3 (0.8%) | 22.0 |
| 20 to 34 years | 306 (84.5%) | 164.0 |
| 35 to 50 years | 53 (14.6%) | 135.0 |
| Total | 362 (100.0%) | 151.0 |
Fertility by Age by Marriage Status in Fort Stewart
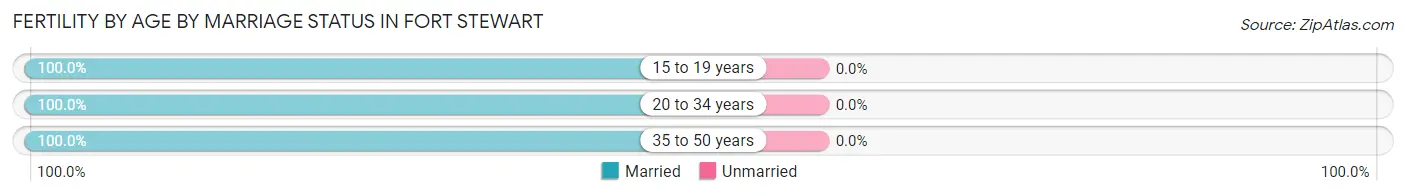
| Age Bracket | Married | Unmarried |
| 15 to 19 years | 3 (100.0%) | 0 (0.0%) |
| 20 to 34 years | 306 (100.0%) | 0 (0.0%) |
| 35 to 50 years | 53 (100.0%) | 0 (0.0%) |
| Total | 362 (100.0%) | 0 (0.0%) |
Fertility by Education in Fort Stewart
Average fertility rate in Fort Stewart is 151.0 births per 1,000 women. Women with the education attainment of graduate degree have the highest fertility rate of 684.0 births per 1,000 women, while women with the education attainment of high school diploma have the lowest fertility at 96.0 births per 1,000 women. Women with the education attainment of college or associate's degree represent 43.6% of all women with births.
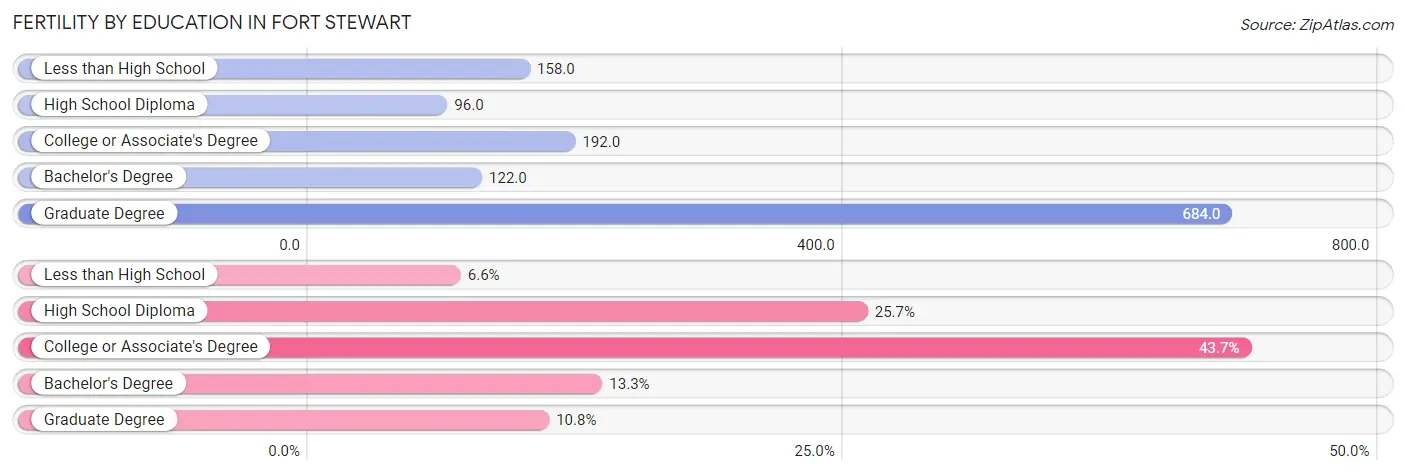
| Educational Attainment | Women with Births | Births / 1,000 Women |
| Less than High School | 24 (6.6%) | 158.0 |
| High School Diploma | 93 (25.7%) | 96.0 |
| College or Associate's Degree | 158 (43.6%) | 192.0 |
| Bachelor's Degree | 48 (13.3%) | 122.0 |
| Graduate Degree | 39 (10.8%) | 684.0 |
| Total | 362 (100.0%) | 151.0 |
Fertility by Education by Marriage Status in Fort Stewart
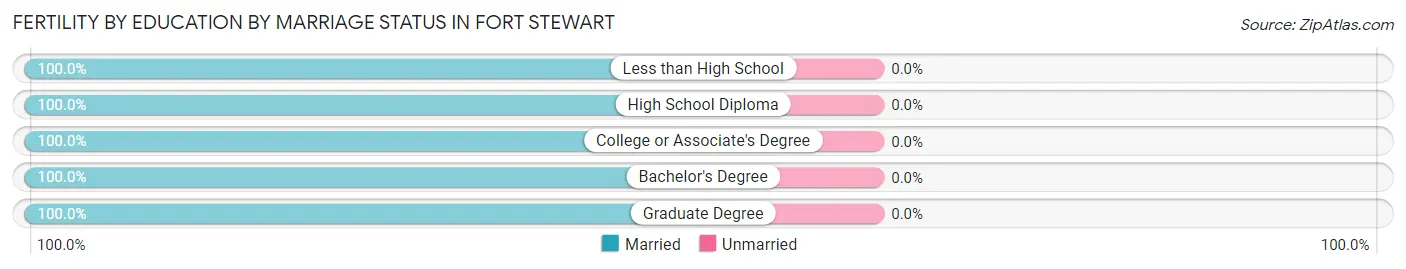
| Educational Attainment | Married | Unmarried |
| Less than High School | 24 (100.0%) | 0 (0.0%) |
| High School Diploma | 93 (100.0%) | 0 (0.0%) |
| College or Associate's Degree | 158 (100.0%) | 0 (0.0%) |
| Bachelor's Degree | 48 (100.0%) | 0 (0.0%) |
| Graduate Degree | 39 (100.0%) | 0 (0.0%) |
| Total | 362 (100.0%) | 0 (0.0%) |
Employment Characteristics in Fort Stewart
Employment by Class of Employer in Fort Stewart
Among the 4,431 employed individuals in Fort Stewart, federal government employees (3,264 | 73.7%), private company employees (928 | 20.9%), and local government employees (82 | 1.8%) make up the most common classes of employment.
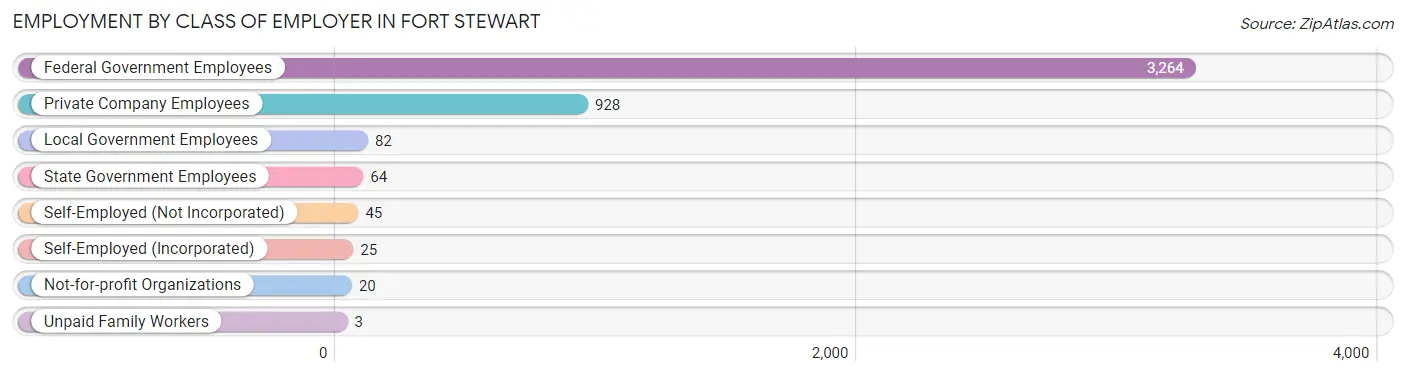
| Employer Class | # Employees | % Employees |
| Private Company Employees | 928 | 20.9% |
| Self-Employed (Incorporated) | 25 | 0.6% |
| Self-Employed (Not Incorporated) | 45 | 1.0% |
| Not-for-profit Organizations | 20 | 0.4% |
| Local Government Employees | 82 | 1.8% |
| State Government Employees | 64 | 1.4% |
| Federal Government Employees | 3,264 | 73.7% |
| Unpaid Family Workers | 3 | 0.1% |
| Total | 4,431 | 100.0% |
Employment Status by Age in Fort Stewart
According to the labor force statistics for Fort Stewart, out of the total population over 16 years of age (5,881), 82.5% or 4,852 individuals are in the labor force, with 13.5% or 655 of them unemployed. The age group with the highest labor force participation rate is 65 to 74 years, with 100.0% or 6 individuals in the labor force. Within the labor force, the 20 to 24 years age range has the highest percentage of unemployed individuals, with 26.1% or 524 of them being unemployed.
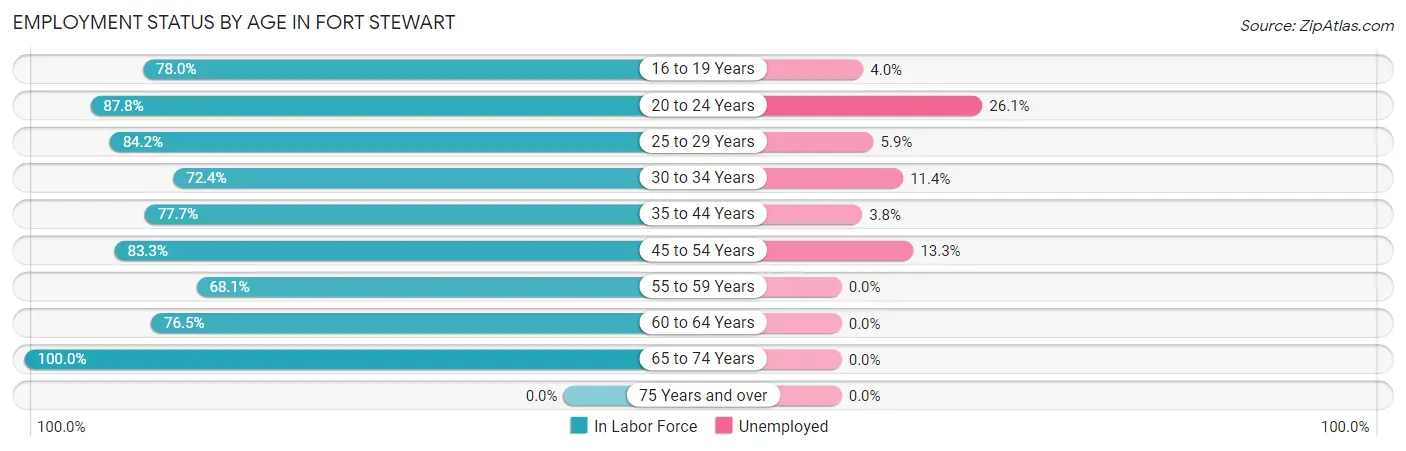
| Age Bracket | In Labor Force | Unemployed |
| 16 to 19 Years | 269 (78.0%) | 11 (4.0%) |
| 20 to 24 Years | 2,007 (87.8%) | 524 (26.1%) |
| 25 to 29 Years | 1,188 (84.2%) | 70 (5.9%) |
| 30 to 34 Years | 589 (72.4%) | 67 (11.4%) |
| 35 to 44 Years | 585 (77.7%) | 22 (3.8%) |
| 45 to 54 Years | 120 (83.3%) | 16 (13.3%) |
| 55 to 59 Years | 47 (68.1%) | 0 (0.0%) |
| 60 to 64 Years | 39 (76.5%) | 0 (0.0%) |
| 65 to 74 Years | 6 (100.0%) | 0 (0.0%) |
| 75 Years and over | 0 (0.0%) | 0 (0.0%) |
| Total | 4,852 (82.5%) | 655 (13.5%) |
Employment Status by Educational Attainment in Fort Stewart
According to labor force statistics for Fort Stewart, 79.2% of individuals (2,567) out of the total population between 25 and 64 years of age (3,241) are in the labor force, with 6.7% or 172 of them being unemployed. The group with the highest labor force participation rate are those with the educational attainment of bachelor's degree or higher, with 87.4% or 514 individuals in the labor force. Within the labor force, individuals with less than high school education have the highest percentage of unemployment, with 16.6% or 27 of them being unemployed.
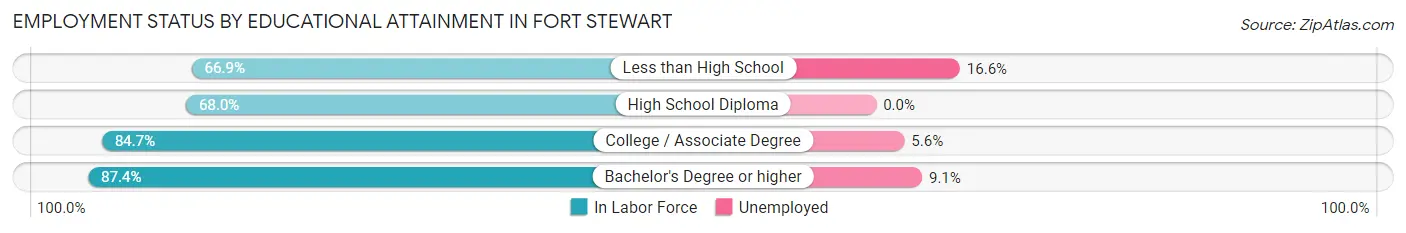
| Educational Attainment | In Labor Force | Unemployed |
| Less than High School | 162 (66.9%) | 40 (16.6%) |
| High School Diploma | 607 (68.0%) | 0 (0.0%) |
| College / Associate Degree | 1,286 (84.7%) | 85 (5.6%) |
| Bachelor's Degree or higher | 514 (87.4%) | 54 (9.1%) |
| Total | 2,567 (79.2%) | 217 (6.7%) |
Employment Occupations by Sex in Fort Stewart
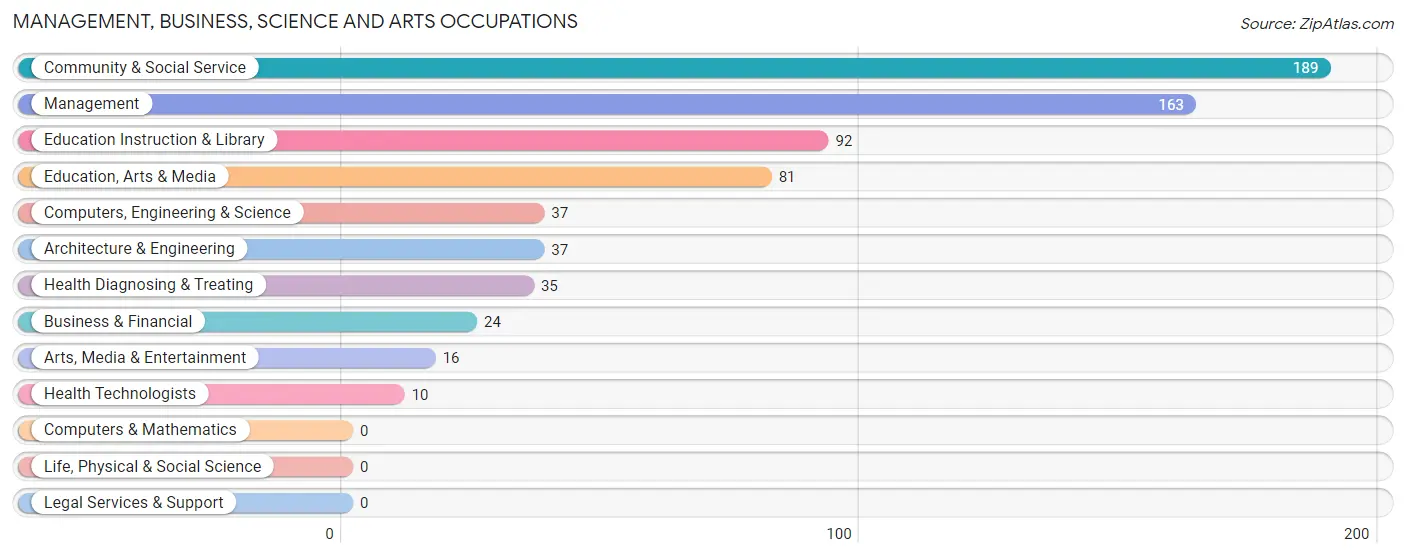
Management, Business, Science and Arts Occupations
The most common Management, Business, Science and Arts occupations in Fort Stewart are Community & Social Service (189 | 12.3%), Management (163 | 10.6%), Education Instruction & Library (92 | 6.0%), Education, Arts & Media (81 | 5.3%), and Computers, Engineering & Science (37 | 2.4%).
Management, Business, Science and Arts Occupations by Sex
Within the Management, Business, Science and Arts occupations in Fort Stewart, the most male-oriented occupations are Computers, Engineering & Science (100.0%), Architecture & Engineering (100.0%), and Education Instruction & Library (66.3%), while the most female-oriented occupations are Management (100.0%), Business & Financial (100.0%), and Arts, Media & Entertainment (100.0%).
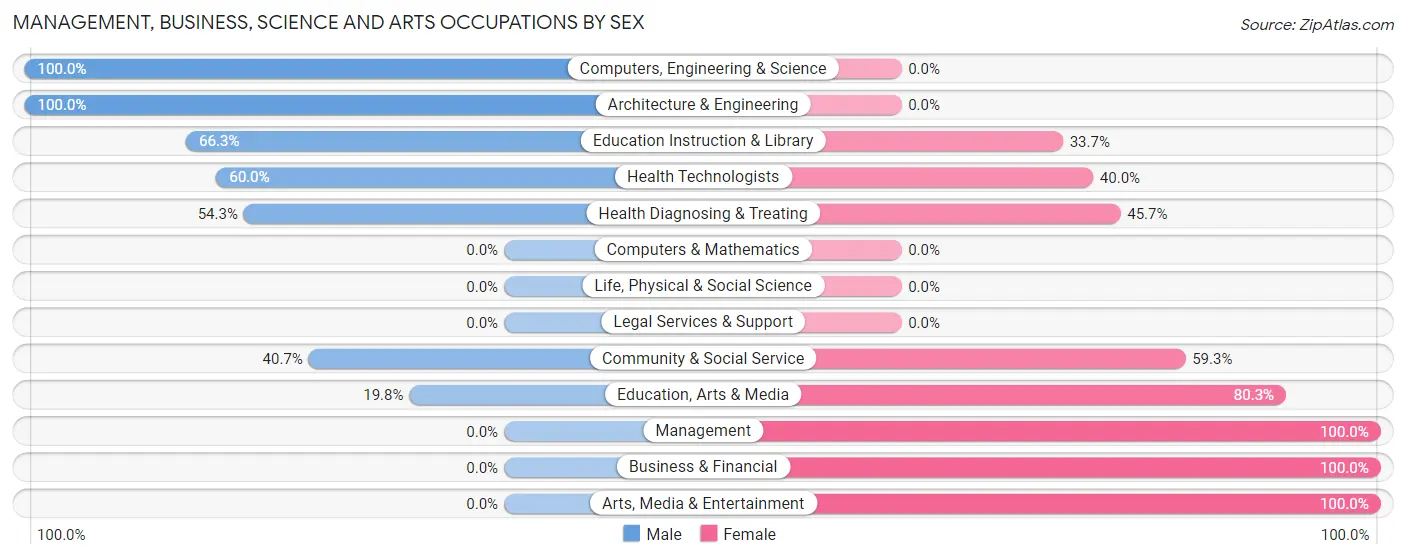
| Occupation | Male | Female |
| Management | 0 (0.0%) | 163 (100.0%) |
| Business & Financial | 0 (0.0%) | 24 (100.0%) |
| Computers, Engineering & Science | 37 (100.0%) | 0 (0.0%) |
| Computers & Mathematics | 0 (0.0%) | 0 (0.0%) |
| Architecture & Engineering | 37 (100.0%) | 0 (0.0%) |
| Life, Physical & Social Science | 0 (0.0%) | 0 (0.0%) |
| Community & Social Service | 77 (40.7%) | 112 (59.3%) |
| Education, Arts & Media | 16 (19.8%) | 65 (80.2%) |
| Legal Services & Support | 0 (0.0%) | 0 (0.0%) |
| Education Instruction & Library | 61 (66.3%) | 31 (33.7%) |
| Arts, Media & Entertainment | 0 (0.0%) | 16 (100.0%) |
| Health Diagnosing & Treating | 19 (54.3%) | 16 (45.7%) |
| Health Technologists | 6 (60.0%) | 4 (40.0%) |
| Total (Category) | 133 (29.7%) | 315 (70.3%) |
| Total (Overall) | 629 (41.0%) | 906 (59.0%) |
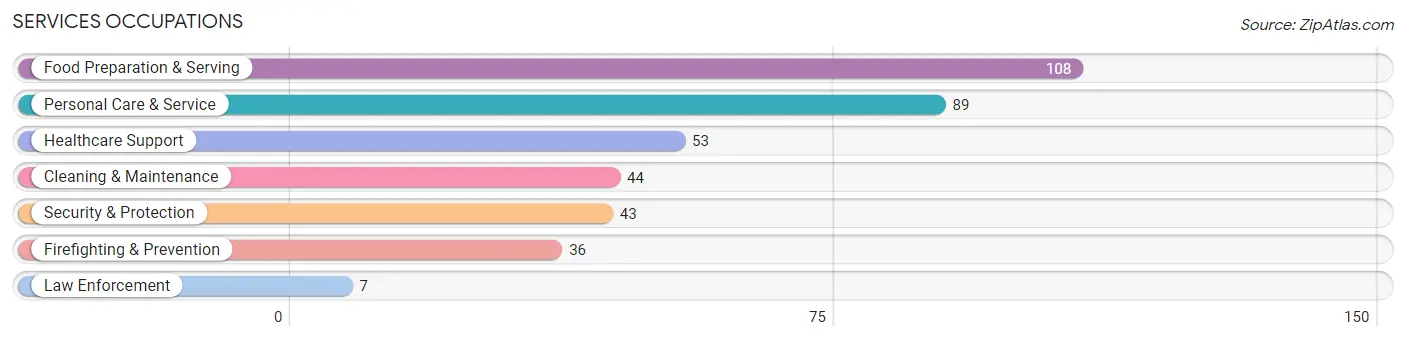
Services Occupations
The most common Services occupations in Fort Stewart are Food Preparation & Serving (108 | 7.0%), Personal Care & Service (89 | 5.8%), Healthcare Support (53 | 3.5%), Cleaning & Maintenance (44 | 2.9%), and Security & Protection (43 | 2.8%).
Services Occupations by Sex
Within the Services occupations in Fort Stewart, the most male-oriented occupations are Cleaning & Maintenance (27.3%), Firefighting & Prevention (25.0%), and Security & Protection (20.9%), while the most female-oriented occupations are Law Enforcement (100.0%), Personal Care & Service (100.0%), and Healthcare Support (88.7%).
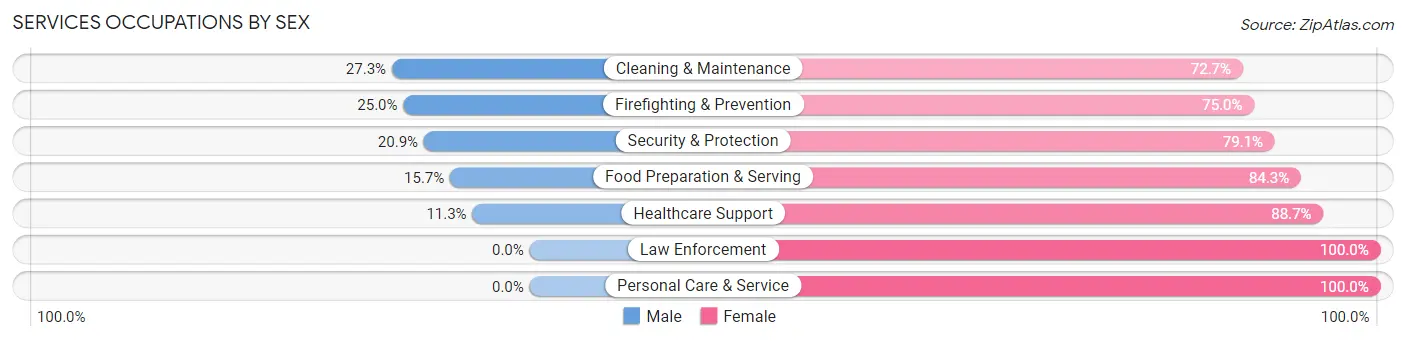
| Occupation | Male | Female |
| Healthcare Support | 6 (11.3%) | 47 (88.7%) |
| Security & Protection | 9 (20.9%) | 34 (79.1%) |
| Firefighting & Prevention | 9 (25.0%) | 27 (75.0%) |
| Law Enforcement | 0 (0.0%) | 7 (100.0%) |
| Food Preparation & Serving | 17 (15.7%) | 91 (84.3%) |
| Cleaning & Maintenance | 12 (27.3%) | 32 (72.7%) |
| Personal Care & Service | 0 (0.0%) | 89 (100.0%) |
| Total (Category) | 44 (13.1%) | 293 (86.9%) |
| Total (Overall) | 629 (41.0%) | 906 (59.0%) |
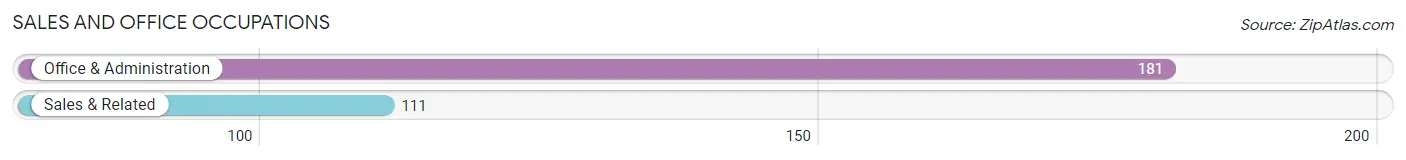
Sales and Office Occupations
The most common Sales and Office occupations in Fort Stewart are Office & Administration (181 | 11.8%), and Sales & Related (111 | 7.2%).
Sales and Office Occupations by Sex
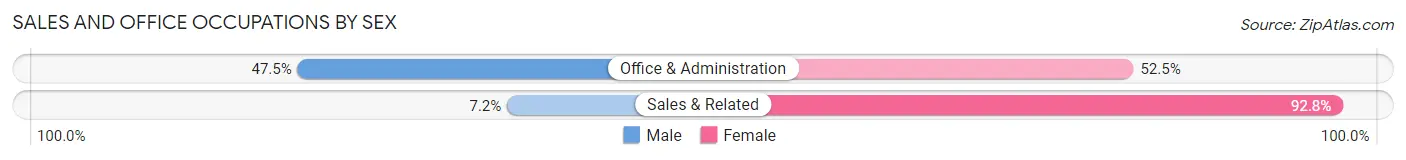
| Occupation | Male | Female |
| Sales & Related | 8 (7.2%) | 103 (92.8%) |
| Office & Administration | 86 (47.5%) | 95 (52.5%) |
| Total (Category) | 94 (32.2%) | 198 (67.8%) |
| Total (Overall) | 629 (41.0%) | 906 (59.0%) |
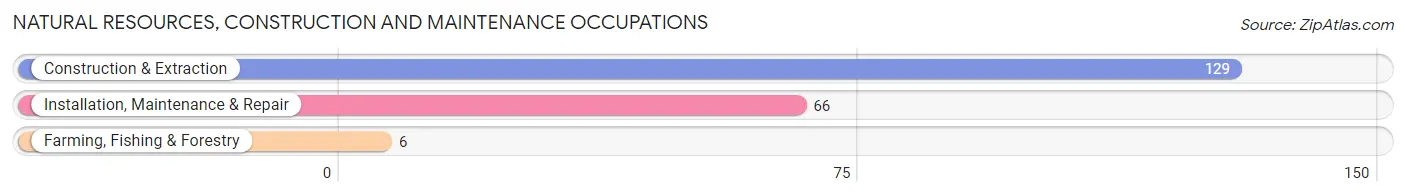
Natural Resources, Construction and Maintenance Occupations
The most common Natural Resources, Construction and Maintenance occupations in Fort Stewart are Construction & Extraction (129 | 8.4%), Installation, Maintenance & Repair (66 | 4.3%), and Farming, Fishing & Forestry (6 | 0.4%).
Natural Resources, Construction and Maintenance Occupations by Sex
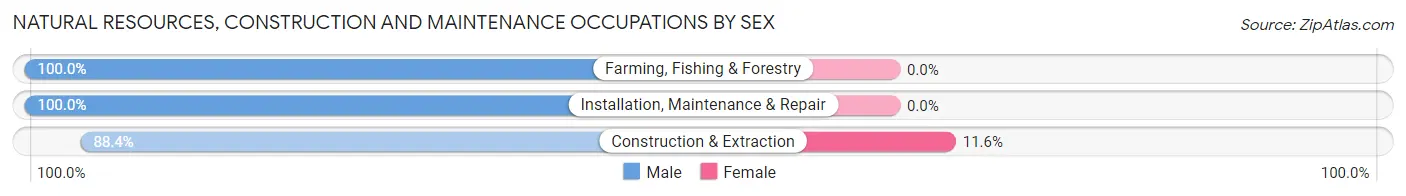
| Occupation | Male | Female |
| Farming, Fishing & Forestry | 6 (100.0%) | 0 (0.0%) |
| Construction & Extraction | 114 (88.4%) | 15 (11.6%) |
| Installation, Maintenance & Repair | 66 (100.0%) | 0 (0.0%) |
| Total (Category) | 186 (92.5%) | 15 (7.5%) |
| Total (Overall) | 629 (41.0%) | 906 (59.0%) |
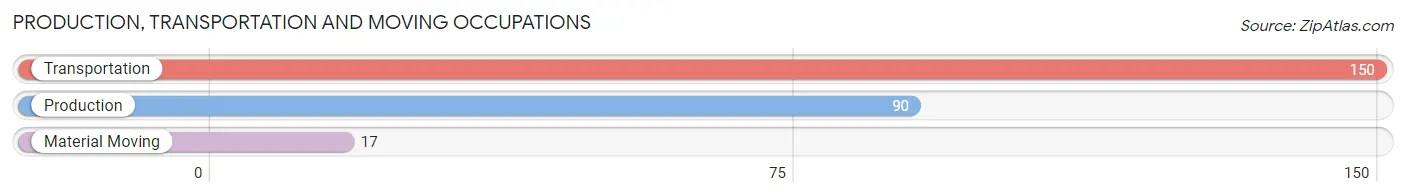
Production, Transportation and Moving Occupations
The most common Production, Transportation and Moving occupations in Fort Stewart are Transportation (150 | 9.8%), Production (90 | 5.9%), and Material Moving (17 | 1.1%).
Production, Transportation and Moving Occupations by Sex
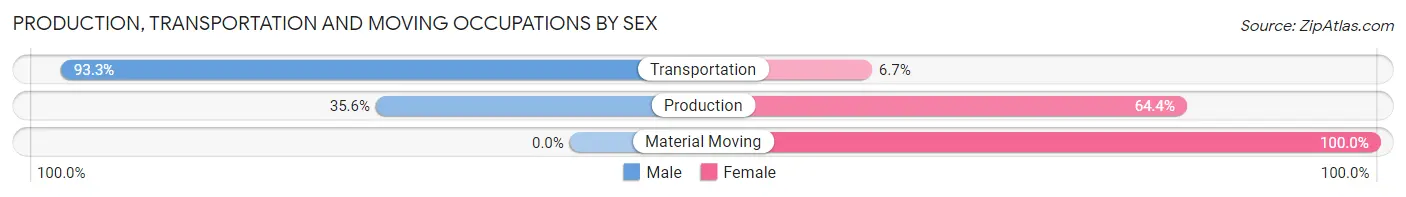
| Occupation | Male | Female |
| Production | 32 (35.6%) | 58 (64.4%) |
| Transportation | 140 (93.3%) | 10 (6.7%) |
| Material Moving | 0 (0.0%) | 17 (100.0%) |
| Total (Category) | 172 (66.9%) | 85 (33.1%) |
| Total (Overall) | 629 (41.0%) | 906 (59.0%) |
Employment Industries by Sex in Fort Stewart
Employment Industries in Fort Stewart
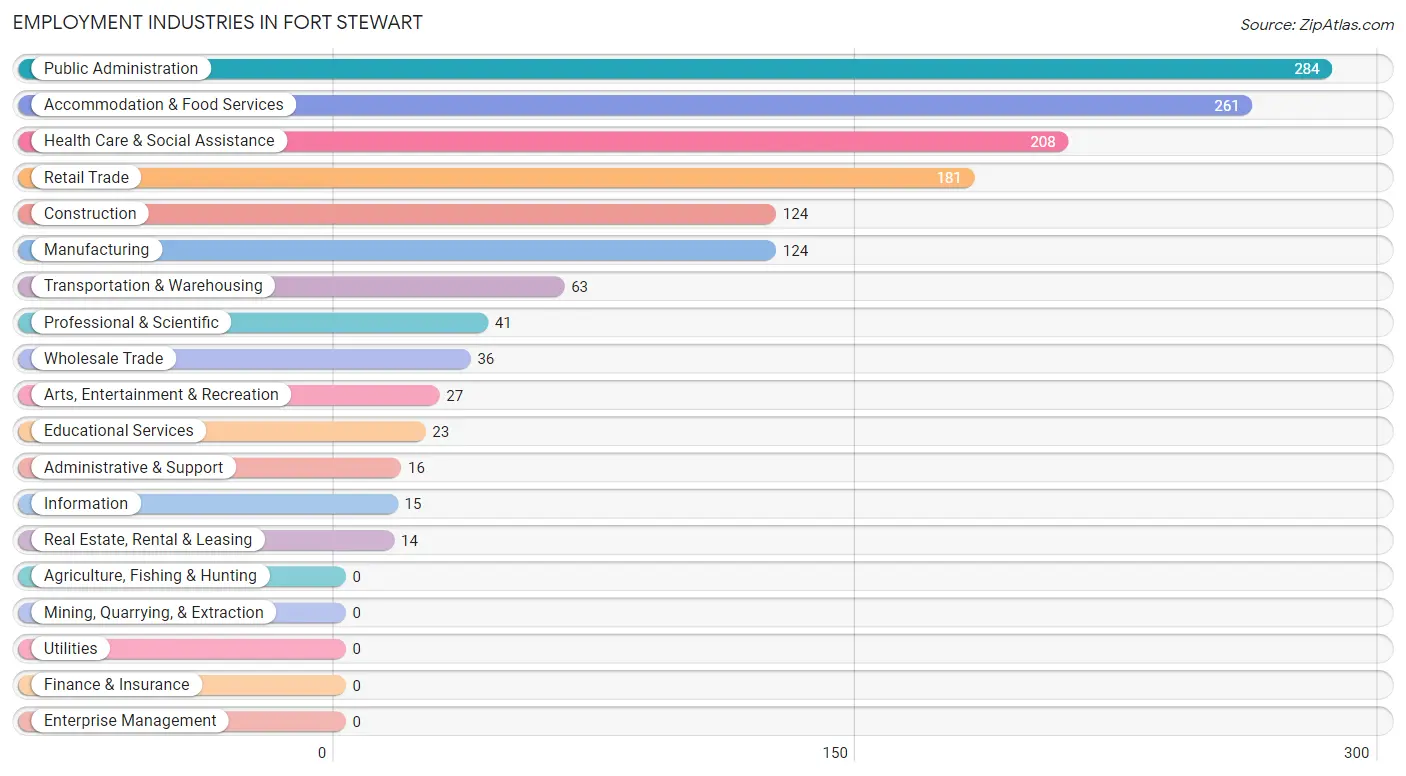
The major employment industries in Fort Stewart include Public Administration (284 | 18.5%), Accommodation & Food Services (261 | 17.0%), Health Care & Social Assistance (208 | 13.6%), Retail Trade (181 | 11.8%), and Construction (124 | 8.1%).
Employment Industries by Sex in Fort Stewart
The Fort Stewart industries that see more men than women are Construction (91.9%), Manufacturing (72.6%), and Wholesale Trade (72.2%), whereas the industries that tend to have a higher number of women are Information (100.0%), Real Estate, Rental & Leasing (100.0%), and Professional & Scientific (100.0%).
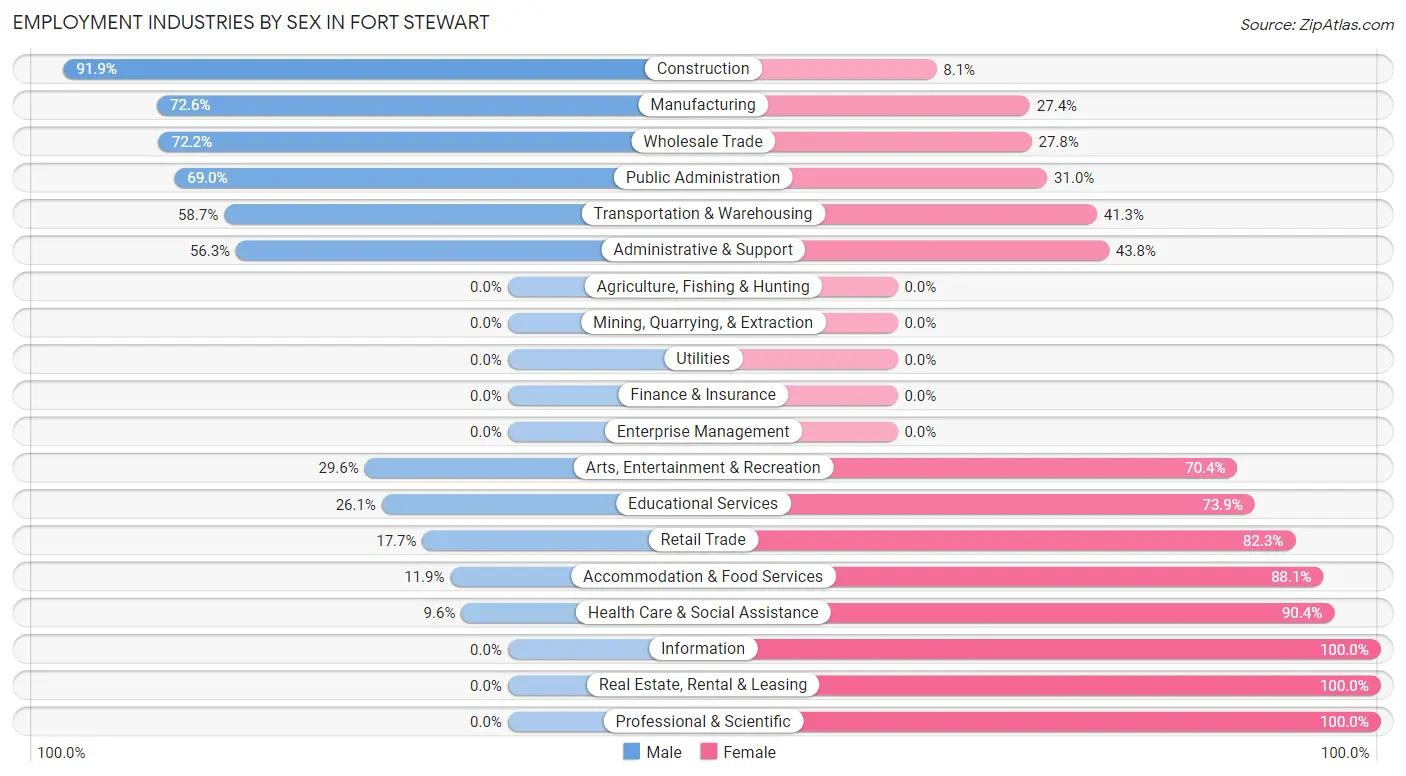
| Industry | Male | Female |
| Agriculture, Fishing & Hunting | 0 (0.0%) | 0 (0.0%) |
| Mining, Quarrying, & Extraction | 0 (0.0%) | 0 (0.0%) |
| Construction | 114 (91.9%) | 10 (8.1%) |
| Manufacturing | 90 (72.6%) | 34 (27.4%) |
| Wholesale Trade | 26 (72.2%) | 10 (27.8%) |
| Retail Trade | 32 (17.7%) | 149 (82.3%) |
| Transportation & Warehousing | 37 (58.7%) | 26 (41.3%) |
| Utilities | 0 (0.0%) | 0 (0.0%) |
| Information | 0 (0.0%) | 15 (100.0%) |
| Finance & Insurance | 0 (0.0%) | 0 (0.0%) |
| Real Estate, Rental & Leasing | 0 (0.0%) | 14 (100.0%) |
| Professional & Scientific | 0 (0.0%) | 41 (100.0%) |
| Enterprise Management | 0 (0.0%) | 0 (0.0%) |
| Administrative & Support | 9 (56.2%) | 7 (43.8%) |
| Educational Services | 6 (26.1%) | 17 (73.9%) |
| Health Care & Social Assistance | 20 (9.6%) | 188 (90.4%) |
| Arts, Entertainment & Recreation | 8 (29.6%) | 19 (70.4%) |
| Accommodation & Food Services | 31 (11.9%) | 230 (88.1%) |
| Public Administration | 196 (69.0%) | 88 (31.0%) |
| Total | 629 (41.0%) | 906 (59.0%) |
Education in Fort Stewart
School Enrollment in Fort Stewart
The most common levels of schooling among the 2,500 students in Fort Stewart are elementary school (916 | 36.6%), college / undergraduate (512 | 20.5%), and middle school (458 | 18.3%).
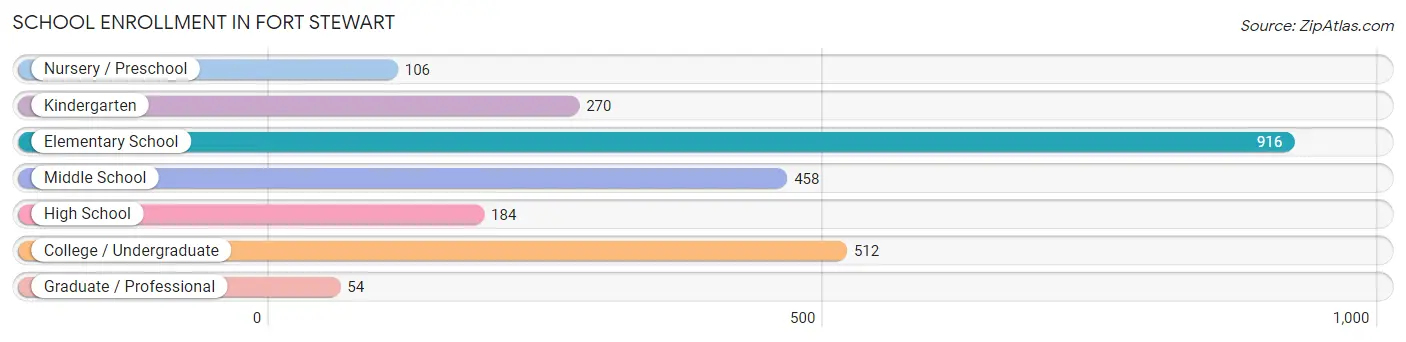
| School Level | # Students | % Students |
| Nursery / Preschool | 106 | 4.2% |
| Kindergarten | 270 | 10.8% |
| Elementary School | 916 | 36.6% |
| Middle School | 458 | 18.3% |
| High School | 184 | 7.4% |
| College / Undergraduate | 512 | 20.5% |
| Graduate / Professional | 54 | 2.2% |
| Total | 2,500 | 100.0% |
School Enrollment by Age by Funding Source in Fort Stewart
Out of a total of 2,500 students who are enrolled in schools in Fort Stewart, 338 (13.5%) attend a private institution, while the remaining 2,162 (86.5%) are enrolled in public schools. The age group of 15 to 17 year olds has the highest likelihood of being enrolled in private schools, with 43 (31.6% in the age bracket) enrolled. Conversely, the age group of 35 years and over has the lowest likelihood of being enrolled in a private school, with 10 (100.0% in the age bracket) attending a public institution.
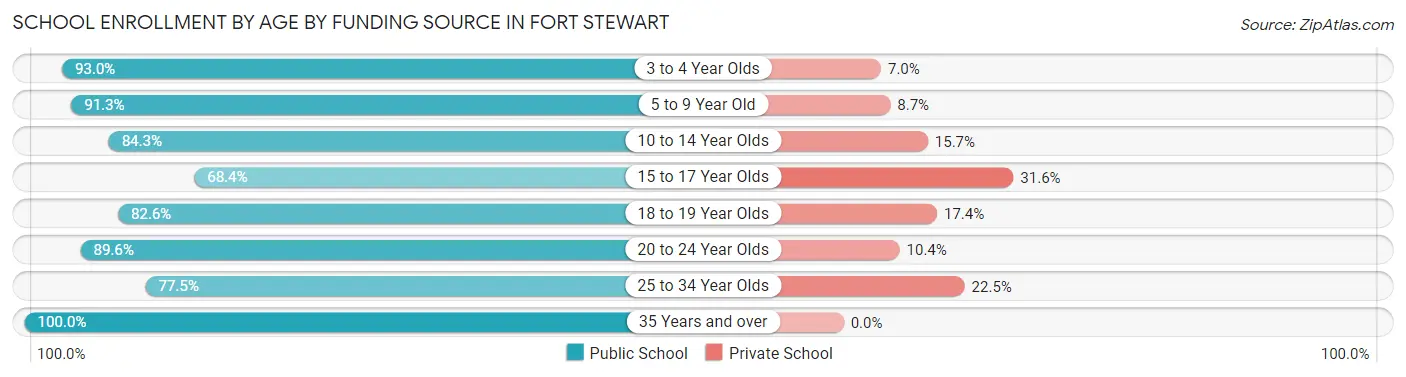
| Age Bracket | Public School | Private School |
| 3 to 4 Year Olds | 107 (93.0%) | 8 (7.0%) |
| 5 to 9 Year Old | 1,029 (91.3%) | 98 (8.7%) |
| 10 to 14 Year Olds | 457 (84.3%) | 85 (15.7%) |
| 15 to 17 Year Olds | 93 (68.4%) | 43 (31.6%) |
| 18 to 19 Year Olds | 19 (82.6%) | 4 (17.4%) |
| 20 to 24 Year Olds | 172 (89.6%) | 20 (10.4%) |
| 25 to 34 Year Olds | 275 (77.5%) | 80 (22.5%) |
| 35 Years and over | 10 (100.0%) | 0 (0.0%) |
| Total | 2,162 (86.5%) | 338 (13.5%) |
Educational Attainment by Field of Study in Fort Stewart
Education (139 | 21.2%), business (127 | 19.4%), arts & humanities (119 | 18.2%), social sciences (41 | 6.3%), and communications (37 | 5.7%) are the most common fields of study among 654 individuals in Fort Stewart who have obtained a bachelor's degree or higher.
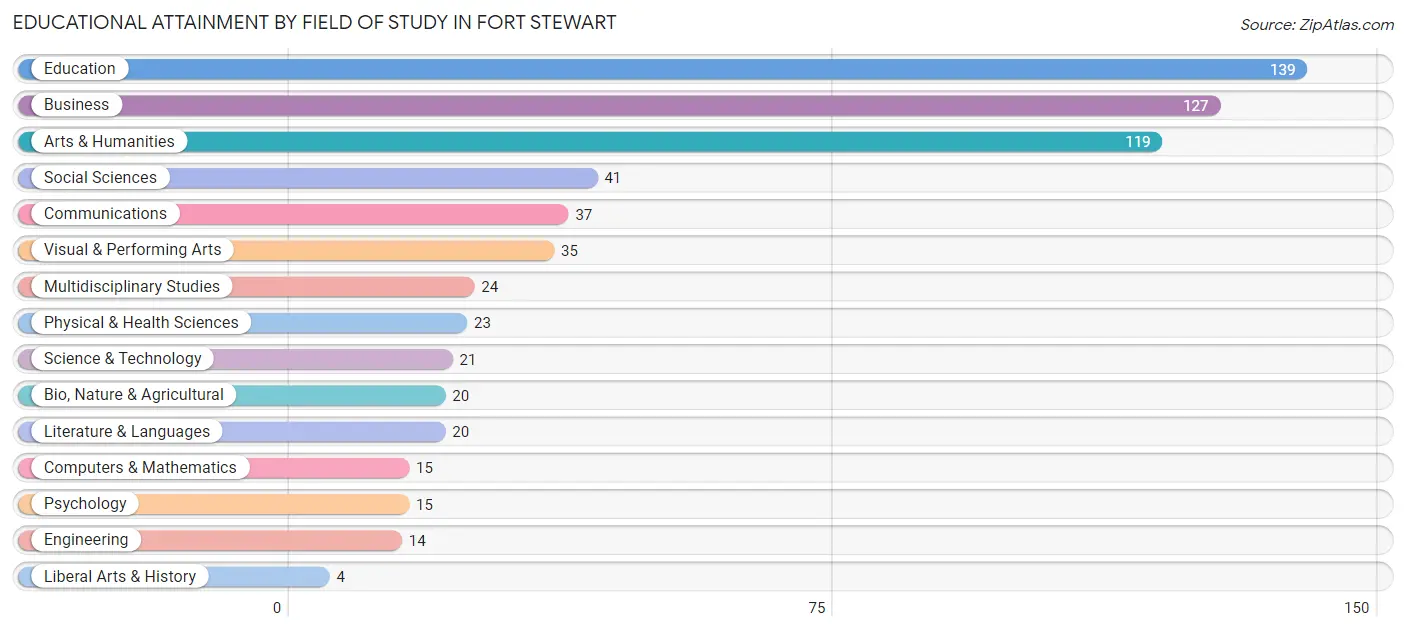
| Field of Study | # Graduates | % Graduates |
| Computers & Mathematics | 15 | 2.3% |
| Bio, Nature & Agricultural | 20 | 3.1% |
| Physical & Health Sciences | 23 | 3.5% |
| Psychology | 15 | 2.3% |
| Social Sciences | 41 | 6.3% |
| Engineering | 14 | 2.1% |
| Multidisciplinary Studies | 24 | 3.7% |
| Science & Technology | 21 | 3.2% |
| Business | 127 | 19.4% |
| Education | 139 | 21.2% |
| Literature & Languages | 20 | 3.1% |
| Liberal Arts & History | 4 | 0.6% |
| Visual & Performing Arts | 35 | 5.3% |
| Communications | 37 | 5.7% |
| Arts & Humanities | 119 | 18.2% |
| Total | 654 | 100.0% |
Transportation & Commute in Fort Stewart
Vehicle Availability by Sex in Fort Stewart
The most prevalent vehicle ownership categories in Fort Stewart are males with 2 vehicles (1,019, accounting for 53.1%) and females with 2 vehicles (687, making up 95.9%).
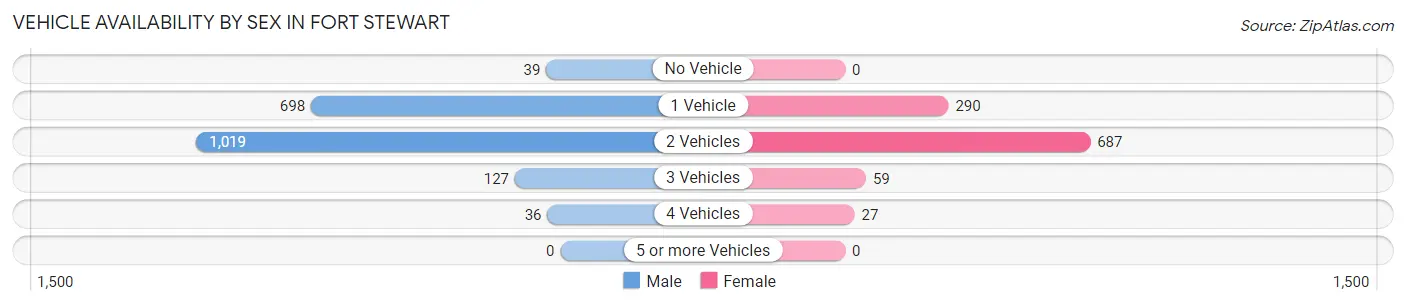
| Vehicles Available | Male | Female |
| No Vehicle | 39 (2.0%) | 0 (0.0%) |
| 1 Vehicle | 698 (36.4%) | 290 (27.3%) |
| 2 Vehicles | 1,019 (53.1%) | 687 (64.6%) |
| 3 Vehicles | 127 (6.6%) | 59 (5.6%) |
| 4 Vehicles | 36 (1.9%) | 27 (2.5%) |
| 5 or more Vehicles | 0 (0.0%) | 0 (0.0%) |
| Total | 1,919 (100.0%) | 1,063 (100.0%) |
Commute Time in Fort Stewart
The most frequently occuring commute durations in Fort Stewart are 5 to 9 minutes (1,352 commuters, 31.6%), 10 to 14 minutes (1,163 commuters, 27.2%), and 15 to 19 minutes (709 commuters, 16.6%).
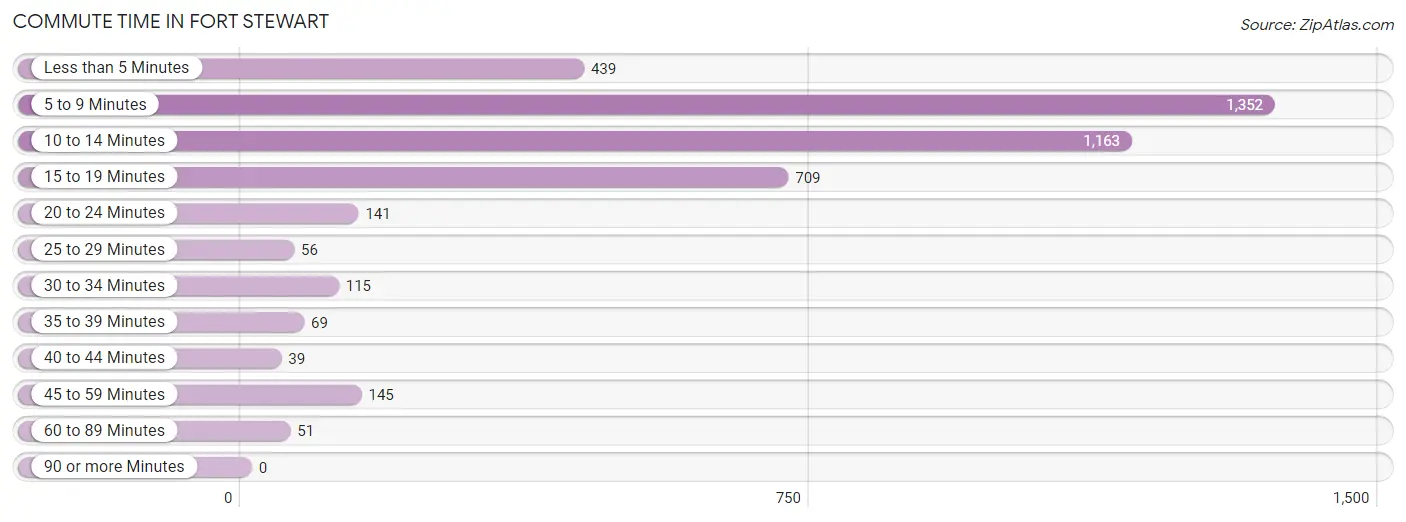
| Commute Time | # Commuters | % Commuters |
| Less than 5 Minutes | 439 | 10.3% |
| 5 to 9 Minutes | 1,352 | 31.6% |
| 10 to 14 Minutes | 1,163 | 27.2% |
| 15 to 19 Minutes | 709 | 16.6% |
| 20 to 24 Minutes | 141 | 3.3% |
| 25 to 29 Minutes | 56 | 1.3% |
| 30 to 34 Minutes | 115 | 2.7% |
| 35 to 39 Minutes | 69 | 1.6% |
| 40 to 44 Minutes | 39 | 0.9% |
| 45 to 59 Minutes | 145 | 3.4% |
| 60 to 89 Minutes | 51 | 1.2% |
| 90 or more Minutes | 0 | 0.0% |
Commute Time by Sex in Fort Stewart
The most common commute times in Fort Stewart are 5 to 9 minutes (862 commuters, 28.8%) for males and 5 to 9 minutes (490 commuters, 38.1%) for females.
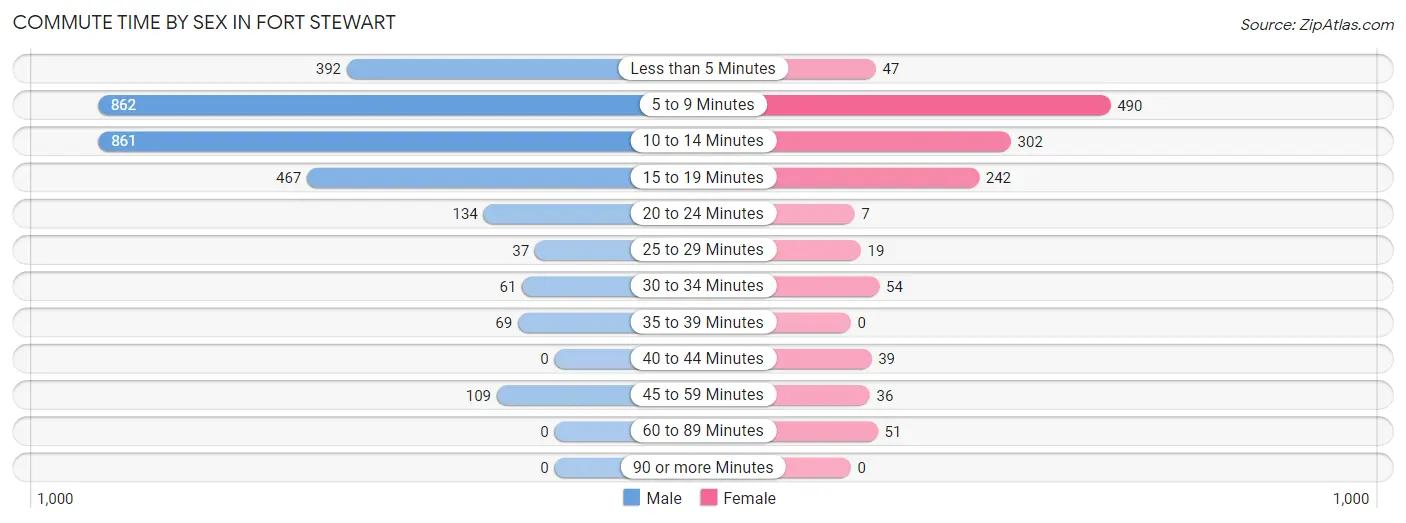
| Commute Time | Male | Female |
| Less than 5 Minutes | 392 (13.1%) | 47 (3.6%) |
| 5 to 9 Minutes | 862 (28.8%) | 490 (38.1%) |
| 10 to 14 Minutes | 861 (28.8%) | 302 (23.5%) |
| 15 to 19 Minutes | 467 (15.6%) | 242 (18.8%) |
| 20 to 24 Minutes | 134 (4.5%) | 7 (0.5%) |
| 25 to 29 Minutes | 37 (1.2%) | 19 (1.5%) |
| 30 to 34 Minutes | 61 (2.0%) | 54 (4.2%) |
| 35 to 39 Minutes | 69 (2.3%) | 0 (0.0%) |
| 40 to 44 Minutes | 0 (0.0%) | 39 (3.0%) |
| 45 to 59 Minutes | 109 (3.6%) | 36 (2.8%) |
| 60 to 89 Minutes | 0 (0.0%) | 51 (4.0%) |
| 90 or more Minutes | 0 (0.0%) | 0 (0.0%) |
Time of Departure to Work by Sex in Fort Stewart
The most frequent times of departure to work in Fort Stewart are 6:00 AM to 6:29 AM (651, 21.8%) for males and 5:30 AM to 5:59 AM (272, 21.1%) for females.
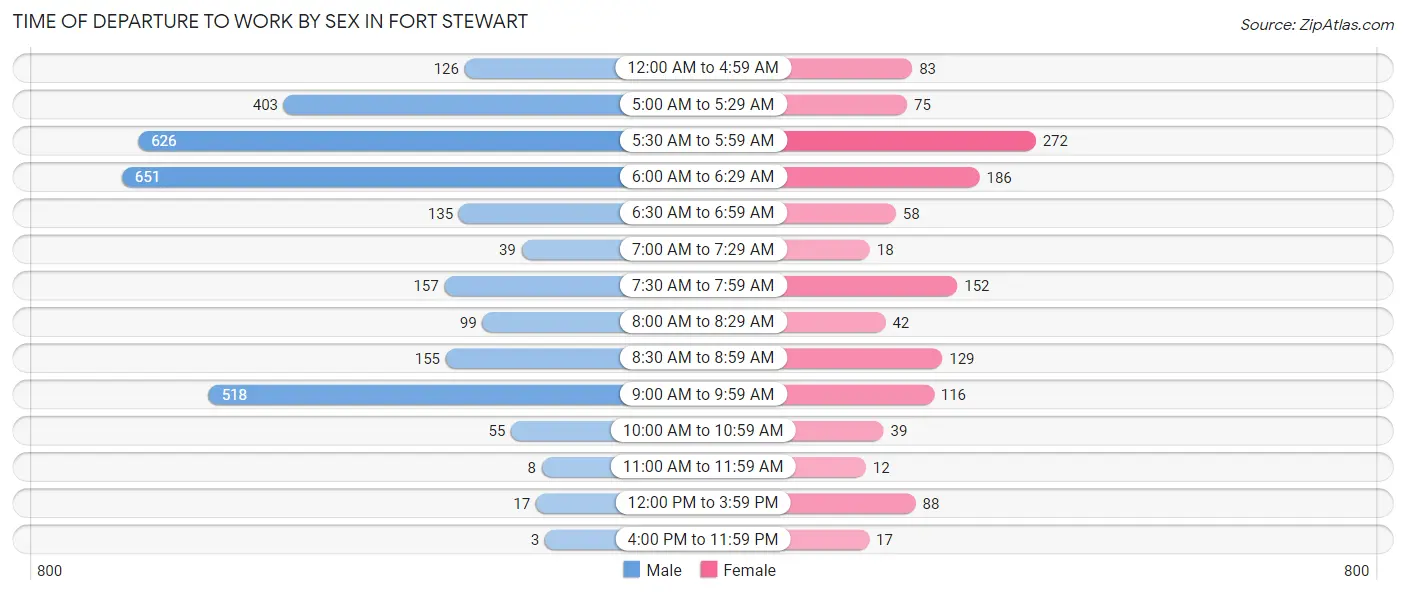
| Time of Departure | Male | Female |
| 12:00 AM to 4:59 AM | 126 (4.2%) | 83 (6.5%) |
| 5:00 AM to 5:29 AM | 403 (13.5%) | 75 (5.8%) |
| 5:30 AM to 5:59 AM | 626 (20.9%) | 272 (21.1%) |
| 6:00 AM to 6:29 AM | 651 (21.8%) | 186 (14.4%) |
| 6:30 AM to 6:59 AM | 135 (4.5%) | 58 (4.5%) |
| 7:00 AM to 7:29 AM | 39 (1.3%) | 18 (1.4%) |
| 7:30 AM to 7:59 AM | 157 (5.2%) | 152 (11.8%) |
| 8:00 AM to 8:29 AM | 99 (3.3%) | 42 (3.3%) |
| 8:30 AM to 8:59 AM | 155 (5.2%) | 129 (10.0%) |
| 9:00 AM to 9:59 AM | 518 (17.3%) | 116 (9.0%) |
| 10:00 AM to 10:59 AM | 55 (1.8%) | 39 (3.0%) |
| 11:00 AM to 11:59 AM | 8 (0.3%) | 12 (0.9%) |
| 12:00 PM to 3:59 PM | 17 (0.6%) | 88 (6.8%) |
| 4:00 PM to 11:59 PM | 3 (0.1%) | 17 (1.3%) |
| Total | 2,992 (100.0%) | 1,287 (100.0%) |
Housing Occupancy in Fort Stewart
Occupancy by Ownership in Fort Stewart
Of the total 2,390 dwellings in Fort Stewart, owner-occupied units account for 4 (0.2%), while renter-occupied units make up 2,386 (99.8%).
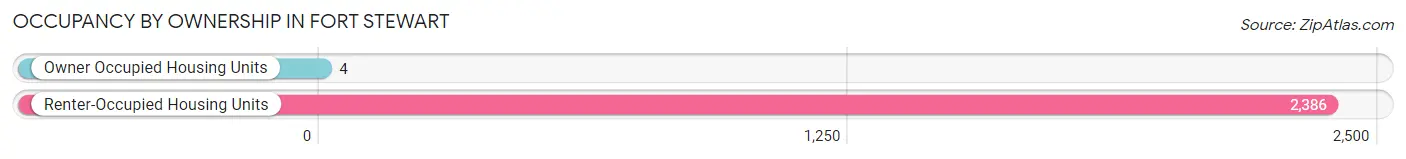
| Occupancy | # Housing Units | % Housing Units |
| Owner Occupied Housing Units | 4 | 0.2% |
| Renter-Occupied Housing Units | 2,386 | 99.8% |
| Total Occupied Housing Units | 2,390 | 100.0% |
Occupancy by Household Size in Fort Stewart
| Household Size | # Housing Units | % Housing Units |
| 1-Person Household | 410 | 17.2% |
| 2-Person Household | 519 | 21.7% |
| 3-Person Household | 536 | 22.4% |
| 4+ Person Household | 925 | 38.7% |
| Total Housing Units | 2,390 | 100.0% |
Occupancy by Ownership by Household Size in Fort Stewart
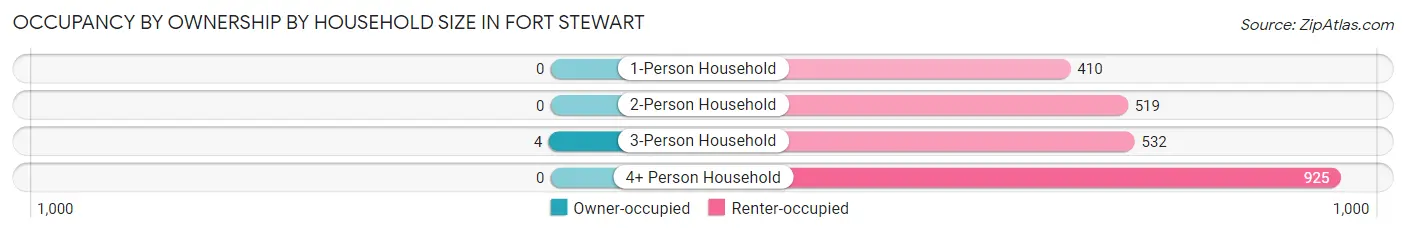
| Household Size | Owner-occupied | Renter-occupied |
| 1-Person Household | 0 (0.0%) | 410 (100.0%) |
| 2-Person Household | 0 (0.0%) | 519 (100.0%) |
| 3-Person Household | 4 (0.7%) | 532 (99.3%) |
| 4+ Person Household | 0 (0.0%) | 925 (100.0%) |
| Total Housing Units | 4 (0.2%) | 2,386 (99.8%) |
Occupancy by Educational Attainment in Fort Stewart
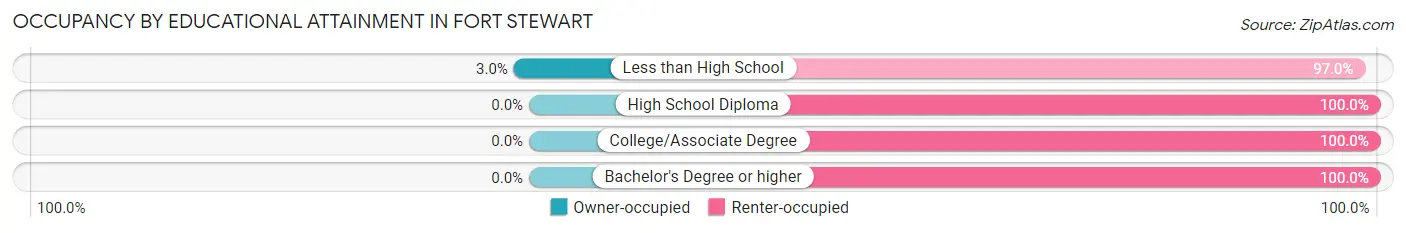
| Household Size | Owner-occupied | Renter-occupied |
| Less than High School | 4 (3.0%) | 128 (97.0%) |
| High School Diploma | 0 (0.0%) | 883 (100.0%) |
| College/Associate Degree | 0 (0.0%) | 1,063 (100.0%) |
| Bachelor's Degree or higher | 0 (0.0%) | 312 (100.0%) |
Occupancy by Age of Householder in Fort Stewart
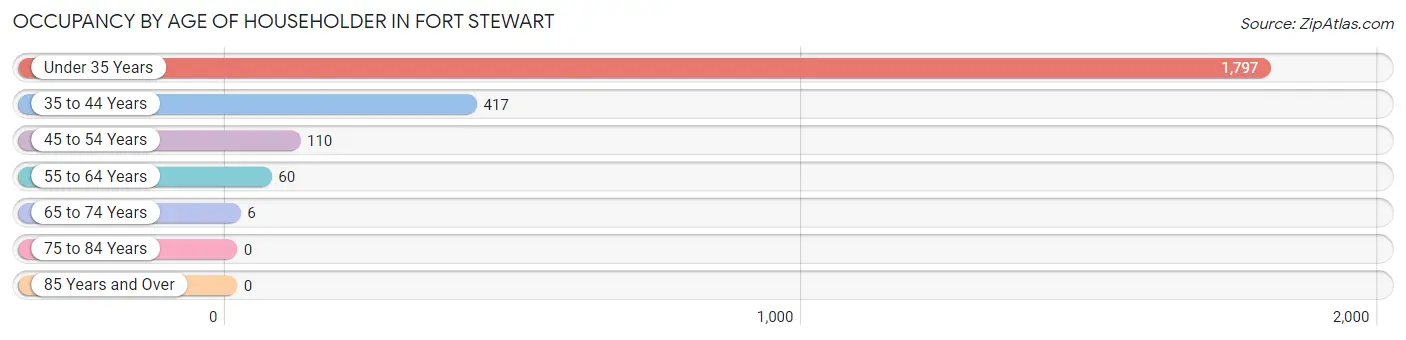
| Age Bracket | # Households | % Households |
| Under 35 Years | 1,797 | 75.2% |
| 35 to 44 Years | 417 | 17.4% |
| 45 to 54 Years | 110 | 4.6% |
| 55 to 64 Years | 60 | 2.5% |
| 65 to 74 Years | 6 | 0.3% |
| 75 to 84 Years | 0 | 0.0% |
| 85 Years and Over | 0 | 0.0% |
| Total | 2,390 | 100.0% |
Housing Finances in Fort Stewart
Median Income by Occupancy in Fort Stewart
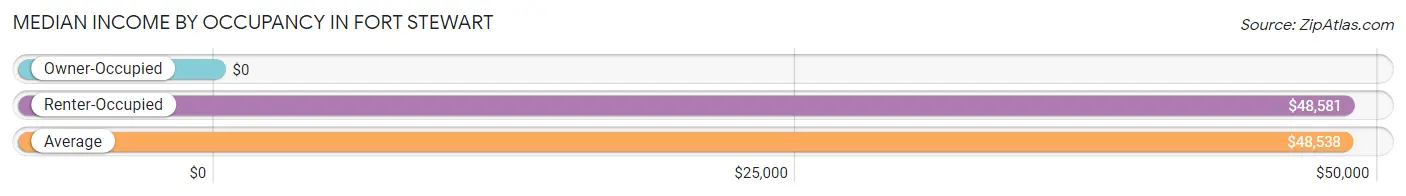
| Occupancy Type | # Households | Median Income |
| Owner-Occupied | 4 (0.2%) | $0 |
| Renter-Occupied | 2,386 (99.8%) | $48,581 |
| Average | 2,390 (100.0%) | $48,538 |
Occupancy by Householder Income Bracket in Fort Stewart
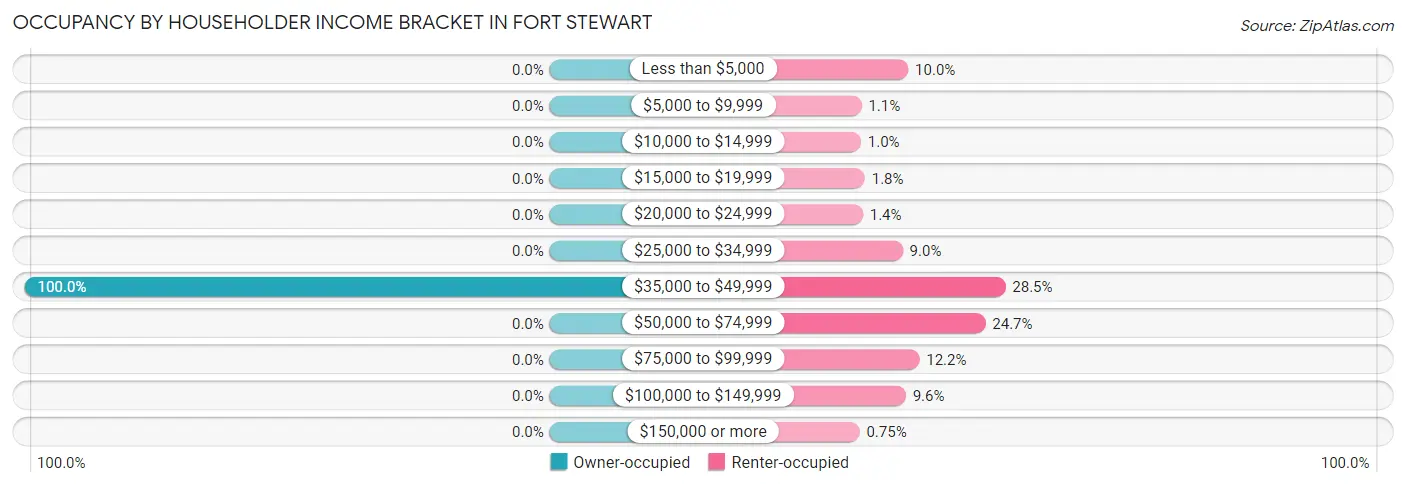
| Income Bracket | Owner-occupied | Renter-occupied |
| Less than $5,000 | 0 (0.0%) | 239 (10.0%) |
| $5,000 to $9,999 | 0 (0.0%) | 27 (1.1%) |
| $10,000 to $14,999 | 0 (0.0%) | 24 (1.0%) |
| $15,000 to $19,999 | 0 (0.0%) | 42 (1.8%) |
| $20,000 to $24,999 | 0 (0.0%) | 33 (1.4%) |
| $25,000 to $34,999 | 0 (0.0%) | 214 (9.0%) |
| $35,000 to $49,999 | 4 (100.0%) | 681 (28.5%) |
| $50,000 to $74,999 | 0 (0.0%) | 590 (24.7%) |
| $75,000 to $99,999 | 0 (0.0%) | 290 (12.1%) |
| $100,000 to $149,999 | 0 (0.0%) | 228 (9.6%) |
| $150,000 or more | 0 (0.0%) | 18 (0.7%) |
| Total | 4 (100.0%) | 2,386 (100.0%) |
Monthly Housing Cost Tiers in Fort Stewart
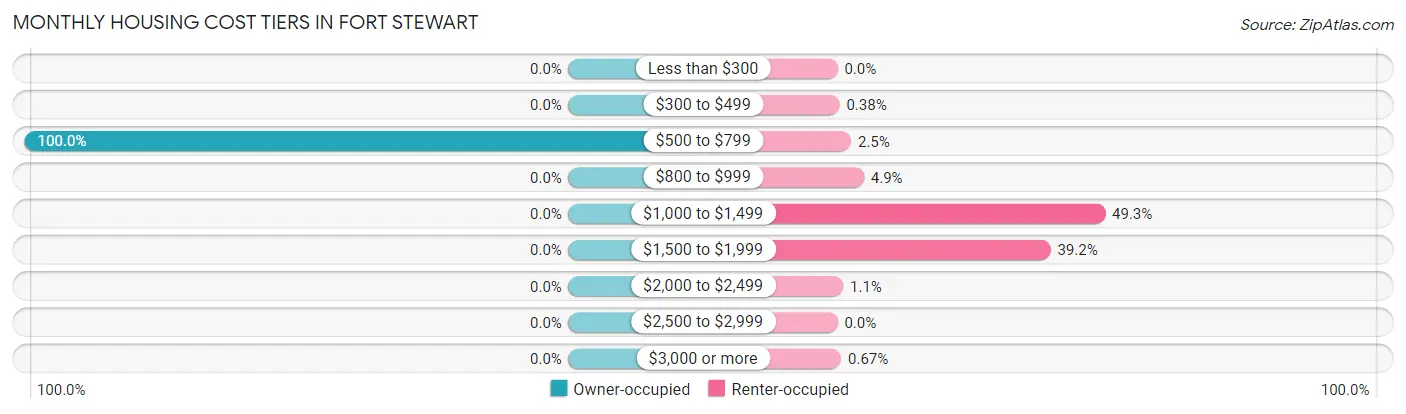
| Monthly Cost | Owner-occupied | Renter-occupied |
| Less than $300 | 0 (0.0%) | 0 (0.0%) |
| $300 to $499 | 0 (0.0%) | 9 (0.4%) |
| $500 to $799 | 4 (100.0%) | 60 (2.5%) |
| $800 to $999 | 0 (0.0%) | 116 (4.9%) |
| $1,000 to $1,499 | 0 (0.0%) | 1,176 (49.3%) |
| $1,500 to $1,999 | 0 (0.0%) | 936 (39.2%) |
| $2,000 to $2,499 | 0 (0.0%) | 25 (1.1%) |
| $2,500 to $2,999 | 0 (0.0%) | 0 (0.0%) |
| $3,000 or more | 0 (0.0%) | 16 (0.7%) |
| Total | 4 (100.0%) | 2,386 (100.0%) |
Physical Housing Characteristics in Fort Stewart
Housing Structures in Fort Stewart
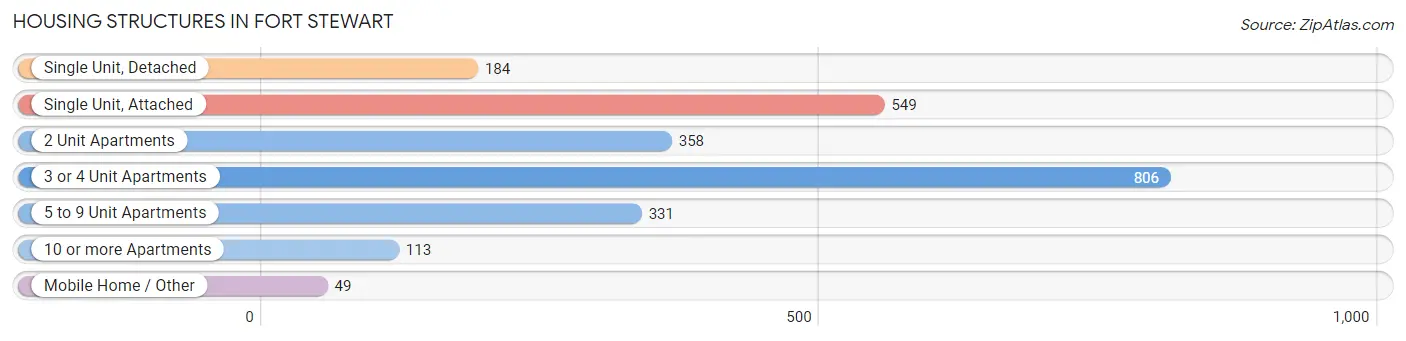
| Structure Type | # Housing Units | % Housing Units |
| Single Unit, Detached | 184 | 7.7% |
| Single Unit, Attached | 549 | 23.0% |
| 2 Unit Apartments | 358 | 15.0% |
| 3 or 4 Unit Apartments | 806 | 33.7% |
| 5 to 9 Unit Apartments | 331 | 13.9% |
| 10 or more Apartments | 113 | 4.7% |
| Mobile Home / Other | 49 | 2.1% |
| Total | 2,390 | 100.0% |
Housing Structures by Occupancy in Fort Stewart
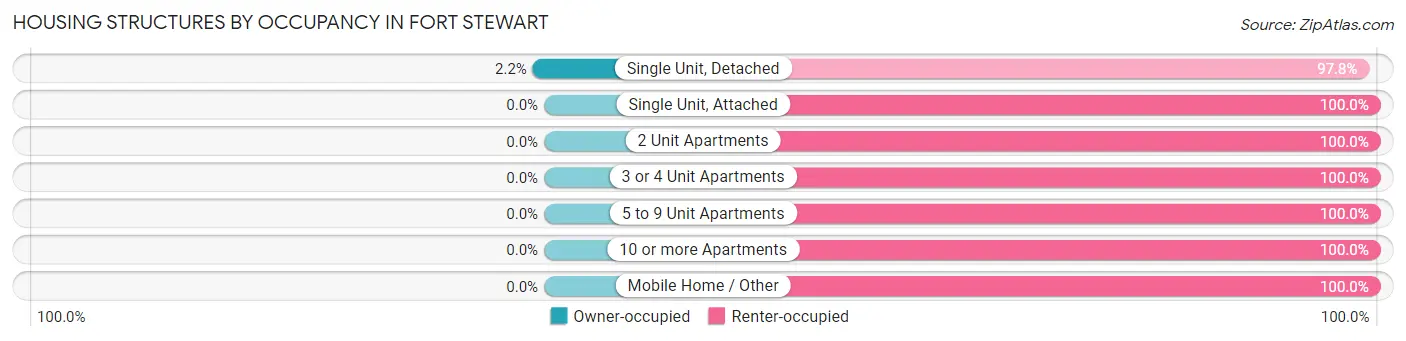
| Structure Type | Owner-occupied | Renter-occupied |
| Single Unit, Detached | 4 (2.2%) | 180 (97.8%) |
| Single Unit, Attached | 0 (0.0%) | 549 (100.0%) |
| 2 Unit Apartments | 0 (0.0%) | 358 (100.0%) |
| 3 or 4 Unit Apartments | 0 (0.0%) | 806 (100.0%) |
| 5 to 9 Unit Apartments | 0 (0.0%) | 331 (100.0%) |
| 10 or more Apartments | 0 (0.0%) | 113 (100.0%) |
| Mobile Home / Other | 0 (0.0%) | 49 (100.0%) |
| Total | 4 (0.2%) | 2,386 (99.8%) |
Housing Structures by Number of Rooms in Fort Stewart
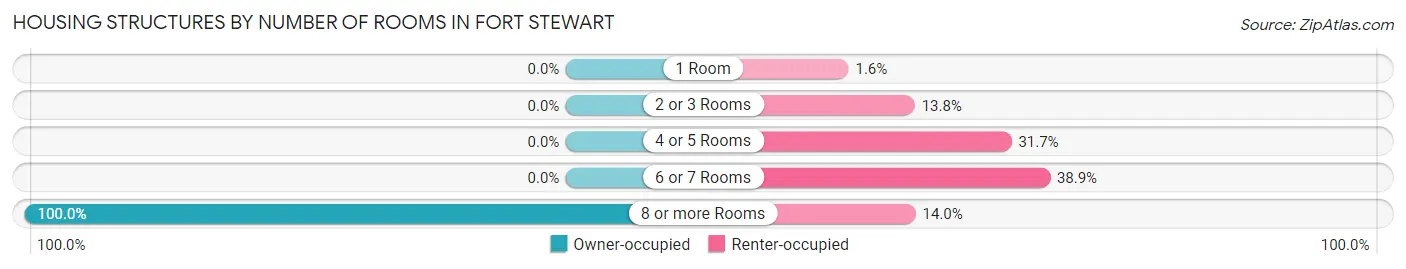
| Number of Rooms | Owner-occupied | Renter-occupied |
| 1 Room | 0 (0.0%) | 38 (1.6%) |
| 2 or 3 Rooms | 0 (0.0%) | 330 (13.8%) |
| 4 or 5 Rooms | 0 (0.0%) | 757 (31.7%) |
| 6 or 7 Rooms | 0 (0.0%) | 927 (38.9%) |
| 8 or more Rooms | 4 (100.0%) | 334 (14.0%) |
| Total | 4 (100.0%) | 2,386 (100.0%) |
Housing Structure by Heating Type in Fort Stewart
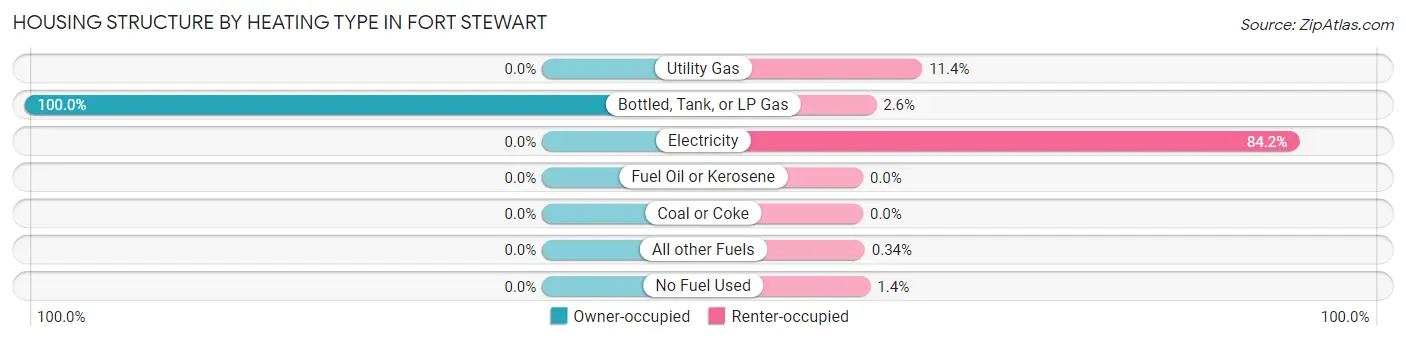
| Heating Type | Owner-occupied | Renter-occupied |
| Utility Gas | 0 (0.0%) | 273 (11.4%) |
| Bottled, Tank, or LP Gas | 4 (100.0%) | 61 (2.6%) |
| Electricity | 0 (0.0%) | 2,010 (84.2%) |
| Fuel Oil or Kerosene | 0 (0.0%) | 0 (0.0%) |
| Coal or Coke | 0 (0.0%) | 0 (0.0%) |
| All other Fuels | 0 (0.0%) | 8 (0.3%) |
| No Fuel Used | 0 (0.0%) | 34 (1.4%) |
| Total | 4 (100.0%) | 2,386 (100.0%) |
Household Vehicle Usage in Fort Stewart
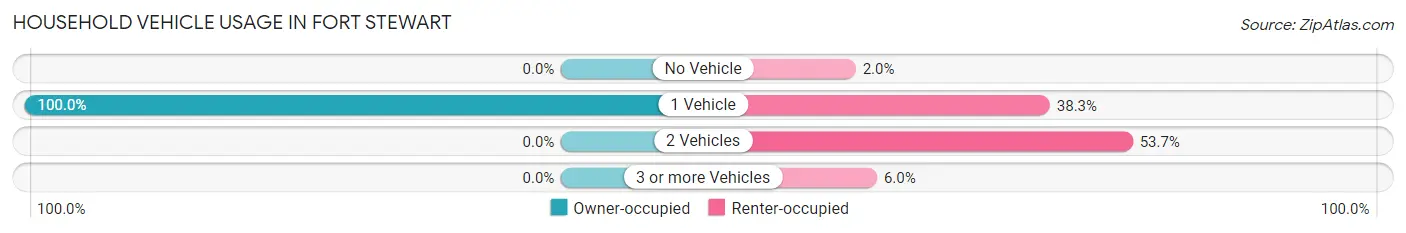
| Vehicles per Household | Owner-occupied | Renter-occupied |
| No Vehicle | 0 (0.0%) | 48 (2.0%) |
| 1 Vehicle | 4 (100.0%) | 913 (38.3%) |
| 2 Vehicles | 0 (0.0%) | 1,282 (53.7%) |
| 3 or more Vehicles | 0 (0.0%) | 143 (6.0%) |
| Total | 4 (100.0%) | 2,386 (100.0%) |
Real Estate & Mortgages in Fort Stewart
Real Estate and Mortgage Overview in Fort Stewart
| Characteristic | Without Mortgage | With Mortgage |
| Housing Units | 4 | 0 |
| Median Property Value | - | - |
| Median Household Income | - | - |
| Monthly Housing Costs | - | - |
| Real Estate Taxes | - | - |
Property Value by Mortgage Status in Fort Stewart
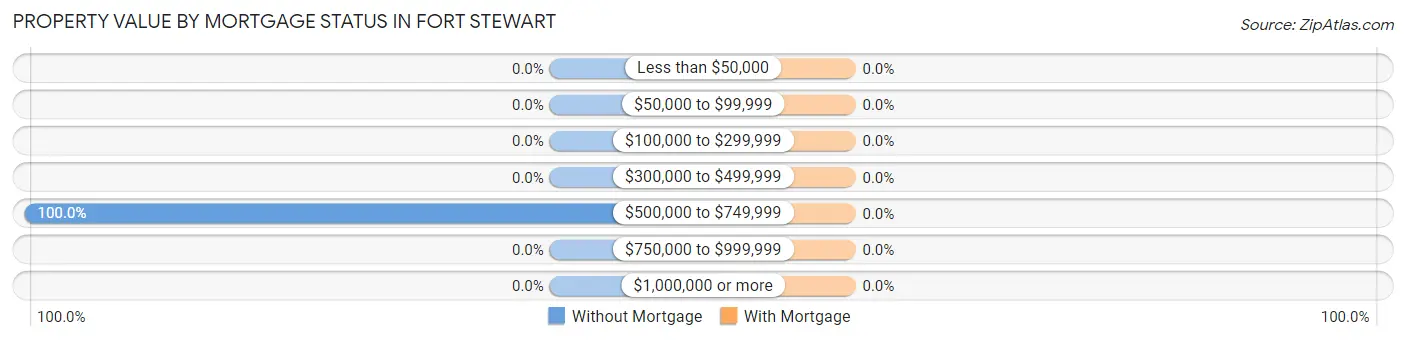
| Property Value | Without Mortgage | With Mortgage |
| Less than $50,000 | 0 (0.0%) | 0 (0.0%) |
| $50,000 to $99,999 | 0 (0.0%) | 0 (0.0%) |
| $100,000 to $299,999 | 0 (0.0%) | 0 (0.0%) |
| $300,000 to $499,999 | 0 (0.0%) | 0 (0.0%) |
| $500,000 to $749,999 | 4 (100.0%) | 0 (0.0%) |
| $750,000 to $999,999 | 0 (0.0%) | 0 (0.0%) |
| $1,000,000 or more | 0 (0.0%) | 0 (0.0%) |
| Total | 4 (100.0%) | 0 (0.0%) |
Household Income by Mortgage Status in Fort Stewart
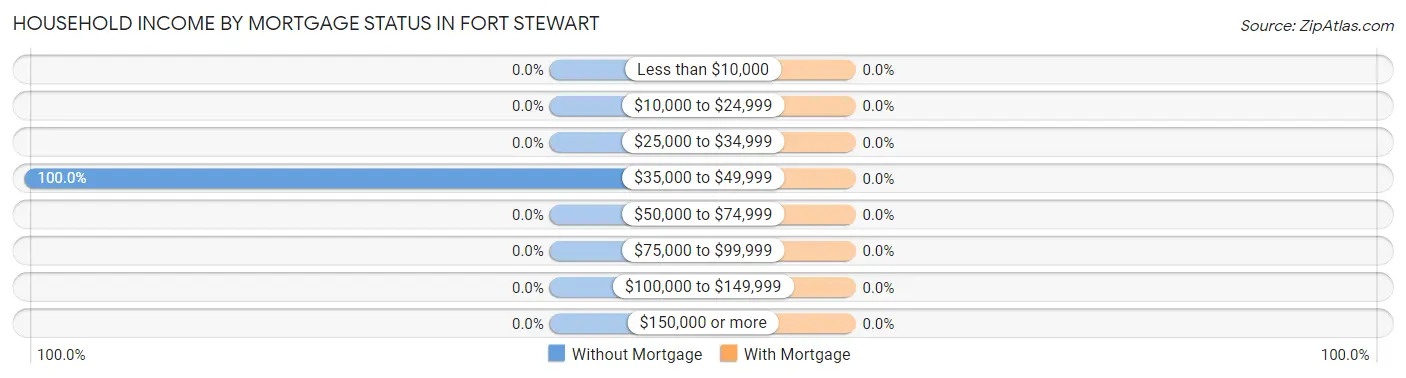
| Household Income | Without Mortgage | With Mortgage |
| Less than $10,000 | 0 (0.0%) | 0 (0.0%) |
| $10,000 to $24,999 | 0 (0.0%) | 0 (0.0%) |
| $25,000 to $34,999 | 0 (0.0%) | 0 (0.0%) |
| $35,000 to $49,999 | 4 (100.0%) | 0 (0.0%) |
| $50,000 to $74,999 | 0 (0.0%) | 0 (0.0%) |
| $75,000 to $99,999 | 0 (0.0%) | 0 (0.0%) |
| $100,000 to $149,999 | 0 (0.0%) | 0 (0.0%) |
| $150,000 or more | 0 (0.0%) | 0 (0.0%) |
| Total | 4 (100.0%) | 0 (0.0%) |
Property Value to Household Income Ratio in Fort Stewart
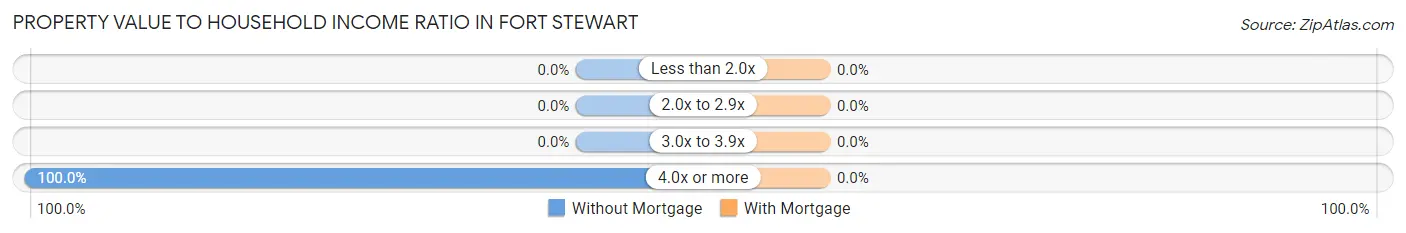
| Value-to-Income Ratio | Without Mortgage | With Mortgage |
| Less than 2.0x | 0 (0.0%) | 0 (0.0%) |
| 2.0x to 2.9x | 0 (0.0%) | 0 (0.0%) |
| 3.0x to 3.9x | 0 (0.0%) | 0 (0.0%) |
| 4.0x or more | 4 (100.0%) | 0 (0.0%) |
| Total | 4 (100.0%) | 0 (0.0%) |
Real Estate Taxes by Mortgage Status in Fort Stewart
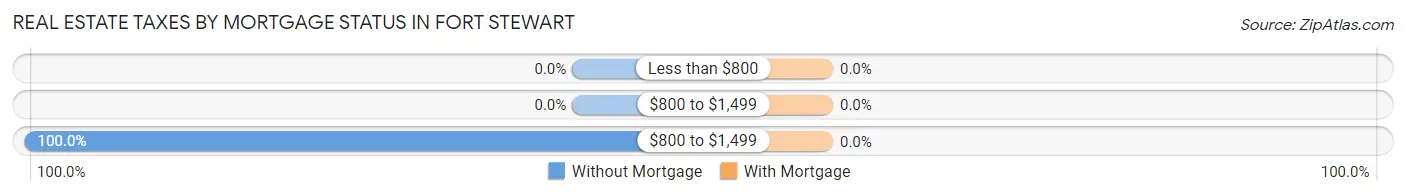
| Property Taxes | Without Mortgage | With Mortgage |
| Less than $800 | 0 (0.0%) | 0 (0.0%) |
| $800 to $1,499 | 0 (0.0%) | 0 (0.0%) |
| $800 to $1,499 | 4 (100.0%) | 0 (0.0%) |
| Total | 4 (100.0%) | 0 (0.0%) |
Health & Disability in Fort Stewart
Health Insurance Coverage by Age in Fort Stewart
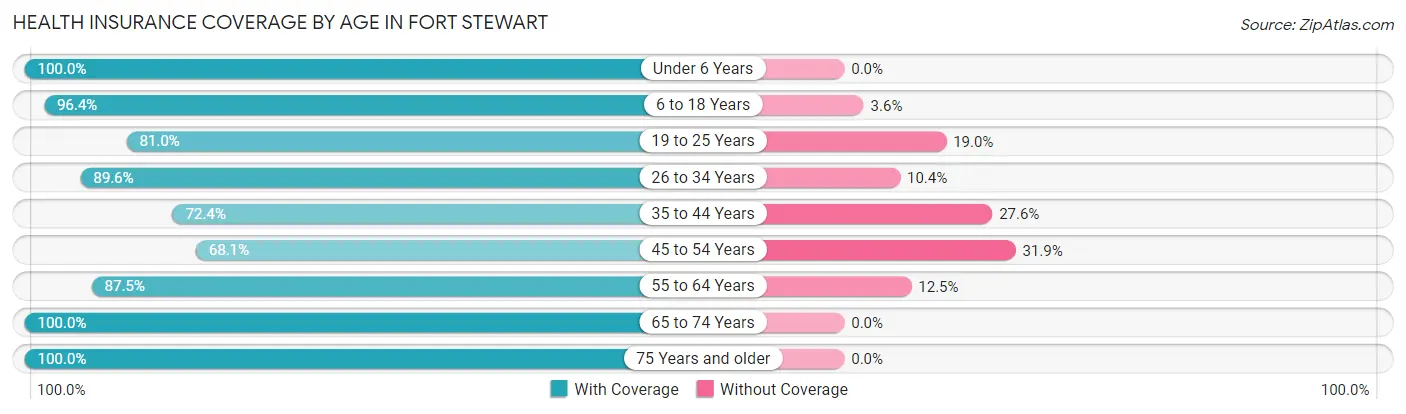
| Age Bracket | With Coverage | Without Coverage |
| Under 6 Years | 1,838 (100.0%) | 0 (0.0%) |
| 6 to 18 Years | 1,657 (96.4%) | 62 (3.6%) |
| 19 to 25 Years | 810 (81.0%) | 190 (19.0%) |
| 26 to 34 Years | 784 (89.6%) | 91 (10.4%) |
| 35 to 44 Years | 386 (72.4%) | 147 (27.6%) |
| 45 to 54 Years | 98 (68.1%) | 46 (31.9%) |
| 55 to 64 Years | 105 (87.5%) | 15 (12.5%) |
| 65 to 74 Years | 6 (100.0%) | 0 (0.0%) |
| 75 Years and older | 3 (100.0%) | 0 (0.0%) |
| Total | 5,687 (91.2%) | 551 (8.8%) |
Health Insurance Coverage by Citizenship Status in Fort Stewart
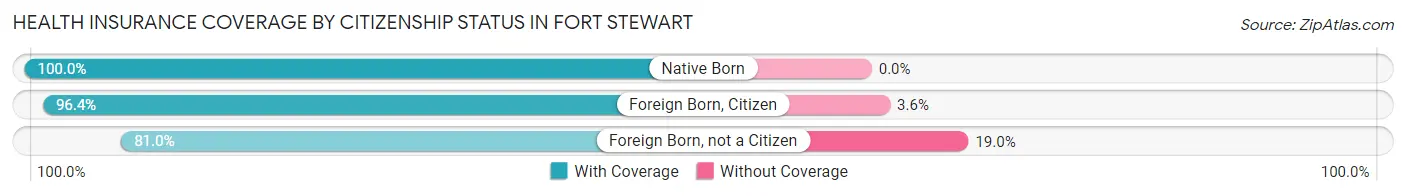
| Citizenship Status | With Coverage | Without Coverage |
| Native Born | 1,838 (100.0%) | 0 (0.0%) |
| Foreign Born, Citizen | 1,657 (96.4%) | 62 (3.6%) |
| Foreign Born, not a Citizen | 810 (81.0%) | 190 (19.0%) |
Health Insurance Coverage by Household Income in Fort Stewart
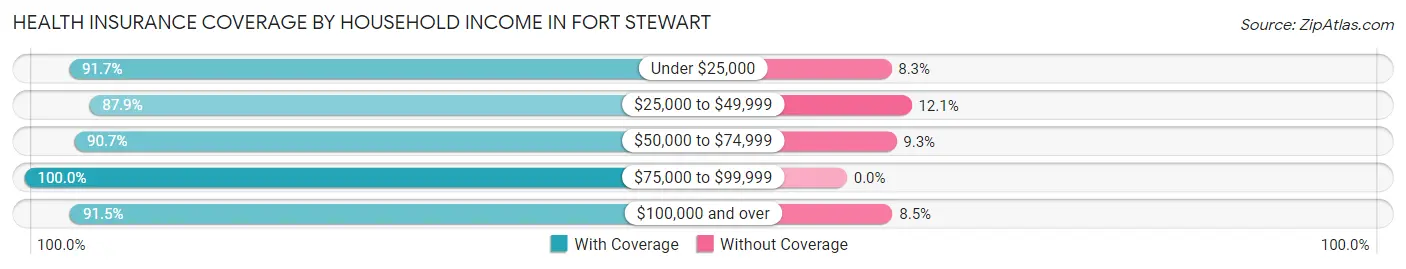
| Household Income | With Coverage | Without Coverage |
| Under $25,000 | 935 (91.7%) | 85 (8.3%) |
| $25,000 to $49,999 | 1,878 (87.9%) | 259 (12.1%) |
| $50,000 to $74,999 | 1,545 (90.7%) | 158 (9.3%) |
| $75,000 to $99,999 | 804 (100.0%) | 0 (0.0%) |
| $100,000 and over | 525 (91.5%) | 49 (8.5%) |
Public vs Private Health Insurance Coverage by Age in Fort Stewart
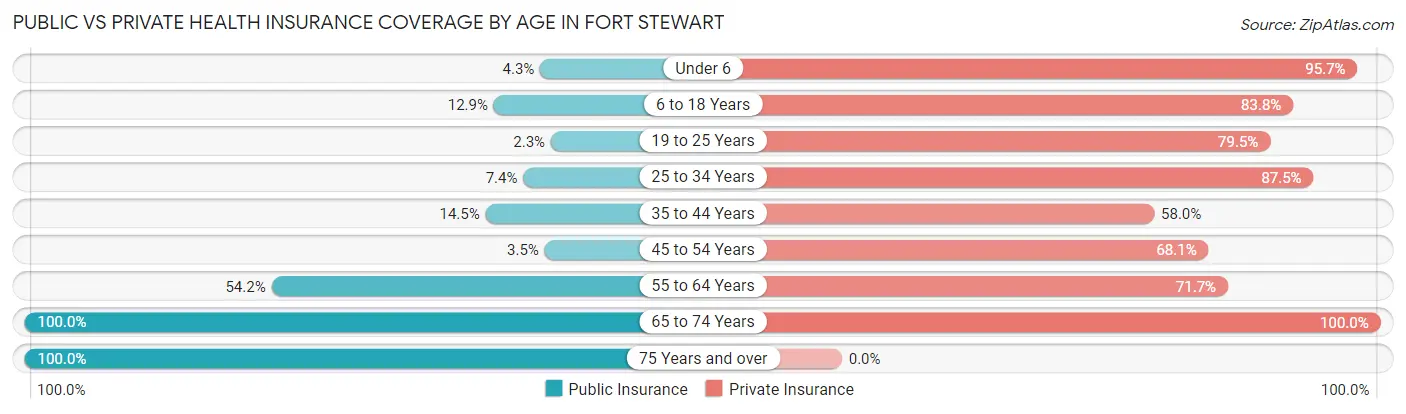
| Age Bracket | Public Insurance | Private Insurance |
| Under 6 | 79 (4.3%) | 1,759 (95.7%) |
| 6 to 18 Years | 222 (12.9%) | 1,440 (83.8%) |
| 19 to 25 Years | 23 (2.3%) | 795 (79.5%) |
| 25 to 34 Years | 65 (7.4%) | 766 (87.5%) |
| 35 to 44 Years | 77 (14.4%) | 309 (58.0%) |
| 45 to 54 Years | 5 (3.5%) | 98 (68.1%) |
| 55 to 64 Years | 65 (54.2%) | 86 (71.7%) |
| 65 to 74 Years | 6 (100.0%) | 6 (100.0%) |
| 75 Years and over | 3 (100.0%) | 0 (0.0%) |
| Total | 545 (8.7%) | 5,259 (84.3%) |
Disability Status by Sex by Age in Fort Stewart
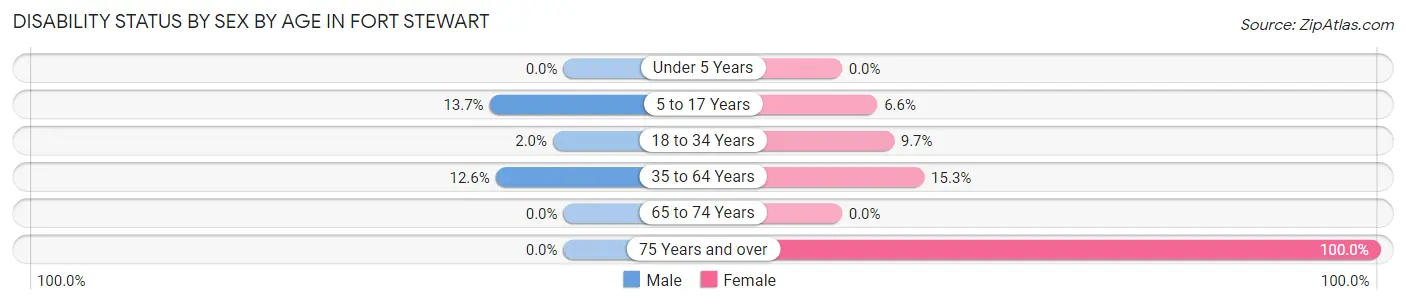
| Age Bracket | Male | Female |
| Under 5 Years | 0 (0.0%) | 0 (0.0%) |
| 5 to 17 Years | 115 (13.7%) | 73 (6.6%) |
| 18 to 34 Years | 8 (1.9%) | 143 (9.7%) |
| 35 to 64 Years | 41 (12.6%) | 72 (15.3%) |
| 65 to 74 Years | 0 (0.0%) | 0 (0.0%) |
| 75 Years and over | 0 (0.0%) | 3 (100.0%) |
Disability Class by Sex by Age in Fort Stewart
Disability Class: Hearing Difficulty
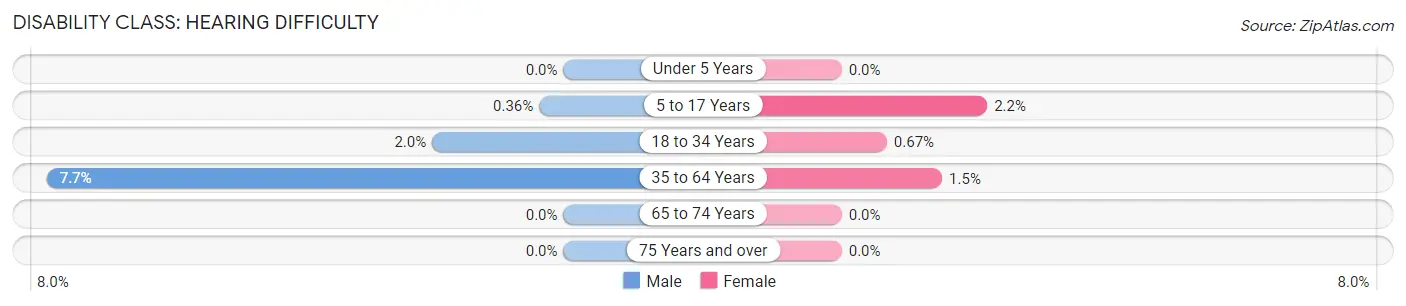
| Age Bracket | Male | Female |
| Under 5 Years | 0 (0.0%) | 0 (0.0%) |
| 5 to 17 Years | 3 (0.4%) | 24 (2.2%) |
| 18 to 34 Years | 8 (1.9%) | 10 (0.7%) |
| 35 to 64 Years | 25 (7.7%) | 7 (1.5%) |
| 65 to 74 Years | 0 (0.0%) | 0 (0.0%) |
| 75 Years and over | 0 (0.0%) | 0 (0.0%) |
Disability Class: Vision Difficulty
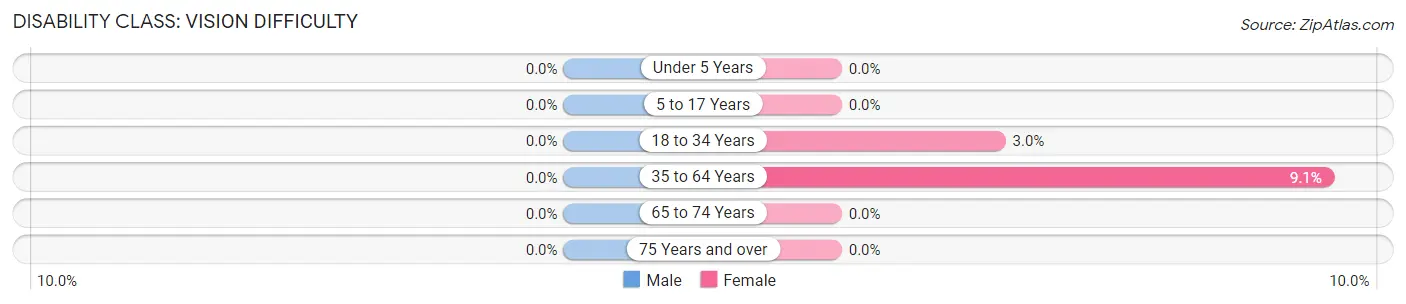
| Age Bracket | Male | Female |
| Under 5 Years | 0 (0.0%) | 0 (0.0%) |
| 5 to 17 Years | 0 (0.0%) | 0 (0.0%) |
| 18 to 34 Years | 0 (0.0%) | 45 (3.0%) |
| 35 to 64 Years | 0 (0.0%) | 43 (9.1%) |
| 65 to 74 Years | 0 (0.0%) | 0 (0.0%) |
| 75 Years and over | 0 (0.0%) | 0 (0.0%) |
Disability Class: Cognitive Difficulty
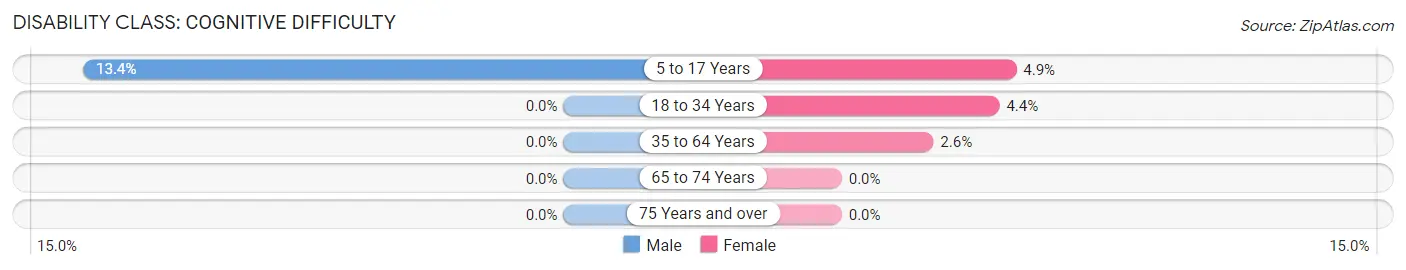
| Age Bracket | Male | Female |
| 5 to 17 Years | 112 (13.4%) | 54 (4.9%) |
| 18 to 34 Years | 0 (0.0%) | 65 (4.4%) |
| 35 to 64 Years | 0 (0.0%) | 12 (2.5%) |
| 65 to 74 Years | 0 (0.0%) | 0 (0.0%) |
| 75 Years and over | 0 (0.0%) | 0 (0.0%) |
Disability Class: Ambulatory Difficulty
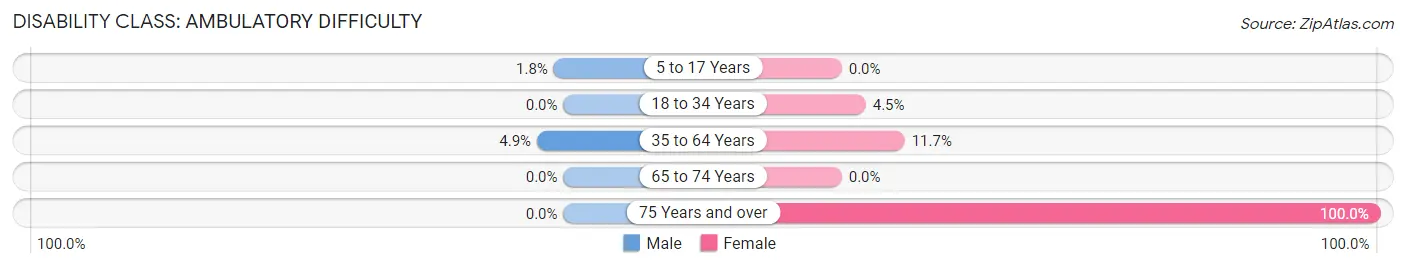
| Age Bracket | Male | Female |
| 5 to 17 Years | 15 (1.8%) | 0 (0.0%) |
| 18 to 34 Years | 0 (0.0%) | 66 (4.4%) |
| 35 to 64 Years | 16 (4.9%) | 55 (11.7%) |
| 65 to 74 Years | 0 (0.0%) | 0 (0.0%) |
| 75 Years and over | 0 (0.0%) | 3 (100.0%) |
Disability Class: Self-Care Difficulty
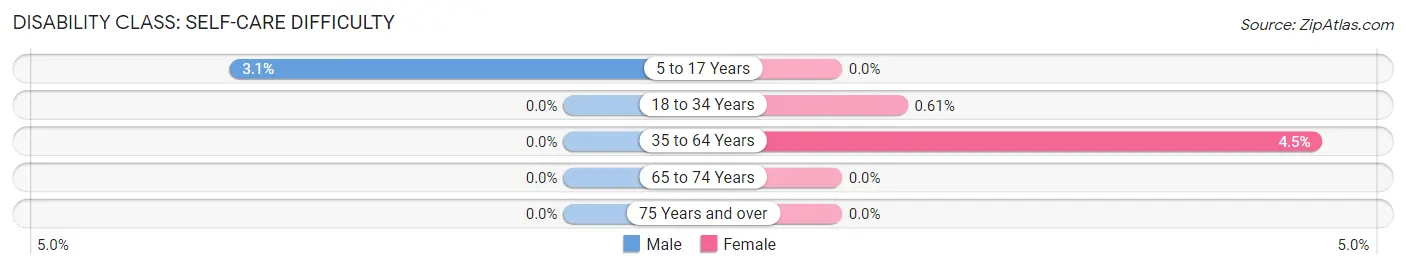
| Age Bracket | Male | Female |
| 5 to 17 Years | 26 (3.1%) | 0 (0.0%) |
| 18 to 34 Years | 0 (0.0%) | 9 (0.6%) |
| 35 to 64 Years | 0 (0.0%) | 21 (4.5%) |
| 65 to 74 Years | 0 (0.0%) | 0 (0.0%) |
| 75 Years and over | 0 (0.0%) | 0 (0.0%) |
Technology Access in Fort Stewart
Computing Device Access in Fort Stewart
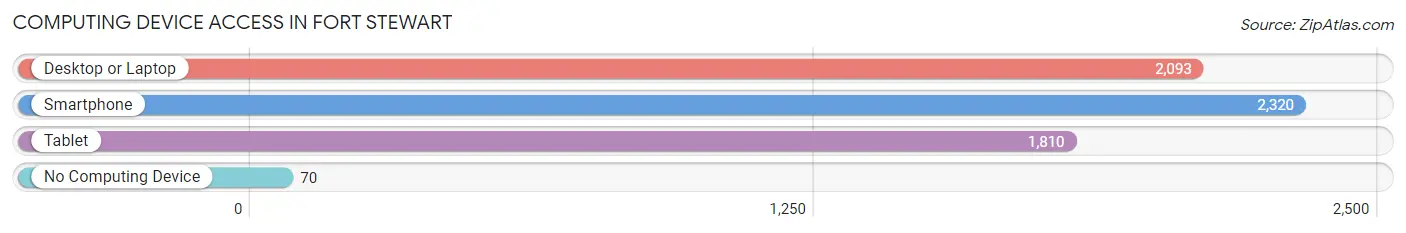
| Device Type | # Households | % Households |
| Desktop or Laptop | 2,093 | 87.6% |
| Smartphone | 2,320 | 97.1% |
| Tablet | 1,810 | 75.7% |
| No Computing Device | 70 | 2.9% |
| Total | 2,390 | 100.0% |
Internet Access in Fort Stewart
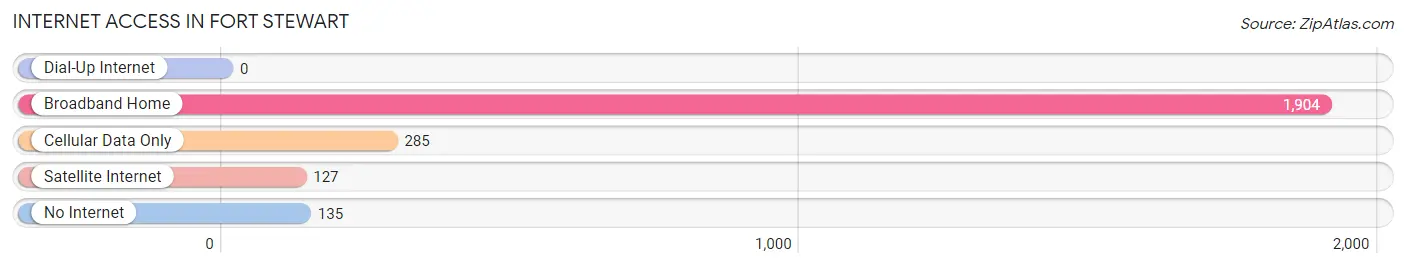
| Internet Type | # Households | % Households |
| Dial-Up Internet | 0 | 0.0% |
| Broadband Home | 1,904 | 79.7% |
| Cellular Data Only | 285 | 11.9% |
| Satellite Internet | 127 | 5.3% |
| No Internet | 135 | 5.7% |
| Total | 2,390 | 100.0% |
Fort Stewart Summary
History
Fort Stewart is a United States Army installation located in Liberty and Long Counties, Georgia. It is the largest Army installation east of the Mississippi River and is home to the 3rd Infantry Division. The installation was established in 1940 and named after General Daniel Stewart, a Revolutionary War hero.
Fort Stewart was originally established as a training camp for the Georgia National Guard in 1940. During World War II, the camp was used to train soldiers for the war effort. After the war, the camp was deactivated and the land was returned to the state of Georgia. In 1955, the Army reactivated the camp and renamed it Fort Stewart.
The installation has played an important role in the history of the United States. During the Vietnam War, Fort Stewart served as a staging area for troops being deployed to the conflict. In the 1980s, the installation was used to train soldiers for the invasion of Grenada. In the 1990s, Fort Stewart was used to train soldiers for the Gulf War.
Today, Fort Stewart is home to the 3rd Infantry Division, which is the Army’s premier mechanized infantry division. The installation is also home to the Army’s Airborne and Special Operations Forces.
Geography
Fort Stewart is located in Liberty and Long Counties, Georgia. The installation covers approximately 280,000 acres of land and is bordered by the Ogeechee River to the east and the Altamaha River to the west. The installation is located approximately 50 miles southwest of Savannah, Georgia.
The terrain of Fort Stewart is mostly flat with some rolling hills. The installation is covered in a mix of pine and hardwood forests. The climate of the area is humid subtropical with hot summers and mild winters.
Economy
Fort Stewart is a major economic driver for the region. The installation has an annual economic impact of over $1 billion. The installation is home to over 20,000 military personnel and their families. This population provides a large consumer base for the local economy.
The installation also provides jobs for over 10,000 civilian employees. These jobs range from administrative and technical positions to construction and maintenance jobs.
The installation also provides a large number of contracts to local businesses. These contracts range from construction and maintenance to food services and retail.
Demographics
As of the 2010 census, the population of Fort Stewart was 11,205. The racial makeup of the installation was 68.3% White, 22.2% African American, 0.7% Native American, 2.2% Asian, 0.1% Pacific Islander, 4.2% from other races, and 2.3% from two or more races. Hispanic or Latino of any race were 8.3% of the population.
The median household income was $45,845 and the median family income was $50,845. The per capita income was $20,845. About 8.3% of families and 10.2% of the population were below the poverty line, including 14.2% of those under age 18 and 6.2% of those age 65 or over.
The population of Fort Stewart is largely military personnel and their families. The installation is home to over 20,000 military personnel and their families. The installation also provides housing for over 10,000 civilian employees.
Common Questions
What is Per Capita Income in Fort Stewart?
Per Capita income in Fort Stewart is $18,963.
What is the Median Family Income in Fort Stewart?
Median Family Income in Fort Stewart is $48,452.
What is the Median Household income in Fort Stewart?
Median Household Income in Fort Stewart is $48,538.
What is Income or Wage Gap in Fort Stewart?
Income or Wage Gap in Fort Stewart is 29.4%.
Women in Fort Stewart earn 70.6 cents for every dollar earned by a man.
What is Family Income Deficit in Fort Stewart?
Family Income Deficit in Fort Stewart is $17,442.
Families that are below poverty line in Fort Stewart earn $17,442 less on average than the poverty threshold level.
What is Inequality or Gini Index in Fort Stewart?
Inequality or Gini Index in Fort Stewart is 0.34.
What is the Total Population of Fort Stewart?
Total Population of Fort Stewart is 9,324.
What is the Total Male Population of Fort Stewart?
Total Male Population of Fort Stewart is 5,034.
What is the Total Female Population of Fort Stewart?
Total Female Population of Fort Stewart is 4,290.
What is the Ratio of Males per 100 Females in Fort Stewart?
There are 117.34 Males per 100 Females in Fort Stewart.
What is the Ratio of Females per 100 Males in Fort Stewart?
There are 85.22 Females per 100 Males in Fort Stewart.
What is the Median Population Age in Fort Stewart?
Median Population Age in Fort Stewart is 21.6 Years.
What is the Average Family Size in Fort Stewart
Average Family Size in Fort Stewart is 3.7 People.
What is the Average Household Size in Fort Stewart
Average Household Size in Fort Stewart is 3.3 People.
How Large is the Labor Force in Fort Stewart?
There are 4,852 People in the Labor Forcein in Fort Stewart.
What is the Percentage of People in the Labor Force in Fort Stewart?
82.5% of People are in the Labor Force in Fort Stewart.
What is the Unemployment Rate in Fort Stewart?
Unemployment Rate in Fort Stewart is 13.5%.