Canton, GA Map & Demographics
Canton Map
Canton Overview
$35,770
PER CAPITA INCOME
$89,341
AVG FAMILY INCOME
$75,414
AVG HOUSEHOLD INCOME
16.9%
WAGE / INCOME GAP [ % ]
83.1¢/ $1
WAGE / INCOME GAP [ $ ]
$15,552
FAMILY INCOME DEFICIT
0.42
INEQUALITY / GINI INDEX
33,499
TOTAL POPULATION
17,238
MALE POPULATION
16,261
FEMALE POPULATION
106.01
MALES / 100 FEMALES
94.33
FEMALES / 100 MALES
34.6
MEDIAN AGE
3.3
AVG FAMILY SIZE
2.7
AVG HOUSEHOLD SIZE
17,887
LABOR FORCE [ PEOPLE ]
69.3%
PERCENT IN LABOR FORCE
7.0%
UNEMPLOYMENT RATE
Income in Canton
Income Overview in Canton
Per Capita Income in Canton is $35,770, while median incomes of families and households are $89,341 and $75,414 respectively.
| Characteristic | Number | Measure |
| Per Capita Income | 33,499 | $35,770 |
| Median Family Income | 8,380 | $89,341 |
| Mean Family Income | 8,380 | $106,623 |
| Median Household Income | 12,268 | $75,414 |
| Mean Household Income | 12,268 | $94,873 |
| Income Deficit | 8,380 | $15,552 |
| Wage / Income Gap (%) | 33,499 | 16.93% |
| Wage / Income Gap ($) | 33,499 | 83.07¢ per $1 |
| Gini / Inequality Index | 33,499 | 0.42 |
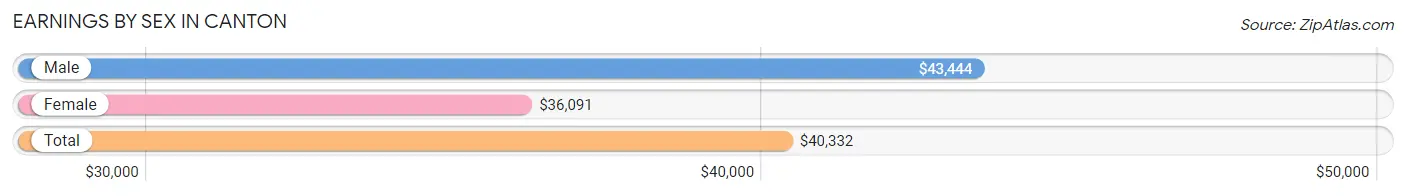
Earnings by Sex in Canton
Average Earnings in Canton are $40,332, $43,444 for men and $36,091 for women, a difference of 16.9%.
| Sex | Number | Average Earnings |
| Male | 10,092 (56.5%) | $43,444 |
| Female | 7,771 (43.5%) | $36,091 |
| Total | 17,863 (100.0%) | $40,332 |
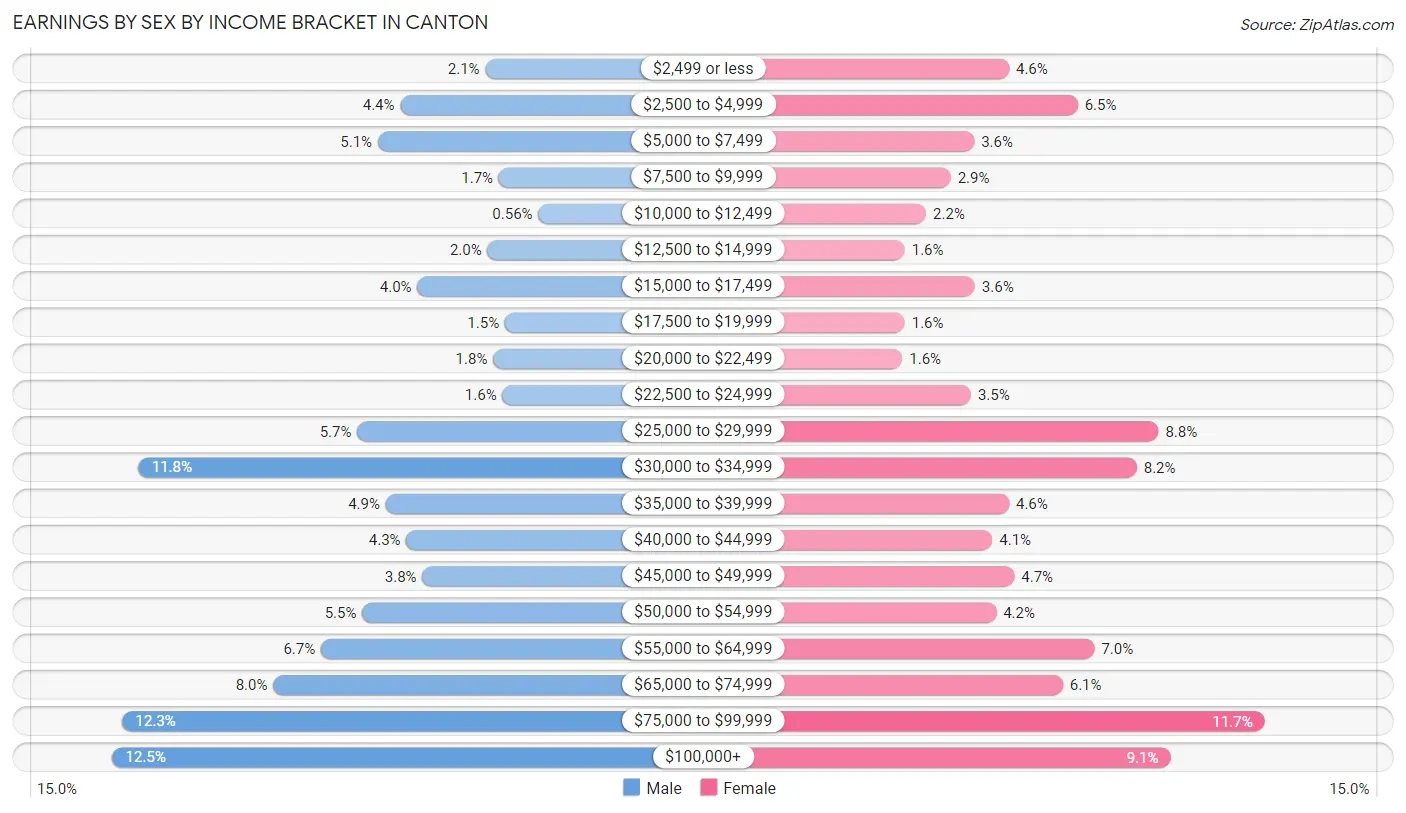
Earnings by Sex by Income Bracket in Canton
The most common earnings brackets in Canton are $100,000+ for men (1,265 | 12.5%) and $75,000 to $99,999 for women (912 | 11.7%).
| Income | Male | Female |
| $2,499 or less | 207 (2.1%) | 354 (4.6%) |
| $2,500 to $4,999 | 448 (4.4%) | 504 (6.5%) |
| $5,000 to $7,499 | 512 (5.1%) | 278 (3.6%) |
| $7,500 to $9,999 | 169 (1.7%) | 227 (2.9%) |
| $10,000 to $12,499 | 57 (0.6%) | 173 (2.2%) |
| $12,500 to $14,999 | 201 (2.0%) | 127 (1.6%) |
| $15,000 to $17,499 | 400 (4.0%) | 280 (3.6%) |
| $17,500 to $19,999 | 151 (1.5%) | 127 (1.6%) |
| $20,000 to $22,499 | 185 (1.8%) | 121 (1.6%) |
| $22,500 to $24,999 | 158 (1.6%) | 271 (3.5%) |
| $25,000 to $29,999 | 570 (5.7%) | 681 (8.8%) |
| $30,000 to $34,999 | 1,190 (11.8%) | 633 (8.2%) |
| $35,000 to $39,999 | 489 (4.9%) | 354 (4.6%) |
| $40,000 to $44,999 | 431 (4.3%) | 318 (4.1%) |
| $45,000 to $49,999 | 386 (3.8%) | 366 (4.7%) |
| $50,000 to $54,999 | 556 (5.5%) | 326 (4.2%) |
| $55,000 to $64,999 | 673 (6.7%) | 541 (7.0%) |
| $65,000 to $74,999 | 808 (8.0%) | 472 (6.1%) |
| $75,000 to $99,999 | 1,236 (12.2%) | 912 (11.7%) |
| $100,000+ | 1,265 (12.5%) | 706 (9.1%) |
| Total | 10,092 (100.0%) | 7,771 (100.0%) |
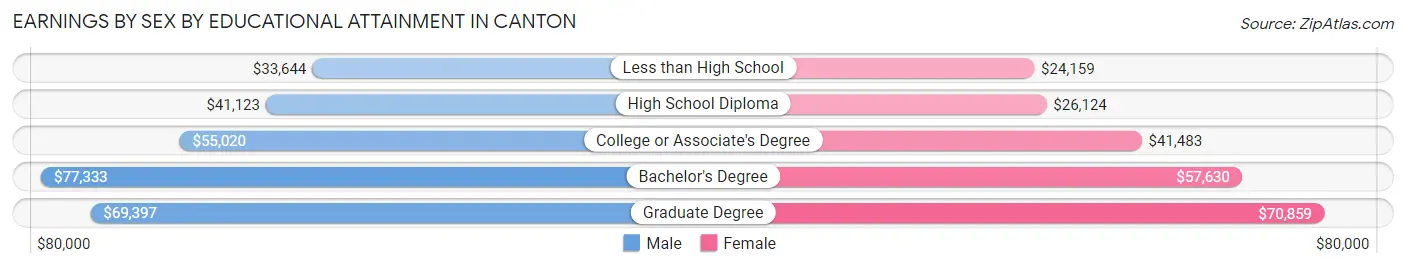
Earnings by Sex by Educational Attainment in Canton
Average earnings in Canton are $53,735 for men and $45,454 for women, a difference of 15.4%. Men with an educational attainment of bachelor's degree enjoy the highest average annual earnings of $77,333, while those with less than high school education earn the least with $33,644. Women with an educational attainment of graduate degree earn the most with the average annual earnings of $70,859, while those with less than high school education have the smallest earnings of $24,159.
| Educational Attainment | Male Income | Female Income |
| Less than High School | $33,644 | $24,159 |
| High School Diploma | $41,123 | $26,124 |
| College or Associate's Degree | $55,020 | $41,483 |
| Bachelor's Degree | $77,333 | $57,630 |
| Graduate Degree | $69,397 | $70,859 |
| Total | $53,735 | $45,454 |
Family Income in Canton
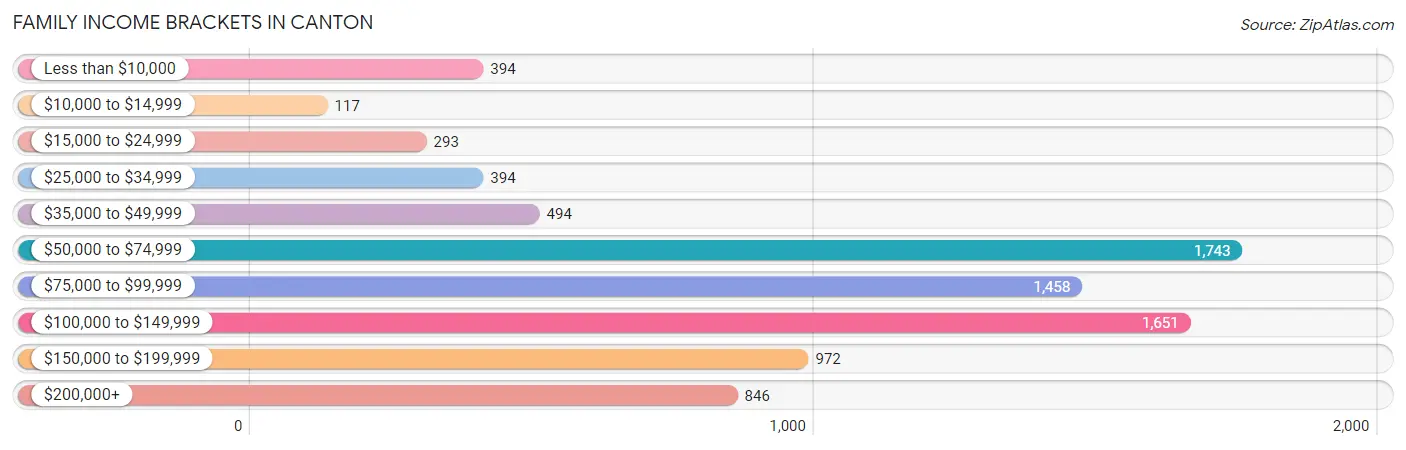
Family Income Brackets in Canton
According to the Canton family income data, there are 1,743 families falling into the $50,000 to $74,999 income range, which is the most common income bracket and makes up 20.8% of all families. Conversely, the $10,000 to $14,999 income bracket is the least frequent group with only 117 families (1.4%) belonging to this category.
| Income Bracket | # Families | % Families |
| Less than $10,000 | 394 | 4.7% |
| $10,000 to $14,999 | 117 | 1.4% |
| $15,000 to $24,999 | 293 | 3.5% |
| $25,000 to $34,999 | 394 | 4.7% |
| $35,000 to $49,999 | 494 | 5.9% |
| $50,000 to $74,999 | 1,743 | 20.8% |
| $75,000 to $99,999 | 1,458 | 17.4% |
| $100,000 to $149,999 | 1,651 | 19.7% |
| $150,000 to $199,999 | 972 | 11.6% |
| $200,000+ | 846 | 10.1% |
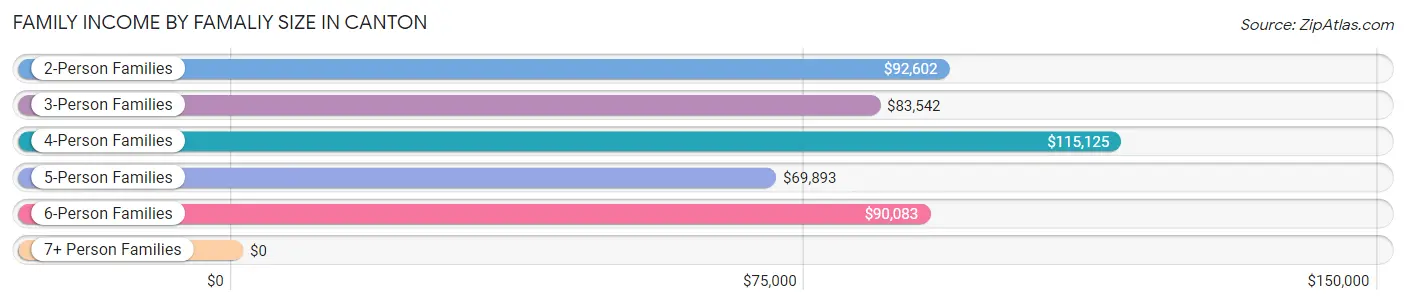
Family Income by Famaliy Size in Canton
4-person families (1,617 | 19.3%) account for the highest median family income in Canton with $115,125 per family, while 2-person families (3,967 | 47.3%) have the highest median income of $46,301 per family member.
| Income Bracket | # Families | Median Income |
| 2-Person Families | 3,967 (47.3%) | $92,602 |
| 3-Person Families | 1,481 (17.7%) | $83,542 |
| 4-Person Families | 1,617 (19.3%) | $115,125 |
| 5-Person Families | 988 (11.8%) | $69,893 |
| 6-Person Families | 263 (3.1%) | $90,083 |
| 7+ Person Families | 64 (0.8%) | $0 |
| Total | 8,380 (100.0%) | $89,341 |
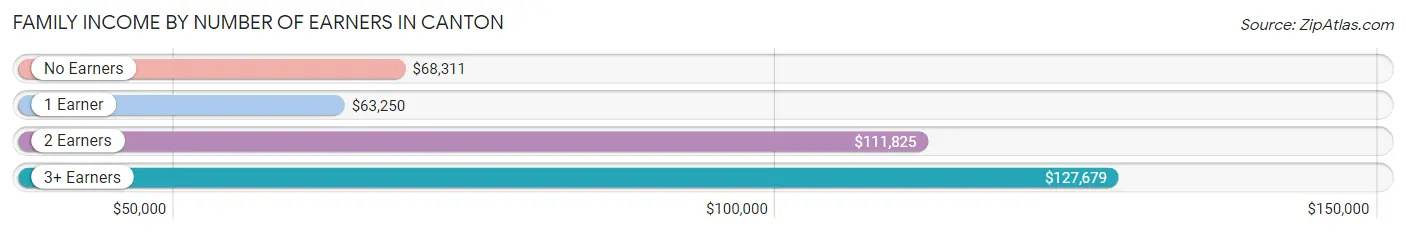
Family Income by Number of Earners in Canton
The median family income in Canton is $89,341, with families comprising 3+ earners (896) having the highest median family income of $127,679, while families with 1 earner (1,939) have the lowest median family income of $63,250, accounting for 10.7% and 23.1% of families, respectively.
| Number of Earners | # Families | Median Income |
| No Earners | 1,397 (16.7%) | $68,311 |
| 1 Earner | 1,939 (23.1%) | $63,250 |
| 2 Earners | 4,148 (49.5%) | $111,825 |
| 3+ Earners | 896 (10.7%) | $127,679 |
| Total | 8,380 (100.0%) | $89,341 |
Household Income in Canton
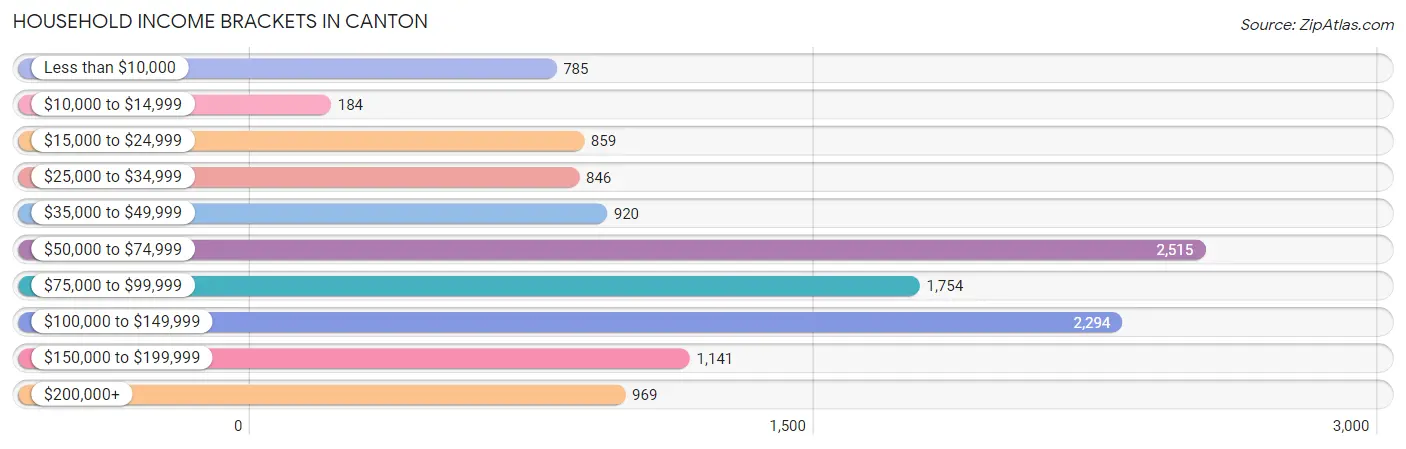
Household Income Brackets in Canton
With 2,515 households falling in the category, the $50,000 to $74,999 income range is the most frequent in Canton, accounting for 20.5% of all households. In contrast, only 184 households (1.5%) fall into the $10,000 to $14,999 income bracket, making it the least populous group.
| Income Bracket | # Households | % Households |
| Less than $10,000 | 785 | 6.4% |
| $10,000 to $14,999 | 184 | 1.5% |
| $15,000 to $24,999 | 859 | 7.0% |
| $25,000 to $34,999 | 846 | 6.9% |
| $35,000 to $49,999 | 920 | 7.5% |
| $50,000 to $74,999 | 2,515 | 20.5% |
| $75,000 to $99,999 | 1,754 | 14.3% |
| $100,000 to $149,999 | 2,294 | 18.7% |
| $150,000 to $199,999 | 1,141 | 9.3% |
| $200,000+ | 969 | 7.9% |
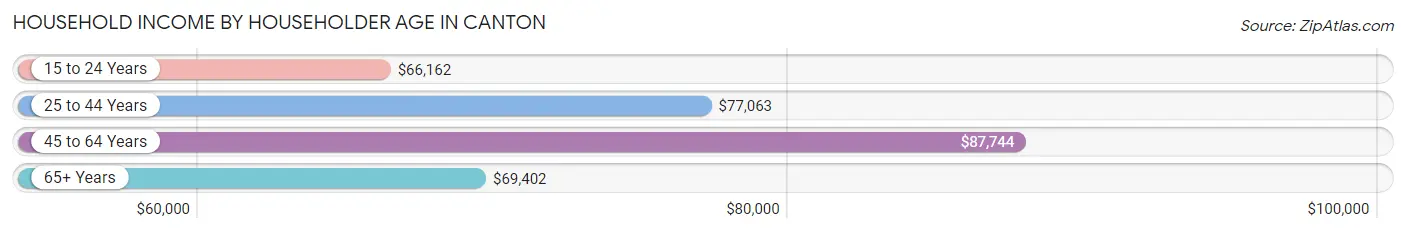
Household Income by Householder Age in Canton
The median household income in Canton is $75,414, with the highest median household income of $87,744 found in the 45 to 64 years age bracket for the primary householder. A total of 3,932 households (32.1%) fall into this category. Meanwhile, the 15 to 24 years age bracket for the primary householder has the lowest median household income of $66,162, with 619 households (5.1%) in this group.
| Income Bracket | # Households | Median Income |
| 15 to 24 Years | 619 (5.1%) | $66,162 |
| 25 to 44 Years | 4,822 (39.3%) | $77,063 |
| 45 to 64 Years | 3,932 (32.1%) | $87,744 |
| 65+ Years | 2,895 (23.6%) | $69,402 |
| Total | 12,268 (100.0%) | $75,414 |
Poverty in Canton
Income Below Poverty by Sex and Age in Canton
With 12.0% poverty level for males and 15.4% for females among the residents of Canton, 16 and 17 year old males and 15 year old females are the most vulnerable to poverty, with 99 males (29.2%) and 95 females (62.5%) in their respective age groups living below the poverty level.
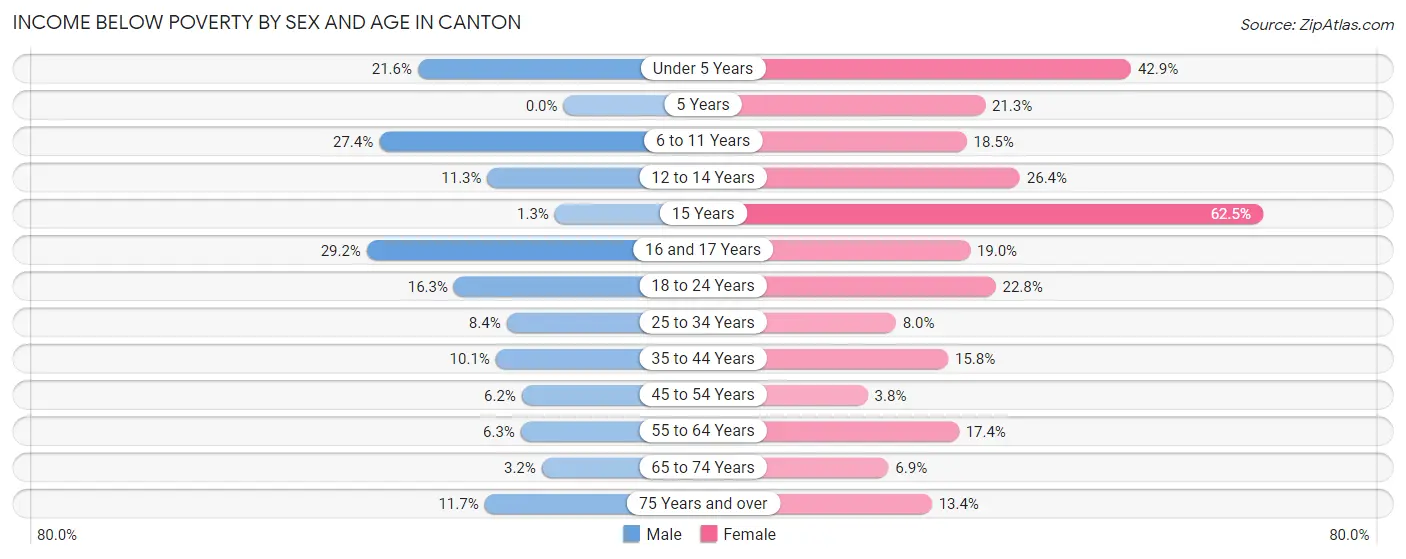
| Age Bracket | Male | Female |
| Under 5 Years | 320 (21.6%) | 298 (42.9%) |
| 5 Years | 0 (0.0%) | 27 (21.3%) |
| 6 to 11 Years | 376 (27.4%) | 264 (18.5%) |
| 12 to 14 Years | 80 (11.3%) | 206 (26.4%) |
| 15 Years | 4 (1.3%) | 95 (62.5%) |
| 16 and 17 Years | 99 (29.2%) | 98 (19.0%) |
| 18 to 24 Years | 356 (16.3%) | 318 (22.8%) |
| 25 to 34 Years | 218 (8.4%) | 179 (8.0%) |
| 35 to 44 Years | 260 (10.1%) | 357 (15.8%) |
| 45 to 54 Years | 102 (6.2%) | 80 (3.8%) |
| 55 to 64 Years | 73 (6.3%) | 301 (17.4%) |
| 65 to 74 Years | 39 (3.2%) | 108 (6.9%) |
| 75 Years and over | 116 (11.7%) | 141 (13.4%) |
| Total | 2,043 (12.0%) | 2,472 (15.4%) |
Income Above Poverty by Sex and Age in Canton
According to the poverty statistics in Canton, males aged 5 years and females aged 45 to 54 years are the age groups that are most secure financially, with 100.0% of males and 96.2% of females in these age groups living above the poverty line.
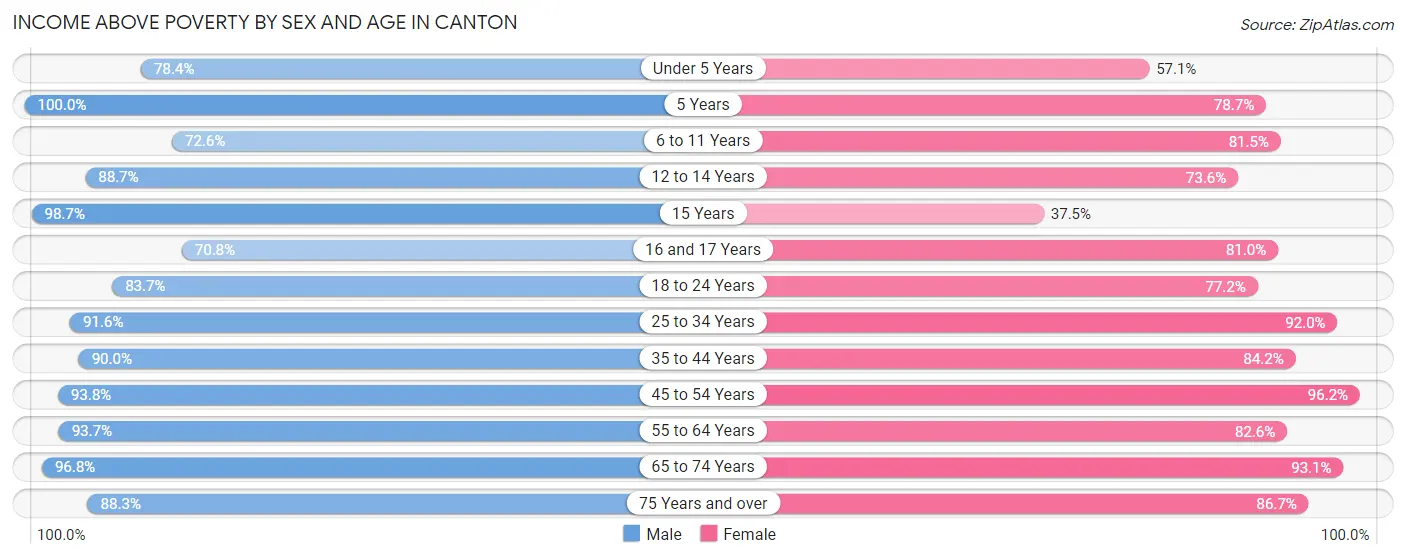
| Age Bracket | Male | Female |
| Under 5 Years | 1,161 (78.4%) | 396 (57.1%) |
| 5 Years | 476 (100.0%) | 100 (78.7%) |
| 6 to 11 Years | 998 (72.6%) | 1,161 (81.5%) |
| 12 to 14 Years | 629 (88.7%) | 573 (73.6%) |
| 15 Years | 307 (98.7%) | 57 (37.5%) |
| 16 and 17 Years | 240 (70.8%) | 417 (81.0%) |
| 18 to 24 Years | 1,832 (83.7%) | 1,075 (77.2%) |
| 25 to 34 Years | 2,366 (91.6%) | 2,057 (92.0%) |
| 35 to 44 Years | 2,326 (89.9%) | 1,905 (84.2%) |
| 45 to 54 Years | 1,546 (93.8%) | 2,002 (96.2%) |
| 55 to 64 Years | 1,079 (93.7%) | 1,433 (82.6%) |
| 65 to 74 Years | 1,167 (96.8%) | 1,452 (93.1%) |
| 75 Years and over | 875 (88.3%) | 915 (86.7%) |
| Total | 15,002 (88.0%) | 13,543 (84.6%) |
Income Below Poverty Among Married-Couple Families in Canton
The poverty statistics for married-couple families in Canton show that 7.1% or 443 of the total 6,211 families live below the poverty line. Families with 5 or more children have the highest poverty rate of 100.0%, comprising of 64 families. On the other hand, families with no children have the lowest poverty rate of 3.9%, which includes 134 families.
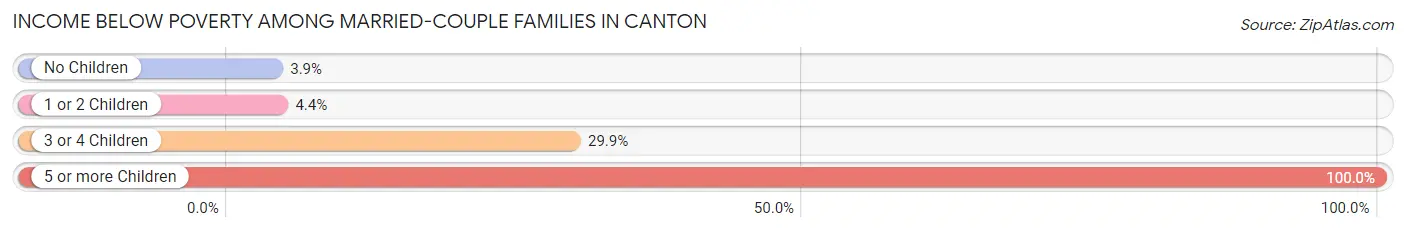
| Children | Above Poverty | Below Poverty |
| No Children | 3,269 (96.1%) | 134 (3.9%) |
| 1 or 2 Children | 2,156 (95.6%) | 99 (4.4%) |
| 3 or 4 Children | 343 (70.1%) | 146 (29.9%) |
| 5 or more Children | 0 (0.0%) | 64 (100.0%) |
| Total | 5,768 (92.9%) | 443 (7.1%) |
Income Below Poverty Among Single-Parent Households in Canton
According to the poverty data in Canton, 11.9% or 93 single-father households and 16.5% or 229 single-mother households are living below the poverty line. Among single-father households, those with 1 or 2 children have the highest poverty rate, with 38 households (16.5%) experiencing poverty. Likewise, among single-mother households, those with 5 or more children have the highest poverty rate, with 32 households (100.0%) falling below the poverty line.
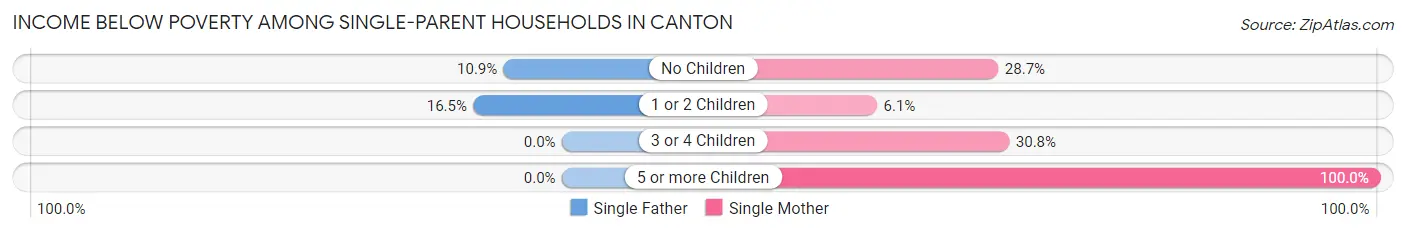
| Children | Single Father | Single Mother |
| No Children | 55 (10.9%) | 104 (28.7%) |
| 1 or 2 Children | 38 (16.5%) | 53 (6.1%) |
| 3 or 4 Children | 0 (0.0%) | 40 (30.8%) |
| 5 or more Children | 0 (0.0%) | 32 (100.0%) |
| Total | 93 (11.9%) | 229 (16.5%) |
Income Below Poverty Among Married-Couple vs Single-Parent Households in Canton
The poverty data for Canton shows that 443 of the married-couple family households (7.1%) and 322 of the single-parent households (14.8%) are living below the poverty level. Within the married-couple family households, those with 5 or more children have the highest poverty rate, with 64 households (100.0%) falling below the poverty line. Among the single-parent households, those with 5 or more children have the highest poverty rate, with 32 household (100.0%) living below poverty.
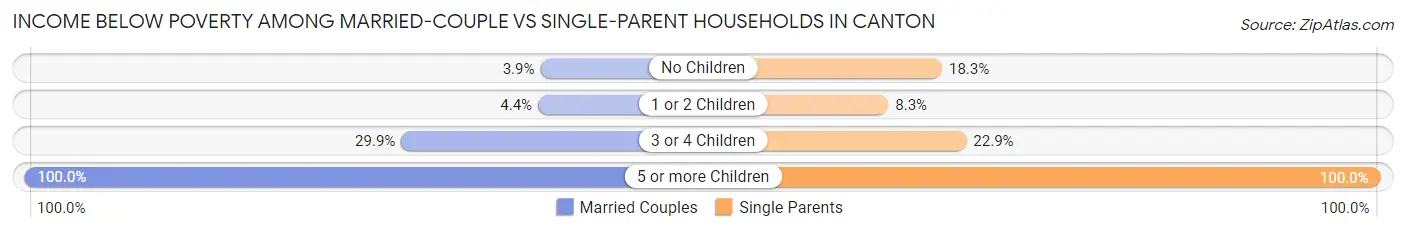
| Children | Married-Couple Families | Single-Parent Households |
| No Children | 134 (3.9%) | 159 (18.3%) |
| 1 or 2 Children | 99 (4.4%) | 91 (8.3%) |
| 3 or 4 Children | 146 (29.9%) | 40 (22.9%) |
| 5 or more Children | 64 (100.0%) | 32 (100.0%) |
| Total | 443 (7.1%) | 322 (14.8%) |
Race in Canton
The most populous races in Canton are White / Caucasian (22,817 | 68.1%), Hispanic or Latino (7,463 | 22.3%), and Black / African American (4,435 | 13.2%).
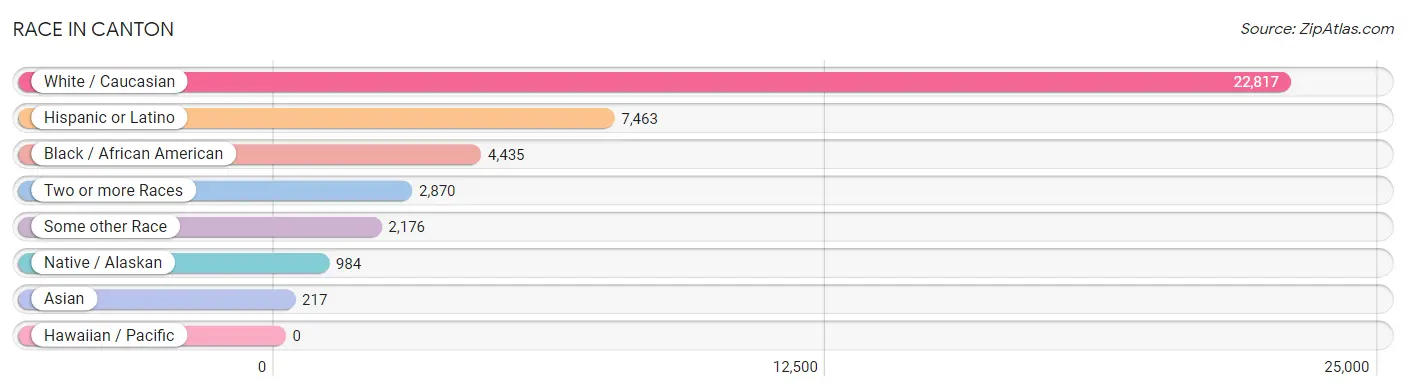
| Race | # Population | % Population |
| Asian | 217 | 0.6% |
| Black / African American | 4,435 | 13.2% |
| Hawaiian / Pacific | 0 | 0.0% |
| Hispanic or Latino | 7,463 | 22.3% |
| Native / Alaskan | 984 | 2.9% |
| White / Caucasian | 22,817 | 68.1% |
| Two or more Races | 2,870 | 8.6% |
| Some other Race | 2,176 | 6.5% |
| Total | 33,499 | 100.0% |
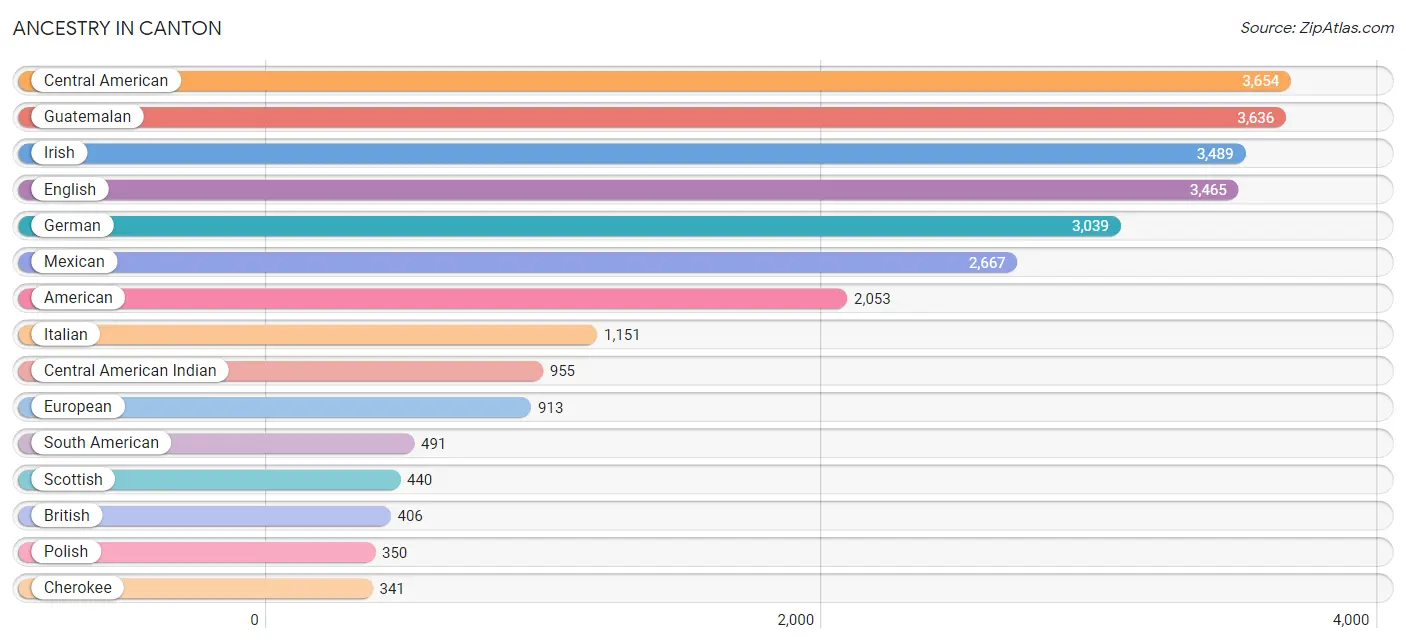
Ancestry in Canton
The most populous ancestries reported in Canton are Central American (3,654 | 10.9%), Guatemalan (3,636 | 10.8%), Irish (3,489 | 10.4%), English (3,465 | 10.3%), and German (3,039 | 9.1%), together accounting for 51.6% of all Canton residents.
| Ancestry | # Population | % Population |
| African | 137 | 0.4% |
| Aleut | 2 | 0.0% |
| American | 2,053 | 6.1% |
| Arab | 47 | 0.1% |
| Australian | 54 | 0.2% |
| Austrian | 9 | 0.0% |
| Bahamian | 192 | 0.6% |
| Belgian | 19 | 0.1% |
| Bhutanese | 149 | 0.4% |
| Blackfeet | 140 | 0.4% |
| Brazilian | 33 | 0.1% |
| British | 406 | 1.2% |
| Burmese | 108 | 0.3% |
| Canadian | 49 | 0.2% |
| Central American | 3,654 | 10.9% |
| Central American Indian | 955 | 2.9% |
| Cherokee | 341 | 1.0% |
| Chilean | 204 | 0.6% |
| Colombian | 220 | 0.7% |
| Comanche | 21 | 0.1% |
| Creek | 4 | 0.0% |
| Cuban | 97 | 0.3% |
| Czech | 97 | 0.3% |
| Czechoslovakian | 14 | 0.0% |
| Danish | 16 | 0.1% |
| Dutch | 236 | 0.7% |
| Eastern European | 41 | 0.1% |
| Egyptian | 22 | 0.1% |
| English | 3,465 | 10.3% |
| European | 913 | 2.7% |
| Filipino | 27 | 0.1% |
| French | 243 | 0.7% |
| French Canadian | 16 | 0.1% |
| German | 3,039 | 9.1% |
| Ghanaian | 36 | 0.1% |
| Greek | 28 | 0.1% |
| Guatemalan | 3,636 | 10.8% |
| Haitian | 165 | 0.5% |
| Houma | 1 | 0.0% |
| Hungarian | 8 | 0.0% |
| Irish | 3,489 | 10.4% |
| Italian | 1,151 | 3.4% |
| Jamaican | 117 | 0.4% |
| Korean | 8 | 0.0% |
| Lebanese | 25 | 0.1% |
| Mexican | 2,667 | 8.0% |
| Northern European | 20 | 0.1% |
| Norwegian | 158 | 0.5% |
| Pakistani | 12 | 0.0% |
| Polish | 350 | 1.0% |
| Puerto Rican | 259 | 0.8% |
| Russian | 124 | 0.4% |
| Salvadoran | 18 | 0.1% |
| Scotch-Irish | 324 | 1.0% |
| Scottish | 440 | 1.3% |
| Serbian | 89 | 0.3% |
| Slovak | 14 | 0.0% |
| South African | 21 | 0.1% |
| South American | 491 | 1.5% |
| Spanish | 33 | 0.1% |
| Subsaharan African | 194 | 0.6% |
| Swedish | 244 | 0.7% |
| Swiss | 8 | 0.0% |
| Thai | 40 | 0.1% |
| Trinidadian and Tobagonian | 34 | 0.1% |
| Venezuelan | 67 | 0.2% |
| Welsh | 157 | 0.5% | View All 67 Rows |
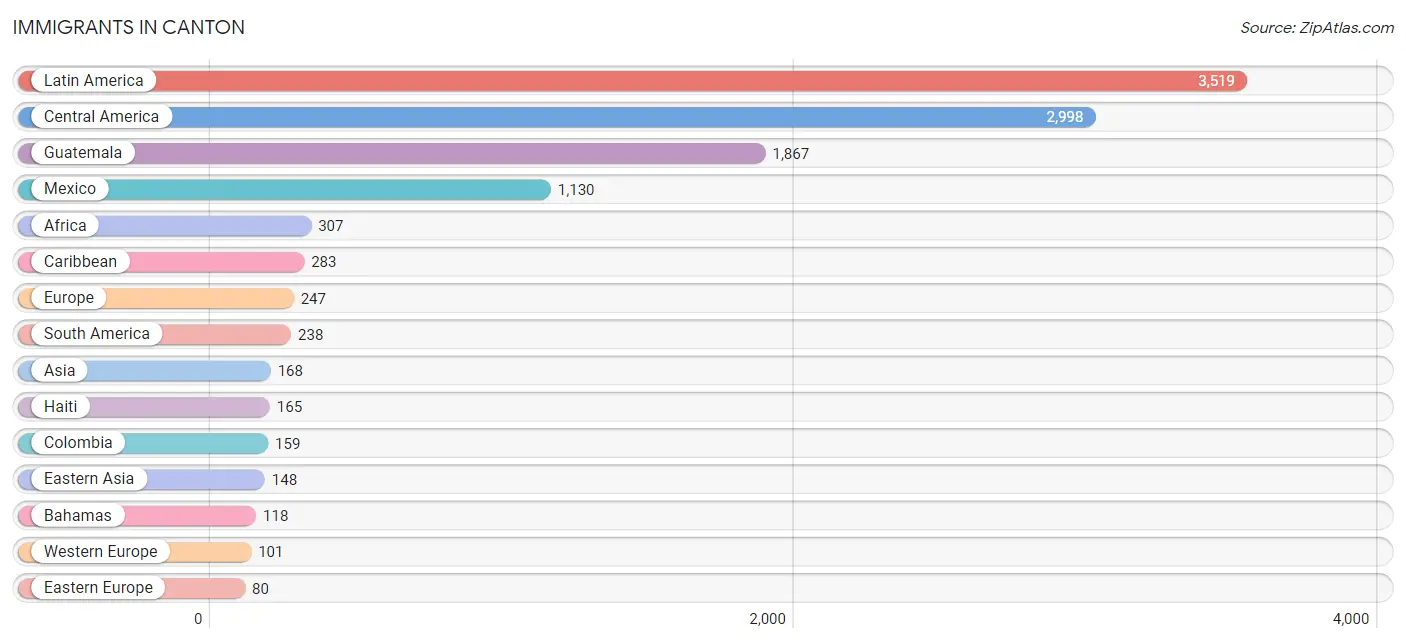
Immigrants in Canton
The most numerous immigrant groups reported in Canton came from Latin America (3,519 | 10.5%), Central America (2,998 | 8.9%), Guatemala (1,867 | 5.6%), Mexico (1,130 | 3.4%), and Africa (307 | 0.9%), together accounting for 29.3% of all Canton residents.
| Immigration Origin | # Population | % Population |
| Africa | 307 | 0.9% |
| Asia | 168 | 0.5% |
| Austria | 23 | 0.1% |
| Bahamas | 118 | 0.4% |
| Belarus | 52 | 0.2% |
| Brazil | 63 | 0.2% |
| Canada | 36 | 0.1% |
| Caribbean | 283 | 0.8% |
| Central America | 2,998 | 8.9% |
| Colombia | 159 | 0.5% |
| Denmark | 11 | 0.0% |
| Eastern Asia | 148 | 0.4% |
| Eastern Europe | 80 | 0.2% |
| El Salvador | 1 | 0.0% |
| England | 55 | 0.2% |
| Europe | 247 | 0.7% |
| France | 41 | 0.1% |
| Germany | 37 | 0.1% |
| Guatemala | 1,867 | 5.6% |
| Haiti | 165 | 0.5% |
| Japan | 73 | 0.2% |
| Korea | 75 | 0.2% |
| Latin America | 3,519 | 10.5% |
| Mexico | 1,130 | 3.4% |
| Northern Europe | 66 | 0.2% |
| Philippines | 8 | 0.0% |
| Russia | 28 | 0.1% |
| South Africa | 21 | 0.1% |
| South America | 238 | 0.7% |
| South Eastern Asia | 20 | 0.1% |
| Thailand | 12 | 0.0% |
| Venezuela | 16 | 0.1% |
| Western Europe | 101 | 0.3% | View All 33 Rows |
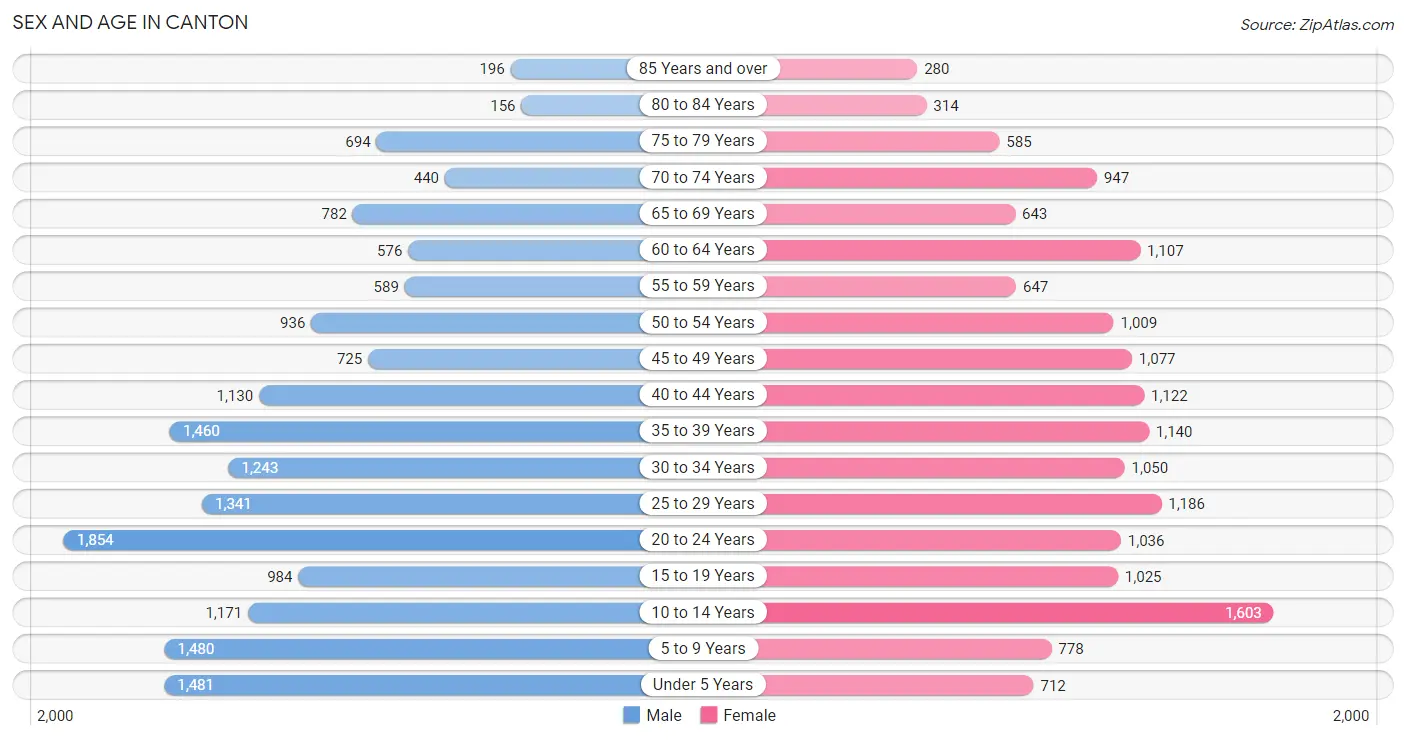
Sex and Age in Canton
Sex and Age in Canton
The most populous age groups in Canton are 20 to 24 Years (1,854 | 10.8%) for men and 10 to 14 Years (1,603 | 9.9%) for women.
| Age Bracket | Male | Female |
| Under 5 Years | 1,481 (8.6%) | 712 (4.4%) |
| 5 to 9 Years | 1,480 (8.6%) | 778 (4.8%) |
| 10 to 14 Years | 1,171 (6.8%) | 1,603 (9.9%) |
| 15 to 19 Years | 984 (5.7%) | 1,025 (6.3%) |
| 20 to 24 Years | 1,854 (10.8%) | 1,036 (6.4%) |
| 25 to 29 Years | 1,341 (7.8%) | 1,186 (7.3%) |
| 30 to 34 Years | 1,243 (7.2%) | 1,050 (6.5%) |
| 35 to 39 Years | 1,460 (8.5%) | 1,140 (7.0%) |
| 40 to 44 Years | 1,130 (6.6%) | 1,122 (6.9%) |
| 45 to 49 Years | 725 (4.2%) | 1,077 (6.6%) |
| 50 to 54 Years | 936 (5.4%) | 1,009 (6.2%) |
| 55 to 59 Years | 589 (3.4%) | 647 (4.0%) |
| 60 to 64 Years | 576 (3.3%) | 1,107 (6.8%) |
| 65 to 69 Years | 782 (4.5%) | 643 (4.0%) |
| 70 to 74 Years | 440 (2.5%) | 947 (5.8%) |
| 75 to 79 Years | 694 (4.0%) | 585 (3.6%) |
| 80 to 84 Years | 156 (0.9%) | 314 (1.9%) |
| 85 Years and over | 196 (1.1%) | 280 (1.7%) |
| Total | 17,238 (100.0%) | 16,261 (100.0%) |
Families and Households in Canton
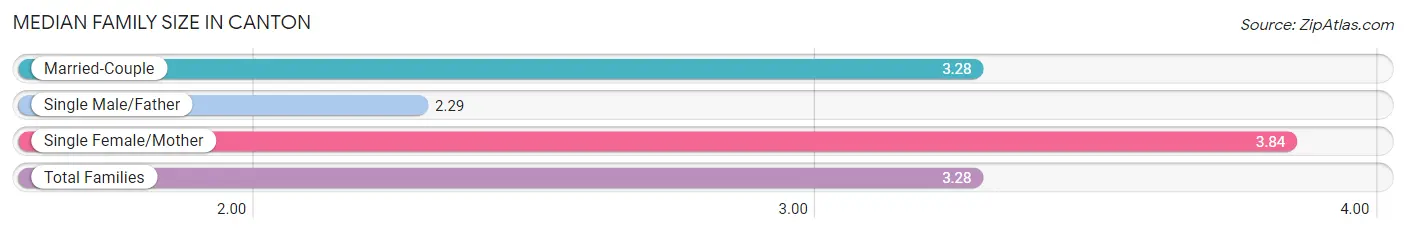
Median Family Size in Canton
The median family size in Canton is 3.28 persons per family, with single female/mother families (1,388 | 16.6%) accounting for the largest median family size of 3.84 persons per family. On the other hand, single male/father families (781 | 9.3%) represent the smallest median family size with 2.29 persons per family.
| Family Type | # Families | Family Size |
| Married-Couple | 6,211 (74.1%) | 3.28 |
| Single Male/Father | 781 (9.3%) | 2.29 |
| Single Female/Mother | 1,388 (16.6%) | 3.84 |
| Total Families | 8,380 (100.0%) | 3.28 |
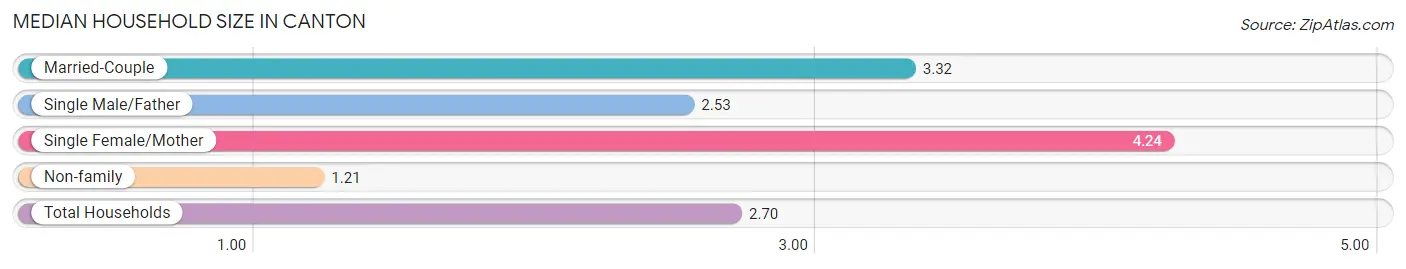
Median Household Size in Canton
The median household size in Canton is 2.70 persons per household, with single female/mother households (1,388 | 11.3%) accounting for the largest median household size of 4.24 persons per household. non-family households (3,888 | 31.7%) represent the smallest median household size with 1.21 persons per household.
| Household Type | # Households | Household Size |
| Married-Couple | 6,211 (50.6%) | 3.32 |
| Single Male/Father | 781 (6.4%) | 2.53 |
| Single Female/Mother | 1,388 (11.3%) | 4.24 |
| Non-family | 3,888 (31.7%) | 1.21 |
| Total Households | 12,268 (100.0%) | 2.70 |
Household Size by Marriage Status in Canton
Out of a total of 12,268 households in Canton, 8,380 (68.3%) are family households, while 3,888 (31.7%) are nonfamily households. The most numerous type of family households are 2-person households, comprising 3,713, and the most common type of nonfamily households are 1-person households, comprising 3,111.
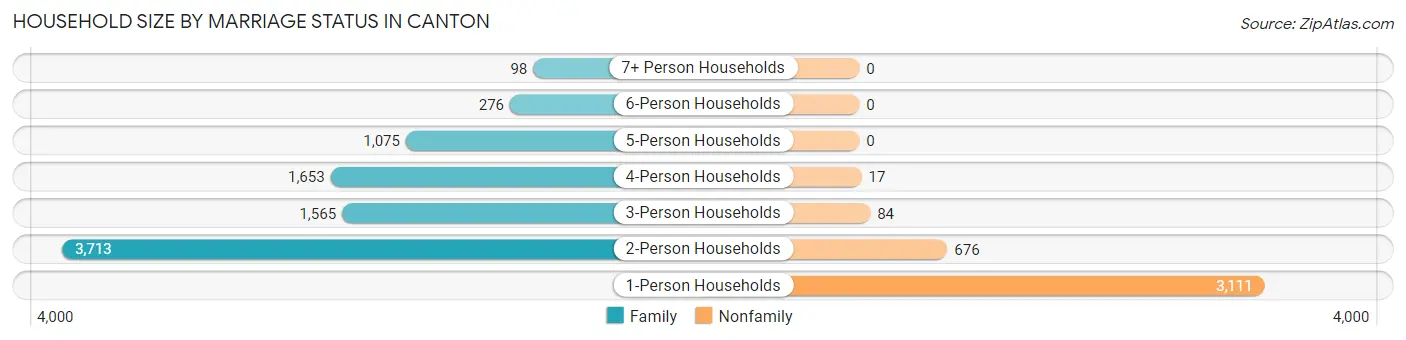
| Household Size | Family Households | Nonfamily Households |
| 1-Person Households | - | 3,111 (25.4%) |
| 2-Person Households | 3,713 (30.3%) | 676 (5.5%) |
| 3-Person Households | 1,565 (12.8%) | 84 (0.7%) |
| 4-Person Households | 1,653 (13.5%) | 17 (0.1%) |
| 5-Person Households | 1,075 (8.8%) | 0 (0.0%) |
| 6-Person Households | 276 (2.2%) | 0 (0.0%) |
| 7+ Person Households | 98 (0.8%) | 0 (0.0%) |
| Total | 8,380 (68.3%) | 3,888 (31.7%) |
Female Fertility in Canton
Fertility by Age in Canton
Average fertility rate in Canton is 60.0 births per 1,000 women. Women in the age bracket of 20 to 34 years have the highest fertility rate with 104.0 births per 1,000 women. Women in the age bracket of 20 to 34 years acount for 71.5% of all women with births.
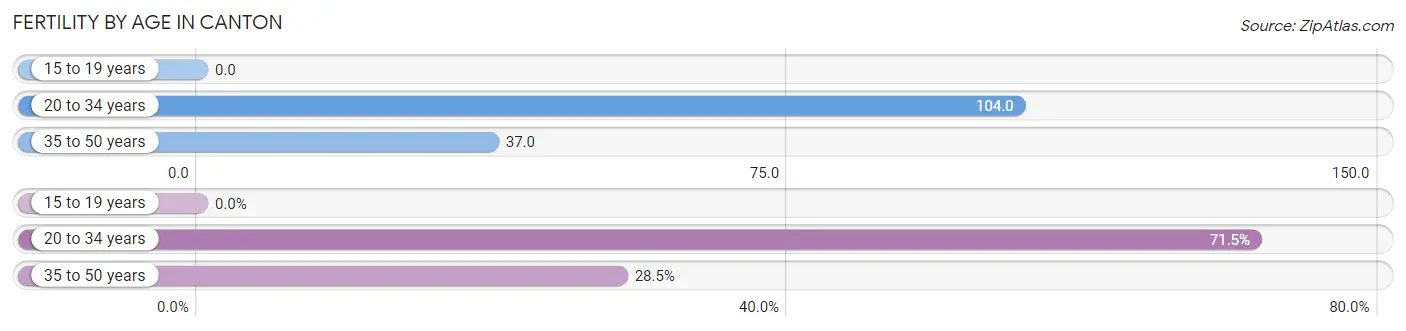
| Age Bracket | Women with Births | Births / 1,000 Women |
| 15 to 19 years | 0 (0.0%) | 0.0 |
| 20 to 34 years | 339 (71.5%) | 104.0 |
| 35 to 50 years | 135 (28.5%) | 37.0 |
| Total | 474 (100.0%) | 60.0 |
Fertility by Age by Marriage Status in Canton
82.9% of women with births (474) in Canton are married. The highest percentage of unmarried women with births falls into 20 to 34 years age bracket with 23.9% of them unmarried at the time of birth, while the lowest percentage of unmarried women with births belong to 35 to 50 years age bracket with 0.0% of them unmarried.
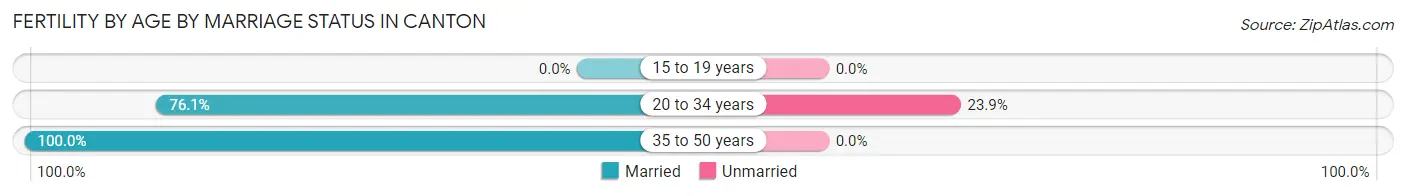
| Age Bracket | Married | Unmarried |
| 15 to 19 years | 0 (0.0%) | 0 (0.0%) |
| 20 to 34 years | 258 (76.1%) | 81 (23.9%) |
| 35 to 50 years | 135 (100.0%) | 0 (0.0%) |
| Total | 393 (82.9%) | 81 (17.1%) |
Fertility by Education in Canton
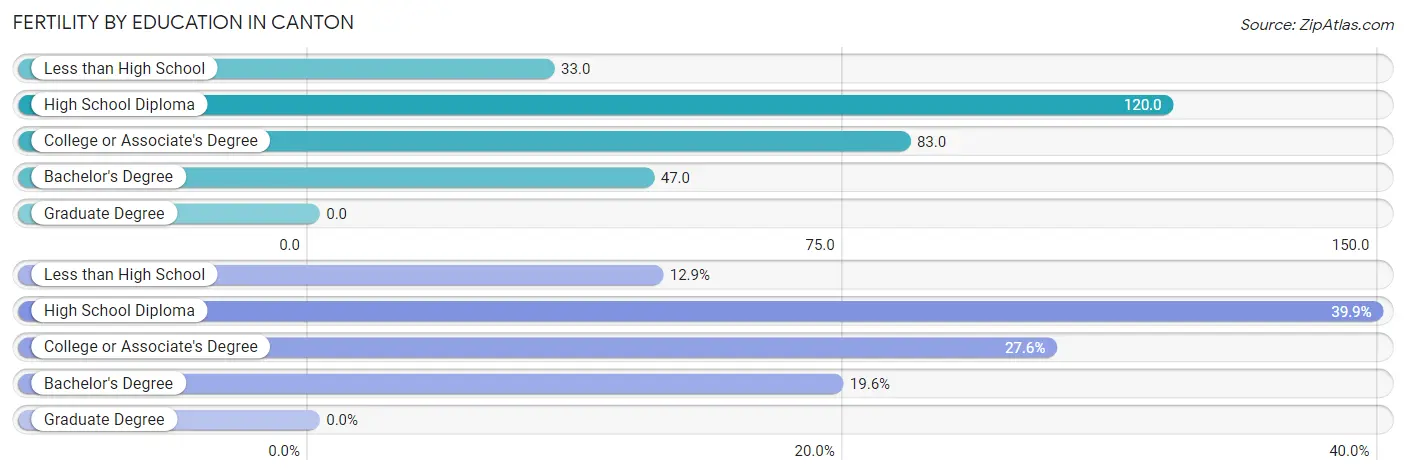
| Educational Attainment | Women with Births | Births / 1,000 Women |
| Less than High School | 61 (12.9%) | 33.0 |
| High School Diploma | 189 (39.9%) | 120.0 |
| College or Associate's Degree | 131 (27.6%) | 83.0 |
| Bachelor's Degree | 93 (19.6%) | 47.0 |
| Graduate Degree | 0 (0.0%) | 0.0 |
| Total | 474 (100.0%) | 60.0 |
Fertility by Education by Marriage Status in Canton
17.1% of women with births in Canton are unmarried. Women with the educational attainment of college or associate's degree are most likely to be married with 100.0% of them married at childbirth, while women with the educational attainment of less than high school are least likely to be married with 47.5% of them unmarried at childbirth.
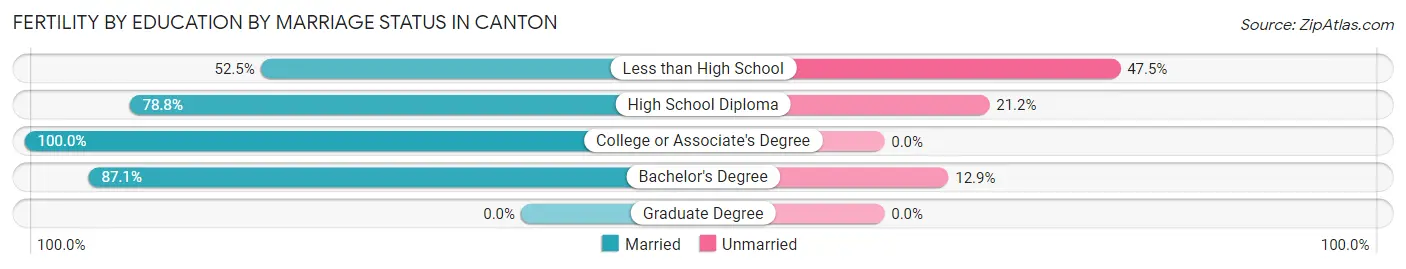
| Educational Attainment | Married | Unmarried |
| Less than High School | 32 (52.5%) | 29 (47.5%) |
| High School Diploma | 149 (78.8%) | 40 (21.2%) |
| College or Associate's Degree | 131 (100.0%) | 0 (0.0%) |
| Bachelor's Degree | 81 (87.1%) | 12 (12.9%) |
| Graduate Degree | 0 (0.0%) | 0 (0.0%) |
| Total | 393 (82.9%) | 81 (17.1%) |
Employment Characteristics in Canton
Employment by Class of Employer in Canton
Among the 16,081 employed individuals in Canton, private company employees (11,701 | 72.8%), local government employees (1,167 | 7.3%), and not-for-profit organizations (944 | 5.9%) make up the most common classes of employment.
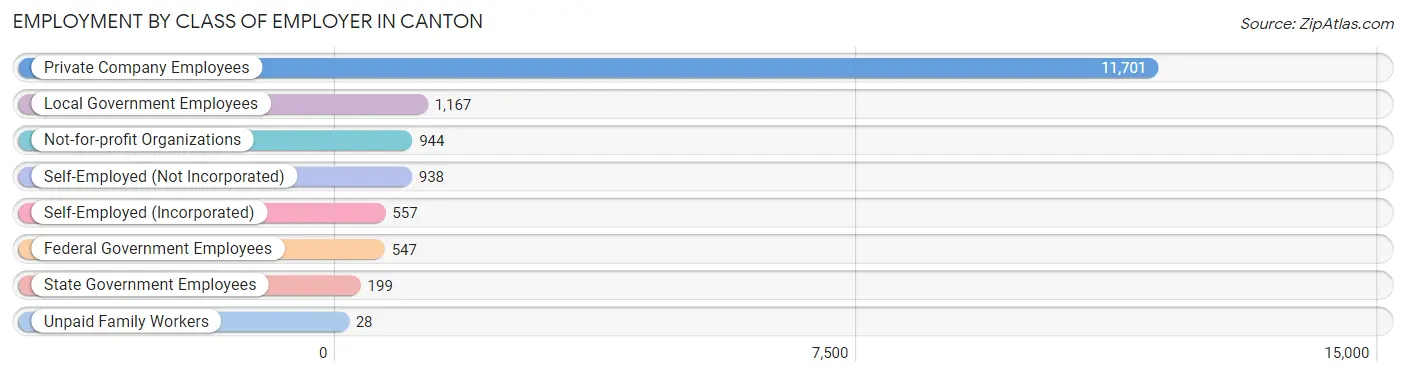
| Employer Class | # Employees | % Employees |
| Private Company Employees | 11,701 | 72.8% |
| Self-Employed (Incorporated) | 557 | 3.5% |
| Self-Employed (Not Incorporated) | 938 | 5.8% |
| Not-for-profit Organizations | 944 | 5.9% |
| Local Government Employees | 1,167 | 7.3% |
| State Government Employees | 199 | 1.2% |
| Federal Government Employees | 547 | 3.4% |
| Unpaid Family Workers | 28 | 0.2% |
| Total | 16,081 | 100.0% |
Employment Status by Age in Canton
According to the labor force statistics for Canton, out of the total population over 16 years of age (25,811), 69.3% or 17,887 individuals are in the labor force, with 7.0% or 1,252 of them unemployed. The age group with the highest labor force participation rate is 30 to 34 years, with 94.7% or 2,171 individuals in the labor force. Within the labor force, the 16 to 19 years age range has the highest percentage of unemployed individuals, with 25.1% or 196 of them being unemployed.
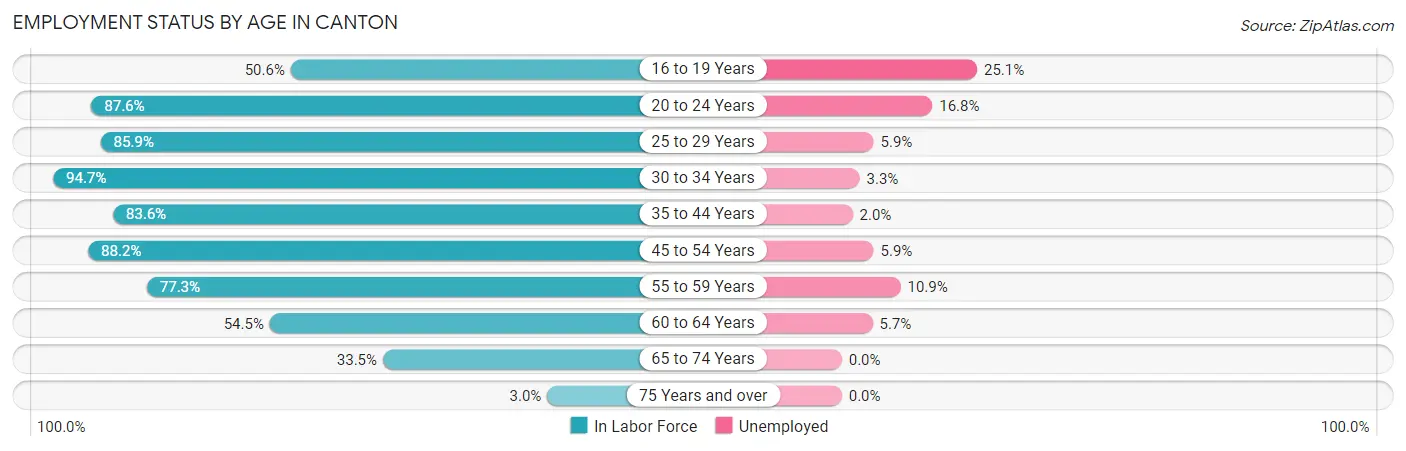
| Age Bracket | In Labor Force | Unemployed |
| 16 to 19 Years | 782 (50.6%) | 196 (25.1%) |
| 20 to 24 Years | 2,532 (87.6%) | 425 (16.8%) |
| 25 to 29 Years | 2,171 (85.9%) | 128 (5.9%) |
| 30 to 34 Years | 2,171 (94.7%) | 72 (3.3%) |
| 35 to 44 Years | 4,056 (83.6%) | 81 (2.0%) |
| 45 to 54 Years | 3,305 (88.2%) | 195 (5.9%) |
| 55 to 59 Years | 955 (77.3%) | 104 (10.9%) |
| 60 to 64 Years | 917 (54.5%) | 52 (5.7%) |
| 65 to 74 Years | 942 (33.5%) | 0 (0.0%) |
| 75 Years and over | 67 (3.0%) | 0 (0.0%) |
| Total | 17,887 (69.3%) | 1,252 (7.0%) |
Employment Status by Educational Attainment in Canton
According to labor force statistics for Canton, 83.1% of individuals (13,577) out of the total population between 25 and 64 years of age (16,338) are in the labor force, with 4.7% or 638 of them being unemployed. The group with the highest labor force participation rate are those with the educational attainment of bachelor's degree or higher, with 95.5% or 4,963 individuals in the labor force. Within the labor force, individuals with less than high school education have the highest percentage of unemployment, with 11.1% or 248 of them being unemployed.
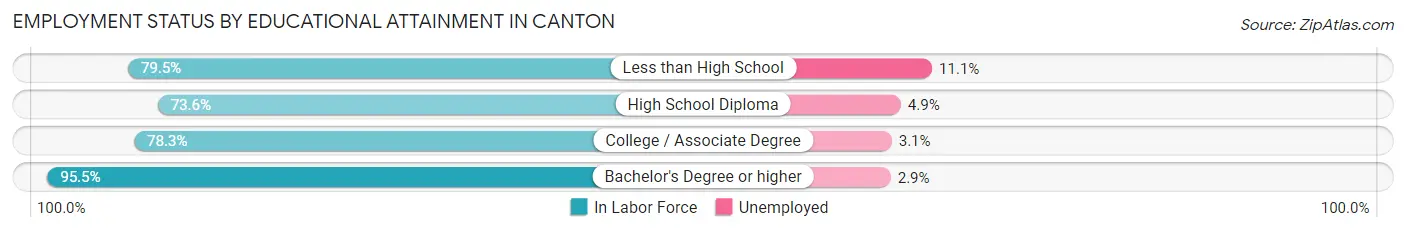
| Educational Attainment | In Labor Force | Unemployed |
| Less than High School | 2,233 (79.5%) | 312 (11.1%) |
| High School Diploma | 2,272 (73.6%) | 151 (4.9%) |
| College / Associate Degree | 4,107 (78.3%) | 163 (3.1%) |
| Bachelor's Degree or higher | 4,963 (95.5%) | 151 (2.9%) |
| Total | 13,577 (83.1%) | 768 (4.7%) |
Employment Occupations by Sex in Canton
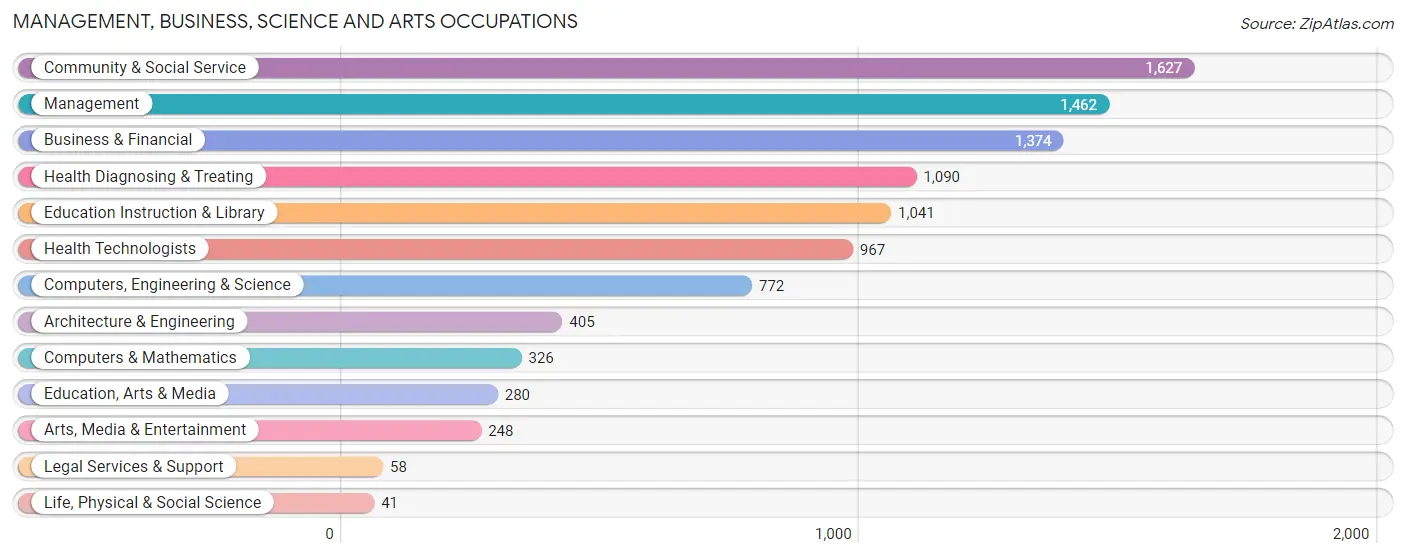
Management, Business, Science and Arts Occupations
The most common Management, Business, Science and Arts occupations in Canton are Community & Social Service (1,627 | 9.8%), Management (1,462 | 8.8%), Business & Financial (1,374 | 8.3%), Health Diagnosing & Treating (1,090 | 6.6%), and Education Instruction & Library (1,041 | 6.3%).
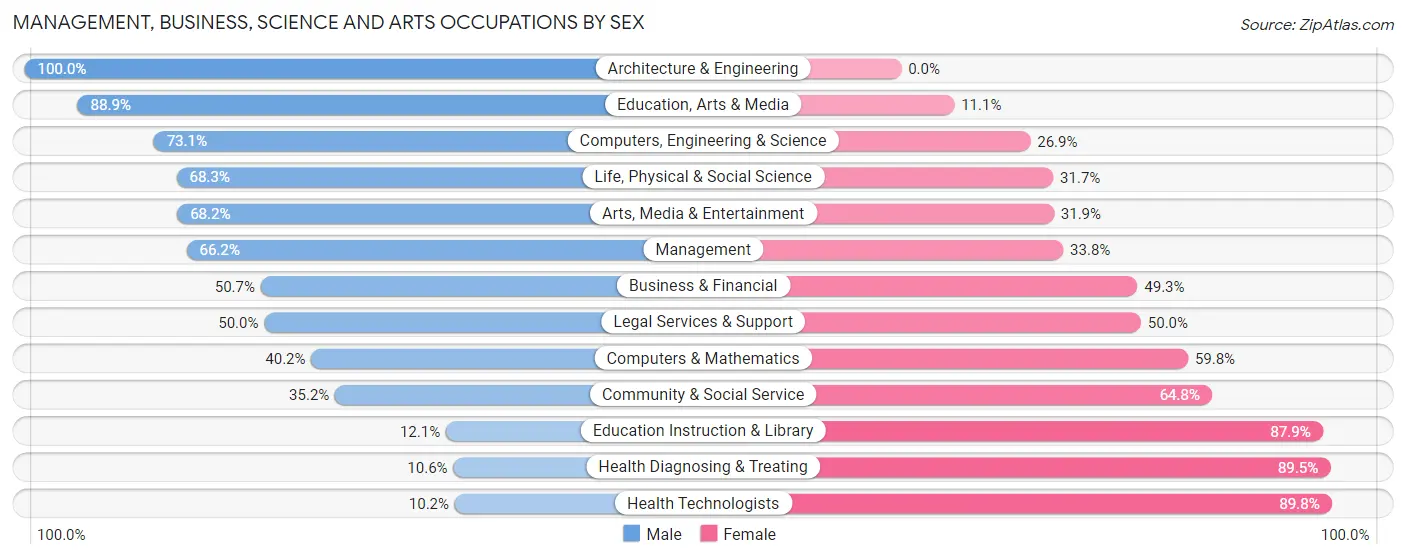
Management, Business, Science and Arts Occupations by Sex
Within the Management, Business, Science and Arts occupations in Canton, the most male-oriented occupations are Architecture & Engineering (100.0%), Education, Arts & Media (88.9%), and Computers, Engineering & Science (73.1%), while the most female-oriented occupations are Health Technologists (89.8%), Health Diagnosing & Treating (89.4%), and Education Instruction & Library (87.9%).
| Occupation | Male | Female |
| Management | 968 (66.2%) | 494 (33.8%) |
| Business & Financial | 697 (50.7%) | 677 (49.3%) |
| Computers, Engineering & Science | 564 (73.1%) | 208 (26.9%) |
| Computers & Mathematics | 131 (40.2%) | 195 (59.8%) |
| Architecture & Engineering | 405 (100.0%) | 0 (0.0%) |
| Life, Physical & Social Science | 28 (68.3%) | 13 (31.7%) |
| Community & Social Service | 573 (35.2%) | 1,054 (64.8%) |
| Education, Arts & Media | 249 (88.9%) | 31 (11.1%) |
| Legal Services & Support | 29 (50.0%) | 29 (50.0%) |
| Education Instruction & Library | 126 (12.1%) | 915 (87.9%) |
| Arts, Media & Entertainment | 169 (68.1%) | 79 (31.9%) |
| Health Diagnosing & Treating | 115 (10.5%) | 975 (89.4%) |
| Health Technologists | 99 (10.2%) | 868 (89.8%) |
| Total (Category) | 2,917 (46.1%) | 3,408 (53.9%) |
| Total (Overall) | 9,288 (55.8%) | 7,352 (44.2%) |
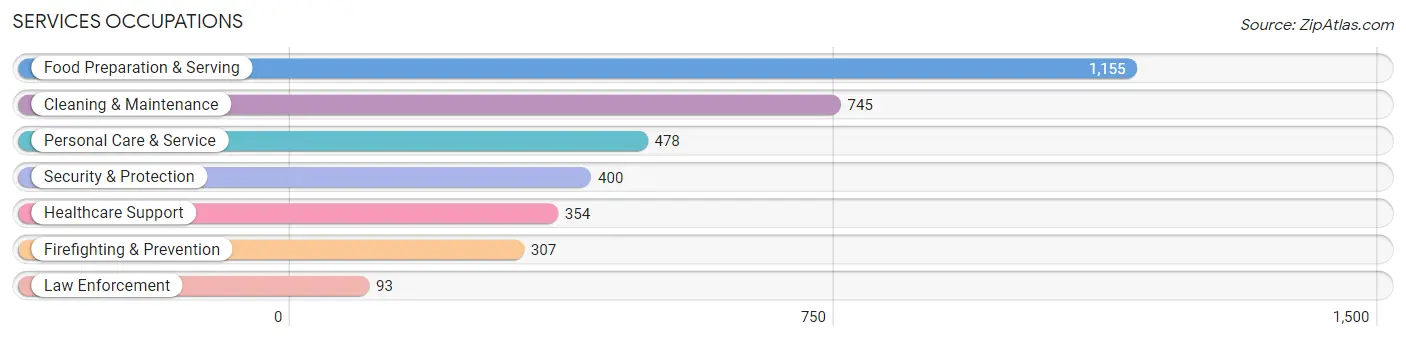
Services Occupations
The most common Services occupations in Canton are Food Preparation & Serving (1,155 | 6.9%), Cleaning & Maintenance (745 | 4.5%), Personal Care & Service (478 | 2.9%), Security & Protection (400 | 2.4%), and Healthcare Support (354 | 2.1%).
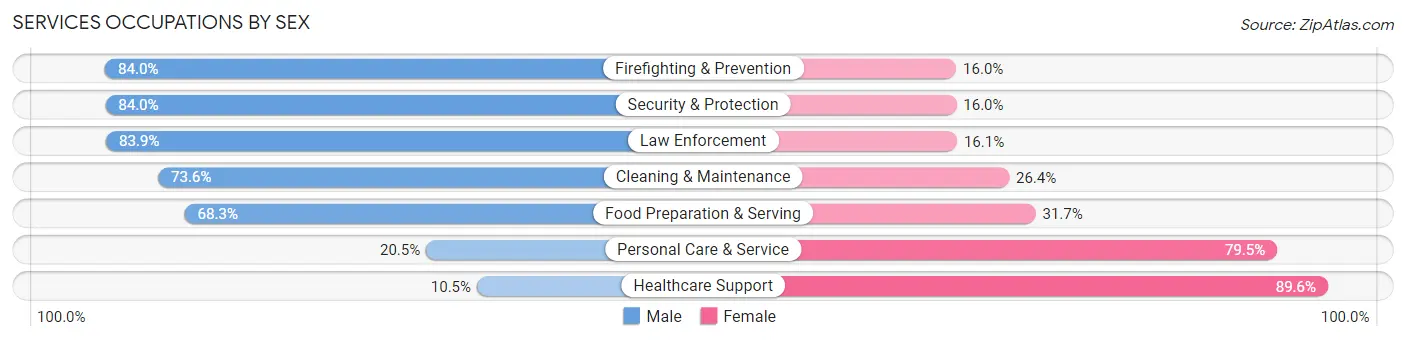
Services Occupations by Sex
Within the Services occupations in Canton, the most male-oriented occupations are Firefighting & Prevention (84.0%), Security & Protection (84.0%), and Law Enforcement (83.9%), while the most female-oriented occupations are Healthcare Support (89.5%), Personal Care & Service (79.5%), and Food Preparation & Serving (31.7%).
| Occupation | Male | Female |
| Healthcare Support | 37 (10.4%) | 317 (89.5%) |
| Security & Protection | 336 (84.0%) | 64 (16.0%) |
| Firefighting & Prevention | 258 (84.0%) | 49 (16.0%) |
| Law Enforcement | 78 (83.9%) | 15 (16.1%) |
| Food Preparation & Serving | 789 (68.3%) | 366 (31.7%) |
| Cleaning & Maintenance | 548 (73.6%) | 197 (26.4%) |
| Personal Care & Service | 98 (20.5%) | 380 (79.5%) |
| Total (Category) | 1,808 (57.7%) | 1,324 (42.3%) |
| Total (Overall) | 9,288 (55.8%) | 7,352 (44.2%) |
Sales and Office Occupations
The most common Sales and Office occupations in Canton are Sales & Related (1,948 | 11.7%), and Office & Administration (1,867 | 11.2%).
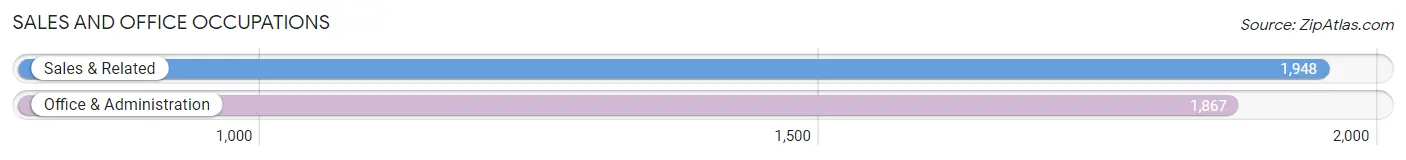
Sales and Office Occupations by Sex
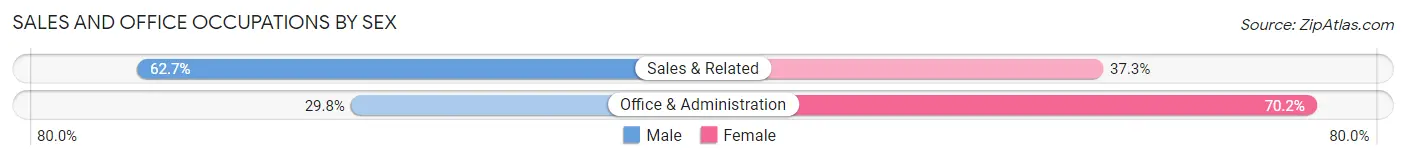
| Occupation | Male | Female |
| Sales & Related | 1,221 (62.7%) | 727 (37.3%) |
| Office & Administration | 557 (29.8%) | 1,310 (70.2%) |
| Total (Category) | 1,778 (46.6%) | 2,037 (53.4%) |
| Total (Overall) | 9,288 (55.8%) | 7,352 (44.2%) |
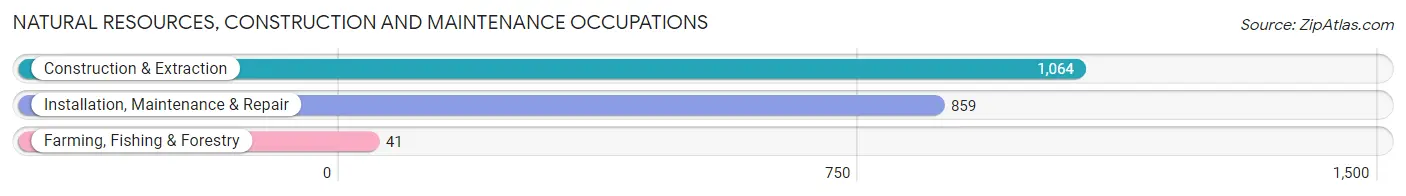
Natural Resources, Construction and Maintenance Occupations
The most common Natural Resources, Construction and Maintenance occupations in Canton are Construction & Extraction (1,064 | 6.4%), Installation, Maintenance & Repair (859 | 5.2%), and Farming, Fishing & Forestry (41 | 0.3%).
Natural Resources, Construction and Maintenance Occupations by Sex
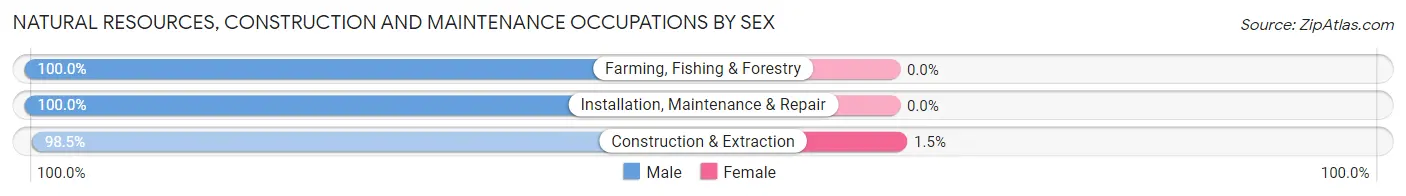
| Occupation | Male | Female |
| Farming, Fishing & Forestry | 41 (100.0%) | 0 (0.0%) |
| Construction & Extraction | 1,048 (98.5%) | 16 (1.5%) |
| Installation, Maintenance & Repair | 859 (100.0%) | 0 (0.0%) |
| Total (Category) | 1,948 (99.2%) | 16 (0.8%) |
| Total (Overall) | 9,288 (55.8%) | 7,352 (44.2%) |
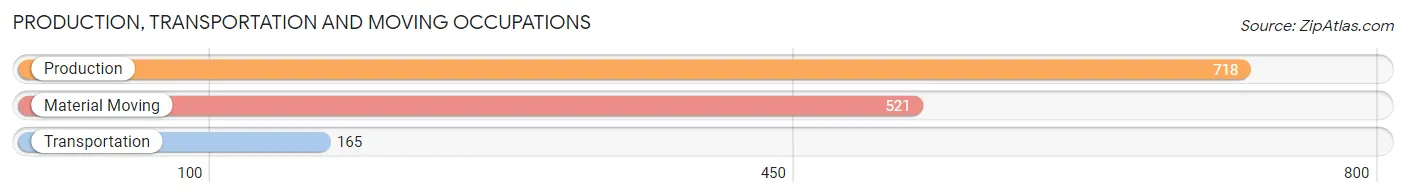
Production, Transportation and Moving Occupations
The most common Production, Transportation and Moving occupations in Canton are Production (718 | 4.3%), Material Moving (521 | 3.1%), and Transportation (165 | 1.0%).
Production, Transportation and Moving Occupations by Sex
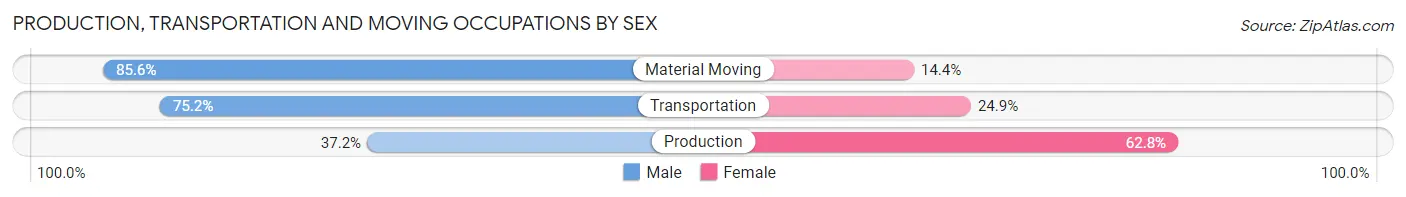
| Occupation | Male | Female |
| Production | 267 (37.2%) | 451 (62.8%) |
| Transportation | 124 (75.1%) | 41 (24.8%) |
| Material Moving | 446 (85.6%) | 75 (14.4%) |
| Total (Category) | 837 (59.6%) | 567 (40.4%) |
| Total (Overall) | 9,288 (55.8%) | 7,352 (44.2%) |
Employment Industries by Sex in Canton
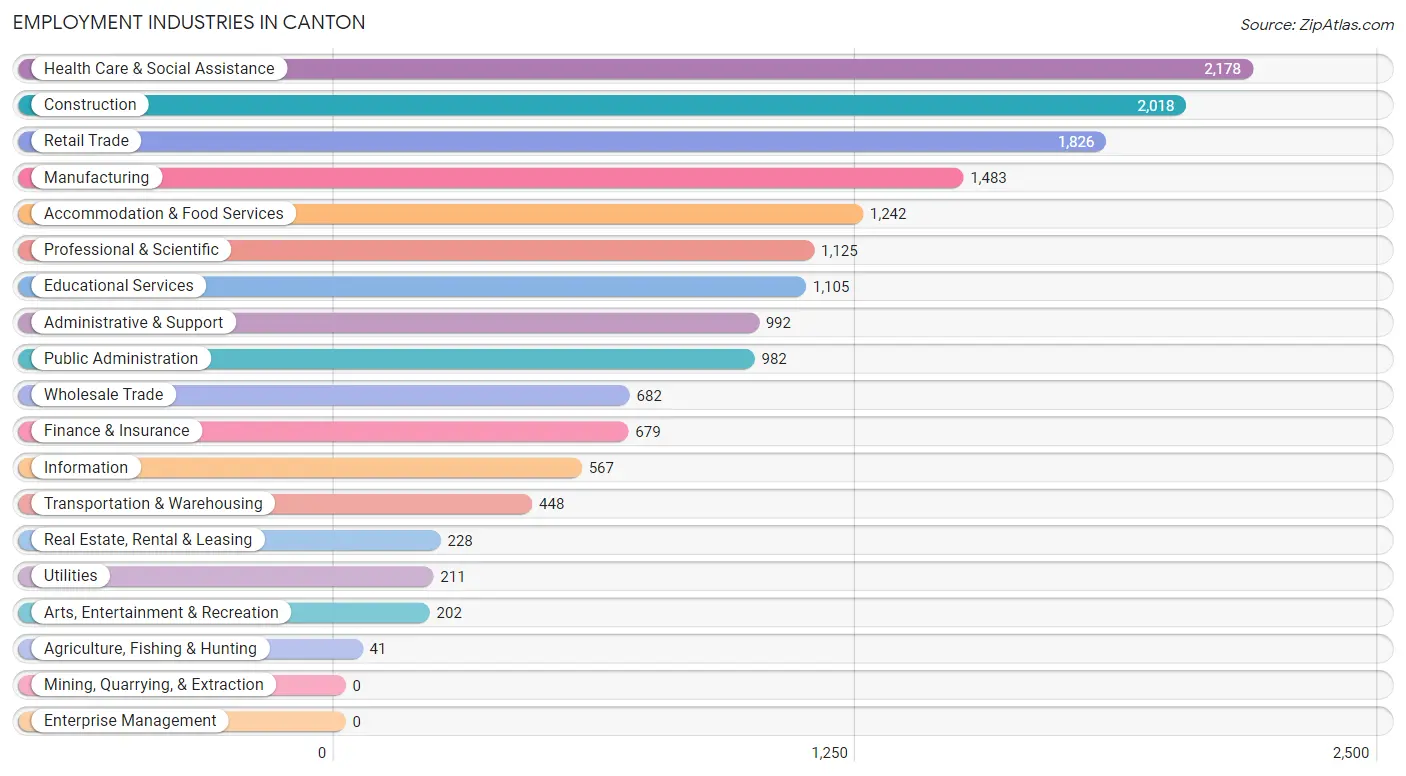
Employment Industries in Canton
The major employment industries in Canton include Health Care & Social Assistance (2,178 | 13.1%), Construction (2,018 | 12.1%), Retail Trade (1,826 | 11.0%), Manufacturing (1,483 | 8.9%), and Accommodation & Food Services (1,242 | 7.5%).
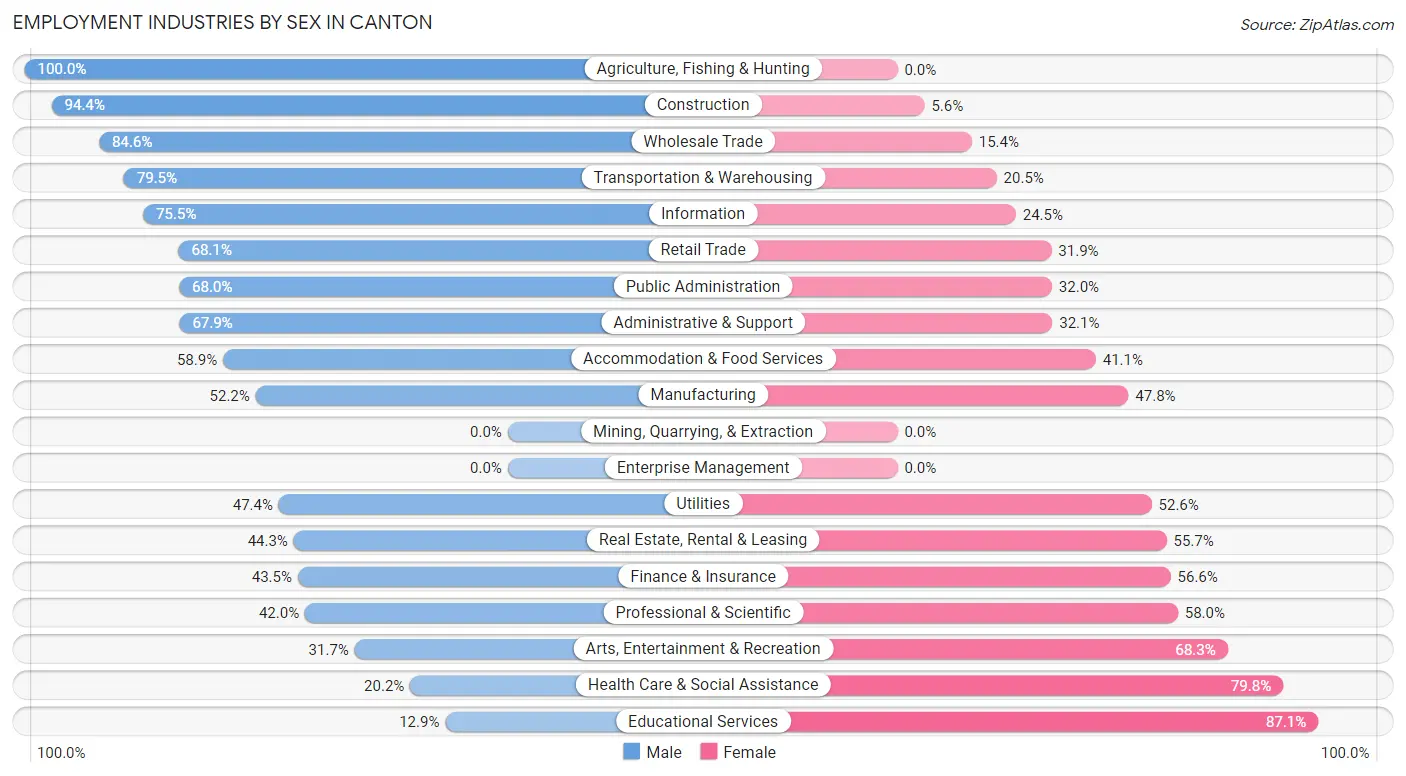
Employment Industries by Sex in Canton
The Canton industries that see more men than women are Agriculture, Fishing & Hunting (100.0%), Construction (94.4%), and Wholesale Trade (84.6%), whereas the industries that tend to have a higher number of women are Educational Services (87.1%), Health Care & Social Assistance (79.8%), and Arts, Entertainment & Recreation (68.3%).
| Industry | Male | Female |
| Agriculture, Fishing & Hunting | 41 (100.0%) | 0 (0.0%) |
| Mining, Quarrying, & Extraction | 0 (0.0%) | 0 (0.0%) |
| Construction | 1,905 (94.4%) | 113 (5.6%) |
| Manufacturing | 774 (52.2%) | 709 (47.8%) |
| Wholesale Trade | 577 (84.6%) | 105 (15.4%) |
| Retail Trade | 1,244 (68.1%) | 582 (31.9%) |
| Transportation & Warehousing | 356 (79.5%) | 92 (20.5%) |
| Utilities | 100 (47.4%) | 111 (52.6%) |
| Information | 428 (75.5%) | 139 (24.5%) |
| Finance & Insurance | 295 (43.4%) | 384 (56.6%) |
| Real Estate, Rental & Leasing | 101 (44.3%) | 127 (55.7%) |
| Professional & Scientific | 472 (42.0%) | 653 (58.0%) |
| Enterprise Management | 0 (0.0%) | 0 (0.0%) |
| Administrative & Support | 674 (67.9%) | 318 (32.1%) |
| Educational Services | 143 (12.9%) | 962 (87.1%) |
| Health Care & Social Assistance | 440 (20.2%) | 1,738 (79.8%) |
| Arts, Entertainment & Recreation | 64 (31.7%) | 138 (68.3%) |
| Accommodation & Food Services | 732 (58.9%) | 510 (41.1%) |
| Public Administration | 668 (68.0%) | 314 (32.0%) |
| Total | 9,288 (55.8%) | 7,352 (44.2%) |
Education in Canton
School Enrollment in Canton
The most common levels of schooling among the 8,235 students in Canton are middle school (2,488 | 30.2%), high school (1,649 | 20.0%), and elementary school (1,537 | 18.7%).
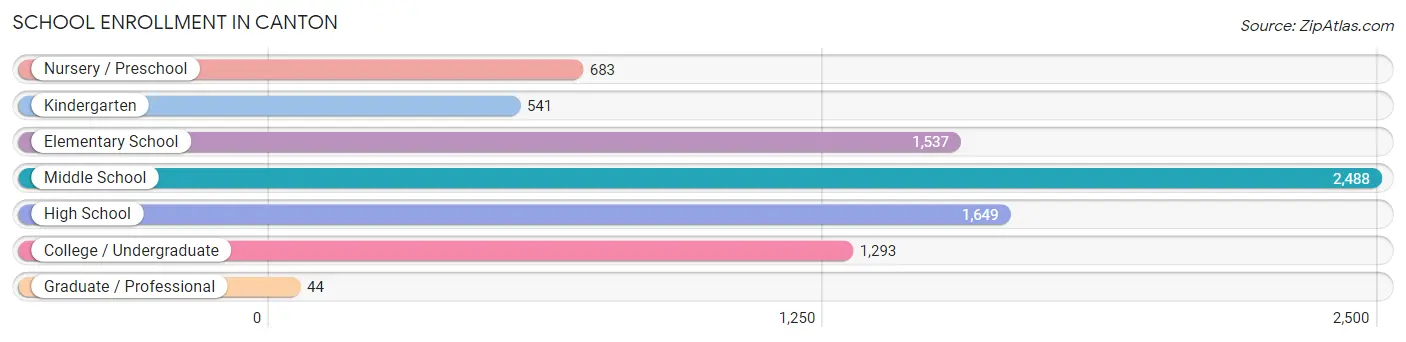
| School Level | # Students | % Students |
| Nursery / Preschool | 683 | 8.3% |
| Kindergarten | 541 | 6.6% |
| Elementary School | 1,537 | 18.7% |
| Middle School | 2,488 | 30.2% |
| High School | 1,649 | 20.0% |
| College / Undergraduate | 1,293 | 15.7% |
| Graduate / Professional | 44 | 0.5% |
| Total | 8,235 | 100.0% |
School Enrollment by Age by Funding Source in Canton
Out of a total of 8,235 students who are enrolled in schools in Canton, 1,425 (17.3%) attend a private institution, while the remaining 6,810 (82.7%) are enrolled in public schools. The age group of 35 years and over has the highest likelihood of being enrolled in private schools, with 176 (90.7% in the age bracket) enrolled. Conversely, the age group of 20 to 24 year olds has the lowest likelihood of being enrolled in a private school, with 574 (99.0% in the age bracket) attending a public institution.
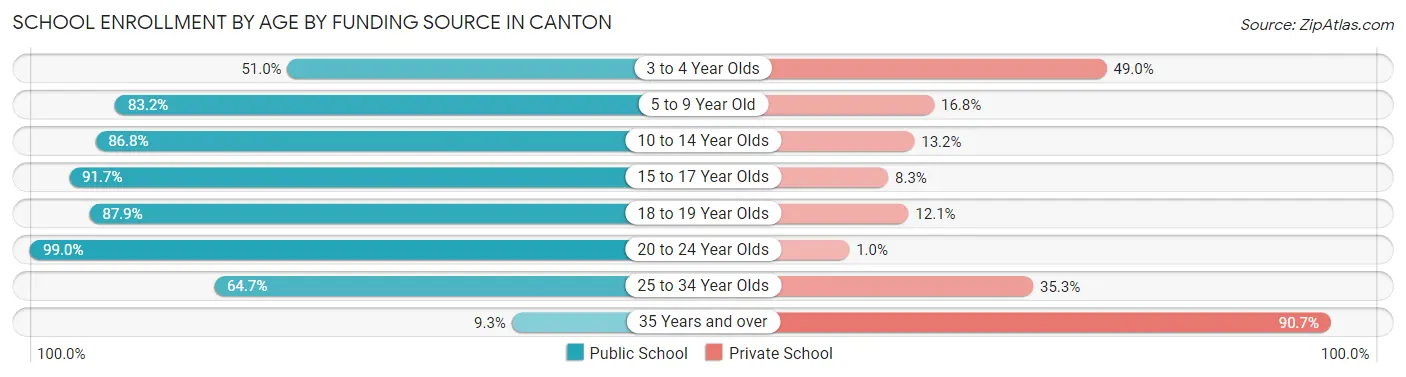
| Age Bracket | Public School | Private School |
| 3 to 4 Year Olds | 220 (51.0%) | 211 (49.0%) |
| 5 to 9 Year Old | 1,878 (83.2%) | 380 (16.8%) |
| 10 to 14 Year Olds | 2,409 (86.8%) | 365 (13.2%) |
| 15 to 17 Year Olds | 1,197 (91.7%) | 108 (8.3%) |
| 18 to 19 Year Olds | 248 (87.9%) | 34 (12.1%) |
| 20 to 24 Year Olds | 574 (99.0%) | 6 (1.0%) |
| 25 to 34 Year Olds | 266 (64.7%) | 145 (35.3%) |
| 35 Years and over | 18 (9.3%) | 176 (90.7%) |
| Total | 6,810 (82.7%) | 1,425 (17.3%) |
Educational Attainment by Field of Study in Canton
Business (1,416 | 19.4%), science & technology (1,223 | 16.7%), education (1,031 | 14.1%), arts & humanities (728 | 10.0%), and engineering (625 | 8.5%) are the most common fields of study among 7,319 individuals in Canton who have obtained a bachelor's degree or higher.
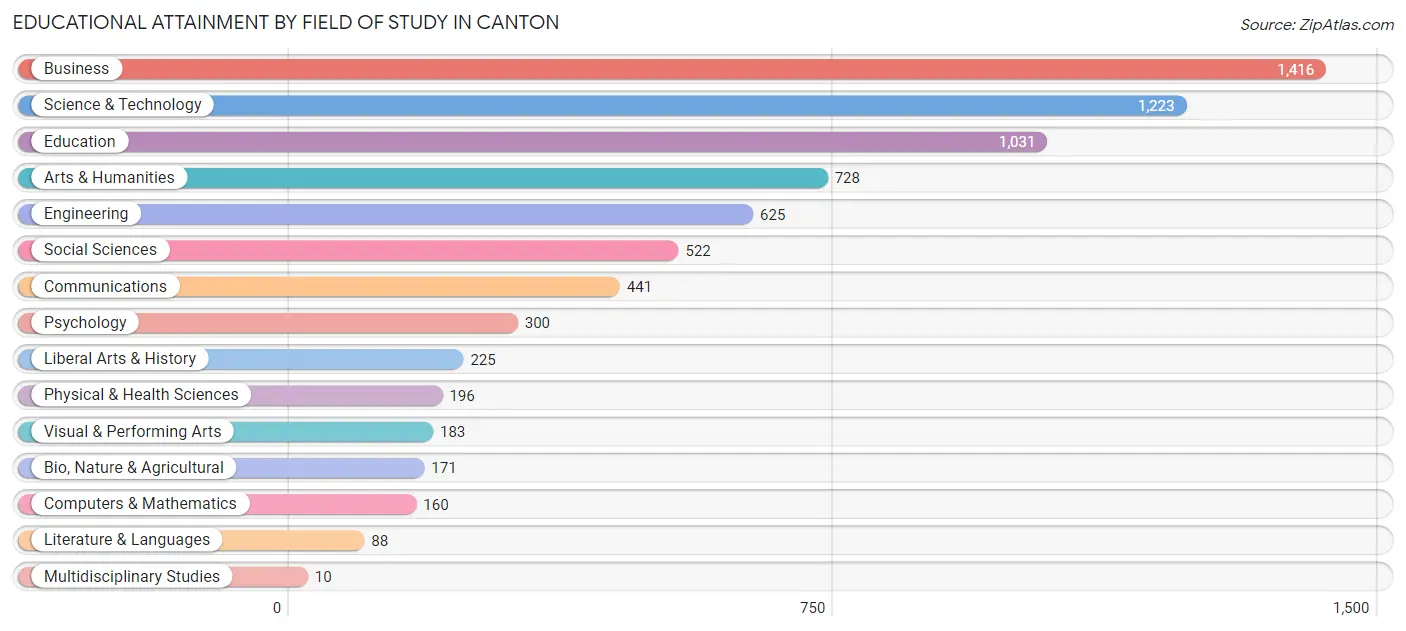
| Field of Study | # Graduates | % Graduates |
| Computers & Mathematics | 160 | 2.2% |
| Bio, Nature & Agricultural | 171 | 2.3% |
| Physical & Health Sciences | 196 | 2.7% |
| Psychology | 300 | 4.1% |
| Social Sciences | 522 | 7.1% |
| Engineering | 625 | 8.5% |
| Multidisciplinary Studies | 10 | 0.1% |
| Science & Technology | 1,223 | 16.7% |
| Business | 1,416 | 19.4% |
| Education | 1,031 | 14.1% |
| Literature & Languages | 88 | 1.2% |
| Liberal Arts & History | 225 | 3.1% |
| Visual & Performing Arts | 183 | 2.5% |
| Communications | 441 | 6.0% |
| Arts & Humanities | 728 | 10.0% |
| Total | 7,319 | 100.0% |
Transportation & Commute in Canton
Vehicle Availability by Sex in Canton
The most prevalent vehicle ownership categories in Canton are males with 2 vehicles (3,847, accounting for 42.0%) and females with 2 vehicles (3,024, making up 55.5%).
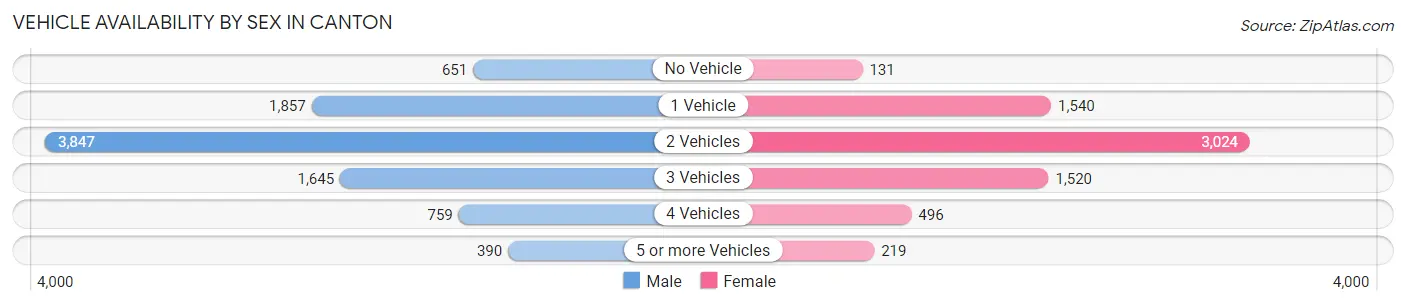
| Vehicles Available | Male | Female |
| No Vehicle | 651 (7.1%) | 131 (1.9%) |
| 1 Vehicle | 1,857 (20.3%) | 1,540 (22.2%) |
| 2 Vehicles | 3,847 (42.0%) | 3,024 (43.6%) |
| 3 Vehicles | 1,645 (18.0%) | 1,520 (21.9%) |
| 4 Vehicles | 759 (8.3%) | 496 (7.2%) |
| 5 or more Vehicles | 390 (4.3%) | 219 (3.2%) |
| Total | 9,149 (100.0%) | 6,930 (100.0%) |
Commute Time in Canton
The most frequently occuring commute durations in Canton are 15 to 19 minutes (2,437 commuters, 18.0%), 10 to 14 minutes (1,957 commuters, 14.5%), and 45 to 59 minutes (1,767 commuters, 13.1%).
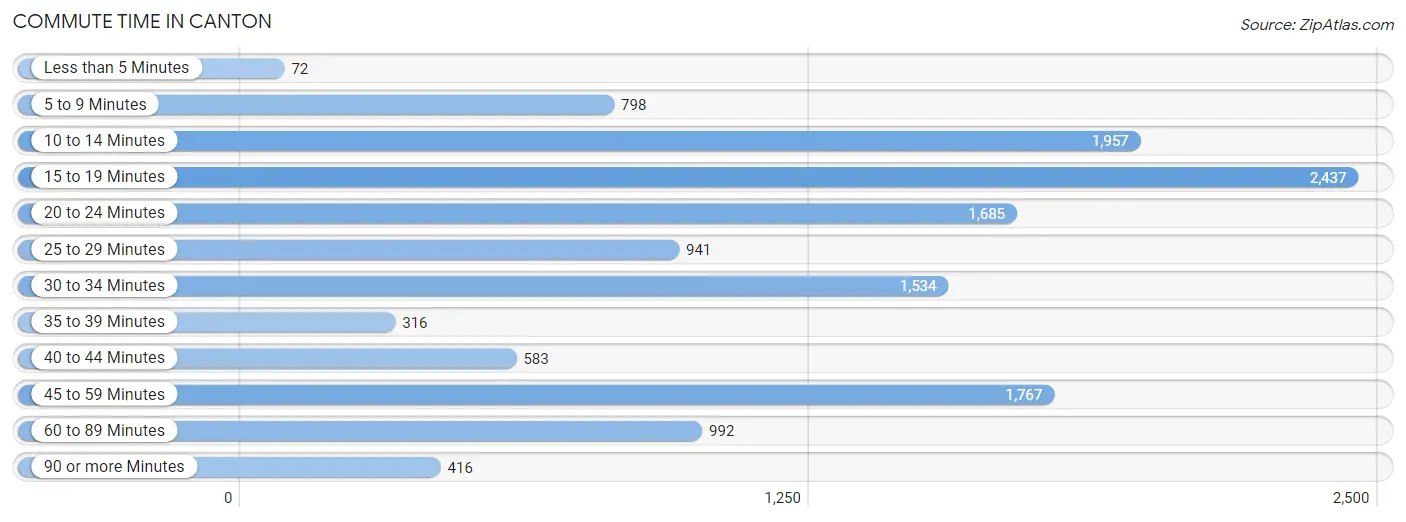
| Commute Time | # Commuters | % Commuters |
| Less than 5 Minutes | 72 | 0.5% |
| 5 to 9 Minutes | 798 | 5.9% |
| 10 to 14 Minutes | 1,957 | 14.5% |
| 15 to 19 Minutes | 2,437 | 18.0% |
| 20 to 24 Minutes | 1,685 | 12.5% |
| 25 to 29 Minutes | 941 | 7.0% |
| 30 to 34 Minutes | 1,534 | 11.4% |
| 35 to 39 Minutes | 316 | 2.3% |
| 40 to 44 Minutes | 583 | 4.3% |
| 45 to 59 Minutes | 1,767 | 13.1% |
| 60 to 89 Minutes | 992 | 7.3% |
| 90 or more Minutes | 416 | 3.1% |
Commute Time by Sex in Canton
The most common commute times in Canton are 15 to 19 minutes (1,679 commuters, 21.1%) for males and 20 to 24 minutes (986 commuters, 17.7%) for females.
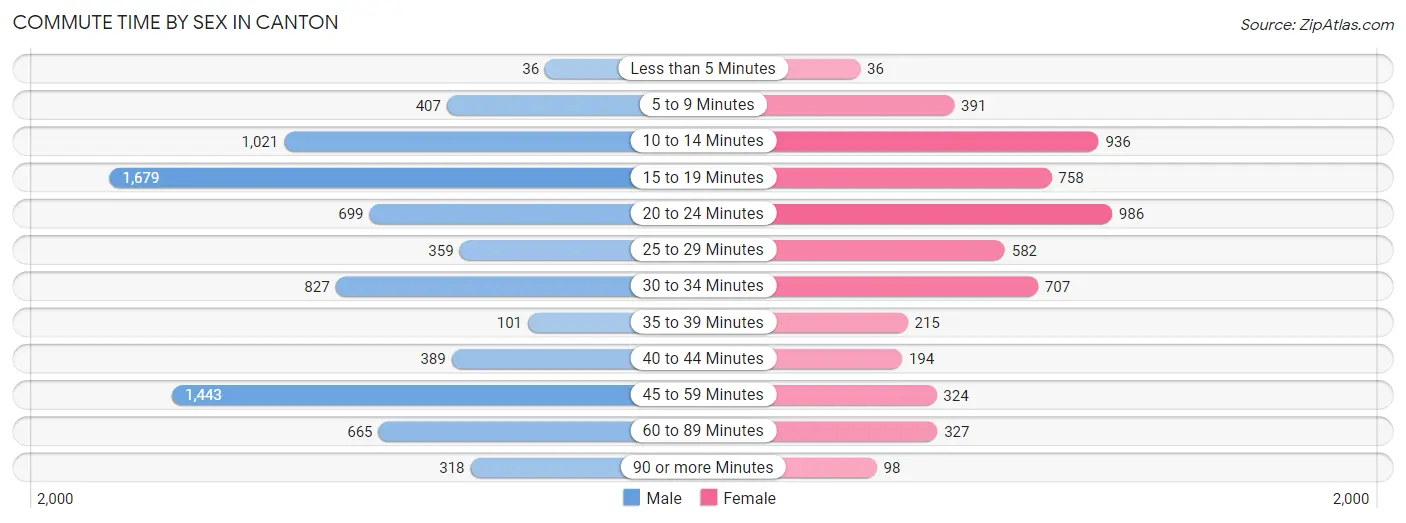
| Commute Time | Male | Female |
| Less than 5 Minutes | 36 (0.4%) | 36 (0.6%) |
| 5 to 9 Minutes | 407 (5.1%) | 391 (7.0%) |
| 10 to 14 Minutes | 1,021 (12.9%) | 936 (16.9%) |
| 15 to 19 Minutes | 1,679 (21.1%) | 758 (13.7%) |
| 20 to 24 Minutes | 699 (8.8%) | 986 (17.7%) |
| 25 to 29 Minutes | 359 (4.5%) | 582 (10.5%) |
| 30 to 34 Minutes | 827 (10.4%) | 707 (12.7%) |
| 35 to 39 Minutes | 101 (1.3%) | 215 (3.9%) |
| 40 to 44 Minutes | 389 (4.9%) | 194 (3.5%) |
| 45 to 59 Minutes | 1,443 (18.2%) | 324 (5.8%) |
| 60 to 89 Minutes | 665 (8.4%) | 327 (5.9%) |
| 90 or more Minutes | 318 (4.0%) | 98 (1.8%) |
Time of Departure to Work by Sex in Canton
The most frequent times of departure to work in Canton are 7:00 AM to 7:29 AM (1,691, 21.3%) for males and 8:00 AM to 8:29 AM (903, 16.3%) for females.
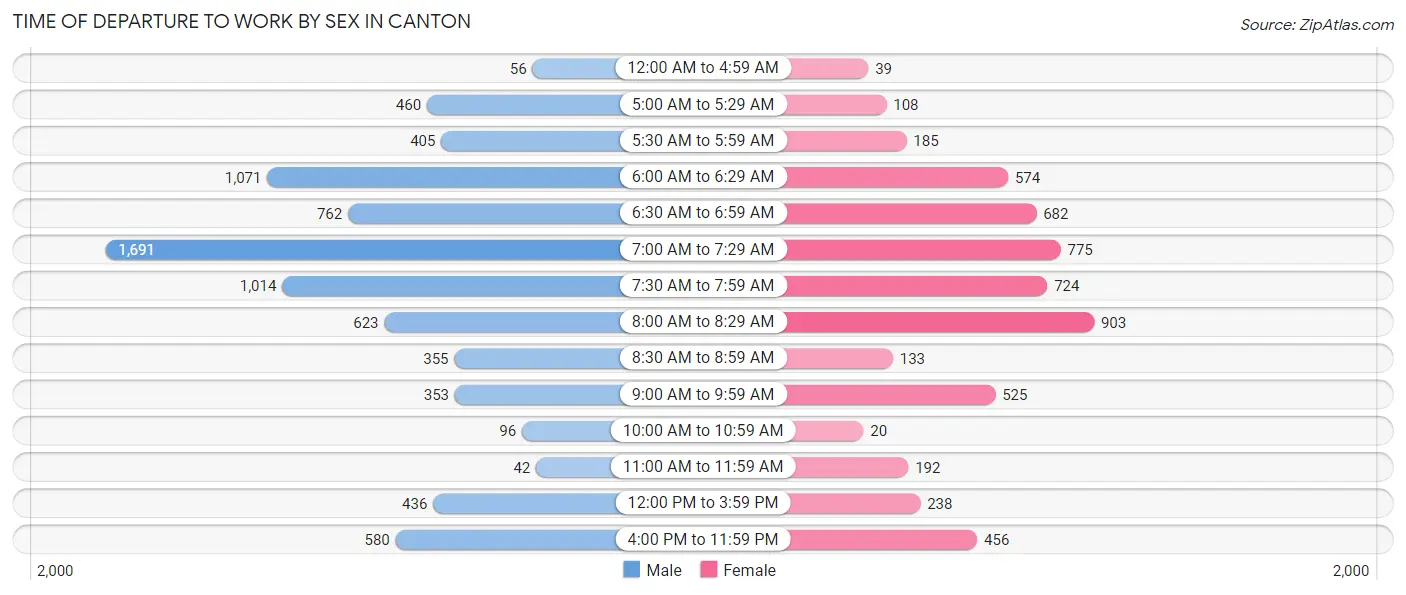
| Time of Departure | Male | Female |
| 12:00 AM to 4:59 AM | 56 (0.7%) | 39 (0.7%) |
| 5:00 AM to 5:29 AM | 460 (5.8%) | 108 (1.9%) |
| 5:30 AM to 5:59 AM | 405 (5.1%) | 185 (3.3%) |
| 6:00 AM to 6:29 AM | 1,071 (13.5%) | 574 (10.3%) |
| 6:30 AM to 6:59 AM | 762 (9.6%) | 682 (12.3%) |
| 7:00 AM to 7:29 AM | 1,691 (21.3%) | 775 (14.0%) |
| 7:30 AM to 7:59 AM | 1,014 (12.8%) | 724 (13.0%) |
| 8:00 AM to 8:29 AM | 623 (7.8%) | 903 (16.3%) |
| 8:30 AM to 8:59 AM | 355 (4.5%) | 133 (2.4%) |
| 9:00 AM to 9:59 AM | 353 (4.4%) | 525 (9.5%) |
| 10:00 AM to 10:59 AM | 96 (1.2%) | 20 (0.4%) |
| 11:00 AM to 11:59 AM | 42 (0.5%) | 192 (3.5%) |
| 12:00 PM to 3:59 PM | 436 (5.5%) | 238 (4.3%) |
| 4:00 PM to 11:59 PM | 580 (7.3%) | 456 (8.2%) |
| Total | 7,944 (100.0%) | 5,554 (100.0%) |
Housing Occupancy in Canton
Occupancy by Ownership in Canton
Of the total 12,268 dwellings in Canton, owner-occupied units account for 6,853 (55.9%), while renter-occupied units make up 5,415 (44.1%).
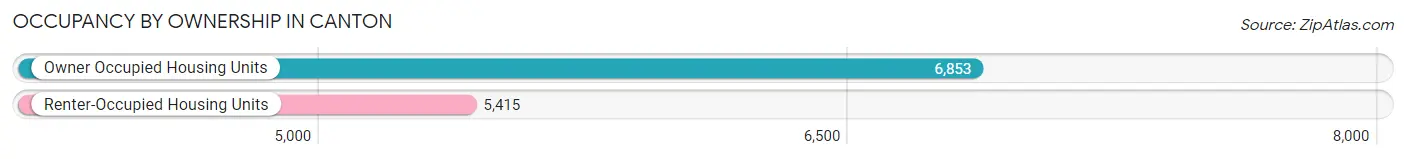
| Occupancy | # Housing Units | % Housing Units |
| Owner Occupied Housing Units | 6,853 | 55.9% |
| Renter-Occupied Housing Units | 5,415 | 44.1% |
| Total Occupied Housing Units | 12,268 | 100.0% |
Occupancy by Household Size in Canton
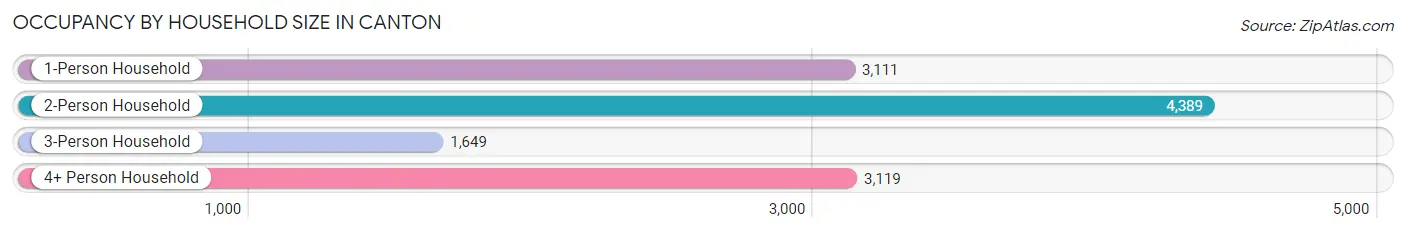
| Household Size | # Housing Units | % Housing Units |
| 1-Person Household | 3,111 | 25.4% |
| 2-Person Household | 4,389 | 35.8% |
| 3-Person Household | 1,649 | 13.4% |
| 4+ Person Household | 3,119 | 25.4% |
| Total Housing Units | 12,268 | 100.0% |
Occupancy by Ownership by Household Size in Canton
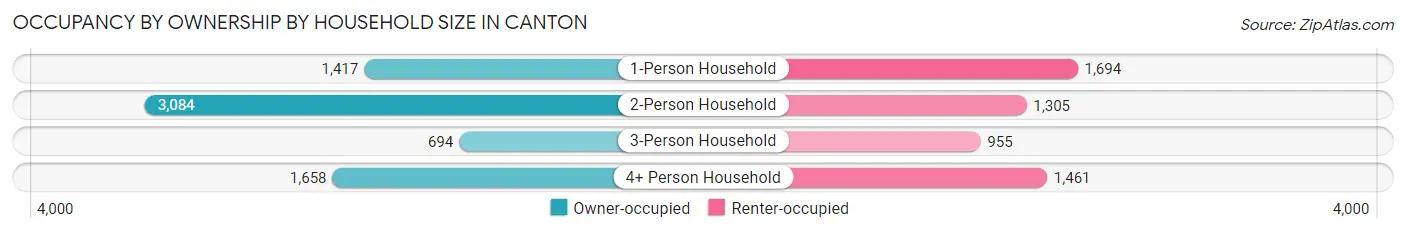
| Household Size | Owner-occupied | Renter-occupied |
| 1-Person Household | 1,417 (45.6%) | 1,694 (54.4%) |
| 2-Person Household | 3,084 (70.3%) | 1,305 (29.7%) |
| 3-Person Household | 694 (42.1%) | 955 (57.9%) |
| 4+ Person Household | 1,658 (53.2%) | 1,461 (46.8%) |
| Total Housing Units | 6,853 (55.9%) | 5,415 (44.1%) |
Occupancy by Educational Attainment in Canton
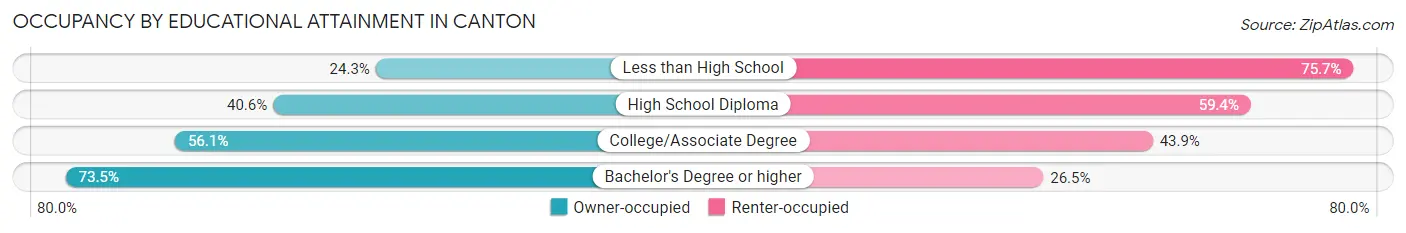
| Household Size | Owner-occupied | Renter-occupied |
| Less than High School | 341 (24.3%) | 1,061 (75.7%) |
| High School Diploma | 1,012 (40.6%) | 1,481 (59.4%) |
| College/Associate Degree | 2,113 (56.1%) | 1,651 (43.9%) |
| Bachelor's Degree or higher | 3,387 (73.5%) | 1,222 (26.5%) |
Occupancy by Age of Householder in Canton
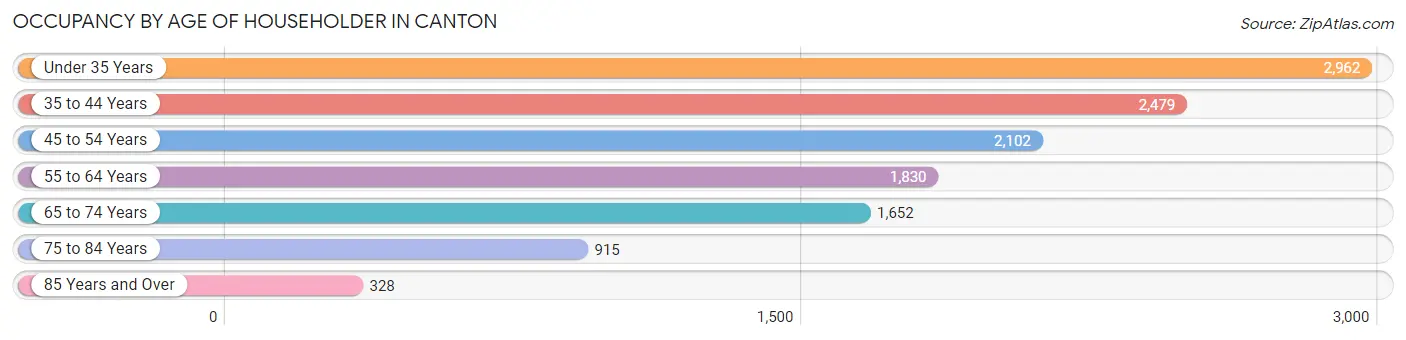
| Age Bracket | # Households | % Households |
| Under 35 Years | 2,962 | 24.1% |
| 35 to 44 Years | 2,479 | 20.2% |
| 45 to 54 Years | 2,102 | 17.1% |
| 55 to 64 Years | 1,830 | 14.9% |
| 65 to 74 Years | 1,652 | 13.5% |
| 75 to 84 Years | 915 | 7.5% |
| 85 Years and Over | 328 | 2.7% |
| Total | 12,268 | 100.0% |
Housing Finances in Canton
Median Income by Occupancy in Canton
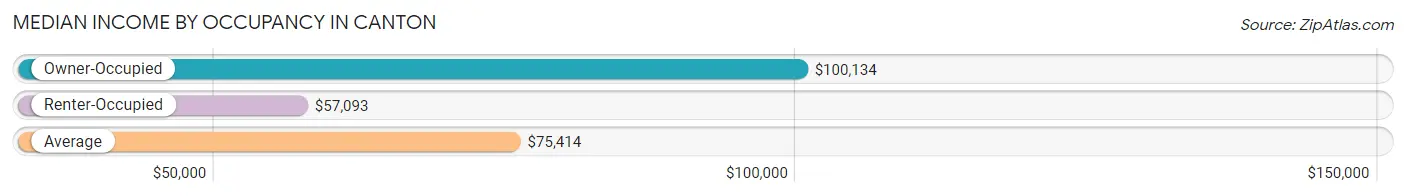
| Occupancy Type | # Households | Median Income |
| Owner-Occupied | 6,853 (55.9%) | $100,134 |
| Renter-Occupied | 5,415 (44.1%) | $57,093 |
| Average | 12,268 (100.0%) | $75,414 |
Occupancy by Householder Income Bracket in Canton
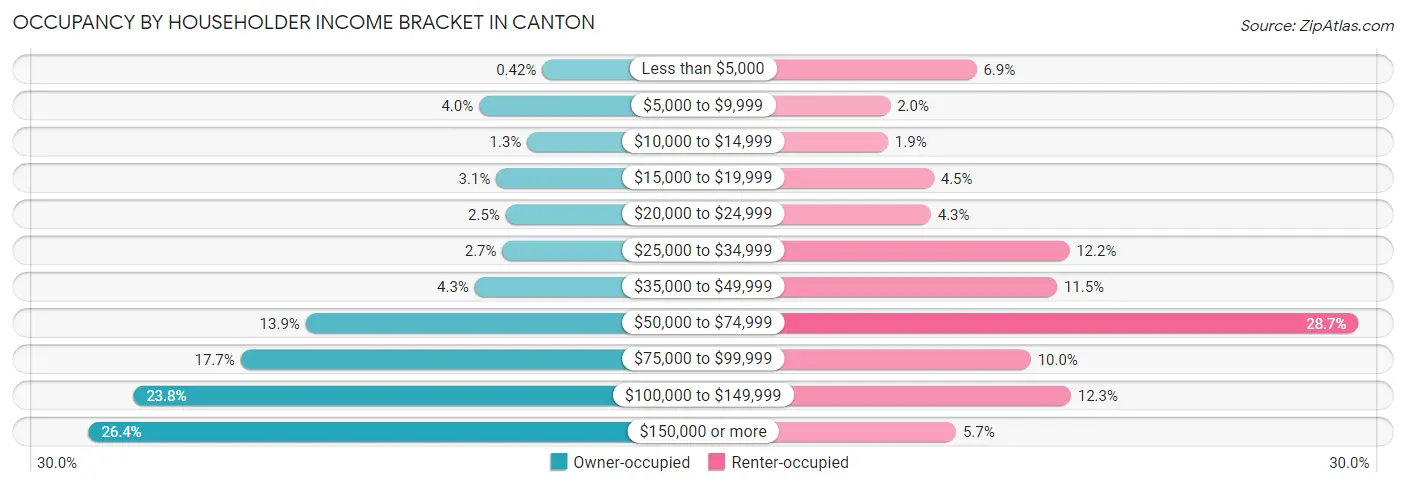
| Income Bracket | Owner-occupied | Renter-occupied |
| Less than $5,000 | 29 (0.4%) | 374 (6.9%) |
| $5,000 to $9,999 | 276 (4.0%) | 107 (2.0%) |
| $10,000 to $14,999 | 88 (1.3%) | 100 (1.8%) |
| $15,000 to $19,999 | 209 (3.0%) | 242 (4.5%) |
| $20,000 to $24,999 | 172 (2.5%) | 233 (4.3%) |
| $25,000 to $34,999 | 185 (2.7%) | 661 (12.2%) |
| $35,000 to $49,999 | 293 (4.3%) | 623 (11.5%) |
| $50,000 to $74,999 | 955 (13.9%) | 1,556 (28.7%) |
| $75,000 to $99,999 | 1,210 (17.7%) | 542 (10.0%) |
| $100,000 to $149,999 | 1,630 (23.8%) | 666 (12.3%) |
| $150,000 or more | 1,806 (26.4%) | 311 (5.7%) |
| Total | 6,853 (100.0%) | 5,415 (100.0%) |
Monthly Housing Cost Tiers in Canton
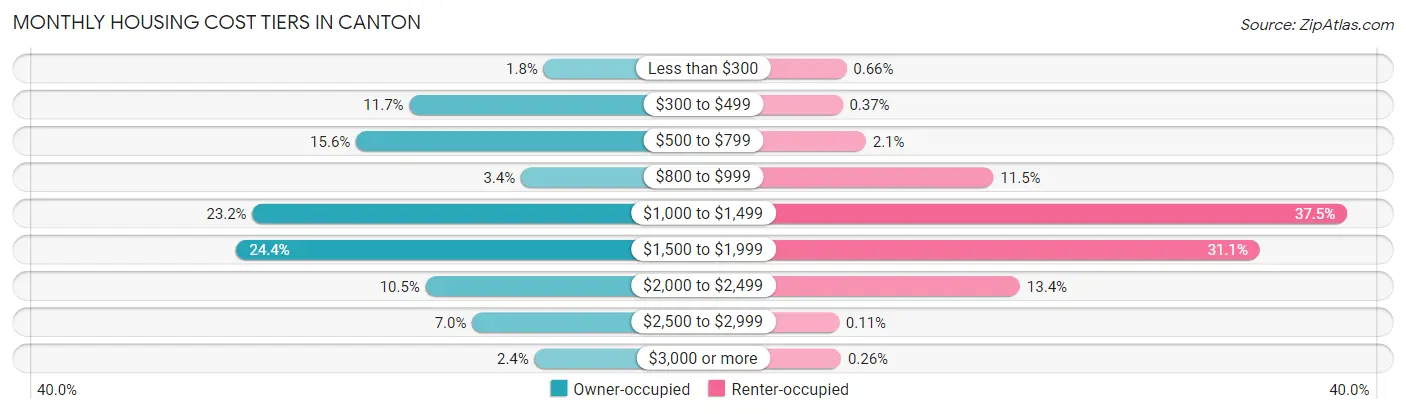
| Monthly Cost | Owner-occupied | Renter-occupied |
| Less than $300 | 121 (1.8%) | 36 (0.7%) |
| $300 to $499 | 799 (11.7%) | 20 (0.4%) |
| $500 to $799 | 1,068 (15.6%) | 113 (2.1%) |
| $800 to $999 | 236 (3.4%) | 622 (11.5%) |
| $1,000 to $1,499 | 1,591 (23.2%) | 2,032 (37.5%) |
| $1,500 to $1,999 | 1,672 (24.4%) | 1,684 (31.1%) |
| $2,000 to $2,499 | 717 (10.5%) | 728 (13.4%) |
| $2,500 to $2,999 | 482 (7.0%) | 6 (0.1%) |
| $3,000 or more | 167 (2.4%) | 14 (0.3%) |
| Total | 6,853 (100.0%) | 5,415 (100.0%) |
Physical Housing Characteristics in Canton
Housing Structures in Canton
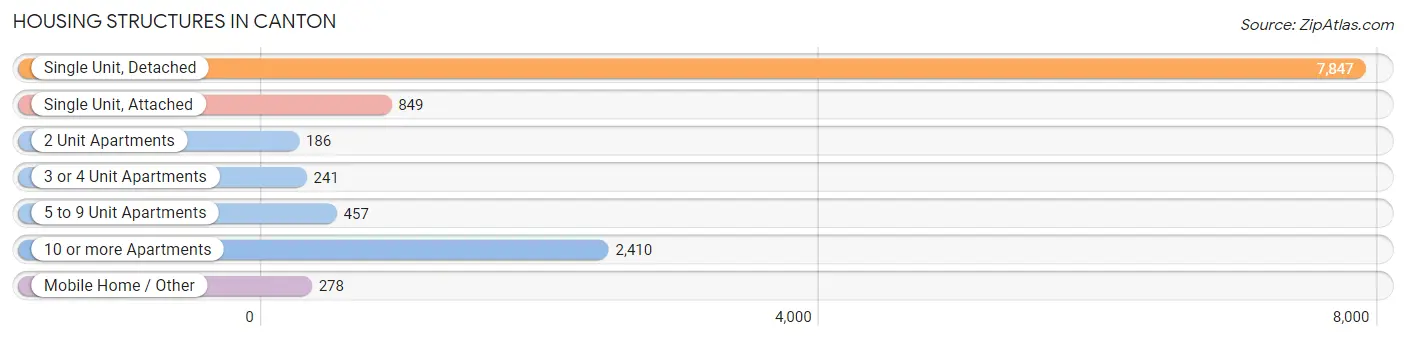
| Structure Type | # Housing Units | % Housing Units |
| Single Unit, Detached | 7,847 | 64.0% |
| Single Unit, Attached | 849 | 6.9% |
| 2 Unit Apartments | 186 | 1.5% |
| 3 or 4 Unit Apartments | 241 | 2.0% |
| 5 to 9 Unit Apartments | 457 | 3.7% |
| 10 or more Apartments | 2,410 | 19.6% |
| Mobile Home / Other | 278 | 2.3% |
| Total | 12,268 | 100.0% |
Housing Structures by Occupancy in Canton
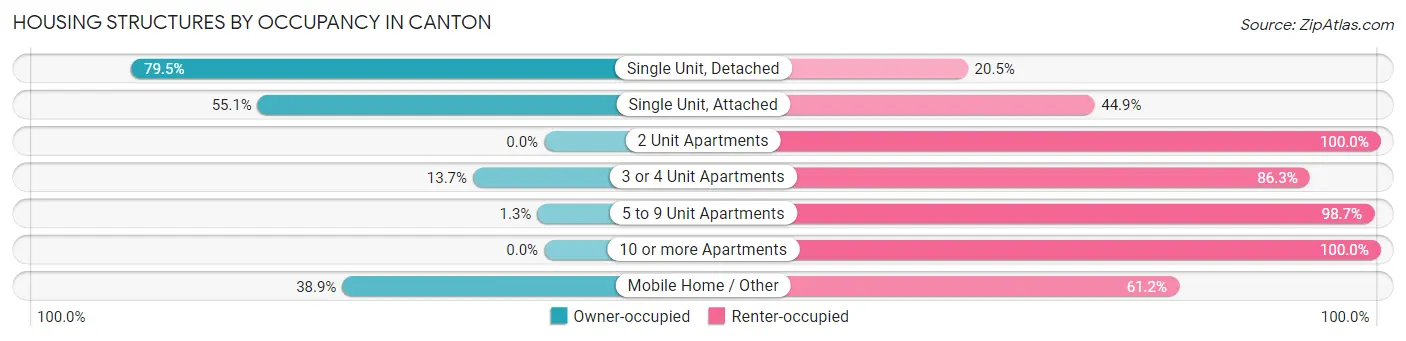
| Structure Type | Owner-occupied | Renter-occupied |
| Single Unit, Detached | 6,238 (79.5%) | 1,609 (20.5%) |
| Single Unit, Attached | 468 (55.1%) | 381 (44.9%) |
| 2 Unit Apartments | 0 (0.0%) | 186 (100.0%) |
| 3 or 4 Unit Apartments | 33 (13.7%) | 208 (86.3%) |
| 5 to 9 Unit Apartments | 6 (1.3%) | 451 (98.7%) |
| 10 or more Apartments | 0 (0.0%) | 2,410 (100.0%) |
| Mobile Home / Other | 108 (38.9%) | 170 (61.2%) |
| Total | 6,853 (55.9%) | 5,415 (44.1%) |
Housing Structures by Number of Rooms in Canton
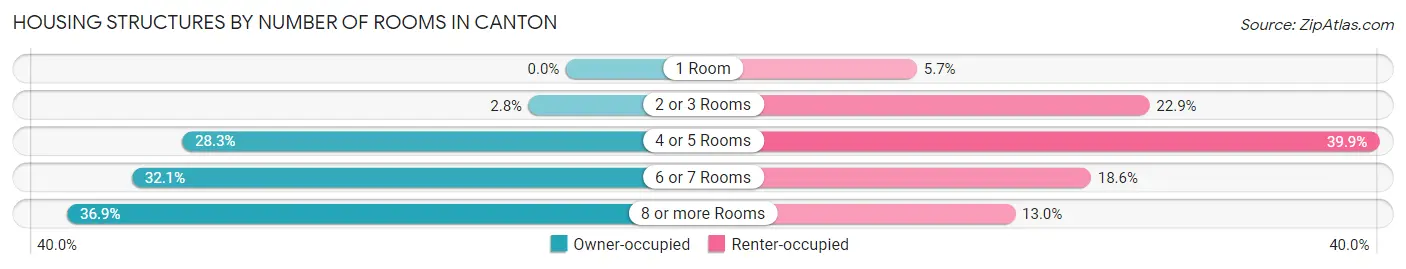
| Number of Rooms | Owner-occupied | Renter-occupied |
| 1 Room | 0 (0.0%) | 308 (5.7%) |
| 2 or 3 Rooms | 189 (2.8%) | 1,240 (22.9%) |
| 4 or 5 Rooms | 1,942 (28.3%) | 2,160 (39.9%) |
| 6 or 7 Rooms | 2,197 (32.1%) | 1,005 (18.6%) |
| 8 or more Rooms | 2,525 (36.8%) | 702 (13.0%) |
| Total | 6,853 (100.0%) | 5,415 (100.0%) |
Housing Structure by Heating Type in Canton
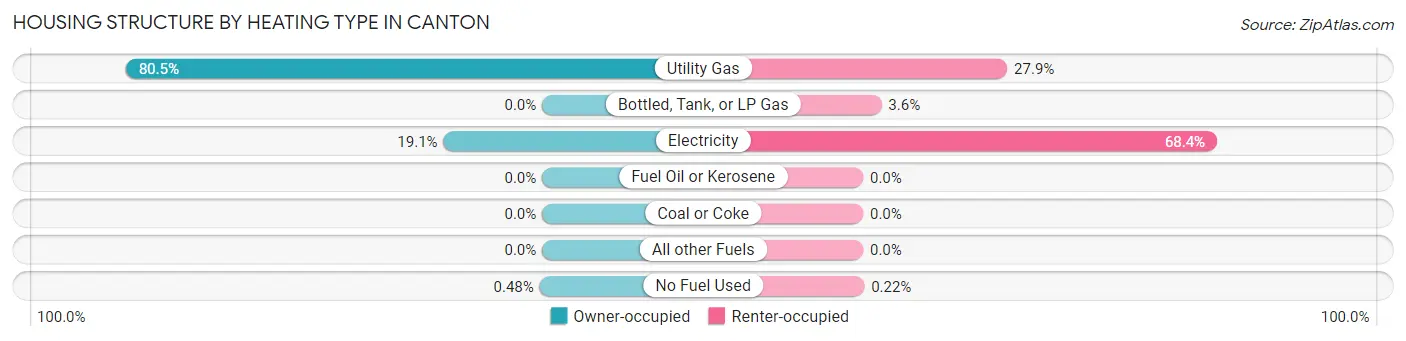
| Heating Type | Owner-occupied | Renter-occupied |
| Utility Gas | 5,513 (80.4%) | 1,508 (27.9%) |
| Bottled, Tank, or LP Gas | 0 (0.0%) | 192 (3.5%) |
| Electricity | 1,307 (19.1%) | 3,703 (68.4%) |
| Fuel Oil or Kerosene | 0 (0.0%) | 0 (0.0%) |
| Coal or Coke | 0 (0.0%) | 0 (0.0%) |
| All other Fuels | 0 (0.0%) | 0 (0.0%) |
| No Fuel Used | 33 (0.5%) | 12 (0.2%) |
| Total | 6,853 (100.0%) | 5,415 (100.0%) |
Household Vehicle Usage in Canton
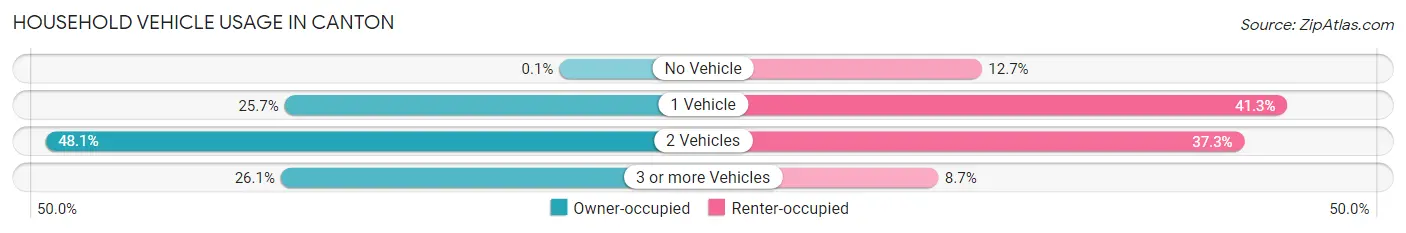
| Vehicles per Household | Owner-occupied | Renter-occupied |
| No Vehicle | 7 (0.1%) | 690 (12.7%) |
| 1 Vehicle | 1,764 (25.7%) | 2,236 (41.3%) |
| 2 Vehicles | 3,294 (48.1%) | 2,019 (37.3%) |
| 3 or more Vehicles | 1,788 (26.1%) | 470 (8.7%) |
| Total | 6,853 (100.0%) | 5,415 (100.0%) |
Real Estate & Mortgages in Canton
Real Estate and Mortgage Overview in Canton
| Characteristic | Without Mortgage | With Mortgage |
| Housing Units | 2,120 | 4,733 |
| Median Property Value | $338,300 | $319,300 |
| Median Household Income | $78,558 | $1,454 |
| Monthly Housing Costs | $524 | $167 |
| Real Estate Taxes | $1,389 | $39 |
Property Value by Mortgage Status in Canton
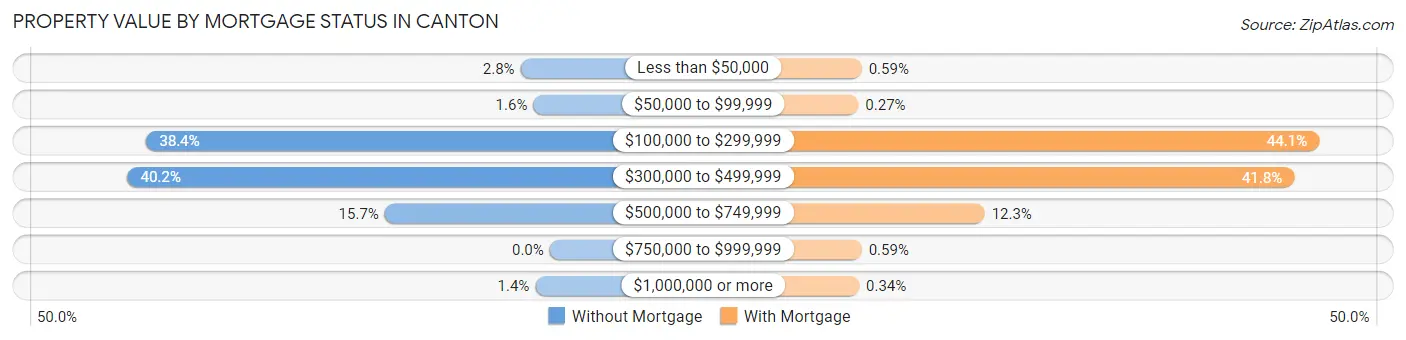
| Property Value | Without Mortgage | With Mortgage |
| Less than $50,000 | 59 (2.8%) | 28 (0.6%) |
| $50,000 to $99,999 | 33 (1.6%) | 13 (0.3%) |
| $100,000 to $299,999 | 814 (38.4%) | 2,089 (44.1%) |
| $300,000 to $499,999 | 852 (40.2%) | 1,977 (41.8%) |
| $500,000 to $749,999 | 333 (15.7%) | 582 (12.3%) |
| $750,000 to $999,999 | 0 (0.0%) | 28 (0.6%) |
| $1,000,000 or more | 29 (1.4%) | 16 (0.3%) |
| Total | 2,120 (100.0%) | 4,733 (100.0%) |
Household Income by Mortgage Status in Canton
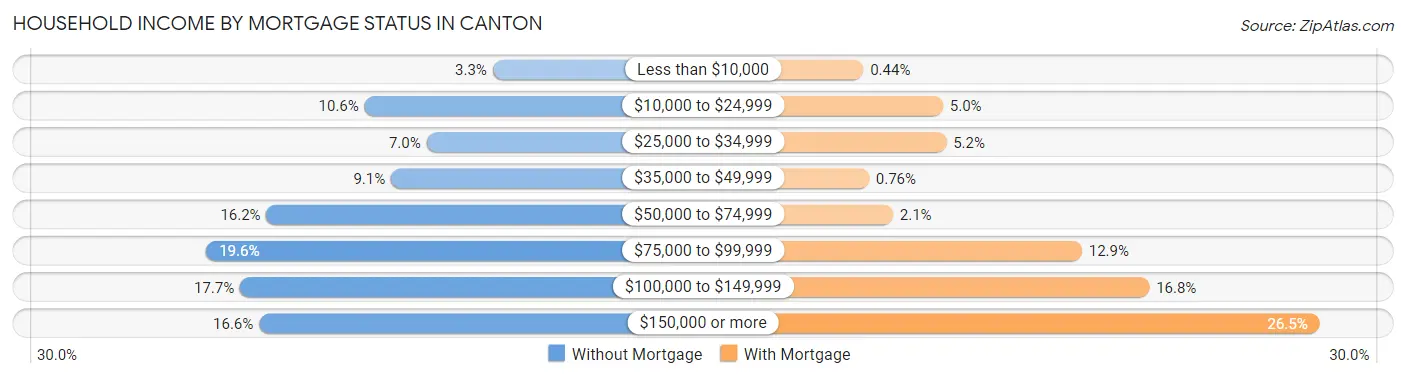
| Household Income | Without Mortgage | With Mortgage |
| Less than $10,000 | 69 (3.3%) | 21 (0.4%) |
| $10,000 to $24,999 | 224 (10.6%) | 236 (5.0%) |
| $25,000 to $34,999 | 149 (7.0%) | 245 (5.2%) |
| $35,000 to $49,999 | 192 (9.1%) | 36 (0.8%) |
| $50,000 to $74,999 | 343 (16.2%) | 101 (2.1%) |
| $75,000 to $99,999 | 416 (19.6%) | 612 (12.9%) |
| $100,000 to $149,999 | 375 (17.7%) | 794 (16.8%) |
| $150,000 or more | 352 (16.6%) | 1,255 (26.5%) |
| Total | 2,120 (100.0%) | 4,733 (100.0%) |
Property Value to Household Income Ratio in Canton
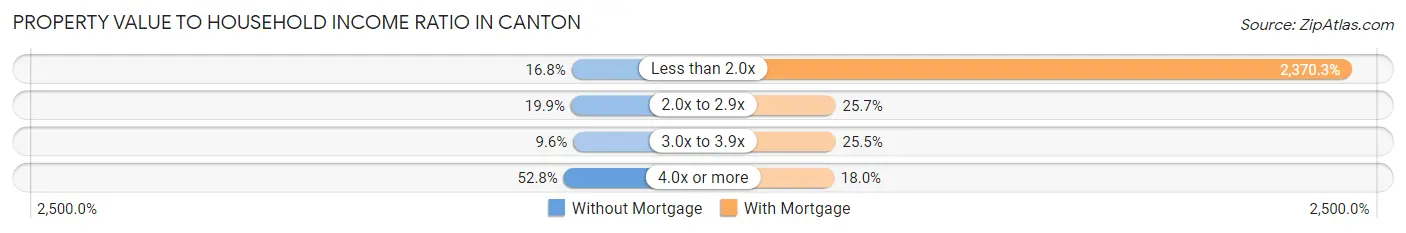
| Value-to-Income Ratio | Without Mortgage | With Mortgage |
| Less than 2.0x | 357 (16.8%) | 112,188 (2,370.3%) |
| 2.0x to 2.9x | 421 (19.9%) | 1,214 (25.7%) |
| 3.0x to 3.9x | 204 (9.6%) | 1,205 (25.5%) |
| 4.0x or more | 1,119 (52.8%) | 854 (18.0%) |
| Total | 2,120 (100.0%) | 4,733 (100.0%) |
Real Estate Taxes by Mortgage Status in Canton
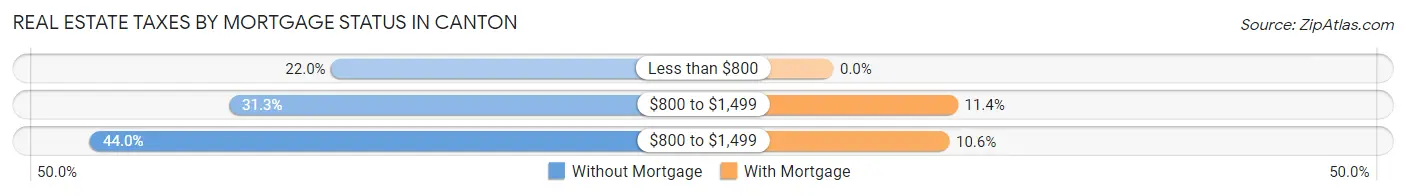
| Property Taxes | Without Mortgage | With Mortgage |
| Less than $800 | 466 (22.0%) | 0 (0.0%) |
| $800 to $1,499 | 664 (31.3%) | 538 (11.4%) |
| $800 to $1,499 | 933 (44.0%) | 501 (10.6%) |
| Total | 2,120 (100.0%) | 4,733 (100.0%) |
Health & Disability in Canton
Health Insurance Coverage by Age in Canton
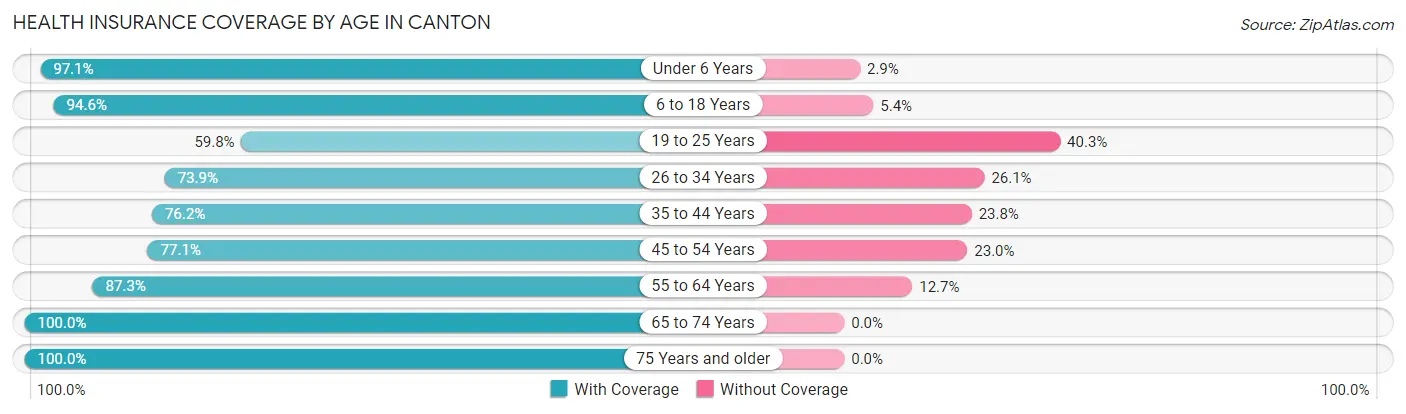
| Age Bracket | With Coverage | Without Coverage |
| Under 6 Years | 2,714 (97.1%) | 82 (2.9%) |
| 6 to 18 Years | 5,746 (94.6%) | 329 (5.4%) |
| 19 to 25 Years | 2,414 (59.8%) | 1,626 (40.3%) |
| 26 to 34 Years | 2,978 (73.9%) | 1,054 (26.1%) |
| 35 to 44 Years | 3,696 (76.2%) | 1,152 (23.8%) |
| 45 to 54 Years | 2,874 (77.0%) | 856 (23.0%) |
| 55 to 64 Years | 2,520 (87.3%) | 366 (12.7%) |
| 65 to 74 Years | 2,766 (100.0%) | 0 (0.0%) |
| 75 Years and older | 2,047 (100.0%) | 0 (0.0%) |
| Total | 27,755 (83.6%) | 5,465 (16.5%) |
Health Insurance Coverage by Citizenship Status in Canton
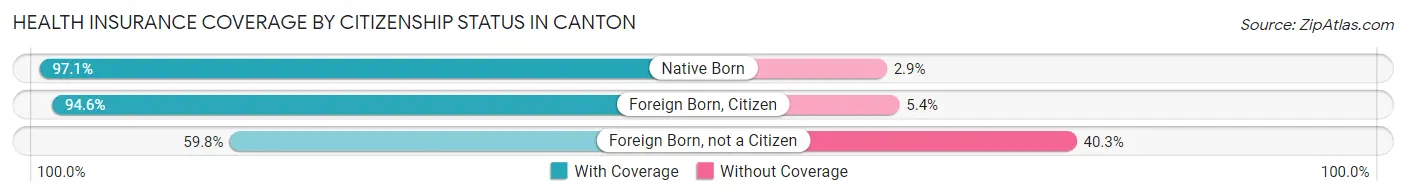
| Citizenship Status | With Coverage | Without Coverage |
| Native Born | 2,714 (97.1%) | 82 (2.9%) |
| Foreign Born, Citizen | 5,746 (94.6%) | 329 (5.4%) |
| Foreign Born, not a Citizen | 2,414 (59.8%) | 1,626 (40.3%) |
Health Insurance Coverage by Household Income in Canton
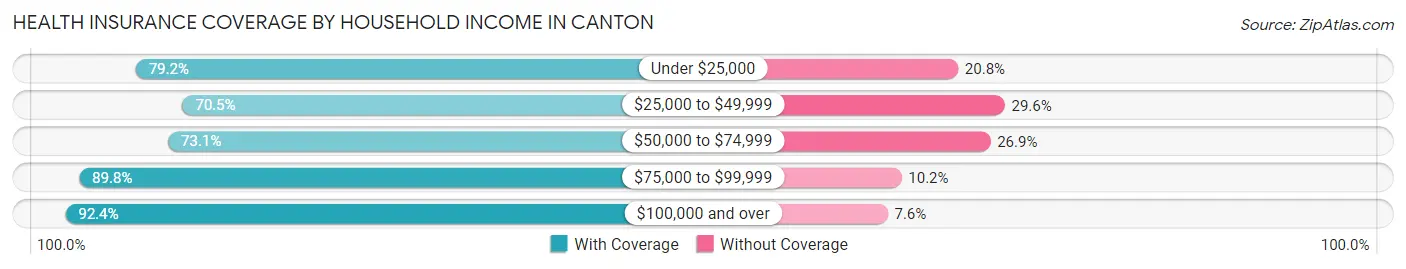
| Household Income | With Coverage | Without Coverage |
| Under $25,000 | 3,537 (79.2%) | 930 (20.8%) |
| $25,000 to $49,999 | 3,068 (70.5%) | 1,287 (29.5%) |
| $50,000 to $74,999 | 4,790 (73.1%) | 1,760 (26.9%) |
| $75,000 to $99,999 | 4,269 (89.8%) | 486 (10.2%) |
| $100,000 and over | 12,050 (92.4%) | 996 (7.6%) |
Public vs Private Health Insurance Coverage by Age in Canton
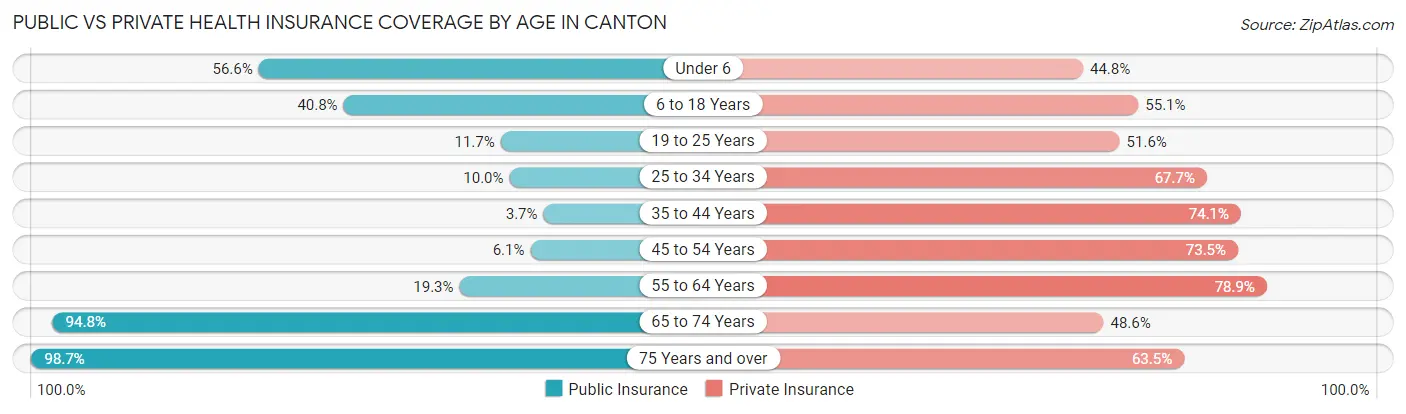
| Age Bracket | Public Insurance | Private Insurance |
| Under 6 | 1,582 (56.6%) | 1,252 (44.8%) |
| 6 to 18 Years | 2,480 (40.8%) | 3,344 (55.0%) |
| 19 to 25 Years | 471 (11.7%) | 2,084 (51.6%) |
| 25 to 34 Years | 404 (10.0%) | 2,731 (67.7%) |
| 35 to 44 Years | 180 (3.7%) | 3,591 (74.1%) |
| 45 to 54 Years | 229 (6.1%) | 2,742 (73.5%) |
| 55 to 64 Years | 557 (19.3%) | 2,276 (78.9%) |
| 65 to 74 Years | 2,622 (94.8%) | 1,344 (48.6%) |
| 75 Years and over | 2,021 (98.7%) | 1,300 (63.5%) |
| Total | 10,546 (31.8%) | 20,664 (62.2%) |
Disability Status by Sex by Age in Canton
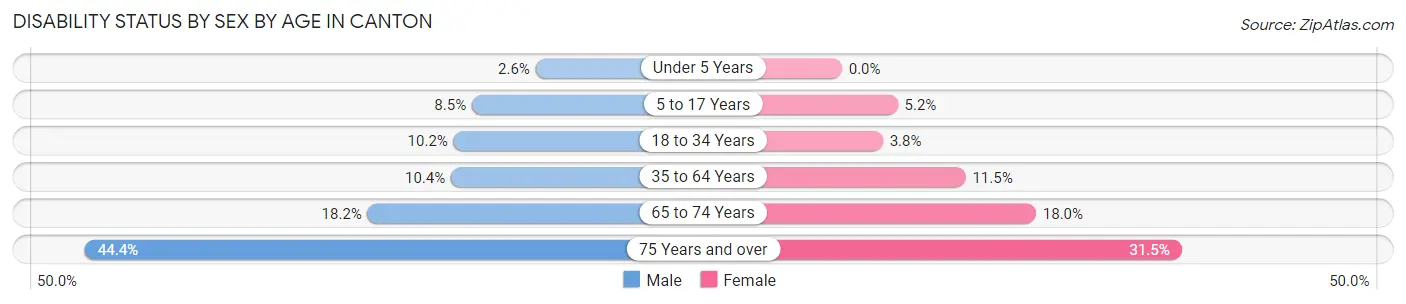
| Age Bracket | Male | Female |
| Under 5 Years | 38 (2.6%) | 0 (0.0%) |
| 5 to 17 Years | 280 (8.5%) | 158 (5.2%) |
| 18 to 34 Years | 486 (10.2%) | 138 (3.8%) |
| 35 to 64 Years | 561 (10.4%) | 698 (11.5%) |
| 65 to 74 Years | 219 (18.2%) | 281 (18.0%) |
| 75 Years and over | 440 (44.4%) | 333 (31.5%) |
Disability Class by Sex by Age in Canton
Disability Class: Hearing Difficulty
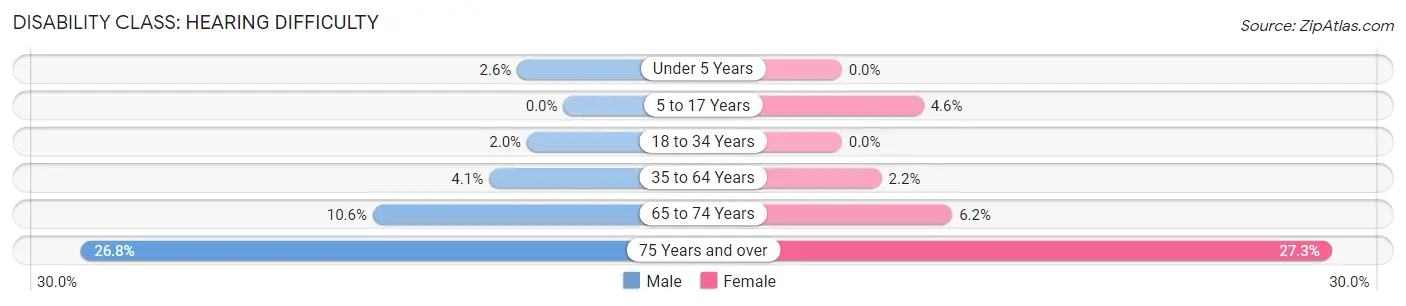
| Age Bracket | Male | Female |
| Under 5 Years | 38 (2.6%) | 0 (0.0%) |
| 5 to 17 Years | 0 (0.0%) | 139 (4.6%) |
| 18 to 34 Years | 97 (2.0%) | 0 (0.0%) |
| 35 to 64 Years | 223 (4.1%) | 135 (2.2%) |
| 65 to 74 Years | 128 (10.6%) | 96 (6.1%) |
| 75 Years and over | 266 (26.8%) | 288 (27.3%) |
Disability Class: Vision Difficulty
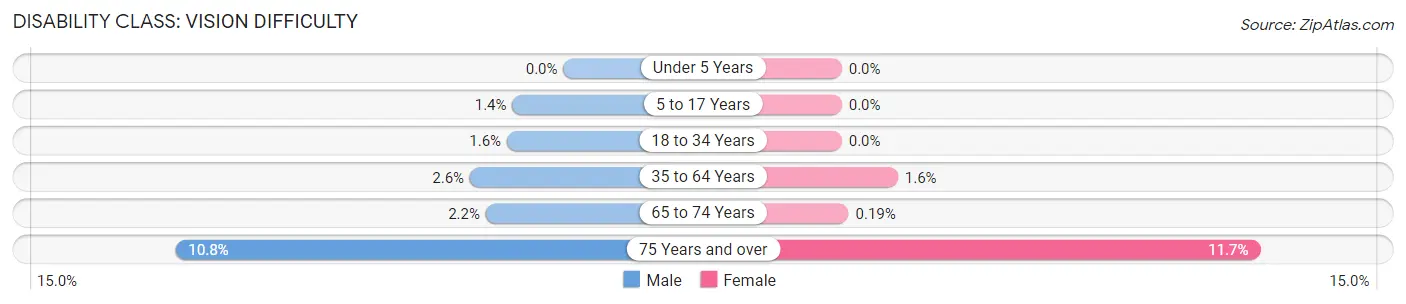
| Age Bracket | Male | Female |
| Under 5 Years | 0 (0.0%) | 0 (0.0%) |
| 5 to 17 Years | 47 (1.4%) | 0 (0.0%) |
| 18 to 34 Years | 75 (1.6%) | 0 (0.0%) |
| 35 to 64 Years | 140 (2.6%) | 95 (1.6%) |
| 65 to 74 Years | 26 (2.2%) | 3 (0.2%) |
| 75 Years and over | 107 (10.8%) | 123 (11.7%) |
Disability Class: Cognitive Difficulty
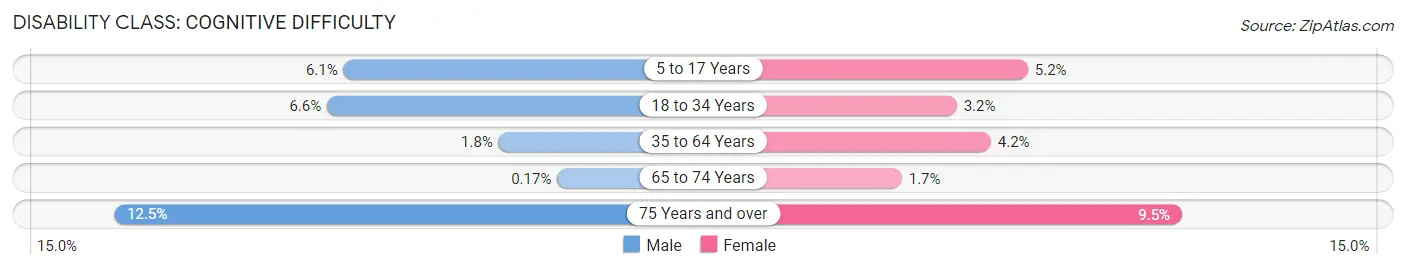
| Age Bracket | Male | Female |
| 5 to 17 Years | 202 (6.1%) | 158 (5.2%) |
| 18 to 34 Years | 314 (6.6%) | 116 (3.2%) |
| 35 to 64 Years | 97 (1.8%) | 252 (4.2%) |
| 65 to 74 Years | 2 (0.2%) | 26 (1.7%) |
| 75 Years and over | 124 (12.5%) | 100 (9.5%) |
Disability Class: Ambulatory Difficulty
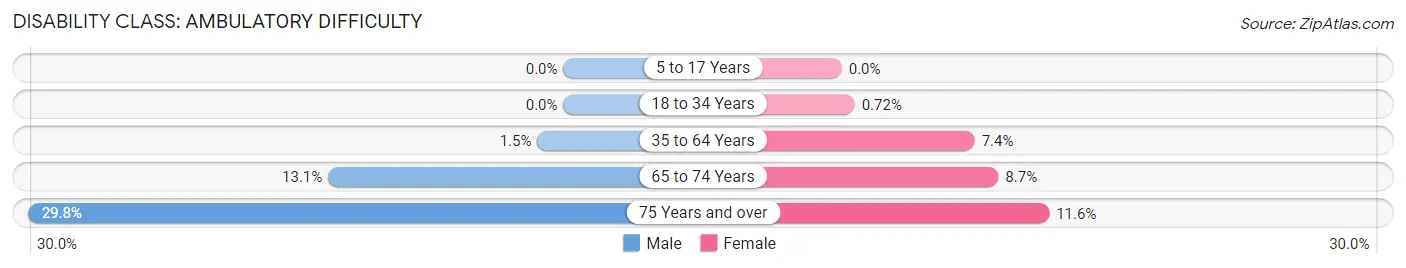
| Age Bracket | Male | Female |
| 5 to 17 Years | 0 (0.0%) | 0 (0.0%) |
| 18 to 34 Years | 0 (0.0%) | 26 (0.7%) |
| 35 to 64 Years | 78 (1.5%) | 450 (7.4%) |
| 65 to 74 Years | 158 (13.1%) | 136 (8.7%) |
| 75 Years and over | 295 (29.8%) | 122 (11.6%) |
Disability Class: Self-Care Difficulty
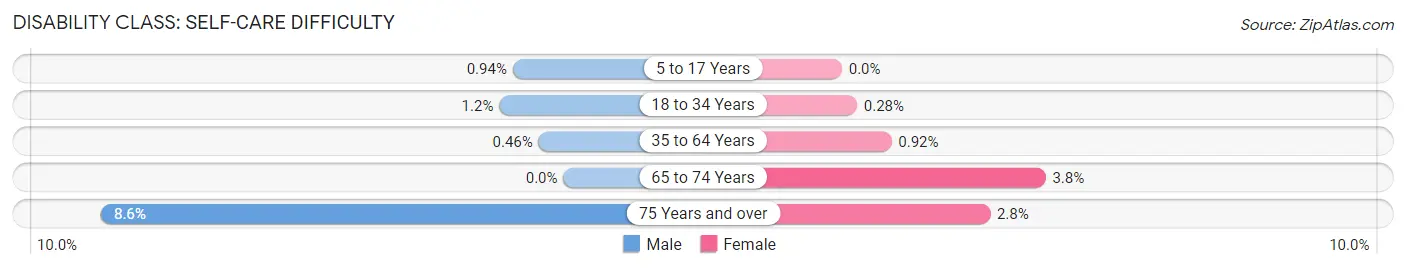
| Age Bracket | Male | Female |
| 5 to 17 Years | 31 (0.9%) | 0 (0.0%) |
| 18 to 34 Years | 57 (1.2%) | 10 (0.3%) |
| 35 to 64 Years | 25 (0.5%) | 56 (0.9%) |
| 65 to 74 Years | 0 (0.0%) | 59 (3.8%) |
| 75 Years and over | 85 (8.6%) | 29 (2.8%) |
Technology Access in Canton
Computing Device Access in Canton
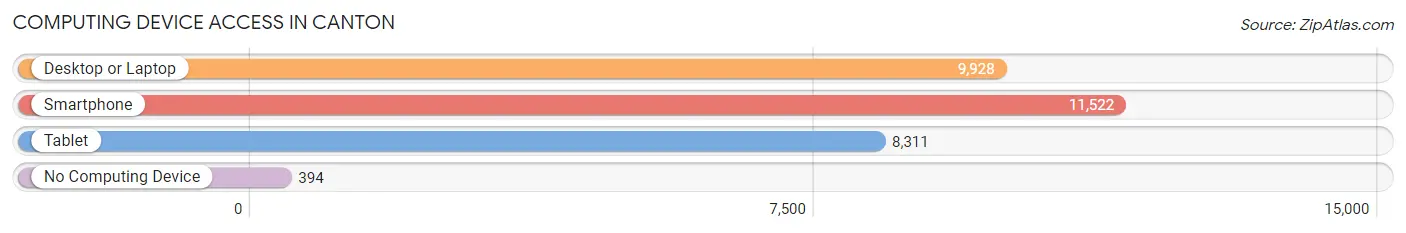
| Device Type | # Households | % Households |
| Desktop or Laptop | 9,928 | 80.9% |
| Smartphone | 11,522 | 93.9% |
| Tablet | 8,311 | 67.7% |
| No Computing Device | 394 | 3.2% |
| Total | 12,268 | 100.0% |
Internet Access in Canton
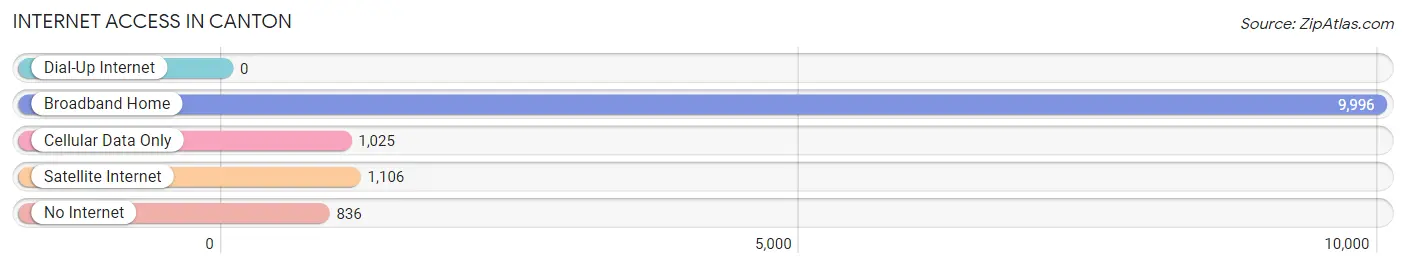
| Internet Type | # Households | % Households |
| Dial-Up Internet | 0 | 0.0% |
| Broadband Home | 9,996 | 81.5% |
| Cellular Data Only | 1,025 | 8.4% |
| Satellite Internet | 1,106 | 9.0% |
| No Internet | 836 | 6.8% |
| Total | 12,268 | 100.0% |
Canton Summary
Canton, Georgia is a city located in the foothills of the Blue Ridge Mountains in Cherokee County, Georgia. It is the county seat of Cherokee County and is located approximately 40 miles north of Atlanta. The city has a population of approximately 24,000 people and is part of the Atlanta metropolitan area.
History
The area that is now Canton was originally inhabited by the Cherokee Indians. The city was founded in 1833 and was named after the city of Canton, China. The city was originally known as Etowah, but the name was changed to Canton in 1834. The city was incorporated in 1835 and was the first city in Cherokee County.
In the late 1800s, Canton was a major center for the production of cotton and woolen goods. The city was also home to several mills and factories. The city was also home to a large number of churches and schools.
In the early 1900s, Canton was a major center for the production of furniture and other wood products. The city was also home to several large manufacturing plants.
In the late 1900s, Canton began to experience a period of growth and development. The city was home to several large retail stores and restaurants. The city was also home to several large industrial parks.
Geography
Canton is located in the foothills of the Blue Ridge Mountains in Cherokee County, Georgia. The city is located approximately 40 miles north of Atlanta. The city is located at an elevation of 1,000 feet above sea level. The city is located in the Etowah River Valley and is surrounded by several mountains, including the Blue Ridge Mountains, the Appalachian Mountains, and the Chattahoochee National Forest.
The city has a total area of 16.2 square miles, of which 16.1 square miles is land and 0.1 square miles is water. The city is located in a humid subtropical climate zone and has hot, humid summers and mild winters.
Economy
Canton is a major center for manufacturing and industry. The city is home to several large industrial parks and manufacturing plants. The city is also home to several large retail stores and restaurants.
The city is also home to several large medical centers and hospitals. The city is also home to several large educational institutions, including Reinhardt University and the University of North Georgia.
Demographics
As of the 2010 census, the city had a population of 24,099 people. The racial makeup of the city was 79.2% White, 14.3% African American, 0.4% Native American, 1.7% Asian, 0.1% Pacific Islander, 2.2% from other races, and 2.3% from two or more races. Hispanic or Latino of any race were 5.3% of the population.
The median income for a household in the city was $45,945 and the median income for a family was $54,945. The per capita income for the city was $22,945. About 11.2% of families and 14.3% of the population were below the poverty line, including 19.2% of those under age 18 and 8.2% of those age 65 or over.
Common Questions
What is Per Capita Income in Canton?
Per Capita income in Canton is $35,770.
What is the Median Family Income in Canton?
Median Family Income in Canton is $89,341.
What is the Median Household income in Canton?
Median Household Income in Canton is $75,414.
What is Income or Wage Gap in Canton?
Income or Wage Gap in Canton is 16.9%.
Women in Canton earn 83.1 cents for every dollar earned by a man.
What is Family Income Deficit in Canton?
Family Income Deficit in Canton is $15,552.
Families that are below poverty line in Canton earn $15,552 less on average than the poverty threshold level.
What is Inequality or Gini Index in Canton?
Inequality or Gini Index in Canton is 0.42.
What is the Total Population of Canton?
Total Population of Canton is 33,499.
What is the Total Male Population of Canton?
Total Male Population of Canton is 17,238.
What is the Total Female Population of Canton?
Total Female Population of Canton is 16,261.
What is the Ratio of Males per 100 Females in Canton?
There are 106.01 Males per 100 Females in Canton.
What is the Ratio of Females per 100 Males in Canton?
There are 94.33 Females per 100 Males in Canton.
What is the Median Population Age in Canton?
Median Population Age in Canton is 34.6 Years.
What is the Average Family Size in Canton
Average Family Size in Canton is 3.3 People.
What is the Average Household Size in Canton
Average Household Size in Canton is 2.7 People.
How Large is the Labor Force in Canton?
There are 17,887 People in the Labor Forcein in Canton.
What is the Percentage of People in the Labor Force in Canton?
69.3% of People are in the Labor Force in Canton.
What is the Unemployment Rate in Canton?
Unemployment Rate in Canton is 7.0%.