Cartersville, GA Map & Demographics
Cartersville Map
Cartersville Overview
$37,989
PER CAPITA INCOME
$92,114
AVG FAMILY INCOME
$75,407
AVG HOUSEHOLD INCOME
22.6%
WAGE / INCOME GAP [ % ]
77.4¢/ $1
WAGE / INCOME GAP [ $ ]
0.45
INEQUALITY / GINI INDEX
23,103
TOTAL POPULATION
12,189
MALE POPULATION
10,914
FEMALE POPULATION
111.68
MALES / 100 FEMALES
89.54
FEMALES / 100 MALES
36.8
MEDIAN AGE
3.2
AVG FAMILY SIZE
2.6
AVG HOUSEHOLD SIZE
11,449
LABOR FORCE [ PEOPLE ]
63.2%
PERCENT IN LABOR FORCE
2.8%
UNEMPLOYMENT RATE
Income in Cartersville
Income Overview in Cartersville
Per Capita Income in Cartersville is $37,989, while median incomes of families and households are $92,114 and $75,407 respectively.
| Characteristic | Number | Measure |
| Per Capita Income | 23,103 | $37,989 |
| Median Family Income | 5,623 | $92,114 |
| Mean Family Income | 5,623 | $118,495 |
| Median Household Income | 8,667 | $75,407 |
| Mean Household Income | 8,667 | $99,940 |
| Income Deficit | 5,623 | $0 |
| Wage / Income Gap (%) | 23,103 | 22.61% |
| Wage / Income Gap ($) | 23,103 | 77.39¢ per $1 |
| Gini / Inequality Index | 23,103 | 0.45 |
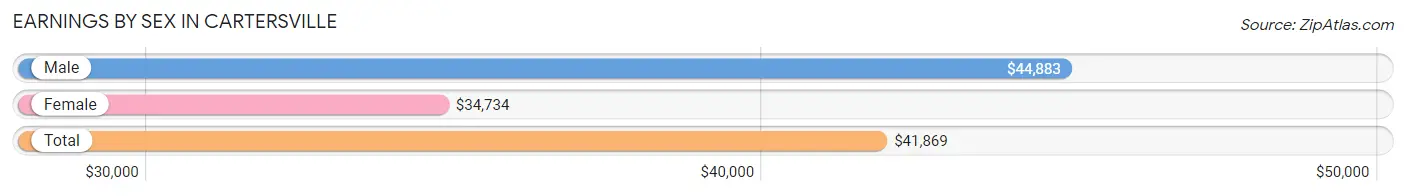
Earnings by Sex in Cartersville
Average Earnings in Cartersville are $41,869, $44,883 for men and $34,734 for women, a difference of 22.6%.
| Sex | Number | Average Earnings |
| Male | 7,065 (57.4%) | $44,883 |
| Female | 5,238 (42.6%) | $34,734 |
| Total | 12,303 (100.0%) | $41,869 |
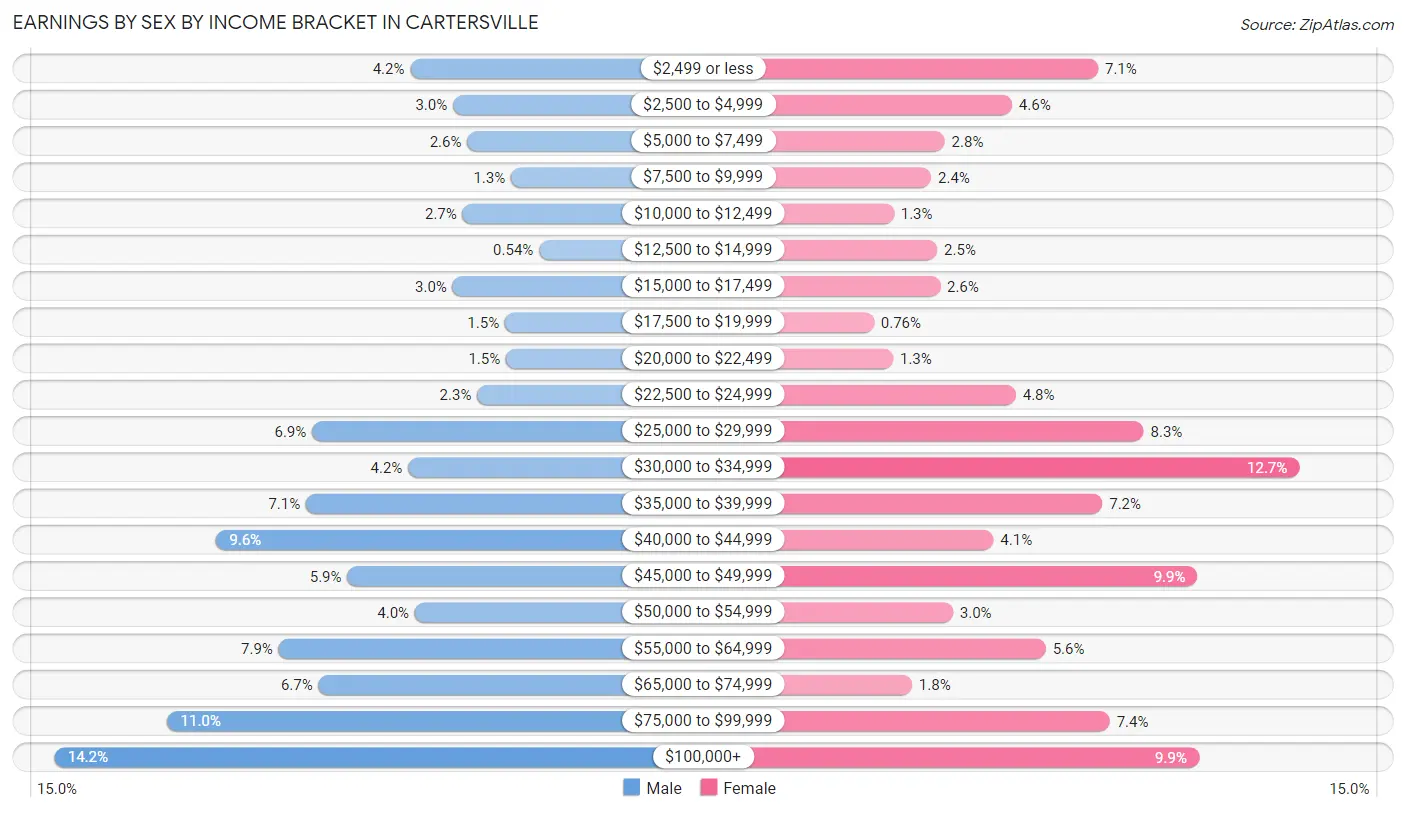
Earnings by Sex by Income Bracket in Cartersville
The most common earnings brackets in Cartersville are $100,000+ for men (1,000 | 14.1%) and $30,000 to $34,999 for women (666 | 12.7%).
| Income | Male | Female |
| $2,499 or less | 294 (4.2%) | 370 (7.1%) |
| $2,500 to $4,999 | 209 (3.0%) | 243 (4.6%) |
| $5,000 to $7,499 | 181 (2.6%) | 144 (2.8%) |
| $7,500 to $9,999 | 94 (1.3%) | 124 (2.4%) |
| $10,000 to $12,499 | 190 (2.7%) | 69 (1.3%) |
| $12,500 to $14,999 | 38 (0.5%) | 133 (2.5%) |
| $15,000 to $17,499 | 210 (3.0%) | 137 (2.6%) |
| $17,500 to $19,999 | 106 (1.5%) | 40 (0.8%) |
| $20,000 to $22,499 | 104 (1.5%) | 68 (1.3%) |
| $22,500 to $24,999 | 161 (2.3%) | 249 (4.8%) |
| $25,000 to $29,999 | 489 (6.9%) | 437 (8.3%) |
| $30,000 to $34,999 | 298 (4.2%) | 666 (12.7%) |
| $35,000 to $39,999 | 501 (7.1%) | 376 (7.2%) |
| $40,000 to $44,999 | 679 (9.6%) | 216 (4.1%) |
| $45,000 to $49,999 | 419 (5.9%) | 516 (9.9%) |
| $50,000 to $54,999 | 285 (4.0%) | 156 (3.0%) |
| $55,000 to $64,999 | 555 (7.9%) | 293 (5.6%) |
| $65,000 to $74,999 | 476 (6.7%) | 96 (1.8%) |
| $75,000 to $99,999 | 776 (11.0%) | 387 (7.4%) |
| $100,000+ | 1,000 (14.1%) | 518 (9.9%) |
| Total | 7,065 (100.0%) | 5,238 (100.0%) |
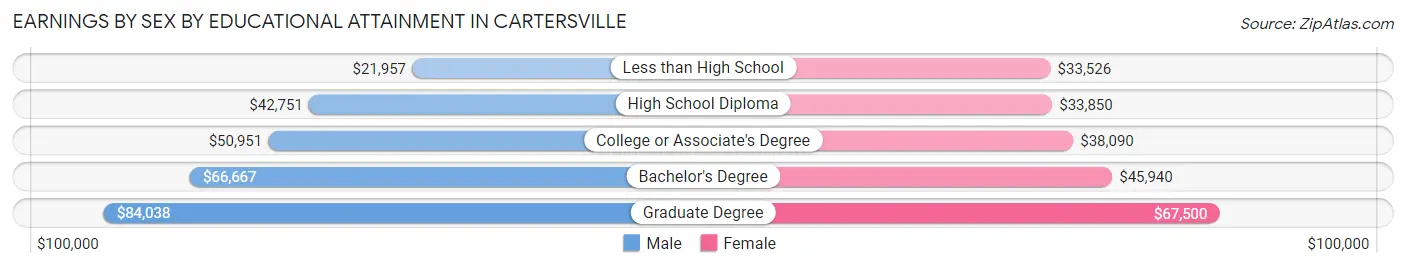
Earnings by Sex by Educational Attainment in Cartersville
Average earnings in Cartersville are $48,967 for men and $38,250 for women, a difference of 21.9%. Men with an educational attainment of graduate degree enjoy the highest average annual earnings of $84,038, while those with less than high school education earn the least with $21,957. Women with an educational attainment of graduate degree earn the most with the average annual earnings of $67,500, while those with less than high school education have the smallest earnings of $33,526.
| Educational Attainment | Male Income | Female Income |
| Less than High School | $21,957 | $33,526 |
| High School Diploma | $42,751 | $33,850 |
| College or Associate's Degree | $50,951 | $38,090 |
| Bachelor's Degree | $66,667 | $45,940 |
| Graduate Degree | $84,038 | $67,500 |
| Total | $48,967 | $38,250 |
Family Income in Cartersville
Family Income Brackets in Cartersville
According to the Cartersville family income data, there are 1,136 families falling into the $75,000 to $99,999 income range, which is the most common income bracket and makes up 20.2% of all families. Conversely, the less than $10,000 income bracket is the least frequent group with only 90 families (1.6%) belonging to this category.
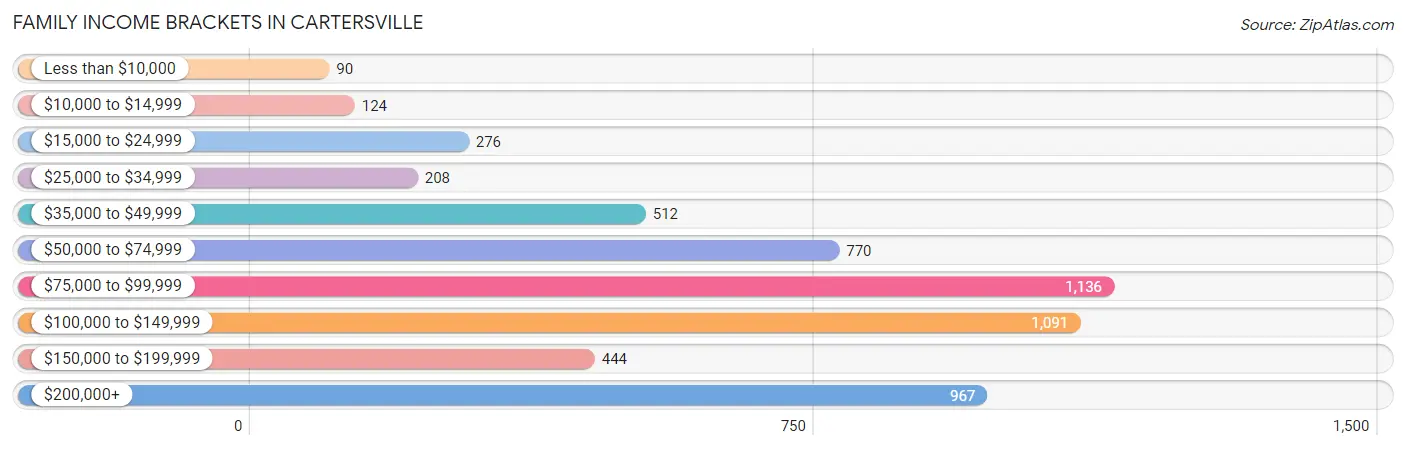
| Income Bracket | # Families | % Families |
| Less than $10,000 | 90 | 1.6% |
| $10,000 to $14,999 | 124 | 2.2% |
| $15,000 to $24,999 | 276 | 4.9% |
| $25,000 to $34,999 | 208 | 3.7% |
| $35,000 to $49,999 | 512 | 9.1% |
| $50,000 to $74,999 | 770 | 13.7% |
| $75,000 to $99,999 | 1,136 | 20.2% |
| $100,000 to $149,999 | 1,091 | 19.4% |
| $150,000 to $199,999 | 444 | 7.9% |
| $200,000+ | 967 | 17.2% |
Family Income by Famaliy Size in Cartersville
7+ person families (81 | 1.4%) account for the highest median family income in Cartersville with $129,471 per family, while 2-person families (2,309 | 41.1%) have the highest median income of $41,304 per family member.
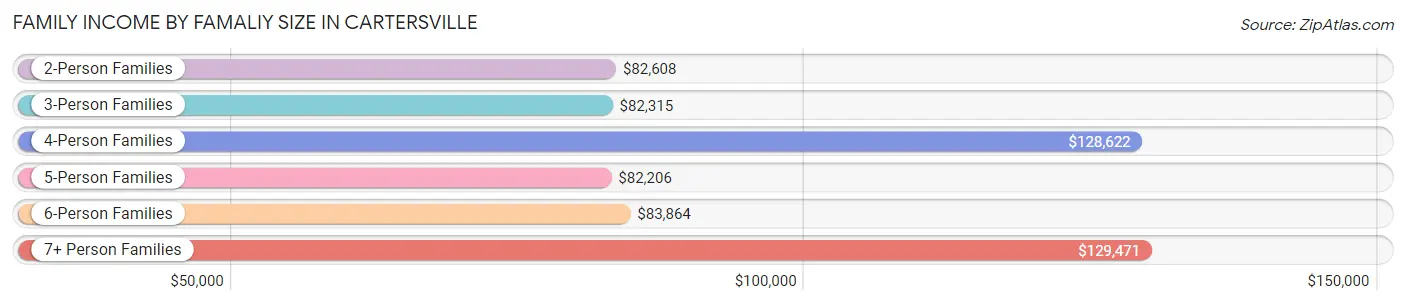
| Income Bracket | # Families | Median Income |
| 2-Person Families | 2,309 (41.1%) | $82,608 |
| 3-Person Families | 1,348 (24.0%) | $82,315 |
| 4-Person Families | 1,237 (22.0%) | $128,622 |
| 5-Person Families | 564 (10.0%) | $82,206 |
| 6-Person Families | 84 (1.5%) | $83,864 |
| 7+ Person Families | 81 (1.4%) | $129,471 |
| Total | 5,623 (100.0%) | $92,114 |
Family Income by Number of Earners in Cartersville
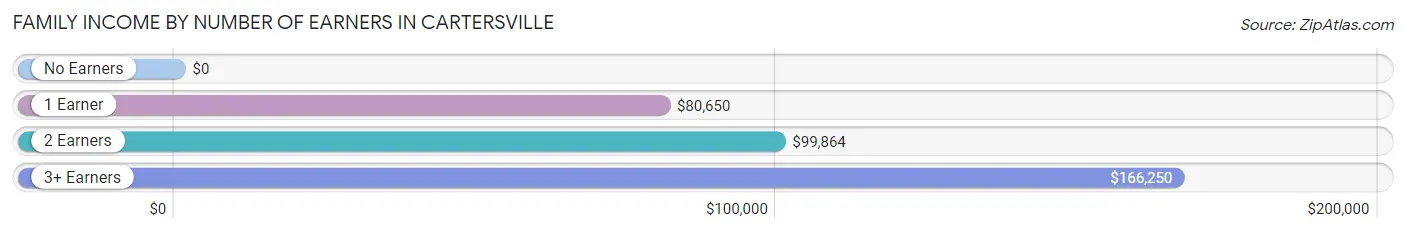
| Number of Earners | # Families | Median Income |
| No Earners | 822 (14.6%) | $0 |
| 1 Earner | 1,785 (31.7%) | $80,650 |
| 2 Earners | 2,303 (41.0%) | $99,864 |
| 3+ Earners | 713 (12.7%) | $166,250 |
| Total | 5,623 (100.0%) | $92,114 |
Household Income in Cartersville
Household Income Brackets in Cartersville
With 1,439 households falling in the category, the $75,000 to $99,999 income range is the most frequent in Cartersville, accounting for 16.6% of all households. In contrast, only 260 households (3.0%) fall into the less than $10,000 income bracket, making it the least populous group.
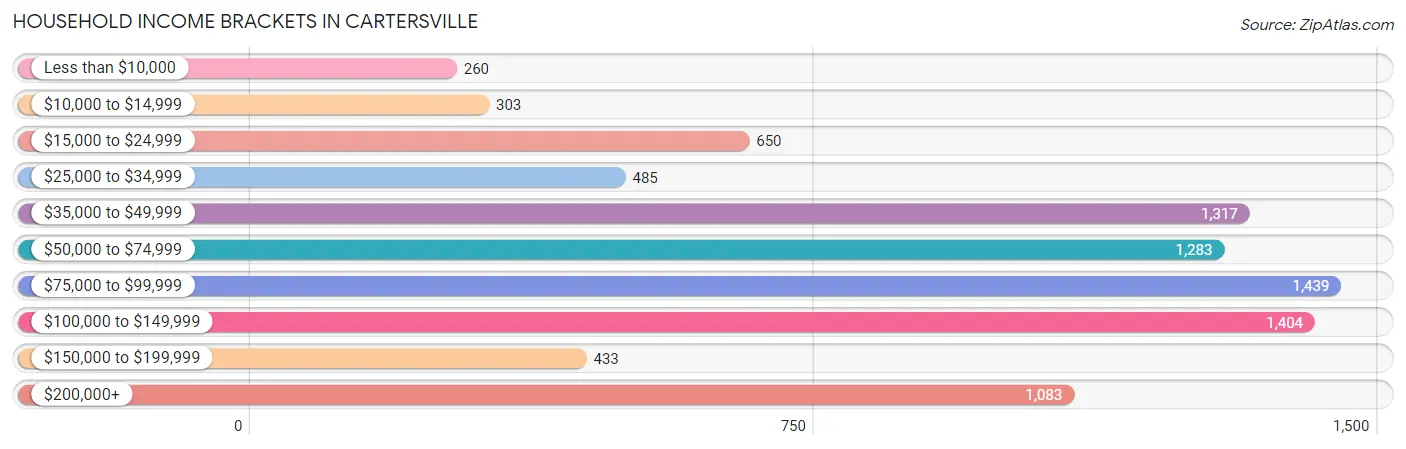
| Income Bracket | # Households | % Households |
| Less than $10,000 | 260 | 3.0% |
| $10,000 to $14,999 | 303 | 3.5% |
| $15,000 to $24,999 | 650 | 7.5% |
| $25,000 to $34,999 | 485 | 5.6% |
| $35,000 to $49,999 | 1,317 | 15.2% |
| $50,000 to $74,999 | 1,283 | 14.8% |
| $75,000 to $99,999 | 1,439 | 16.6% |
| $100,000 to $149,999 | 1,404 | 16.2% |
| $150,000 to $199,999 | 433 | 5.0% |
| $200,000+ | 1,083 | 12.5% |
Household Income by Householder Age in Cartersville
The median household income in Cartersville is $75,407, with the highest median household income of $92,232 found in the 45 to 64 years age bracket for the primary householder. A total of 3,329 households (38.4%) fall into this category. Meanwhile, the 15 to 24 years age bracket for the primary householder has the lowest median household income of $46,948, with 286 households (3.3%) in this group.
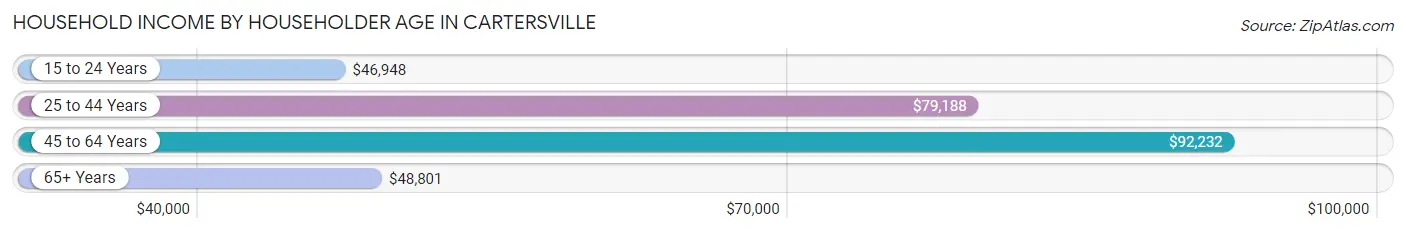
| Income Bracket | # Households | Median Income |
| 15 to 24 Years | 286 (3.3%) | $46,948 |
| 25 to 44 Years | 3,255 (37.6%) | $79,188 |
| 45 to 64 Years | 3,329 (38.4%) | $92,232 |
| 65+ Years | 1,797 (20.7%) | $48,801 |
| Total | 8,667 (100.0%) | $75,407 |
Poverty in Cartersville
Income Below Poverty by Sex and Age in Cartersville
With 10.5% poverty level for males and 14.5% for females among the residents of Cartersville, 15 year old males and 18 to 24 year old females are the most vulnerable to poverty, with 78 males (30.9%) and 224 females (25.1%) in their respective age groups living below the poverty level.
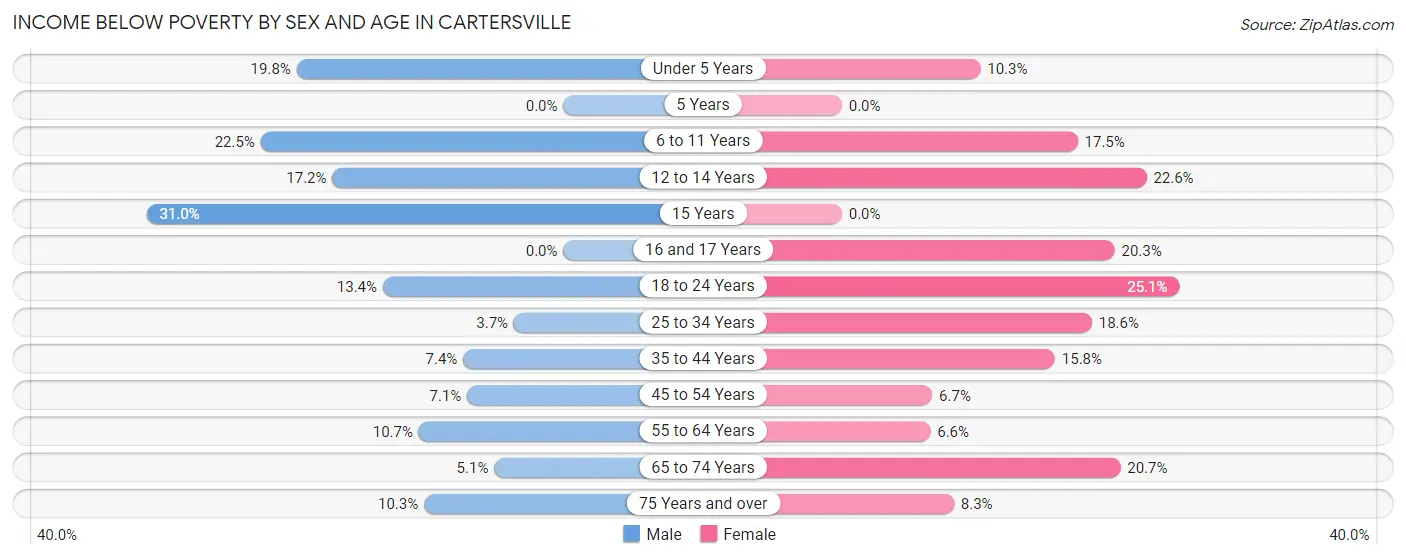
| Age Bracket | Male | Female |
| Under 5 Years | 196 (19.8%) | 66 (10.3%) |
| 5 Years | 0 (0.0%) | 0 (0.0%) |
| 6 to 11 Years | 178 (22.5%) | 193 (17.5%) |
| 12 to 14 Years | 107 (17.2%) | 76 (22.6%) |
| 15 Years | 78 (30.9%) | 0 (0.0%) |
| 16 and 17 Years | 0 (0.0%) | 48 (20.3%) |
| 18 to 24 Years | 119 (13.4%) | 224 (25.1%) |
| 25 to 34 Years | 71 (3.7%) | 232 (18.6%) |
| 35 to 44 Years | 138 (7.4%) | 258 (15.8%) |
| 45 to 54 Years | 116 (7.1%) | 93 (6.7%) |
| 55 to 64 Years | 126 (10.7%) | 87 (6.6%) |
| 65 to 74 Years | 35 (5.1%) | 213 (20.7%) |
| 75 Years and over | 48 (10.3%) | 55 (8.3%) |
| Total | 1,212 (10.5%) | 1,545 (14.5%) |
Income Above Poverty by Sex and Age in Cartersville
According to the poverty statistics in Cartersville, males aged 5 years and females aged 5 years are the age groups that are most secure financially, with 100.0% of males and 100.0% of females in these age groups living above the poverty line.
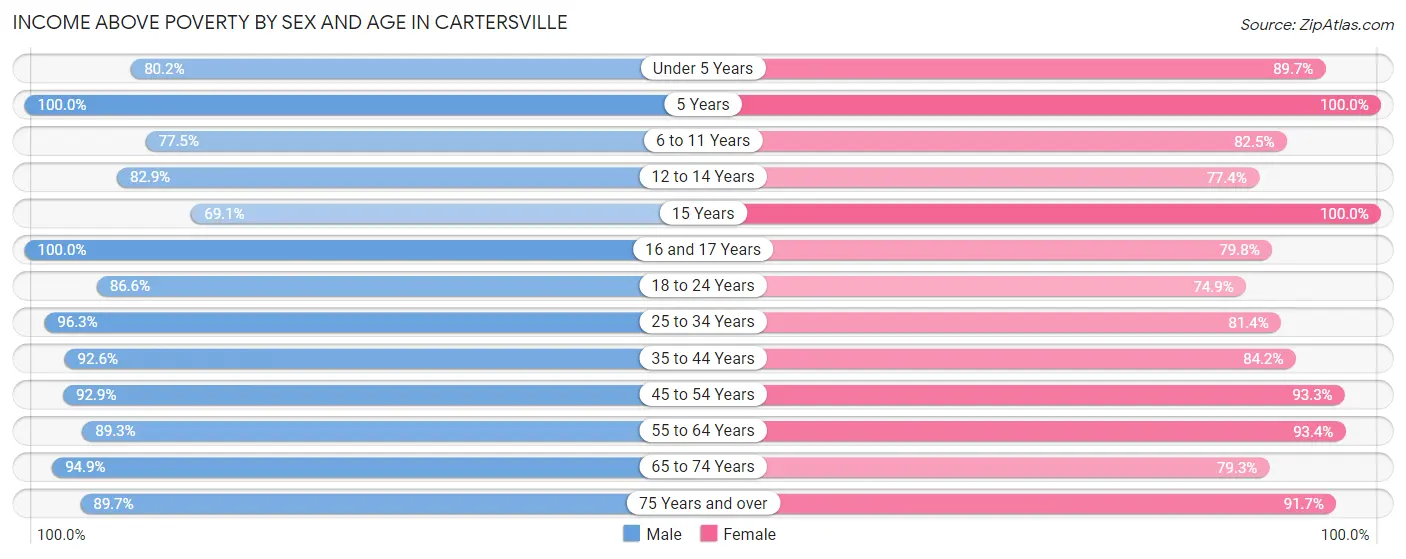
| Age Bracket | Male | Female |
| Under 5 Years | 794 (80.2%) | 576 (89.7%) |
| 5 Years | 88 (100.0%) | 44 (100.0%) |
| 6 to 11 Years | 614 (77.5%) | 909 (82.5%) |
| 12 to 14 Years | 517 (82.9%) | 260 (77.4%) |
| 15 Years | 174 (69.1%) | 77 (100.0%) |
| 16 and 17 Years | 210 (100.0%) | 189 (79.7%) |
| 18 to 24 Years | 769 (86.6%) | 670 (74.9%) |
| 25 to 34 Years | 1,865 (96.3%) | 1,018 (81.4%) |
| 35 to 44 Years | 1,716 (92.6%) | 1,373 (84.2%) |
| 45 to 54 Years | 1,509 (92.9%) | 1,293 (93.3%) |
| 55 to 64 Years | 1,048 (89.3%) | 1,238 (93.4%) |
| 65 to 74 Years | 647 (94.9%) | 817 (79.3%) |
| 75 Years and over | 416 (89.7%) | 606 (91.7%) |
| Total | 10,367 (89.5%) | 9,070 (85.5%) |
Income Below Poverty Among Married-Couple Families in Cartersville
The poverty statistics for married-couple families in Cartersville show that 6.3% or 251 of the total 3,980 families live below the poverty line. Families with 3 or 4 children have the highest poverty rate of 16.1%, comprising of 70 families. On the other hand, families with no children have the lowest poverty rate of 4.2%, which includes 92 families.
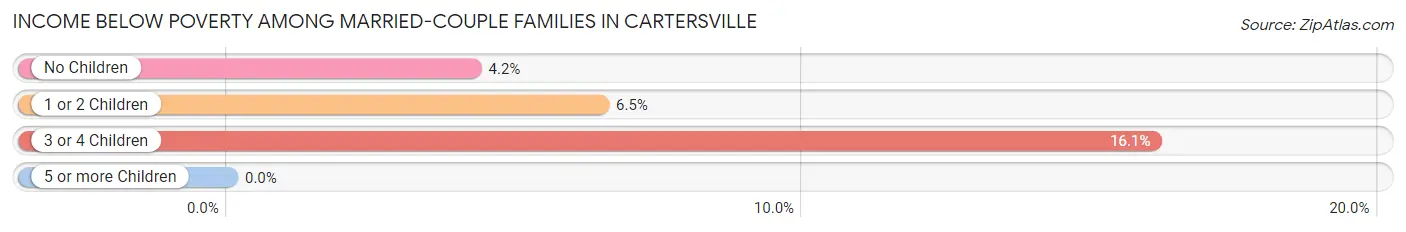
| Children | Above Poverty | Below Poverty |
| No Children | 2,076 (95.8%) | 92 (4.2%) |
| 1 or 2 Children | 1,288 (93.5%) | 89 (6.5%) |
| 3 or 4 Children | 365 (83.9%) | 70 (16.1%) |
| 5 or more Children | 0 (0.0%) | 0 (0.0%) |
| Total | 3,729 (93.7%) | 251 (6.3%) |
Income Below Poverty Among Single-Parent Households in Cartersville
According to the poverty data in Cartersville, 8.8% or 46 single-father households and 25.9% or 289 single-mother households are living below the poverty line. Among single-father households, those with 1 or 2 children have the highest poverty rate, with 46 households (17.2%) experiencing poverty. Likewise, among single-mother households, those with 3 or 4 children have the highest poverty rate, with 43 households (100.0%) falling below the poverty line.
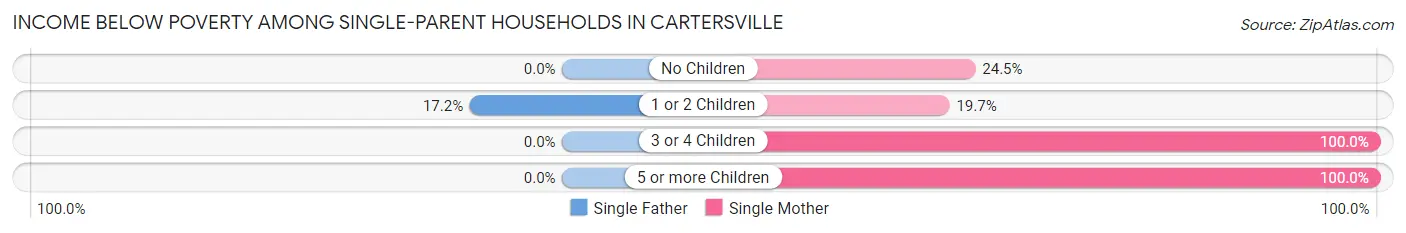
| Children | Single Father | Single Mother |
| No Children | 0 (0.0%) | 92 (24.5%) |
| 1 or 2 Children | 46 (17.2%) | 134 (19.7%) |
| 3 or 4 Children | 0 (0.0%) | 43 (100.0%) |
| 5 or more Children | 0 (0.0%) | 20 (100.0%) |
| Total | 46 (8.8%) | 289 (25.9%) |
Income Below Poverty Among Married-Couple vs Single-Parent Households in Cartersville
The poverty data for Cartersville shows that 251 of the married-couple family households (6.3%) and 335 of the single-parent households (20.4%) are living below the poverty level. Within the married-couple family households, those with 3 or 4 children have the highest poverty rate, with 70 households (16.1%) falling below the poverty line. Among the single-parent households, those with 5 or more children have the highest poverty rate, with 20 household (100.0%) living below poverty.
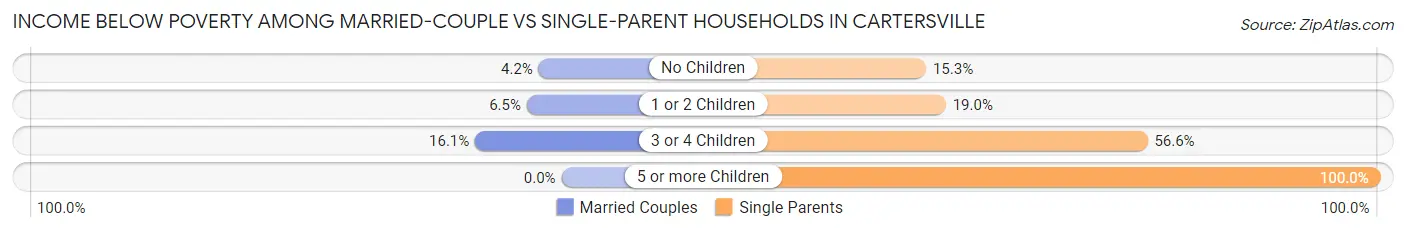
| Children | Married-Couple Families | Single-Parent Households |
| No Children | 92 (4.2%) | 92 (15.3%) |
| 1 or 2 Children | 89 (6.5%) | 180 (19.0%) |
| 3 or 4 Children | 70 (16.1%) | 43 (56.6%) |
| 5 or more Children | 0 (0.0%) | 20 (100.0%) |
| Total | 251 (6.3%) | 335 (20.4%) |
Race in Cartersville
The most populous races in Cartersville are White / Caucasian (17,568 | 76.0%), Black / African American (3,065 | 13.3%), and Hispanic or Latino (3,017 | 13.1%).
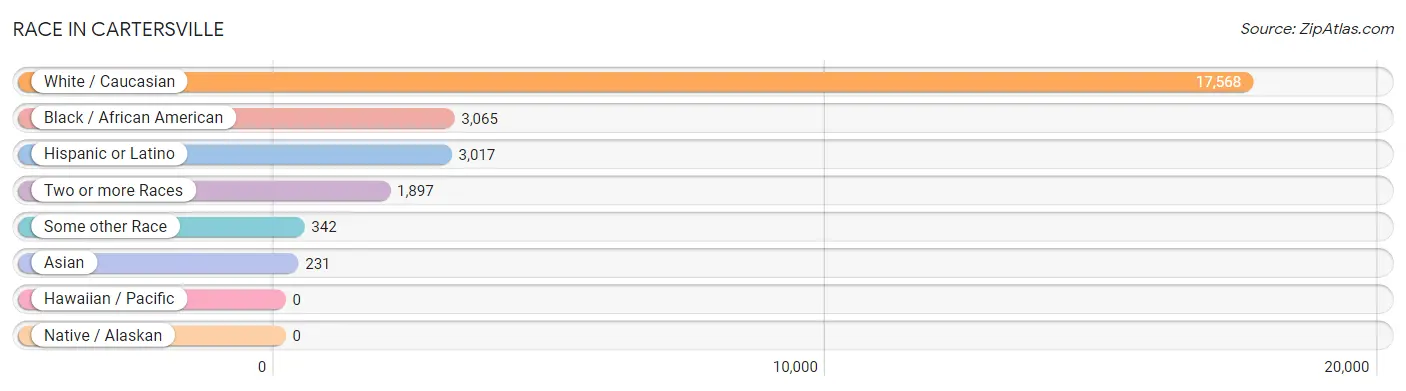
| Race | # Population | % Population |
| Asian | 231 | 1.0% |
| Black / African American | 3,065 | 13.3% |
| Hawaiian / Pacific | 0 | 0.0% |
| Hispanic or Latino | 3,017 | 13.1% |
| Native / Alaskan | 0 | 0.0% |
| White / Caucasian | 17,568 | 76.0% |
| Two or more Races | 1,897 | 8.2% |
| Some other Race | 342 | 1.5% |
| Total | 23,103 | 100.0% |
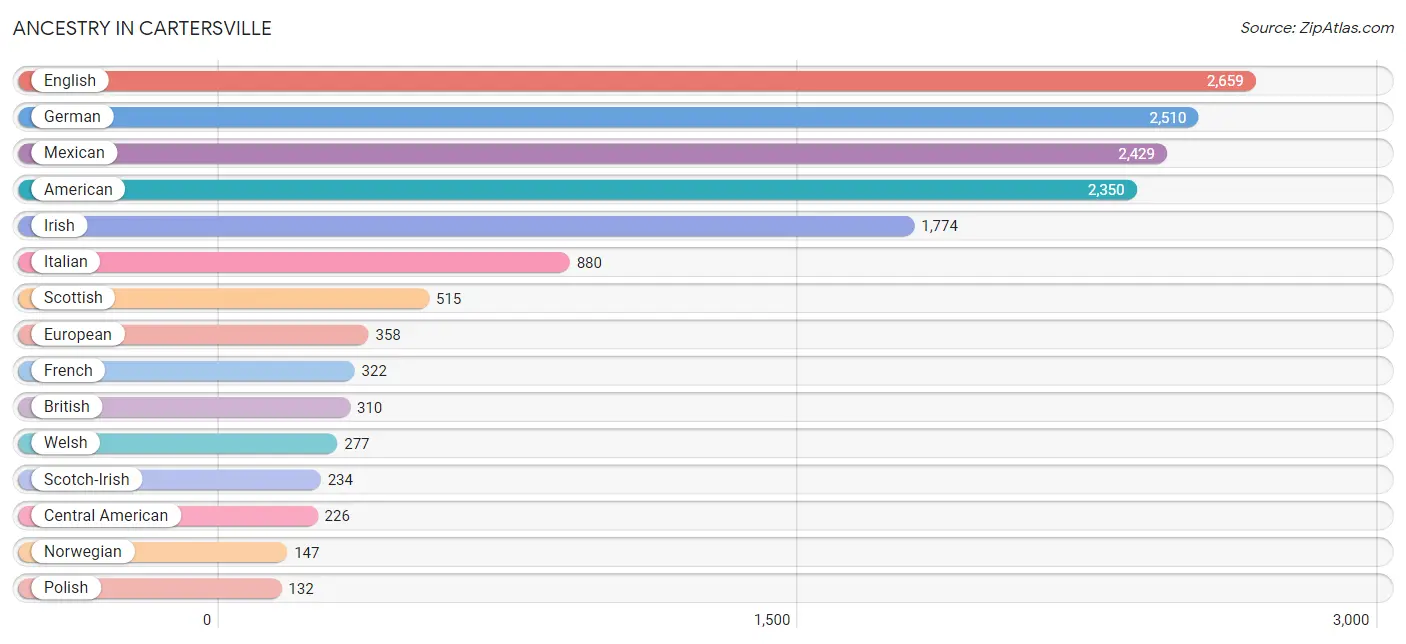
Ancestry in Cartersville
The most populous ancestries reported in Cartersville are English (2,659 | 11.5%), German (2,510 | 10.9%), Mexican (2,429 | 10.5%), American (2,350 | 10.2%), and Irish (1,774 | 7.7%), together accounting for 50.7% of all Cartersville residents.
| Ancestry | # Population | % Population |
| African | 29 | 0.1% |
| American | 2,350 | 10.2% |
| Arab | 82 | 0.4% |
| Argentinean | 14 | 0.1% |
| Austrian | 13 | 0.1% |
| Belgian | 10 | 0.0% |
| Blackfeet | 21 | 0.1% |
| Brazilian | 10 | 0.0% |
| British | 310 | 1.3% |
| Canadian | 36 | 0.2% |
| Central American | 226 | 1.0% |
| Cherokee | 65 | 0.3% |
| Colombian | 12 | 0.1% |
| Costa Rican | 33 | 0.1% |
| Czech | 44 | 0.2% |
| Danish | 101 | 0.4% |
| Dutch | 130 | 0.6% |
| Dutch West Indian | 20 | 0.1% |
| Eastern European | 23 | 0.1% |
| Ecuadorian | 8 | 0.0% |
| Egyptian | 82 | 0.4% |
| English | 2,659 | 11.5% |
| European | 358 | 1.5% |
| Finnish | 24 | 0.1% |
| French | 322 | 1.4% |
| French Canadian | 36 | 0.2% |
| German | 2,510 | 10.9% |
| Guatemalan | 81 | 0.4% |
| Haitian | 102 | 0.4% |
| Hungarian | 39 | 0.2% |
| Indian (Asian) | 1 | 0.0% |
| Irish | 1,774 | 7.7% |
| Italian | 880 | 3.8% |
| Jamaican | 84 | 0.4% |
| Korean | 77 | 0.3% |
| Macedonian | 31 | 0.1% |
| Mexican | 2,429 | 10.5% |
| Mongolian | 33 | 0.1% |
| Nicaraguan | 27 | 0.1% |
| Norwegian | 147 | 0.6% |
| Panamanian | 28 | 0.1% |
| Paraguayan | 88 | 0.4% |
| Pennsylvania German | 17 | 0.1% |
| Polish | 132 | 0.6% |
| Portuguese | 10 | 0.0% |
| Puerto Rican | 94 | 0.4% |
| Romanian | 56 | 0.2% |
| Russian | 55 | 0.2% |
| Salvadoran | 57 | 0.3% |
| Scandinavian | 26 | 0.1% |
| Scotch-Irish | 234 | 1.0% |
| Scottish | 515 | 2.2% |
| South American | 122 | 0.5% |
| Sri Lankan | 30 | 0.1% |
| Subsaharan African | 82 | 0.4% |
| Swedish | 94 | 0.4% |
| Swiss | 29 | 0.1% |
| Thai | 127 | 0.5% |
| Trinidadian and Tobagonian | 9 | 0.0% |
| Welsh | 277 | 1.2% | View All 60 Rows |
Immigrants in Cartersville
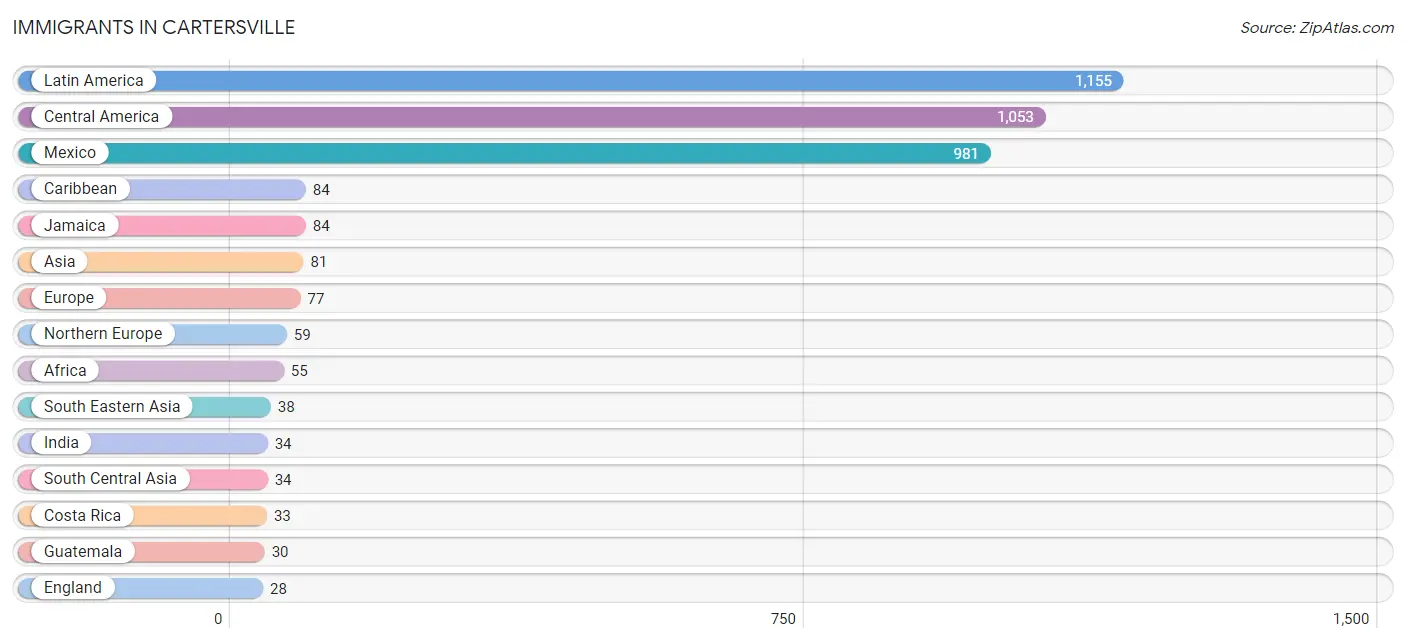
The most numerous immigrant groups reported in Cartersville came from Latin America (1,155 | 5.0%), Central America (1,053 | 4.6%), Mexico (981 | 4.3%), Caribbean (84 | 0.4%), and Jamaica (84 | 0.4%), together accounting for 14.5% of all Cartersville residents.
| Immigration Origin | # Population | % Population |
| Africa | 55 | 0.2% |
| Asia | 81 | 0.4% |
| Brazil | 10 | 0.0% |
| Canada | 13 | 0.1% |
| Caribbean | 84 | 0.4% |
| Central America | 1,053 | 4.6% |
| China | 1 | 0.0% |
| Costa Rica | 33 | 0.1% |
| Denmark | 19 | 0.1% |
| Eastern Asia | 1 | 0.0% |
| Eastern Europe | 16 | 0.1% |
| Ecuador | 8 | 0.0% |
| El Salvador | 9 | 0.0% |
| England | 28 | 0.1% |
| Europe | 77 | 0.3% |
| Germany | 2 | 0.0% |
| Guatemala | 30 | 0.1% |
| India | 34 | 0.2% |
| Jamaica | 84 | 0.4% |
| Latin America | 1,155 | 5.0% |
| Mexico | 981 | 4.3% |
| North Macedonia | 16 | 0.1% |
| Northern Europe | 59 | 0.3% |
| Philippines | 23 | 0.1% |
| Scotland | 12 | 0.1% |
| South America | 18 | 0.1% |
| South Central Asia | 34 | 0.2% |
| South Eastern Asia | 38 | 0.2% |
| Vietnam | 15 | 0.1% |
| Western Africa | 22 | 0.1% |
| Western Asia | 8 | 0.0% |
| Western Europe | 2 | 0.0% | View All 32 Rows |
Sex and Age in Cartersville
Sex and Age in Cartersville
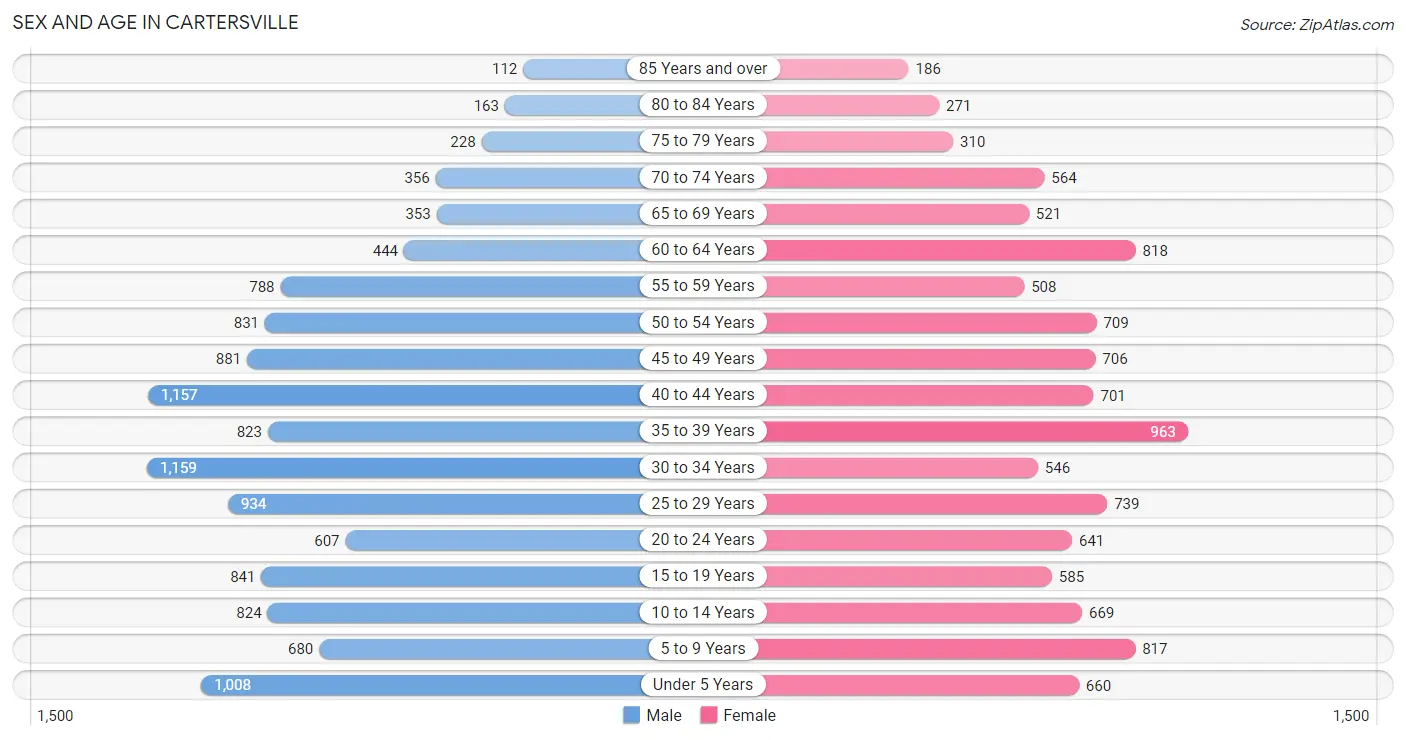
The most populous age groups in Cartersville are 30 to 34 Years (1,159 | 9.5%) for men and 35 to 39 Years (963 | 8.8%) for women.
| Age Bracket | Male | Female |
| Under 5 Years | 1,008 (8.3%) | 660 (6.0%) |
| 5 to 9 Years | 680 (5.6%) | 817 (7.5%) |
| 10 to 14 Years | 824 (6.8%) | 669 (6.1%) |
| 15 to 19 Years | 841 (6.9%) | 585 (5.4%) |
| 20 to 24 Years | 607 (5.0%) | 641 (5.9%) |
| 25 to 29 Years | 934 (7.7%) | 739 (6.8%) |
| 30 to 34 Years | 1,159 (9.5%) | 546 (5.0%) |
| 35 to 39 Years | 823 (6.8%) | 963 (8.8%) |
| 40 to 44 Years | 1,157 (9.5%) | 701 (6.4%) |
| 45 to 49 Years | 881 (7.2%) | 706 (6.5%) |
| 50 to 54 Years | 831 (6.8%) | 709 (6.5%) |
| 55 to 59 Years | 788 (6.5%) | 508 (4.6%) |
| 60 to 64 Years | 444 (3.6%) | 818 (7.5%) |
| 65 to 69 Years | 353 (2.9%) | 521 (4.8%) |
| 70 to 74 Years | 356 (2.9%) | 564 (5.2%) |
| 75 to 79 Years | 228 (1.9%) | 310 (2.8%) |
| 80 to 84 Years | 163 (1.3%) | 271 (2.5%) |
| 85 Years and over | 112 (0.9%) | 186 (1.7%) |
| Total | 12,189 (100.0%) | 10,914 (100.0%) |
Families and Households in Cartersville
Median Family Size in Cartersville
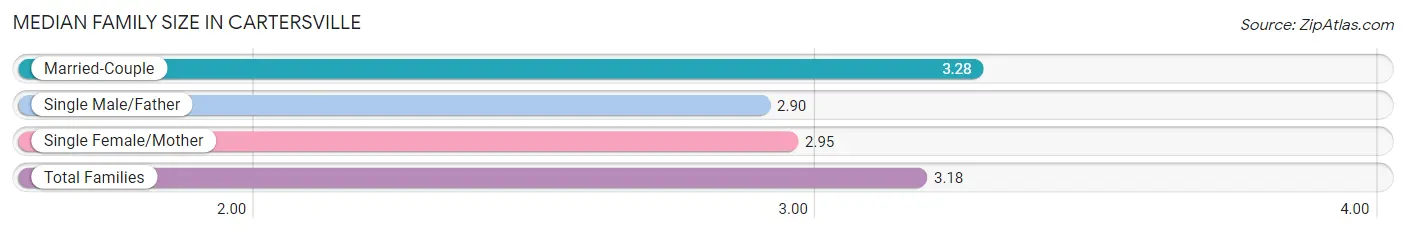
The median family size in Cartersville is 3.18 persons per family, with married-couple families (3,980 | 70.8%) accounting for the largest median family size of 3.28 persons per family. On the other hand, single male/father families (525 | 9.3%) represent the smallest median family size with 2.90 persons per family.
| Family Type | # Families | Family Size |
| Married-Couple | 3,980 (70.8%) | 3.28 |
| Single Male/Father | 525 (9.3%) | 2.90 |
| Single Female/Mother | 1,118 (19.9%) | 2.95 |
| Total Families | 5,623 (100.0%) | 3.18 |
Median Household Size in Cartersville
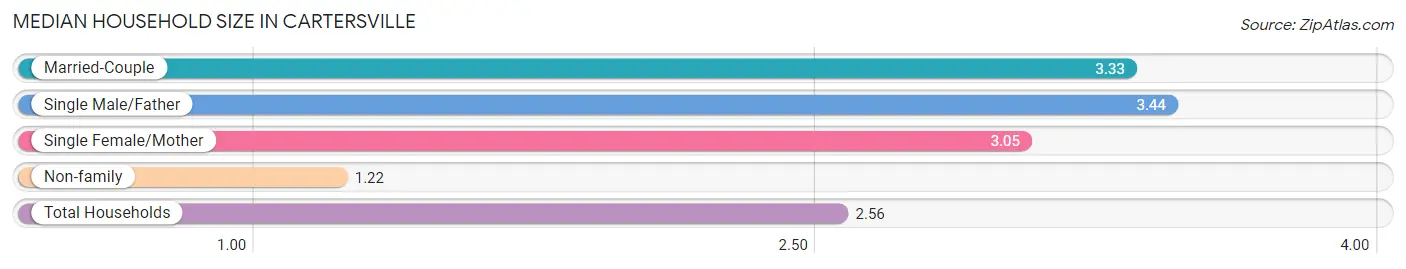
The median household size in Cartersville is 2.56 persons per household, with single male/father households (525 | 6.1%) accounting for the largest median household size of 3.44 persons per household. non-family households (3,044 | 35.1%) represent the smallest median household size with 1.22 persons per household.
| Household Type | # Households | Household Size |
| Married-Couple | 3,980 (45.9%) | 3.33 |
| Single Male/Father | 525 (6.1%) | 3.44 |
| Single Female/Mother | 1,118 (12.9%) | 3.05 |
| Non-family | 3,044 (35.1%) | 1.22 |
| Total Households | 8,667 (100.0%) | 2.56 |
Household Size by Marriage Status in Cartersville
Out of a total of 8,667 households in Cartersville, 5,623 (64.9%) are family households, while 3,044 (35.1%) are nonfamily households. The most numerous type of family households are 2-person households, comprising 2,240, and the most common type of nonfamily households are 1-person households, comprising 2,606.
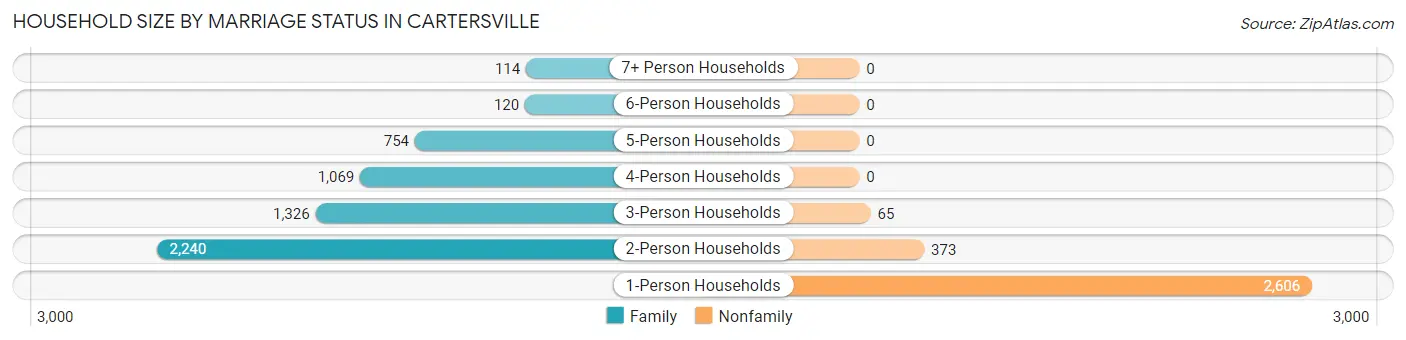
| Household Size | Family Households | Nonfamily Households |
| 1-Person Households | - | 2,606 (30.1%) |
| 2-Person Households | 2,240 (25.9%) | 373 (4.3%) |
| 3-Person Households | 1,326 (15.3%) | 65 (0.7%) |
| 4-Person Households | 1,069 (12.3%) | 0 (0.0%) |
| 5-Person Households | 754 (8.7%) | 0 (0.0%) |
| 6-Person Households | 120 (1.4%) | 0 (0.0%) |
| 7+ Person Households | 114 (1.3%) | 0 (0.0%) |
| Total | 5,623 (64.9%) | 3,044 (35.1%) |
Female Fertility in Cartersville
Fertility by Age in Cartersville
Average fertility rate in Cartersville is 93.0 births per 1,000 women. Women in the age bracket of 20 to 34 years have the highest fertility rate with 168.0 births per 1,000 women. Women in the age bracket of 20 to 34 years acount for 70.0% of all women with births.
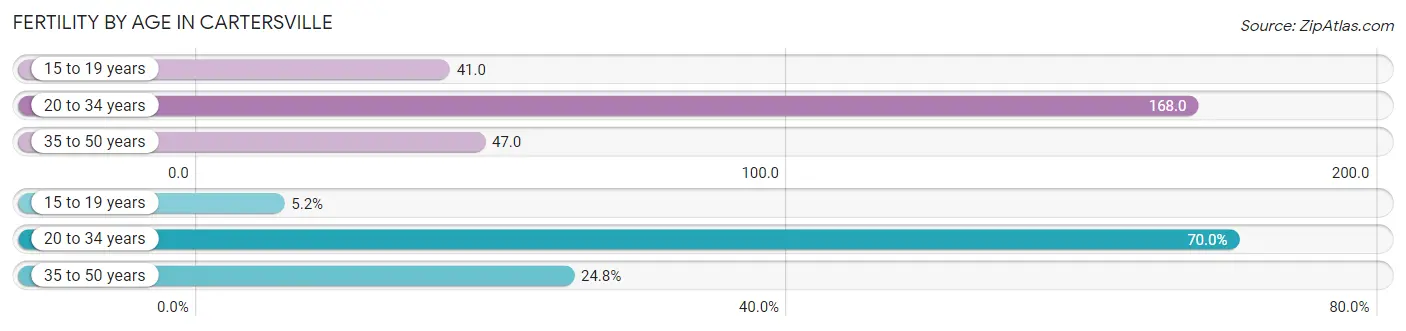
| Age Bracket | Women with Births | Births / 1,000 Women |
| 15 to 19 years | 24 (5.2%) | 41.0 |
| 20 to 34 years | 324 (70.0%) | 168.0 |
| 35 to 50 years | 115 (24.8%) | 47.0 |
| Total | 463 (100.0%) | 93.0 |
Fertility by Age by Marriage Status in Cartersville
83.2% of women with births (463) in Cartersville are married. The highest percentage of unmarried women with births falls into 15 to 19 years age bracket with 100.0% of them unmarried at the time of birth, while the lowest percentage of unmarried women with births belong to 35 to 50 years age bracket with 0.0% of them unmarried.
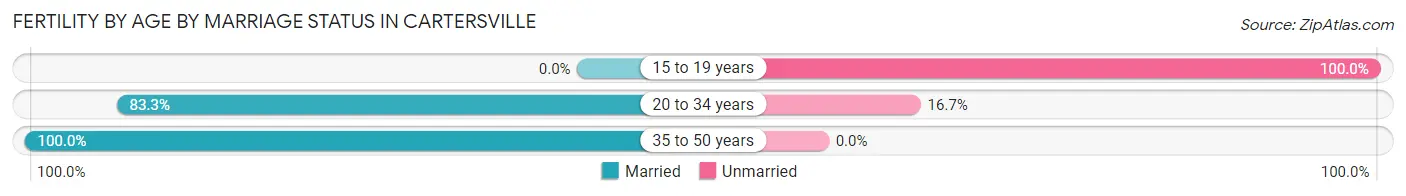
| Age Bracket | Married | Unmarried |
| 15 to 19 years | 0 (0.0%) | 24 (100.0%) |
| 20 to 34 years | 270 (83.3%) | 54 (16.7%) |
| 35 to 50 years | 115 (100.0%) | 0 (0.0%) |
| Total | 385 (83.2%) | 78 (16.9%) |
Fertility by Education in Cartersville
Average fertility rate in Cartersville is 93.0 births per 1,000 women. Women with the education attainment of college or associate's degree have the highest fertility rate of 138.0 births per 1,000 women, while women with the education attainment of less than high school have the lowest fertility at 46.0 births per 1,000 women. Women with the education attainment of high school diploma represent 38.9% of all women with births.
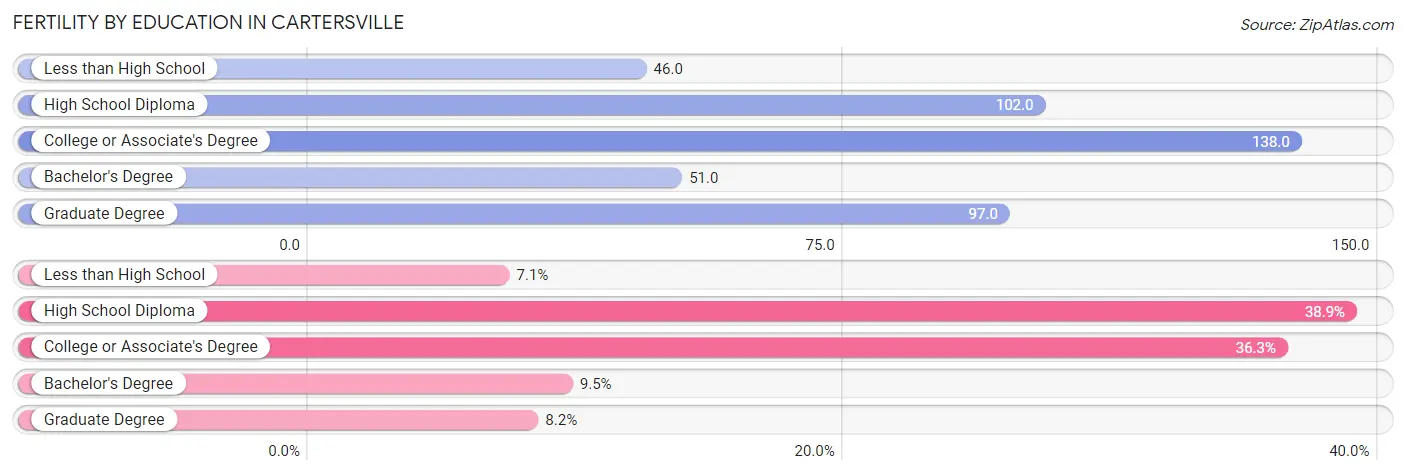
| Educational Attainment | Women with Births | Births / 1,000 Women |
| Less than High School | 33 (7.1%) | 46.0 |
| High School Diploma | 180 (38.9%) | 102.0 |
| College or Associate's Degree | 168 (36.3%) | 138.0 |
| Bachelor's Degree | 44 (9.5%) | 51.0 |
| Graduate Degree | 38 (8.2%) | 97.0 |
| Total | 463 (100.0%) | 93.0 |
Fertility by Education by Marriage Status in Cartersville
16.9% of women with births in Cartersville are unmarried. Women with the educational attainment of college or associate's degree are most likely to be married with 100.0% of them married at childbirth, while women with the educational attainment of less than high school are least likely to be married with 100.0% of them unmarried at childbirth.
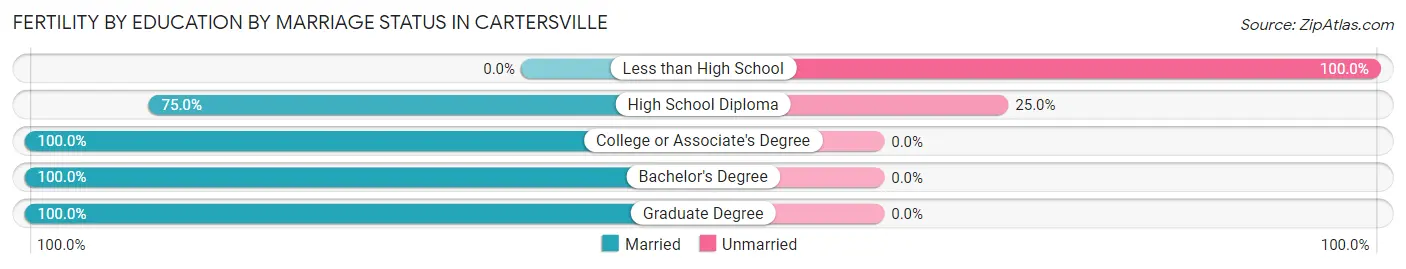
| Educational Attainment | Married | Unmarried |
| Less than High School | 0 (0.0%) | 33 (100.0%) |
| High School Diploma | 135 (75.0%) | 45 (25.0%) |
| College or Associate's Degree | 168 (100.0%) | 0 (0.0%) |
| Bachelor's Degree | 44 (100.0%) | 0 (0.0%) |
| Graduate Degree | 38 (100.0%) | 0 (0.0%) |
| Total | 385 (83.2%) | 78 (16.9%) |
Employment Characteristics in Cartersville
Employment by Class of Employer in Cartersville
Among the 10,913 employed individuals in Cartersville, private company employees (7,977 | 73.1%), local government employees (1,080 | 9.9%), and self-employed (incorporated) (655 | 6.0%) make up the most common classes of employment.
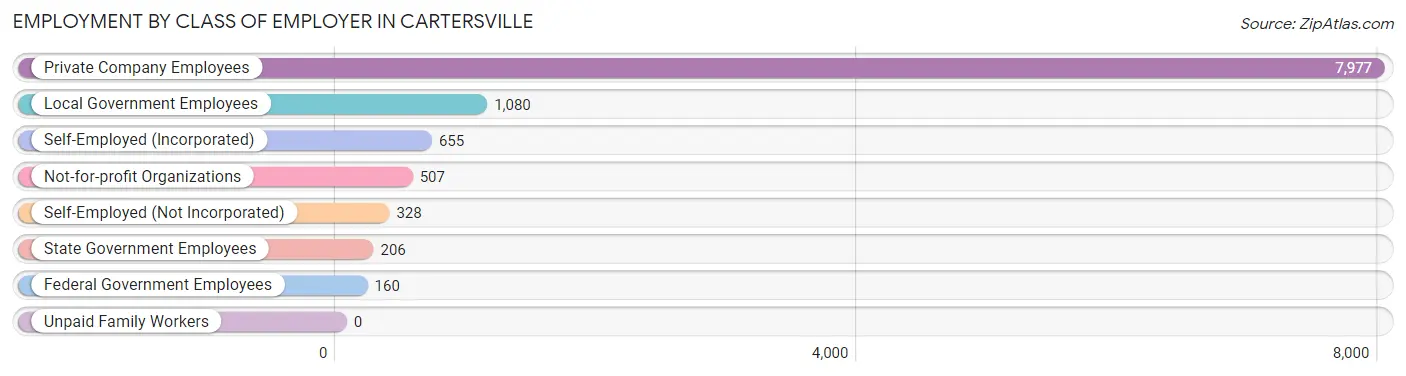
| Employer Class | # Employees | % Employees |
| Private Company Employees | 7,977 | 73.1% |
| Self-Employed (Incorporated) | 655 | 6.0% |
| Self-Employed (Not Incorporated) | 328 | 3.0% |
| Not-for-profit Organizations | 507 | 4.6% |
| Local Government Employees | 1,080 | 9.9% |
| State Government Employees | 206 | 1.9% |
| Federal Government Employees | 160 | 1.5% |
| Unpaid Family Workers | 0 | 0.0% |
| Total | 10,913 | 100.0% |
Employment Status by Age in Cartersville
According to the labor force statistics for Cartersville, out of the total population over 16 years of age (18,116), 63.2% or 11,449 individuals are in the labor force, with 2.8% or 321 of them unemployed. The age group with the highest labor force participation rate is 25 to 29 years, with 85.6% or 1,432 individuals in the labor force. Within the labor force, the 16 to 19 years age range has the highest percentage of unemployed individuals, with 25.2% or 170 of them being unemployed.
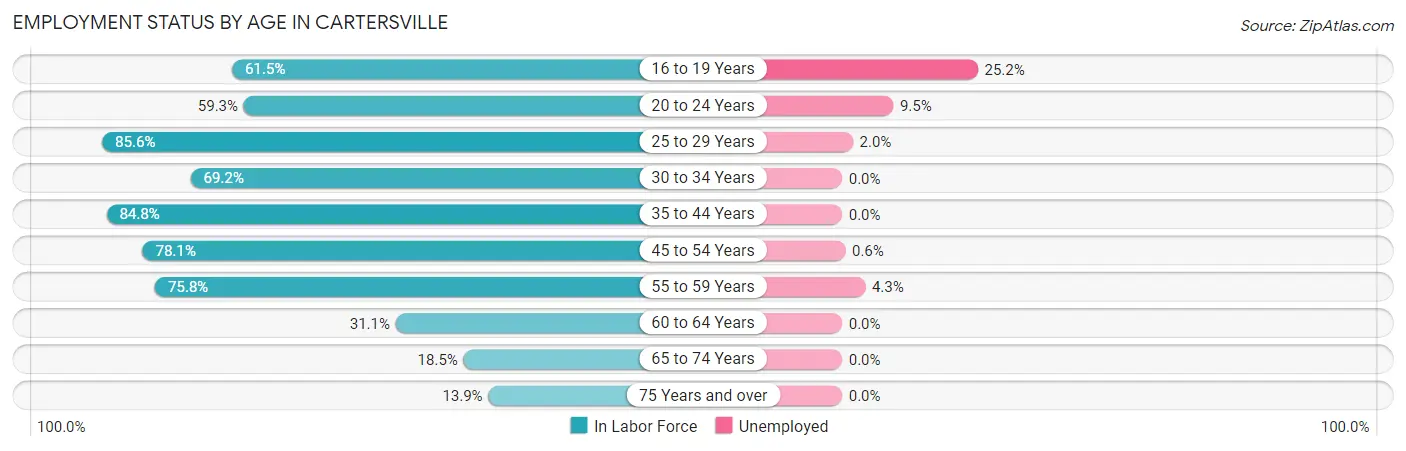
| Age Bracket | In Labor Force | Unemployed |
| 16 to 19 Years | 675 (61.5%) | 170 (25.2%) |
| 20 to 24 Years | 740 (59.3%) | 70 (9.5%) |
| 25 to 29 Years | 1,432 (85.6%) | 29 (2.0%) |
| 30 to 34 Years | 1,180 (69.2%) | 0 (0.0%) |
| 35 to 44 Years | 3,090 (84.8%) | 0 (0.0%) |
| 45 to 54 Years | 2,442 (78.1%) | 15 (0.6%) |
| 55 to 59 Years | 982 (75.8%) | 42 (4.3%) |
| 60 to 64 Years | 392 (31.1%) | 0 (0.0%) |
| 65 to 74 Years | 332 (18.5%) | 0 (0.0%) |
| 75 Years and over | 177 (13.9%) | 0 (0.0%) |
| Total | 11,449 (63.2%) | 321 (2.8%) |
Employment Status by Educational Attainment in Cartersville
According to labor force statistics for Cartersville, 74.9% of individuals (9,518) out of the total population between 25 and 64 years of age (12,707) are in the labor force, with 0.9% or 86 of them being unemployed. The group with the highest labor force participation rate are those with the educational attainment of bachelor's degree or higher, with 85.4% or 3,074 individuals in the labor force. Within the labor force, individuals with bachelor's degree or higher education have the highest percentage of unemployment, with 1.4% or 43 of them being unemployed.
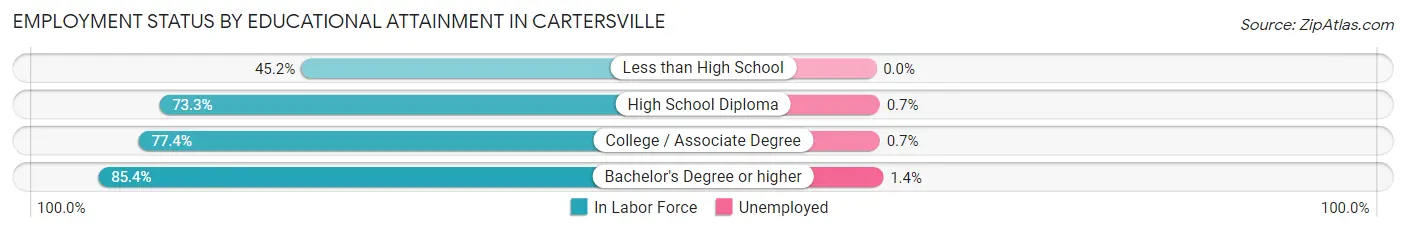
| Educational Attainment | In Labor Force | Unemployed |
| Less than High School | 602 (45.2%) | 0 (0.0%) |
| High School Diploma | 3,130 (73.3%) | 30 (0.7%) |
| College / Associate Degree | 2,714 (77.4%) | 25 (0.7%) |
| Bachelor's Degree or higher | 3,074 (85.4%) | 50 (1.4%) |
| Total | 9,518 (74.9%) | 114 (0.9%) |
Employment Occupations by Sex in Cartersville
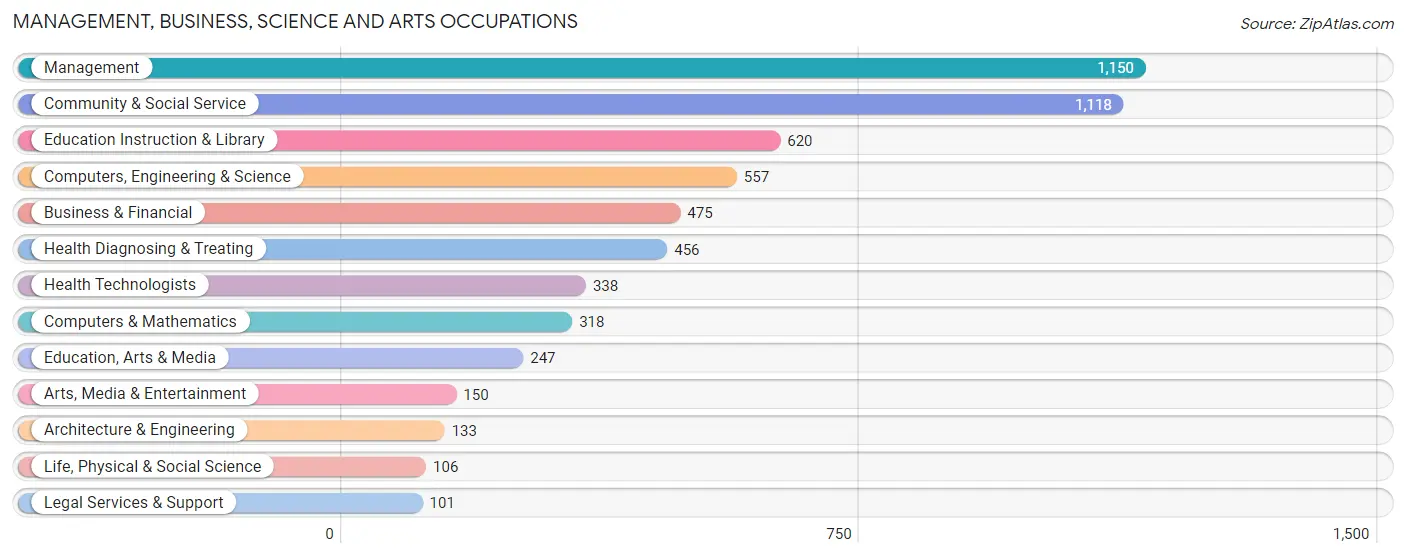
Management, Business, Science and Arts Occupations
The most common Management, Business, Science and Arts occupations in Cartersville are Management (1,150 | 10.3%), Community & Social Service (1,118 | 10.1%), Education Instruction & Library (620 | 5.6%), Computers, Engineering & Science (557 | 5.0%), and Business & Financial (475 | 4.3%).
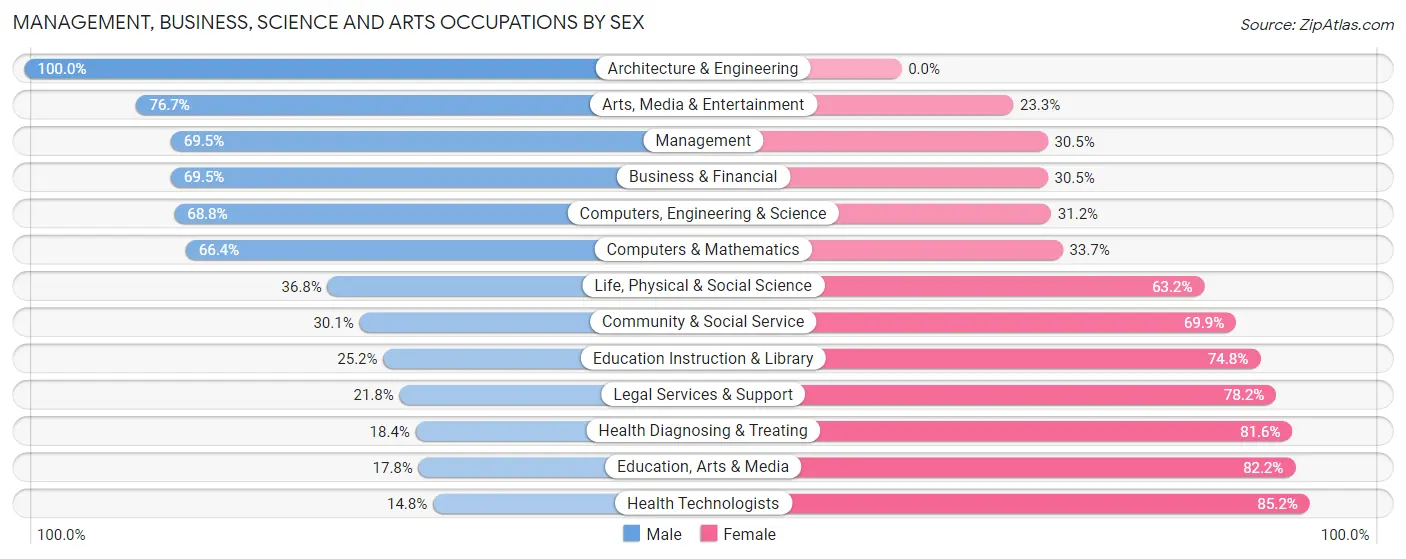
Management, Business, Science and Arts Occupations by Sex
Within the Management, Business, Science and Arts occupations in Cartersville, the most male-oriented occupations are Architecture & Engineering (100.0%), Arts, Media & Entertainment (76.7%), and Management (69.5%), while the most female-oriented occupations are Health Technologists (85.2%), Education, Arts & Media (82.2%), and Health Diagnosing & Treating (81.6%).
| Occupation | Male | Female |
| Management | 799 (69.5%) | 351 (30.5%) |
| Business & Financial | 330 (69.5%) | 145 (30.5%) |
| Computers, Engineering & Science | 383 (68.8%) | 174 (31.2%) |
| Computers & Mathematics | 211 (66.3%) | 107 (33.7%) |
| Architecture & Engineering | 133 (100.0%) | 0 (0.0%) |
| Life, Physical & Social Science | 39 (36.8%) | 67 (63.2%) |
| Community & Social Service | 337 (30.1%) | 781 (69.9%) |
| Education, Arts & Media | 44 (17.8%) | 203 (82.2%) |
| Legal Services & Support | 22 (21.8%) | 79 (78.2%) |
| Education Instruction & Library | 156 (25.2%) | 464 (74.8%) |
| Arts, Media & Entertainment | 115 (76.7%) | 35 (23.3%) |
| Health Diagnosing & Treating | 84 (18.4%) | 372 (81.6%) |
| Health Technologists | 50 (14.8%) | 288 (85.2%) |
| Total (Category) | 1,933 (51.5%) | 1,823 (48.5%) |
| Total (Overall) | 6,352 (57.1%) | 4,764 (42.9%) |
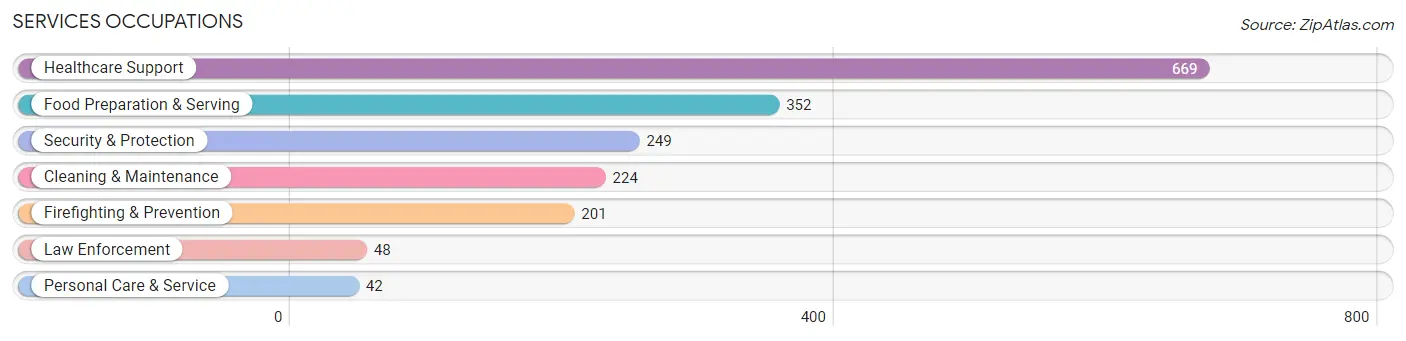
Services Occupations
The most common Services occupations in Cartersville are Healthcare Support (669 | 6.0%), Food Preparation & Serving (352 | 3.2%), Security & Protection (249 | 2.2%), Cleaning & Maintenance (224 | 2.0%), and Firefighting & Prevention (201 | 1.8%).
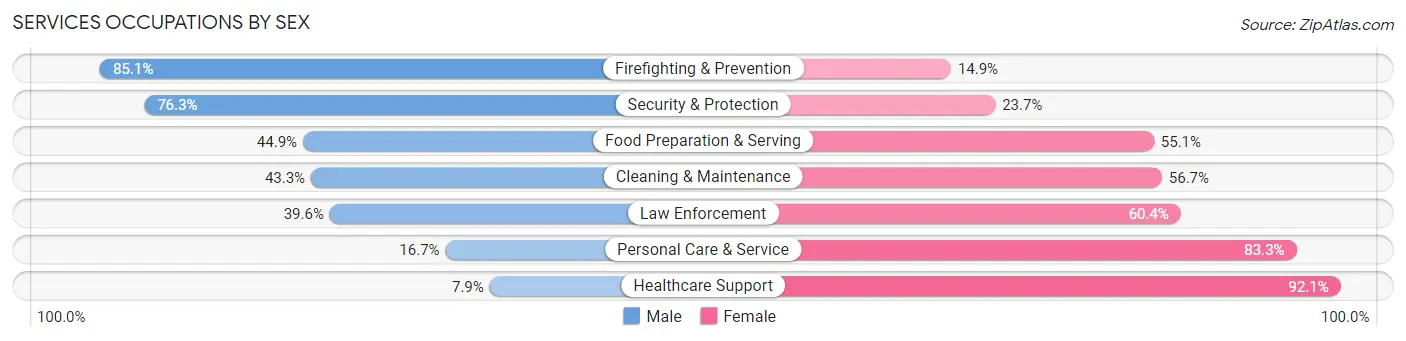
Services Occupations by Sex
Within the Services occupations in Cartersville, the most male-oriented occupations are Firefighting & Prevention (85.1%), Security & Protection (76.3%), and Food Preparation & Serving (44.9%), while the most female-oriented occupations are Healthcare Support (92.1%), Personal Care & Service (83.3%), and Law Enforcement (60.4%).
| Occupation | Male | Female |
| Healthcare Support | 53 (7.9%) | 616 (92.1%) |
| Security & Protection | 190 (76.3%) | 59 (23.7%) |
| Firefighting & Prevention | 171 (85.1%) | 30 (14.9%) |
| Law Enforcement | 19 (39.6%) | 29 (60.4%) |
| Food Preparation & Serving | 158 (44.9%) | 194 (55.1%) |
| Cleaning & Maintenance | 97 (43.3%) | 127 (56.7%) |
| Personal Care & Service | 7 (16.7%) | 35 (83.3%) |
| Total (Category) | 505 (32.9%) | 1,031 (67.1%) |
| Total (Overall) | 6,352 (57.1%) | 4,764 (42.9%) |
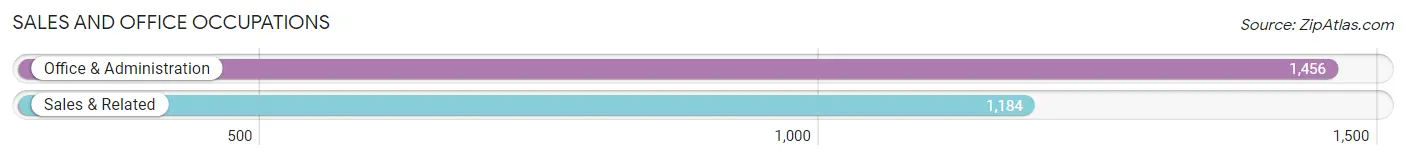
Sales and Office Occupations
The most common Sales and Office occupations in Cartersville are Office & Administration (1,456 | 13.1%), and Sales & Related (1,184 | 10.6%).
Sales and Office Occupations by Sex
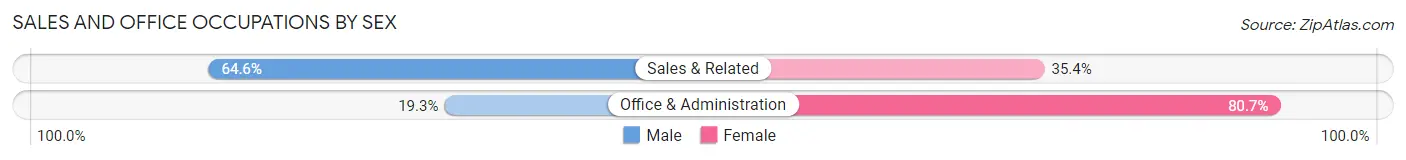
| Occupation | Male | Female |
| Sales & Related | 765 (64.6%) | 419 (35.4%) |
| Office & Administration | 281 (19.3%) | 1,175 (80.7%) |
| Total (Category) | 1,046 (39.6%) | 1,594 (60.4%) |
| Total (Overall) | 6,352 (57.1%) | 4,764 (42.9%) |
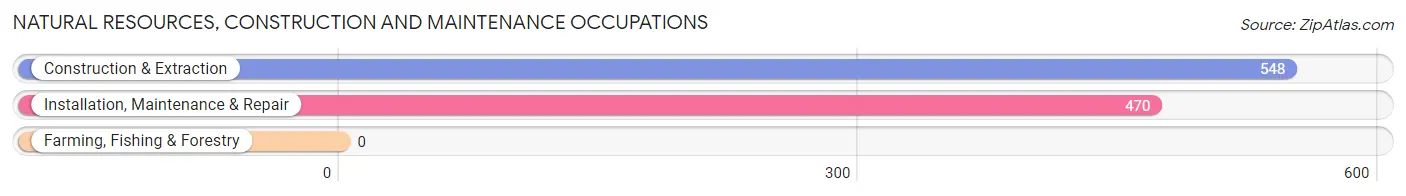
Natural Resources, Construction and Maintenance Occupations
The most common Natural Resources, Construction and Maintenance occupations in Cartersville are Construction & Extraction (548 | 4.9%), and Installation, Maintenance & Repair (470 | 4.2%).
Natural Resources, Construction and Maintenance Occupations by Sex
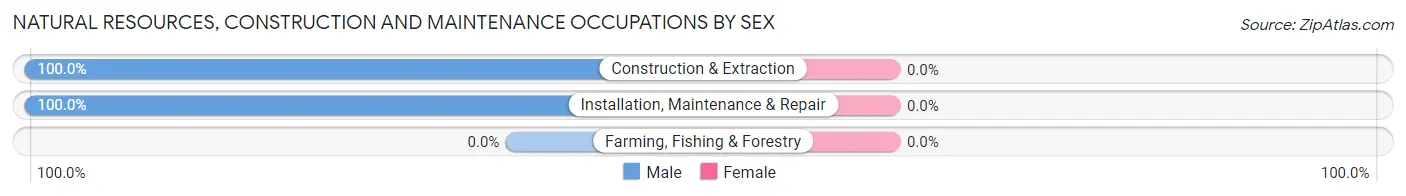
| Occupation | Male | Female |
| Farming, Fishing & Forestry | 0 (0.0%) | 0 (0.0%) |
| Construction & Extraction | 548 (100.0%) | 0 (0.0%) |
| Installation, Maintenance & Repair | 470 (100.0%) | 0 (0.0%) |
| Total (Category) | 1,018 (100.0%) | 0 (0.0%) |
| Total (Overall) | 6,352 (57.1%) | 4,764 (42.9%) |
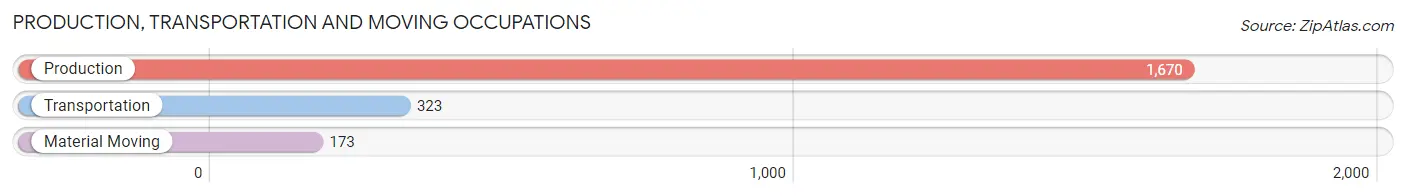
Production, Transportation and Moving Occupations
The most common Production, Transportation and Moving occupations in Cartersville are Production (1,670 | 15.0%), Transportation (323 | 2.9%), and Material Moving (173 | 1.6%).
Production, Transportation and Moving Occupations by Sex
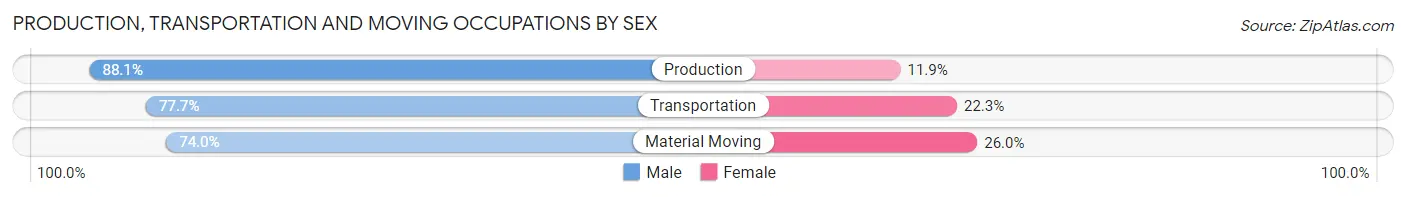
| Occupation | Male | Female |
| Production | 1,471 (88.1%) | 199 (11.9%) |
| Transportation | 251 (77.7%) | 72 (22.3%) |
| Material Moving | 128 (74.0%) | 45 (26.0%) |
| Total (Category) | 1,850 (85.4%) | 316 (14.6%) |
| Total (Overall) | 6,352 (57.1%) | 4,764 (42.9%) |
Employment Industries by Sex in Cartersville
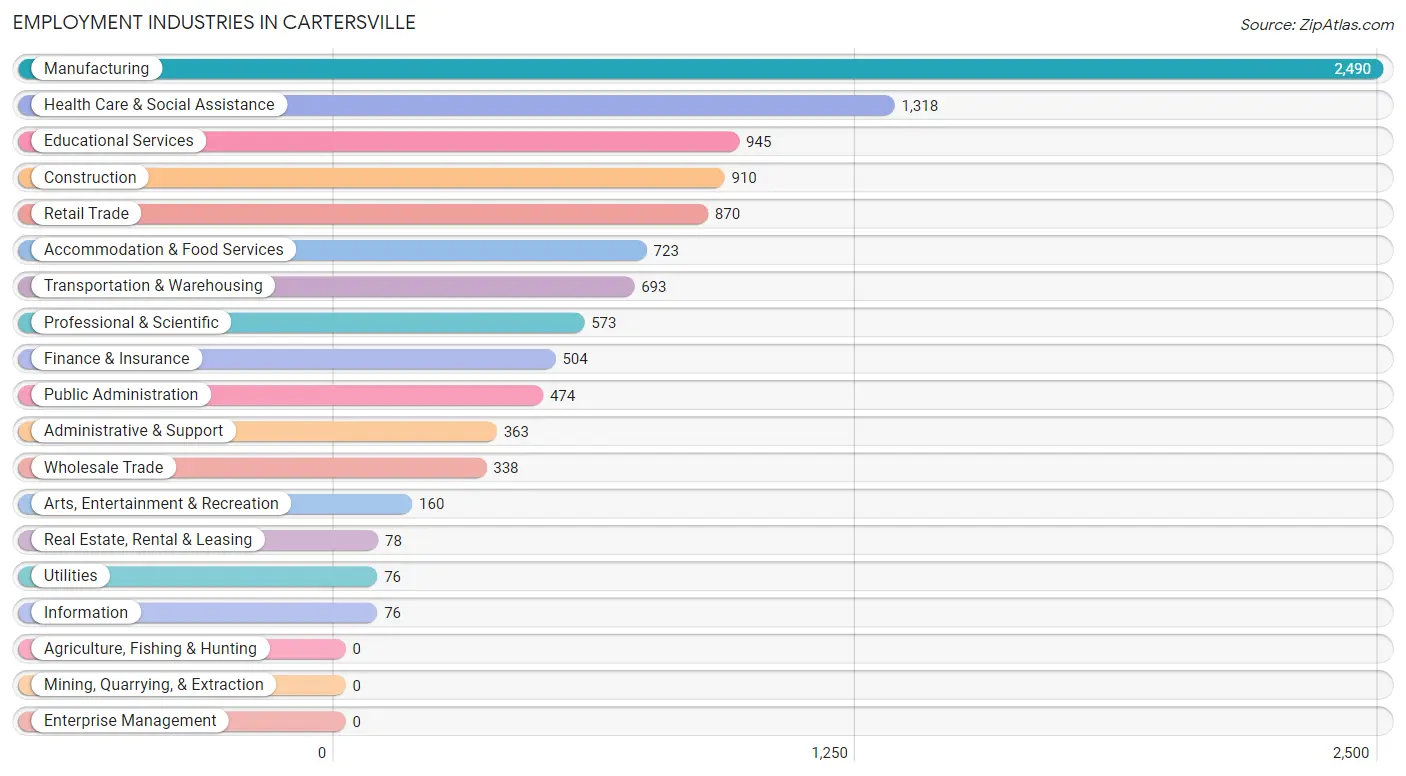
Employment Industries in Cartersville
The major employment industries in Cartersville include Manufacturing (2,490 | 22.4%), Health Care & Social Assistance (1,318 | 11.9%), Educational Services (945 | 8.5%), Construction (910 | 8.2%), and Retail Trade (870 | 7.8%).
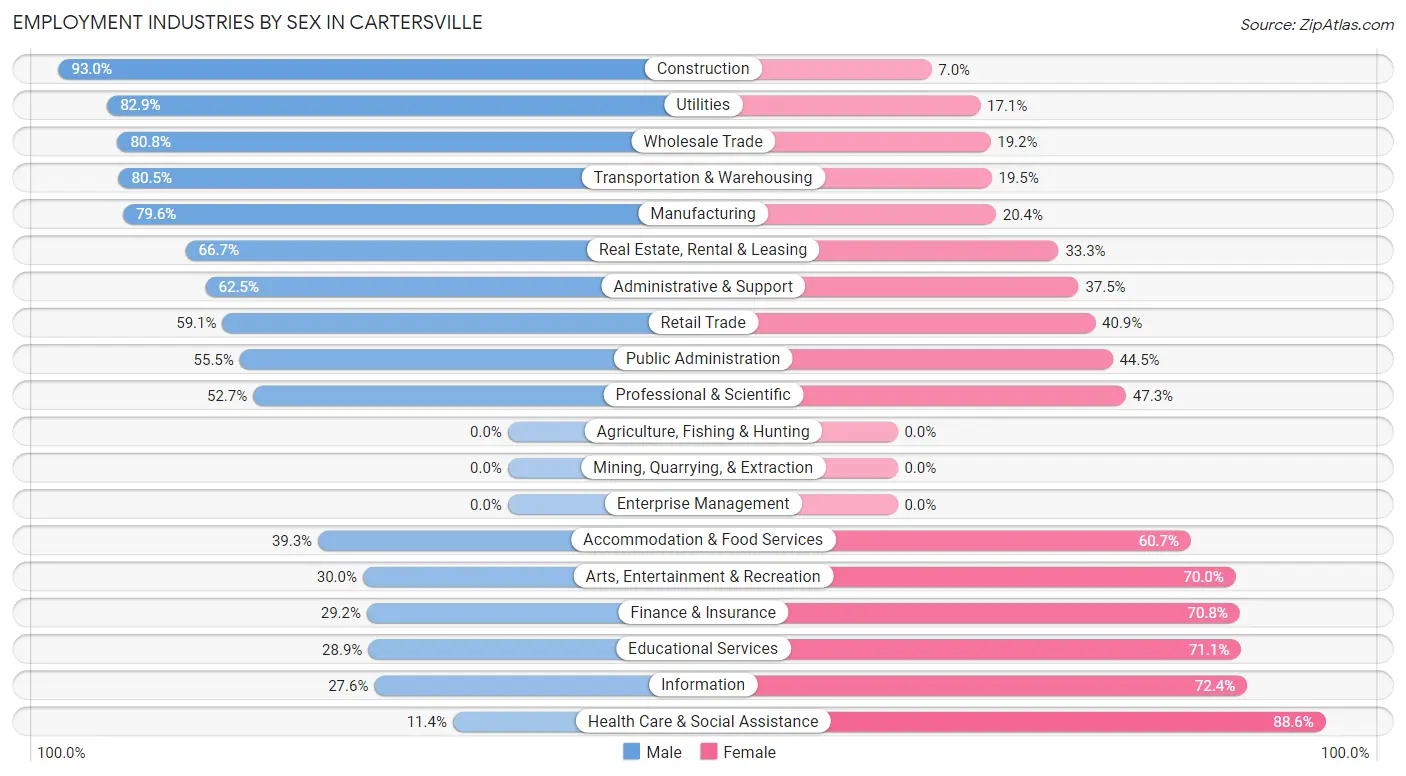
Employment Industries by Sex in Cartersville
The Cartersville industries that see more men than women are Construction (93.0%), Utilities (82.9%), and Wholesale Trade (80.8%), whereas the industries that tend to have a higher number of women are Health Care & Social Assistance (88.6%), Information (72.4%), and Educational Services (71.1%).
| Industry | Male | Female |
| Agriculture, Fishing & Hunting | 0 (0.0%) | 0 (0.0%) |
| Mining, Quarrying, & Extraction | 0 (0.0%) | 0 (0.0%) |
| Construction | 846 (93.0%) | 64 (7.0%) |
| Manufacturing | 1,983 (79.6%) | 507 (20.4%) |
| Wholesale Trade | 273 (80.8%) | 65 (19.2%) |
| Retail Trade | 514 (59.1%) | 356 (40.9%) |
| Transportation & Warehousing | 558 (80.5%) | 135 (19.5%) |
| Utilities | 63 (82.9%) | 13 (17.1%) |
| Information | 21 (27.6%) | 55 (72.4%) |
| Finance & Insurance | 147 (29.2%) | 357 (70.8%) |
| Real Estate, Rental & Leasing | 52 (66.7%) | 26 (33.3%) |
| Professional & Scientific | 302 (52.7%) | 271 (47.3%) |
| Enterprise Management | 0 (0.0%) | 0 (0.0%) |
| Administrative & Support | 227 (62.5%) | 136 (37.5%) |
| Educational Services | 273 (28.9%) | 672 (71.1%) |
| Health Care & Social Assistance | 150 (11.4%) | 1,168 (88.6%) |
| Arts, Entertainment & Recreation | 48 (30.0%) | 112 (70.0%) |
| Accommodation & Food Services | 284 (39.3%) | 439 (60.7%) |
| Public Administration | 263 (55.5%) | 211 (44.5%) |
| Total | 6,352 (57.1%) | 4,764 (42.9%) |
Education in Cartersville
School Enrollment in Cartersville
The most common levels of schooling among the 4,822 students in Cartersville are elementary school (1,232 | 25.6%), high school (1,231 | 25.5%), and middle school (1,137 | 23.6%).
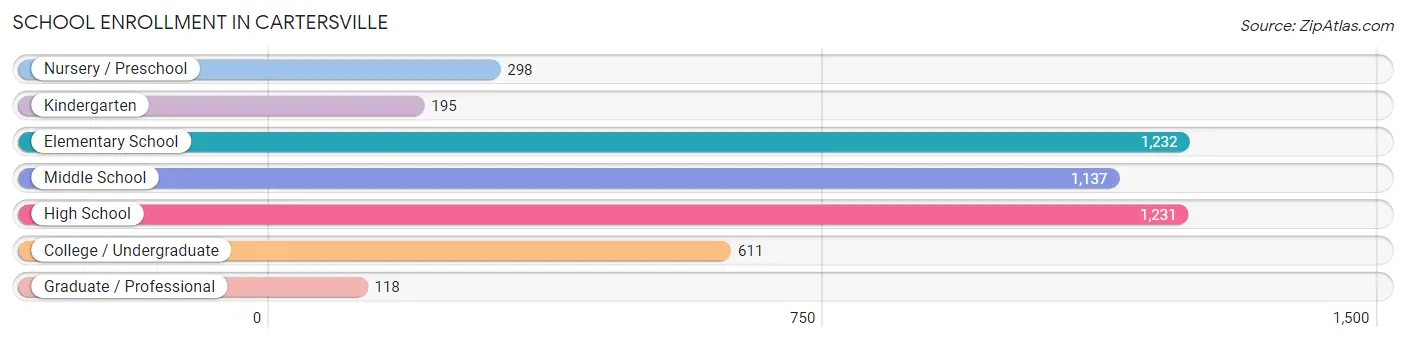
| School Level | # Students | % Students |
| Nursery / Preschool | 298 | 6.2% |
| Kindergarten | 195 | 4.0% |
| Elementary School | 1,232 | 25.6% |
| Middle School | 1,137 | 23.6% |
| High School | 1,231 | 25.5% |
| College / Undergraduate | 611 | 12.7% |
| Graduate / Professional | 118 | 2.5% |
| Total | 4,822 | 100.0% |
School Enrollment by Age by Funding Source in Cartersville
Out of a total of 4,822 students who are enrolled in schools in Cartersville, 665 (13.8%) attend a private institution, while the remaining 4,157 (86.2%) are enrolled in public schools. The age group of 3 to 4 year olds has the highest likelihood of being enrolled in private schools, with 127 (46.0% in the age bracket) enrolled. Conversely, the age group of 20 to 24 year olds has the lowest likelihood of being enrolled in a private school, with 298 (100.0% in the age bracket) attending a public institution.
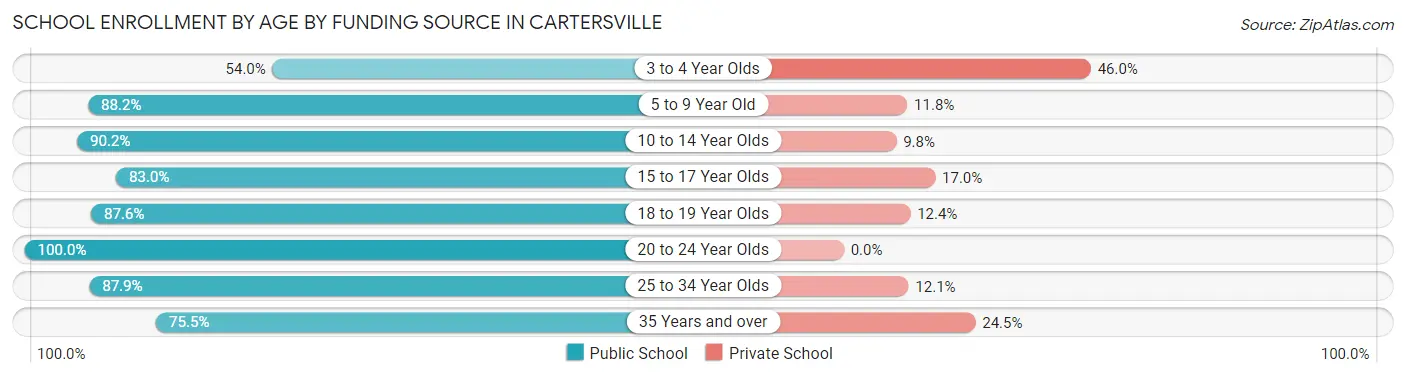
| Age Bracket | Public School | Private School |
| 3 to 4 Year Olds | 149 (54.0%) | 127 (46.0%) |
| 5 to 9 Year Old | 1,126 (88.2%) | 151 (11.8%) |
| 10 to 14 Year Olds | 1,347 (90.2%) | 146 (9.8%) |
| 15 to 17 Year Olds | 604 (83.0%) | 124 (17.0%) |
| 18 to 19 Year Olds | 304 (87.6%) | 43 (12.4%) |
| 20 to 24 Year Olds | 298 (100.0%) | 0 (0.0%) |
| 25 to 34 Year Olds | 175 (87.9%) | 24 (12.1%) |
| 35 Years and over | 154 (75.5%) | 50 (24.5%) |
| Total | 4,157 (86.2%) | 665 (13.8%) |
Educational Attainment by Field of Study in Cartersville
Business (1,064 | 23.3%), education (812 | 17.8%), science & technology (412 | 9.0%), bio, nature & agricultural (262 | 5.7%), and computers & mathematics (256 | 5.6%) are the most common fields of study among 4,569 individuals in Cartersville who have obtained a bachelor's degree or higher.
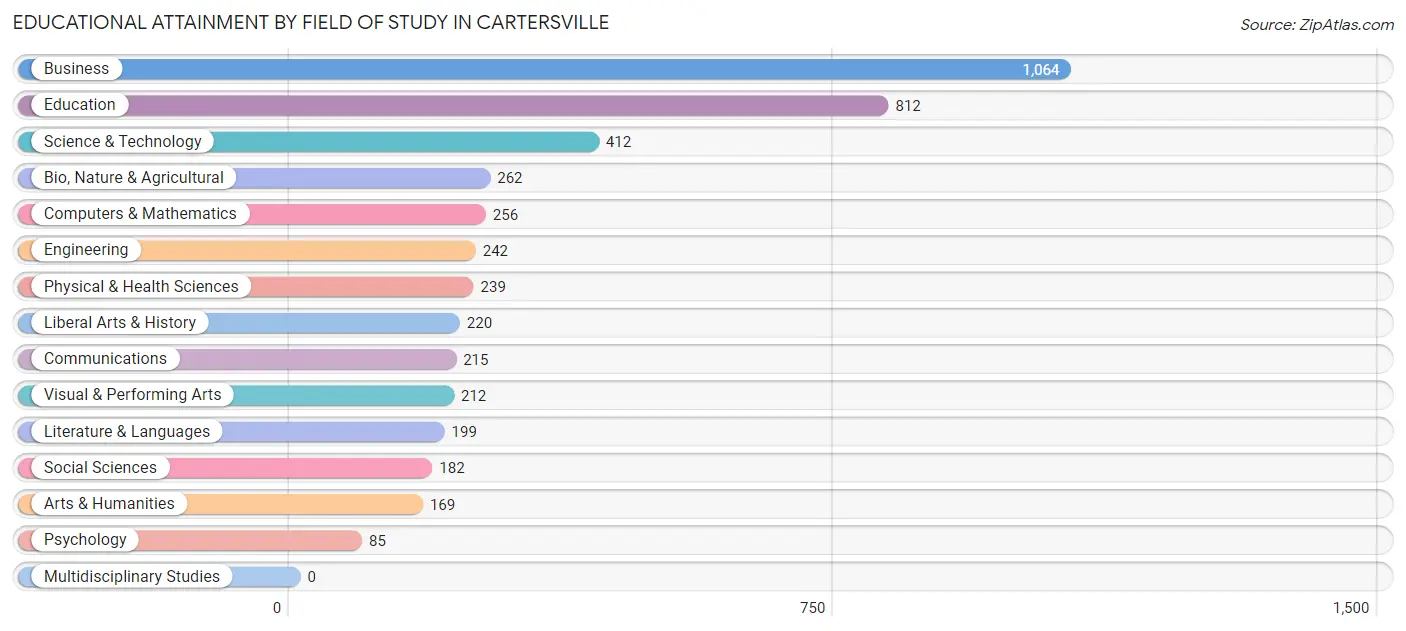
| Field of Study | # Graduates | % Graduates |
| Computers & Mathematics | 256 | 5.6% |
| Bio, Nature & Agricultural | 262 | 5.7% |
| Physical & Health Sciences | 239 | 5.2% |
| Psychology | 85 | 1.9% |
| Social Sciences | 182 | 4.0% |
| Engineering | 242 | 5.3% |
| Multidisciplinary Studies | 0 | 0.0% |
| Science & Technology | 412 | 9.0% |
| Business | 1,064 | 23.3% |
| Education | 812 | 17.8% |
| Literature & Languages | 199 | 4.4% |
| Liberal Arts & History | 220 | 4.8% |
| Visual & Performing Arts | 212 | 4.6% |
| Communications | 215 | 4.7% |
| Arts & Humanities | 169 | 3.7% |
| Total | 4,569 | 100.0% |
Transportation & Commute in Cartersville
Vehicle Availability by Sex in Cartersville
The most prevalent vehicle ownership categories in Cartersville are males with 2 vehicles (2,215, accounting for 35.4%) and females with 2 vehicles (2,167, making up 47.8%).
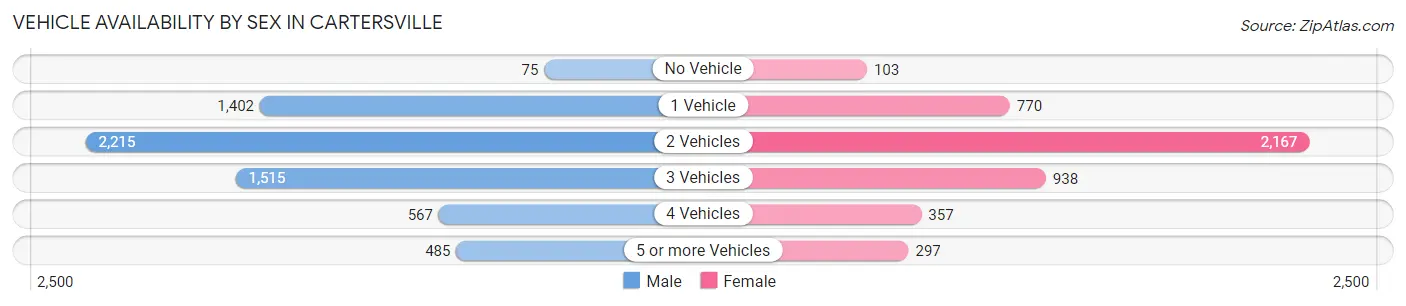
| Vehicles Available | Male | Female |
| No Vehicle | 75 (1.2%) | 103 (2.2%) |
| 1 Vehicle | 1,402 (22.4%) | 770 (16.6%) |
| 2 Vehicles | 2,215 (35.4%) | 2,167 (46.8%) |
| 3 Vehicles | 1,515 (24.2%) | 938 (20.3%) |
| 4 Vehicles | 567 (9.1%) | 357 (7.7%) |
| 5 or more Vehicles | 485 (7.7%) | 297 (6.4%) |
| Total | 6,259 (100.0%) | 4,632 (100.0%) |
Commute Time in Cartersville
The most frequently occuring commute durations in Cartersville are 5 to 9 minutes (1,665 commuters, 16.5%), 10 to 14 minutes (1,620 commuters, 16.1%), and 15 to 19 minutes (1,484 commuters, 14.7%).
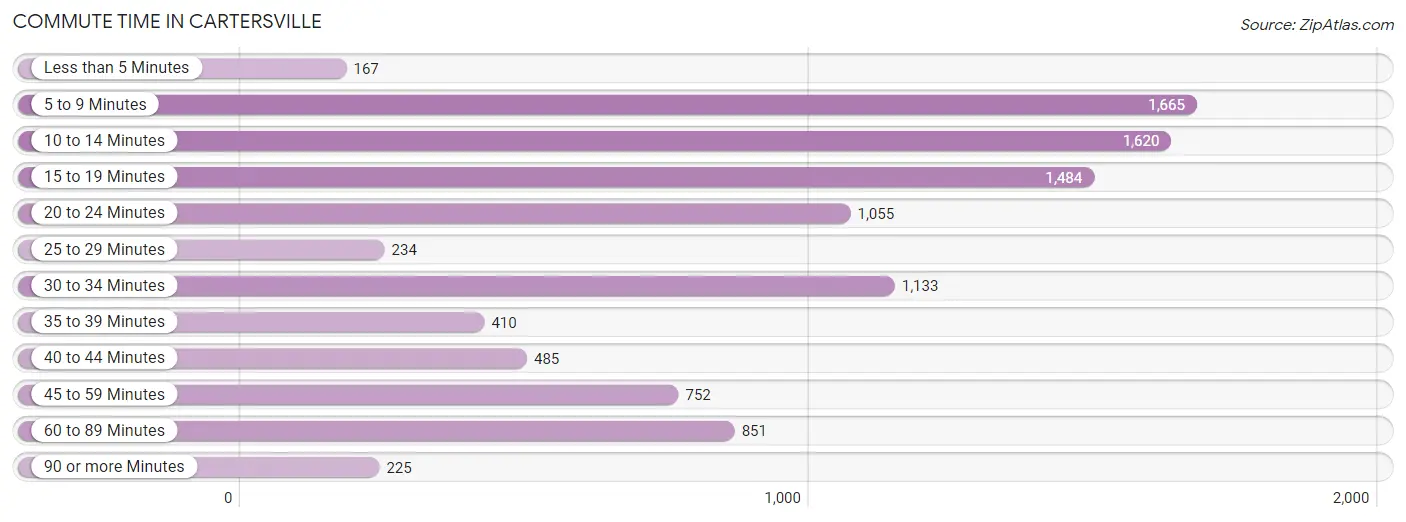
| Commute Time | # Commuters | % Commuters |
| Less than 5 Minutes | 167 | 1.7% |
| 5 to 9 Minutes | 1,665 | 16.5% |
| 10 to 14 Minutes | 1,620 | 16.1% |
| 15 to 19 Minutes | 1,484 | 14.7% |
| 20 to 24 Minutes | 1,055 | 10.5% |
| 25 to 29 Minutes | 234 | 2.3% |
| 30 to 34 Minutes | 1,133 | 11.2% |
| 35 to 39 Minutes | 410 | 4.1% |
| 40 to 44 Minutes | 485 | 4.8% |
| 45 to 59 Minutes | 752 | 7.5% |
| 60 to 89 Minutes | 851 | 8.4% |
| 90 or more Minutes | 225 | 2.2% |
Commute Time by Sex in Cartersville
The most common commute times in Cartersville are 5 to 9 minutes (873 commuters, 15.0%) for males and 10 to 14 minutes (821 commuters, 19.2%) for females.
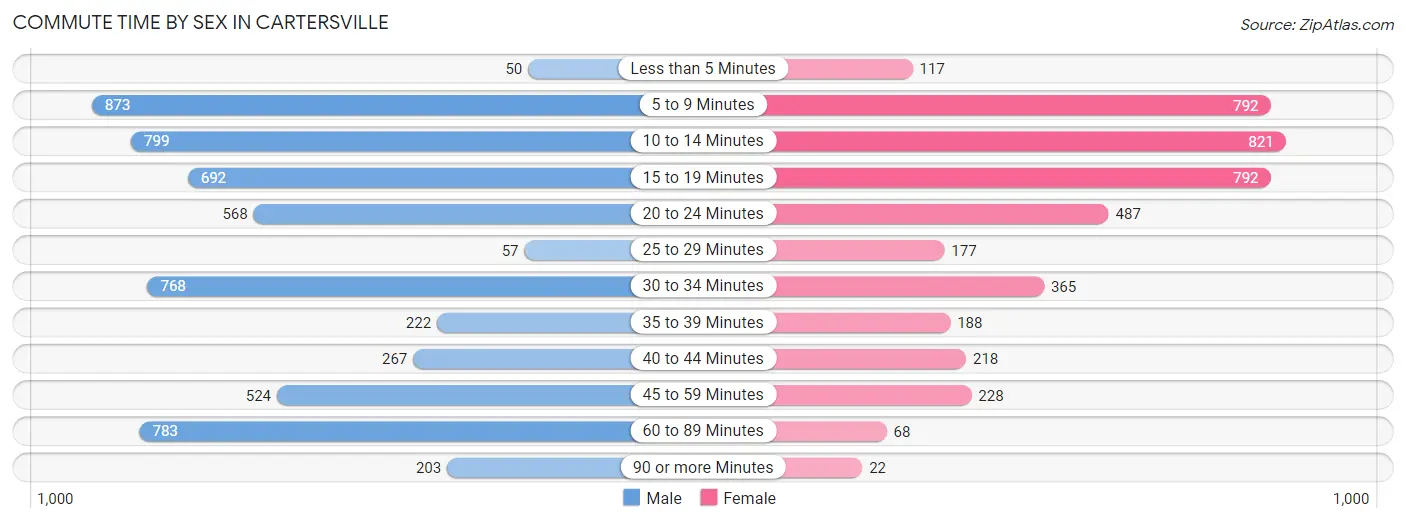
| Commute Time | Male | Female |
| Less than 5 Minutes | 50 (0.9%) | 117 (2.7%) |
| 5 to 9 Minutes | 873 (15.0%) | 792 (18.5%) |
| 10 to 14 Minutes | 799 (13.8%) | 821 (19.2%) |
| 15 to 19 Minutes | 692 (11.9%) | 792 (18.5%) |
| 20 to 24 Minutes | 568 (9.8%) | 487 (11.4%) |
| 25 to 29 Minutes | 57 (1.0%) | 177 (4.1%) |
| 30 to 34 Minutes | 768 (13.2%) | 365 (8.5%) |
| 35 to 39 Minutes | 222 (3.8%) | 188 (4.4%) |
| 40 to 44 Minutes | 267 (4.6%) | 218 (5.1%) |
| 45 to 59 Minutes | 524 (9.0%) | 228 (5.3%) |
| 60 to 89 Minutes | 783 (13.5%) | 68 (1.6%) |
| 90 or more Minutes | 203 (3.5%) | 22 (0.5%) |
Time of Departure to Work by Sex in Cartersville
The most frequent times of departure to work in Cartersville are 7:00 AM to 7:29 AM (1,052, 18.1%) for males and 7:00 AM to 7:29 AM (1,117, 26.1%) for females.
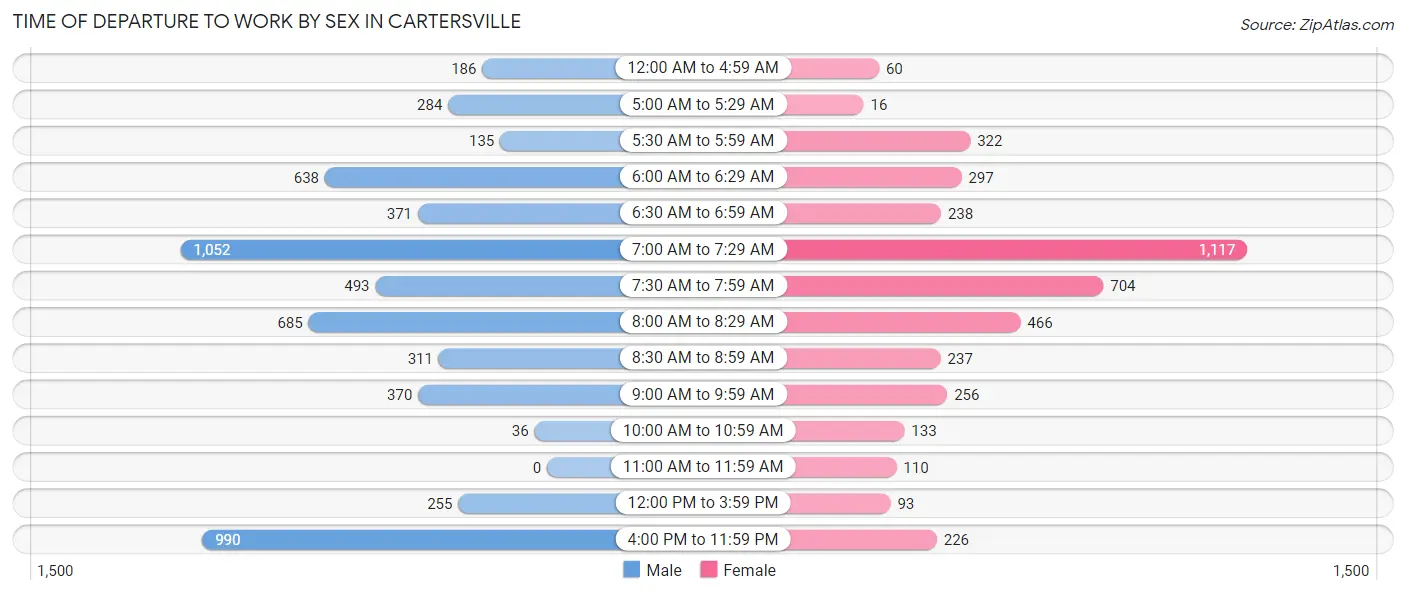
| Time of Departure | Male | Female |
| 12:00 AM to 4:59 AM | 186 (3.2%) | 60 (1.4%) |
| 5:00 AM to 5:29 AM | 284 (4.9%) | 16 (0.4%) |
| 5:30 AM to 5:59 AM | 135 (2.3%) | 322 (7.5%) |
| 6:00 AM to 6:29 AM | 638 (11.0%) | 297 (7.0%) |
| 6:30 AM to 6:59 AM | 371 (6.4%) | 238 (5.6%) |
| 7:00 AM to 7:29 AM | 1,052 (18.1%) | 1,117 (26.1%) |
| 7:30 AM to 7:59 AM | 493 (8.5%) | 704 (16.5%) |
| 8:00 AM to 8:29 AM | 685 (11.8%) | 466 (10.9%) |
| 8:30 AM to 8:59 AM | 311 (5.4%) | 237 (5.5%) |
| 9:00 AM to 9:59 AM | 370 (6.4%) | 256 (6.0%) |
| 10:00 AM to 10:59 AM | 36 (0.6%) | 133 (3.1%) |
| 11:00 AM to 11:59 AM | 0 (0.0%) | 110 (2.6%) |
| 12:00 PM to 3:59 PM | 255 (4.4%) | 93 (2.2%) |
| 4:00 PM to 11:59 PM | 990 (17.1%) | 226 (5.3%) |
| Total | 5,806 (100.0%) | 4,275 (100.0%) |
Housing Occupancy in Cartersville
Occupancy by Ownership in Cartersville
Of the total 8,667 dwellings in Cartersville, owner-occupied units account for 5,251 (60.6%), while renter-occupied units make up 3,416 (39.4%).
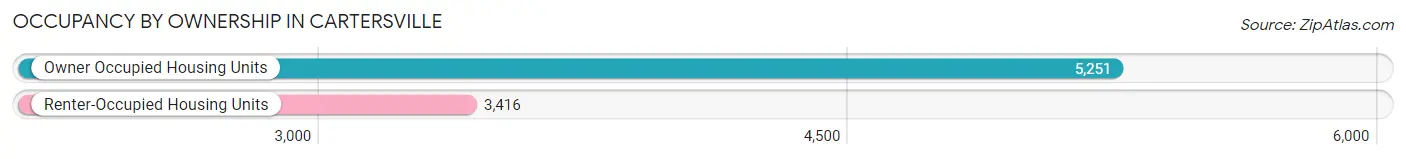
| Occupancy | # Housing Units | % Housing Units |
| Owner Occupied Housing Units | 5,251 | 60.6% |
| Renter-Occupied Housing Units | 3,416 | 39.4% |
| Total Occupied Housing Units | 8,667 | 100.0% |
Occupancy by Household Size in Cartersville
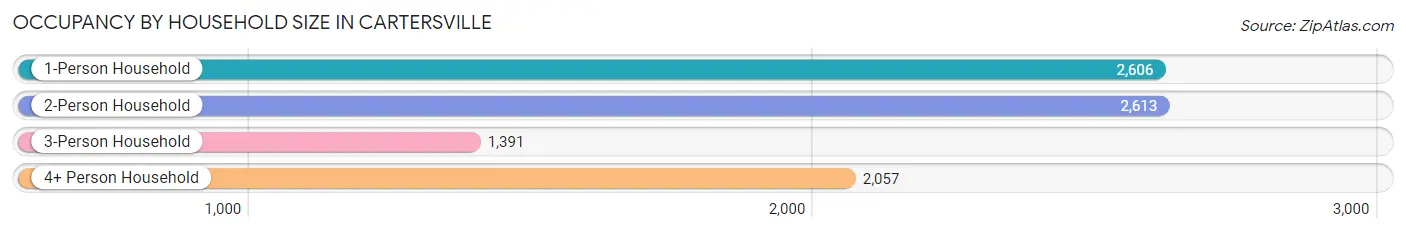
| Household Size | # Housing Units | % Housing Units |
| 1-Person Household | 2,606 | 30.1% |
| 2-Person Household | 2,613 | 30.1% |
| 3-Person Household | 1,391 | 16.1% |
| 4+ Person Household | 2,057 | 23.7% |
| Total Housing Units | 8,667 | 100.0% |
Occupancy by Ownership by Household Size in Cartersville
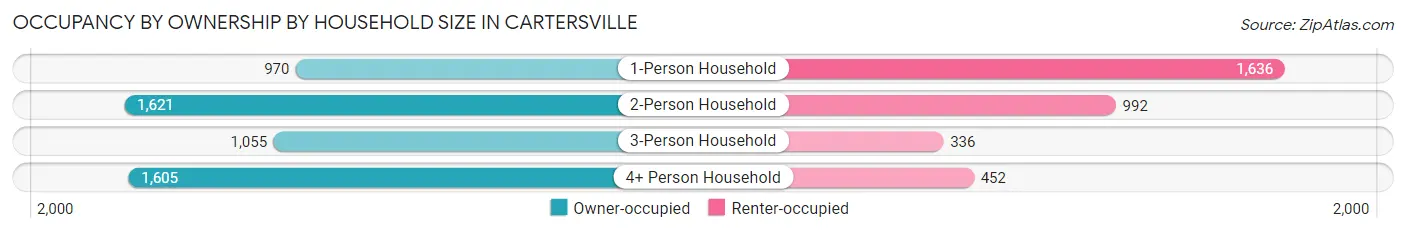
| Household Size | Owner-occupied | Renter-occupied |
| 1-Person Household | 970 (37.2%) | 1,636 (62.8%) |
| 2-Person Household | 1,621 (62.0%) | 992 (38.0%) |
| 3-Person Household | 1,055 (75.8%) | 336 (24.2%) |
| 4+ Person Household | 1,605 (78.0%) | 452 (22.0%) |
| Total Housing Units | 5,251 (60.6%) | 3,416 (39.4%) |
Occupancy by Educational Attainment in Cartersville
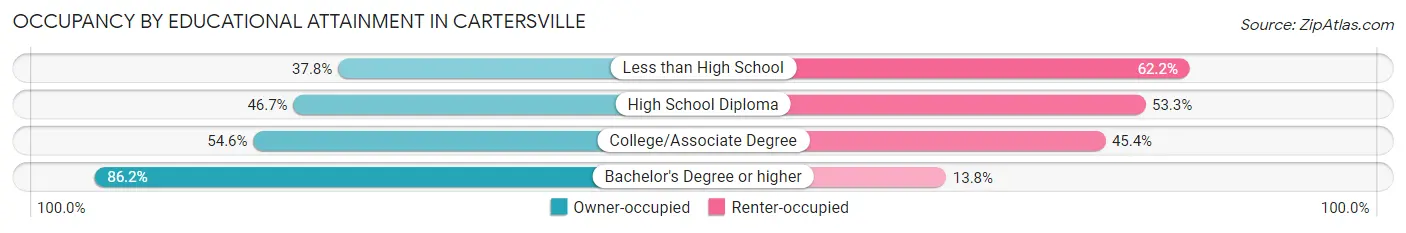
| Household Size | Owner-occupied | Renter-occupied |
| Less than High School | 207 (37.8%) | 340 (62.2%) |
| High School Diploma | 1,394 (46.7%) | 1,591 (53.3%) |
| College/Associate Degree | 1,343 (54.6%) | 1,115 (45.4%) |
| Bachelor's Degree or higher | 2,307 (86.2%) | 370 (13.8%) |
Occupancy by Age of Householder in Cartersville
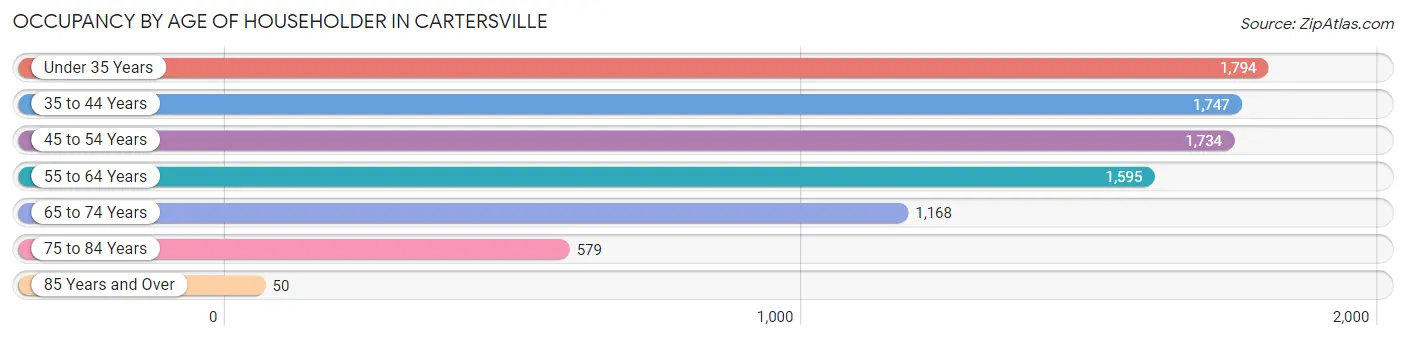
| Age Bracket | # Households | % Households |
| Under 35 Years | 1,794 | 20.7% |
| 35 to 44 Years | 1,747 | 20.2% |
| 45 to 54 Years | 1,734 | 20.0% |
| 55 to 64 Years | 1,595 | 18.4% |
| 65 to 74 Years | 1,168 | 13.5% |
| 75 to 84 Years | 579 | 6.7% |
| 85 Years and Over | 50 | 0.6% |
| Total | 8,667 | 100.0% |
Housing Finances in Cartersville
Median Income by Occupancy in Cartersville
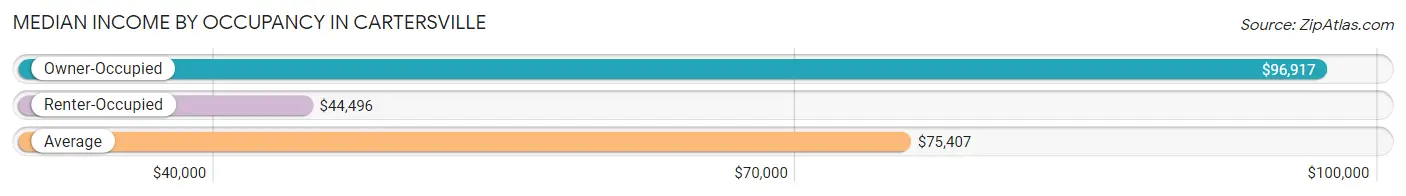
| Occupancy Type | # Households | Median Income |
| Owner-Occupied | 5,251 (60.6%) | $96,917 |
| Renter-Occupied | 3,416 (39.4%) | $44,496 |
| Average | 8,667 (100.0%) | $75,407 |
Occupancy by Householder Income Bracket in Cartersville
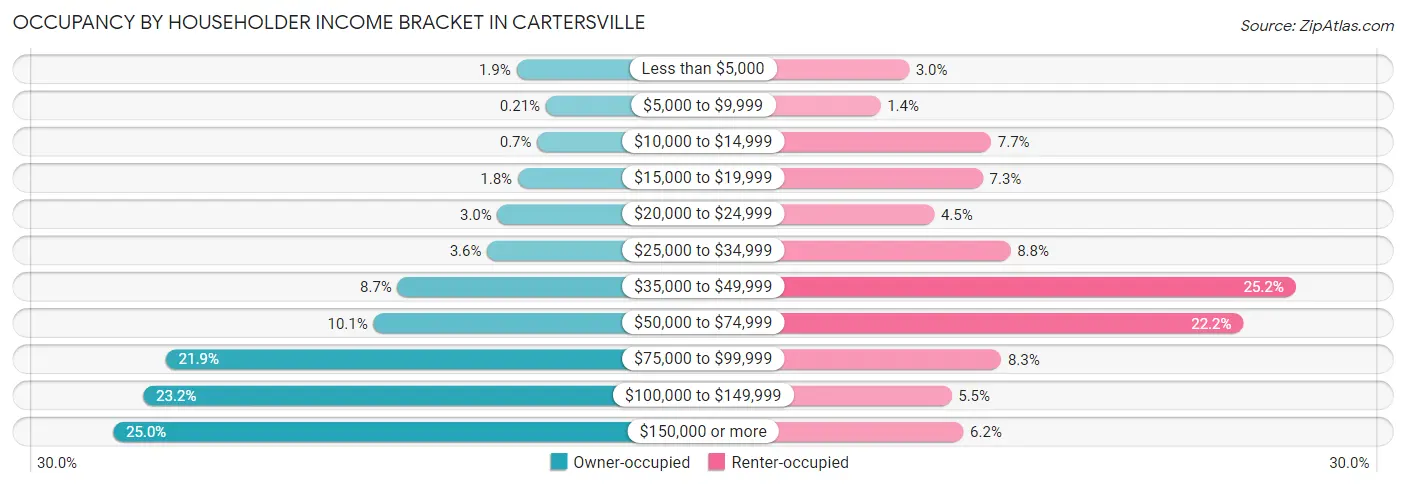
| Income Bracket | Owner-occupied | Renter-occupied |
| Less than $5,000 | 99 (1.9%) | 104 (3.0%) |
| $5,000 to $9,999 | 11 (0.2%) | 48 (1.4%) |
| $10,000 to $14,999 | 37 (0.7%) | 264 (7.7%) |
| $15,000 to $19,999 | 95 (1.8%) | 248 (7.3%) |
| $20,000 to $24,999 | 156 (3.0%) | 153 (4.5%) |
| $25,000 to $34,999 | 187 (3.6%) | 302 (8.8%) |
| $35,000 to $49,999 | 456 (8.7%) | 859 (25.2%) |
| $50,000 to $74,999 | 528 (10.1%) | 757 (22.2%) |
| $75,000 to $99,999 | 1,152 (21.9%) | 284 (8.3%) |
| $100,000 to $149,999 | 1,220 (23.2%) | 187 (5.5%) |
| $150,000 or more | 1,310 (24.9%) | 210 (6.1%) |
| Total | 5,251 (100.0%) | 3,416 (100.0%) |
Monthly Housing Cost Tiers in Cartersville
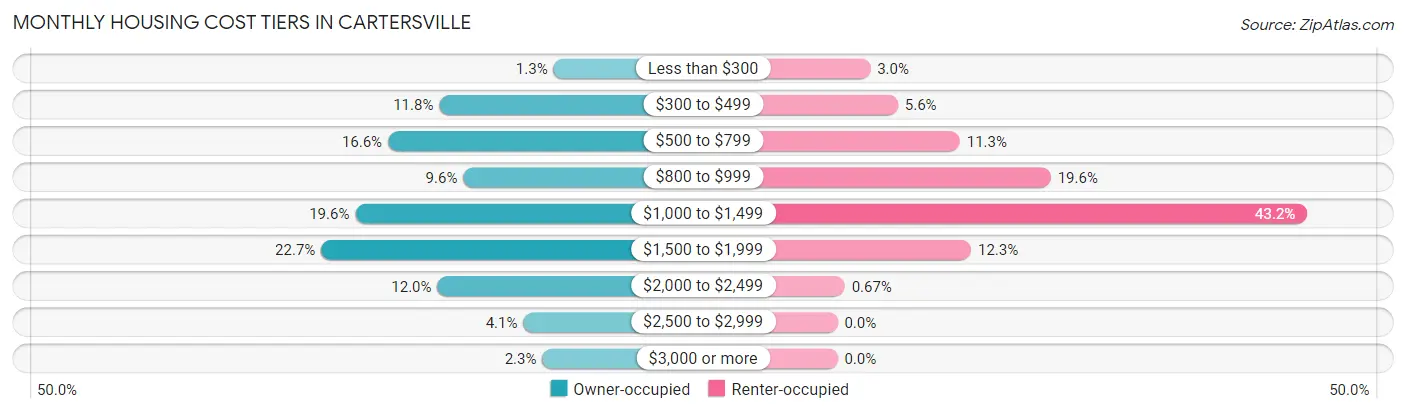
| Monthly Cost | Owner-occupied | Renter-occupied |
| Less than $300 | 69 (1.3%) | 103 (3.0%) |
| $300 to $499 | 621 (11.8%) | 190 (5.6%) |
| $500 to $799 | 869 (16.6%) | 385 (11.3%) |
| $800 to $999 | 505 (9.6%) | 671 (19.6%) |
| $1,000 to $1,499 | 1,027 (19.6%) | 1,477 (43.2%) |
| $1,500 to $1,999 | 1,192 (22.7%) | 420 (12.3%) |
| $2,000 to $2,499 | 630 (12.0%) | 23 (0.7%) |
| $2,500 to $2,999 | 215 (4.1%) | 0 (0.0%) |
| $3,000 or more | 123 (2.3%) | 0 (0.0%) |
| Total | 5,251 (100.0%) | 3,416 (100.0%) |
Physical Housing Characteristics in Cartersville
Housing Structures in Cartersville
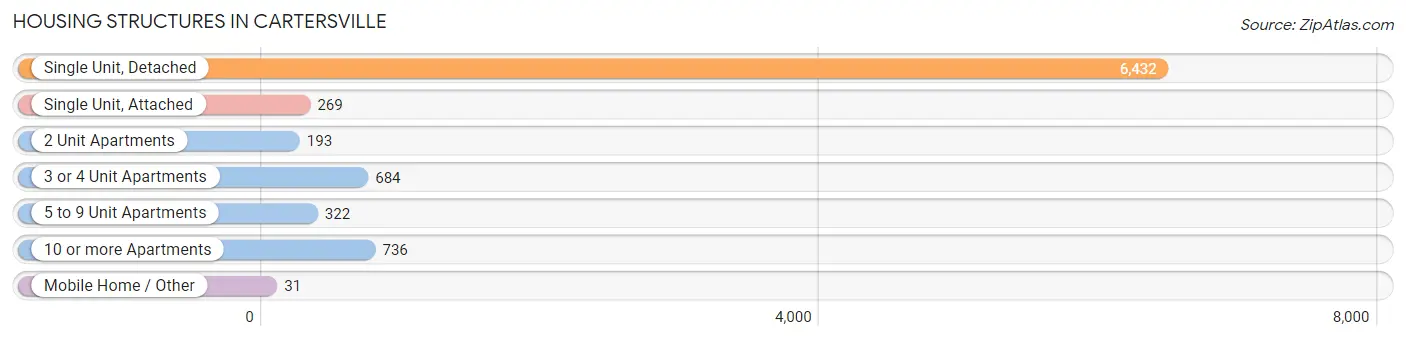
| Structure Type | # Housing Units | % Housing Units |
| Single Unit, Detached | 6,432 | 74.2% |
| Single Unit, Attached | 269 | 3.1% |
| 2 Unit Apartments | 193 | 2.2% |
| 3 or 4 Unit Apartments | 684 | 7.9% |
| 5 to 9 Unit Apartments | 322 | 3.7% |
| 10 or more Apartments | 736 | 8.5% |
| Mobile Home / Other | 31 | 0.4% |
| Total | 8,667 | 100.0% |
Housing Structures by Occupancy in Cartersville
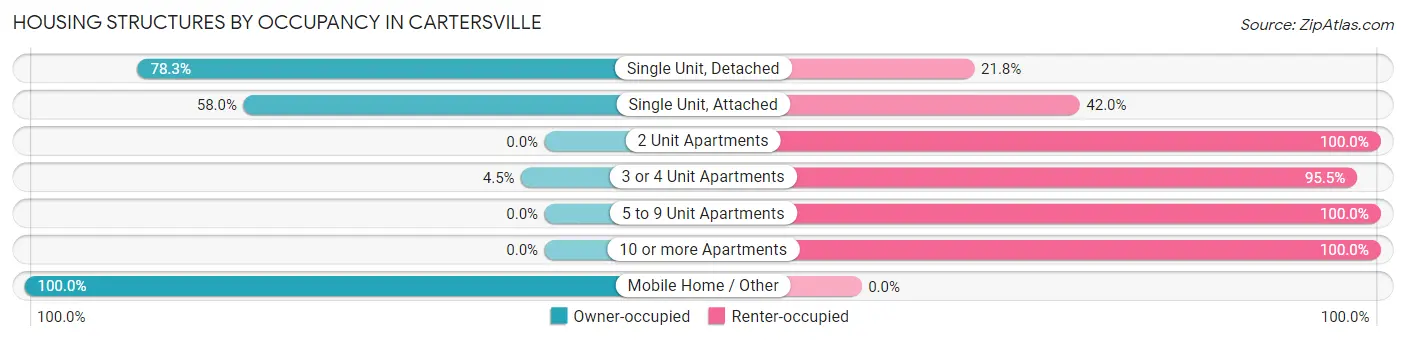
| Structure Type | Owner-occupied | Renter-occupied |
| Single Unit, Detached | 5,033 (78.2%) | 1,399 (21.7%) |
| Single Unit, Attached | 156 (58.0%) | 113 (42.0%) |
| 2 Unit Apartments | 0 (0.0%) | 193 (100.0%) |
| 3 or 4 Unit Apartments | 31 (4.5%) | 653 (95.5%) |
| 5 to 9 Unit Apartments | 0 (0.0%) | 322 (100.0%) |
| 10 or more Apartments | 0 (0.0%) | 736 (100.0%) |
| Mobile Home / Other | 31 (100.0%) | 0 (0.0%) |
| Total | 5,251 (60.6%) | 3,416 (39.4%) |
Housing Structures by Number of Rooms in Cartersville
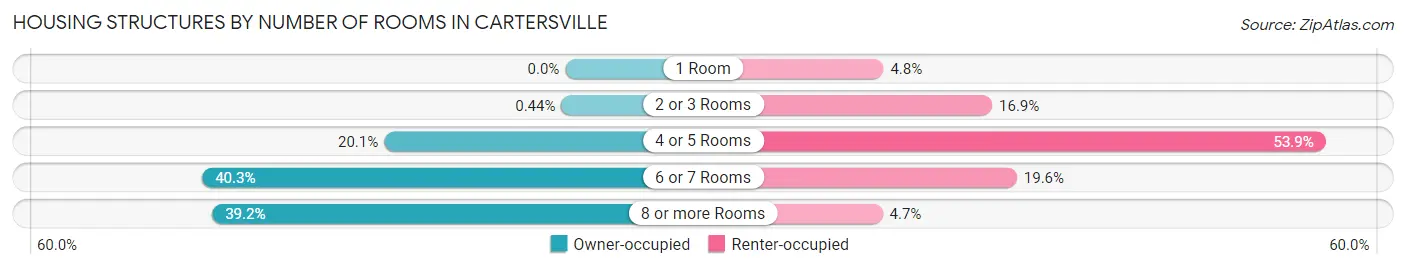
| Number of Rooms | Owner-occupied | Renter-occupied |
| 1 Room | 0 (0.0%) | 165 (4.8%) |
| 2 or 3 Rooms | 23 (0.4%) | 577 (16.9%) |
| 4 or 5 Rooms | 1,056 (20.1%) | 1,841 (53.9%) |
| 6 or 7 Rooms | 2,115 (40.3%) | 671 (19.6%) |
| 8 or more Rooms | 2,057 (39.2%) | 162 (4.7%) |
| Total | 5,251 (100.0%) | 3,416 (100.0%) |
Housing Structure by Heating Type in Cartersville
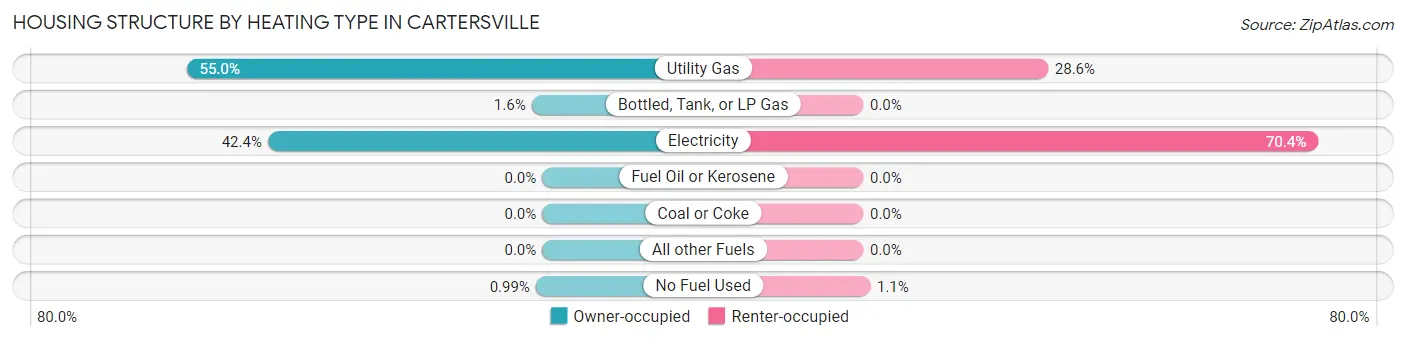
| Heating Type | Owner-occupied | Renter-occupied |
| Utility Gas | 2,886 (55.0%) | 976 (28.6%) |
| Bottled, Tank, or LP Gas | 86 (1.6%) | 0 (0.0%) |
| Electricity | 2,227 (42.4%) | 2,403 (70.4%) |
| Fuel Oil or Kerosene | 0 (0.0%) | 0 (0.0%) |
| Coal or Coke | 0 (0.0%) | 0 (0.0%) |
| All other Fuels | 0 (0.0%) | 0 (0.0%) |
| No Fuel Used | 52 (1.0%) | 37 (1.1%) |
| Total | 5,251 (100.0%) | 3,416 (100.0%) |
Household Vehicle Usage in Cartersville
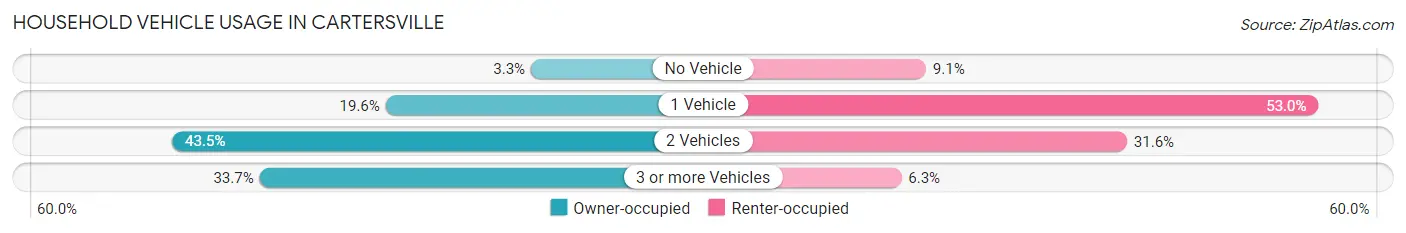
| Vehicles per Household | Owner-occupied | Renter-occupied |
| No Vehicle | 172 (3.3%) | 310 (9.1%) |
| 1 Vehicle | 1,027 (19.6%) | 1,811 (53.0%) |
| 2 Vehicles | 2,283 (43.5%) | 1,079 (31.6%) |
| 3 or more Vehicles | 1,769 (33.7%) | 216 (6.3%) |
| Total | 5,251 (100.0%) | 3,416 (100.0%) |
Real Estate & Mortgages in Cartersville
Real Estate and Mortgage Overview in Cartersville
| Characteristic | Without Mortgage | With Mortgage |
| Housing Units | 1,702 | 3,549 |
| Median Property Value | $253,400 | $287,800 |
| Median Household Income | $82,778 | $1,006 |
| Monthly Housing Costs | $554 | $111 |
| Real Estate Taxes | $1,898 | $291 |
Property Value by Mortgage Status in Cartersville
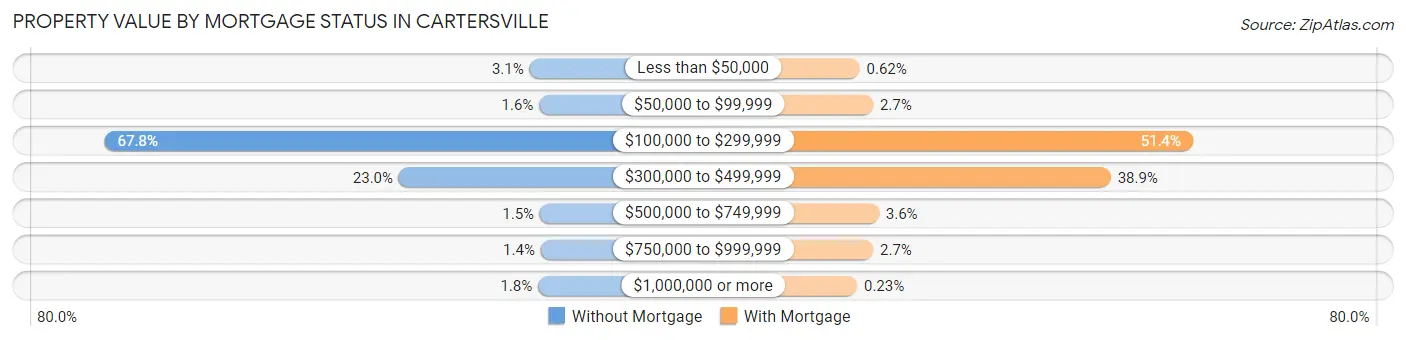
| Property Value | Without Mortgage | With Mortgage |
| Less than $50,000 | 52 (3.1%) | 22 (0.6%) |
| $50,000 to $99,999 | 27 (1.6%) | 94 (2.6%) |
| $100,000 to $299,999 | 1,154 (67.8%) | 1,824 (51.4%) |
| $300,000 to $499,999 | 391 (23.0%) | 1,380 (38.9%) |
| $500,000 to $749,999 | 25 (1.5%) | 126 (3.5%) |
| $750,000 to $999,999 | 23 (1.3%) | 95 (2.7%) |
| $1,000,000 or more | 30 (1.8%) | 8 (0.2%) |
| Total | 1,702 (100.0%) | 3,549 (100.0%) |
Household Income by Mortgage Status in Cartersville
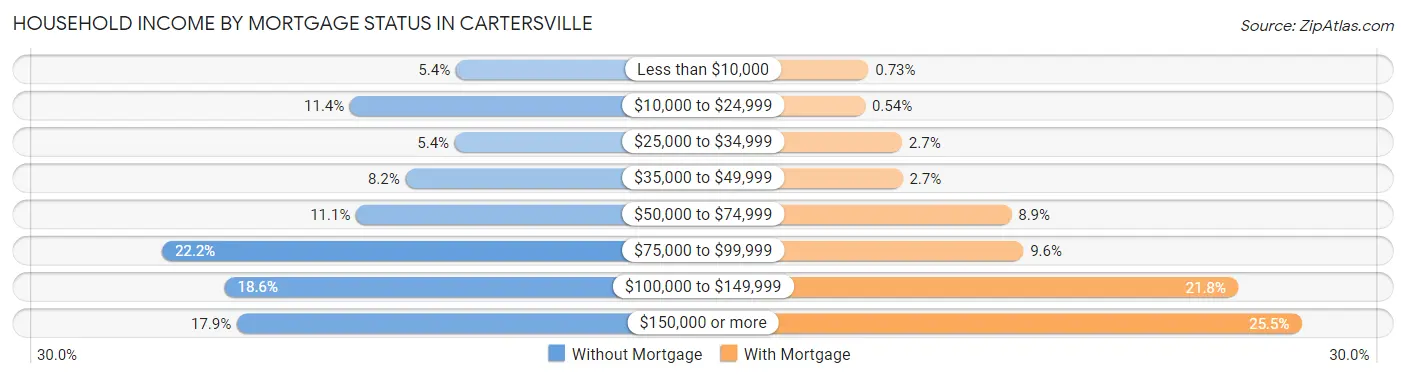
| Household Income | Without Mortgage | With Mortgage |
| Less than $10,000 | 91 (5.3%) | 26 (0.7%) |
| $10,000 to $24,999 | 194 (11.4%) | 19 (0.5%) |
| $25,000 to $34,999 | 92 (5.4%) | 94 (2.6%) |
| $35,000 to $49,999 | 140 (8.2%) | 95 (2.7%) |
| $50,000 to $74,999 | 188 (11.1%) | 316 (8.9%) |
| $75,000 to $99,999 | 377 (22.2%) | 340 (9.6%) |
| $100,000 to $149,999 | 316 (18.6%) | 775 (21.8%) |
| $150,000 or more | 304 (17.9%) | 904 (25.5%) |
| Total | 1,702 (100.0%) | 3,549 (100.0%) |
Property Value to Household Income Ratio in Cartersville
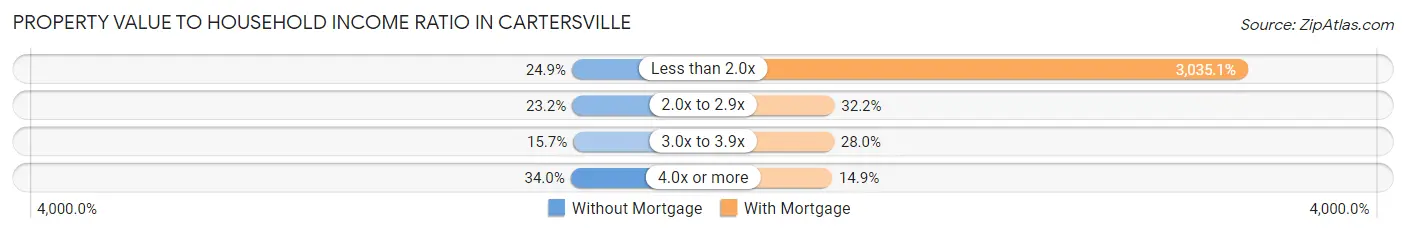
| Value-to-Income Ratio | Without Mortgage | With Mortgage |
| Less than 2.0x | 423 (24.8%) | 107,717 (3,035.1%) |
| 2.0x to 2.9x | 394 (23.2%) | 1,142 (32.2%) |
| 3.0x to 3.9x | 267 (15.7%) | 995 (28.0%) |
| 4.0x or more | 578 (34.0%) | 530 (14.9%) |
| Total | 1,702 (100.0%) | 3,549 (100.0%) |
Real Estate Taxes by Mortgage Status in Cartersville
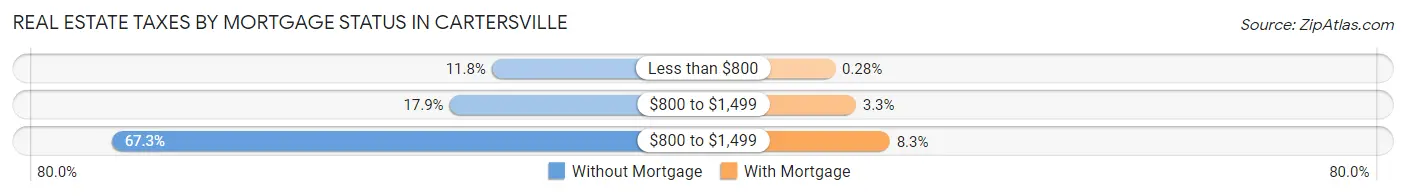
| Property Taxes | Without Mortgage | With Mortgage |
| Less than $800 | 200 (11.7%) | 10 (0.3%) |
| $800 to $1,499 | 305 (17.9%) | 118 (3.3%) |
| $800 to $1,499 | 1,145 (67.3%) | 294 (8.3%) |
| Total | 1,702 (100.0%) | 3,549 (100.0%) |
Health & Disability in Cartersville
Health Insurance Coverage by Age in Cartersville
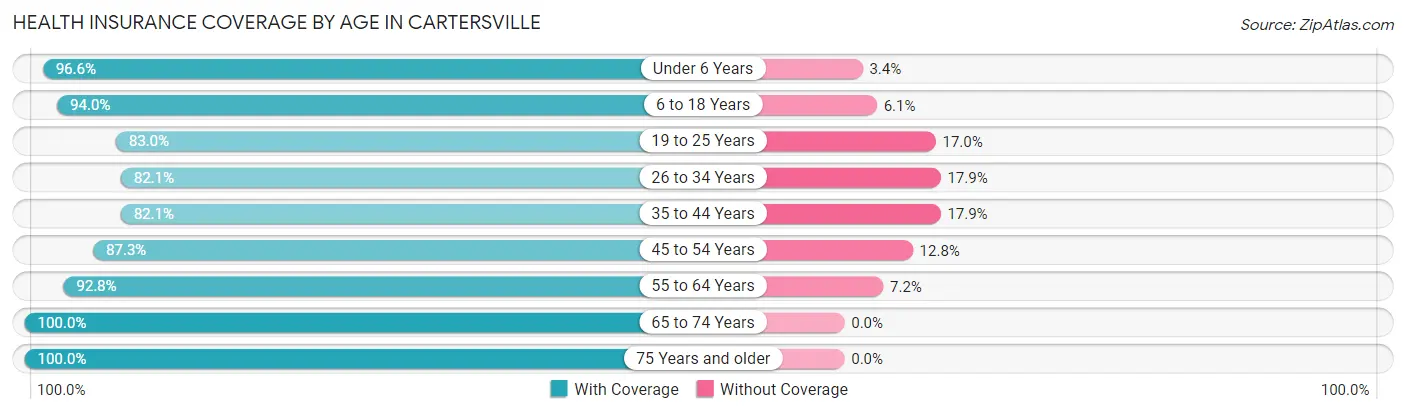
| Age Bracket | With Coverage | Without Coverage |
| Under 6 Years | 1,739 (96.6%) | 61 (3.4%) |
| 6 to 18 Years | 3,839 (94.0%) | 247 (6.0%) |
| 19 to 25 Years | 1,347 (83.0%) | 276 (17.0%) |
| 26 to 34 Years | 2,374 (82.1%) | 519 (17.9%) |
| 35 to 44 Years | 2,860 (82.1%) | 625 (17.9%) |
| 45 to 54 Years | 2,627 (87.3%) | 384 (12.8%) |
| 55 to 64 Years | 2,318 (92.8%) | 181 (7.2%) |
| 65 to 74 Years | 1,712 (100.0%) | 0 (0.0%) |
| 75 Years and older | 1,125 (100.0%) | 0 (0.0%) |
| Total | 19,941 (89.7%) | 2,293 (10.3%) |
Health Insurance Coverage by Citizenship Status in Cartersville
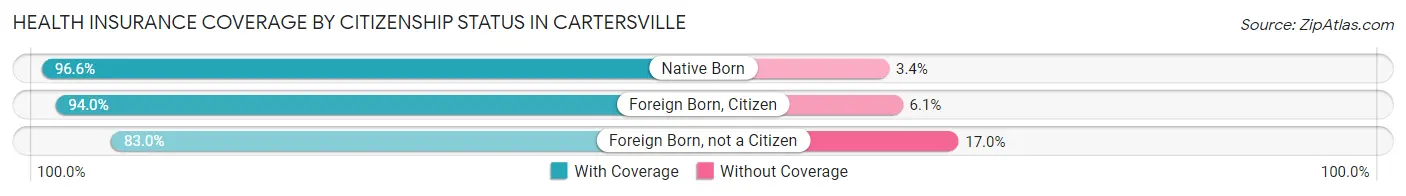
| Citizenship Status | With Coverage | Without Coverage |
| Native Born | 1,739 (96.6%) | 61 (3.4%) |
| Foreign Born, Citizen | 3,839 (94.0%) | 247 (6.0%) |
| Foreign Born, not a Citizen | 1,347 (83.0%) | 276 (17.0%) |
Health Insurance Coverage by Household Income in Cartersville
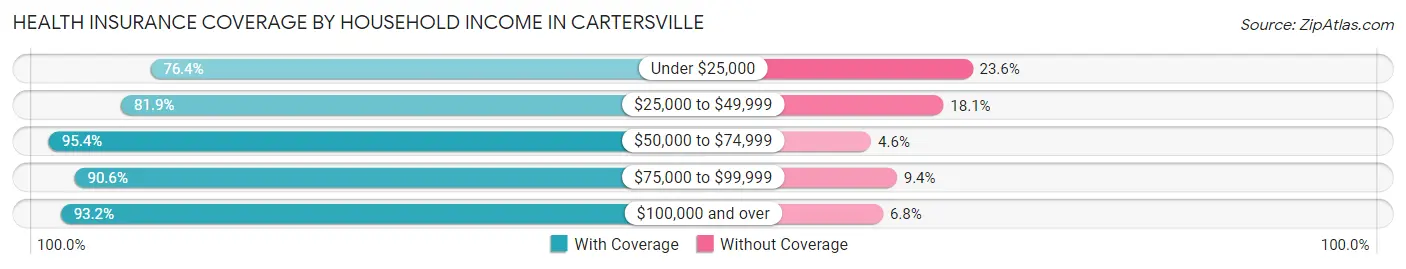
| Household Income | With Coverage | Without Coverage |
| Under $25,000 | 1,720 (76.4%) | 530 (23.6%) |
| $25,000 to $49,999 | 2,665 (81.9%) | 589 (18.1%) |
| $50,000 to $74,999 | 3,159 (95.4%) | 151 (4.6%) |
| $75,000 to $99,999 | 3,667 (90.6%) | 379 (9.4%) |
| $100,000 and over | 8,705 (93.2%) | 633 (6.8%) |
Public vs Private Health Insurance Coverage by Age in Cartersville
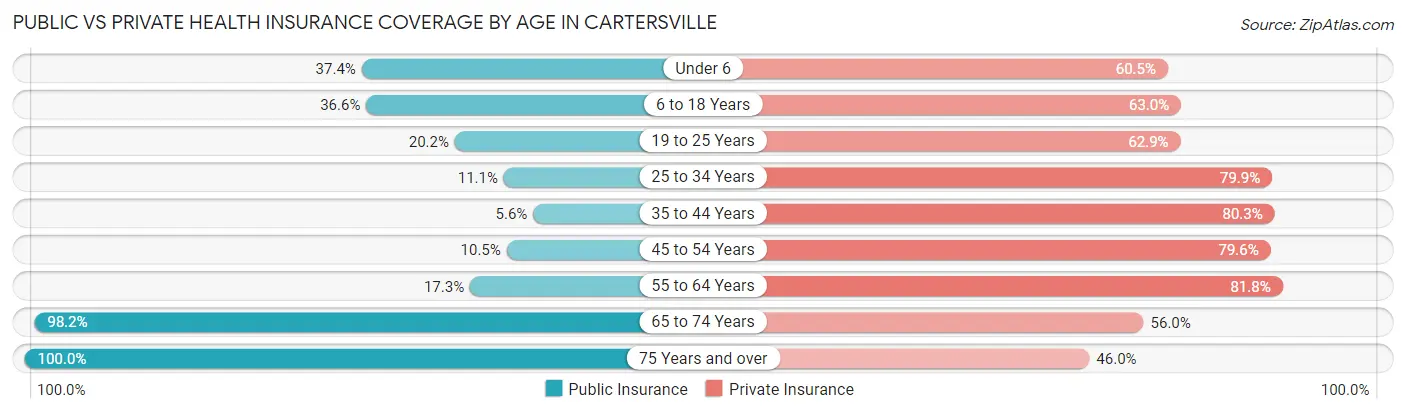
| Age Bracket | Public Insurance | Private Insurance |
| Under 6 | 674 (37.4%) | 1,089 (60.5%) |
| 6 to 18 Years | 1,495 (36.6%) | 2,573 (63.0%) |
| 19 to 25 Years | 327 (20.2%) | 1,020 (62.8%) |
| 25 to 34 Years | 320 (11.1%) | 2,310 (79.8%) |
| 35 to 44 Years | 195 (5.6%) | 2,799 (80.3%) |
| 45 to 54 Years | 317 (10.5%) | 2,396 (79.6%) |
| 55 to 64 Years | 433 (17.3%) | 2,044 (81.8%) |
| 65 to 74 Years | 1,681 (98.2%) | 959 (56.0%) |
| 75 Years and over | 1,125 (100.0%) | 517 (46.0%) |
| Total | 6,567 (29.5%) | 15,707 (70.6%) |
Disability Status by Sex by Age in Cartersville
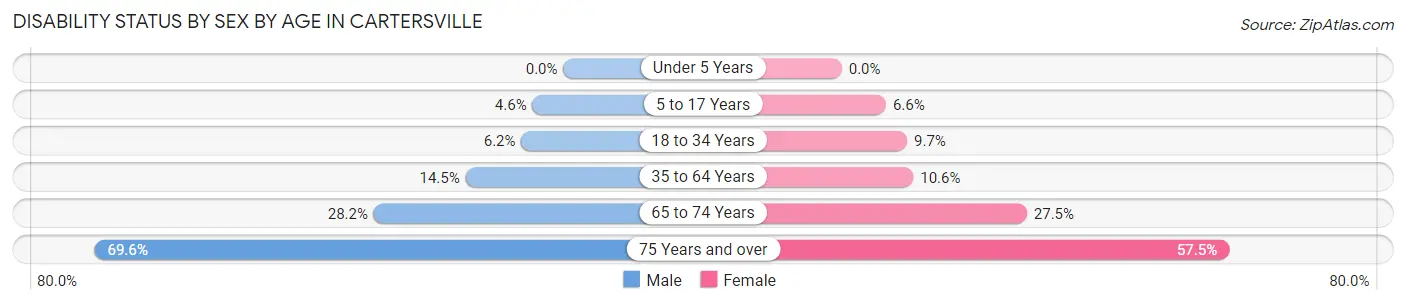
| Age Bracket | Male | Female |
| Under 5 Years | 0 (0.0%) | 0 (0.0%) |
| 5 to 17 Years | 90 (4.6%) | 118 (6.6%) |
| 18 to 34 Years | 176 (6.2%) | 208 (9.7%) |
| 35 to 64 Years | 676 (14.5%) | 461 (10.6%) |
| 65 to 74 Years | 192 (28.1%) | 283 (27.5%) |
| 75 Years and over | 323 (69.6%) | 380 (57.5%) |
Disability Class by Sex by Age in Cartersville
Disability Class: Hearing Difficulty
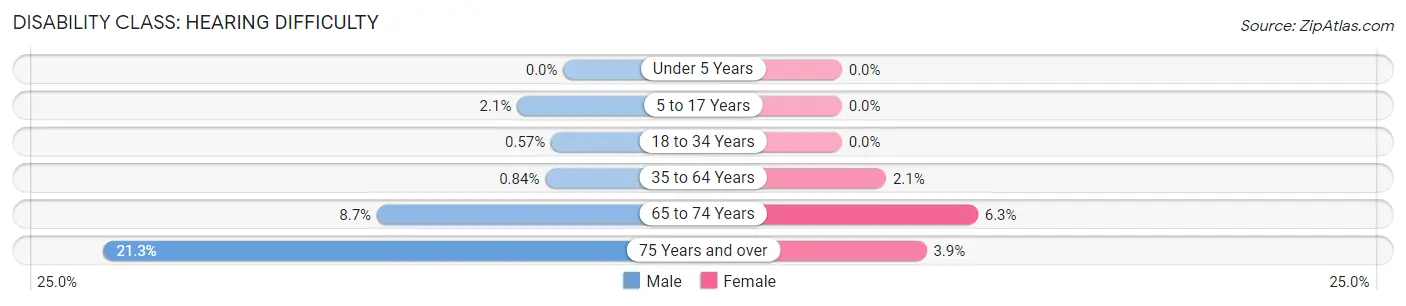
| Age Bracket | Male | Female |
| Under 5 Years | 0 (0.0%) | 0 (0.0%) |
| 5 to 17 Years | 42 (2.1%) | 0 (0.0%) |
| 18 to 34 Years | 16 (0.6%) | 0 (0.0%) |
| 35 to 64 Years | 39 (0.8%) | 89 (2.1%) |
| 65 to 74 Years | 59 (8.6%) | 65 (6.3%) |
| 75 Years and over | 99 (21.3%) | 26 (3.9%) |
Disability Class: Vision Difficulty
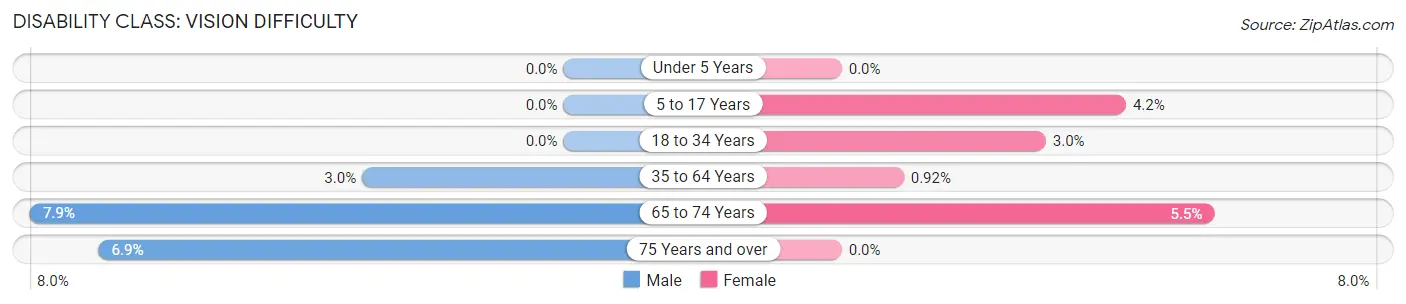
| Age Bracket | Male | Female |
| Under 5 Years | 0 (0.0%) | 0 (0.0%) |
| 5 to 17 Years | 0 (0.0%) | 76 (4.2%) |
| 18 to 34 Years | 0 (0.0%) | 65 (3.0%) |
| 35 to 64 Years | 139 (3.0%) | 40 (0.9%) |
| 65 to 74 Years | 54 (7.9%) | 57 (5.5%) |
| 75 Years and over | 32 (6.9%) | 0 (0.0%) |
Disability Class: Cognitive Difficulty
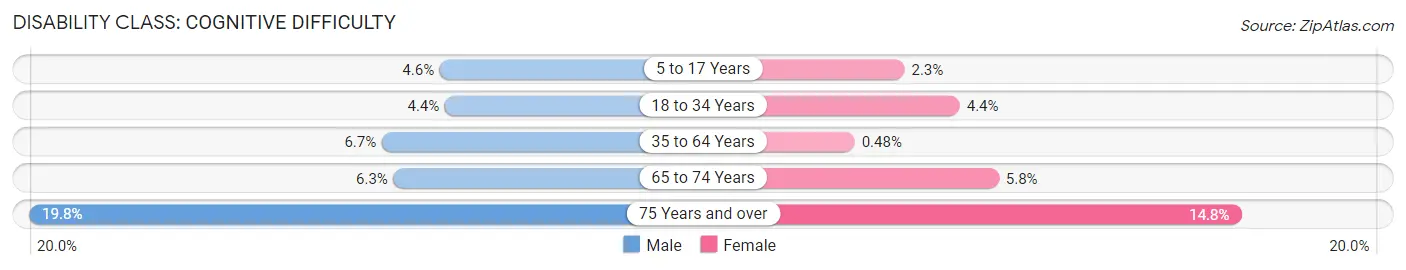
| Age Bracket | Male | Female |
| 5 to 17 Years | 90 (4.6%) | 42 (2.3%) |
| 18 to 34 Years | 124 (4.4%) | 94 (4.4%) |
| 35 to 64 Years | 313 (6.7%) | 21 (0.5%) |
| 65 to 74 Years | 43 (6.3%) | 60 (5.8%) |
| 75 Years and over | 92 (19.8%) | 98 (14.8%) |
Disability Class: Ambulatory Difficulty
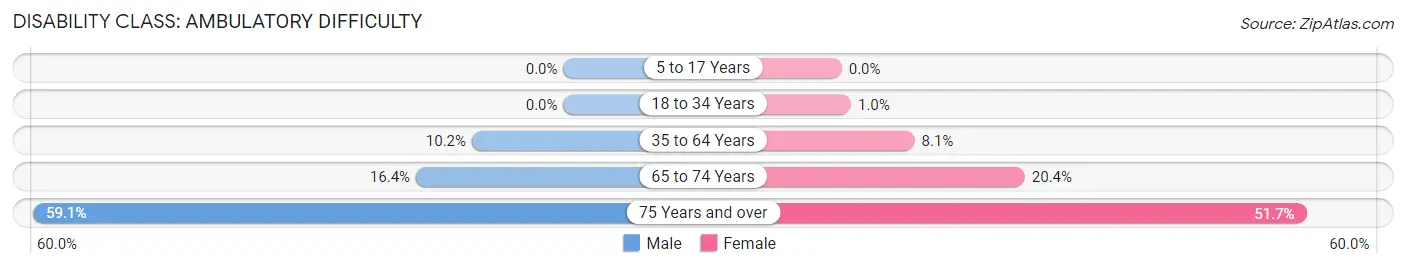
| Age Bracket | Male | Female |
| 5 to 17 Years | 0 (0.0%) | 0 (0.0%) |
| 18 to 34 Years | 0 (0.0%) | 22 (1.0%) |
| 35 to 64 Years | 474 (10.2%) | 352 (8.1%) |
| 65 to 74 Years | 112 (16.4%) | 210 (20.4%) |
| 75 Years and over | 274 (59.1%) | 342 (51.7%) |
Disability Class: Self-Care Difficulty
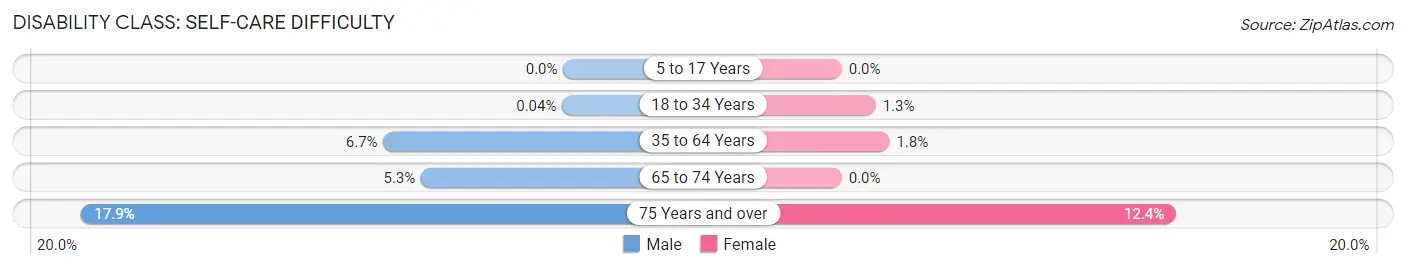
| Age Bracket | Male | Female |
| 5 to 17 Years | 0 (0.0%) | 0 (0.0%) |
| 18 to 34 Years | 1 (0.0%) | 27 (1.3%) |
| 35 to 64 Years | 311 (6.7%) | 77 (1.8%) |
| 65 to 74 Years | 36 (5.3%) | 0 (0.0%) |
| 75 Years and over | 83 (17.9%) | 82 (12.4%) |
Technology Access in Cartersville
Computing Device Access in Cartersville
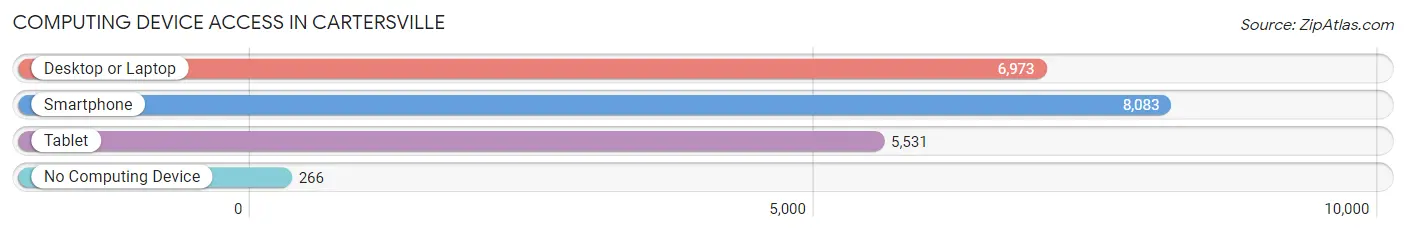
| Device Type | # Households | % Households |
| Desktop or Laptop | 6,973 | 80.4% |
| Smartphone | 8,083 | 93.3% |
| Tablet | 5,531 | 63.8% |
| No Computing Device | 266 | 3.1% |
| Total | 8,667 | 100.0% |
Internet Access in Cartersville
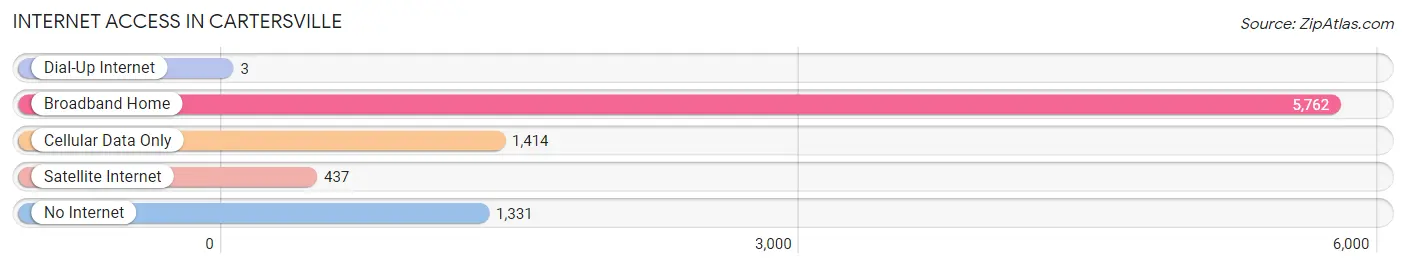
| Internet Type | # Households | % Households |
| Dial-Up Internet | 3 | 0.0% |
| Broadband Home | 5,762 | 66.5% |
| Cellular Data Only | 1,414 | 16.3% |
| Satellite Internet | 437 | 5.0% |
| No Internet | 1,331 | 15.4% |
| Total | 8,667 | 100.0% |
Cartersville Summary
Cartersville, Georgia is a city located in Bartow County, Georgia, United States. It is the county seat of Bartow County and is located approximately 40 miles northwest of Atlanta. The city has a population of 19,731 as of the 2010 census.
History
Cartersville was founded in 1854 as a small trading post and was named after Colonel Farish Carter, a prominent local citizen. The city was incorporated in 1872 and has since grown to become the largest city in Bartow County.
The city was an important center for the Confederate Army during the Civil War. It was the site of several battles, including the Battle of Allatoona Pass in 1864. After the war, the city experienced a period of growth and development, becoming an important center for the cotton and textile industries.
Geography
Cartersville is located in the foothills of the Appalachian Mountains in northwest Georgia. The city is situated at the confluence of the Etowah and Oostanaula Rivers, which form the Coosawattee River. The city is located approximately 40 miles northwest of Atlanta and is part of the Atlanta metropolitan area.
The city has a total area of 11.2 square miles, of which 11.1 square miles is land and 0.1 square miles is water. The city is located at an elevation of 830 feet above sea level.
Economy
Cartersville is a major economic center for the region. The city is home to several major employers, including Shaw Industries, Mohawk Industries, and the Cartersville Medical Center. The city is also home to several industrial parks, which are home to a variety of businesses.
The city is also home to several tourist attractions, including the Booth Western Art Museum, the Tellus Science Museum, and the Etowah Indian Mounds State Historic Site.
Demographics
As of the 2010 census, the city had a population of 19,731. The racial makeup of the city was 75.3% White, 17.2% African American, 0.4% Native American, 1.7% Asian, 0.1% Pacific Islander, 3.2% from other races, and 2.1% from two or more races. Hispanic or Latino of any race were 8.2% of the population.
The median income for a household in the city was $41,945, and the median income for a family was $50,945. The per capita income for the city was $21,845. About 11.3% of families and 14.2% of the population were below the poverty line, including 19.2% of those under age 18 and 10.2% of those age 65 or over.
Common Questions
What is Per Capita Income in Cartersville?
Per Capita income in Cartersville is $37,989.
What is the Median Family Income in Cartersville?
Median Family Income in Cartersville is $92,114.
What is the Median Household income in Cartersville?
Median Household Income in Cartersville is $75,407.
What is Income or Wage Gap in Cartersville?
Income or Wage Gap in Cartersville is 22.6%.
Women in Cartersville earn 77.4 cents for every dollar earned by a man.
What is Inequality or Gini Index in Cartersville?
Inequality or Gini Index in Cartersville is 0.45.
What is the Total Population of Cartersville?
Total Population of Cartersville is 23,103.
What is the Total Male Population of Cartersville?
Total Male Population of Cartersville is 12,189.
What is the Total Female Population of Cartersville?
Total Female Population of Cartersville is 10,914.
What is the Ratio of Males per 100 Females in Cartersville?
There are 111.68 Males per 100 Females in Cartersville.
What is the Ratio of Females per 100 Males in Cartersville?
There are 89.54 Females per 100 Males in Cartersville.
What is the Median Population Age in Cartersville?
Median Population Age in Cartersville is 36.8 Years.
What is the Average Family Size in Cartersville
Average Family Size in Cartersville is 3.2 People.
What is the Average Household Size in Cartersville
Average Household Size in Cartersville is 2.6 People.
How Large is the Labor Force in Cartersville?
There are 11,449 People in the Labor Forcein in Cartersville.
What is the Percentage of People in the Labor Force in Cartersville?
63.2% of People are in the Labor Force in Cartersville.
What is the Unemployment Rate in Cartersville?
Unemployment Rate in Cartersville is 2.8%.