Buena Vista, GA Map & Demographics
Buena Vista Map
Buena Vista Overview
$20,323
PER CAPITA INCOME
$44,297
AVG FAMILY INCOME
$31,308
AVG HOUSEHOLD INCOME
28.5%
WAGE / INCOME GAP [ % ]
71.5¢/ $1
WAGE / INCOME GAP [ $ ]
$16,165
FAMILY INCOME DEFICIT
0.51
INEQUALITY / GINI INDEX
1,964
TOTAL POPULATION
885
MALE POPULATION
1,079
FEMALE POPULATION
82.02
MALES / 100 FEMALES
121.92
FEMALES / 100 MALES
37.0
MEDIAN AGE
3.3
AVG FAMILY SIZE
2.6
AVG HOUSEHOLD SIZE
610
LABOR FORCE [ PEOPLE ]
39.9%
PERCENT IN LABOR FORCE
0.3%
UNEMPLOYMENT RATE
Buena Vista Zip Codes
Buena Vista Area Codes
Income in Buena Vista
Income Overview in Buena Vista
Per Capita Income in Buena Vista is $20,323, while median incomes of families and households are $44,297 and $31,308 respectively.
| Characteristic | Number | Measure |
| Per Capita Income | 1,964 | $20,323 |
| Median Family Income | 449 | $44,297 |
| Mean Family Income | 449 | $65,898 |
| Median Household Income | 729 | $31,308 |
| Mean Household Income | 729 | $50,670 |
| Income Deficit | 449 | $16,165 |
| Wage / Income Gap (%) | 1,964 | 28.51% |
| Wage / Income Gap ($) | 1,964 | 71.49¢ per $1 |
| Gini / Inequality Index | 1,964 | 0.51 |
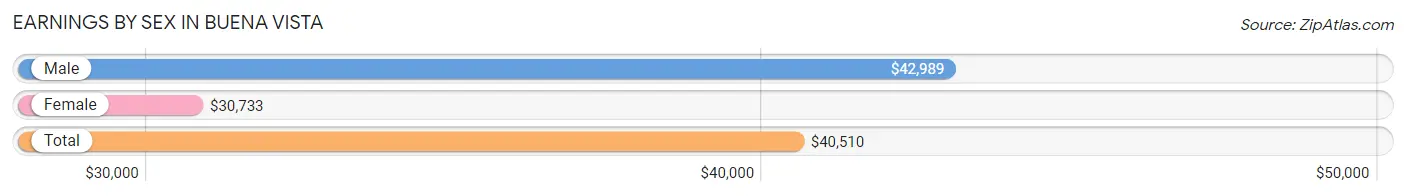
Earnings by Sex in Buena Vista
Average Earnings in Buena Vista are $40,510, $42,989 for men and $30,733 for women, a difference of 28.5%.
| Sex | Number | Average Earnings |
| Male | 337 (49.4%) | $42,989 |
| Female | 345 (50.6%) | $30,733 |
| Total | 682 (100.0%) | $40,510 |
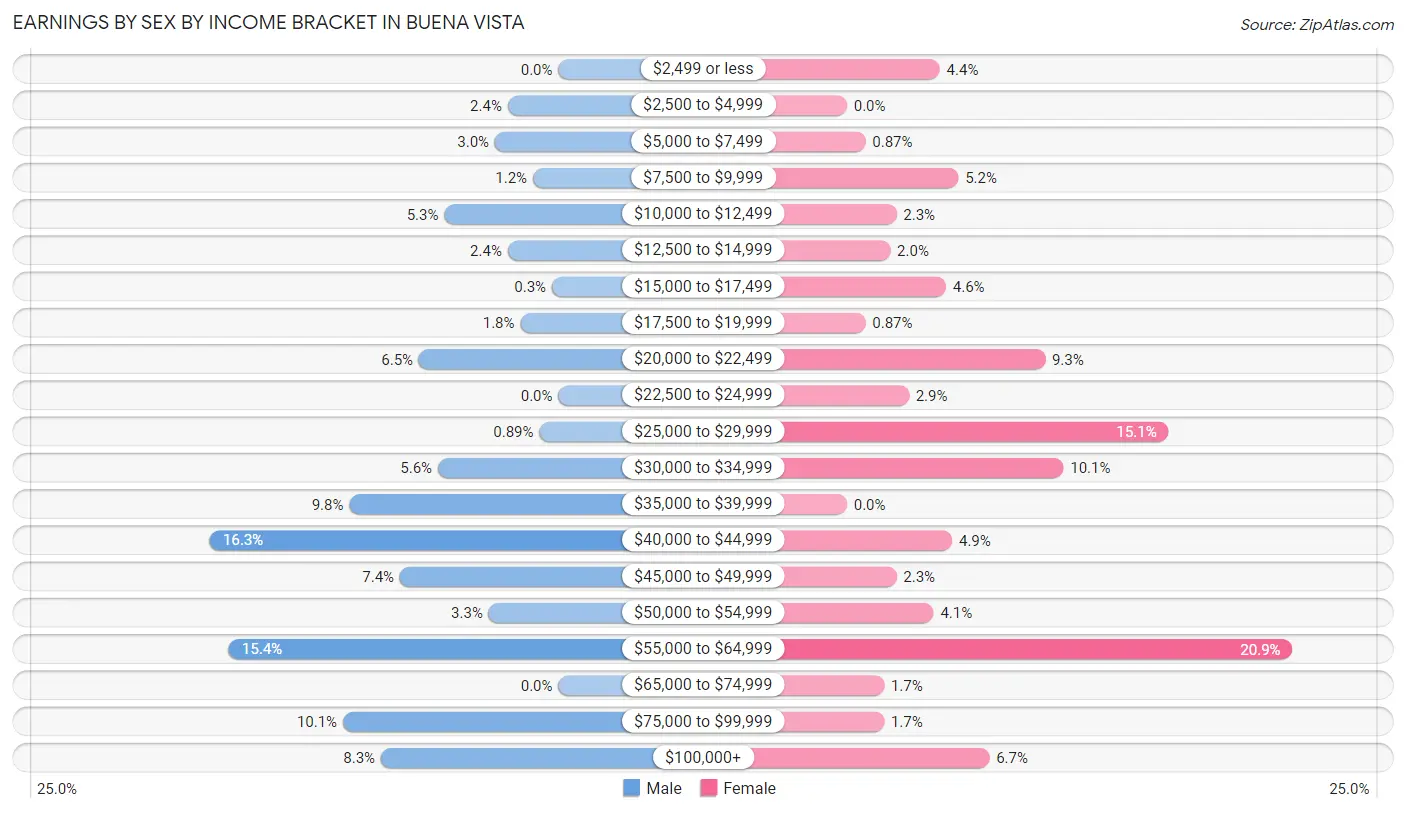
Earnings by Sex by Income Bracket in Buena Vista
The most common earnings brackets in Buena Vista are $40,000 to $44,999 for men (55 | 16.3%) and $55,000 to $64,999 for women (72 | 20.9%).
| Income | Male | Female |
| $2,499 or less | 0 (0.0%) | 15 (4.3%) |
| $2,500 to $4,999 | 8 (2.4%) | 0 (0.0%) |
| $5,000 to $7,499 | 10 (3.0%) | 3 (0.9%) |
| $7,500 to $9,999 | 4 (1.2%) | 18 (5.2%) |
| $10,000 to $12,499 | 18 (5.3%) | 8 (2.3%) |
| $12,500 to $14,999 | 8 (2.4%) | 7 (2.0%) |
| $15,000 to $17,499 | 1 (0.3%) | 16 (4.6%) |
| $17,500 to $19,999 | 6 (1.8%) | 3 (0.9%) |
| $20,000 to $22,499 | 22 (6.5%) | 32 (9.3%) |
| $22,500 to $24,999 | 0 (0.0%) | 10 (2.9%) |
| $25,000 to $29,999 | 3 (0.9%) | 52 (15.1%) |
| $30,000 to $34,999 | 19 (5.6%) | 35 (10.1%) |
| $35,000 to $39,999 | 33 (9.8%) | 0 (0.0%) |
| $40,000 to $44,999 | 55 (16.3%) | 17 (4.9%) |
| $45,000 to $49,999 | 25 (7.4%) | 8 (2.3%) |
| $50,000 to $54,999 | 11 (3.3%) | 14 (4.1%) |
| $55,000 to $64,999 | 52 (15.4%) | 72 (20.9%) |
| $65,000 to $74,999 | 0 (0.0%) | 6 (1.7%) |
| $75,000 to $99,999 | 34 (10.1%) | 6 (1.7%) |
| $100,000+ | 28 (8.3%) | 23 (6.7%) |
| Total | 337 (100.0%) | 345 (100.0%) |
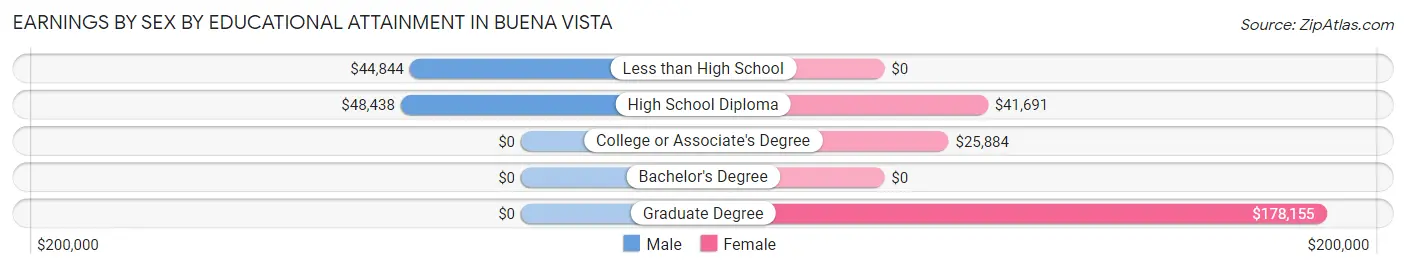
Earnings by Sex by Educational Attainment in Buena Vista
Average earnings in Buena Vista are $47,917 for men and $32,708 for women, a difference of 31.7%. Men with an educational attainment of high school diploma enjoy the highest average annual earnings of $48,438, while those with less than high school education earn the least with $44,844. Women with an educational attainment of graduate degree earn the most with the average annual earnings of $178,155, while those with college or associate's degree education have the smallest earnings of $25,884.
| Educational Attainment | Male Income | Female Income |
| Less than High School | $44,844 | $0 |
| High School Diploma | $48,438 | $41,691 |
| College or Associate's Degree | - | - |
| Bachelor's Degree | - | - |
| Graduate Degree | - | - |
| Total | $47,917 | $32,708 |
Family Income in Buena Vista
Family Income Brackets in Buena Vista
According to the Buena Vista family income data, there are 108 families falling into the $50,000 to $74,999 income range, which is the most common income bracket and makes up 24.0% of all families. Conversely, the $100,000 to $149,999 income bracket is the least frequent group with only 6 families (1.3%) belonging to this category.
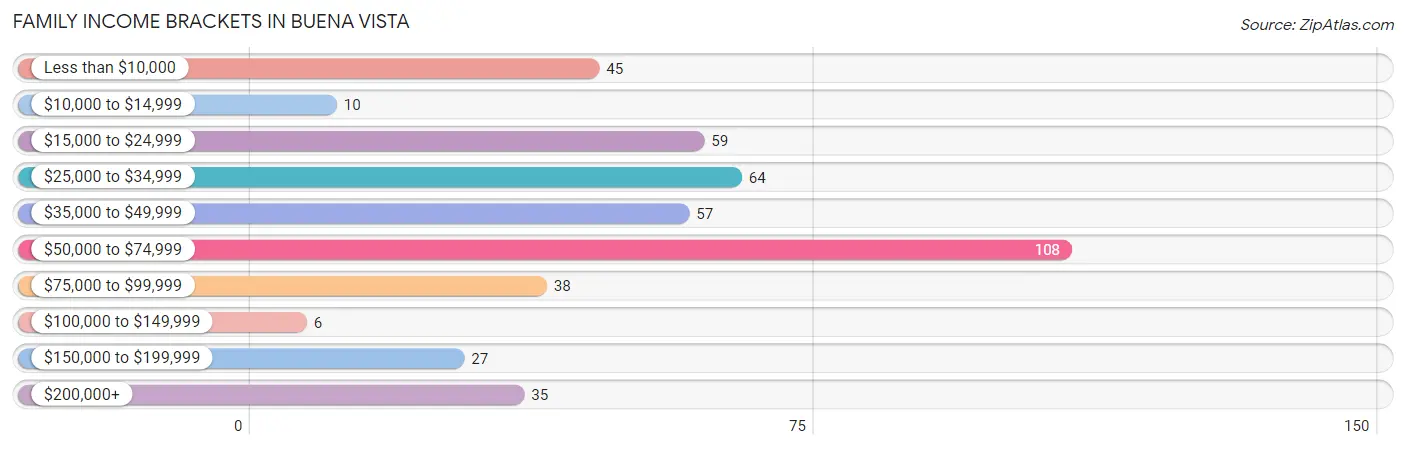
| Income Bracket | # Families | % Families |
| Less than $10,000 | 45 | 10.0% |
| $10,000 to $14,999 | 10 | 2.2% |
| $15,000 to $24,999 | 59 | 13.1% |
| $25,000 to $34,999 | 64 | 14.3% |
| $35,000 to $49,999 | 57 | 12.7% |
| $50,000 to $74,999 | 108 | 24.1% |
| $75,000 to $99,999 | 38 | 8.5% |
| $100,000 to $149,999 | 6 | 1.3% |
| $150,000 to $199,999 | 27 | 6.0% |
| $200,000+ | 35 | 7.8% |
Family Income by Famaliy Size in Buena Vista
2-person families (168 | 37.4%) account for the highest median family income in Buena Vista with $60,625 per family, while 2-person families (168 | 37.4%) have the highest median income of $30,312 per family member.
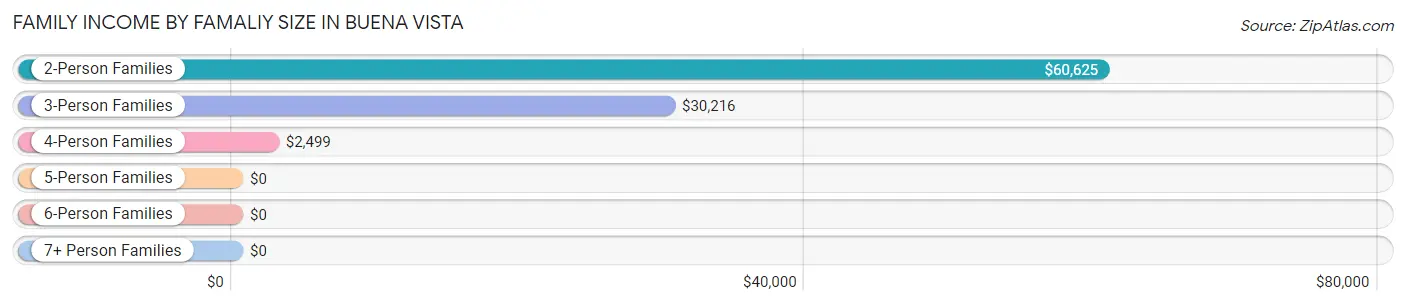
| Income Bracket | # Families | Median Income |
| 2-Person Families | 168 (37.4%) | $60,625 |
| 3-Person Families | 123 (27.4%) | $30,216 |
| 4-Person Families | 57 (12.7%) | $2,499 |
| 5-Person Families | 58 (12.9%) | $0 |
| 6-Person Families | 43 (9.6%) | $0 |
| 7+ Person Families | 0 (0.0%) | $0 |
| Total | 449 (100.0%) | $44,297 |
Family Income by Number of Earners in Buena Vista
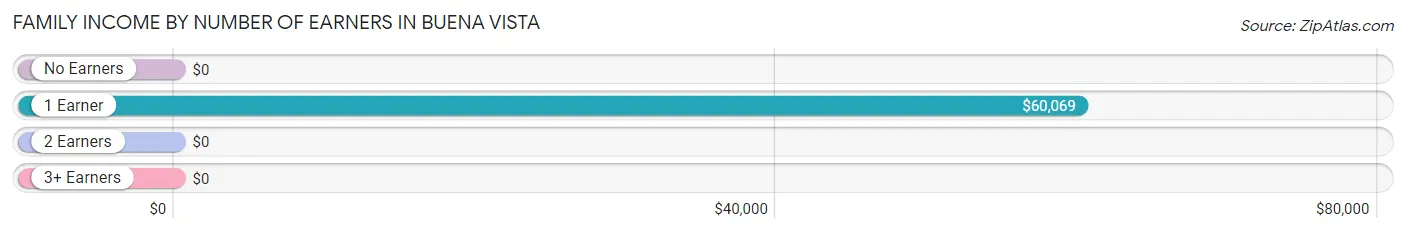
| Number of Earners | # Families | Median Income |
| No Earners | 99 (22.1%) | $0 |
| 1 Earner | 258 (57.5%) | $60,069 |
| 2 Earners | 78 (17.4%) | $0 |
| 3+ Earners | 14 (3.1%) | $0 |
| Total | 449 (100.0%) | $44,297 |
Household Income in Buena Vista
Household Income Brackets in Buena Vista
With 157 households falling in the category, the $15,000 to $24,999 income range is the most frequent in Buena Vista, accounting for 21.5% of all households. In contrast, only 6 households (0.8%) fall into the $100,000 to $149,999 income bracket, making it the least populous group.
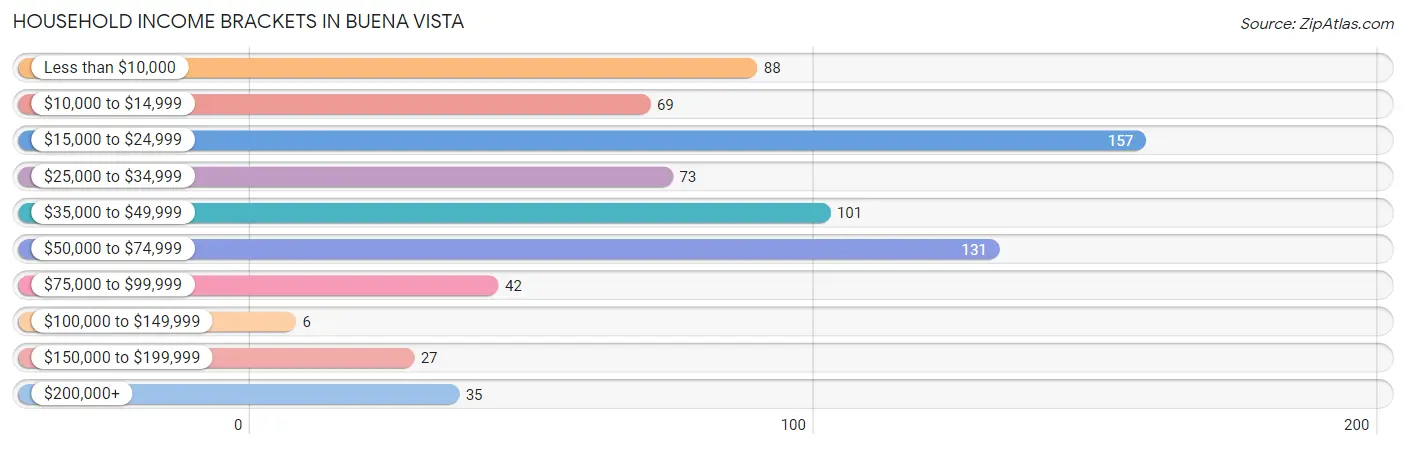
| Income Bracket | # Households | % Households |
| Less than $10,000 | 88 | 12.1% |
| $10,000 to $14,999 | 69 | 9.5% |
| $15,000 to $24,999 | 157 | 21.5% |
| $25,000 to $34,999 | 73 | 10.0% |
| $35,000 to $49,999 | 101 | 13.9% |
| $50,000 to $74,999 | 131 | 18.0% |
| $75,000 to $99,999 | 42 | 5.8% |
| $100,000 to $149,999 | 6 | 0.8% |
| $150,000 to $199,999 | 27 | 3.7% |
| $200,000+ | 35 | 4.8% |
Household Income by Householder Age in Buena Vista
The median household income in Buena Vista is $31,308, with the highest median household income of $49,784 found in the 25 to 44 years age bracket for the primary householder. A total of 287 households (39.4%) fall into this category. Meanwhile, the 65+ years age bracket for the primary householder has the lowest median household income of $20,089, with 145 households (19.9%) in this group.
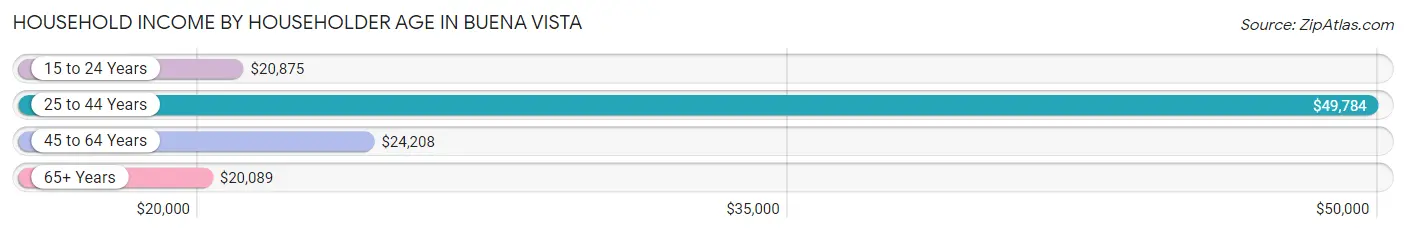
| Income Bracket | # Households | Median Income |
| 15 to 24 Years | 40 (5.5%) | $20,875 |
| 25 to 44 Years | 287 (39.4%) | $49,784 |
| 45 to 64 Years | 257 (35.2%) | $24,208 |
| 65+ Years | 145 (19.9%) | $20,089 |
| Total | 729 (100.0%) | $31,308 |
Poverty in Buena Vista
Income Below Poverty by Sex and Age in Buena Vista
With 19.2% poverty level for males and 25.4% for females among the residents of Buena Vista, under 5 year old males and 25 to 34 year old females are the most vulnerable to poverty, with 63 males (94.0%) and 54 females (74.0%) in their respective age groups living below the poverty level.
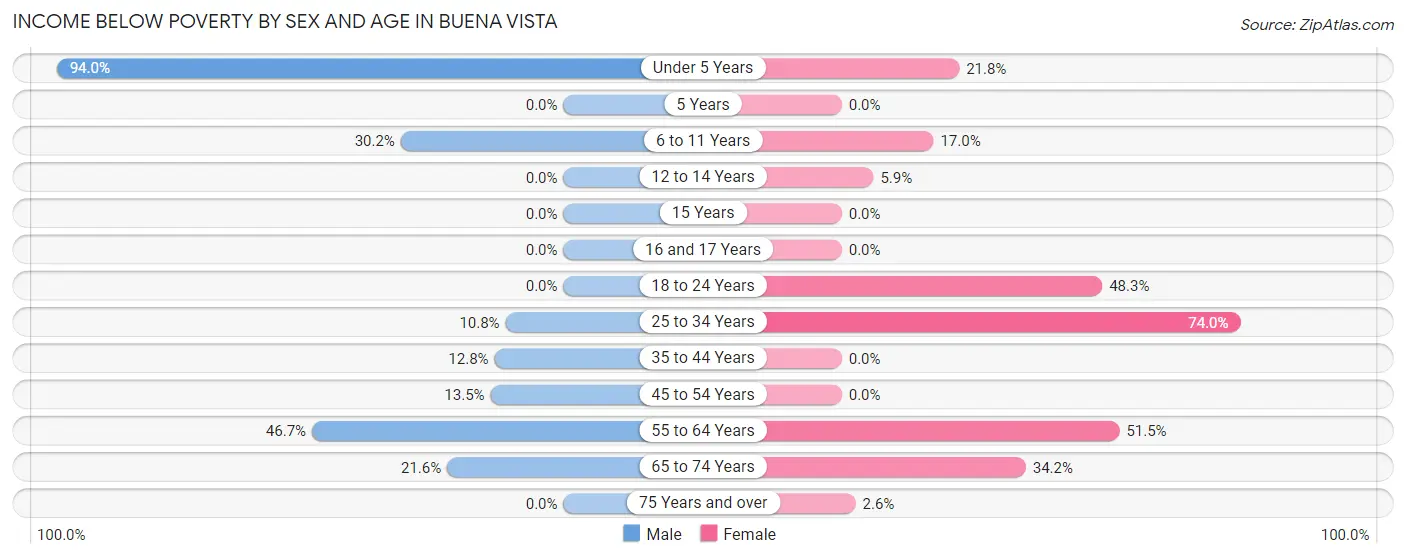
| Age Bracket | Male | Female |
| Under 5 Years | 63 (94.0%) | 17 (21.8%) |
| 5 Years | 0 (0.0%) | 0 (0.0%) |
| 6 to 11 Years | 16 (30.2%) | 16 (17.0%) |
| 12 to 14 Years | 0 (0.0%) | 5 (5.9%) |
| 15 Years | 0 (0.0%) | 0 (0.0%) |
| 16 and 17 Years | 0 (0.0%) | 0 (0.0%) |
| 18 to 24 Years | 0 (0.0%) | 73 (48.3%) |
| 25 to 34 Years | 10 (10.7%) | 54 (74.0%) |
| 35 to 44 Years | 16 (12.8%) | 0 (0.0%) |
| 45 to 54 Years | 13 (13.5%) | 0 (0.0%) |
| 55 to 64 Years | 21 (46.7%) | 67 (51.5%) |
| 65 to 74 Years | 19 (21.6%) | 28 (34.2%) |
| 75 Years and over | 0 (0.0%) | 1 (2.6%) |
| Total | 158 (19.2%) | 261 (25.4%) |
Income Above Poverty by Sex and Age in Buena Vista
According to the poverty statistics in Buena Vista, males aged 12 to 14 years and females aged 16 and 17 years are the age groups that are most secure financially, with 100.0% of males and 100.0% of females in these age groups living above the poverty line.
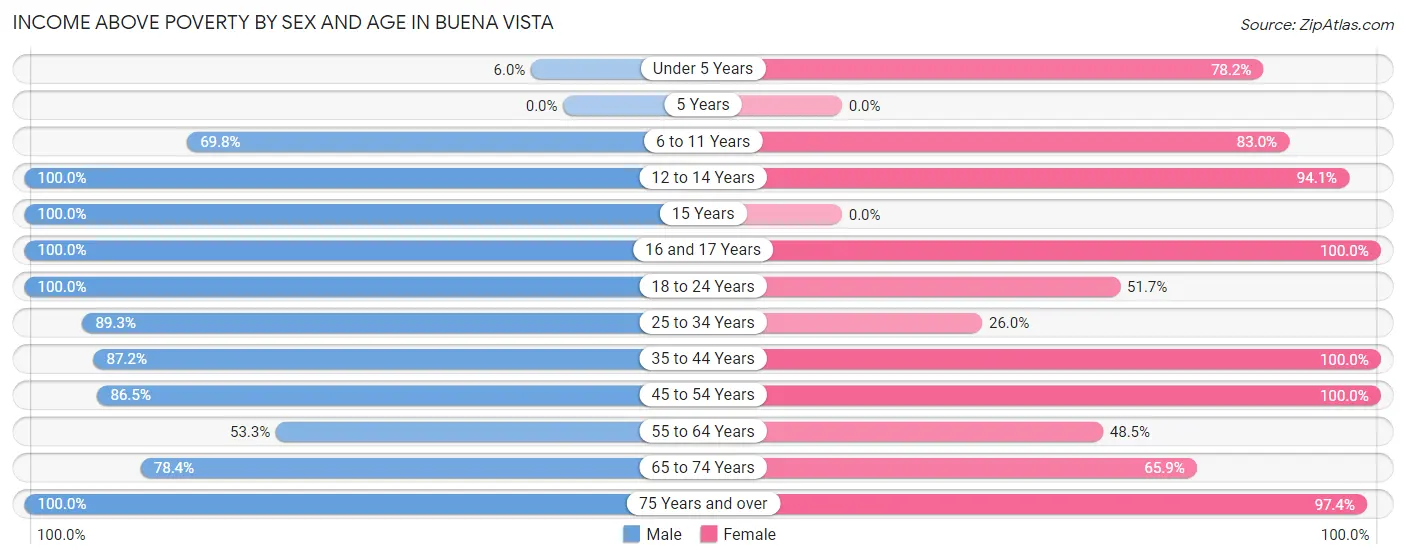
| Age Bracket | Male | Female |
| Under 5 Years | 4 (6.0%) | 61 (78.2%) |
| 5 Years | 0 (0.0%) | 0 (0.0%) |
| 6 to 11 Years | 37 (69.8%) | 78 (83.0%) |
| 12 to 14 Years | 2 (100.0%) | 80 (94.1%) |
| 15 Years | 41 (100.0%) | 0 (0.0%) |
| 16 and 17 Years | 51 (100.0%) | 32 (100.0%) |
| 18 to 24 Years | 122 (100.0%) | 78 (51.7%) |
| 25 to 34 Years | 83 (89.2%) | 19 (26.0%) |
| 35 to 44 Years | 109 (87.2%) | 190 (100.0%) |
| 45 to 54 Years | 83 (86.5%) | 74 (100.0%) |
| 55 to 64 Years | 24 (53.3%) | 63 (48.5%) |
| 65 to 74 Years | 69 (78.4%) | 54 (65.8%) |
| 75 Years and over | 42 (100.0%) | 38 (97.4%) |
| Total | 667 (80.8%) | 767 (74.6%) |
Income Below Poverty Among Married-Couple Families in Buena Vista
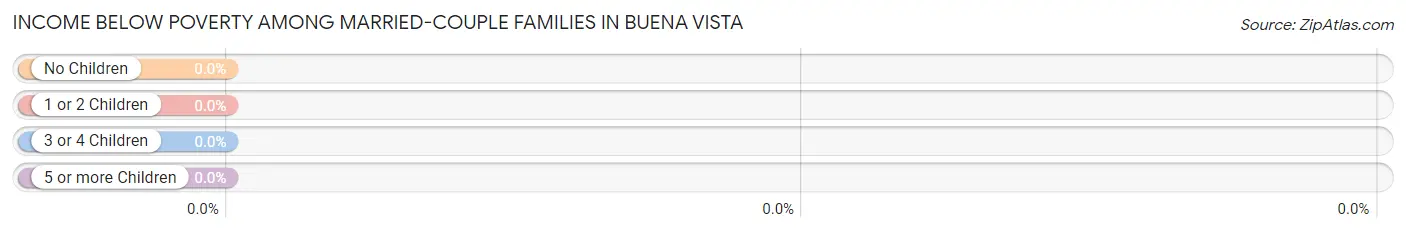
| Children | Above Poverty | Below Poverty |
| No Children | 82 (100.0%) | 0 (0.0%) |
| 1 or 2 Children | 88 (100.0%) | 0 (0.0%) |
| 3 or 4 Children | 29 (100.0%) | 0 (0.0%) |
| 5 or more Children | 0 (0.0%) | 0 (0.0%) |
| Total | 199 (100.0%) | 0 (0.0%) |
Income Below Poverty Among Single-Parent Households in Buena Vista
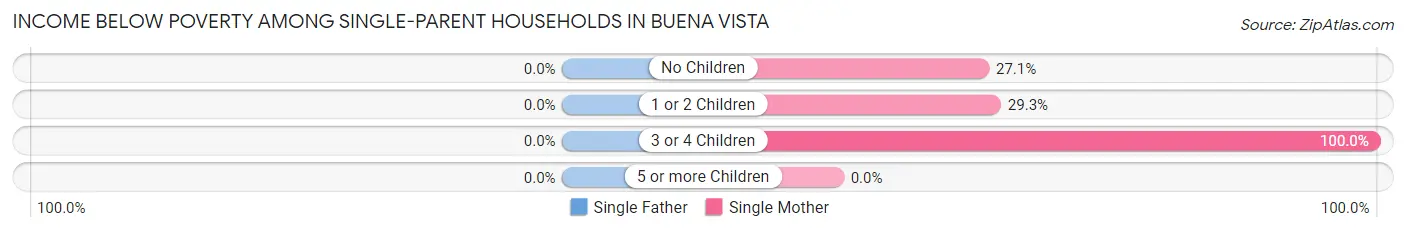
| Children | Single Father | Single Mother |
| No Children | 0 (0.0%) | 13 (27.1%) |
| 1 or 2 Children | 0 (0.0%) | 41 (29.3%) |
| 3 or 4 Children | 0 (0.0%) | 21 (100.0%) |
| 5 or more Children | 0 (0.0%) | 0 (0.0%) |
| Total | 0 (0.0%) | 75 (35.9%) |
Income Below Poverty Among Married-Couple vs Single-Parent Households in Buena Vista
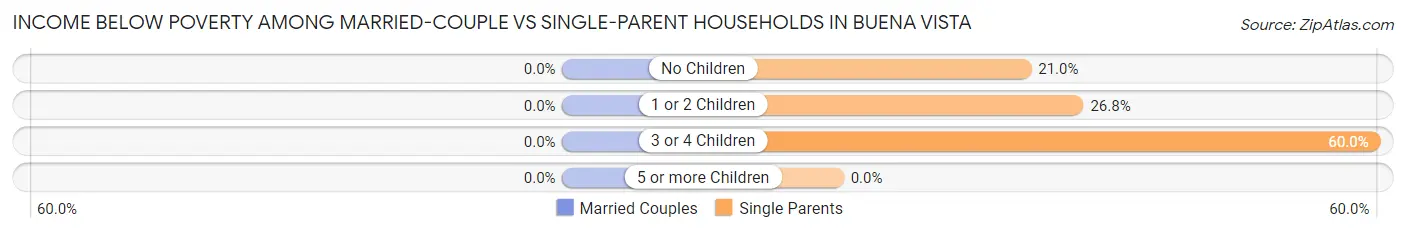
| Children | Married-Couple Families | Single-Parent Households |
| No Children | 0 (0.0%) | 13 (21.0%) |
| 1 or 2 Children | 0 (0.0%) | 41 (26.8%) |
| 3 or 4 Children | 0 (0.0%) | 21 (60.0%) |
| 5 or more Children | 0 (0.0%) | 0 (0.0%) |
| Total | 0 (0.0%) | 75 (30.0%) |
Race in Buena Vista
The most populous races in Buena Vista are Black / African American (1,262 | 64.3%), White / Caucasian (358 | 18.2%), and Hispanic or Latino (335 | 17.1%).
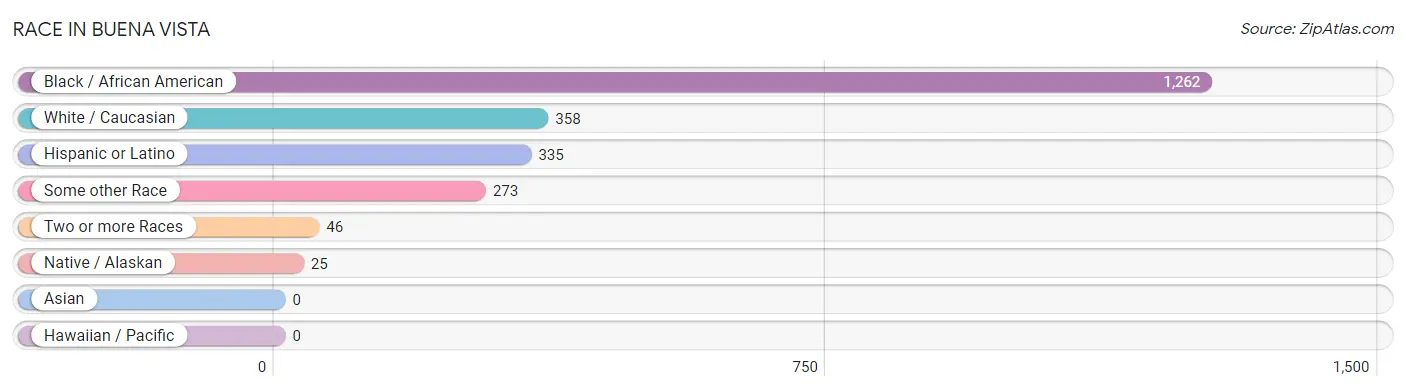
| Race | # Population | % Population |
| Asian | 0 | 0.0% |
| Black / African American | 1,262 | 64.3% |
| Hawaiian / Pacific | 0 | 0.0% |
| Hispanic or Latino | 335 | 17.1% |
| Native / Alaskan | 25 | 1.3% |
| White / Caucasian | 358 | 18.2% |
| Two or more Races | 46 | 2.3% |
| Some other Race | 273 | 13.9% |
| Total | 1,964 | 100.0% |
Ancestry in Buena Vista
The most populous ancestries reported in Buena Vista are Central American (276 | 14.1%), Guatemalan (258 | 13.1%), American (48 | 2.4%), English (33 | 1.7%), and Mexican (32 | 1.6%), together accounting for 32.9% of all Buena Vista residents.
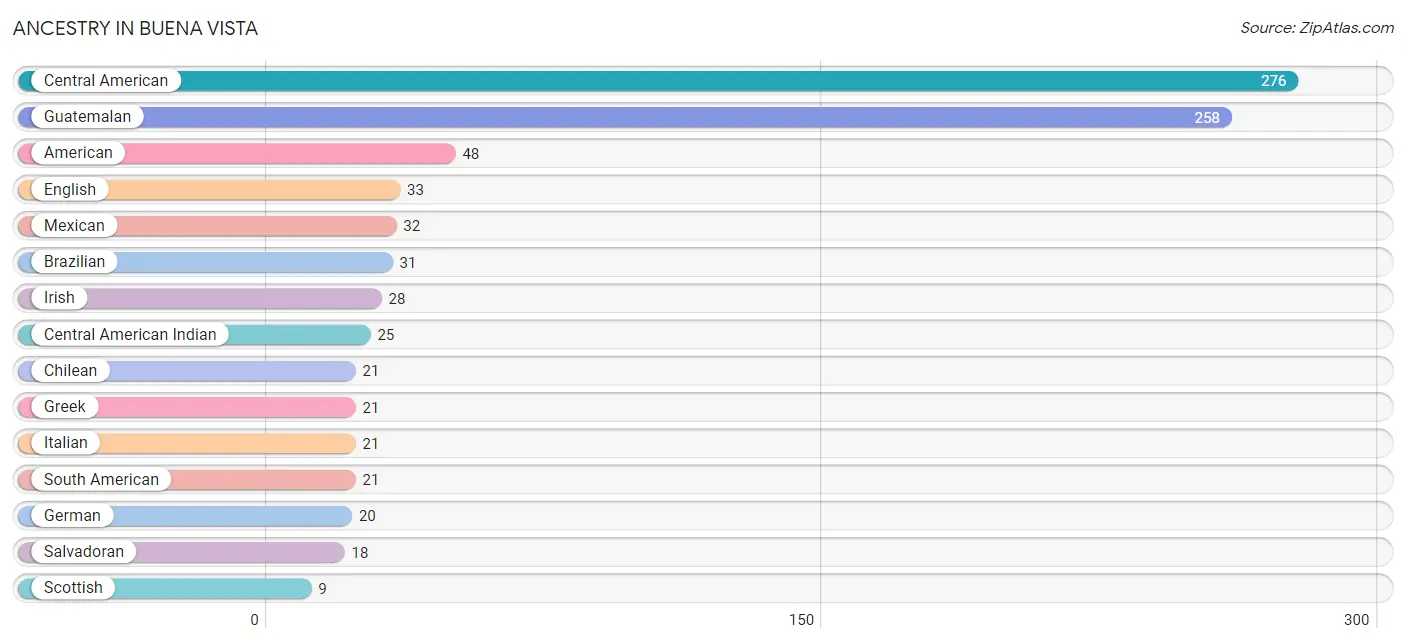
| Ancestry | # Population | % Population |
| American | 48 | 2.4% |
| Arab | 7 | 0.4% |
| Belgian | 4 | 0.2% |
| Brazilian | 31 | 1.6% |
| British | 3 | 0.2% |
| Central American | 276 | 14.1% |
| Central American Indian | 25 | 1.3% |
| Chilean | 21 | 1.1% |
| Cuban | 4 | 0.2% |
| Dutch | 5 | 0.3% |
| Egyptian | 2 | 0.1% |
| English | 33 | 1.7% |
| Finnish | 4 | 0.2% |
| German | 20 | 1.0% |
| Greek | 21 | 1.1% |
| Guatemalan | 258 | 13.1% |
| Irish | 28 | 1.4% |
| Italian | 21 | 1.1% |
| Lebanese | 5 | 0.3% |
| Mexican | 32 | 1.6% |
| Salvadoran | 18 | 0.9% |
| Scottish | 9 | 0.5% |
| South American | 21 | 1.1% | View All 23 Rows |
Immigrants in Buena Vista
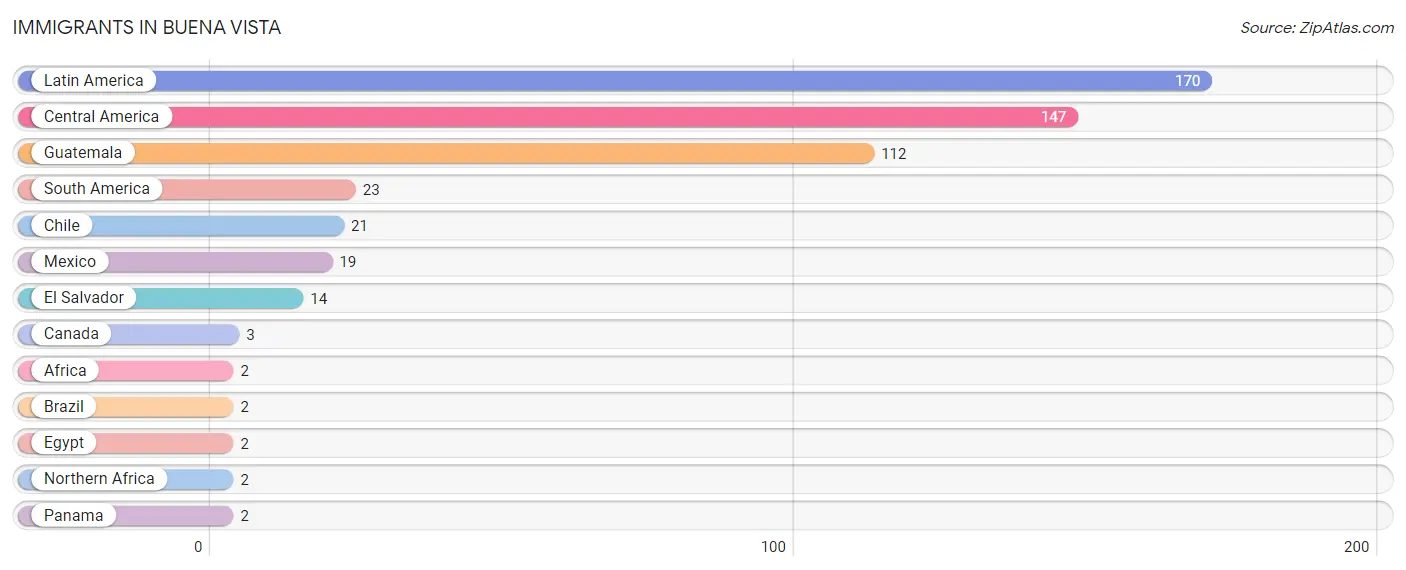
The most numerous immigrant groups reported in Buena Vista came from Latin America (170 | 8.7%), Central America (147 | 7.5%), Guatemala (112 | 5.7%), South America (23 | 1.2%), and Chile (21 | 1.1%), together accounting for 24.1% of all Buena Vista residents.
| Immigration Origin | # Population | % Population |
| Africa | 2 | 0.1% |
| Brazil | 2 | 0.1% |
| Canada | 3 | 0.2% |
| Central America | 147 | 7.5% |
| Chile | 21 | 1.1% |
| Egypt | 2 | 0.1% |
| El Salvador | 14 | 0.7% |
| Guatemala | 112 | 5.7% |
| Latin America | 170 | 8.7% |
| Mexico | 19 | 1.0% |
| Northern Africa | 2 | 0.1% |
| Panama | 2 | 0.1% |
| South America | 23 | 1.2% | View All 13 Rows |
Sex and Age in Buena Vista
Sex and Age in Buena Vista
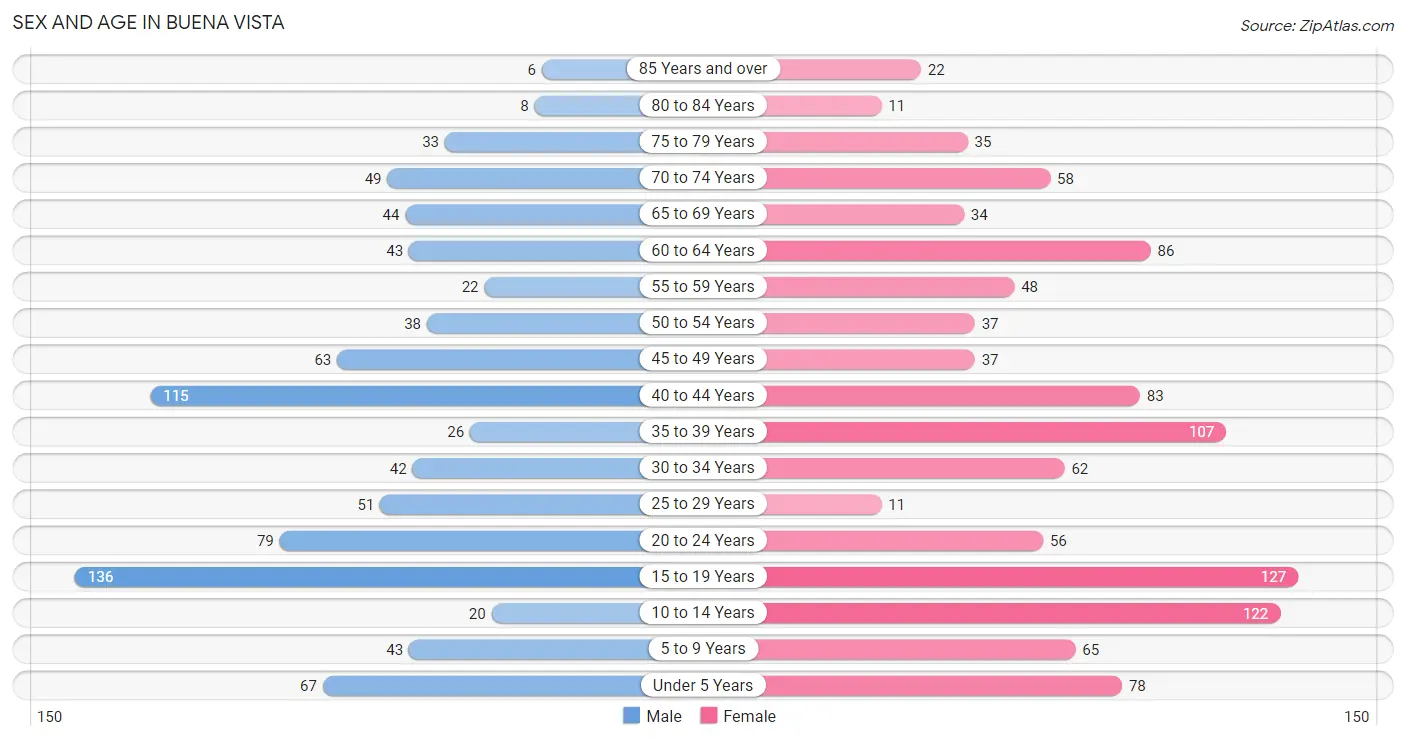
The most populous age groups in Buena Vista are 15 to 19 Years (136 | 15.4%) for men and 15 to 19 Years (127 | 11.8%) for women.
| Age Bracket | Male | Female |
| Under 5 Years | 67 (7.6%) | 78 (7.2%) |
| 5 to 9 Years | 43 (4.9%) | 65 (6.0%) |
| 10 to 14 Years | 20 (2.3%) | 122 (11.3%) |
| 15 to 19 Years | 136 (15.4%) | 127 (11.8%) |
| 20 to 24 Years | 79 (8.9%) | 56 (5.2%) |
| 25 to 29 Years | 51 (5.8%) | 11 (1.0%) |
| 30 to 34 Years | 42 (4.8%) | 62 (5.8%) |
| 35 to 39 Years | 26 (2.9%) | 107 (9.9%) |
| 40 to 44 Years | 115 (13.0%) | 83 (7.7%) |
| 45 to 49 Years | 63 (7.1%) | 37 (3.4%) |
| 50 to 54 Years | 38 (4.3%) | 37 (3.4%) |
| 55 to 59 Years | 22 (2.5%) | 48 (4.4%) |
| 60 to 64 Years | 43 (4.9%) | 86 (8.0%) |
| 65 to 69 Years | 44 (5.0%) | 34 (3.2%) |
| 70 to 74 Years | 49 (5.5%) | 58 (5.4%) |
| 75 to 79 Years | 33 (3.7%) | 35 (3.2%) |
| 80 to 84 Years | 8 (0.9%) | 11 (1.0%) |
| 85 Years and over | 6 (0.7%) | 22 (2.0%) |
| Total | 885 (100.0%) | 1,079 (100.0%) |
Families and Households in Buena Vista
Median Family Size in Buena Vista
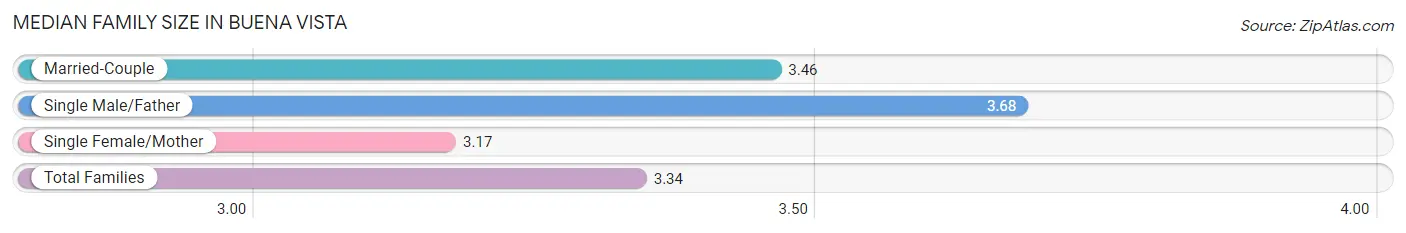
The median family size in Buena Vista is 3.34 persons per family, with single male/father families (41 | 9.1%) accounting for the largest median family size of 3.68 persons per family. On the other hand, single female/mother families (209 | 46.6%) represent the smallest median family size with 3.17 persons per family.
| Family Type | # Families | Family Size |
| Married-Couple | 199 (44.3%) | 3.46 |
| Single Male/Father | 41 (9.1%) | 3.68 |
| Single Female/Mother | 209 (46.6%) | 3.17 |
| Total Families | 449 (100.0%) | 3.34 |
Median Household Size in Buena Vista
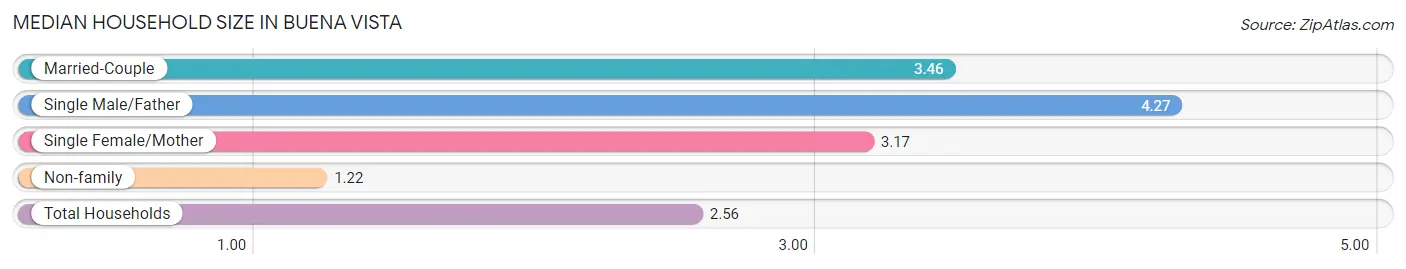
The median household size in Buena Vista is 2.56 persons per household, with single male/father households (41 | 5.6%) accounting for the largest median household size of 4.27 persons per household. non-family households (280 | 38.4%) represent the smallest median household size with 1.22 persons per household.
| Household Type | # Households | Household Size |
| Married-Couple | 199 (27.3%) | 3.46 |
| Single Male/Father | 41 (5.6%) | 4.27 |
| Single Female/Mother | 209 (28.7%) | 3.17 |
| Non-family | 280 (38.4%) | 1.22 |
| Total Households | 729 (100.0%) | 2.56 |
Household Size by Marriage Status in Buena Vista
Out of a total of 729 households in Buena Vista, 449 (61.6%) are family households, while 280 (38.4%) are nonfamily households. The most numerous type of family households are 2-person households, comprising 154, and the most common type of nonfamily households are 1-person households, comprising 240.
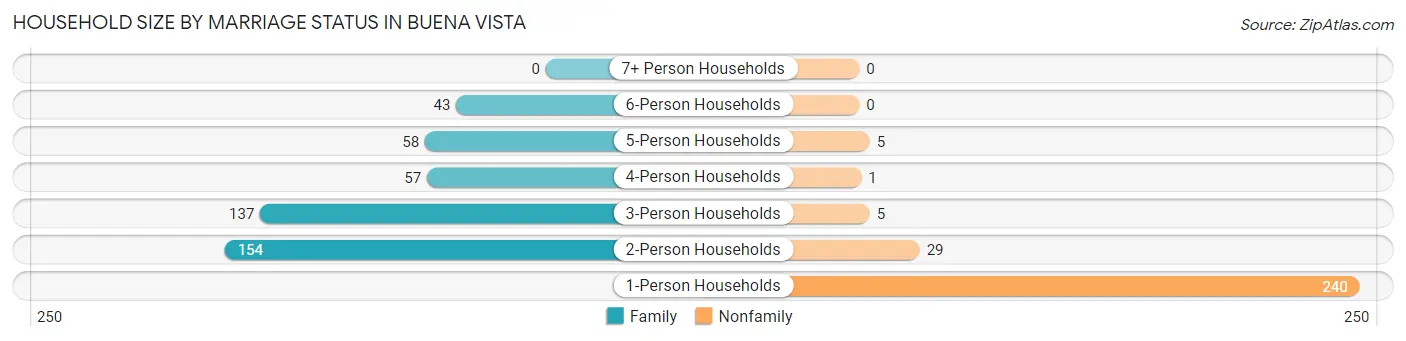
| Household Size | Family Households | Nonfamily Households |
| 1-Person Households | - | 240 (32.9%) |
| 2-Person Households | 154 (21.1%) | 29 (4.0%) |
| 3-Person Households | 137 (18.8%) | 5 (0.7%) |
| 4-Person Households | 57 (7.8%) | 1 (0.1%) |
| 5-Person Households | 58 (8.0%) | 5 (0.7%) |
| 6-Person Households | 43 (5.9%) | 0 (0.0%) |
| 7+ Person Households | 0 (0.0%) | 0 (0.0%) |
| Total | 449 (61.6%) | 280 (38.4%) |
Female Fertility in Buena Vista
Fertility by Age in Buena Vista
Average fertility rate in Buena Vista is 93.0 births per 1,000 women. Women in the age bracket of 15 to 19 years have the highest fertility rate with 189.0 births per 1,000 women. Women in the age bracket of 15 to 19 years acount for 53.3% of all women with births.
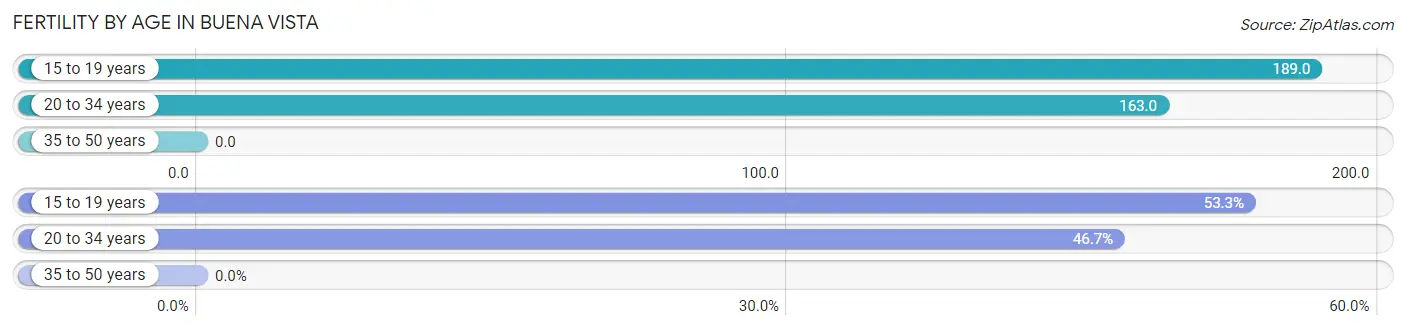
| Age Bracket | Women with Births | Births / 1,000 Women |
| 15 to 19 years | 24 (53.3%) | 189.0 |
| 20 to 34 years | 21 (46.7%) | 163.0 |
| 35 to 50 years | 0 (0.0%) | 0.0 |
| Total | 45 (100.0%) | 93.0 |
Fertility by Age by Marriage Status in Buena Vista
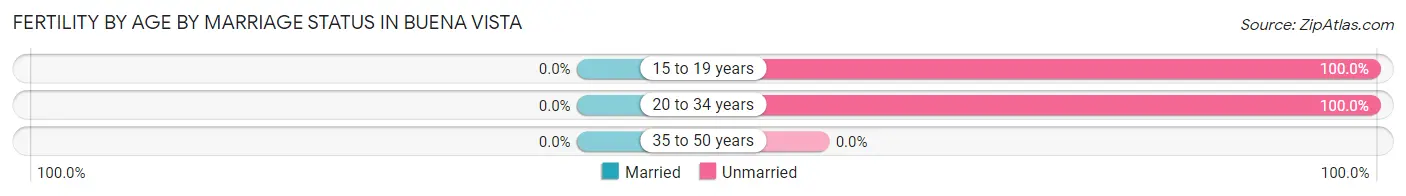
| Age Bracket | Married | Unmarried |
| 15 to 19 years | 0 (0.0%) | 24 (100.0%) |
| 20 to 34 years | 0 (0.0%) | 21 (100.0%) |
| 35 to 50 years | 0 (0.0%) | 0 (0.0%) |
| Total | 0 (0.0%) | 45 (100.0%) |
Fertility by Education in Buena Vista
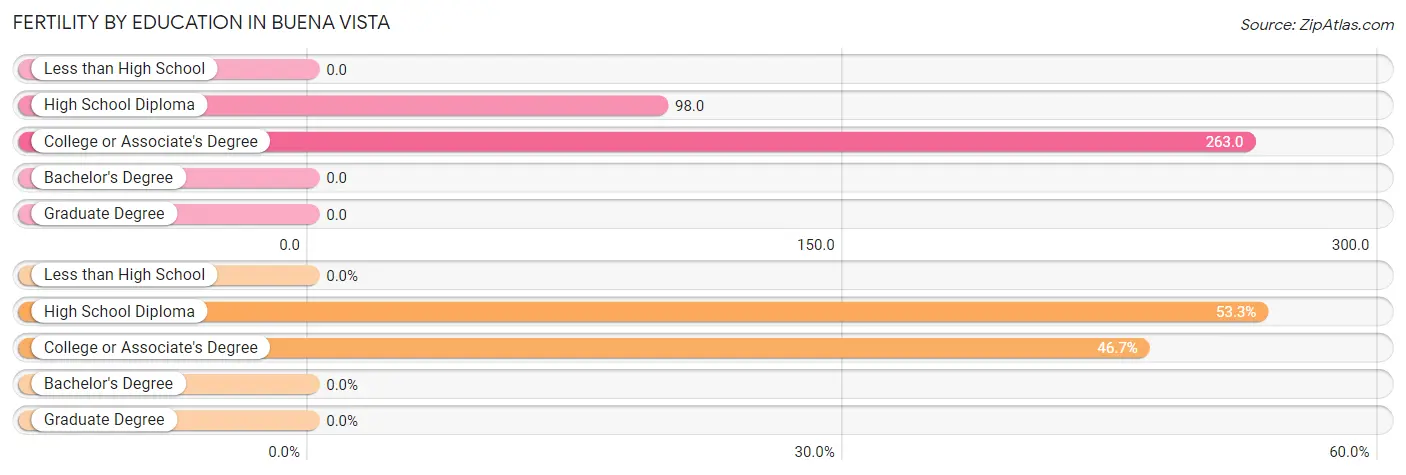
| Educational Attainment | Women with Births | Births / 1,000 Women |
| Less than High School | 0 (0.0%) | 0.0 |
| High School Diploma | 24 (53.3%) | 98.0 |
| College or Associate's Degree | 21 (46.7%) | 263.0 |
| Bachelor's Degree | 0 (0.0%) | 0.0 |
| Graduate Degree | 0 (0.0%) | 0.0 |
| Total | 45 (100.0%) | 93.0 |
Fertility by Education by Marriage Status in Buena Vista
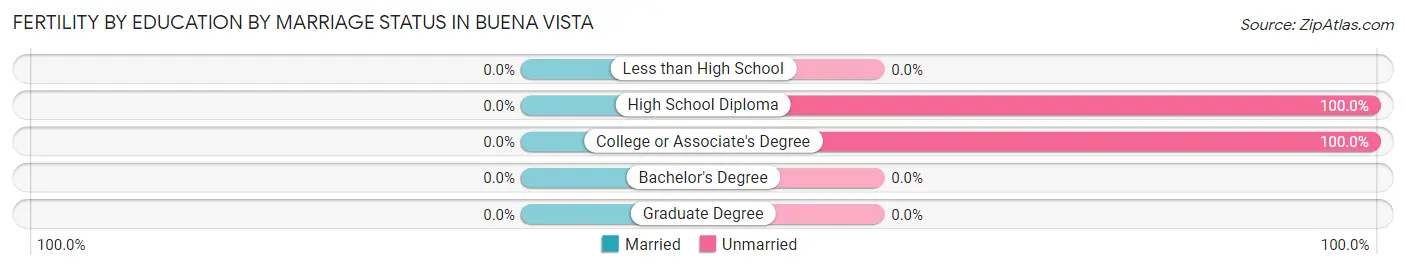
| Educational Attainment | Married | Unmarried |
| Less than High School | 0 (0.0%) | 0 (0.0%) |
| High School Diploma | 0 (0.0%) | 24 (100.0%) |
| College or Associate's Degree | 0 (0.0%) | 21 (100.0%) |
| Bachelor's Degree | 0 (0.0%) | 0 (0.0%) |
| Graduate Degree | 0 (0.0%) | 0 (0.0%) |
| Total | 0 (0.0%) | 45 (100.0%) |
Employment Characteristics in Buena Vista
Employment by Class of Employer in Buena Vista
Among the 607 employed individuals in Buena Vista, private company employees (499 | 82.2%), local government employees (50 | 8.2%), and self-employed (not incorporated) (29 | 4.8%) make up the most common classes of employment.
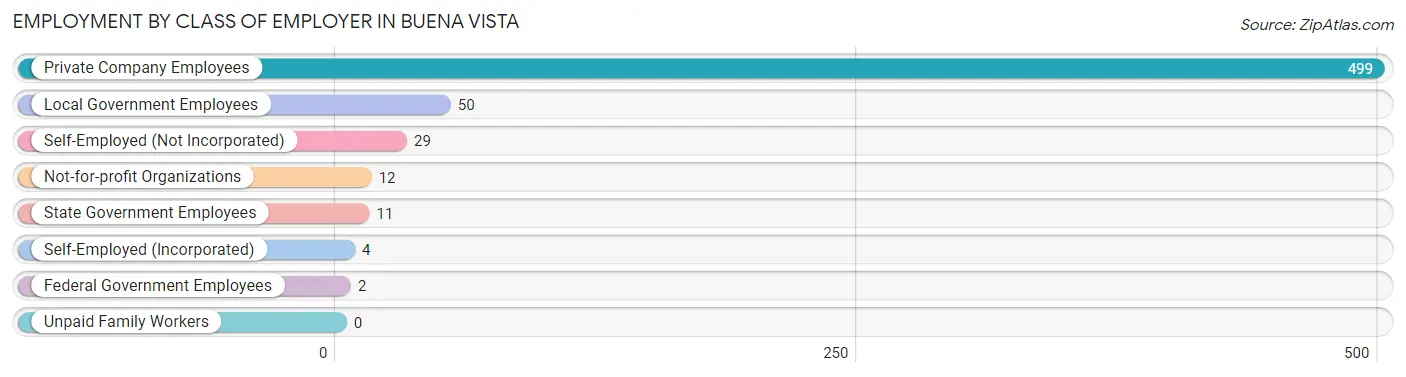
| Employer Class | # Employees | % Employees |
| Private Company Employees | 499 | 82.2% |
| Self-Employed (Incorporated) | 4 | 0.7% |
| Self-Employed (Not Incorporated) | 29 | 4.8% |
| Not-for-profit Organizations | 12 | 2.0% |
| Local Government Employees | 50 | 8.2% |
| State Government Employees | 11 | 1.8% |
| Federal Government Employees | 2 | 0.3% |
| Unpaid Family Workers | 0 | 0.0% |
| Total | 607 | 100.0% |
Employment Status by Age in Buena Vista
According to the labor force statistics for Buena Vista, out of the total population over 16 years of age (1,528), 39.9% or 610 individuals are in the labor force, with 0.3% or 2 of them unemployed. The age group with the highest labor force participation rate is 25 to 29 years, with 85.5% or 53 individuals in the labor force. Within the labor force, the 25 to 29 years age range has the highest percentage of unemployed individuals, with 3.8% or 2 of them being unemployed.
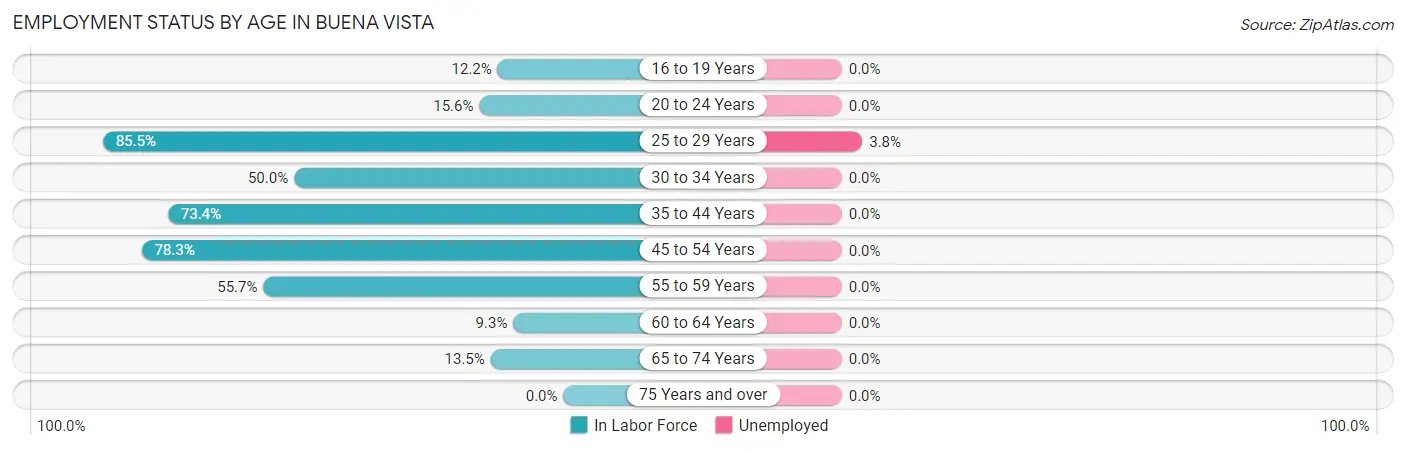
| Age Bracket | In Labor Force | Unemployed |
| 16 to 19 Years | 27 (12.2%) | 0 (0.0%) |
| 20 to 24 Years | 21 (15.6%) | 0 (0.0%) |
| 25 to 29 Years | 53 (85.5%) | 2 (3.8%) |
| 30 to 34 Years | 52 (50.0%) | 0 (0.0%) |
| 35 to 44 Years | 243 (73.4%) | 0 (0.0%) |
| 45 to 54 Years | 137 (78.3%) | 0 (0.0%) |
| 55 to 59 Years | 39 (55.7%) | 0 (0.0%) |
| 60 to 64 Years | 12 (9.3%) | 0 (0.0%) |
| 65 to 74 Years | 25 (13.5%) | 0 (0.0%) |
| 75 Years and over | 0 (0.0%) | 0 (0.0%) |
| Total | 610 (39.9%) | 2 (0.3%) |
Employment Status by Educational Attainment in Buena Vista
According to labor force statistics for Buena Vista, 61.5% of individuals (536) out of the total population between 25 and 64 years of age (871) are in the labor force, with 0.4% or 2 of them being unemployed. The group with the highest labor force participation rate are those with the educational attainment of bachelor's degree or higher, with 92.5% or 74 individuals in the labor force. Within the labor force, individuals with college / associate degree education have the highest percentage of unemployment, with 2.1% or 2 of them being unemployed.
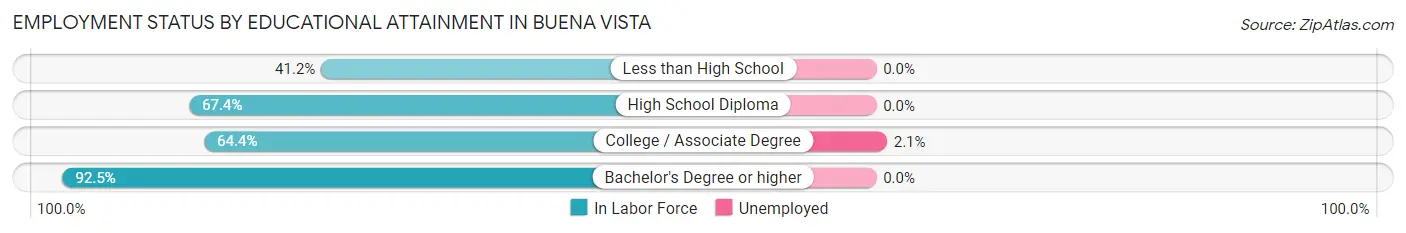
| Educational Attainment | In Labor Force | Unemployed |
| Less than High School | 105 (41.2%) | 0 (0.0%) |
| High School Diploma | 261 (67.4%) | 0 (0.0%) |
| College / Associate Degree | 96 (64.4%) | 3 (2.1%) |
| Bachelor's Degree or higher | 74 (92.5%) | 0 (0.0%) |
| Total | 536 (61.5%) | 3 (0.4%) |
Employment Occupations by Sex in Buena Vista
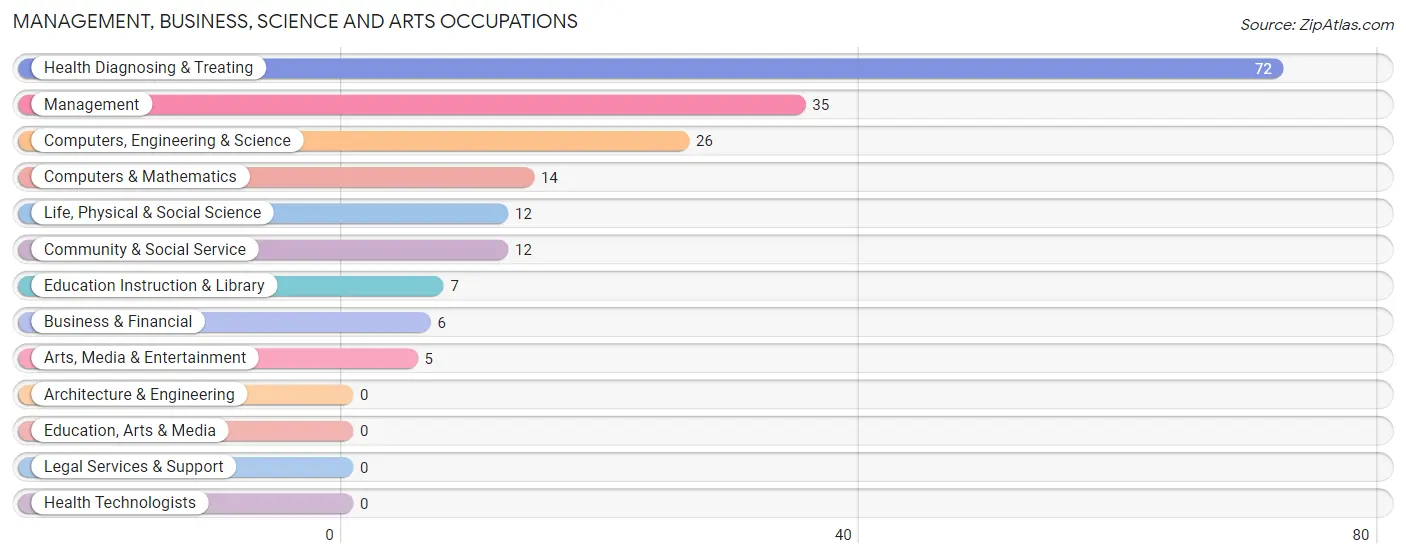
Management, Business, Science and Arts Occupations
The most common Management, Business, Science and Arts occupations in Buena Vista are Health Diagnosing & Treating (72 | 11.9%), Management (35 | 5.8%), Computers, Engineering & Science (26 | 4.3%), Computers & Mathematics (14 | 2.3%), and Life, Physical & Social Science (12 | 2.0%).
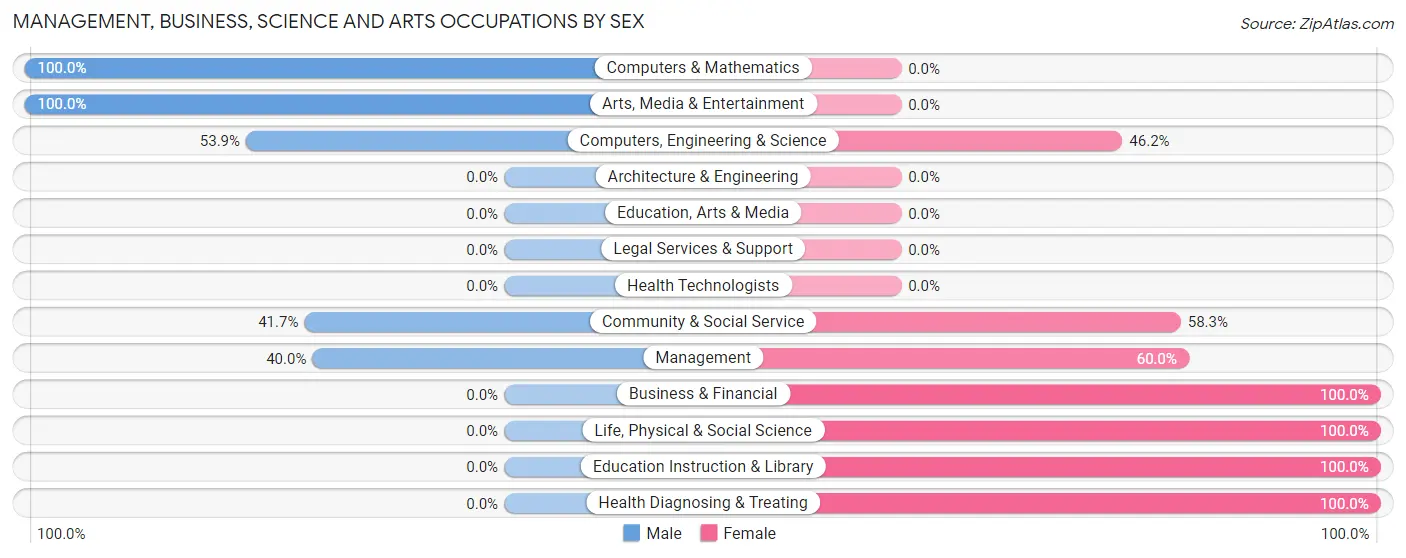
Management, Business, Science and Arts Occupations by Sex
Within the Management, Business, Science and Arts occupations in Buena Vista, the most male-oriented occupations are Computers & Mathematics (100.0%), Arts, Media & Entertainment (100.0%), and Computers, Engineering & Science (53.8%), while the most female-oriented occupations are Business & Financial (100.0%), Life, Physical & Social Science (100.0%), and Education Instruction & Library (100.0%).
| Occupation | Male | Female |
| Management | 14 (40.0%) | 21 (60.0%) |
| Business & Financial | 0 (0.0%) | 6 (100.0%) |
| Computers, Engineering & Science | 14 (53.8%) | 12 (46.2%) |
| Computers & Mathematics | 14 (100.0%) | 0 (0.0%) |
| Architecture & Engineering | 0 (0.0%) | 0 (0.0%) |
| Life, Physical & Social Science | 0 (0.0%) | 12 (100.0%) |
| Community & Social Service | 5 (41.7%) | 7 (58.3%) |
| Education, Arts & Media | 0 (0.0%) | 0 (0.0%) |
| Legal Services & Support | 0 (0.0%) | 0 (0.0%) |
| Education Instruction & Library | 0 (0.0%) | 7 (100.0%) |
| Arts, Media & Entertainment | 5 (100.0%) | 0 (0.0%) |
| Health Diagnosing & Treating | 0 (0.0%) | 72 (100.0%) |
| Health Technologists | 0 (0.0%) | 0 (0.0%) |
| Total (Category) | 33 (21.8%) | 118 (78.1%) |
| Total (Overall) | 280 (46.1%) | 327 (53.9%) |
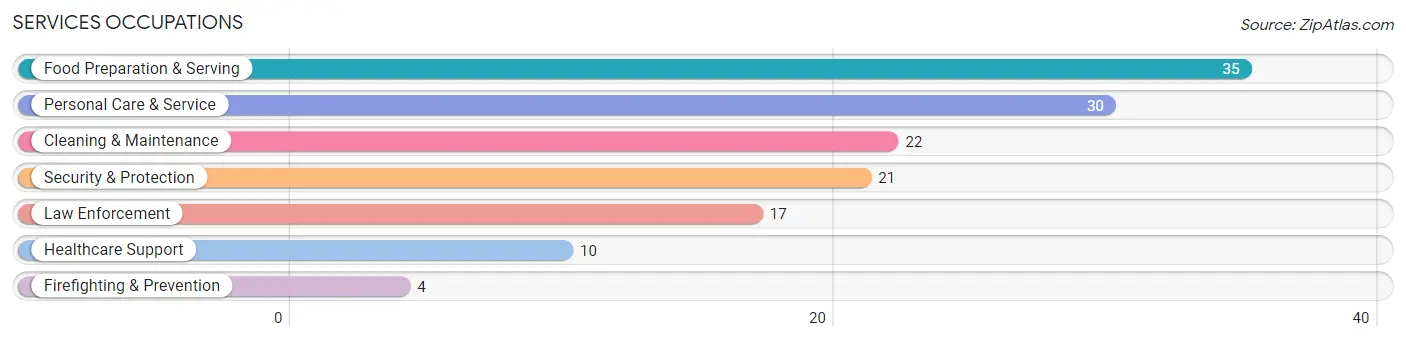
Services Occupations
The most common Services occupations in Buena Vista are Food Preparation & Serving (35 | 5.8%), Personal Care & Service (30 | 4.9%), Cleaning & Maintenance (22 | 3.6%), Security & Protection (21 | 3.5%), and Law Enforcement (17 | 2.8%).
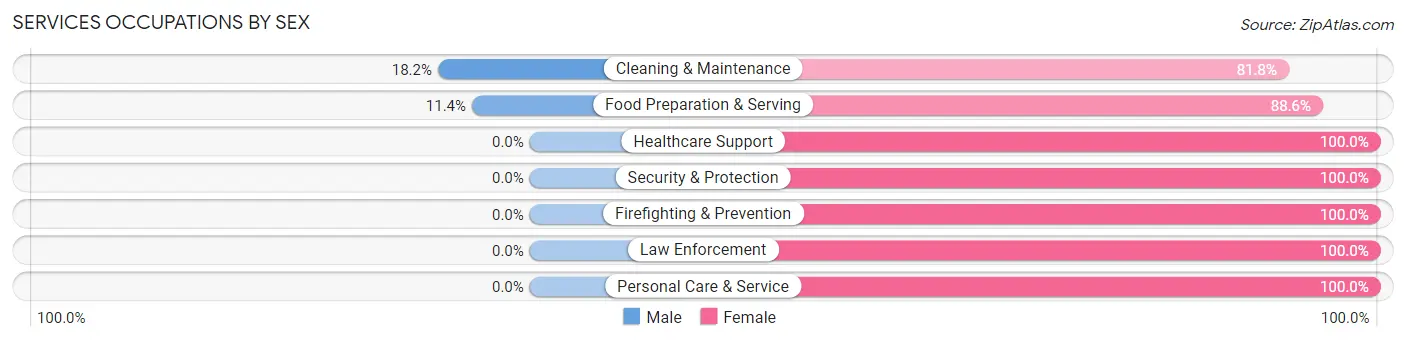
Services Occupations by Sex
Within the Services occupations in Buena Vista, the most male-oriented occupations are Cleaning & Maintenance (18.2%), and Food Preparation & Serving (11.4%), while the most female-oriented occupations are Healthcare Support (100.0%), Security & Protection (100.0%), and Firefighting & Prevention (100.0%).
| Occupation | Male | Female |
| Healthcare Support | 0 (0.0%) | 10 (100.0%) |
| Security & Protection | 0 (0.0%) | 21 (100.0%) |
| Firefighting & Prevention | 0 (0.0%) | 4 (100.0%) |
| Law Enforcement | 0 (0.0%) | 17 (100.0%) |
| Food Preparation & Serving | 4 (11.4%) | 31 (88.6%) |
| Cleaning & Maintenance | 4 (18.2%) | 18 (81.8%) |
| Personal Care & Service | 0 (0.0%) | 30 (100.0%) |
| Total (Category) | 8 (6.8%) | 110 (93.2%) |
| Total (Overall) | 280 (46.1%) | 327 (53.9%) |
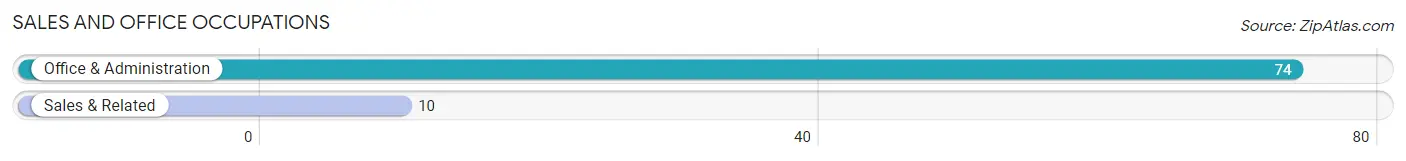
Sales and Office Occupations
The most common Sales and Office occupations in Buena Vista are Office & Administration (74 | 12.2%), and Sales & Related (10 | 1.7%).
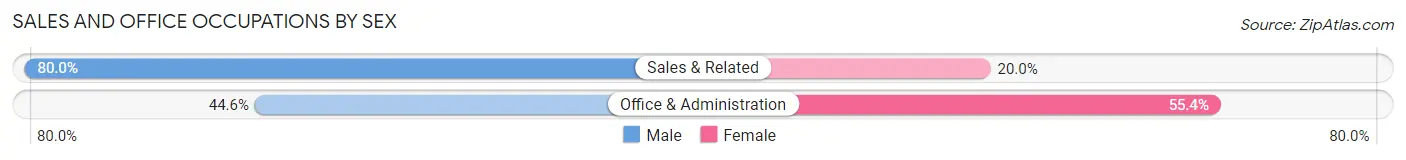
Sales and Office Occupations by Sex
| Occupation | Male | Female |
| Sales & Related | 8 (80.0%) | 2 (20.0%) |
| Office & Administration | 33 (44.6%) | 41 (55.4%) |
| Total (Category) | 41 (48.8%) | 43 (51.2%) |
| Total (Overall) | 280 (46.1%) | 327 (53.9%) |
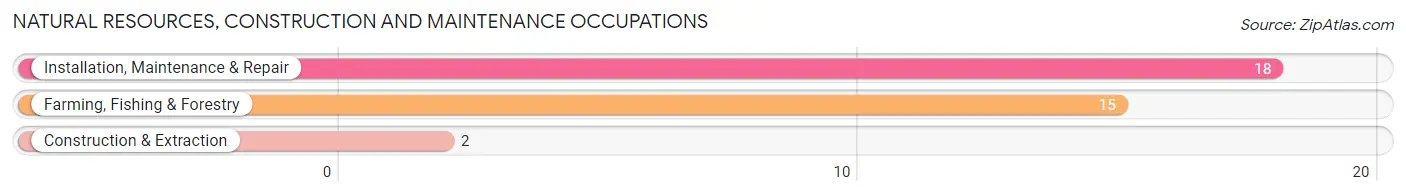
Natural Resources, Construction and Maintenance Occupations
The most common Natural Resources, Construction and Maintenance occupations in Buena Vista are Installation, Maintenance & Repair (18 | 3.0%), Farming, Fishing & Forestry (15 | 2.5%), and Construction & Extraction (2 | 0.3%).
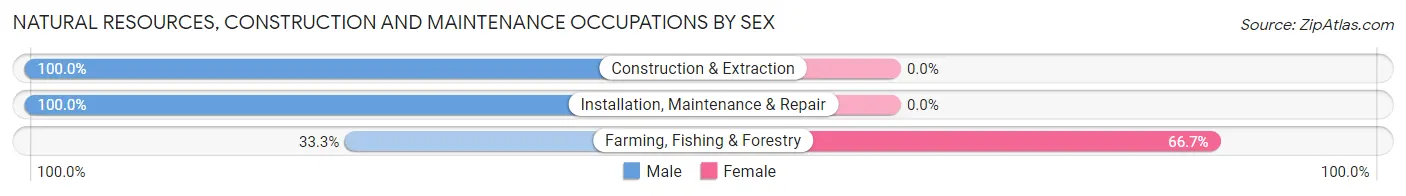
Natural Resources, Construction and Maintenance Occupations by Sex
| Occupation | Male | Female |
| Farming, Fishing & Forestry | 5 (33.3%) | 10 (66.7%) |
| Construction & Extraction | 2 (100.0%) | 0 (0.0%) |
| Installation, Maintenance & Repair | 18 (100.0%) | 0 (0.0%) |
| Total (Category) | 25 (71.4%) | 10 (28.6%) |
| Total (Overall) | 280 (46.1%) | 327 (53.9%) |
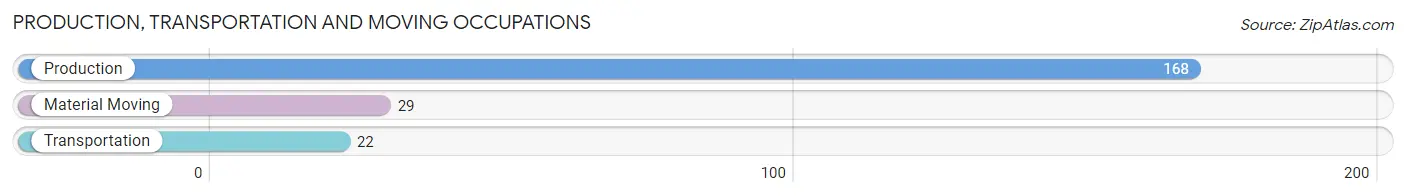
Production, Transportation and Moving Occupations
The most common Production, Transportation and Moving occupations in Buena Vista are Production (168 | 27.7%), Material Moving (29 | 4.8%), and Transportation (22 | 3.6%).
Production, Transportation and Moving Occupations by Sex
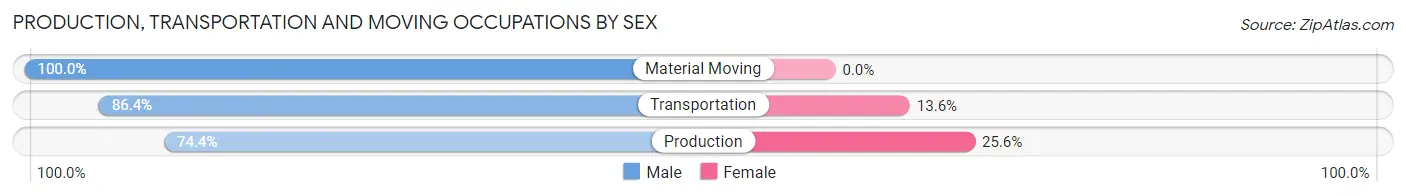
| Occupation | Male | Female |
| Production | 125 (74.4%) | 43 (25.6%) |
| Transportation | 19 (86.4%) | 3 (13.6%) |
| Material Moving | 29 (100.0%) | 0 (0.0%) |
| Total (Category) | 173 (79.0%) | 46 (21.0%) |
| Total (Overall) | 280 (46.1%) | 327 (53.9%) |
Employment Industries by Sex in Buena Vista
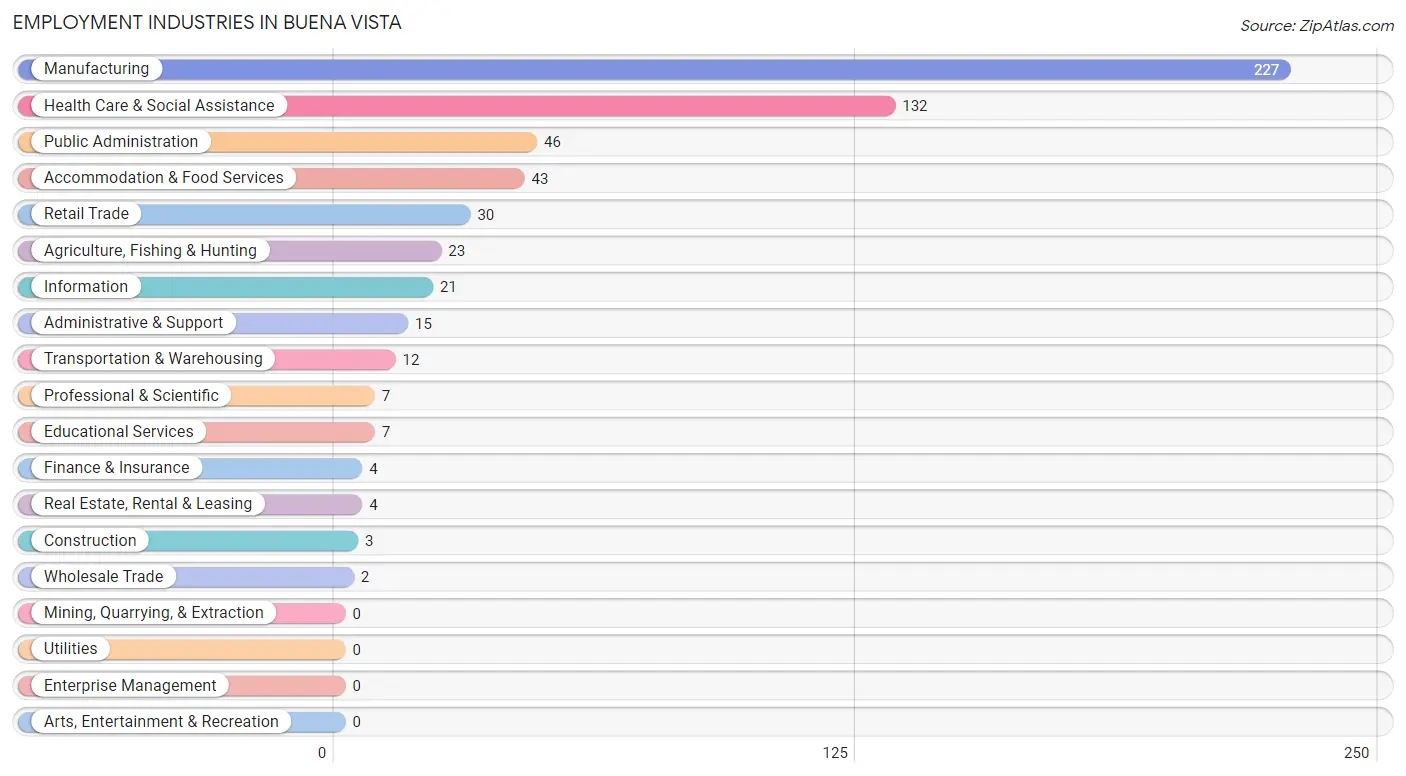
Employment Industries in Buena Vista
The major employment industries in Buena Vista include Manufacturing (227 | 37.4%), Health Care & Social Assistance (132 | 21.7%), Public Administration (46 | 7.6%), Accommodation & Food Services (43 | 7.1%), and Retail Trade (30 | 4.9%).
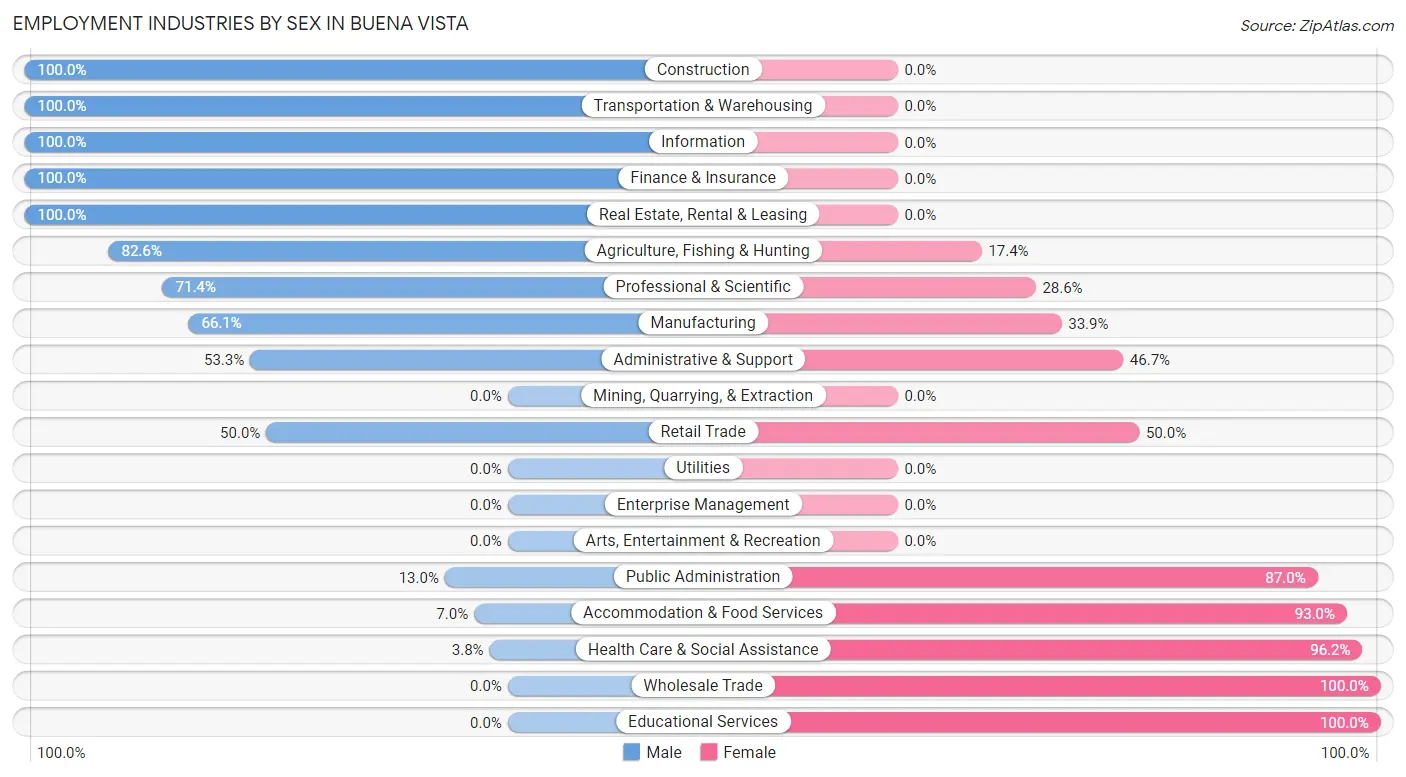
Employment Industries by Sex in Buena Vista
The Buena Vista industries that see more men than women are Construction (100.0%), Transportation & Warehousing (100.0%), and Information (100.0%), whereas the industries that tend to have a higher number of women are Wholesale Trade (100.0%), Educational Services (100.0%), and Health Care & Social Assistance (96.2%).
| Industry | Male | Female |
| Agriculture, Fishing & Hunting | 19 (82.6%) | 4 (17.4%) |
| Mining, Quarrying, & Extraction | 0 (0.0%) | 0 (0.0%) |
| Construction | 3 (100.0%) | 0 (0.0%) |
| Manufacturing | 150 (66.1%) | 77 (33.9%) |
| Wholesale Trade | 0 (0.0%) | 2 (100.0%) |
| Retail Trade | 15 (50.0%) | 15 (50.0%) |
| Transportation & Warehousing | 12 (100.0%) | 0 (0.0%) |
| Utilities | 0 (0.0%) | 0 (0.0%) |
| Information | 21 (100.0%) | 0 (0.0%) |
| Finance & Insurance | 4 (100.0%) | 0 (0.0%) |
| Real Estate, Rental & Leasing | 4 (100.0%) | 0 (0.0%) |
| Professional & Scientific | 5 (71.4%) | 2 (28.6%) |
| Enterprise Management | 0 (0.0%) | 0 (0.0%) |
| Administrative & Support | 8 (53.3%) | 7 (46.7%) |
| Educational Services | 0 (0.0%) | 7 (100.0%) |
| Health Care & Social Assistance | 5 (3.8%) | 127 (96.2%) |
| Arts, Entertainment & Recreation | 0 (0.0%) | 0 (0.0%) |
| Accommodation & Food Services | 3 (7.0%) | 40 (93.0%) |
| Public Administration | 6 (13.0%) | 40 (87.0%) |
| Total | 280 (46.1%) | 327 (53.9%) |
Education in Buena Vista
School Enrollment in Buena Vista
The most common levels of schooling among the 508 students in Buena Vista are high school (194 | 38.2%), middle school (127 | 25.0%), and elementary school (98 | 19.3%).
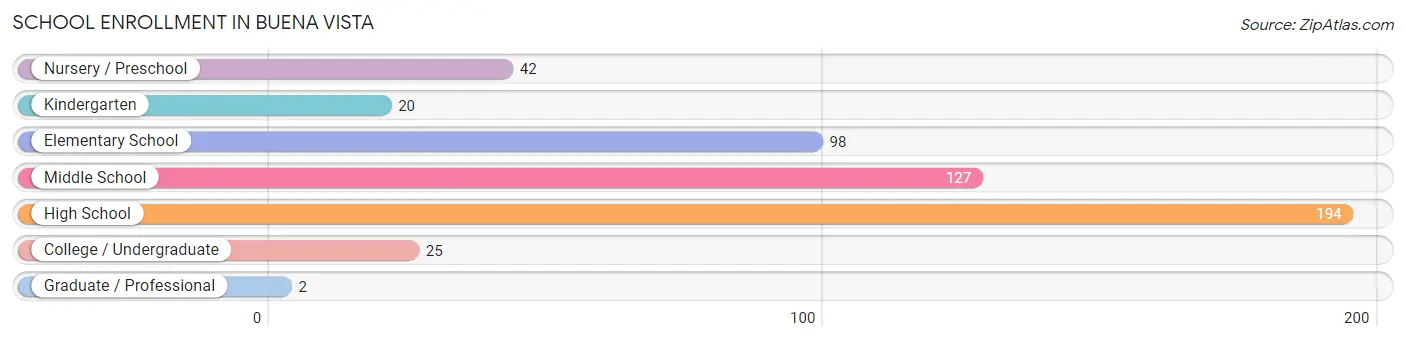
| School Level | # Students | % Students |
| Nursery / Preschool | 42 | 8.3% |
| Kindergarten | 20 | 3.9% |
| Elementary School | 98 | 19.3% |
| Middle School | 127 | 25.0% |
| High School | 194 | 38.2% |
| College / Undergraduate | 25 | 4.9% |
| Graduate / Professional | 2 | 0.4% |
| Total | 508 | 100.0% |
School Enrollment by Age by Funding Source in Buena Vista
Out of a total of 508 students who are enrolled in schools in Buena Vista, 23 (4.5%) attend a private institution, while the remaining 485 (95.5%) are enrolled in public schools. The age group of 25 to 34 year olds has the highest likelihood of being enrolled in private schools, with 2 (100.0% in the age bracket) enrolled. Conversely, the age group of 5 to 9 year old has the lowest likelihood of being enrolled in a private school, with 108 (100.0% in the age bracket) attending a public institution.
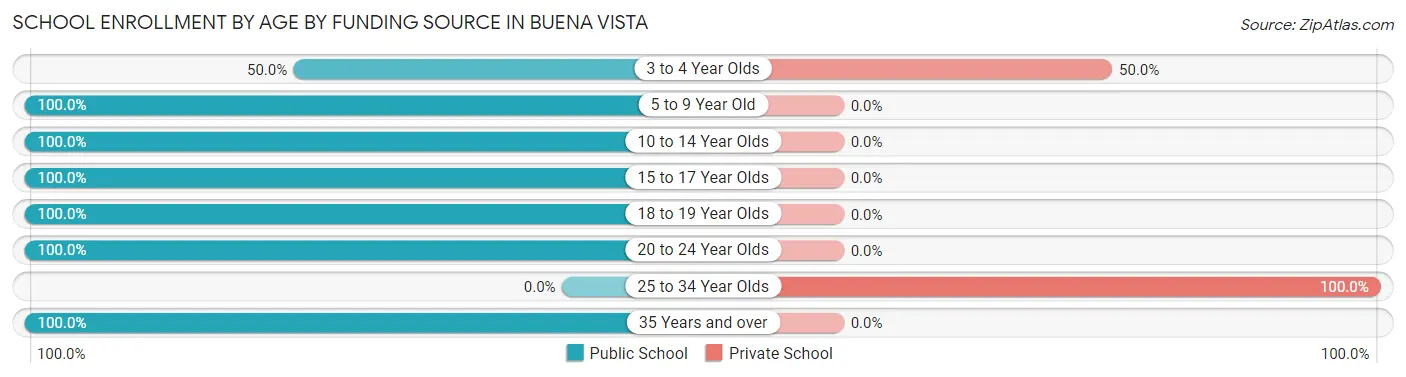
| Age Bracket | Public School | Private School |
| 3 to 4 Year Olds | 21 (50.0%) | 21 (50.0%) |
| 5 to 9 Year Old | 108 (100.0%) | 0 (0.0%) |
| 10 to 14 Year Olds | 142 (100.0%) | 0 (0.0%) |
| 15 to 17 Year Olds | 124 (100.0%) | 0 (0.0%) |
| 18 to 19 Year Olds | 62 (100.0%) | 0 (0.0%) |
| 20 to 24 Year Olds | 20 (100.0%) | 0 (0.0%) |
| 25 to 34 Year Olds | 0 (0.0%) | 2 (100.0%) |
| 35 Years and over | 8 (100.0%) | 0 (0.0%) |
| Total | 485 (95.5%) | 23 (4.5%) |
Educational Attainment by Field of Study in Buena Vista
Business (59 | 68.6%), engineering (10 | 11.6%), bio, nature & agricultural (6 | 7.0%), education (6 | 7.0%), and communications (5 | 5.8%) are the most common fields of study among 86 individuals in Buena Vista who have obtained a bachelor's degree or higher.
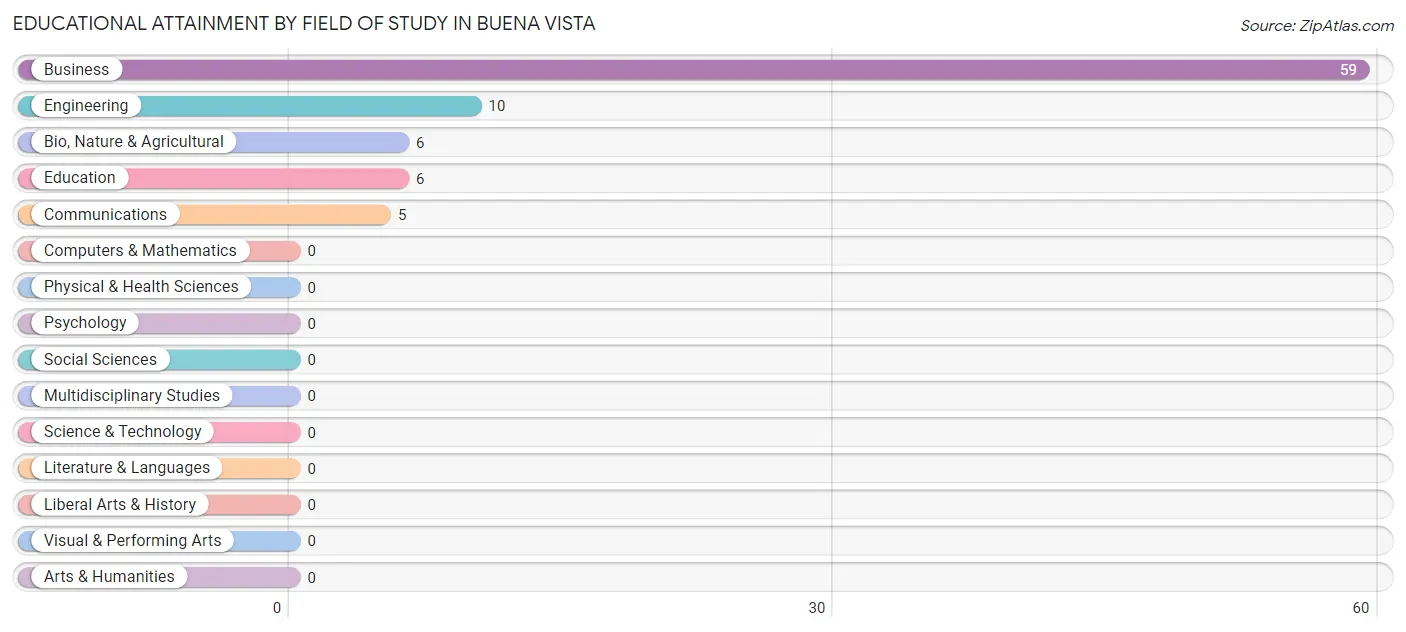
| Field of Study | # Graduates | % Graduates |
| Computers & Mathematics | 0 | 0.0% |
| Bio, Nature & Agricultural | 6 | 7.0% |
| Physical & Health Sciences | 0 | 0.0% |
| Psychology | 0 | 0.0% |
| Social Sciences | 0 | 0.0% |
| Engineering | 10 | 11.6% |
| Multidisciplinary Studies | 0 | 0.0% |
| Science & Technology | 0 | 0.0% |
| Business | 59 | 68.6% |
| Education | 6 | 7.0% |
| Literature & Languages | 0 | 0.0% |
| Liberal Arts & History | 0 | 0.0% |
| Visual & Performing Arts | 0 | 0.0% |
| Communications | 5 | 5.8% |
| Arts & Humanities | 0 | 0.0% |
| Total | 86 | 100.0% |
Transportation & Commute in Buena Vista
Vehicle Availability by Sex in Buena Vista
The most prevalent vehicle ownership categories in Buena Vista are males with 2 vehicles (73, accounting for 26.1%) and females with 2 vehicles (14, making up 22.5%).
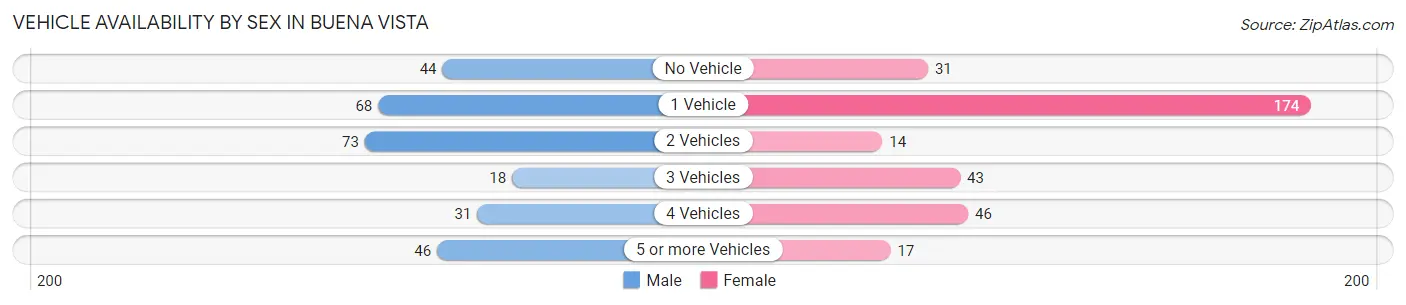
| Vehicles Available | Male | Female |
| No Vehicle | 44 (15.7%) | 31 (9.5%) |
| 1 Vehicle | 68 (24.3%) | 174 (53.5%) |
| 2 Vehicles | 73 (26.1%) | 14 (4.3%) |
| 3 Vehicles | 18 (6.4%) | 43 (13.2%) |
| 4 Vehicles | 31 (11.1%) | 46 (14.1%) |
| 5 or more Vehicles | 46 (16.4%) | 17 (5.2%) |
| Total | 280 (100.0%) | 325 (100.0%) |
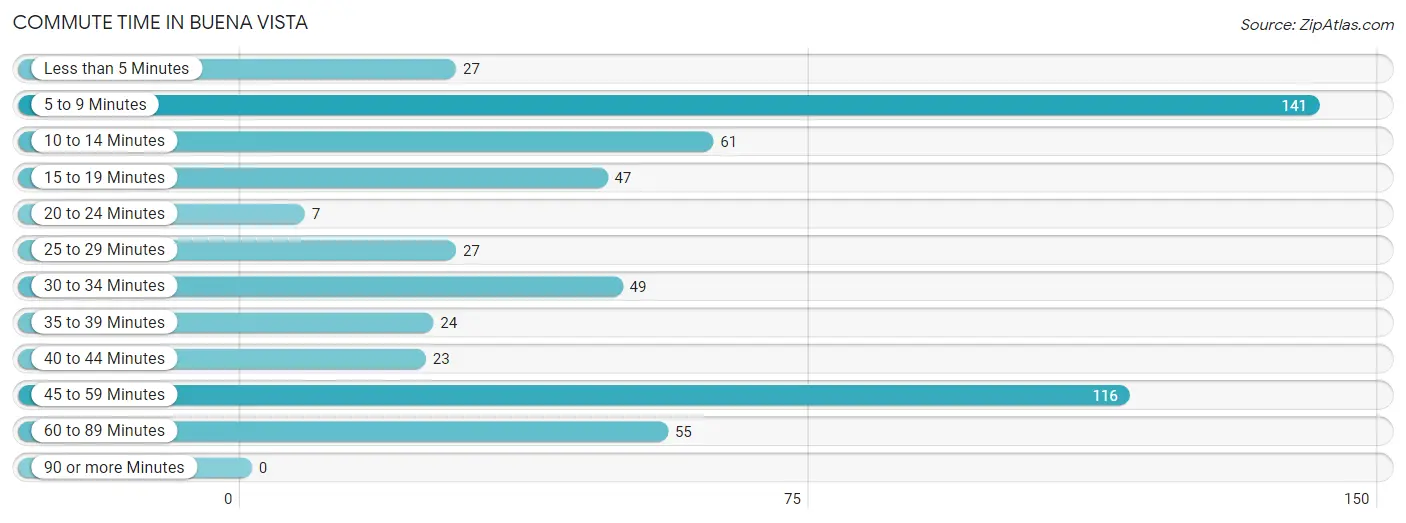
Commute Time in Buena Vista
The most frequently occuring commute durations in Buena Vista are 5 to 9 minutes (141 commuters, 24.4%), 45 to 59 minutes (116 commuters, 20.1%), and 10 to 14 minutes (61 commuters, 10.6%).
| Commute Time | # Commuters | % Commuters |
| Less than 5 Minutes | 27 | 4.7% |
| 5 to 9 Minutes | 141 | 24.4% |
| 10 to 14 Minutes | 61 | 10.6% |
| 15 to 19 Minutes | 47 | 8.2% |
| 20 to 24 Minutes | 7 | 1.2% |
| 25 to 29 Minutes | 27 | 4.7% |
| 30 to 34 Minutes | 49 | 8.5% |
| 35 to 39 Minutes | 24 | 4.2% |
| 40 to 44 Minutes | 23 | 4.0% |
| 45 to 59 Minutes | 116 | 20.1% |
| 60 to 89 Minutes | 55 | 9.5% |
| 90 or more Minutes | 0 | 0.0% |
Commute Time by Sex in Buena Vista
The most common commute times in Buena Vista are 45 to 59 minutes (69 commuters, 25.2%) for males and 5 to 9 minutes (115 commuters, 38.0%) for females.
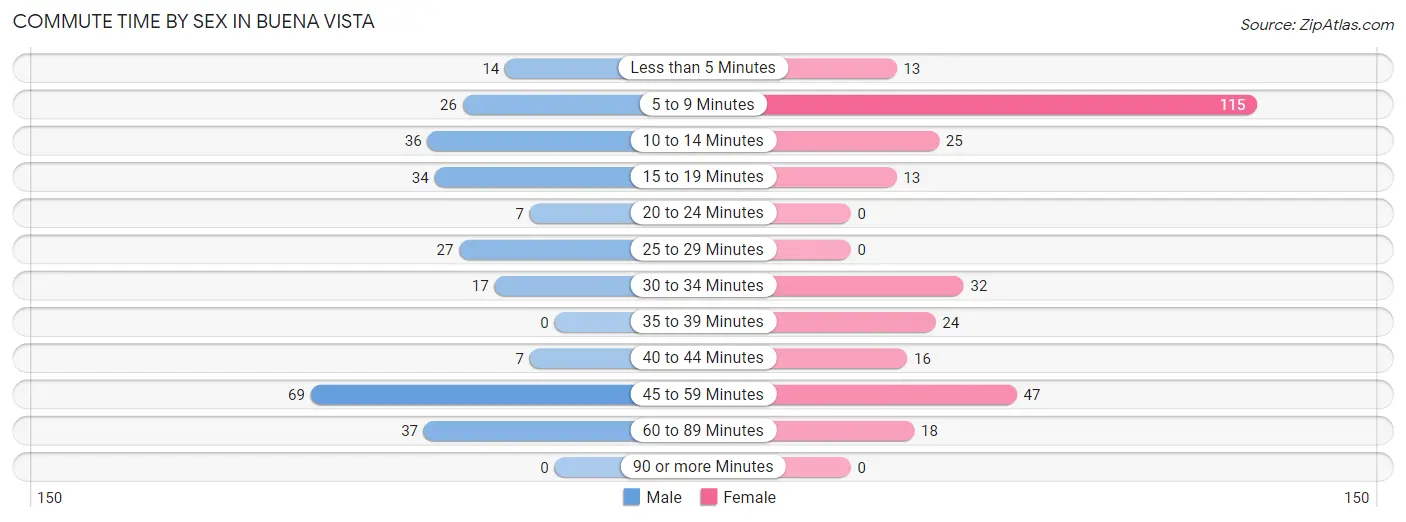
| Commute Time | Male | Female |
| Less than 5 Minutes | 14 (5.1%) | 13 (4.3%) |
| 5 to 9 Minutes | 26 (9.5%) | 115 (38.0%) |
| 10 to 14 Minutes | 36 (13.1%) | 25 (8.3%) |
| 15 to 19 Minutes | 34 (12.4%) | 13 (4.3%) |
| 20 to 24 Minutes | 7 (2.5%) | 0 (0.0%) |
| 25 to 29 Minutes | 27 (9.9%) | 0 (0.0%) |
| 30 to 34 Minutes | 17 (6.2%) | 32 (10.6%) |
| 35 to 39 Minutes | 0 (0.0%) | 24 (7.9%) |
| 40 to 44 Minutes | 7 (2.5%) | 16 (5.3%) |
| 45 to 59 Minutes | 69 (25.2%) | 47 (15.5%) |
| 60 to 89 Minutes | 37 (13.5%) | 18 (5.9%) |
| 90 or more Minutes | 0 (0.0%) | 0 (0.0%) |
Time of Departure to Work by Sex in Buena Vista
The most frequent times of departure to work in Buena Vista are 4:00 PM to 11:59 PM (74, 27.0%) for males and 4:00 PM to 11:59 PM (77, 25.4%) for females.
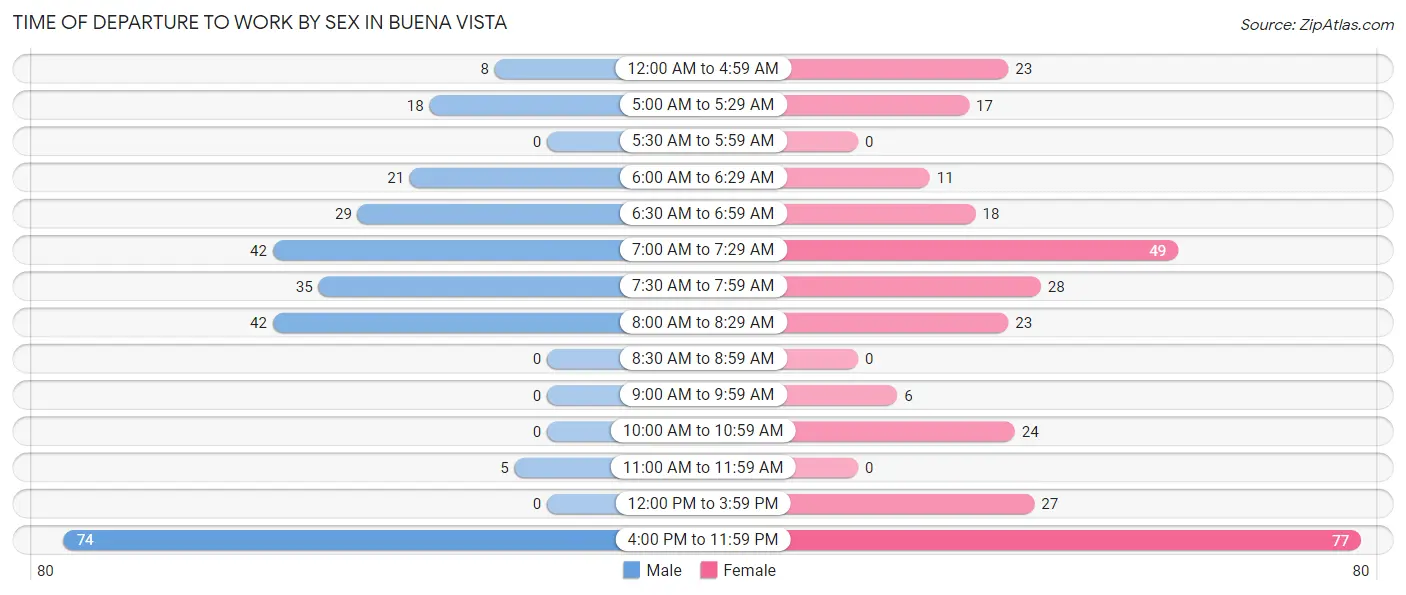
| Time of Departure | Male | Female |
| 12:00 AM to 4:59 AM | 8 (2.9%) | 23 (7.6%) |
| 5:00 AM to 5:29 AM | 18 (6.6%) | 17 (5.6%) |
| 5:30 AM to 5:59 AM | 0 (0.0%) | 0 (0.0%) |
| 6:00 AM to 6:29 AM | 21 (7.7%) | 11 (3.6%) |
| 6:30 AM to 6:59 AM | 29 (10.6%) | 18 (5.9%) |
| 7:00 AM to 7:29 AM | 42 (15.3%) | 49 (16.2%) |
| 7:30 AM to 7:59 AM | 35 (12.8%) | 28 (9.2%) |
| 8:00 AM to 8:29 AM | 42 (15.3%) | 23 (7.6%) |
| 8:30 AM to 8:59 AM | 0 (0.0%) | 0 (0.0%) |
| 9:00 AM to 9:59 AM | 0 (0.0%) | 6 (2.0%) |
| 10:00 AM to 10:59 AM | 0 (0.0%) | 24 (7.9%) |
| 11:00 AM to 11:59 AM | 5 (1.8%) | 0 (0.0%) |
| 12:00 PM to 3:59 PM | 0 (0.0%) | 27 (8.9%) |
| 4:00 PM to 11:59 PM | 74 (27.0%) | 77 (25.4%) |
| Total | 274 (100.0%) | 303 (100.0%) |
Housing Occupancy in Buena Vista
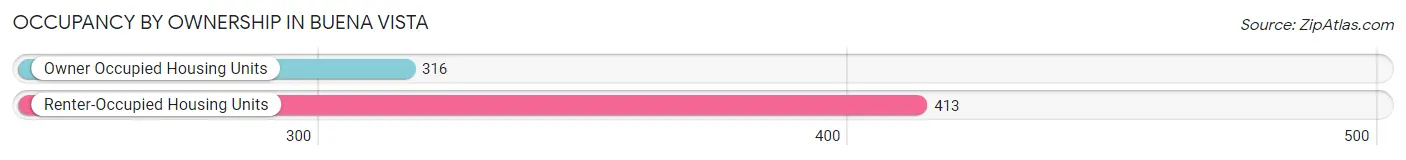
Occupancy by Ownership in Buena Vista
Of the total 729 dwellings in Buena Vista, owner-occupied units account for 316 (43.3%), while renter-occupied units make up 413 (56.7%).
| Occupancy | # Housing Units | % Housing Units |
| Owner Occupied Housing Units | 316 | 43.3% |
| Renter-Occupied Housing Units | 413 | 56.7% |
| Total Occupied Housing Units | 729 | 100.0% |
Occupancy by Household Size in Buena Vista
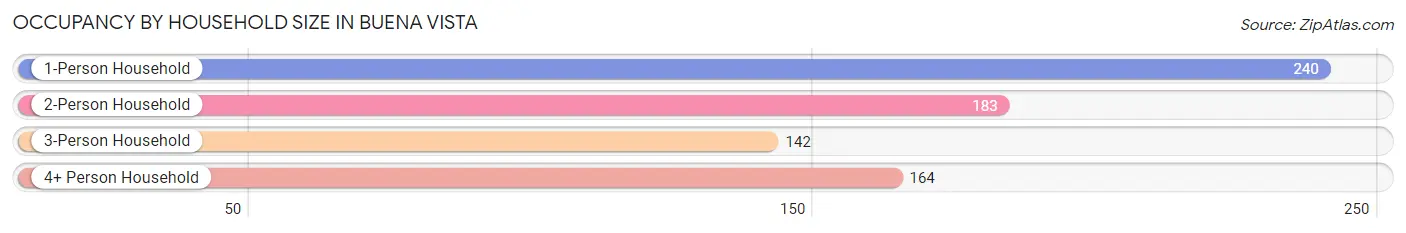
| Household Size | # Housing Units | % Housing Units |
| 1-Person Household | 240 | 32.9% |
| 2-Person Household | 183 | 25.1% |
| 3-Person Household | 142 | 19.5% |
| 4+ Person Household | 164 | 22.5% |
| Total Housing Units | 729 | 100.0% |
Occupancy by Ownership by Household Size in Buena Vista
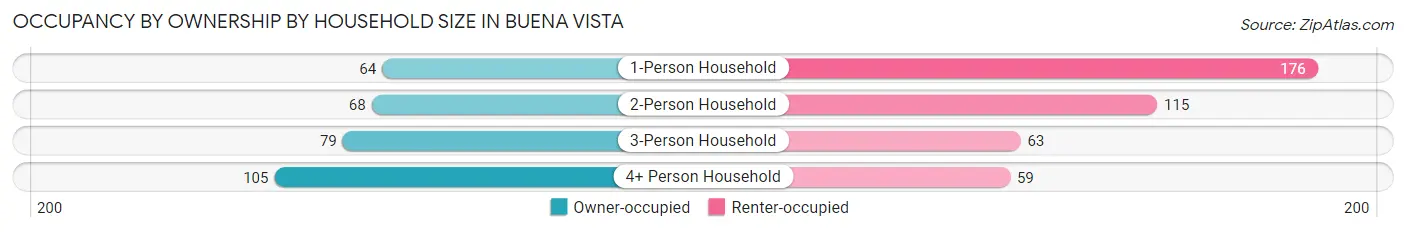
| Household Size | Owner-occupied | Renter-occupied |
| 1-Person Household | 64 (26.7%) | 176 (73.3%) |
| 2-Person Household | 68 (37.2%) | 115 (62.8%) |
| 3-Person Household | 79 (55.6%) | 63 (44.4%) |
| 4+ Person Household | 105 (64.0%) | 59 (36.0%) |
| Total Housing Units | 316 (43.3%) | 413 (56.7%) |
Occupancy by Educational Attainment in Buena Vista
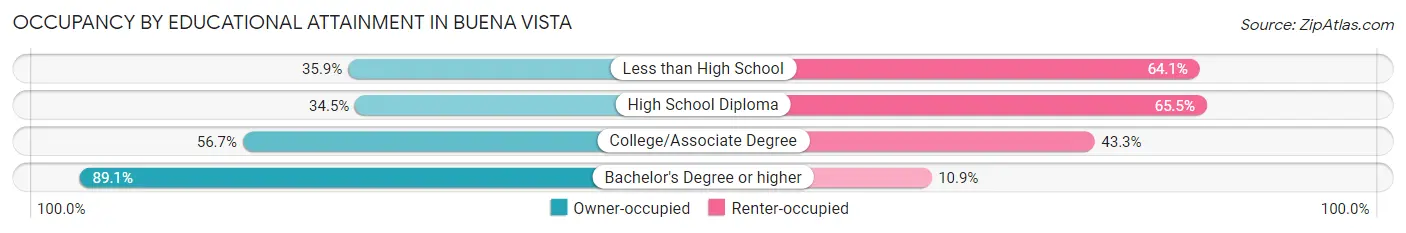
| Household Size | Owner-occupied | Renter-occupied |
| Less than High School | 85 (35.9%) | 152 (64.1%) |
| High School Diploma | 102 (34.5%) | 194 (65.5%) |
| College/Associate Degree | 80 (56.7%) | 61 (43.3%) |
| Bachelor's Degree or higher | 49 (89.1%) | 6 (10.9%) |
Occupancy by Age of Householder in Buena Vista
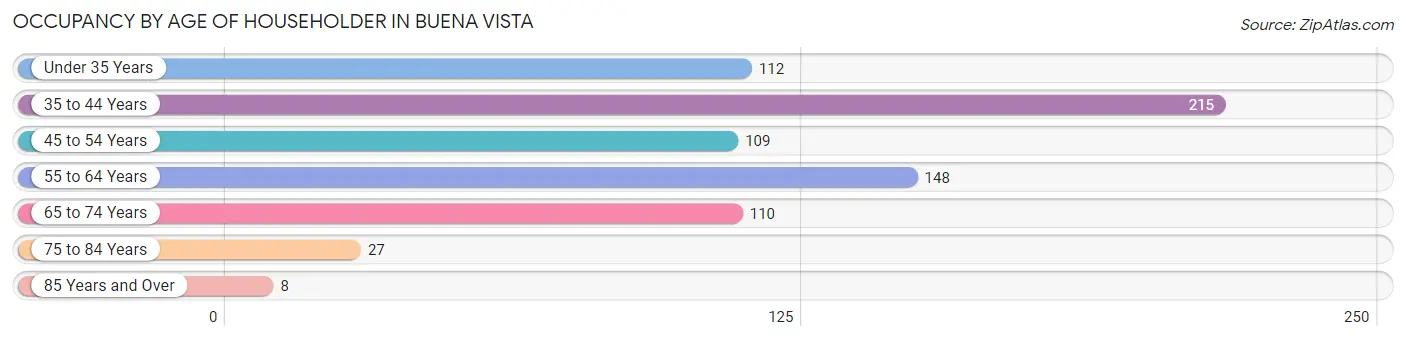
| Age Bracket | # Households | % Households |
| Under 35 Years | 112 | 15.4% |
| 35 to 44 Years | 215 | 29.5% |
| 45 to 54 Years | 109 | 14.9% |
| 55 to 64 Years | 148 | 20.3% |
| 65 to 74 Years | 110 | 15.1% |
| 75 to 84 Years | 27 | 3.7% |
| 85 Years and Over | 8 | 1.1% |
| Total | 729 | 100.0% |
Housing Finances in Buena Vista
Median Income by Occupancy in Buena Vista
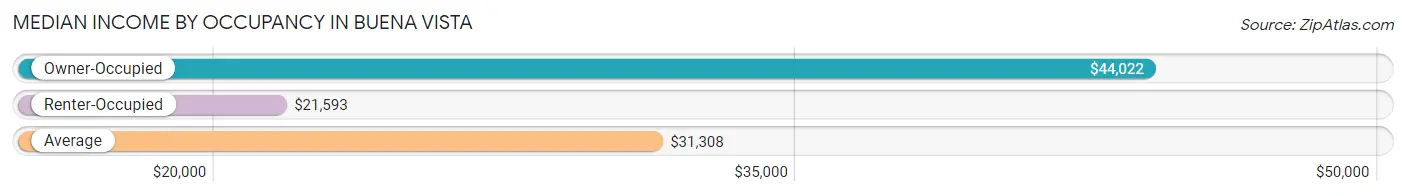
| Occupancy Type | # Households | Median Income |
| Owner-Occupied | 316 (43.3%) | $44,022 |
| Renter-Occupied | 413 (56.7%) | $21,593 |
| Average | 729 (100.0%) | $31,308 |
Occupancy by Householder Income Bracket in Buena Vista
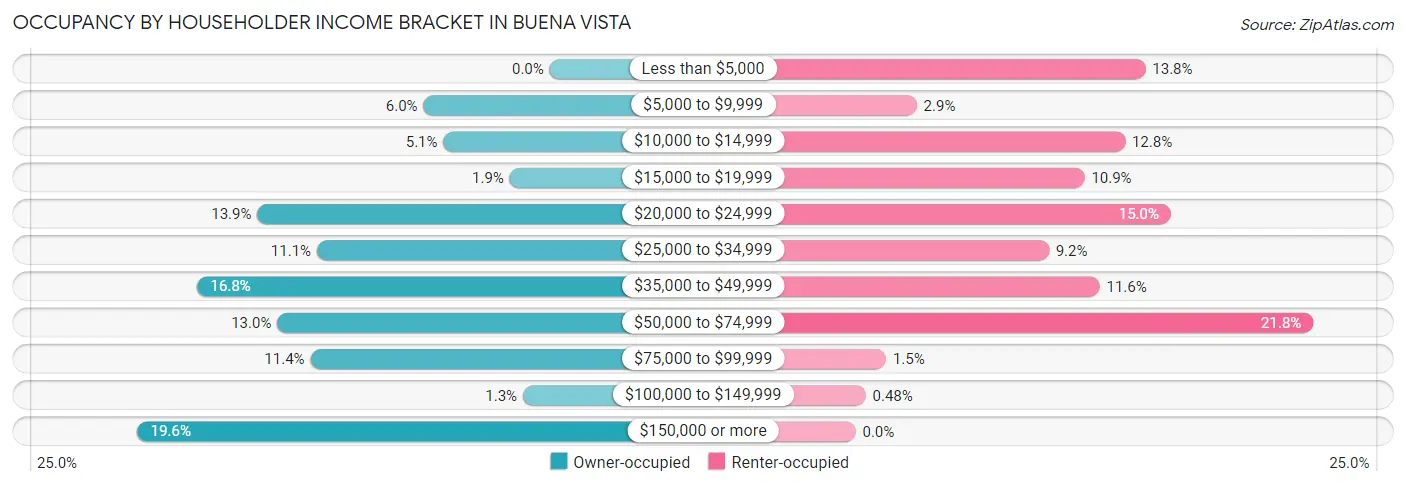
| Income Bracket | Owner-occupied | Renter-occupied |
| Less than $5,000 | 0 (0.0%) | 57 (13.8%) |
| $5,000 to $9,999 | 19 (6.0%) | 12 (2.9%) |
| $10,000 to $14,999 | 16 (5.1%) | 53 (12.8%) |
| $15,000 to $19,999 | 6 (1.9%) | 45 (10.9%) |
| $20,000 to $24,999 | 44 (13.9%) | 62 (15.0%) |
| $25,000 to $34,999 | 35 (11.1%) | 38 (9.2%) |
| $35,000 to $49,999 | 53 (16.8%) | 48 (11.6%) |
| $50,000 to $74,999 | 41 (13.0%) | 90 (21.8%) |
| $75,000 to $99,999 | 36 (11.4%) | 6 (1.5%) |
| $100,000 to $149,999 | 4 (1.3%) | 2 (0.5%) |
| $150,000 or more | 62 (19.6%) | 0 (0.0%) |
| Total | 316 (100.0%) | 413 (100.0%) |
Monthly Housing Cost Tiers in Buena Vista
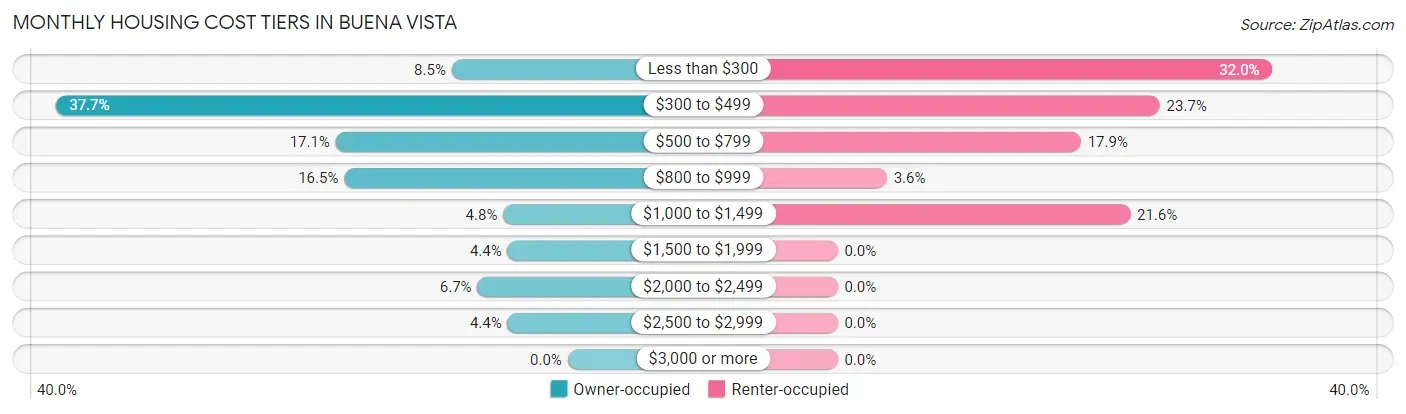
| Monthly Cost | Owner-occupied | Renter-occupied |
| Less than $300 | 27 (8.5%) | 132 (32.0%) |
| $300 to $499 | 119 (37.7%) | 98 (23.7%) |
| $500 to $799 | 54 (17.1%) | 74 (17.9%) |
| $800 to $999 | 52 (16.5%) | 15 (3.6%) |
| $1,000 to $1,499 | 15 (4.8%) | 89 (21.5%) |
| $1,500 to $1,999 | 14 (4.4%) | 0 (0.0%) |
| $2,000 to $2,499 | 21 (6.7%) | 0 (0.0%) |
| $2,500 to $2,999 | 14 (4.4%) | 0 (0.0%) |
| $3,000 or more | 0 (0.0%) | 0 (0.0%) |
| Total | 316 (100.0%) | 413 (100.0%) |
Physical Housing Characteristics in Buena Vista
Housing Structures in Buena Vista
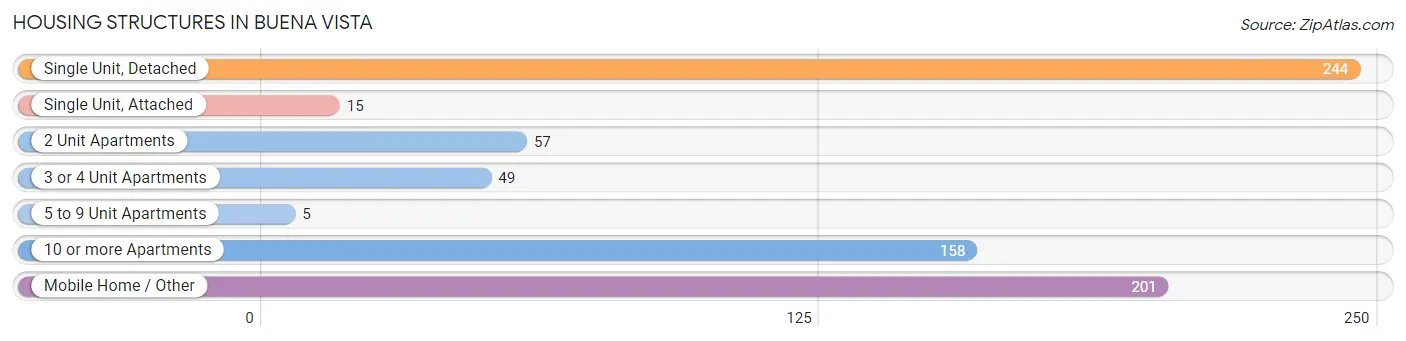
| Structure Type | # Housing Units | % Housing Units |
| Single Unit, Detached | 244 | 33.5% |
| Single Unit, Attached | 15 | 2.1% |
| 2 Unit Apartments | 57 | 7.8% |
| 3 or 4 Unit Apartments | 49 | 6.7% |
| 5 to 9 Unit Apartments | 5 | 0.7% |
| 10 or more Apartments | 158 | 21.7% |
| Mobile Home / Other | 201 | 27.6% |
| Total | 729 | 100.0% |
Housing Structures by Occupancy in Buena Vista
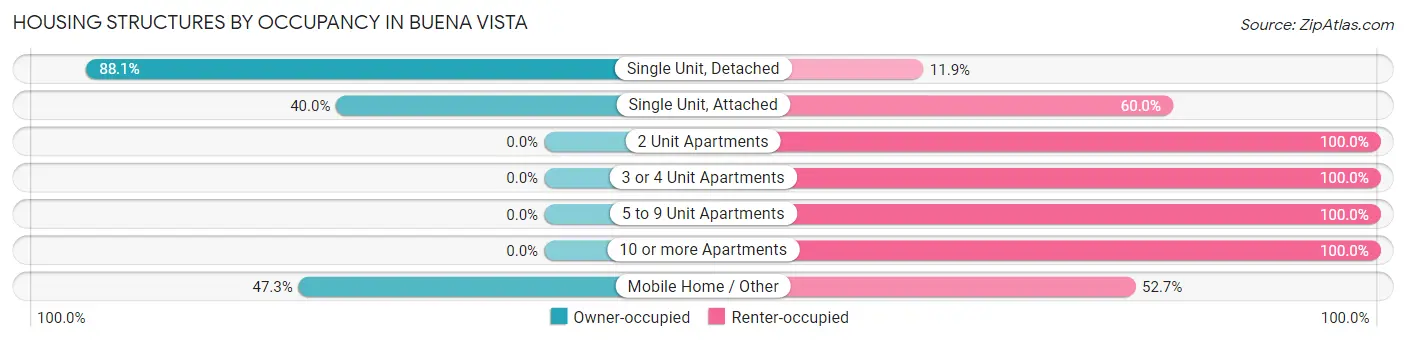
| Structure Type | Owner-occupied | Renter-occupied |
| Single Unit, Detached | 215 (88.1%) | 29 (11.9%) |
| Single Unit, Attached | 6 (40.0%) | 9 (60.0%) |
| 2 Unit Apartments | 0 (0.0%) | 57 (100.0%) |
| 3 or 4 Unit Apartments | 0 (0.0%) | 49 (100.0%) |
| 5 to 9 Unit Apartments | 0 (0.0%) | 5 (100.0%) |
| 10 or more Apartments | 0 (0.0%) | 158 (100.0%) |
| Mobile Home / Other | 95 (47.3%) | 106 (52.7%) |
| Total | 316 (43.3%) | 413 (56.7%) |
Housing Structures by Number of Rooms in Buena Vista
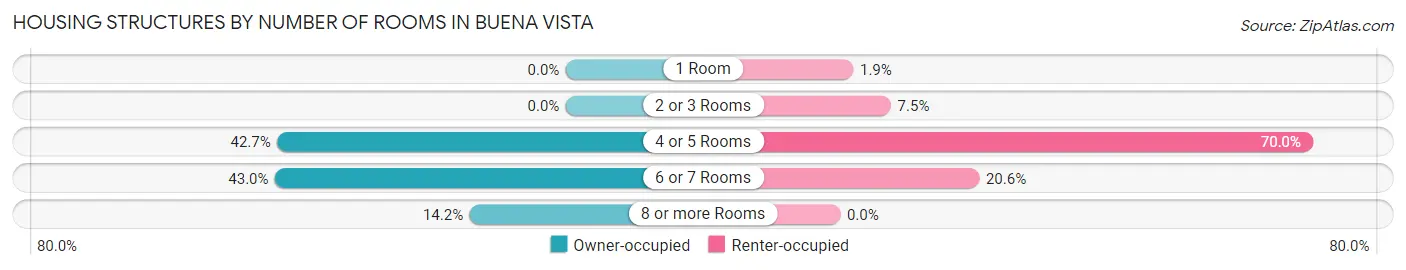
| Number of Rooms | Owner-occupied | Renter-occupied |
| 1 Room | 0 (0.0%) | 8 (1.9%) |
| 2 or 3 Rooms | 0 (0.0%) | 31 (7.5%) |
| 4 or 5 Rooms | 135 (42.7%) | 289 (70.0%) |
| 6 or 7 Rooms | 136 (43.0%) | 85 (20.6%) |
| 8 or more Rooms | 45 (14.2%) | 0 (0.0%) |
| Total | 316 (100.0%) | 413 (100.0%) |
Housing Structure by Heating Type in Buena Vista
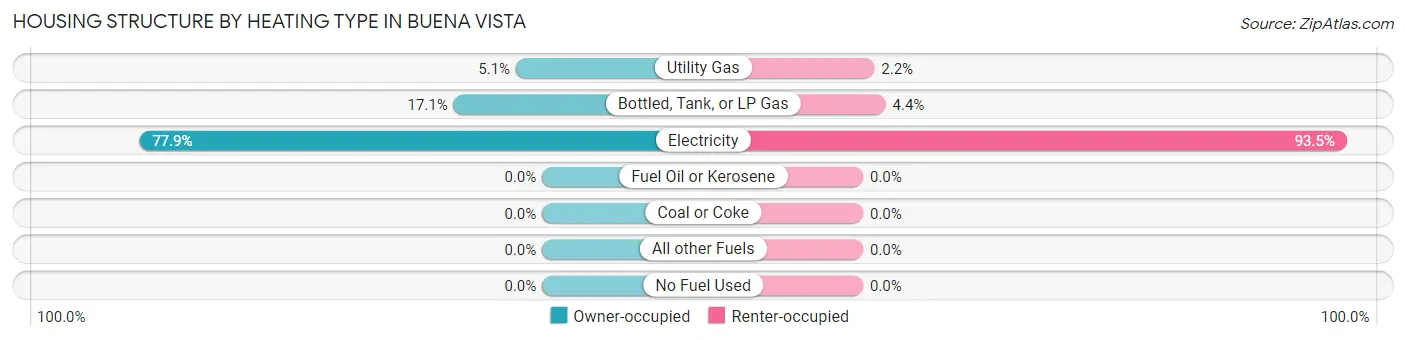
| Heating Type | Owner-occupied | Renter-occupied |
| Utility Gas | 16 (5.1%) | 9 (2.2%) |
| Bottled, Tank, or LP Gas | 54 (17.1%) | 18 (4.4%) |
| Electricity | 246 (77.8%) | 386 (93.5%) |
| Fuel Oil or Kerosene | 0 (0.0%) | 0 (0.0%) |
| Coal or Coke | 0 (0.0%) | 0 (0.0%) |
| All other Fuels | 0 (0.0%) | 0 (0.0%) |
| No Fuel Used | 0 (0.0%) | 0 (0.0%) |
| Total | 316 (100.0%) | 413 (100.0%) |
Household Vehicle Usage in Buena Vista
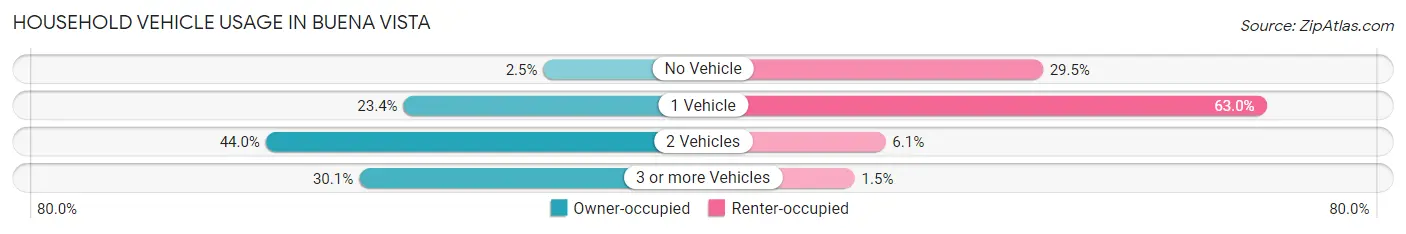
| Vehicles per Household | Owner-occupied | Renter-occupied |
| No Vehicle | 8 (2.5%) | 122 (29.5%) |
| 1 Vehicle | 74 (23.4%) | 260 (62.9%) |
| 2 Vehicles | 139 (44.0%) | 25 (6.0%) |
| 3 or more Vehicles | 95 (30.1%) | 6 (1.5%) |
| Total | 316 (100.0%) | 413 (100.0%) |
Real Estate & Mortgages in Buena Vista
Real Estate and Mortgage Overview in Buena Vista
| Characteristic | Without Mortgage | With Mortgage |
| Housing Units | 170 | 146 |
| Median Property Value | $85,000 | $121,300 |
| Median Household Income | $38,929 | $49 |
| Monthly Housing Costs | $443 | $0 |
| Real Estate Taxes | $1,102 | $3 |
Property Value by Mortgage Status in Buena Vista
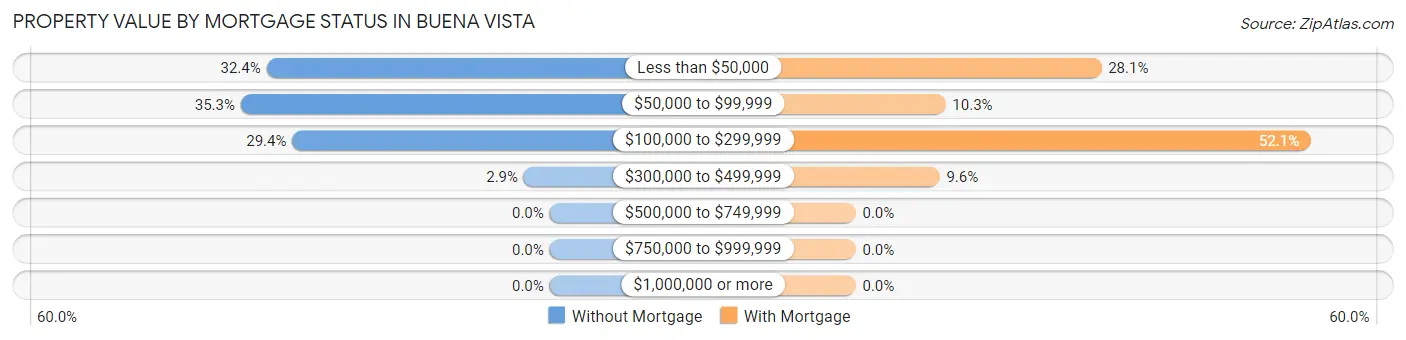
| Property Value | Without Mortgage | With Mortgage |
| Less than $50,000 | 55 (32.4%) | 41 (28.1%) |
| $50,000 to $99,999 | 60 (35.3%) | 15 (10.3%) |
| $100,000 to $299,999 | 50 (29.4%) | 76 (52.0%) |
| $300,000 to $499,999 | 5 (2.9%) | 14 (9.6%) |
| $500,000 to $749,999 | 0 (0.0%) | 0 (0.0%) |
| $750,000 to $999,999 | 0 (0.0%) | 0 (0.0%) |
| $1,000,000 or more | 0 (0.0%) | 0 (0.0%) |
| Total | 170 (100.0%) | 146 (100.0%) |
Household Income by Mortgage Status in Buena Vista
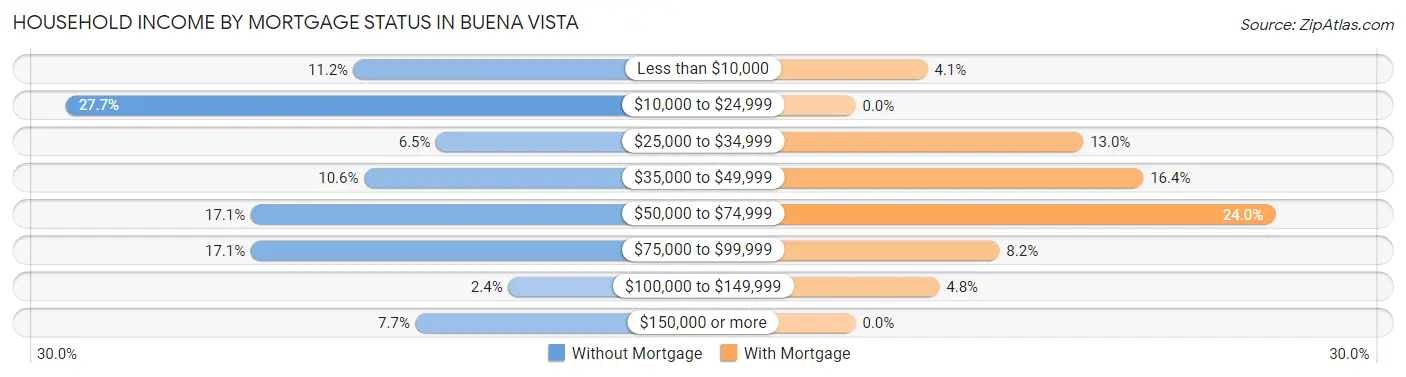
| Household Income | Without Mortgage | With Mortgage |
| Less than $10,000 | 19 (11.2%) | 6 (4.1%) |
| $10,000 to $24,999 | 47 (27.7%) | 0 (0.0%) |
| $25,000 to $34,999 | 11 (6.5%) | 19 (13.0%) |
| $35,000 to $49,999 | 18 (10.6%) | 24 (16.4%) |
| $50,000 to $74,999 | 29 (17.1%) | 35 (24.0%) |
| $75,000 to $99,999 | 29 (17.1%) | 12 (8.2%) |
| $100,000 to $149,999 | 4 (2.4%) | 7 (4.8%) |
| $150,000 or more | 13 (7.6%) | 0 (0.0%) |
| Total | 170 (100.0%) | 146 (100.0%) |
Property Value to Household Income Ratio in Buena Vista
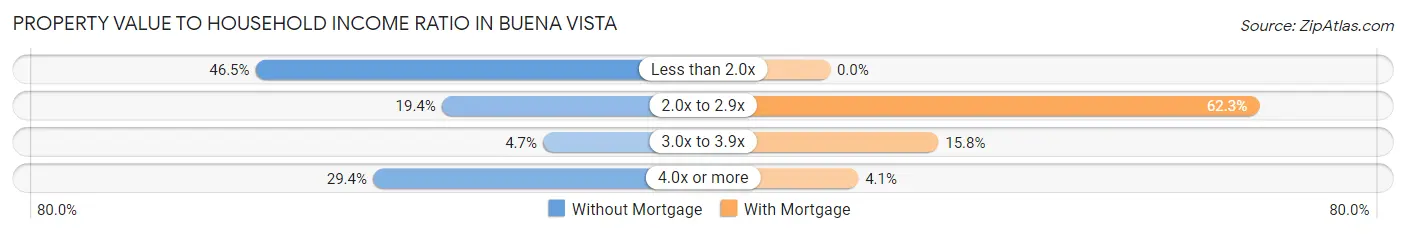
| Value-to-Income Ratio | Without Mortgage | With Mortgage |
| Less than 2.0x | 79 (46.5%) | 0 (0.0%) |
| 2.0x to 2.9x | 33 (19.4%) | 91 (62.3%) |
| 3.0x to 3.9x | 8 (4.7%) | 23 (15.8%) |
| 4.0x or more | 50 (29.4%) | 6 (4.1%) |
| Total | 170 (100.0%) | 146 (100.0%) |
Real Estate Taxes by Mortgage Status in Buena Vista
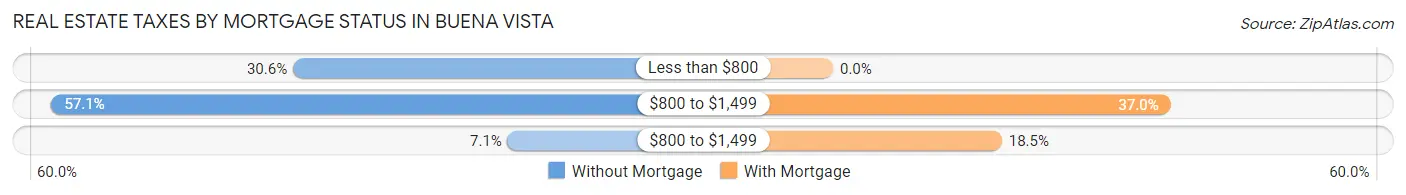
| Property Taxes | Without Mortgage | With Mortgage |
| Less than $800 | 52 (30.6%) | 0 (0.0%) |
| $800 to $1,499 | 97 (57.1%) | 54 (37.0%) |
| $800 to $1,499 | 12 (7.1%) | 27 (18.5%) |
| Total | 170 (100.0%) | 146 (100.0%) |
Health & Disability in Buena Vista
Health Insurance Coverage by Age in Buena Vista
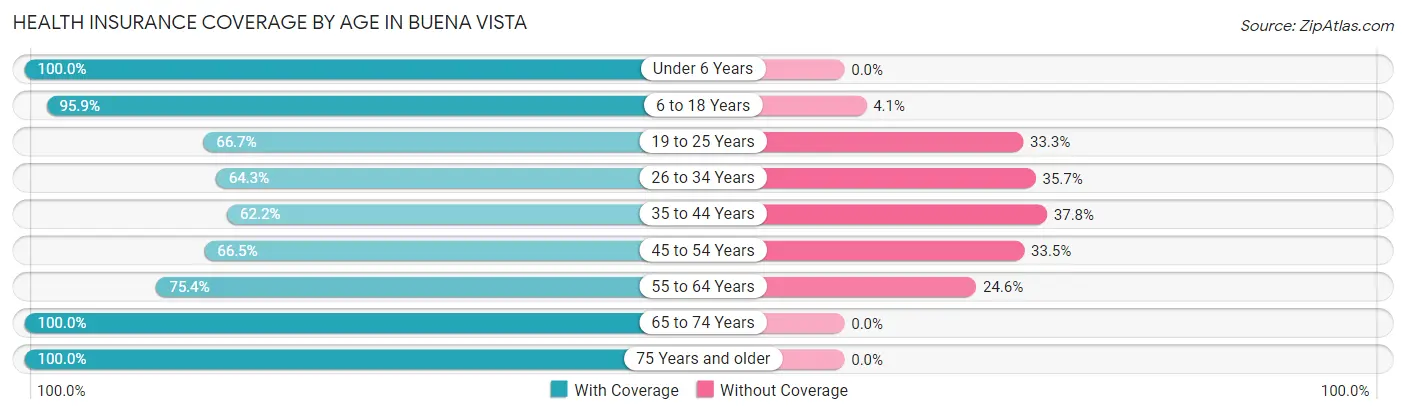
| Age Bracket | With Coverage | Without Coverage |
| Under 6 Years | 145 (100.0%) | 0 (0.0%) |
| 6 to 18 Years | 446 (95.9%) | 19 (4.1%) |
| 19 to 25 Years | 146 (66.7%) | 73 (33.3%) |
| 26 to 34 Years | 83 (64.3%) | 46 (35.7%) |
| 35 to 44 Years | 196 (62.2%) | 119 (37.8%) |
| 45 to 54 Years | 113 (66.5%) | 57 (33.5%) |
| 55 to 64 Years | 132 (75.4%) | 43 (24.6%) |
| 65 to 74 Years | 170 (100.0%) | 0 (0.0%) |
| 75 Years and older | 81 (100.0%) | 0 (0.0%) |
| Total | 1,512 (80.9%) | 357 (19.1%) |
Health Insurance Coverage by Citizenship Status in Buena Vista
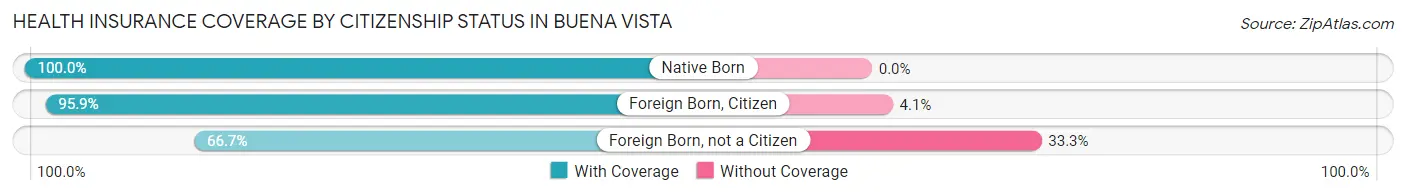
| Citizenship Status | With Coverage | Without Coverage |
| Native Born | 145 (100.0%) | 0 (0.0%) |
| Foreign Born, Citizen | 446 (95.9%) | 19 (4.1%) |
| Foreign Born, not a Citizen | 146 (66.7%) | 73 (33.3%) |
Health Insurance Coverage by Household Income in Buena Vista
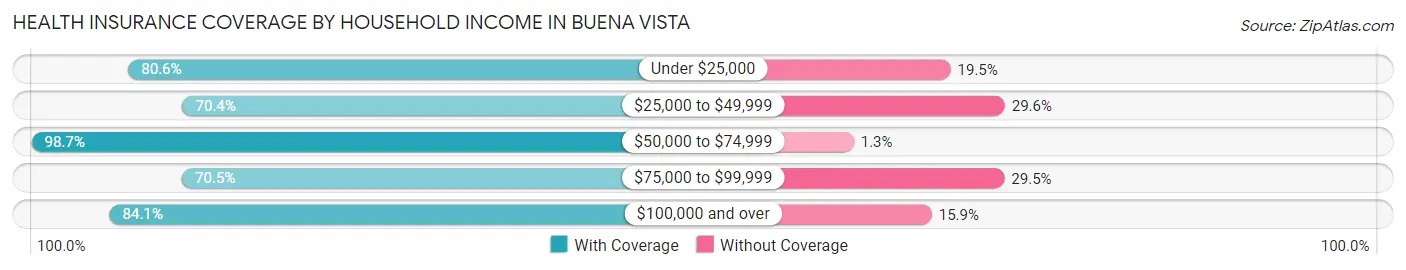
| Household Income | With Coverage | Without Coverage |
| Under $25,000 | 497 (80.5%) | 120 (19.5%) |
| $25,000 to $49,999 | 321 (70.4%) | 135 (29.6%) |
| $50,000 to $74,999 | 302 (98.7%) | 4 (1.3%) |
| $75,000 to $99,999 | 105 (70.5%) | 44 (29.5%) |
| $100,000 and over | 285 (84.1%) | 54 (15.9%) |
Public vs Private Health Insurance Coverage by Age in Buena Vista
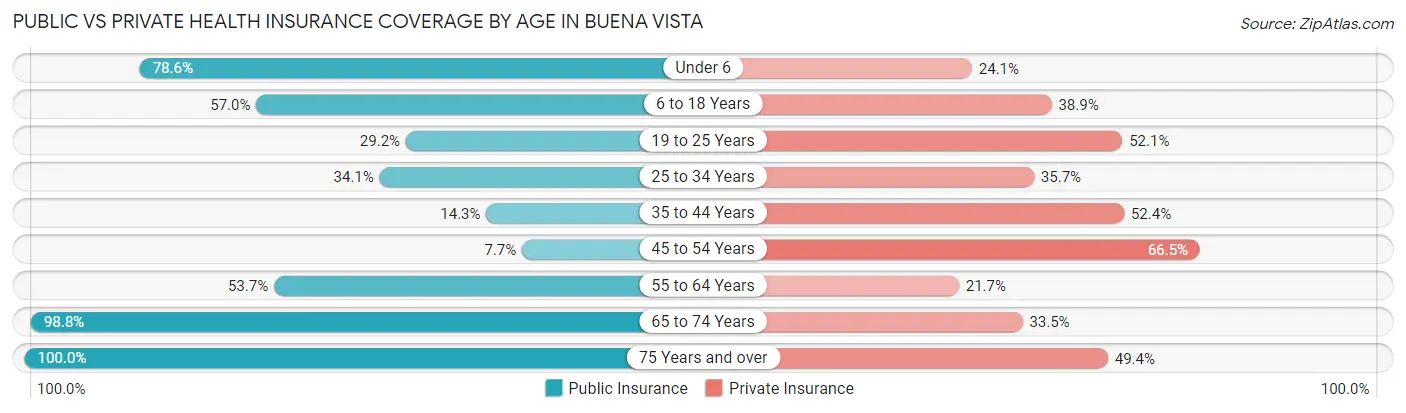
| Age Bracket | Public Insurance | Private Insurance |
| Under 6 | 114 (78.6%) | 35 (24.1%) |
| 6 to 18 Years | 265 (57.0%) | 181 (38.9%) |
| 19 to 25 Years | 64 (29.2%) | 114 (52.0%) |
| 25 to 34 Years | 44 (34.1%) | 46 (35.7%) |
| 35 to 44 Years | 45 (14.3%) | 165 (52.4%) |
| 45 to 54 Years | 13 (7.6%) | 113 (66.5%) |
| 55 to 64 Years | 94 (53.7%) | 38 (21.7%) |
| 65 to 74 Years | 168 (98.8%) | 57 (33.5%) |
| 75 Years and over | 81 (100.0%) | 40 (49.4%) |
| Total | 888 (47.5%) | 789 (42.2%) |
Disability Status by Sex by Age in Buena Vista
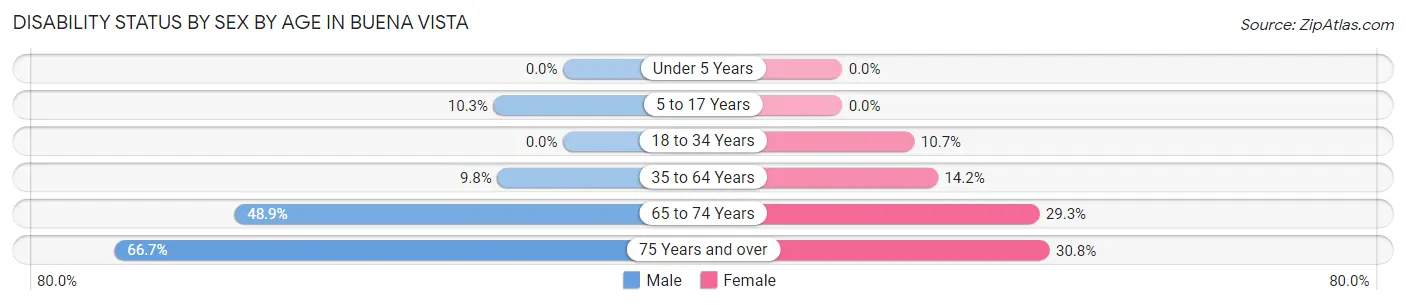
| Age Bracket | Male | Female |
| Under 5 Years | 0 (0.0%) | 0 (0.0%) |
| 5 to 17 Years | 16 (10.3%) | 0 (0.0%) |
| 18 to 34 Years | 0 (0.0%) | 24 (10.7%) |
| 35 to 64 Years | 26 (9.8%) | 56 (14.2%) |
| 65 to 74 Years | 43 (48.9%) | 24 (29.3%) |
| 75 Years and over | 28 (66.7%) | 12 (30.8%) |
Disability Class by Sex by Age in Buena Vista
Disability Class: Hearing Difficulty
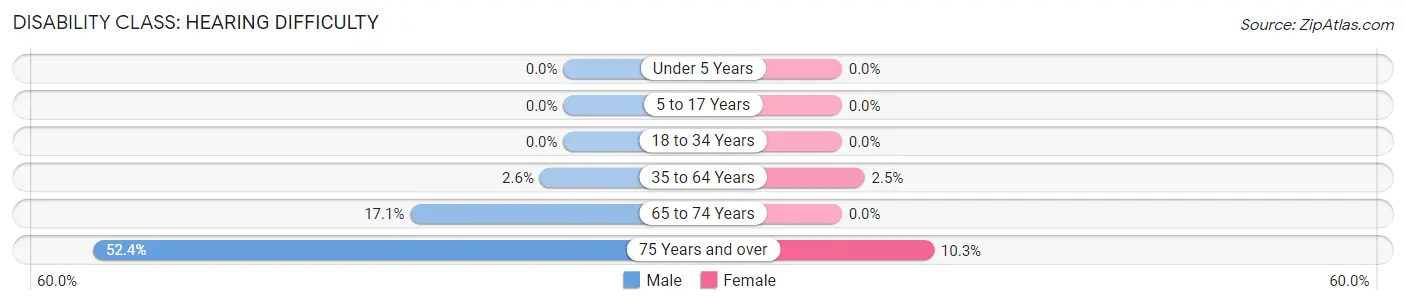
| Age Bracket | Male | Female |
| Under 5 Years | 0 (0.0%) | 0 (0.0%) |
| 5 to 17 Years | 0 (0.0%) | 0 (0.0%) |
| 18 to 34 Years | 0 (0.0%) | 0 (0.0%) |
| 35 to 64 Years | 7 (2.6%) | 10 (2.5%) |
| 65 to 74 Years | 15 (17.1%) | 0 (0.0%) |
| 75 Years and over | 22 (52.4%) | 4 (10.3%) |
Disability Class: Vision Difficulty
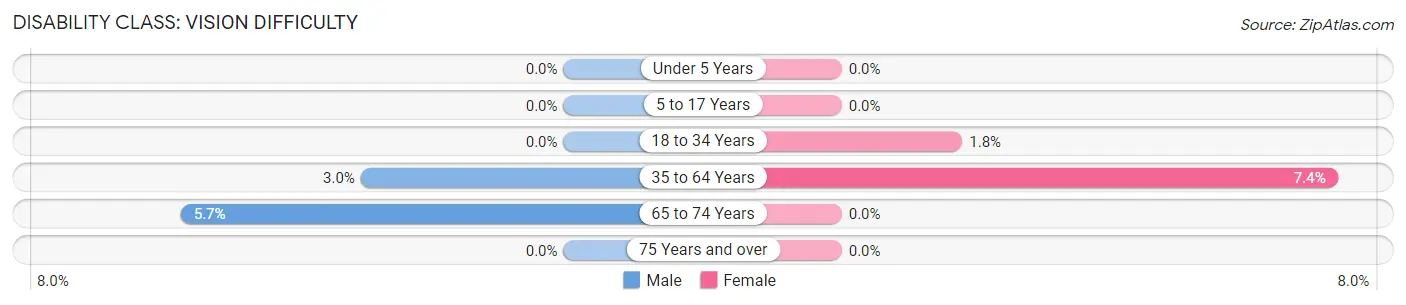
| Age Bracket | Male | Female |
| Under 5 Years | 0 (0.0%) | 0 (0.0%) |
| 5 to 17 Years | 0 (0.0%) | 0 (0.0%) |
| 18 to 34 Years | 0 (0.0%) | 4 (1.8%) |
| 35 to 64 Years | 8 (3.0%) | 29 (7.4%) |
| 65 to 74 Years | 5 (5.7%) | 0 (0.0%) |
| 75 Years and over | 0 (0.0%) | 0 (0.0%) |
Disability Class: Cognitive Difficulty
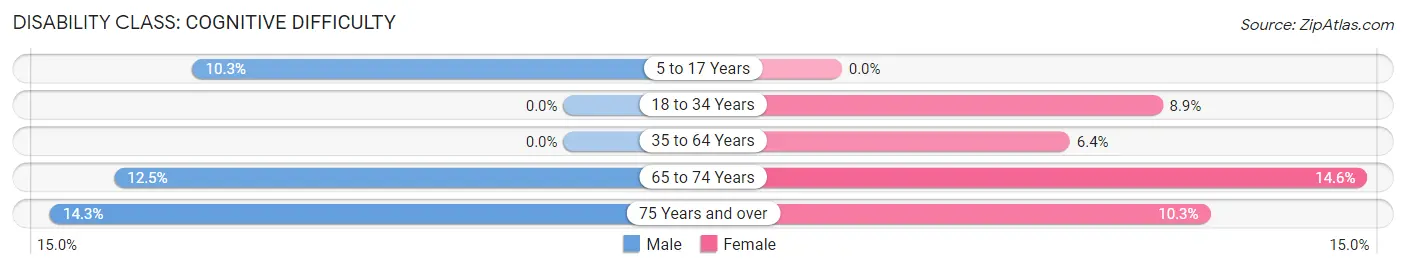
| Age Bracket | Male | Female |
| 5 to 17 Years | 16 (10.3%) | 0 (0.0%) |
| 18 to 34 Years | 0 (0.0%) | 20 (8.9%) |
| 35 to 64 Years | 0 (0.0%) | 25 (6.4%) |
| 65 to 74 Years | 11 (12.5%) | 12 (14.6%) |
| 75 Years and over | 6 (14.3%) | 4 (10.3%) |
Disability Class: Ambulatory Difficulty
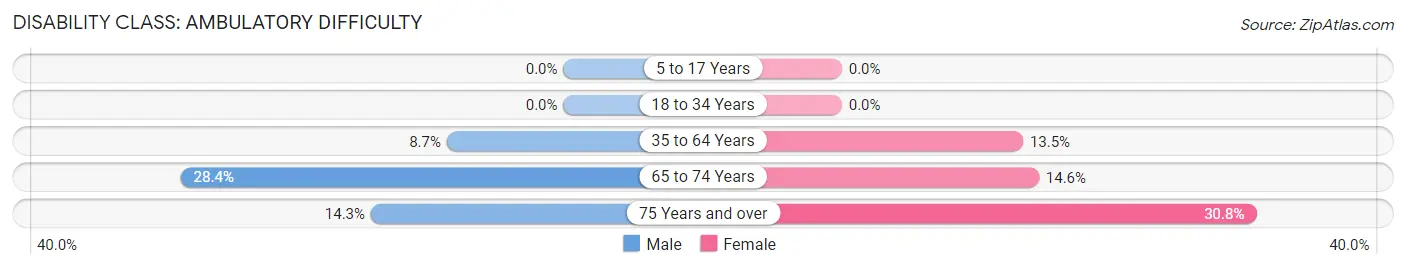
| Age Bracket | Male | Female |
| 5 to 17 Years | 0 (0.0%) | 0 (0.0%) |
| 18 to 34 Years | 0 (0.0%) | 0 (0.0%) |
| 35 to 64 Years | 23 (8.6%) | 53 (13.5%) |
| 65 to 74 Years | 25 (28.4%) | 12 (14.6%) |
| 75 Years and over | 6 (14.3%) | 12 (30.8%) |
Disability Class: Self-Care Difficulty
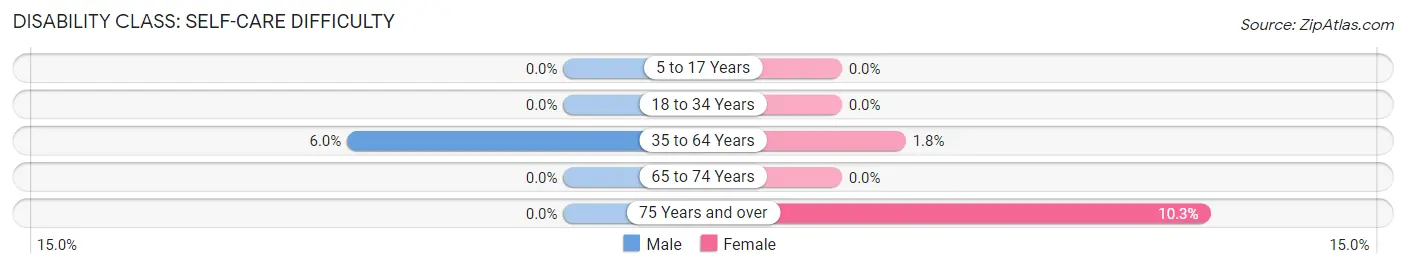
| Age Bracket | Male | Female |
| 5 to 17 Years | 0 (0.0%) | 0 (0.0%) |
| 18 to 34 Years | 0 (0.0%) | 0 (0.0%) |
| 35 to 64 Years | 16 (6.0%) | 7 (1.8%) |
| 65 to 74 Years | 0 (0.0%) | 0 (0.0%) |
| 75 Years and over | 0 (0.0%) | 4 (10.3%) |
Technology Access in Buena Vista
Computing Device Access in Buena Vista
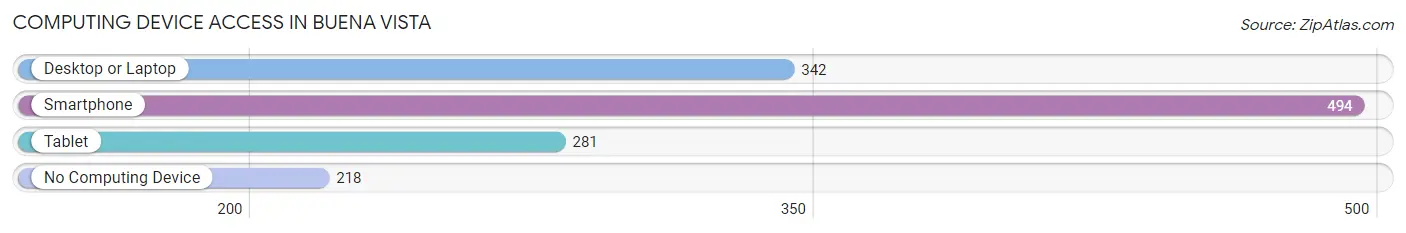
| Device Type | # Households | % Households |
| Desktop or Laptop | 342 | 46.9% |
| Smartphone | 494 | 67.8% |
| Tablet | 281 | 38.6% |
| No Computing Device | 218 | 29.9% |
| Total | 729 | 100.0% |
Internet Access in Buena Vista
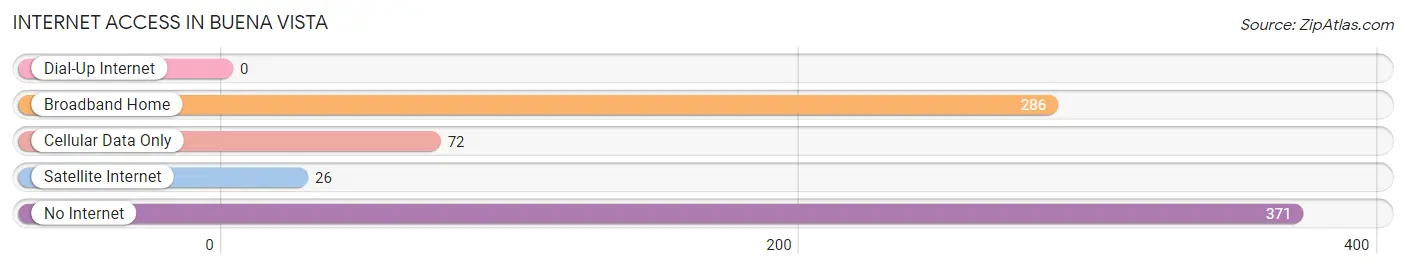
| Internet Type | # Households | % Households |
| Dial-Up Internet | 0 | 0.0% |
| Broadband Home | 286 | 39.2% |
| Cellular Data Only | 72 | 9.9% |
| Satellite Internet | 26 | 3.6% |
| No Internet | 371 | 50.9% |
| Total | 729 | 100.0% |
Buena Vista Summary
Buena Vista, Georgia is a small city located in Marion County, Georgia. It is situated in the southwestern part of the state, approximately 60 miles south of Atlanta. The city has a population of approximately 3,000 people and is the county seat of Marion County.
History
The area that is now Buena Vista was first settled in the early 1800s by settlers from North Carolina. The town was originally known as “Buena Vista”, which is Spanish for “good view”. The town was officially incorporated in 1854 and was named after the Battle of Buena Vista, which was fought during the Mexican-American War.
The town was an important stop on the Central of Georgia Railroad, which ran through the town in the late 1800s. The railroad brought economic growth to the area and helped to make Buena Vista a thriving community.
Geography
Buena Vista is located in the southwestern part of Georgia, approximately 60 miles south of Atlanta. The city is situated in the foothills of the Appalachian Mountains and is surrounded by rolling hills and forests. The city is located near the Flint River, which provides a source of recreation for the residents of Buena Vista.
The climate in Buena Vista is mild and humid, with temperatures ranging from the mid-50s in the winter to the mid-80s in the summer. The city receives an average of 48 inches of rain per year.
Economy
The economy of Buena Vista is largely based on agriculture and manufacturing. The city is home to several large farms, which produce a variety of crops, including cotton, corn, soybeans, and peanuts. The city is also home to several manufacturing companies, which produce a variety of products, including furniture, textiles, and automotive parts.
The city is also home to several small businesses, including restaurants, retail stores, and service providers. The city is also home to several educational institutions, including a community college and a technical college.
Demographics
As of the 2010 census, the population of Buena Vista was 3,000. The racial makeup of the city was 79.3% White, 17.2% African American, 0.7% Native American, 0.3% Asian, and 2.5% from other races. The median household income in Buena Vista was $30,000, and the median age was 37.
Buena Vista is a small city with a rich history and a vibrant economy. The city is home to a diverse population and offers a variety of recreational activities and educational opportunities. The city is a great place to live, work, and raise a family.
Common Questions
What is Per Capita Income in Buena Vista?
Per Capita income in Buena Vista is $20,323.
What is the Median Family Income in Buena Vista?
Median Family Income in Buena Vista is $44,297.
What is the Median Household income in Buena Vista?
Median Household Income in Buena Vista is $31,308.
What is Income or Wage Gap in Buena Vista?
Income or Wage Gap in Buena Vista is 28.5%.
Women in Buena Vista earn 71.5 cents for every dollar earned by a man.
What is Family Income Deficit in Buena Vista?
Family Income Deficit in Buena Vista is $16,165.
Families that are below poverty line in Buena Vista earn $16,165 less on average than the poverty threshold level.
What is Inequality or Gini Index in Buena Vista?
Inequality or Gini Index in Buena Vista is 0.51.
What is the Total Population of Buena Vista?
Total Population of Buena Vista is 1,964.
What is the Total Male Population of Buena Vista?
Total Male Population of Buena Vista is 885.
What is the Total Female Population of Buena Vista?
Total Female Population of Buena Vista is 1,079.
What is the Ratio of Males per 100 Females in Buena Vista?
There are 82.02 Males per 100 Females in Buena Vista.
What is the Ratio of Females per 100 Males in Buena Vista?
There are 121.92 Females per 100 Males in Buena Vista.
What is the Median Population Age in Buena Vista?
Median Population Age in Buena Vista is 37.0 Years.
What is the Average Family Size in Buena Vista
Average Family Size in Buena Vista is 3.3 People.
What is the Average Household Size in Buena Vista
Average Household Size in Buena Vista is 2.6 People.
How Large is the Labor Force in Buena Vista?
There are 610 People in the Labor Forcein in Buena Vista.
What is the Percentage of People in the Labor Force in Buena Vista?
39.9% of People are in the Labor Force in Buena Vista.
What is the Unemployment Rate in Buena Vista?
Unemployment Rate in Buena Vista is 0.3%.