Blairsville, GA Map & Demographics
Blairsville Map
Blairsville Overview
$23,657
PER CAPITA INCOME
$29,028
AVG FAMILY INCOME
$21,827
AVG HOUSEHOLD INCOME
$10,098
FAMILY INCOME DEFICIT
0.52
INEQUALITY / GINI INDEX
736
TOTAL POPULATION
492
MALE POPULATION
244
FEMALE POPULATION
201.64
MALES / 100 FEMALES
49.59
FEMALES / 100 MALES
38.4
MEDIAN AGE
2.8
AVG FAMILY SIZE
2.2
AVG HOUSEHOLD SIZE
227
LABOR FORCE [ PEOPLE ]
36.0%
PERCENT IN LABOR FORCE
2.2%
UNEMPLOYMENT RATE
Blairsville Zip Codes
Blairsville Area Codes
Income in Blairsville
Income Overview in Blairsville
Per Capita Income in Blairsville is $23,657, while median incomes of families and households are $29,028 and $21,827 respectively.
| Characteristic | Number | Measure |
| Per Capita Income | 736 | $23,657 |
| Median Family Income | 119 | $29,028 |
| Mean Family Income | 119 | $49,961 |
| Median Household Income | 211 | $21,827 |
| Mean Household Income | 211 | $40,649 |
| Income Deficit | 119 | $10,098 |
| Wage / Income Gap (%) | 736 | 0.00% |
| Wage / Income Gap ($) | 736 | 100.00¢ per $1 |
| Gini / Inequality Index | 736 | 0.52 |
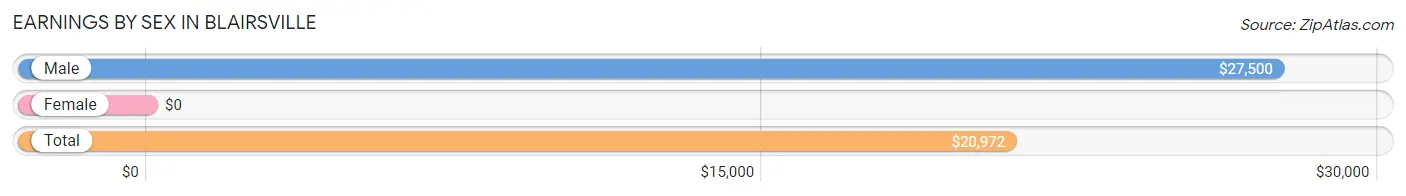
Earnings by Sex in Blairsville
| Sex | Number | Average Earnings |
| Male | 262 (72.0%) | $27,500 |
| Female | 102 (28.0%) | $0 |
| Total | 364 (100.0%) | $20,972 |
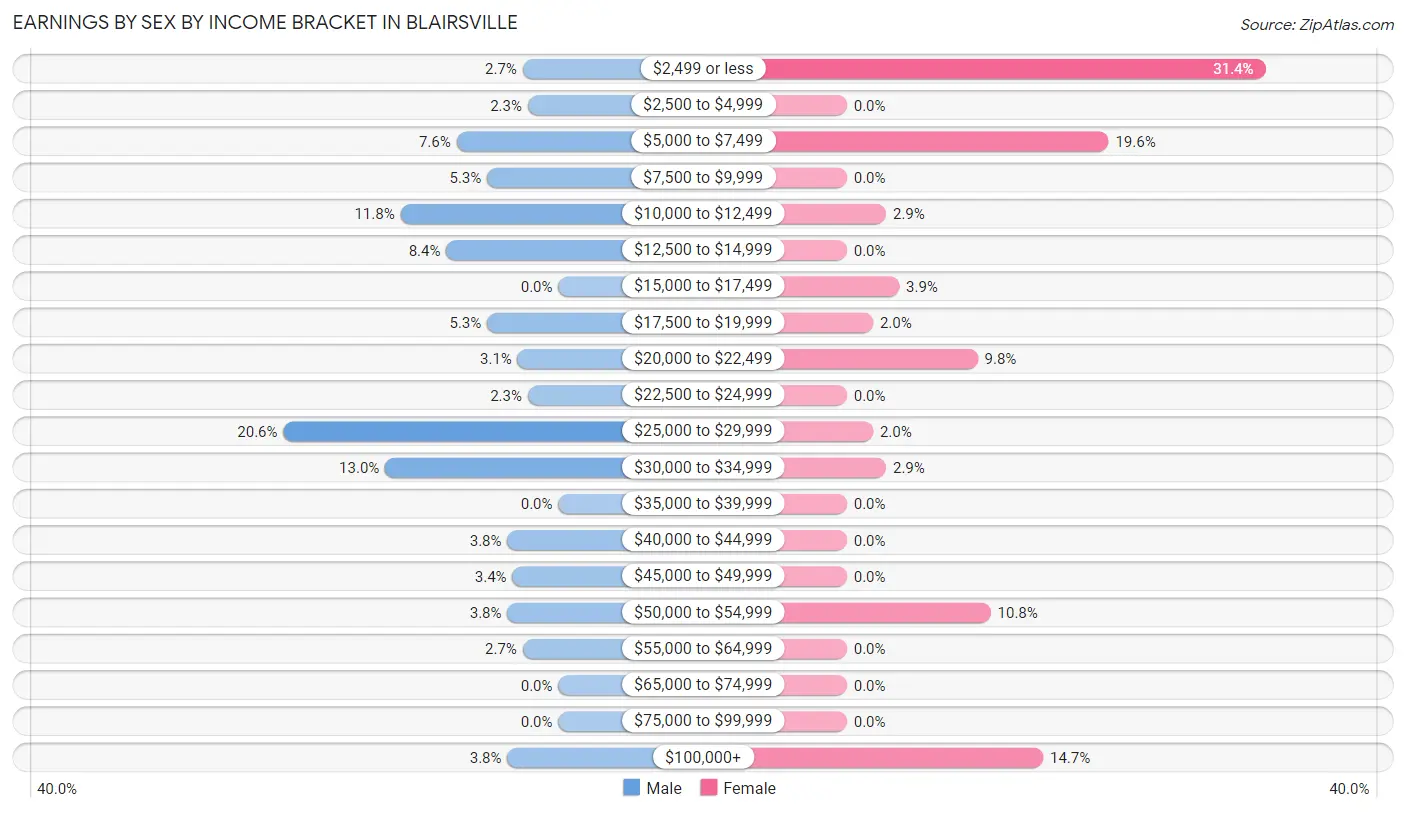
Earnings by Sex by Income Bracket in Blairsville
The most common earnings brackets in Blairsville are $25,000 to $29,999 for men (54 | 20.6%) and $2,499 or less for women (32 | 31.4%).
| Income | Male | Female |
| $2,499 or less | 7 (2.7%) | 32 (31.4%) |
| $2,500 to $4,999 | 6 (2.3%) | 0 (0.0%) |
| $5,000 to $7,499 | 20 (7.6%) | 20 (19.6%) |
| $7,500 to $9,999 | 14 (5.3%) | 0 (0.0%) |
| $10,000 to $12,499 | 31 (11.8%) | 3 (2.9%) |
| $12,500 to $14,999 | 22 (8.4%) | 0 (0.0%) |
| $15,000 to $17,499 | 0 (0.0%) | 4 (3.9%) |
| $17,500 to $19,999 | 14 (5.3%) | 2 (2.0%) |
| $20,000 to $22,499 | 8 (3.0%) | 10 (9.8%) |
| $22,500 to $24,999 | 6 (2.3%) | 0 (0.0%) |
| $25,000 to $29,999 | 54 (20.6%) | 2 (2.0%) |
| $30,000 to $34,999 | 34 (13.0%) | 3 (2.9%) |
| $35,000 to $39,999 | 0 (0.0%) | 0 (0.0%) |
| $40,000 to $44,999 | 10 (3.8%) | 0 (0.0%) |
| $45,000 to $49,999 | 9 (3.4%) | 0 (0.0%) |
| $50,000 to $54,999 | 10 (3.8%) | 11 (10.8%) |
| $55,000 to $64,999 | 7 (2.7%) | 0 (0.0%) |
| $65,000 to $74,999 | 0 (0.0%) | 0 (0.0%) |
| $75,000 to $99,999 | 0 (0.0%) | 0 (0.0%) |
| $100,000+ | 10 (3.8%) | 15 (14.7%) |
| Total | 262 (100.0%) | 102 (100.0%) |
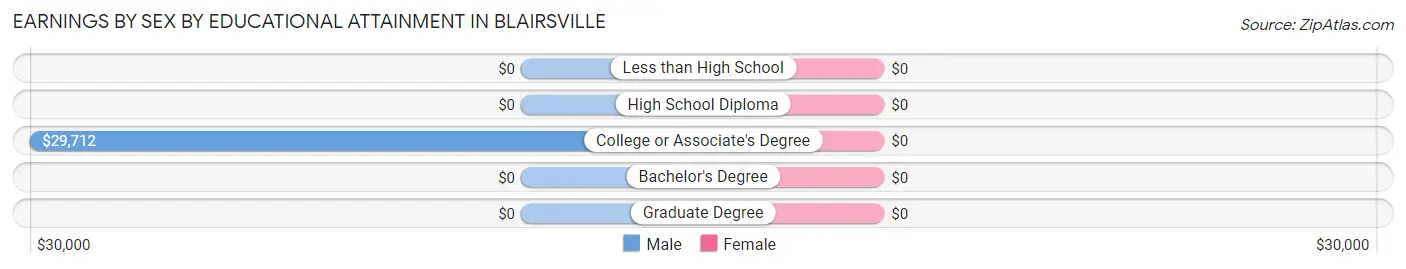
Earnings by Sex by Educational Attainment in Blairsville
| Educational Attainment | Male Income | Female Income |
| Less than High School | - | - |
| High School Diploma | - | - |
| College or Associate's Degree | $29,712 | $0 |
| Bachelor's Degree | - | - |
| Graduate Degree | - | - |
| Total | $28,039 | $0 |
Family Income in Blairsville
Family Income Brackets in Blairsville
According to the Blairsville family income data, there are 31 families falling into the $25,000 to $34,999 income range, which is the most common income bracket and makes up 26.1% of all families.
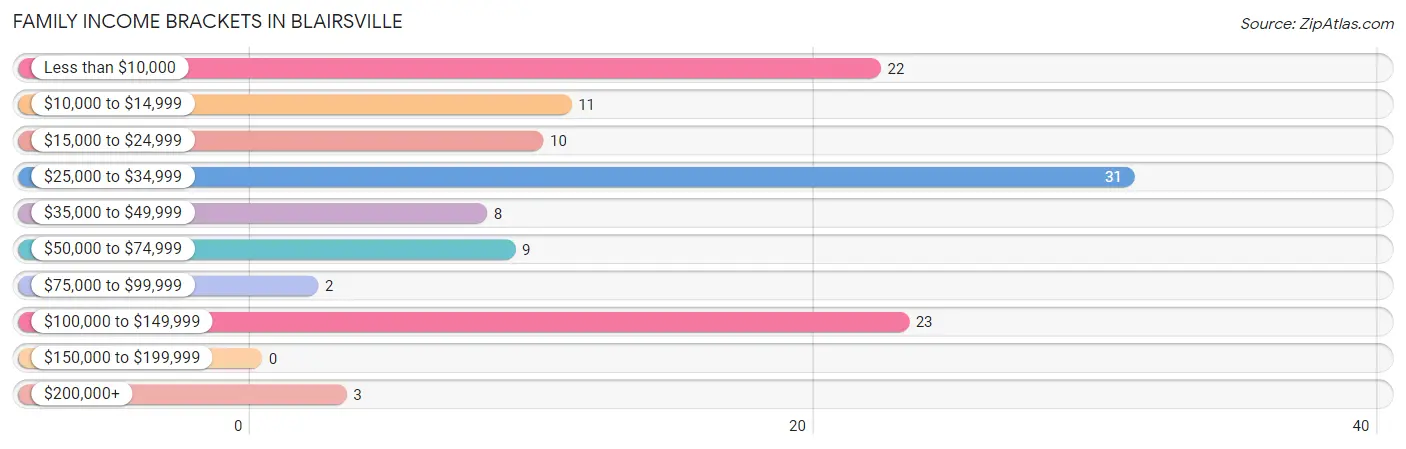
| Income Bracket | # Families | % Families |
| Less than $10,000 | 22 | 18.5% |
| $10,000 to $14,999 | 11 | 9.2% |
| $15,000 to $24,999 | 10 | 8.4% |
| $25,000 to $34,999 | 31 | 26.1% |
| $35,000 to $49,999 | 8 | 6.7% |
| $50,000 to $74,999 | 9 | 7.6% |
| $75,000 to $99,999 | 2 | 1.7% |
| $100,000 to $149,999 | 23 | 19.3% |
| $150,000 to $199,999 | 0 | 0.0% |
| $200,000+ | 3 | 2.5% |
Family Income by Famaliy Size in Blairsville
2-person families (86 | 72.3%) account for the highest median family income in Blairsville with $28,654 per family, while 2-person families (86 | 72.3%) have the highest median income of $14,327 per family member.
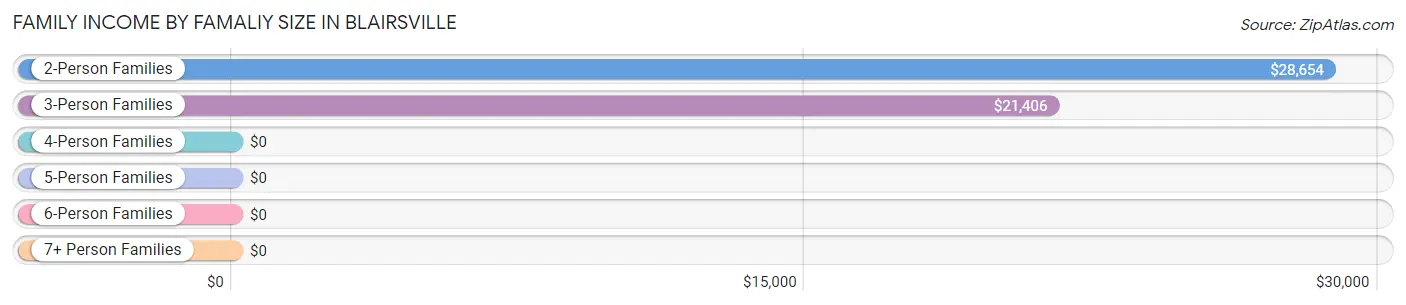
| Income Bracket | # Families | Median Income |
| 2-Person Families | 86 (72.3%) | $28,654 |
| 3-Person Families | 17 (14.3%) | $21,406 |
| 4-Person Families | 14 (11.8%) | $0 |
| 5-Person Families | 0 (0.0%) | $0 |
| 6-Person Families | 2 (1.7%) | $0 |
| 7+ Person Families | 0 (0.0%) | $0 |
| Total | 119 (100.0%) | $29,028 |
Family Income by Number of Earners in Blairsville
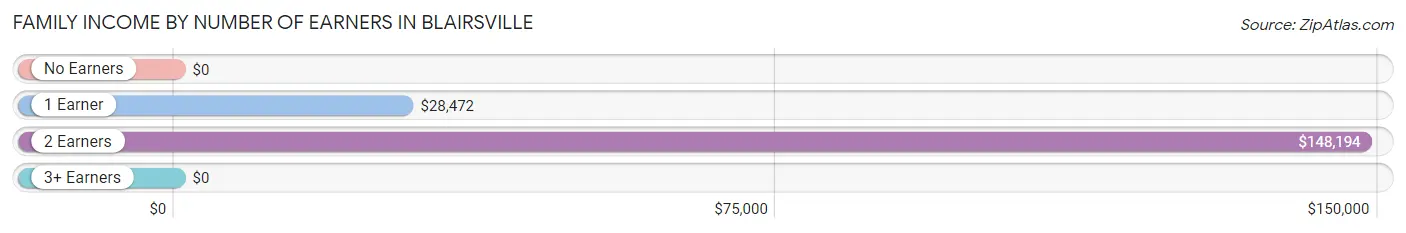
| Number of Earners | # Families | Median Income |
| No Earners | 15 (12.6%) | $0 |
| 1 Earner | 81 (68.1%) | $28,472 |
| 2 Earners | 13 (10.9%) | $148,194 |
| 3+ Earners | 10 (8.4%) | $0 |
| Total | 119 (100.0%) | $29,028 |
Household Income in Blairsville
Household Income Brackets in Blairsville
With 51 households falling in the category, the $15,000 to $24,999 income range is the most frequent in Blairsville, accounting for 24.2% of all households. In contrast, only 3 households (1.4%) fall into the $150,000 to $199,999 income bracket, making it the least populous group.
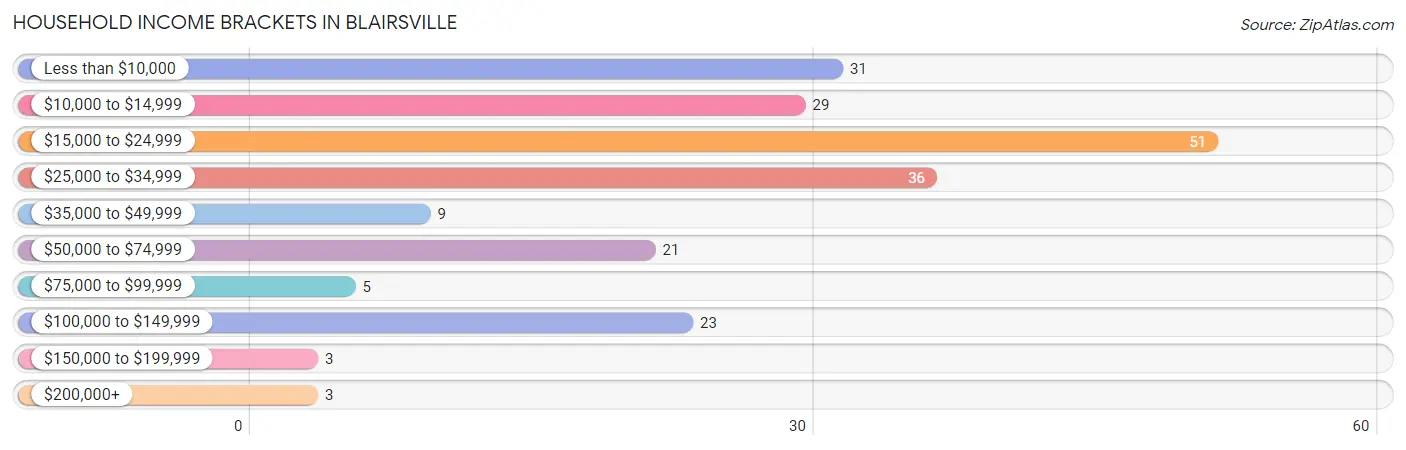
| Income Bracket | # Households | % Households |
| Less than $10,000 | 31 | 14.7% |
| $10,000 to $14,999 | 29 | 13.7% |
| $15,000 to $24,999 | 51 | 24.2% |
| $25,000 to $34,999 | 36 | 17.1% |
| $35,000 to $49,999 | 9 | 4.3% |
| $50,000 to $74,999 | 21 | 10.0% |
| $75,000 to $99,999 | 5 | 2.4% |
| $100,000 to $149,999 | 23 | 10.9% |
| $150,000 to $199,999 | 3 | 1.4% |
| $200,000+ | 3 | 1.4% |
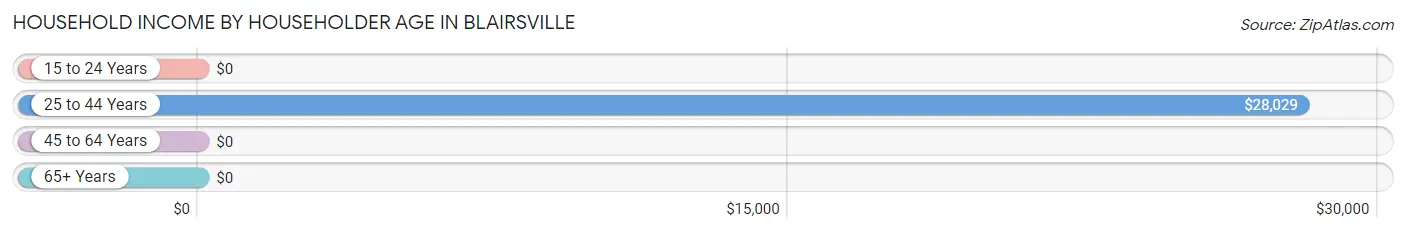
Household Income by Householder Age in Blairsville
The median household income in Blairsville is $21,827, with the highest median household income of $28,029 found in the 25 to 44 years age bracket for the primary householder. A total of 81 households (38.4%) fall into this category. Meanwhile, the 15 to 24 years age bracket for the primary householder has the lowest median household income of $0, with 32 households (15.2%) in this group.
| Income Bracket | # Households | Median Income |
| 15 to 24 Years | 32 (15.2%) | $0 |
| 25 to 44 Years | 81 (38.4%) | $28,029 |
| 45 to 64 Years | 44 (20.8%) | $0 |
| 65+ Years | 54 (25.6%) | $0 |
| Total | 211 (100.0%) | $21,827 |
Poverty in Blairsville
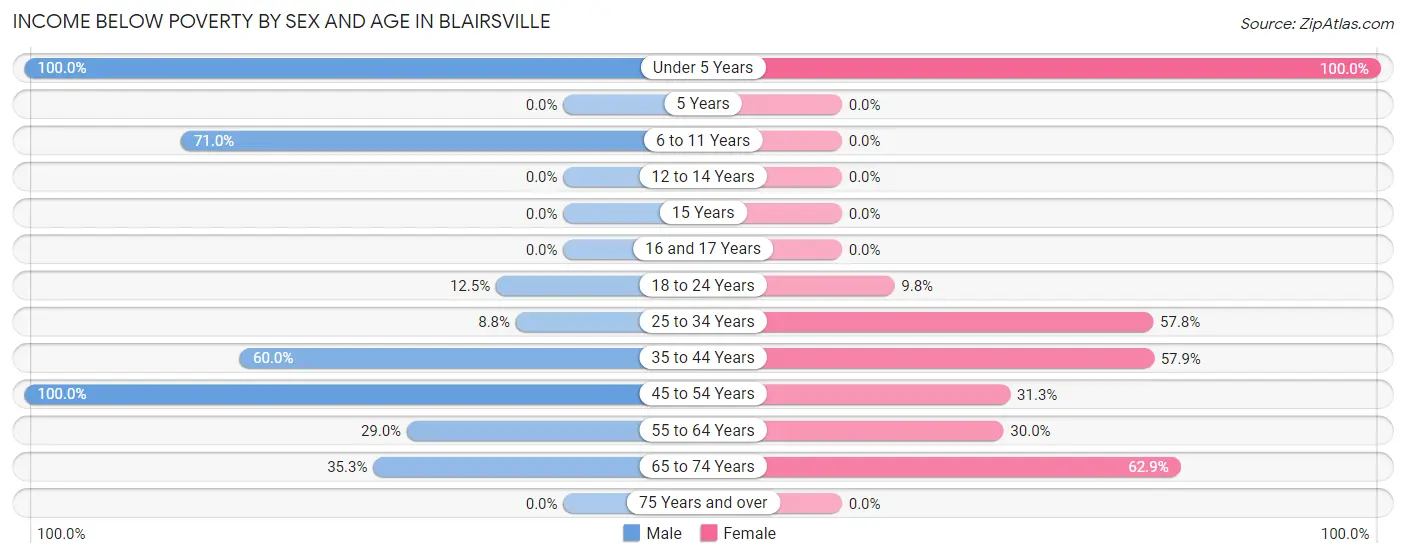
Income Below Poverty by Sex and Age in Blairsville
With 38.9% poverty level for males and 42.0% for females among the residents of Blairsville, under 5 year old males and under 5 year old females are the most vulnerable to poverty, with 34 males (100.0%) and 21 females (100.0%) in their respective age groups living below the poverty level.
| Age Bracket | Male | Female |
| Under 5 Years | 34 (100.0%) | 21 (100.0%) |
| 5 Years | 0 (0.0%) | 0 (0.0%) |
| 6 to 11 Years | 22 (71.0%) | 0 (0.0%) |
| 12 to 14 Years | 0 (0.0%) | 0 (0.0%) |
| 15 Years | 0 (0.0%) | 0 (0.0%) |
| 16 and 17 Years | 0 (0.0%) | 0 (0.0%) |
| 18 to 24 Years | 5 (12.5%) | 4 (9.8%) |
| 25 to 34 Years | 6 (8.8%) | 26 (57.8%) |
| 35 to 44 Years | 9 (60.0%) | 11 (57.9%) |
| 45 to 54 Years | 4 (100.0%) | 10 (31.2%) |
| 55 to 64 Years | 9 (29.0%) | 3 (30.0%) |
| 65 to 74 Years | 6 (35.3%) | 22 (62.9%) |
| 75 Years and over | 0 (0.0%) | 0 (0.0%) |
| Total | 95 (38.9%) | 97 (42.0%) |
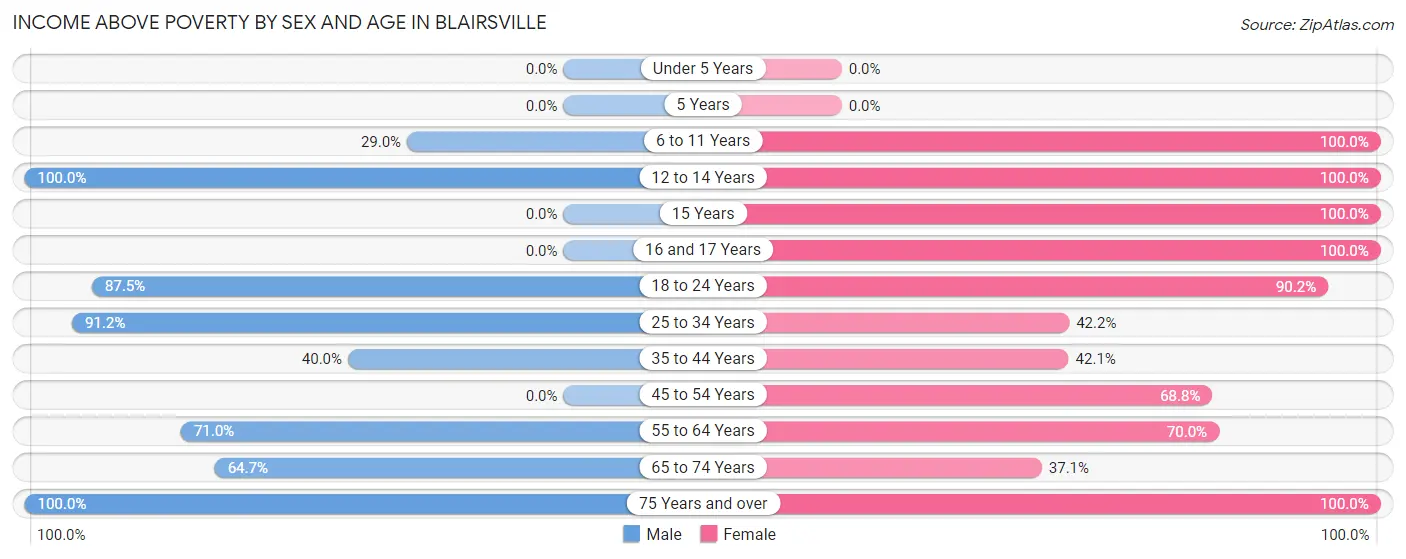
Income Above Poverty by Sex and Age in Blairsville
According to the poverty statistics in Blairsville, males aged 12 to 14 years and females aged 6 to 11 years are the age groups that are most secure financially, with 100.0% of males and 100.0% of females in these age groups living above the poverty line.
| Age Bracket | Male | Female |
| Under 5 Years | 0 (0.0%) | 0 (0.0%) |
| 5 Years | 0 (0.0%) | 0 (0.0%) |
| 6 to 11 Years | 9 (29.0%) | 13 (100.0%) |
| 12 to 14 Years | 1 (100.0%) | 4 (100.0%) |
| 15 Years | 0 (0.0%) | 1 (100.0%) |
| 16 and 17 Years | 0 (0.0%) | 1 (100.0%) |
| 18 to 24 Years | 35 (87.5%) | 37 (90.2%) |
| 25 to 34 Years | 62 (91.2%) | 19 (42.2%) |
| 35 to 44 Years | 6 (40.0%) | 8 (42.1%) |
| 45 to 54 Years | 0 (0.0%) | 22 (68.8%) |
| 55 to 64 Years | 22 (71.0%) | 7 (70.0%) |
| 65 to 74 Years | 11 (64.7%) | 13 (37.1%) |
| 75 Years and over | 3 (100.0%) | 9 (100.0%) |
| Total | 149 (61.1%) | 134 (58.0%) |
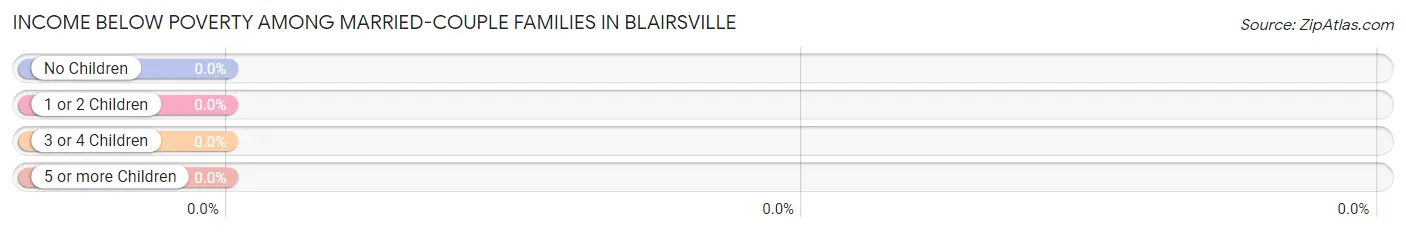
Income Below Poverty Among Married-Couple Families in Blairsville
| Children | Above Poverty | Below Poverty |
| No Children | 64 (100.0%) | 0 (0.0%) |
| 1 or 2 Children | 7 (100.0%) | 0 (0.0%) |
| 3 or 4 Children | 2 (100.0%) | 0 (0.0%) |
| 5 or more Children | 0 (0.0%) | 0 (0.0%) |
| Total | 73 (100.0%) | 0 (0.0%) |
Income Below Poverty Among Single-Parent Households in Blairsville
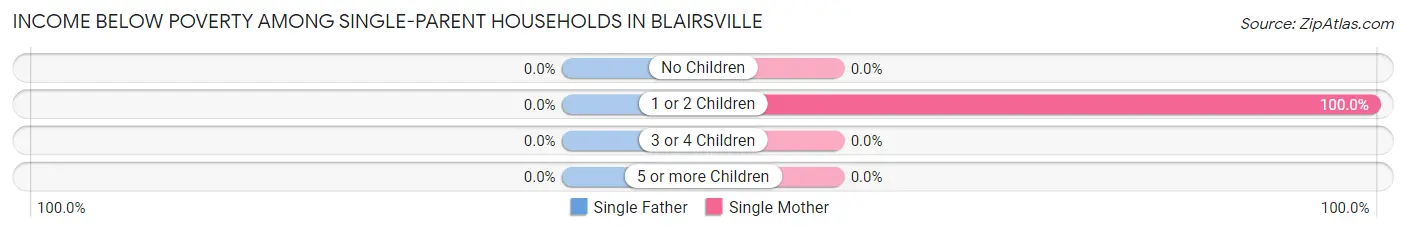
| Children | Single Father | Single Mother |
| No Children | 0 (0.0%) | 0 (0.0%) |
| 1 or 2 Children | 0 (0.0%) | 41 (100.0%) |
| 3 or 4 Children | 0 (0.0%) | 0 (0.0%) |
| 5 or more Children | 0 (0.0%) | 0 (0.0%) |
| Total | 0 (0.0%) | 41 (91.1%) |
Income Below Poverty Among Married-Couple vs Single-Parent Households in Blairsville
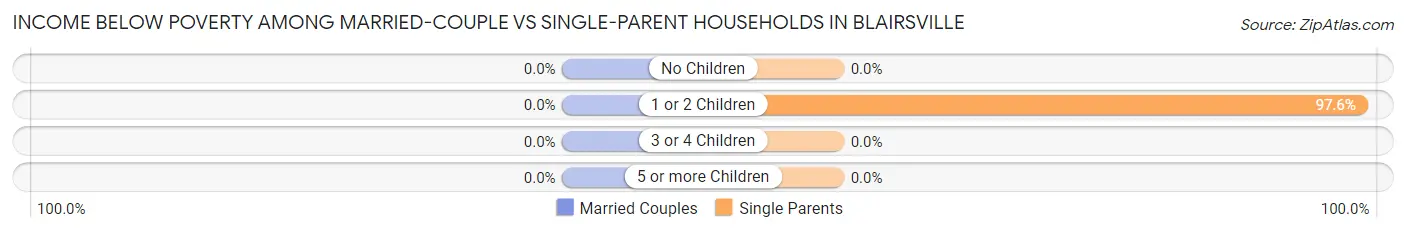
| Children | Married-Couple Families | Single-Parent Households |
| No Children | 0 (0.0%) | 0 (0.0%) |
| 1 or 2 Children | 0 (0.0%) | 41 (97.6%) |
| 3 or 4 Children | 0 (0.0%) | 0 (0.0%) |
| 5 or more Children | 0 (0.0%) | 0 (0.0%) |
| Total | 0 (0.0%) | 41 (89.1%) |
Race in Blairsville
The most populous races in Blairsville are White / Caucasian (535 | 72.7%), Hispanic or Latino (112 | 15.2%), and Black / African American (97 | 13.2%).
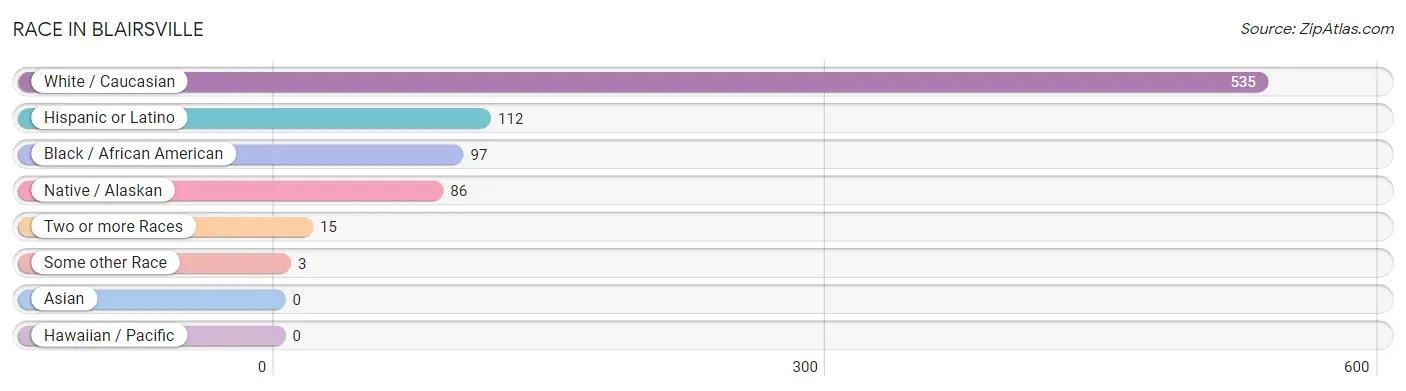
| Race | # Population | % Population |
| Asian | 0 | 0.0% |
| Black / African American | 97 | 13.2% |
| Hawaiian / Pacific | 0 | 0.0% |
| Hispanic or Latino | 112 | 15.2% |
| Native / Alaskan | 86 | 11.7% |
| White / Caucasian | 535 | 72.7% |
| Two or more Races | 15 | 2.0% |
| Some other Race | 3 | 0.4% |
| Total | 736 | 100.0% |
Ancestry in Blairsville
The most populous ancestries reported in Blairsville are English (130 | 17.7%), Irish (105 | 14.3%), Central American (77 | 10.5%), Central American Indian (77 | 10.5%), and Guatemalan (77 | 10.5%), together accounting for 63.3% of all Blairsville residents.
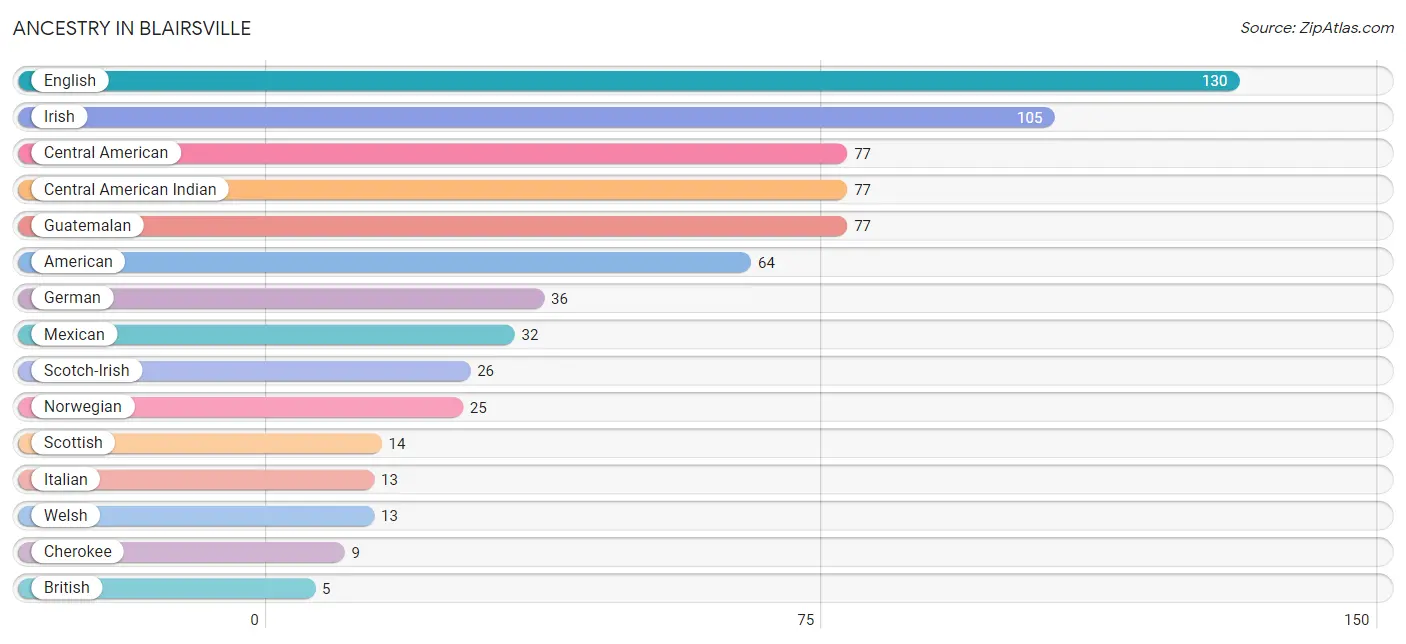
| Ancestry | # Population | % Population |
| American | 64 | 8.7% |
| Bhutanese | 1 | 0.1% |
| British | 5 | 0.7% |
| Central American | 77 | 10.5% |
| Central American Indian | 77 | 10.5% |
| Cherokee | 9 | 1.2% |
| English | 130 | 17.7% |
| European | 5 | 0.7% |
| French | 3 | 0.4% |
| German | 36 | 4.9% |
| Guatemalan | 77 | 10.5% |
| Irish | 105 | 14.3% |
| Italian | 13 | 1.8% |
| Mexican | 32 | 4.3% |
| Norwegian | 25 | 3.4% |
| Puerto Rican | 3 | 0.4% |
| Scotch-Irish | 26 | 3.5% |
| Scottish | 14 | 1.9% |
| Welsh | 13 | 1.8% | View All 19 Rows |
Immigrants in Blairsville
The most numerous immigrant groups reported in Blairsville came from Central America (68 | 9.2%), Latin America (68 | 9.2%), Guatemala (54 | 7.3%), and Mexico (14 | 1.9%), together accounting for 27.7% of all Blairsville residents.
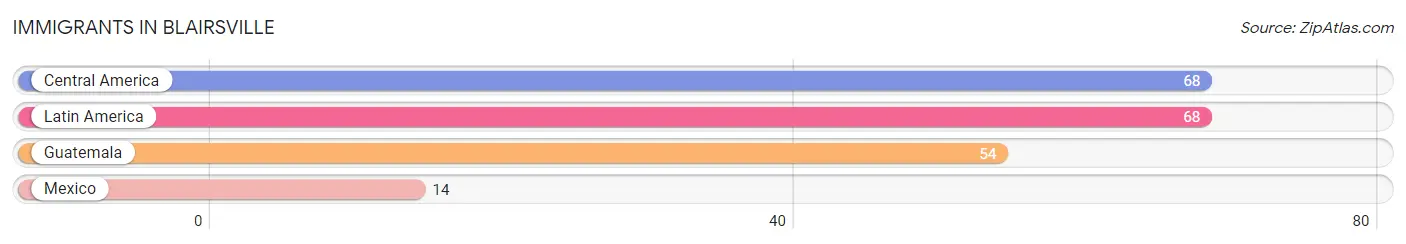
| Immigration Origin | # Population | % Population |
| Central America | 68 | 9.2% |
| Guatemala | 54 | 7.3% |
| Latin America | 68 | 9.2% |
| Mexico | 14 | 1.9% | View All 4 Rows |
Sex and Age in Blairsville
Sex and Age in Blairsville
The most populous age groups in Blairsville are 40 to 44 Years (114 | 23.2%) for men and 25 to 29 Years (41 | 16.8%) for women.
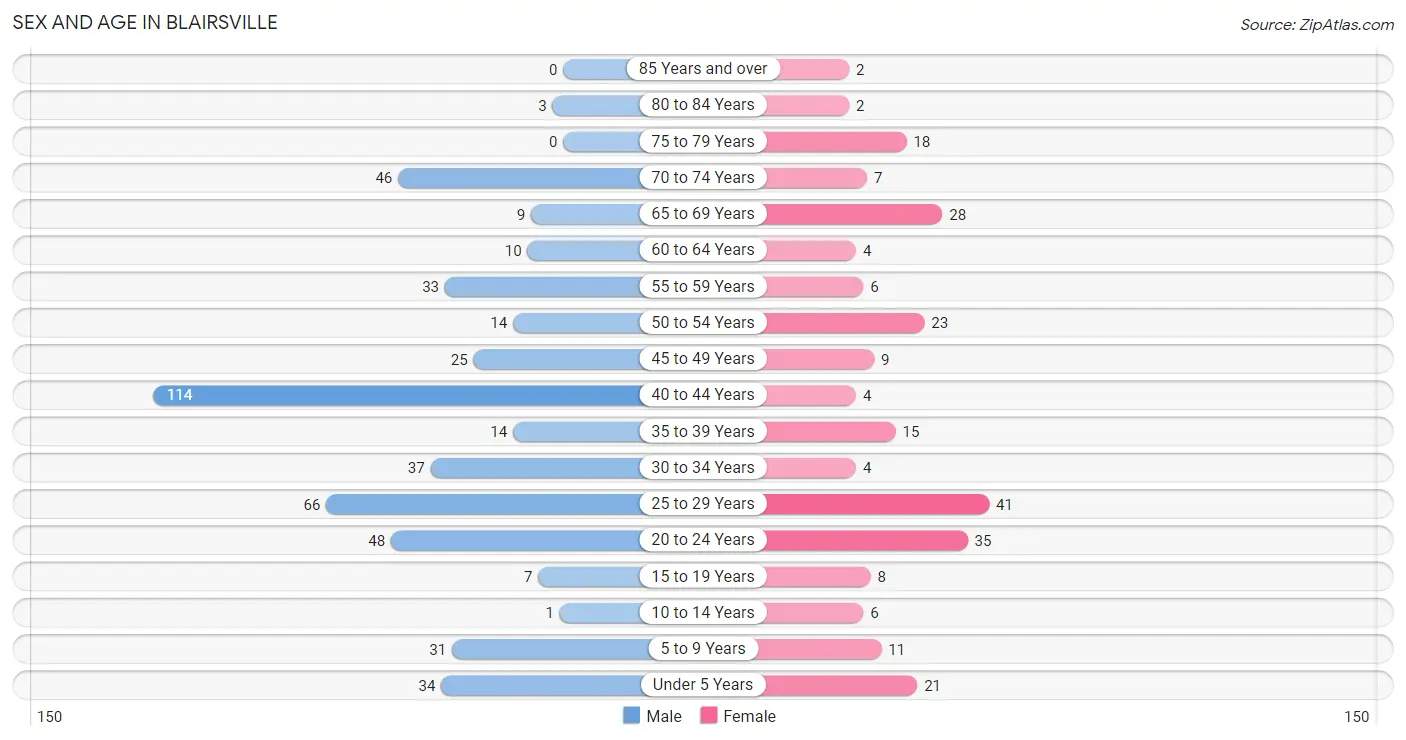
| Age Bracket | Male | Female |
| Under 5 Years | 34 (6.9%) | 21 (8.6%) |
| 5 to 9 Years | 31 (6.3%) | 11 (4.5%) |
| 10 to 14 Years | 1 (0.2%) | 6 (2.5%) |
| 15 to 19 Years | 7 (1.4%) | 8 (3.3%) |
| 20 to 24 Years | 48 (9.8%) | 35 (14.3%) |
| 25 to 29 Years | 66 (13.4%) | 41 (16.8%) |
| 30 to 34 Years | 37 (7.5%) | 4 (1.6%) |
| 35 to 39 Years | 14 (2.9%) | 15 (6.1%) |
| 40 to 44 Years | 114 (23.2%) | 4 (1.6%) |
| 45 to 49 Years | 25 (5.1%) | 9 (3.7%) |
| 50 to 54 Years | 14 (2.9%) | 23 (9.4%) |
| 55 to 59 Years | 33 (6.7%) | 6 (2.5%) |
| 60 to 64 Years | 10 (2.0%) | 4 (1.6%) |
| 65 to 69 Years | 9 (1.8%) | 28 (11.5%) |
| 70 to 74 Years | 46 (9.3%) | 7 (2.9%) |
| 75 to 79 Years | 0 (0.0%) | 18 (7.4%) |
| 80 to 84 Years | 3 (0.6%) | 2 (0.8%) |
| 85 Years and over | 0 (0.0%) | 2 (0.8%) |
| Total | 492 (100.0%) | 244 (100.0%) |
Families and Households in Blairsville
Median Family Size in Blairsville
The median family size in Blairsville is 2.82 persons per family, with single male/father families (1 | 0.8%) accounting for the largest median family size of 4 persons per family. On the other hand, single female/mother families (45 | 37.8%) represent the smallest median family size with 2.80 persons per family.
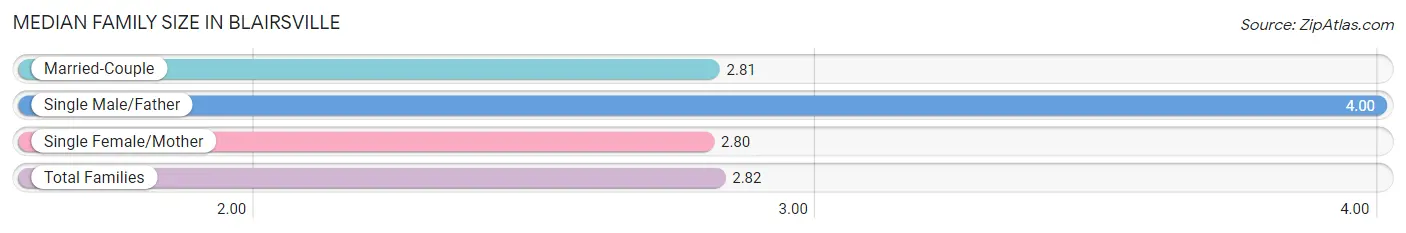
| Family Type | # Families | Family Size |
| Married-Couple | 73 (61.3%) | 2.81 |
| Single Male/Father | 1 (0.8%) | 4.00 |
| Single Female/Mother | 45 (37.8%) | 2.80 |
| Total Families | 119 (100.0%) | 2.82 |
Median Household Size in Blairsville
The median household size in Blairsville is 2.25 persons per household, with single male/father households (1 | 0.5%) accounting for the largest median household size of 4 persons per household. non-family households (92 | 43.6%) represent the smallest median household size with 1.07 persons per household.
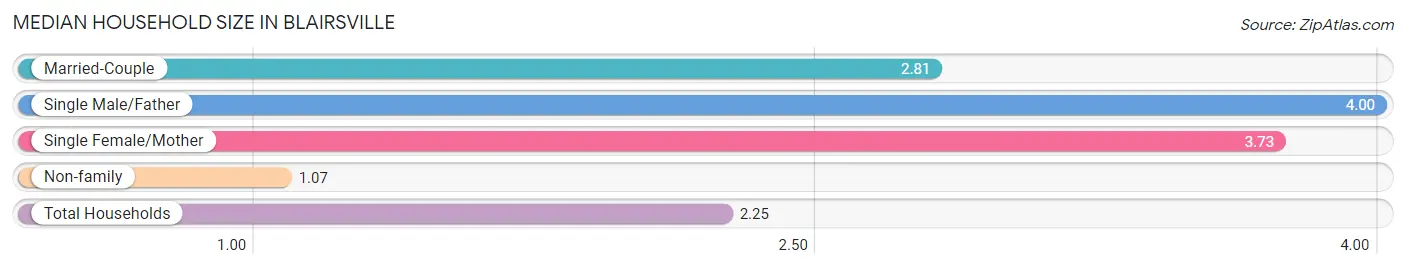
| Household Type | # Households | Household Size |
| Married-Couple | 73 (34.6%) | 2.81 |
| Single Male/Father | 1 (0.5%) | 4.00 |
| Single Female/Mother | 45 (21.3%) | 3.73 |
| Non-family | 92 (43.6%) | 1.07 |
| Total Households | 211 (100.0%) | 2.25 |
Household Size by Marriage Status in Blairsville
Out of a total of 211 households in Blairsville, 119 (56.4%) are family households, while 92 (43.6%) are nonfamily households. The most numerous type of family households are 2-person households, comprising 57, and the most common type of nonfamily households are 1-person households, comprising 88.
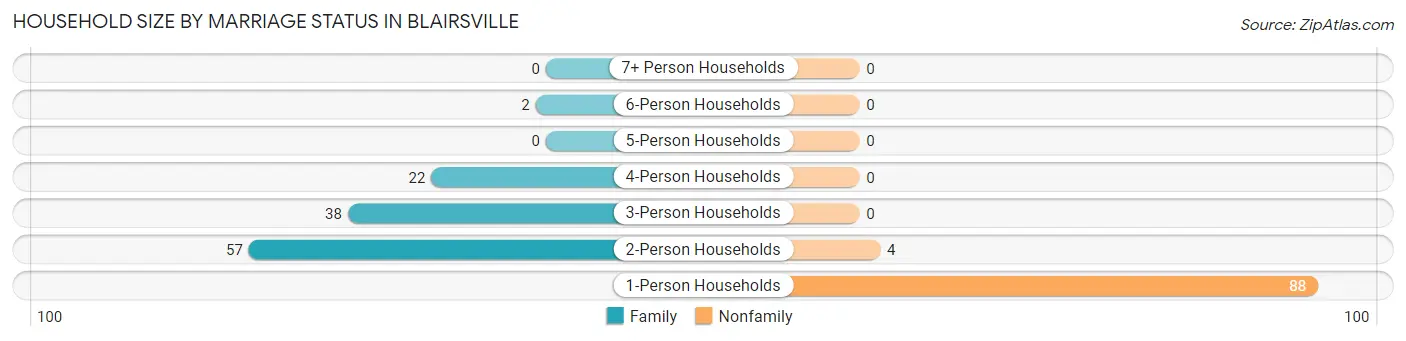
| Household Size | Family Households | Nonfamily Households |
| 1-Person Households | - | 88 (41.7%) |
| 2-Person Households | 57 (27.0%) | 4 (1.9%) |
| 3-Person Households | 38 (18.0%) | 0 (0.0%) |
| 4-Person Households | 22 (10.4%) | 0 (0.0%) |
| 5-Person Households | 0 (0.0%) | 0 (0.0%) |
| 6-Person Households | 2 (0.9%) | 0 (0.0%) |
| 7+ Person Households | 0 (0.0%) | 0 (0.0%) |
| Total | 119 (56.4%) | 92 (43.6%) |
Female Fertility in Blairsville
Fertility by Age in Blairsville
Average fertility rate in Blairsville is 379.0 births per 1,000 women. Women in the age bracket of 20 to 34 years have the highest fertility rate with 413.0 births per 1,000 women. Women in the age bracket of 20 to 34 years acount for 75.0% of all women with births.
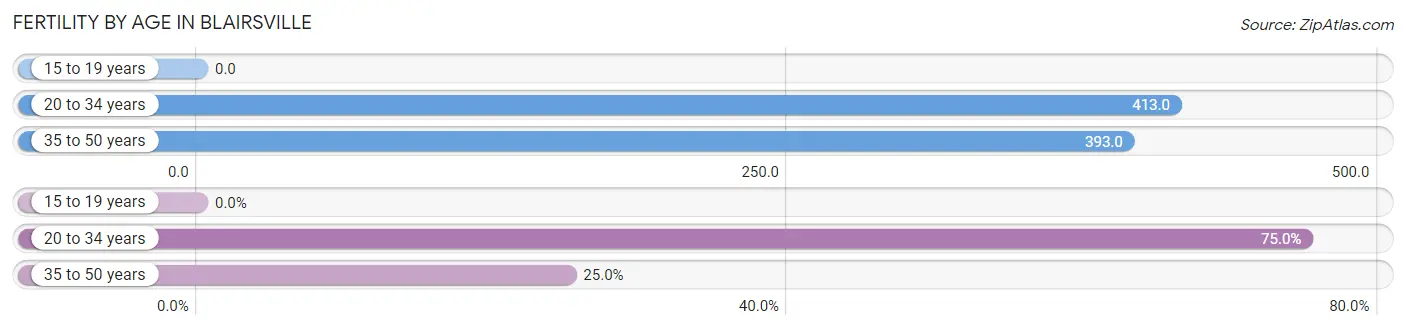
| Age Bracket | Women with Births | Births / 1,000 Women |
| 15 to 19 years | 0 (0.0%) | 0.0 |
| 20 to 34 years | 33 (75.0%) | 413.0 |
| 35 to 50 years | 11 (25.0%) | 393.0 |
| Total | 44 (100.0%) | 379.0 |
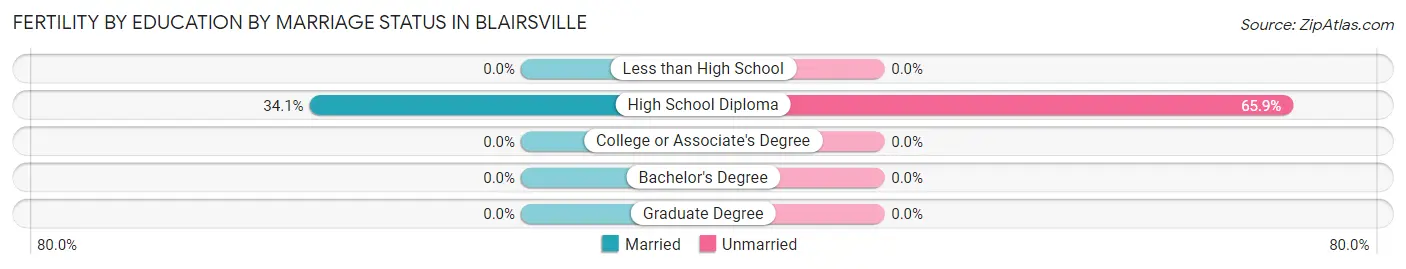
Fertility by Age by Marriage Status in Blairsville
34.1% of women with births (44) in Blairsville are married. The highest percentage of unmarried women with births falls into 35 to 50 years age bracket with 100.0% of them unmarried at the time of birth, while the lowest percentage of unmarried women with births belong to 20 to 34 years age bracket with 54.5% of them unmarried.
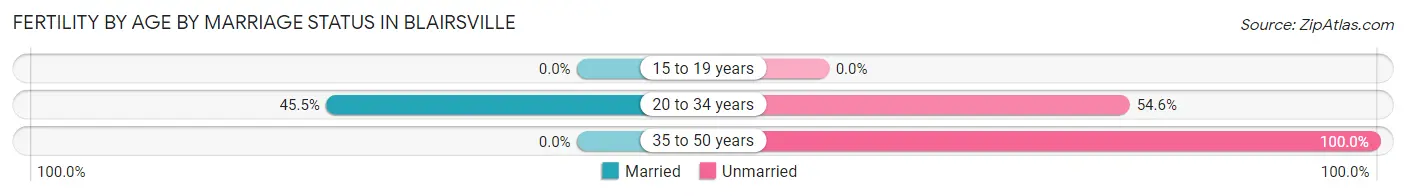
| Age Bracket | Married | Unmarried |
| 15 to 19 years | 0 (0.0%) | 0 (0.0%) |
| 20 to 34 years | 15 (45.5%) | 18 (54.5%) |
| 35 to 50 years | 0 (0.0%) | 11 (100.0%) |
| Total | 15 (34.1%) | 29 (65.9%) |
Fertility by Education in Blairsville
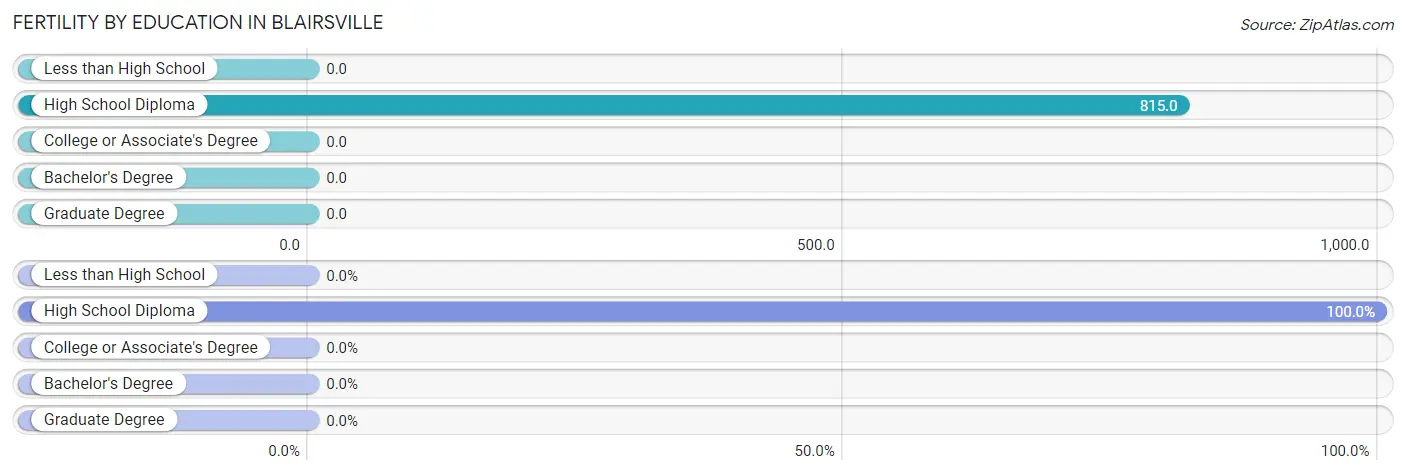
| Educational Attainment | Women with Births | Births / 1,000 Women |
| Less than High School | 0 (0.0%) | 0.0 |
| High School Diploma | 44 (100.0%) | 815.0 |
| College or Associate's Degree | 0 (0.0%) | 0.0 |
| Bachelor's Degree | 0 (0.0%) | 0.0 |
| Graduate Degree | 0 (0.0%) | 0.0 |
| Total | 44 (100.0%) | 379.0 |
Fertility by Education by Marriage Status in Blairsville
65.9% of women with births in Blairsville are unmarried. Women with the educational attainment of high school diploma are most likely to be married with 34.1% of them married at childbirth, while women with the educational attainment of high school diploma are least likely to be married with 65.9% of them unmarried at childbirth.
| Educational Attainment | Married | Unmarried |
| Less than High School | 0 (0.0%) | 0 (0.0%) |
| High School Diploma | 15 (34.1%) | 29 (65.9%) |
| College or Associate's Degree | 0 (0.0%) | 0 (0.0%) |
| Bachelor's Degree | 0 (0.0%) | 0 (0.0%) |
| Graduate Degree | 0 (0.0%) | 0 (0.0%) |
| Total | 15 (34.1%) | 29 (65.9%) |
Employment Characteristics in Blairsville
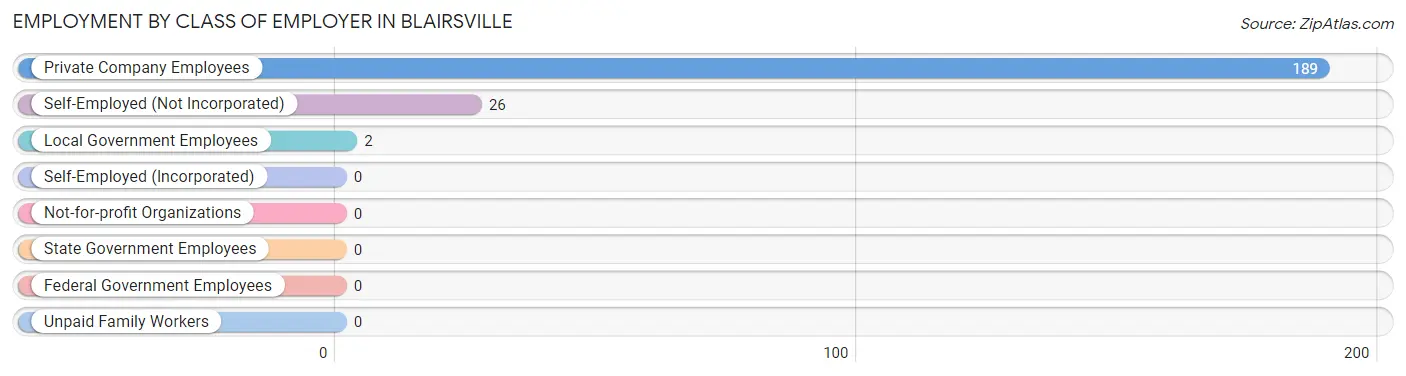
Employment by Class of Employer in Blairsville
Among the 217 employed individuals in Blairsville, private company employees (189 | 87.1%), self-employed (not incorporated) (26 | 12.0%), and local government employees (2 | 0.9%) make up the most common classes of employment.
| Employer Class | # Employees | % Employees |
| Private Company Employees | 189 | 87.1% |
| Self-Employed (Incorporated) | 0 | 0.0% |
| Self-Employed (Not Incorporated) | 26 | 12.0% |
| Not-for-profit Organizations | 0 | 0.0% |
| Local Government Employees | 2 | 0.9% |
| State Government Employees | 0 | 0.0% |
| Federal Government Employees | 0 | 0.0% |
| Unpaid Family Workers | 0 | 0.0% |
| Total | 217 | 100.0% |
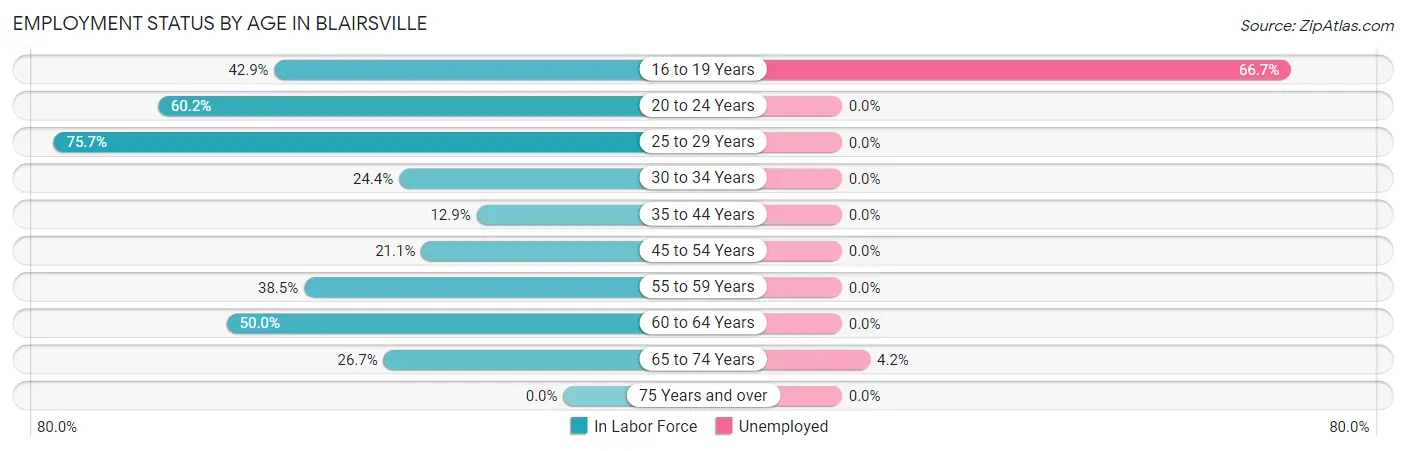
Employment Status by Age in Blairsville
According to the labor force statistics for Blairsville, out of the total population over 16 years of age (631), 36.0% or 227 individuals are in the labor force, with 2.2% or 5 of them unemployed. The age group with the highest labor force participation rate is 25 to 29 years, with 75.7% or 81 individuals in the labor force. Within the labor force, the 16 to 19 years age range has the highest percentage of unemployed individuals, with 66.7% or 4 of them being unemployed.
| Age Bracket | In Labor Force | Unemployed |
| 16 to 19 Years | 6 (42.9%) | 4 (66.7%) |
| 20 to 24 Years | 50 (60.2%) | 0 (0.0%) |
| 25 to 29 Years | 81 (75.7%) | 0 (0.0%) |
| 30 to 34 Years | 10 (24.4%) | 0 (0.0%) |
| 35 to 44 Years | 19 (12.9%) | 0 (0.0%) |
| 45 to 54 Years | 15 (21.1%) | 0 (0.0%) |
| 55 to 59 Years | 15 (38.5%) | 0 (0.0%) |
| 60 to 64 Years | 7 (50.0%) | 0 (0.0%) |
| 65 to 74 Years | 24 (26.7%) | 1 (4.2%) |
| 75 Years and over | 0 (0.0%) | 0 (0.0%) |
| Total | 227 (36.0%) | 5 (2.2%) |
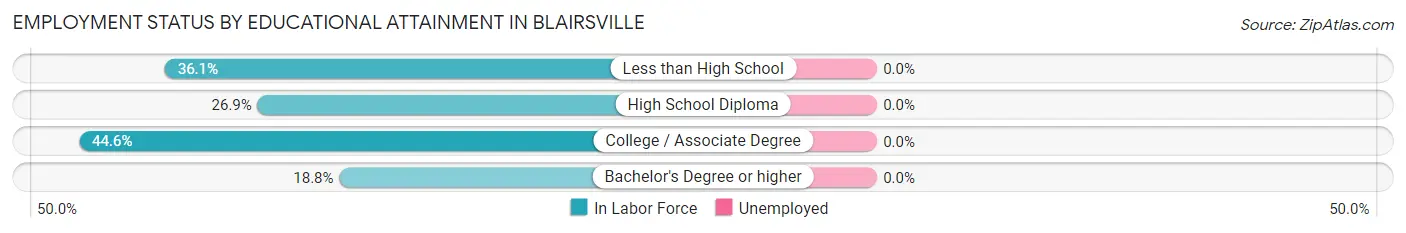
Employment Status by Educational Attainment in Blairsville
| Educational Attainment | In Labor Force | Unemployed |
| Less than High School | 43 (36.1%) | 0 (0.0%) |
| High School Diploma | 39 (26.9%) | 0 (0.0%) |
| College / Associate Degree | 62 (44.6%) | 0 (0.0%) |
| Bachelor's Degree or higher | 3 (18.8%) | 0 (0.0%) |
| Total | 147 (35.1%) | 0 (0.0%) |
Employment Occupations by Sex in Blairsville
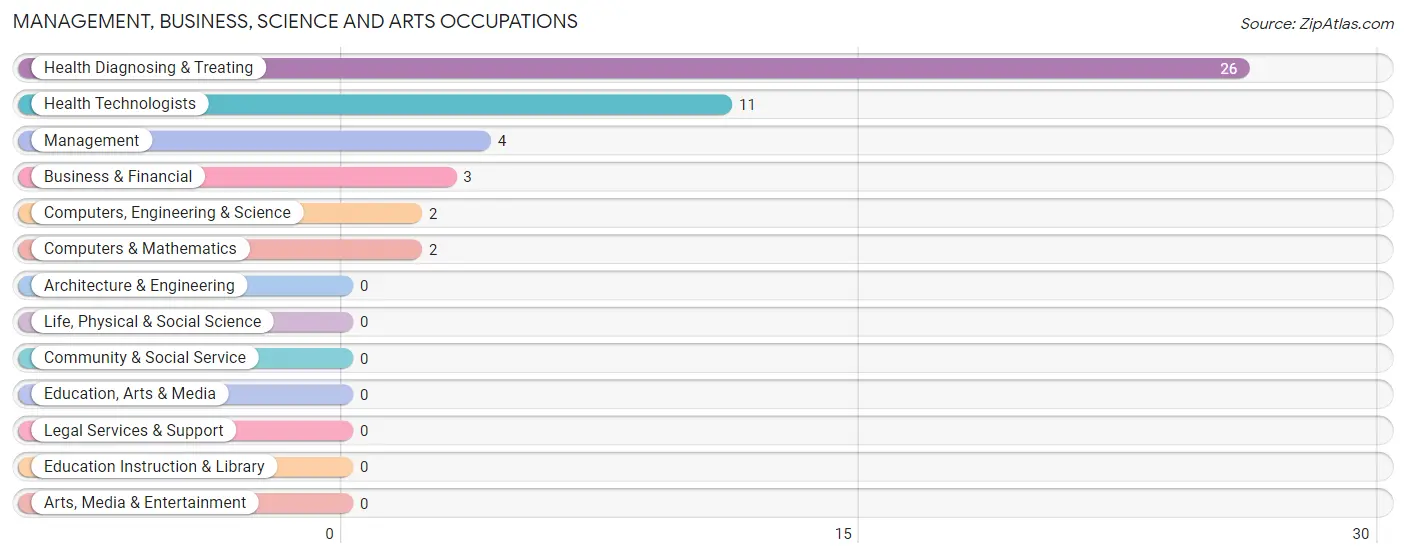
Management, Business, Science and Arts Occupations
The most common Management, Business, Science and Arts occupations in Blairsville are Health Diagnosing & Treating (26 | 11.7%), Health Technologists (11 | 5.0%), Management (4 | 1.8%), Business & Financial (3 | 1.3%), and Computers, Engineering & Science (2 | 0.9%).
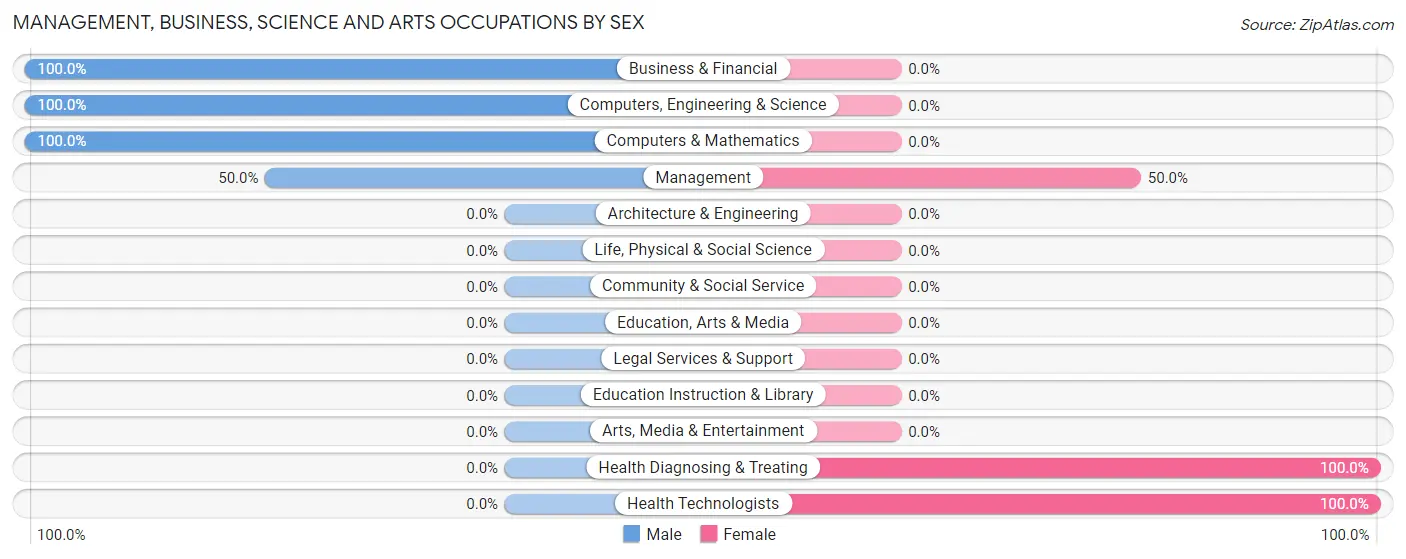
Management, Business, Science and Arts Occupations by Sex
Within the Management, Business, Science and Arts occupations in Blairsville, the most male-oriented occupations are Business & Financial (100.0%), Computers, Engineering & Science (100.0%), and Computers & Mathematics (100.0%), while the most female-oriented occupations are Health Diagnosing & Treating (100.0%), Health Technologists (100.0%), and Management (50.0%).
| Occupation | Male | Female |
| Management | 2 (50.0%) | 2 (50.0%) |
| Business & Financial | 3 (100.0%) | 0 (0.0%) |
| Computers, Engineering & Science | 2 (100.0%) | 0 (0.0%) |
| Computers & Mathematics | 2 (100.0%) | 0 (0.0%) |
| Architecture & Engineering | 0 (0.0%) | 0 (0.0%) |
| Life, Physical & Social Science | 0 (0.0%) | 0 (0.0%) |
| Community & Social Service | 0 (0.0%) | 0 (0.0%) |
| Education, Arts & Media | 0 (0.0%) | 0 (0.0%) |
| Legal Services & Support | 0 (0.0%) | 0 (0.0%) |
| Education Instruction & Library | 0 (0.0%) | 0 (0.0%) |
| Arts, Media & Entertainment | 0 (0.0%) | 0 (0.0%) |
| Health Diagnosing & Treating | 0 (0.0%) | 26 (100.0%) |
| Health Technologists | 0 (0.0%) | 11 (100.0%) |
| Total (Category) | 7 (20.0%) | 28 (80.0%) |
| Total (Overall) | 142 (64.0%) | 80 (36.0%) |
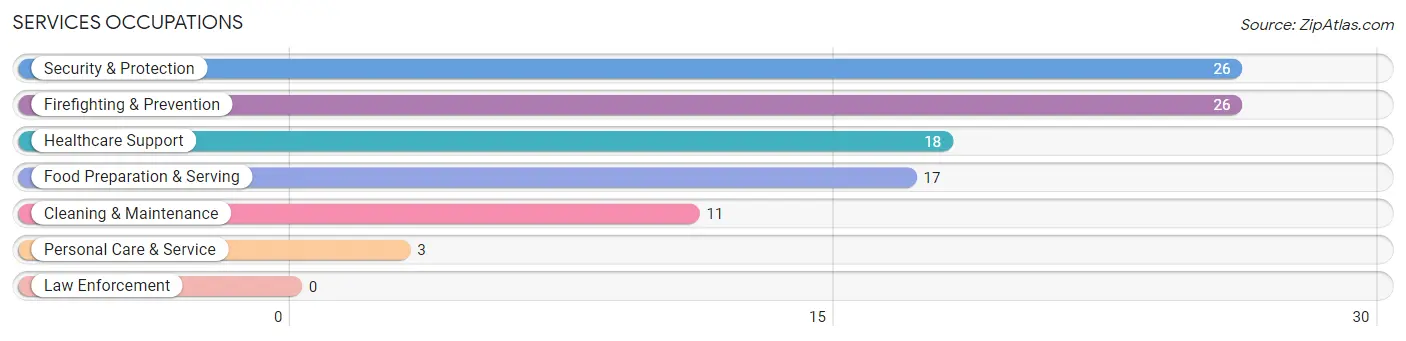
Services Occupations
The most common Services occupations in Blairsville are Security & Protection (26 | 11.7%), Firefighting & Prevention (26 | 11.7%), Healthcare Support (18 | 8.1%), Food Preparation & Serving (17 | 7.7%), and Cleaning & Maintenance (11 | 5.0%).
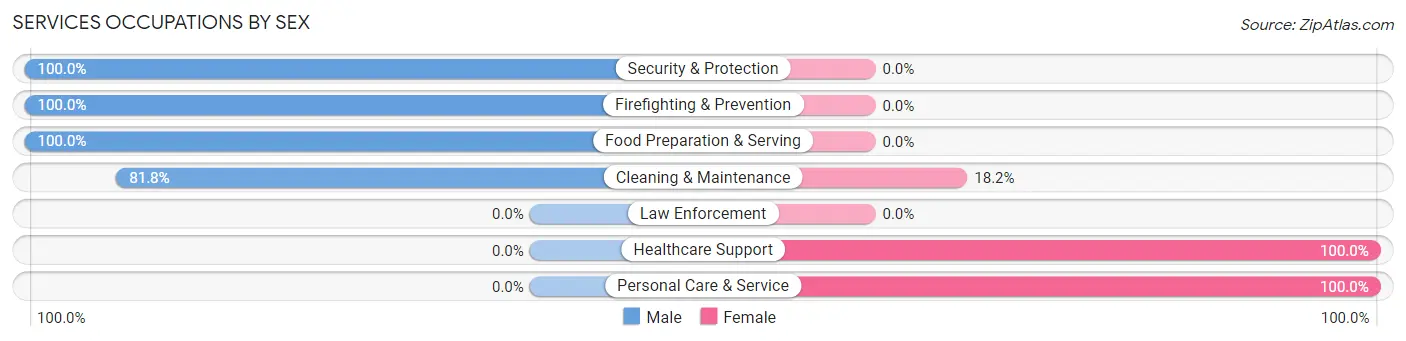
Services Occupations by Sex
Within the Services occupations in Blairsville, the most male-oriented occupations are Security & Protection (100.0%), Firefighting & Prevention (100.0%), and Food Preparation & Serving (100.0%), while the most female-oriented occupations are Healthcare Support (100.0%), Personal Care & Service (100.0%), and Cleaning & Maintenance (18.2%).
| Occupation | Male | Female |
| Healthcare Support | 0 (0.0%) | 18 (100.0%) |
| Security & Protection | 26 (100.0%) | 0 (0.0%) |
| Firefighting & Prevention | 26 (100.0%) | 0 (0.0%) |
| Law Enforcement | 0 (0.0%) | 0 (0.0%) |
| Food Preparation & Serving | 17 (100.0%) | 0 (0.0%) |
| Cleaning & Maintenance | 9 (81.8%) | 2 (18.2%) |
| Personal Care & Service | 0 (0.0%) | 3 (100.0%) |
| Total (Category) | 52 (69.3%) | 23 (30.7%) |
| Total (Overall) | 142 (64.0%) | 80 (36.0%) |
Sales and Office Occupations
The most common Sales and Office occupations in Blairsville are Office & Administration (36 | 16.2%), and Sales & Related (7 | 3.2%).
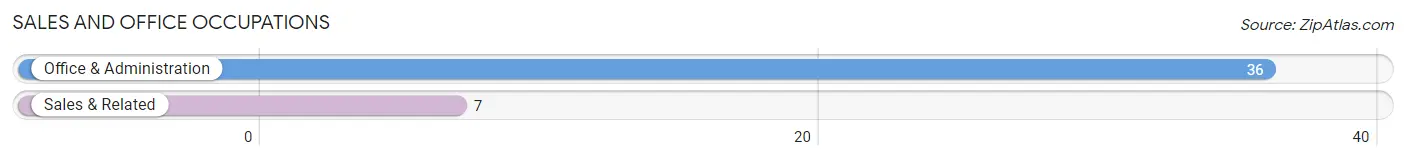
Sales and Office Occupations by Sex
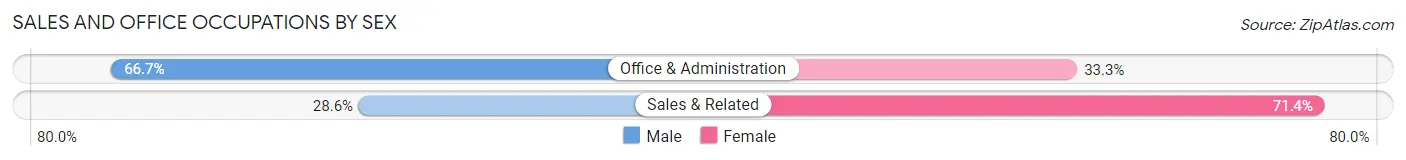
| Occupation | Male | Female |
| Sales & Related | 2 (28.6%) | 5 (71.4%) |
| Office & Administration | 24 (66.7%) | 12 (33.3%) |
| Total (Category) | 26 (60.5%) | 17 (39.5%) |
| Total (Overall) | 142 (64.0%) | 80 (36.0%) |
Natural Resources, Construction and Maintenance Occupations
The most common Natural Resources, Construction and Maintenance occupations in Blairsville are Construction & Extraction (38 | 17.1%), and Installation, Maintenance & Repair (6 | 2.7%).
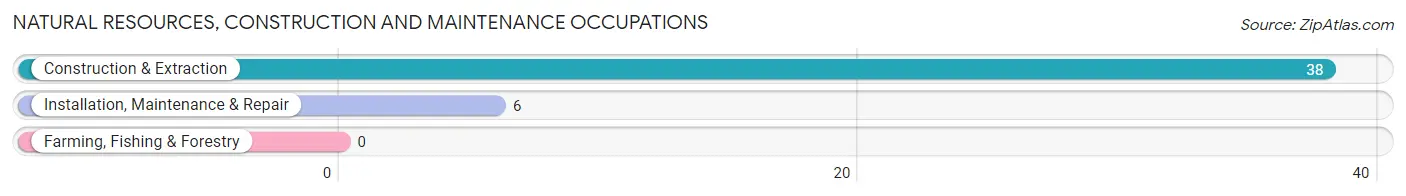
Natural Resources, Construction and Maintenance Occupations by Sex
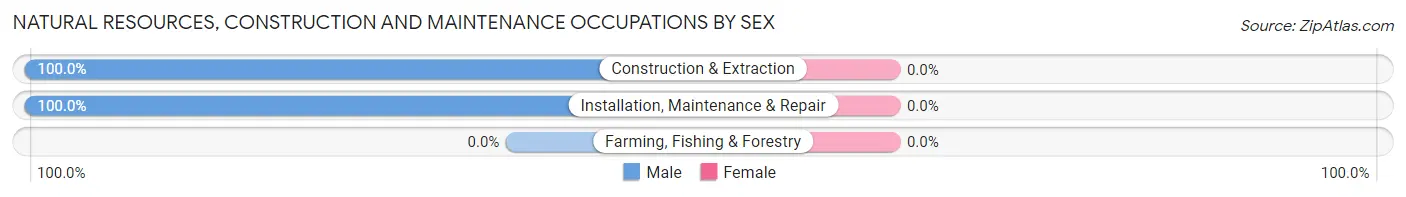
| Occupation | Male | Female |
| Farming, Fishing & Forestry | 0 (0.0%) | 0 (0.0%) |
| Construction & Extraction | 38 (100.0%) | 0 (0.0%) |
| Installation, Maintenance & Repair | 6 (100.0%) | 0 (0.0%) |
| Total (Category) | 44 (100.0%) | 0 (0.0%) |
| Total (Overall) | 142 (64.0%) | 80 (36.0%) |
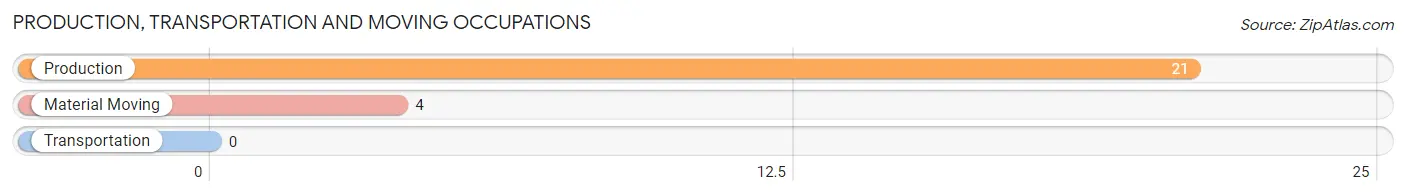
Production, Transportation and Moving Occupations
The most common Production, Transportation and Moving occupations in Blairsville are Production (21 | 9.5%), and Material Moving (4 | 1.8%).
Production, Transportation and Moving Occupations by Sex
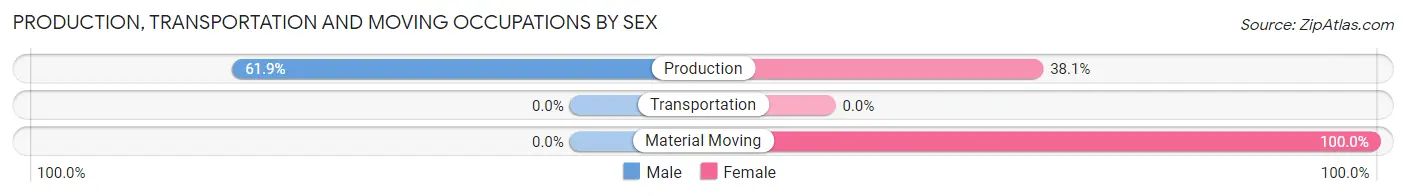
| Occupation | Male | Female |
| Production | 13 (61.9%) | 8 (38.1%) |
| Transportation | 0 (0.0%) | 0 (0.0%) |
| Material Moving | 0 (0.0%) | 4 (100.0%) |
| Total (Category) | 13 (52.0%) | 12 (48.0%) |
| Total (Overall) | 142 (64.0%) | 80 (36.0%) |
Employment Industries by Sex in Blairsville
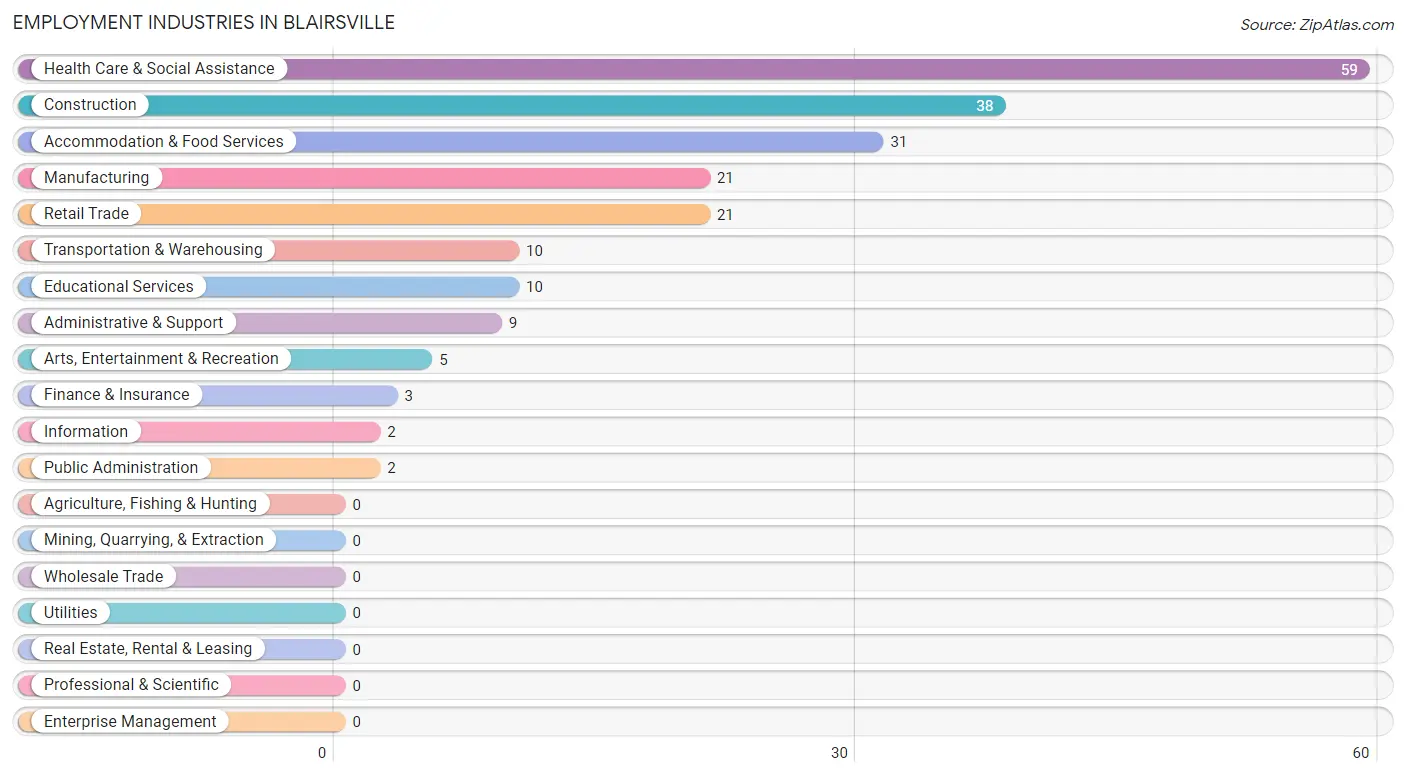
Employment Industries in Blairsville
The major employment industries in Blairsville include Health Care & Social Assistance (59 | 26.6%), Construction (38 | 17.1%), Accommodation & Food Services (31 | 14.0%), Manufacturing (21 | 9.5%), and Retail Trade (21 | 9.5%).
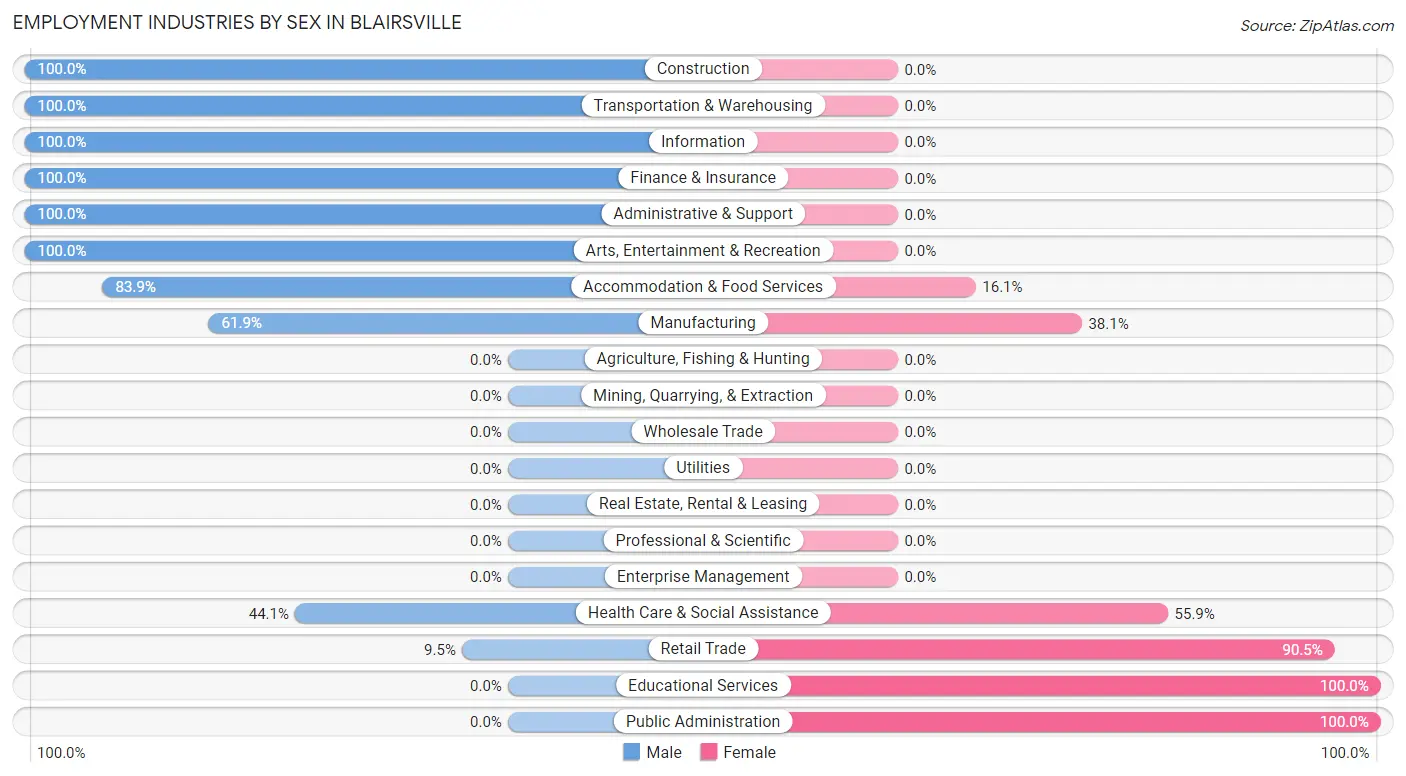
Employment Industries by Sex in Blairsville
The Blairsville industries that see more men than women are Construction (100.0%), Transportation & Warehousing (100.0%), and Information (100.0%), whereas the industries that tend to have a higher number of women are Educational Services (100.0%), Public Administration (100.0%), and Retail Trade (90.5%).
| Industry | Male | Female |
| Agriculture, Fishing & Hunting | 0 (0.0%) | 0 (0.0%) |
| Mining, Quarrying, & Extraction | 0 (0.0%) | 0 (0.0%) |
| Construction | 38 (100.0%) | 0 (0.0%) |
| Manufacturing | 13 (61.9%) | 8 (38.1%) |
| Wholesale Trade | 0 (0.0%) | 0 (0.0%) |
| Retail Trade | 2 (9.5%) | 19 (90.5%) |
| Transportation & Warehousing | 10 (100.0%) | 0 (0.0%) |
| Utilities | 0 (0.0%) | 0 (0.0%) |
| Information | 2 (100.0%) | 0 (0.0%) |
| Finance & Insurance | 3 (100.0%) | 0 (0.0%) |
| Real Estate, Rental & Leasing | 0 (0.0%) | 0 (0.0%) |
| Professional & Scientific | 0 (0.0%) | 0 (0.0%) |
| Enterprise Management | 0 (0.0%) | 0 (0.0%) |
| Administrative & Support | 9 (100.0%) | 0 (0.0%) |
| Educational Services | 0 (0.0%) | 10 (100.0%) |
| Health Care & Social Assistance | 26 (44.1%) | 33 (55.9%) |
| Arts, Entertainment & Recreation | 5 (100.0%) | 0 (0.0%) |
| Accommodation & Food Services | 26 (83.9%) | 5 (16.1%) |
| Public Administration | 0 (0.0%) | 2 (100.0%) |
| Total | 142 (64.0%) | 80 (36.0%) |
Education in Blairsville
School Enrollment in Blairsville
The most common levels of schooling among the 84 students in Blairsville are elementary school (33 | 39.3%), college / undergraduate (33 | 39.3%), and kindergarten (9 | 10.7%).
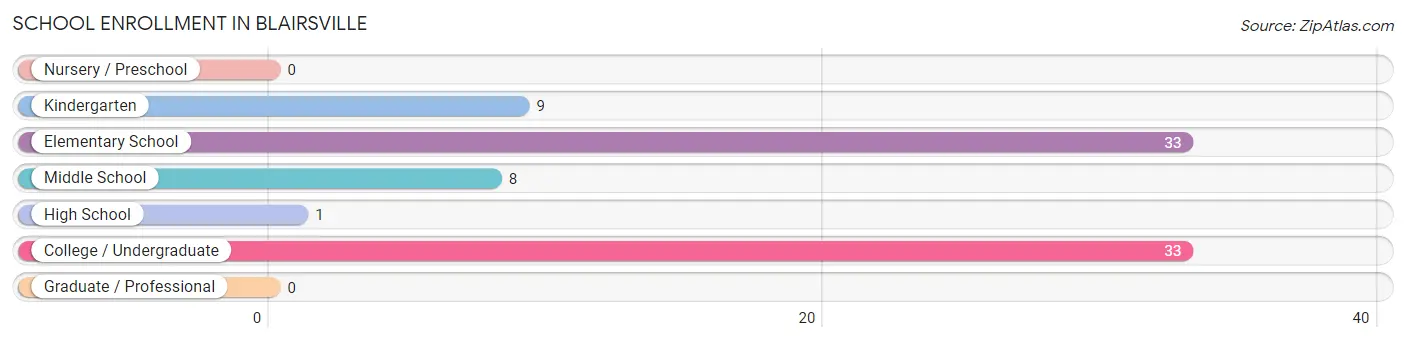
| School Level | # Students | % Students |
| Nursery / Preschool | 0 | 0.0% |
| Kindergarten | 9 | 10.7% |
| Elementary School | 33 | 39.3% |
| Middle School | 8 | 9.5% |
| High School | 1 | 1.2% |
| College / Undergraduate | 33 | 39.3% |
| Graduate / Professional | 0 | 0.0% |
| Total | 84 | 100.0% |
School Enrollment by Age by Funding Source in Blairsville
Out of a total of 84 students who are enrolled in schools in Blairsville, 35 (41.7%) attend a private institution, while the remaining 49 (58.3%) are enrolled in public schools. The age group of 35 years and over has the highest likelihood of being enrolled in private schools, with 6 (100.0% in the age bracket) enrolled. Conversely, the age group of 5 to 9 year old has the lowest likelihood of being enrolled in a private school, with 40 (95.2% in the age bracket) attending a public institution.
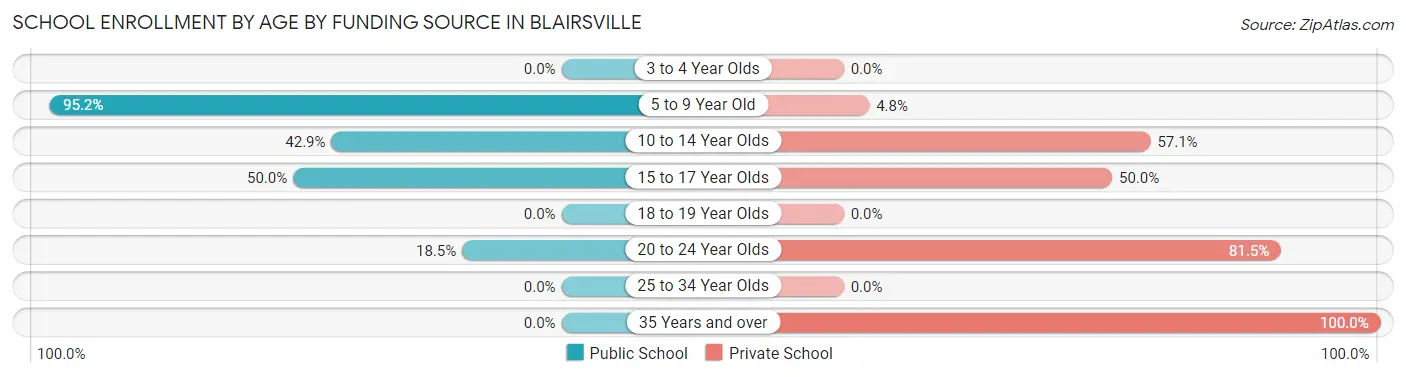
| Age Bracket | Public School | Private School |
| 3 to 4 Year Olds | 0 (0.0%) | 0 (0.0%) |
| 5 to 9 Year Old | 40 (95.2%) | 2 (4.8%) |
| 10 to 14 Year Olds | 3 (42.9%) | 4 (57.1%) |
| 15 to 17 Year Olds | 1 (50.0%) | 1 (50.0%) |
| 18 to 19 Year Olds | 0 (0.0%) | 0 (0.0%) |
| 20 to 24 Year Olds | 5 (18.5%) | 22 (81.5%) |
| 25 to 34 Year Olds | 0 (0.0%) | 0 (0.0%) |
| 35 Years and over | 0 (0.0%) | 6 (100.0%) |
| Total | 49 (58.3%) | 35 (41.7%) |
Educational Attainment by Field of Study in Blairsville
Business (13 | 81.2%), and social sciences (3 | 18.8%) are the most common fields of study among 16 individuals in Blairsville who have obtained a bachelor's degree or higher.
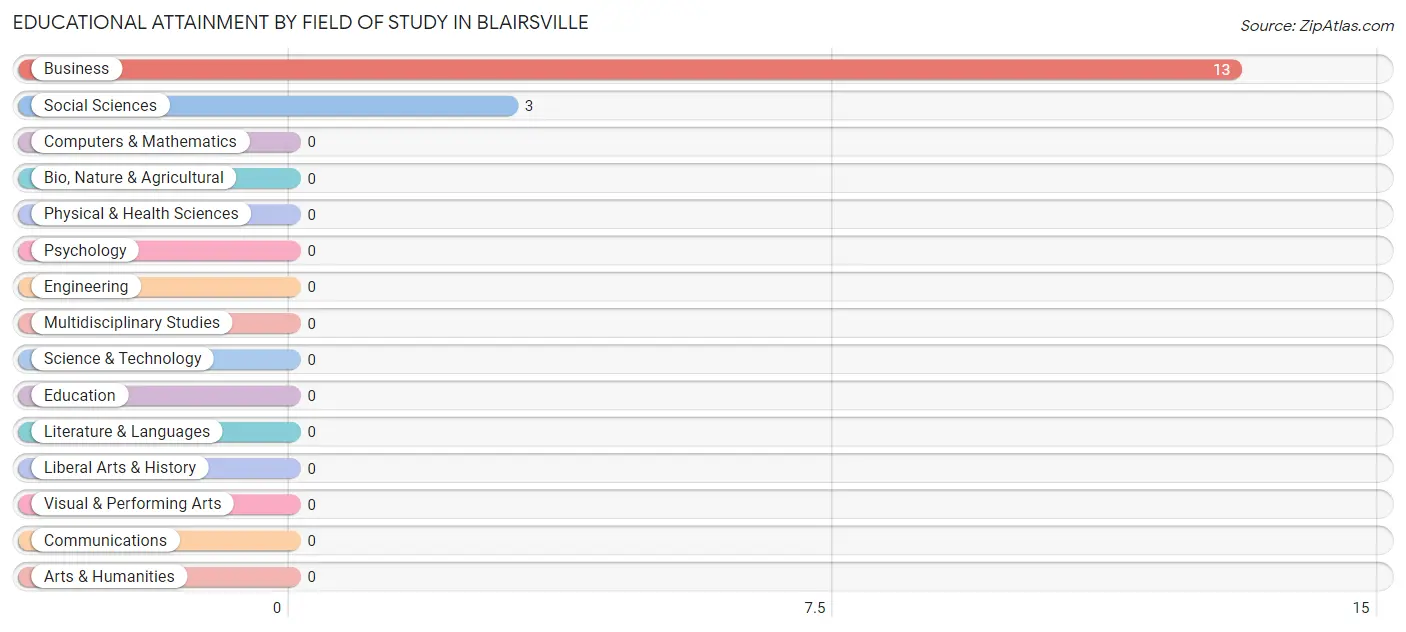
| Field of Study | # Graduates | % Graduates |
| Computers & Mathematics | 0 | 0.0% |
| Bio, Nature & Agricultural | 0 | 0.0% |
| Physical & Health Sciences | 0 | 0.0% |
| Psychology | 0 | 0.0% |
| Social Sciences | 3 | 18.8% |
| Engineering | 0 | 0.0% |
| Multidisciplinary Studies | 0 | 0.0% |
| Science & Technology | 0 | 0.0% |
| Business | 13 | 81.2% |
| Education | 0 | 0.0% |
| Literature & Languages | 0 | 0.0% |
| Liberal Arts & History | 0 | 0.0% |
| Visual & Performing Arts | 0 | 0.0% |
| Communications | 0 | 0.0% |
| Arts & Humanities | 0 | 0.0% |
| Total | 16 | 100.0% |
Transportation & Commute in Blairsville
Vehicle Availability by Sex in Blairsville
The most prevalent vehicle ownership categories in Blairsville are males with 1 vehicle (71, accounting for 51.8%) and females with 1 vehicle (23, making up 88.7%).
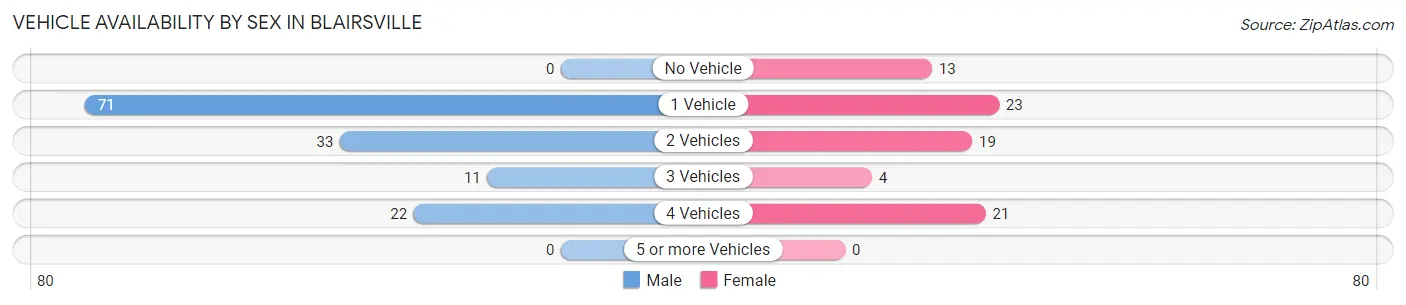
| Vehicles Available | Male | Female |
| No Vehicle | 0 (0.0%) | 13 (16.3%) |
| 1 Vehicle | 71 (51.8%) | 23 (28.7%) |
| 2 Vehicles | 33 (24.1%) | 19 (23.7%) |
| 3 Vehicles | 11 (8.0%) | 4 (5.0%) |
| 4 Vehicles | 22 (16.1%) | 21 (26.3%) |
| 5 or more Vehicles | 0 (0.0%) | 0 (0.0%) |
| Total | 137 (100.0%) | 80 (100.0%) |
Commute Time in Blairsville
The most frequently occuring commute durations in Blairsville are 5 to 9 minutes (70 commuters, 32.6%), 10 to 14 minutes (62 commuters, 28.8%), and less than 5 minutes (34 commuters, 15.8%).
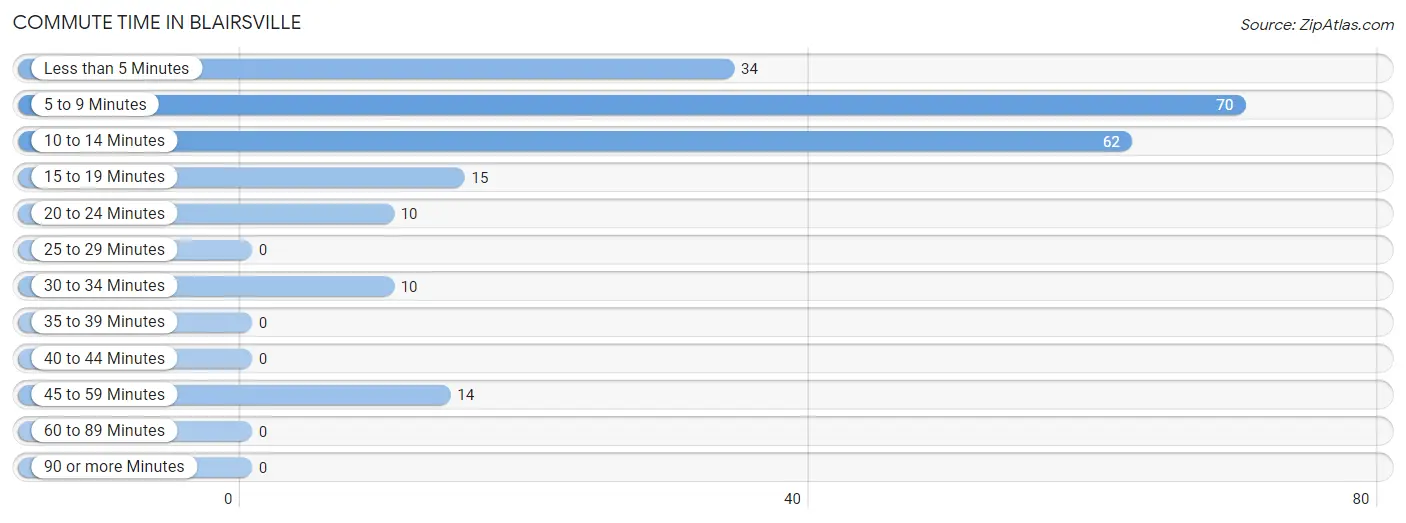
| Commute Time | # Commuters | % Commuters |
| Less than 5 Minutes | 34 | 15.8% |
| 5 to 9 Minutes | 70 | 32.6% |
| 10 to 14 Minutes | 62 | 28.8% |
| 15 to 19 Minutes | 15 | 7.0% |
| 20 to 24 Minutes | 10 | 4.6% |
| 25 to 29 Minutes | 0 | 0.0% |
| 30 to 34 Minutes | 10 | 4.6% |
| 35 to 39 Minutes | 0 | 0.0% |
| 40 to 44 Minutes | 0 | 0.0% |
| 45 to 59 Minutes | 14 | 6.5% |
| 60 to 89 Minutes | 0 | 0.0% |
| 90 or more Minutes | 0 | 0.0% |
Commute Time by Sex in Blairsville
The most common commute times in Blairsville are 10 to 14 minutes (47 commuters, 34.8%) for males and 5 to 9 minutes (45 commuters, 56.2%) for females.
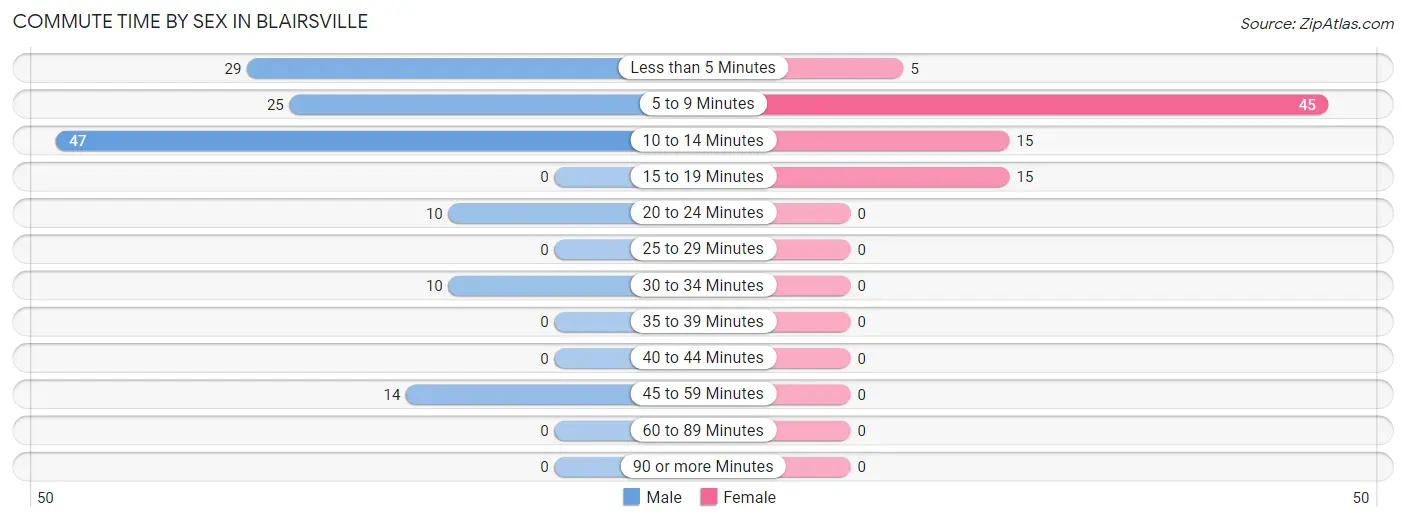
| Commute Time | Male | Female |
| Less than 5 Minutes | 29 (21.5%) | 5 (6.2%) |
| 5 to 9 Minutes | 25 (18.5%) | 45 (56.2%) |
| 10 to 14 Minutes | 47 (34.8%) | 15 (18.8%) |
| 15 to 19 Minutes | 0 (0.0%) | 15 (18.8%) |
| 20 to 24 Minutes | 10 (7.4%) | 0 (0.0%) |
| 25 to 29 Minutes | 0 (0.0%) | 0 (0.0%) |
| 30 to 34 Minutes | 10 (7.4%) | 0 (0.0%) |
| 35 to 39 Minutes | 0 (0.0%) | 0 (0.0%) |
| 40 to 44 Minutes | 0 (0.0%) | 0 (0.0%) |
| 45 to 59 Minutes | 14 (10.4%) | 0 (0.0%) |
| 60 to 89 Minutes | 0 (0.0%) | 0 (0.0%) |
| 90 or more Minutes | 0 (0.0%) | 0 (0.0%) |
Time of Departure to Work by Sex in Blairsville
The most frequent times of departure to work in Blairsville are 4:00 PM to 11:59 PM (41, 30.4%) for males and 8:00 AM to 8:29 AM (41, 51.2%) for females.
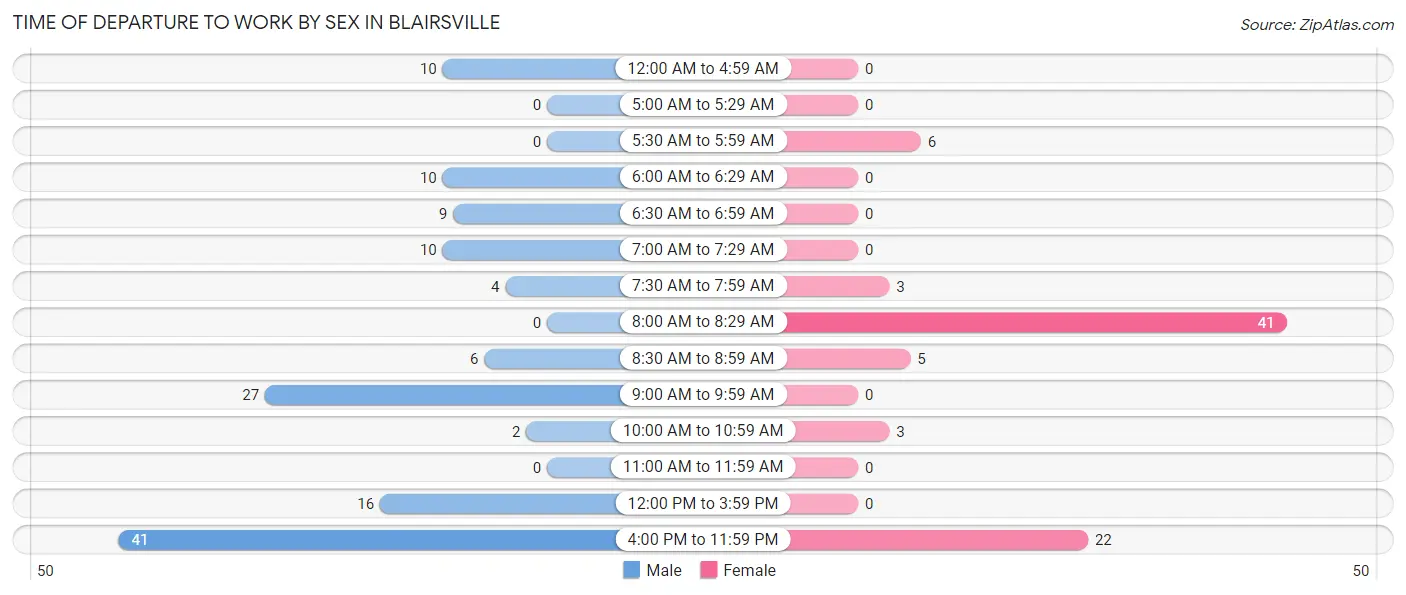
| Time of Departure | Male | Female |
| 12:00 AM to 4:59 AM | 10 (7.4%) | 0 (0.0%) |
| 5:00 AM to 5:29 AM | 0 (0.0%) | 0 (0.0%) |
| 5:30 AM to 5:59 AM | 0 (0.0%) | 6 (7.5%) |
| 6:00 AM to 6:29 AM | 10 (7.4%) | 0 (0.0%) |
| 6:30 AM to 6:59 AM | 9 (6.7%) | 0 (0.0%) |
| 7:00 AM to 7:29 AM | 10 (7.4%) | 0 (0.0%) |
| 7:30 AM to 7:59 AM | 4 (3.0%) | 3 (3.7%) |
| 8:00 AM to 8:29 AM | 0 (0.0%) | 41 (51.2%) |
| 8:30 AM to 8:59 AM | 6 (4.4%) | 5 (6.2%) |
| 9:00 AM to 9:59 AM | 27 (20.0%) | 0 (0.0%) |
| 10:00 AM to 10:59 AM | 2 (1.5%) | 3 (3.7%) |
| 11:00 AM to 11:59 AM | 0 (0.0%) | 0 (0.0%) |
| 12:00 PM to 3:59 PM | 16 (11.8%) | 0 (0.0%) |
| 4:00 PM to 11:59 PM | 41 (30.4%) | 22 (27.5%) |
| Total | 135 (100.0%) | 80 (100.0%) |
Housing Occupancy in Blairsville
Occupancy by Ownership in Blairsville
Of the total 211 dwellings in Blairsville, owner-occupied units account for 51 (24.2%), while renter-occupied units make up 160 (75.8%).
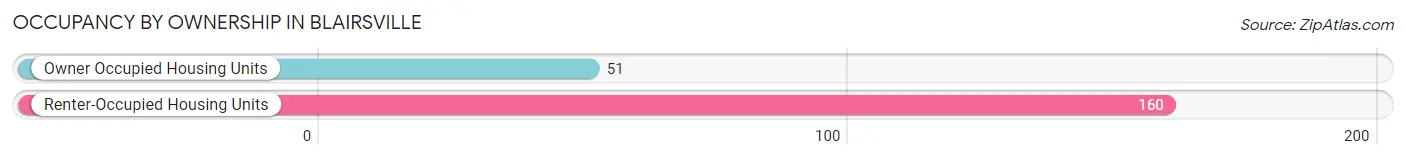
| Occupancy | # Housing Units | % Housing Units |
| Owner Occupied Housing Units | 51 | 24.2% |
| Renter-Occupied Housing Units | 160 | 75.8% |
| Total Occupied Housing Units | 211 | 100.0% |
Occupancy by Household Size in Blairsville
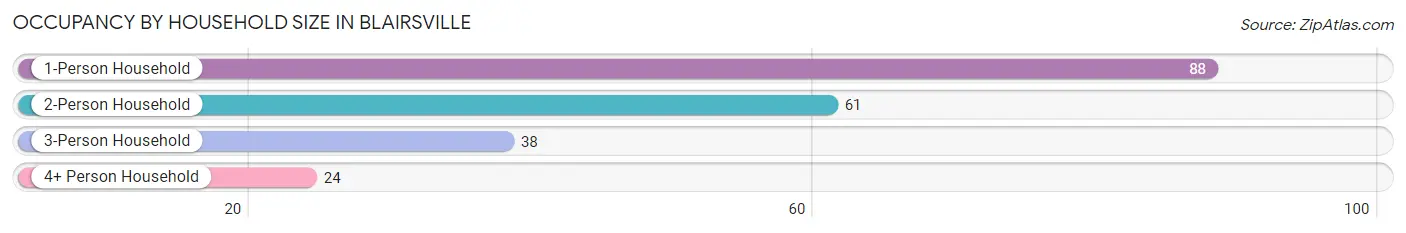
| Household Size | # Housing Units | % Housing Units |
| 1-Person Household | 88 | 41.7% |
| 2-Person Household | 61 | 28.9% |
| 3-Person Household | 38 | 18.0% |
| 4+ Person Household | 24 | 11.4% |
| Total Housing Units | 211 | 100.0% |
Occupancy by Ownership by Household Size in Blairsville
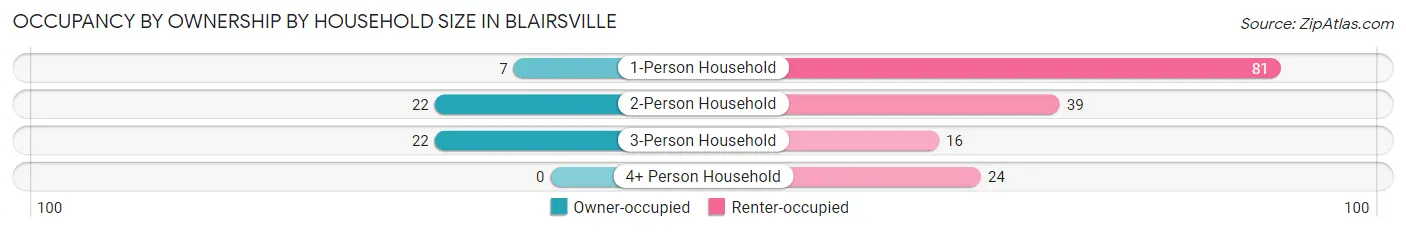
| Household Size | Owner-occupied | Renter-occupied |
| 1-Person Household | 7 (8.0%) | 81 (92.0%) |
| 2-Person Household | 22 (36.1%) | 39 (63.9%) |
| 3-Person Household | 22 (57.9%) | 16 (42.1%) |
| 4+ Person Household | 0 (0.0%) | 24 (100.0%) |
| Total Housing Units | 51 (24.2%) | 160 (75.8%) |
Occupancy by Educational Attainment in Blairsville
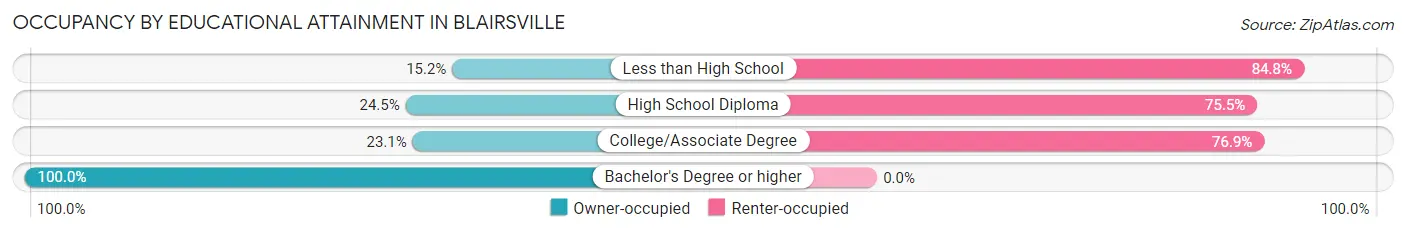
| Household Size | Owner-occupied | Renter-occupied |
| Less than High School | 7 (15.2%) | 39 (84.8%) |
| High School Diploma | 23 (24.5%) | 71 (75.5%) |
| College/Associate Degree | 15 (23.1%) | 50 (76.9%) |
| Bachelor's Degree or higher | 6 (100.0%) | 0 (0.0%) |
Occupancy by Age of Householder in Blairsville
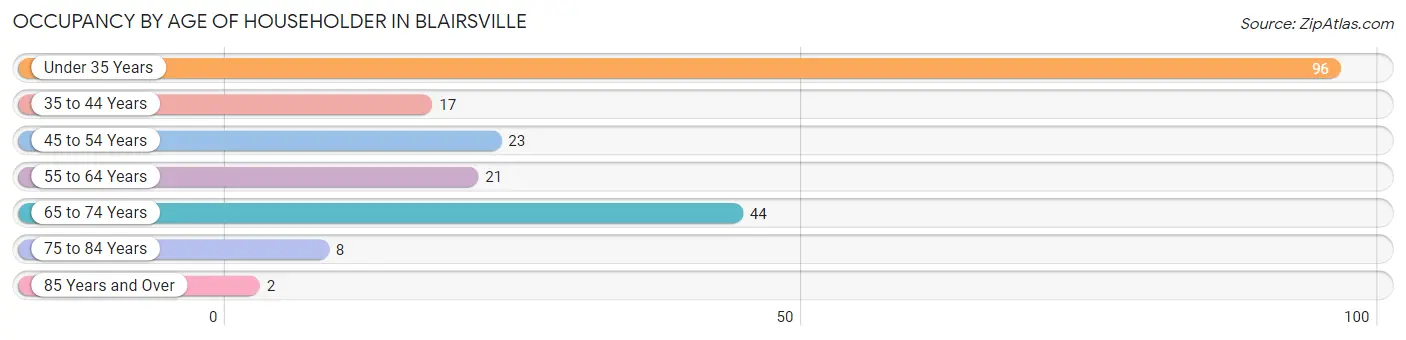
| Age Bracket | # Households | % Households |
| Under 35 Years | 96 | 45.5% |
| 35 to 44 Years | 17 | 8.1% |
| 45 to 54 Years | 23 | 10.9% |
| 55 to 64 Years | 21 | 10.0% |
| 65 to 74 Years | 44 | 20.8% |
| 75 to 84 Years | 8 | 3.8% |
| 85 Years and Over | 2 | 0.9% |
| Total | 211 | 100.0% |
Housing Finances in Blairsville
Median Income by Occupancy in Blairsville
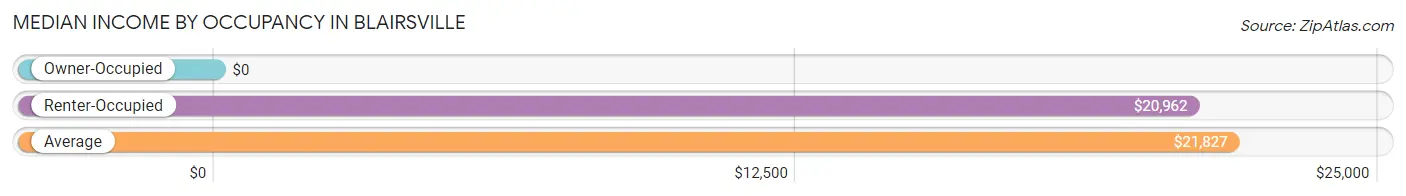
| Occupancy Type | # Households | Median Income |
| Owner-Occupied | 51 (24.2%) | $0 |
| Renter-Occupied | 160 (75.8%) | $20,962 |
| Average | 211 (100.0%) | $21,827 |
Occupancy by Householder Income Bracket in Blairsville
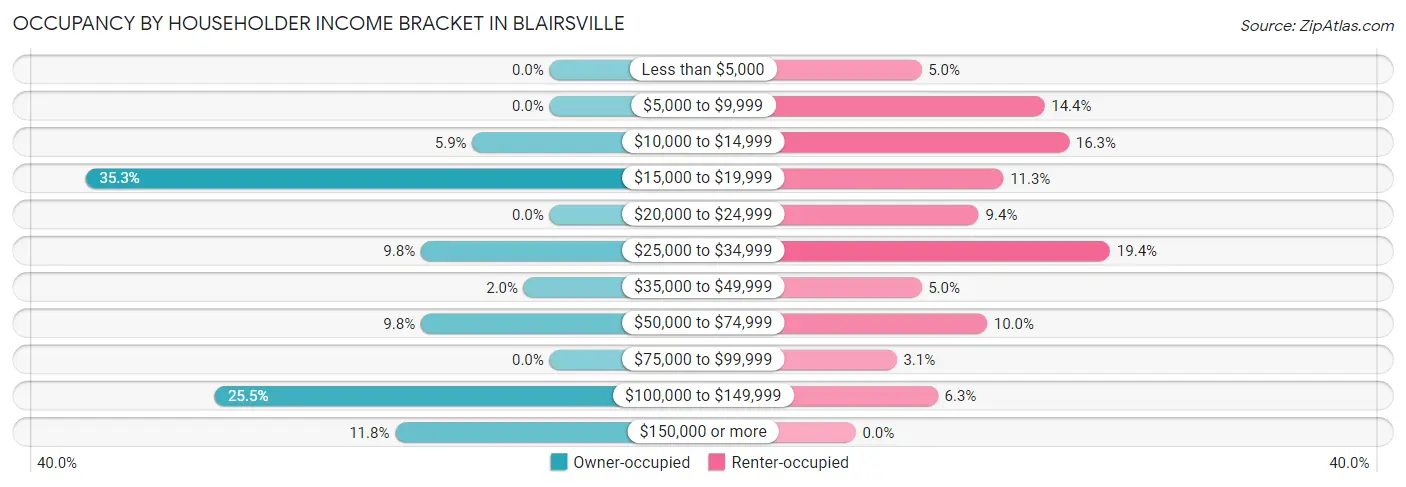
| Income Bracket | Owner-occupied | Renter-occupied |
| Less than $5,000 | 0 (0.0%) | 8 (5.0%) |
| $5,000 to $9,999 | 0 (0.0%) | 23 (14.4%) |
| $10,000 to $14,999 | 3 (5.9%) | 26 (16.3%) |
| $15,000 to $19,999 | 18 (35.3%) | 18 (11.3%) |
| $20,000 to $24,999 | 0 (0.0%) | 15 (9.4%) |
| $25,000 to $34,999 | 5 (9.8%) | 31 (19.4%) |
| $35,000 to $49,999 | 1 (2.0%) | 8 (5.0%) |
| $50,000 to $74,999 | 5 (9.8%) | 16 (10.0%) |
| $75,000 to $99,999 | 0 (0.0%) | 5 (3.1%) |
| $100,000 to $149,999 | 13 (25.5%) | 10 (6.2%) |
| $150,000 or more | 6 (11.8%) | 0 (0.0%) |
| Total | 51 (100.0%) | 160 (100.0%) |
Monthly Housing Cost Tiers in Blairsville
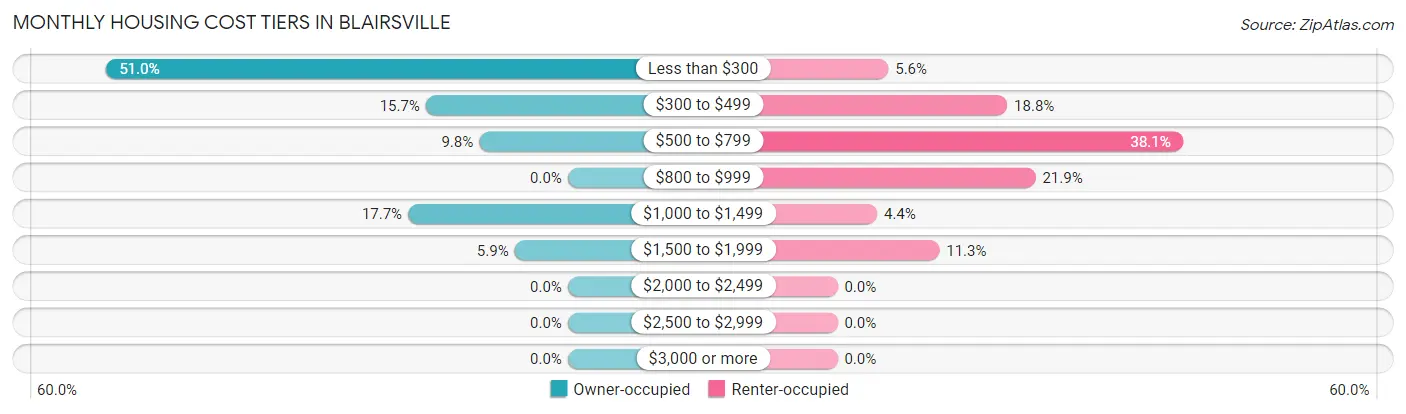
| Monthly Cost | Owner-occupied | Renter-occupied |
| Less than $300 | 26 (51.0%) | 9 (5.6%) |
| $300 to $499 | 8 (15.7%) | 30 (18.8%) |
| $500 to $799 | 5 (9.8%) | 61 (38.1%) |
| $800 to $999 | 0 (0.0%) | 35 (21.9%) |
| $1,000 to $1,499 | 9 (17.6%) | 7 (4.4%) |
| $1,500 to $1,999 | 3 (5.9%) | 18 (11.3%) |
| $2,000 to $2,499 | 0 (0.0%) | 0 (0.0%) |
| $2,500 to $2,999 | 0 (0.0%) | 0 (0.0%) |
| $3,000 or more | 0 (0.0%) | 0 (0.0%) |
| Total | 51 (100.0%) | 160 (100.0%) |
Physical Housing Characteristics in Blairsville
Housing Structures in Blairsville
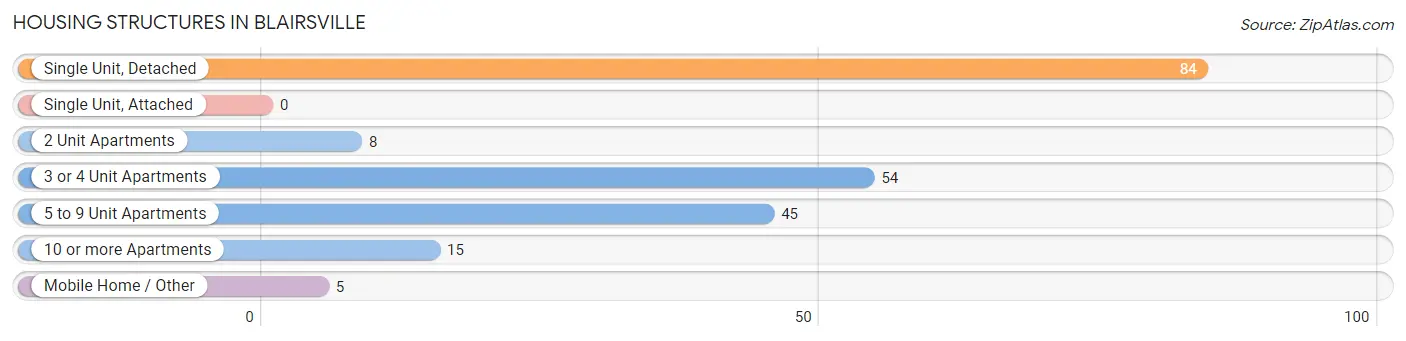
| Structure Type | # Housing Units | % Housing Units |
| Single Unit, Detached | 84 | 39.8% |
| Single Unit, Attached | 0 | 0.0% |
| 2 Unit Apartments | 8 | 3.8% |
| 3 or 4 Unit Apartments | 54 | 25.6% |
| 5 to 9 Unit Apartments | 45 | 21.3% |
| 10 or more Apartments | 15 | 7.1% |
| Mobile Home / Other | 5 | 2.4% |
| Total | 211 | 100.0% |
Housing Structures by Occupancy in Blairsville
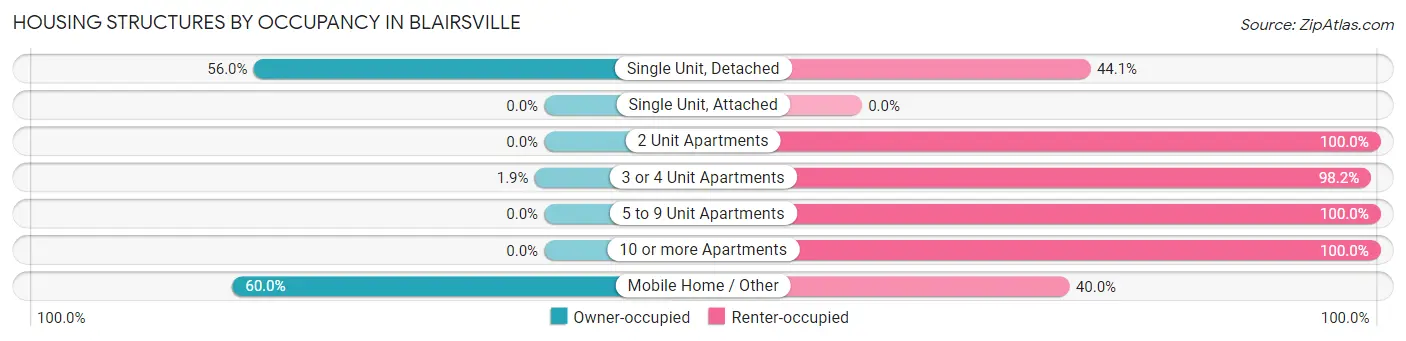
| Structure Type | Owner-occupied | Renter-occupied |
| Single Unit, Detached | 47 (55.9%) | 37 (44.1%) |
| Single Unit, Attached | 0 (0.0%) | 0 (0.0%) |
| 2 Unit Apartments | 0 (0.0%) | 8 (100.0%) |
| 3 or 4 Unit Apartments | 1 (1.8%) | 53 (98.2%) |
| 5 to 9 Unit Apartments | 0 (0.0%) | 45 (100.0%) |
| 10 or more Apartments | 0 (0.0%) | 15 (100.0%) |
| Mobile Home / Other | 3 (60.0%) | 2 (40.0%) |
| Total | 51 (24.2%) | 160 (75.8%) |
Housing Structures by Number of Rooms in Blairsville
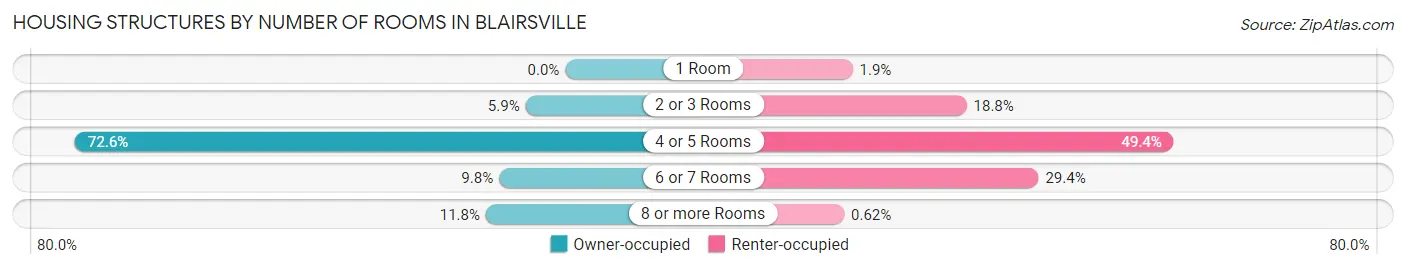
| Number of Rooms | Owner-occupied | Renter-occupied |
| 1 Room | 0 (0.0%) | 3 (1.9%) |
| 2 or 3 Rooms | 3 (5.9%) | 30 (18.8%) |
| 4 or 5 Rooms | 37 (72.6%) | 79 (49.4%) |
| 6 or 7 Rooms | 5 (9.8%) | 47 (29.4%) |
| 8 or more Rooms | 6 (11.8%) | 1 (0.6%) |
| Total | 51 (100.0%) | 160 (100.0%) |
Housing Structure by Heating Type in Blairsville
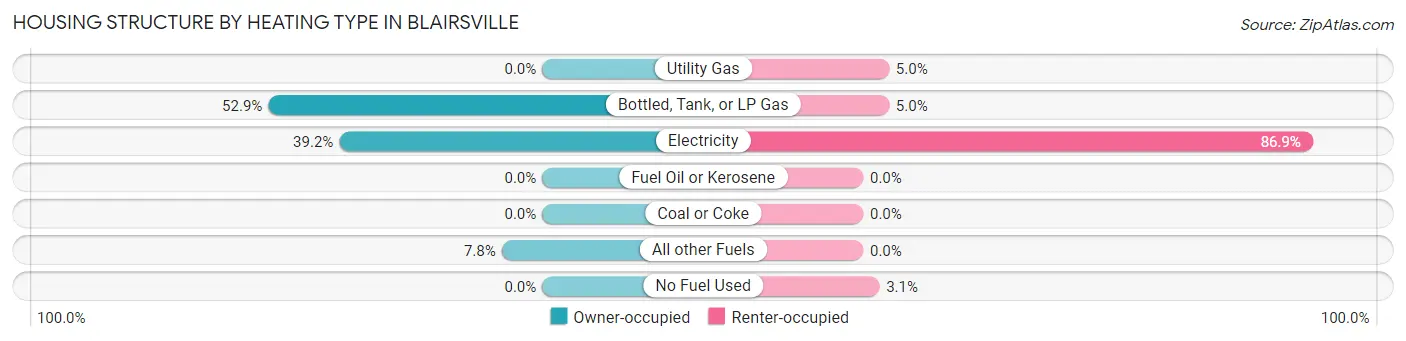
| Heating Type | Owner-occupied | Renter-occupied |
| Utility Gas | 0 (0.0%) | 8 (5.0%) |
| Bottled, Tank, or LP Gas | 27 (52.9%) | 8 (5.0%) |
| Electricity | 20 (39.2%) | 139 (86.9%) |
| Fuel Oil or Kerosene | 0 (0.0%) | 0 (0.0%) |
| Coal or Coke | 0 (0.0%) | 0 (0.0%) |
| All other Fuels | 4 (7.8%) | 0 (0.0%) |
| No Fuel Used | 0 (0.0%) | 5 (3.1%) |
| Total | 51 (100.0%) | 160 (100.0%) |
Household Vehicle Usage in Blairsville
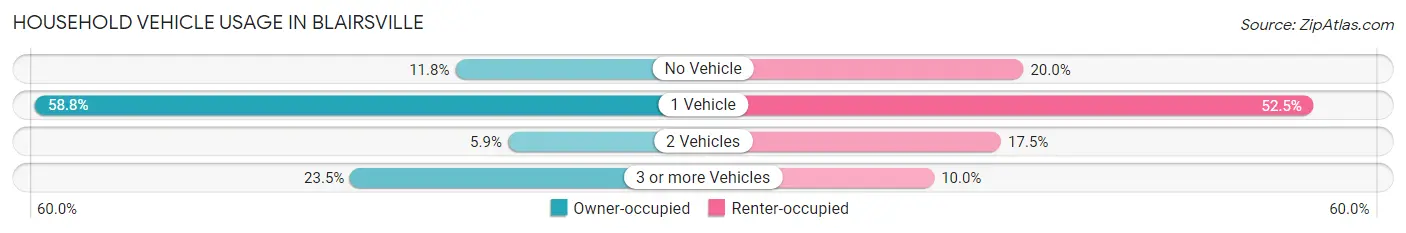
| Vehicles per Household | Owner-occupied | Renter-occupied |
| No Vehicle | 6 (11.8%) | 32 (20.0%) |
| 1 Vehicle | 30 (58.8%) | 84 (52.5%) |
| 2 Vehicles | 3 (5.9%) | 28 (17.5%) |
| 3 or more Vehicles | 12 (23.5%) | 16 (10.0%) |
| Total | 51 (100.0%) | 160 (100.0%) |
Real Estate & Mortgages in Blairsville
Real Estate and Mortgage Overview in Blairsville
| Characteristic | Without Mortgage | With Mortgage |
| Housing Units | 39 | 12 |
| Median Property Value | $157,200 | $0 |
| Median Household Income | - | - |
| Monthly Housing Costs | $285 | $0 |
| Real Estate Taxes | $517 | $0 |
Property Value by Mortgage Status in Blairsville
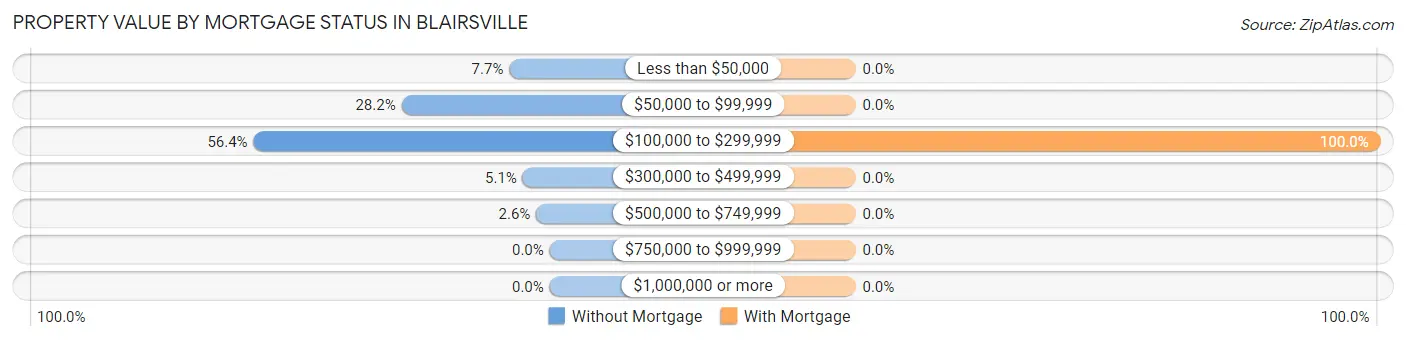
| Property Value | Without Mortgage | With Mortgage |
| Less than $50,000 | 3 (7.7%) | 0 (0.0%) |
| $50,000 to $99,999 | 11 (28.2%) | 0 (0.0%) |
| $100,000 to $299,999 | 22 (56.4%) | 12 (100.0%) |
| $300,000 to $499,999 | 2 (5.1%) | 0 (0.0%) |
| $500,000 to $749,999 | 1 (2.6%) | 0 (0.0%) |
| $750,000 to $999,999 | 0 (0.0%) | 0 (0.0%) |
| $1,000,000 or more | 0 (0.0%) | 0 (0.0%) |
| Total | 39 (100.0%) | 12 (100.0%) |
Household Income by Mortgage Status in Blairsville
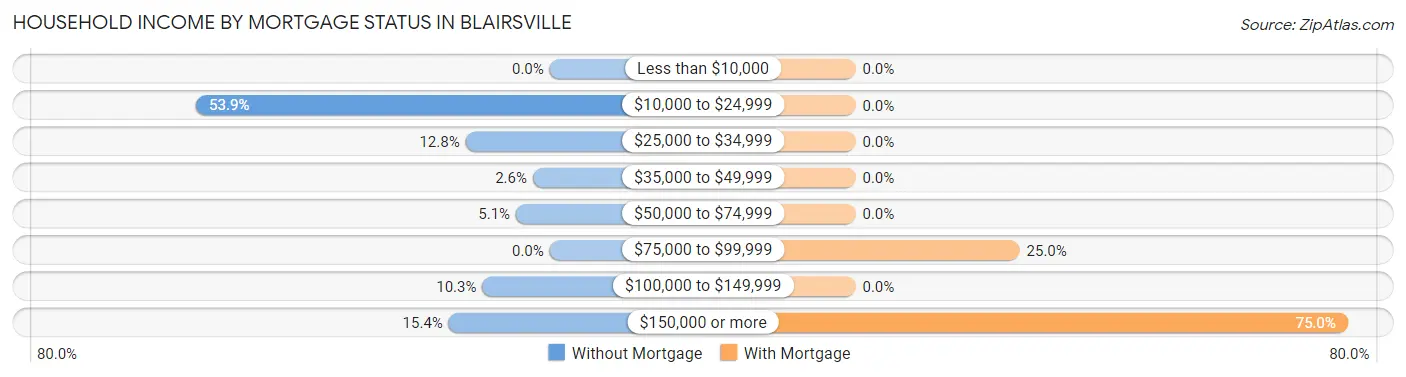
| Household Income | Without Mortgage | With Mortgage |
| Less than $10,000 | 0 (0.0%) | 0 (0.0%) |
| $10,000 to $24,999 | 21 (53.8%) | 0 (0.0%) |
| $25,000 to $34,999 | 5 (12.8%) | 0 (0.0%) |
| $35,000 to $49,999 | 1 (2.6%) | 0 (0.0%) |
| $50,000 to $74,999 | 2 (5.1%) | 0 (0.0%) |
| $75,000 to $99,999 | 0 (0.0%) | 3 (25.0%) |
| $100,000 to $149,999 | 4 (10.3%) | 0 (0.0%) |
| $150,000 or more | 6 (15.4%) | 9 (75.0%) |
| Total | 39 (100.0%) | 12 (100.0%) |
Property Value to Household Income Ratio in Blairsville
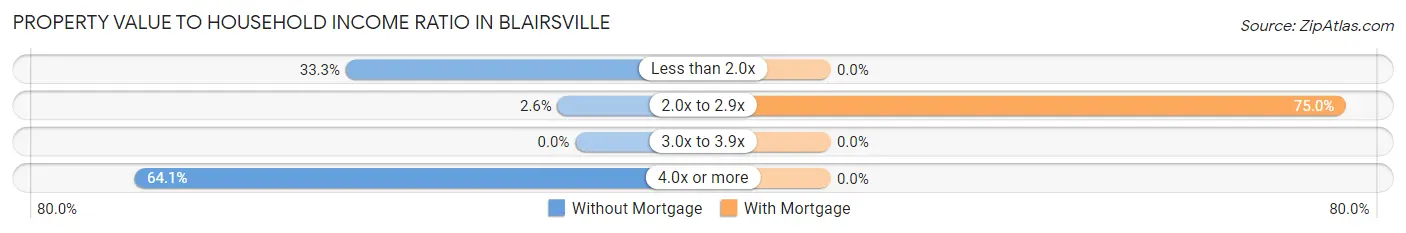
| Value-to-Income Ratio | Without Mortgage | With Mortgage |
| Less than 2.0x | 13 (33.3%) | 0 (0.0%) |
| 2.0x to 2.9x | 1 (2.6%) | 9 (75.0%) |
| 3.0x to 3.9x | 0 (0.0%) | 0 (0.0%) |
| 4.0x or more | 25 (64.1%) | 0 (0.0%) |
| Total | 39 (100.0%) | 12 (100.0%) |
Real Estate Taxes by Mortgage Status in Blairsville
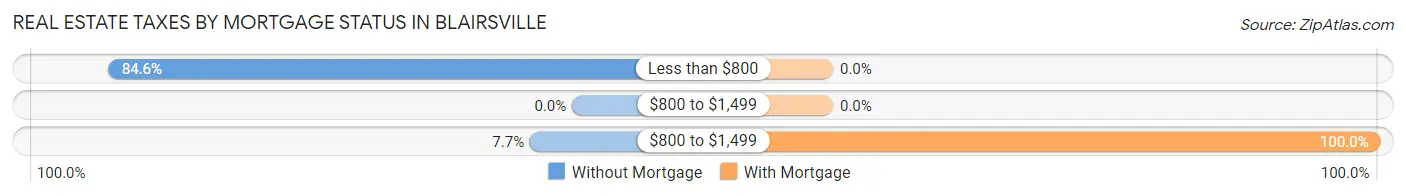
| Property Taxes | Without Mortgage | With Mortgage |
| Less than $800 | 33 (84.6%) | 0 (0.0%) |
| $800 to $1,499 | 0 (0.0%) | 0 (0.0%) |
| $800 to $1,499 | 3 (7.7%) | 12 (100.0%) |
| Total | 39 (100.0%) | 12 (100.0%) |
Health & Disability in Blairsville
Health Insurance Coverage by Age in Blairsville
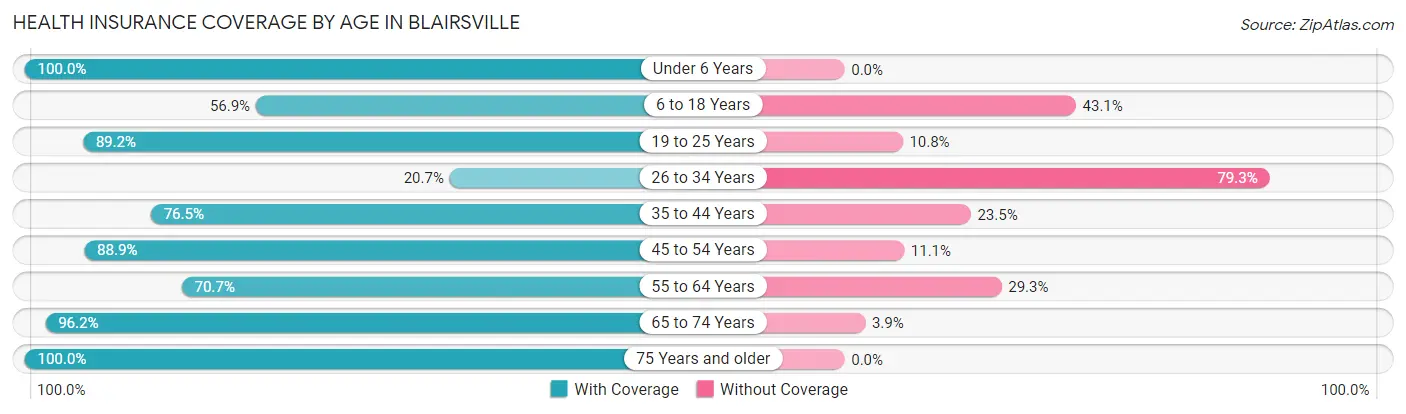
| Age Bracket | With Coverage | Without Coverage |
| Under 6 Years | 55 (100.0%) | 0 (0.0%) |
| 6 to 18 Years | 29 (56.9%) | 22 (43.1%) |
| 19 to 25 Years | 74 (89.2%) | 9 (10.8%) |
| 26 to 34 Years | 23 (20.7%) | 88 (79.3%) |
| 35 to 44 Years | 26 (76.5%) | 8 (23.5%) |
| 45 to 54 Years | 32 (88.9%) | 4 (11.1%) |
| 55 to 64 Years | 29 (70.7%) | 12 (29.3%) |
| 65 to 74 Years | 50 (96.2%) | 2 (3.8%) |
| 75 Years and older | 12 (100.0%) | 0 (0.0%) |
| Total | 330 (69.5%) | 145 (30.5%) |
Health Insurance Coverage by Citizenship Status in Blairsville
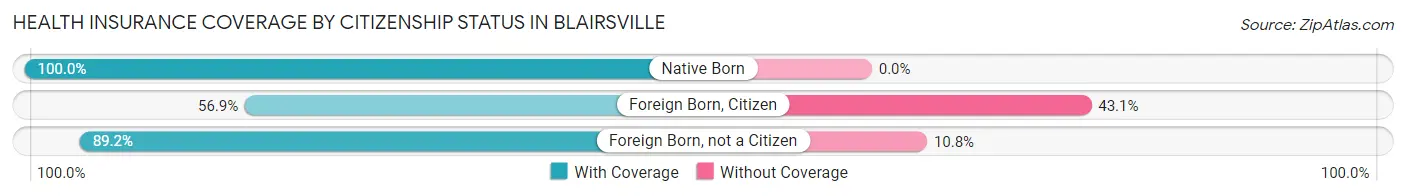
| Citizenship Status | With Coverage | Without Coverage |
| Native Born | 55 (100.0%) | 0 (0.0%) |
| Foreign Born, Citizen | 29 (56.9%) | 22 (43.1%) |
| Foreign Born, not a Citizen | 74 (89.2%) | 9 (10.8%) |
Health Insurance Coverage by Household Income in Blairsville
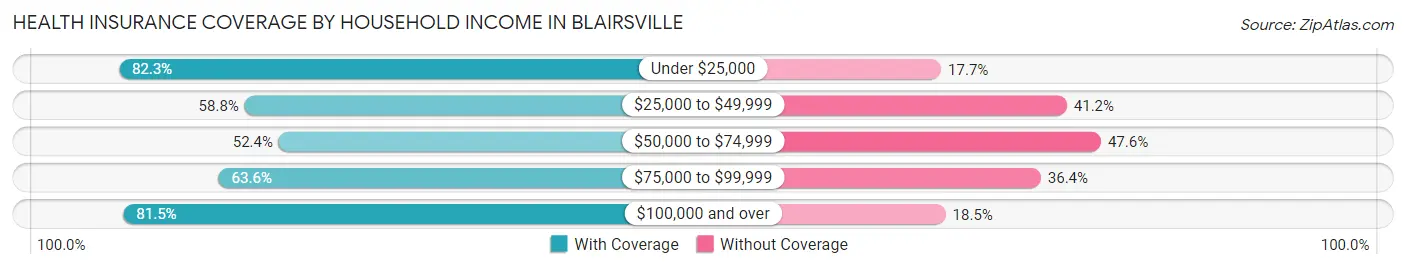
| Household Income | With Coverage | Without Coverage |
| Under $25,000 | 135 (82.3%) | 29 (17.7%) |
| $25,000 to $49,999 | 67 (58.8%) | 47 (41.2%) |
| $50,000 to $74,999 | 55 (52.4%) | 50 (47.6%) |
| $75,000 to $99,999 | 7 (63.6%) | 4 (36.4%) |
| $100,000 and over | 66 (81.5%) | 15 (18.5%) |
Public vs Private Health Insurance Coverage by Age in Blairsville
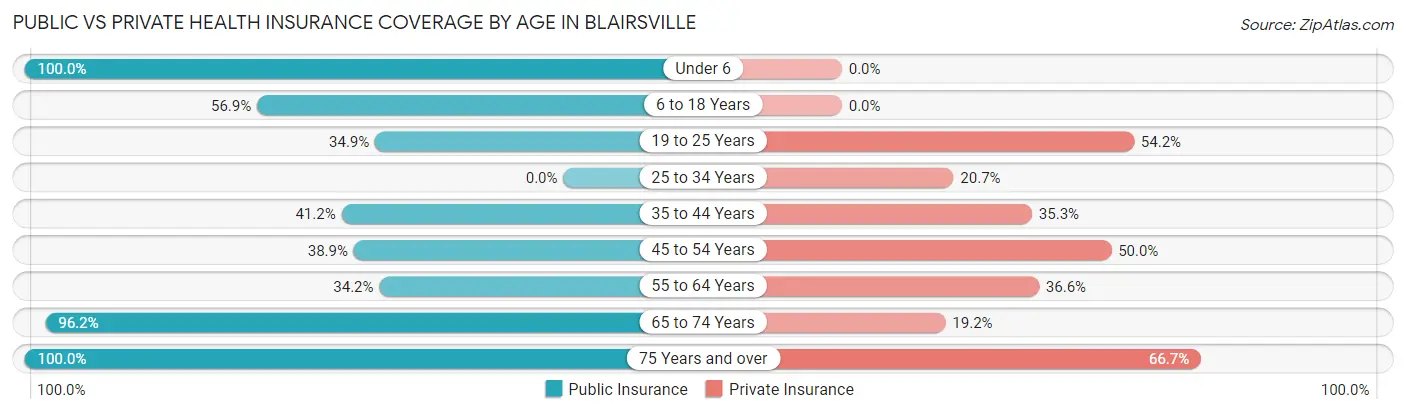
| Age Bracket | Public Insurance | Private Insurance |
| Under 6 | 55 (100.0%) | 0 (0.0%) |
| 6 to 18 Years | 29 (56.9%) | 0 (0.0%) |
| 19 to 25 Years | 29 (34.9%) | 45 (54.2%) |
| 25 to 34 Years | 0 (0.0%) | 23 (20.7%) |
| 35 to 44 Years | 14 (41.2%) | 12 (35.3%) |
| 45 to 54 Years | 14 (38.9%) | 18 (50.0%) |
| 55 to 64 Years | 14 (34.2%) | 15 (36.6%) |
| 65 to 74 Years | 50 (96.2%) | 10 (19.2%) |
| 75 Years and over | 12 (100.0%) | 8 (66.7%) |
| Total | 217 (45.7%) | 131 (27.6%) |
Disability Status by Sex by Age in Blairsville
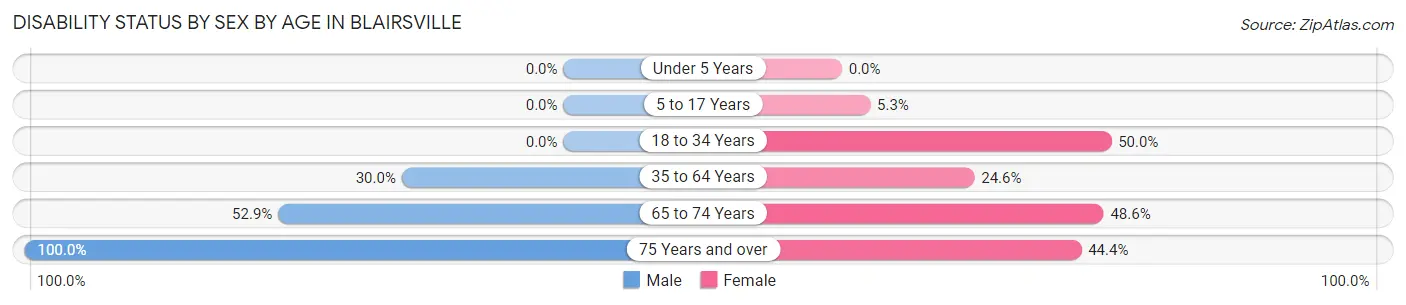
| Age Bracket | Male | Female |
| Under 5 Years | 0 (0.0%) | 0 (0.0%) |
| 5 to 17 Years | 0 (0.0%) | 1 (5.3%) |
| 18 to 34 Years | 0 (0.0%) | 43 (50.0%) |
| 35 to 64 Years | 15 (30.0%) | 15 (24.6%) |
| 65 to 74 Years | 9 (52.9%) | 17 (48.6%) |
| 75 Years and over | 3 (100.0%) | 4 (44.4%) |
Disability Class by Sex by Age in Blairsville
Disability Class: Hearing Difficulty
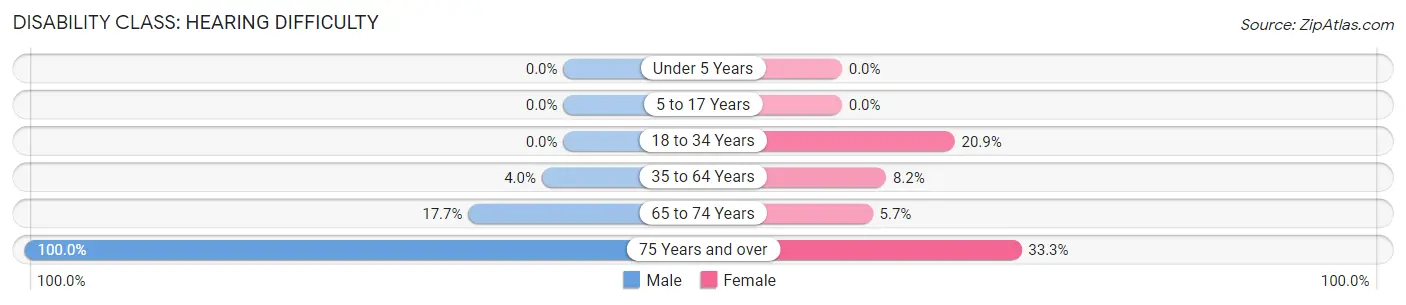
| Age Bracket | Male | Female |
| Under 5 Years | 0 (0.0%) | 0 (0.0%) |
| 5 to 17 Years | 0 (0.0%) | 0 (0.0%) |
| 18 to 34 Years | 0 (0.0%) | 18 (20.9%) |
| 35 to 64 Years | 2 (4.0%) | 5 (8.2%) |
| 65 to 74 Years | 3 (17.6%) | 2 (5.7%) |
| 75 Years and over | 3 (100.0%) | 3 (33.3%) |
Disability Class: Vision Difficulty
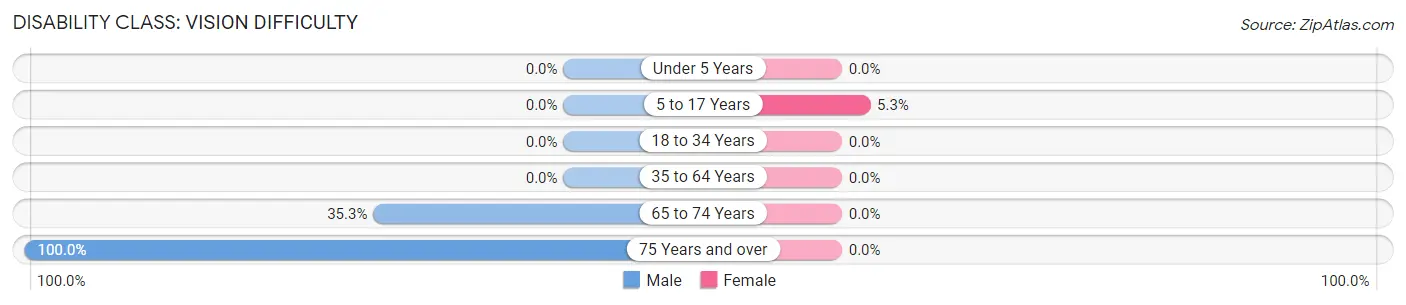
| Age Bracket | Male | Female |
| Under 5 Years | 0 (0.0%) | 0 (0.0%) |
| 5 to 17 Years | 0 (0.0%) | 1 (5.3%) |
| 18 to 34 Years | 0 (0.0%) | 0 (0.0%) |
| 35 to 64 Years | 0 (0.0%) | 0 (0.0%) |
| 65 to 74 Years | 6 (35.3%) | 0 (0.0%) |
| 75 Years and over | 3 (100.0%) | 0 (0.0%) |
Disability Class: Cognitive Difficulty
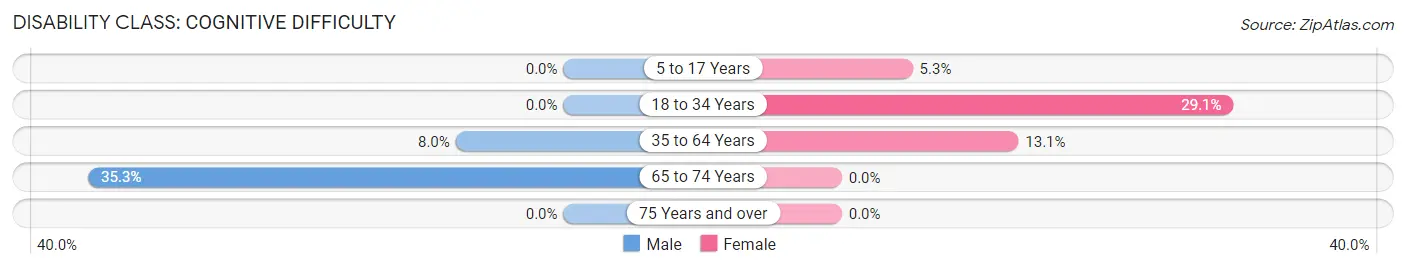
| Age Bracket | Male | Female |
| 5 to 17 Years | 0 (0.0%) | 1 (5.3%) |
| 18 to 34 Years | 0 (0.0%) | 25 (29.1%) |
| 35 to 64 Years | 4 (8.0%) | 8 (13.1%) |
| 65 to 74 Years | 6 (35.3%) | 0 (0.0%) |
| 75 Years and over | 0 (0.0%) | 0 (0.0%) |
Disability Class: Ambulatory Difficulty
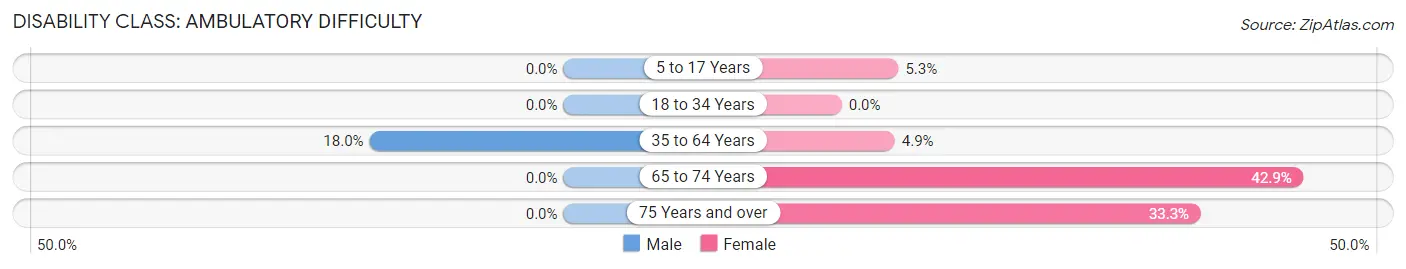
| Age Bracket | Male | Female |
| 5 to 17 Years | 0 (0.0%) | 1 (5.3%) |
| 18 to 34 Years | 0 (0.0%) | 0 (0.0%) |
| 35 to 64 Years | 9 (18.0%) | 3 (4.9%) |
| 65 to 74 Years | 0 (0.0%) | 15 (42.9%) |
| 75 Years and over | 0 (0.0%) | 3 (33.3%) |
Disability Class: Self-Care Difficulty
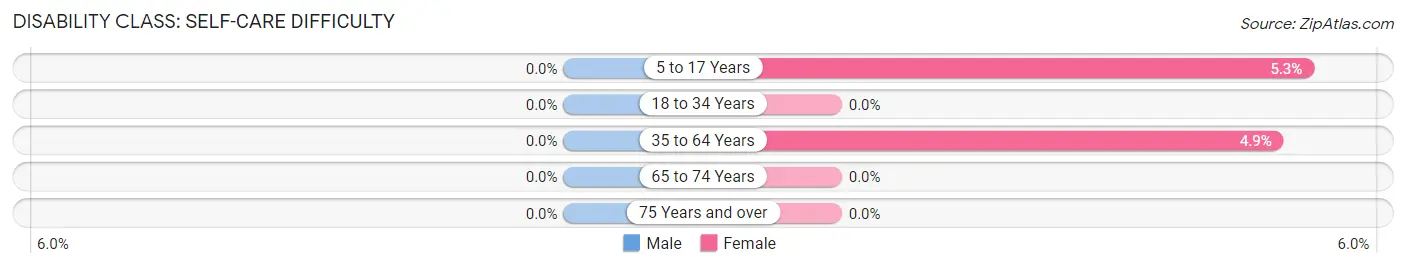
| Age Bracket | Male | Female |
| 5 to 17 Years | 0 (0.0%) | 1 (5.3%) |
| 18 to 34 Years | 0 (0.0%) | 0 (0.0%) |
| 35 to 64 Years | 0 (0.0%) | 3 (4.9%) |
| 65 to 74 Years | 0 (0.0%) | 0 (0.0%) |
| 75 Years and over | 0 (0.0%) | 0 (0.0%) |
Technology Access in Blairsville
Computing Device Access in Blairsville
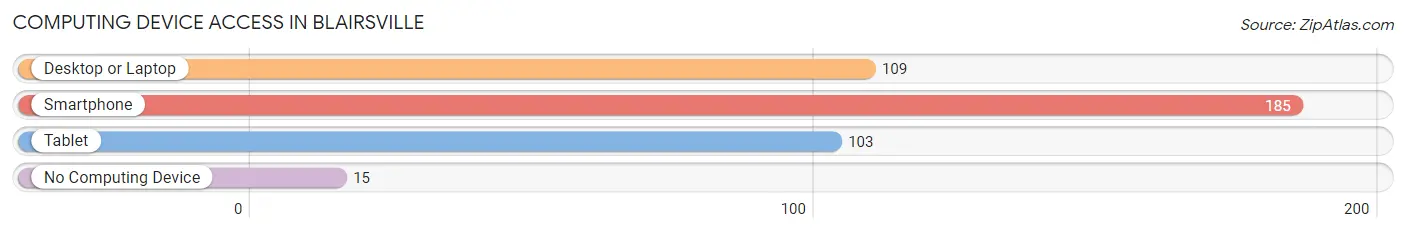
| Device Type | # Households | % Households |
| Desktop or Laptop | 109 | 51.7% |
| Smartphone | 185 | 87.7% |
| Tablet | 103 | 48.8% |
| No Computing Device | 15 | 7.1% |
| Total | 211 | 100.0% |
Internet Access in Blairsville
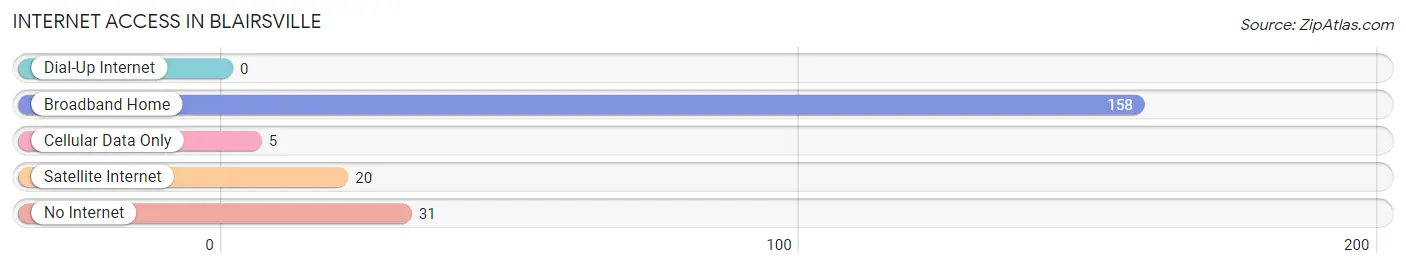
| Internet Type | # Households | % Households |
| Dial-Up Internet | 0 | 0.0% |
| Broadband Home | 158 | 74.9% |
| Cellular Data Only | 5 | 2.4% |
| Satellite Internet | 20 | 9.5% |
| No Internet | 31 | 14.7% |
| Total | 211 | 100.0% |
Blairsville Summary
Blairsville, Georgia is a small town located in the Appalachian Mountains of Union County, Georgia. It is the county seat of Union County and is located about 90 miles north of Atlanta. The town has a population of approximately 600 people and is known for its rural charm and scenic beauty.
History
Blairsville was founded in 1835 by James Blair, a Revolutionary War veteran. The town was originally called Blairsville Station and was a stop on the Western and Atlantic Railroad. In 1839, the town was officially incorporated and renamed Blairsville.
During the Civil War, Blairsville was a major supply center for the Confederate Army. The town was also the site of a major battle in 1864, when Union forces attempted to capture the town. The Union forces were unsuccessful and the town remained in Confederate hands.
After the Civil War, Blairsville experienced a period of growth and prosperity. The town was home to several businesses, including a sawmill, a gristmill, and a tannery. In the late 19th century, the town was also home to a number of churches, schools, and other civic organizations.
Geography
Blairsville is located in the Appalachian Mountains of Union County, Georgia. The town is situated at the confluence of the Nottely and Hiwassee Rivers. The town is surrounded by the Chattahoochee National Forest and is located about 90 miles north of Atlanta.
The town has a total area of 2.2 square miles, all of which is land. The town is located at an elevation of 1,890 feet above sea level. The climate in Blairsville is mild and humid, with temperatures ranging from the low 30s in the winter to the mid-80s in the summer.
Economy
The economy of Blairsville is largely based on tourism. The town is home to several attractions, including the Nottely Dam, the Appalachian Trail, and the Chattahoochee National Forest. The town is also home to several wineries, breweries, and distilleries.
In addition to tourism, Blairsville is home to several small businesses, including restaurants, retail stores, and professional services. The town is also home to a number of manufacturing companies, including a furniture manufacturer and a plastics manufacturer.
Demographics
As of the 2010 census, Blairsville had a population of 600 people. The racial makeup of the town was 95.3% White, 0.2% African American, 0.2% Native American, 0.2% Asian, 0.2% Pacific Islander, and 3.8% from other races. The median household income in Blairsville was $31,250, and the median family income was $37,500. The per capita income in Blairsville was $17,917.
Blairsville is home to a number of churches, including Baptist, Methodist, Presbyterian, and Catholic. The town is also home to a number of civic organizations, including the Blairsville Lions Club and the Blairsville Rotary Club. The town is served by the Union County School System.
Common Questions
What is Per Capita Income in Blairsville?
Per Capita income in Blairsville is $23,657.
What is the Median Family Income in Blairsville?
Median Family Income in Blairsville is $29,028.
What is the Median Household income in Blairsville?
Median Household Income in Blairsville is $21,827.
What is Family Income Deficit in Blairsville?
Family Income Deficit in Blairsville is $10,098.
Families that are below poverty line in Blairsville earn $10,098 less on average than the poverty threshold level.
What is Inequality or Gini Index in Blairsville?
Inequality or Gini Index in Blairsville is 0.52.
What is the Total Population of Blairsville?
Total Population of Blairsville is 736.
What is the Total Male Population of Blairsville?
Total Male Population of Blairsville is 492.
What is the Total Female Population of Blairsville?
Total Female Population of Blairsville is 244.
What is the Ratio of Males per 100 Females in Blairsville?
There are 201.64 Males per 100 Females in Blairsville.
What is the Ratio of Females per 100 Males in Blairsville?
There are 49.59 Females per 100 Males in Blairsville.
What is the Median Population Age in Blairsville?
Median Population Age in Blairsville is 38.4 Years.
What is the Average Family Size in Blairsville
Average Family Size in Blairsville is 2.8 People.
What is the Average Household Size in Blairsville
Average Household Size in Blairsville is 2.2 People.
How Large is the Labor Force in Blairsville?
There are 227 People in the Labor Forcein in Blairsville.
What is the Percentage of People in the Labor Force in Blairsville?
36.0% of People are in the Labor Force in Blairsville.
What is the Unemployment Rate in Blairsville?
Unemployment Rate in Blairsville is 2.2%.