Trion, GA Map & Demographics
Trion Map
Trion Overview
$17,687
PER CAPITA INCOME
$47,500
AVG FAMILY INCOME
$39,073
AVG HOUSEHOLD INCOME
26.8%
WAGE / INCOME GAP [ % ]
73.2¢/ $1
WAGE / INCOME GAP [ $ ]
$9,793
FAMILY INCOME DEFICIT
0.43
INEQUALITY / GINI INDEX
2,389
TOTAL POPULATION
1,238
MALE POPULATION
1,151
FEMALE POPULATION
107.56
MALES / 100 FEMALES
92.97
FEMALES / 100 MALES
28.0
MEDIAN AGE
4.0
AVG FAMILY SIZE
3.3
AVG HOUSEHOLD SIZE
981
LABOR FORCE [ PEOPLE ]
58.8%
PERCENT IN LABOR FORCE
4.0%
UNEMPLOYMENT RATE
Trion Zip Codes
Trion Area Codes
Income in Trion
Income Overview in Trion
Per Capita Income in Trion is $17,687, while median incomes of families and households are $47,500 and $39,073 respectively.
| Characteristic | Number | Measure |
| Per Capita Income | 2,389 | $17,687 |
| Median Family Income | 512 | $47,500 |
| Mean Family Income | 512 | $62,285 |
| Median Household Income | 731 | $39,073 |
| Mean Household Income | 731 | $54,000 |
| Income Deficit | 512 | $9,793 |
| Wage / Income Gap (%) | 2,389 | 26.85% |
| Wage / Income Gap ($) | 2,389 | 73.15¢ per $1 |
| Gini / Inequality Index | 2,389 | 0.43 |
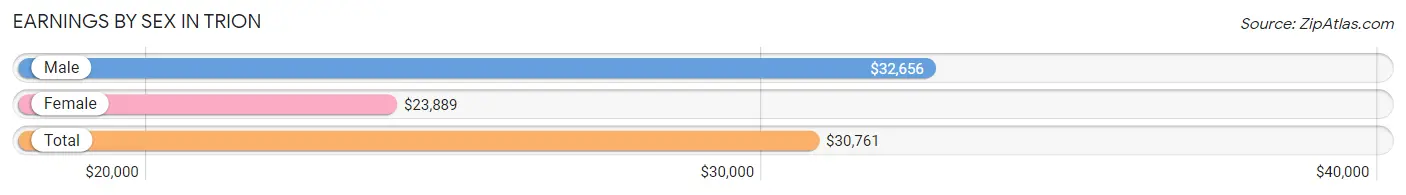
Earnings by Sex in Trion
Average Earnings in Trion are $30,761, $32,656 for men and $23,889 for women, a difference of 26.9%.
| Sex | Number | Average Earnings |
| Male | 580 (58.0%) | $32,656 |
| Female | 420 (42.0%) | $23,889 |
| Total | 1,000 (100.0%) | $30,761 |
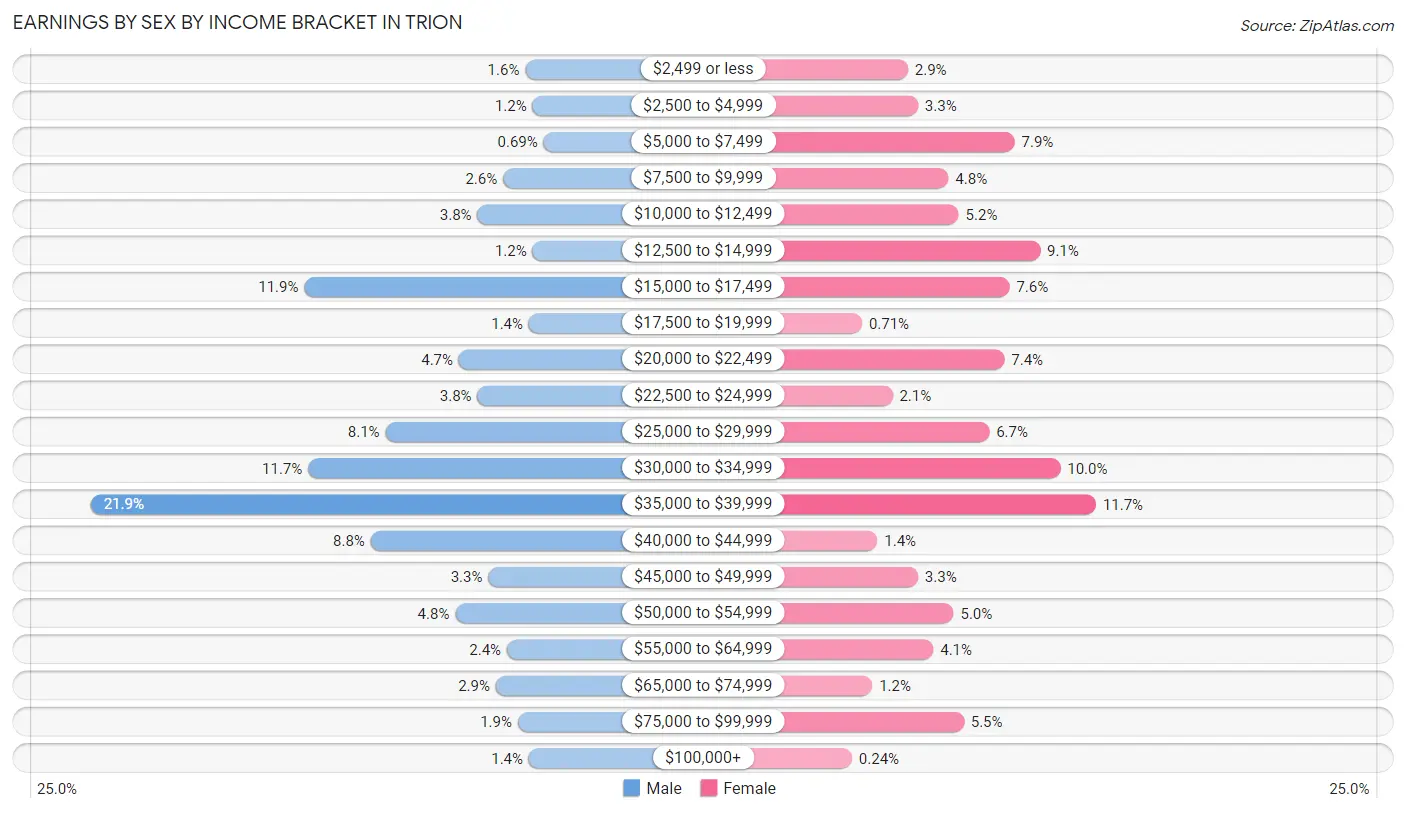
Earnings by Sex by Income Bracket in Trion
The most common earnings brackets in Trion are $35,000 to $39,999 for men (127 | 21.9%) and $35,000 to $39,999 for women (49 | 11.7%).
| Income | Male | Female |
| $2,499 or less | 9 (1.5%) | 12 (2.9%) |
| $2,500 to $4,999 | 7 (1.2%) | 14 (3.3%) |
| $5,000 to $7,499 | 4 (0.7%) | 33 (7.9%) |
| $7,500 to $9,999 | 15 (2.6%) | 20 (4.8%) |
| $10,000 to $12,499 | 22 (3.8%) | 22 (5.2%) |
| $12,500 to $14,999 | 7 (1.2%) | 38 (9.0%) |
| $15,000 to $17,499 | 69 (11.9%) | 32 (7.6%) |
| $17,500 to $19,999 | 8 (1.4%) | 3 (0.7%) |
| $20,000 to $22,499 | 27 (4.7%) | 31 (7.4%) |
| $22,500 to $24,999 | 22 (3.8%) | 9 (2.1%) |
| $25,000 to $29,999 | 47 (8.1%) | 28 (6.7%) |
| $30,000 to $34,999 | 68 (11.7%) | 42 (10.0%) |
| $35,000 to $39,999 | 127 (21.9%) | 49 (11.7%) |
| $40,000 to $44,999 | 51 (8.8%) | 6 (1.4%) |
| $45,000 to $49,999 | 19 (3.3%) | 14 (3.3%) |
| $50,000 to $54,999 | 28 (4.8%) | 21 (5.0%) |
| $55,000 to $64,999 | 14 (2.4%) | 17 (4.1%) |
| $65,000 to $74,999 | 17 (2.9%) | 5 (1.2%) |
| $75,000 to $99,999 | 11 (1.9%) | 23 (5.5%) |
| $100,000+ | 8 (1.4%) | 1 (0.2%) |
| Total | 580 (100.0%) | 420 (100.0%) |
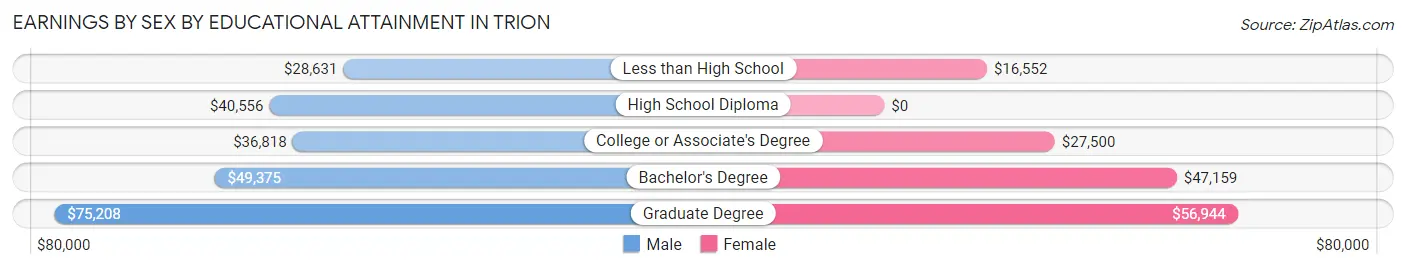
Earnings by Sex by Educational Attainment in Trion
Average earnings in Trion are $35,542 for men and $22,778 for women, a difference of 35.9%. Men with an educational attainment of graduate degree enjoy the highest average annual earnings of $75,208, while those with less than high school education earn the least with $28,631. Women with an educational attainment of graduate degree earn the most with the average annual earnings of $56,944, while those with less than high school education have the smallest earnings of $16,552.
| Educational Attainment | Male Income | Female Income |
| Less than High School | $28,631 | $16,552 |
| High School Diploma | $40,556 | $0 |
| College or Associate's Degree | $36,818 | $27,500 |
| Bachelor's Degree | $49,375 | $47,159 |
| Graduate Degree | $75,208 | $56,944 |
| Total | $35,542 | $22,778 |
Family Income in Trion
Family Income Brackets in Trion
According to the Trion family income data, there are 110 families falling into the $50,000 to $74,999 income range, which is the most common income bracket and makes up 21.5% of all families. Conversely, the $200,000+ income bracket is the least frequent group with only 2 families (0.4%) belonging to this category.
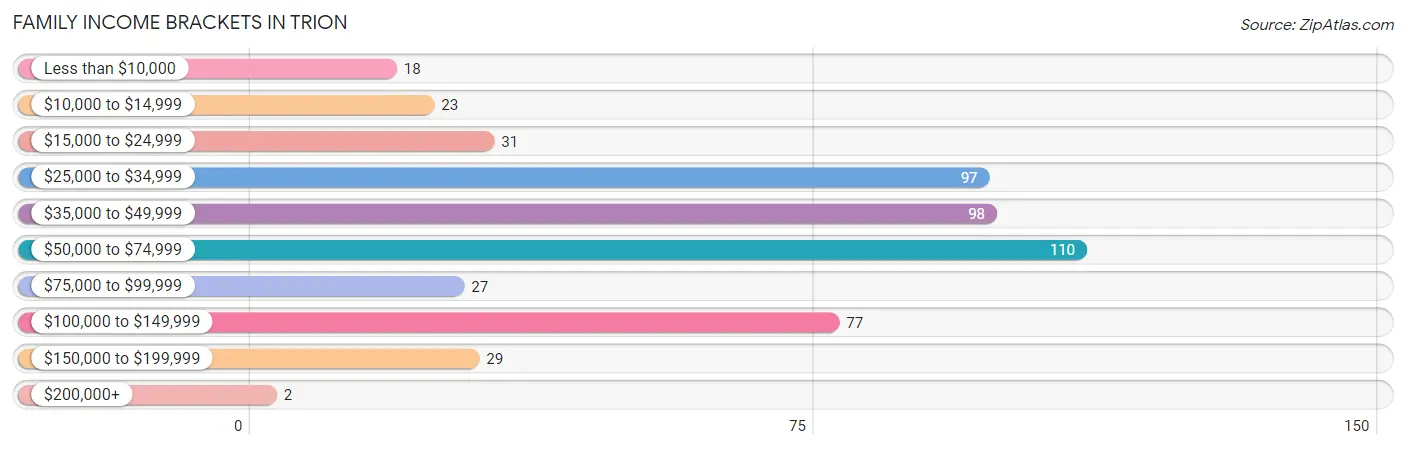
| Income Bracket | # Families | % Families |
| Less than $10,000 | 18 | 3.5% |
| $10,000 to $14,999 | 23 | 4.5% |
| $15,000 to $24,999 | 31 | 6.1% |
| $25,000 to $34,999 | 97 | 18.9% |
| $35,000 to $49,999 | 98 | 19.1% |
| $50,000 to $74,999 | 110 | 21.5% |
| $75,000 to $99,999 | 27 | 5.3% |
| $100,000 to $149,999 | 77 | 15.0% |
| $150,000 to $199,999 | 29 | 5.7% |
| $200,000+ | 2 | 0.4% |
Family Income by Famaliy Size in Trion
4-person families (101 | 19.7%) account for the highest median family income in Trion with $65,417 per family, while 2-person families (137 | 26.8%) have the highest median income of $25,208 per family member.
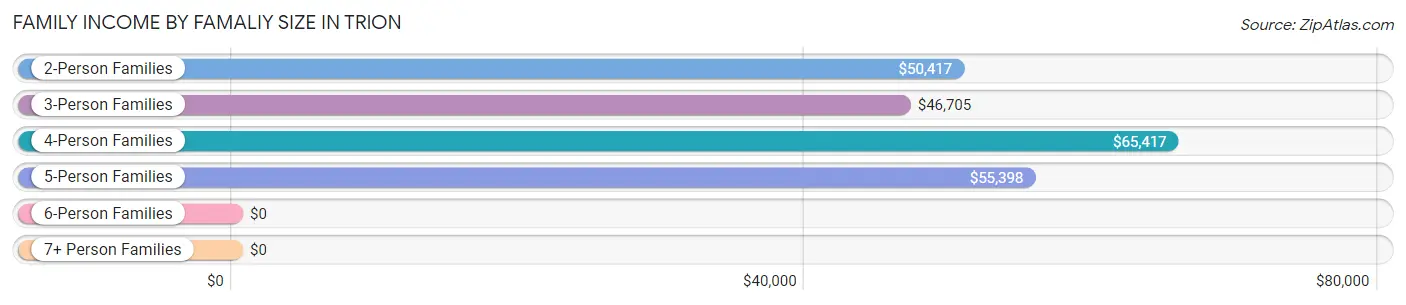
| Income Bracket | # Families | Median Income |
| 2-Person Families | 137 (26.8%) | $50,417 |
| 3-Person Families | 127 (24.8%) | $46,705 |
| 4-Person Families | 101 (19.7%) | $65,417 |
| 5-Person Families | 87 (17.0%) | $55,398 |
| 6-Person Families | 27 (5.3%) | $0 |
| 7+ Person Families | 33 (6.5%) | $0 |
| Total | 512 (100.0%) | $47,500 |
Family Income by Number of Earners in Trion
The median family income in Trion is $47,500, with families comprising 3+ earners (56) having the highest median family income of $143,125, while families with 1 earner (213) have the lowest median family income of $34,327, accounting for 10.9% and 41.6% of families, respectively.
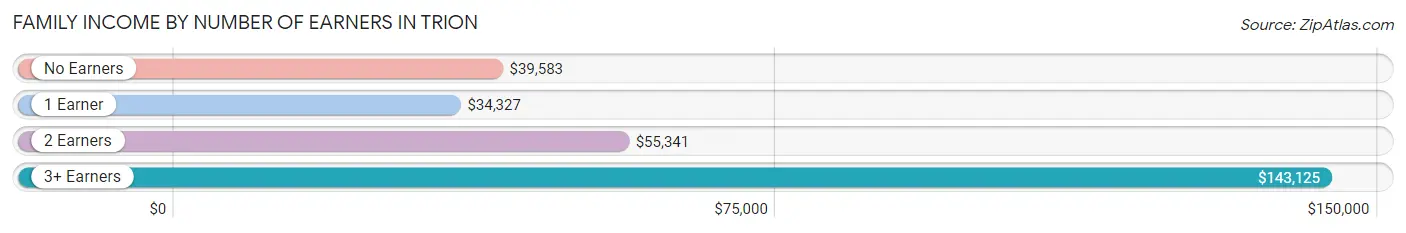
| Number of Earners | # Families | Median Income |
| No Earners | 51 (10.0%) | $39,583 |
| 1 Earner | 213 (41.6%) | $34,327 |
| 2 Earners | 192 (37.5%) | $55,341 |
| 3+ Earners | 56 (10.9%) | $143,125 |
| Total | 512 (100.0%) | $47,500 |
Household Income in Trion
Household Income Brackets in Trion
With 129 households falling in the category, the $50,000 to $74,999 income range is the most frequent in Trion, accounting for 17.6% of all households. In contrast, only 2 households (0.3%) fall into the $200,000+ income bracket, making it the least populous group.
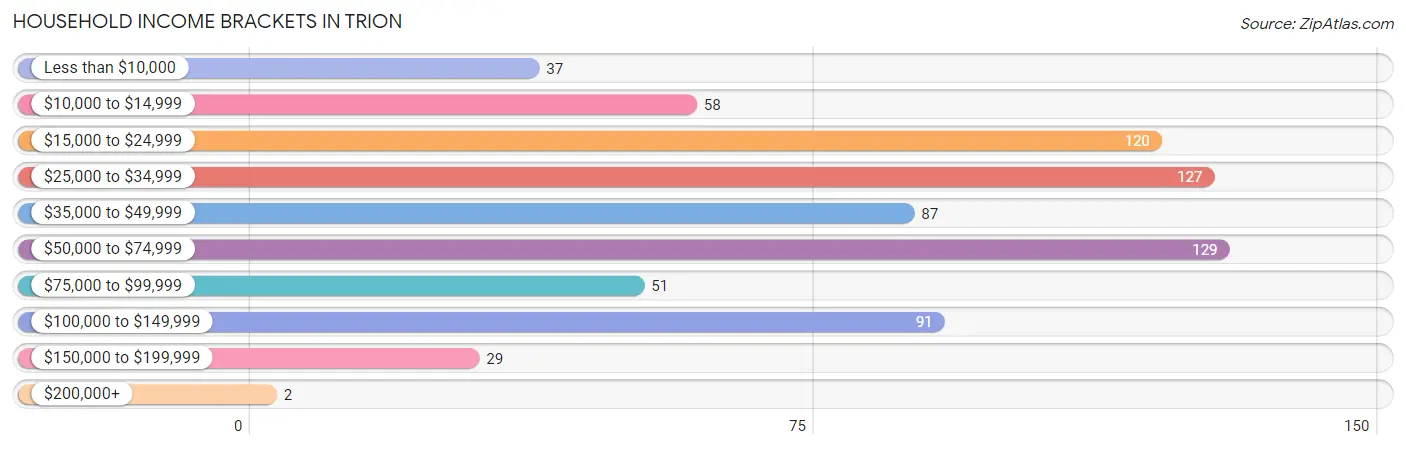
| Income Bracket | # Households | % Households |
| Less than $10,000 | 37 | 5.1% |
| $10,000 to $14,999 | 58 | 7.9% |
| $15,000 to $24,999 | 120 | 16.4% |
| $25,000 to $34,999 | 127 | 17.4% |
| $35,000 to $49,999 | 87 | 11.9% |
| $50,000 to $74,999 | 129 | 17.6% |
| $75,000 to $99,999 | 51 | 7.0% |
| $100,000 to $149,999 | 91 | 12.4% |
| $150,000 to $199,999 | 29 | 4.0% |
| $200,000+ | 2 | 0.3% |
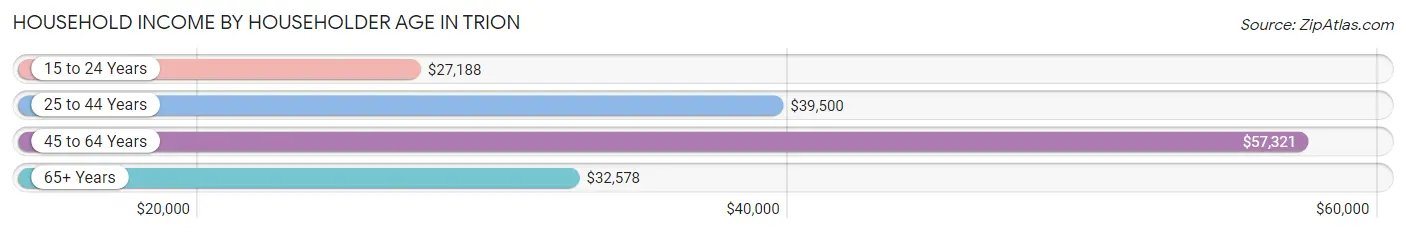
Household Income by Householder Age in Trion
The median household income in Trion is $39,073, with the highest median household income of $57,321 found in the 45 to 64 years age bracket for the primary householder. A total of 184 households (25.2%) fall into this category. Meanwhile, the 15 to 24 years age bracket for the primary householder has the lowest median household income of $27,188, with 42 households (5.8%) in this group.
| Income Bracket | # Households | Median Income |
| 15 to 24 Years | 42 (5.8%) | $27,188 |
| 25 to 44 Years | 312 (42.7%) | $39,500 |
| 45 to 64 Years | 184 (25.2%) | $57,321 |
| 65+ Years | 193 (26.4%) | $32,578 |
| Total | 731 (100.0%) | $39,073 |
Poverty in Trion
Income Below Poverty by Sex and Age in Trion
With 27.4% poverty level for males and 33.5% for females among the residents of Trion, 12 to 14 year old males and 5 year old females are the most vulnerable to poverty, with 43 males (86.0%) and 4 females (100.0%) in their respective age groups living below the poverty level.
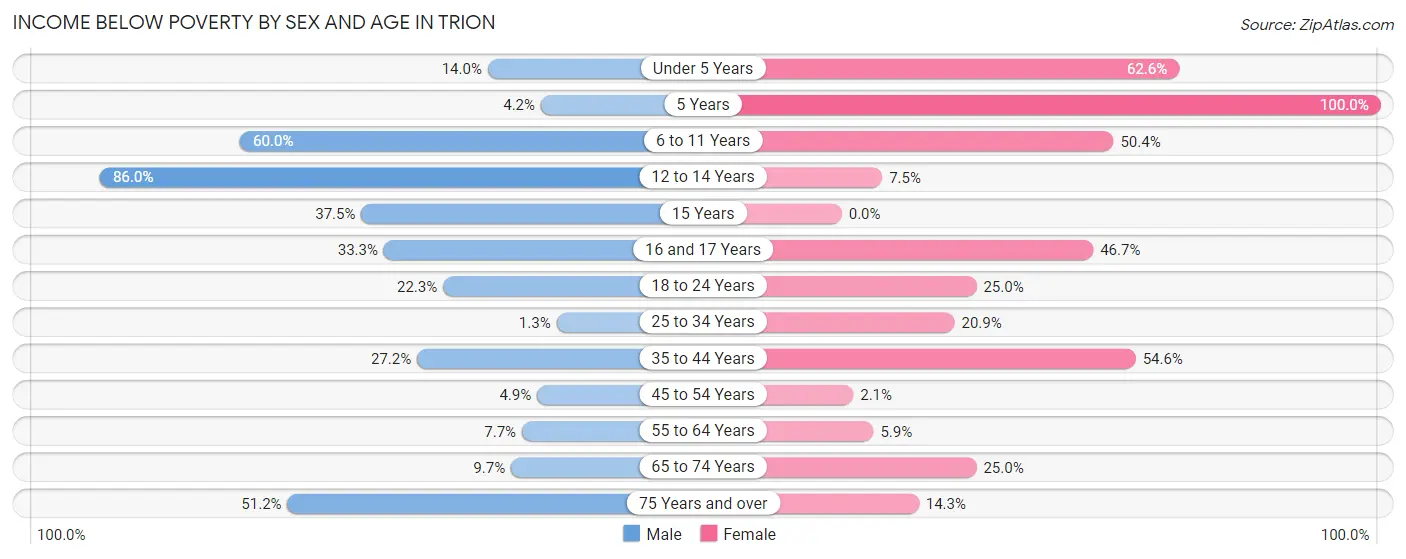
| Age Bracket | Male | Female |
| Under 5 Years | 8 (14.0%) | 87 (62.6%) |
| 5 Years | 3 (4.2%) | 4 (100.0%) |
| 6 to 11 Years | 111 (60.0%) | 59 (50.4%) |
| 12 to 14 Years | 43 (86.0%) | 3 (7.5%) |
| 15 Years | 6 (37.5%) | 0 (0.0%) |
| 16 and 17 Years | 19 (33.3%) | 21 (46.7%) |
| 18 to 24 Years | 48 (22.3%) | 19 (25.0%) |
| 25 to 34 Years | 1 (1.3%) | 27 (20.9%) |
| 35 to 44 Years | 63 (27.2%) | 114 (54.5%) |
| 45 to 54 Years | 6 (4.9%) | 1 (2.1%) |
| 55 to 64 Years | 3 (7.7%) | 6 (5.9%) |
| 65 to 74 Years | 7 (9.7%) | 19 (25.0%) |
| 75 Years and over | 21 (51.2%) | 18 (14.3%) |
| Total | 339 (27.4%) | 378 (33.5%) |
Income Above Poverty by Sex and Age in Trion
According to the poverty statistics in Trion, males aged 25 to 34 years and females aged 15 years are the age groups that are most secure financially, with 98.7% of males and 100.0% of females in these age groups living above the poverty line.
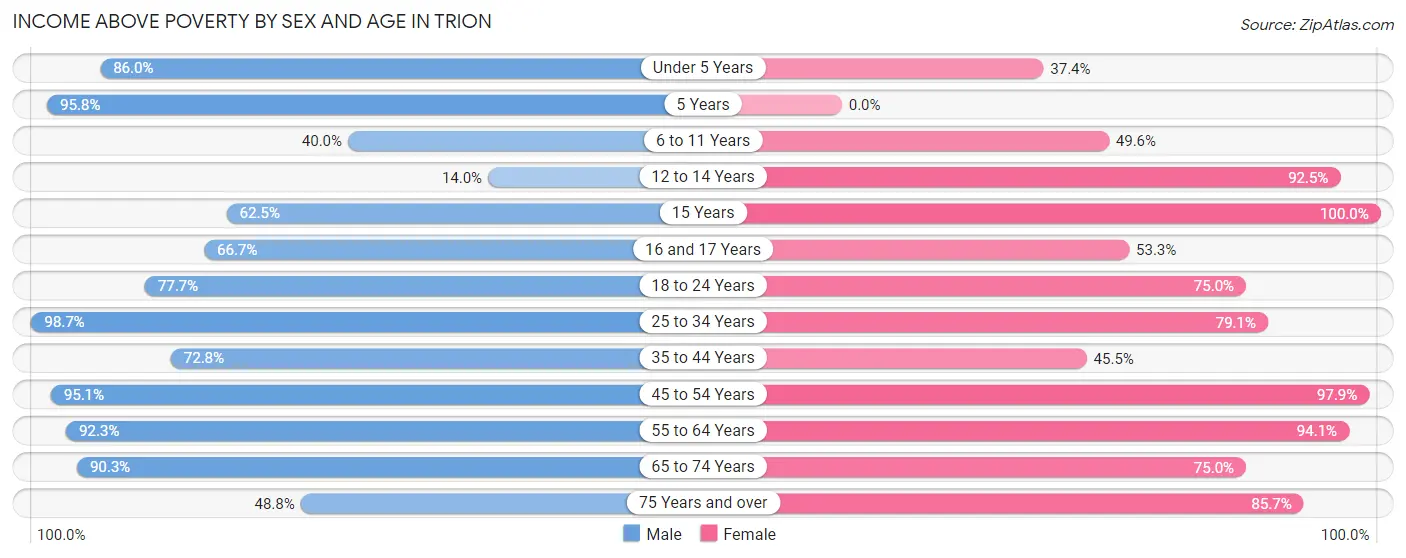
| Age Bracket | Male | Female |
| Under 5 Years | 49 (86.0%) | 52 (37.4%) |
| 5 Years | 69 (95.8%) | 0 (0.0%) |
| 6 to 11 Years | 74 (40.0%) | 58 (49.6%) |
| 12 to 14 Years | 7 (14.0%) | 37 (92.5%) |
| 15 Years | 10 (62.5%) | 18 (100.0%) |
| 16 and 17 Years | 38 (66.7%) | 24 (53.3%) |
| 18 to 24 Years | 167 (77.7%) | 57 (75.0%) |
| 25 to 34 Years | 78 (98.7%) | 102 (79.1%) |
| 35 to 44 Years | 169 (72.8%) | 95 (45.5%) |
| 45 to 54 Years | 117 (95.1%) | 46 (97.9%) |
| 55 to 64 Years | 36 (92.3%) | 96 (94.1%) |
| 65 to 74 Years | 65 (90.3%) | 57 (75.0%) |
| 75 Years and over | 20 (48.8%) | 108 (85.7%) |
| Total | 899 (72.6%) | 750 (66.5%) |
Income Below Poverty Among Married-Couple Families in Trion
The poverty statistics for married-couple families in Trion show that 27.0% or 79 of the total 293 families live below the poverty line. Families with 5 or more children have the highest poverty rate of 100.0%, comprising of 33 families. On the other hand, families with no children have the lowest poverty rate of 2.5%, which includes 3 families.
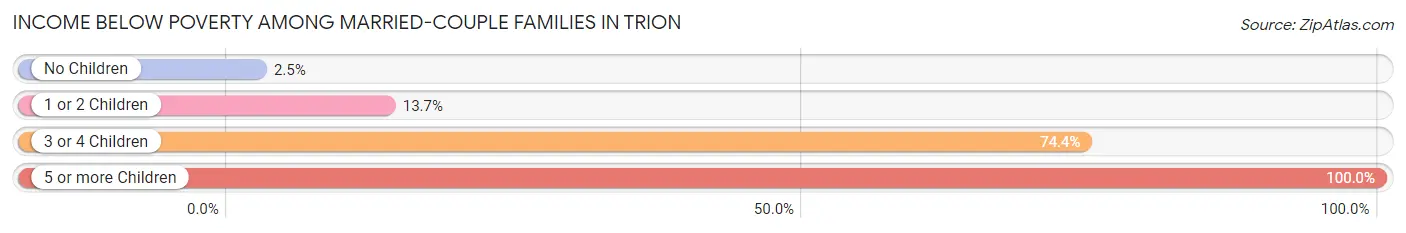
| Children | Above Poverty | Below Poverty |
| No Children | 116 (97.5%) | 3 (2.5%) |
| 1 or 2 Children | 88 (86.3%) | 14 (13.7%) |
| 3 or 4 Children | 10 (25.6%) | 29 (74.4%) |
| 5 or more Children | 0 (0.0%) | 33 (100.0%) |
| Total | 214 (73.0%) | 79 (27.0%) |
Income Below Poverty Among Single-Parent Households in Trion
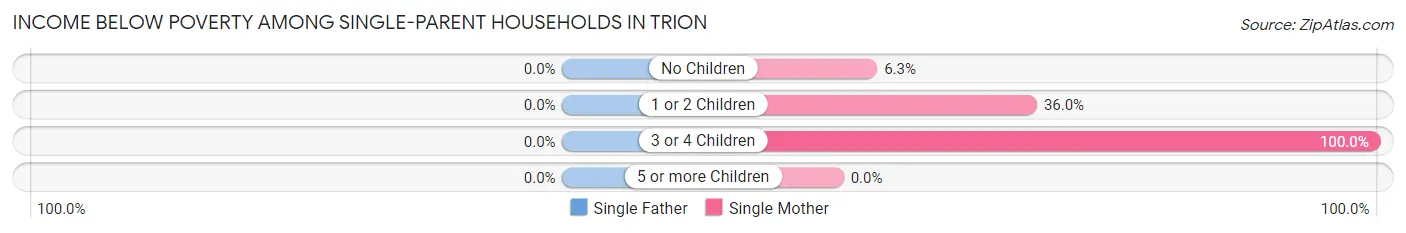
| Children | Single Father | Single Mother |
| No Children | 0 (0.0%) | 2 (6.2%) |
| 1 or 2 Children | 0 (0.0%) | 36 (36.0%) |
| 3 or 4 Children | 0 (0.0%) | 22 (100.0%) |
| 5 or more Children | 0 (0.0%) | 0 (0.0%) |
| Total | 0 (0.0%) | 60 (39.0%) |
Income Below Poverty Among Married-Couple vs Single-Parent Households in Trion
The poverty data for Trion shows that 79 of the married-couple family households (27.0%) and 60 of the single-parent households (27.4%) are living below the poverty level. Within the married-couple family households, those with 5 or more children have the highest poverty rate, with 33 households (100.0%) falling below the poverty line. Among the single-parent households, those with 3 or 4 children have the highest poverty rate, with 22 household (55.0%) living below poverty.
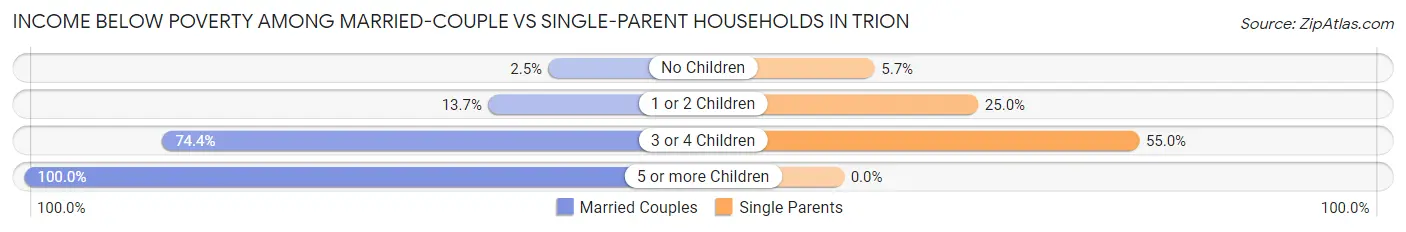
| Children | Married-Couple Families | Single-Parent Households |
| No Children | 3 (2.5%) | 2 (5.7%) |
| 1 or 2 Children | 14 (13.7%) | 36 (25.0%) |
| 3 or 4 Children | 29 (74.4%) | 22 (55.0%) |
| 5 or more Children | 33 (100.0%) | 0 (0.0%) |
| Total | 79 (27.0%) | 60 (27.4%) |
Race in Trion
The most populous races in Trion are White / Caucasian (1,441 | 60.3%), Hispanic or Latino (915 | 38.3%), and Two or more Races (364 | 15.2%).
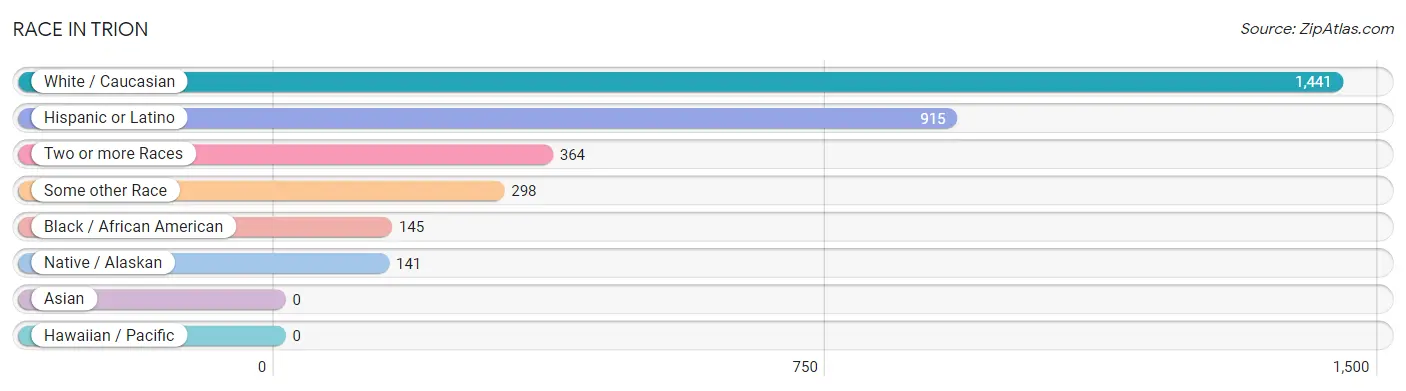
| Race | # Population | % Population |
| Asian | 0 | 0.0% |
| Black / African American | 145 | 6.1% |
| Hawaiian / Pacific | 0 | 0.0% |
| Hispanic or Latino | 915 | 38.3% |
| Native / Alaskan | 141 | 5.9% |
| White / Caucasian | 1,441 | 60.3% |
| Two or more Races | 364 | 15.2% |
| Some other Race | 298 | 12.5% |
| Total | 2,389 | 100.0% |
Ancestry in Trion
The most populous ancestries reported in Trion are American (816 | 34.2%), Central American (796 | 33.3%), Guatemalan (796 | 33.3%), English (232 | 9.7%), and Mexican (110 | 4.6%), together accounting for 115.1% of all Trion residents.
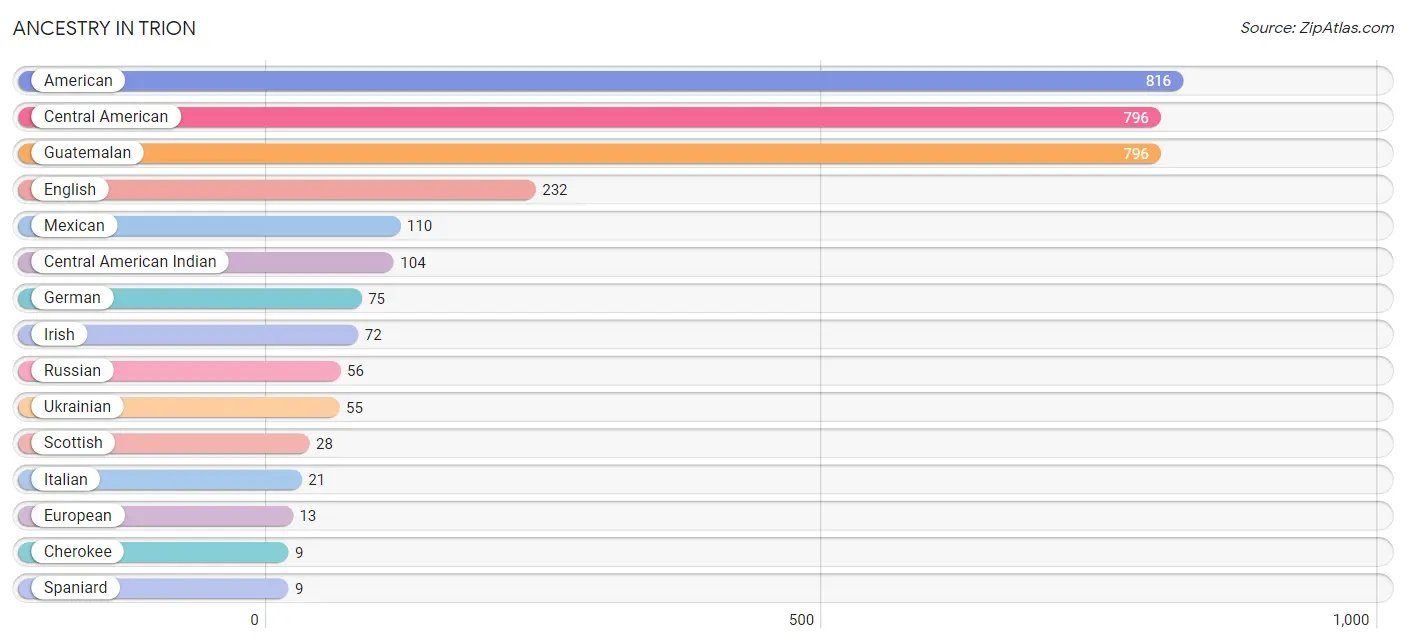
| Ancestry | # Population | % Population |
| American | 816 | 34.2% |
| British | 2 | 0.1% |
| Central American | 796 | 33.3% |
| Central American Indian | 104 | 4.3% |
| Cherokee | 9 | 0.4% |
| Eastern European | 3 | 0.1% |
| English | 232 | 9.7% |
| European | 13 | 0.5% |
| French | 4 | 0.2% |
| German | 75 | 3.1% |
| Guatemalan | 796 | 33.3% |
| Irish | 72 | 3.0% |
| Italian | 21 | 0.9% |
| Mexican | 110 | 4.6% |
| Northern European | 5 | 0.2% |
| Polish | 5 | 0.2% |
| Russian | 56 | 2.3% |
| Scotch-Irish | 6 | 0.3% |
| Scottish | 28 | 1.2% |
| Spaniard | 9 | 0.4% |
| Ukrainian | 55 | 2.3% |
| Welsh | 5 | 0.2% |
| Yup'ik | 6 | 0.3% | View All 23 Rows |
Immigrants in Trion
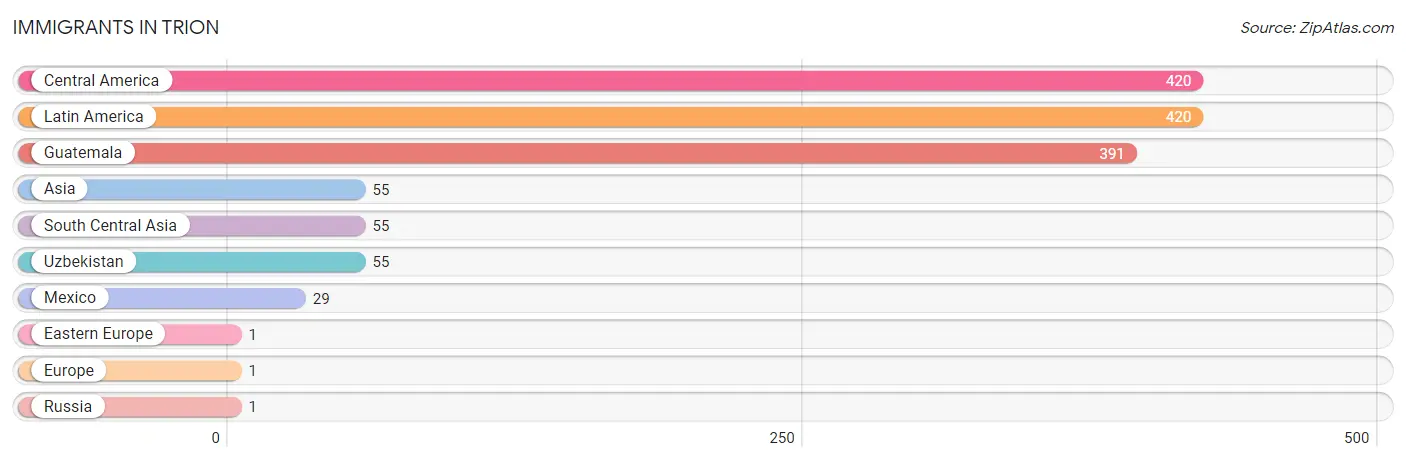
The most numerous immigrant groups reported in Trion came from Central America (420 | 17.6%), Latin America (420 | 17.6%), Guatemala (391 | 16.4%), Asia (55 | 2.3%), and South Central Asia (55 | 2.3%), together accounting for 56.1% of all Trion residents.
| Immigration Origin | # Population | % Population |
| Asia | 55 | 2.3% |
| Central America | 420 | 17.6% |
| Eastern Europe | 1 | 0.0% |
| Europe | 1 | 0.0% |
| Guatemala | 391 | 16.4% |
| Latin America | 420 | 17.6% |
| Mexico | 29 | 1.2% |
| Russia | 1 | 0.0% |
| South Central Asia | 55 | 2.3% |
| Uzbekistan | 55 | 2.3% | View All 10 Rows |
Sex and Age in Trion
Sex and Age in Trion
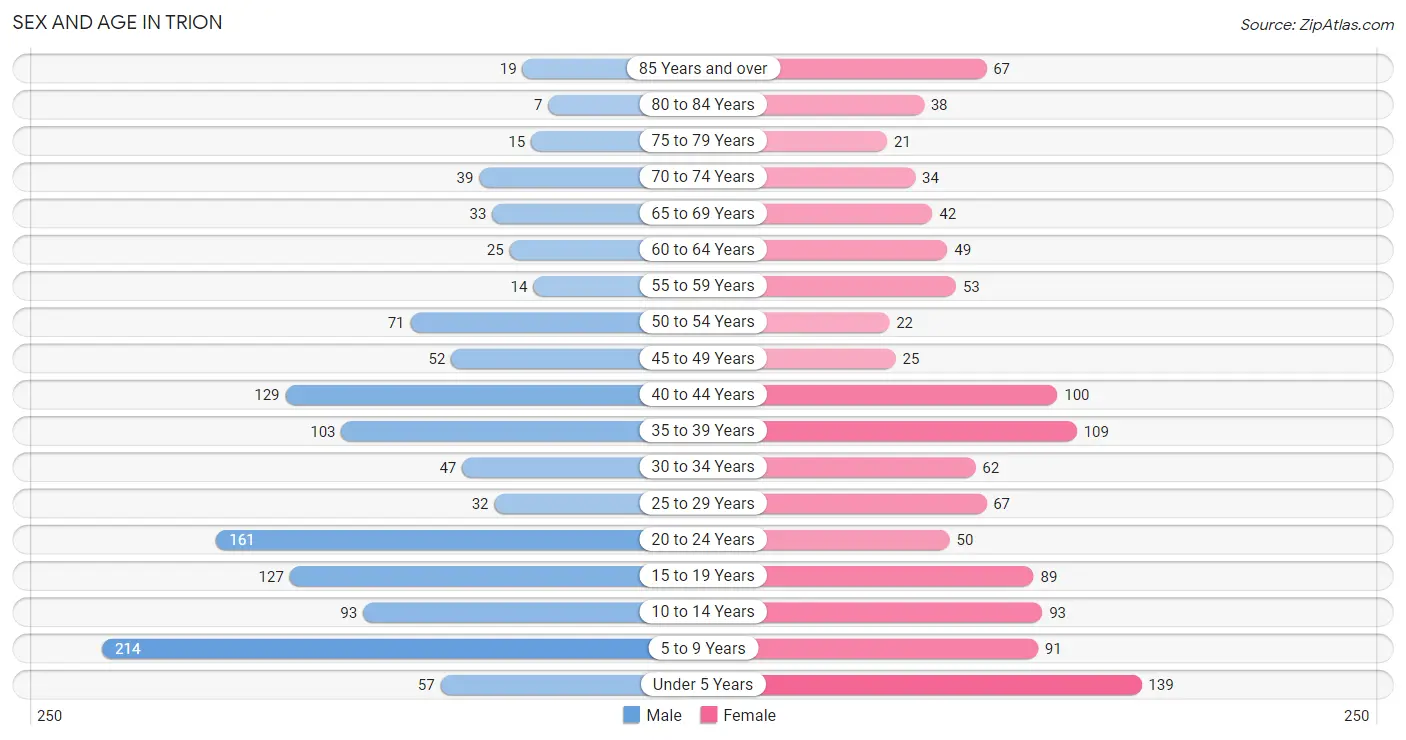
The most populous age groups in Trion are 5 to 9 Years (214 | 17.3%) for men and Under 5 Years (139 | 12.1%) for women.
| Age Bracket | Male | Female |
| Under 5 Years | 57 (4.6%) | 139 (12.1%) |
| 5 to 9 Years | 214 (17.3%) | 91 (7.9%) |
| 10 to 14 Years | 93 (7.5%) | 93 (8.1%) |
| 15 to 19 Years | 127 (10.3%) | 89 (7.7%) |
| 20 to 24 Years | 161 (13.0%) | 50 (4.3%) |
| 25 to 29 Years | 32 (2.6%) | 67 (5.8%) |
| 30 to 34 Years | 47 (3.8%) | 62 (5.4%) |
| 35 to 39 Years | 103 (8.3%) | 109 (9.5%) |
| 40 to 44 Years | 129 (10.4%) | 100 (8.7%) |
| 45 to 49 Years | 52 (4.2%) | 25 (2.2%) |
| 50 to 54 Years | 71 (5.7%) | 22 (1.9%) |
| 55 to 59 Years | 14 (1.1%) | 53 (4.6%) |
| 60 to 64 Years | 25 (2.0%) | 49 (4.3%) |
| 65 to 69 Years | 33 (2.7%) | 42 (3.6%) |
| 70 to 74 Years | 39 (3.2%) | 34 (2.9%) |
| 75 to 79 Years | 15 (1.2%) | 21 (1.8%) |
| 80 to 84 Years | 7 (0.6%) | 38 (3.3%) |
| 85 Years and over | 19 (1.5%) | 67 (5.8%) |
| Total | 1,238 (100.0%) | 1,151 (100.0%) |
Families and Households in Trion
Median Family Size in Trion
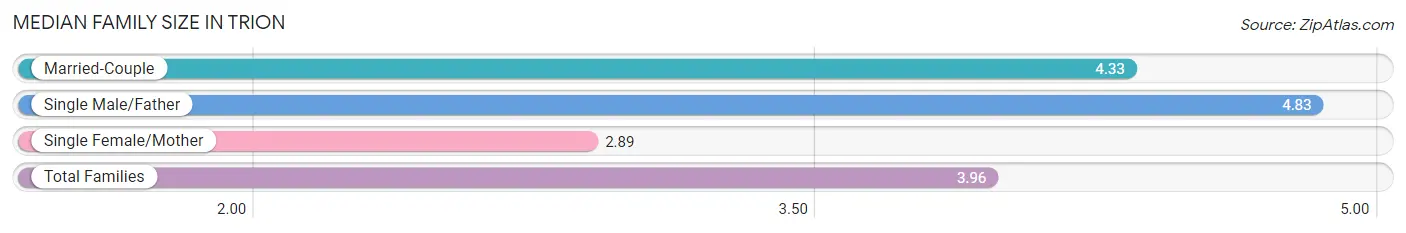
The median family size in Trion is 3.96 persons per family, with single male/father families (65 | 12.7%) accounting for the largest median family size of 4.83 persons per family. On the other hand, single female/mother families (154 | 30.1%) represent the smallest median family size with 2.89 persons per family.
| Family Type | # Families | Family Size |
| Married-Couple | 293 (57.2%) | 4.33 |
| Single Male/Father | 65 (12.7%) | 4.83 |
| Single Female/Mother | 154 (30.1%) | 2.89 |
| Total Families | 512 (100.0%) | 3.96 |
Median Household Size in Trion
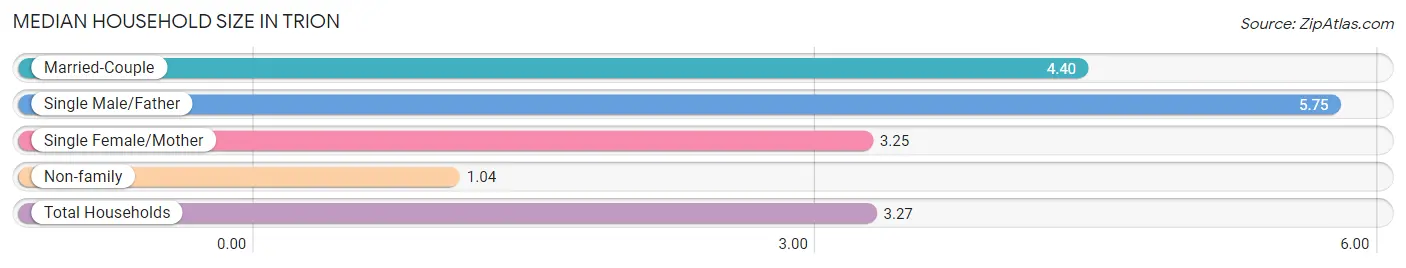
The median household size in Trion is 3.27 persons per household, with single male/father households (65 | 8.9%) accounting for the largest median household size of 5.75 persons per household. non-family households (219 | 30.0%) represent the smallest median household size with 1.04 persons per household.
| Household Type | # Households | Household Size |
| Married-Couple | 293 (40.1%) | 4.40 |
| Single Male/Father | 65 (8.9%) | 5.75 |
| Single Female/Mother | 154 (21.1%) | 3.25 |
| Non-family | 219 (30.0%) | 1.04 |
| Total Households | 731 (100.0%) | 3.27 |
Household Size by Marriage Status in Trion
Out of a total of 731 households in Trion, 512 (70.0%) are family households, while 219 (30.0%) are nonfamily households. The most numerous type of family households are 3-person households, comprising 145, and the most common type of nonfamily households are 1-person households, comprising 210.
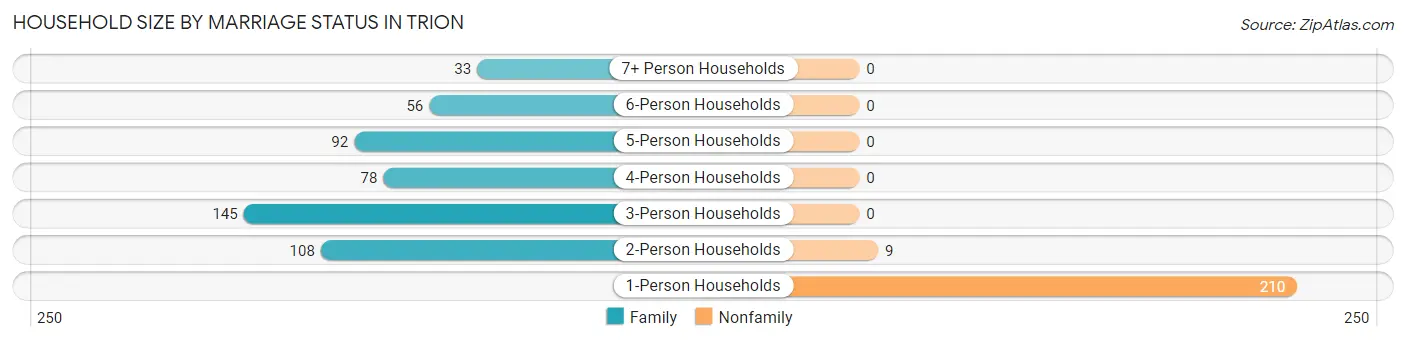
| Household Size | Family Households | Nonfamily Households |
| 1-Person Households | - | 210 (28.7%) |
| 2-Person Households | 108 (14.8%) | 9 (1.2%) |
| 3-Person Households | 145 (19.8%) | 0 (0.0%) |
| 4-Person Households | 78 (10.7%) | 0 (0.0%) |
| 5-Person Households | 92 (12.6%) | 0 (0.0%) |
| 6-Person Households | 56 (7.7%) | 0 (0.0%) |
| 7+ Person Households | 33 (4.5%) | 0 (0.0%) |
| Total | 512 (70.0%) | 219 (30.0%) |
Female Fertility in Trion
Fertility by Age in Trion
Average fertility rate in Trion is 68.0 births per 1,000 women. Women in the age bracket of 20 to 34 years have the highest fertility rate with 95.0 births per 1,000 women. Women in the age bracket of 35 to 50 years acount for 51.4% of all women with births.
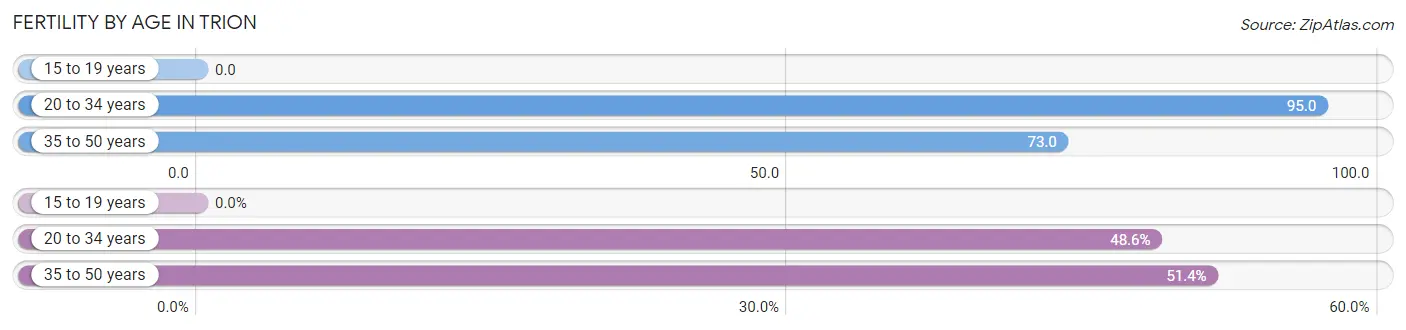
| Age Bracket | Women with Births | Births / 1,000 Women |
| 15 to 19 years | 0 (0.0%) | 0.0 |
| 20 to 34 years | 17 (48.6%) | 95.0 |
| 35 to 50 years | 18 (51.4%) | 73.0 |
| Total | 35 (100.0%) | 68.0 |
Fertility by Age by Marriage Status in Trion
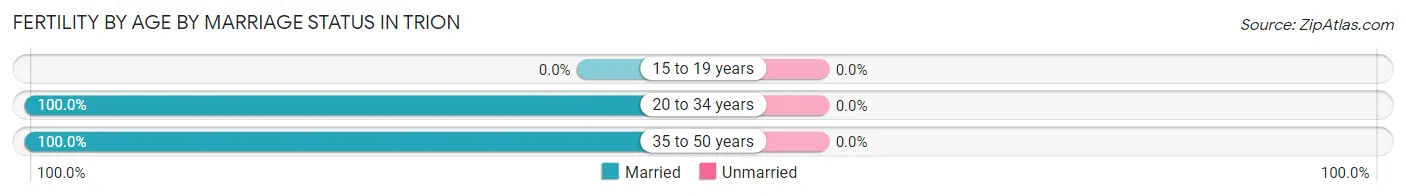
| Age Bracket | Married | Unmarried |
| 15 to 19 years | 0 (0.0%) | 0 (0.0%) |
| 20 to 34 years | 17 (100.0%) | 0 (0.0%) |
| 35 to 50 years | 18 (100.0%) | 0 (0.0%) |
| Total | 35 (100.0%) | 0 (0.0%) |
Fertility by Education in Trion
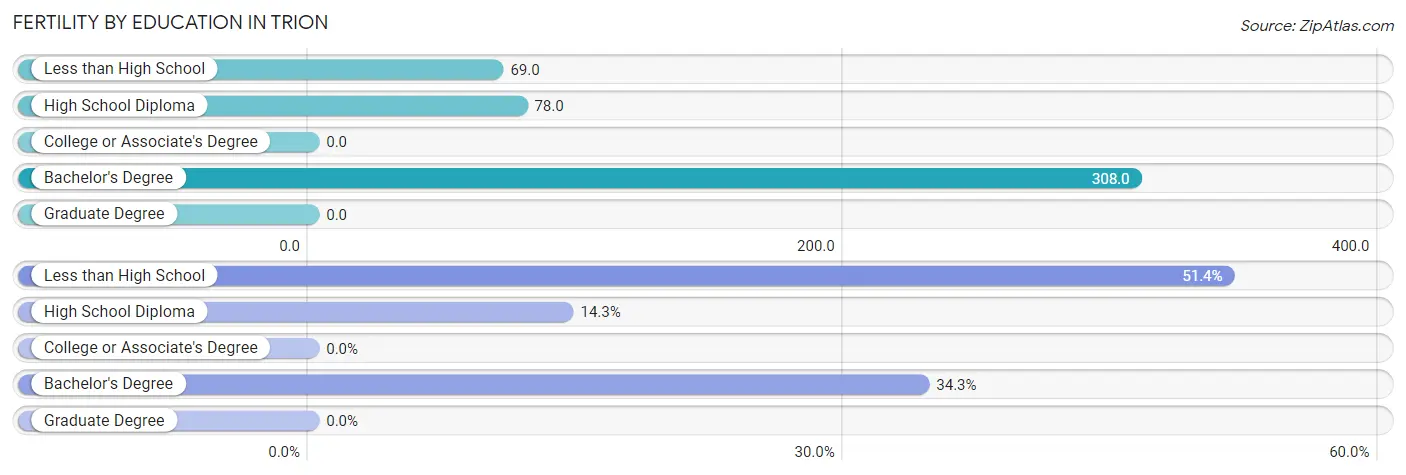
| Educational Attainment | Women with Births | Births / 1,000 Women |
| Less than High School | 18 (51.4%) | 69.0 |
| High School Diploma | 5 (14.3%) | 78.0 |
| College or Associate's Degree | 0 (0.0%) | 0.0 |
| Bachelor's Degree | 12 (34.3%) | 308.0 |
| Graduate Degree | 0 (0.0%) | 0.0 |
| Total | 35 (100.0%) | 68.0 |
Fertility by Education by Marriage Status in Trion
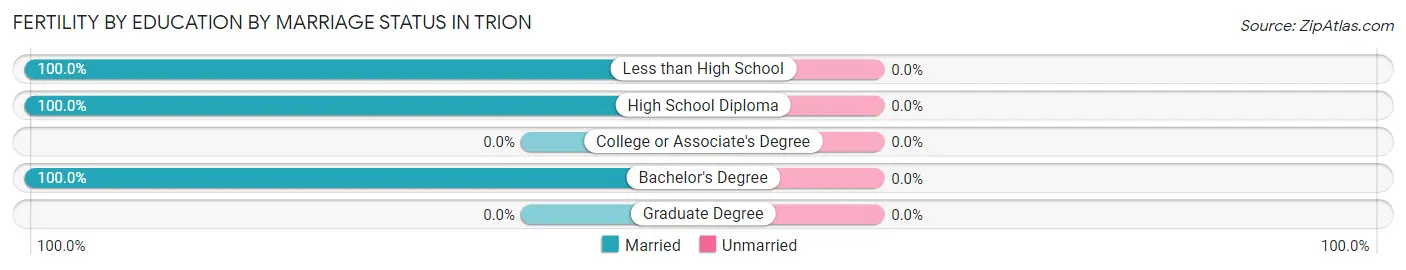
| Educational Attainment | Married | Unmarried |
| Less than High School | 18 (100.0%) | 0 (0.0%) |
| High School Diploma | 5 (100.0%) | 0 (0.0%) |
| College or Associate's Degree | 0 (0.0%) | 0 (0.0%) |
| Bachelor's Degree | 12 (100.0%) | 0 (0.0%) |
| Graduate Degree | 0 (0.0%) | 0 (0.0%) |
| Total | 35 (100.0%) | 0 (0.0%) |
Employment Characteristics in Trion
Employment by Class of Employer in Trion
Among the 896 employed individuals in Trion, private company employees (715 | 79.8%), self-employed (not incorporated) (87 | 9.7%), and local government employees (50 | 5.6%) make up the most common classes of employment.
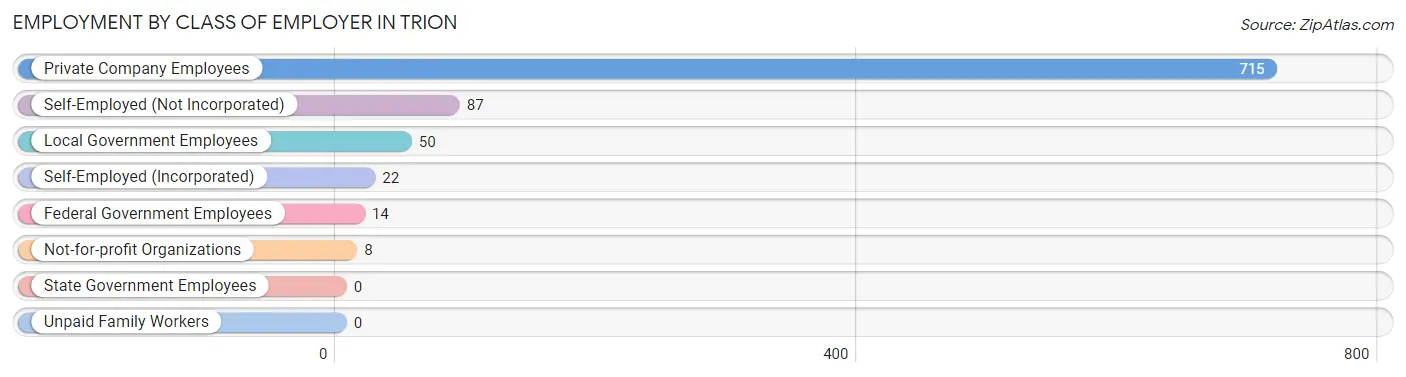
| Employer Class | # Employees | % Employees |
| Private Company Employees | 715 | 79.8% |
| Self-Employed (Incorporated) | 22 | 2.5% |
| Self-Employed (Not Incorporated) | 87 | 9.7% |
| Not-for-profit Organizations | 8 | 0.9% |
| Local Government Employees | 50 | 5.6% |
| State Government Employees | 0 | 0.0% |
| Federal Government Employees | 14 | 1.6% |
| Unpaid Family Workers | 0 | 0.0% |
| Total | 896 | 100.0% |
Employment Status by Age in Trion
According to the labor force statistics for Trion, out of the total population over 16 years of age (1,668), 58.8% or 981 individuals are in the labor force, with 4.0% or 39 of them unemployed. The age group with the highest labor force participation rate is 20 to 24 years, with 92.4% or 195 individuals in the labor force. Within the labor force, the 55 to 59 years age range has the highest percentage of unemployed individuals, with 8.9% or 4 of them being unemployed.
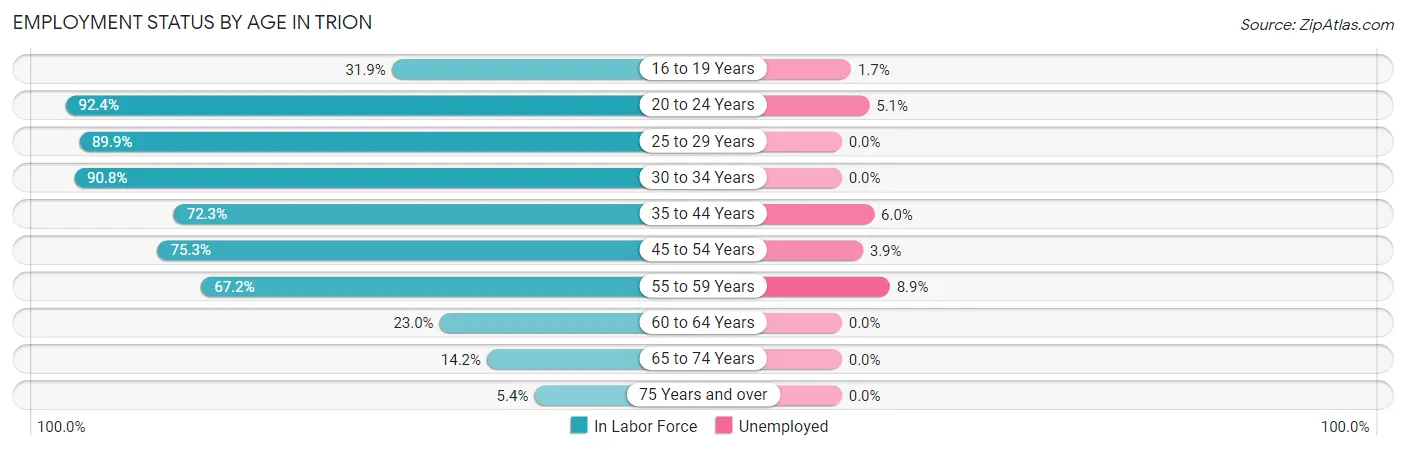
| Age Bracket | In Labor Force | Unemployed |
| 16 to 19 Years | 58 (31.9%) | 1 (1.7%) |
| 20 to 24 Years | 195 (92.4%) | 10 (5.1%) |
| 25 to 29 Years | 89 (89.9%) | 0 (0.0%) |
| 30 to 34 Years | 99 (90.8%) | 0 (0.0%) |
| 35 to 44 Years | 319 (72.3%) | 19 (6.0%) |
| 45 to 54 Years | 128 (75.3%) | 5 (3.9%) |
| 55 to 59 Years | 45 (67.2%) | 4 (8.9%) |
| 60 to 64 Years | 17 (23.0%) | 0 (0.0%) |
| 65 to 74 Years | 21 (14.2%) | 0 (0.0%) |
| 75 Years and over | 9 (5.4%) | 0 (0.0%) |
| Total | 981 (58.8%) | 39 (4.0%) |
Employment Status by Educational Attainment in Trion
According to labor force statistics for Trion, 72.6% of individuals (697) out of the total population between 25 and 64 years of age (960) are in the labor force, with 4.0% or 28 of them being unemployed. The group with the highest labor force participation rate are those with the educational attainment of college / associate degree, with 79.9% or 195 individuals in the labor force. Within the labor force, individuals with less than high school education have the highest percentage of unemployment, with 7.1% or 19 of them being unemployed.
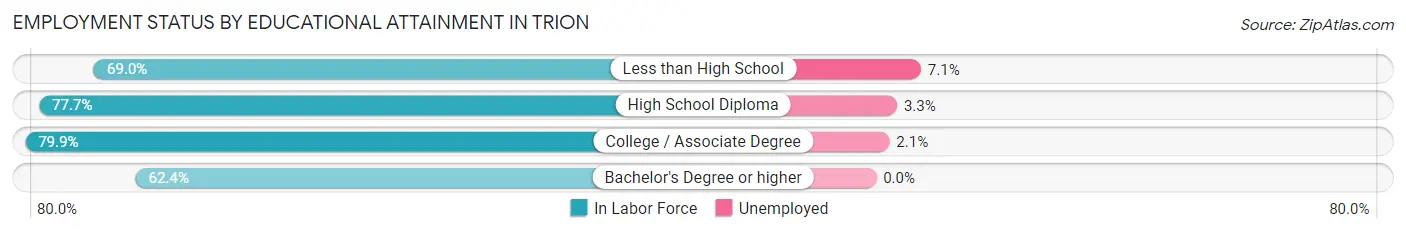
| Educational Attainment | In Labor Force | Unemployed |
| Less than High School | 269 (69.0%) | 28 (7.1%) |
| High School Diploma | 150 (77.7%) | 6 (3.3%) |
| College / Associate Degree | 195 (79.9%) | 5 (2.1%) |
| Bachelor's Degree or higher | 83 (62.4%) | 0 (0.0%) |
| Total | 697 (72.6%) | 38 (4.0%) |
Employment Occupations by Sex in Trion
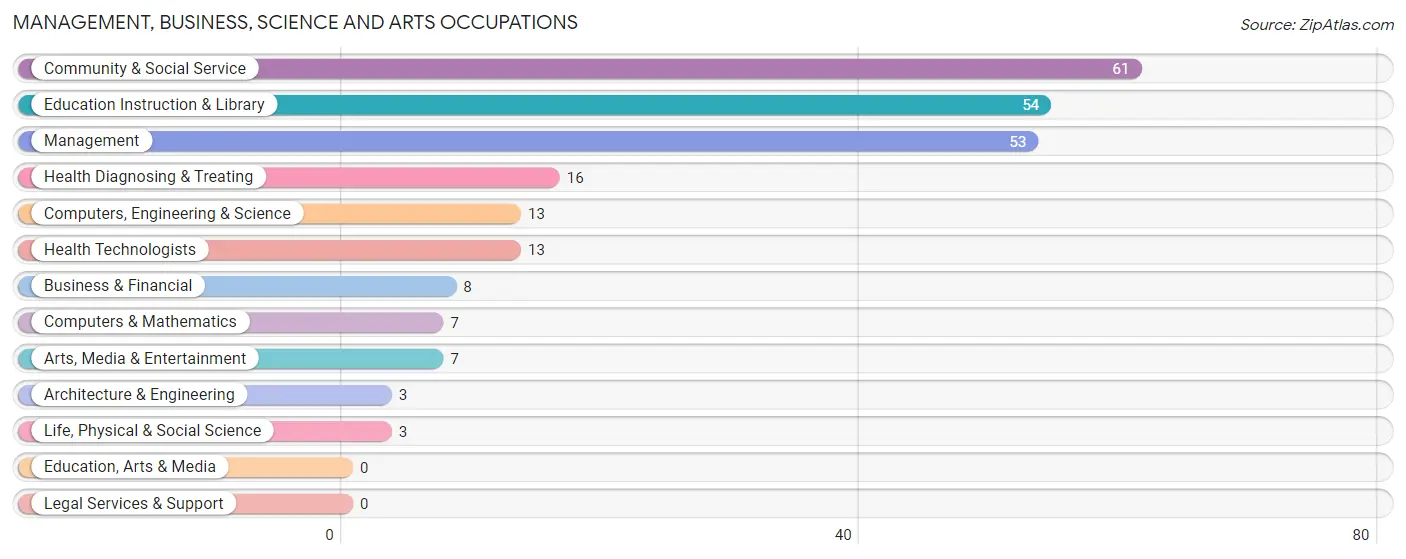
Management, Business, Science and Arts Occupations
The most common Management, Business, Science and Arts occupations in Trion are Community & Social Service (61 | 6.5%), Education Instruction & Library (54 | 5.7%), Management (53 | 5.6%), Health Diagnosing & Treating (16 | 1.7%), and Computers, Engineering & Science (13 | 1.4%).
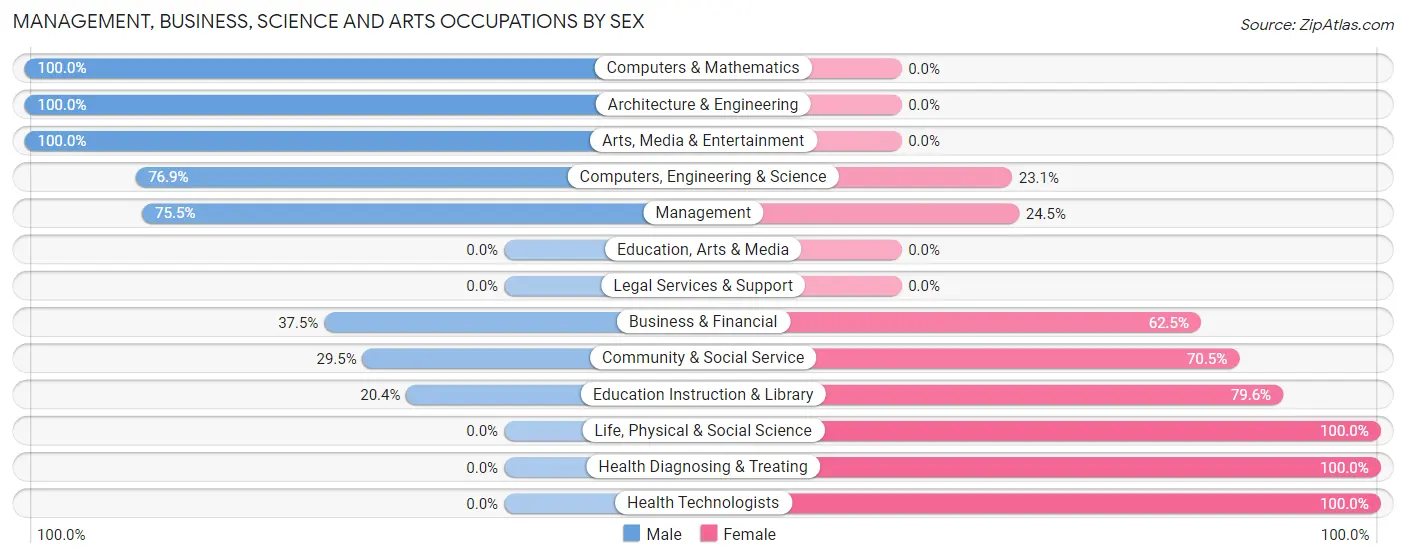
Management, Business, Science and Arts Occupations by Sex
Within the Management, Business, Science and Arts occupations in Trion, the most male-oriented occupations are Computers & Mathematics (100.0%), Architecture & Engineering (100.0%), and Arts, Media & Entertainment (100.0%), while the most female-oriented occupations are Life, Physical & Social Science (100.0%), Health Diagnosing & Treating (100.0%), and Health Technologists (100.0%).
| Occupation | Male | Female |
| Management | 40 (75.5%) | 13 (24.5%) |
| Business & Financial | 3 (37.5%) | 5 (62.5%) |
| Computers, Engineering & Science | 10 (76.9%) | 3 (23.1%) |
| Computers & Mathematics | 7 (100.0%) | 0 (0.0%) |
| Architecture & Engineering | 3 (100.0%) | 0 (0.0%) |
| Life, Physical & Social Science | 0 (0.0%) | 3 (100.0%) |
| Community & Social Service | 18 (29.5%) | 43 (70.5%) |
| Education, Arts & Media | 0 (0.0%) | 0 (0.0%) |
| Legal Services & Support | 0 (0.0%) | 0 (0.0%) |
| Education Instruction & Library | 11 (20.4%) | 43 (79.6%) |
| Arts, Media & Entertainment | 7 (100.0%) | 0 (0.0%) |
| Health Diagnosing & Treating | 0 (0.0%) | 16 (100.0%) |
| Health Technologists | 0 (0.0%) | 13 (100.0%) |
| Total (Category) | 71 (47.0%) | 80 (53.0%) |
| Total (Overall) | 559 (59.4%) | 382 (40.6%) |
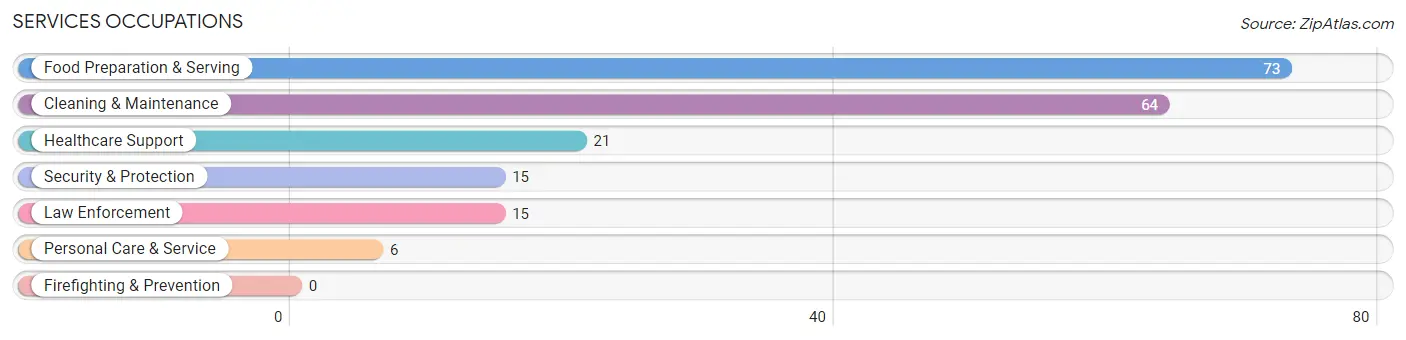
Services Occupations
The most common Services occupations in Trion are Food Preparation & Serving (73 | 7.8%), Cleaning & Maintenance (64 | 6.8%), Healthcare Support (21 | 2.2%), Security & Protection (15 | 1.6%), and Law Enforcement (15 | 1.6%).
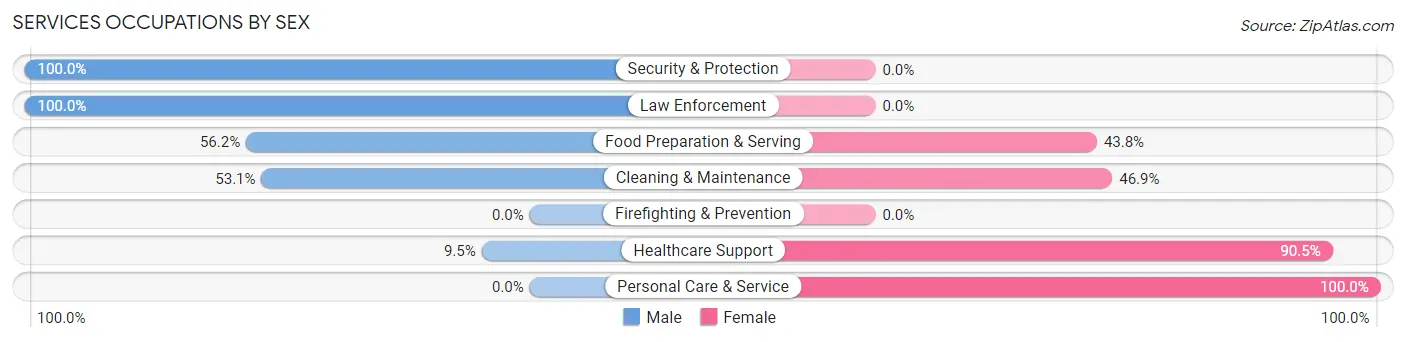
Services Occupations by Sex
Within the Services occupations in Trion, the most male-oriented occupations are Security & Protection (100.0%), Law Enforcement (100.0%), and Food Preparation & Serving (56.2%), while the most female-oriented occupations are Personal Care & Service (100.0%), Healthcare Support (90.5%), and Cleaning & Maintenance (46.9%).
| Occupation | Male | Female |
| Healthcare Support | 2 (9.5%) | 19 (90.5%) |
| Security & Protection | 15 (100.0%) | 0 (0.0%) |
| Firefighting & Prevention | 0 (0.0%) | 0 (0.0%) |
| Law Enforcement | 15 (100.0%) | 0 (0.0%) |
| Food Preparation & Serving | 41 (56.2%) | 32 (43.8%) |
| Cleaning & Maintenance | 34 (53.1%) | 30 (46.9%) |
| Personal Care & Service | 0 (0.0%) | 6 (100.0%) |
| Total (Category) | 92 (51.4%) | 87 (48.6%) |
| Total (Overall) | 559 (59.4%) | 382 (40.6%) |
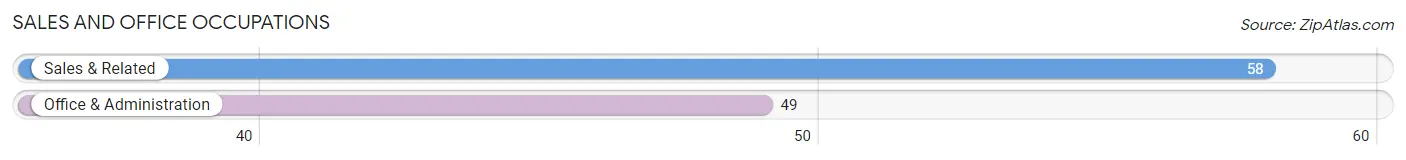
Sales and Office Occupations
The most common Sales and Office occupations in Trion are Sales & Related (58 | 6.2%), and Office & Administration (49 | 5.2%).
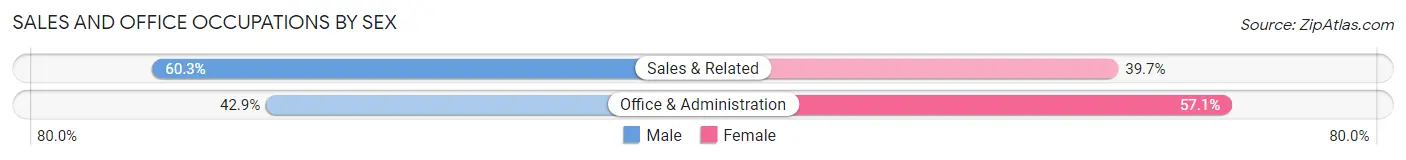
Sales and Office Occupations by Sex
| Occupation | Male | Female |
| Sales & Related | 35 (60.3%) | 23 (39.7%) |
| Office & Administration | 21 (42.9%) | 28 (57.1%) |
| Total (Category) | 56 (52.3%) | 51 (47.7%) |
| Total (Overall) | 559 (59.4%) | 382 (40.6%) |
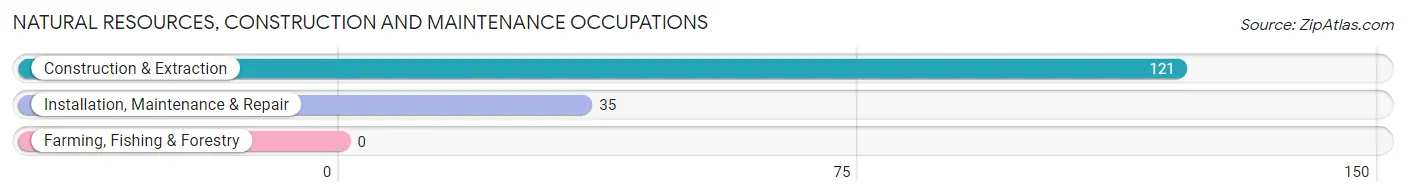
Natural Resources, Construction and Maintenance Occupations
The most common Natural Resources, Construction and Maintenance occupations in Trion are Construction & Extraction (121 | 12.9%), and Installation, Maintenance & Repair (35 | 3.7%).
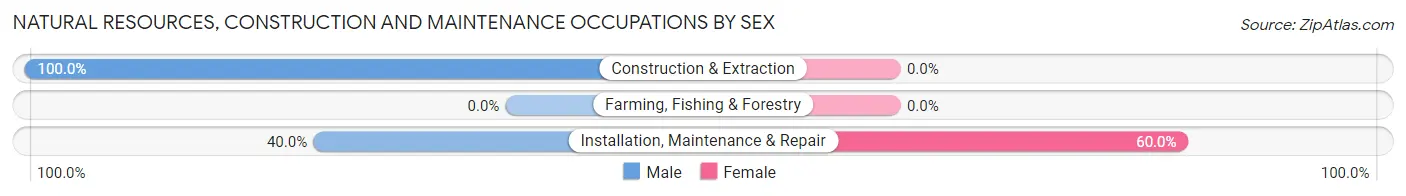
Natural Resources, Construction and Maintenance Occupations by Sex
| Occupation | Male | Female |
| Farming, Fishing & Forestry | 0 (0.0%) | 0 (0.0%) |
| Construction & Extraction | 121 (100.0%) | 0 (0.0%) |
| Installation, Maintenance & Repair | 14 (40.0%) | 21 (60.0%) |
| Total (Category) | 135 (86.5%) | 21 (13.5%) |
| Total (Overall) | 559 (59.4%) | 382 (40.6%) |
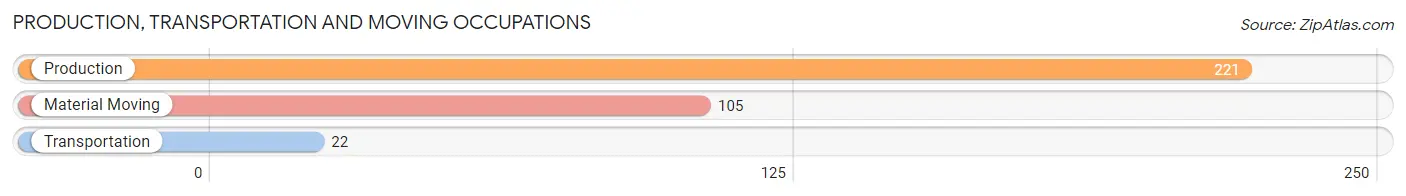
Production, Transportation and Moving Occupations
The most common Production, Transportation and Moving occupations in Trion are Production (221 | 23.5%), Material Moving (105 | 11.2%), and Transportation (22 | 2.3%).
Production, Transportation and Moving Occupations by Sex
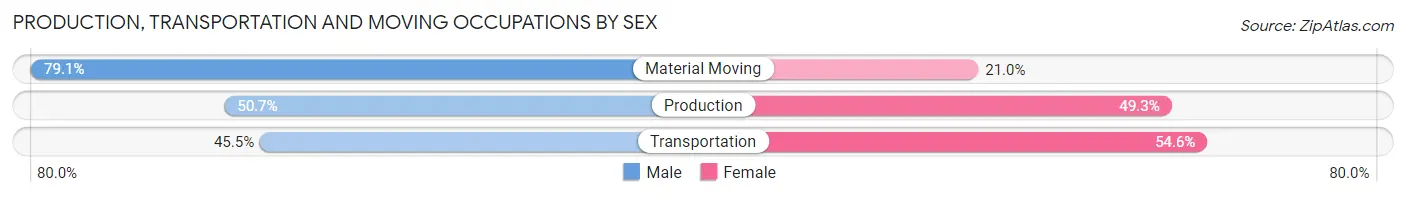
| Occupation | Male | Female |
| Production | 112 (50.7%) | 109 (49.3%) |
| Transportation | 10 (45.5%) | 12 (54.5%) |
| Material Moving | 83 (79.0%) | 22 (20.9%) |
| Total (Category) | 205 (58.9%) | 143 (41.1%) |
| Total (Overall) | 559 (59.4%) | 382 (40.6%) |
Employment Industries by Sex in Trion
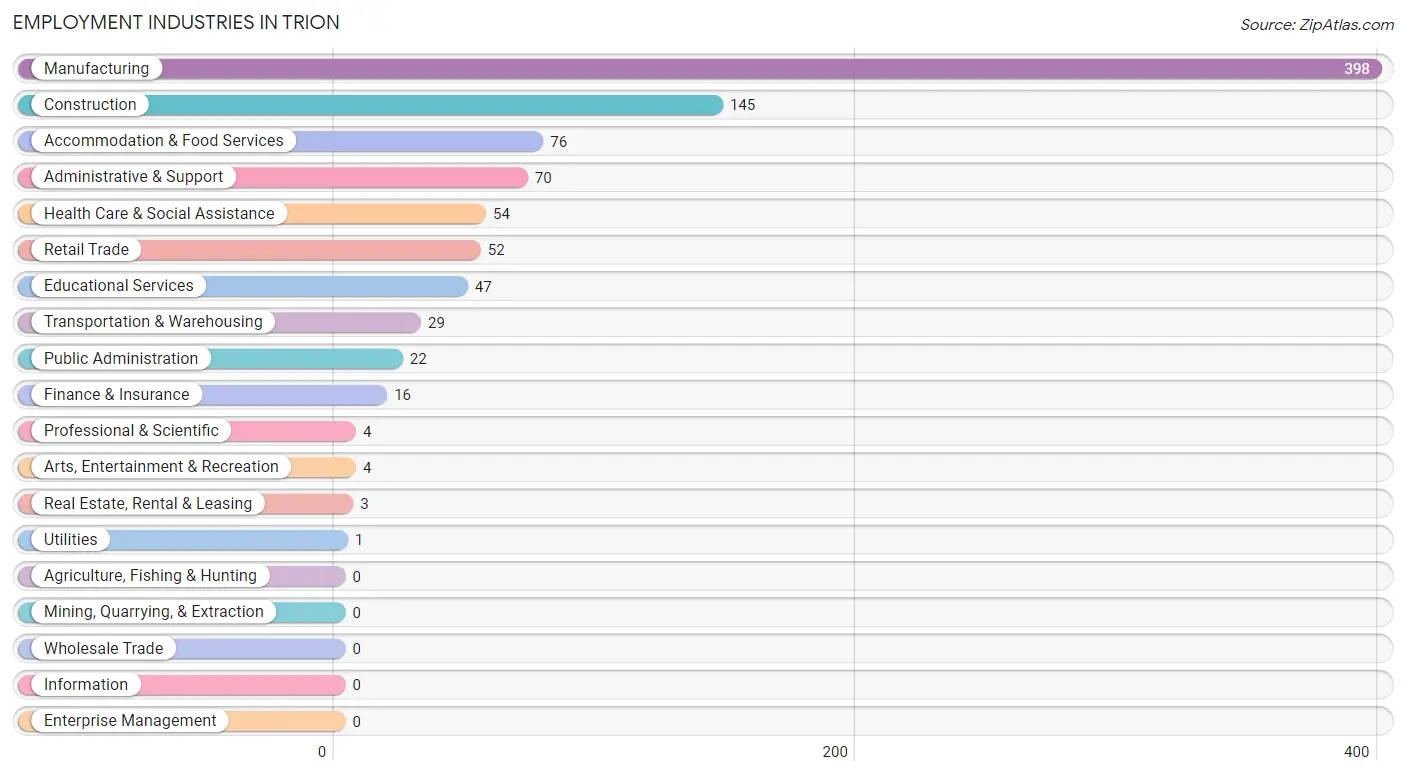
Employment Industries in Trion
The major employment industries in Trion include Manufacturing (398 | 42.3%), Construction (145 | 15.4%), Accommodation & Food Services (76 | 8.1%), Administrative & Support (70 | 7.4%), and Health Care & Social Assistance (54 | 5.7%).
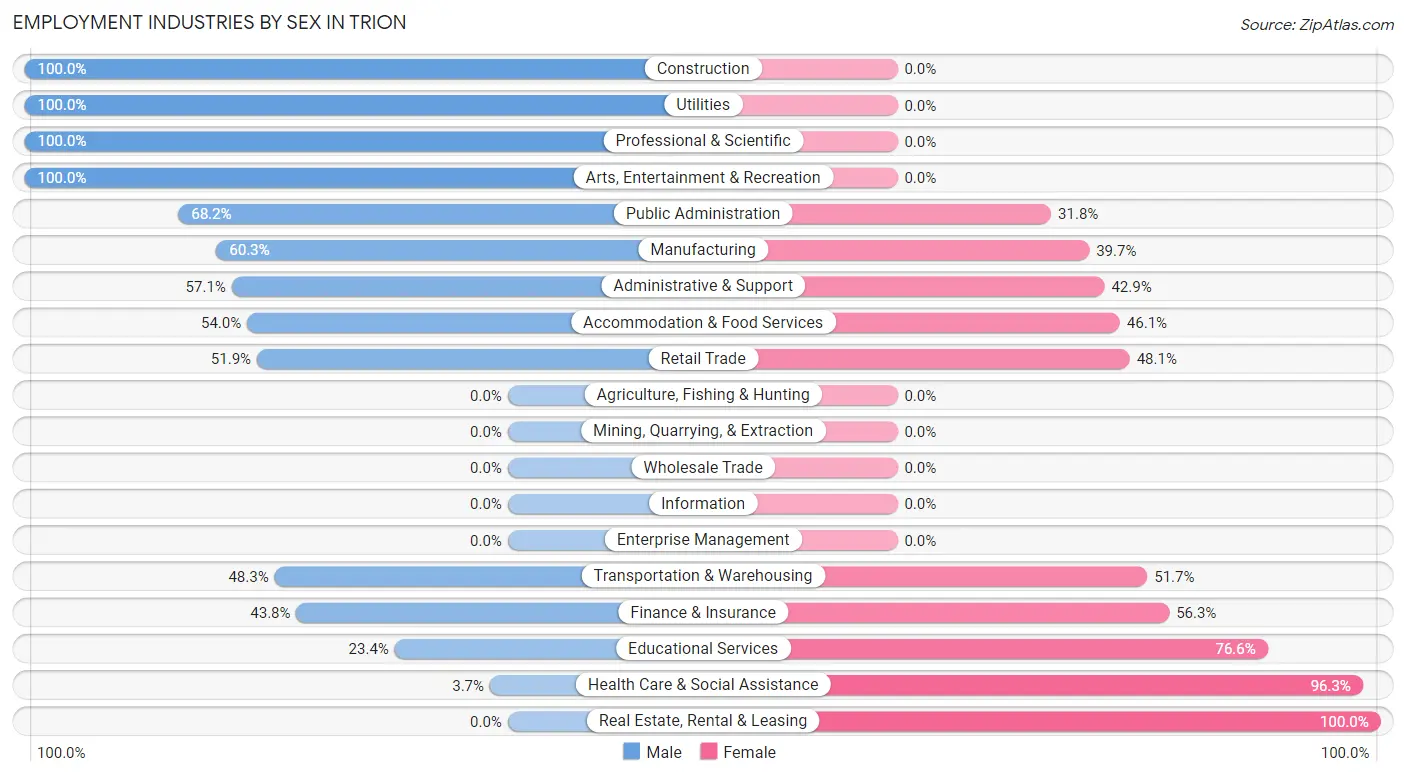
Employment Industries by Sex in Trion
The Trion industries that see more men than women are Construction (100.0%), Utilities (100.0%), and Professional & Scientific (100.0%), whereas the industries that tend to have a higher number of women are Real Estate, Rental & Leasing (100.0%), Health Care & Social Assistance (96.3%), and Educational Services (76.6%).
| Industry | Male | Female |
| Agriculture, Fishing & Hunting | 0 (0.0%) | 0 (0.0%) |
| Mining, Quarrying, & Extraction | 0 (0.0%) | 0 (0.0%) |
| Construction | 145 (100.0%) | 0 (0.0%) |
| Manufacturing | 240 (60.3%) | 158 (39.7%) |
| Wholesale Trade | 0 (0.0%) | 0 (0.0%) |
| Retail Trade | 27 (51.9%) | 25 (48.1%) |
| Transportation & Warehousing | 14 (48.3%) | 15 (51.7%) |
| Utilities | 1 (100.0%) | 0 (0.0%) |
| Information | 0 (0.0%) | 0 (0.0%) |
| Finance & Insurance | 7 (43.8%) | 9 (56.2%) |
| Real Estate, Rental & Leasing | 0 (0.0%) | 3 (100.0%) |
| Professional & Scientific | 4 (100.0%) | 0 (0.0%) |
| Enterprise Management | 0 (0.0%) | 0 (0.0%) |
| Administrative & Support | 40 (57.1%) | 30 (42.9%) |
| Educational Services | 11 (23.4%) | 36 (76.6%) |
| Health Care & Social Assistance | 2 (3.7%) | 52 (96.3%) |
| Arts, Entertainment & Recreation | 4 (100.0%) | 0 (0.0%) |
| Accommodation & Food Services | 41 (53.9%) | 35 (46.1%) |
| Public Administration | 15 (68.2%) | 7 (31.8%) |
| Total | 559 (59.4%) | 382 (40.6%) |
Education in Trion
School Enrollment in Trion
The most common levels of schooling among the 762 students in Trion are elementary school (190 | 24.9%), high school (188 | 24.7%), and middle school (138 | 18.1%).
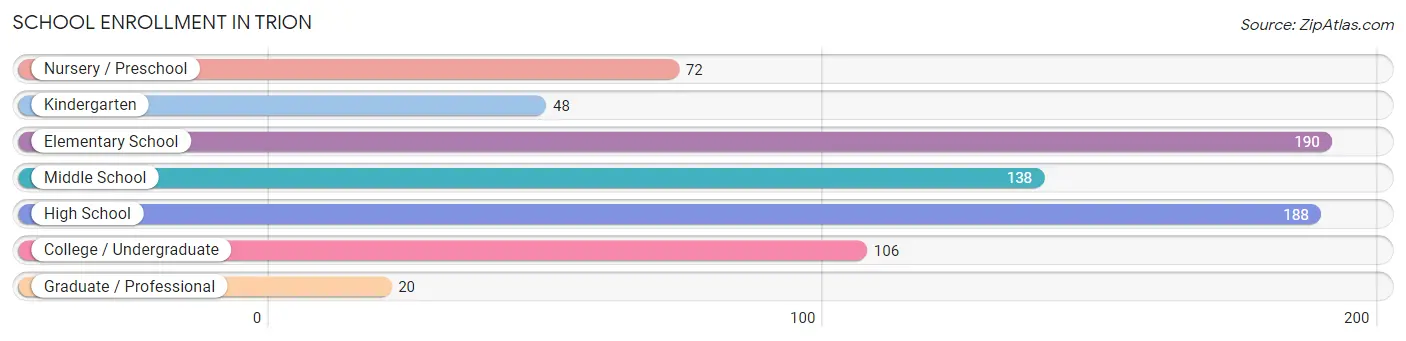
| School Level | # Students | % Students |
| Nursery / Preschool | 72 | 9.5% |
| Kindergarten | 48 | 6.3% |
| Elementary School | 190 | 24.9% |
| Middle School | 138 | 18.1% |
| High School | 188 | 24.7% |
| College / Undergraduate | 106 | 13.9% |
| Graduate / Professional | 20 | 2.6% |
| Total | 762 | 100.0% |
School Enrollment by Age by Funding Source in Trion
Out of a total of 762 students who are enrolled in schools in Trion, 62 (8.1%) attend a private institution, while the remaining 700 (91.9%) are enrolled in public schools. The age group of 25 to 34 year olds has the highest likelihood of being enrolled in private schools, with 14 (100.0% in the age bracket) enrolled. Conversely, the age group of 3 to 4 year olds has the lowest likelihood of being enrolled in a private school, with 10 (100.0% in the age bracket) attending a public institution.
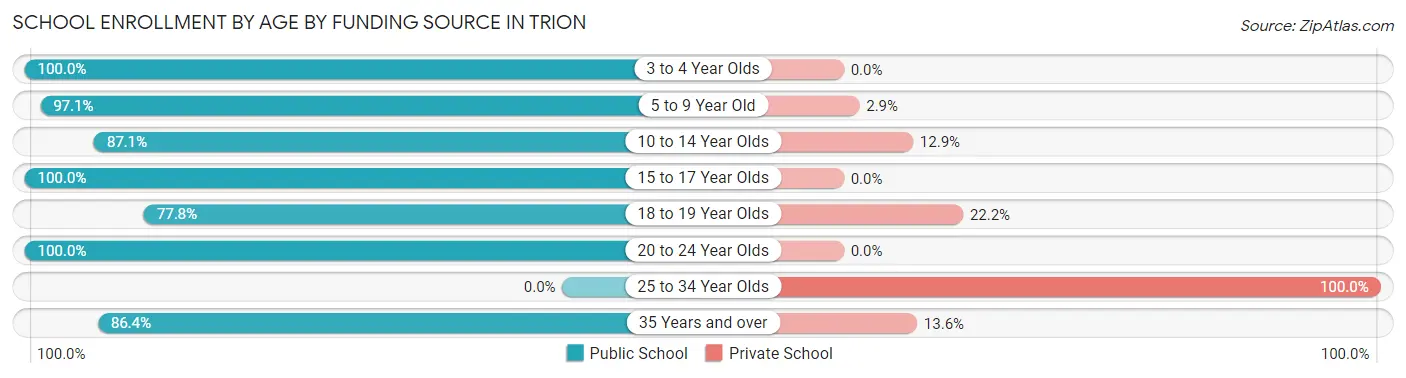
| Age Bracket | Public School | Private School |
| 3 to 4 Year Olds | 10 (100.0%) | 0 (0.0%) |
| 5 to 9 Year Old | 267 (97.1%) | 8 (2.9%) |
| 10 to 14 Year Olds | 162 (87.1%) | 24 (12.9%) |
| 15 to 17 Year Olds | 136 (100.0%) | 0 (0.0%) |
| 18 to 19 Year Olds | 35 (77.8%) | 10 (22.2%) |
| 20 to 24 Year Olds | 52 (100.0%) | 0 (0.0%) |
| 25 to 34 Year Olds | 0 (0.0%) | 14 (100.0%) |
| 35 Years and over | 38 (86.4%) | 6 (13.6%) |
| Total | 700 (91.9%) | 62 (8.1%) |
Educational Attainment by Field of Study in Trion
Education (58 | 28.0%), literature & languages (58 | 28.0%), business (56 | 27.1%), multidisciplinary studies (9 | 4.3%), and science & technology (8 | 3.9%) are the most common fields of study among 207 individuals in Trion who have obtained a bachelor's degree or higher.
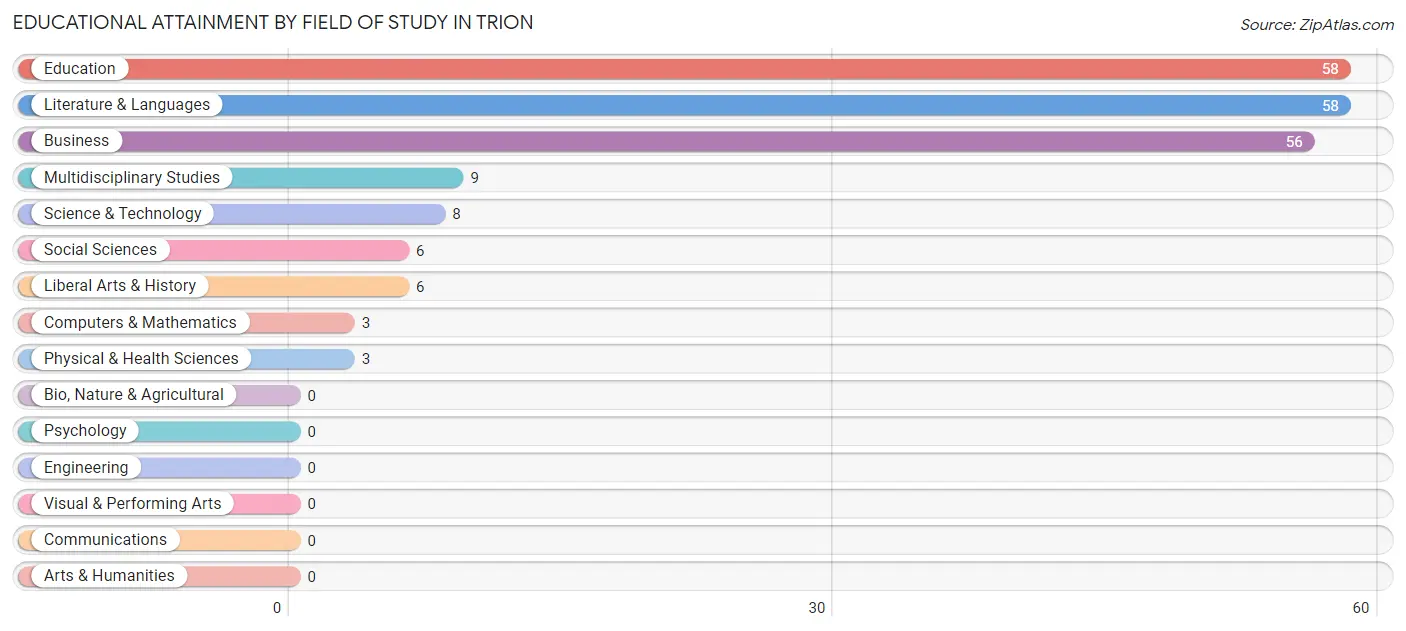
| Field of Study | # Graduates | % Graduates |
| Computers & Mathematics | 3 | 1.5% |
| Bio, Nature & Agricultural | 0 | 0.0% |
| Physical & Health Sciences | 3 | 1.5% |
| Psychology | 0 | 0.0% |
| Social Sciences | 6 | 2.9% |
| Engineering | 0 | 0.0% |
| Multidisciplinary Studies | 9 | 4.3% |
| Science & Technology | 8 | 3.9% |
| Business | 56 | 27.1% |
| Education | 58 | 28.0% |
| Literature & Languages | 58 | 28.0% |
| Liberal Arts & History | 6 | 2.9% |
| Visual & Performing Arts | 0 | 0.0% |
| Communications | 0 | 0.0% |
| Arts & Humanities | 0 | 0.0% |
| Total | 207 | 100.0% |
Transportation & Commute in Trion
Vehicle Availability by Sex in Trion
The most prevalent vehicle ownership categories in Trion are males with 2 vehicles (192, accounting for 36.9%) and females with 2 vehicles (138, making up 51.1%).
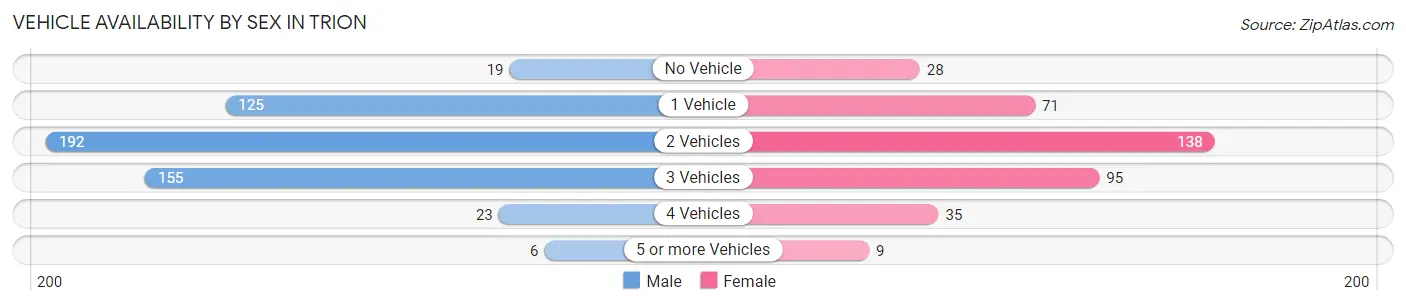
| Vehicles Available | Male | Female |
| No Vehicle | 19 (3.6%) | 28 (7.4%) |
| 1 Vehicle | 125 (24.0%) | 71 (18.9%) |
| 2 Vehicles | 192 (36.9%) | 138 (36.7%) |
| 3 Vehicles | 155 (29.8%) | 95 (25.3%) |
| 4 Vehicles | 23 (4.4%) | 35 (9.3%) |
| 5 or more Vehicles | 6 (1.1%) | 9 (2.4%) |
| Total | 520 (100.0%) | 376 (100.0%) |
Commute Time in Trion
The most frequently occuring commute durations in Trion are 20 to 24 minutes (220 commuters, 24.9%), 15 to 19 minutes (120 commuters, 13.6%), and 5 to 9 minutes (116 commuters, 13.1%).
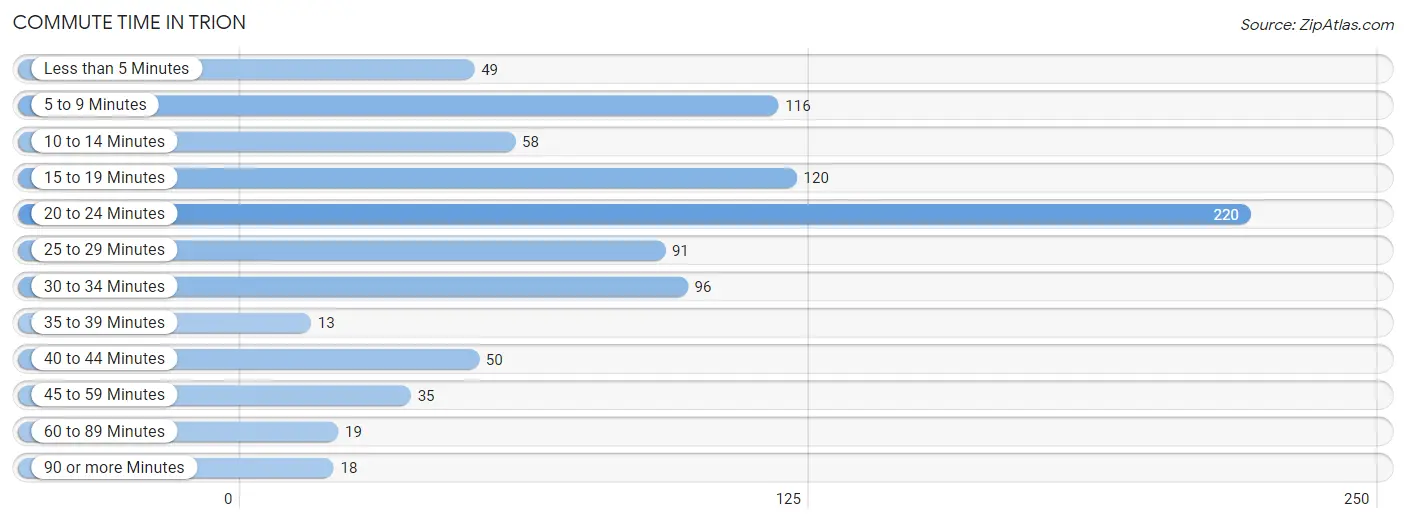
| Commute Time | # Commuters | % Commuters |
| Less than 5 Minutes | 49 | 5.5% |
| 5 to 9 Minutes | 116 | 13.1% |
| 10 to 14 Minutes | 58 | 6.6% |
| 15 to 19 Minutes | 120 | 13.6% |
| 20 to 24 Minutes | 220 | 24.9% |
| 25 to 29 Minutes | 91 | 10.3% |
| 30 to 34 Minutes | 96 | 10.8% |
| 35 to 39 Minutes | 13 | 1.5% |
| 40 to 44 Minutes | 50 | 5.7% |
| 45 to 59 Minutes | 35 | 4.0% |
| 60 to 89 Minutes | 19 | 2.1% |
| 90 or more Minutes | 18 | 2.0% |
Commute Time by Sex in Trion
The most common commute times in Trion are 20 to 24 minutes (147 commuters, 28.4%) for males and 20 to 24 minutes (73 commuters, 19.8%) for females.
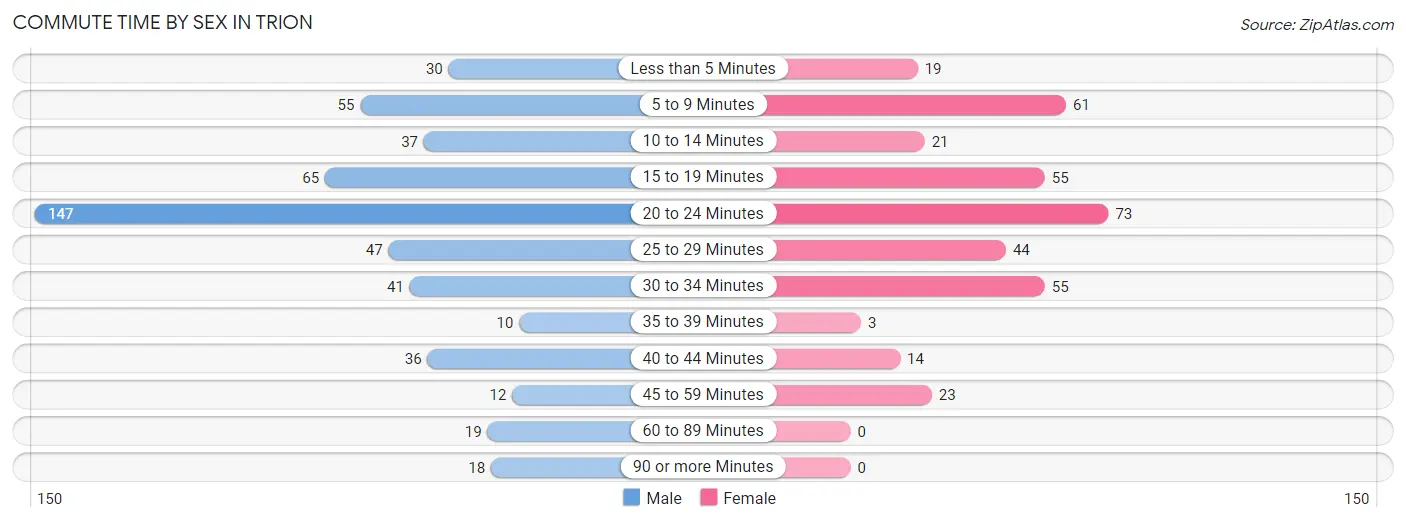
| Commute Time | Male | Female |
| Less than 5 Minutes | 30 (5.8%) | 19 (5.2%) |
| 5 to 9 Minutes | 55 (10.6%) | 61 (16.6%) |
| 10 to 14 Minutes | 37 (7.2%) | 21 (5.7%) |
| 15 to 19 Minutes | 65 (12.6%) | 55 (14.9%) |
| 20 to 24 Minutes | 147 (28.4%) | 73 (19.8%) |
| 25 to 29 Minutes | 47 (9.1%) | 44 (12.0%) |
| 30 to 34 Minutes | 41 (7.9%) | 55 (14.9%) |
| 35 to 39 Minutes | 10 (1.9%) | 3 (0.8%) |
| 40 to 44 Minutes | 36 (7.0%) | 14 (3.8%) |
| 45 to 59 Minutes | 12 (2.3%) | 23 (6.2%) |
| 60 to 89 Minutes | 19 (3.7%) | 0 (0.0%) |
| 90 or more Minutes | 18 (3.5%) | 0 (0.0%) |
Time of Departure to Work by Sex in Trion
The most frequent times of departure to work in Trion are 7:00 AM to 7:29 AM (112, 21.7%) for males and 7:00 AM to 7:29 AM (119, 32.3%) for females.
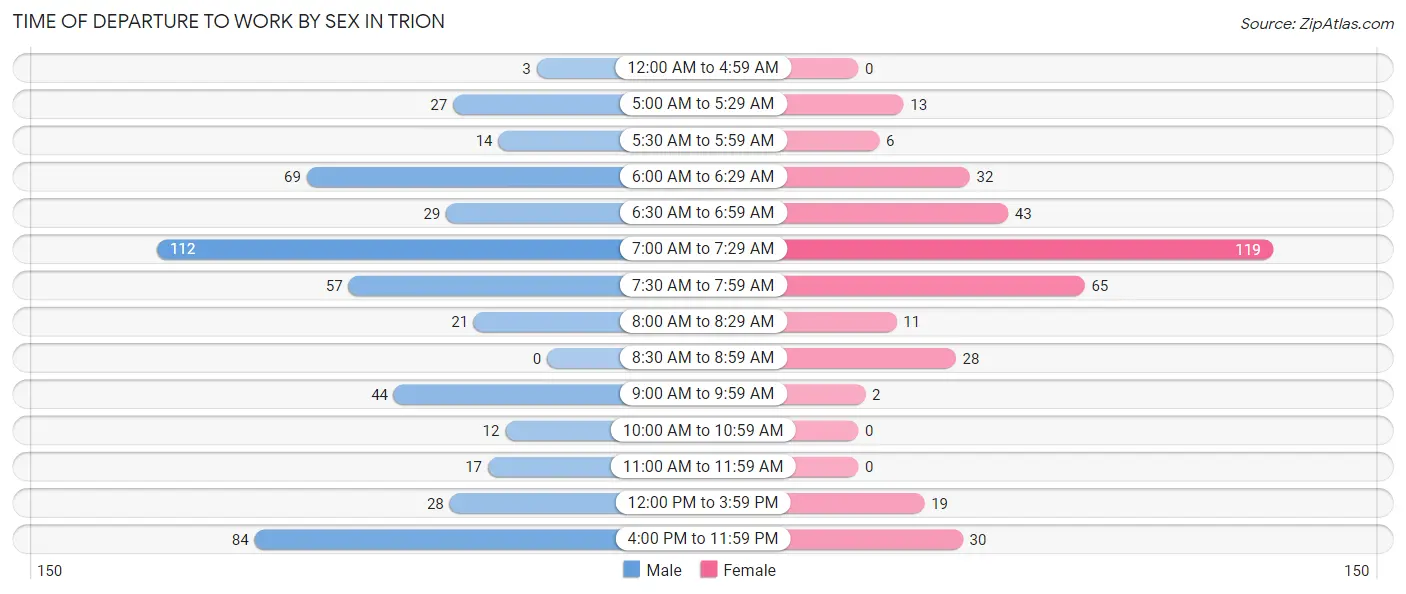
| Time of Departure | Male | Female |
| 12:00 AM to 4:59 AM | 3 (0.6%) | 0 (0.0%) |
| 5:00 AM to 5:29 AM | 27 (5.2%) | 13 (3.5%) |
| 5:30 AM to 5:59 AM | 14 (2.7%) | 6 (1.6%) |
| 6:00 AM to 6:29 AM | 69 (13.4%) | 32 (8.7%) |
| 6:30 AM to 6:59 AM | 29 (5.6%) | 43 (11.7%) |
| 7:00 AM to 7:29 AM | 112 (21.7%) | 119 (32.3%) |
| 7:30 AM to 7:59 AM | 57 (11.0%) | 65 (17.7%) |
| 8:00 AM to 8:29 AM | 21 (4.1%) | 11 (3.0%) |
| 8:30 AM to 8:59 AM | 0 (0.0%) | 28 (7.6%) |
| 9:00 AM to 9:59 AM | 44 (8.5%) | 2 (0.5%) |
| 10:00 AM to 10:59 AM | 12 (2.3%) | 0 (0.0%) |
| 11:00 AM to 11:59 AM | 17 (3.3%) | 0 (0.0%) |
| 12:00 PM to 3:59 PM | 28 (5.4%) | 19 (5.2%) |
| 4:00 PM to 11:59 PM | 84 (16.3%) | 30 (8.2%) |
| Total | 517 (100.0%) | 368 (100.0%) |
Housing Occupancy in Trion
Occupancy by Ownership in Trion
Of the total 731 dwellings in Trion, owner-occupied units account for 417 (57.1%), while renter-occupied units make up 314 (42.9%).
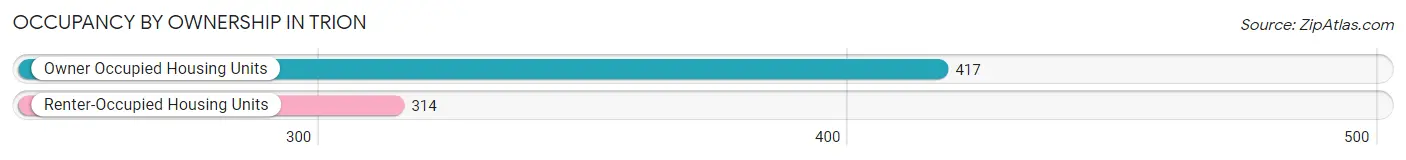
| Occupancy | # Housing Units | % Housing Units |
| Owner Occupied Housing Units | 417 | 57.1% |
| Renter-Occupied Housing Units | 314 | 42.9% |
| Total Occupied Housing Units | 731 | 100.0% |
Occupancy by Household Size in Trion
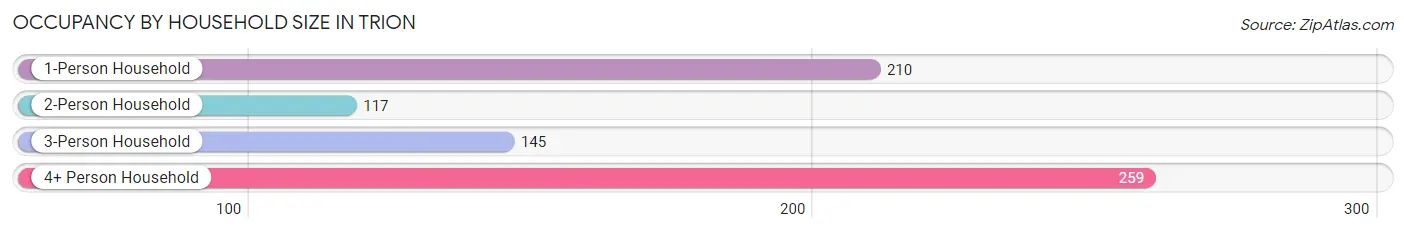
| Household Size | # Housing Units | % Housing Units |
| 1-Person Household | 210 | 28.7% |
| 2-Person Household | 117 | 16.0% |
| 3-Person Household | 145 | 19.8% |
| 4+ Person Household | 259 | 35.4% |
| Total Housing Units | 731 | 100.0% |
Occupancy by Ownership by Household Size in Trion
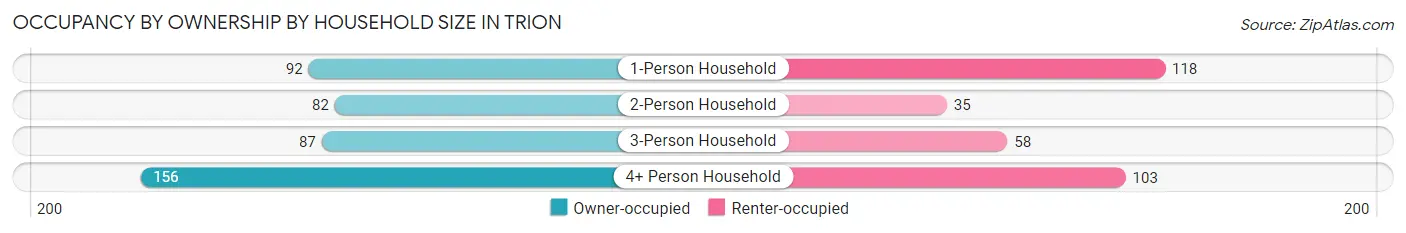
| Household Size | Owner-occupied | Renter-occupied |
| 1-Person Household | 92 (43.8%) | 118 (56.2%) |
| 2-Person Household | 82 (70.1%) | 35 (29.9%) |
| 3-Person Household | 87 (60.0%) | 58 (40.0%) |
| 4+ Person Household | 156 (60.2%) | 103 (39.8%) |
| Total Housing Units | 417 (57.1%) | 314 (42.9%) |
Occupancy by Educational Attainment in Trion
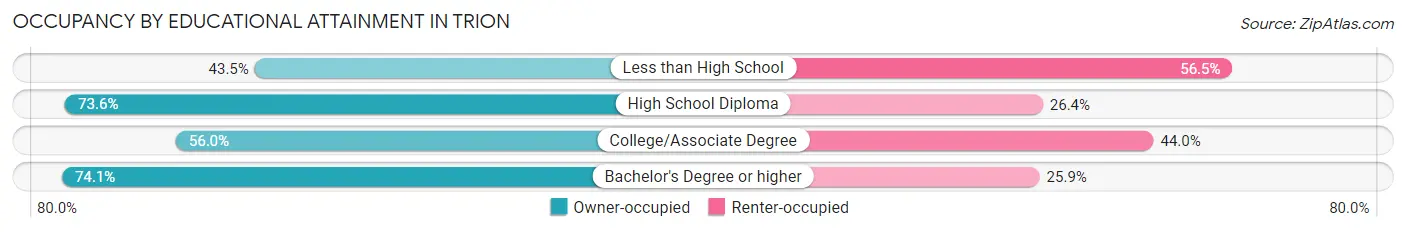
| Household Size | Owner-occupied | Renter-occupied |
| Less than High School | 131 (43.5%) | 170 (56.5%) |
| High School Diploma | 128 (73.6%) | 46 (26.4%) |
| College/Associate Degree | 98 (56.0%) | 77 (44.0%) |
| Bachelor's Degree or higher | 60 (74.1%) | 21 (25.9%) |
Occupancy by Age of Householder in Trion
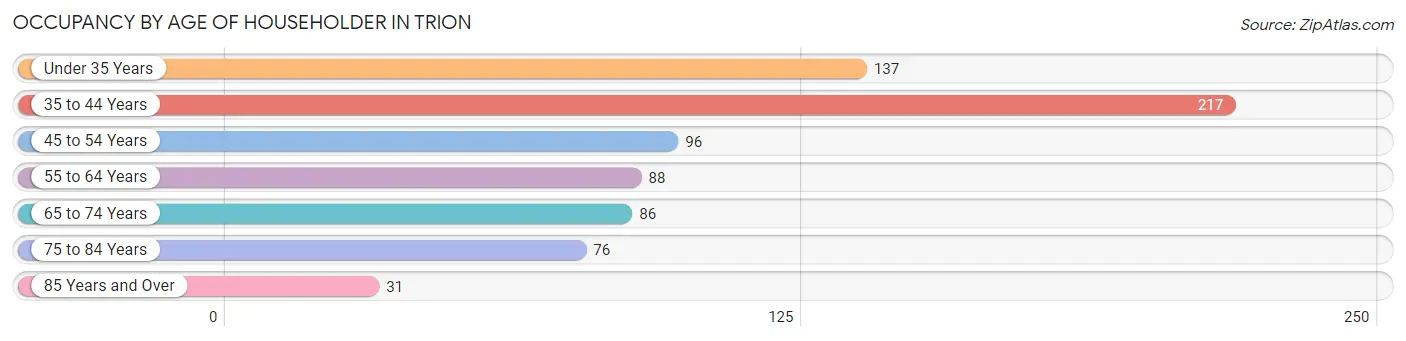
| Age Bracket | # Households | % Households |
| Under 35 Years | 137 | 18.7% |
| 35 to 44 Years | 217 | 29.7% |
| 45 to 54 Years | 96 | 13.1% |
| 55 to 64 Years | 88 | 12.0% |
| 65 to 74 Years | 86 | 11.8% |
| 75 to 84 Years | 76 | 10.4% |
| 85 Years and Over | 31 | 4.2% |
| Total | 731 | 100.0% |
Housing Finances in Trion
Median Income by Occupancy in Trion
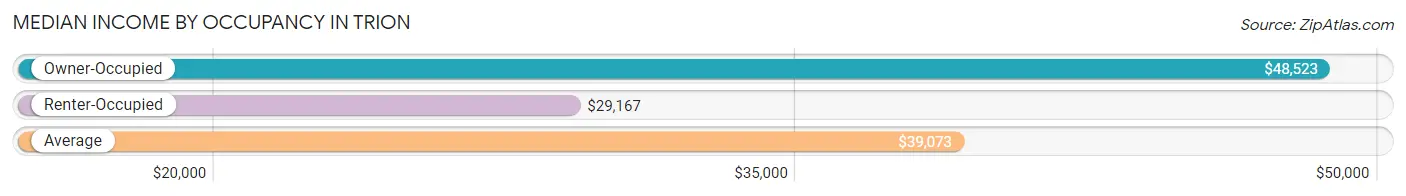
| Occupancy Type | # Households | Median Income |
| Owner-Occupied | 417 (57.1%) | $48,523 |
| Renter-Occupied | 314 (42.9%) | $29,167 |
| Average | 731 (100.0%) | $39,073 |
Occupancy by Householder Income Bracket in Trion
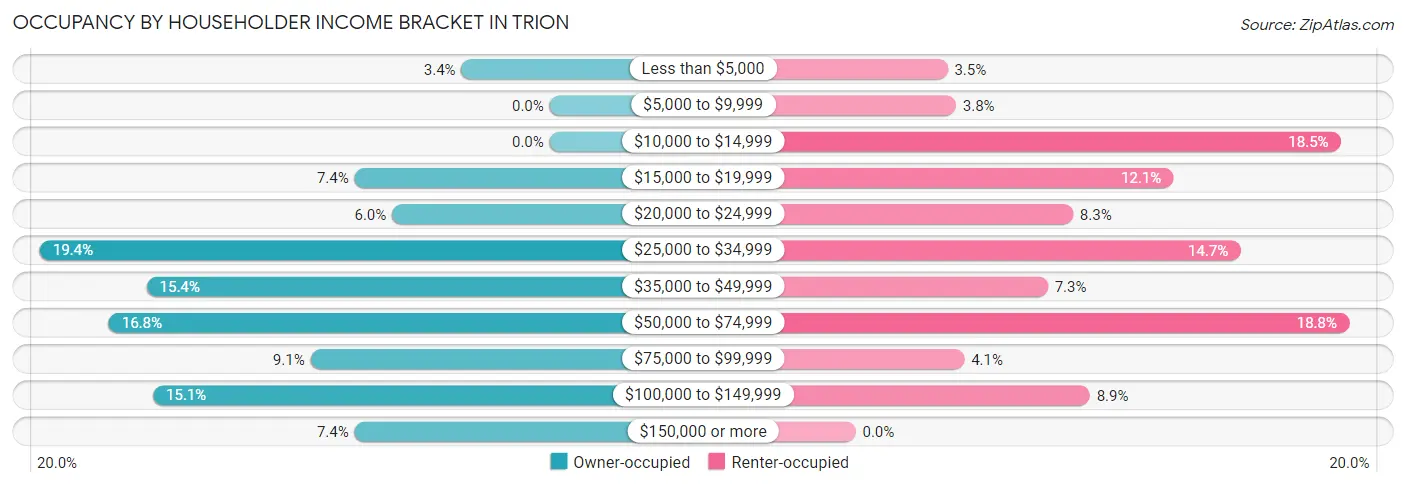
| Income Bracket | Owner-occupied | Renter-occupied |
| Less than $5,000 | 14 (3.4%) | 11 (3.5%) |
| $5,000 to $9,999 | 0 (0.0%) | 12 (3.8%) |
| $10,000 to $14,999 | 0 (0.0%) | 58 (18.5%) |
| $15,000 to $19,999 | 31 (7.4%) | 38 (12.1%) |
| $20,000 to $24,999 | 25 (6.0%) | 26 (8.3%) |
| $25,000 to $34,999 | 81 (19.4%) | 46 (14.6%) |
| $35,000 to $49,999 | 64 (15.3%) | 23 (7.3%) |
| $50,000 to $74,999 | 70 (16.8%) | 59 (18.8%) |
| $75,000 to $99,999 | 38 (9.1%) | 13 (4.1%) |
| $100,000 to $149,999 | 63 (15.1%) | 28 (8.9%) |
| $150,000 or more | 31 (7.4%) | 0 (0.0%) |
| Total | 417 (100.0%) | 314 (100.0%) |
Monthly Housing Cost Tiers in Trion
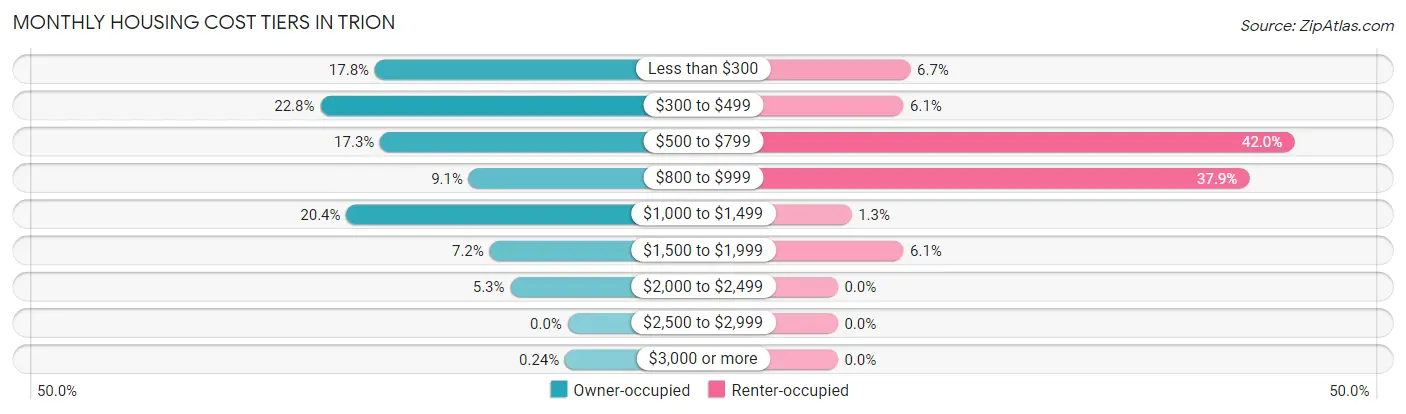
| Monthly Cost | Owner-occupied | Renter-occupied |
| Less than $300 | 74 (17.7%) | 21 (6.7%) |
| $300 to $499 | 95 (22.8%) | 19 (6.0%) |
| $500 to $799 | 72 (17.3%) | 132 (42.0%) |
| $800 to $999 | 38 (9.1%) | 119 (37.9%) |
| $1,000 to $1,499 | 85 (20.4%) | 4 (1.3%) |
| $1,500 to $1,999 | 30 (7.2%) | 19 (6.0%) |
| $2,000 to $2,499 | 22 (5.3%) | 0 (0.0%) |
| $2,500 to $2,999 | 0 (0.0%) | 0 (0.0%) |
| $3,000 or more | 1 (0.2%) | 0 (0.0%) |
| Total | 417 (100.0%) | 314 (100.0%) |
Physical Housing Characteristics in Trion
Housing Structures in Trion
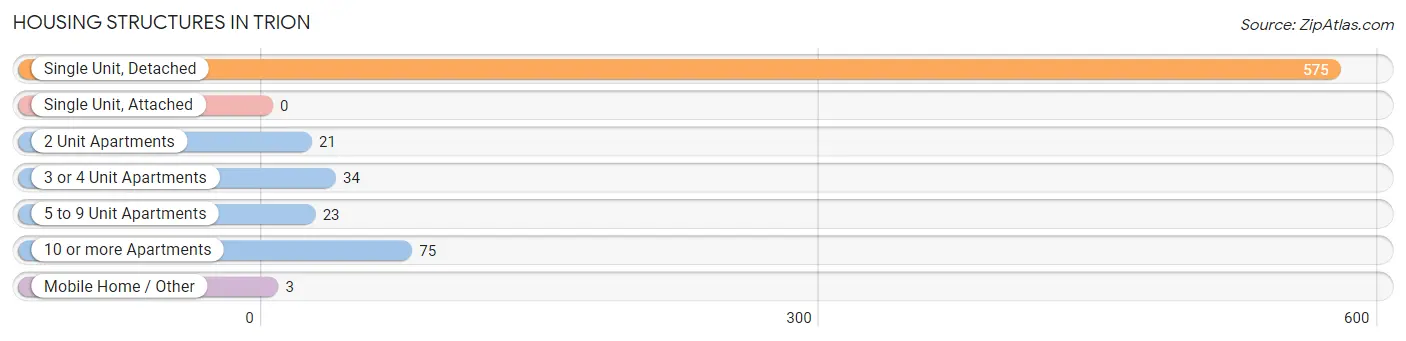
| Structure Type | # Housing Units | % Housing Units |
| Single Unit, Detached | 575 | 78.7% |
| Single Unit, Attached | 0 | 0.0% |
| 2 Unit Apartments | 21 | 2.9% |
| 3 or 4 Unit Apartments | 34 | 4.6% |
| 5 to 9 Unit Apartments | 23 | 3.2% |
| 10 or more Apartments | 75 | 10.3% |
| Mobile Home / Other | 3 | 0.4% |
| Total | 731 | 100.0% |
Housing Structures by Occupancy in Trion
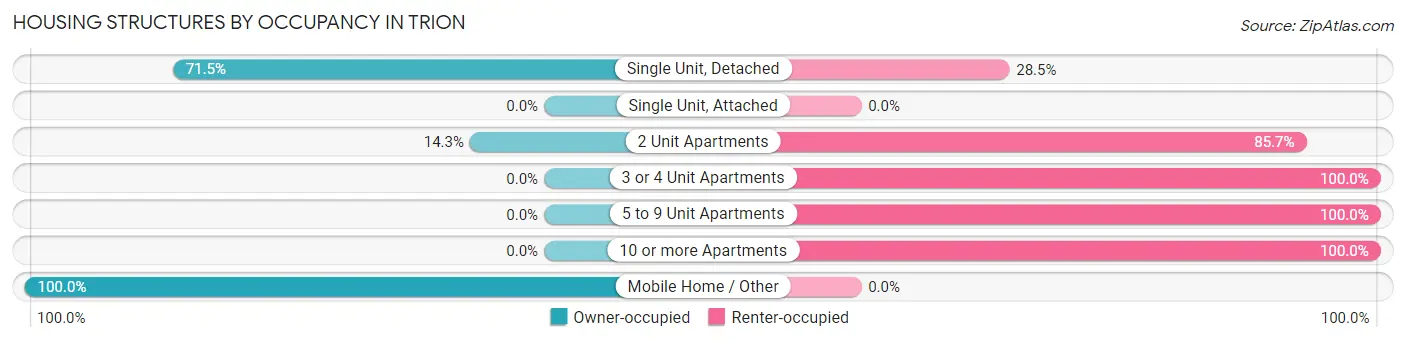
| Structure Type | Owner-occupied | Renter-occupied |
| Single Unit, Detached | 411 (71.5%) | 164 (28.5%) |
| Single Unit, Attached | 0 (0.0%) | 0 (0.0%) |
| 2 Unit Apartments | 3 (14.3%) | 18 (85.7%) |
| 3 or 4 Unit Apartments | 0 (0.0%) | 34 (100.0%) |
| 5 to 9 Unit Apartments | 0 (0.0%) | 23 (100.0%) |
| 10 or more Apartments | 0 (0.0%) | 75 (100.0%) |
| Mobile Home / Other | 3 (100.0%) | 0 (0.0%) |
| Total | 417 (57.1%) | 314 (42.9%) |
Housing Structures by Number of Rooms in Trion
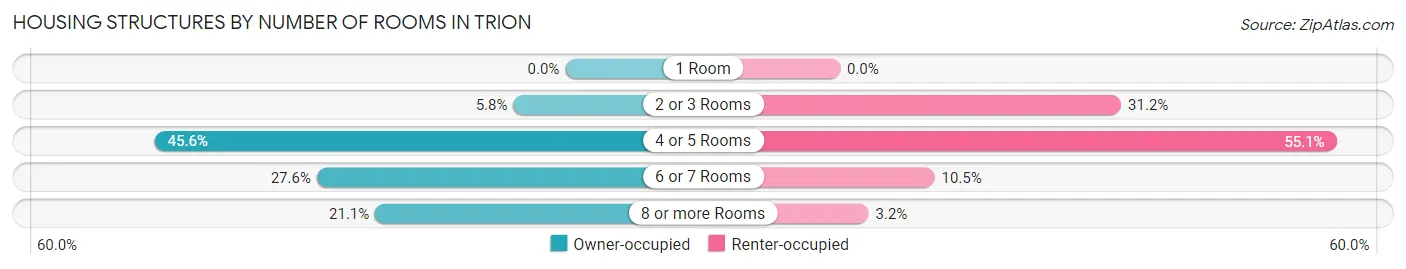
| Number of Rooms | Owner-occupied | Renter-occupied |
| 1 Room | 0 (0.0%) | 0 (0.0%) |
| 2 or 3 Rooms | 24 (5.8%) | 98 (31.2%) |
| 4 or 5 Rooms | 190 (45.6%) | 173 (55.1%) |
| 6 or 7 Rooms | 115 (27.6%) | 33 (10.5%) |
| 8 or more Rooms | 88 (21.1%) | 10 (3.2%) |
| Total | 417 (100.0%) | 314 (100.0%) |
Housing Structure by Heating Type in Trion
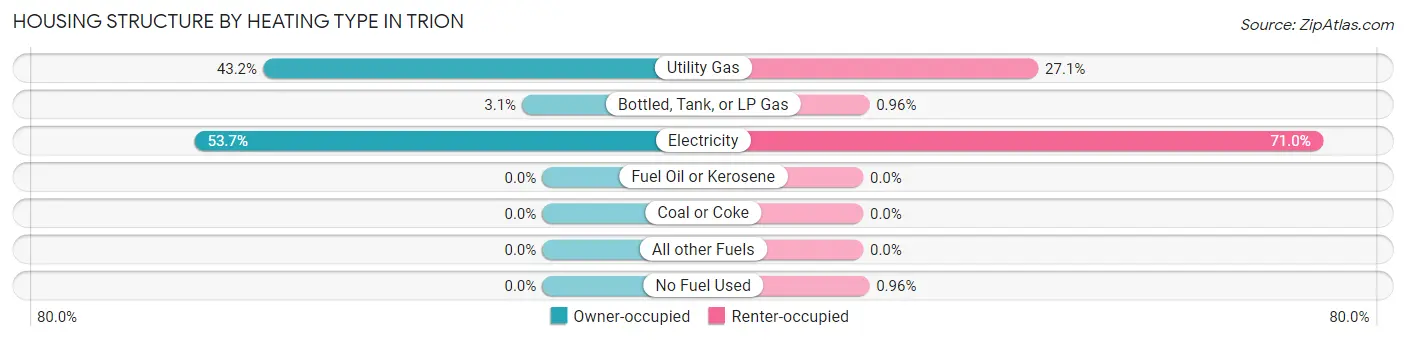
| Heating Type | Owner-occupied | Renter-occupied |
| Utility Gas | 180 (43.2%) | 85 (27.1%) |
| Bottled, Tank, or LP Gas | 13 (3.1%) | 3 (1.0%) |
| Electricity | 224 (53.7%) | 223 (71.0%) |
| Fuel Oil or Kerosene | 0 (0.0%) | 0 (0.0%) |
| Coal or Coke | 0 (0.0%) | 0 (0.0%) |
| All other Fuels | 0 (0.0%) | 0 (0.0%) |
| No Fuel Used | 0 (0.0%) | 3 (1.0%) |
| Total | 417 (100.0%) | 314 (100.0%) |
Household Vehicle Usage in Trion
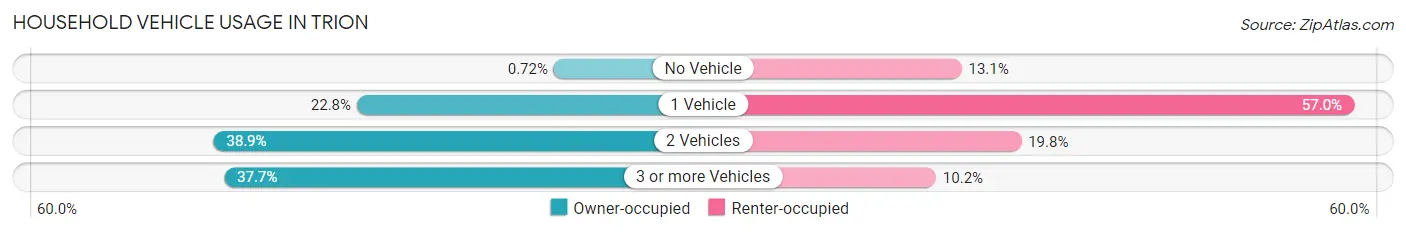
| Vehicles per Household | Owner-occupied | Renter-occupied |
| No Vehicle | 3 (0.7%) | 41 (13.1%) |
| 1 Vehicle | 95 (22.8%) | 179 (57.0%) |
| 2 Vehicles | 162 (38.9%) | 62 (19.8%) |
| 3 or more Vehicles | 157 (37.7%) | 32 (10.2%) |
| Total | 417 (100.0%) | 314 (100.0%) |
Real Estate & Mortgages in Trion
Real Estate and Mortgage Overview in Trion
| Characteristic | Without Mortgage | With Mortgage |
| Housing Units | 214 | 203 |
| Median Property Value | $65,000 | $108,800 |
| Median Household Income | $33,889 | $20 |
| Monthly Housing Costs | $368 | $1 |
| Real Estate Taxes | $541 | $0 |
Property Value by Mortgage Status in Trion
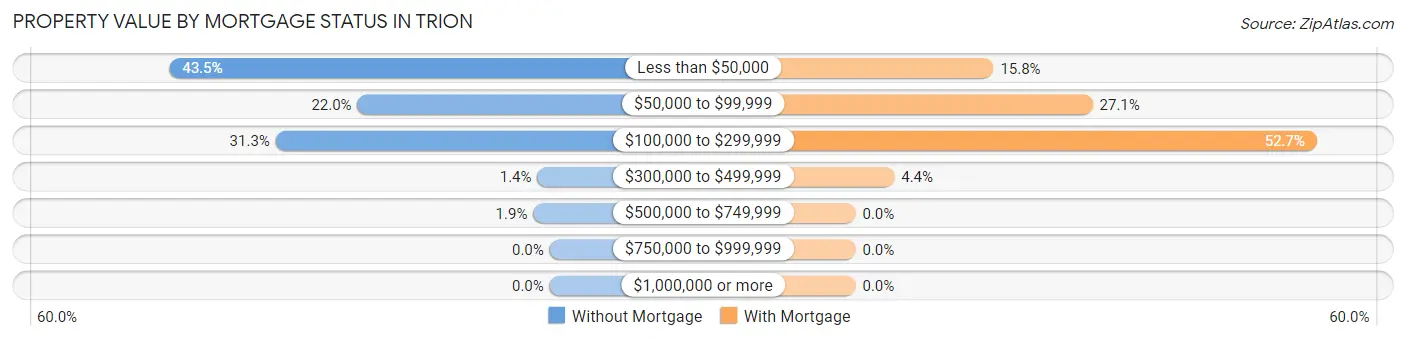
| Property Value | Without Mortgage | With Mortgage |
| Less than $50,000 | 93 (43.5%) | 32 (15.8%) |
| $50,000 to $99,999 | 47 (22.0%) | 55 (27.1%) |
| $100,000 to $299,999 | 67 (31.3%) | 107 (52.7%) |
| $300,000 to $499,999 | 3 (1.4%) | 9 (4.4%) |
| $500,000 to $749,999 | 4 (1.9%) | 0 (0.0%) |
| $750,000 to $999,999 | 0 (0.0%) | 0 (0.0%) |
| $1,000,000 or more | 0 (0.0%) | 0 (0.0%) |
| Total | 214 (100.0%) | 203 (100.0%) |
Household Income by Mortgage Status in Trion
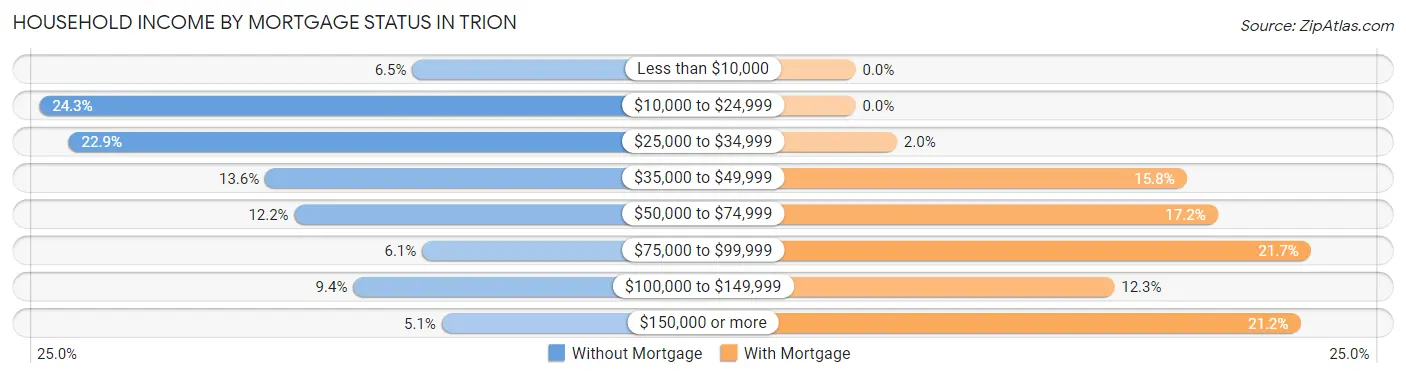
| Household Income | Without Mortgage | With Mortgage |
| Less than $10,000 | 14 (6.5%) | 0 (0.0%) |
| $10,000 to $24,999 | 52 (24.3%) | 0 (0.0%) |
| $25,000 to $34,999 | 49 (22.9%) | 4 (2.0%) |
| $35,000 to $49,999 | 29 (13.6%) | 32 (15.8%) |
| $50,000 to $74,999 | 26 (12.1%) | 35 (17.2%) |
| $75,000 to $99,999 | 13 (6.1%) | 44 (21.7%) |
| $100,000 to $149,999 | 20 (9.3%) | 25 (12.3%) |
| $150,000 or more | 11 (5.1%) | 43 (21.2%) |
| Total | 214 (100.0%) | 203 (100.0%) |
Property Value to Household Income Ratio in Trion
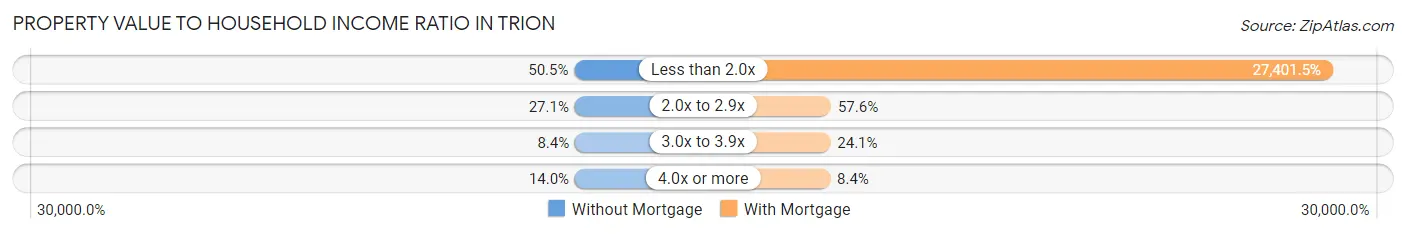
| Value-to-Income Ratio | Without Mortgage | With Mortgage |
| Less than 2.0x | 108 (50.5%) | 55,625 (27,401.5%) |
| 2.0x to 2.9x | 58 (27.1%) | 117 (57.6%) |
| 3.0x to 3.9x | 18 (8.4%) | 49 (24.1%) |
| 4.0x or more | 30 (14.0%) | 17 (8.4%) |
| Total | 214 (100.0%) | 203 (100.0%) |
Real Estate Taxes by Mortgage Status in Trion
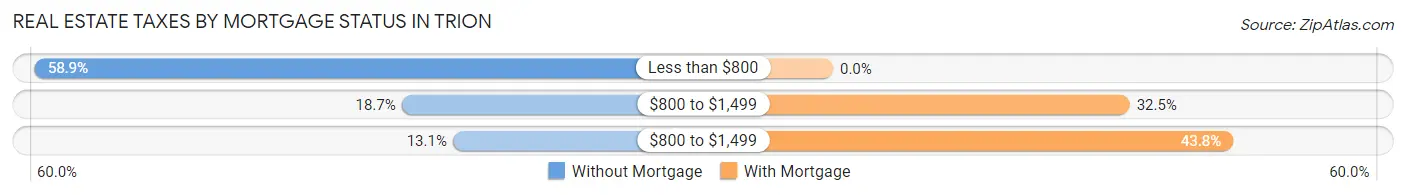
| Property Taxes | Without Mortgage | With Mortgage |
| Less than $800 | 126 (58.9%) | 0 (0.0%) |
| $800 to $1,499 | 40 (18.7%) | 66 (32.5%) |
| $800 to $1,499 | 28 (13.1%) | 89 (43.8%) |
| Total | 214 (100.0%) | 203 (100.0%) |
Health & Disability in Trion
Health Insurance Coverage by Age in Trion
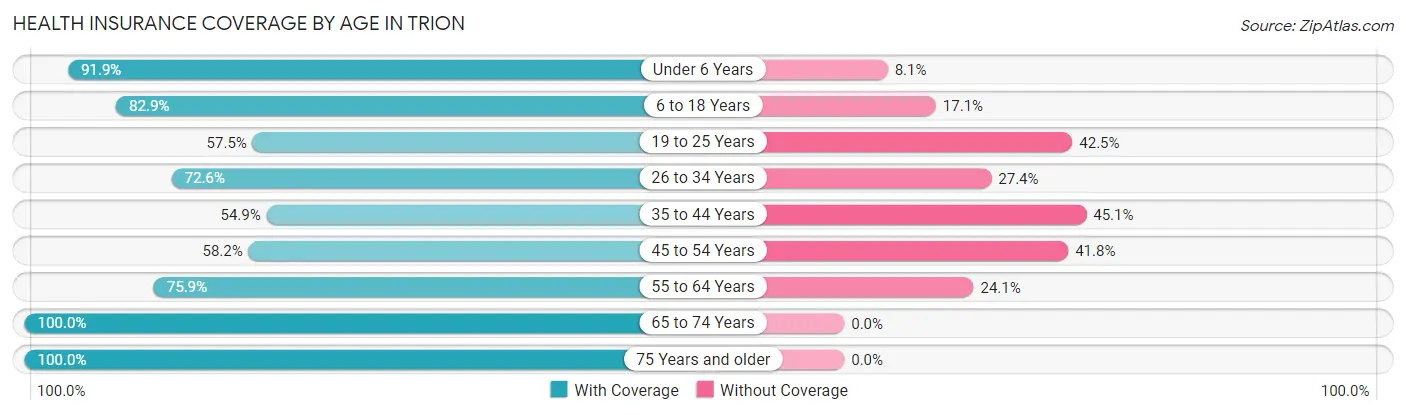
| Age Bracket | With Coverage | Without Coverage |
| Under 6 Years | 250 (91.9%) | 22 (8.1%) |
| 6 to 18 Years | 500 (82.9%) | 103 (17.1%) |
| 19 to 25 Years | 150 (57.5%) | 111 (42.5%) |
| 26 to 34 Years | 135 (72.6%) | 51 (27.4%) |
| 35 to 44 Years | 242 (54.9%) | 199 (45.1%) |
| 45 to 54 Years | 99 (58.2%) | 71 (41.8%) |
| 55 to 64 Years | 107 (75.9%) | 34 (24.1%) |
| 65 to 74 Years | 148 (100.0%) | 0 (0.0%) |
| 75 Years and older | 167 (100.0%) | 0 (0.0%) |
| Total | 1,798 (75.3%) | 591 (24.7%) |
Health Insurance Coverage by Citizenship Status in Trion
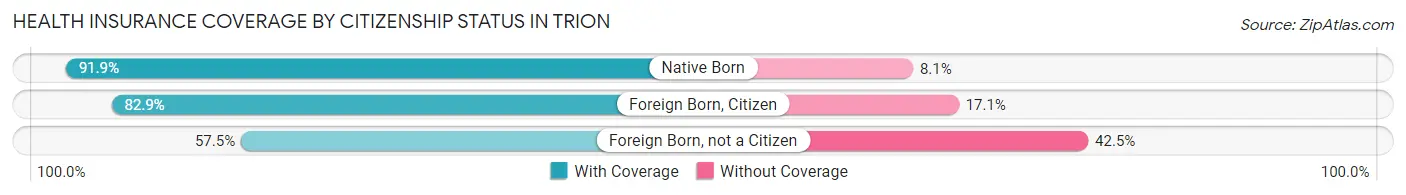
| Citizenship Status | With Coverage | Without Coverage |
| Native Born | 250 (91.9%) | 22 (8.1%) |
| Foreign Born, Citizen | 500 (82.9%) | 103 (17.1%) |
| Foreign Born, not a Citizen | 150 (57.5%) | 111 (42.5%) |
Health Insurance Coverage by Household Income in Trion
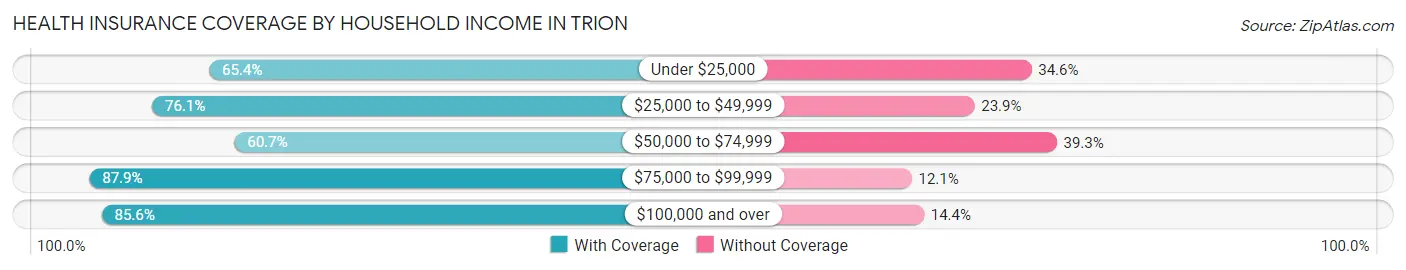
| Household Income | With Coverage | Without Coverage |
| Under $25,000 | 214 (65.4%) | 113 (34.6%) |
| $25,000 to $49,999 | 602 (76.1%) | 189 (23.9%) |
| $50,000 to $74,999 | 275 (60.7%) | 178 (39.3%) |
| $75,000 to $99,999 | 268 (87.9%) | 37 (12.1%) |
| $100,000 and over | 439 (85.6%) | 74 (14.4%) |
Public vs Private Health Insurance Coverage by Age in Trion
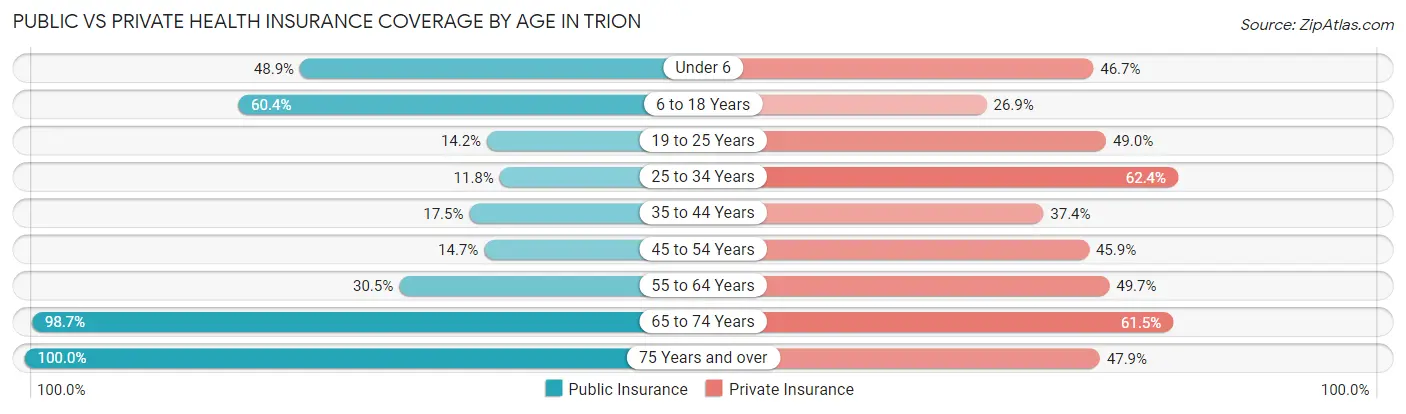
| Age Bracket | Public Insurance | Private Insurance |
| Under 6 | 133 (48.9%) | 127 (46.7%) |
| 6 to 18 Years | 364 (60.4%) | 162 (26.9%) |
| 19 to 25 Years | 37 (14.2%) | 128 (49.0%) |
| 25 to 34 Years | 22 (11.8%) | 116 (62.4%) |
| 35 to 44 Years | 77 (17.5%) | 165 (37.4%) |
| 45 to 54 Years | 25 (14.7%) | 78 (45.9%) |
| 55 to 64 Years | 43 (30.5%) | 70 (49.6%) |
| 65 to 74 Years | 146 (98.7%) | 91 (61.5%) |
| 75 Years and over | 167 (100.0%) | 80 (47.9%) |
| Total | 1,014 (42.4%) | 1,017 (42.6%) |
Disability Status by Sex by Age in Trion
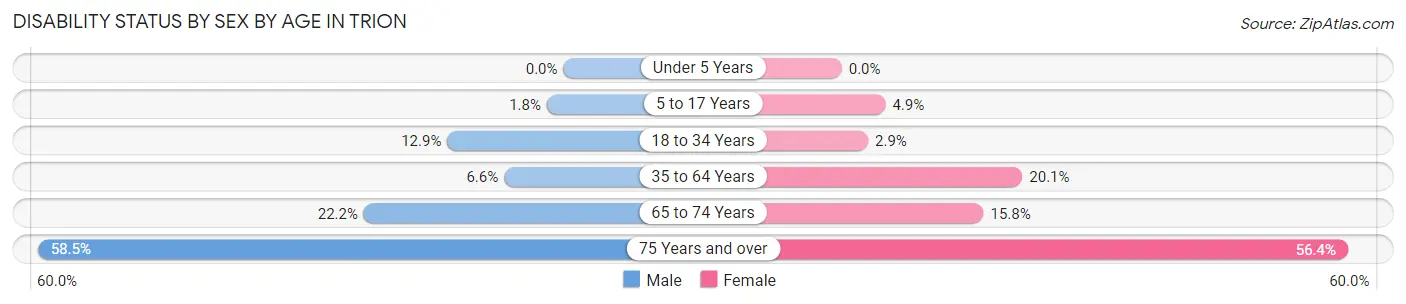
| Age Bracket | Male | Female |
| Under 5 Years | 0 (0.0%) | 0 (0.0%) |
| 5 to 17 Years | 7 (1.8%) | 12 (4.9%) |
| 18 to 34 Years | 38 (12.9%) | 6 (2.9%) |
| 35 to 64 Years | 26 (6.6%) | 72 (20.1%) |
| 65 to 74 Years | 16 (22.2%) | 12 (15.8%) |
| 75 Years and over | 24 (58.5%) | 71 (56.4%) |
Disability Class by Sex by Age in Trion
Disability Class: Hearing Difficulty
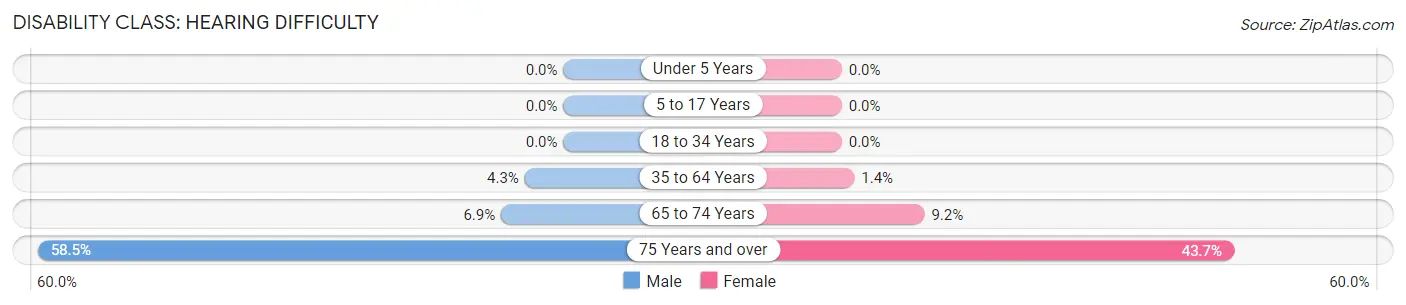
| Age Bracket | Male | Female |
| Under 5 Years | 0 (0.0%) | 0 (0.0%) |
| 5 to 17 Years | 0 (0.0%) | 0 (0.0%) |
| 18 to 34 Years | 0 (0.0%) | 0 (0.0%) |
| 35 to 64 Years | 17 (4.3%) | 5 (1.4%) |
| 65 to 74 Years | 5 (6.9%) | 7 (9.2%) |
| 75 Years and over | 24 (58.5%) | 55 (43.6%) |
Disability Class: Vision Difficulty
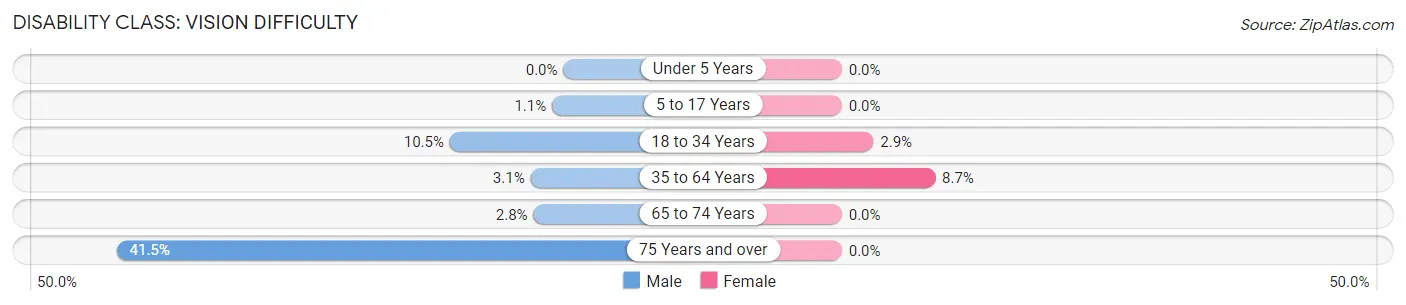
| Age Bracket | Male | Female |
| Under 5 Years | 0 (0.0%) | 0 (0.0%) |
| 5 to 17 Years | 4 (1.1%) | 0 (0.0%) |
| 18 to 34 Years | 31 (10.5%) | 6 (2.9%) |
| 35 to 64 Years | 12 (3.0%) | 31 (8.7%) |
| 65 to 74 Years | 2 (2.8%) | 0 (0.0%) |
| 75 Years and over | 17 (41.5%) | 0 (0.0%) |
Disability Class: Cognitive Difficulty
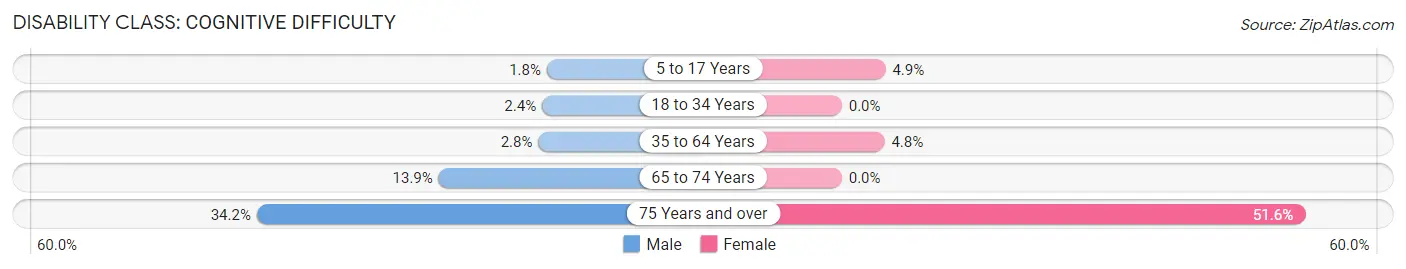
| Age Bracket | Male | Female |
| 5 to 17 Years | 7 (1.8%) | 12 (4.9%) |
| 18 to 34 Years | 7 (2.4%) | 0 (0.0%) |
| 35 to 64 Years | 11 (2.8%) | 17 (4.8%) |
| 65 to 74 Years | 10 (13.9%) | 0 (0.0%) |
| 75 Years and over | 14 (34.2%) | 65 (51.6%) |
Disability Class: Ambulatory Difficulty
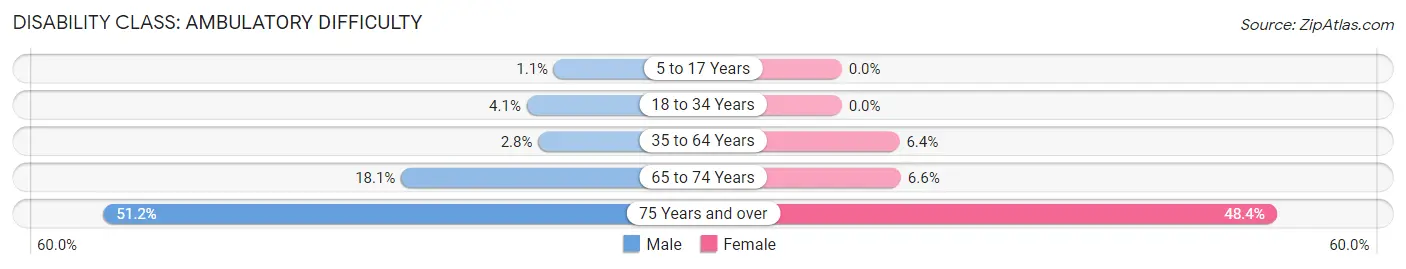
| Age Bracket | Male | Female |
| 5 to 17 Years | 4 (1.1%) | 0 (0.0%) |
| 18 to 34 Years | 12 (4.1%) | 0 (0.0%) |
| 35 to 64 Years | 11 (2.8%) | 23 (6.4%) |
| 65 to 74 Years | 13 (18.1%) | 5 (6.6%) |
| 75 Years and over | 21 (51.2%) | 61 (48.4%) |
Disability Class: Self-Care Difficulty
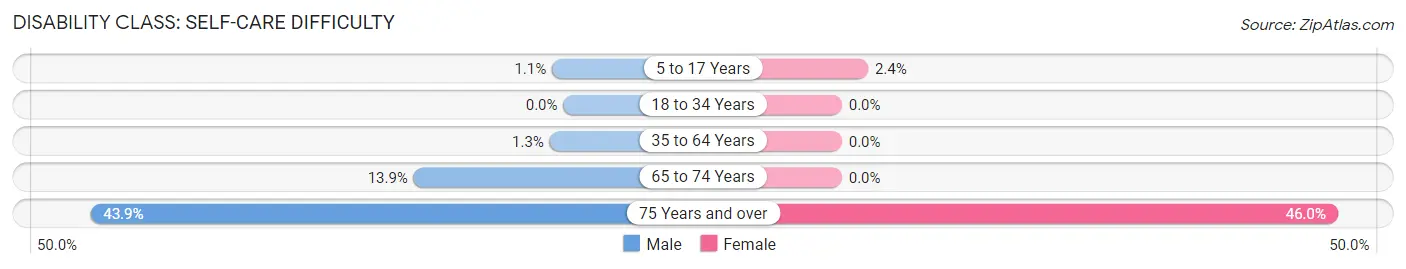
| Age Bracket | Male | Female |
| 5 to 17 Years | 4 (1.1%) | 6 (2.4%) |
| 18 to 34 Years | 0 (0.0%) | 0 (0.0%) |
| 35 to 64 Years | 5 (1.3%) | 0 (0.0%) |
| 65 to 74 Years | 10 (13.9%) | 0 (0.0%) |
| 75 Years and over | 18 (43.9%) | 58 (46.0%) |
Technology Access in Trion
Computing Device Access in Trion
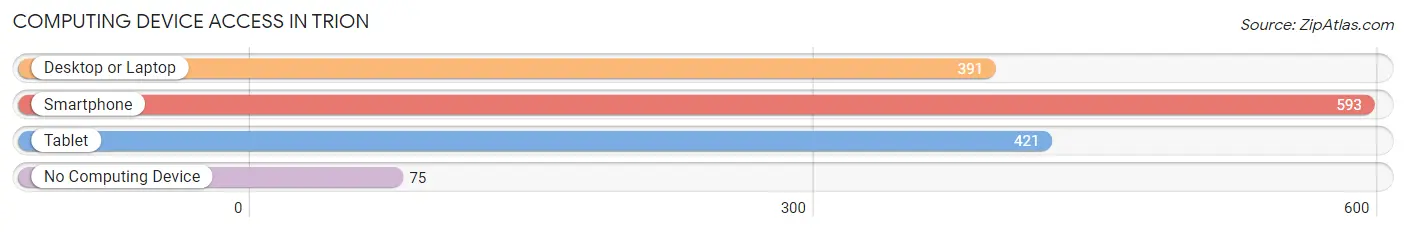
| Device Type | # Households | % Households |
| Desktop or Laptop | 391 | 53.5% |
| Smartphone | 593 | 81.1% |
| Tablet | 421 | 57.6% |
| No Computing Device | 75 | 10.3% |
| Total | 731 | 100.0% |
Internet Access in Trion
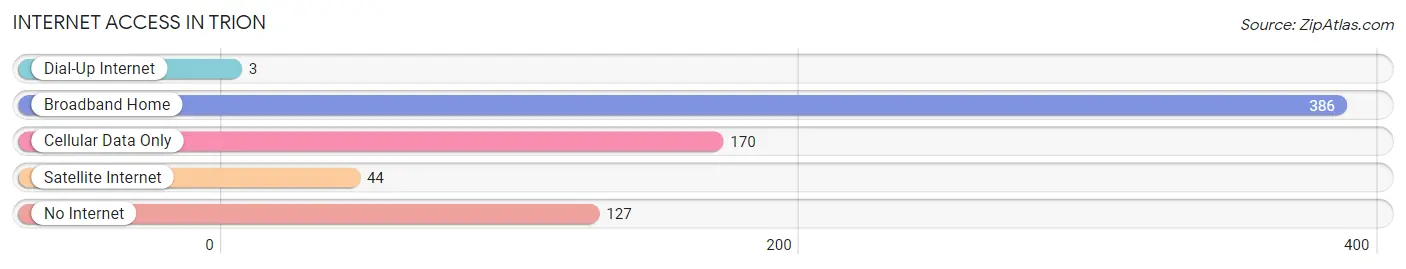
| Internet Type | # Households | % Households |
| Dial-Up Internet | 3 | 0.4% |
| Broadband Home | 386 | 52.8% |
| Cellular Data Only | 170 | 23.3% |
| Satellite Internet | 44 | 6.0% |
| No Internet | 127 | 17.4% |
| Total | 731 | 100.0% |
Trion Summary
Trion, Georgia is a small town located in Chattooga County in the northwest corner of the state. It is situated along the banks of the Chattooga River, and is home to a population of approximately 1,800 people. The town was founded in 1847 and has a rich history of industry and agriculture.
Geography
Trion is located in the foothills of the Appalachian Mountains, and is surrounded by lush forests and rolling hills. The town is situated along the banks of the Chattooga River, which is a major tributary of the Tennessee River. The town is located approximately 30 miles from Chattanooga, Tennessee, and is accessible by US Highway 27.
Economy
Trion’s economy is largely based on agriculture and manufacturing. The town is home to several large poultry farms, as well as a number of smaller farms that produce a variety of crops. The town is also home to several manufacturing plants, including a carpet mill, a furniture factory, and a textile mill. In addition, the town is home to a number of small businesses, including restaurants, retail stores, and service providers.
Demographics
Trion is a predominantly white town, with approximately 90% of the population identifying as Caucasian. The remaining 10% of the population is made up of African Americans, Hispanics, and other ethnicities. The median household income in Trion is approximately $30,000, and the median age is 38.
Conclusion
Trion, Georgia is a small town with a rich history and a vibrant economy. The town is situated along the banks of the Chattooga River, and is home to a population of approximately 1,800 people. The town’s economy is largely based on agriculture and manufacturing, and the town is home to a number of small businesses. The population of Trion is predominantly white, with approximately 90% of the population identifying as Caucasian.
Common Questions
What is Per Capita Income in Trion?
Per Capita income in Trion is $17,687.
What is the Median Family Income in Trion?
Median Family Income in Trion is $47,500.
What is the Median Household income in Trion?
Median Household Income in Trion is $39,073.
What is Income or Wage Gap in Trion?
Income or Wage Gap in Trion is 26.8%.
Women in Trion earn 73.2 cents for every dollar earned by a man.
What is Family Income Deficit in Trion?
Family Income Deficit in Trion is $9,793.
Families that are below poverty line in Trion earn $9,793 less on average than the poverty threshold level.
What is Inequality or Gini Index in Trion?
Inequality or Gini Index in Trion is 0.43.
What is the Total Population of Trion?
Total Population of Trion is 2,389.
What is the Total Male Population of Trion?
Total Male Population of Trion is 1,238.
What is the Total Female Population of Trion?
Total Female Population of Trion is 1,151.
What is the Ratio of Males per 100 Females in Trion?
There are 107.56 Males per 100 Females in Trion.
What is the Ratio of Females per 100 Males in Trion?
There are 92.97 Females per 100 Males in Trion.
What is the Median Population Age in Trion?
Median Population Age in Trion is 28.0 Years.
What is the Average Family Size in Trion
Average Family Size in Trion is 4.0 People.
What is the Average Household Size in Trion
Average Household Size in Trion is 3.3 People.
How Large is the Labor Force in Trion?
There are 981 People in the Labor Forcein in Trion.
What is the Percentage of People in the Labor Force in Trion?
58.8% of People are in the Labor Force in Trion.
What is the Unemployment Rate in Trion?
Unemployment Rate in Trion is 4.0%.