Lagrange, GA Map & Demographics
Lagrange Map
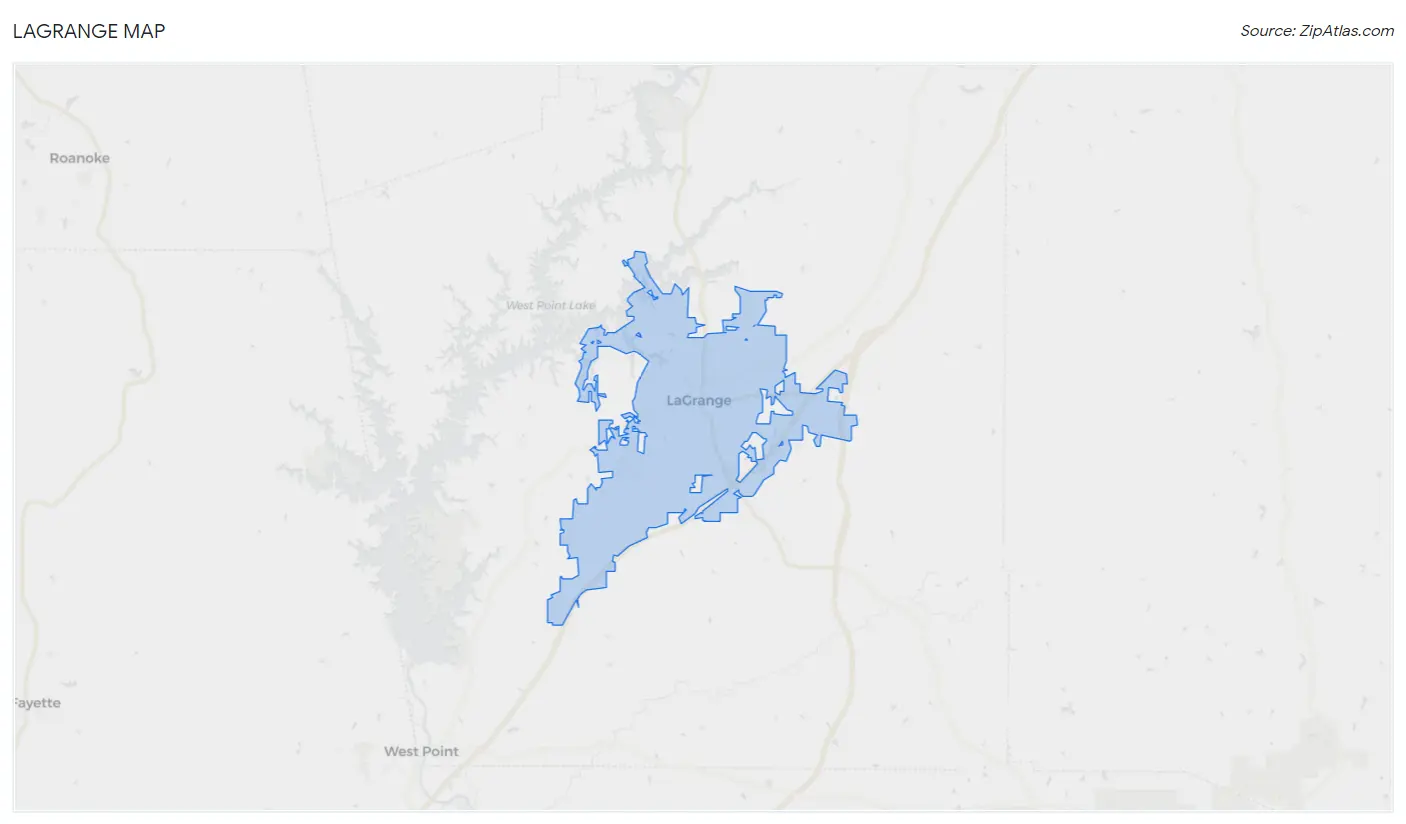
Lagrange Overview
$28,005
PER CAPITA INCOME
$54,383
AVG FAMILY INCOME
$41,030
AVG HOUSEHOLD INCOME
19.1%
WAGE / INCOME GAP [ % ]
80.9¢/ $1
WAGE / INCOME GAP [ $ ]
$11,311
FAMILY INCOME DEFICIT
0.54
INEQUALITY / GINI INDEX
31,173
TOTAL POPULATION
14,428
MALE POPULATION
16,745
FEMALE POPULATION
86.16
MALES / 100 FEMALES
116.06
FEMALES / 100 MALES
34.9
MEDIAN AGE
3.3
AVG FAMILY SIZE
2.5
AVG HOUSEHOLD SIZE
14,725
LABOR FORCE [ PEOPLE ]
61.6%
PERCENT IN LABOR FORCE
5.3%
UNEMPLOYMENT RATE
Income in Lagrange
Income Overview in Lagrange
Per Capita Income in Lagrange is $28,005, while median incomes of families and households are $54,383 and $41,030 respectively.
| Characteristic | Number | Measure |
| Per Capita Income | 31,173 | $28,005 |
| Median Family Income | 6,992 | $54,383 |
| Mean Family Income | 6,992 | $87,872 |
| Median Household Income | 12,131 | $41,030 |
| Mean Household Income | 12,131 | $67,778 |
| Income Deficit | 6,992 | $11,311 |
| Wage / Income Gap (%) | 31,173 | 19.09% |
| Wage / Income Gap ($) | 31,173 | 80.91¢ per $1 |
| Gini / Inequality Index | 31,173 | 0.54 |
Earnings by Sex in Lagrange
Average Earnings in Lagrange are $33,013, $36,902 for men and $29,856 for women, a difference of 19.1%.
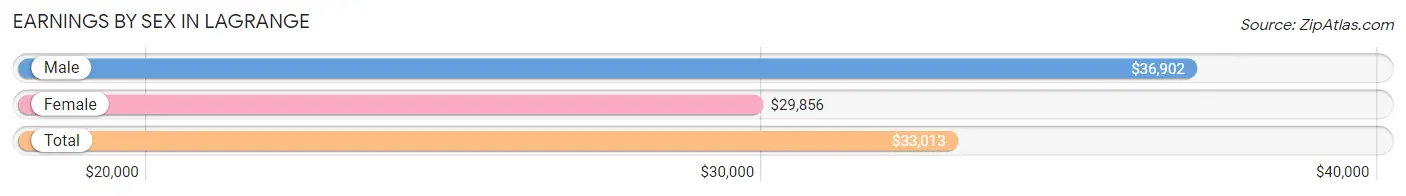
| Sex | Number | Average Earnings |
| Male | 7,397 (48.8%) | $36,902 |
| Female | 7,747 (51.2%) | $29,856 |
| Total | 15,144 (100.0%) | $33,013 |
Earnings by Sex by Income Bracket in Lagrange
The most common earnings brackets in Lagrange are $100,000+ for men (710 | 9.6%) and $35,000 to $39,999 for women (895 | 11.6%).
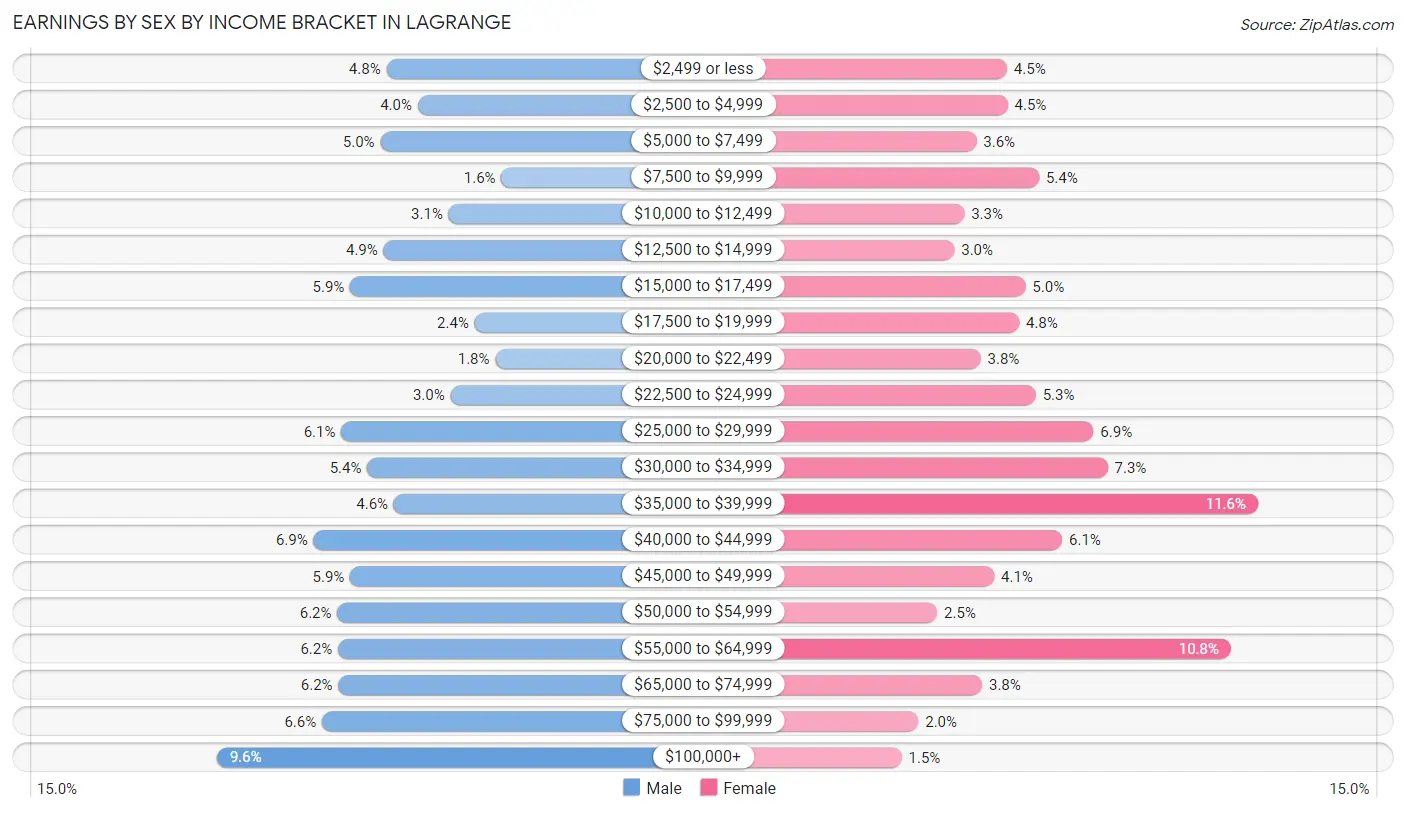
| Income | Male | Female |
| $2,499 or less | 357 (4.8%) | 349 (4.5%) |
| $2,500 to $4,999 | 292 (4.0%) | 350 (4.5%) |
| $5,000 to $7,499 | 370 (5.0%) | 282 (3.6%) |
| $7,500 to $9,999 | 118 (1.6%) | 418 (5.4%) |
| $10,000 to $12,499 | 228 (3.1%) | 256 (3.3%) |
| $12,500 to $14,999 | 363 (4.9%) | 234 (3.0%) |
| $15,000 to $17,499 | 433 (5.9%) | 389 (5.0%) |
| $17,500 to $19,999 | 174 (2.4%) | 375 (4.8%) |
| $20,000 to $22,499 | 131 (1.8%) | 291 (3.8%) |
| $22,500 to $24,999 | 224 (3.0%) | 411 (5.3%) |
| $25,000 to $29,999 | 451 (6.1%) | 537 (6.9%) |
| $30,000 to $34,999 | 397 (5.4%) | 568 (7.3%) |
| $35,000 to $39,999 | 342 (4.6%) | 895 (11.6%) |
| $40,000 to $44,999 | 509 (6.9%) | 469 (6.0%) |
| $45,000 to $49,999 | 433 (5.9%) | 321 (4.1%) |
| $50,000 to $54,999 | 459 (6.2%) | 197 (2.5%) |
| $55,000 to $64,999 | 458 (6.2%) | 836 (10.8%) |
| $65,000 to $74,999 | 457 (6.2%) | 294 (3.8%) |
| $75,000 to $99,999 | 491 (6.6%) | 156 (2.0%) |
| $100,000+ | 710 (9.6%) | 119 (1.5%) |
| Total | 7,397 (100.0%) | 7,747 (100.0%) |
Earnings by Sex by Educational Attainment in Lagrange
Average earnings in Lagrange are $43,218 for men and $32,710 for women, a difference of 24.3%. Men with an educational attainment of graduate degree enjoy the highest average annual earnings of $90,286, while those with less than high school education earn the least with $32,095. Women with an educational attainment of graduate degree earn the most with the average annual earnings of $48,821, while those with less than high school education have the smallest earnings of $22,621.
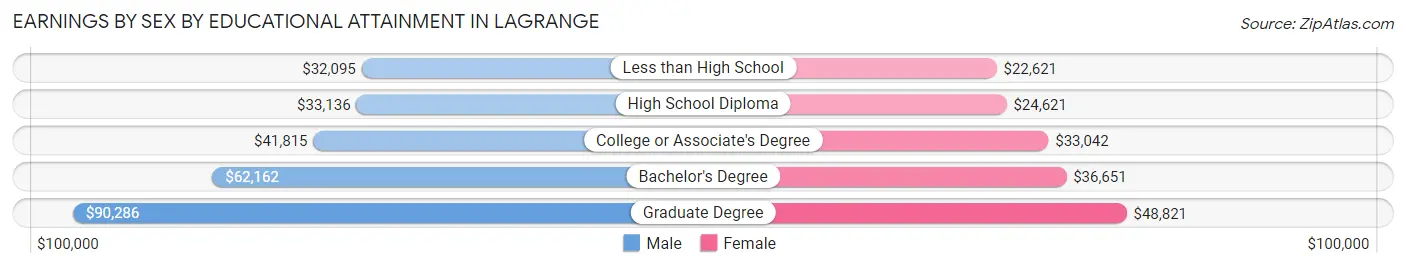
| Educational Attainment | Male Income | Female Income |
| Less than High School | $32,095 | $22,621 |
| High School Diploma | $33,136 | $24,621 |
| College or Associate's Degree | $41,815 | $33,042 |
| Bachelor's Degree | $62,162 | $36,651 |
| Graduate Degree | $90,286 | $48,821 |
| Total | $43,218 | $32,710 |
Family Income in Lagrange
Family Income Brackets in Lagrange
According to the Lagrange family income data, there are 1,314 families falling into the $50,000 to $74,999 income range, which is the most common income bracket and makes up 18.8% of all families. Conversely, the $10,000 to $14,999 income bracket is the least frequent group with only 294 families (4.2%) belonging to this category.
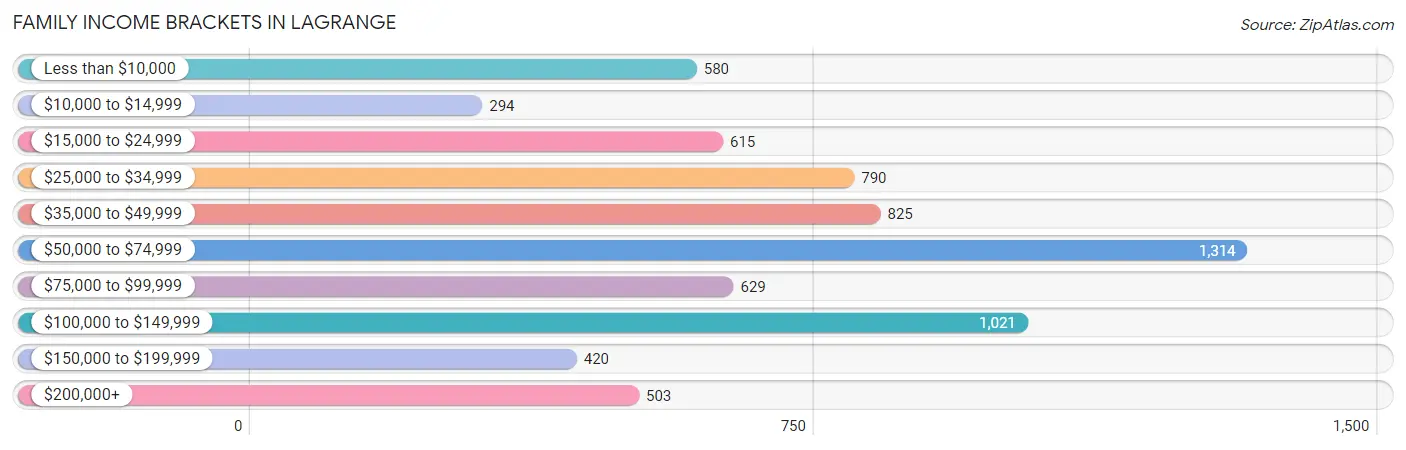
| Income Bracket | # Families | % Families |
| Less than $10,000 | 580 | 8.3% |
| $10,000 to $14,999 | 294 | 4.2% |
| $15,000 to $24,999 | 615 | 8.8% |
| $25,000 to $34,999 | 790 | 11.3% |
| $35,000 to $49,999 | 825 | 11.8% |
| $50,000 to $74,999 | 1,314 | 18.8% |
| $75,000 to $99,999 | 629 | 9.0% |
| $100,000 to $149,999 | 1,021 | 14.6% |
| $150,000 to $199,999 | 420 | 6.0% |
| $200,000+ | 503 | 7.2% |
Family Income by Famaliy Size in Lagrange
6-person families (202 | 2.9%) account for the highest median family income in Lagrange with $137,685 per family, while 4-person families (1,187 | 17.0%) have the highest median income of $25,735 per family member.
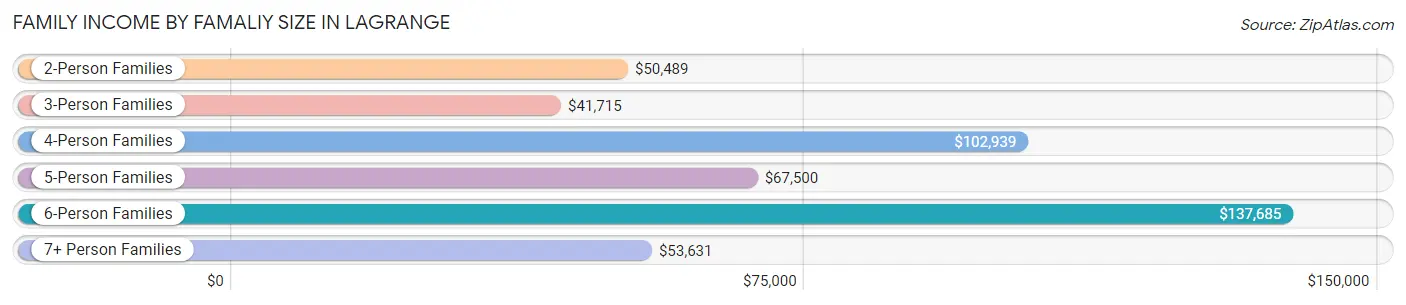
| Income Bracket | # Families | Median Income |
| 2-Person Families | 2,671 (38.2%) | $50,489 |
| 3-Person Families | 2,236 (32.0%) | $41,715 |
| 4-Person Families | 1,187 (17.0%) | $102,939 |
| 5-Person Families | 562 (8.0%) | $67,500 |
| 6-Person Families | 202 (2.9%) | $137,685 |
| 7+ Person Families | 134 (1.9%) | $53,631 |
| Total | 6,992 (100.0%) | $54,383 |
Family Income by Number of Earners in Lagrange
The median family income in Lagrange is $54,383, with families comprising 3+ earners (649) having the highest median family income of $139,317, while families with no earners (920) have the lowest median family income of $30,909, accounting for 9.3% and 13.2% of families, respectively.
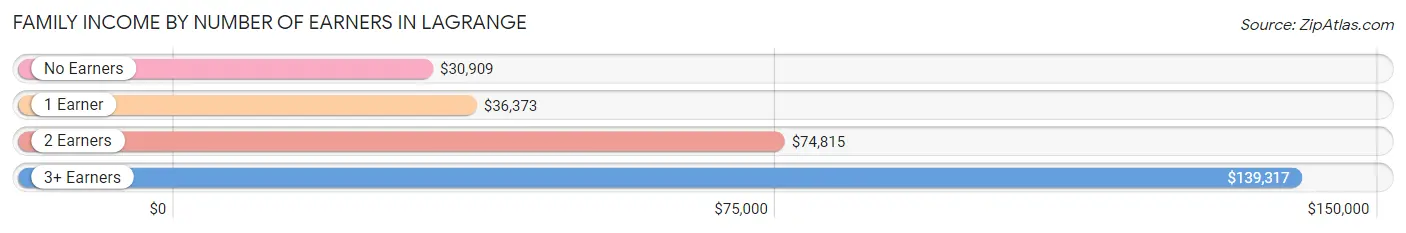
| Number of Earners | # Families | Median Income |
| No Earners | 920 (13.2%) | $30,909 |
| 1 Earner | 3,235 (46.3%) | $36,373 |
| 2 Earners | 2,188 (31.3%) | $74,815 |
| 3+ Earners | 649 (9.3%) | $139,317 |
| Total | 6,992 (100.0%) | $54,383 |
Household Income in Lagrange
Household Income Brackets in Lagrange
With 2,062 households falling in the category, the $50,000 to $74,999 income range is the most frequent in Lagrange, accounting for 17.0% of all households. In contrast, only 497 households (4.1%) fall into the $150,000 to $199,999 income bracket, making it the least populous group.
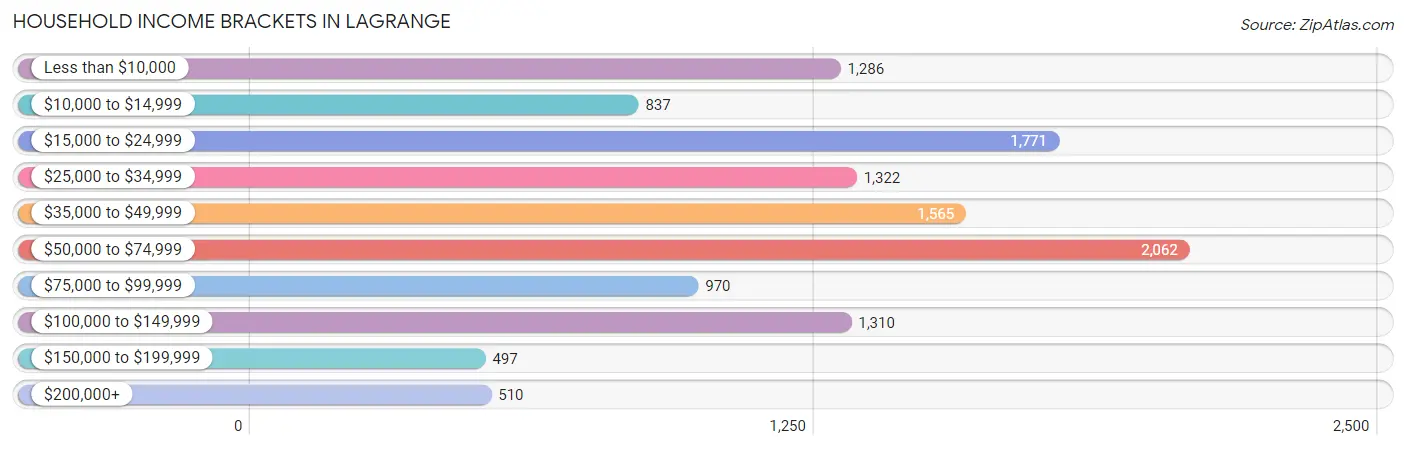
| Income Bracket | # Households | % Households |
| Less than $10,000 | 1,286 | 10.6% |
| $10,000 to $14,999 | 837 | 6.9% |
| $15,000 to $24,999 | 1,771 | 14.6% |
| $25,000 to $34,999 | 1,322 | 10.9% |
| $35,000 to $49,999 | 1,565 | 12.9% |
| $50,000 to $74,999 | 2,062 | 17.0% |
| $75,000 to $99,999 | 970 | 8.0% |
| $100,000 to $149,999 | 1,310 | 10.8% |
| $150,000 to $199,999 | 497 | 4.1% |
| $200,000+ | 510 | 4.2% |
Household Income by Householder Age in Lagrange
The median household income in Lagrange is $41,030, with the highest median household income of $48,719 found in the 25 to 44 years age bracket for the primary householder. A total of 4,141 households (34.1%) fall into this category. Meanwhile, the 15 to 24 years age bracket for the primary householder has the lowest median household income of $0, with 551 households (4.5%) in this group.
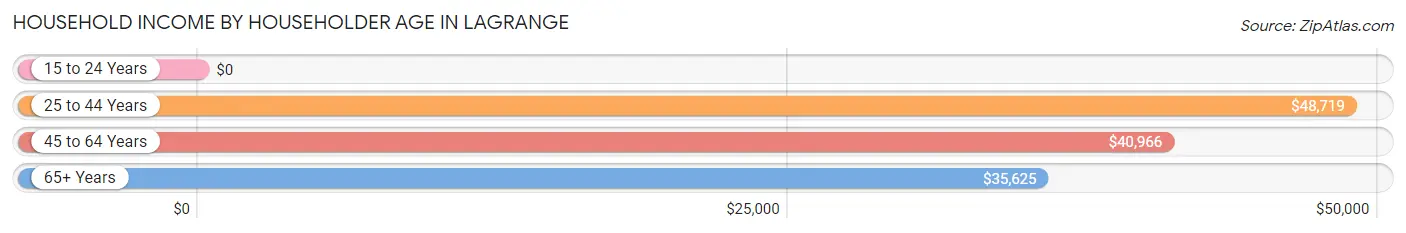
| Income Bracket | # Households | Median Income |
| 15 to 24 Years | 551 (4.5%) | $0 |
| 25 to 44 Years | 4,141 (34.1%) | $48,719 |
| 45 to 64 Years | 4,412 (36.4%) | $40,966 |
| 65+ Years | 3,027 (24.9%) | $35,625 |
| Total | 12,131 (100.0%) | $41,030 |
Poverty in Lagrange
Income Below Poverty by Sex and Age in Lagrange
With 25.2% poverty level for males and 25.6% for females among the residents of Lagrange, 15 year old males and 16 and 17 year old females are the most vulnerable to poverty, with 157 males (50.5%) and 180 females (58.4%) in their respective age groups living below the poverty level.
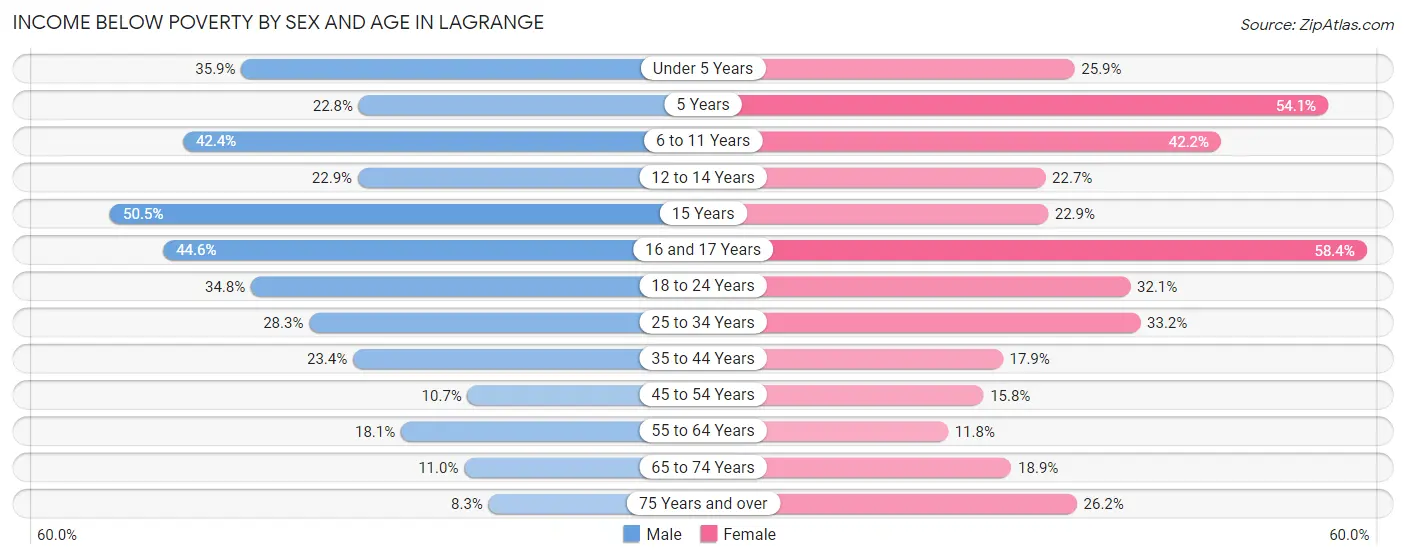
| Age Bracket | Male | Female |
| Under 5 Years | 431 (35.9%) | 195 (25.9%) |
| 5 Years | 54 (22.8%) | 216 (54.1%) |
| 6 to 11 Years | 474 (42.4%) | 539 (42.2%) |
| 12 to 14 Years | 202 (22.9%) | 113 (22.7%) |
| 15 Years | 157 (50.5%) | 75 (22.9%) |
| 16 and 17 Years | 86 (44.6%) | 180 (58.4%) |
| 18 to 24 Years | 560 (34.8%) | 447 (32.1%) |
| 25 to 34 Years | 572 (28.3%) | 888 (33.2%) |
| 35 to 44 Years | 382 (23.4%) | 361 (17.9%) |
| 45 to 54 Years | 195 (10.7%) | 322 (15.8%) |
| 55 to 64 Years | 245 (18.1%) | 229 (11.8%) |
| 65 to 74 Years | 109 (11.0%) | 232 (18.9%) |
| 75 Years and over | 47 (8.3%) | 359 (26.2%) |
| Total | 3,514 (25.2%) | 4,156 (25.6%) |
Income Above Poverty by Sex and Age in Lagrange
According to the poverty statistics in Lagrange, males aged 75 years and over and females aged 55 to 64 years are the age groups that are most secure financially, with 91.7% of males and 88.2% of females in these age groups living above the poverty line.
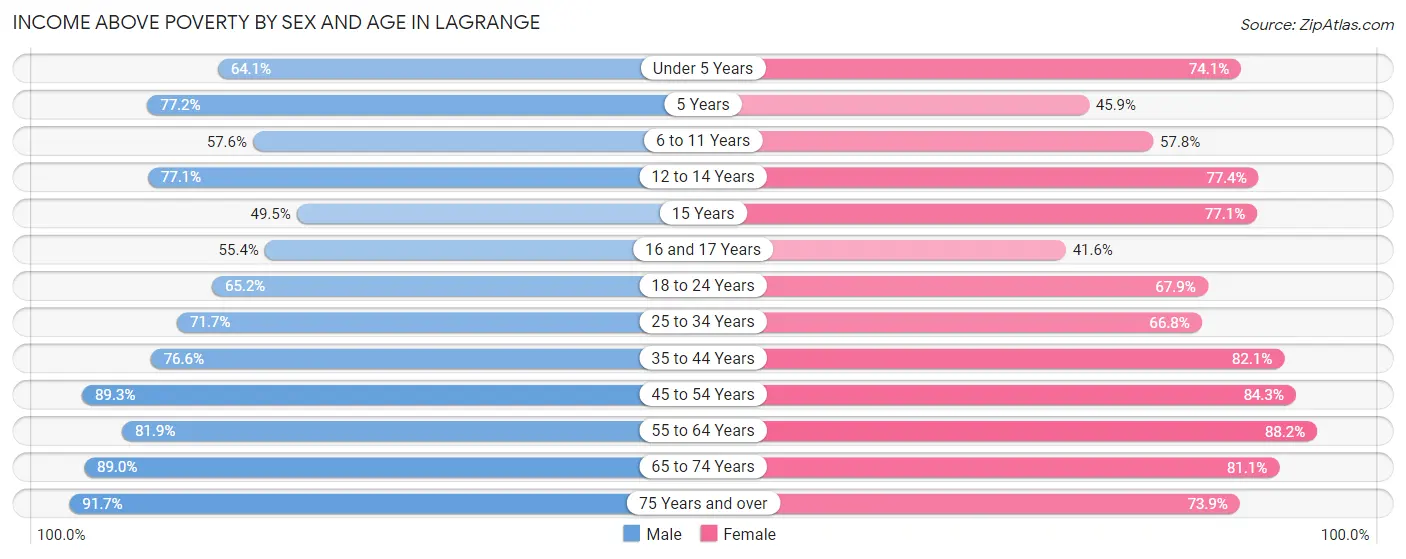
| Age Bracket | Male | Female |
| Under 5 Years | 771 (64.1%) | 558 (74.1%) |
| 5 Years | 183 (77.2%) | 183 (45.9%) |
| 6 to 11 Years | 645 (57.6%) | 738 (57.8%) |
| 12 to 14 Years | 681 (77.1%) | 386 (77.3%) |
| 15 Years | 154 (49.5%) | 252 (77.1%) |
| 16 and 17 Years | 107 (55.4%) | 128 (41.6%) |
| 18 to 24 Years | 1,050 (65.2%) | 945 (67.9%) |
| 25 to 34 Years | 1,449 (71.7%) | 1,785 (66.8%) |
| 35 to 44 Years | 1,249 (76.6%) | 1,655 (82.1%) |
| 45 to 54 Years | 1,634 (89.3%) | 1,723 (84.3%) |
| 55 to 64 Years | 1,110 (81.9%) | 1,711 (88.2%) |
| 65 to 74 Years | 878 (89.0%) | 998 (81.1%) |
| 75 Years and over | 518 (91.7%) | 1,014 (73.9%) |
| Total | 10,429 (74.8%) | 12,076 (74.4%) |
Income Below Poverty Among Married-Couple Families in Lagrange
The poverty statistics for married-couple families in Lagrange show that 9.1% or 347 of the total 3,831 families live below the poverty line. Families with 5 or more children have the highest poverty rate of 100.0%, comprising of 90 families. On the other hand, families with no children have the lowest poverty rate of 3.0%, which includes 62 families.
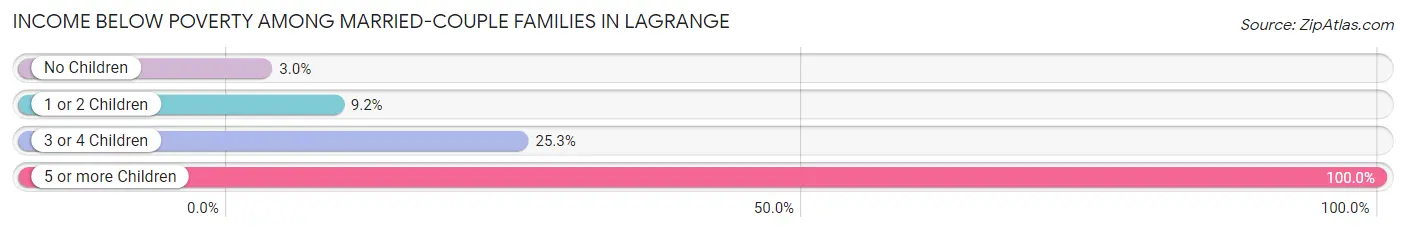
| Children | Above Poverty | Below Poverty |
| No Children | 2,011 (97.0%) | 62 (3.0%) |
| 1 or 2 Children | 1,281 (90.8%) | 130 (9.2%) |
| 3 or 4 Children | 192 (74.7%) | 65 (25.3%) |
| 5 or more Children | 0 (0.0%) | 90 (100.0%) |
| Total | 3,484 (90.9%) | 347 (9.1%) |
Income Below Poverty Among Single-Parent Households in Lagrange
According to the poverty data in Lagrange, 46.4% or 305 single-father households and 35.1% or 880 single-mother households are living below the poverty line. Among single-father households, those with 1 or 2 children have the highest poverty rate, with 246 households (59.7%) experiencing poverty. Likewise, among single-mother households, those with 1 or 2 children have the highest poverty rate, with 739 households (40.3%) falling below the poverty line.
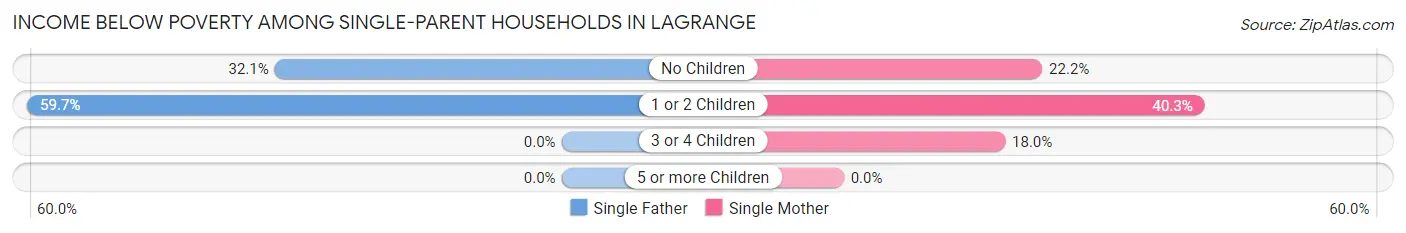
| Children | Single Father | Single Mother |
| No Children | 59 (32.1%) | 106 (22.2%) |
| 1 or 2 Children | 246 (59.7%) | 739 (40.3%) |
| 3 or 4 Children | 0 (0.0%) | 35 (18.0%) |
| 5 or more Children | 0 (0.0%) | 0 (0.0%) |
| Total | 305 (46.4%) | 880 (35.1%) |
Income Below Poverty Among Married-Couple vs Single-Parent Households in Lagrange
The poverty data for Lagrange shows that 347 of the married-couple family households (9.1%) and 1,185 of the single-parent households (37.5%) are living below the poverty level. Within the married-couple family households, those with 5 or more children have the highest poverty rate, with 90 households (100.0%) falling below the poverty line. Among the single-parent households, those with 1 or 2 children have the highest poverty rate, with 985 household (43.9%) living below poverty.
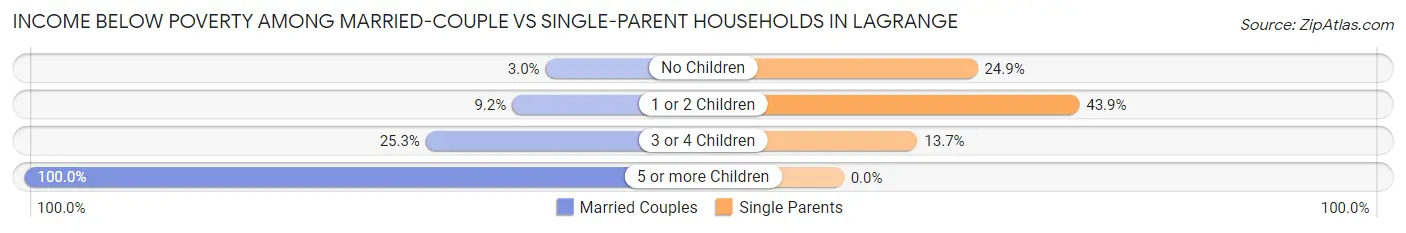
| Children | Married-Couple Families | Single-Parent Households |
| No Children | 62 (3.0%) | 165 (24.9%) |
| 1 or 2 Children | 130 (9.2%) | 985 (43.9%) |
| 3 or 4 Children | 65 (25.3%) | 35 (13.7%) |
| 5 or more Children | 90 (100.0%) | 0 (0.0%) |
| Total | 347 (9.1%) | 1,185 (37.5%) |
Race in Lagrange
The most populous races in Lagrange are Black / African American (16,337 | 52.4%), White / Caucasian (11,771 | 37.8%), and Hispanic or Latino (1,486 | 4.8%).
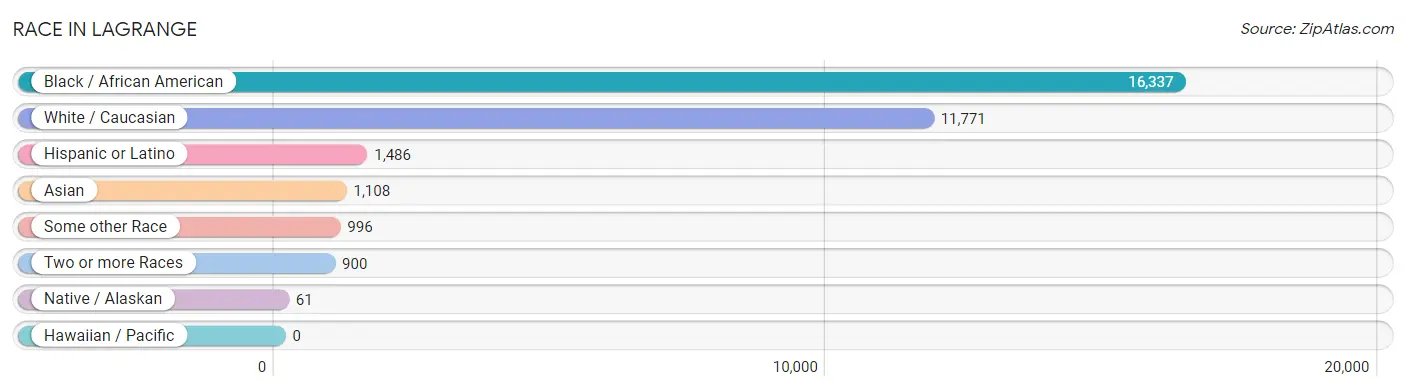
| Race | # Population | % Population |
| Asian | 1,108 | 3.5% |
| Black / African American | 16,337 | 52.4% |
| Hawaiian / Pacific | 0 | 0.0% |
| Hispanic or Latino | 1,486 | 4.8% |
| Native / Alaskan | 61 | 0.2% |
| White / Caucasian | 11,771 | 37.8% |
| Two or more Races | 900 | 2.9% |
| Some other Race | 996 | 3.2% |
| Total | 31,173 | 100.0% |
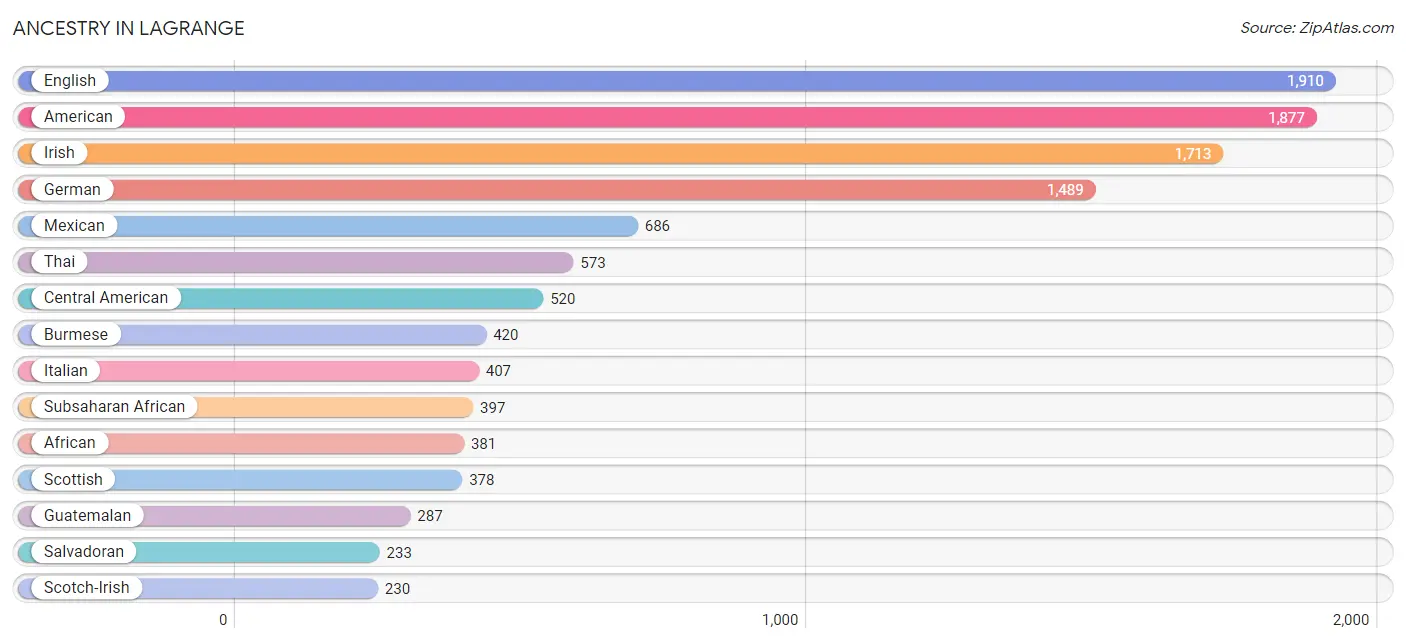
Ancestry in Lagrange
The most populous ancestries reported in Lagrange are English (1,910 | 6.1%), American (1,877 | 6.0%), Irish (1,713 | 5.5%), German (1,489 | 4.8%), and Mexican (686 | 2.2%), together accounting for 24.6% of all Lagrange residents.
| Ancestry | # Population | % Population |
| African | 381 | 1.2% |
| American | 1,877 | 6.0% |
| Austrian | 21 | 0.1% |
| Belgian | 37 | 0.1% |
| Bhutanese | 13 | 0.0% |
| British | 57 | 0.2% |
| Bulgarian | 12 | 0.0% |
| Burmese | 420 | 1.3% |
| Canadian | 99 | 0.3% |
| Celtic | 40 | 0.1% |
| Central American | 520 | 1.7% |
| Cherokee | 143 | 0.5% |
| Creek | 14 | 0.0% |
| Cuban | 105 | 0.3% |
| Czechoslovakian | 33 | 0.1% |
| Danish | 8 | 0.0% |
| Dutch | 90 | 0.3% |
| Eastern European | 43 | 0.1% |
| English | 1,910 | 6.1% |
| European | 99 | 0.3% |
| French | 228 | 0.7% |
| French Canadian | 11 | 0.0% |
| German | 1,489 | 4.8% |
| Greek | 18 | 0.1% |
| Guatemalan | 287 | 0.9% |
| Haitian | 184 | 0.6% |
| Hungarian | 22 | 0.1% |
| Indian (Asian) | 102 | 0.3% |
| Iranian | 26 | 0.1% |
| Irish | 1,713 | 5.5% |
| Israeli | 4 | 0.0% |
| Italian | 407 | 1.3% |
| Jamaican | 143 | 0.5% |
| Korean | 28 | 0.1% |
| Mexican | 686 | 2.2% |
| Nigerian | 16 | 0.1% |
| Northern European | 33 | 0.1% |
| Norwegian | 82 | 0.3% |
| Peruvian | 78 | 0.3% |
| Polish | 128 | 0.4% |
| Portuguese | 28 | 0.1% |
| Puerto Rican | 69 | 0.2% |
| Russian | 27 | 0.1% |
| Salvadoran | 233 | 0.7% |
| Scandinavian | 75 | 0.2% |
| Scotch-Irish | 230 | 0.7% |
| Scottish | 378 | 1.2% |
| Slovene | 10 | 0.0% |
| South American | 78 | 0.3% |
| Subsaharan African | 397 | 1.3% |
| Swedish | 83 | 0.3% |
| Thai | 573 | 1.8% |
| Ukrainian | 8 | 0.0% |
| Welsh | 38 | 0.1% | View All 54 Rows |
Immigrants in Lagrange
The most numerous immigrant groups reported in Lagrange came from Asia (784 | 2.5%), Latin America (692 | 2.2%), Central America (558 | 1.8%), Eastern Asia (418 | 1.3%), and Korea (366 | 1.2%), together accounting for 9.0% of all Lagrange residents.
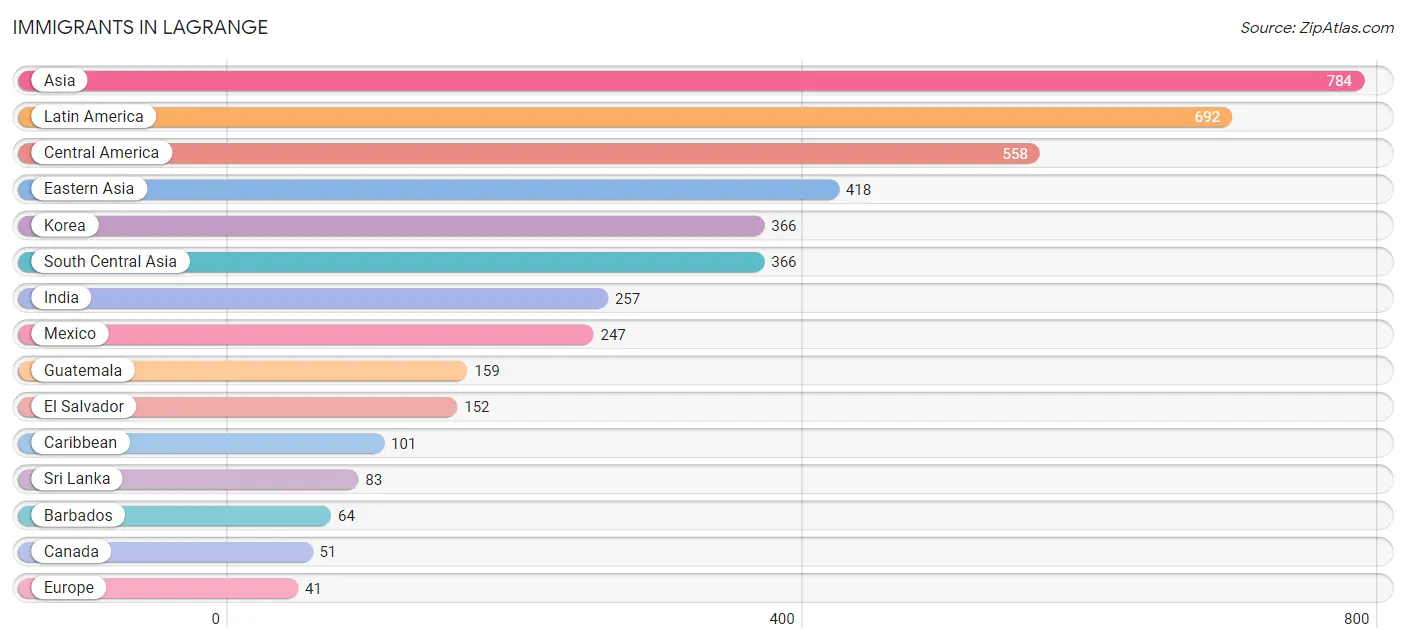
| Immigration Origin | # Population | % Population |
| Africa | 29 | 0.1% |
| Asia | 784 | 2.5% |
| Barbados | 64 | 0.2% |
| Canada | 51 | 0.2% |
| Caribbean | 101 | 0.3% |
| Central America | 558 | 1.8% |
| China | 39 | 0.1% |
| Cuba | 16 | 0.1% |
| Eastern Africa | 29 | 0.1% |
| Eastern Asia | 418 | 1.3% |
| Eastern Europe | 2 | 0.0% |
| El Salvador | 152 | 0.5% |
| England | 14 | 0.0% |
| Europe | 41 | 0.1% |
| Germany | 17 | 0.1% |
| Greece | 8 | 0.0% |
| Guatemala | 159 | 0.5% |
| Haiti | 19 | 0.1% |
| India | 257 | 0.8% |
| Iran | 26 | 0.1% |
| Jamaica | 2 | 0.0% |
| Japan | 13 | 0.0% |
| Korea | 366 | 1.2% |
| Latin America | 692 | 2.2% |
| Mexico | 247 | 0.8% |
| Northern Europe | 14 | 0.0% |
| Peru | 33 | 0.1% |
| South America | 33 | 0.1% |
| South Central Asia | 366 | 1.2% |
| Southern Europe | 8 | 0.0% |
| Sri Lanka | 83 | 0.3% |
| Uganda | 29 | 0.1% |
| Ukraine | 2 | 0.0% |
| Western Europe | 17 | 0.1% | View All 34 Rows |
Sex and Age in Lagrange
Sex and Age in Lagrange
The most populous age groups in Lagrange are 10 to 14 Years (1,434 | 9.9%) for men and 25 to 29 Years (1,406 | 8.4%) for women.
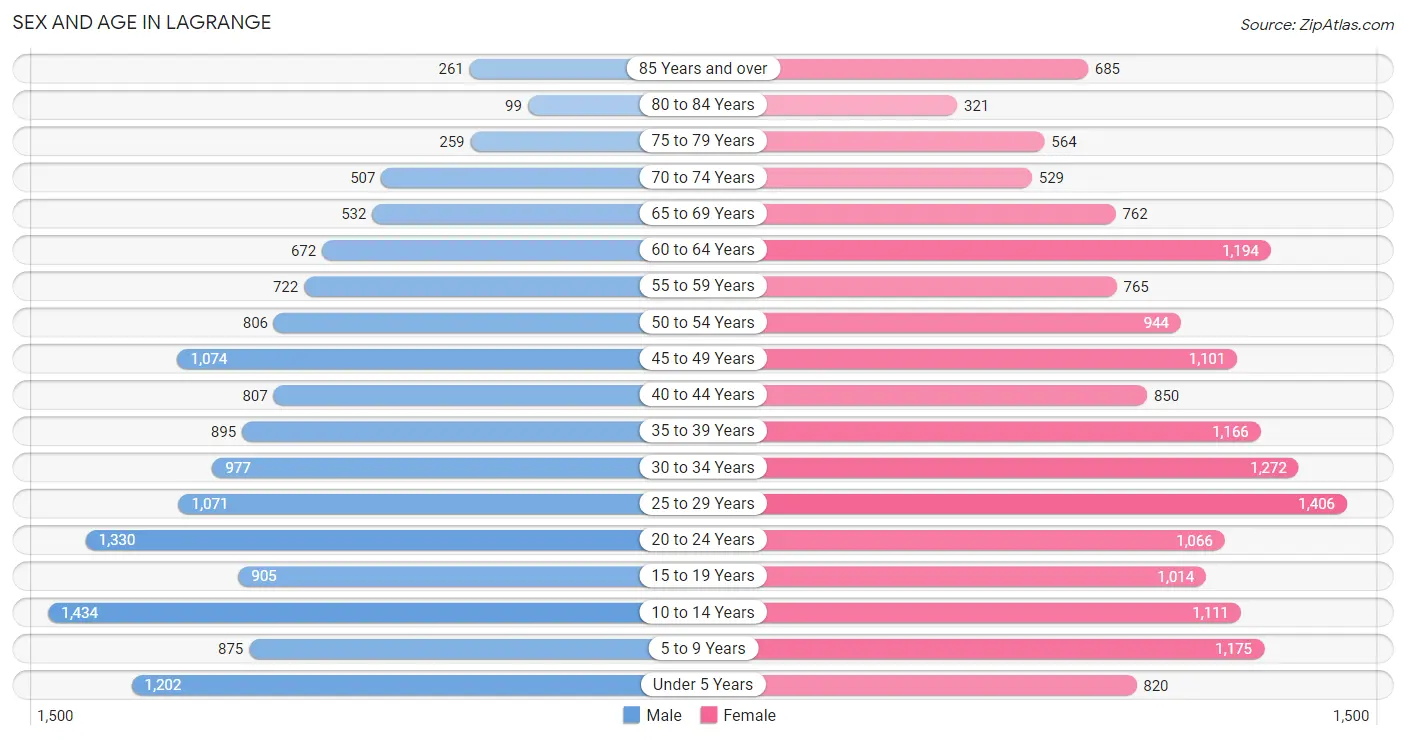
| Age Bracket | Male | Female |
| Under 5 Years | 1,202 (8.3%) | 820 (4.9%) |
| 5 to 9 Years | 875 (6.1%) | 1,175 (7.0%) |
| 10 to 14 Years | 1,434 (9.9%) | 1,111 (6.6%) |
| 15 to 19 Years | 905 (6.3%) | 1,014 (6.1%) |
| 20 to 24 Years | 1,330 (9.2%) | 1,066 (6.4%) |
| 25 to 29 Years | 1,071 (7.4%) | 1,406 (8.4%) |
| 30 to 34 Years | 977 (6.8%) | 1,272 (7.6%) |
| 35 to 39 Years | 895 (6.2%) | 1,166 (7.0%) |
| 40 to 44 Years | 807 (5.6%) | 850 (5.1%) |
| 45 to 49 Years | 1,074 (7.4%) | 1,101 (6.6%) |
| 50 to 54 Years | 806 (5.6%) | 944 (5.6%) |
| 55 to 59 Years | 722 (5.0%) | 765 (4.6%) |
| 60 to 64 Years | 672 (4.7%) | 1,194 (7.1%) |
| 65 to 69 Years | 532 (3.7%) | 762 (4.5%) |
| 70 to 74 Years | 507 (3.5%) | 529 (3.2%) |
| 75 to 79 Years | 259 (1.8%) | 564 (3.4%) |
| 80 to 84 Years | 99 (0.7%) | 321 (1.9%) |
| 85 Years and over | 261 (1.8%) | 685 (4.1%) |
| Total | 14,428 (100.0%) | 16,745 (100.0%) |
Families and Households in Lagrange
Median Family Size in Lagrange
The median family size in Lagrange is 3.29 persons per family, with married-couple families (3,831 | 54.8%) accounting for the largest median family size of 3.48 persons per family. On the other hand, single male/father families (657 | 9.4%) represent the smallest median family size with 2.83 persons per family.
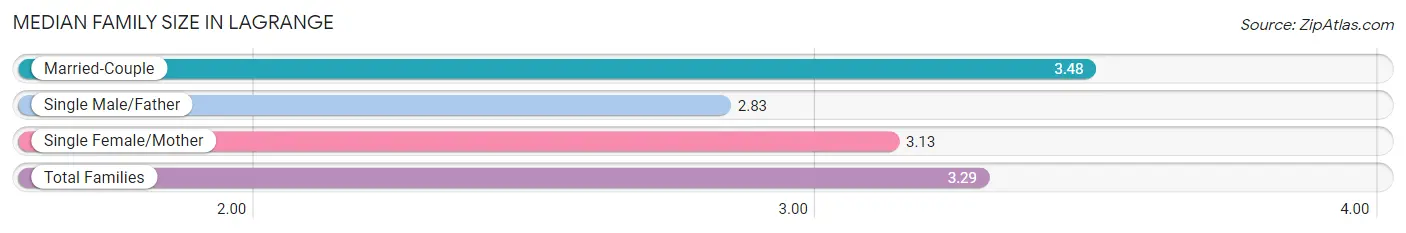
| Family Type | # Families | Family Size |
| Married-Couple | 3,831 (54.8%) | 3.48 |
| Single Male/Father | 657 (9.4%) | 2.83 |
| Single Female/Mother | 2,504 (35.8%) | 3.13 |
| Total Families | 6,992 (100.0%) | 3.29 |
Median Household Size in Lagrange
The median household size in Lagrange is 2.50 persons per household, with married-couple households (3,831 | 31.6%) accounting for the largest median household size of 3.52 persons per household. non-family households (5,139 | 42.4%) represent the smallest median household size with 1.25 persons per household.
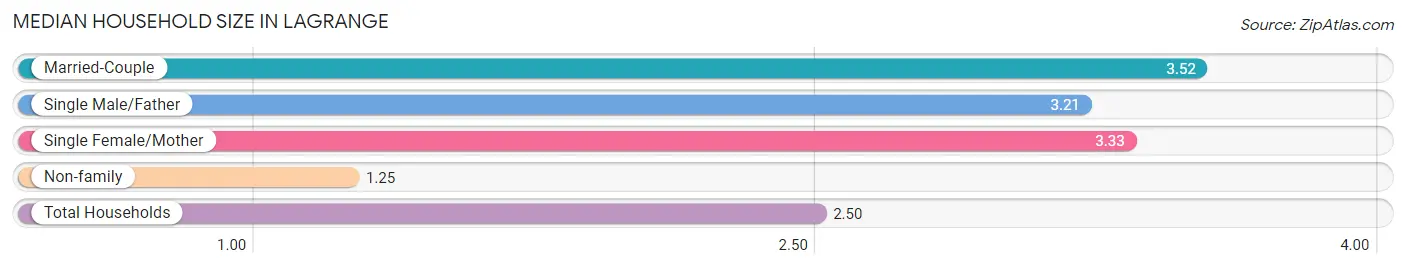
| Household Type | # Households | Household Size |
| Married-Couple | 3,831 (31.6%) | 3.52 |
| Single Male/Father | 657 (5.4%) | 3.21 |
| Single Female/Mother | 2,504 (20.6%) | 3.33 |
| Non-family | 5,139 (42.4%) | 1.25 |
| Total Households | 12,131 (100.0%) | 2.50 |
Household Size by Marriage Status in Lagrange
Out of a total of 12,131 households in Lagrange, 6,992 (57.6%) are family households, while 5,139 (42.4%) are nonfamily households. The most numerous type of family households are 2-person households, comprising 2,473, and the most common type of nonfamily households are 1-person households, comprising 4,442.
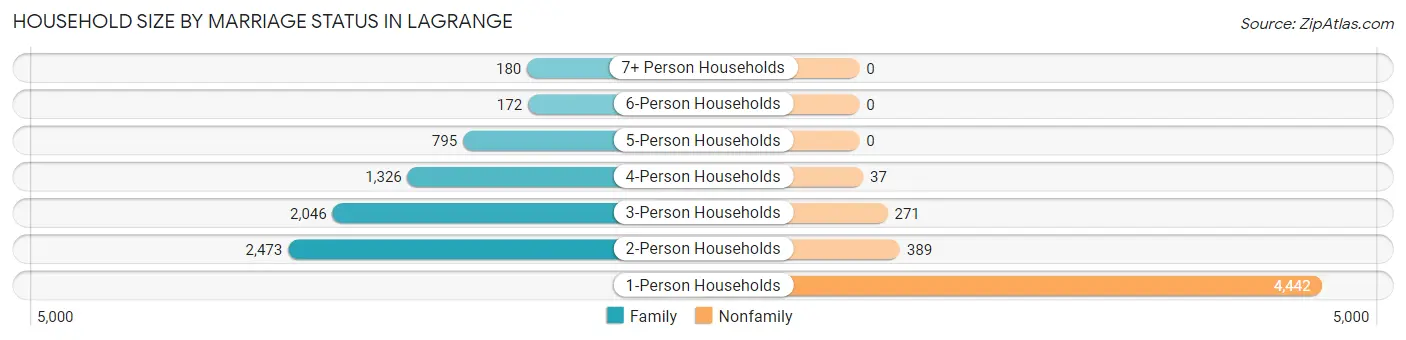
| Household Size | Family Households | Nonfamily Households |
| 1-Person Households | - | 4,442 (36.6%) |
| 2-Person Households | 2,473 (20.4%) | 389 (3.2%) |
| 3-Person Households | 2,046 (16.9%) | 271 (2.2%) |
| 4-Person Households | 1,326 (10.9%) | 37 (0.3%) |
| 5-Person Households | 795 (6.6%) | 0 (0.0%) |
| 6-Person Households | 172 (1.4%) | 0 (0.0%) |
| 7+ Person Households | 180 (1.5%) | 0 (0.0%) |
| Total | 6,992 (57.6%) | 5,139 (42.4%) |
Female Fertility in Lagrange
Fertility by Age in Lagrange
Average fertility rate in Lagrange is 34.0 births per 1,000 women. Women in the age bracket of 20 to 34 years have the highest fertility rate with 51.0 births per 1,000 women. Women in the age bracket of 20 to 34 years acount for 68.8% of all women with births.
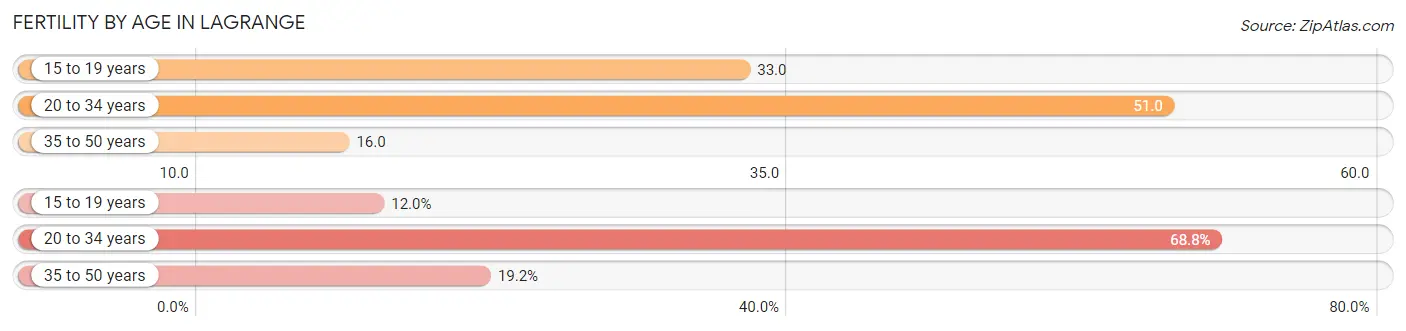
| Age Bracket | Women with Births | Births / 1,000 Women |
| 15 to 19 years | 33 (12.0%) | 33.0 |
| 20 to 34 years | 190 (68.8%) | 51.0 |
| 35 to 50 years | 53 (19.2%) | 16.0 |
| Total | 276 (100.0%) | 34.0 |
Fertility by Age by Marriage Status in Lagrange
18.5% of women with births (276) in Lagrange are married. The highest percentage of unmarried women with births falls into 15 to 19 years age bracket with 100.0% of them unmarried at the time of birth, while the lowest percentage of unmarried women with births belong to 20 to 34 years age bracket with 77.9% of them unmarried.
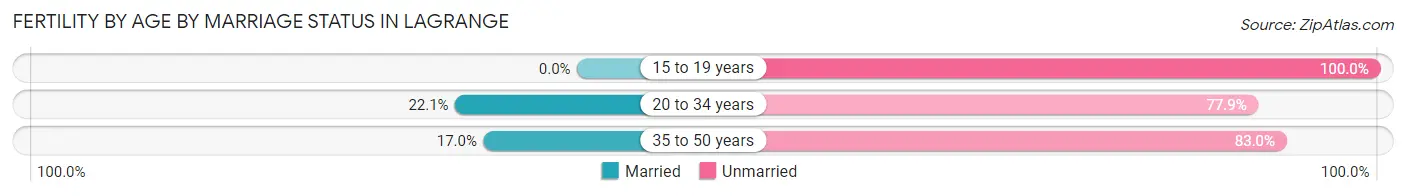
| Age Bracket | Married | Unmarried |
| 15 to 19 years | 0 (0.0%) | 33 (100.0%) |
| 20 to 34 years | 42 (22.1%) | 148 (77.9%) |
| 35 to 50 years | 9 (17.0%) | 44 (83.0%) |
| Total | 51 (18.5%) | 225 (81.5%) |
Fertility by Education in Lagrange
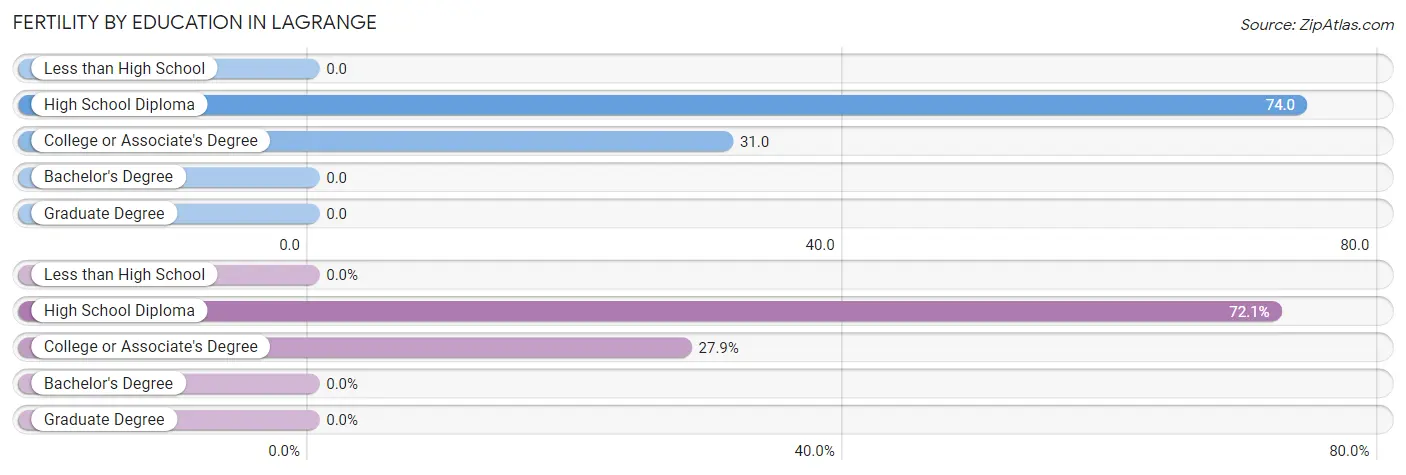
| Educational Attainment | Women with Births | Births / 1,000 Women |
| Less than High School | 0 (0.0%) | 0.0 |
| High School Diploma | 199 (72.1%) | 74.0 |
| College or Associate's Degree | 77 (27.9%) | 31.0 |
| Bachelor's Degree | 0 (0.0%) | 0.0 |
| Graduate Degree | 0 (0.0%) | 0.0 |
| Total | 276 (100.0%) | 34.0 |
Fertility by Education by Marriage Status in Lagrange
81.5% of women with births in Lagrange are unmarried. Women with the educational attainment of high school diploma are most likely to be married with 25.6% of them married at childbirth, while women with the educational attainment of college or associate's degree are least likely to be married with 100.0% of them unmarried at childbirth.
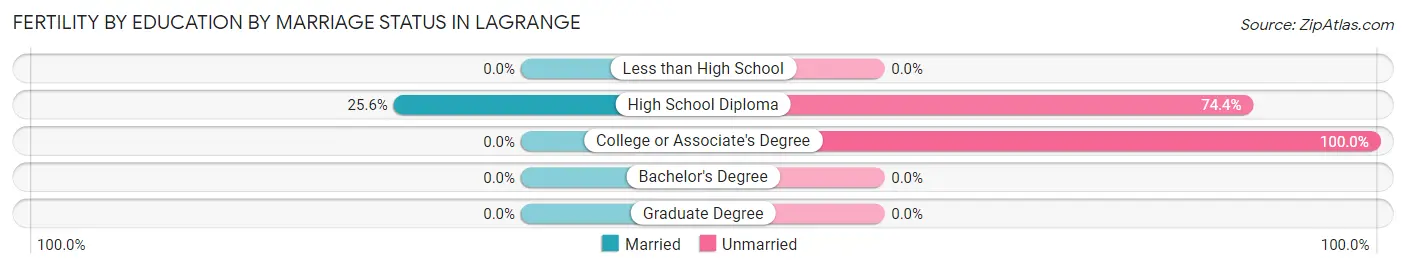
| Educational Attainment | Married | Unmarried |
| Less than High School | 0 (0.0%) | 0 (0.0%) |
| High School Diploma | 51 (25.6%) | 148 (74.4%) |
| College or Associate's Degree | 0 (0.0%) | 77 (100.0%) |
| Bachelor's Degree | 0 (0.0%) | 0 (0.0%) |
| Graduate Degree | 0 (0.0%) | 0 (0.0%) |
| Total | 51 (18.5%) | 225 (81.5%) |
Employment Characteristics in Lagrange
Employment by Class of Employer in Lagrange
Among the 13,649 employed individuals in Lagrange, private company employees (9,740 | 71.4%), local government employees (1,062 | 7.8%), and state government employees (754 | 5.5%) make up the most common classes of employment.
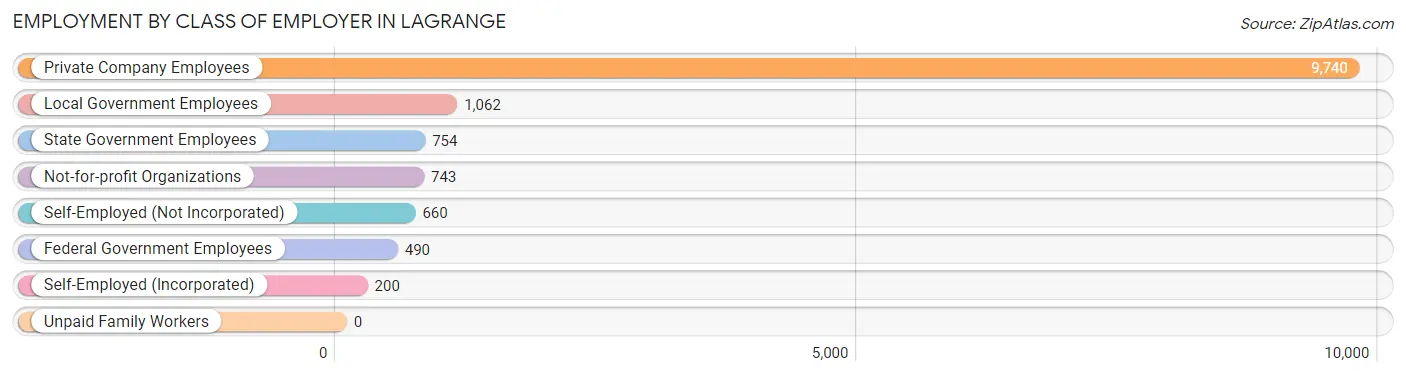
| Employer Class | # Employees | % Employees |
| Private Company Employees | 9,740 | 71.4% |
| Self-Employed (Incorporated) | 200 | 1.5% |
| Self-Employed (Not Incorporated) | 660 | 4.8% |
| Not-for-profit Organizations | 743 | 5.4% |
| Local Government Employees | 1,062 | 7.8% |
| State Government Employees | 754 | 5.5% |
| Federal Government Employees | 490 | 3.6% |
| Unpaid Family Workers | 0 | 0.0% |
| Total | 13,649 | 100.0% |
Employment Status by Age in Lagrange
According to the labor force statistics for Lagrange, out of the total population over 16 years of age (23,905), 61.6% or 14,725 individuals are in the labor force, with 5.3% or 780 of them unemployed. The age group with the highest labor force participation rate is 25 to 29 years, with 91.4% or 2,264 individuals in the labor force. Within the labor force, the 16 to 19 years age range has the highest percentage of unemployed individuals, with 28.5% or 109 of them being unemployed.
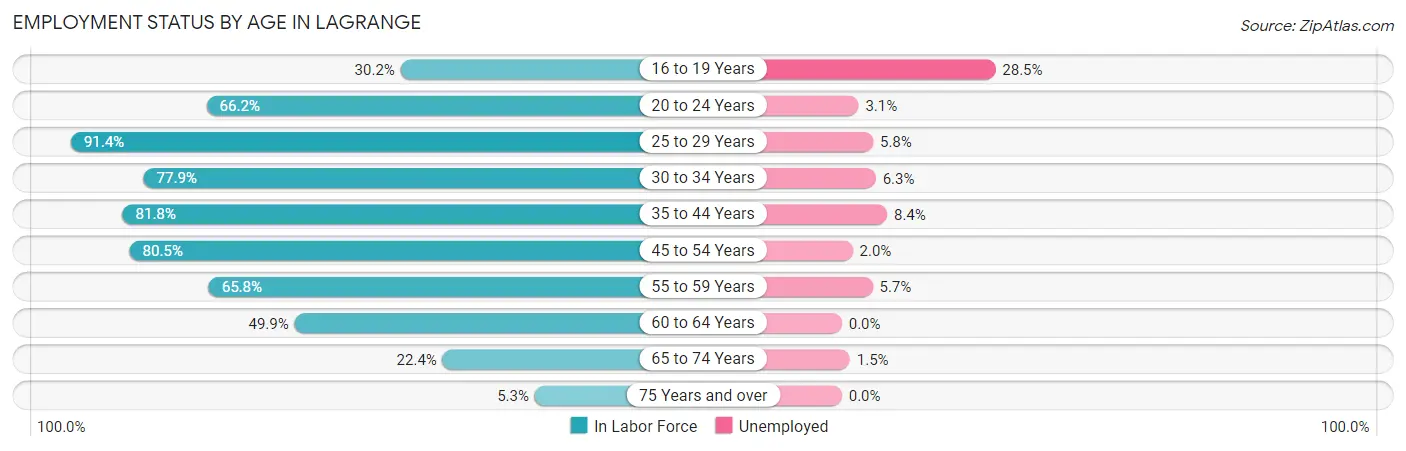
| Age Bracket | In Labor Force | Unemployed |
| 16 to 19 Years | 383 (30.2%) | 109 (28.5%) |
| 20 to 24 Years | 1,586 (66.2%) | 49 (3.1%) |
| 25 to 29 Years | 2,264 (91.4%) | 131 (5.8%) |
| 30 to 34 Years | 1,752 (77.9%) | 110 (6.3%) |
| 35 to 44 Years | 3,041 (81.8%) | 255 (8.4%) |
| 45 to 54 Years | 3,160 (80.5%) | 63 (2.0%) |
| 55 to 59 Years | 978 (65.8%) | 56 (5.7%) |
| 60 to 64 Years | 931 (49.9%) | 0 (0.0%) |
| 65 to 74 Years | 522 (22.4%) | 8 (1.5%) |
| 75 Years and over | 116 (5.3%) | 0 (0.0%) |
| Total | 14,725 (61.6%) | 780 (5.3%) |
Employment Status by Educational Attainment in Lagrange
According to labor force statistics for Lagrange, 77.1% of individuals (12,122) out of the total population between 25 and 64 years of age (15,722) are in the labor force, with 5.1% or 618 of them being unemployed. The group with the highest labor force participation rate are those with the educational attainment of bachelor's degree or higher, with 91.0% or 3,161 individuals in the labor force. Within the labor force, individuals with less than high school education have the highest percentage of unemployment, with 22.8% or 256 of them being unemployed.
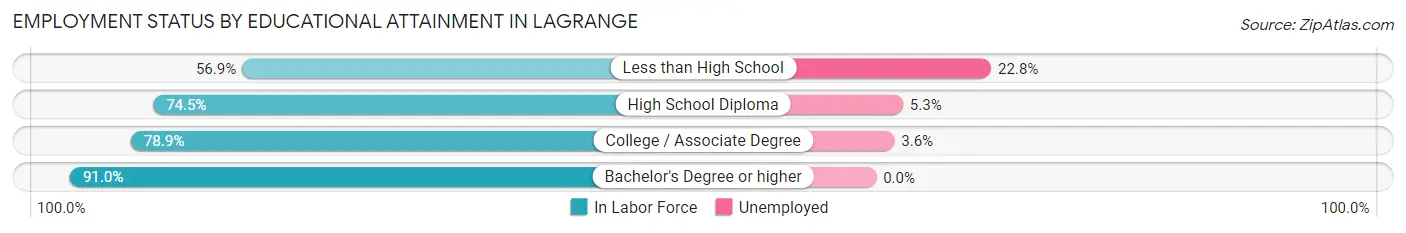
| Educational Attainment | In Labor Force | Unemployed |
| Less than High School | 1,124 (56.9%) | 450 (22.8%) |
| High School Diploma | 4,338 (74.5%) | 309 (5.3%) |
| College / Associate Degree | 3,511 (78.9%) | 160 (3.6%) |
| Bachelor's Degree or higher | 3,161 (91.0%) | 0 (0.0%) |
| Total | 12,122 (77.1%) | 802 (5.1%) |
Employment Occupations by Sex in Lagrange
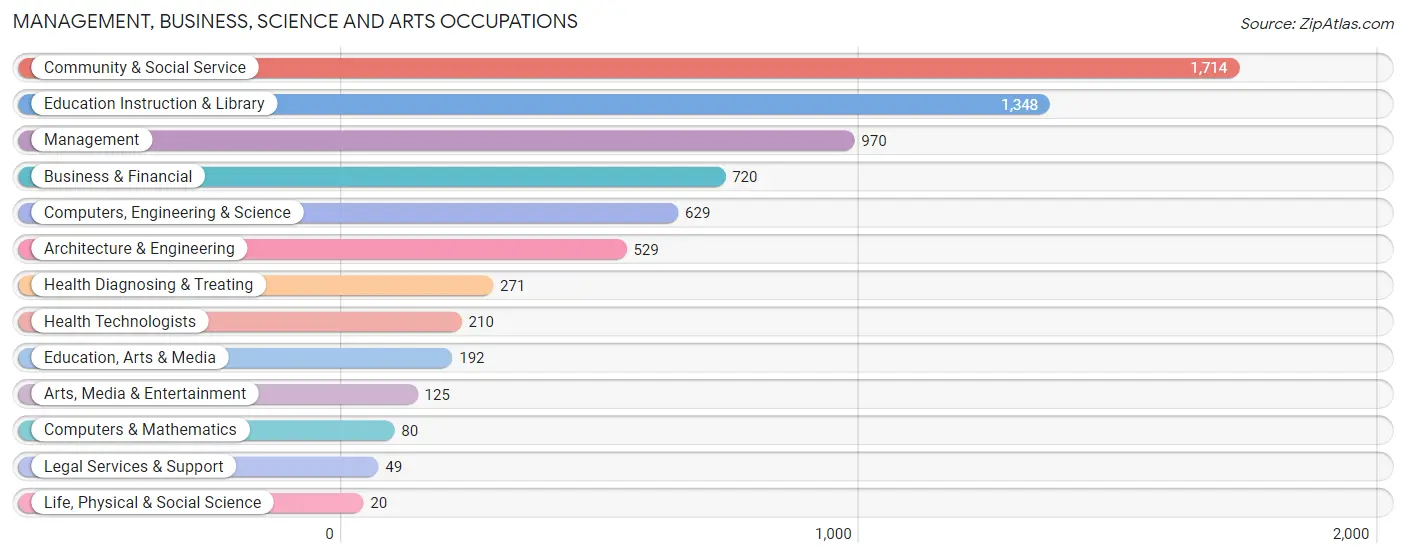
Management, Business, Science and Arts Occupations
The most common Management, Business, Science and Arts occupations in Lagrange are Community & Social Service (1,714 | 12.3%), Education Instruction & Library (1,348 | 9.7%), Management (970 | 7.0%), Business & Financial (720 | 5.2%), and Computers, Engineering & Science (629 | 4.5%).
Management, Business, Science and Arts Occupations by Sex
Within the Management, Business, Science and Arts occupations in Lagrange, the most male-oriented occupations are Computers & Mathematics (87.5%), Computers, Engineering & Science (74.1%), and Architecture & Engineering (73.4%), while the most female-oriented occupations are Legal Services & Support (100.0%), Health Technologists (82.4%), and Education Instruction & Library (76.3%).
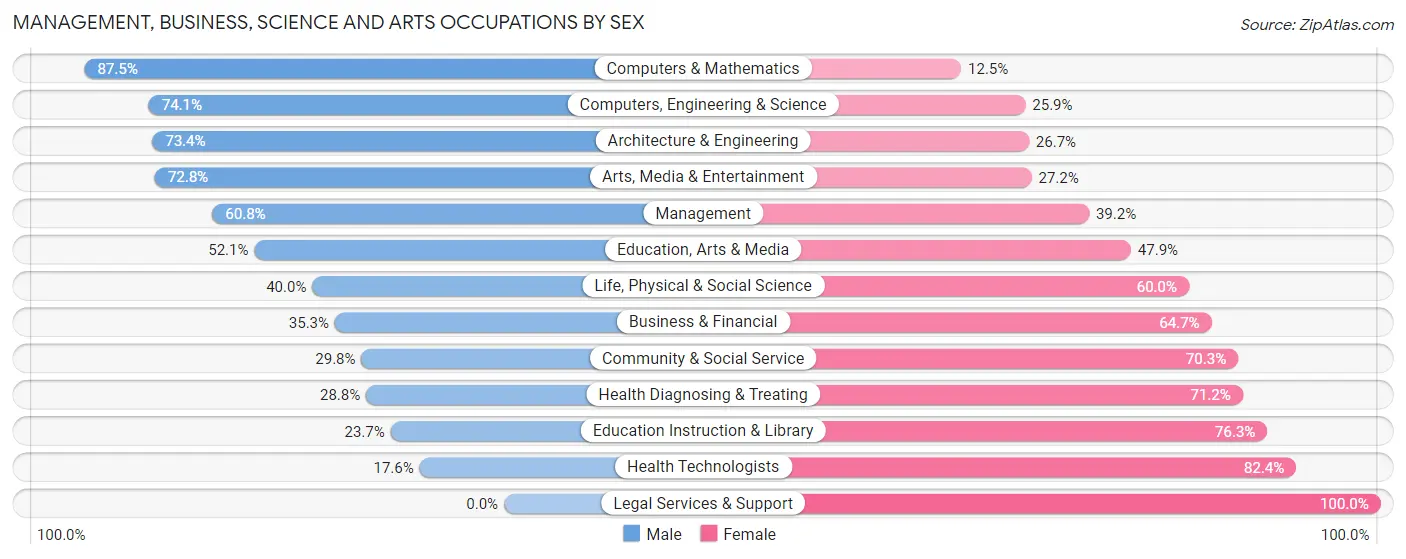
| Occupation | Male | Female |
| Management | 590 (60.8%) | 380 (39.2%) |
| Business & Financial | 254 (35.3%) | 466 (64.7%) |
| Computers, Engineering & Science | 466 (74.1%) | 163 (25.9%) |
| Computers & Mathematics | 70 (87.5%) | 10 (12.5%) |
| Architecture & Engineering | 388 (73.4%) | 141 (26.7%) |
| Life, Physical & Social Science | 8 (40.0%) | 12 (60.0%) |
| Community & Social Service | 510 (29.7%) | 1,204 (70.3%) |
| Education, Arts & Media | 100 (52.1%) | 92 (47.9%) |
| Legal Services & Support | 0 (0.0%) | 49 (100.0%) |
| Education Instruction & Library | 319 (23.7%) | 1,029 (76.3%) |
| Arts, Media & Entertainment | 91 (72.8%) | 34 (27.2%) |
| Health Diagnosing & Treating | 78 (28.8%) | 193 (71.2%) |
| Health Technologists | 37 (17.6%) | 173 (82.4%) |
| Total (Category) | 1,898 (44.1%) | 2,406 (55.9%) |
| Total (Overall) | 6,790 (48.6%) | 7,167 (51.3%) |
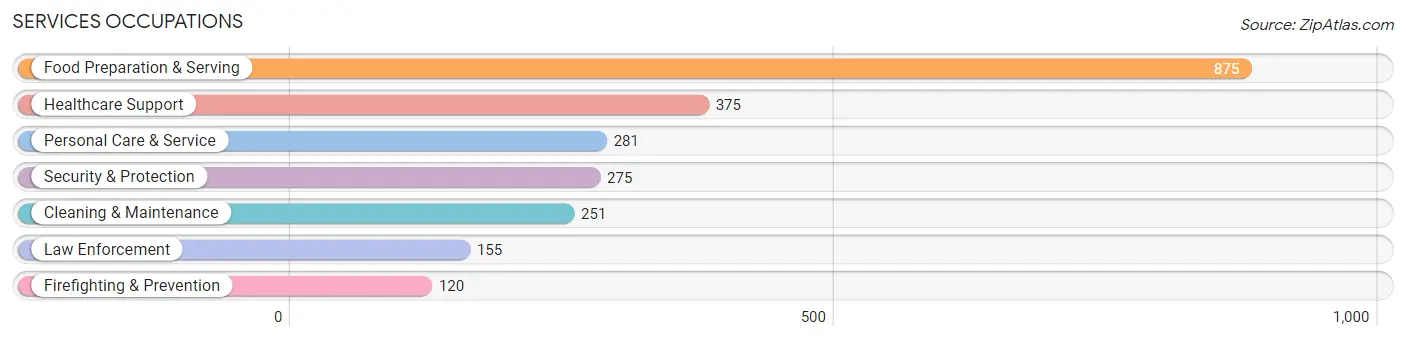
Services Occupations
The most common Services occupations in Lagrange are Food Preparation & Serving (875 | 6.3%), Healthcare Support (375 | 2.7%), Personal Care & Service (281 | 2.0%), Security & Protection (275 | 2.0%), and Cleaning & Maintenance (251 | 1.8%).
Services Occupations by Sex
Within the Services occupations in Lagrange, the most male-oriented occupations are Firefighting & Prevention (83.3%), Security & Protection (78.9%), and Law Enforcement (75.5%), while the most female-oriented occupations are Personal Care & Service (82.6%), Healthcare Support (81.3%), and Cleaning & Maintenance (73.7%).
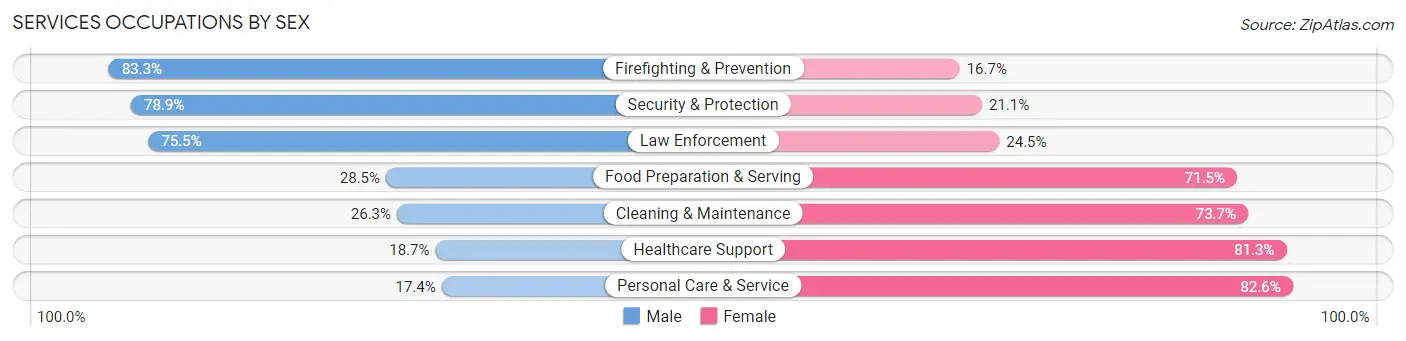
| Occupation | Male | Female |
| Healthcare Support | 70 (18.7%) | 305 (81.3%) |
| Security & Protection | 217 (78.9%) | 58 (21.1%) |
| Firefighting & Prevention | 100 (83.3%) | 20 (16.7%) |
| Law Enforcement | 117 (75.5%) | 38 (24.5%) |
| Food Preparation & Serving | 249 (28.5%) | 626 (71.5%) |
| Cleaning & Maintenance | 66 (26.3%) | 185 (73.7%) |
| Personal Care & Service | 49 (17.4%) | 232 (82.6%) |
| Total (Category) | 651 (31.7%) | 1,406 (68.3%) |
| Total (Overall) | 6,790 (48.6%) | 7,167 (51.3%) |
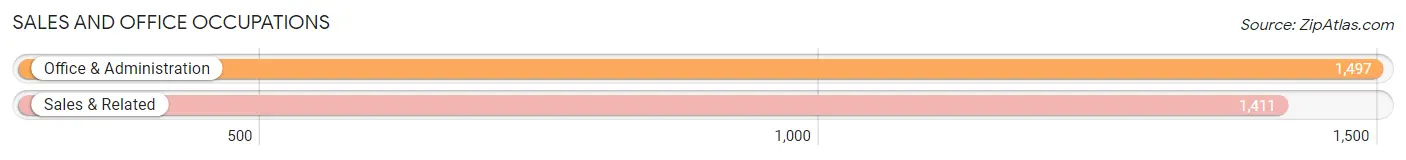
Sales and Office Occupations
The most common Sales and Office occupations in Lagrange are Office & Administration (1,497 | 10.7%), and Sales & Related (1,411 | 10.1%).
Sales and Office Occupations by Sex

| Occupation | Male | Female |
| Sales & Related | 817 (57.9%) | 594 (42.1%) |
| Office & Administration | 227 (15.2%) | 1,270 (84.8%) |
| Total (Category) | 1,044 (35.9%) | 1,864 (64.1%) |
| Total (Overall) | 6,790 (48.6%) | 7,167 (51.3%) |
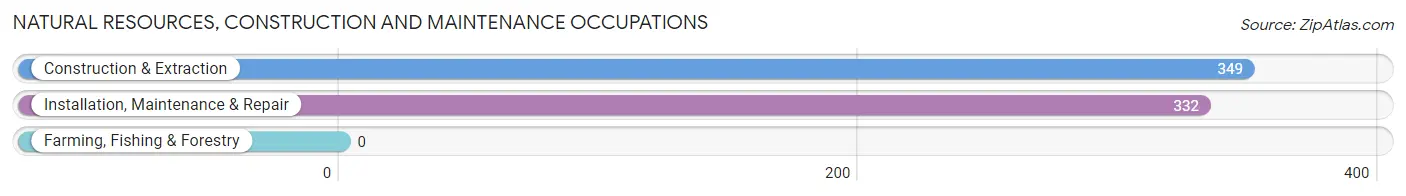
Natural Resources, Construction and Maintenance Occupations
The most common Natural Resources, Construction and Maintenance occupations in Lagrange are Construction & Extraction (349 | 2.5%), and Installation, Maintenance & Repair (332 | 2.4%).
Natural Resources, Construction and Maintenance Occupations by Sex
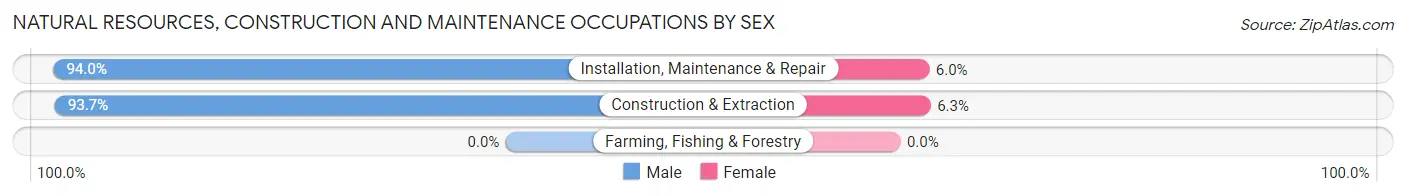
| Occupation | Male | Female |
| Farming, Fishing & Forestry | 0 (0.0%) | 0 (0.0%) |
| Construction & Extraction | 327 (93.7%) | 22 (6.3%) |
| Installation, Maintenance & Repair | 312 (94.0%) | 20 (6.0%) |
| Total (Category) | 639 (93.8%) | 42 (6.2%) |
| Total (Overall) | 6,790 (48.6%) | 7,167 (51.3%) |
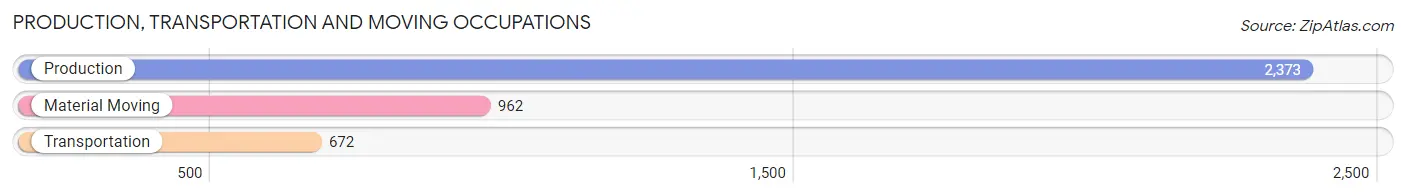
Production, Transportation and Moving Occupations
The most common Production, Transportation and Moving occupations in Lagrange are Production (2,373 | 17.0%), Material Moving (962 | 6.9%), and Transportation (672 | 4.8%).
Production, Transportation and Moving Occupations by Sex
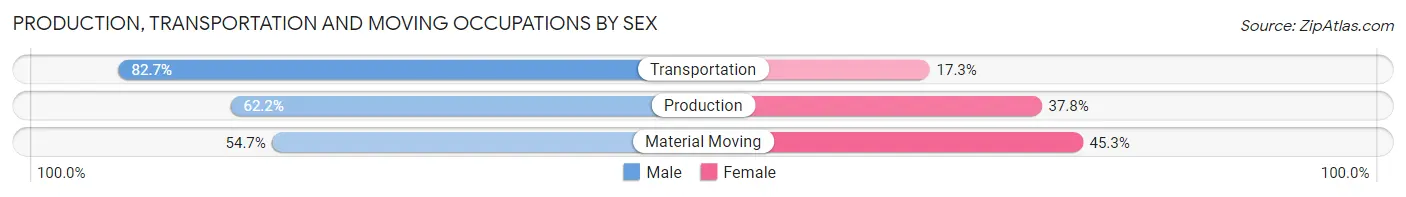
| Occupation | Male | Female |
| Production | 1,476 (62.2%) | 897 (37.8%) |
| Transportation | 556 (82.7%) | 116 (17.3%) |
| Material Moving | 526 (54.7%) | 436 (45.3%) |
| Total (Category) | 2,558 (63.8%) | 1,449 (36.2%) |
| Total (Overall) | 6,790 (48.6%) | 7,167 (51.3%) |
Employment Industries by Sex in Lagrange
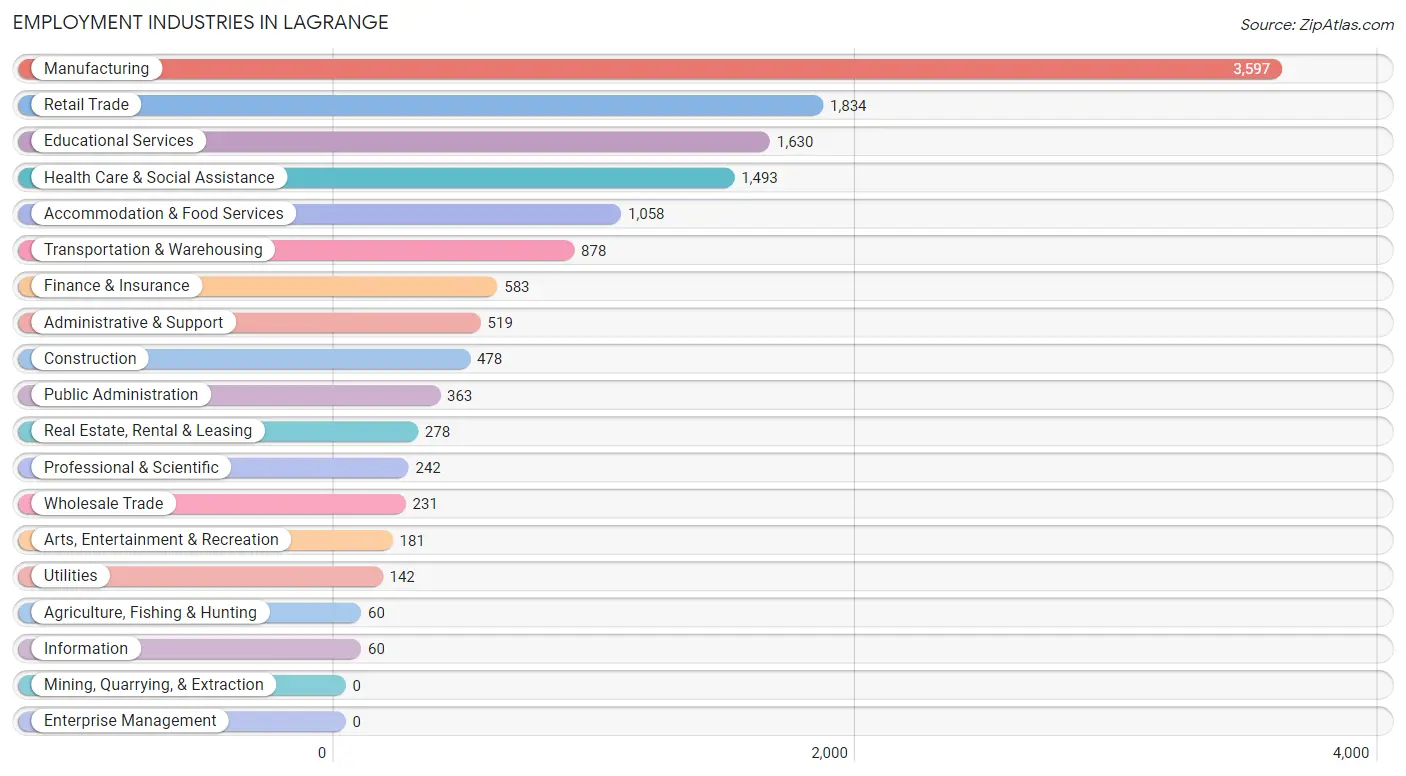
Employment Industries in Lagrange
The major employment industries in Lagrange include Manufacturing (3,597 | 25.8%), Retail Trade (1,834 | 13.1%), Educational Services (1,630 | 11.7%), Health Care & Social Assistance (1,493 | 10.7%), and Accommodation & Food Services (1,058 | 7.6%).
Employment Industries by Sex in Lagrange
The Lagrange industries that see more men than women are Utilities (100.0%), Information (90.0%), and Construction (79.3%), whereas the industries that tend to have a higher number of women are Agriculture, Fishing & Hunting (100.0%), Health Care & Social Assistance (89.0%), and Administrative & Support (78.0%).
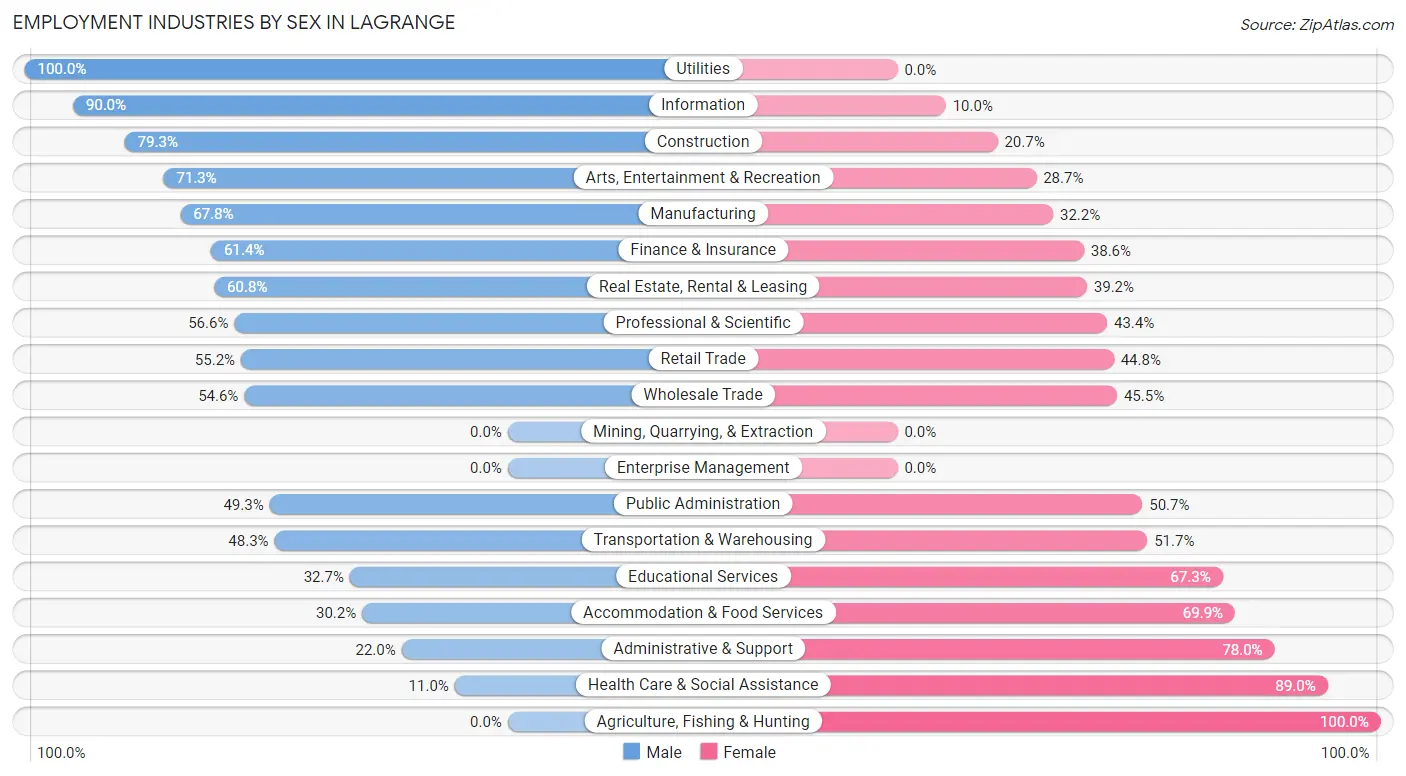
| Industry | Male | Female |
| Agriculture, Fishing & Hunting | 0 (0.0%) | 60 (100.0%) |
| Mining, Quarrying, & Extraction | 0 (0.0%) | 0 (0.0%) |
| Construction | 379 (79.3%) | 99 (20.7%) |
| Manufacturing | 2,438 (67.8%) | 1,159 (32.2%) |
| Wholesale Trade | 126 (54.5%) | 105 (45.5%) |
| Retail Trade | 1,013 (55.2%) | 821 (44.8%) |
| Transportation & Warehousing | 424 (48.3%) | 454 (51.7%) |
| Utilities | 142 (100.0%) | 0 (0.0%) |
| Information | 54 (90.0%) | 6 (10.0%) |
| Finance & Insurance | 358 (61.4%) | 225 (38.6%) |
| Real Estate, Rental & Leasing | 169 (60.8%) | 109 (39.2%) |
| Professional & Scientific | 137 (56.6%) | 105 (43.4%) |
| Enterprise Management | 0 (0.0%) | 0 (0.0%) |
| Administrative & Support | 114 (22.0%) | 405 (78.0%) |
| Educational Services | 533 (32.7%) | 1,097 (67.3%) |
| Health Care & Social Assistance | 164 (11.0%) | 1,329 (89.0%) |
| Arts, Entertainment & Recreation | 129 (71.3%) | 52 (28.7%) |
| Accommodation & Food Services | 319 (30.1%) | 739 (69.9%) |
| Public Administration | 179 (49.3%) | 184 (50.7%) |
| Total | 6,790 (48.6%) | 7,167 (51.3%) |
Education in Lagrange
School Enrollment in Lagrange
The most common levels of schooling among the 8,481 students in Lagrange are middle school (2,152 | 25.4%), elementary school (1,679 | 19.8%), and college / undergraduate (1,302 | 15.3%).
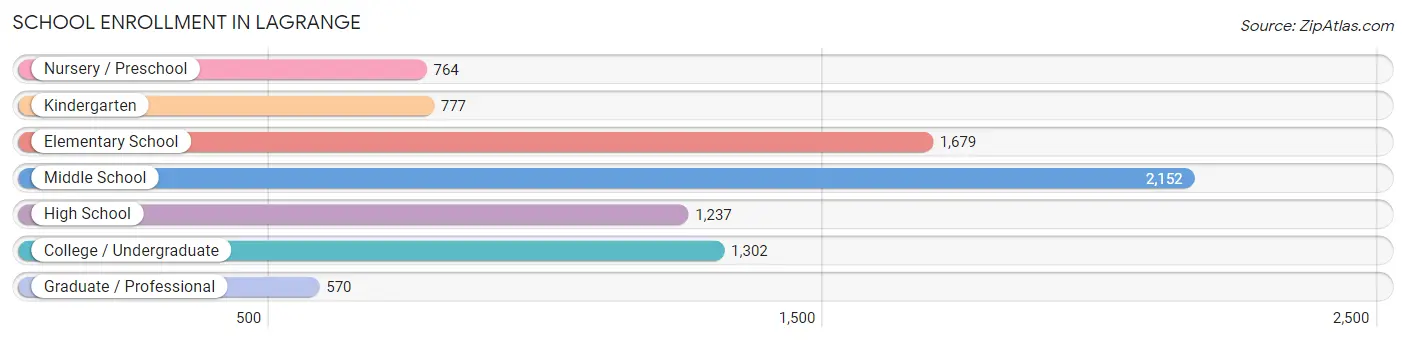
| School Level | # Students | % Students |
| Nursery / Preschool | 764 | 9.0% |
| Kindergarten | 777 | 9.2% |
| Elementary School | 1,679 | 19.8% |
| Middle School | 2,152 | 25.4% |
| High School | 1,237 | 14.6% |
| College / Undergraduate | 1,302 | 15.3% |
| Graduate / Professional | 570 | 6.7% |
| Total | 8,481 | 100.0% |
School Enrollment by Age by Funding Source in Lagrange
Out of a total of 8,481 students who are enrolled in schools in Lagrange, 1,077 (12.7%) attend a private institution, while the remaining 7,404 (87.3%) are enrolled in public schools. The age group of 35 years and over has the highest likelihood of being enrolled in private schools, with 196 (29.5% in the age bracket) enrolled. Conversely, the age group of 3 to 4 year olds has the lowest likelihood of being enrolled in a private school, with 632 (96.9% in the age bracket) attending a public institution.
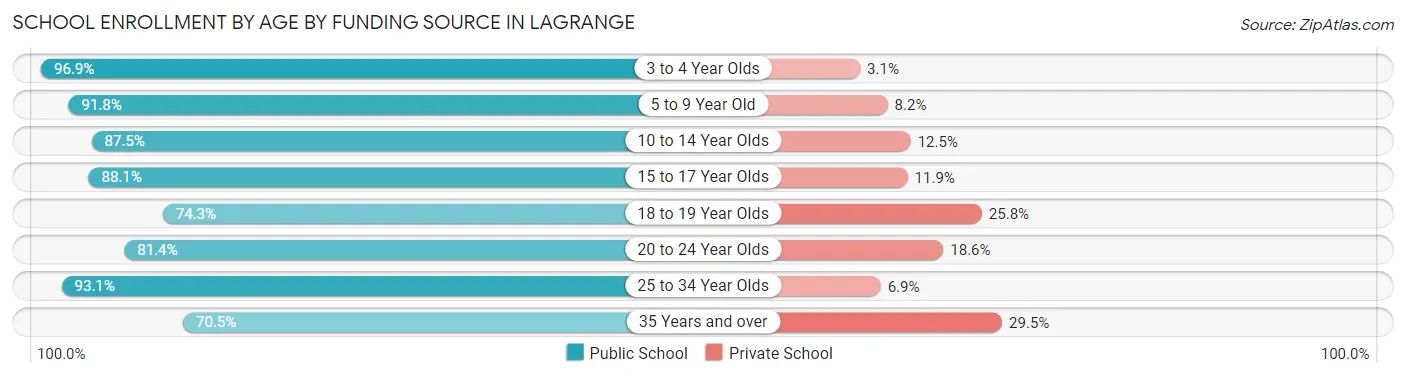
| Age Bracket | Public School | Private School |
| 3 to 4 Year Olds | 632 (96.9%) | 20 (3.1%) |
| 5 to 9 Year Old | 1,827 (91.8%) | 163 (8.2%) |
| 10 to 14 Year Olds | 2,208 (87.5%) | 315 (12.5%) |
| 15 to 17 Year Olds | 990 (88.1%) | 134 (11.9%) |
| 18 to 19 Year Olds | 320 (74.3%) | 111 (25.8%) |
| 20 to 24 Year Olds | 421 (81.4%) | 96 (18.6%) |
| 25 to 34 Year Olds | 540 (93.1%) | 40 (6.9%) |
| 35 Years and over | 468 (70.5%) | 196 (29.5%) |
| Total | 7,404 (87.3%) | 1,077 (12.7%) |
Educational Attainment by Field of Study in Lagrange
Education (1,165 | 23.6%), business (729 | 14.7%), arts & humanities (632 | 12.8%), engineering (453 | 9.2%), and social sciences (432 | 8.7%) are the most common fields of study among 4,942 individuals in Lagrange who have obtained a bachelor's degree or higher.
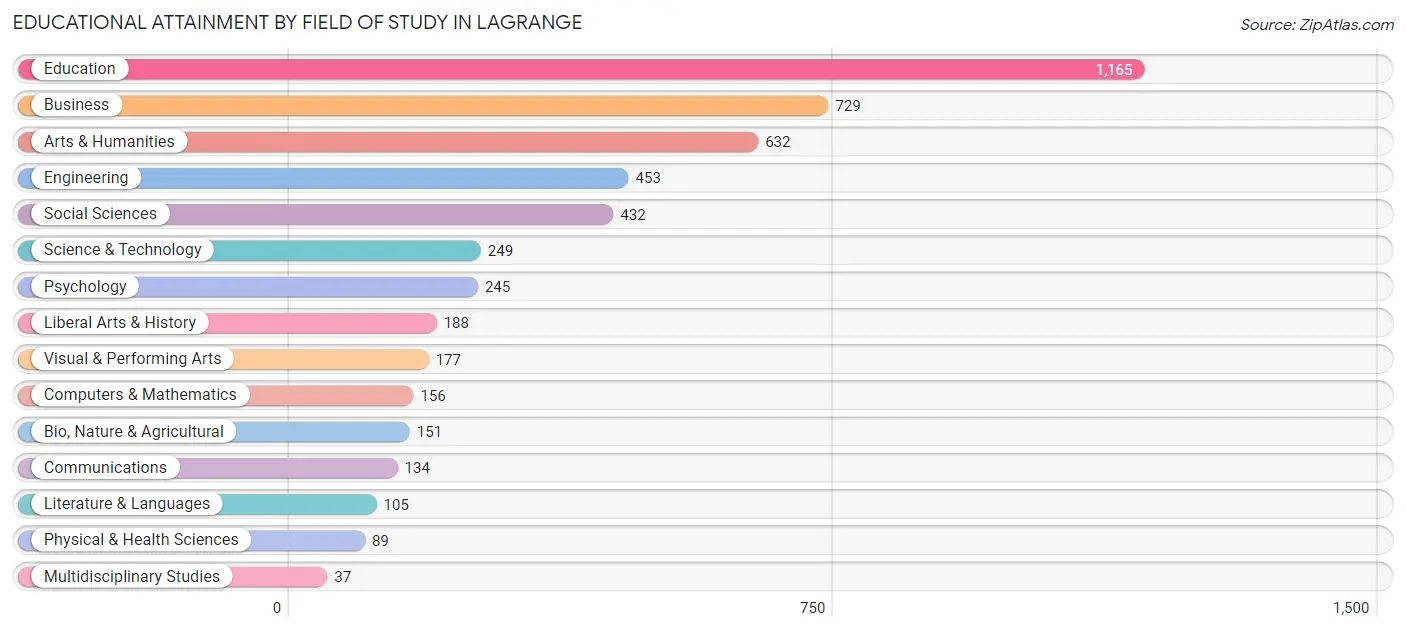
| Field of Study | # Graduates | % Graduates |
| Computers & Mathematics | 156 | 3.2% |
| Bio, Nature & Agricultural | 151 | 3.1% |
| Physical & Health Sciences | 89 | 1.8% |
| Psychology | 245 | 5.0% |
| Social Sciences | 432 | 8.7% |
| Engineering | 453 | 9.2% |
| Multidisciplinary Studies | 37 | 0.7% |
| Science & Technology | 249 | 5.0% |
| Business | 729 | 14.7% |
| Education | 1,165 | 23.6% |
| Literature & Languages | 105 | 2.1% |
| Liberal Arts & History | 188 | 3.8% |
| Visual & Performing Arts | 177 | 3.6% |
| Communications | 134 | 2.7% |
| Arts & Humanities | 632 | 12.8% |
| Total | 4,942 | 100.0% |
Transportation & Commute in Lagrange
Vehicle Availability by Sex in Lagrange
The most prevalent vehicle ownership categories in Lagrange are males with 2 vehicles (2,474, accounting for 37.3%) and females with 2 vehicles (2,037, making up 35.5%).
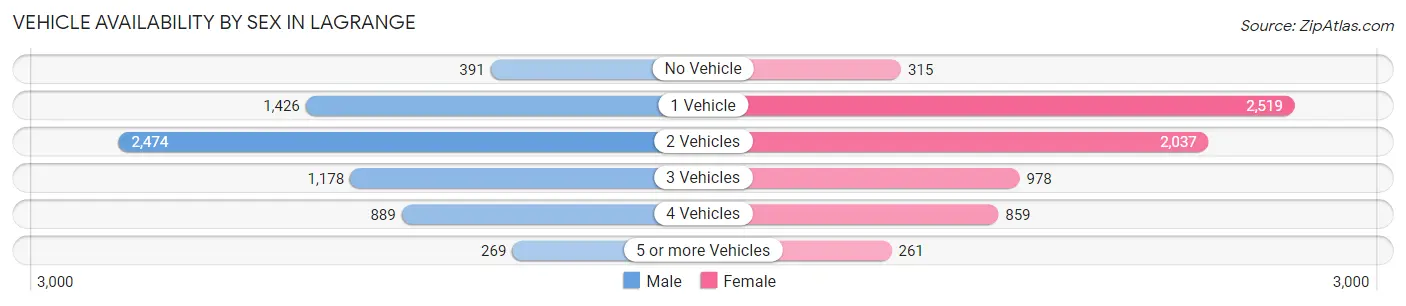
| Vehicles Available | Male | Female |
| No Vehicle | 391 (5.9%) | 315 (4.5%) |
| 1 Vehicle | 1,426 (21.5%) | 2,519 (36.1%) |
| 2 Vehicles | 2,474 (37.3%) | 2,037 (29.2%) |
| 3 Vehicles | 1,178 (17.8%) | 978 (14.0%) |
| 4 Vehicles | 889 (13.4%) | 859 (12.3%) |
| 5 or more Vehicles | 269 (4.1%) | 261 (3.7%) |
| Total | 6,627 (100.0%) | 6,969 (100.0%) |
Commute Time in Lagrange
The most frequently occuring commute durations in Lagrange are 15 to 19 minutes (2,944 commuters, 23.5%), 10 to 14 minutes (2,144 commuters, 17.1%), and 5 to 9 minutes (2,021 commuters, 16.1%).
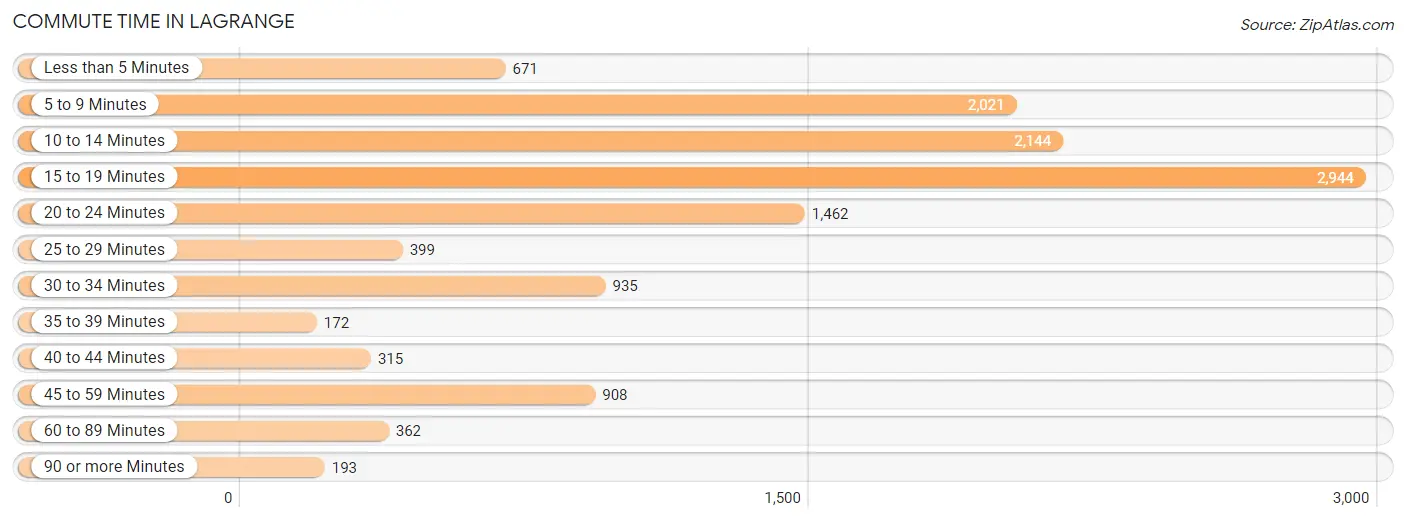
| Commute Time | # Commuters | % Commuters |
| Less than 5 Minutes | 671 | 5.4% |
| 5 to 9 Minutes | 2,021 | 16.1% |
| 10 to 14 Minutes | 2,144 | 17.1% |
| 15 to 19 Minutes | 2,944 | 23.5% |
| 20 to 24 Minutes | 1,462 | 11.7% |
| 25 to 29 Minutes | 399 | 3.2% |
| 30 to 34 Minutes | 935 | 7.5% |
| 35 to 39 Minutes | 172 | 1.4% |
| 40 to 44 Minutes | 315 | 2.5% |
| 45 to 59 Minutes | 908 | 7.2% |
| 60 to 89 Minutes | 362 | 2.9% |
| 90 or more Minutes | 193 | 1.5% |
Commute Time by Sex in Lagrange
The most common commute times in Lagrange are 15 to 19 minutes (1,416 commuters, 22.9%) for males and 15 to 19 minutes (1,528 commuters, 24.1%) for females.
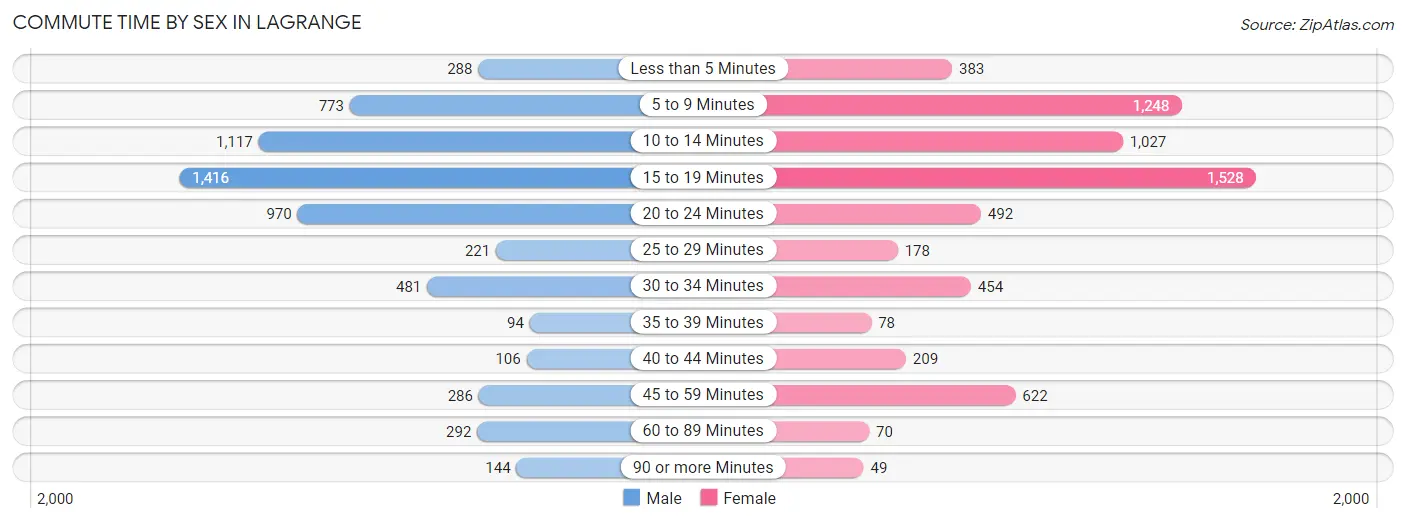
| Commute Time | Male | Female |
| Less than 5 Minutes | 288 (4.6%) | 383 (6.0%) |
| 5 to 9 Minutes | 773 (12.5%) | 1,248 (19.7%) |
| 10 to 14 Minutes | 1,117 (18.0%) | 1,027 (16.2%) |
| 15 to 19 Minutes | 1,416 (22.9%) | 1,528 (24.1%) |
| 20 to 24 Minutes | 970 (15.7%) | 492 (7.8%) |
| 25 to 29 Minutes | 221 (3.6%) | 178 (2.8%) |
| 30 to 34 Minutes | 481 (7.8%) | 454 (7.2%) |
| 35 to 39 Minutes | 94 (1.5%) | 78 (1.2%) |
| 40 to 44 Minutes | 106 (1.7%) | 209 (3.3%) |
| 45 to 59 Minutes | 286 (4.6%) | 622 (9.8%) |
| 60 to 89 Minutes | 292 (4.7%) | 70 (1.1%) |
| 90 or more Minutes | 144 (2.3%) | 49 (0.8%) |
Time of Departure to Work by Sex in Lagrange
The most frequent times of departure to work in Lagrange are 4:00 PM to 11:59 PM (915, 14.8%) for males and 7:30 AM to 7:59 AM (787, 12.4%) for females.
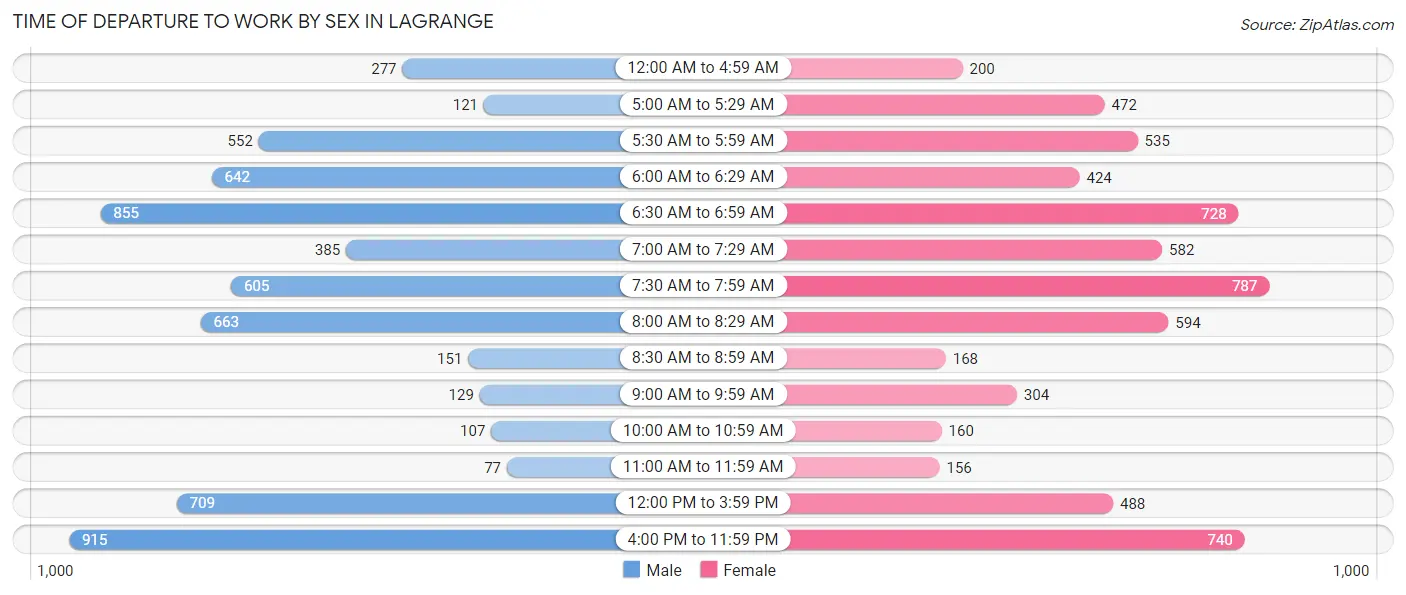
| Time of Departure | Male | Female |
| 12:00 AM to 4:59 AM | 277 (4.5%) | 200 (3.2%) |
| 5:00 AM to 5:29 AM | 121 (2.0%) | 472 (7.4%) |
| 5:30 AM to 5:59 AM | 552 (8.9%) | 535 (8.4%) |
| 6:00 AM to 6:29 AM | 642 (10.4%) | 424 (6.7%) |
| 6:30 AM to 6:59 AM | 855 (13.8%) | 728 (11.5%) |
| 7:00 AM to 7:29 AM | 385 (6.2%) | 582 (9.2%) |
| 7:30 AM to 7:59 AM | 605 (9.8%) | 787 (12.4%) |
| 8:00 AM to 8:29 AM | 663 (10.7%) | 594 (9.4%) |
| 8:30 AM to 8:59 AM | 151 (2.4%) | 168 (2.6%) |
| 9:00 AM to 9:59 AM | 129 (2.1%) | 304 (4.8%) |
| 10:00 AM to 10:59 AM | 107 (1.7%) | 160 (2.5%) |
| 11:00 AM to 11:59 AM | 77 (1.2%) | 156 (2.5%) |
| 12:00 PM to 3:59 PM | 709 (11.5%) | 488 (7.7%) |
| 4:00 PM to 11:59 PM | 915 (14.8%) | 740 (11.7%) |
| Total | 6,188 (100.0%) | 6,338 (100.0%) |
Housing Occupancy in Lagrange
Occupancy by Ownership in Lagrange
Of the total 12,131 dwellings in Lagrange, owner-occupied units account for 5,027 (41.4%), while renter-occupied units make up 7,104 (58.6%).
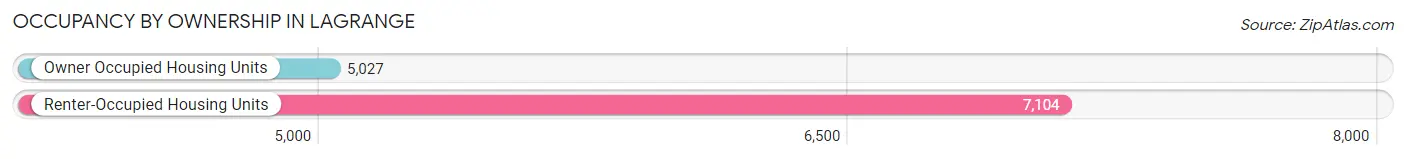
| Occupancy | # Housing Units | % Housing Units |
| Owner Occupied Housing Units | 5,027 | 41.4% |
| Renter-Occupied Housing Units | 7,104 | 58.6% |
| Total Occupied Housing Units | 12,131 | 100.0% |
Occupancy by Household Size in Lagrange
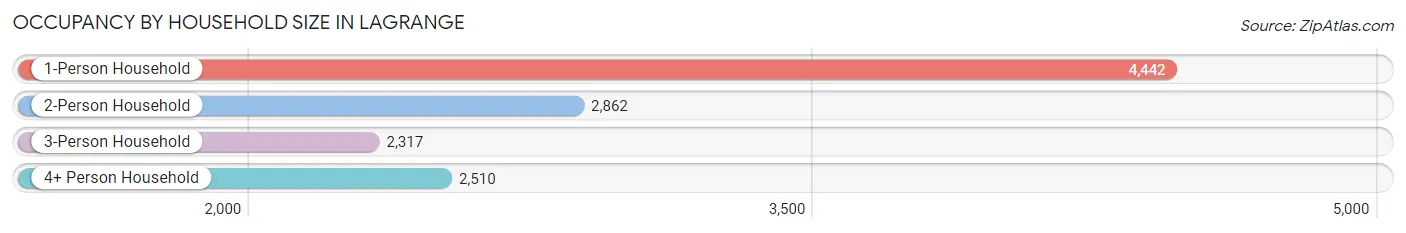
| Household Size | # Housing Units | % Housing Units |
| 1-Person Household | 4,442 | 36.6% |
| 2-Person Household | 2,862 | 23.6% |
| 3-Person Household | 2,317 | 19.1% |
| 4+ Person Household | 2,510 | 20.7% |
| Total Housing Units | 12,131 | 100.0% |
Occupancy by Ownership by Household Size in Lagrange
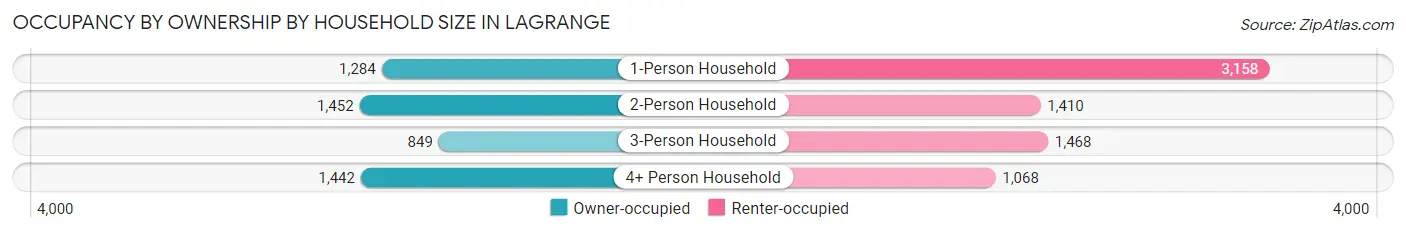
| Household Size | Owner-occupied | Renter-occupied |
| 1-Person Household | 1,284 (28.9%) | 3,158 (71.1%) |
| 2-Person Household | 1,452 (50.7%) | 1,410 (49.3%) |
| 3-Person Household | 849 (36.6%) | 1,468 (63.4%) |
| 4+ Person Household | 1,442 (57.5%) | 1,068 (42.5%) |
| Total Housing Units | 5,027 (41.4%) | 7,104 (58.6%) |
Occupancy by Educational Attainment in Lagrange
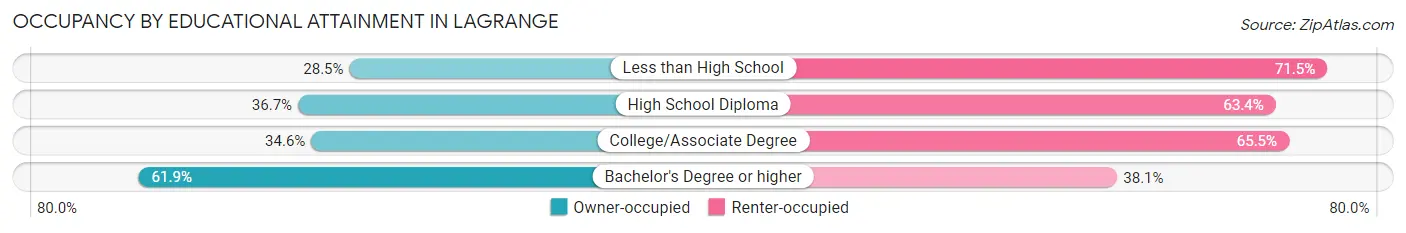
| Household Size | Owner-occupied | Renter-occupied |
| Less than High School | 414 (28.5%) | 1,039 (71.5%) |
| High School Diploma | 1,534 (36.6%) | 2,651 (63.3%) |
| College/Associate Degree | 1,188 (34.5%) | 2,250 (65.4%) |
| Bachelor's Degree or higher | 1,891 (61.9%) | 1,164 (38.1%) |
Occupancy by Age of Householder in Lagrange
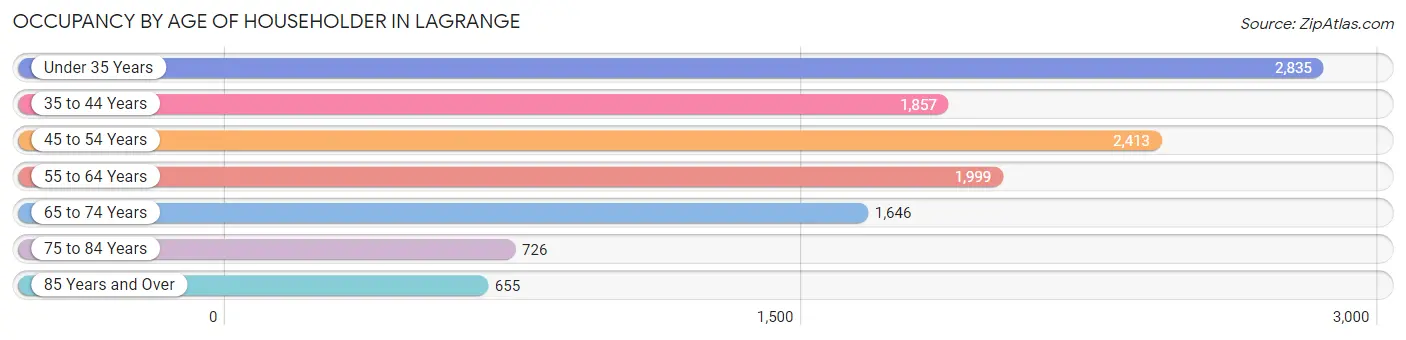
| Age Bracket | # Households | % Households |
| Under 35 Years | 2,835 | 23.4% |
| 35 to 44 Years | 1,857 | 15.3% |
| 45 to 54 Years | 2,413 | 19.9% |
| 55 to 64 Years | 1,999 | 16.5% |
| 65 to 74 Years | 1,646 | 13.6% |
| 75 to 84 Years | 726 | 6.0% |
| 85 Years and Over | 655 | 5.4% |
| Total | 12,131 | 100.0% |
Housing Finances in Lagrange
Median Income by Occupancy in Lagrange
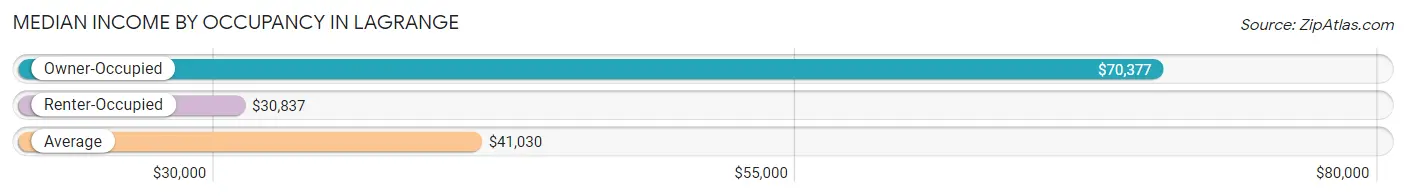
| Occupancy Type | # Households | Median Income |
| Owner-Occupied | 5,027 (41.4%) | $70,377 |
| Renter-Occupied | 7,104 (58.6%) | $30,837 |
| Average | 12,131 (100.0%) | $41,030 |
Occupancy by Householder Income Bracket in Lagrange
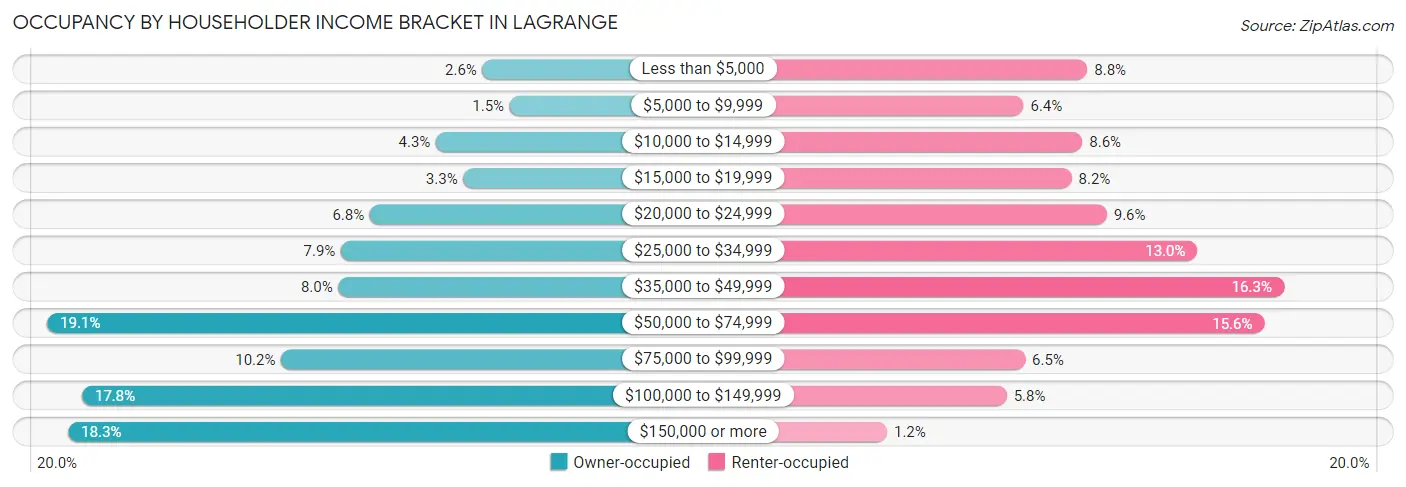
| Income Bracket | Owner-occupied | Renter-occupied |
| Less than $5,000 | 128 (2.5%) | 627 (8.8%) |
| $5,000 to $9,999 | 76 (1.5%) | 455 (6.4%) |
| $10,000 to $14,999 | 217 (4.3%) | 614 (8.6%) |
| $15,000 to $19,999 | 165 (3.3%) | 585 (8.2%) |
| $20,000 to $24,999 | 344 (6.8%) | 680 (9.6%) |
| $25,000 to $34,999 | 399 (7.9%) | 925 (13.0%) |
| $35,000 to $49,999 | 404 (8.0%) | 1,159 (16.3%) |
| $50,000 to $74,999 | 962 (19.1%) | 1,106 (15.6%) |
| $75,000 to $99,999 | 514 (10.2%) | 459 (6.5%) |
| $100,000 to $149,999 | 896 (17.8%) | 409 (5.8%) |
| $150,000 or more | 922 (18.3%) | 85 (1.2%) |
| Total | 5,027 (100.0%) | 7,104 (100.0%) |
Monthly Housing Cost Tiers in Lagrange
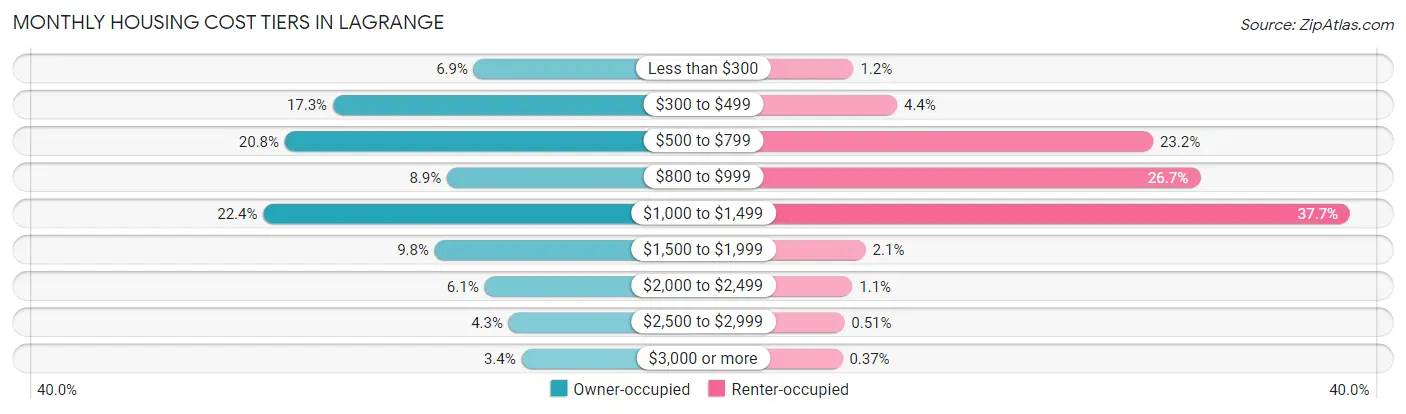
| Monthly Cost | Owner-occupied | Renter-occupied |
| Less than $300 | 348 (6.9%) | 84 (1.2%) |
| $300 to $499 | 869 (17.3%) | 312 (4.4%) |
| $500 to $799 | 1,047 (20.8%) | 1,651 (23.2%) |
| $800 to $999 | 447 (8.9%) | 1,897 (26.7%) |
| $1,000 to $1,499 | 1,127 (22.4%) | 2,681 (37.7%) |
| $1,500 to $1,999 | 492 (9.8%) | 148 (2.1%) |
| $2,000 to $2,499 | 308 (6.1%) | 78 (1.1%) |
| $2,500 to $2,999 | 218 (4.3%) | 36 (0.5%) |
| $3,000 or more | 171 (3.4%) | 26 (0.4%) |
| Total | 5,027 (100.0%) | 7,104 (100.0%) |
Physical Housing Characteristics in Lagrange
Housing Structures in Lagrange
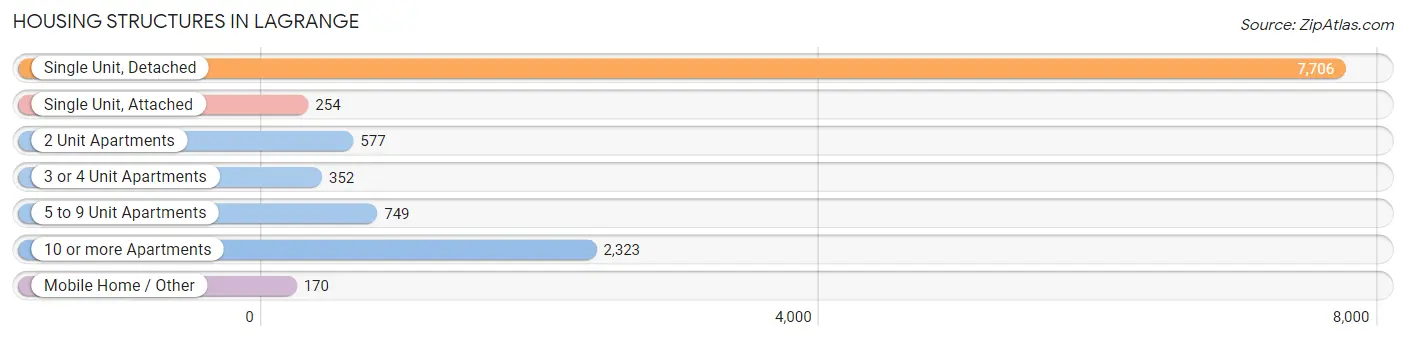
| Structure Type | # Housing Units | % Housing Units |
| Single Unit, Detached | 7,706 | 63.5% |
| Single Unit, Attached | 254 | 2.1% |
| 2 Unit Apartments | 577 | 4.8% |
| 3 or 4 Unit Apartments | 352 | 2.9% |
| 5 to 9 Unit Apartments | 749 | 6.2% |
| 10 or more Apartments | 2,323 | 19.2% |
| Mobile Home / Other | 170 | 1.4% |
| Total | 12,131 | 100.0% |
Housing Structures by Occupancy in Lagrange
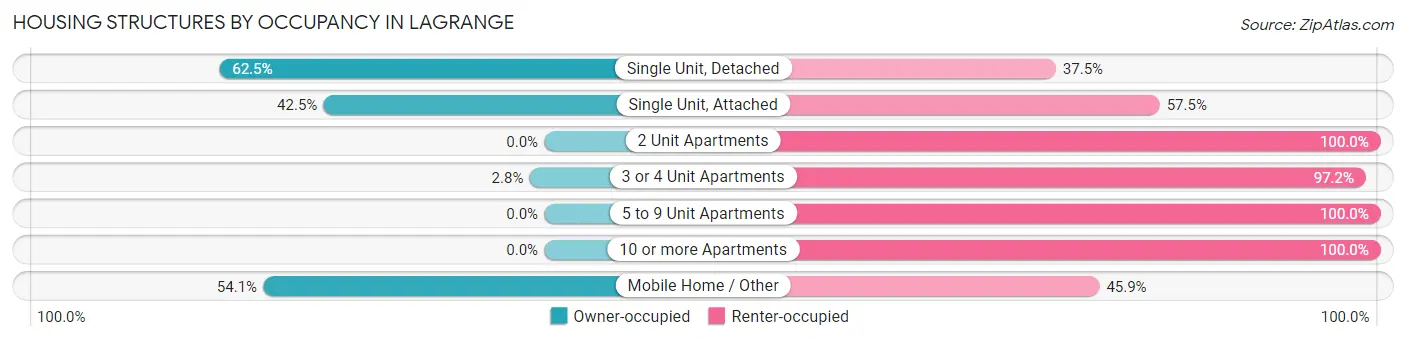
| Structure Type | Owner-occupied | Renter-occupied |
| Single Unit, Detached | 4,817 (62.5%) | 2,889 (37.5%) |
| Single Unit, Attached | 108 (42.5%) | 146 (57.5%) |
| 2 Unit Apartments | 0 (0.0%) | 577 (100.0%) |
| 3 or 4 Unit Apartments | 10 (2.8%) | 342 (97.2%) |
| 5 to 9 Unit Apartments | 0 (0.0%) | 749 (100.0%) |
| 10 or more Apartments | 0 (0.0%) | 2,323 (100.0%) |
| Mobile Home / Other | 92 (54.1%) | 78 (45.9%) |
| Total | 5,027 (41.4%) | 7,104 (58.6%) |
Housing Structures by Number of Rooms in Lagrange
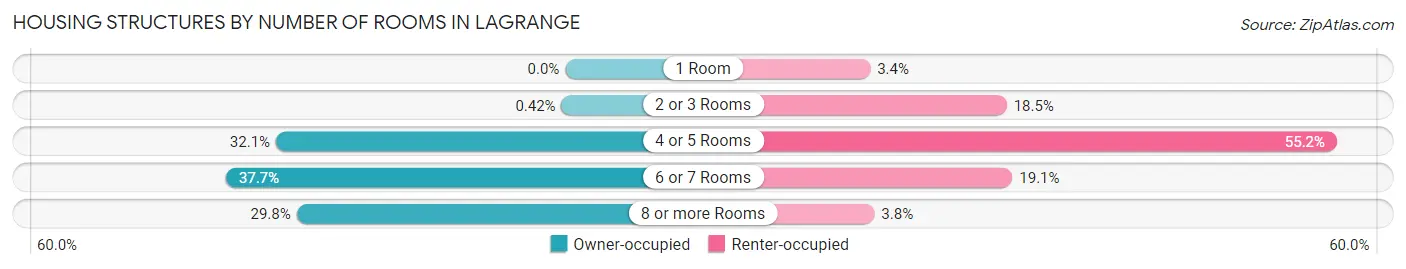
| Number of Rooms | Owner-occupied | Renter-occupied |
| 1 Room | 0 (0.0%) | 239 (3.4%) |
| 2 or 3 Rooms | 21 (0.4%) | 1,315 (18.5%) |
| 4 or 5 Rooms | 1,614 (32.1%) | 3,918 (55.1%) |
| 6 or 7 Rooms | 1,893 (37.7%) | 1,360 (19.1%) |
| 8 or more Rooms | 1,499 (29.8%) | 272 (3.8%) |
| Total | 5,027 (100.0%) | 7,104 (100.0%) |
Housing Structure by Heating Type in Lagrange
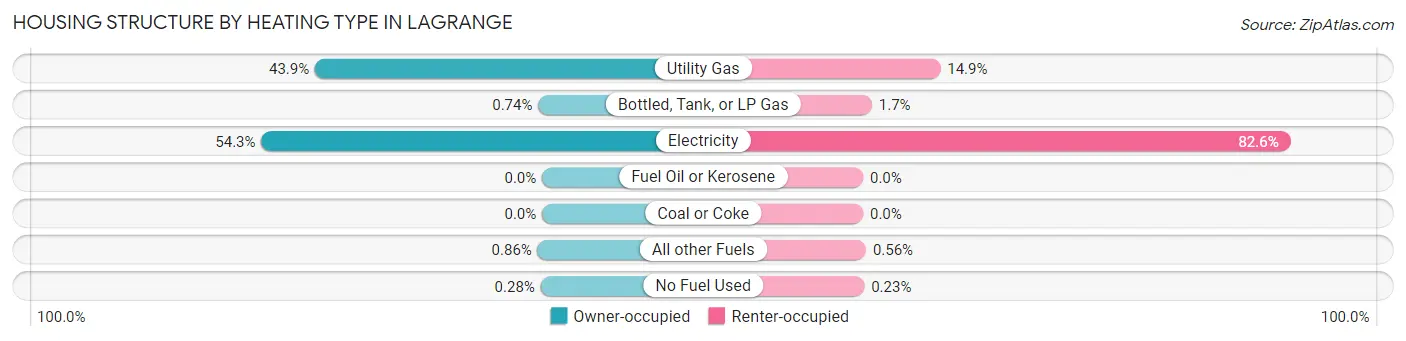
| Heating Type | Owner-occupied | Renter-occupied |
| Utility Gas | 2,206 (43.9%) | 1,060 (14.9%) |
| Bottled, Tank, or LP Gas | 37 (0.7%) | 121 (1.7%) |
| Electricity | 2,727 (54.2%) | 5,867 (82.6%) |
| Fuel Oil or Kerosene | 0 (0.0%) | 0 (0.0%) |
| Coal or Coke | 0 (0.0%) | 0 (0.0%) |
| All other Fuels | 43 (0.9%) | 40 (0.6%) |
| No Fuel Used | 14 (0.3%) | 16 (0.2%) |
| Total | 5,027 (100.0%) | 7,104 (100.0%) |
Household Vehicle Usage in Lagrange
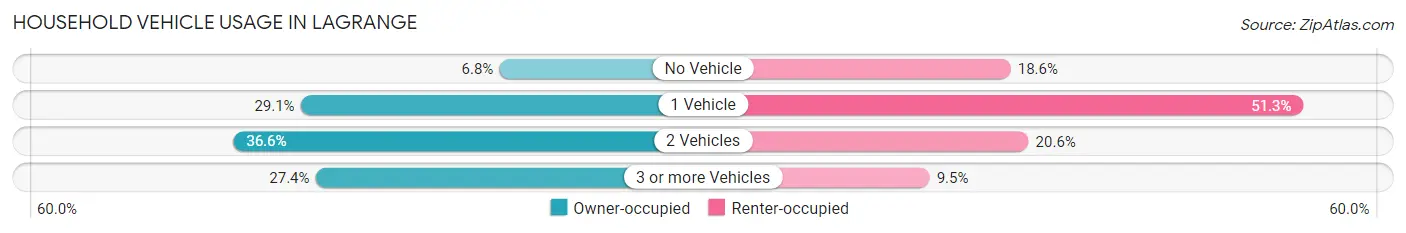
| Vehicles per Household | Owner-occupied | Renter-occupied |
| No Vehicle | 344 (6.8%) | 1,320 (18.6%) |
| 1 Vehicle | 1,463 (29.1%) | 3,647 (51.3%) |
| 2 Vehicles | 1,841 (36.6%) | 1,462 (20.6%) |
| 3 or more Vehicles | 1,379 (27.4%) | 675 (9.5%) |
| Total | 5,027 (100.0%) | 7,104 (100.0%) |
Real Estate & Mortgages in Lagrange
Real Estate and Mortgage Overview in Lagrange
| Characteristic | Without Mortgage | With Mortgage |
| Housing Units | 2,109 | 2,918 |
| Median Property Value | $116,900 | $165,600 |
| Median Household Income | $42,209 | $717 |
| Monthly Housing Costs | $470 | $171 |
| Real Estate Taxes | $1,097 | $40 |
Property Value by Mortgage Status in Lagrange
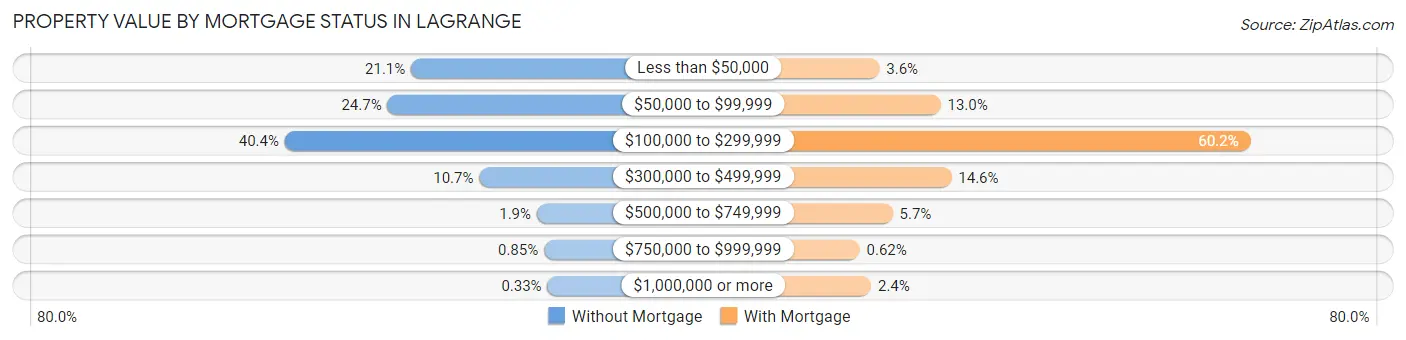
| Property Value | Without Mortgage | With Mortgage |
| Less than $50,000 | 445 (21.1%) | 106 (3.6%) |
| $50,000 to $99,999 | 521 (24.7%) | 378 (13.0%) |
| $100,000 to $299,999 | 851 (40.4%) | 1,756 (60.2%) |
| $300,000 to $499,999 | 226 (10.7%) | 426 (14.6%) |
| $500,000 to $749,999 | 41 (1.9%) | 165 (5.7%) |
| $750,000 to $999,999 | 18 (0.9%) | 18 (0.6%) |
| $1,000,000 or more | 7 (0.3%) | 69 (2.4%) |
| Total | 2,109 (100.0%) | 2,918 (100.0%) |
Household Income by Mortgage Status in Lagrange
| Household Income | Without Mortgage | With Mortgage |
| Less than $10,000 | 123 (5.8%) | 7 (0.2%) |
| $10,000 to $24,999 | 583 (27.6%) | 81 (2.8%) |
| $25,000 to $34,999 | 217 (10.3%) | 143 (4.9%) |
| $35,000 to $49,999 | 215 (10.2%) | 182 (6.2%) |
| $50,000 to $74,999 | 352 (16.7%) | 189 (6.5%) |
| $75,000 to $99,999 | 115 (5.4%) | 610 (20.9%) |
| $100,000 to $149,999 | 299 (14.2%) | 399 (13.7%) |
| $150,000 or more | 205 (9.7%) | 597 (20.5%) |
| Total | 2,109 (100.0%) | 2,918 (100.0%) |
Property Value to Household Income Ratio in Lagrange
| Value-to-Income Ratio | Without Mortgage | With Mortgage |
| Less than 2.0x | 809 (38.4%) | 90,993 (3,118.3%) |
| 2.0x to 2.9x | 410 (19.4%) | 1,453 (49.8%) |
| 3.0x to 3.9x | 329 (15.6%) | 838 (28.7%) |
| 4.0x or more | 490 (23.2%) | 205 (7.0%) |
| Total | 2,109 (100.0%) | 2,918 (100.0%) |
Real Estate Taxes by Mortgage Status in Lagrange
| Property Taxes | Without Mortgage | With Mortgage |
| Less than $800 | 751 (35.6%) | 57 (1.9%) |
| $800 to $1,499 | 414 (19.6%) | 377 (12.9%) |
| $800 to $1,499 | 749 (35.5%) | 662 (22.7%) |
| Total | 2,109 (100.0%) | 2,918 (100.0%) |
Health & Disability in Lagrange
Health Insurance Coverage by Age in Lagrange
| Age Bracket | With Coverage | Without Coverage |
| Under 6 Years | 2,671 (98.7%) | 35 (1.3%) |
| 6 to 18 Years | 4,986 (92.8%) | 386 (7.2%) |
| 19 to 25 Years | 2,798 (81.3%) | 642 (18.7%) |
| 26 to 34 Years | 3,114 (77.4%) | 909 (22.6%) |
| 35 to 44 Years | 2,673 (73.3%) | 974 (26.7%) |
| 45 to 54 Years | 3,414 (88.1%) | 460 (11.9%) |
| 55 to 64 Years | 3,043 (92.3%) | 252 (7.6%) |
| 65 to 74 Years | 2,217 (100.0%) | 0 (0.0%) |
| 75 Years and older | 1,938 (100.0%) | 0 (0.0%) |
| Total | 26,854 (88.0%) | 3,658 (12.0%) |
Health Insurance Coverage by Citizenship Status in Lagrange

| Citizenship Status | With Coverage | Without Coverage |
| Native Born | 2,671 (98.7%) | 35 (1.3%) |
| Foreign Born, Citizen | 4,986 (92.8%) | 386 (7.2%) |
| Foreign Born, not a Citizen | 2,798 (81.3%) | 642 (18.7%) |
Health Insurance Coverage by Household Income in Lagrange
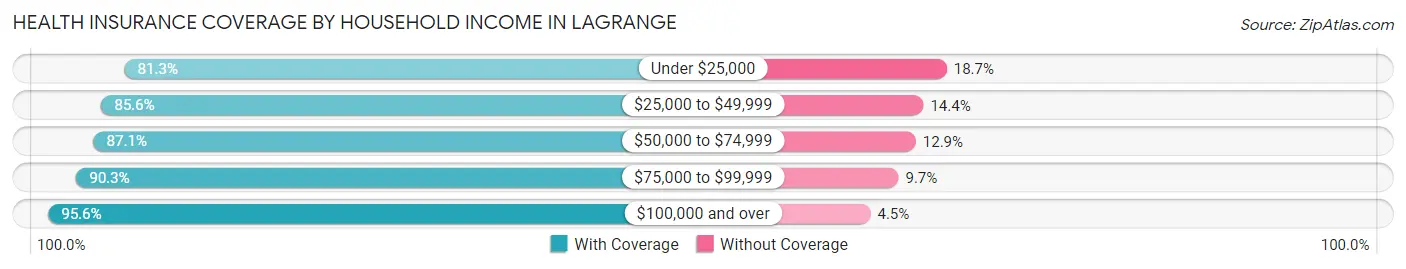
| Household Income | With Coverage | Without Coverage |
| Under $25,000 | 5,619 (81.3%) | 1,295 (18.7%) |
| $25,000 to $49,999 | 5,597 (85.6%) | 939 (14.4%) |
| $50,000 to $74,999 | 4,910 (87.1%) | 730 (12.9%) |
| $75,000 to $99,999 | 2,777 (90.3%) | 298 (9.7%) |
| $100,000 and over | 7,807 (95.6%) | 364 (4.4%) |
Public vs Private Health Insurance Coverage by Age in Lagrange
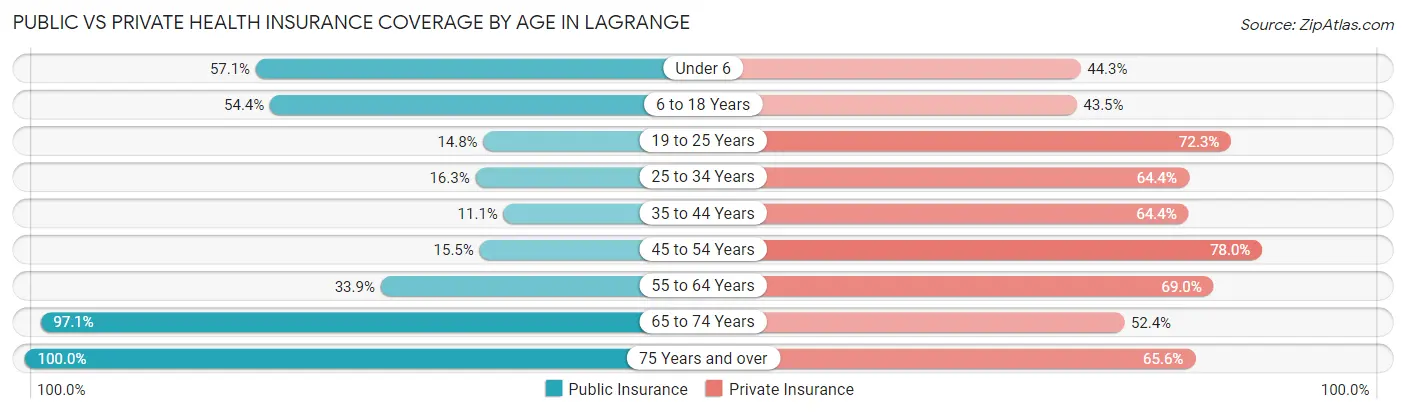
| Age Bracket | Public Insurance | Private Insurance |
| Under 6 | 1,544 (57.1%) | 1,198 (44.3%) |
| 6 to 18 Years | 2,924 (54.4%) | 2,339 (43.5%) |
| 19 to 25 Years | 510 (14.8%) | 2,486 (72.3%) |
| 25 to 34 Years | 656 (16.3%) | 2,591 (64.4%) |
| 35 to 44 Years | 404 (11.1%) | 2,347 (64.3%) |
| 45 to 54 Years | 602 (15.5%) | 3,023 (78.0%) |
| 55 to 64 Years | 1,117 (33.9%) | 2,274 (69.0%) |
| 65 to 74 Years | 2,152 (97.1%) | 1,161 (52.4%) |
| 75 Years and over | 1,938 (100.0%) | 1,271 (65.6%) |
| Total | 11,847 (38.8%) | 18,690 (61.3%) |
Disability Status by Sex by Age in Lagrange
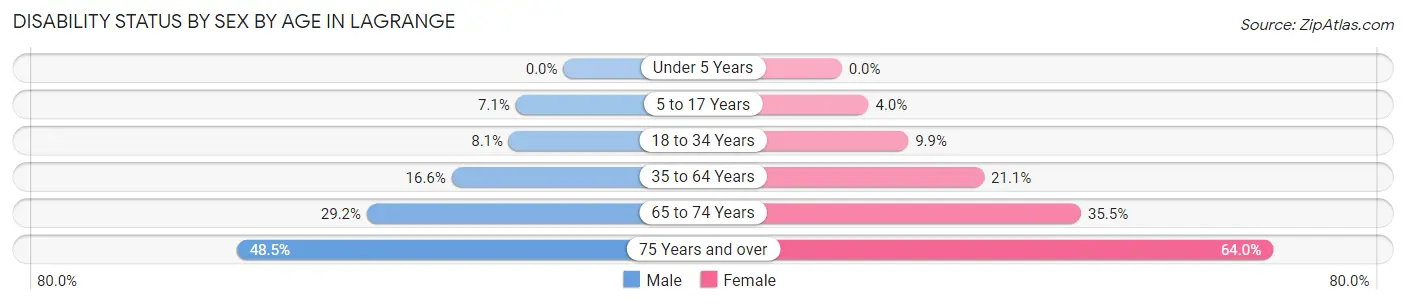
| Age Bracket | Male | Female |
| Under 5 Years | 0 (0.0%) | 0 (0.0%) |
| 5 to 17 Years | 199 (7.1%) | 116 (4.0%) |
| 18 to 34 Years | 298 (8.1%) | 406 (9.9%) |
| 35 to 64 Years | 799 (16.6%) | 1,268 (21.1%) |
| 65 to 74 Years | 288 (29.2%) | 437 (35.5%) |
| 75 Years and over | 274 (48.5%) | 879 (64.0%) |
Disability Class by Sex by Age in Lagrange
Disability Class: Hearing Difficulty
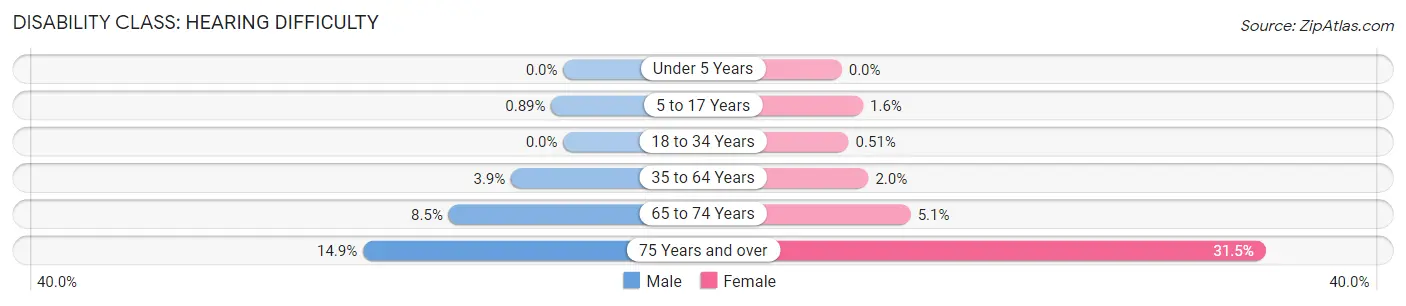
| Age Bracket | Male | Female |
| Under 5 Years | 0 (0.0%) | 0 (0.0%) |
| 5 to 17 Years | 25 (0.9%) | 46 (1.6%) |
| 18 to 34 Years | 0 (0.0%) | 21 (0.5%) |
| 35 to 64 Years | 187 (3.9%) | 119 (2.0%) |
| 65 to 74 Years | 84 (8.5%) | 63 (5.1%) |
| 75 Years and over | 84 (14.9%) | 432 (31.5%) |
Disability Class: Vision Difficulty
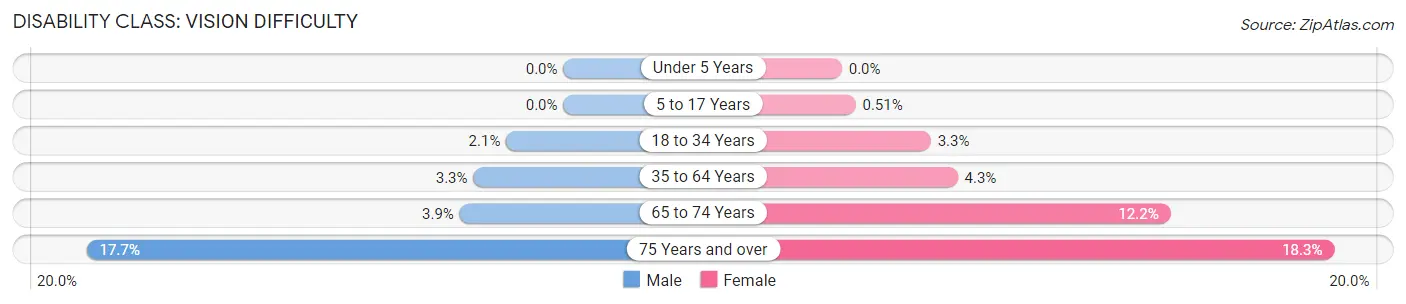
| Age Bracket | Male | Female |
| Under 5 Years | 0 (0.0%) | 0 (0.0%) |
| 5 to 17 Years | 0 (0.0%) | 15 (0.5%) |
| 18 to 34 Years | 78 (2.1%) | 136 (3.3%) |
| 35 to 64 Years | 161 (3.3%) | 258 (4.3%) |
| 65 to 74 Years | 38 (3.8%) | 150 (12.2%) |
| 75 Years and over | 100 (17.7%) | 251 (18.3%) |
Disability Class: Cognitive Difficulty
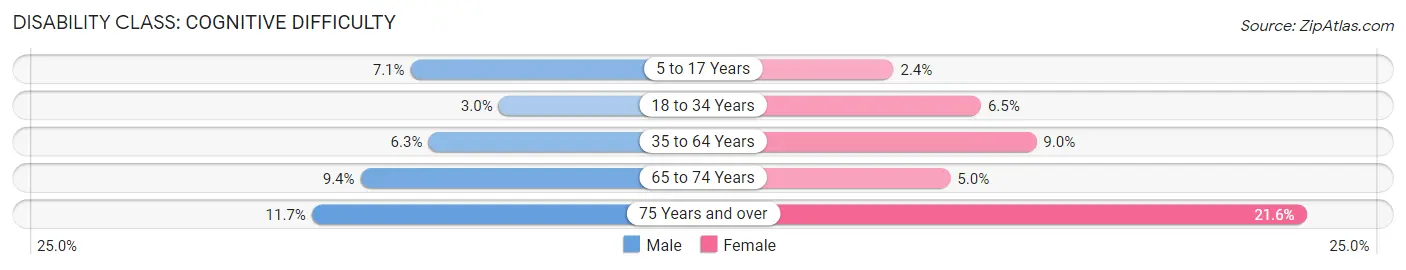
| Age Bracket | Male | Female |
| 5 to 17 Years | 199 (7.1%) | 70 (2.4%) |
| 18 to 34 Years | 111 (3.0%) | 266 (6.5%) |
| 35 to 64 Years | 302 (6.3%) | 542 (9.0%) |
| 65 to 74 Years | 93 (9.4%) | 62 (5.0%) |
| 75 Years and over | 66 (11.7%) | 296 (21.6%) |
Disability Class: Ambulatory Difficulty
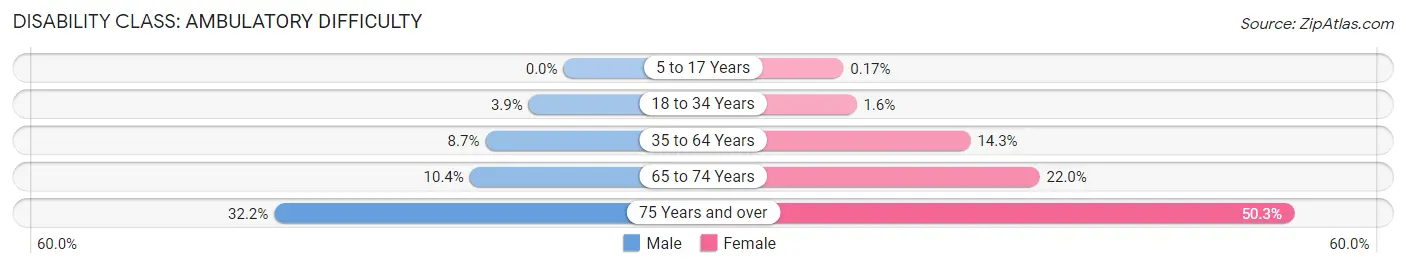
| Age Bracket | Male | Female |
| 5 to 17 Years | 0 (0.0%) | 5 (0.2%) |
| 18 to 34 Years | 143 (3.9%) | 67 (1.6%) |
| 35 to 64 Years | 419 (8.7%) | 860 (14.3%) |
| 65 to 74 Years | 103 (10.4%) | 271 (22.0%) |
| 75 Years and over | 182 (32.2%) | 691 (50.3%) |
Disability Class: Self-Care Difficulty
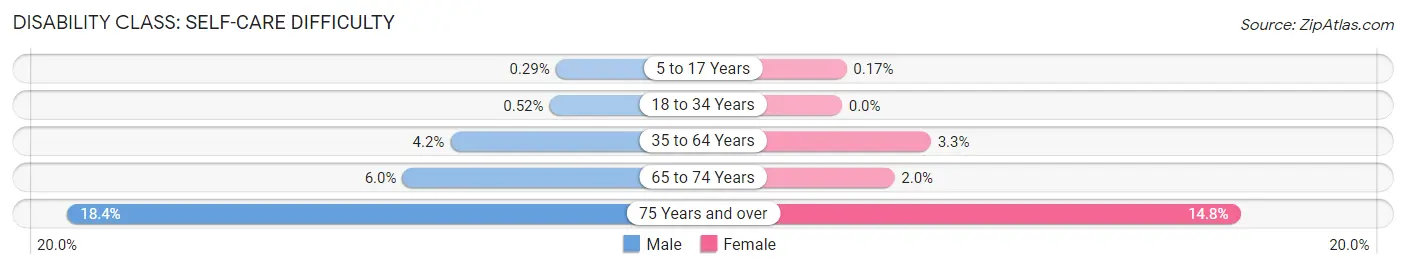
| Age Bracket | Male | Female |
| 5 to 17 Years | 8 (0.3%) | 5 (0.2%) |
| 18 to 34 Years | 19 (0.5%) | 0 (0.0%) |
| 35 to 64 Years | 202 (4.2%) | 198 (3.3%) |
| 65 to 74 Years | 59 (6.0%) | 24 (1.9%) |
| 75 Years and over | 104 (18.4%) | 203 (14.8%) |
Technology Access in Lagrange
Computing Device Access in Lagrange
| Device Type | # Households | % Households |
| Desktop or Laptop | 7,718 | 63.6% |
| Smartphone | 9,608 | 79.2% |
| Tablet | 6,008 | 49.5% |
| No Computing Device | 1,537 | 12.7% |
| Total | 12,131 | 100.0% |
Internet Access in Lagrange
| Internet Type | # Households | % Households |
| Dial-Up Internet | 0 | 0.0% |
| Broadband Home | 7,670 | 63.2% |
| Cellular Data Only | 1,484 | 12.2% |
| Satellite Internet | 675 | 5.6% |
| No Internet | 2,093 | 17.2% |
| Total | 12,131 | 100.0% |
Lagrange Summary
Lagrange is a city located in Troup County, Georgia, United States. It is the county seat of Troup County and is located approximately 70 miles southwest of Atlanta. The population of Lagrange was estimated to be 30,452 in 2019.
History
Lagrange was founded in 1828 as a trading post along the West Point-Macon Railroad. The city was named after the estate of the Marquis de La Fayette, who had visited the area in 1825. The city was incorporated in December 1828 and was designated as the county seat of Troup County in 1829.
In the early 19th century, Lagrange was a center of cotton production and processing. The city was also home to several cotton mills, which provided employment for many of the city’s residents.
In the late 19th century, the city experienced a period of growth and development. The city was home to several educational institutions, including LaGrange Female College, which was founded in 1831 and was the first college for women in the state of Georgia.
In the early 20th century, the city experienced a period of industrialization. The city was home to several manufacturing plants, including the LaGrange Cotton Mill, which was founded in 1902 and was the largest cotton mill in the state.
Geography
Lagrange is located in the foothills of the Appalachian Mountains in west-central Georgia. The city is situated along the Chattahoochee River, which forms the border between Georgia and Alabama. The city is located approximately 70 miles southwest of Atlanta and is part of the Atlanta metropolitan area.
The city has a total area of 22.2 square miles, of which 21.9 square miles is land and 0.3 square miles is water. The city has a humid subtropical climate, with hot, humid summers and mild winters.
Economy
Lagrange’s economy is largely based on manufacturing and agriculture. The city is home to several manufacturing plants, including the LaGrange Cotton Mill, which is the largest cotton mill in the state. The city is also home to several agricultural businesses, including poultry farms and dairy farms.
The city is also home to several educational institutions, including LaGrange College, which is a private liberal arts college. The city is also home to several healthcare facilities, including the West Georgia Medical Center.
Demographics
As of the 2019 census, the population of Lagrange was estimated to be 30,452. The racial makeup of the city was 57.2% White, 37.2% African American, 0.7% Native American, 1.2% Asian, 0.1% Pacific Islander, 1.7% from other races, and 2.0% from two or more races. Hispanic or Latino of any race were 4.3% of the population.
The median household income in Lagrange was $37,945 in 2019. The per capita income in the city was $20,945. The poverty rate in the city was 22.2%.
Common Questions
What is Per Capita Income in Lagrange?
Per Capita income in Lagrange is $28,005.
What is the Median Family Income in Lagrange?
Median Family Income in Lagrange is $54,383.
What is the Median Household income in Lagrange?
Median Household Income in Lagrange is $41,030.
What is Income or Wage Gap in Lagrange?
Income or Wage Gap in Lagrange is 19.1%.
Women in Lagrange earn 80.9 cents for every dollar earned by a man.
What is Family Income Deficit in Lagrange?
Family Income Deficit in Lagrange is $11,311.
Families that are below poverty line in Lagrange earn $11,311 less on average than the poverty threshold level.
What is Inequality or Gini Index in Lagrange?
Inequality or Gini Index in Lagrange is 0.54.
What is the Total Population of Lagrange?
Total Population of Lagrange is 31,173.
What is the Total Male Population of Lagrange?
Total Male Population of Lagrange is 14,428.
What is the Total Female Population of Lagrange?
Total Female Population of Lagrange is 16,745.
What is the Ratio of Males per 100 Females in Lagrange?
There are 86.16 Males per 100 Females in Lagrange.
What is the Ratio of Females per 100 Males in Lagrange?
There are 116.06 Females per 100 Males in Lagrange.
What is the Median Population Age in Lagrange?
Median Population Age in Lagrange is 34.9 Years.
What is the Average Family Size in Lagrange
Average Family Size in Lagrange is 3.3 People.
What is the Average Household Size in Lagrange
Average Household Size in Lagrange is 2.5 People.
How Large is the Labor Force in Lagrange?
There are 14,725 People in the Labor Forcein in Lagrange.
What is the Percentage of People in the Labor Force in Lagrange?
61.6% of People are in the Labor Force in Lagrange.
What is the Unemployment Rate in Lagrange?
Unemployment Rate in Lagrange is 5.3%.