Winterville, GA Map & Demographics
Winterville Map
Winterville Overview
$35,385
PER CAPITA INCOME
$113,333
AVG FAMILY INCOME
$96,883
AVG HOUSEHOLD INCOME
14.2%
WAGE / INCOME GAP [ % ]
85.8¢/ $1
WAGE / INCOME GAP [ $ ]
0.30
INEQUALITY / GINI INDEX
2,165
TOTAL POPULATION
1,016
MALE POPULATION
1,149
FEMALE POPULATION
88.42
MALES / 100 FEMALES
113.09
FEMALES / 100 MALES
39.4
MEDIAN AGE
3.3
AVG FAMILY SIZE
3.0
AVG HOUSEHOLD SIZE
1,035
LABOR FORCE [ PEOPLE ]
61.0%
PERCENT IN LABOR FORCE
2.4%
UNEMPLOYMENT RATE
Winterville Zip Codes
Winterville Area Codes
Income in Winterville
Income Overview in Winterville
Per Capita Income in Winterville is $35,385, while median incomes of families and households are $113,333 and $96,883 respectively.
| Characteristic | Number | Measure |
| Per Capita Income | 2,165 | $35,385 |
| Median Family Income | 586 | $113,333 |
| Mean Family Income | 586 | $121,992 |
| Median Household Income | 715 | $96,883 |
| Mean Household Income | 715 | $111,856 |
| Income Deficit | 586 | $0 |
| Wage / Income Gap (%) | 2,165 | 14.18% |
| Wage / Income Gap ($) | 2,165 | 85.82¢ per $1 |
| Gini / Inequality Index | 2,165 | 0.30 |
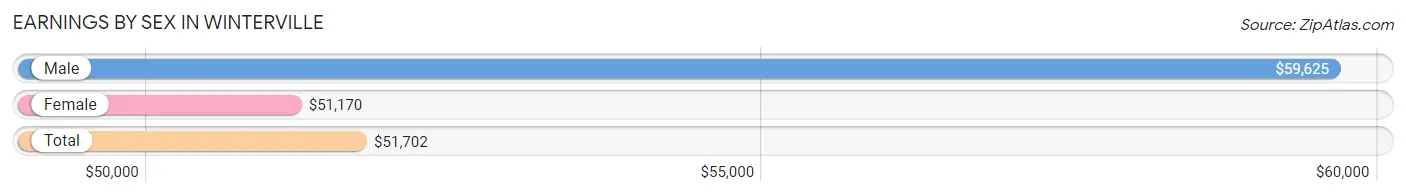
Earnings by Sex in Winterville
Average Earnings in Winterville are $51,702, $59,625 for men and $51,170 for women, a difference of 14.2%.
| Sex | Number | Average Earnings |
| Male | 483 (46.0%) | $59,625 |
| Female | 566 (54.0%) | $51,170 |
| Total | 1,049 (100.0%) | $51,702 |
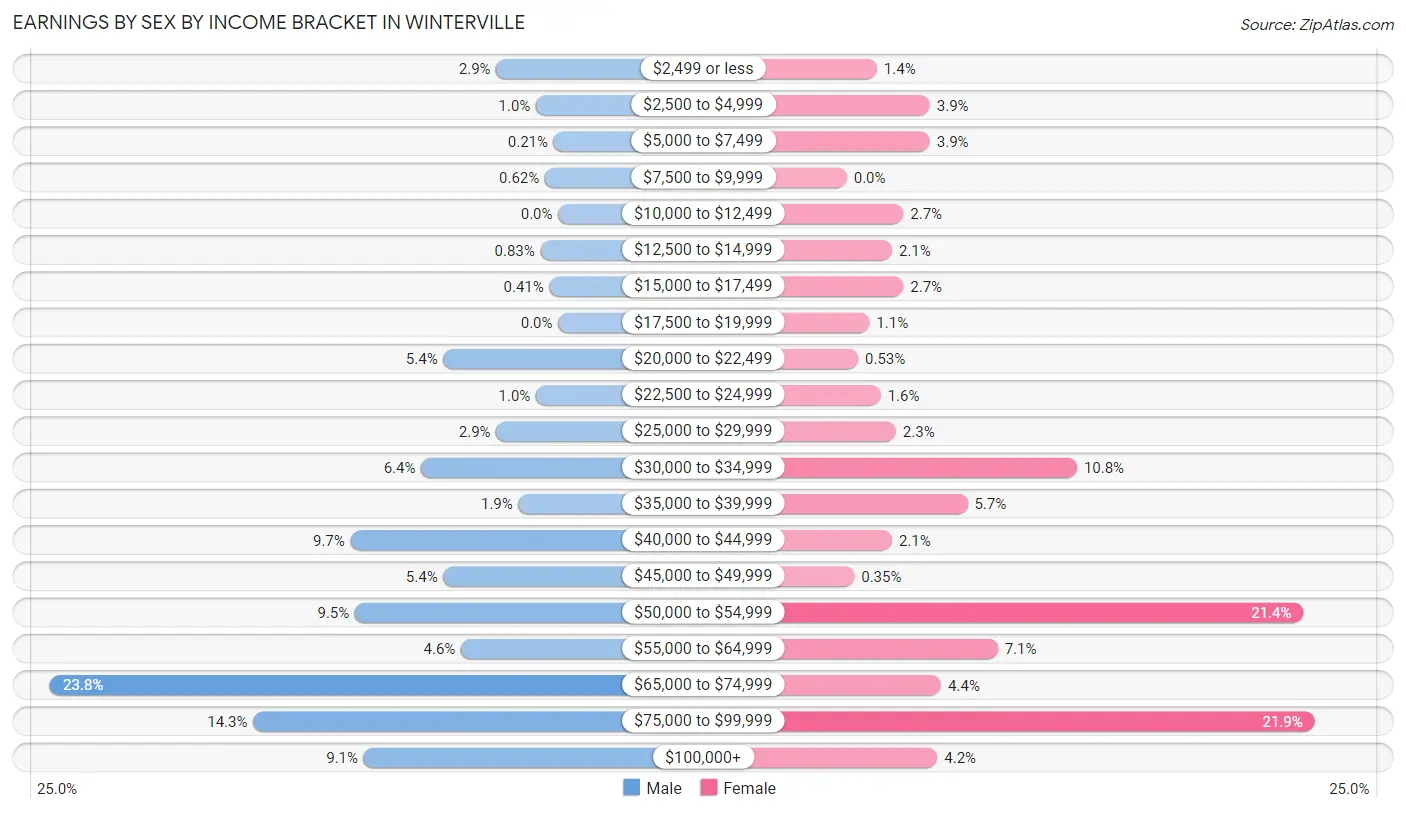
Earnings by Sex by Income Bracket in Winterville
The most common earnings brackets in Winterville are $65,000 to $74,999 for men (115 | 23.8%) and $75,000 to $99,999 for women (124 | 21.9%).
| Income | Male | Female |
| $2,499 or less | 14 (2.9%) | 8 (1.4%) |
| $2,500 to $4,999 | 5 (1.0%) | 22 (3.9%) |
| $5,000 to $7,499 | 1 (0.2%) | 22 (3.9%) |
| $7,500 to $9,999 | 3 (0.6%) | 0 (0.0%) |
| $10,000 to $12,499 | 0 (0.0%) | 15 (2.6%) |
| $12,500 to $14,999 | 4 (0.8%) | 12 (2.1%) |
| $15,000 to $17,499 | 2 (0.4%) | 15 (2.6%) |
| $17,500 to $19,999 | 0 (0.0%) | 6 (1.1%) |
| $20,000 to $22,499 | 26 (5.4%) | 3 (0.5%) |
| $22,500 to $24,999 | 5 (1.0%) | 9 (1.6%) |
| $25,000 to $29,999 | 14 (2.9%) | 13 (2.3%) |
| $30,000 to $34,999 | 31 (6.4%) | 61 (10.8%) |
| $35,000 to $39,999 | 9 (1.9%) | 32 (5.7%) |
| $40,000 to $44,999 | 47 (9.7%) | 12 (2.1%) |
| $45,000 to $49,999 | 26 (5.4%) | 2 (0.4%) |
| $50,000 to $54,999 | 46 (9.5%) | 121 (21.4%) |
| $55,000 to $64,999 | 22 (4.5%) | 40 (7.1%) |
| $65,000 to $74,999 | 115 (23.8%) | 25 (4.4%) |
| $75,000 to $99,999 | 69 (14.3%) | 124 (21.9%) |
| $100,000+ | 44 (9.1%) | 24 (4.2%) |
| Total | 483 (100.0%) | 566 (100.0%) |
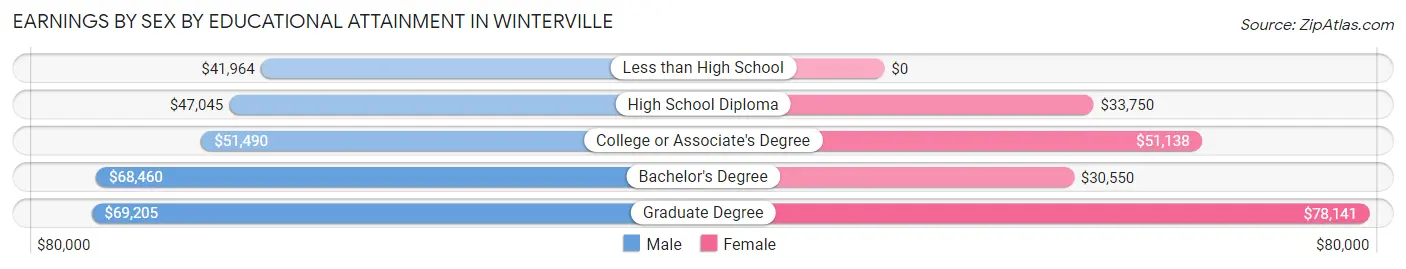
Earnings by Sex by Educational Attainment in Winterville
Average earnings in Winterville are $64,063 for men and $51,342 for women, a difference of 19.9%. Men with an educational attainment of graduate degree enjoy the highest average annual earnings of $69,205, while those with less than high school education earn the least with $41,964. Women with an educational attainment of graduate degree earn the most with the average annual earnings of $78,141, while those with bachelor's degree education have the smallest earnings of $30,550.
| Educational Attainment | Male Income | Female Income |
| Less than High School | $41,964 | $0 |
| High School Diploma | $47,045 | $33,750 |
| College or Associate's Degree | $51,490 | $51,138 |
| Bachelor's Degree | $68,460 | $30,550 |
| Graduate Degree | $69,205 | $78,141 |
| Total | $64,063 | $51,342 |
Family Income in Winterville
Family Income Brackets in Winterville
According to the Winterville family income data, there are 142 families falling into the $150,000 to $199,999 income range, which is the most common income bracket and makes up 24.2% of all families.
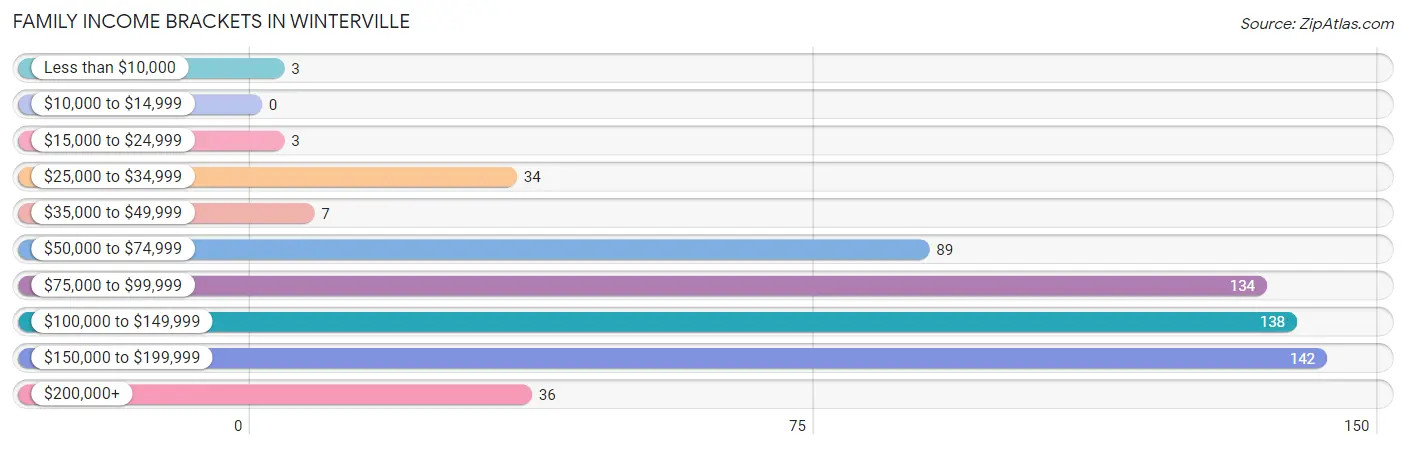
| Income Bracket | # Families | % Families |
| Less than $10,000 | 3 | 0.5% |
| $10,000 to $14,999 | 0 | 0.0% |
| $15,000 to $24,999 | 3 | 0.5% |
| $25,000 to $34,999 | 34 | 5.8% |
| $35,000 to $49,999 | 7 | 1.2% |
| $50,000 to $74,999 | 89 | 15.2% |
| $75,000 to $99,999 | 134 | 22.9% |
| $100,000 to $149,999 | 138 | 23.5% |
| $150,000 to $199,999 | 142 | 24.2% |
| $200,000+ | 36 | 6.1% |
Family Income by Famaliy Size in Winterville
4-person families (100 | 17.1%) account for the highest median family income in Winterville with $114,286 per family, while 2-person families (244 | 41.6%) have the highest median income of $48,212 per family member.
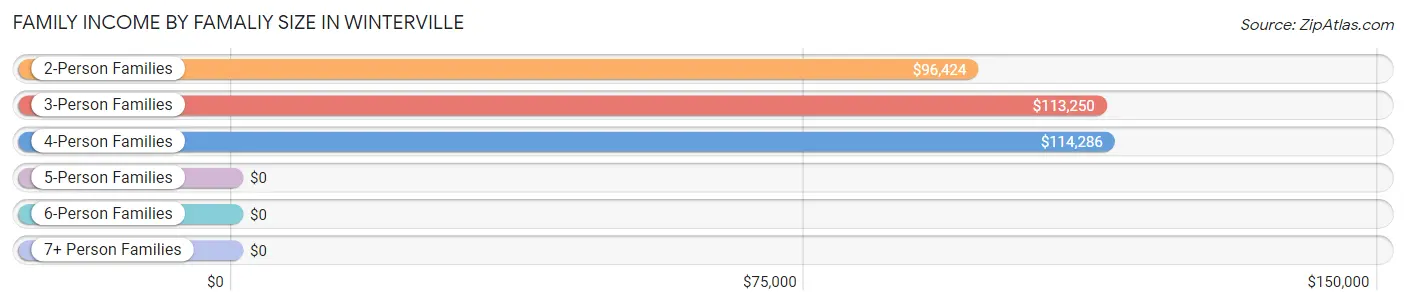
| Income Bracket | # Families | Median Income |
| 2-Person Families | 244 (41.6%) | $96,424 |
| 3-Person Families | 113 (19.3%) | $113,250 |
| 4-Person Families | 100 (17.1%) | $114,286 |
| 5-Person Families | 102 (17.4%) | $0 |
| 6-Person Families | 14 (2.4%) | $0 |
| 7+ Person Families | 13 (2.2%) | $0 |
| Total | 586 (100.0%) | $113,333 |
Family Income by Number of Earners in Winterville
The median family income in Winterville is $113,333, with families comprising 3+ earners (36) having the highest median family income of $164,750, while families with no earners (41) have the lowest median family income of $66,750, accounting for 6.1% and 7.0% of families, respectively.
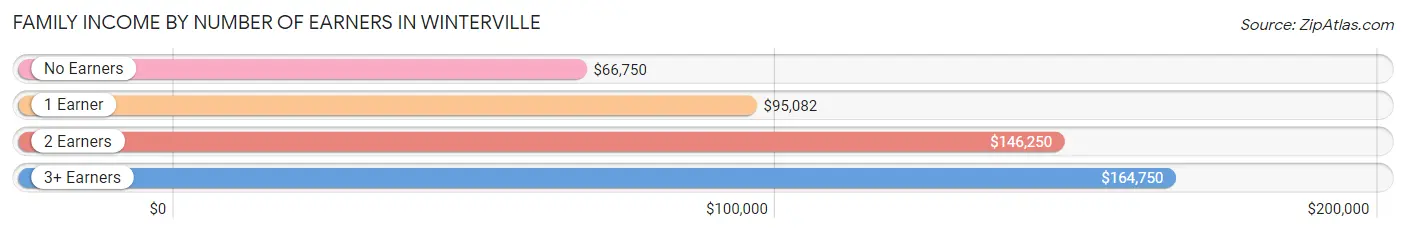
| Number of Earners | # Families | Median Income |
| No Earners | 41 (7.0%) | $66,750 |
| 1 Earner | 215 (36.7%) | $95,082 |
| 2 Earners | 294 (50.2%) | $146,250 |
| 3+ Earners | 36 (6.1%) | $164,750 |
| Total | 586 (100.0%) | $113,333 |
Household Income in Winterville
Household Income Brackets in Winterville
With 153 households falling in the category, the $75,000 to $99,999 income range is the most frequent in Winterville, accounting for 21.4% of all households.
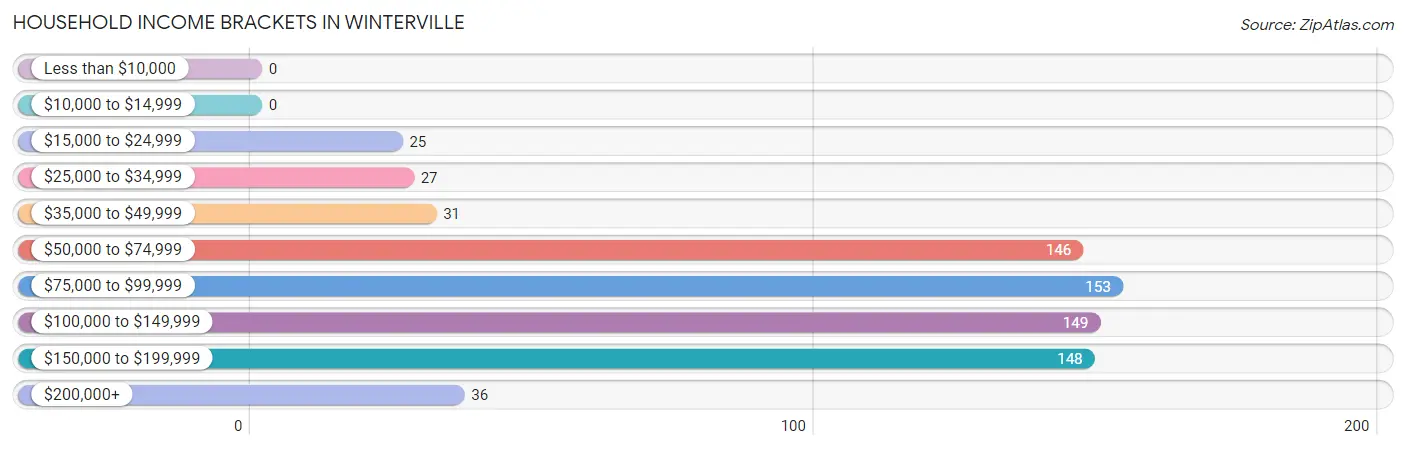
| Income Bracket | # Households | % Households |
| Less than $10,000 | 0 | 0.0% |
| $10,000 to $14,999 | 0 | 0.0% |
| $15,000 to $24,999 | 25 | 3.5% |
| $25,000 to $34,999 | 27 | 3.8% |
| $35,000 to $49,999 | 31 | 4.3% |
| $50,000 to $74,999 | 146 | 20.4% |
| $75,000 to $99,999 | 153 | 21.4% |
| $100,000 to $149,999 | 149 | 20.8% |
| $150,000 to $199,999 | 148 | 20.7% |
| $200,000+ | 36 | 5.0% |
Household Income by Householder Age in Winterville
The median household income in Winterville is $96,883, with the highest median household income of $109,792 found in the 25 to 44 years age bracket for the primary householder. A total of 193 households (27.0%) fall into this category. Meanwhile, the 15 to 24 years age bracket for the primary householder has the lowest median household income of $0, with 2 households (0.3%) in this group.
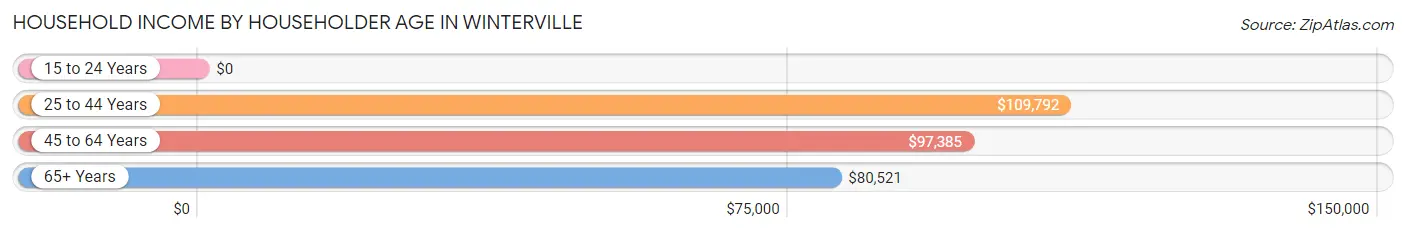
| Income Bracket | # Households | Median Income |
| 15 to 24 Years | 2 (0.3%) | $0 |
| 25 to 44 Years | 193 (27.0%) | $109,792 |
| 45 to 64 Years | 387 (54.1%) | $97,385 |
| 65+ Years | 133 (18.6%) | $80,521 |
| Total | 715 (100.0%) | $96,883 |
Poverty in Winterville
Income Below Poverty by Sex and Age in Winterville
With 0.6% poverty level for males and 1.5% for females among the residents of Winterville, 25 to 34 year old males and 25 to 34 year old females are the most vulnerable to poverty, with 6 males (7.1%) and 8 females (4.2%) in their respective age groups living below the poverty level.
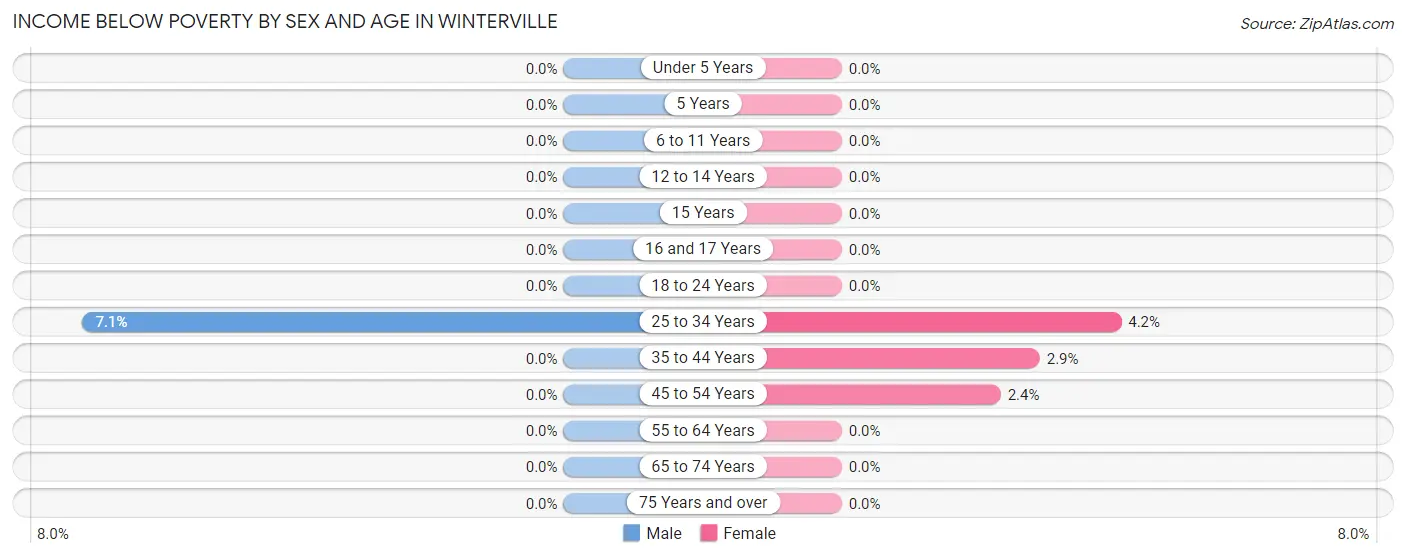
| Age Bracket | Male | Female |
| Under 5 Years | 0 (0.0%) | 0 (0.0%) |
| 5 Years | 0 (0.0%) | 0 (0.0%) |
| 6 to 11 Years | 0 (0.0%) | 0 (0.0%) |
| 12 to 14 Years | 0 (0.0%) | 0 (0.0%) |
| 15 Years | 0 (0.0%) | 0 (0.0%) |
| 16 and 17 Years | 0 (0.0%) | 0 (0.0%) |
| 18 to 24 Years | 0 (0.0%) | 0 (0.0%) |
| 25 to 34 Years | 6 (7.1%) | 8 (4.2%) |
| 35 to 44 Years | 0 (0.0%) | 3 (2.9%) |
| 45 to 54 Years | 0 (0.0%) | 6 (2.4%) |
| 55 to 64 Years | 0 (0.0%) | 0 (0.0%) |
| 65 to 74 Years | 0 (0.0%) | 0 (0.0%) |
| 75 Years and over | 0 (0.0%) | 0 (0.0%) |
| Total | 6 (0.6%) | 17 (1.5%) |
Income Above Poverty by Sex and Age in Winterville
According to the poverty statistics in Winterville, males aged under 5 years and females aged under 5 years are the age groups that are most secure financially, with 100.0% of males and 100.0% of females in these age groups living above the poverty line.
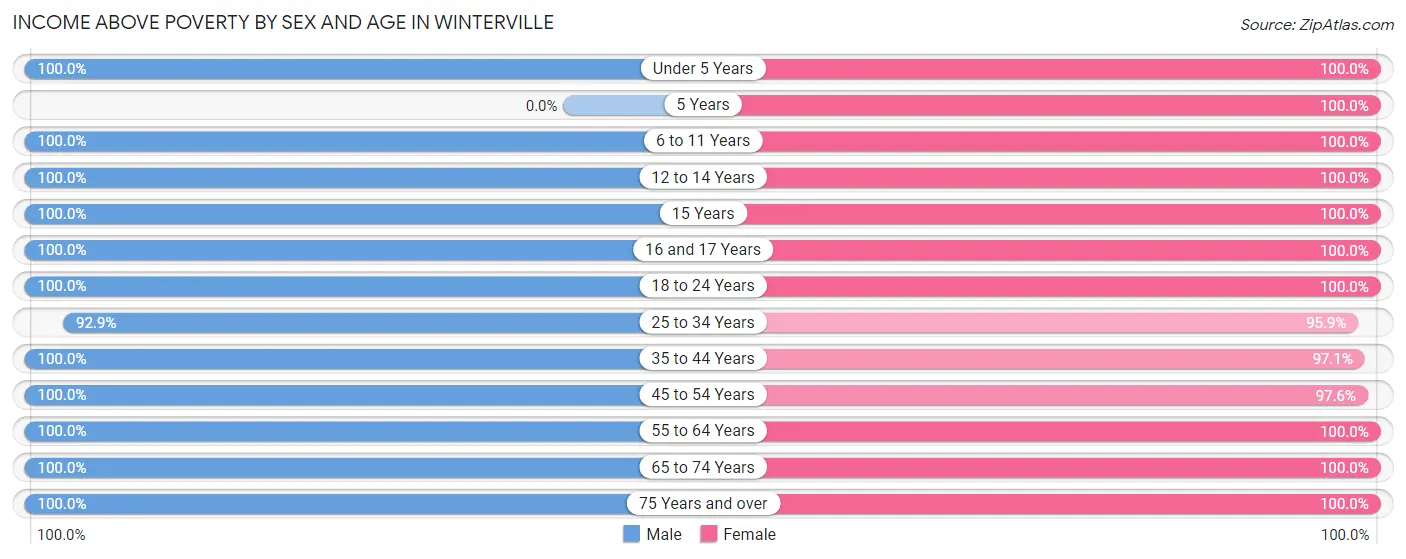
| Age Bracket | Male | Female |
| Under 5 Years | 85 (100.0%) | 97 (100.0%) |
| 5 Years | 0 (0.0%) | 2 (100.0%) |
| 6 to 11 Years | 63 (100.0%) | 74 (100.0%) |
| 12 to 14 Years | 26 (100.0%) | 35 (100.0%) |
| 15 Years | 50 (100.0%) | 37 (100.0%) |
| 16 and 17 Years | 166 (100.0%) | 24 (100.0%) |
| 18 to 24 Years | 29 (100.0%) | 19 (100.0%) |
| 25 to 34 Years | 78 (92.9%) | 185 (95.9%) |
| 35 to 44 Years | 123 (100.0%) | 99 (97.1%) |
| 45 to 54 Years | 125 (100.0%) | 248 (97.6%) |
| 55 to 64 Years | 178 (100.0%) | 117 (100.0%) |
| 65 to 74 Years | 49 (100.0%) | 100 (100.0%) |
| 75 Years and over | 38 (100.0%) | 63 (100.0%) |
| Total | 1,010 (99.4%) | 1,100 (98.5%) |
Income Below Poverty Among Married-Couple Families in Winterville
The poverty statistics for married-couple families in Winterville show that 0.7% or 3 of the total 434 families live below the poverty line. Families with no children have the highest poverty rate of 1.1%, comprising of 3 families. On the other hand, families with 1 or 2 children have the lowest poverty rate of 0.0%, which includes 0 families.
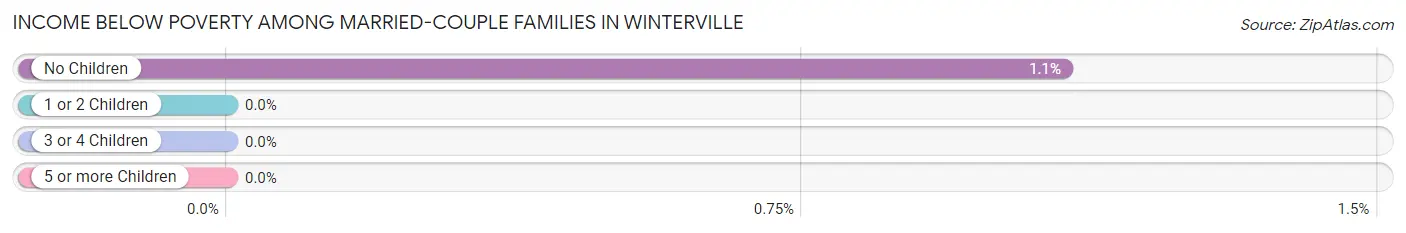
| Children | Above Poverty | Below Poverty |
| No Children | 271 (98.9%) | 3 (1.1%) |
| 1 or 2 Children | 133 (100.0%) | 0 (0.0%) |
| 3 or 4 Children | 24 (100.0%) | 0 (0.0%) |
| 5 or more Children | 3 (100.0%) | 0 (0.0%) |
| Total | 431 (99.3%) | 3 (0.7%) |
Income Below Poverty Among Single-Parent Households in Winterville
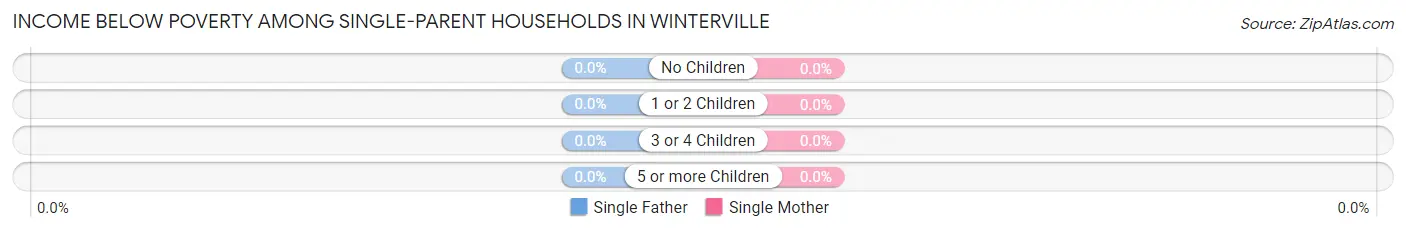
| Children | Single Father | Single Mother |
| No Children | 0 (0.0%) | 0 (0.0%) |
| 1 or 2 Children | 0 (0.0%) | 0 (0.0%) |
| 3 or 4 Children | 0 (0.0%) | 0 (0.0%) |
| 5 or more Children | 0 (0.0%) | 0 (0.0%) |
| Total | 0 (0.0%) | 0 (0.0%) |
Income Below Poverty Among Married-Couple vs Single-Parent Households in Winterville
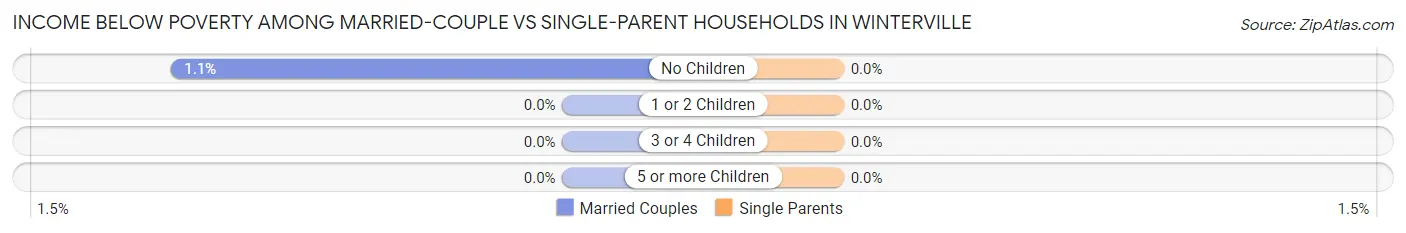
| Children | Married-Couple Families | Single-Parent Households |
| No Children | 3 (1.1%) | 0 (0.0%) |
| 1 or 2 Children | 0 (0.0%) | 0 (0.0%) |
| 3 or 4 Children | 0 (0.0%) | 0 (0.0%) |
| 5 or more Children | 0 (0.0%) | 0 (0.0%) |
| Total | 3 (0.7%) | 0 (0.0%) |
Race in Winterville
The most populous races in Winterville are White / Caucasian (1,477 | 68.2%), Black / African American (539 | 24.9%), and Hispanic or Latino (219 | 10.1%).
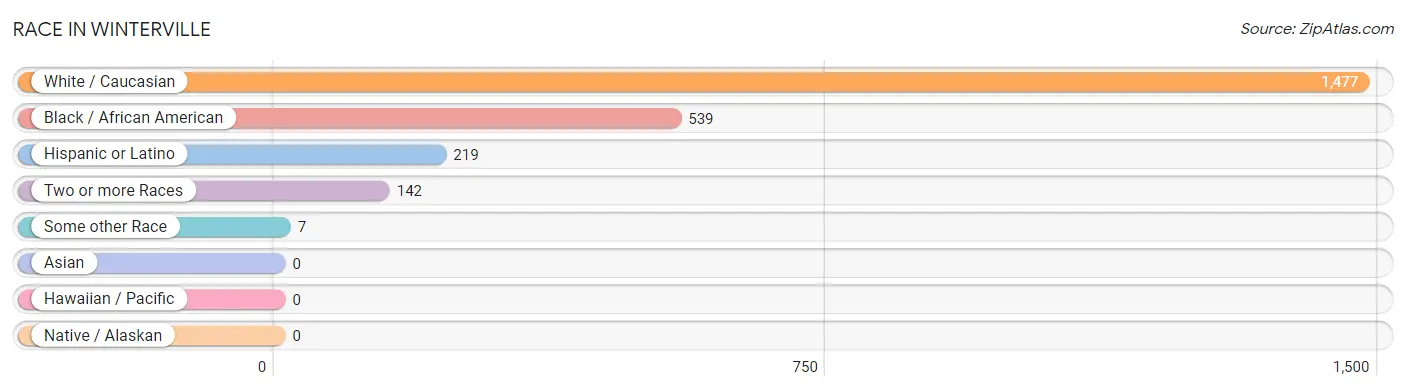
| Race | # Population | % Population |
| Asian | 0 | 0.0% |
| Black / African American | 539 | 24.9% |
| Hawaiian / Pacific | 0 | 0.0% |
| Hispanic or Latino | 219 | 10.1% |
| Native / Alaskan | 0 | 0.0% |
| White / Caucasian | 1,477 | 68.2% |
| Two or more Races | 142 | 6.6% |
| Some other Race | 7 | 0.3% |
| Total | 2,165 | 100.0% |
Ancestry in Winterville
The most populous ancestries reported in Winterville are American (373 | 17.2%), English (166 | 7.7%), Irish (152 | 7.0%), German (113 | 5.2%), and European (59 | 2.7%), together accounting for 39.9% of all Winterville residents.
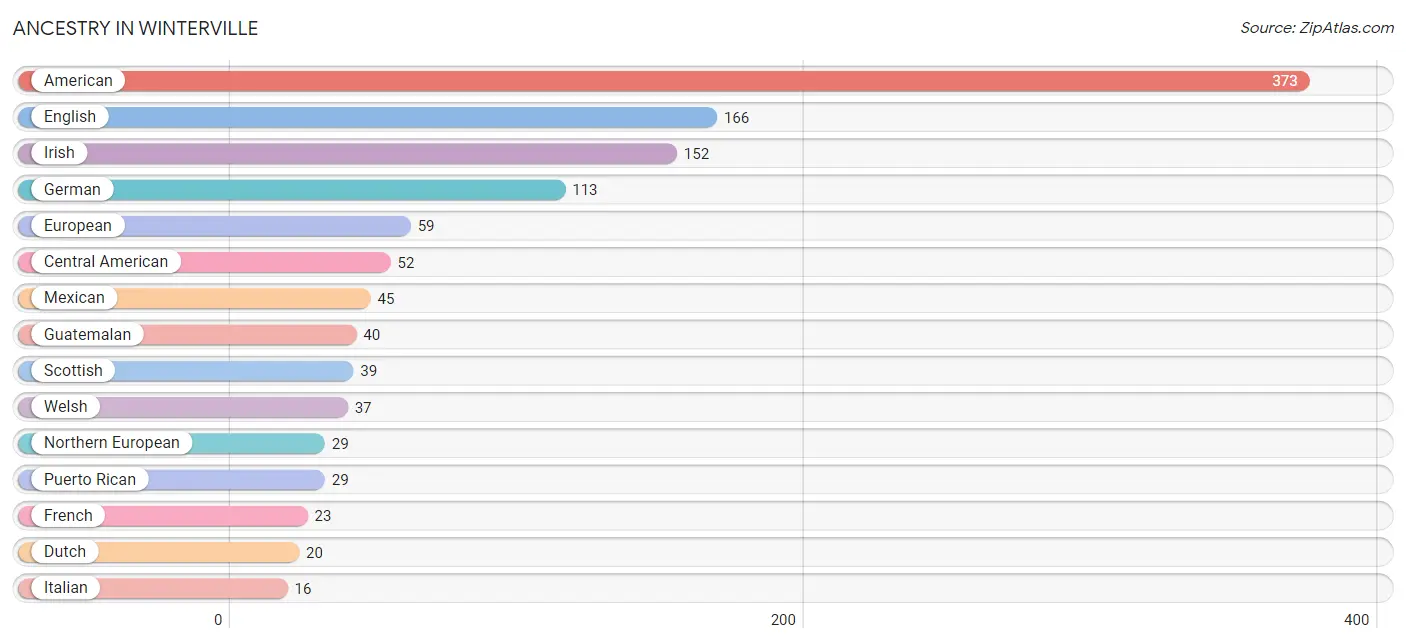
| Ancestry | # Population | % Population |
| African | 3 | 0.1% |
| American | 373 | 17.2% |
| Austrian | 3 | 0.1% |
| British | 3 | 0.1% |
| Central American | 52 | 2.4% |
| Cherokee | 3 | 0.1% |
| Costa Rican | 4 | 0.2% |
| Czech | 15 | 0.7% |
| Czechoslovakian | 3 | 0.1% |
| Danish | 13 | 0.6% |
| Dutch | 20 | 0.9% |
| English | 166 | 7.7% |
| European | 59 | 2.7% |
| French | 23 | 1.1% |
| French Canadian | 2 | 0.1% |
| German | 113 | 5.2% |
| Guatemalan | 40 | 1.8% |
| Indian (Asian) | 14 | 0.6% |
| Irish | 152 | 7.0% |
| Italian | 16 | 0.7% |
| Mexican | 45 | 2.1% |
| Navajo | 5 | 0.2% |
| Nigerian | 13 | 0.6% |
| Northern European | 29 | 1.3% |
| Norwegian | 6 | 0.3% |
| Polish | 7 | 0.3% |
| Puerto Rican | 29 | 1.3% |
| Salvadoran | 8 | 0.4% |
| Scotch-Irish | 15 | 0.7% |
| Scottish | 39 | 1.8% |
| Subsaharan African | 16 | 0.7% |
| Swedish | 9 | 0.4% |
| Swiss | 2 | 0.1% |
| Welsh | 37 | 1.7% | View All 34 Rows |
Immigrants in Winterville
The most numerous immigrant groups reported in Winterville came from Central America (35 | 1.6%), Latin America (35 | 1.6%), Mexico (15 | 0.7%), Africa (13 | 0.6%), and Nigeria (13 | 0.6%), together accounting for 5.1% of all Winterville residents.
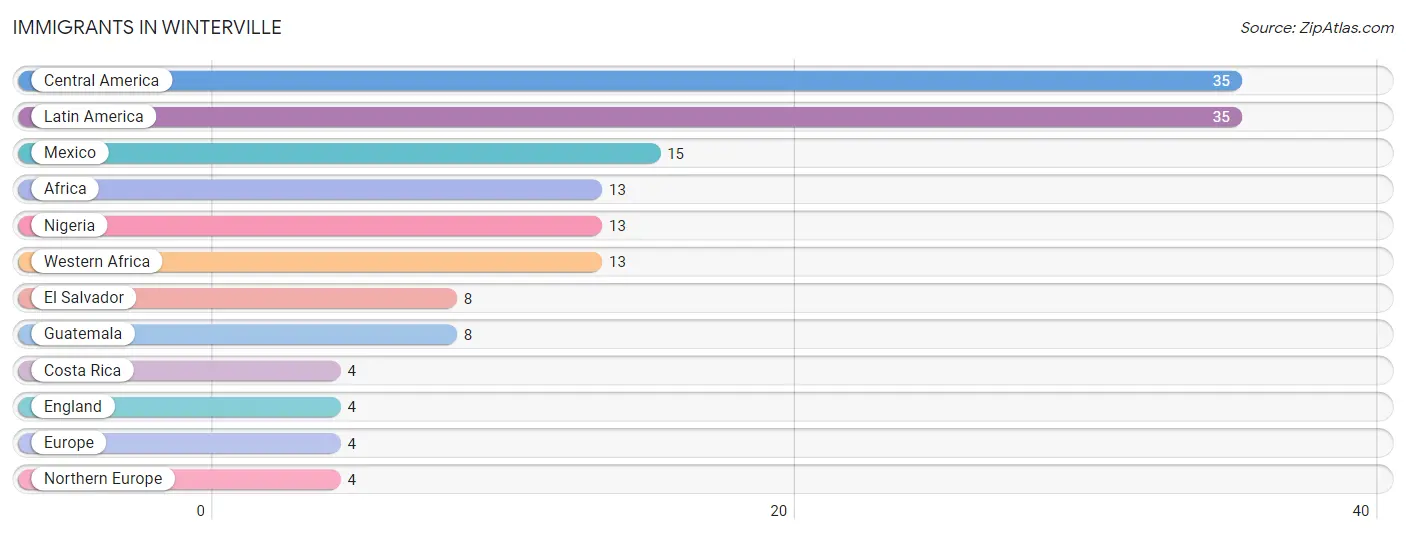
| Immigration Origin | # Population | % Population |
| Africa | 13 | 0.6% |
| Central America | 35 | 1.6% |
| Costa Rica | 4 | 0.2% |
| El Salvador | 8 | 0.4% |
| England | 4 | 0.2% |
| Europe | 4 | 0.2% |
| Guatemala | 8 | 0.4% |
| Latin America | 35 | 1.6% |
| Mexico | 15 | 0.7% |
| Nigeria | 13 | 0.6% |
| Northern Europe | 4 | 0.2% |
| Western Africa | 13 | 0.6% | View All 12 Rows |
Sex and Age in Winterville
Sex and Age in Winterville
The most populous age groups in Winterville are 15 to 19 Years (216 | 21.3%) for men and 50 to 54 Years (192 | 16.7%) for women.
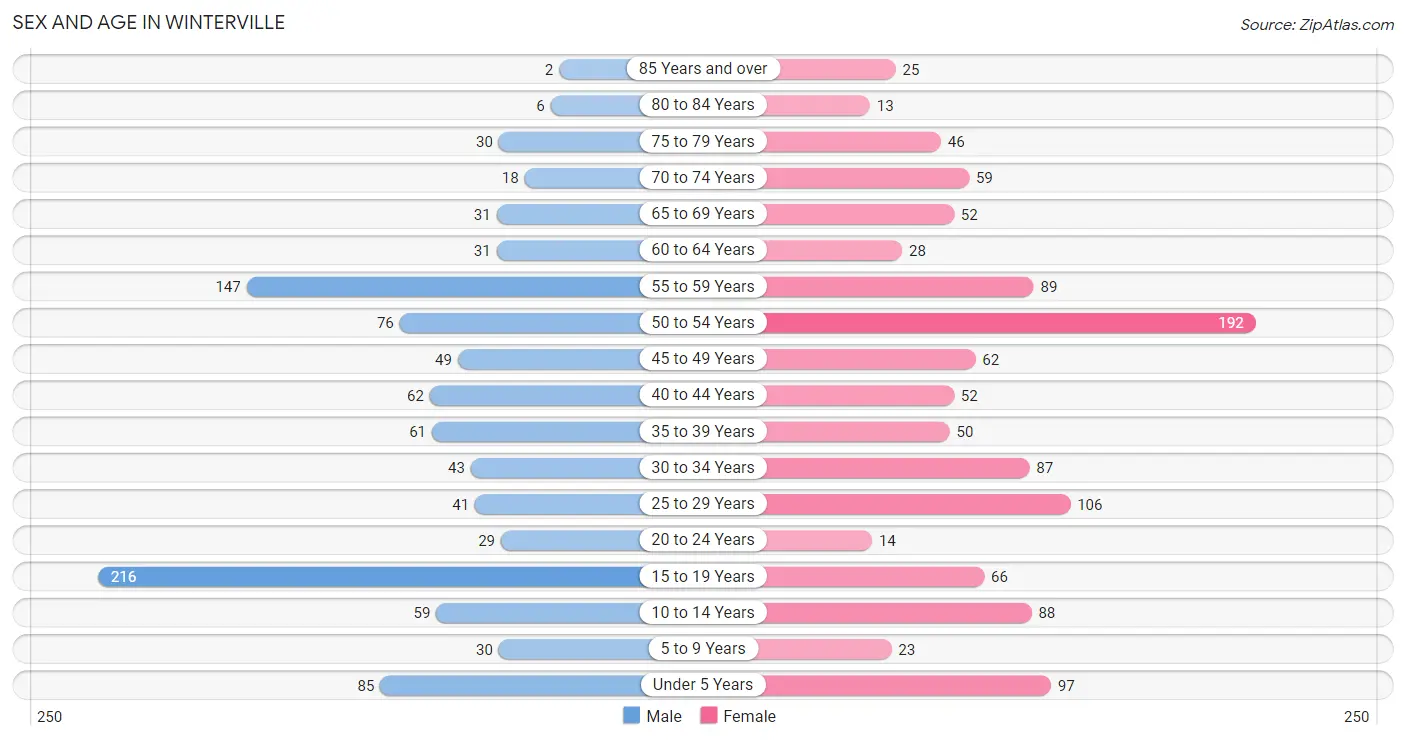
| Age Bracket | Male | Female |
| Under 5 Years | 85 (8.4%) | 97 (8.4%) |
| 5 to 9 Years | 30 (2.9%) | 23 (2.0%) |
| 10 to 14 Years | 59 (5.8%) | 88 (7.7%) |
| 15 to 19 Years | 216 (21.3%) | 66 (5.7%) |
| 20 to 24 Years | 29 (2.9%) | 14 (1.2%) |
| 25 to 29 Years | 41 (4.0%) | 106 (9.2%) |
| 30 to 34 Years | 43 (4.2%) | 87 (7.6%) |
| 35 to 39 Years | 61 (6.0%) | 50 (4.3%) |
| 40 to 44 Years | 62 (6.1%) | 52 (4.5%) |
| 45 to 49 Years | 49 (4.8%) | 62 (5.4%) |
| 50 to 54 Years | 76 (7.5%) | 192 (16.7%) |
| 55 to 59 Years | 147 (14.5%) | 89 (7.7%) |
| 60 to 64 Years | 31 (3.0%) | 28 (2.4%) |
| 65 to 69 Years | 31 (3.0%) | 52 (4.5%) |
| 70 to 74 Years | 18 (1.8%) | 59 (5.1%) |
| 75 to 79 Years | 30 (2.9%) | 46 (4.0%) |
| 80 to 84 Years | 6 (0.6%) | 13 (1.1%) |
| 85 Years and over | 2 (0.2%) | 25 (2.2%) |
| Total | 1,016 (100.0%) | 1,149 (100.0%) |
Families and Households in Winterville
Median Family Size in Winterville
The median family size in Winterville is 3.31 persons per family, with married-couple families (434 | 74.1%) accounting for the largest median family size of 3.5 persons per family. On the other hand, single male/father families (10 | 1.7%) represent the smallest median family size with 2.00 persons per family.
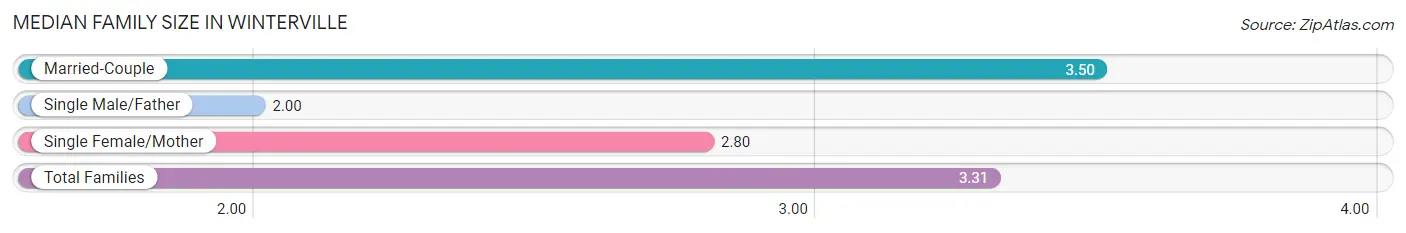
| Family Type | # Families | Family Size |
| Married-Couple | 434 (74.1%) | 3.50 |
| Single Male/Father | 10 (1.7%) | 2.00 |
| Single Female/Mother | 142 (24.2%) | 2.80 |
| Total Families | 586 (100.0%) | 3.31 |
Median Household Size in Winterville
The median household size in Winterville is 2.98 persons per household, with married-couple households (434 | 60.7%) accounting for the largest median household size of 3.52 persons per household. non-family households (129 | 18.0%) represent the smallest median household size with 1.26 persons per household.
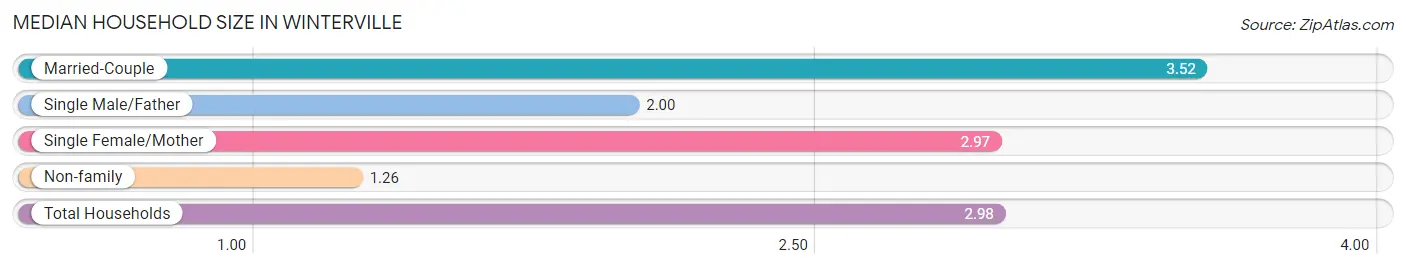
| Household Type | # Households | Household Size |
| Married-Couple | 434 (60.7%) | 3.52 |
| Single Male/Father | 10 (1.4%) | 2.00 |
| Single Female/Mother | 142 (19.9%) | 2.97 |
| Non-family | 129 (18.0%) | 1.26 |
| Total Households | 715 (100.0%) | 2.98 |
Household Size by Marriage Status in Winterville
Out of a total of 715 households in Winterville, 586 (82.0%) are family households, while 129 (18.0%) are nonfamily households. The most numerous type of family households are 2-person households, comprising 241, and the most common type of nonfamily households are 1-person households, comprising 93.
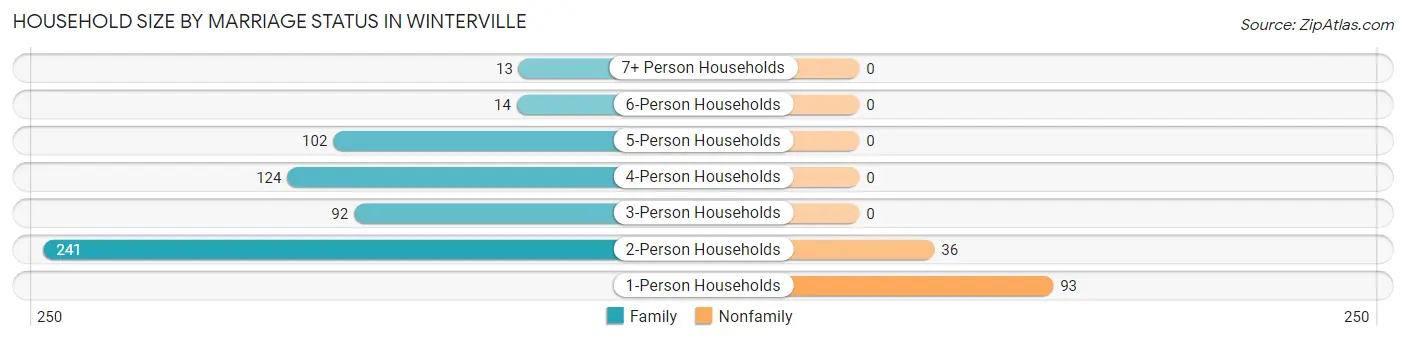
| Household Size | Family Households | Nonfamily Households |
| 1-Person Households | - | 93 (13.0%) |
| 2-Person Households | 241 (33.7%) | 36 (5.0%) |
| 3-Person Households | 92 (12.9%) | 0 (0.0%) |
| 4-Person Households | 124 (17.3%) | 0 (0.0%) |
| 5-Person Households | 102 (14.3%) | 0 (0.0%) |
| 6-Person Households | 14 (2.0%) | 0 (0.0%) |
| 7+ Person Households | 13 (1.8%) | 0 (0.0%) |
| Total | 586 (82.0%) | 129 (18.0%) |
Female Fertility in Winterville
Fertility by Age in Winterville
Average fertility rate in Winterville is 50.0 births per 1,000 women. Women in the age bracket of 20 to 34 years have the highest fertility rate with 97.0 births per 1,000 women. Women in the age bracket of 20 to 34 years acount for 90.9% of all women with births.
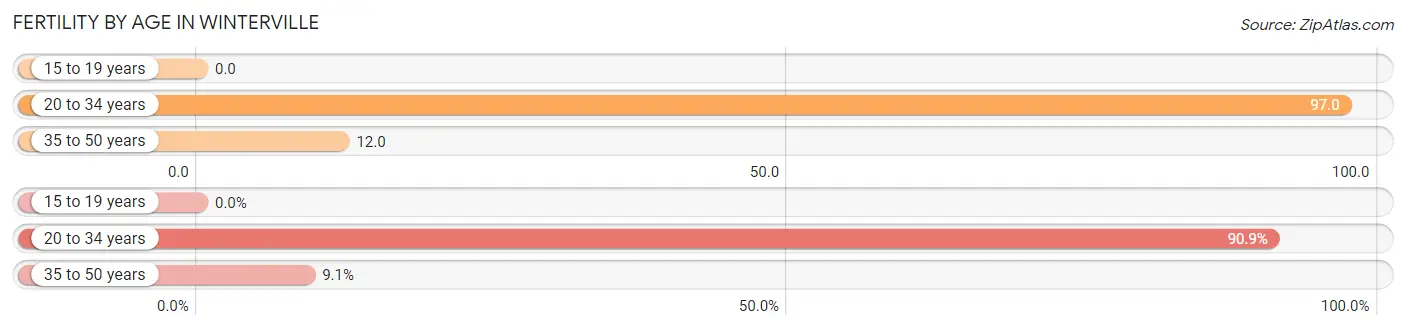
| Age Bracket | Women with Births | Births / 1,000 Women |
| 15 to 19 years | 0 (0.0%) | 0.0 |
| 20 to 34 years | 20 (90.9%) | 97.0 |
| 35 to 50 years | 2 (9.1%) | 12.0 |
| Total | 22 (100.0%) | 50.0 |
Fertility by Age by Marriage Status in Winterville
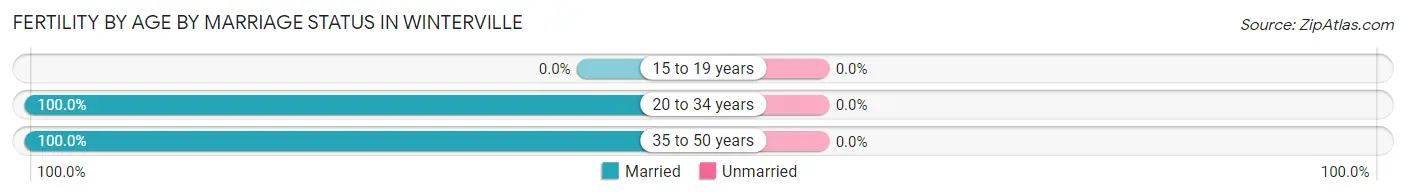
| Age Bracket | Married | Unmarried |
| 15 to 19 years | 0 (0.0%) | 0 (0.0%) |
| 20 to 34 years | 20 (100.0%) | 0 (0.0%) |
| 35 to 50 years | 2 (100.0%) | 0 (0.0%) |
| Total | 22 (100.0%) | 0 (0.0%) |
Fertility by Education in Winterville
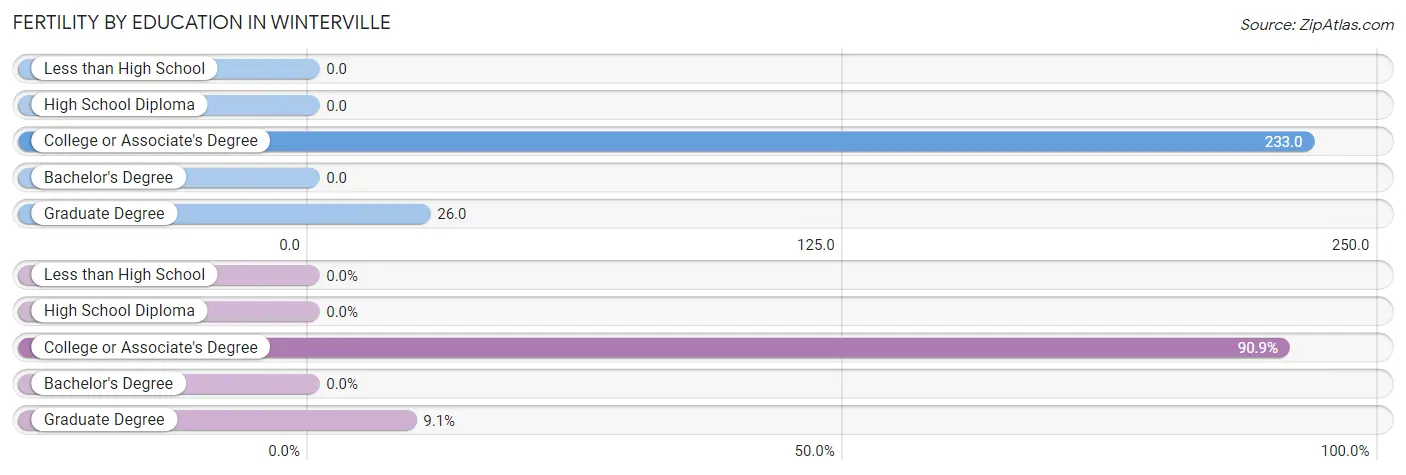
| Educational Attainment | Women with Births | Births / 1,000 Women |
| Less than High School | 0 (0.0%) | 0.0 |
| High School Diploma | 0 (0.0%) | 0.0 |
| College or Associate's Degree | 20 (90.9%) | 233.0 |
| Bachelor's Degree | 0 (0.0%) | 0.0 |
| Graduate Degree | 2 (9.1%) | 26.0 |
| Total | 22 (100.0%) | 50.0 |
Fertility by Education by Marriage Status in Winterville
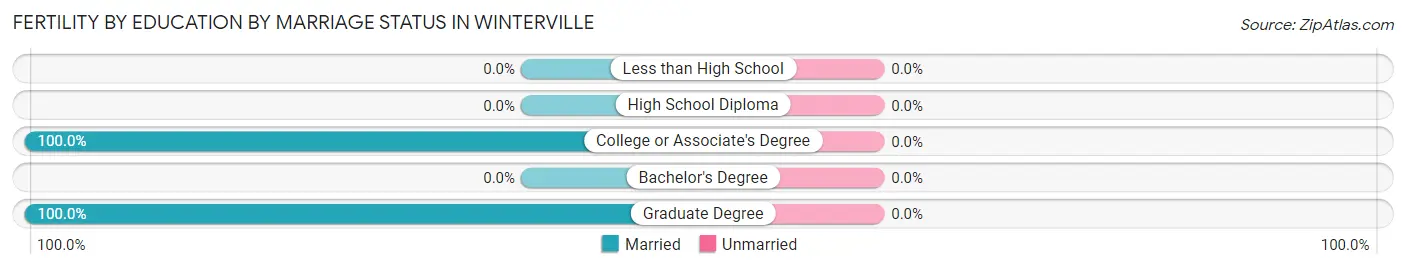
| Educational Attainment | Married | Unmarried |
| Less than High School | 0 (0.0%) | 0 (0.0%) |
| High School Diploma | 0 (0.0%) | 0 (0.0%) |
| College or Associate's Degree | 20 (100.0%) | 0 (0.0%) |
| Bachelor's Degree | 0 (0.0%) | 0 (0.0%) |
| Graduate Degree | 2 (100.0%) | 0 (0.0%) |
| Total | 22 (100.0%) | 0 (0.0%) |
Employment Characteristics in Winterville
Employment by Class of Employer in Winterville
Among the 943 employed individuals in Winterville, private company employees (566 | 60.0%), state government employees (185 | 19.6%), and local government employees (66 | 7.0%) make up the most common classes of employment.
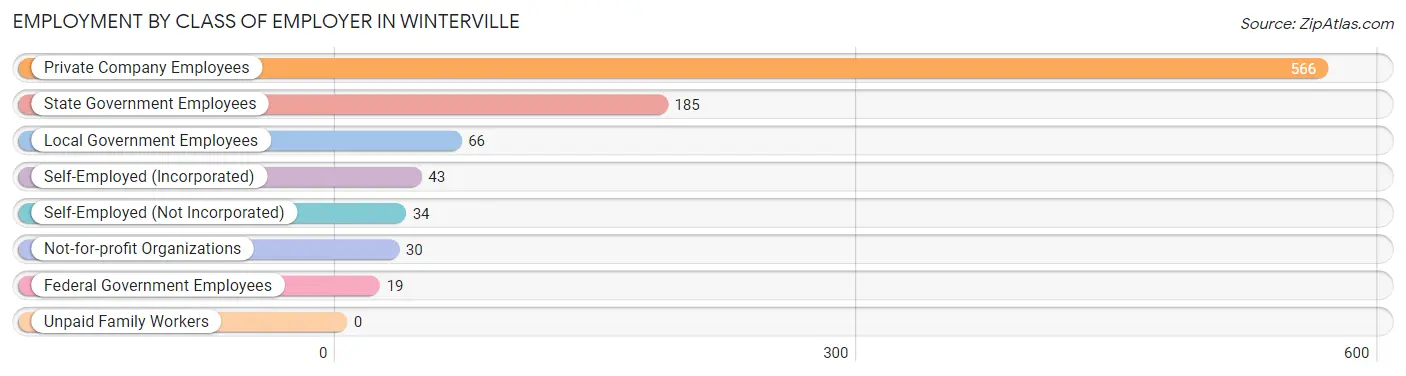
| Employer Class | # Employees | % Employees |
| Private Company Employees | 566 | 60.0% |
| Self-Employed (Incorporated) | 43 | 4.6% |
| Self-Employed (Not Incorporated) | 34 | 3.6% |
| Not-for-profit Organizations | 30 | 3.2% |
| Local Government Employees | 66 | 7.0% |
| State Government Employees | 185 | 19.6% |
| Federal Government Employees | 19 | 2.0% |
| Unpaid Family Workers | 0 | 0.0% |
| Total | 943 | 100.0% |
Employment Status by Age in Winterville
According to the labor force statistics for Winterville, out of the total population over 16 years of age (1,696), 61.0% or 1,035 individuals are in the labor force, with 2.4% or 25 of them unemployed. The age group with the highest labor force participation rate is 30 to 34 years, with 95.4% or 124 individuals in the labor force. Within the labor force, the 25 to 29 years age range has the highest percentage of unemployed individuals, with 7.9% or 5 of them being unemployed.
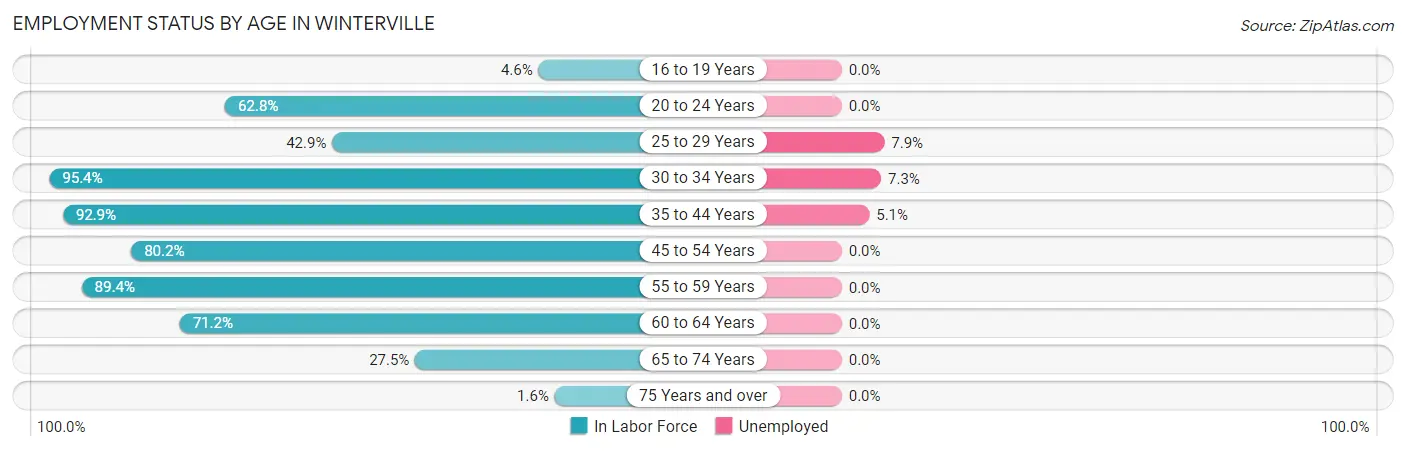
| Age Bracket | In Labor Force | Unemployed |
| 16 to 19 Years | 9 (4.6%) | 0 (0.0%) |
| 20 to 24 Years | 27 (62.8%) | 0 (0.0%) |
| 25 to 29 Years | 63 (42.9%) | 5 (7.9%) |
| 30 to 34 Years | 124 (95.4%) | 9 (7.3%) |
| 35 to 44 Years | 209 (92.9%) | 11 (5.1%) |
| 45 to 54 Years | 304 (80.2%) | 0 (0.0%) |
| 55 to 59 Years | 211 (89.4%) | 0 (0.0%) |
| 60 to 64 Years | 42 (71.2%) | 0 (0.0%) |
| 65 to 74 Years | 44 (27.5%) | 0 (0.0%) |
| 75 Years and over | 2 (1.6%) | 0 (0.0%) |
| Total | 1,035 (61.0%) | 25 (2.4%) |
Employment Status by Educational Attainment in Winterville
According to labor force statistics for Winterville, 81.0% of individuals (953) out of the total population between 25 and 64 years of age (1,176) are in the labor force, with 2.6% or 25 of them being unemployed. The group with the highest labor force participation rate are those with the educational attainment of college / associate degree, with 90.4% or 358 individuals in the labor force. Within the labor force, individuals with less than high school education have the highest percentage of unemployment, with 50.0% or 7 of them being unemployed.
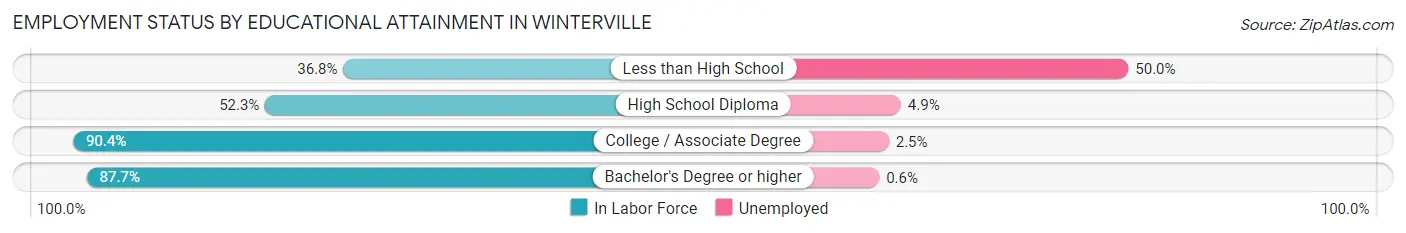
| Educational Attainment | In Labor Force | Unemployed |
| Less than High School | 14 (36.8%) | 19 (50.0%) |
| High School Diploma | 103 (52.3%) | 10 (4.9%) |
| College / Associate Degree | 358 (90.4%) | 10 (2.5%) |
| Bachelor's Degree or higher | 478 (87.7%) | 3 (0.6%) |
| Total | 953 (81.0%) | 31 (2.6%) |
Employment Occupations by Sex in Winterville
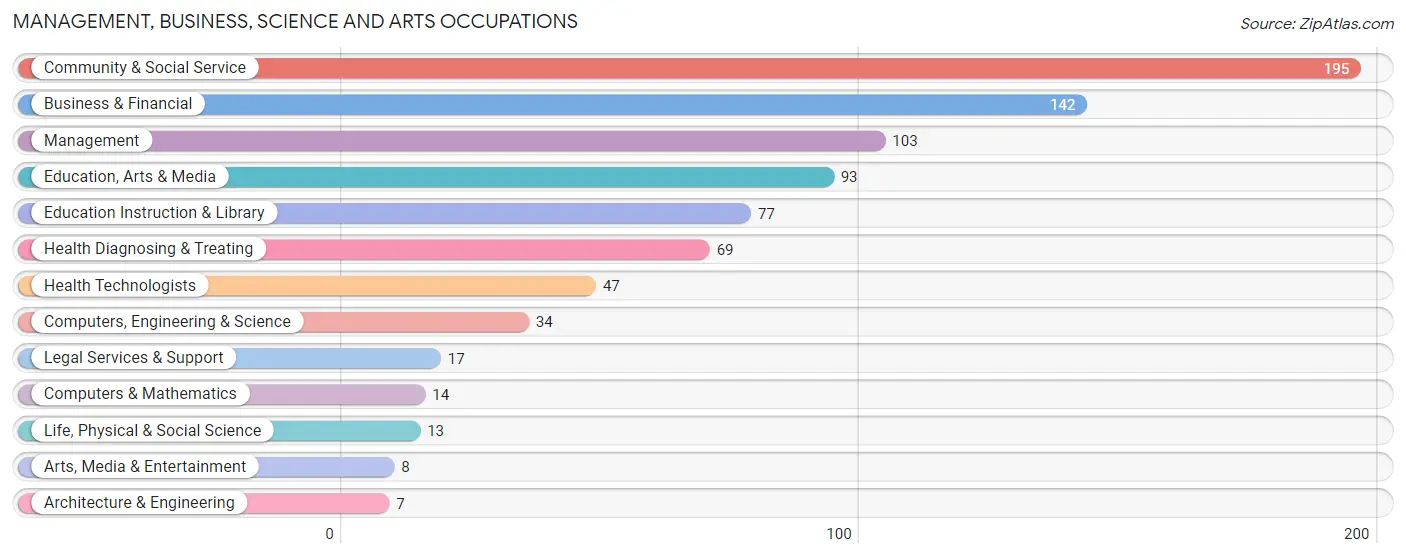
Management, Business, Science and Arts Occupations
The most common Management, Business, Science and Arts occupations in Winterville are Community & Social Service (195 | 19.6%), Business & Financial (142 | 14.2%), Management (103 | 10.3%), Education, Arts & Media (93 | 9.3%), and Education Instruction & Library (77 | 7.7%).
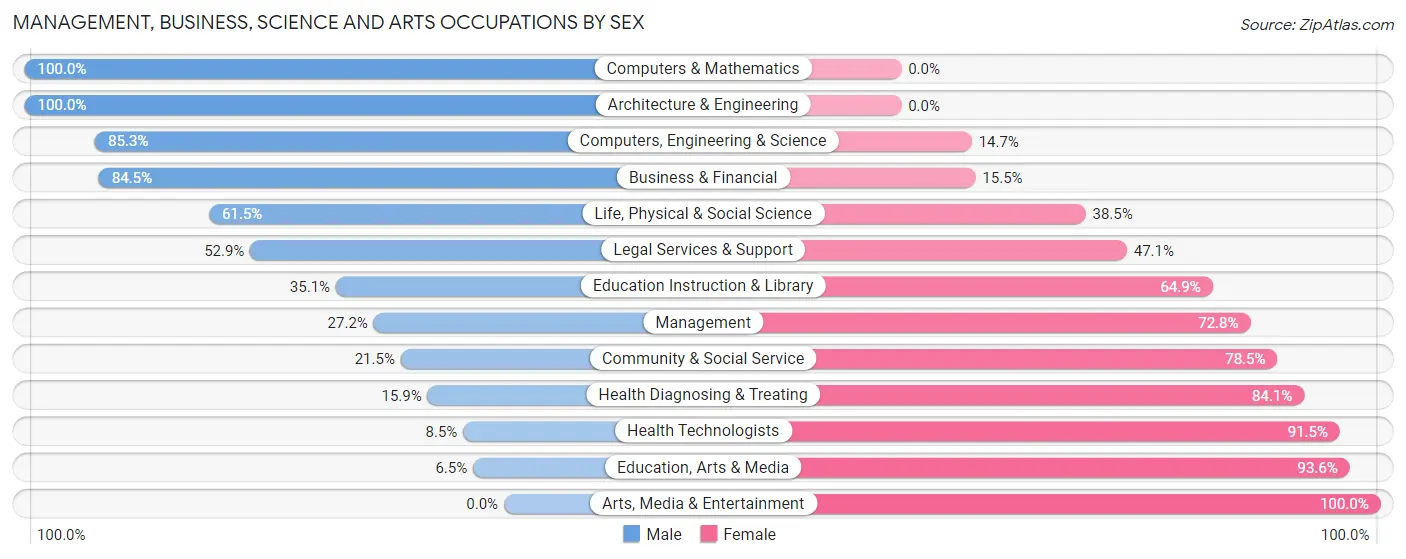
Management, Business, Science and Arts Occupations by Sex
Within the Management, Business, Science and Arts occupations in Winterville, the most male-oriented occupations are Computers & Mathematics (100.0%), Architecture & Engineering (100.0%), and Computers, Engineering & Science (85.3%), while the most female-oriented occupations are Arts, Media & Entertainment (100.0%), Education, Arts & Media (93.5%), and Health Technologists (91.5%).
| Occupation | Male | Female |
| Management | 28 (27.2%) | 75 (72.8%) |
| Business & Financial | 120 (84.5%) | 22 (15.5%) |
| Computers, Engineering & Science | 29 (85.3%) | 5 (14.7%) |
| Computers & Mathematics | 14 (100.0%) | 0 (0.0%) |
| Architecture & Engineering | 7 (100.0%) | 0 (0.0%) |
| Life, Physical & Social Science | 8 (61.5%) | 5 (38.5%) |
| Community & Social Service | 42 (21.5%) | 153 (78.5%) |
| Education, Arts & Media | 6 (6.5%) | 87 (93.5%) |
| Legal Services & Support | 9 (52.9%) | 8 (47.1%) |
| Education Instruction & Library | 27 (35.1%) | 50 (64.9%) |
| Arts, Media & Entertainment | 0 (0.0%) | 8 (100.0%) |
| Health Diagnosing & Treating | 11 (15.9%) | 58 (84.1%) |
| Health Technologists | 4 (8.5%) | 43 (91.5%) |
| Total (Category) | 230 (42.4%) | 313 (57.6%) |
| Total (Overall) | 441 (44.2%) | 556 (55.8%) |
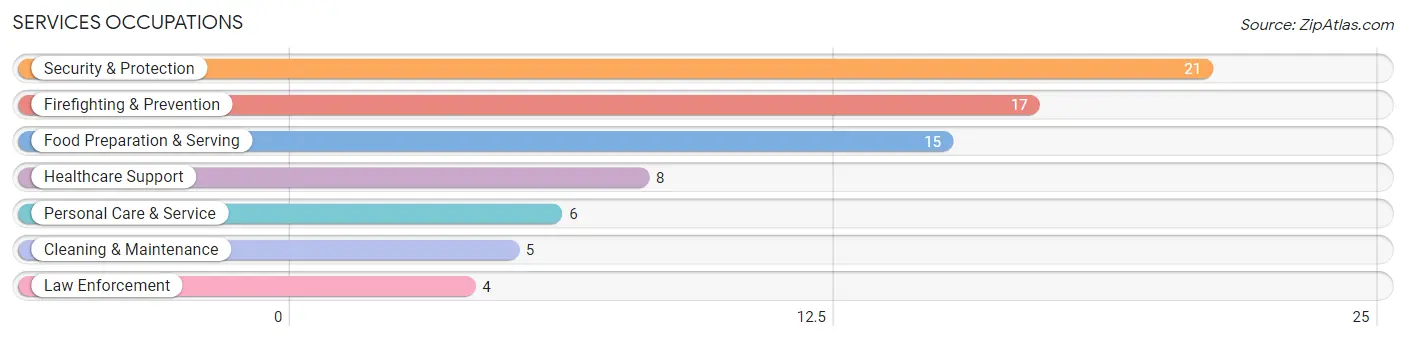
Services Occupations
The most common Services occupations in Winterville are Security & Protection (21 | 2.1%), Firefighting & Prevention (17 | 1.7%), Food Preparation & Serving (15 | 1.5%), Healthcare Support (8 | 0.8%), and Personal Care & Service (6 | 0.6%).
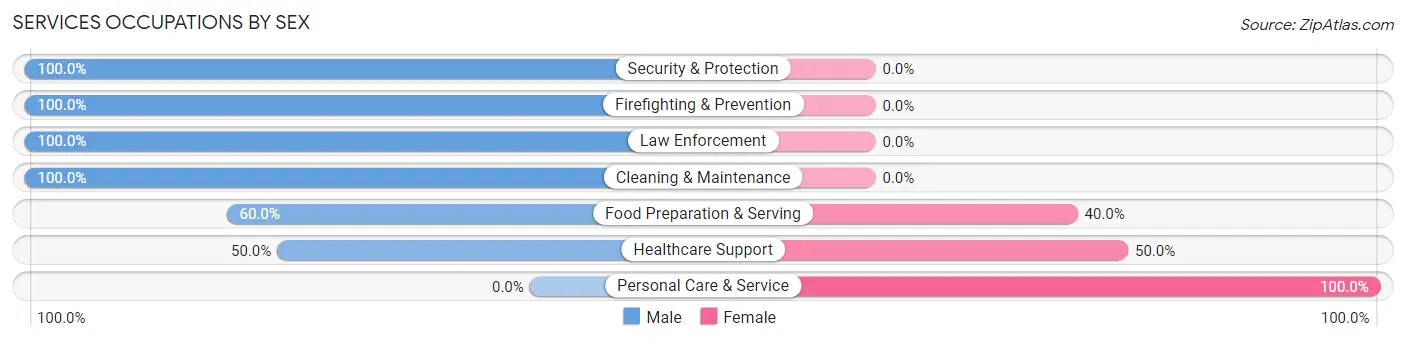
Services Occupations by Sex
Within the Services occupations in Winterville, the most male-oriented occupations are Security & Protection (100.0%), Firefighting & Prevention (100.0%), and Law Enforcement (100.0%), while the most female-oriented occupations are Personal Care & Service (100.0%), Healthcare Support (50.0%), and Food Preparation & Serving (40.0%).
| Occupation | Male | Female |
| Healthcare Support | 4 (50.0%) | 4 (50.0%) |
| Security & Protection | 21 (100.0%) | 0 (0.0%) |
| Firefighting & Prevention | 17 (100.0%) | 0 (0.0%) |
| Law Enforcement | 4 (100.0%) | 0 (0.0%) |
| Food Preparation & Serving | 9 (60.0%) | 6 (40.0%) |
| Cleaning & Maintenance | 5 (100.0%) | 0 (0.0%) |
| Personal Care & Service | 0 (0.0%) | 6 (100.0%) |
| Total (Category) | 39 (70.9%) | 16 (29.1%) |
| Total (Overall) | 441 (44.2%) | 556 (55.8%) |
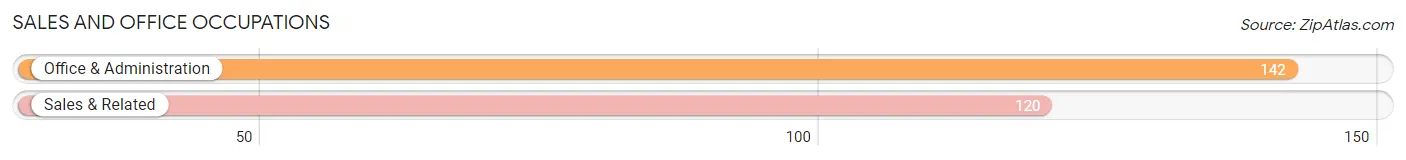
Sales and Office Occupations
The most common Sales and Office occupations in Winterville are Office & Administration (142 | 14.2%), and Sales & Related (120 | 12.0%).
Sales and Office Occupations by Sex
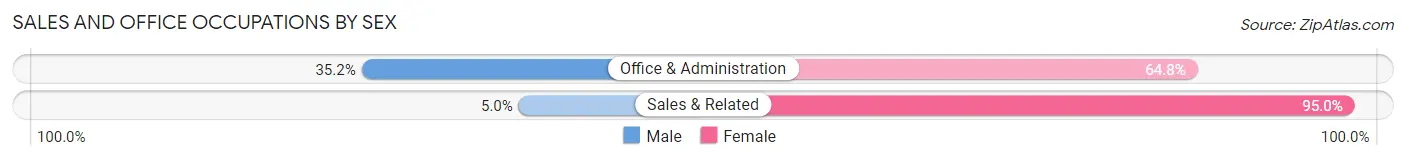
| Occupation | Male | Female |
| Sales & Related | 6 (5.0%) | 114 (95.0%) |
| Office & Administration | 50 (35.2%) | 92 (64.8%) |
| Total (Category) | 56 (21.4%) | 206 (78.6%) |
| Total (Overall) | 441 (44.2%) | 556 (55.8%) |
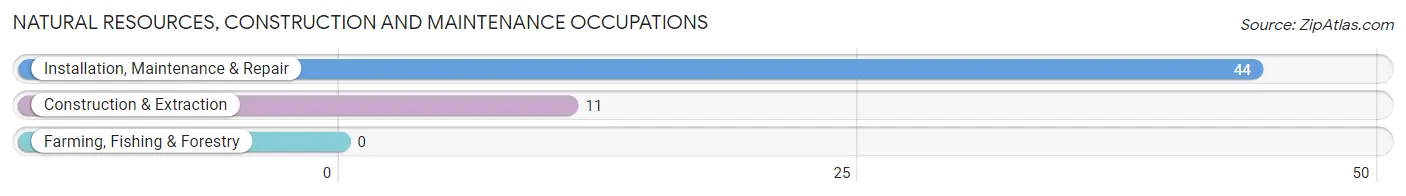
Natural Resources, Construction and Maintenance Occupations
The most common Natural Resources, Construction and Maintenance occupations in Winterville are Installation, Maintenance & Repair (44 | 4.4%), and Construction & Extraction (11 | 1.1%).
Natural Resources, Construction and Maintenance Occupations by Sex

| Occupation | Male | Female |
| Farming, Fishing & Forestry | 0 (0.0%) | 0 (0.0%) |
| Construction & Extraction | 11 (100.0%) | 0 (0.0%) |
| Installation, Maintenance & Repair | 44 (100.0%) | 0 (0.0%) |
| Total (Category) | 55 (100.0%) | 0 (0.0%) |
| Total (Overall) | 441 (44.2%) | 556 (55.8%) |
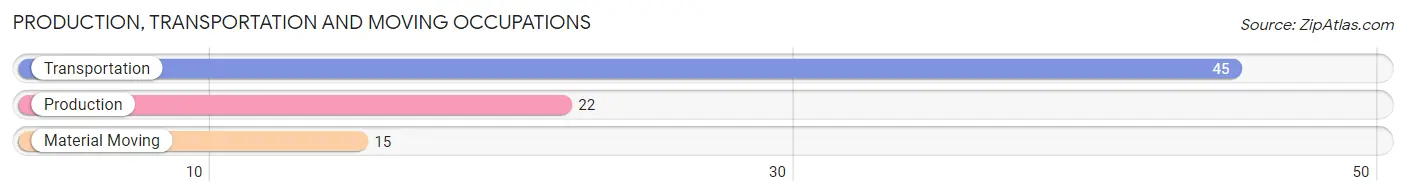
Production, Transportation and Moving Occupations
The most common Production, Transportation and Moving occupations in Winterville are Transportation (45 | 4.5%), Production (22 | 2.2%), and Material Moving (15 | 1.5%).
Production, Transportation and Moving Occupations by Sex
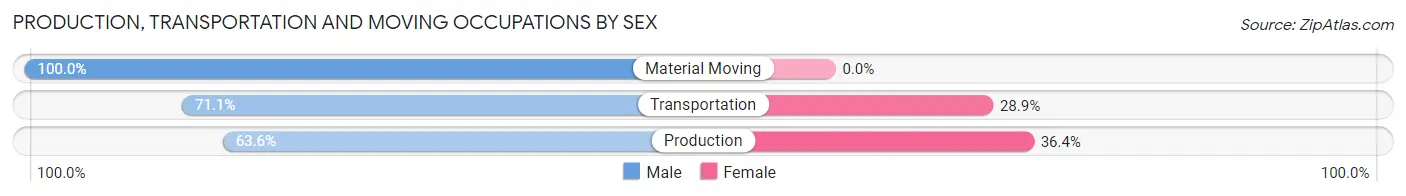
| Occupation | Male | Female |
| Production | 14 (63.6%) | 8 (36.4%) |
| Transportation | 32 (71.1%) | 13 (28.9%) |
| Material Moving | 15 (100.0%) | 0 (0.0%) |
| Total (Category) | 61 (74.4%) | 21 (25.6%) |
| Total (Overall) | 441 (44.2%) | 556 (55.8%) |
Employment Industries by Sex in Winterville
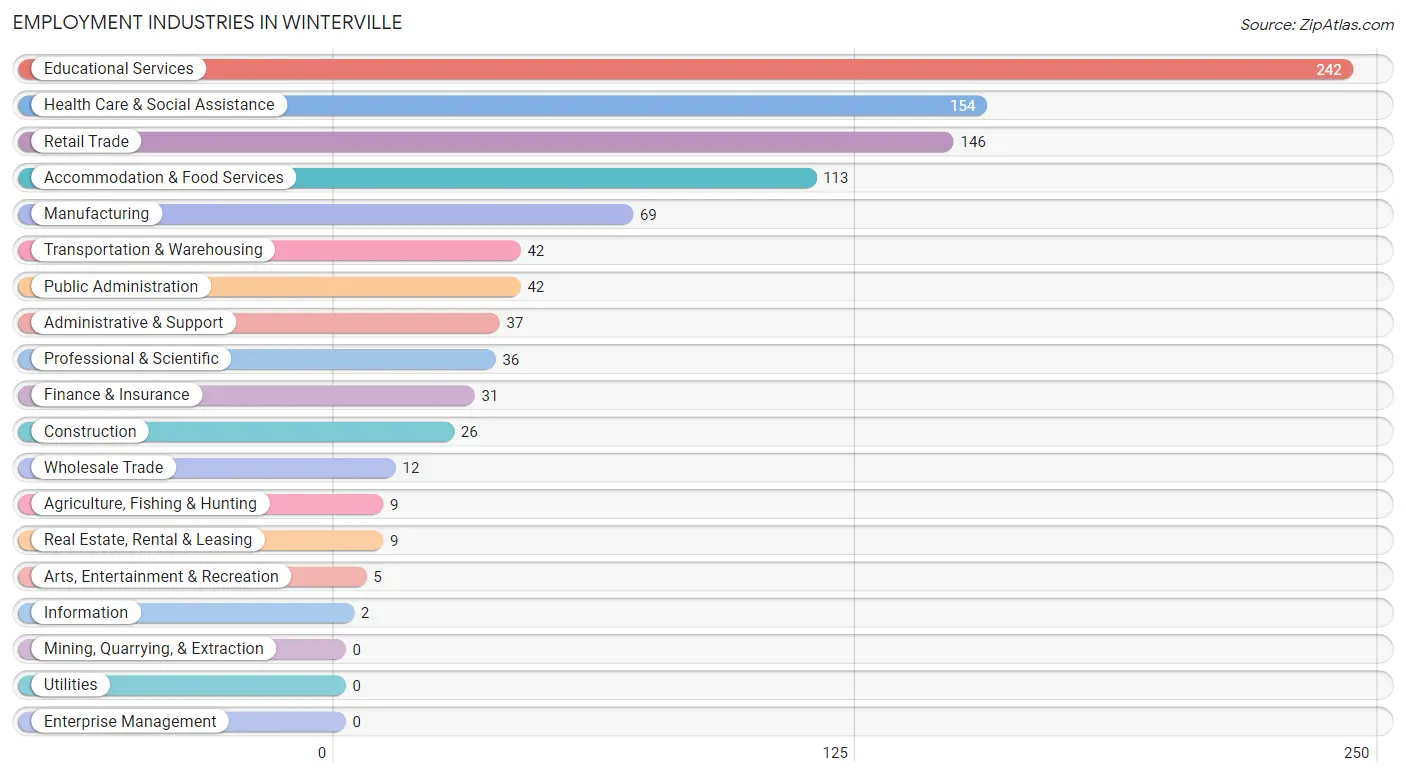
Employment Industries in Winterville
The major employment industries in Winterville include Educational Services (242 | 24.3%), Health Care & Social Assistance (154 | 15.4%), Retail Trade (146 | 14.6%), Accommodation & Food Services (113 | 11.3%), and Manufacturing (69 | 6.9%).
Employment Industries by Sex in Winterville
The Winterville industries that see more men than women are Agriculture, Fishing & Hunting (100.0%), Construction (100.0%), and Information (100.0%), whereas the industries that tend to have a higher number of women are Finance & Insurance (100.0%), Arts, Entertainment & Recreation (100.0%), and Real Estate, Rental & Leasing (77.8%).
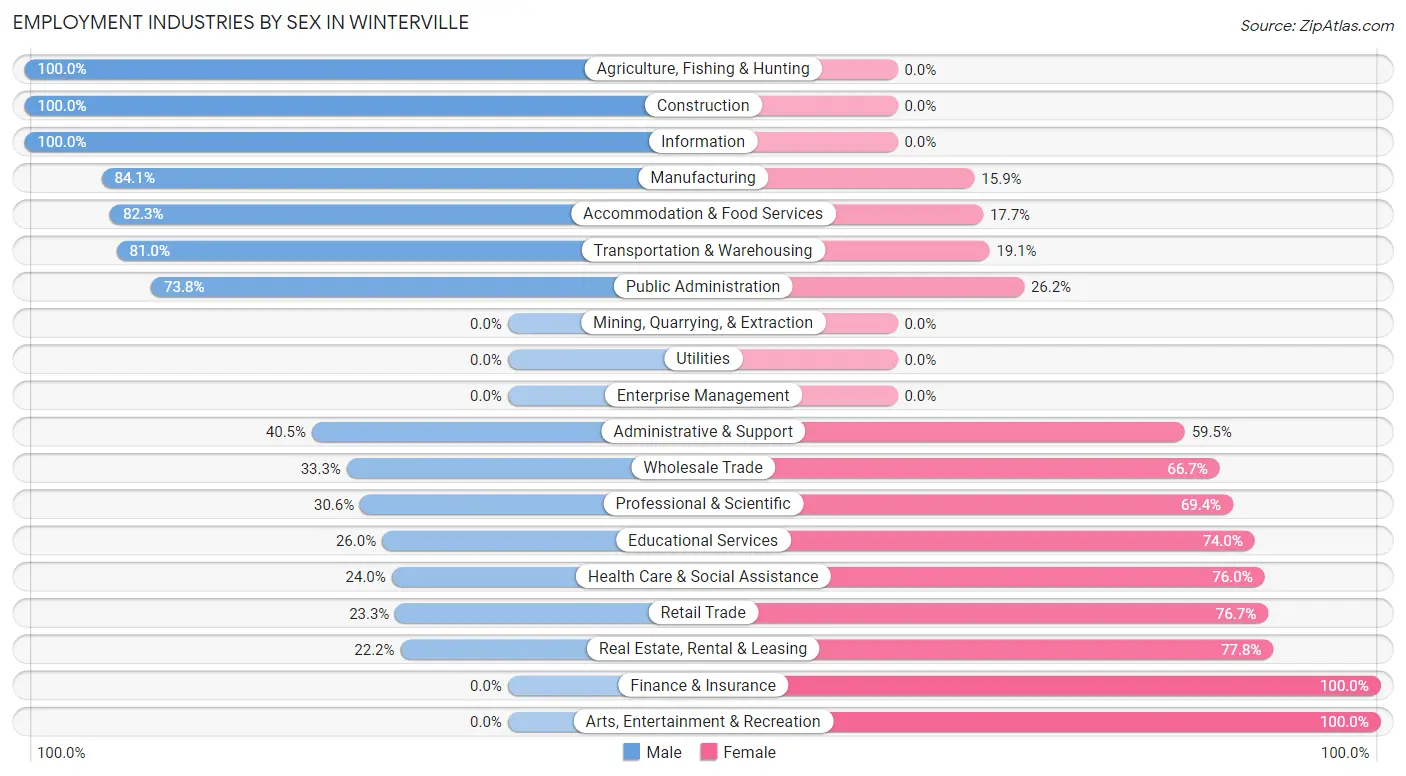
| Industry | Male | Female |
| Agriculture, Fishing & Hunting | 9 (100.0%) | 0 (0.0%) |
| Mining, Quarrying, & Extraction | 0 (0.0%) | 0 (0.0%) |
| Construction | 26 (100.0%) | 0 (0.0%) |
| Manufacturing | 58 (84.1%) | 11 (15.9%) |
| Wholesale Trade | 4 (33.3%) | 8 (66.7%) |
| Retail Trade | 34 (23.3%) | 112 (76.7%) |
| Transportation & Warehousing | 34 (80.9%) | 8 (19.1%) |
| Utilities | 0 (0.0%) | 0 (0.0%) |
| Information | 2 (100.0%) | 0 (0.0%) |
| Finance & Insurance | 0 (0.0%) | 31 (100.0%) |
| Real Estate, Rental & Leasing | 2 (22.2%) | 7 (77.8%) |
| Professional & Scientific | 11 (30.6%) | 25 (69.4%) |
| Enterprise Management | 0 (0.0%) | 0 (0.0%) |
| Administrative & Support | 15 (40.5%) | 22 (59.5%) |
| Educational Services | 63 (26.0%) | 179 (74.0%) |
| Health Care & Social Assistance | 37 (24.0%) | 117 (76.0%) |
| Arts, Entertainment & Recreation | 0 (0.0%) | 5 (100.0%) |
| Accommodation & Food Services | 93 (82.3%) | 20 (17.7%) |
| Public Administration | 31 (73.8%) | 11 (26.2%) |
| Total | 441 (44.2%) | 556 (55.8%) |
Education in Winterville
School Enrollment in Winterville
The most common levels of schooling among the 628 students in Winterville are high school (285 | 45.4%), middle school (139 | 22.1%), and college / undergraduate (67 | 10.7%).
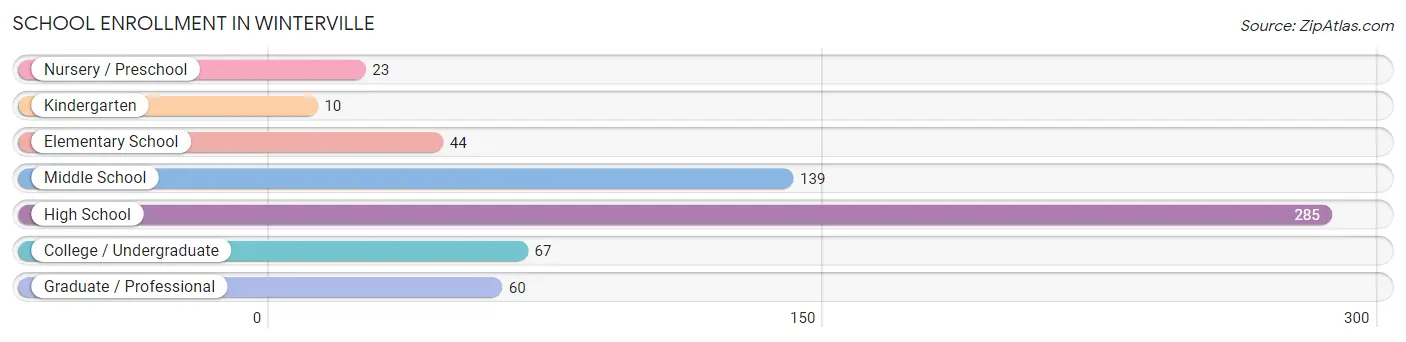
| School Level | # Students | % Students |
| Nursery / Preschool | 23 | 3.7% |
| Kindergarten | 10 | 1.6% |
| Elementary School | 44 | 7.0% |
| Middle School | 139 | 22.1% |
| High School | 285 | 45.4% |
| College / Undergraduate | 67 | 10.7% |
| Graduate / Professional | 60 | 9.6% |
| Total | 628 | 100.0% |
School Enrollment by Age by Funding Source in Winterville
Out of a total of 628 students who are enrolled in schools in Winterville, 79 (12.6%) attend a private institution, while the remaining 549 (87.4%) are enrolled in public schools. The age group of 10 to 14 year olds has the highest likelihood of being enrolled in private schools, with 55 (37.4% in the age bracket) enrolled. Conversely, the age group of 3 to 4 year olds has the lowest likelihood of being enrolled in a private school, with 23 (100.0% in the age bracket) attending a public institution.
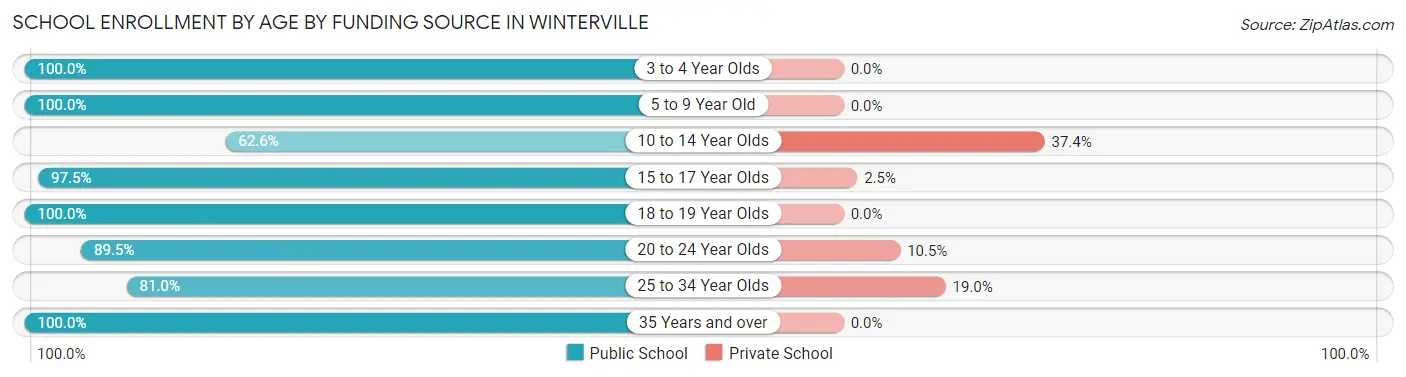
| Age Bracket | Public School | Private School |
| 3 to 4 Year Olds | 23 (100.0%) | 0 (0.0%) |
| 5 to 9 Year Old | 53 (100.0%) | 0 (0.0%) |
| 10 to 14 Year Olds | 92 (62.6%) | 55 (37.4%) |
| 15 to 17 Year Olds | 270 (97.5%) | 7 (2.5%) |
| 18 to 19 Year Olds | 3 (100.0%) | 0 (0.0%) |
| 20 to 24 Year Olds | 17 (89.5%) | 2 (10.5%) |
| 25 to 34 Year Olds | 64 (81.0%) | 15 (19.0%) |
| 35 Years and over | 27 (100.0%) | 0 (0.0%) |
| Total | 549 (87.4%) | 79 (12.6%) |
Educational Attainment by Field of Study in Winterville
Business (206 | 29.3%), arts & humanities (130 | 18.5%), science & technology (83 | 11.8%), education (78 | 11.1%), and liberal arts & history (54 | 7.7%) are the most common fields of study among 703 individuals in Winterville who have obtained a bachelor's degree or higher.
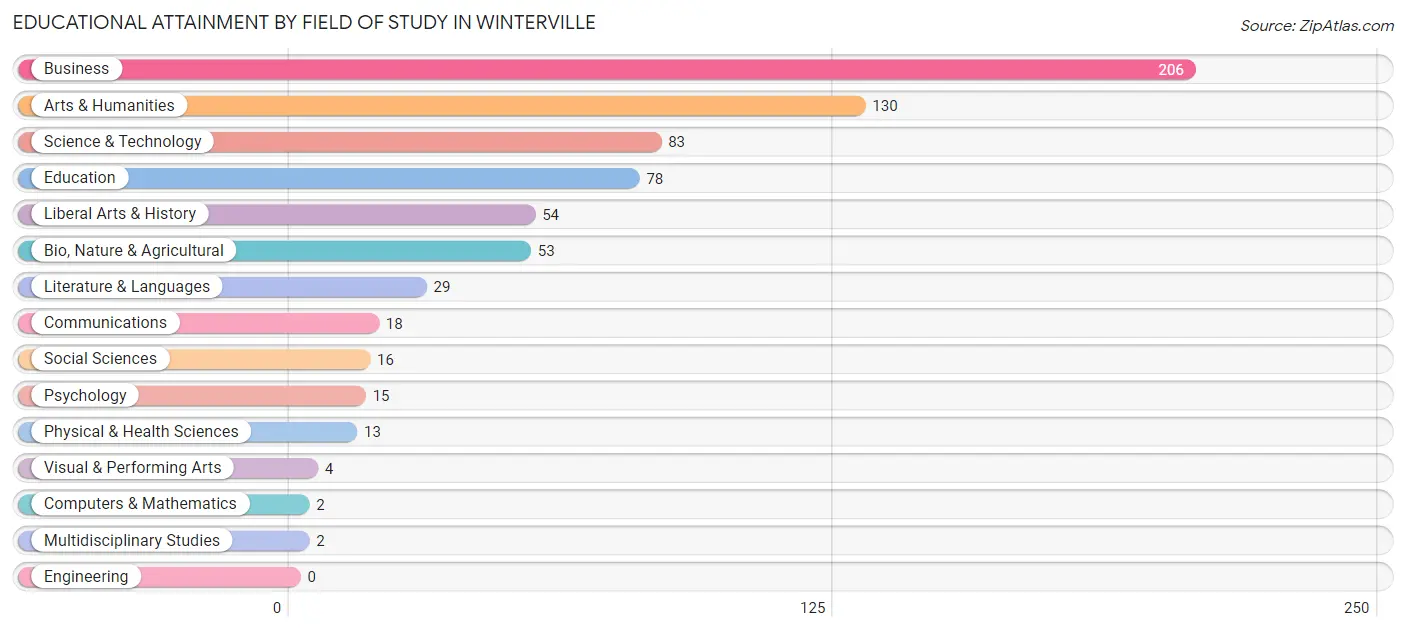
| Field of Study | # Graduates | % Graduates |
| Computers & Mathematics | 2 | 0.3% |
| Bio, Nature & Agricultural | 53 | 7.5% |
| Physical & Health Sciences | 13 | 1.8% |
| Psychology | 15 | 2.1% |
| Social Sciences | 16 | 2.3% |
| Engineering | 0 | 0.0% |
| Multidisciplinary Studies | 2 | 0.3% |
| Science & Technology | 83 | 11.8% |
| Business | 206 | 29.3% |
| Education | 78 | 11.1% |
| Literature & Languages | 29 | 4.1% |
| Liberal Arts & History | 54 | 7.7% |
| Visual & Performing Arts | 4 | 0.6% |
| Communications | 18 | 2.6% |
| Arts & Humanities | 130 | 18.5% |
| Total | 703 | 100.0% |
Transportation & Commute in Winterville
Vehicle Availability by Sex in Winterville
The most prevalent vehicle ownership categories in Winterville are males with 2 vehicles (205, accounting for 45.9%) and females with 2 vehicles (226, making up 41.3%).
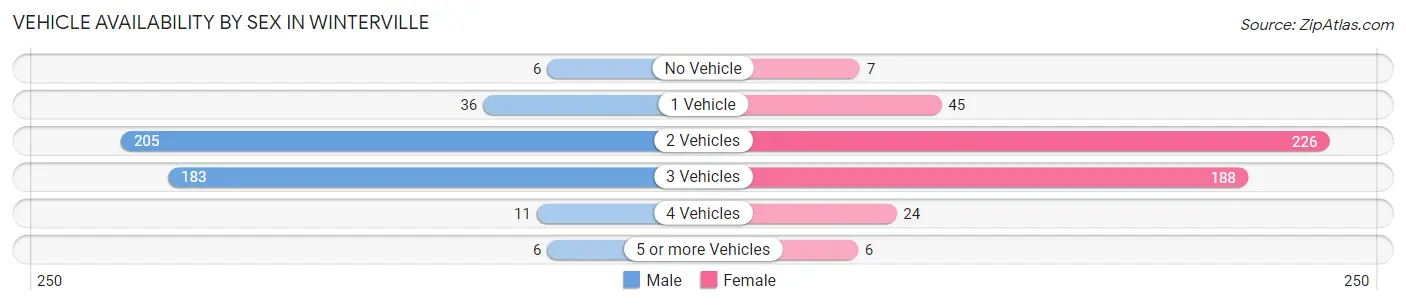
| Vehicles Available | Male | Female |
| No Vehicle | 6 (1.3%) | 7 (1.4%) |
| 1 Vehicle | 36 (8.1%) | 45 (9.1%) |
| 2 Vehicles | 205 (45.9%) | 226 (45.6%) |
| 3 Vehicles | 183 (40.9%) | 188 (37.9%) |
| 4 Vehicles | 11 (2.5%) | 24 (4.8%) |
| 5 or more Vehicles | 6 (1.3%) | 6 (1.2%) |
| Total | 447 (100.0%) | 496 (100.0%) |
Commute Time in Winterville
The most frequently occuring commute durations in Winterville are 15 to 19 minutes (218 commuters, 24.9%), 25 to 29 minutes (136 commuters, 15.5%), and 20 to 24 minutes (130 commuters, 14.8%).
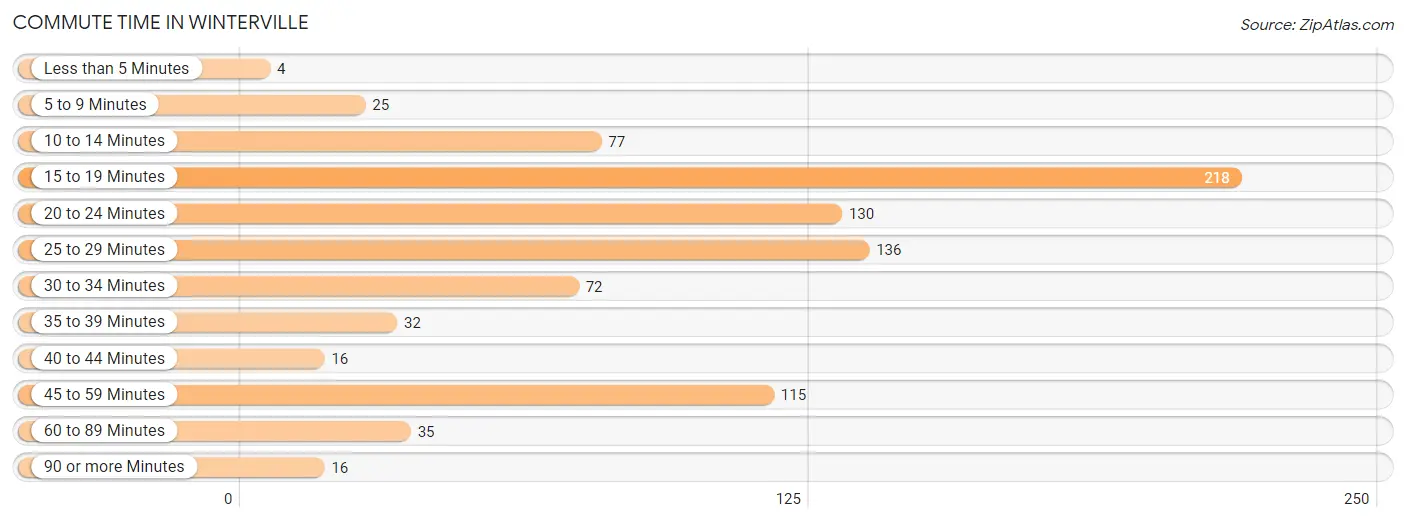
| Commute Time | # Commuters | % Commuters |
| Less than 5 Minutes | 4 | 0.5% |
| 5 to 9 Minutes | 25 | 2.9% |
| 10 to 14 Minutes | 77 | 8.8% |
| 15 to 19 Minutes | 218 | 24.9% |
| 20 to 24 Minutes | 130 | 14.8% |
| 25 to 29 Minutes | 136 | 15.5% |
| 30 to 34 Minutes | 72 | 8.2% |
| 35 to 39 Minutes | 32 | 3.6% |
| 40 to 44 Minutes | 16 | 1.8% |
| 45 to 59 Minutes | 115 | 13.1% |
| 60 to 89 Minutes | 35 | 4.0% |
| 90 or more Minutes | 16 | 1.8% |
Commute Time by Sex in Winterville
The most common commute times in Winterville are 25 to 29 minutes (97 commuters, 22.7%) for males and 15 to 19 minutes (153 commuters, 34.1%) for females.
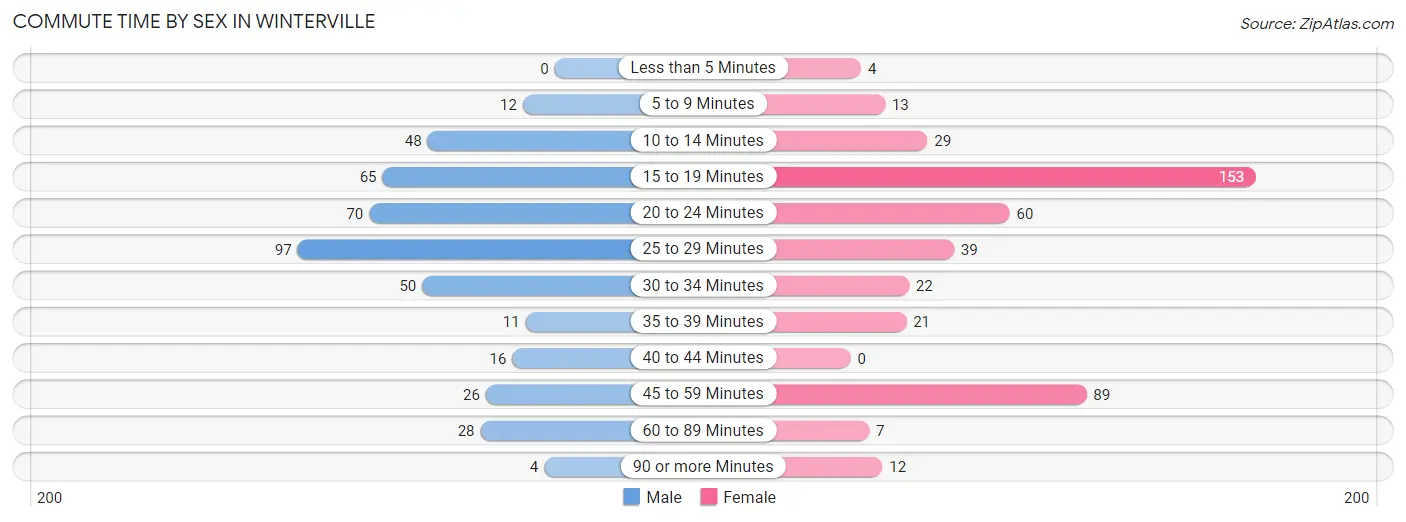
| Commute Time | Male | Female |
| Less than 5 Minutes | 0 (0.0%) | 4 (0.9%) |
| 5 to 9 Minutes | 12 (2.8%) | 13 (2.9%) |
| 10 to 14 Minutes | 48 (11.2%) | 29 (6.5%) |
| 15 to 19 Minutes | 65 (15.2%) | 153 (34.1%) |
| 20 to 24 Minutes | 70 (16.4%) | 60 (13.4%) |
| 25 to 29 Minutes | 97 (22.7%) | 39 (8.7%) |
| 30 to 34 Minutes | 50 (11.7%) | 22 (4.9%) |
| 35 to 39 Minutes | 11 (2.6%) | 21 (4.7%) |
| 40 to 44 Minutes | 16 (3.7%) | 0 (0.0%) |
| 45 to 59 Minutes | 26 (6.1%) | 89 (19.8%) |
| 60 to 89 Minutes | 28 (6.6%) | 7 (1.6%) |
| 90 or more Minutes | 4 (0.9%) | 12 (2.7%) |
Time of Departure to Work by Sex in Winterville
The most frequent times of departure to work in Winterville are 7:30 AM to 7:59 AM (168, 39.3%) for males and 6:30 AM to 6:59 AM (106, 23.6%) for females.
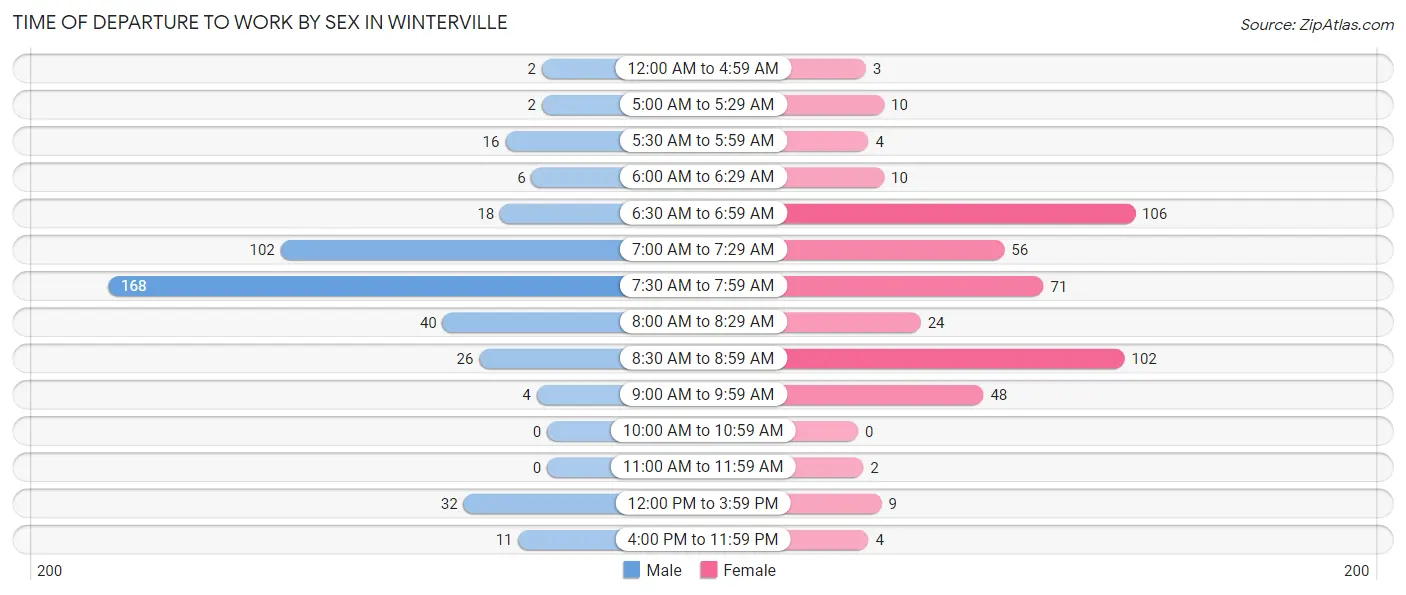
| Time of Departure | Male | Female |
| 12:00 AM to 4:59 AM | 2 (0.5%) | 3 (0.7%) |
| 5:00 AM to 5:29 AM | 2 (0.5%) | 10 (2.2%) |
| 5:30 AM to 5:59 AM | 16 (3.7%) | 4 (0.9%) |
| 6:00 AM to 6:29 AM | 6 (1.4%) | 10 (2.2%) |
| 6:30 AM to 6:59 AM | 18 (4.2%) | 106 (23.6%) |
| 7:00 AM to 7:29 AM | 102 (23.9%) | 56 (12.5%) |
| 7:30 AM to 7:59 AM | 168 (39.3%) | 71 (15.8%) |
| 8:00 AM to 8:29 AM | 40 (9.4%) | 24 (5.3%) |
| 8:30 AM to 8:59 AM | 26 (6.1%) | 102 (22.7%) |
| 9:00 AM to 9:59 AM | 4 (0.9%) | 48 (10.7%) |
| 10:00 AM to 10:59 AM | 0 (0.0%) | 0 (0.0%) |
| 11:00 AM to 11:59 AM | 0 (0.0%) | 2 (0.4%) |
| 12:00 PM to 3:59 PM | 32 (7.5%) | 9 (2.0%) |
| 4:00 PM to 11:59 PM | 11 (2.6%) | 4 (0.9%) |
| Total | 427 (100.0%) | 449 (100.0%) |
Housing Occupancy in Winterville
Occupancy by Ownership in Winterville
Of the total 715 dwellings in Winterville, owner-occupied units account for 628 (87.8%), while renter-occupied units make up 87 (12.2%).
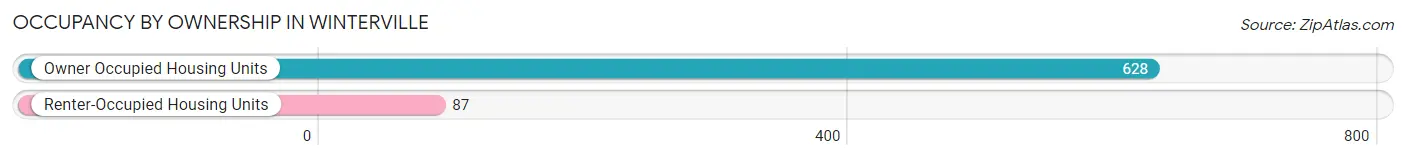
| Occupancy | # Housing Units | % Housing Units |
| Owner Occupied Housing Units | 628 | 87.8% |
| Renter-Occupied Housing Units | 87 | 12.2% |
| Total Occupied Housing Units | 715 | 100.0% |
Occupancy by Household Size in Winterville
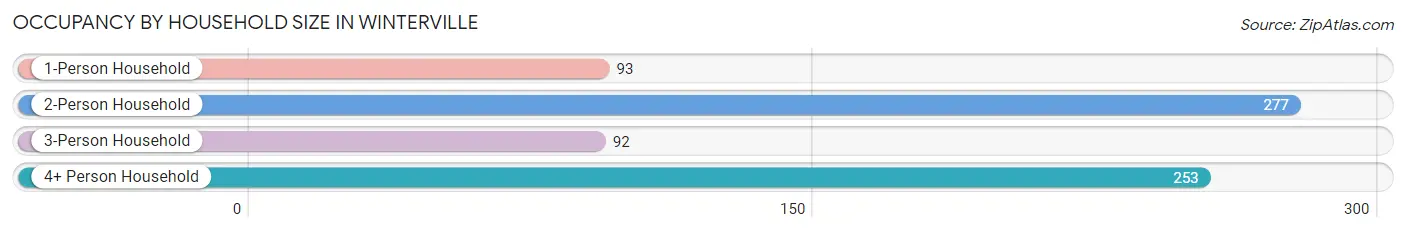
| Household Size | # Housing Units | % Housing Units |
| 1-Person Household | 93 | 13.0% |
| 2-Person Household | 277 | 38.7% |
| 3-Person Household | 92 | 12.9% |
| 4+ Person Household | 253 | 35.4% |
| Total Housing Units | 715 | 100.0% |
Occupancy by Ownership by Household Size in Winterville
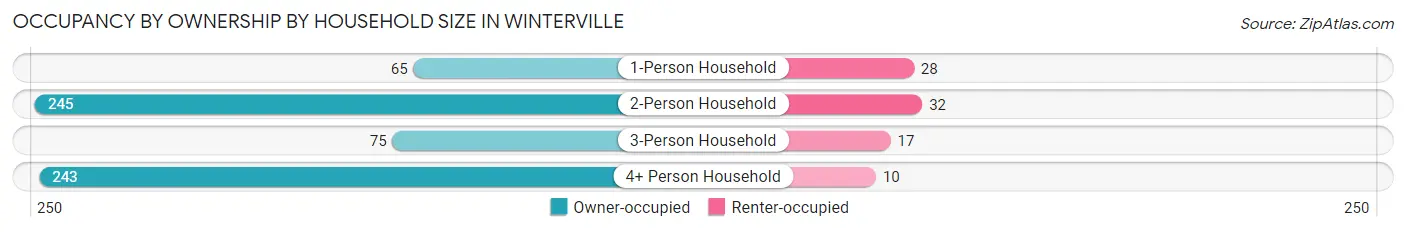
| Household Size | Owner-occupied | Renter-occupied |
| 1-Person Household | 65 (69.9%) | 28 (30.1%) |
| 2-Person Household | 245 (88.4%) | 32 (11.6%) |
| 3-Person Household | 75 (81.5%) | 17 (18.5%) |
| 4+ Person Household | 243 (96.1%) | 10 (4.0%) |
| Total Housing Units | 628 (87.8%) | 87 (12.2%) |
Occupancy by Educational Attainment in Winterville
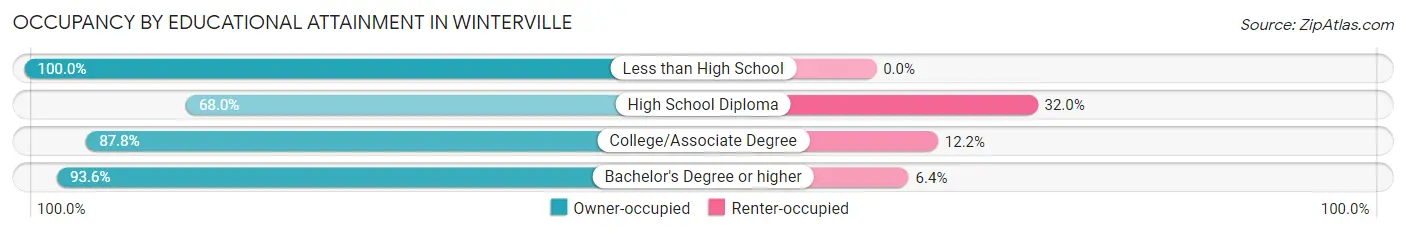
| Household Size | Owner-occupied | Renter-occupied |
| Less than High School | 11 (100.0%) | 0 (0.0%) |
| High School Diploma | 68 (68.0%) | 32 (32.0%) |
| College/Associate Degree | 244 (87.8%) | 34 (12.2%) |
| Bachelor's Degree or higher | 305 (93.6%) | 21 (6.4%) |
Occupancy by Age of Householder in Winterville
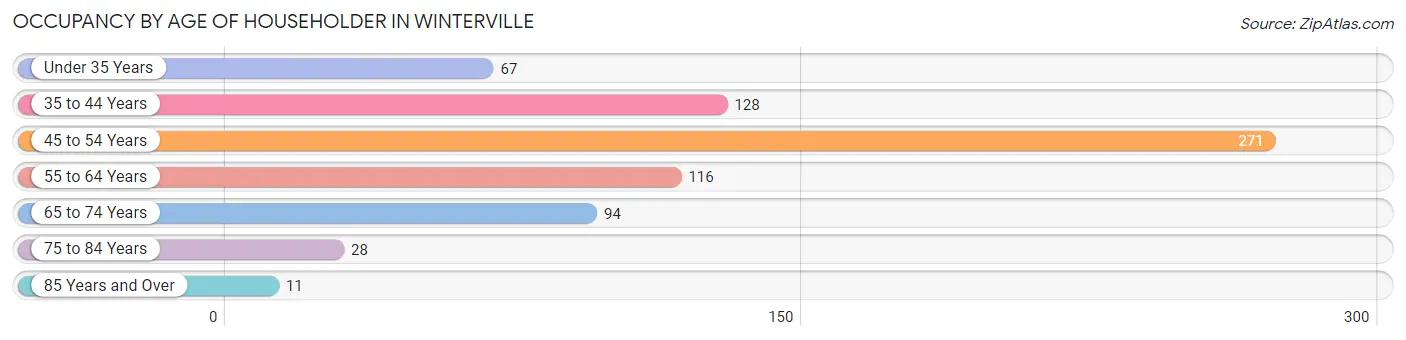
| Age Bracket | # Households | % Households |
| Under 35 Years | 67 | 9.4% |
| 35 to 44 Years | 128 | 17.9% |
| 45 to 54 Years | 271 | 37.9% |
| 55 to 64 Years | 116 | 16.2% |
| 65 to 74 Years | 94 | 13.2% |
| 75 to 84 Years | 28 | 3.9% |
| 85 Years and Over | 11 | 1.5% |
| Total | 715 | 100.0% |
Housing Finances in Winterville
Median Income by Occupancy in Winterville
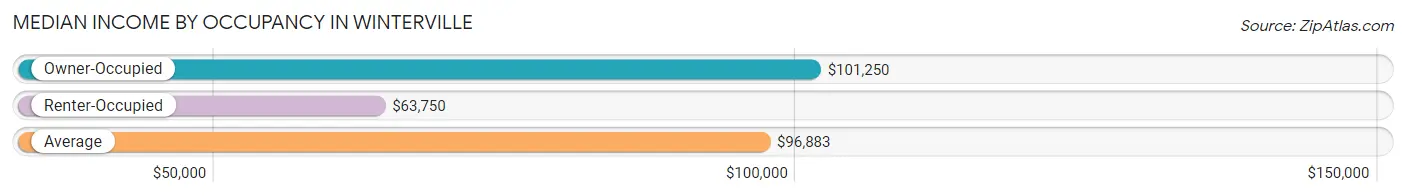
| Occupancy Type | # Households | Median Income |
| Owner-Occupied | 628 (87.8%) | $101,250 |
| Renter-Occupied | 87 (12.2%) | $63,750 |
| Average | 715 (100.0%) | $96,883 |
Occupancy by Householder Income Bracket in Winterville
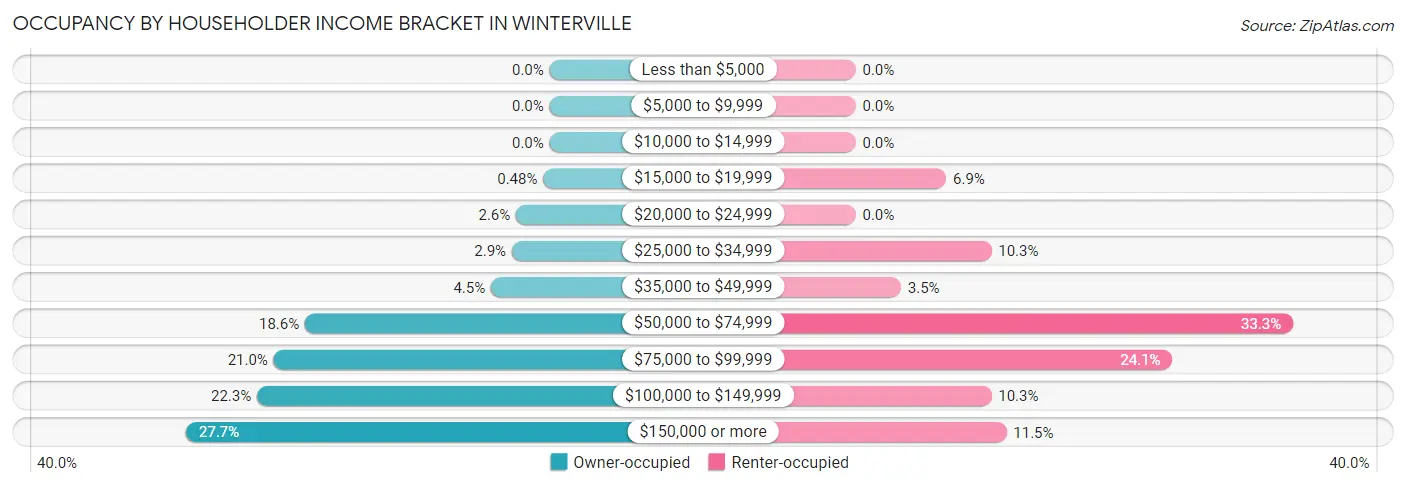
| Income Bracket | Owner-occupied | Renter-occupied |
| Less than $5,000 | 0 (0.0%) | 0 (0.0%) |
| $5,000 to $9,999 | 0 (0.0%) | 0 (0.0%) |
| $10,000 to $14,999 | 0 (0.0%) | 0 (0.0%) |
| $15,000 to $19,999 | 3 (0.5%) | 6 (6.9%) |
| $20,000 to $24,999 | 16 (2.5%) | 0 (0.0%) |
| $25,000 to $34,999 | 18 (2.9%) | 9 (10.3%) |
| $35,000 to $49,999 | 28 (4.5%) | 3 (3.5%) |
| $50,000 to $74,999 | 117 (18.6%) | 29 (33.3%) |
| $75,000 to $99,999 | 132 (21.0%) | 21 (24.1%) |
| $100,000 to $149,999 | 140 (22.3%) | 9 (10.3%) |
| $150,000 or more | 174 (27.7%) | 10 (11.5%) |
| Total | 628 (100.0%) | 87 (100.0%) |
Monthly Housing Cost Tiers in Winterville
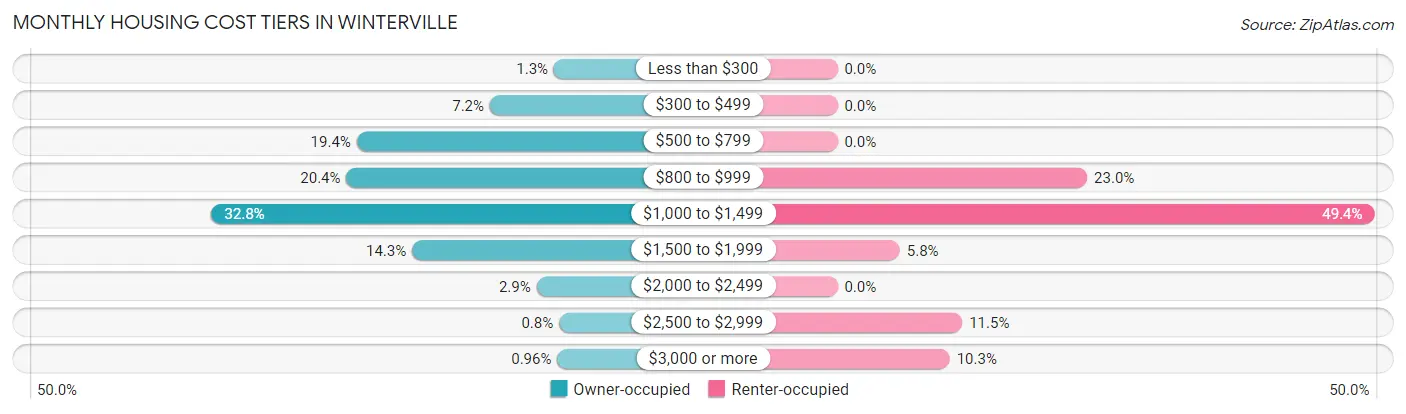
| Monthly Cost | Owner-occupied | Renter-occupied |
| Less than $300 | 8 (1.3%) | 0 (0.0%) |
| $300 to $499 | 45 (7.2%) | 0 (0.0%) |
| $500 to $799 | 122 (19.4%) | 0 (0.0%) |
| $800 to $999 | 128 (20.4%) | 20 (23.0%) |
| $1,000 to $1,499 | 206 (32.8%) | 43 (49.4%) |
| $1,500 to $1,999 | 90 (14.3%) | 5 (5.8%) |
| $2,000 to $2,499 | 18 (2.9%) | 0 (0.0%) |
| $2,500 to $2,999 | 5 (0.8%) | 10 (11.5%) |
| $3,000 or more | 6 (1.0%) | 9 (10.3%) |
| Total | 628 (100.0%) | 87 (100.0%) |
Physical Housing Characteristics in Winterville
Housing Structures in Winterville
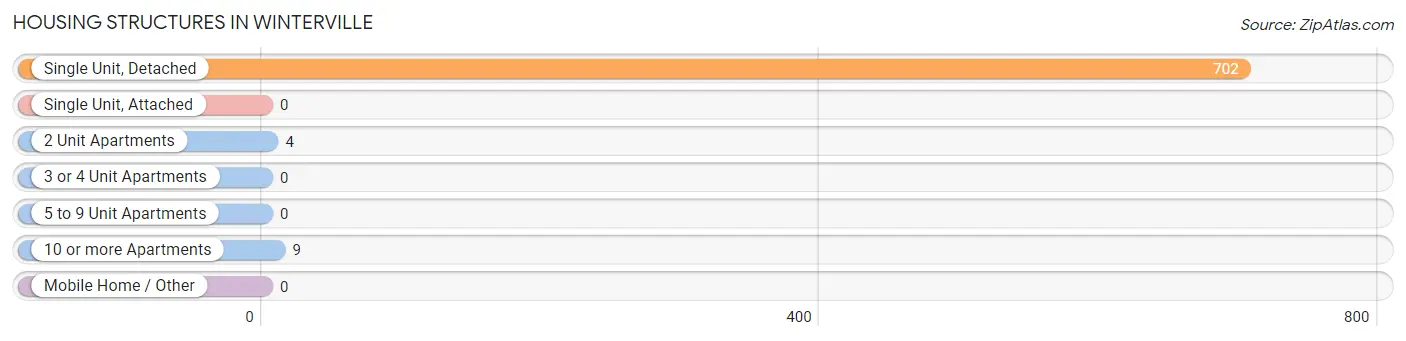
| Structure Type | # Housing Units | % Housing Units |
| Single Unit, Detached | 702 | 98.2% |
| Single Unit, Attached | 0 | 0.0% |
| 2 Unit Apartments | 4 | 0.6% |
| 3 or 4 Unit Apartments | 0 | 0.0% |
| 5 to 9 Unit Apartments | 0 | 0.0% |
| 10 or more Apartments | 9 | 1.3% |
| Mobile Home / Other | 0 | 0.0% |
| Total | 715 | 100.0% |
Housing Structures by Occupancy in Winterville
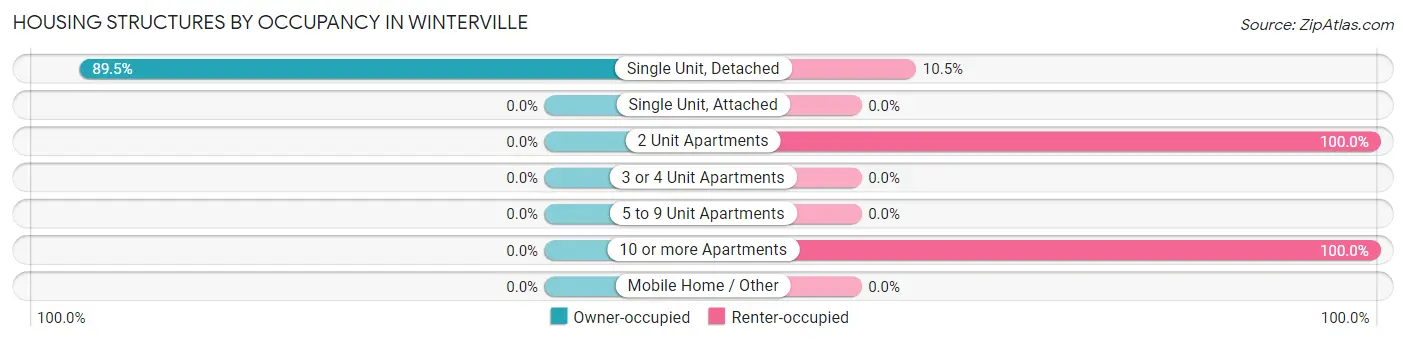
| Structure Type | Owner-occupied | Renter-occupied |
| Single Unit, Detached | 628 (89.5%) | 74 (10.5%) |
| Single Unit, Attached | 0 (0.0%) | 0 (0.0%) |
| 2 Unit Apartments | 0 (0.0%) | 4 (100.0%) |
| 3 or 4 Unit Apartments | 0 (0.0%) | 0 (0.0%) |
| 5 to 9 Unit Apartments | 0 (0.0%) | 0 (0.0%) |
| 10 or more Apartments | 0 (0.0%) | 9 (100.0%) |
| Mobile Home / Other | 0 (0.0%) | 0 (0.0%) |
| Total | 628 (87.8%) | 87 (12.2%) |
Housing Structures by Number of Rooms in Winterville
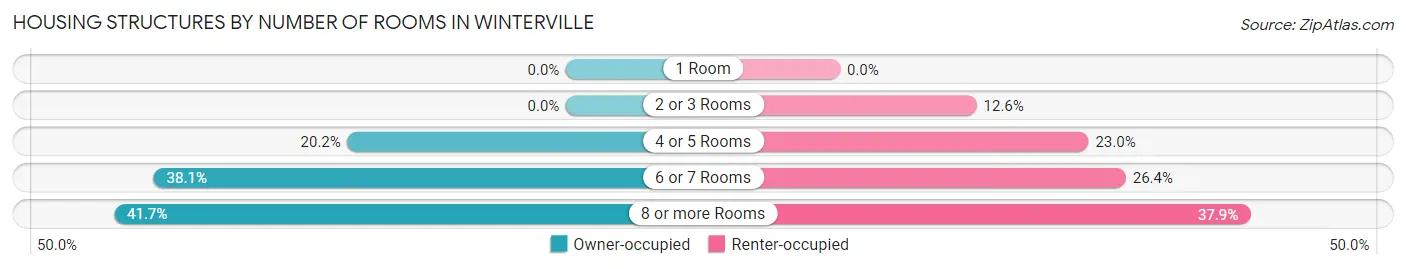
| Number of Rooms | Owner-occupied | Renter-occupied |
| 1 Room | 0 (0.0%) | 0 (0.0%) |
| 2 or 3 Rooms | 0 (0.0%) | 11 (12.6%) |
| 4 or 5 Rooms | 127 (20.2%) | 20 (23.0%) |
| 6 or 7 Rooms | 239 (38.1%) | 23 (26.4%) |
| 8 or more Rooms | 262 (41.7%) | 33 (37.9%) |
| Total | 628 (100.0%) | 87 (100.0%) |
Housing Structure by Heating Type in Winterville
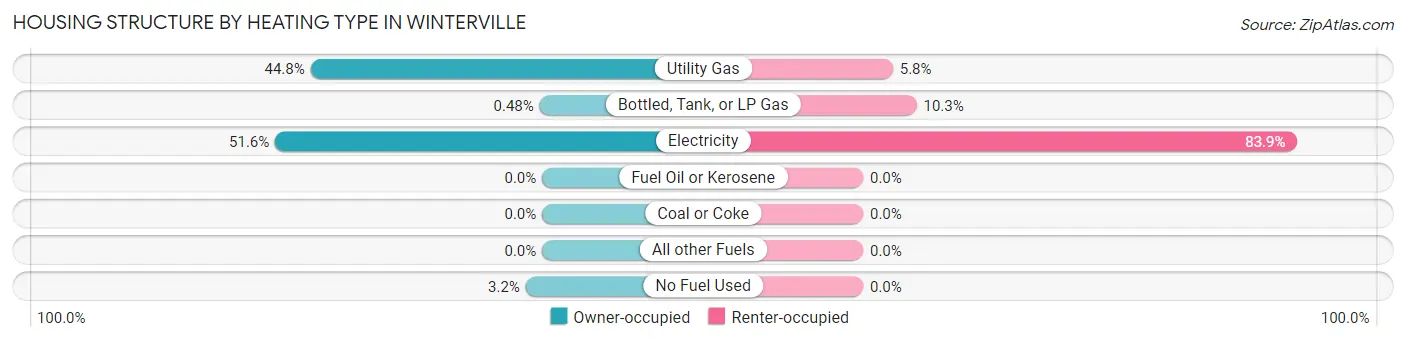
| Heating Type | Owner-occupied | Renter-occupied |
| Utility Gas | 281 (44.8%) | 5 (5.8%) |
| Bottled, Tank, or LP Gas | 3 (0.5%) | 9 (10.3%) |
| Electricity | 324 (51.6%) | 73 (83.9%) |
| Fuel Oil or Kerosene | 0 (0.0%) | 0 (0.0%) |
| Coal or Coke | 0 (0.0%) | 0 (0.0%) |
| All other Fuels | 0 (0.0%) | 0 (0.0%) |
| No Fuel Used | 20 (3.2%) | 0 (0.0%) |
| Total | 628 (100.0%) | 87 (100.0%) |
Household Vehicle Usage in Winterville
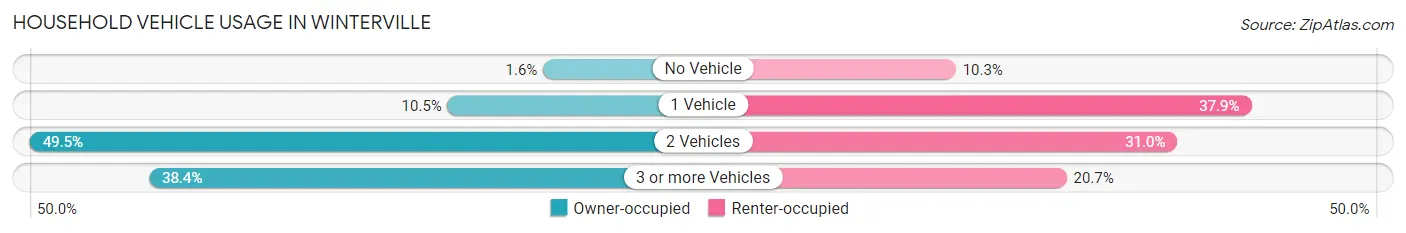
| Vehicles per Household | Owner-occupied | Renter-occupied |
| No Vehicle | 10 (1.6%) | 9 (10.3%) |
| 1 Vehicle | 66 (10.5%) | 33 (37.9%) |
| 2 Vehicles | 311 (49.5%) | 27 (31.0%) |
| 3 or more Vehicles | 241 (38.4%) | 18 (20.7%) |
| Total | 628 (100.0%) | 87 (100.0%) |
Real Estate & Mortgages in Winterville
Real Estate and Mortgage Overview in Winterville
| Characteristic | Without Mortgage | With Mortgage |
| Housing Units | 270 | 358 |
| Median Property Value | $405,700 | $231,000 |
| Median Household Income | $146,250 | $40 |
| Monthly Housing Costs | $759 | $6 |
| Real Estate Taxes | $3,375 | $8 |
Property Value by Mortgage Status in Winterville
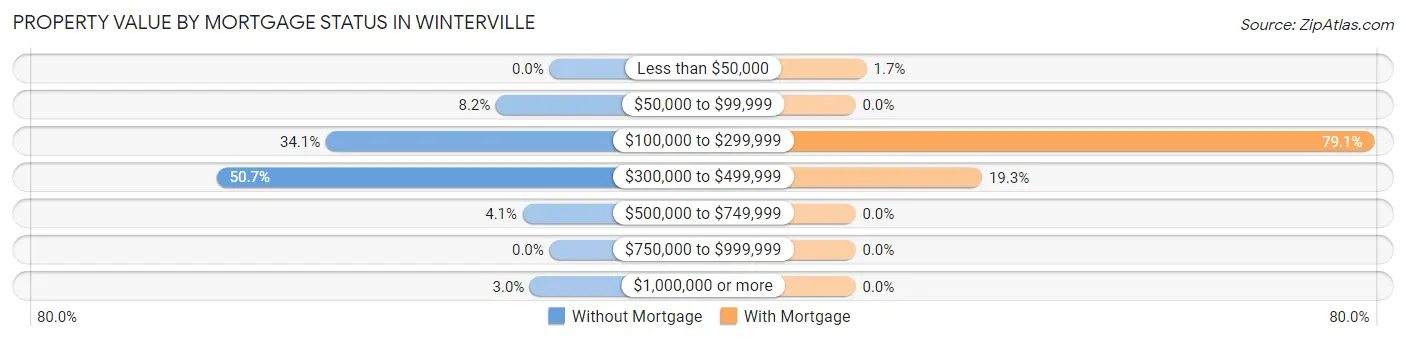
| Property Value | Without Mortgage | With Mortgage |
| Less than $50,000 | 0 (0.0%) | 6 (1.7%) |
| $50,000 to $99,999 | 22 (8.2%) | 0 (0.0%) |
| $100,000 to $299,999 | 92 (34.1%) | 283 (79.0%) |
| $300,000 to $499,999 | 137 (50.7%) | 69 (19.3%) |
| $500,000 to $749,999 | 11 (4.1%) | 0 (0.0%) |
| $750,000 to $999,999 | 0 (0.0%) | 0 (0.0%) |
| $1,000,000 or more | 8 (3.0%) | 0 (0.0%) |
| Total | 270 (100.0%) | 358 (100.0%) |
Household Income by Mortgage Status in Winterville
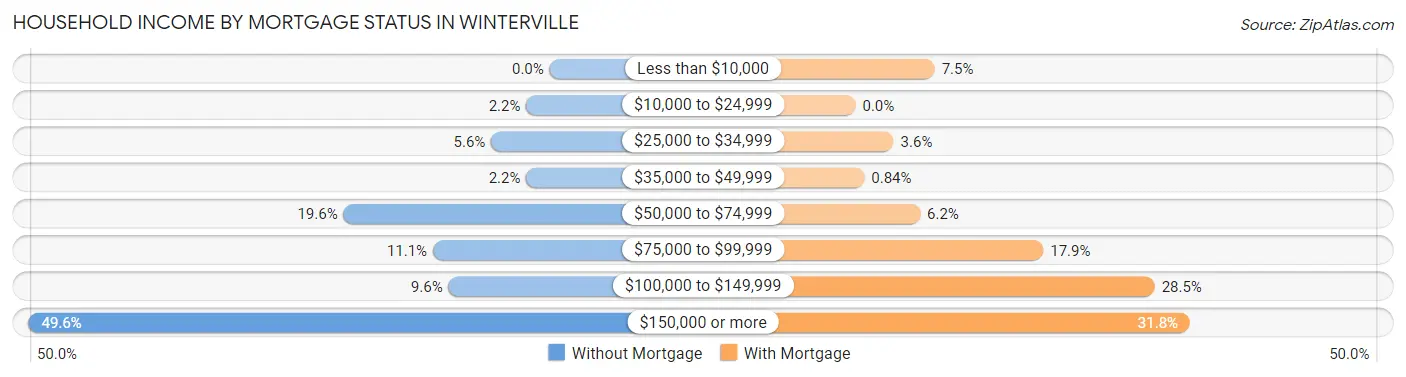
| Household Income | Without Mortgage | With Mortgage |
| Less than $10,000 | 0 (0.0%) | 27 (7.5%) |
| $10,000 to $24,999 | 6 (2.2%) | 0 (0.0%) |
| $25,000 to $34,999 | 15 (5.6%) | 13 (3.6%) |
| $35,000 to $49,999 | 6 (2.2%) | 3 (0.8%) |
| $50,000 to $74,999 | 53 (19.6%) | 22 (6.1%) |
| $75,000 to $99,999 | 30 (11.1%) | 64 (17.9%) |
| $100,000 to $149,999 | 26 (9.6%) | 102 (28.5%) |
| $150,000 or more | 134 (49.6%) | 114 (31.8%) |
| Total | 270 (100.0%) | 358 (100.0%) |
Property Value to Household Income Ratio in Winterville
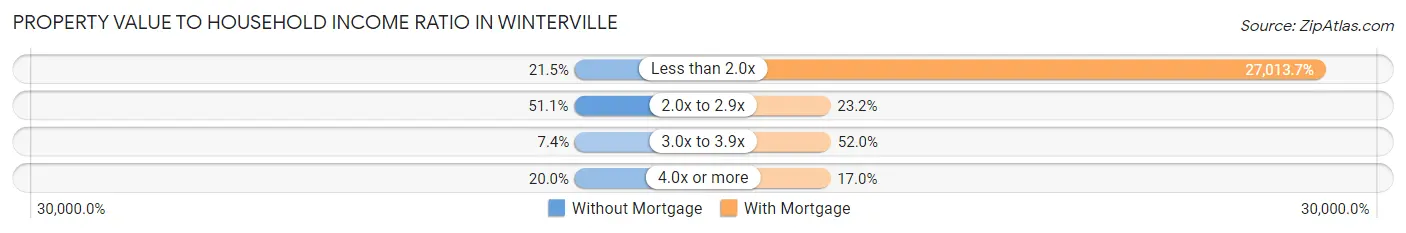
| Value-to-Income Ratio | Without Mortgage | With Mortgage |
| Less than 2.0x | 58 (21.5%) | 96,709 (27,013.7%) |
| 2.0x to 2.9x | 138 (51.1%) | 83 (23.2%) |
| 3.0x to 3.9x | 20 (7.4%) | 186 (52.0%) |
| 4.0x or more | 54 (20.0%) | 61 (17.0%) |
| Total | 270 (100.0%) | 358 (100.0%) |
Real Estate Taxes by Mortgage Status in Winterville
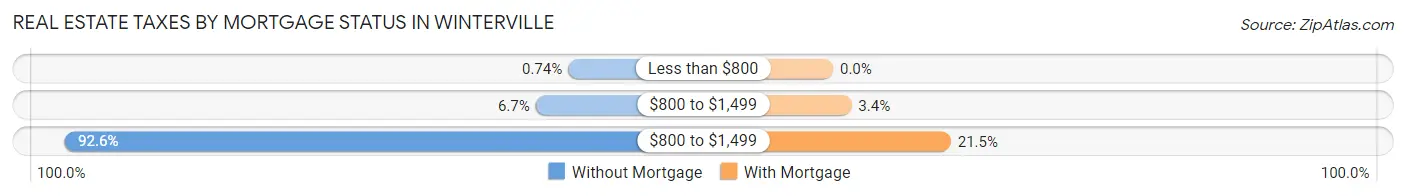
| Property Taxes | Without Mortgage | With Mortgage |
| Less than $800 | 2 (0.7%) | 0 (0.0%) |
| $800 to $1,499 | 18 (6.7%) | 12 (3.4%) |
| $800 to $1,499 | 250 (92.6%) | 77 (21.5%) |
| Total | 270 (100.0%) | 358 (100.0%) |
Health & Disability in Winterville
Health Insurance Coverage by Age in Winterville
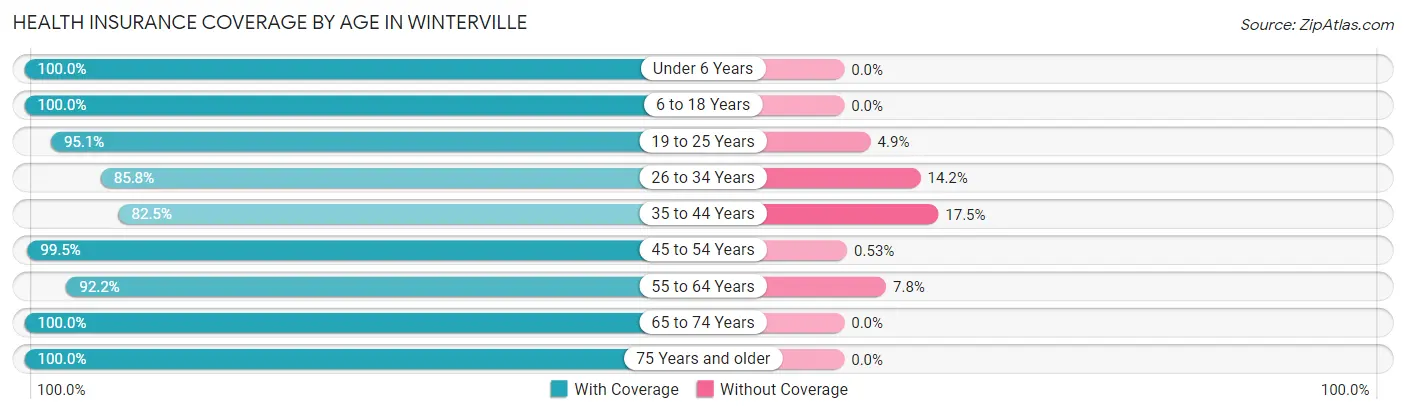
| Age Bracket | With Coverage | Without Coverage |
| Under 6 Years | 184 (100.0%) | 0 (0.0%) |
| 6 to 18 Years | 479 (100.0%) | 0 (0.0%) |
| 19 to 25 Years | 58 (95.1%) | 3 (4.9%) |
| 26 to 34 Years | 223 (85.8%) | 37 (14.2%) |
| 35 to 44 Years | 174 (82.5%) | 37 (17.5%) |
| 45 to 54 Years | 377 (99.5%) | 2 (0.5%) |
| 55 to 64 Years | 272 (92.2%) | 23 (7.8%) |
| 65 to 74 Years | 149 (100.0%) | 0 (0.0%) |
| 75 Years and older | 101 (100.0%) | 0 (0.0%) |
| Total | 2,017 (95.2%) | 102 (4.8%) |
Health Insurance Coverage by Citizenship Status in Winterville
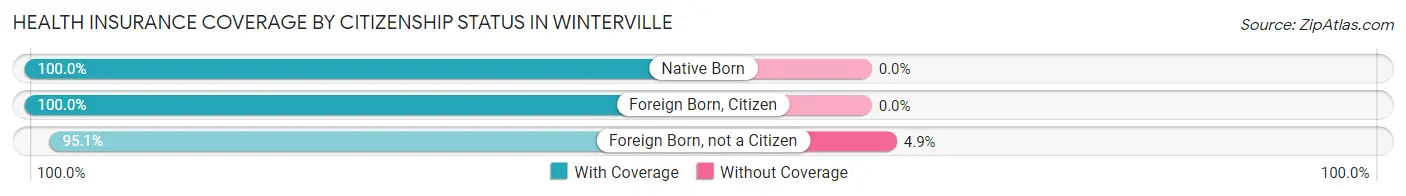
| Citizenship Status | With Coverage | Without Coverage |
| Native Born | 184 (100.0%) | 0 (0.0%) |
| Foreign Born, Citizen | 479 (100.0%) | 0 (0.0%) |
| Foreign Born, not a Citizen | 58 (95.1%) | 3 (4.9%) |
Health Insurance Coverage by Household Income in Winterville
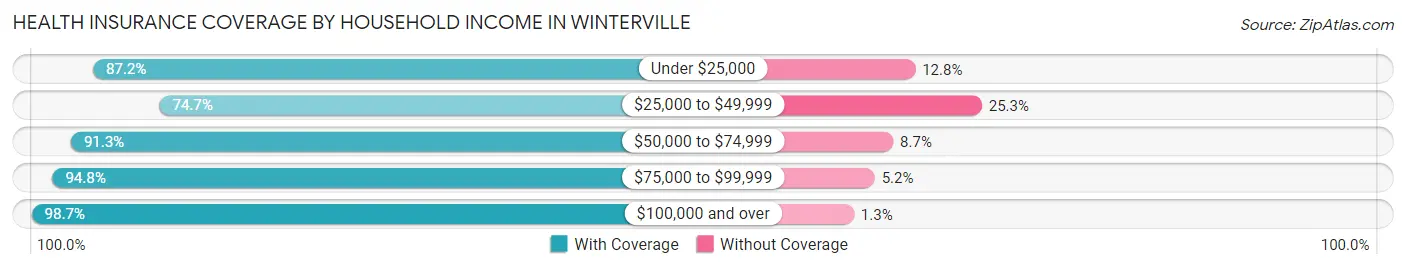
| Household Income | With Coverage | Without Coverage |
| Under $25,000 | 34 (87.2%) | 5 (12.8%) |
| $25,000 to $49,999 | 65 (74.7%) | 22 (25.3%) |
| $50,000 to $74,999 | 389 (91.3%) | 37 (8.7%) |
| $75,000 to $99,999 | 417 (94.8%) | 23 (5.2%) |
| $100,000 and over | 1,112 (98.7%) | 15 (1.3%) |
Public vs Private Health Insurance Coverage by Age in Winterville
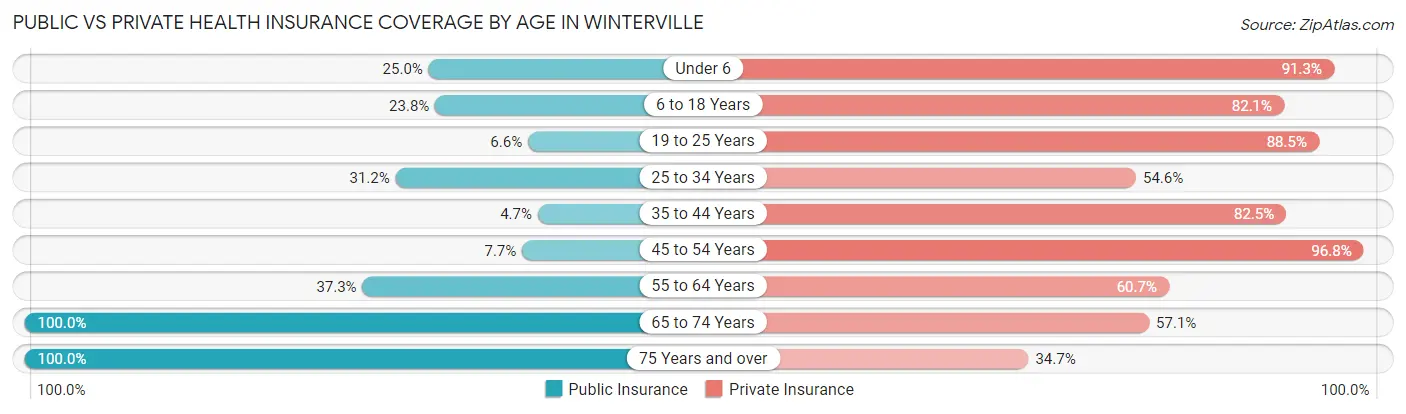
| Age Bracket | Public Insurance | Private Insurance |
| Under 6 | 46 (25.0%) | 168 (91.3%) |
| 6 to 18 Years | 114 (23.8%) | 393 (82.1%) |
| 19 to 25 Years | 4 (6.6%) | 54 (88.5%) |
| 25 to 34 Years | 81 (31.1%) | 142 (54.6%) |
| 35 to 44 Years | 10 (4.7%) | 174 (82.5%) |
| 45 to 54 Years | 29 (7.6%) | 367 (96.8%) |
| 55 to 64 Years | 110 (37.3%) | 179 (60.7%) |
| 65 to 74 Years | 149 (100.0%) | 85 (57.1%) |
| 75 Years and over | 101 (100.0%) | 35 (34.6%) |
| Total | 644 (30.4%) | 1,597 (75.4%) |
Disability Status by Sex by Age in Winterville
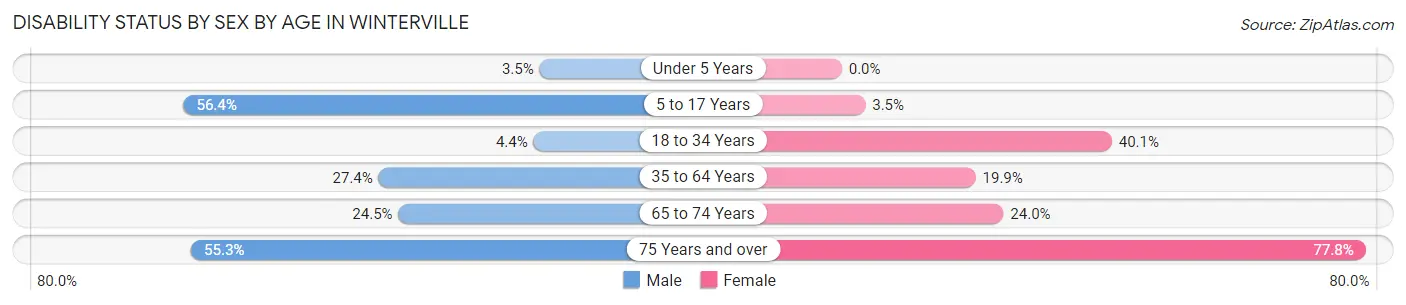
| Age Bracket | Male | Female |
| Under 5 Years | 3 (3.5%) | 0 (0.0%) |
| 5 to 17 Years | 172 (56.4%) | 6 (3.5%) |
| 18 to 34 Years | 5 (4.4%) | 85 (40.1%) |
| 35 to 64 Years | 113 (27.4%) | 94 (19.9%) |
| 65 to 74 Years | 12 (24.5%) | 24 (24.0%) |
| 75 Years and over | 21 (55.3%) | 49 (77.8%) |
Disability Class by Sex by Age in Winterville
Disability Class: Hearing Difficulty
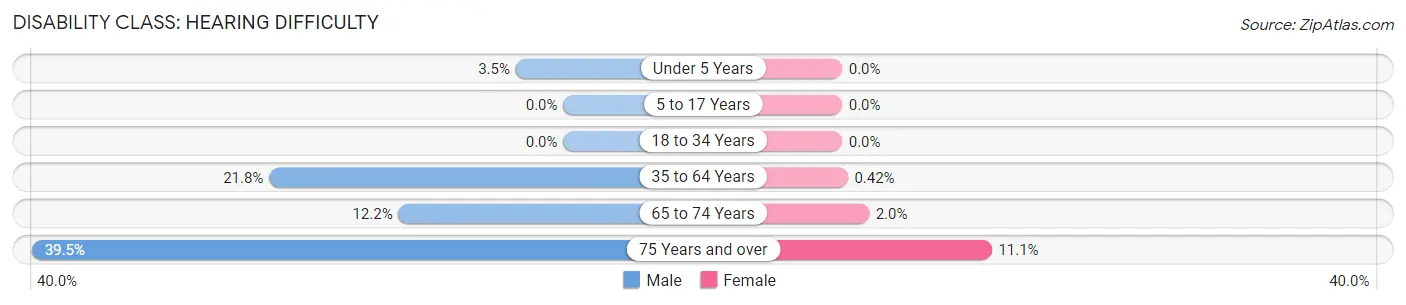
| Age Bracket | Male | Female |
| Under 5 Years | 3 (3.5%) | 0 (0.0%) |
| 5 to 17 Years | 0 (0.0%) | 0 (0.0%) |
| 18 to 34 Years | 0 (0.0%) | 0 (0.0%) |
| 35 to 64 Years | 90 (21.8%) | 2 (0.4%) |
| 65 to 74 Years | 6 (12.2%) | 2 (2.0%) |
| 75 Years and over | 15 (39.5%) | 7 (11.1%) |
Disability Class: Vision Difficulty
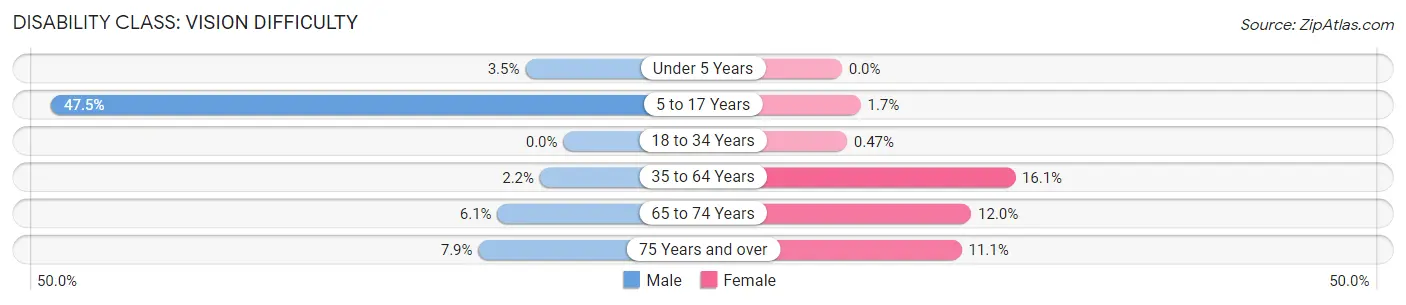
| Age Bracket | Male | Female |
| Under 5 Years | 3 (3.5%) | 0 (0.0%) |
| 5 to 17 Years | 145 (47.5%) | 3 (1.7%) |
| 18 to 34 Years | 0 (0.0%) | 1 (0.5%) |
| 35 to 64 Years | 9 (2.2%) | 76 (16.1%) |
| 65 to 74 Years | 3 (6.1%) | 12 (12.0%) |
| 75 Years and over | 3 (7.9%) | 7 (11.1%) |
Disability Class: Cognitive Difficulty
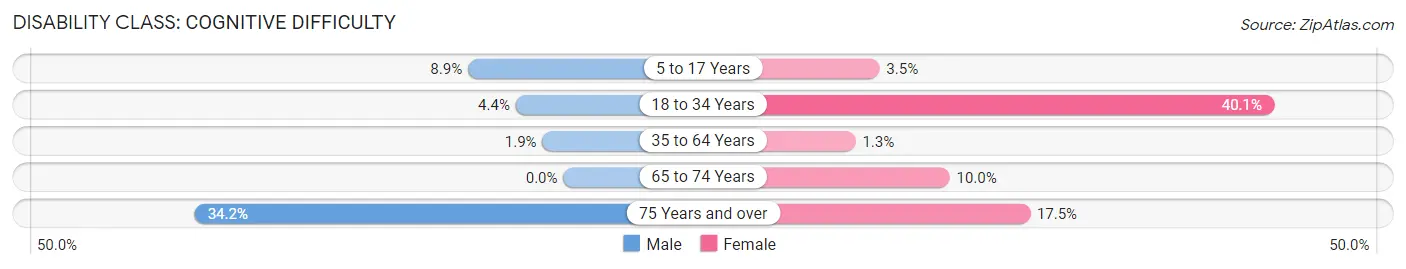
| Age Bracket | Male | Female |
| 5 to 17 Years | 27 (8.8%) | 6 (3.5%) |
| 18 to 34 Years | 5 (4.4%) | 85 (40.1%) |
| 35 to 64 Years | 8 (1.9%) | 6 (1.3%) |
| 65 to 74 Years | 0 (0.0%) | 10 (10.0%) |
| 75 Years and over | 13 (34.2%) | 11 (17.5%) |
Disability Class: Ambulatory Difficulty
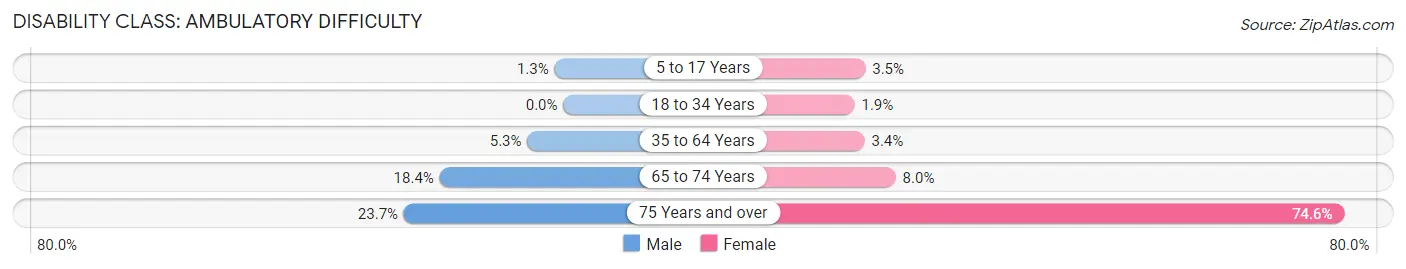
| Age Bracket | Male | Female |
| 5 to 17 Years | 4 (1.3%) | 6 (3.5%) |
| 18 to 34 Years | 0 (0.0%) | 4 (1.9%) |
| 35 to 64 Years | 22 (5.3%) | 16 (3.4%) |
| 65 to 74 Years | 9 (18.4%) | 8 (8.0%) |
| 75 Years and over | 9 (23.7%) | 47 (74.6%) |
Disability Class: Self-Care Difficulty
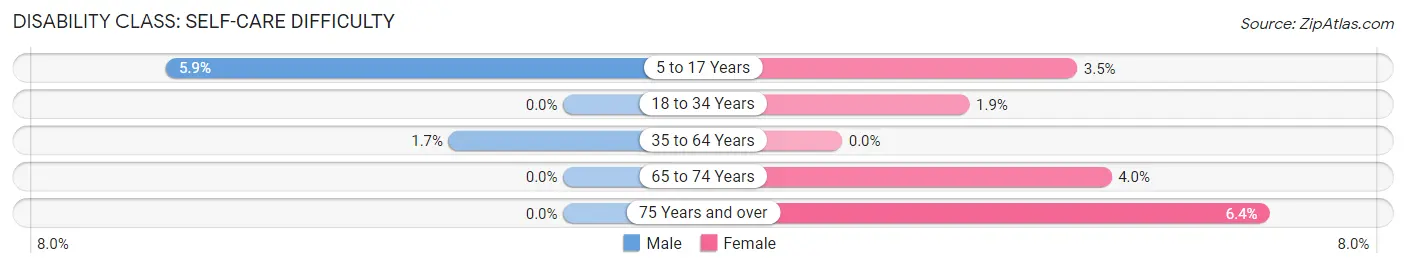
| Age Bracket | Male | Female |
| 5 to 17 Years | 18 (5.9%) | 6 (3.5%) |
| 18 to 34 Years | 0 (0.0%) | 4 (1.9%) |
| 35 to 64 Years | 7 (1.7%) | 0 (0.0%) |
| 65 to 74 Years | 0 (0.0%) | 4 (4.0%) |
| 75 Years and over | 0 (0.0%) | 4 (6.4%) |
Technology Access in Winterville
Computing Device Access in Winterville
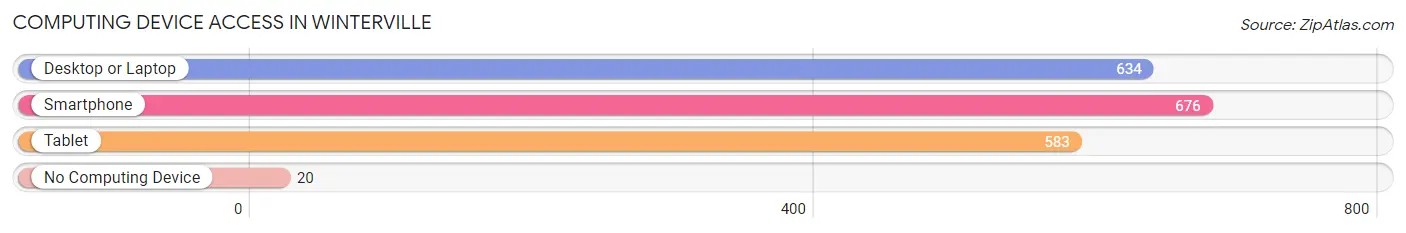
| Device Type | # Households | % Households |
| Desktop or Laptop | 634 | 88.7% |
| Smartphone | 676 | 94.6% |
| Tablet | 583 | 81.5% |
| No Computing Device | 20 | 2.8% |
| Total | 715 | 100.0% |
Internet Access in Winterville
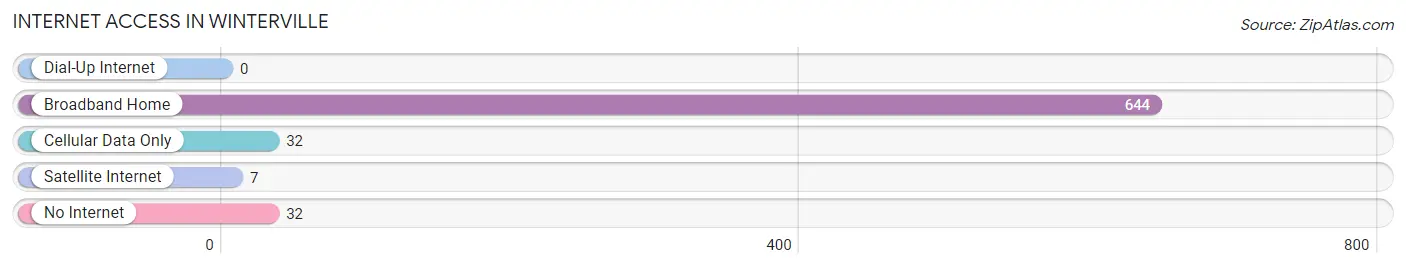
| Internet Type | # Households | % Households |
| Dial-Up Internet | 0 | 0.0% |
| Broadband Home | 644 | 90.1% |
| Cellular Data Only | 32 | 4.5% |
| Satellite Internet | 7 | 1.0% |
| No Internet | 32 | 4.5% |
| Total | 715 | 100.0% |
Winterville Summary
History
The city of Winterville, Georgia is located in Clarke County, approximately 10 miles east of Athens. It is a small city with a population of 1,717 as of the 2010 census. The city was founded in 1820 and was originally known as Whitehall. It was later renamed Winterville in 1891 after the local postmaster, William Winter.
The city of Winterville has a rich history that dates back to the early 19th century. The city was founded by a group of settlers from North Carolina who were looking for a new home. The settlers were attracted to the area due to its fertile soil and abundant natural resources. The city was incorporated in 1891 and has since grown to become a thriving community.
The city of Winterville has a long history of being a center for education. The city is home to the University of Georgia, which was founded in 1785. The university is one of the oldest public universities in the United States and is a major employer in the city. The city is also home to several other educational institutions, including Athens Technical College, Athens Christian Academy, and the Athens-Clarke County School System.
Geography
Winterville is located in Clarke County, Georgia, approximately 10 miles east of Athens. The city is situated in the foothills of the Blue Ridge Mountains and is surrounded by rolling hills and lush forests. The city is located at an elevation of 845 feet above sea level.
The city of Winterville is located in the Piedmont region of Georgia, which is characterized by rolling hills and lush forests. The city is located in the Oconee River watershed and is bordered by the Oconee River to the north and the Middle Oconee River to the south. The city is also located near the Oconee National Forest, which is a popular destination for outdoor recreation.
Economy
The economy of Winterville is largely based on the University of Georgia, which is the city’s largest employer. The university employs over 10,000 people and is a major contributor to the local economy. Other major employers in the city include Athens Technical College, Athens Christian Academy, and the Athens-Clarke County School System.
The city of Winterville is also home to several small businesses, including restaurants, retail stores, and professional services. The city is also home to several manufacturing companies, including a paper mill and a furniture factory.
Demographics
As of the 2010 census, the city of Winterville had a population of 1,717. The population is predominantly white (90.2%) and the median age is 37. The median household income is $41,944 and the median home value is $164,400.
The city of Winterville is served by the Athens-Clarke County School System, which includes four elementary schools, one middle school, and one high school. The city is also home to several private schools, including Athens Christian Academy and Athens Academy.
Conclusion
Winterville, Georgia is a small city located in Clarke County, approximately 10 miles east of Athens. The city has a rich history that dates back to the early 19th century and is home to the University of Georgia, which is the city’s largest employer. The city is also home to several small businesses, including restaurants, retail stores, and professional services. The population of Winterville is predominantly white and the median age is 37. The median household income is $41,944 and the median home value is $164,400. The city is served by the Athens-Clarke County School System, which includes four elementary schools, one middle school, and one high school.
Common Questions
What is Per Capita Income in Winterville?
Per Capita income in Winterville is $35,385.
What is the Median Family Income in Winterville?
Median Family Income in Winterville is $113,333.
What is the Median Household income in Winterville?
Median Household Income in Winterville is $96,883.
What is Income or Wage Gap in Winterville?
Income or Wage Gap in Winterville is 14.2%.
Women in Winterville earn 85.8 cents for every dollar earned by a man.
What is Inequality or Gini Index in Winterville?
Inequality or Gini Index in Winterville is 0.30.
What is the Total Population of Winterville?
Total Population of Winterville is 2,165.
What is the Total Male Population of Winterville?
Total Male Population of Winterville is 1,016.
What is the Total Female Population of Winterville?
Total Female Population of Winterville is 1,149.
What is the Ratio of Males per 100 Females in Winterville?
There are 88.42 Males per 100 Females in Winterville.
What is the Ratio of Females per 100 Males in Winterville?
There are 113.09 Females per 100 Males in Winterville.
What is the Median Population Age in Winterville?
Median Population Age in Winterville is 39.4 Years.
What is the Average Family Size in Winterville
Average Family Size in Winterville is 3.3 People.
What is the Average Household Size in Winterville
Average Household Size in Winterville is 3.0 People.
How Large is the Labor Force in Winterville?
There are 1,035 People in the Labor Forcein in Winterville.
What is the Percentage of People in the Labor Force in Winterville?
61.0% of People are in the Labor Force in Winterville.
What is the Unemployment Rate in Winterville?
Unemployment Rate in Winterville is 2.4%.