Powder Springs, GA Map & Demographics
Powder Springs Map
Powder Springs Overview
$39,078
PER CAPITA INCOME
$97,282
AVG FAMILY INCOME
$88,311
AVG HOUSEHOLD INCOME
4.8%
WAGE / INCOME GAP [ % ]
95.2¢/ $1
WAGE / INCOME GAP [ $ ]
$7,168
FAMILY INCOME DEFICIT
0.37
INEQUALITY / GINI INDEX
16,930
TOTAL POPULATION
7,804
MALE POPULATION
9,126
FEMALE POPULATION
85.51
MALES / 100 FEMALES
116.94
FEMALES / 100 MALES
38.7
MEDIAN AGE
3.3
AVG FAMILY SIZE
2.7
AVG HOUSEHOLD SIZE
9,382
LABOR FORCE [ PEOPLE ]
69.7%
PERCENT IN LABOR FORCE
4.5%
UNEMPLOYMENT RATE
Powder Springs Zip Codes
Income in Powder Springs
Income Overview in Powder Springs
Per Capita Income in Powder Springs is $39,078, while median incomes of families and households are $97,282 and $88,311 respectively.
| Characteristic | Number | Measure |
| Per Capita Income | 16,930 | $39,078 |
| Median Family Income | 4,415 | $97,282 |
| Mean Family Income | 4,415 | $109,972 |
| Median Household Income | 6,082 | $88,311 |
| Mean Household Income | 6,082 | $107,764 |
| Income Deficit | 4,415 | $7,168 |
| Wage / Income Gap (%) | 16,930 | 4.76% |
| Wage / Income Gap ($) | 16,930 | 95.24¢ per $1 |
| Gini / Inequality Index | 16,930 | 0.37 |
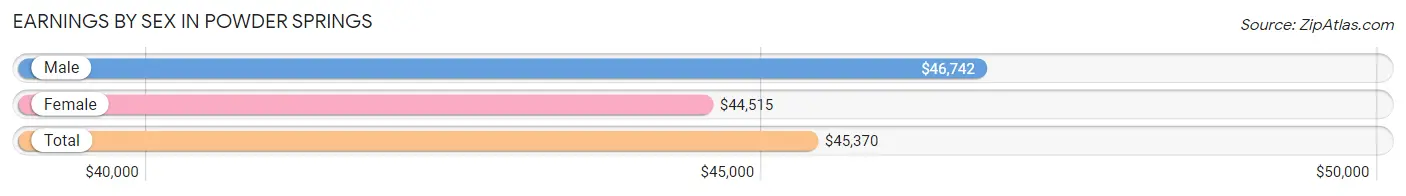
Earnings by Sex in Powder Springs
Average Earnings in Powder Springs are $45,370, $46,742 for men and $44,515 for women, a difference of 4.8%.
| Sex | Number | Average Earnings |
| Male | 4,604 (46.7%) | $46,742 |
| Female | 5,265 (53.3%) | $44,515 |
| Total | 9,869 (100.0%) | $45,370 |
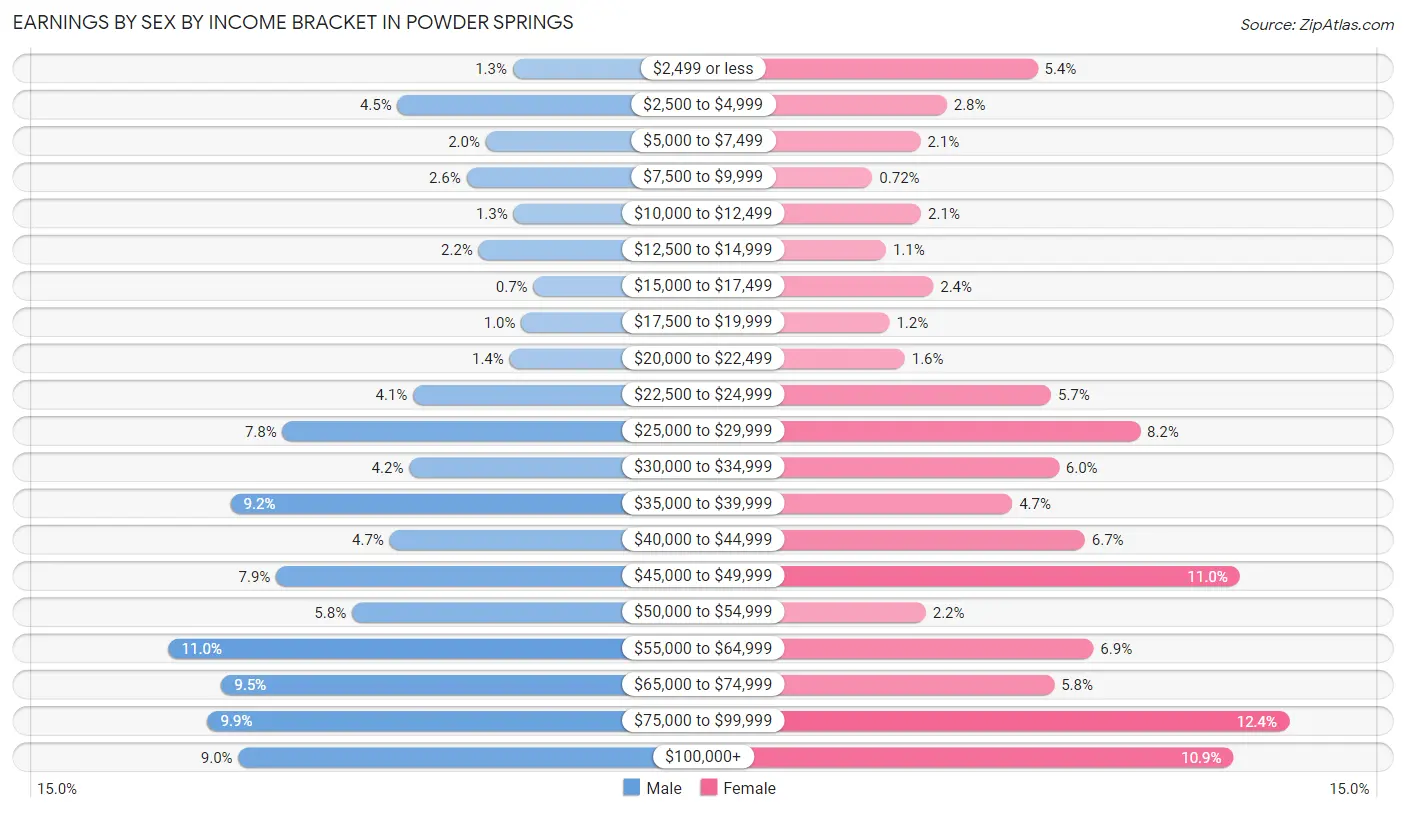
Earnings by Sex by Income Bracket in Powder Springs
The most common earnings brackets in Powder Springs are $55,000 to $64,999 for men (504 | 11.0%) and $75,000 to $99,999 for women (654 | 12.4%).
| Income | Male | Female |
| $2,499 or less | 59 (1.3%) | 282 (5.4%) |
| $2,500 to $4,999 | 208 (4.5%) | 148 (2.8%) |
| $5,000 to $7,499 | 94 (2.0%) | 109 (2.1%) |
| $7,500 to $9,999 | 119 (2.6%) | 38 (0.7%) |
| $10,000 to $12,499 | 58 (1.3%) | 110 (2.1%) |
| $12,500 to $14,999 | 103 (2.2%) | 58 (1.1%) |
| $15,000 to $17,499 | 32 (0.7%) | 128 (2.4%) |
| $17,500 to $19,999 | 48 (1.0%) | 63 (1.2%) |
| $20,000 to $22,499 | 63 (1.4%) | 86 (1.6%) |
| $22,500 to $24,999 | 188 (4.1%) | 302 (5.7%) |
| $25,000 to $29,999 | 357 (7.7%) | 434 (8.2%) |
| $30,000 to $34,999 | 193 (4.2%) | 314 (6.0%) |
| $35,000 to $39,999 | 424 (9.2%) | 245 (4.6%) |
| $40,000 to $44,999 | 218 (4.7%) | 352 (6.7%) |
| $45,000 to $49,999 | 365 (7.9%) | 581 (11.0%) |
| $50,000 to $54,999 | 267 (5.8%) | 117 (2.2%) |
| $55,000 to $64,999 | 504 (11.0%) | 365 (6.9%) |
| $65,000 to $74,999 | 436 (9.5%) | 307 (5.8%) |
| $75,000 to $99,999 | 454 (9.9%) | 654 (12.4%) |
| $100,000+ | 414 (9.0%) | 572 (10.9%) |
| Total | 4,604 (100.0%) | 5,265 (100.0%) |
Earnings by Sex by Educational Attainment in Powder Springs
Average earnings in Powder Springs are $51,273 for men and $46,706 for women, a difference of 8.9%. Men with an educational attainment of graduate degree enjoy the highest average annual earnings of $68,380, while those with college or associate's degree education earn the least with $39,837. Women with an educational attainment of graduate degree earn the most with the average annual earnings of $80,373, while those with less than high school education have the smallest earnings of $30,906.

| Educational Attainment | Male Income | Female Income |
| Less than High School | $61,518 | $30,906 |
| High School Diploma | $45,577 | $37,361 |
| College or Associate's Degree | $39,837 | $41,107 |
| Bachelor's Degree | $59,561 | $60,176 |
| Graduate Degree | $68,380 | $80,373 |
| Total | $51,273 | $46,706 |
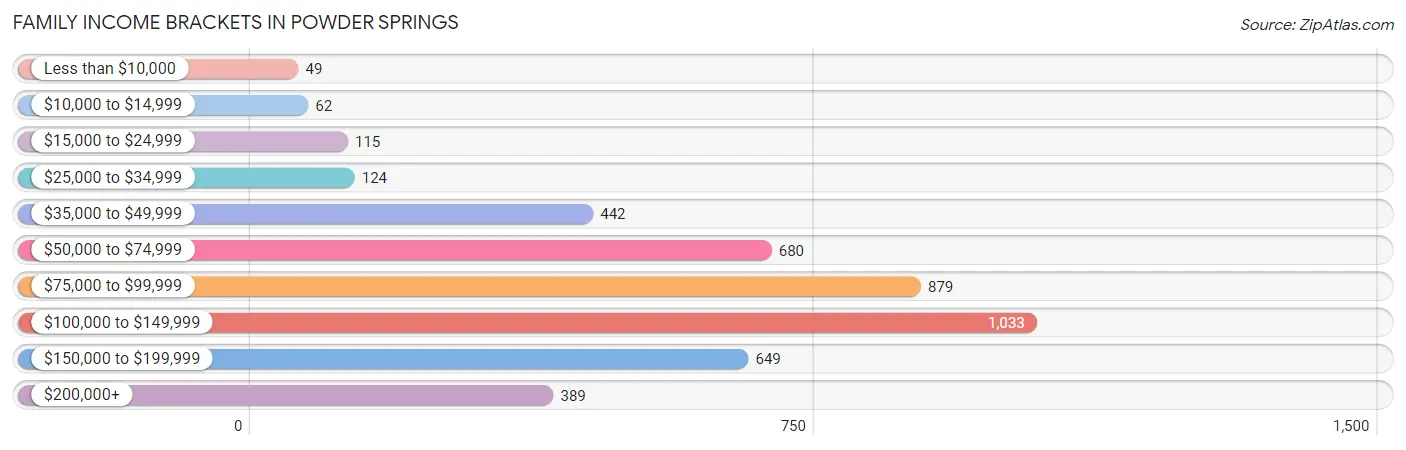
Family Income in Powder Springs
Family Income Brackets in Powder Springs
According to the Powder Springs family income data, there are 1,033 families falling into the $100,000 to $149,999 income range, which is the most common income bracket and makes up 23.4% of all families. Conversely, the less than $10,000 income bracket is the least frequent group with only 49 families (1.1%) belonging to this category.
| Income Bracket | # Families | % Families |
| Less than $10,000 | 49 | 1.1% |
| $10,000 to $14,999 | 62 | 1.4% |
| $15,000 to $24,999 | 115 | 2.6% |
| $25,000 to $34,999 | 124 | 2.8% |
| $35,000 to $49,999 | 442 | 10.0% |
| $50,000 to $74,999 | 680 | 15.4% |
| $75,000 to $99,999 | 879 | 19.9% |
| $100,000 to $149,999 | 1,033 | 23.4% |
| $150,000 to $199,999 | 649 | 14.7% |
| $200,000+ | 389 | 8.8% |
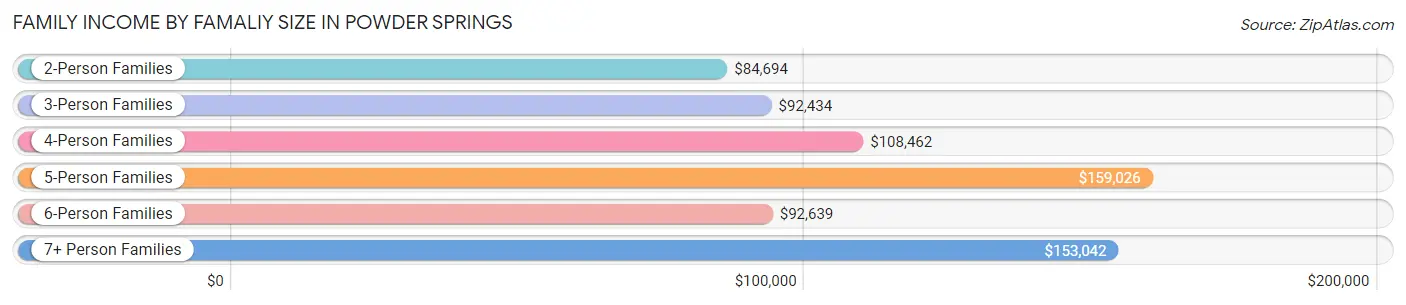
Family Income by Famaliy Size in Powder Springs
5-person families (363 | 8.2%) account for the highest median family income in Powder Springs with $159,026 per family, while 2-person families (1,774 | 40.2%) have the highest median income of $42,347 per family member.
| Income Bracket | # Families | Median Income |
| 2-Person Families | 1,774 (40.2%) | $84,694 |
| 3-Person Families | 1,249 (28.3%) | $92,434 |
| 4-Person Families | 752 (17.0%) | $108,462 |
| 5-Person Families | 363 (8.2%) | $159,026 |
| 6-Person Families | 198 (4.5%) | $92,639 |
| 7+ Person Families | 79 (1.8%) | $153,042 |
| Total | 4,415 (100.0%) | $97,282 |
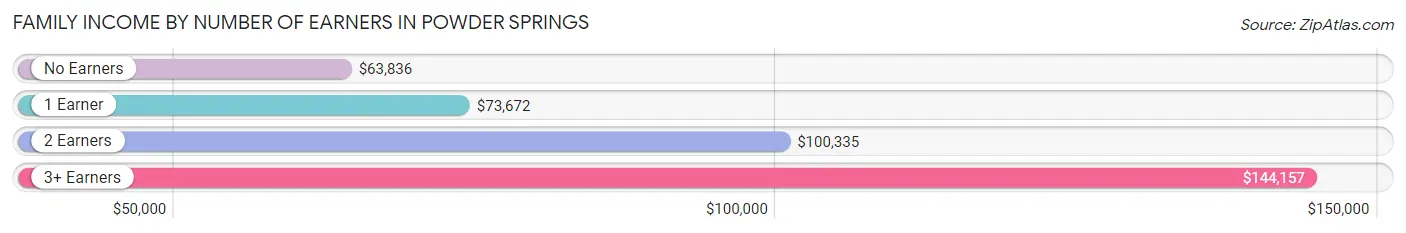
Family Income by Number of Earners in Powder Springs
The median family income in Powder Springs is $97,282, with families comprising 3+ earners (887) having the highest median family income of $144,157, while families with no earners (395) have the lowest median family income of $63,836, accounting for 20.1% and 8.9% of families, respectively.
| Number of Earners | # Families | Median Income |
| No Earners | 395 (8.9%) | $63,836 |
| 1 Earner | 1,096 (24.8%) | $73,672 |
| 2 Earners | 2,037 (46.1%) | $100,335 |
| 3+ Earners | 887 (20.1%) | $144,157 |
| Total | 4,415 (100.0%) | $97,282 |
Household Income in Powder Springs
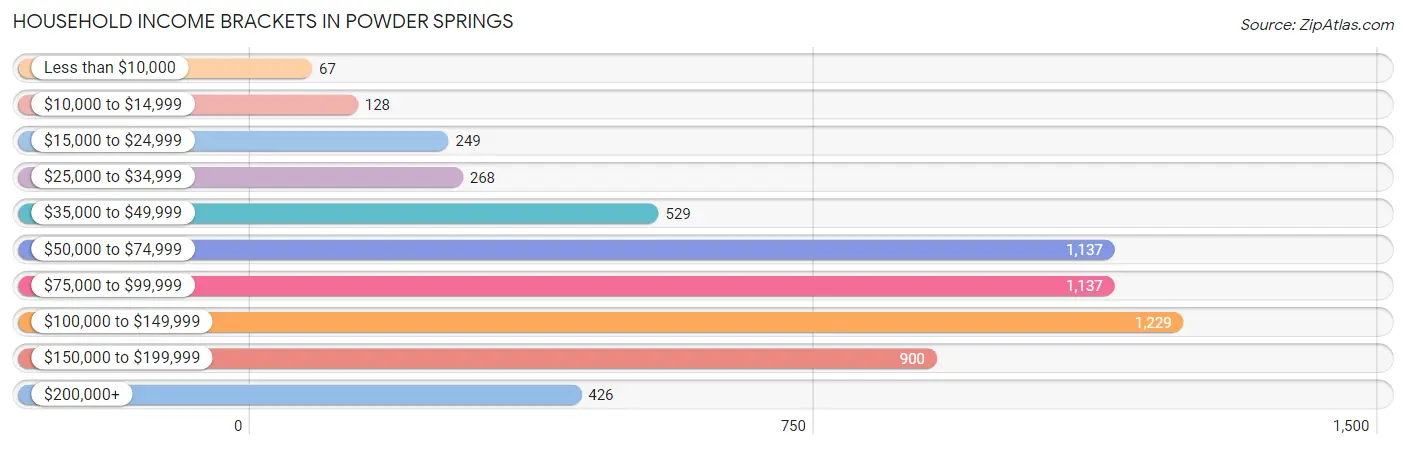
Household Income Brackets in Powder Springs
With 1,229 households falling in the category, the $100,000 to $149,999 income range is the most frequent in Powder Springs, accounting for 20.2% of all households. In contrast, only 67 households (1.1%) fall into the less than $10,000 income bracket, making it the least populous group.
| Income Bracket | # Households | % Households |
| Less than $10,000 | 67 | 1.1% |
| $10,000 to $14,999 | 128 | 2.1% |
| $15,000 to $24,999 | 249 | 4.1% |
| $25,000 to $34,999 | 268 | 4.4% |
| $35,000 to $49,999 | 529 | 8.7% |
| $50,000 to $74,999 | 1,137 | 18.7% |
| $75,000 to $99,999 | 1,137 | 18.7% |
| $100,000 to $149,999 | 1,229 | 20.2% |
| $150,000 to $199,999 | 900 | 14.8% |
| $200,000+ | 426 | 7.0% |
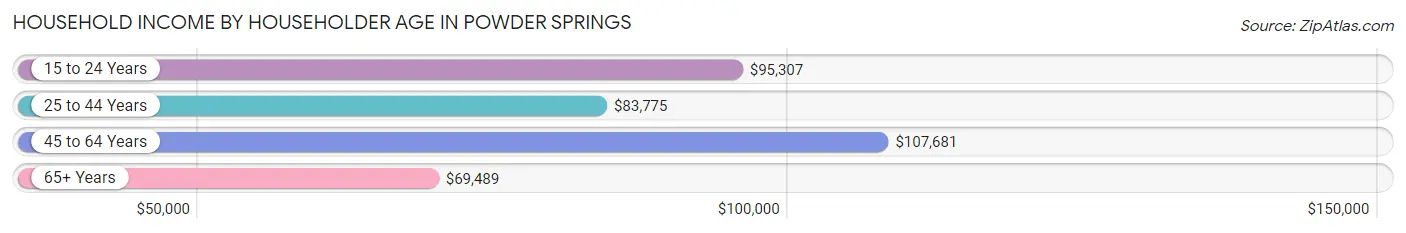
Household Income by Householder Age in Powder Springs
The median household income in Powder Springs is $88,311, with the highest median household income of $107,681 found in the 45 to 64 years age bracket for the primary householder. A total of 2,576 households (42.3%) fall into this category. Meanwhile, the 65+ years age bracket for the primary householder has the lowest median household income of $69,489, with 1,275 households (21.0%) in this group.
| Income Bracket | # Households | Median Income |
| 15 to 24 Years | 137 (2.2%) | $95,307 |
| 25 to 44 Years | 2,094 (34.4%) | $83,775 |
| 45 to 64 Years | 2,576 (42.3%) | $107,681 |
| 65+ Years | 1,275 (21.0%) | $69,489 |
| Total | 6,082 (100.0%) | $88,311 |
Poverty in Powder Springs
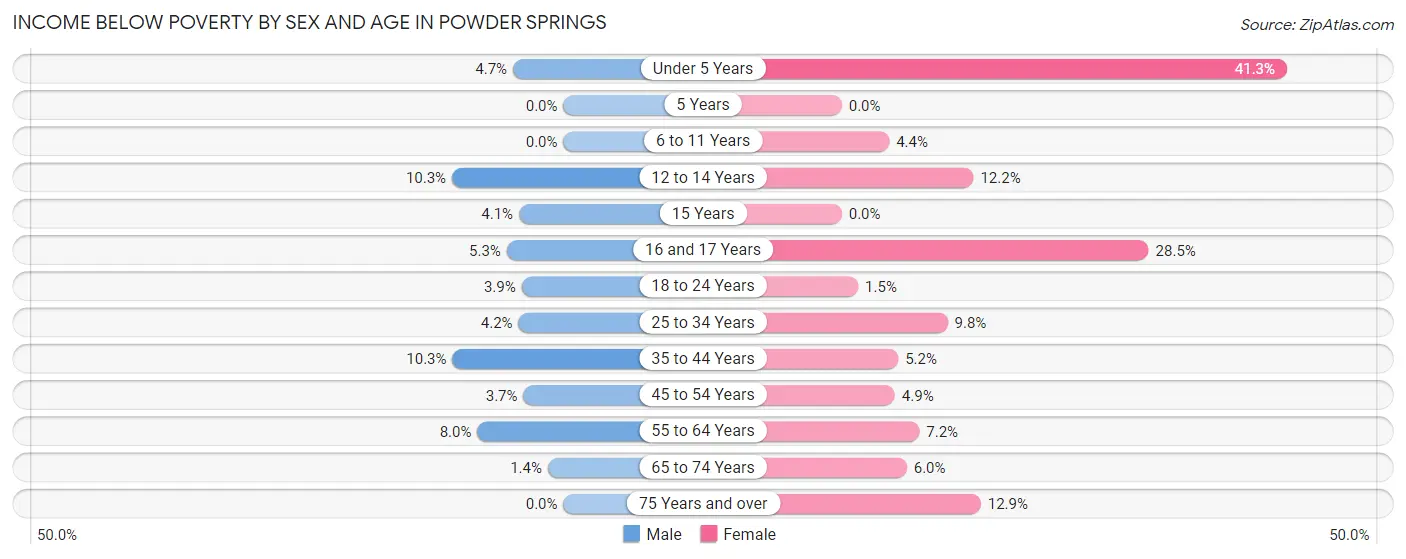
Income Below Poverty by Sex and Age in Powder Springs
With 5.1% poverty level for males and 9.6% for females among the residents of Powder Springs, 12 to 14 year old males and under 5 year old females are the most vulnerable to poverty, with 58 males (10.3%) and 190 females (41.3%) in their respective age groups living below the poverty level.
| Age Bracket | Male | Female |
| Under 5 Years | 28 (4.7%) | 190 (41.3%) |
| 5 Years | 0 (0.0%) | 0 (0.0%) |
| 6 to 11 Years | 0 (0.0%) | 29 (4.4%) |
| 12 to 14 Years | 58 (10.3%) | 50 (12.2%) |
| 15 Years | 4 (4.1%) | 0 (0.0%) |
| 16 and 17 Years | 9 (5.3%) | 129 (28.5%) |
| 18 to 24 Years | 31 (3.9%) | 10 (1.5%) |
| 25 to 34 Years | 38 (4.2%) | 118 (9.8%) |
| 35 to 44 Years | 93 (10.3%) | 85 (5.2%) |
| 45 to 54 Years | 46 (3.7%) | 53 (4.9%) |
| 55 to 64 Years | 70 (8.0%) | 86 (7.2%) |
| 65 to 74 Years | 11 (1.4%) | 38 (6.0%) |
| 75 Years and over | 0 (0.0%) | 68 (12.9%) |
| Total | 388 (5.1%) | 856 (9.6%) |
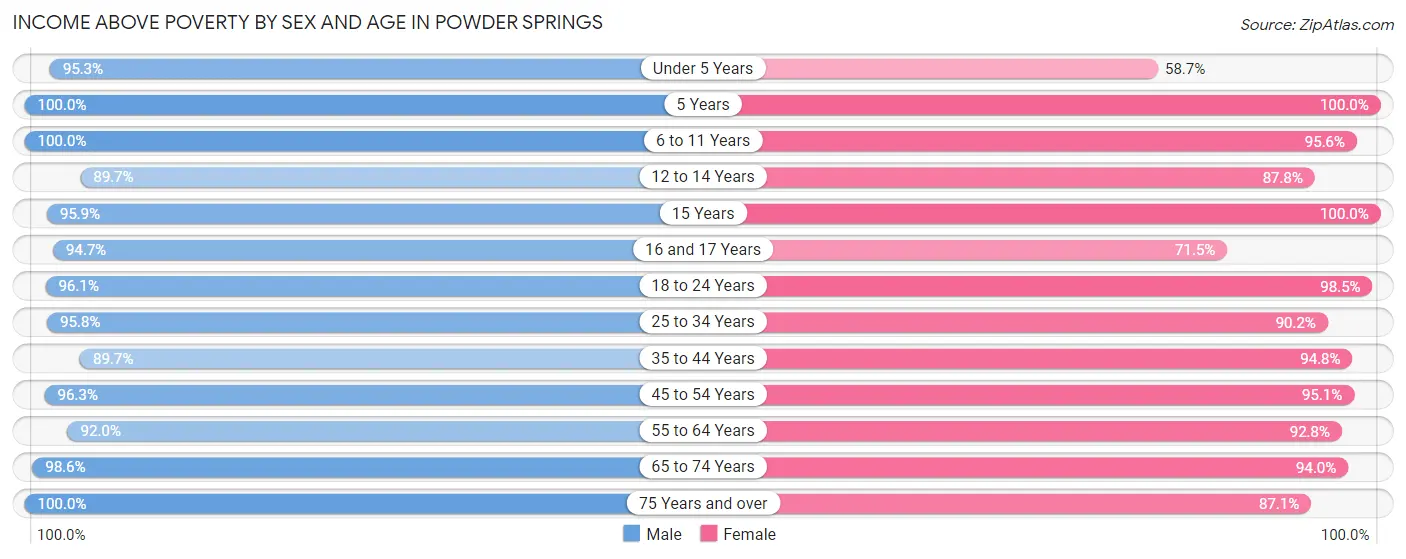
Income Above Poverty by Sex and Age in Powder Springs
According to the poverty statistics in Powder Springs, males aged 5 years and females aged 5 years are the age groups that are most secure financially, with 100.0% of males and 100.0% of females in these age groups living above the poverty line.
| Age Bracket | Male | Female |
| Under 5 Years | 570 (95.3%) | 270 (58.7%) |
| 5 Years | 57 (100.0%) | 31 (100.0%) |
| 6 to 11 Years | 469 (100.0%) | 630 (95.6%) |
| 12 to 14 Years | 503 (89.7%) | 359 (87.8%) |
| 15 Years | 93 (95.9%) | 45 (100.0%) |
| 16 and 17 Years | 162 (94.7%) | 324 (71.5%) |
| 18 to 24 Years | 769 (96.1%) | 649 (98.5%) |
| 25 to 34 Years | 873 (95.8%) | 1,084 (90.2%) |
| 35 to 44 Years | 810 (89.7%) | 1,538 (94.8%) |
| 45 to 54 Years | 1,193 (96.3%) | 1,023 (95.1%) |
| 55 to 64 Years | 806 (92.0%) | 1,108 (92.8%) |
| 65 to 74 Years | 751 (98.6%) | 592 (94.0%) |
| 75 Years and over | 201 (100.0%) | 459 (87.1%) |
| Total | 7,257 (94.9%) | 8,112 (90.4%) |
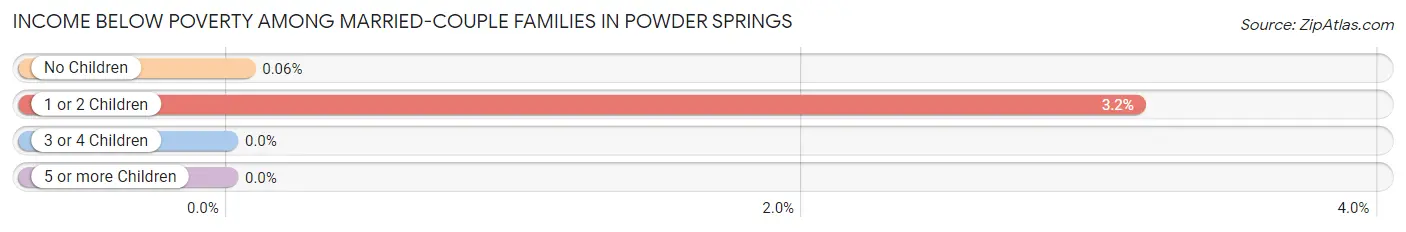
Income Below Poverty Among Married-Couple Families in Powder Springs
The poverty statistics for married-couple families in Powder Springs show that 1.3% or 40 of the total 3,002 families live below the poverty line. Families with 1 or 2 children have the highest poverty rate of 3.2%, comprising of 39 families. On the other hand, families with 3 or 4 children have the lowest poverty rate of 0.0%, which includes 0 families.
| Children | Above Poverty | Below Poverty |
| No Children | 1,547 (99.9%) | 1 (0.1%) |
| 1 or 2 Children | 1,195 (96.8%) | 39 (3.2%) |
| 3 or 4 Children | 190 (100.0%) | 0 (0.0%) |
| 5 or more Children | 30 (100.0%) | 0 (0.0%) |
| Total | 2,962 (98.7%) | 40 (1.3%) |
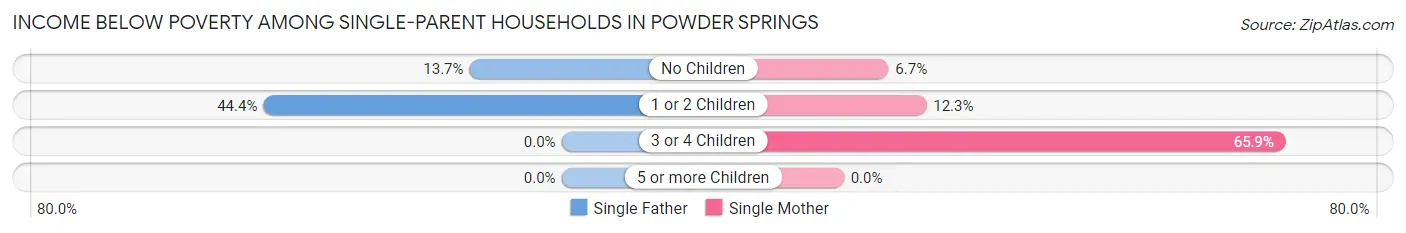
Income Below Poverty Among Single-Parent Households in Powder Springs
According to the poverty data in Powder Springs, 26.4% or 69 single-father households and 14.5% or 167 single-mother households are living below the poverty line. Among single-father households, those with 1 or 2 children have the highest poverty rate, with 48 households (44.4%) experiencing poverty. Likewise, among single-mother households, those with 3 or 4 children have the highest poverty rate, with 56 households (65.9%) falling below the poverty line.
| Children | Single Father | Single Mother |
| No Children | 21 (13.7%) | 24 (6.7%) |
| 1 or 2 Children | 48 (44.4%) | 87 (12.3%) |
| 3 or 4 Children | 0 (0.0%) | 56 (65.9%) |
| 5 or more Children | 0 (0.0%) | 0 (0.0%) |
| Total | 69 (26.4%) | 167 (14.5%) |
Income Below Poverty Among Married-Couple vs Single-Parent Households in Powder Springs
The poverty data for Powder Springs shows that 40 of the married-couple family households (1.3%) and 236 of the single-parent households (16.7%) are living below the poverty level. Within the married-couple family households, those with 1 or 2 children have the highest poverty rate, with 39 households (3.2%) falling below the poverty line. Among the single-parent households, those with 3 or 4 children have the highest poverty rate, with 56 household (65.9%) living below poverty.
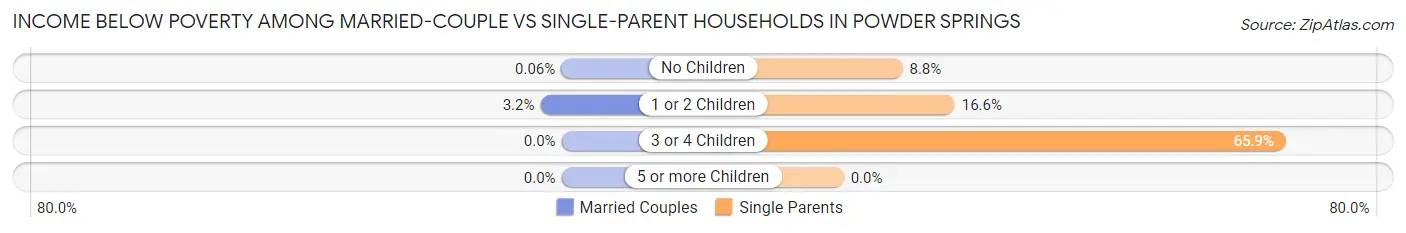
| Children | Married-Couple Families | Single-Parent Households |
| No Children | 1 (0.1%) | 45 (8.8%) |
| 1 or 2 Children | 39 (3.2%) | 135 (16.6%) |
| 3 or 4 Children | 0 (0.0%) | 56 (65.9%) |
| 5 or more Children | 0 (0.0%) | 0 (0.0%) |
| Total | 40 (1.3%) | 236 (16.7%) |
Race in Powder Springs
The most populous races in Powder Springs are Black / African American (8,831 | 52.2%), White / Caucasian (5,117 | 30.2%), and Hispanic or Latino (3,238 | 19.1%).
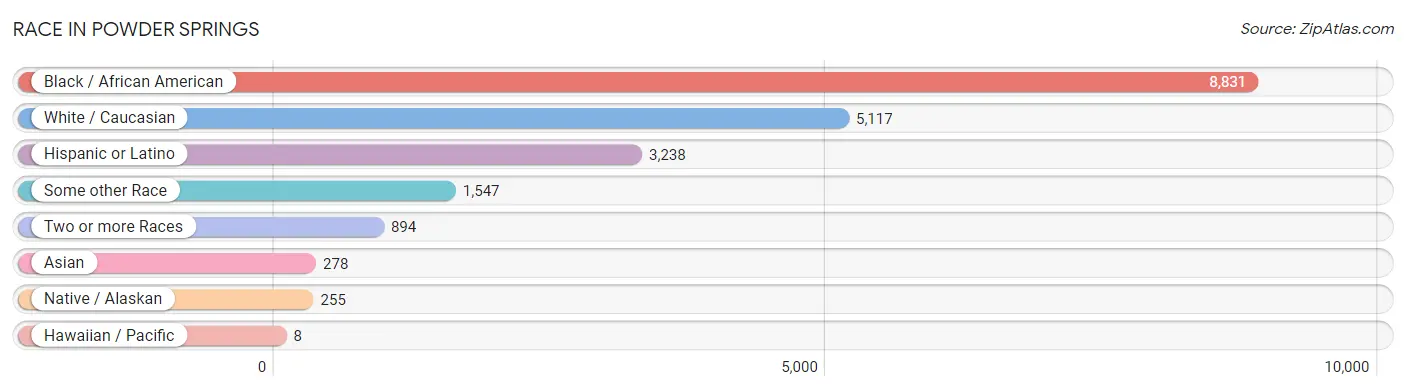
| Race | # Population | % Population |
| Asian | 278 | 1.6% |
| Black / African American | 8,831 | 52.2% |
| Hawaiian / Pacific | 8 | 0.1% |
| Hispanic or Latino | 3,238 | 19.1% |
| Native / Alaskan | 255 | 1.5% |
| White / Caucasian | 5,117 | 30.2% |
| Two or more Races | 894 | 5.3% |
| Some other Race | 1,547 | 9.1% |
| Total | 16,930 | 100.0% |
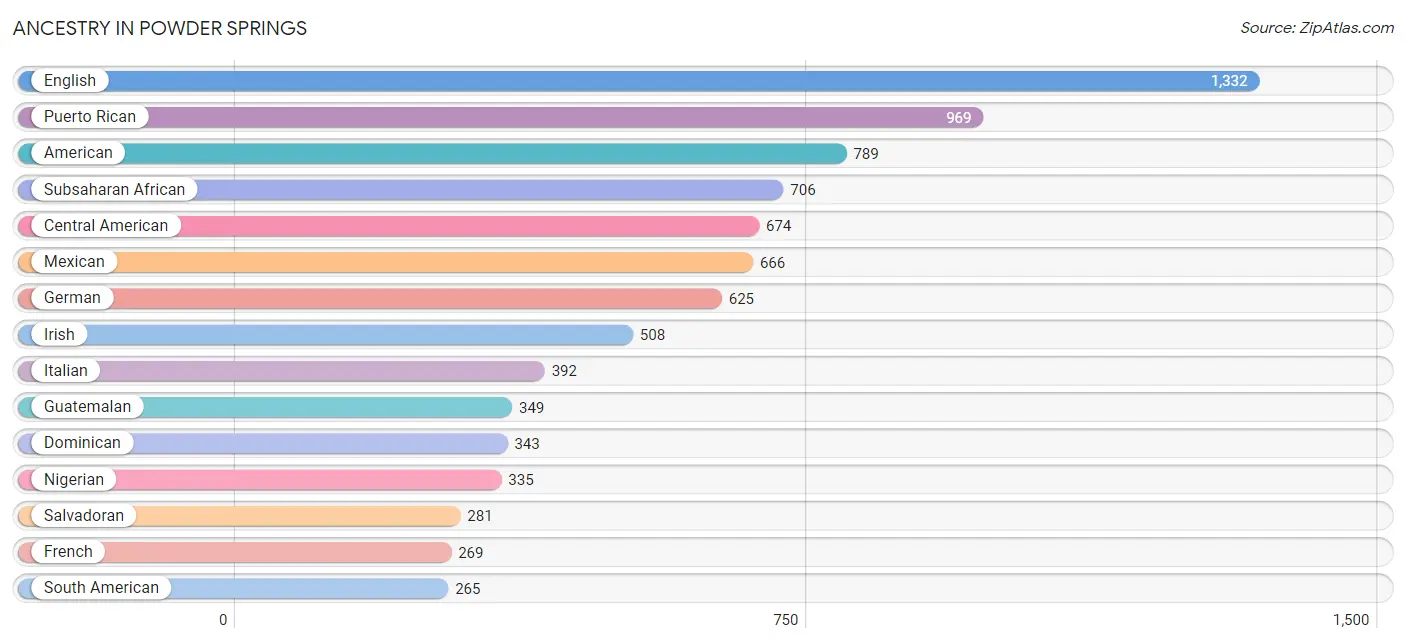
Ancestry in Powder Springs
The most populous ancestries reported in Powder Springs are English (1,332 | 7.9%), Puerto Rican (969 | 5.7%), American (789 | 4.7%), Subsaharan African (706 | 4.2%), and Central American (674 | 4.0%), together accounting for 26.4% of all Powder Springs residents.
| Ancestry | # Population | % Population |
| African | 128 | 0.8% |
| American | 789 | 4.7% |
| Arab | 16 | 0.1% |
| Austrian | 14 | 0.1% |
| Bahamian | 13 | 0.1% |
| Blackfeet | 11 | 0.1% |
| Brazilian | 12 | 0.1% |
| British | 32 | 0.2% |
| Central American | 674 | 4.0% |
| Central American Indian | 255 | 1.5% |
| Colombian | 173 | 1.0% |
| Costa Rican | 32 | 0.2% |
| Czech | 18 | 0.1% |
| Czechoslovakian | 16 | 0.1% |
| Danish | 12 | 0.1% |
| Dominican | 343 | 2.0% |
| Dutch | 69 | 0.4% |
| English | 1,332 | 7.9% |
| Ethiopian | 171 | 1.0% |
| European | 158 | 0.9% |
| French | 269 | 1.6% |
| French Canadian | 155 | 0.9% |
| German | 625 | 3.7% |
| Ghanaian | 54 | 0.3% |
| Guatemalan | 349 | 2.1% |
| Guyanese | 78 | 0.5% |
| Haitian | 229 | 1.3% |
| Honduran | 12 | 0.1% |
| Iranian | 18 | 0.1% |
| Irish | 508 | 3.0% |
| Italian | 392 | 2.3% |
| Jamaican | 159 | 0.9% |
| Japanese | 105 | 0.6% |
| Kenyan | 18 | 0.1% |
| Korean | 135 | 0.8% |
| Mexican | 666 | 3.9% |
| Native Hawaiian | 8 | 0.1% |
| Nigerian | 335 | 2.0% |
| Norwegian | 50 | 0.3% |
| Pakistani | 35 | 0.2% |
| Polish | 36 | 0.2% |
| Portuguese | 48 | 0.3% |
| Puerto Rican | 969 | 5.7% |
| Russian | 26 | 0.2% |
| Salvadoran | 281 | 1.7% |
| Scandinavian | 16 | 0.1% |
| Scotch-Irish | 125 | 0.7% |
| Scottish | 68 | 0.4% |
| Slavic | 7 | 0.0% |
| South American | 265 | 1.6% |
| Spaniard | 197 | 1.2% |
| Subsaharan African | 706 | 4.2% |
| Swiss | 10 | 0.1% |
| Venezuelan | 92 | 0.5% |
| Welsh | 27 | 0.2% |
| West Indian | 13 | 0.1% | View All 56 Rows |
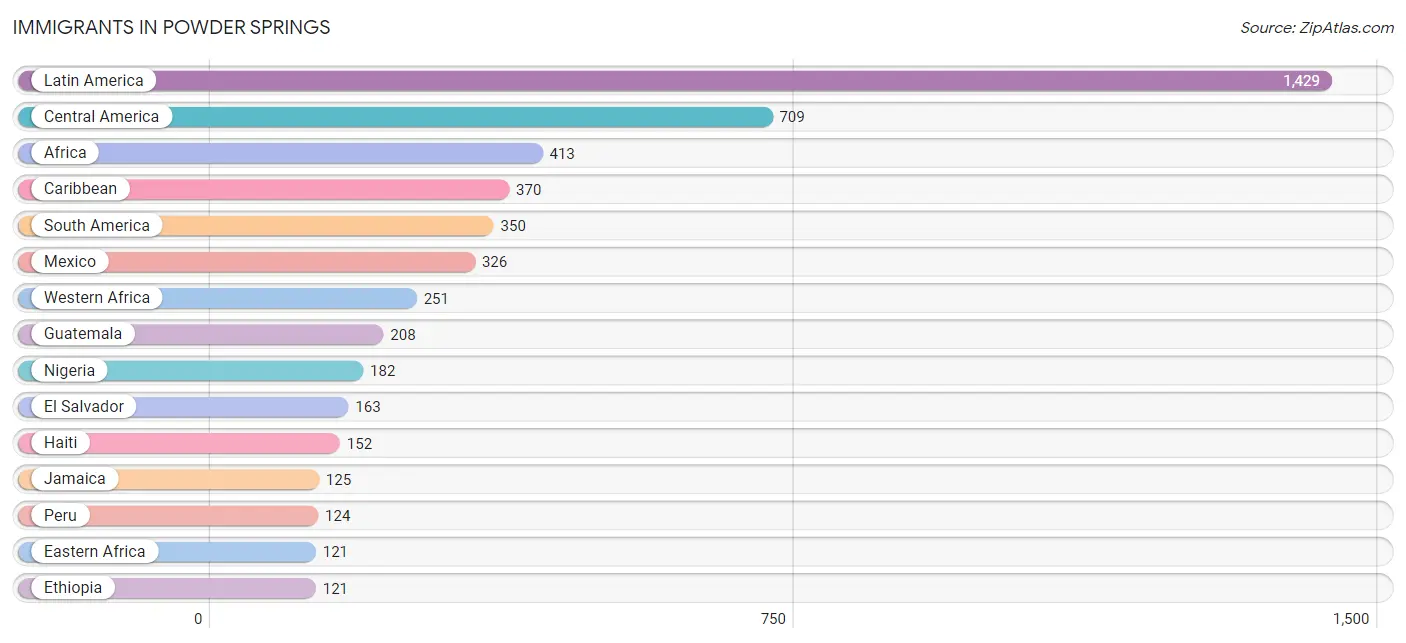
Immigrants in Powder Springs
The most numerous immigrant groups reported in Powder Springs came from Latin America (1,429 | 8.4%), Central America (709 | 4.2%), Africa (413 | 2.4%), Caribbean (370 | 2.2%), and South America (350 | 2.1%), together accounting for 19.3% of all Powder Springs residents.
| Immigration Origin | # Population | % Population |
| Africa | 413 | 2.4% |
| Asia | 67 | 0.4% |
| Cambodia | 22 | 0.1% |
| Cameroon | 41 | 0.2% |
| Canada | 110 | 0.6% |
| Caribbean | 370 | 2.2% |
| Central America | 709 | 4.2% |
| Colombia | 56 | 0.3% |
| Dominican Republic | 93 | 0.5% |
| Eastern Africa | 121 | 0.7% |
| El Salvador | 163 | 1.0% |
| Ethiopia | 121 | 0.7% |
| Europe | 118 | 0.7% |
| Germany | 80 | 0.5% |
| Ghana | 69 | 0.4% |
| Guatemala | 208 | 1.2% |
| Guyana | 78 | 0.5% |
| Haiti | 152 | 0.9% |
| Honduras | 12 | 0.1% |
| Iran | 18 | 0.1% |
| Jamaica | 125 | 0.7% |
| Latin America | 1,429 | 8.4% |
| Mexico | 326 | 1.9% |
| Middle Africa | 41 | 0.2% |
| Nigeria | 182 | 1.1% |
| Northern Europe | 38 | 0.2% |
| Peru | 124 | 0.7% |
| Philippines | 17 | 0.1% |
| South America | 350 | 2.1% |
| South Central Asia | 18 | 0.1% |
| South Eastern Asia | 49 | 0.3% |
| Thailand | 10 | 0.1% |
| Venezuela | 92 | 0.5% |
| Western Africa | 251 | 1.5% |
| Western Europe | 80 | 0.5% | View All 35 Rows |
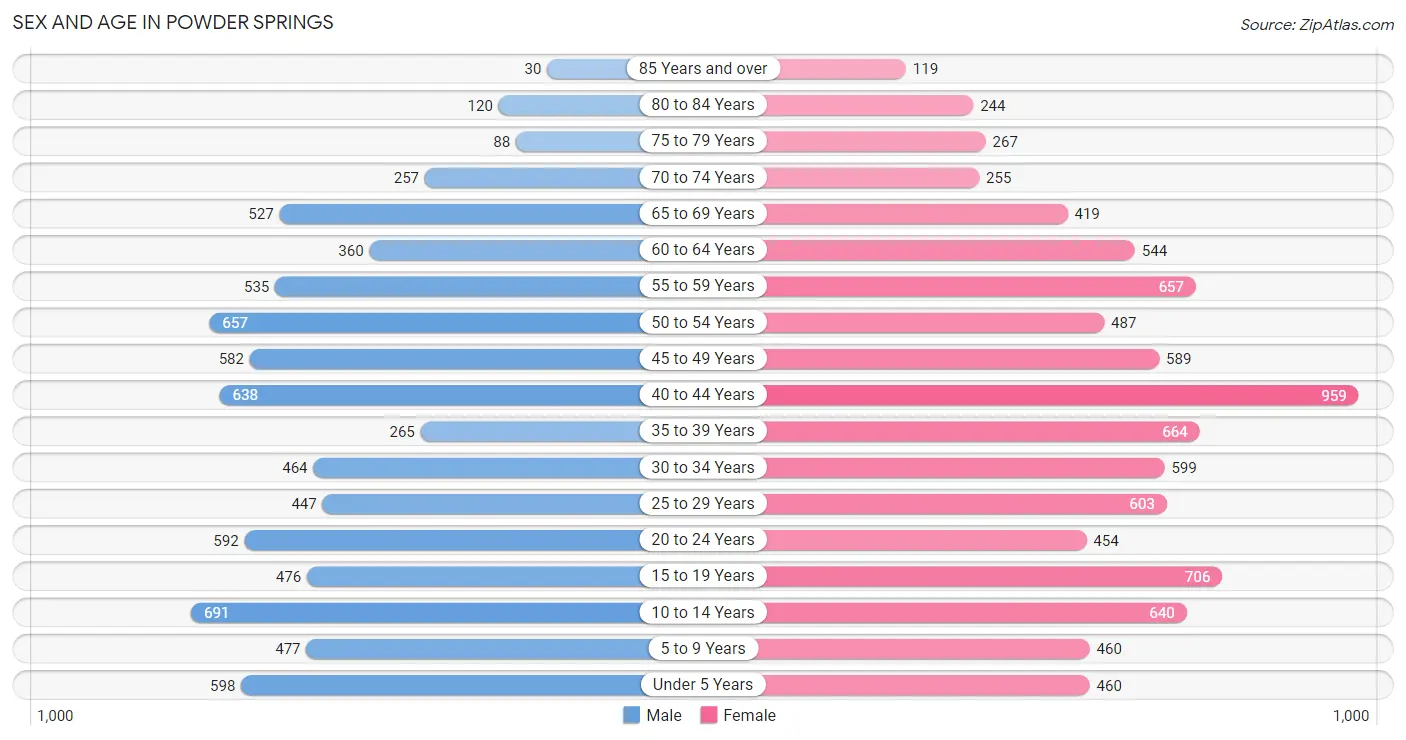
Sex and Age in Powder Springs
Sex and Age in Powder Springs
The most populous age groups in Powder Springs are 10 to 14 Years (691 | 8.8%) for men and 40 to 44 Years (959 | 10.5%) for women.
| Age Bracket | Male | Female |
| Under 5 Years | 598 (7.7%) | 460 (5.0%) |
| 5 to 9 Years | 477 (6.1%) | 460 (5.0%) |
| 10 to 14 Years | 691 (8.8%) | 640 (7.0%) |
| 15 to 19 Years | 476 (6.1%) | 706 (7.7%) |
| 20 to 24 Years | 592 (7.6%) | 454 (5.0%) |
| 25 to 29 Years | 447 (5.7%) | 603 (6.6%) |
| 30 to 34 Years | 464 (5.9%) | 599 (6.6%) |
| 35 to 39 Years | 265 (3.4%) | 664 (7.3%) |
| 40 to 44 Years | 638 (8.2%) | 959 (10.5%) |
| 45 to 49 Years | 582 (7.5%) | 589 (6.5%) |
| 50 to 54 Years | 657 (8.4%) | 487 (5.3%) |
| 55 to 59 Years | 535 (6.9%) | 657 (7.2%) |
| 60 to 64 Years | 360 (4.6%) | 544 (6.0%) |
| 65 to 69 Years | 527 (6.8%) | 419 (4.6%) |
| 70 to 74 Years | 257 (3.3%) | 255 (2.8%) |
| 75 to 79 Years | 88 (1.1%) | 267 (2.9%) |
| 80 to 84 Years | 120 (1.5%) | 244 (2.7%) |
| 85 Years and over | 30 (0.4%) | 119 (1.3%) |
| Total | 7,804 (100.0%) | 9,126 (100.0%) |
Families and Households in Powder Springs
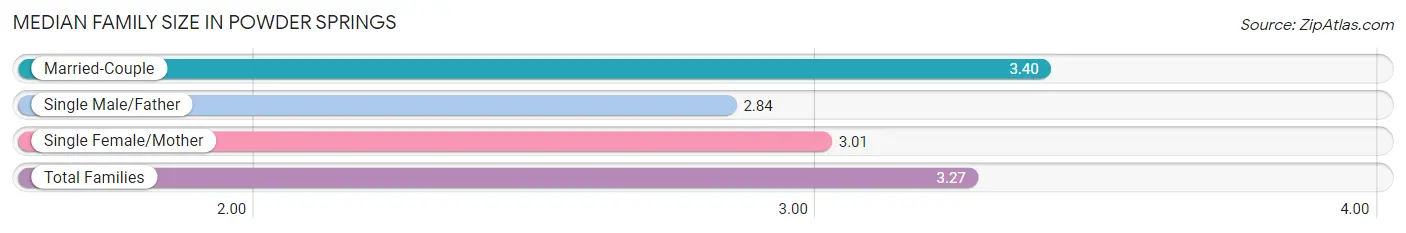
Median Family Size in Powder Springs
The median family size in Powder Springs is 3.27 persons per family, with married-couple families (3,002 | 68.0%) accounting for the largest median family size of 3.4 persons per family. On the other hand, single male/father families (261 | 5.9%) represent the smallest median family size with 2.84 persons per family.
| Family Type | # Families | Family Size |
| Married-Couple | 3,002 (68.0%) | 3.40 |
| Single Male/Father | 261 (5.9%) | 2.84 |
| Single Female/Mother | 1,152 (26.1%) | 3.01 |
| Total Families | 4,415 (100.0%) | 3.27 |
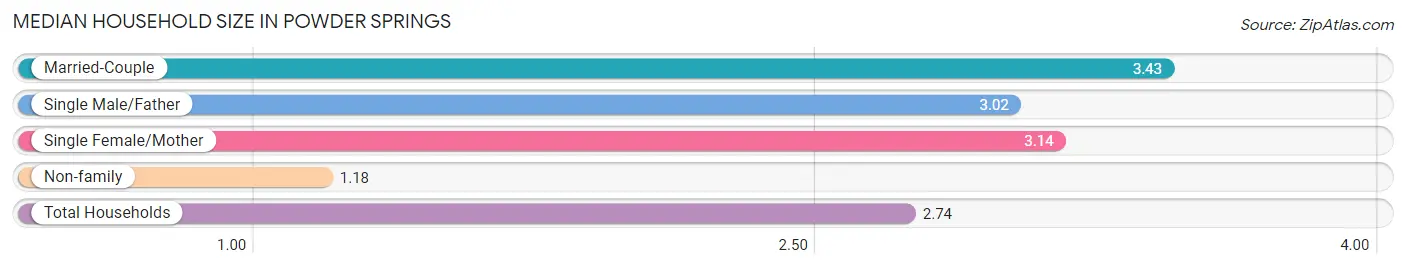
Median Household Size in Powder Springs
The median household size in Powder Springs is 2.74 persons per household, with married-couple households (3,002 | 49.4%) accounting for the largest median household size of 3.43 persons per household. non-family households (1,667 | 27.4%) represent the smallest median household size with 1.18 persons per household.
| Household Type | # Households | Household Size |
| Married-Couple | 3,002 (49.4%) | 3.43 |
| Single Male/Father | 261 (4.3%) | 3.02 |
| Single Female/Mother | 1,152 (18.9%) | 3.14 |
| Non-family | 1,667 (27.4%) | 1.18 |
| Total Households | 6,082 (100.0%) | 2.74 |
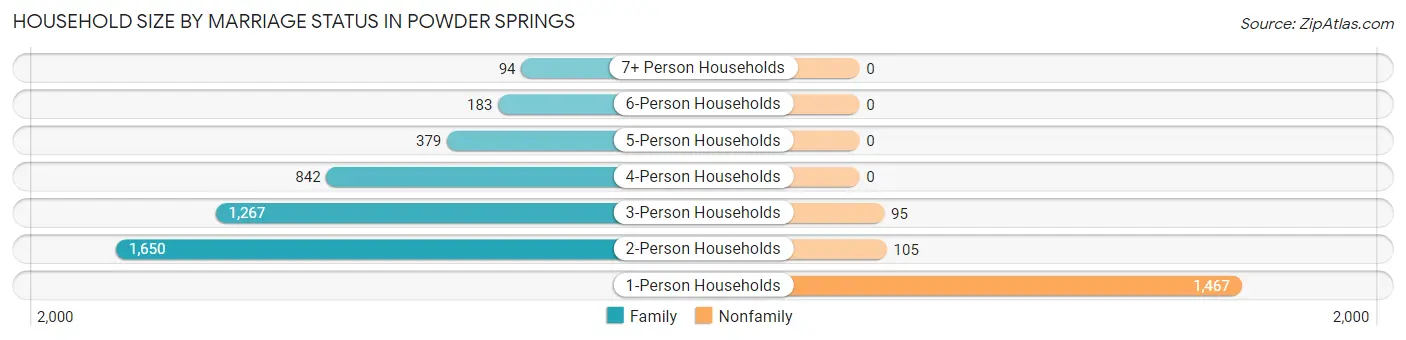
Household Size by Marriage Status in Powder Springs
Out of a total of 6,082 households in Powder Springs, 4,415 (72.6%) are family households, while 1,667 (27.4%) are nonfamily households. The most numerous type of family households are 2-person households, comprising 1,650, and the most common type of nonfamily households are 1-person households, comprising 1,467.
| Household Size | Family Households | Nonfamily Households |
| 1-Person Households | - | 1,467 (24.1%) |
| 2-Person Households | 1,650 (27.1%) | 105 (1.7%) |
| 3-Person Households | 1,267 (20.8%) | 95 (1.6%) |
| 4-Person Households | 842 (13.8%) | 0 (0.0%) |
| 5-Person Households | 379 (6.2%) | 0 (0.0%) |
| 6-Person Households | 183 (3.0%) | 0 (0.0%) |
| 7+ Person Households | 94 (1.5%) | 0 (0.0%) |
| Total | 4,415 (72.6%) | 1,667 (27.4%) |
Female Fertility in Powder Springs
Fertility by Age in Powder Springs
Average fertility rate in Powder Springs is 29.0 births per 1,000 women. Women in the age bracket of 20 to 34 years have the highest fertility rate with 69.0 births per 1,000 women. Women in the age bracket of 20 to 34 years acount for 85.1% of all women with births.
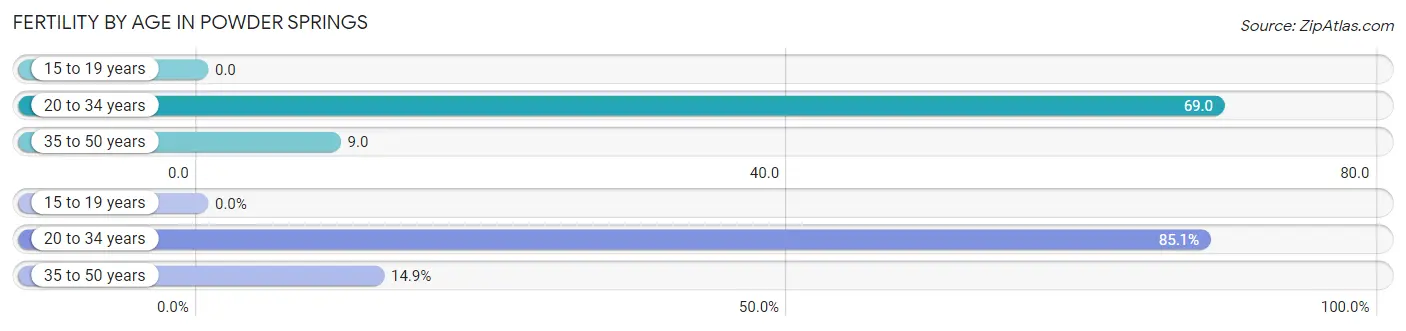
| Age Bracket | Women with Births | Births / 1,000 Women |
| 15 to 19 years | 0 (0.0%) | 0.0 |
| 20 to 34 years | 114 (85.1%) | 69.0 |
| 35 to 50 years | 20 (14.9%) | 9.0 |
| Total | 134 (100.0%) | 29.0 |
Fertility by Age by Marriage Status in Powder Springs
70.9% of women with births (134) in Powder Springs are married. The highest percentage of unmarried women with births falls into 20 to 34 years age bracket with 34.2% of them unmarried at the time of birth, while the lowest percentage of unmarried women with births belong to 35 to 50 years age bracket with 0.0% of them unmarried.
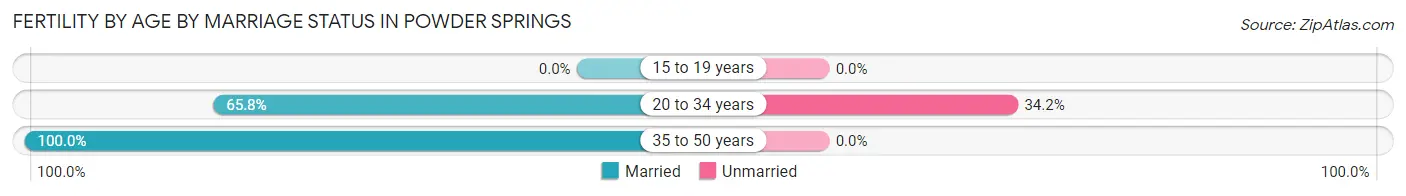
| Age Bracket | Married | Unmarried |
| 15 to 19 years | 0 (0.0%) | 0 (0.0%) |
| 20 to 34 years | 75 (65.8%) | 39 (34.2%) |
| 35 to 50 years | 20 (100.0%) | 0 (0.0%) |
| Total | 95 (70.9%) | 39 (29.1%) |
Fertility by Education in Powder Springs
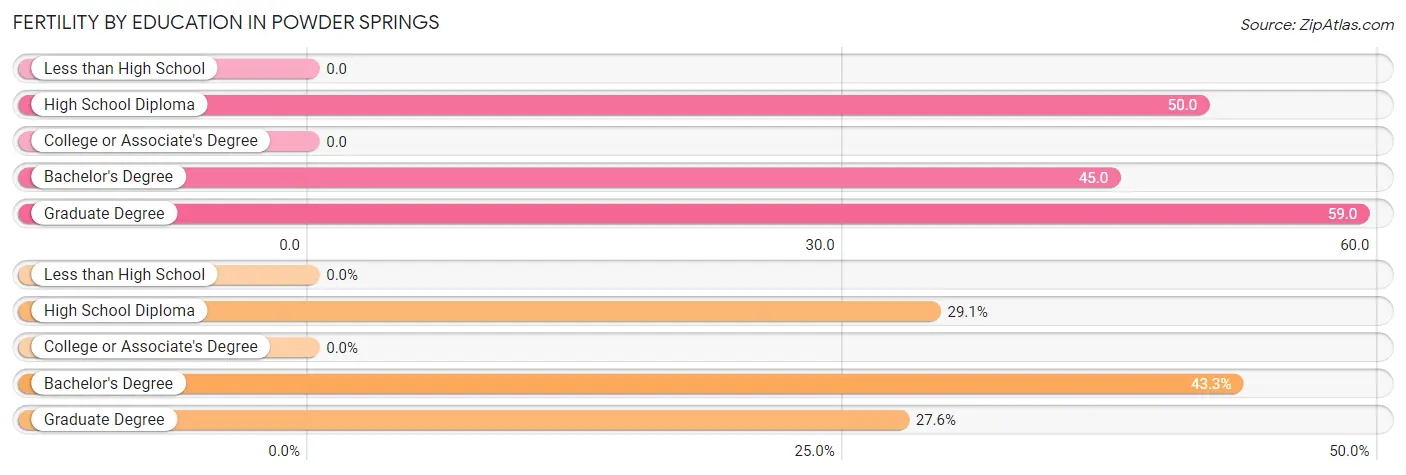
| Educational Attainment | Women with Births | Births / 1,000 Women |
| Less than High School | 0 (0.0%) | 0.0 |
| High School Diploma | 39 (29.1%) | 50.0 |
| College or Associate's Degree | 0 (0.0%) | 0.0 |
| Bachelor's Degree | 58 (43.3%) | 45.0 |
| Graduate Degree | 37 (27.6%) | 59.0 |
| Total | 134 (100.0%) | 29.0 |
Fertility by Education by Marriage Status in Powder Springs
29.1% of women with births in Powder Springs are unmarried. Women with the educational attainment of bachelor's degree are most likely to be married with 100.0% of them married at childbirth, while women with the educational attainment of high school diploma are least likely to be married with 100.0% of them unmarried at childbirth.
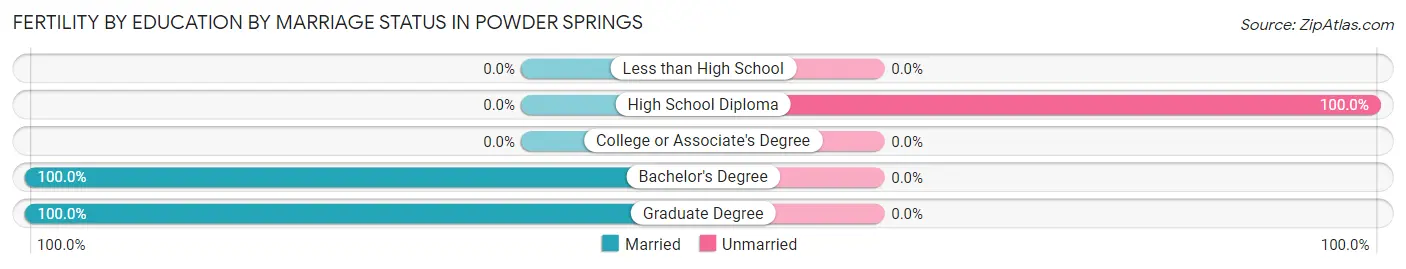
| Educational Attainment | Married | Unmarried |
| Less than High School | 0 (0.0%) | 0 (0.0%) |
| High School Diploma | 0 (0.0%) | 39 (100.0%) |
| College or Associate's Degree | 0 (0.0%) | 0 (0.0%) |
| Bachelor's Degree | 58 (100.0%) | 0 (0.0%) |
| Graduate Degree | 37 (100.0%) | 0 (0.0%) |
| Total | 95 (70.9%) | 39 (29.1%) |
Employment Characteristics in Powder Springs
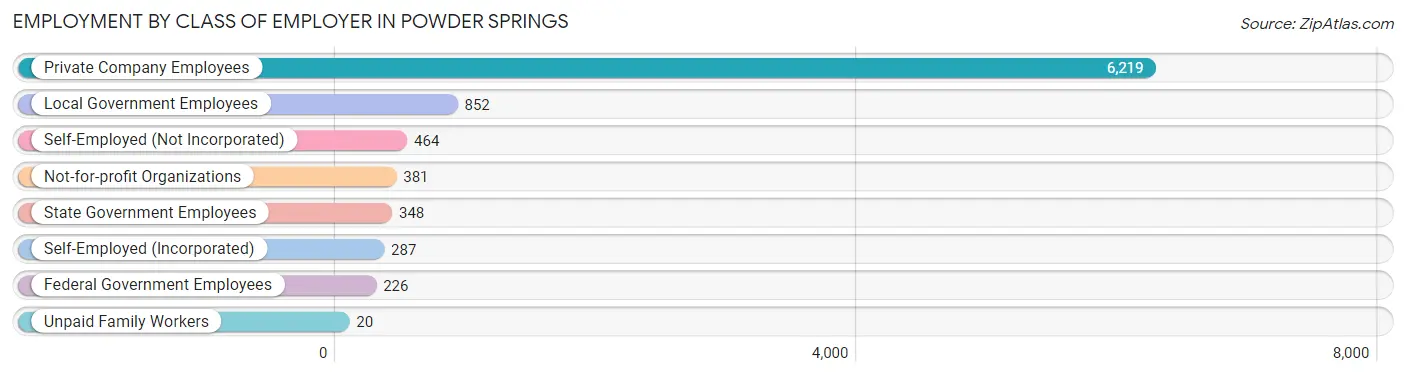
Employment by Class of Employer in Powder Springs
Among the 8,797 employed individuals in Powder Springs, private company employees (6,219 | 70.7%), local government employees (852 | 9.7%), and self-employed (not incorporated) (464 | 5.3%) make up the most common classes of employment.
| Employer Class | # Employees | % Employees |
| Private Company Employees | 6,219 | 70.7% |
| Self-Employed (Incorporated) | 287 | 3.3% |
| Self-Employed (Not Incorporated) | 464 | 5.3% |
| Not-for-profit Organizations | 381 | 4.3% |
| Local Government Employees | 852 | 9.7% |
| State Government Employees | 348 | 4.0% |
| Federal Government Employees | 226 | 2.6% |
| Unpaid Family Workers | 20 | 0.2% |
| Total | 8,797 | 100.0% |
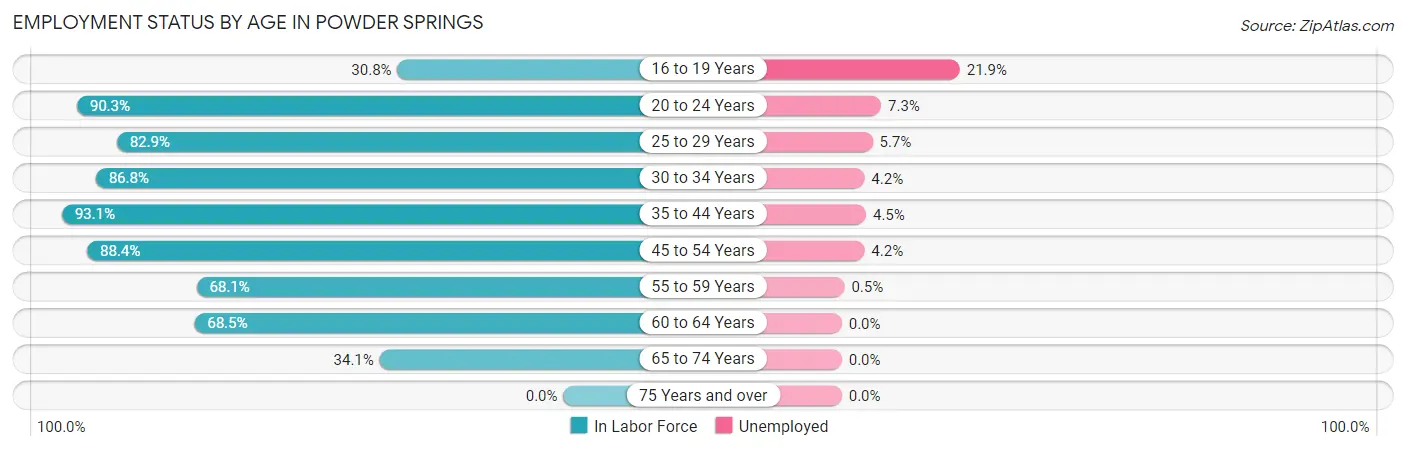
Employment Status by Age in Powder Springs
According to the labor force statistics for Powder Springs, out of the total population over 16 years of age (13,461), 69.7% or 9,382 individuals are in the labor force, with 4.5% or 422 of them unemployed. The age group with the highest labor force participation rate is 35 to 44 years, with 93.1% or 2,352 individuals in the labor force. Within the labor force, the 16 to 19 years age range has the highest percentage of unemployed individuals, with 21.9% or 70 of them being unemployed.
| Age Bracket | In Labor Force | Unemployed |
| 16 to 19 Years | 320 (30.8%) | 70 (21.9%) |
| 20 to 24 Years | 945 (90.3%) | 69 (7.3%) |
| 25 to 29 Years | 870 (82.9%) | 50 (5.7%) |
| 30 to 34 Years | 923 (86.8%) | 39 (4.2%) |
| 35 to 44 Years | 2,352 (93.1%) | 106 (4.5%) |
| 45 to 54 Years | 2,046 (88.4%) | 86 (4.2%) |
| 55 to 59 Years | 812 (68.1%) | 4 (0.5%) |
| 60 to 64 Years | 619 (68.5%) | 0 (0.0%) |
| 65 to 74 Years | 497 (34.1%) | 0 (0.0%) |
| 75 Years and over | 0 (0.0%) | 0 (0.0%) |
| Total | 9,382 (69.7%) | 422 (4.5%) |
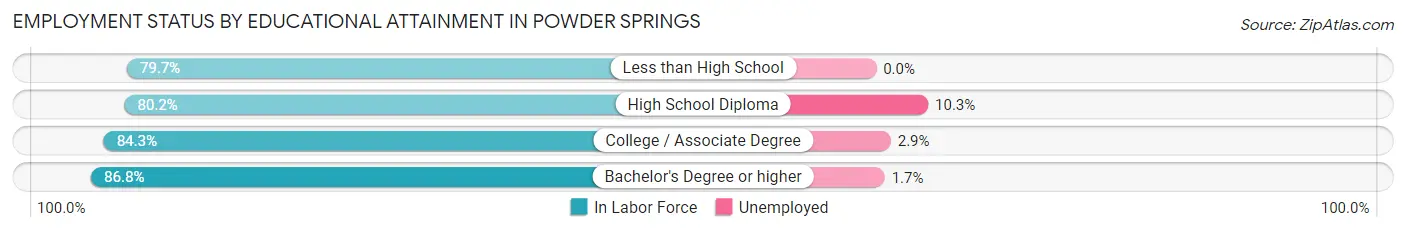
Employment Status by Educational Attainment in Powder Springs
According to labor force statistics for Powder Springs, 84.2% of individuals (7,620) out of the total population between 25 and 64 years of age (9,050) are in the labor force, with 3.7% or 282 of them being unemployed. The group with the highest labor force participation rate are those with the educational attainment of bachelor's degree or higher, with 86.8% or 3,295 individuals in the labor force. Within the labor force, individuals with high school diploma education have the highest percentage of unemployment, with 10.3% or 160 of them being unemployed.
| Educational Attainment | In Labor Force | Unemployed |
| Less than High School | 445 (79.7%) | 0 (0.0%) |
| High School Diploma | 1,552 (80.2%) | 199 (10.3%) |
| College / Associate Degree | 2,328 (84.3%) | 80 (2.9%) |
| Bachelor's Degree or higher | 3,295 (86.8%) | 65 (1.7%) |
| Total | 7,620 (84.2%) | 335 (3.7%) |
Employment Occupations by Sex in Powder Springs
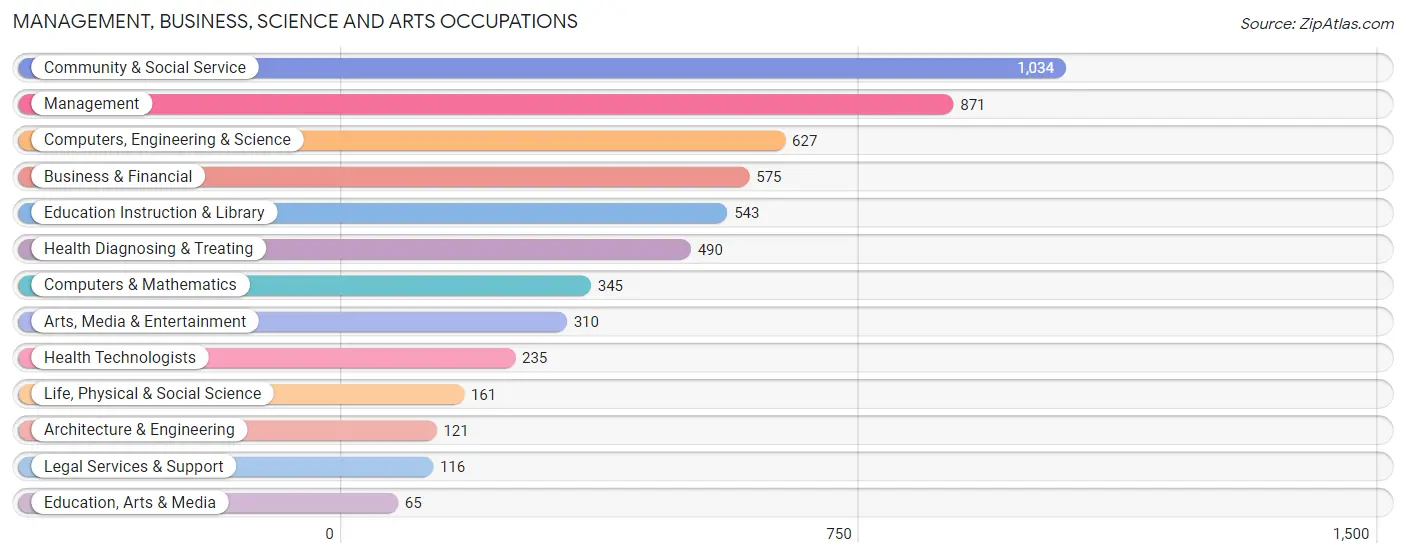
Management, Business, Science and Arts Occupations
The most common Management, Business, Science and Arts occupations in Powder Springs are Community & Social Service (1,034 | 11.6%), Management (871 | 9.7%), Computers, Engineering & Science (627 | 7.0%), Business & Financial (575 | 6.4%), and Education Instruction & Library (543 | 6.1%).
Management, Business, Science and Arts Occupations by Sex
Within the Management, Business, Science and Arts occupations in Powder Springs, the most male-oriented occupations are Education, Arts & Media (100.0%), Architecture & Engineering (87.6%), and Computers & Mathematics (49.9%), while the most female-oriented occupations are Legal Services & Support (100.0%), Health Diagnosing & Treating (96.9%), and Life, Physical & Social Science (93.8%).
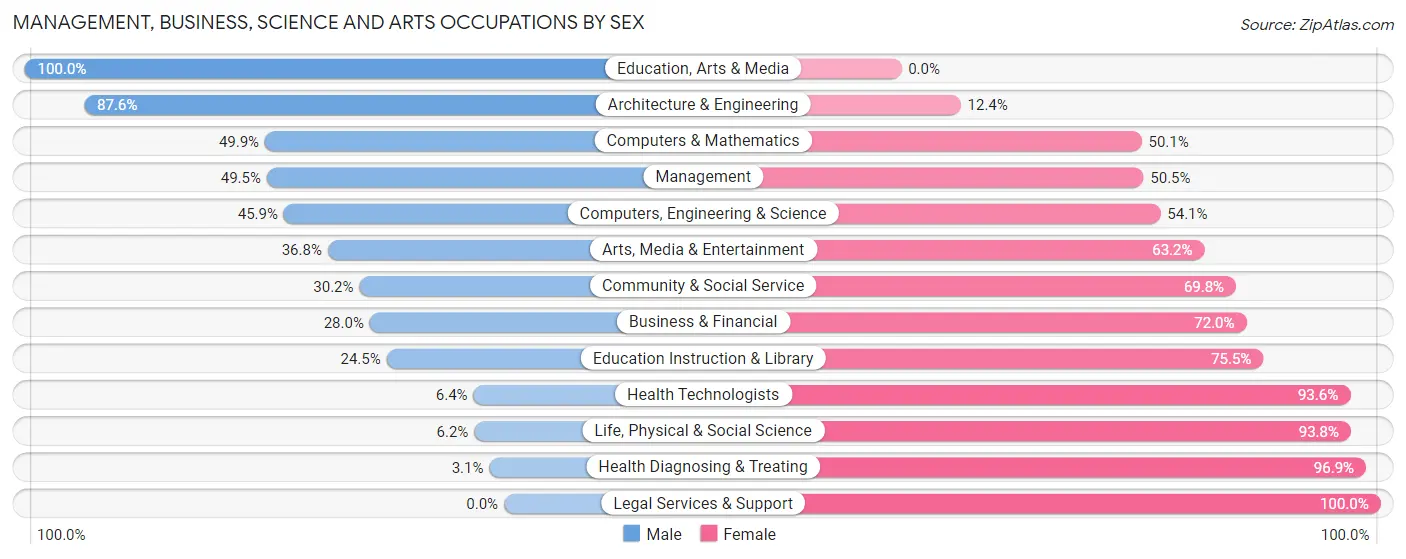
| Occupation | Male | Female |
| Management | 431 (49.5%) | 440 (50.5%) |
| Business & Financial | 161 (28.0%) | 414 (72.0%) |
| Computers, Engineering & Science | 288 (45.9%) | 339 (54.1%) |
| Computers & Mathematics | 172 (49.9%) | 173 (50.1%) |
| Architecture & Engineering | 106 (87.6%) | 15 (12.4%) |
| Life, Physical & Social Science | 10 (6.2%) | 151 (93.8%) |
| Community & Social Service | 312 (30.2%) | 722 (69.8%) |
| Education, Arts & Media | 65 (100.0%) | 0 (0.0%) |
| Legal Services & Support | 0 (0.0%) | 116 (100.0%) |
| Education Instruction & Library | 133 (24.5%) | 410 (75.5%) |
| Arts, Media & Entertainment | 114 (36.8%) | 196 (63.2%) |
| Health Diagnosing & Treating | 15 (3.1%) | 475 (96.9%) |
| Health Technologists | 15 (6.4%) | 220 (93.6%) |
| Total (Category) | 1,207 (33.6%) | 2,390 (66.4%) |
| Total (Overall) | 4,205 (47.0%) | 4,734 (53.0%) |
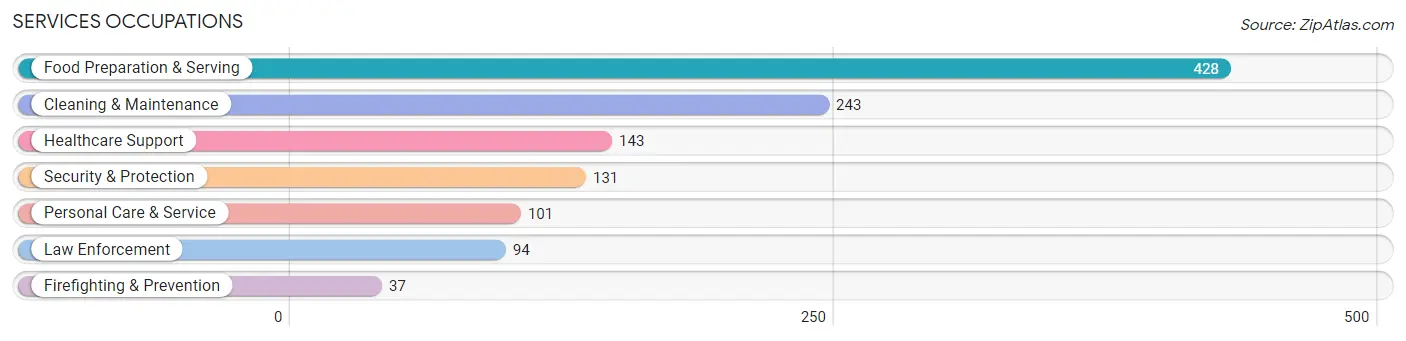
Services Occupations
The most common Services occupations in Powder Springs are Food Preparation & Serving (428 | 4.8%), Cleaning & Maintenance (243 | 2.7%), Healthcare Support (143 | 1.6%), Security & Protection (131 | 1.5%), and Personal Care & Service (101 | 1.1%).
Services Occupations by Sex
Within the Services occupations in Powder Springs, the most male-oriented occupations are Firefighting & Prevention (100.0%), Personal Care & Service (59.4%), and Security & Protection (50.4%), while the most female-oriented occupations are Healthcare Support (100.0%), Law Enforcement (69.2%), and Cleaning & Maintenance (66.3%).
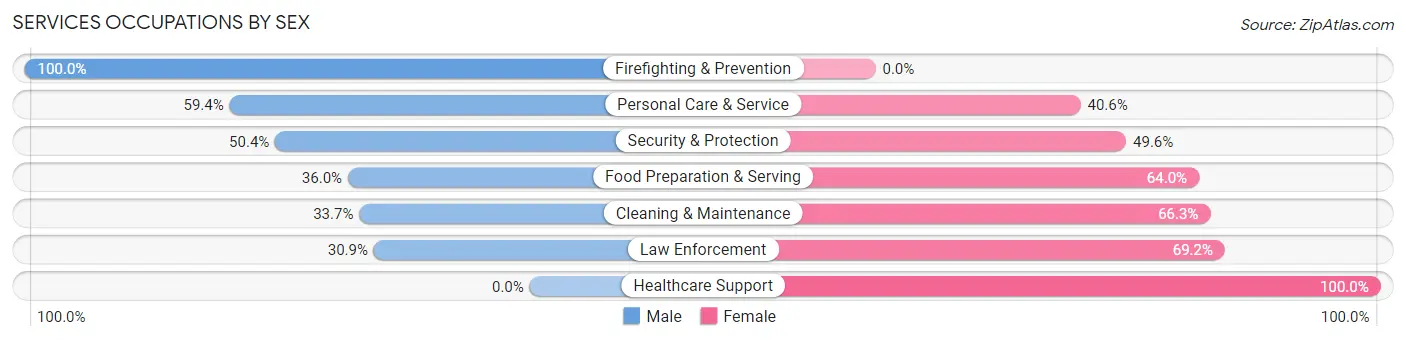
| Occupation | Male | Female |
| Healthcare Support | 0 (0.0%) | 143 (100.0%) |
| Security & Protection | 66 (50.4%) | 65 (49.6%) |
| Firefighting & Prevention | 37 (100.0%) | 0 (0.0%) |
| Law Enforcement | 29 (30.8%) | 65 (69.2%) |
| Food Preparation & Serving | 154 (36.0%) | 274 (64.0%) |
| Cleaning & Maintenance | 82 (33.7%) | 161 (66.3%) |
| Personal Care & Service | 60 (59.4%) | 41 (40.6%) |
| Total (Category) | 362 (34.6%) | 684 (65.4%) |
| Total (Overall) | 4,205 (47.0%) | 4,734 (53.0%) |
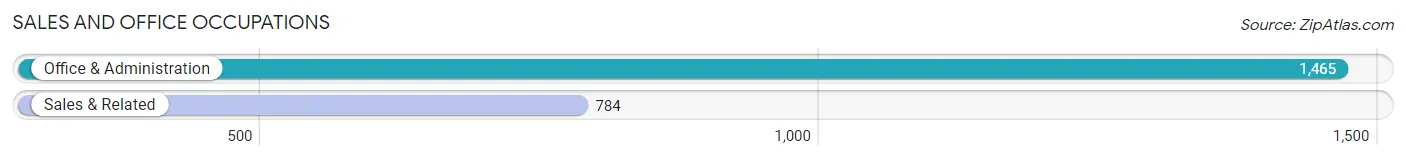
Sales and Office Occupations
The most common Sales and Office occupations in Powder Springs are Office & Administration (1,465 | 16.4%), and Sales & Related (784 | 8.8%).
Sales and Office Occupations by Sex
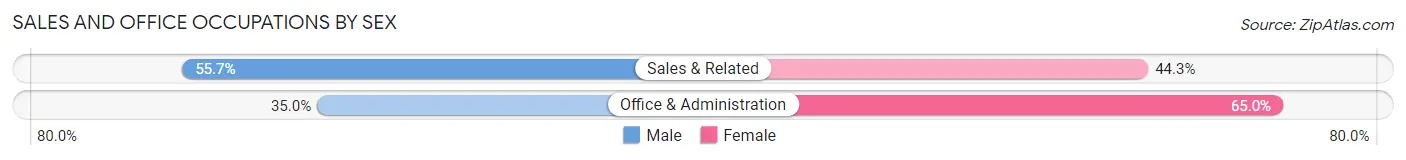
| Occupation | Male | Female |
| Sales & Related | 437 (55.7%) | 347 (44.3%) |
| Office & Administration | 513 (35.0%) | 952 (65.0%) |
| Total (Category) | 950 (42.2%) | 1,299 (57.8%) |
| Total (Overall) | 4,205 (47.0%) | 4,734 (53.0%) |
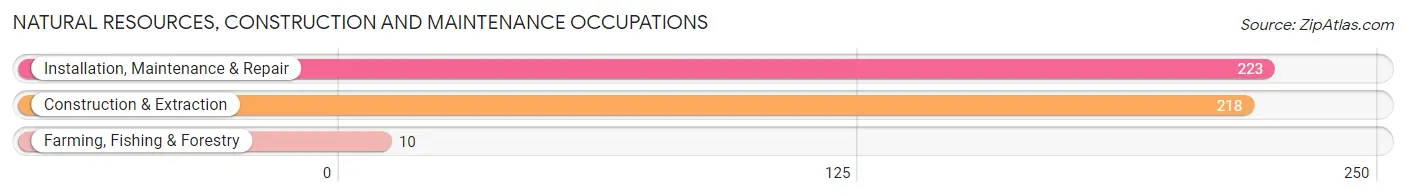
Natural Resources, Construction and Maintenance Occupations
The most common Natural Resources, Construction and Maintenance occupations in Powder Springs are Installation, Maintenance & Repair (223 | 2.5%), Construction & Extraction (218 | 2.4%), and Farming, Fishing & Forestry (10 | 0.1%).
Natural Resources, Construction and Maintenance Occupations by Sex
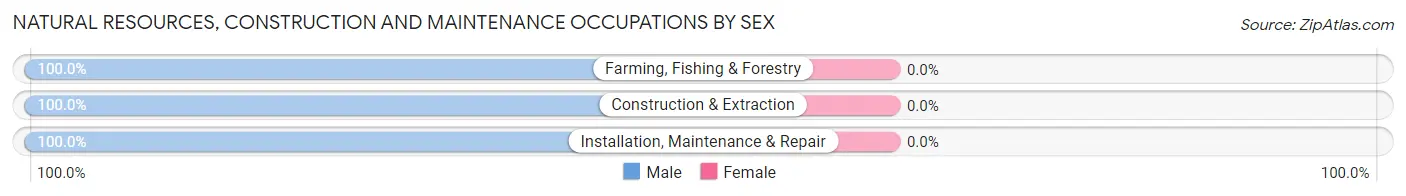
| Occupation | Male | Female |
| Farming, Fishing & Forestry | 10 (100.0%) | 0 (0.0%) |
| Construction & Extraction | 218 (100.0%) | 0 (0.0%) |
| Installation, Maintenance & Repair | 223 (100.0%) | 0 (0.0%) |
| Total (Category) | 451 (100.0%) | 0 (0.0%) |
| Total (Overall) | 4,205 (47.0%) | 4,734 (53.0%) |
Production, Transportation and Moving Occupations
The most common Production, Transportation and Moving occupations in Powder Springs are Transportation (823 | 9.2%), Production (490 | 5.5%), and Material Moving (283 | 3.2%).
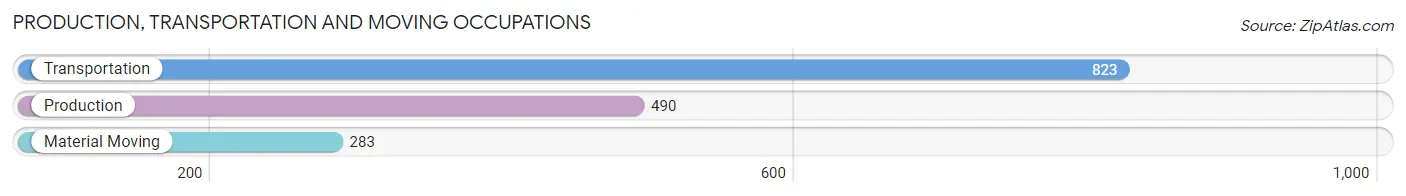
Production, Transportation and Moving Occupations by Sex
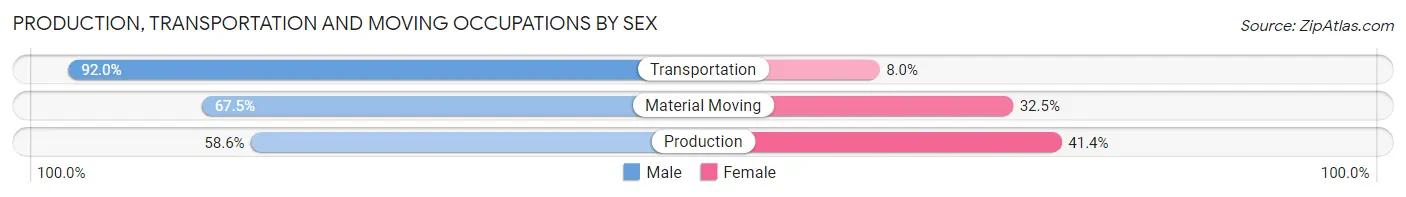
| Occupation | Male | Female |
| Production | 287 (58.6%) | 203 (41.4%) |
| Transportation | 757 (92.0%) | 66 (8.0%) |
| Material Moving | 191 (67.5%) | 92 (32.5%) |
| Total (Category) | 1,235 (77.4%) | 361 (22.6%) |
| Total (Overall) | 4,205 (47.0%) | 4,734 (53.0%) |
Employment Industries by Sex in Powder Springs
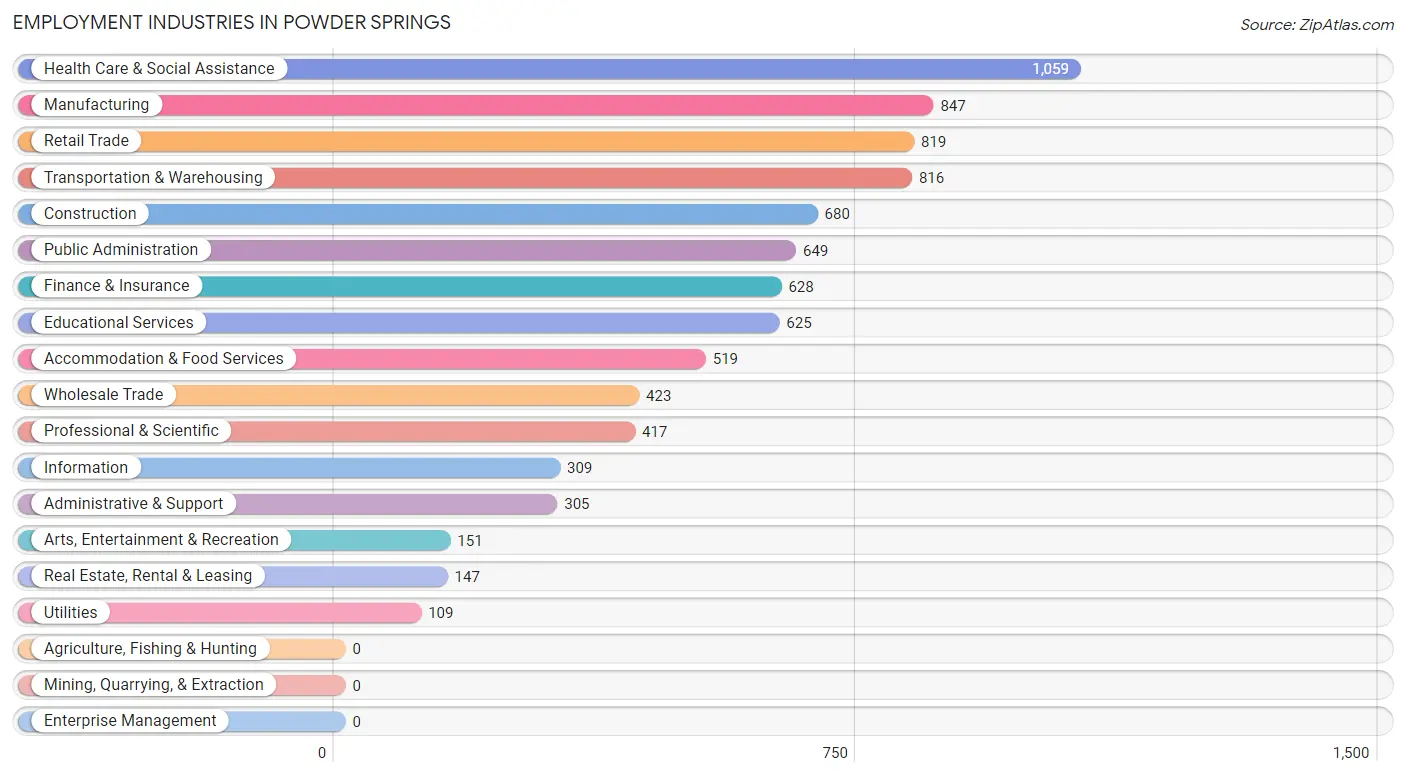
Employment Industries in Powder Springs
The major employment industries in Powder Springs include Health Care & Social Assistance (1,059 | 11.8%), Manufacturing (847 | 9.5%), Retail Trade (819 | 9.2%), Transportation & Warehousing (816 | 9.1%), and Construction (680 | 7.6%).
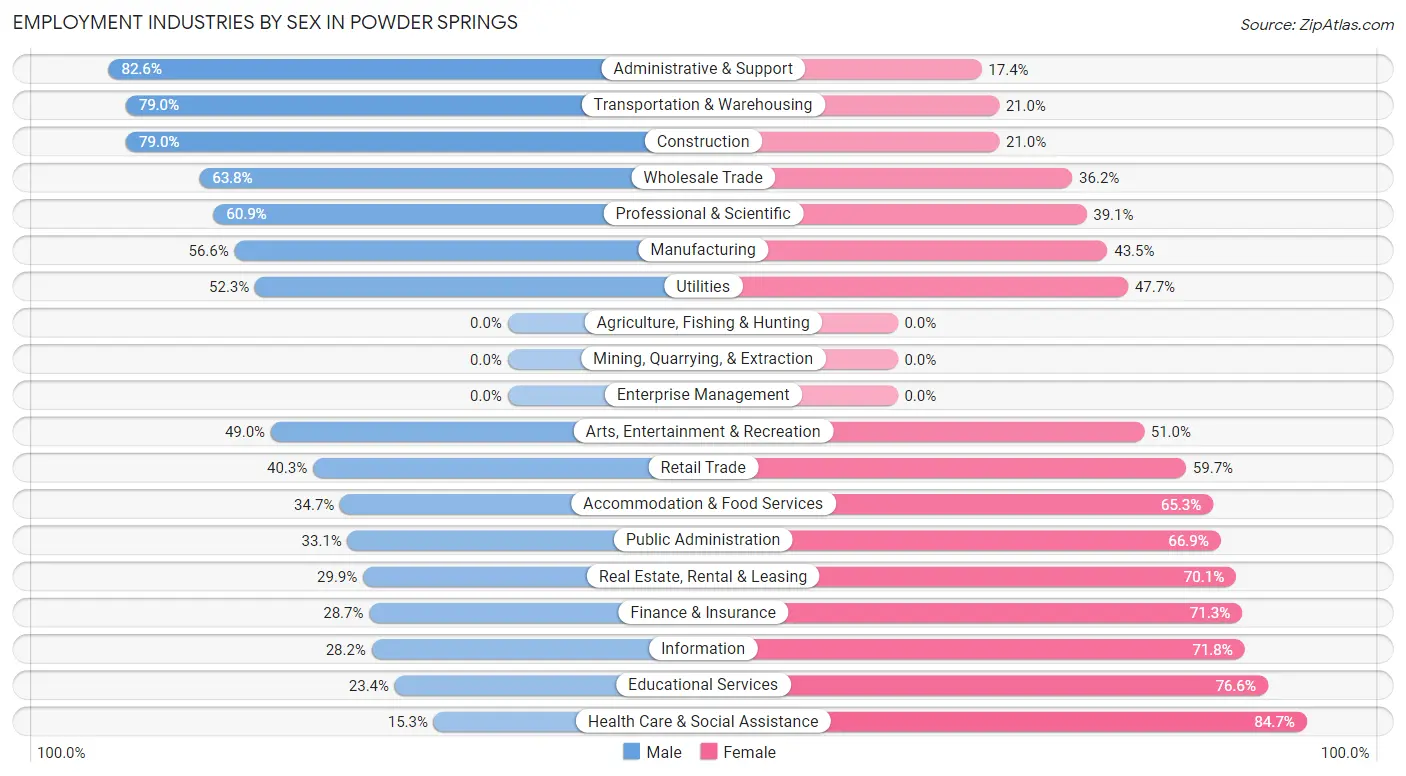
Employment Industries by Sex in Powder Springs
The Powder Springs industries that see more men than women are Administrative & Support (82.6%), Transportation & Warehousing (79.0%), and Construction (79.0%), whereas the industries that tend to have a higher number of women are Health Care & Social Assistance (84.7%), Educational Services (76.6%), and Information (71.8%).
| Industry | Male | Female |
| Agriculture, Fishing & Hunting | 0 (0.0%) | 0 (0.0%) |
| Mining, Quarrying, & Extraction | 0 (0.0%) | 0 (0.0%) |
| Construction | 537 (79.0%) | 143 (21.0%) |
| Manufacturing | 479 (56.6%) | 368 (43.4%) |
| Wholesale Trade | 270 (63.8%) | 153 (36.2%) |
| Retail Trade | 330 (40.3%) | 489 (59.7%) |
| Transportation & Warehousing | 645 (79.0%) | 171 (21.0%) |
| Utilities | 57 (52.3%) | 52 (47.7%) |
| Information | 87 (28.2%) | 222 (71.8%) |
| Finance & Insurance | 180 (28.7%) | 448 (71.3%) |
| Real Estate, Rental & Leasing | 44 (29.9%) | 103 (70.1%) |
| Professional & Scientific | 254 (60.9%) | 163 (39.1%) |
| Enterprise Management | 0 (0.0%) | 0 (0.0%) |
| Administrative & Support | 252 (82.6%) | 53 (17.4%) |
| Educational Services | 146 (23.4%) | 479 (76.6%) |
| Health Care & Social Assistance | 162 (15.3%) | 897 (84.7%) |
| Arts, Entertainment & Recreation | 74 (49.0%) | 77 (51.0%) |
| Accommodation & Food Services | 180 (34.7%) | 339 (65.3%) |
| Public Administration | 215 (33.1%) | 434 (66.9%) |
| Total | 4,205 (47.0%) | 4,734 (53.0%) |
Education in Powder Springs
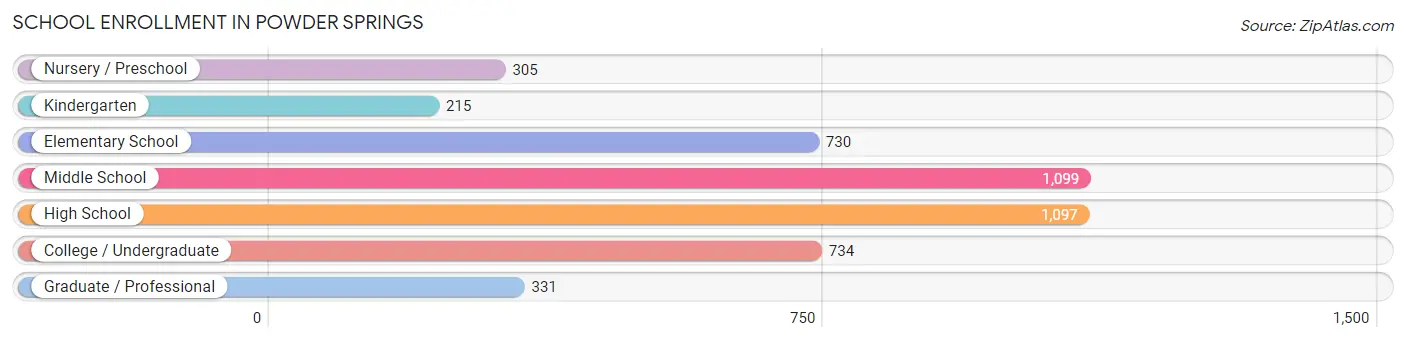
School Enrollment in Powder Springs
The most common levels of schooling among the 4,511 students in Powder Springs are middle school (1,099 | 24.4%), high school (1,097 | 24.3%), and college / undergraduate (734 | 16.3%).
| School Level | # Students | % Students |
| Nursery / Preschool | 305 | 6.8% |
| Kindergarten | 215 | 4.8% |
| Elementary School | 730 | 16.2% |
| Middle School | 1,099 | 24.4% |
| High School | 1,097 | 24.3% |
| College / Undergraduate | 734 | 16.3% |
| Graduate / Professional | 331 | 7.3% |
| Total | 4,511 | 100.0% |
School Enrollment by Age by Funding Source in Powder Springs
Out of a total of 4,511 students who are enrolled in schools in Powder Springs, 559 (12.4%) attend a private institution, while the remaining 3,952 (87.6%) are enrolled in public schools. The age group of 3 to 4 year olds has the highest likelihood of being enrolled in private schools, with 91 (41.9% in the age bracket) enrolled. Conversely, the age group of 15 to 17 year olds has the lowest likelihood of being enrolled in a private school, with 751 (97.7% in the age bracket) attending a public institution.
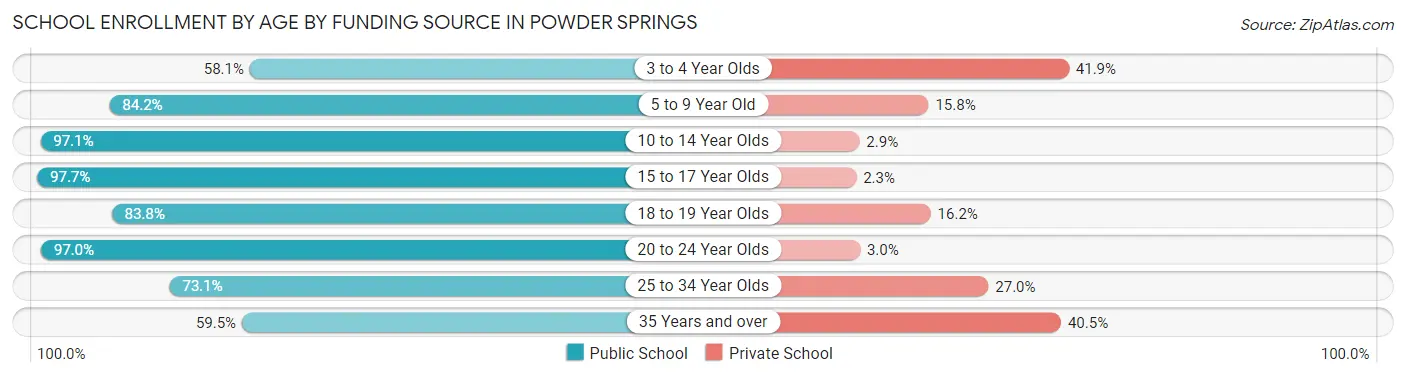
| Age Bracket | Public School | Private School |
| 3 to 4 Year Olds | 126 (58.1%) | 91 (41.9%) |
| 5 to 9 Year Old | 789 (84.2%) | 148 (15.8%) |
| 10 to 14 Year Olds | 1,292 (97.1%) | 39 (2.9%) |
| 15 to 17 Year Olds | 751 (97.7%) | 18 (2.3%) |
| 18 to 19 Year Olds | 181 (83.8%) | 35 (16.2%) |
| 20 to 24 Year Olds | 320 (97.0%) | 10 (3.0%) |
| 25 to 34 Year Olds | 366 (73.1%) | 135 (27.0%) |
| 35 Years and over | 125 (59.5%) | 85 (40.5%) |
| Total | 3,952 (87.6%) | 559 (12.4%) |
Educational Attainment by Field of Study in Powder Springs
Business (1,274 | 26.1%), science & technology (583 | 11.9%), education (484 | 9.9%), psychology (353 | 7.2%), and communications (329 | 6.7%) are the most common fields of study among 4,878 individuals in Powder Springs who have obtained a bachelor's degree or higher.
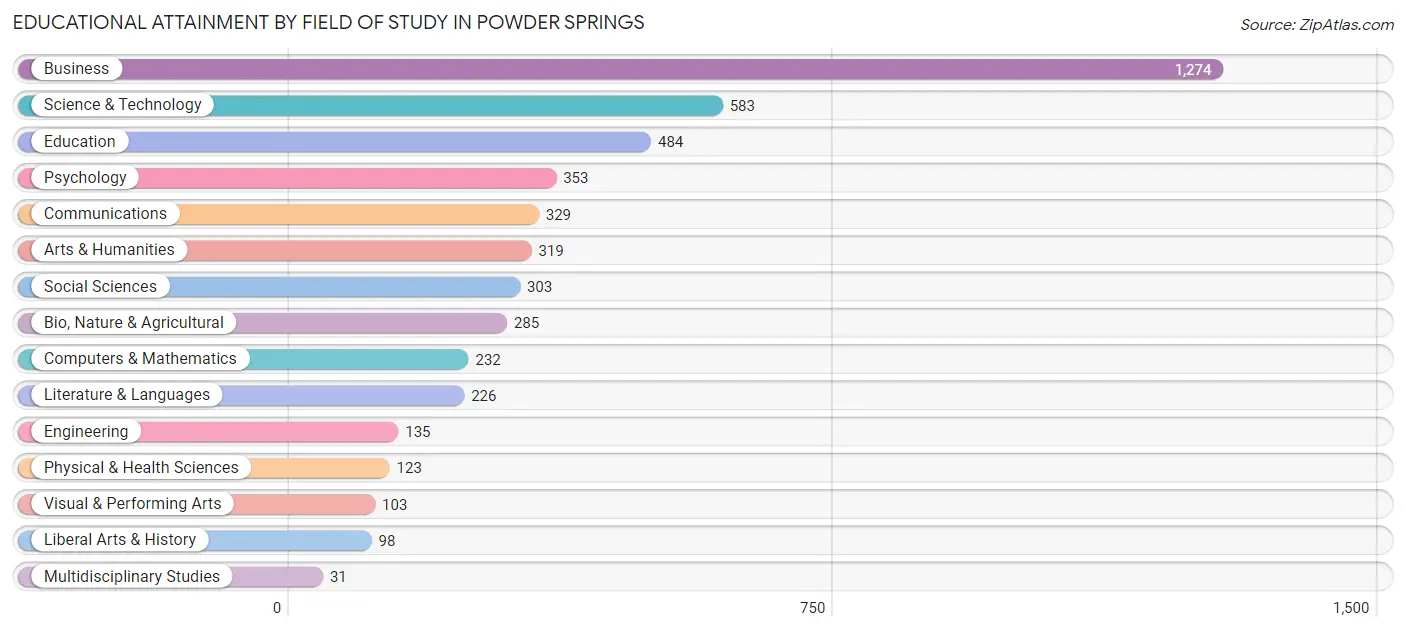
| Field of Study | # Graduates | % Graduates |
| Computers & Mathematics | 232 | 4.8% |
| Bio, Nature & Agricultural | 285 | 5.8% |
| Physical & Health Sciences | 123 | 2.5% |
| Psychology | 353 | 7.2% |
| Social Sciences | 303 | 6.2% |
| Engineering | 135 | 2.8% |
| Multidisciplinary Studies | 31 | 0.6% |
| Science & Technology | 583 | 11.9% |
| Business | 1,274 | 26.1% |
| Education | 484 | 9.9% |
| Literature & Languages | 226 | 4.6% |
| Liberal Arts & History | 98 | 2.0% |
| Visual & Performing Arts | 103 | 2.1% |
| Communications | 329 | 6.7% |
| Arts & Humanities | 319 | 6.5% |
| Total | 4,878 | 100.0% |
Transportation & Commute in Powder Springs
Vehicle Availability by Sex in Powder Springs
The most prevalent vehicle ownership categories in Powder Springs are males with 2 vehicles (1,470, accounting for 35.5%) and females with 2 vehicles (1,886, making up 31.6%).
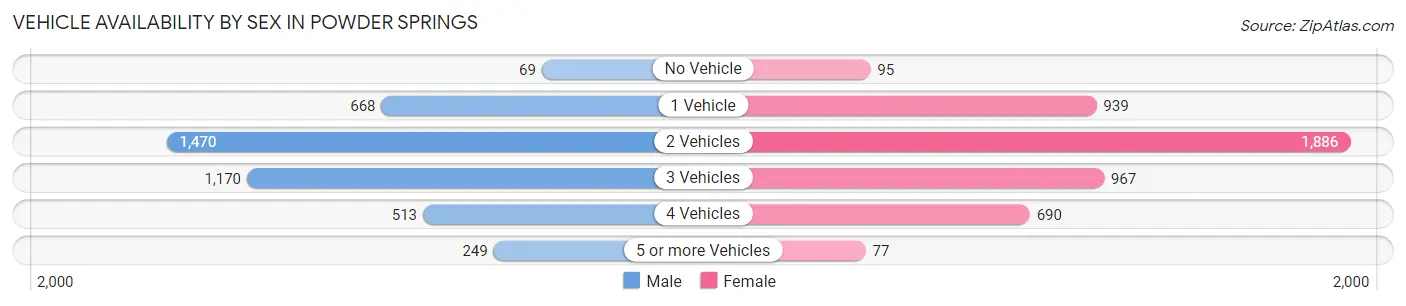
| Vehicles Available | Male | Female |
| No Vehicle | 69 (1.7%) | 95 (2.0%) |
| 1 Vehicle | 668 (16.1%) | 939 (20.2%) |
| 2 Vehicles | 1,470 (35.5%) | 1,886 (40.5%) |
| 3 Vehicles | 1,170 (28.3%) | 967 (20.8%) |
| 4 Vehicles | 513 (12.4%) | 690 (14.8%) |
| 5 or more Vehicles | 249 (6.0%) | 77 (1.7%) |
| Total | 4,139 (100.0%) | 4,654 (100.0%) |
Commute Time in Powder Springs
The most frequently occuring commute durations in Powder Springs are 30 to 34 minutes (1,446 commuters, 19.2%), 45 to 59 minutes (1,343 commuters, 17.8%), and 60 to 89 minutes (1,052 commuters, 14.0%).
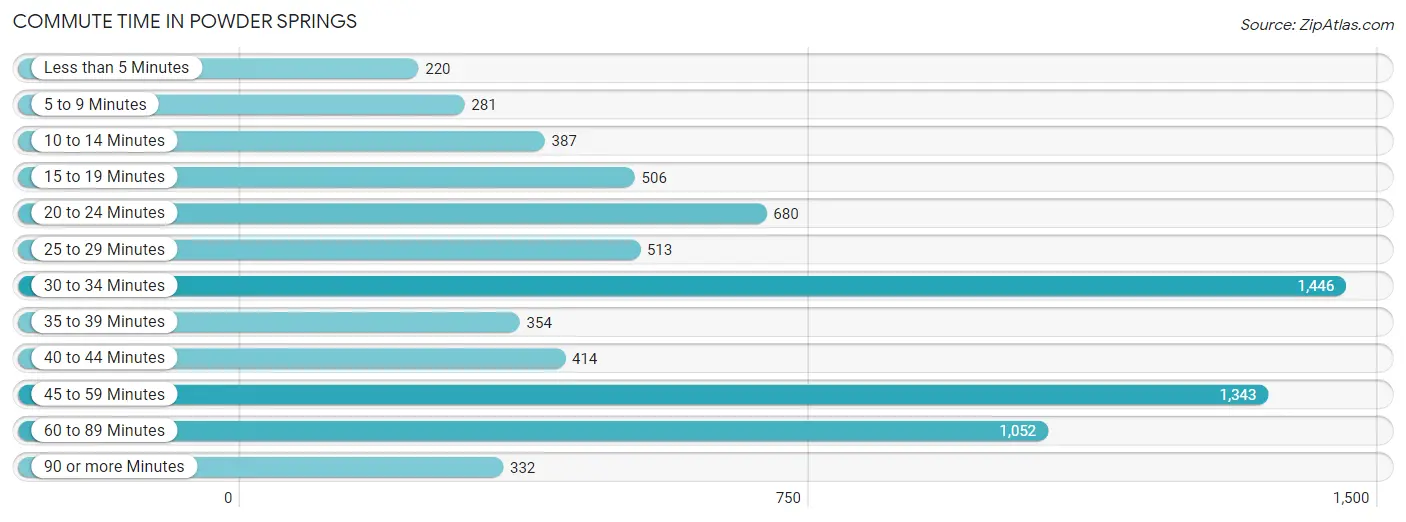
| Commute Time | # Commuters | % Commuters |
| Less than 5 Minutes | 220 | 2.9% |
| 5 to 9 Minutes | 281 | 3.7% |
| 10 to 14 Minutes | 387 | 5.1% |
| 15 to 19 Minutes | 506 | 6.7% |
| 20 to 24 Minutes | 680 | 9.0% |
| 25 to 29 Minutes | 513 | 6.8% |
| 30 to 34 Minutes | 1,446 | 19.2% |
| 35 to 39 Minutes | 354 | 4.7% |
| 40 to 44 Minutes | 414 | 5.5% |
| 45 to 59 Minutes | 1,343 | 17.8% |
| 60 to 89 Minutes | 1,052 | 14.0% |
| 90 or more Minutes | 332 | 4.4% |
Commute Time by Sex in Powder Springs
The most common commute times in Powder Springs are 30 to 34 minutes (859 commuters, 23.7%) for males and 45 to 59 minutes (1,047 commuters, 26.8%) for females.
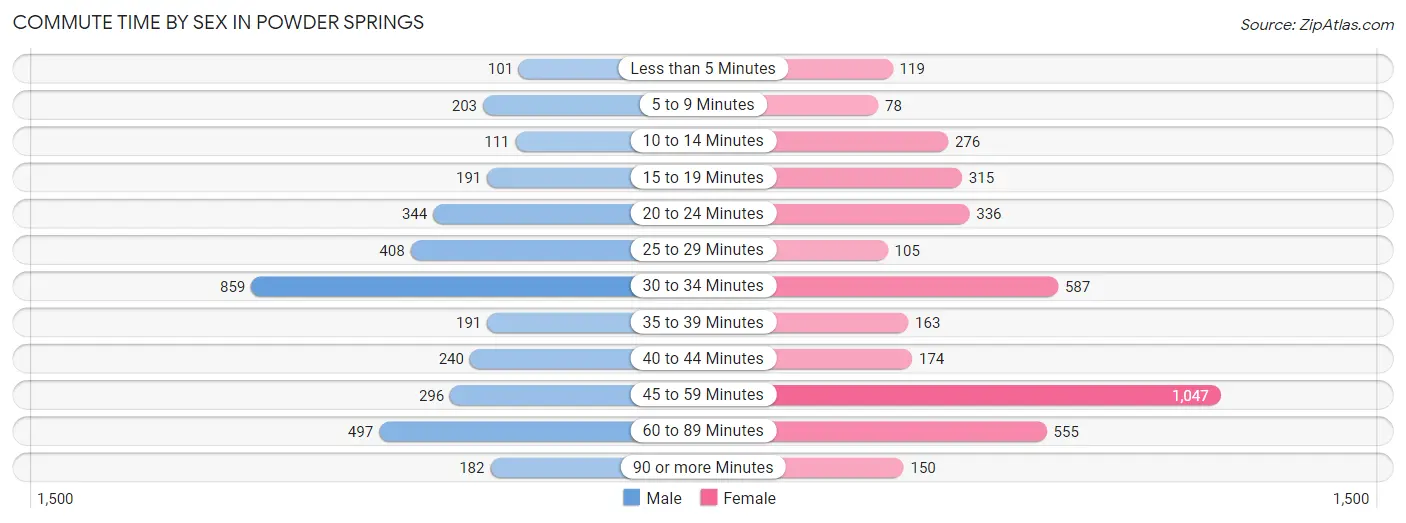
| Commute Time | Male | Female |
| Less than 5 Minutes | 101 (2.8%) | 119 (3.0%) |
| 5 to 9 Minutes | 203 (5.6%) | 78 (2.0%) |
| 10 to 14 Minutes | 111 (3.1%) | 276 (7.1%) |
| 15 to 19 Minutes | 191 (5.3%) | 315 (8.1%) |
| 20 to 24 Minutes | 344 (9.5%) | 336 (8.6%) |
| 25 to 29 Minutes | 408 (11.3%) | 105 (2.7%) |
| 30 to 34 Minutes | 859 (23.7%) | 587 (15.0%) |
| 35 to 39 Minutes | 191 (5.3%) | 163 (4.2%) |
| 40 to 44 Minutes | 240 (6.6%) | 174 (4.5%) |
| 45 to 59 Minutes | 296 (8.2%) | 1,047 (26.8%) |
| 60 to 89 Minutes | 497 (13.7%) | 555 (14.2%) |
| 90 or more Minutes | 182 (5.0%) | 150 (3.8%) |
Time of Departure to Work by Sex in Powder Springs
The most frequent times of departure to work in Powder Springs are 7:00 AM to 7:29 AM (463, 12.8%) for males and 7:00 AM to 7:29 AM (704, 18.0%) for females.
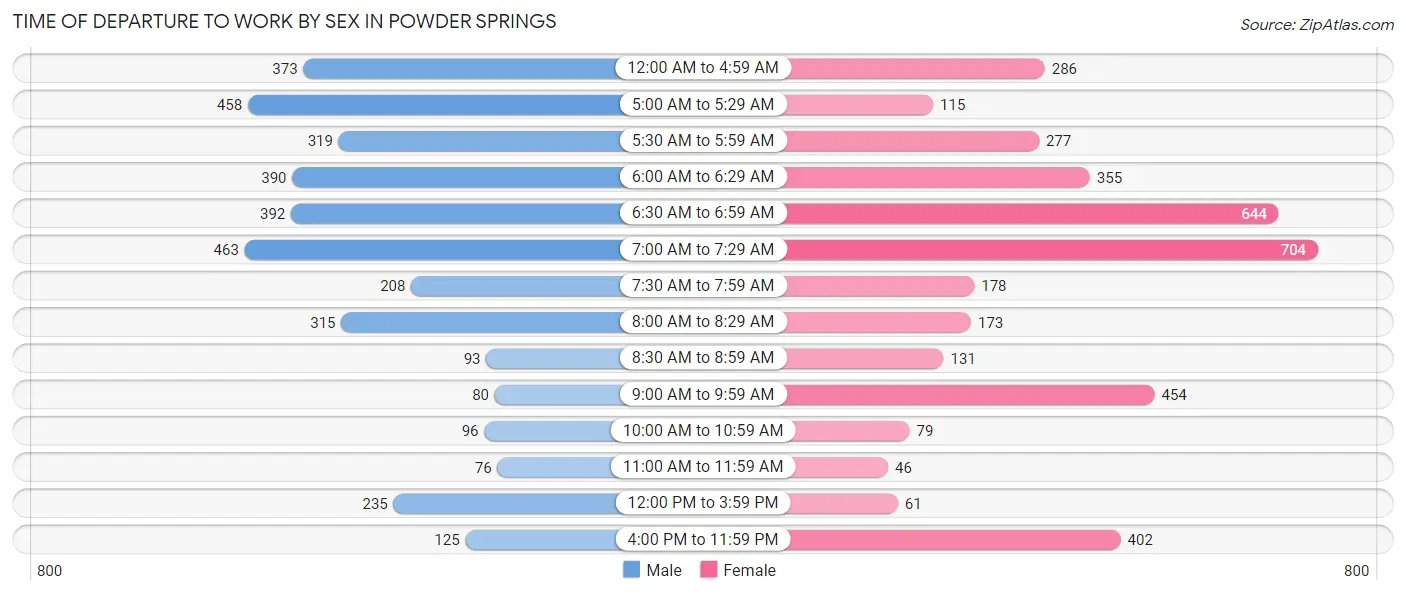
| Time of Departure | Male | Female |
| 12:00 AM to 4:59 AM | 373 (10.3%) | 286 (7.3%) |
| 5:00 AM to 5:29 AM | 458 (12.6%) | 115 (2.9%) |
| 5:30 AM to 5:59 AM | 319 (8.8%) | 277 (7.1%) |
| 6:00 AM to 6:29 AM | 390 (10.8%) | 355 (9.1%) |
| 6:30 AM to 6:59 AM | 392 (10.8%) | 644 (16.5%) |
| 7:00 AM to 7:29 AM | 463 (12.8%) | 704 (18.0%) |
| 7:30 AM to 7:59 AM | 208 (5.7%) | 178 (4.6%) |
| 8:00 AM to 8:29 AM | 315 (8.7%) | 173 (4.4%) |
| 8:30 AM to 8:59 AM | 93 (2.6%) | 131 (3.4%) |
| 9:00 AM to 9:59 AM | 80 (2.2%) | 454 (11.6%) |
| 10:00 AM to 10:59 AM | 96 (2.6%) | 79 (2.0%) |
| 11:00 AM to 11:59 AM | 76 (2.1%) | 46 (1.2%) |
| 12:00 PM to 3:59 PM | 235 (6.5%) | 61 (1.6%) |
| 4:00 PM to 11:59 PM | 125 (3.5%) | 402 (10.3%) |
| Total | 3,623 (100.0%) | 3,905 (100.0%) |
Housing Occupancy in Powder Springs
Occupancy by Ownership in Powder Springs
Of the total 6,082 dwellings in Powder Springs, owner-occupied units account for 4,796 (78.9%), while renter-occupied units make up 1,286 (21.1%).
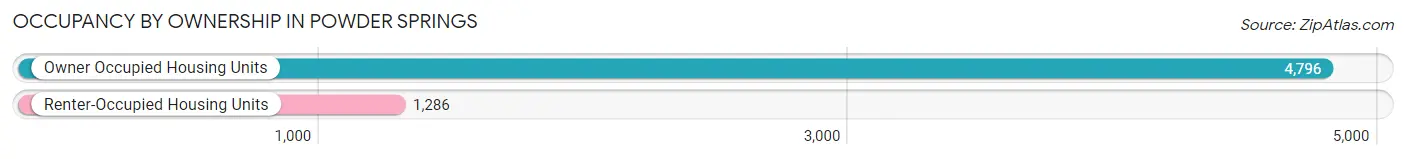
| Occupancy | # Housing Units | % Housing Units |
| Owner Occupied Housing Units | 4,796 | 78.9% |
| Renter-Occupied Housing Units | 1,286 | 21.1% |
| Total Occupied Housing Units | 6,082 | 100.0% |
Occupancy by Household Size in Powder Springs
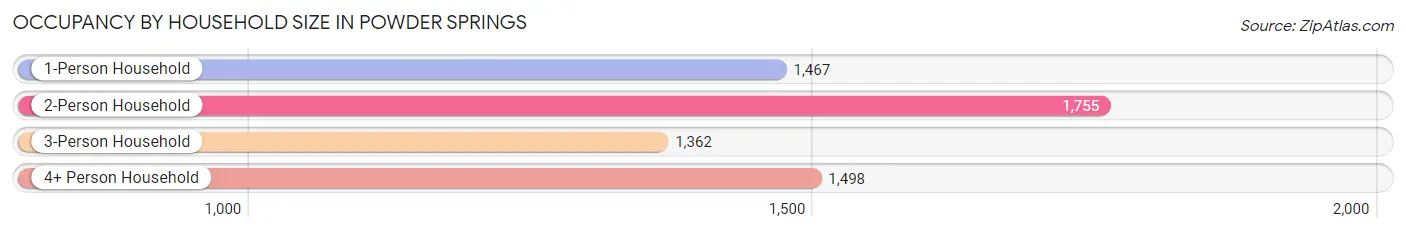
| Household Size | # Housing Units | % Housing Units |
| 1-Person Household | 1,467 | 24.1% |
| 2-Person Household | 1,755 | 28.9% |
| 3-Person Household | 1,362 | 22.4% |
| 4+ Person Household | 1,498 | 24.6% |
| Total Housing Units | 6,082 | 100.0% |
Occupancy by Ownership by Household Size in Powder Springs
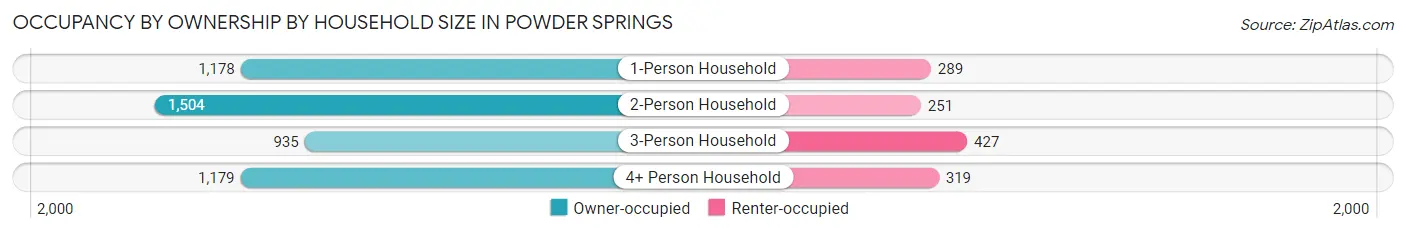
| Household Size | Owner-occupied | Renter-occupied |
| 1-Person Household | 1,178 (80.3%) | 289 (19.7%) |
| 2-Person Household | 1,504 (85.7%) | 251 (14.3%) |
| 3-Person Household | 935 (68.6%) | 427 (31.4%) |
| 4+ Person Household | 1,179 (78.7%) | 319 (21.3%) |
| Total Housing Units | 4,796 (78.9%) | 1,286 (21.1%) |
Occupancy by Educational Attainment in Powder Springs
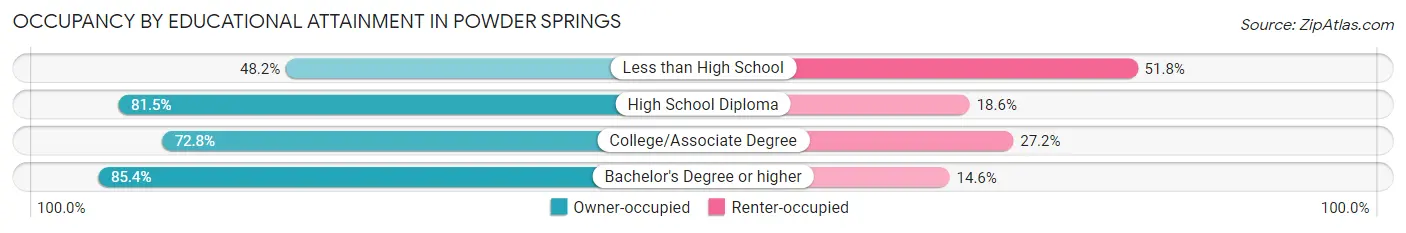
| Household Size | Owner-occupied | Renter-occupied |
| Less than High School | 157 (48.2%) | 169 (51.8%) |
| High School Diploma | 1,124 (81.5%) | 256 (18.5%) |
| College/Associate Degree | 1,291 (72.8%) | 482 (27.2%) |
| Bachelor's Degree or higher | 2,224 (85.4%) | 379 (14.6%) |
Occupancy by Age of Householder in Powder Springs
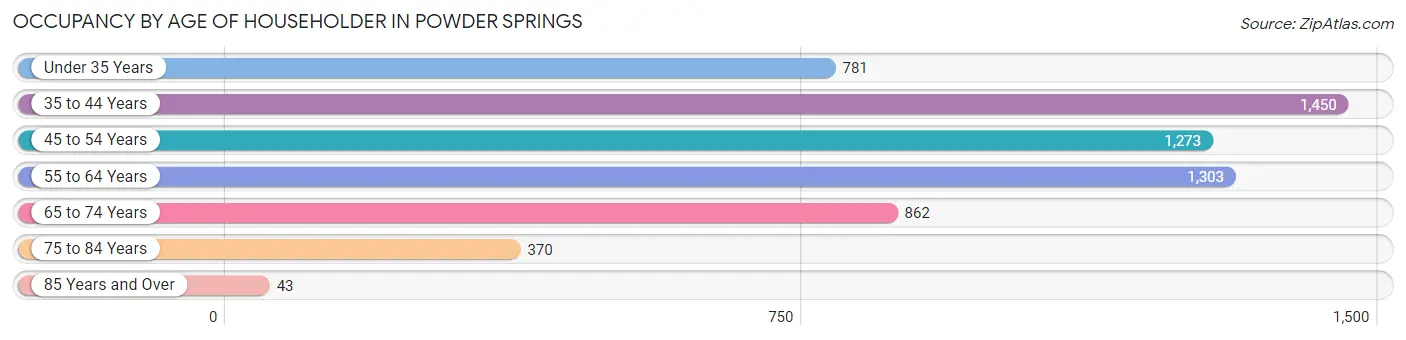
| Age Bracket | # Households | % Households |
| Under 35 Years | 781 | 12.8% |
| 35 to 44 Years | 1,450 | 23.8% |
| 45 to 54 Years | 1,273 | 20.9% |
| 55 to 64 Years | 1,303 | 21.4% |
| 65 to 74 Years | 862 | 14.2% |
| 75 to 84 Years | 370 | 6.1% |
| 85 Years and Over | 43 | 0.7% |
| Total | 6,082 | 100.0% |
Housing Finances in Powder Springs
Median Income by Occupancy in Powder Springs
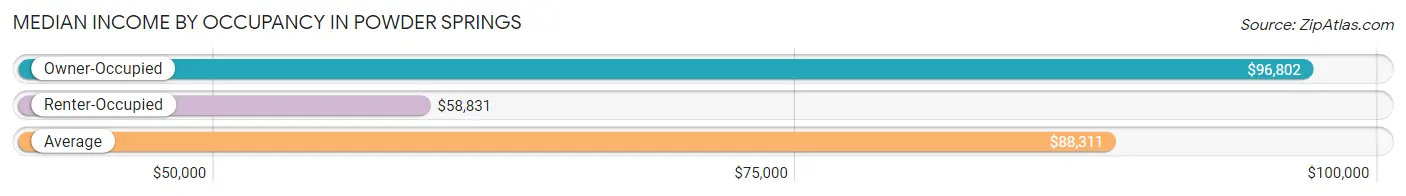
| Occupancy Type | # Households | Median Income |
| Owner-Occupied | 4,796 (78.9%) | $96,802 |
| Renter-Occupied | 1,286 (21.1%) | $58,831 |
| Average | 6,082 (100.0%) | $88,311 |
Occupancy by Householder Income Bracket in Powder Springs
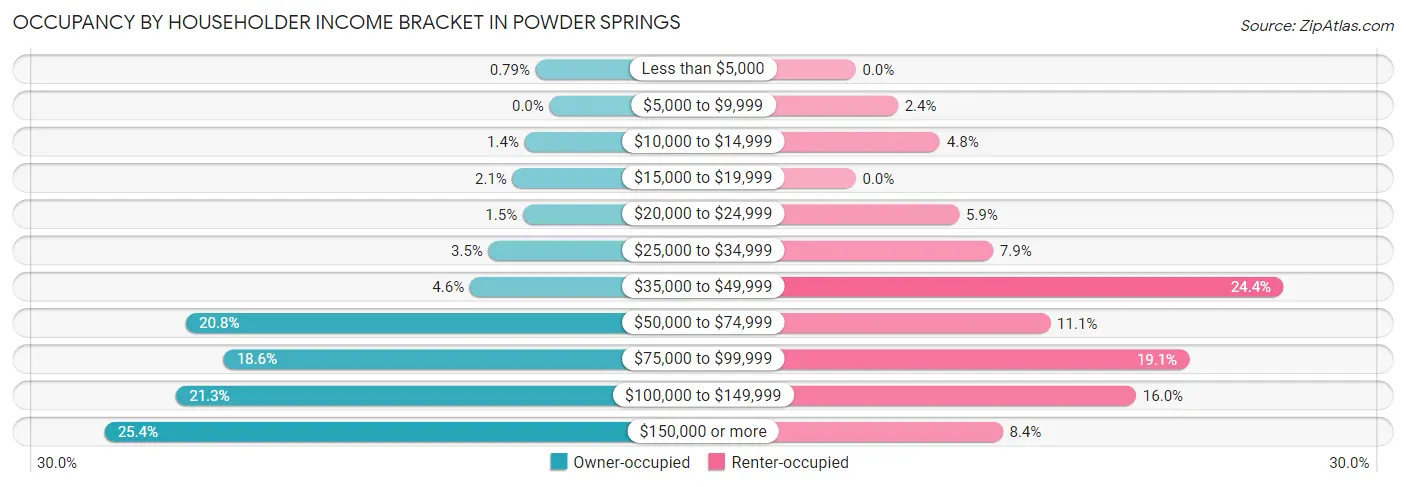
| Income Bracket | Owner-occupied | Renter-occupied |
| Less than $5,000 | 38 (0.8%) | 0 (0.0%) |
| $5,000 to $9,999 | 0 (0.0%) | 31 (2.4%) |
| $10,000 to $14,999 | 68 (1.4%) | 62 (4.8%) |
| $15,000 to $19,999 | 101 (2.1%) | 0 (0.0%) |
| $20,000 to $24,999 | 73 (1.5%) | 76 (5.9%) |
| $25,000 to $34,999 | 167 (3.5%) | 101 (7.9%) |
| $35,000 to $49,999 | 218 (4.5%) | 314 (24.4%) |
| $50,000 to $74,999 | 996 (20.8%) | 143 (11.1%) |
| $75,000 to $99,999 | 893 (18.6%) | 245 (19.1%) |
| $100,000 to $149,999 | 1,023 (21.3%) | 206 (16.0%) |
| $150,000 or more | 1,219 (25.4%) | 108 (8.4%) |
| Total | 4,796 (100.0%) | 1,286 (100.0%) |
Monthly Housing Cost Tiers in Powder Springs
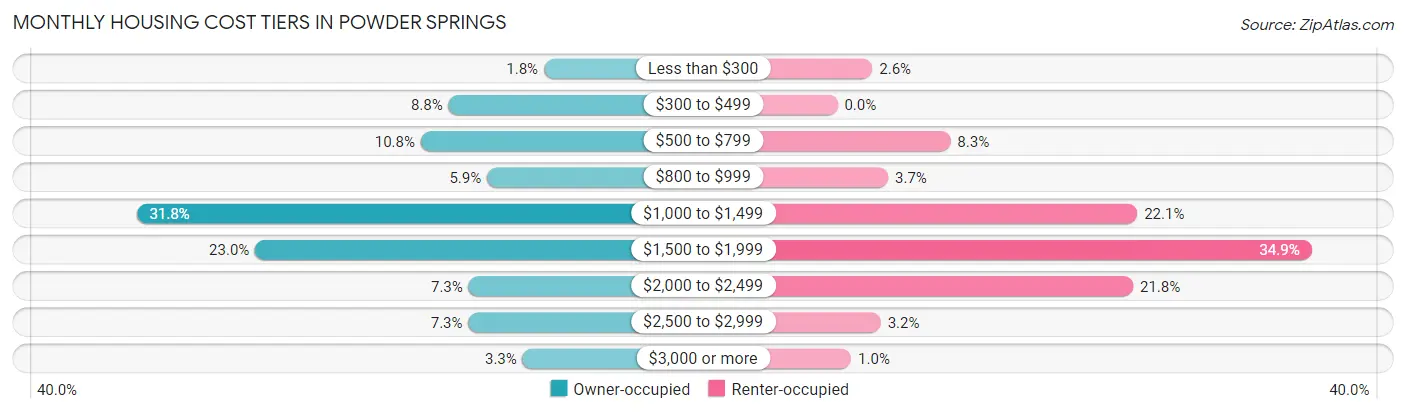
| Monthly Cost | Owner-occupied | Renter-occupied |
| Less than $300 | 84 (1.8%) | 33 (2.6%) |
| $300 to $499 | 421 (8.8%) | 0 (0.0%) |
| $500 to $799 | 519 (10.8%) | 107 (8.3%) |
| $800 to $999 | 285 (5.9%) | 48 (3.7%) |
| $1,000 to $1,499 | 1,523 (31.8%) | 284 (22.1%) |
| $1,500 to $1,999 | 1,104 (23.0%) | 449 (34.9%) |
| $2,000 to $2,499 | 350 (7.3%) | 280 (21.8%) |
| $2,500 to $2,999 | 351 (7.3%) | 41 (3.2%) |
| $3,000 or more | 159 (3.3%) | 13 (1.0%) |
| Total | 4,796 (100.0%) | 1,286 (100.0%) |
Physical Housing Characteristics in Powder Springs
Housing Structures in Powder Springs
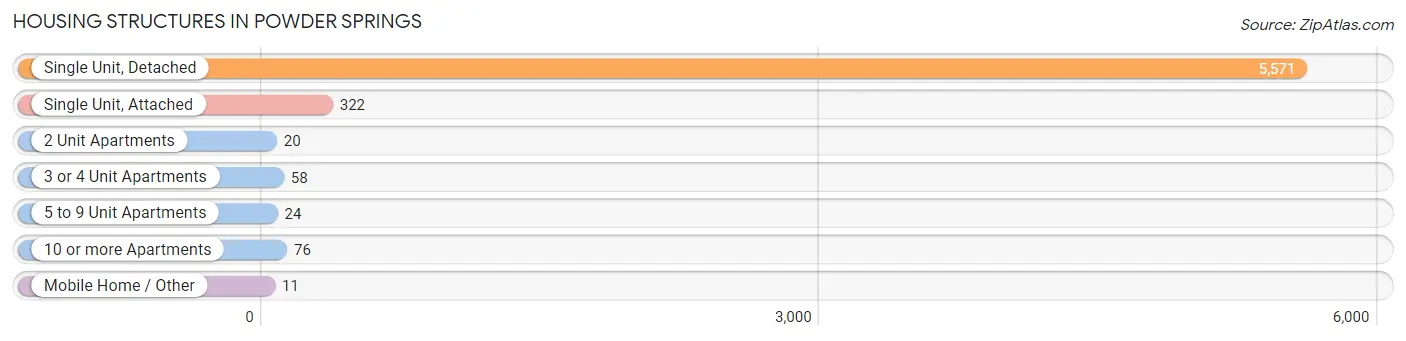
| Structure Type | # Housing Units | % Housing Units |
| Single Unit, Detached | 5,571 | 91.6% |
| Single Unit, Attached | 322 | 5.3% |
| 2 Unit Apartments | 20 | 0.3% |
| 3 or 4 Unit Apartments | 58 | 0.9% |
| 5 to 9 Unit Apartments | 24 | 0.4% |
| 10 or more Apartments | 76 | 1.3% |
| Mobile Home / Other | 11 | 0.2% |
| Total | 6,082 | 100.0% |
Housing Structures by Occupancy in Powder Springs
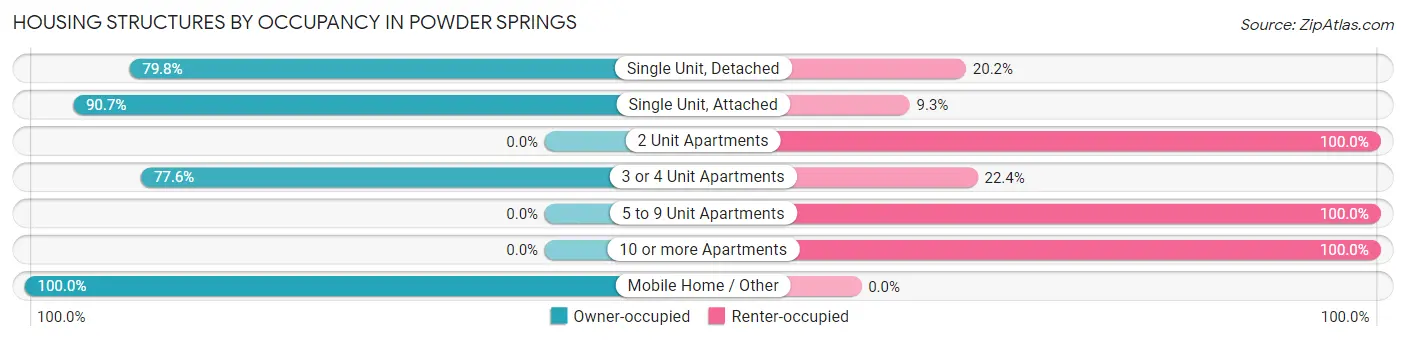
| Structure Type | Owner-occupied | Renter-occupied |
| Single Unit, Detached | 4,448 (79.8%) | 1,123 (20.2%) |
| Single Unit, Attached | 292 (90.7%) | 30 (9.3%) |
| 2 Unit Apartments | 0 (0.0%) | 20 (100.0%) |
| 3 or 4 Unit Apartments | 45 (77.6%) | 13 (22.4%) |
| 5 to 9 Unit Apartments | 0 (0.0%) | 24 (100.0%) |
| 10 or more Apartments | 0 (0.0%) | 76 (100.0%) |
| Mobile Home / Other | 11 (100.0%) | 0 (0.0%) |
| Total | 4,796 (78.9%) | 1,286 (21.1%) |
Housing Structures by Number of Rooms in Powder Springs
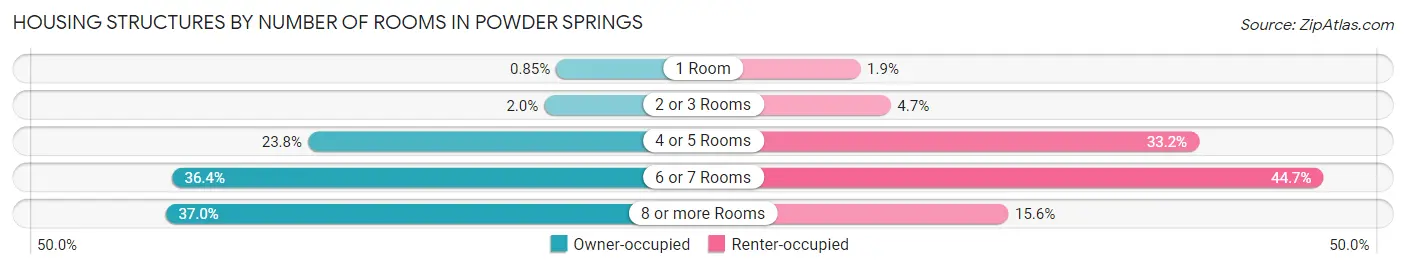
| Number of Rooms | Owner-occupied | Renter-occupied |
| 1 Room | 41 (0.9%) | 24 (1.9%) |
| 2 or 3 Rooms | 94 (2.0%) | 60 (4.7%) |
| 4 or 5 Rooms | 1,142 (23.8%) | 427 (33.2%) |
| 6 or 7 Rooms | 1,746 (36.4%) | 575 (44.7%) |
| 8 or more Rooms | 1,773 (37.0%) | 200 (15.5%) |
| Total | 4,796 (100.0%) | 1,286 (100.0%) |
Housing Structure by Heating Type in Powder Springs
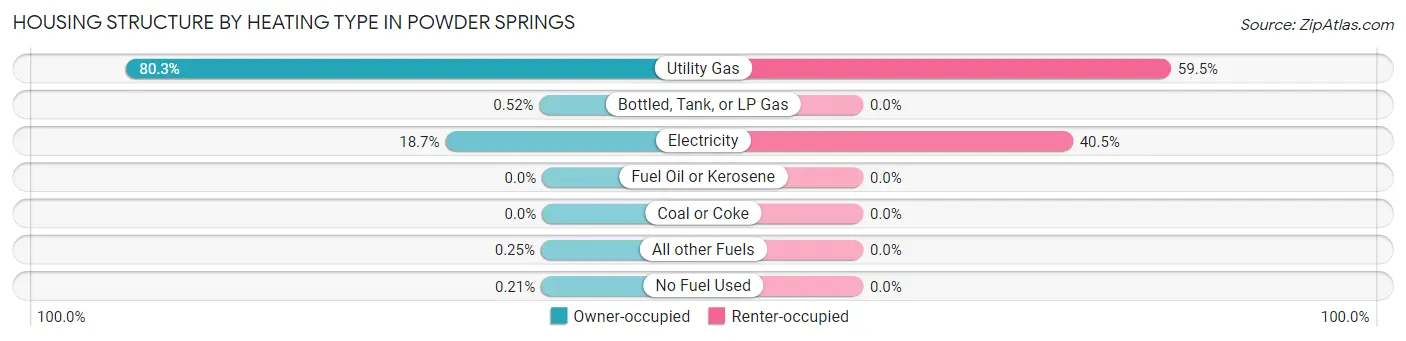
| Heating Type | Owner-occupied | Renter-occupied |
| Utility Gas | 3,852 (80.3%) | 765 (59.5%) |
| Bottled, Tank, or LP Gas | 25 (0.5%) | 0 (0.0%) |
| Electricity | 897 (18.7%) | 521 (40.5%) |
| Fuel Oil or Kerosene | 0 (0.0%) | 0 (0.0%) |
| Coal or Coke | 0 (0.0%) | 0 (0.0%) |
| All other Fuels | 12 (0.3%) | 0 (0.0%) |
| No Fuel Used | 10 (0.2%) | 0 (0.0%) |
| Total | 4,796 (100.0%) | 1,286 (100.0%) |
Household Vehicle Usage in Powder Springs
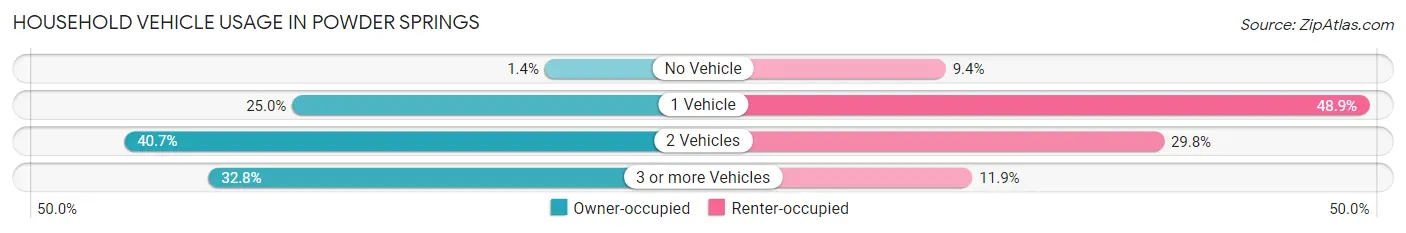
| Vehicles per Household | Owner-occupied | Renter-occupied |
| No Vehicle | 69 (1.4%) | 121 (9.4%) |
| 1 Vehicle | 1,200 (25.0%) | 629 (48.9%) |
| 2 Vehicles | 1,952 (40.7%) | 383 (29.8%) |
| 3 or more Vehicles | 1,575 (32.8%) | 153 (11.9%) |
| Total | 4,796 (100.0%) | 1,286 (100.0%) |
Real Estate & Mortgages in Powder Springs
Real Estate and Mortgage Overview in Powder Springs
| Characteristic | Without Mortgage | With Mortgage |
| Housing Units | 987 | 3,809 |
| Median Property Value | $203,700 | $252,600 |
| Median Household Income | $70,789 | $1,136 |
| Monthly Housing Costs | $493 | $159 |
| Real Estate Taxes | $1,482 | $56 |
Property Value by Mortgage Status in Powder Springs
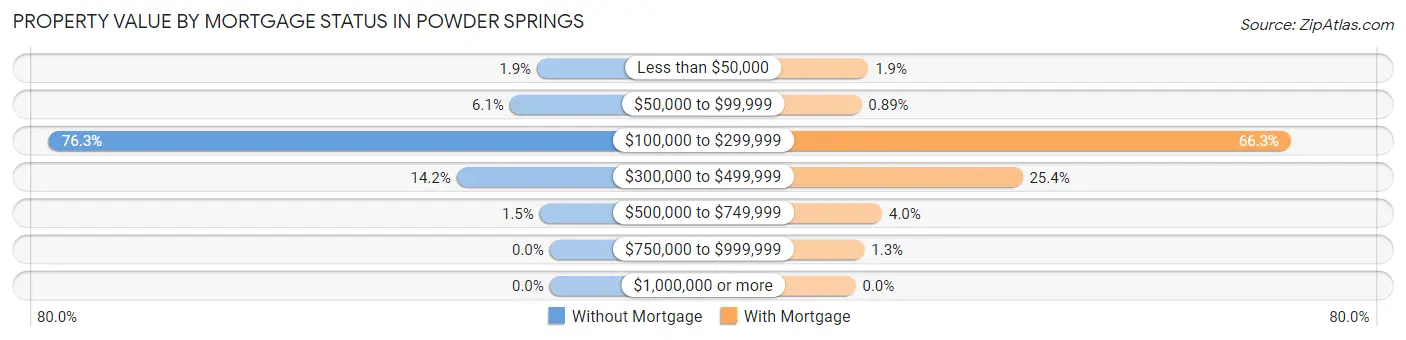
| Property Value | Without Mortgage | With Mortgage |
| Less than $50,000 | 19 (1.9%) | 74 (1.9%) |
| $50,000 to $99,999 | 60 (6.1%) | 34 (0.9%) |
| $100,000 to $299,999 | 753 (76.3%) | 2,527 (66.3%) |
| $300,000 to $499,999 | 140 (14.2%) | 969 (25.4%) |
| $500,000 to $749,999 | 15 (1.5%) | 154 (4.0%) |
| $750,000 to $999,999 | 0 (0.0%) | 51 (1.3%) |
| $1,000,000 or more | 0 (0.0%) | 0 (0.0%) |
| Total | 987 (100.0%) | 3,809 (100.0%) |
Household Income by Mortgage Status in Powder Springs
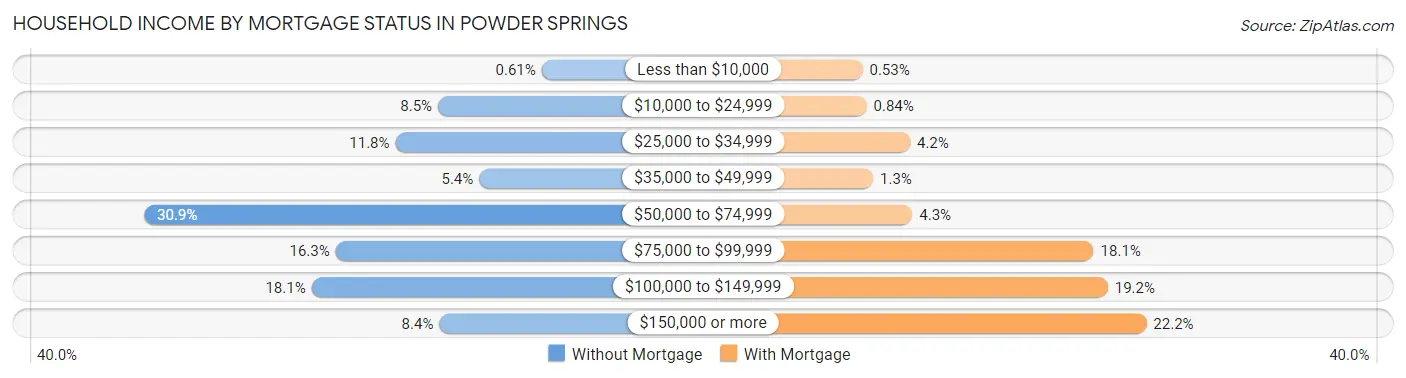
| Household Income | Without Mortgage | With Mortgage |
| Less than $10,000 | 6 (0.6%) | 20 (0.5%) |
| $10,000 to $24,999 | 84 (8.5%) | 32 (0.8%) |
| $25,000 to $34,999 | 116 (11.7%) | 158 (4.2%) |
| $35,000 to $49,999 | 53 (5.4%) | 51 (1.3%) |
| $50,000 to $74,999 | 305 (30.9%) | 165 (4.3%) |
| $75,000 to $99,999 | 161 (16.3%) | 691 (18.1%) |
| $100,000 to $149,999 | 179 (18.1%) | 732 (19.2%) |
| $150,000 or more | 83 (8.4%) | 844 (22.2%) |
| Total | 987 (100.0%) | 3,809 (100.0%) |
Property Value to Household Income Ratio in Powder Springs
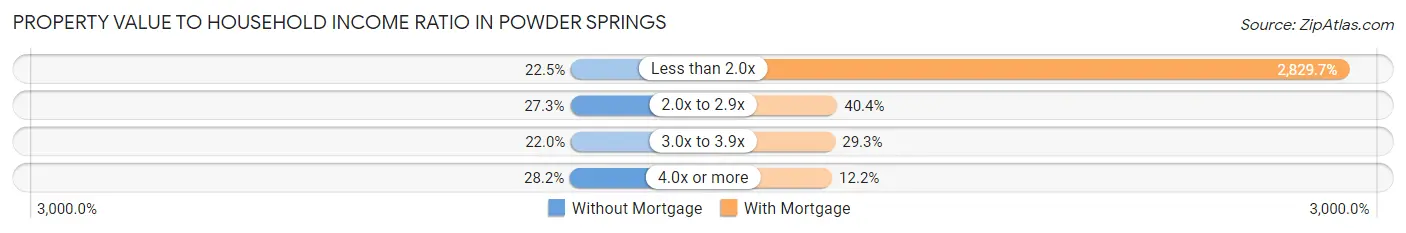
| Value-to-Income Ratio | Without Mortgage | With Mortgage |
| Less than 2.0x | 222 (22.5%) | 107,784 (2,829.7%) |
| 2.0x to 2.9x | 269 (27.3%) | 1,538 (40.4%) |
| 3.0x to 3.9x | 217 (22.0%) | 1,116 (29.3%) |
| 4.0x or more | 278 (28.2%) | 466 (12.2%) |
| Total | 987 (100.0%) | 3,809 (100.0%) |
Real Estate Taxes by Mortgage Status in Powder Springs
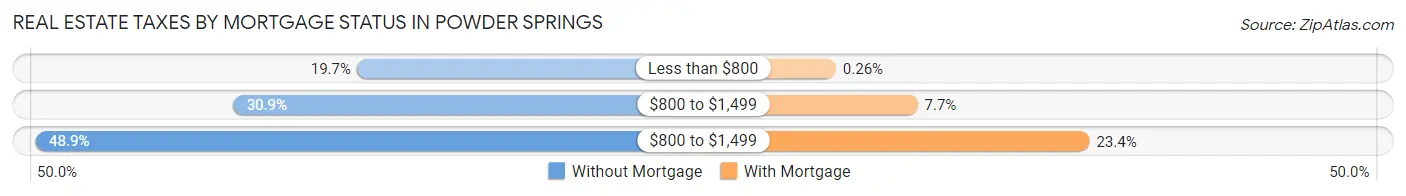
| Property Taxes | Without Mortgage | With Mortgage |
| Less than $800 | 194 (19.7%) | 10 (0.3%) |
| $800 to $1,499 | 305 (30.9%) | 294 (7.7%) |
| $800 to $1,499 | 483 (48.9%) | 892 (23.4%) |
| Total | 987 (100.0%) | 3,809 (100.0%) |
Health & Disability in Powder Springs
Health Insurance Coverage by Age in Powder Springs
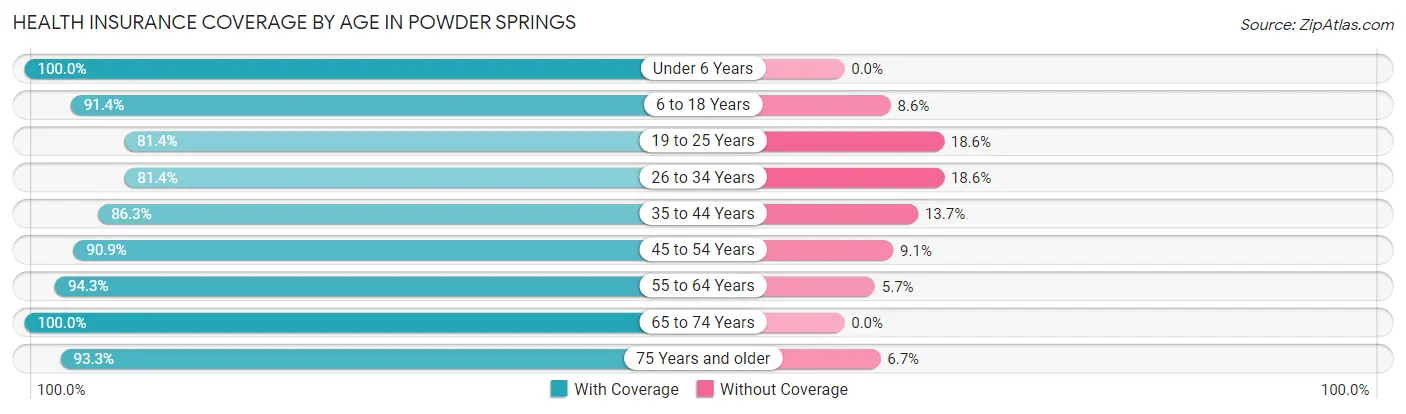
| Age Bracket | With Coverage | Without Coverage |
| Under 6 Years | 1,146 (100.0%) | 0 (0.0%) |
| 6 to 18 Years | 2,870 (91.4%) | 271 (8.6%) |
| 19 to 25 Years | 1,299 (81.4%) | 296 (18.6%) |
| 26 to 34 Years | 1,432 (81.4%) | 327 (18.6%) |
| 35 to 44 Years | 2,179 (86.3%) | 347 (13.7%) |
| 45 to 54 Years | 2,104 (90.9%) | 211 (9.1%) |
| 55 to 64 Years | 1,952 (94.3%) | 118 (5.7%) |
| 65 to 74 Years | 1,392 (100.0%) | 0 (0.0%) |
| 75 Years and older | 679 (93.3%) | 49 (6.7%) |
| Total | 15,053 (90.3%) | 1,619 (9.7%) |
Health Insurance Coverage by Citizenship Status in Powder Springs
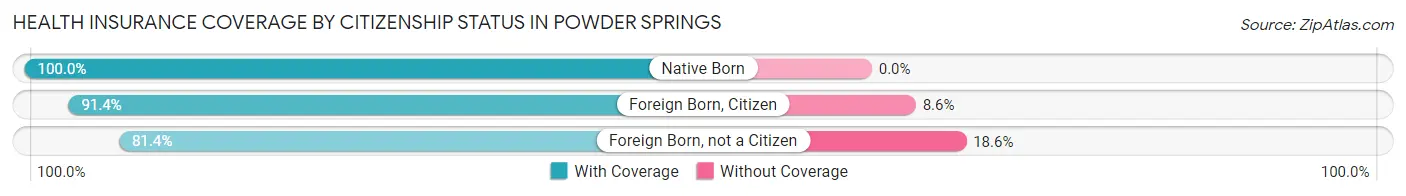
| Citizenship Status | With Coverage | Without Coverage |
| Native Born | 1,146 (100.0%) | 0 (0.0%) |
| Foreign Born, Citizen | 2,870 (91.4%) | 271 (8.6%) |
| Foreign Born, not a Citizen | 1,299 (81.4%) | 296 (18.6%) |
Health Insurance Coverage by Household Income in Powder Springs
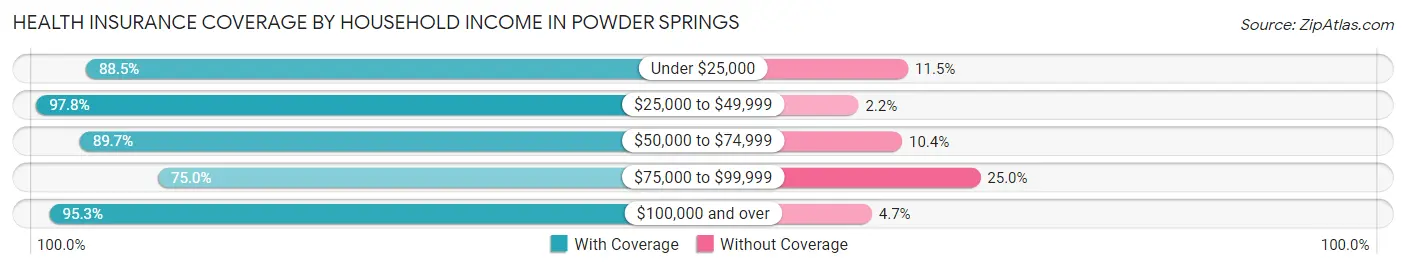
| Household Income | With Coverage | Without Coverage |
| Under $25,000 | 685 (88.5%) | 89 (11.5%) |
| $25,000 to $49,999 | 1,880 (97.8%) | 42 (2.2%) |
| $50,000 to $74,999 | 2,555 (89.6%) | 295 (10.3%) |
| $75,000 to $99,999 | 2,469 (75.0%) | 824 (25.0%) |
| $100,000 and over | 7,454 (95.3%) | 367 (4.7%) |
Public vs Private Health Insurance Coverage by Age in Powder Springs
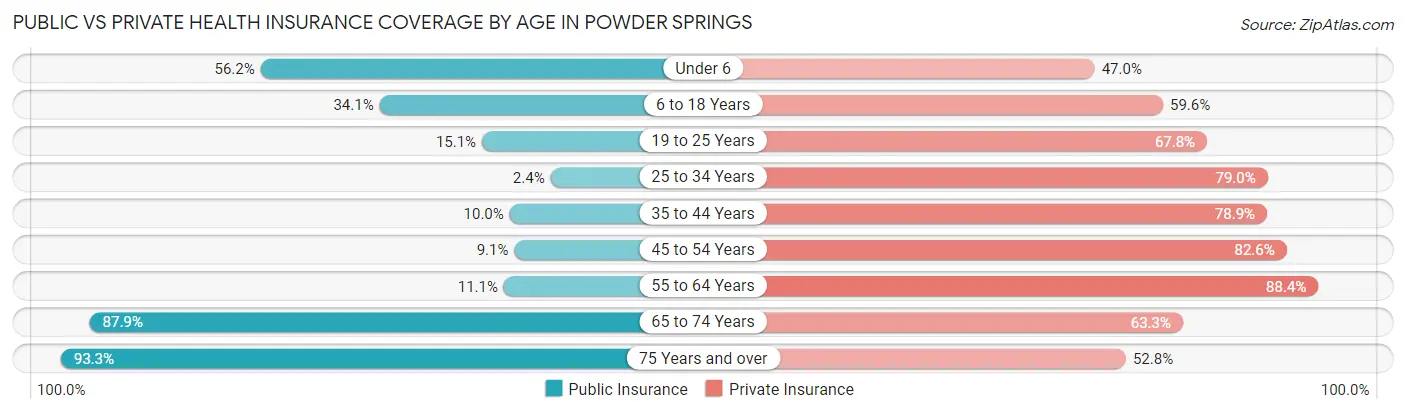
| Age Bracket | Public Insurance | Private Insurance |
| Under 6 | 644 (56.2%) | 538 (46.9%) |
| 6 to 18 Years | 1,072 (34.1%) | 1,873 (59.6%) |
| 19 to 25 Years | 241 (15.1%) | 1,081 (67.8%) |
| 25 to 34 Years | 42 (2.4%) | 1,390 (79.0%) |
| 35 to 44 Years | 252 (10.0%) | 1,993 (78.9%) |
| 45 to 54 Years | 211 (9.1%) | 1,911 (82.6%) |
| 55 to 64 Years | 229 (11.1%) | 1,830 (88.4%) |
| 65 to 74 Years | 1,224 (87.9%) | 881 (63.3%) |
| 75 Years and over | 679 (93.3%) | 384 (52.7%) |
| Total | 4,594 (27.6%) | 11,881 (71.3%) |
Disability Status by Sex by Age in Powder Springs
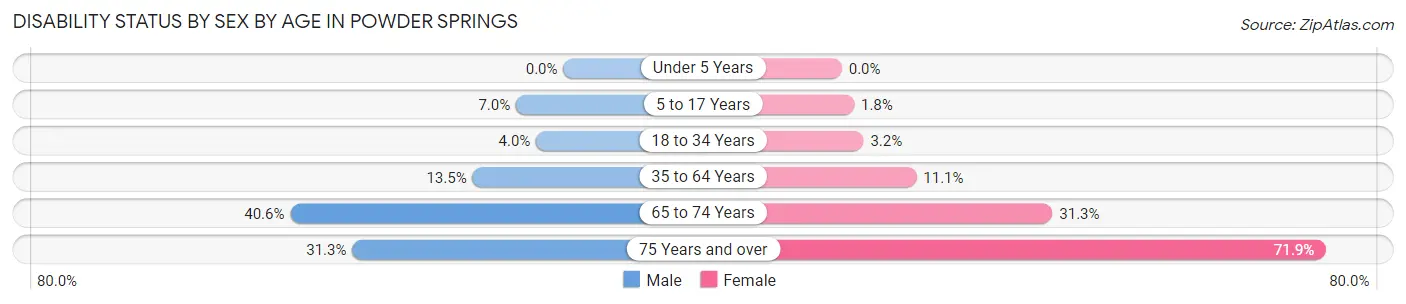
| Age Bracket | Male | Female |
| Under 5 Years | 0 (0.0%) | 0 (0.0%) |
| 5 to 17 Years | 101 (7.0%) | 29 (1.8%) |
| 18 to 34 Years | 68 (4.0%) | 60 (3.2%) |
| 35 to 64 Years | 407 (13.5%) | 431 (11.1%) |
| 65 to 74 Years | 309 (40.6%) | 197 (31.3%) |
| 75 Years and over | 63 (31.3%) | 379 (71.9%) |
Disability Class by Sex by Age in Powder Springs
Disability Class: Hearing Difficulty
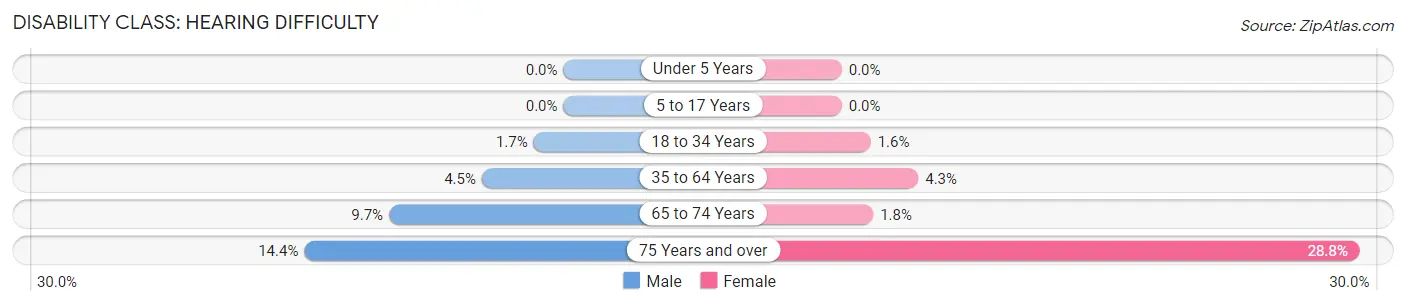
| Age Bracket | Male | Female |
| Under 5 Years | 0 (0.0%) | 0 (0.0%) |
| 5 to 17 Years | 0 (0.0%) | 0 (0.0%) |
| 18 to 34 Years | 28 (1.7%) | 30 (1.6%) |
| 35 to 64 Years | 137 (4.5%) | 166 (4.3%) |
| 65 to 74 Years | 74 (9.7%) | 11 (1.8%) |
| 75 Years and over | 29 (14.4%) | 152 (28.8%) |
Disability Class: Vision Difficulty
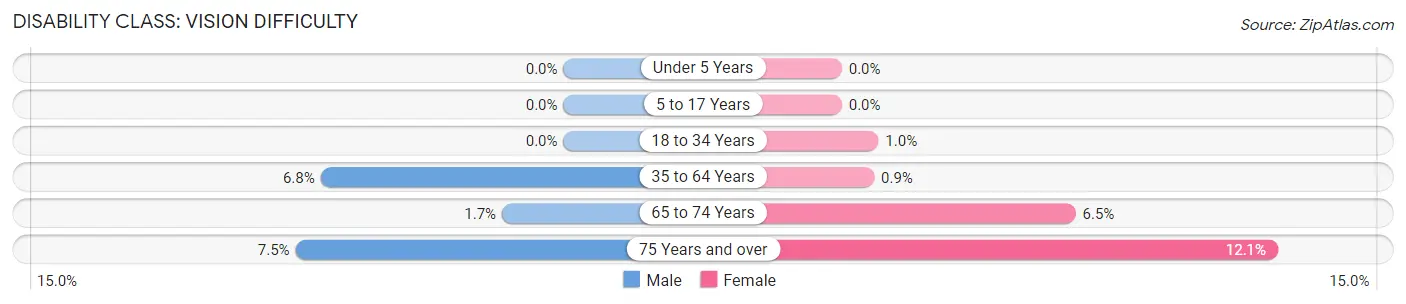
| Age Bracket | Male | Female |
| Under 5 Years | 0 (0.0%) | 0 (0.0%) |
| 5 to 17 Years | 0 (0.0%) | 0 (0.0%) |
| 18 to 34 Years | 0 (0.0%) | 19 (1.0%) |
| 35 to 64 Years | 204 (6.8%) | 35 (0.9%) |
| 65 to 74 Years | 13 (1.7%) | 41 (6.5%) |
| 75 Years and over | 15 (7.5%) | 64 (12.1%) |
Disability Class: Cognitive Difficulty
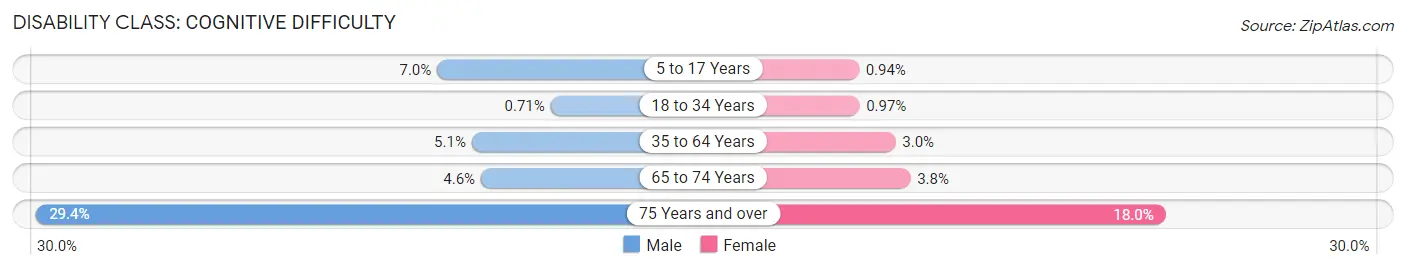
| Age Bracket | Male | Female |
| 5 to 17 Years | 101 (7.0%) | 15 (0.9%) |
| 18 to 34 Years | 12 (0.7%) | 18 (1.0%) |
| 35 to 64 Years | 154 (5.1%) | 116 (3.0%) |
| 65 to 74 Years | 35 (4.6%) | 24 (3.8%) |
| 75 Years and over | 59 (29.3%) | 95 (18.0%) |
Disability Class: Ambulatory Difficulty
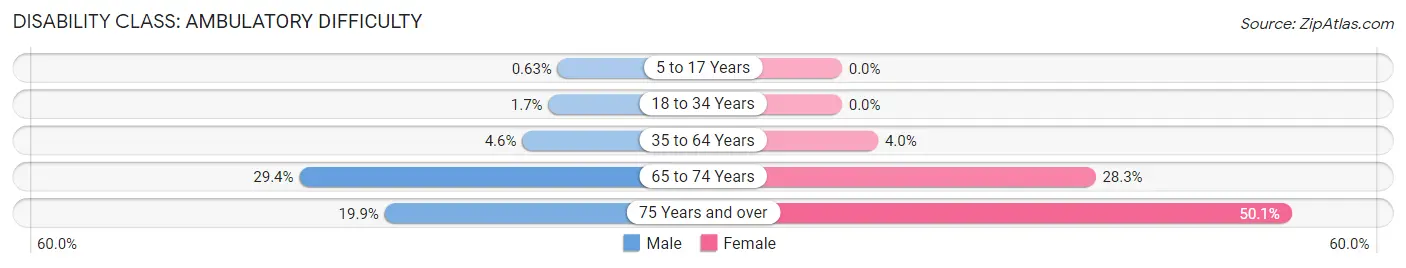
| Age Bracket | Male | Female |
| 5 to 17 Years | 9 (0.6%) | 0 (0.0%) |
| 18 to 34 Years | 28 (1.7%) | 0 (0.0%) |
| 35 to 64 Years | 138 (4.6%) | 157 (4.0%) |
| 65 to 74 Years | 224 (29.4%) | 178 (28.2%) |
| 75 Years and over | 40 (19.9%) | 264 (50.1%) |
Disability Class: Self-Care Difficulty
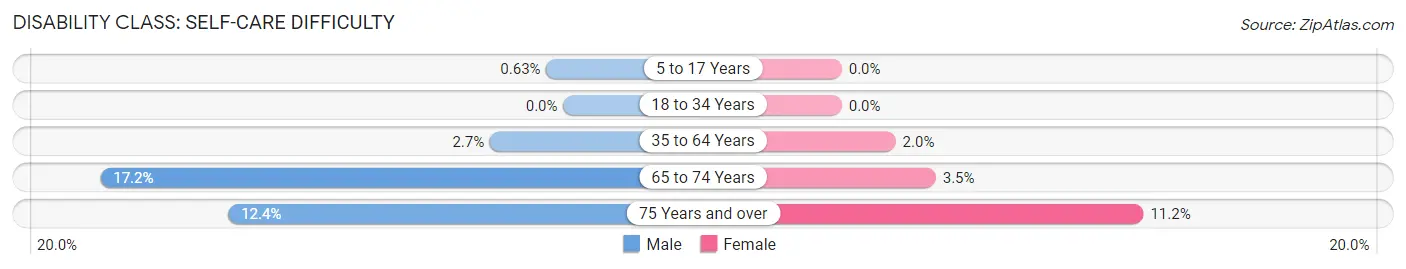
| Age Bracket | Male | Female |
| 5 to 17 Years | 9 (0.6%) | 0 (0.0%) |
| 18 to 34 Years | 0 (0.0%) | 0 (0.0%) |
| 35 to 64 Years | 82 (2.7%) | 78 (2.0%) |
| 65 to 74 Years | 131 (17.2%) | 22 (3.5%) |
| 75 Years and over | 25 (12.4%) | 59 (11.2%) |
Technology Access in Powder Springs
Computing Device Access in Powder Springs
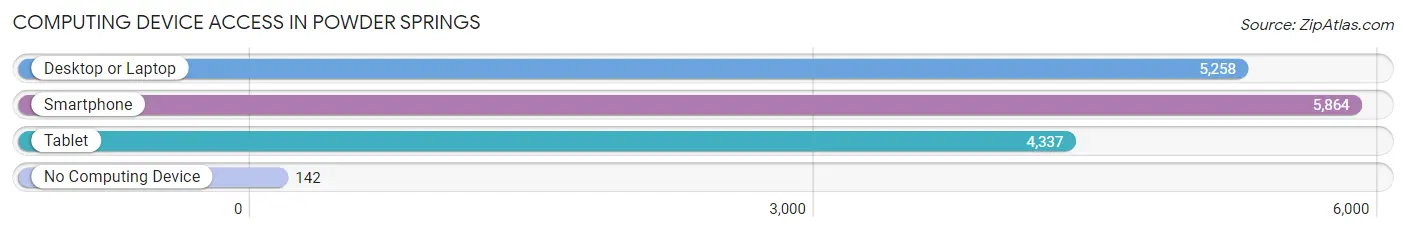
| Device Type | # Households | % Households |
| Desktop or Laptop | 5,258 | 86.5% |
| Smartphone | 5,864 | 96.4% |
| Tablet | 4,337 | 71.3% |
| No Computing Device | 142 | 2.3% |
| Total | 6,082 | 100.0% |
Internet Access in Powder Springs
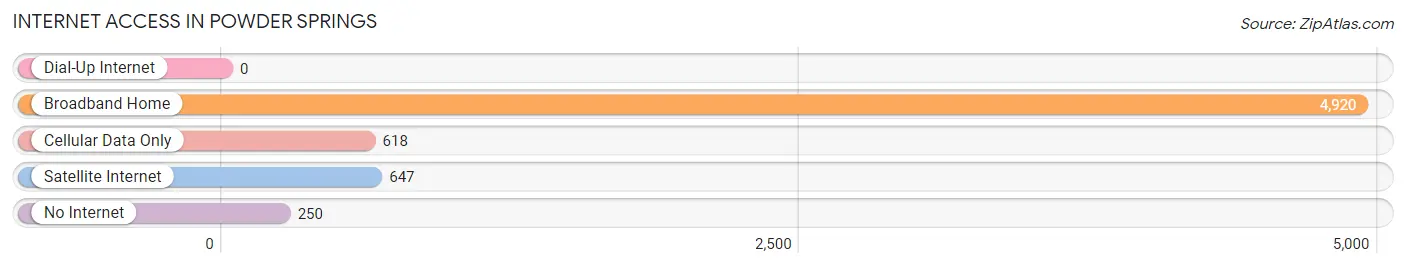
| Internet Type | # Households | % Households |
| Dial-Up Internet | 0 | 0.0% |
| Broadband Home | 4,920 | 80.9% |
| Cellular Data Only | 618 | 10.2% |
| Satellite Internet | 647 | 10.6% |
| No Internet | 250 | 4.1% |
| Total | 6,082 | 100.0% |
Powder Springs Summary
Powder Springs is a city located in Cobb County, Georgia, United States. It is an affluent suburb of Atlanta, located just west of the city. The population was 13,940 at the 2010 census.
History
Powder Springs was founded in 1838 by settlers from the Cherokee Nation. The city was named for the seven springs located in the area, which were said to have a powder-like consistency. The springs were used by Native Americans for medicinal purposes, and the settlers used them for drinking water.
In the late 19th century, the city became a popular destination for wealthy Atlantans looking to escape the city. The city was incorporated in 1838 and was the first city in Cobb County.
Geography
Powder Springs is located in northwestern Cobb County at 33°51'45" North, 84°40'45" West (33.8624, -84.6791). It is bordered to the north by the city of Marietta, to the east by Austell, to the south by Mableton, and to the west by Dallas.
The city is located in the foothills of the Appalachian Mountains, and is part of the Atlanta metropolitan area. The city is located approximately 20 miles northwest of downtown Atlanta.
Economy
Powder Springs is home to a variety of businesses, including manufacturing, retail, and service industries. The city is also home to several corporate headquarters, including the headquarters of the Georgia Power Company.
The city is also home to a number of small businesses, including restaurants, shops, and professional services.
Demographics
As of the 2010 census, there were 13,940 people, 5,093 households, and 3,717 families residing in the city. The population density was 1,845.3 people per square mile (711.7/km2). There were 5,541 housing units at an average density of 745.3 per square mile (287.3/km2). The racial makeup of the city was 68.2% White, 22.3% African American, 0.3% Native American, 3.2% Asian, 0.1% Pacific Islander, 3.7% from other races, and 2.4% from two or more races. Hispanic or Latino of any race were 8.2% of the population.
There were 5,093 households, out of which 33.2% had children under the age of 18 living with them, 54.2% were married couples living together, 11.7% had a female householder with no husband present, and 29.2% were non-families. 24.2% of all households were made up of individuals, and 8.2% had someone living alone who was 65 years of age or older. The average household size was 2.71 and the average family size was 3.22.
In the city, the population was spread out, with 25.7% under the age of 18, 8.2% from 18 to 24, 30.2% from 25 to 44, 24.2% from 45 to 64, and 11.7% who were 65 years of age or older. The median age was 36 years. For every 100 females, there were 93.2 males. For every 100 females age 18 and over, there were 89.7 males.
The median income for a household in the city was $60,945, and the median income for a family was $68,945. Males had a median income of $50,000 versus $36,000 for females. The per capita income for the city was $27,845. About 4.2% of families and 5.7% of the population were below the poverty line, including 6.7% of those under age 18 and 5.2% of those age 65 or over.
Common Questions
What is Per Capita Income in Powder Springs?
Per Capita income in Powder Springs is $39,078.
What is the Median Family Income in Powder Springs?
Median Family Income in Powder Springs is $97,282.
What is the Median Household income in Powder Springs?
Median Household Income in Powder Springs is $88,311.
What is Income or Wage Gap in Powder Springs?
Income or Wage Gap in Powder Springs is 4.8%.
Women in Powder Springs earn 95.2 cents for every dollar earned by a man.
What is Family Income Deficit in Powder Springs?
Family Income Deficit in Powder Springs is $7,168.
Families that are below poverty line in Powder Springs earn $7,168 less on average than the poverty threshold level.
What is Inequality or Gini Index in Powder Springs?
Inequality or Gini Index in Powder Springs is 0.37.
What is the Total Population of Powder Springs?
Total Population of Powder Springs is 16,930.
What is the Total Male Population of Powder Springs?
Total Male Population of Powder Springs is 7,804.
What is the Total Female Population of Powder Springs?
Total Female Population of Powder Springs is 9,126.
What is the Ratio of Males per 100 Females in Powder Springs?
There are 85.51 Males per 100 Females in Powder Springs.
What is the Ratio of Females per 100 Males in Powder Springs?
There are 116.94 Females per 100 Males in Powder Springs.
What is the Median Population Age in Powder Springs?
Median Population Age in Powder Springs is 38.7 Years.
What is the Average Family Size in Powder Springs
Average Family Size in Powder Springs is 3.3 People.
What is the Average Household Size in Powder Springs
Average Household Size in Powder Springs is 2.7 People.
How Large is the Labor Force in Powder Springs?
There are 9,382 People in the Labor Forcein in Powder Springs.
What is the Percentage of People in the Labor Force in Powder Springs?
69.7% of People are in the Labor Force in Powder Springs.
What is the Unemployment Rate in Powder Springs?
Unemployment Rate in Powder Springs is 4.5%.