Conley, GA Map & Demographics
Conley Map
Conley Overview
$24,096
PER CAPITA INCOME
$48,639
AVG FAMILY INCOME
$47,429
AVG HOUSEHOLD INCOME
22.7%
WAGE / INCOME GAP [ % ]
77.3¢/ $1
WAGE / INCOME GAP [ $ ]
0.45
INEQUALITY / GINI INDEX
5,892
TOTAL POPULATION
2,773
MALE POPULATION
3,119
FEMALE POPULATION
88.91
MALES / 100 FEMALES
112.48
FEMALES / 100 MALES
45.7
MEDIAN AGE
3.0
AVG FAMILY SIZE
2.2
AVG HOUSEHOLD SIZE
2,829
LABOR FORCE [ PEOPLE ]
56.2%
PERCENT IN LABOR FORCE
4.6%
UNEMPLOYMENT RATE
Conley Zip Codes
Income in Conley
Income Overview in Conley
Per Capita Income in Conley is $24,096, while median incomes of families and households are $48,639 and $47,429 respectively.
| Characteristic | Number | Measure |
| Per Capita Income | 5,892 | $24,096 |
| Median Family Income | 1,416 | $48,639 |
| Mean Family Income | 1,416 | $63,404 |
| Median Household Income | 2,690 | $47,429 |
| Mean Household Income | 2,690 | $59,622 |
| Income Deficit | 1,416 | $0 |
| Wage / Income Gap (%) | 5,892 | 22.67% |
| Wage / Income Gap ($) | 5,892 | 77.33¢ per $1 |
| Gini / Inequality Index | 5,892 | 0.45 |
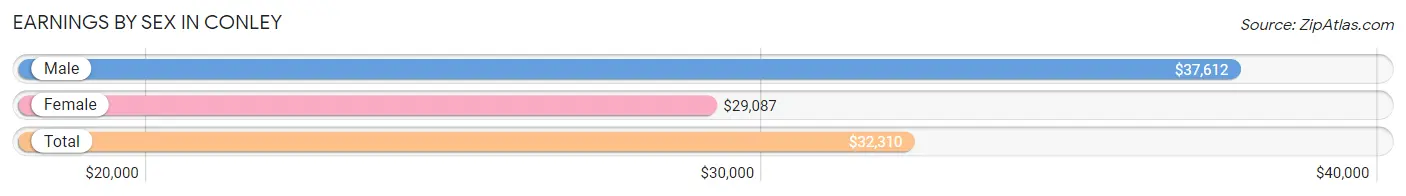
Earnings by Sex in Conley
Average Earnings in Conley are $32,310, $37,612 for men and $29,087 for women, a difference of 22.7%.
| Sex | Number | Average Earnings |
| Male | 1,578 (53.0%) | $37,612 |
| Female | 1,398 (47.0%) | $29,087 |
| Total | 2,976 (100.0%) | $32,310 |
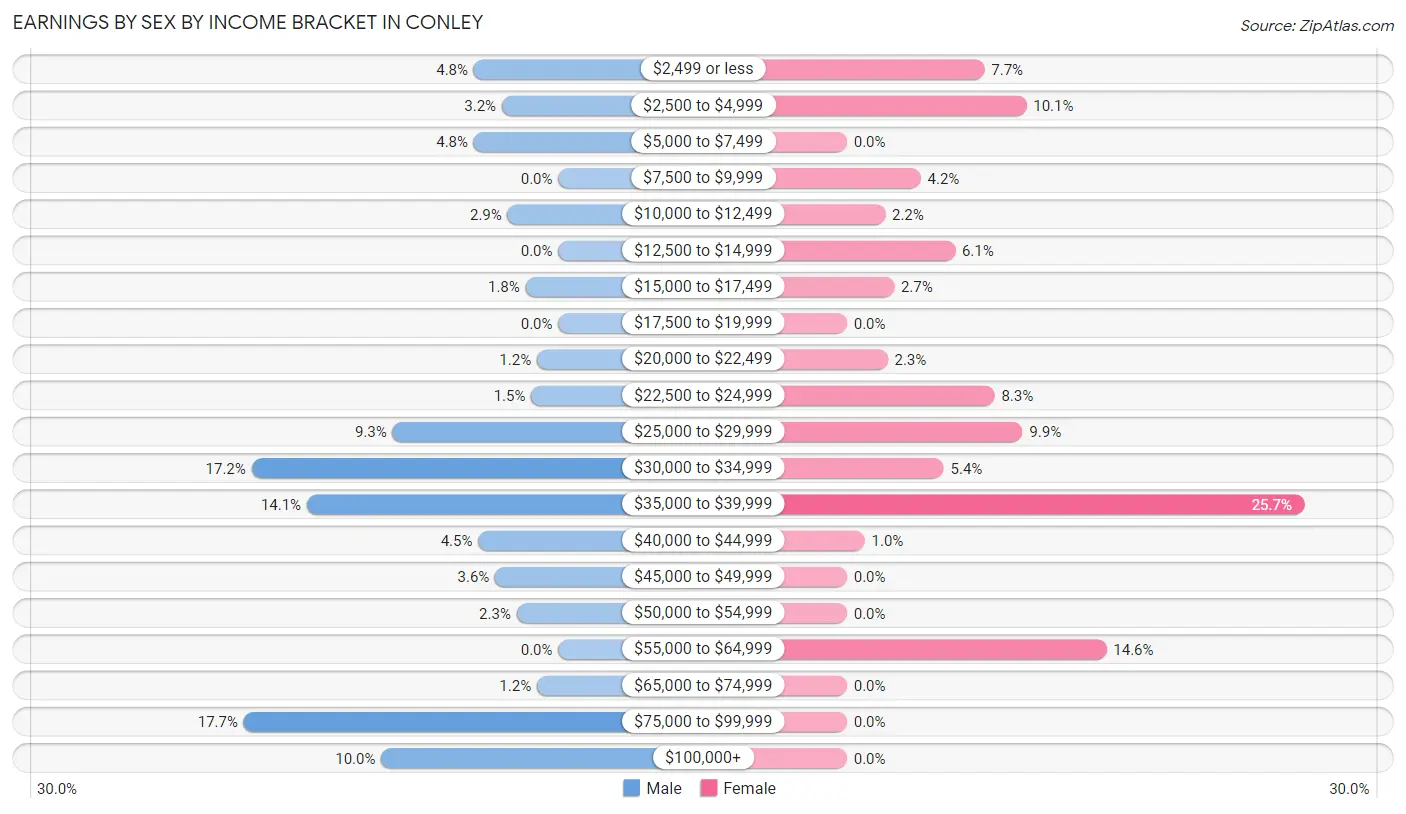
Earnings by Sex by Income Bracket in Conley
The most common earnings brackets in Conley are $75,000 to $99,999 for men (279 | 17.7%) and $35,000 to $39,999 for women (359 | 25.7%).
| Income | Male | Female |
| $2,499 or less | 75 (4.8%) | 108 (7.7%) |
| $2,500 to $4,999 | 50 (3.2%) | 141 (10.1%) |
| $5,000 to $7,499 | 75 (4.8%) | 0 (0.0%) |
| $7,500 to $9,999 | 0 (0.0%) | 58 (4.2%) |
| $10,000 to $12,499 | 45 (2.9%) | 30 (2.1%) |
| $12,500 to $14,999 | 0 (0.0%) | 85 (6.1%) |
| $15,000 to $17,499 | 29 (1.8%) | 37 (2.6%) |
| $17,500 to $19,999 | 0 (0.0%) | 0 (0.0%) |
| $20,000 to $22,499 | 19 (1.2%) | 32 (2.3%) |
| $22,500 to $24,999 | 24 (1.5%) | 116 (8.3%) |
| $25,000 to $29,999 | 147 (9.3%) | 138 (9.9%) |
| $30,000 to $34,999 | 272 (17.2%) | 76 (5.4%) |
| $35,000 to $39,999 | 223 (14.1%) | 359 (25.7%) |
| $40,000 to $44,999 | 71 (4.5%) | 14 (1.0%) |
| $45,000 to $49,999 | 56 (3.5%) | 0 (0.0%) |
| $50,000 to $54,999 | 37 (2.3%) | 0 (0.0%) |
| $55,000 to $64,999 | 0 (0.0%) | 204 (14.6%) |
| $65,000 to $74,999 | 19 (1.2%) | 0 (0.0%) |
| $75,000 to $99,999 | 279 (17.7%) | 0 (0.0%) |
| $100,000+ | 157 (10.0%) | 0 (0.0%) |
| Total | 1,578 (100.0%) | 1,398 (100.0%) |
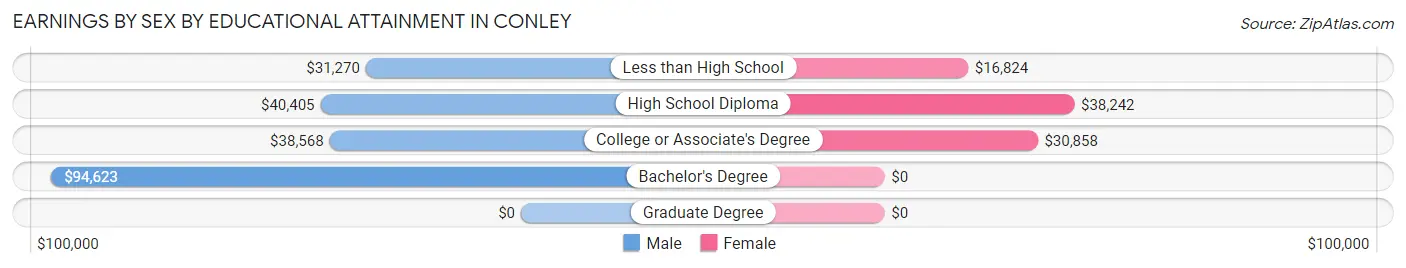
Earnings by Sex by Educational Attainment in Conley
Average earnings in Conley are $38,062 for men and $31,618 for women, a difference of 16.9%. Men with an educational attainment of bachelor's degree enjoy the highest average annual earnings of $94,623, while those with less than high school education earn the least with $31,270. Women with an educational attainment of high school diploma earn the most with the average annual earnings of $38,242, while those with less than high school education have the smallest earnings of $16,824.
| Educational Attainment | Male Income | Female Income |
| Less than High School | $31,270 | $16,824 |
| High School Diploma | $40,405 | $38,242 |
| College or Associate's Degree | $38,568 | $30,858 |
| Bachelor's Degree | $94,623 | $0 |
| Graduate Degree | - | - |
| Total | $38,062 | $31,618 |
Family Income in Conley
Family Income Brackets in Conley
According to the Conley family income data, there are 439 families falling into the $35,000 to $49,999 income range, which is the most common income bracket and makes up 31.0% of all families. Conversely, the $75,000 to $99,999 income bracket is the least frequent group with only 41 families (2.9%) belonging to this category.
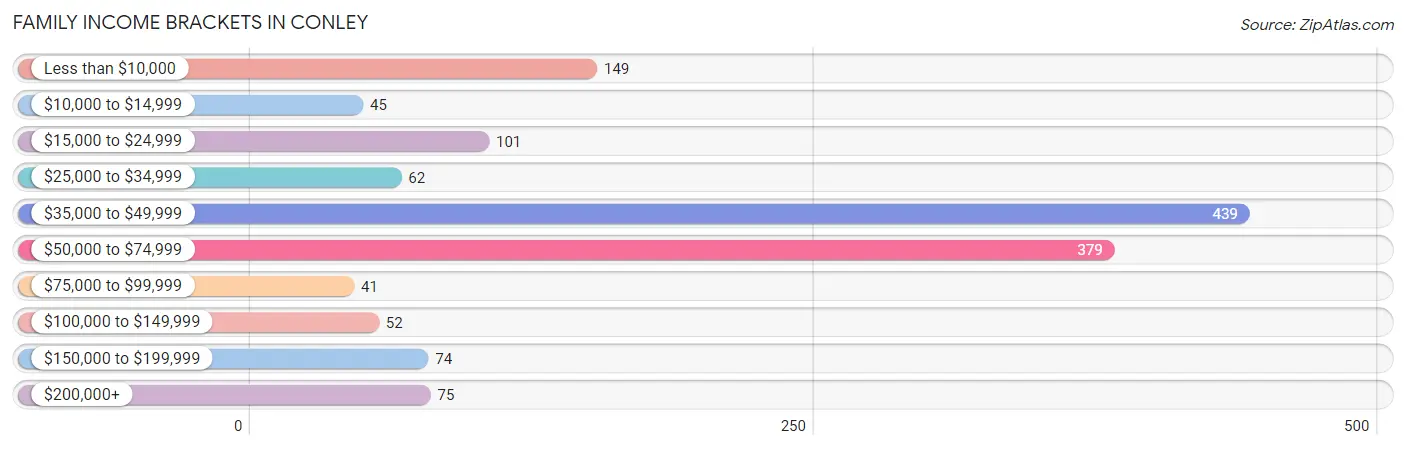
| Income Bracket | # Families | % Families |
| Less than $10,000 | 149 | 10.5% |
| $10,000 to $14,999 | 45 | 3.2% |
| $15,000 to $24,999 | 101 | 7.1% |
| $25,000 to $34,999 | 62 | 4.4% |
| $35,000 to $49,999 | 439 | 31.0% |
| $50,000 to $74,999 | 379 | 26.8% |
| $75,000 to $99,999 | 41 | 2.9% |
| $100,000 to $149,999 | 52 | 3.7% |
| $150,000 to $199,999 | 74 | 5.2% |
| $200,000+ | 75 | 5.3% |
Family Income by Famaliy Size in Conley
4-person families (158 | 11.2%) account for the highest median family income in Conley with $59,375 per family, while 2-person families (806 | 56.9%) have the highest median income of $23,278 per family member.
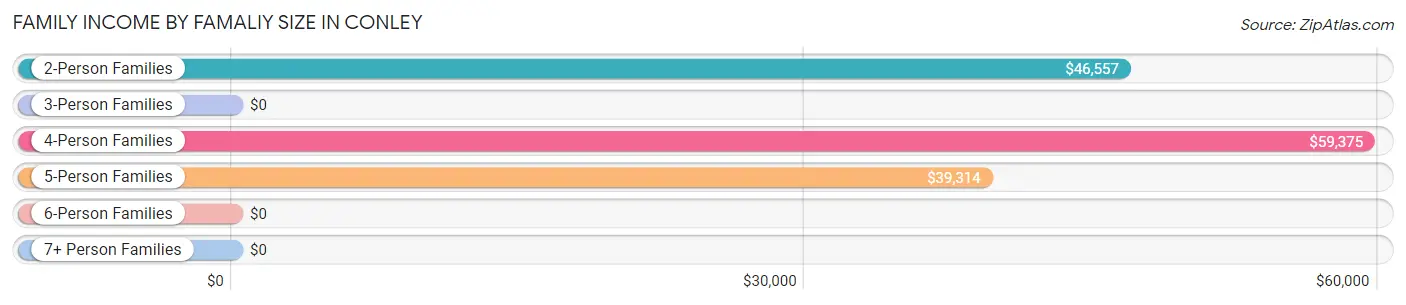
| Income Bracket | # Families | Median Income |
| 2-Person Families | 806 (56.9%) | $46,557 |
| 3-Person Families | 213 (15.0%) | $0 |
| 4-Person Families | 158 (11.2%) | $59,375 |
| 5-Person Families | 164 (11.6%) | $39,314 |
| 6-Person Families | 0 (0.0%) | $0 |
| 7+ Person Families | 75 (5.3%) | $0 |
| Total | 1,416 (100.0%) | $48,639 |
Family Income by Number of Earners in Conley
The median family income in Conley is $48,639, with families comprising 3+ earners (132) having the highest median family income of $250,001, while families with no earners (250) have the lowest median family income of $18,875, accounting for 9.3% and 17.7% of families, respectively.
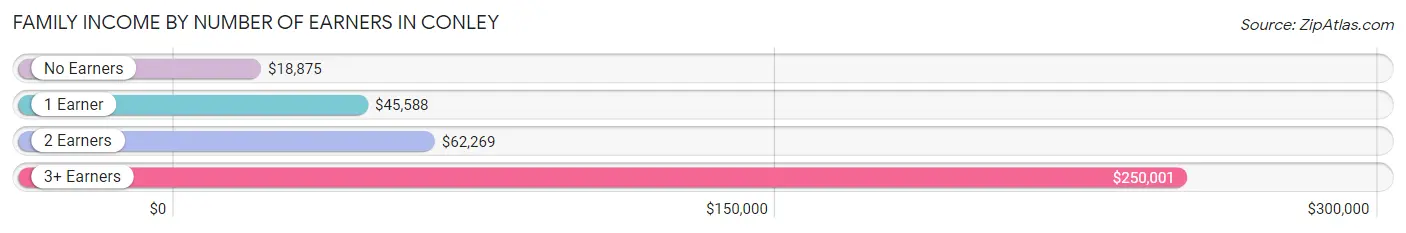
| Number of Earners | # Families | Median Income |
| No Earners | 250 (17.7%) | $18,875 |
| 1 Earner | 434 (30.6%) | $45,588 |
| 2 Earners | 600 (42.4%) | $62,269 |
| 3+ Earners | 132 (9.3%) | $250,001 |
| Total | 1,416 (100.0%) | $48,639 |
Household Income in Conley
Household Income Brackets in Conley
With 519 households falling in the category, the $35,000 to $49,999 income range is the most frequent in Conley, accounting for 19.3% of all households. In contrast, only 75 households (2.8%) fall into the $150,000 to $199,999 income bracket, making it the least populous group.
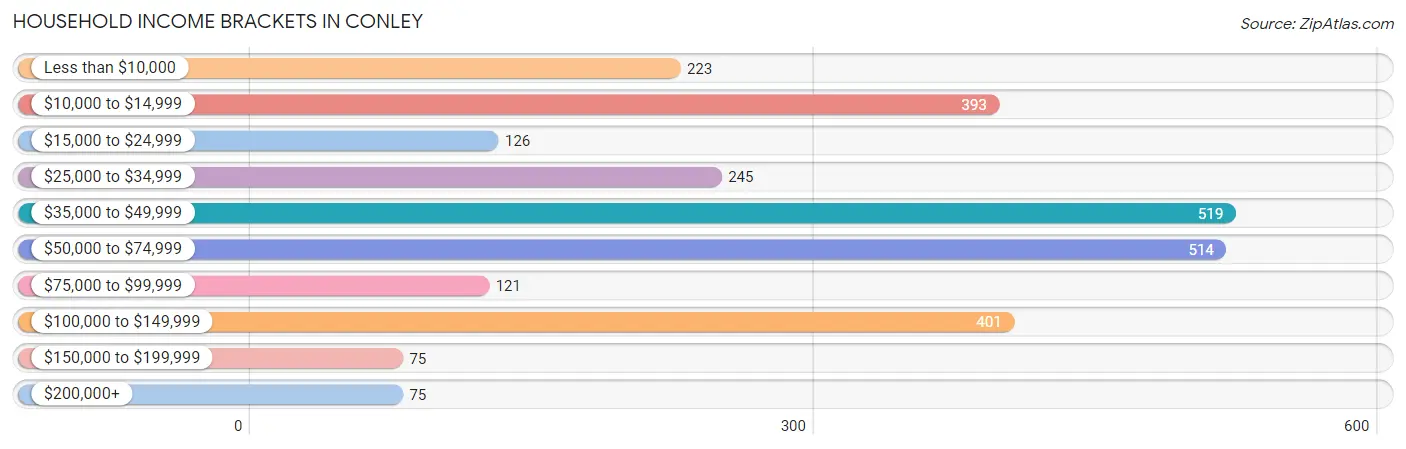
| Income Bracket | # Households | % Households |
| Less than $10,000 | 223 | 8.3% |
| $10,000 to $14,999 | 393 | 14.6% |
| $15,000 to $24,999 | 126 | 4.7% |
| $25,000 to $34,999 | 245 | 9.1% |
| $35,000 to $49,999 | 519 | 19.3% |
| $50,000 to $74,999 | 514 | 19.1% |
| $75,000 to $99,999 | 121 | 4.5% |
| $100,000 to $149,999 | 401 | 14.9% |
| $150,000 to $199,999 | 75 | 2.8% |
| $200,000+ | 75 | 2.8% |
Household Income by Householder Age in Conley
The median household income in Conley is $47,429, with the highest median household income of $49,413 found in the 45 to 64 years age bracket for the primary householder. A total of 1,713 households (63.7%) fall into this category.
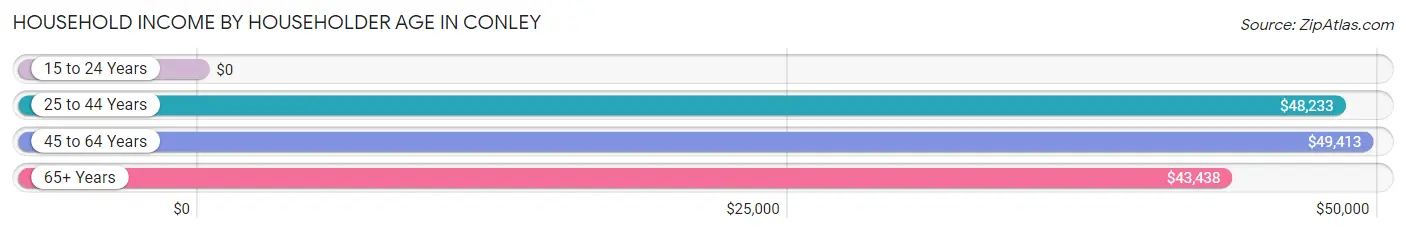
| Income Bracket | # Households | Median Income |
| 15 to 24 Years | 0 (0.0%) | $0 |
| 25 to 44 Years | 496 (18.4%) | $48,233 |
| 45 to 64 Years | 1,713 (63.7%) | $49,413 |
| 65+ Years | 481 (17.9%) | $43,438 |
| Total | 2,690 (100.0%) | $47,429 |
Poverty in Conley
Income Below Poverty by Sex and Age in Conley
With 20.2% poverty level for males and 16.6% for females among the residents of Conley, 16 and 17 year old males and 12 to 14 year old females are the most vulnerable to poverty, with 23 males (59.0%) and 63 females (38.7%) in their respective age groups living below the poverty level.
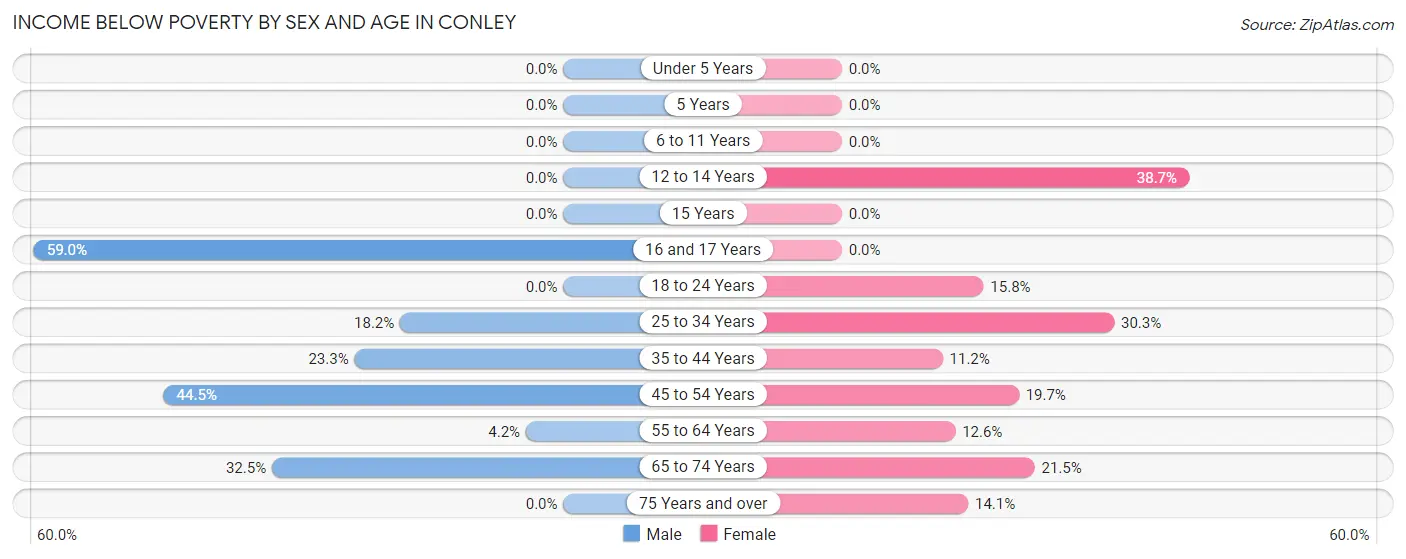
| Age Bracket | Male | Female |
| Under 5 Years | 0 (0.0%) | 0 (0.0%) |
| 5 Years | 0 (0.0%) | 0 (0.0%) |
| 6 to 11 Years | 0 (0.0%) | 0 (0.0%) |
| 12 to 14 Years | 0 (0.0%) | 63 (38.7%) |
| 15 Years | 0 (0.0%) | 0 (0.0%) |
| 16 and 17 Years | 23 (59.0%) | 0 (0.0%) |
| 18 to 24 Years | 0 (0.0%) | 50 (15.8%) |
| 25 to 34 Years | 68 (18.2%) | 114 (30.3%) |
| 35 to 44 Years | 80 (23.3%) | 31 (11.2%) |
| 45 to 54 Years | 312 (44.5%) | 105 (19.7%) |
| 55 to 64 Years | 28 (4.2%) | 72 (12.6%) |
| 65 to 74 Years | 49 (32.5%) | 35 (21.5%) |
| 75 Years and over | 0 (0.0%) | 27 (14.1%) |
| Total | 560 (20.2%) | 497 (16.6%) |
Income Above Poverty by Sex and Age in Conley
According to the poverty statistics in Conley, males aged under 5 years and females aged under 5 years are the age groups that are most secure financially, with 100.0% of males and 100.0% of females in these age groups living above the poverty line.
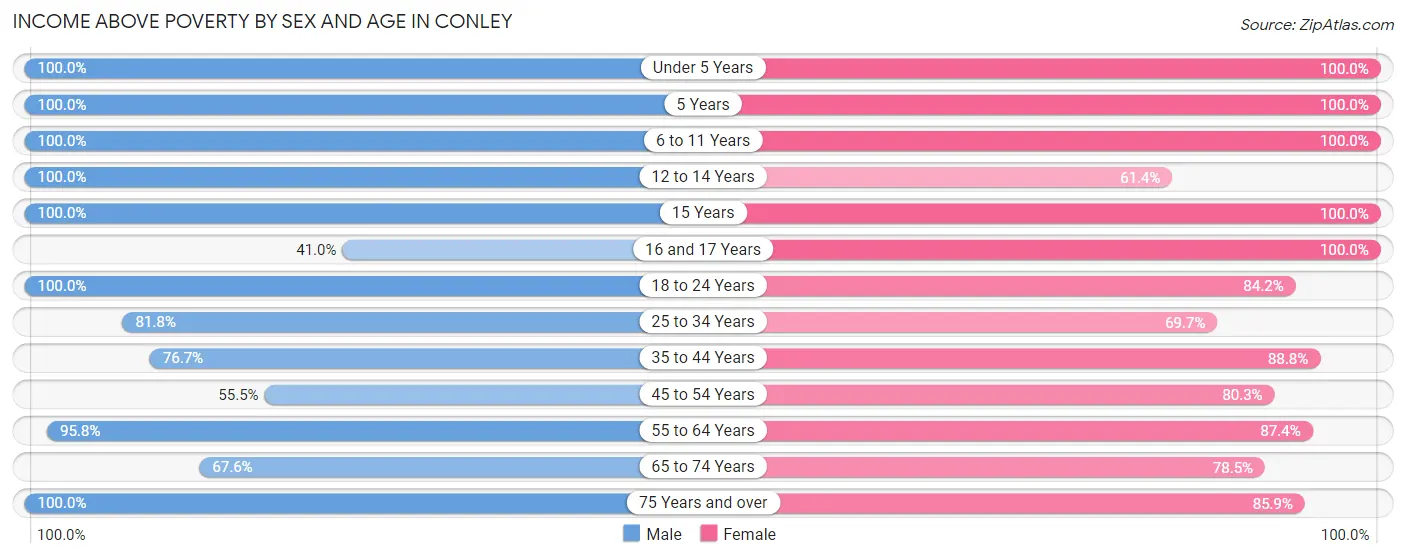
| Age Bracket | Male | Female |
| Under 5 Years | 80 (100.0%) | 62 (100.0%) |
| 5 Years | 61 (100.0%) | 56 (100.0%) |
| 6 to 11 Years | 47 (100.0%) | 182 (100.0%) |
| 12 to 14 Years | 38 (100.0%) | 100 (61.4%) |
| 15 Years | 26 (100.0%) | 18 (100.0%) |
| 16 and 17 Years | 16 (41.0%) | 86 (100.0%) |
| 18 to 24 Years | 112 (100.0%) | 267 (84.2%) |
| 25 to 34 Years | 306 (81.8%) | 262 (69.7%) |
| 35 to 44 Years | 264 (76.7%) | 245 (88.8%) |
| 45 to 54 Years | 389 (55.5%) | 428 (80.3%) |
| 55 to 64 Years | 644 (95.8%) | 498 (87.4%) |
| 65 to 74 Years | 102 (67.5%) | 128 (78.5%) |
| 75 Years and over | 128 (100.0%) | 165 (85.9%) |
| Total | 2,213 (79.8%) | 2,497 (83.4%) |
Income Below Poverty Among Married-Couple Families in Conley
The poverty statistics for married-couple families in Conley show that 9.1% or 61 of the total 669 families live below the poverty line. Families with no children have the highest poverty rate of 14.3%, comprising of 61 families. On the other hand, families with 1 or 2 children have the lowest poverty rate of 0.0%, which includes 0 families.
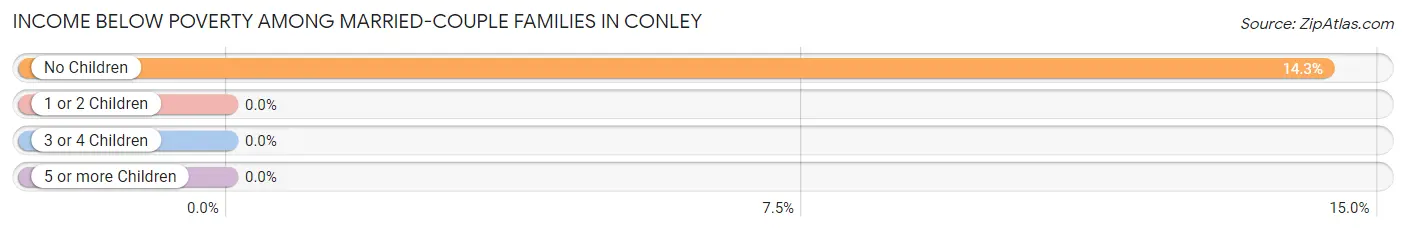
| Children | Above Poverty | Below Poverty |
| No Children | 365 (85.7%) | 61 (14.3%) |
| 1 or 2 Children | 243 (100.0%) | 0 (0.0%) |
| 3 or 4 Children | 0 (0.0%) | 0 (0.0%) |
| 5 or more Children | 0 (0.0%) | 0 (0.0%) |
| Total | 608 (90.9%) | 61 (9.1%) |
Income Below Poverty Among Single-Parent Households in Conley
According to the poverty data in Conley, 32.4% or 56 single-father households and 13.2% or 76 single-mother households are living below the poverty line. Among single-father households, those with 1 or 2 children have the highest poverty rate, with 56 households (50.4%) experiencing poverty. Likewise, among single-mother households, those with 1 or 2 children have the highest poverty rate, with 31 households (16.6%) falling below the poverty line.
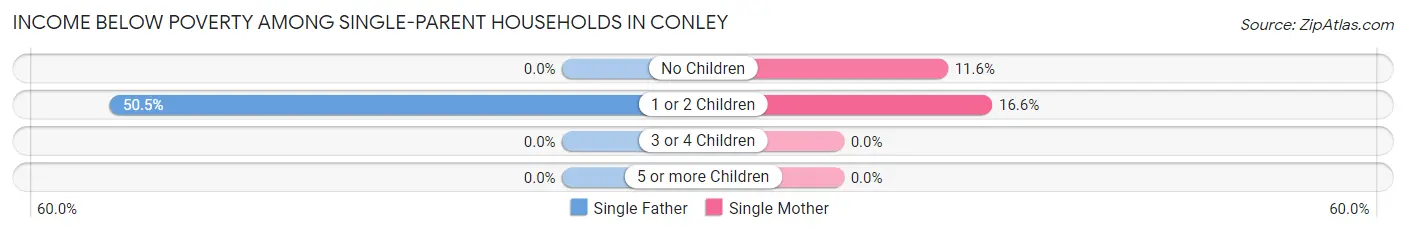
| Children | Single Father | Single Mother |
| No Children | 0 (0.0%) | 45 (11.6%) |
| 1 or 2 Children | 56 (50.4%) | 31 (16.6%) |
| 3 or 4 Children | 0 (0.0%) | 0 (0.0%) |
| 5 or more Children | 0 (0.0%) | 0 (0.0%) |
| Total | 56 (32.4%) | 76 (13.2%) |
Income Below Poverty Among Married-Couple vs Single-Parent Households in Conley
The poverty data for Conley shows that 61 of the married-couple family households (9.1%) and 132 of the single-parent households (17.7%) are living below the poverty level. Within the married-couple family households, those with no children have the highest poverty rate, with 61 households (14.3%) falling below the poverty line. Among the single-parent households, those with 1 or 2 children have the highest poverty rate, with 87 household (29.2%) living below poverty.
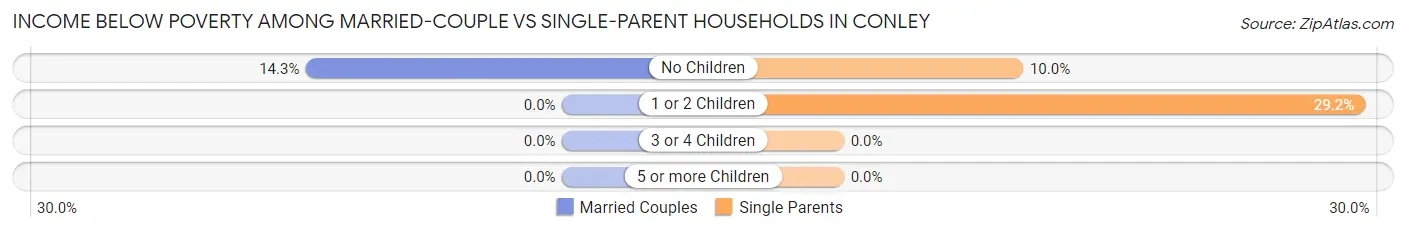
| Children | Married-Couple Families | Single-Parent Households |
| No Children | 61 (14.3%) | 45 (10.0%) |
| 1 or 2 Children | 0 (0.0%) | 87 (29.2%) |
| 3 or 4 Children | 0 (0.0%) | 0 (0.0%) |
| 5 or more Children | 0 (0.0%) | 0 (0.0%) |
| Total | 61 (9.1%) | 132 (17.7%) |
Race in Conley
The most populous races in Conley are Black / African American (3,332 | 56.6%), Hispanic or Latino (1,408 | 23.9%), and Two or more Races (982 | 16.7%).
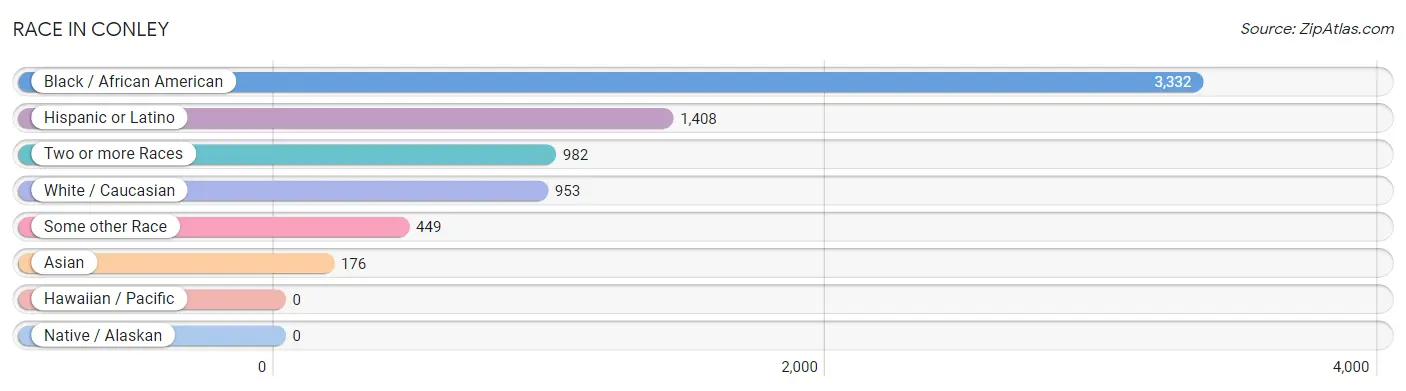
| Race | # Population | % Population |
| Asian | 176 | 3.0% |
| Black / African American | 3,332 | 56.6% |
| Hawaiian / Pacific | 0 | 0.0% |
| Hispanic or Latino | 1,408 | 23.9% |
| Native / Alaskan | 0 | 0.0% |
| White / Caucasian | 953 | 16.2% |
| Two or more Races | 982 | 16.7% |
| Some other Race | 449 | 7.6% |
| Total | 5,892 | 100.0% |
Ancestry in Conley
The most populous ancestries reported in Conley are Mexican (1,114 | 18.9%), Irish (132 | 2.2%), Dominican (131 | 2.2%), Cherokee (118 | 2.0%), and Sri Lankan (115 | 1.9%), together accounting for 27.3% of all Conley residents.
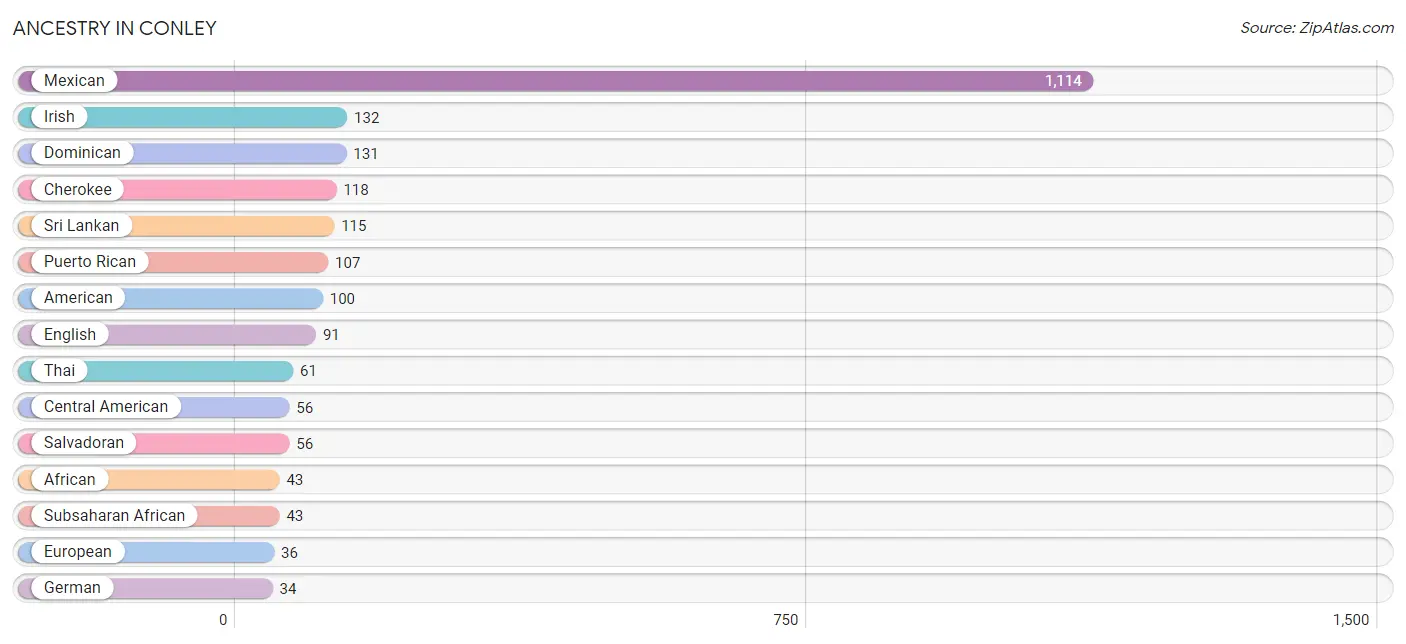
| Ancestry | # Population | % Population |
| African | 43 | 0.7% |
| American | 100 | 1.7% |
| Central American | 56 | 0.9% |
| Cherokee | 118 | 2.0% |
| Dominican | 131 | 2.2% |
| Dutch | 16 | 0.3% |
| English | 91 | 1.5% |
| European | 36 | 0.6% |
| French Canadian | 18 | 0.3% |
| German | 34 | 0.6% |
| Irish | 132 | 2.2% |
| Italian | 9 | 0.2% |
| Jamaican | 20 | 0.3% |
| Mexican | 1,114 | 18.9% |
| Puerto Rican | 107 | 1.8% |
| Russian | 26 | 0.4% |
| Salvadoran | 56 | 0.9% |
| Sri Lankan | 115 | 1.9% |
| Subsaharan African | 43 | 0.7% |
| Thai | 61 | 1.0% |
| Trinidadian and Tobagonian | 11 | 0.2% | View All 21 Rows |
Immigrants in Conley
The most numerous immigrant groups reported in Conley came from Latin America (519 | 8.8%), Central America (437 | 7.4%), Mexico (381 | 6.5%), Asia (176 | 3.0%), and South Eastern Asia (115 | 1.9%), together accounting for 27.6% of all Conley residents.
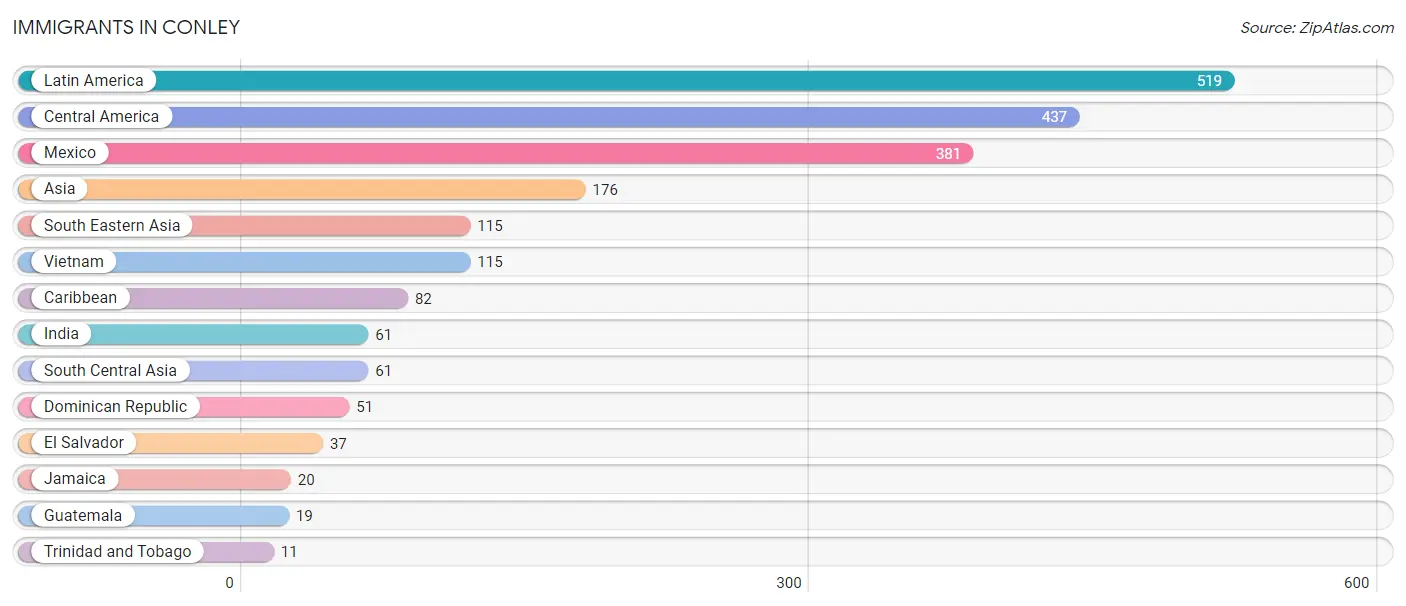
| Immigration Origin | # Population | % Population |
| Asia | 176 | 3.0% |
| Caribbean | 82 | 1.4% |
| Central America | 437 | 7.4% |
| Dominican Republic | 51 | 0.9% |
| El Salvador | 37 | 0.6% |
| Guatemala | 19 | 0.3% |
| India | 61 | 1.0% |
| Jamaica | 20 | 0.3% |
| Latin America | 519 | 8.8% |
| Mexico | 381 | 6.5% |
| South Central Asia | 61 | 1.0% |
| South Eastern Asia | 115 | 1.9% |
| Trinidad and Tobago | 11 | 0.2% |
| Vietnam | 115 | 1.9% | View All 14 Rows |
Sex and Age in Conley
Sex and Age in Conley
The most populous age groups in Conley are 60 to 64 Years (402 | 14.5%) for men and 5 to 9 Years (316 | 10.1%) for women.
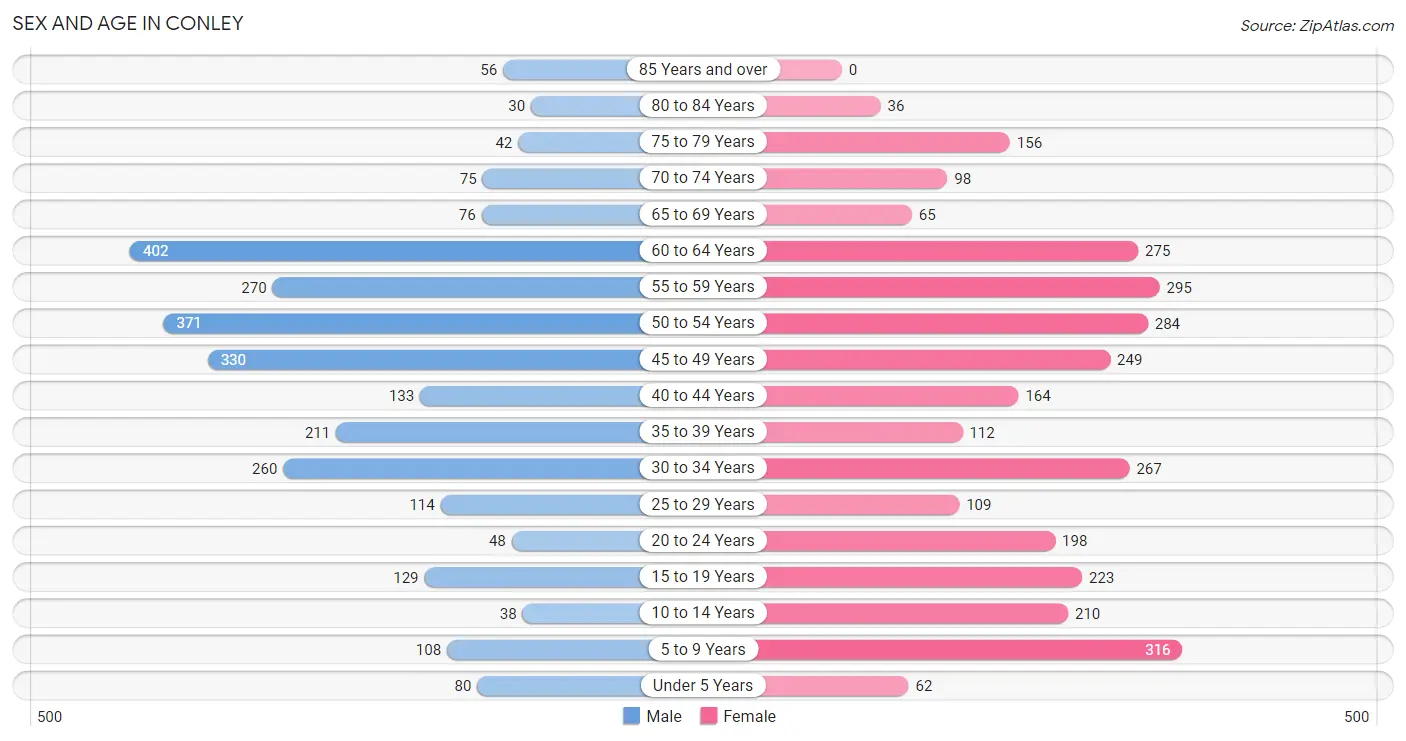
| Age Bracket | Male | Female |
| Under 5 Years | 80 (2.9%) | 62 (2.0%) |
| 5 to 9 Years | 108 (3.9%) | 316 (10.1%) |
| 10 to 14 Years | 38 (1.4%) | 210 (6.7%) |
| 15 to 19 Years | 129 (4.6%) | 223 (7.1%) |
| 20 to 24 Years | 48 (1.7%) | 198 (6.4%) |
| 25 to 29 Years | 114 (4.1%) | 109 (3.5%) |
| 30 to 34 Years | 260 (9.4%) | 267 (8.6%) |
| 35 to 39 Years | 211 (7.6%) | 112 (3.6%) |
| 40 to 44 Years | 133 (4.8%) | 164 (5.3%) |
| 45 to 49 Years | 330 (11.9%) | 249 (8.0%) |
| 50 to 54 Years | 371 (13.4%) | 284 (9.1%) |
| 55 to 59 Years | 270 (9.7%) | 295 (9.5%) |
| 60 to 64 Years | 402 (14.5%) | 275 (8.8%) |
| 65 to 69 Years | 76 (2.7%) | 65 (2.1%) |
| 70 to 74 Years | 75 (2.7%) | 98 (3.1%) |
| 75 to 79 Years | 42 (1.5%) | 156 (5.0%) |
| 80 to 84 Years | 30 (1.1%) | 36 (1.1%) |
| 85 Years and over | 56 (2.0%) | 0 (0.0%) |
| Total | 2,773 (100.0%) | 3,119 (100.0%) |
Families and Households in Conley
Median Family Size in Conley
The median family size in Conley is 2.97 persons per family, with married-couple families (669 | 47.2%) accounting for the largest median family size of 3.34 persons per family. On the other hand, single male/father families (173 | 12.2%) represent the smallest median family size with 2.08 persons per family.
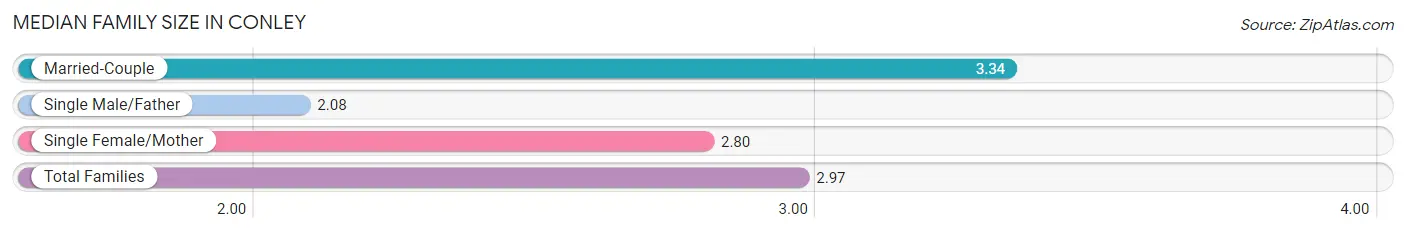
| Family Type | # Families | Family Size |
| Married-Couple | 669 (47.2%) | 3.34 |
| Single Male/Father | 173 (12.2%) | 2.08 |
| Single Female/Mother | 574 (40.5%) | 2.80 |
| Total Families | 1,416 (100.0%) | 2.97 |
Median Household Size in Conley
The median household size in Conley is 2.19 persons per household, with married-couple households (669 | 24.9%) accounting for the largest median household size of 3.34 persons per household. non-family households (1,274 | 47.4%) represent the smallest median household size with 1.11 persons per household.
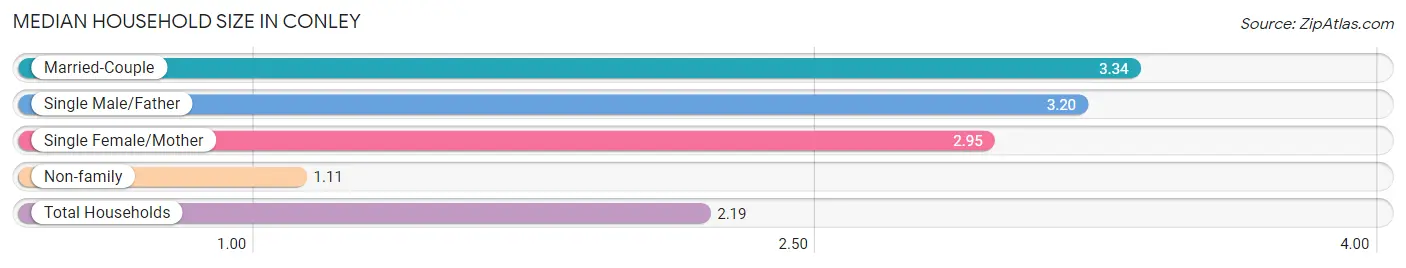
| Household Type | # Households | Household Size |
| Married-Couple | 669 (24.9%) | 3.34 |
| Single Male/Father | 173 (6.4%) | 3.20 |
| Single Female/Mother | 574 (21.3%) | 2.95 |
| Non-family | 1,274 (47.4%) | 1.11 |
| Total Households | 2,690 (100.0%) | 2.19 |
Household Size by Marriage Status in Conley
Out of a total of 2,690 households in Conley, 1,416 (52.6%) are family households, while 1,274 (47.4%) are nonfamily households. The most numerous type of family households are 2-person households, comprising 708, and the most common type of nonfamily households are 1-person households, comprising 961.
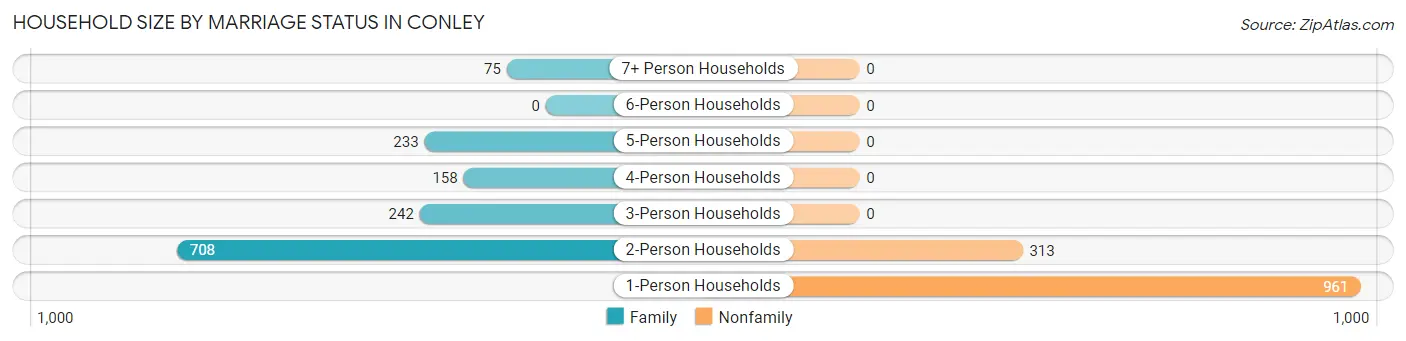
| Household Size | Family Households | Nonfamily Households |
| 1-Person Households | - | 961 (35.7%) |
| 2-Person Households | 708 (26.3%) | 313 (11.6%) |
| 3-Person Households | 242 (9.0%) | 0 (0.0%) |
| 4-Person Households | 158 (5.9%) | 0 (0.0%) |
| 5-Person Households | 233 (8.7%) | 0 (0.0%) |
| 6-Person Households | 0 (0.0%) | 0 (0.0%) |
| 7+ Person Households | 75 (2.8%) | 0 (0.0%) |
| Total | 1,416 (52.6%) | 1,274 (47.4%) |
Female Fertility in Conley
Fertility by Age in Conley
Average fertility rate in Conley is 76.0 births per 1,000 women. Women in the age bracket of 20 to 34 years have the highest fertility rate with 185.0 births per 1,000 women. Women in the age bracket of 20 to 34 years acount for 100.0% of all women with births.
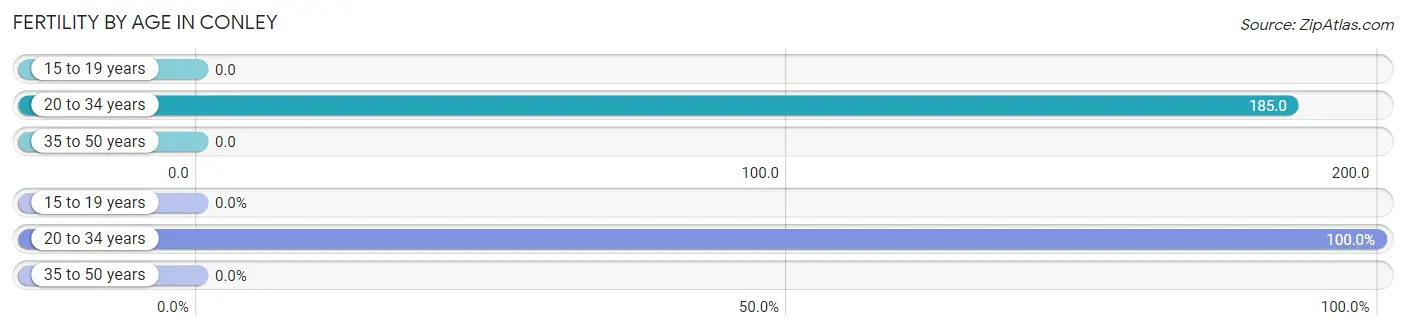
| Age Bracket | Women with Births | Births / 1,000 Women |
| 15 to 19 years | 0 (0.0%) | 0.0 |
| 20 to 34 years | 106 (100.0%) | 185.0 |
| 35 to 50 years | 0 (0.0%) | 0.0 |
| Total | 106 (100.0%) | 76.0 |
Fertility by Age by Marriage Status in Conley
48.1% of women with births (106) in Conley are married. The highest percentage of unmarried women with births falls into 20 to 34 years age bracket with 51.9% of them unmarried at the time of birth, while the lowest percentage of unmarried women with births belong to 20 to 34 years age bracket with 51.9% of them unmarried.
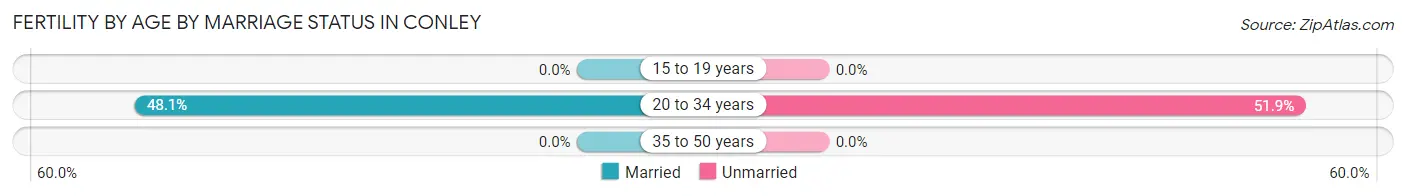
| Age Bracket | Married | Unmarried |
| 15 to 19 years | 0 (0.0%) | 0 (0.0%) |
| 20 to 34 years | 51 (48.1%) | 55 (51.9%) |
| 35 to 50 years | 0 (0.0%) | 0 (0.0%) |
| Total | 51 (48.1%) | 55 (51.9%) |
Fertility by Education in Conley
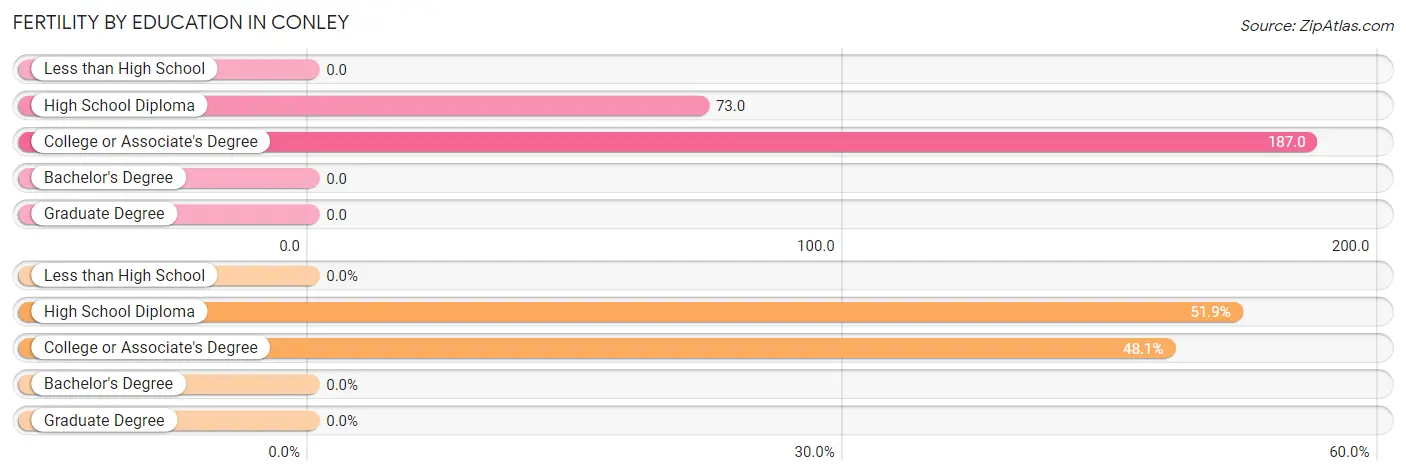
| Educational Attainment | Women with Births | Births / 1,000 Women |
| Less than High School | 0 (0.0%) | 0.0 |
| High School Diploma | 55 (51.9%) | 73.0 |
| College or Associate's Degree | 51 (48.1%) | 187.0 |
| Bachelor's Degree | 0 (0.0%) | 0.0 |
| Graduate Degree | 0 (0.0%) | 0.0 |
| Total | 106 (100.0%) | 76.0 |
Fertility by Education by Marriage Status in Conley
51.9% of women with births in Conley are unmarried. Women with the educational attainment of college or associate's degree are most likely to be married with 100.0% of them married at childbirth, while women with the educational attainment of high school diploma are least likely to be married with 100.0% of them unmarried at childbirth.
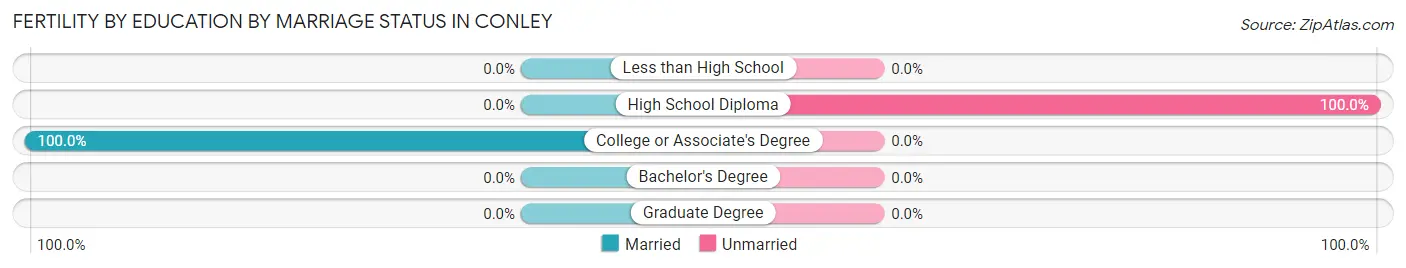
| Educational Attainment | Married | Unmarried |
| Less than High School | 0 (0.0%) | 0 (0.0%) |
| High School Diploma | 0 (0.0%) | 55 (100.0%) |
| College or Associate's Degree | 51 (100.0%) | 0 (0.0%) |
| Bachelor's Degree | 0 (0.0%) | 0 (0.0%) |
| Graduate Degree | 0 (0.0%) | 0 (0.0%) |
| Total | 51 (48.1%) | 55 (51.9%) |
Employment Characteristics in Conley
Employment by Class of Employer in Conley
Among the 2,701 employed individuals in Conley, private company employees (1,641 | 60.8%), self-employed (incorporated) (512 | 19.0%), and local government employees (223 | 8.3%) make up the most common classes of employment.
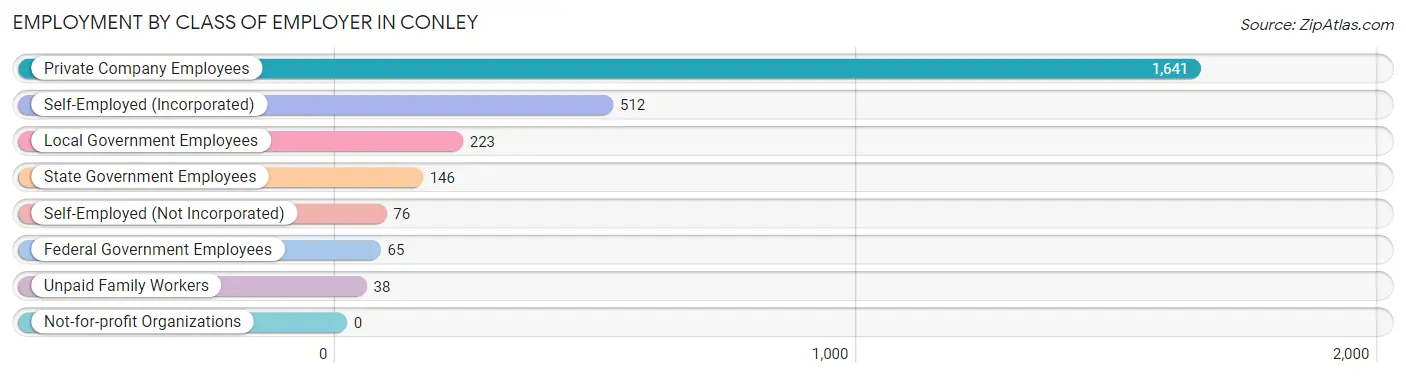
| Employer Class | # Employees | % Employees |
| Private Company Employees | 1,641 | 60.8% |
| Self-Employed (Incorporated) | 512 | 19.0% |
| Self-Employed (Not Incorporated) | 76 | 2.8% |
| Not-for-profit Organizations | 0 | 0.0% |
| Local Government Employees | 223 | 8.3% |
| State Government Employees | 146 | 5.4% |
| Federal Government Employees | 65 | 2.4% |
| Unpaid Family Workers | 38 | 1.4% |
| Total | 2,701 | 100.0% |
Employment Status by Age in Conley
According to the labor force statistics for Conley, out of the total population over 16 years of age (5,034), 56.2% or 2,829 individuals are in the labor force, with 4.6% or 130 of them unemployed. The age group with the highest labor force participation rate is 35 to 44 years, with 85.2% or 528 individuals in the labor force. Within the labor force, the 30 to 34 years age range has the highest percentage of unemployed individuals, with 19.2% or 63 of them being unemployed.
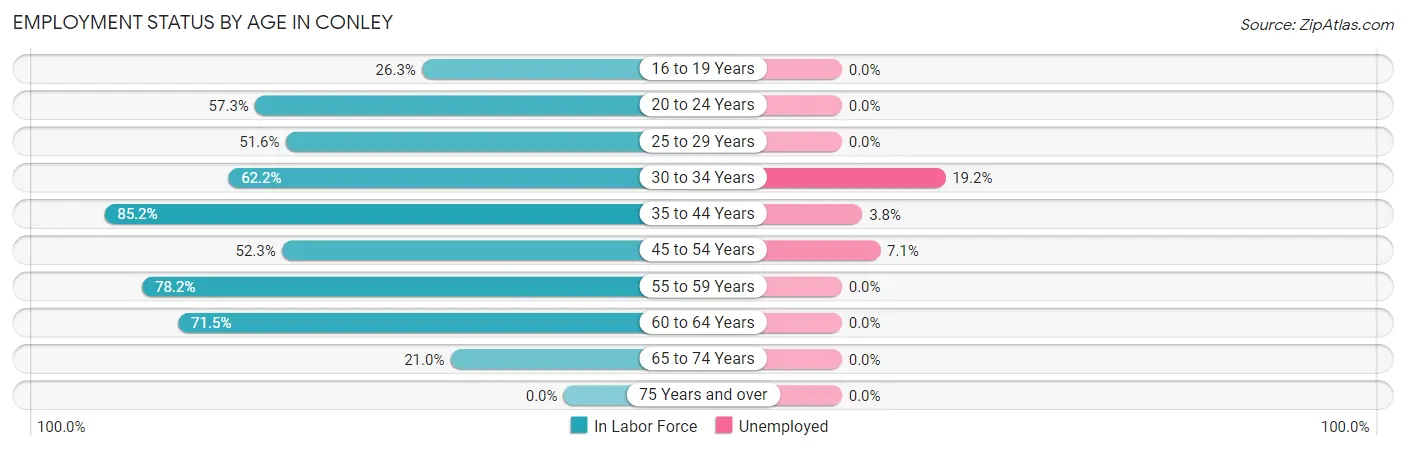
| Age Bracket | In Labor Force | Unemployed |
| 16 to 19 Years | 81 (26.3%) | 0 (0.0%) |
| 20 to 24 Years | 141 (57.3%) | 0 (0.0%) |
| 25 to 29 Years | 115 (51.6%) | 0 (0.0%) |
| 30 to 34 Years | 328 (62.2%) | 63 (19.2%) |
| 35 to 44 Years | 528 (85.2%) | 20 (3.8%) |
| 45 to 54 Years | 645 (52.3%) | 46 (7.1%) |
| 55 to 59 Years | 442 (78.2%) | 0 (0.0%) |
| 60 to 64 Years | 484 (71.5%) | 0 (0.0%) |
| 65 to 74 Years | 66 (21.0%) | 0 (0.0%) |
| 75 Years and over | 0 (0.0%) | 0 (0.0%) |
| Total | 2,829 (56.2%) | 130 (4.6%) |
Employment Status by Educational Attainment in Conley
According to labor force statistics for Conley, 66.1% of individuals (2,542) out of the total population between 25 and 64 years of age (3,846) are in the labor force, with 5.1% or 130 of them being unemployed. The group with the highest labor force participation rate are those with the educational attainment of college / associate degree, with 75.9% or 686 individuals in the labor force. Within the labor force, individuals with bachelor's degree or higher education have the highest percentage of unemployment, with 14.7% or 63 of them being unemployed.
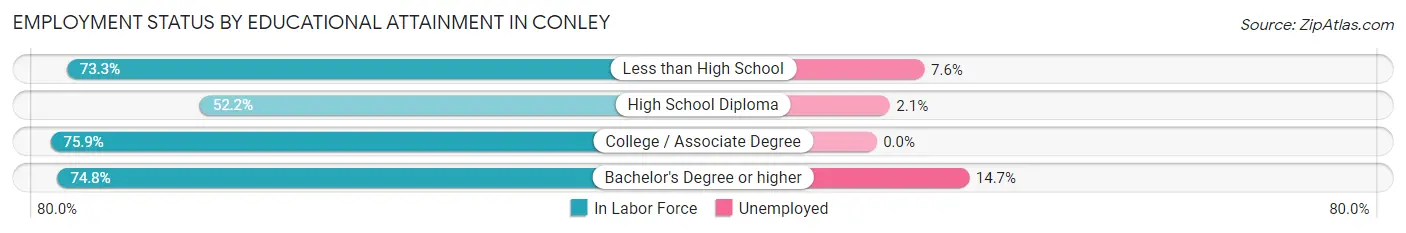
| Educational Attainment | In Labor Force | Unemployed |
| Less than High School | 660 (73.3%) | 68 (7.6%) |
| High School Diploma | 766 (52.2%) | 31 (2.1%) |
| College / Associate Degree | 686 (75.9%) | 0 (0.0%) |
| Bachelor's Degree or higher | 430 (74.8%) | 85 (14.7%) |
| Total | 2,542 (66.1%) | 196 (5.1%) |
Employment Occupations by Sex in Conley
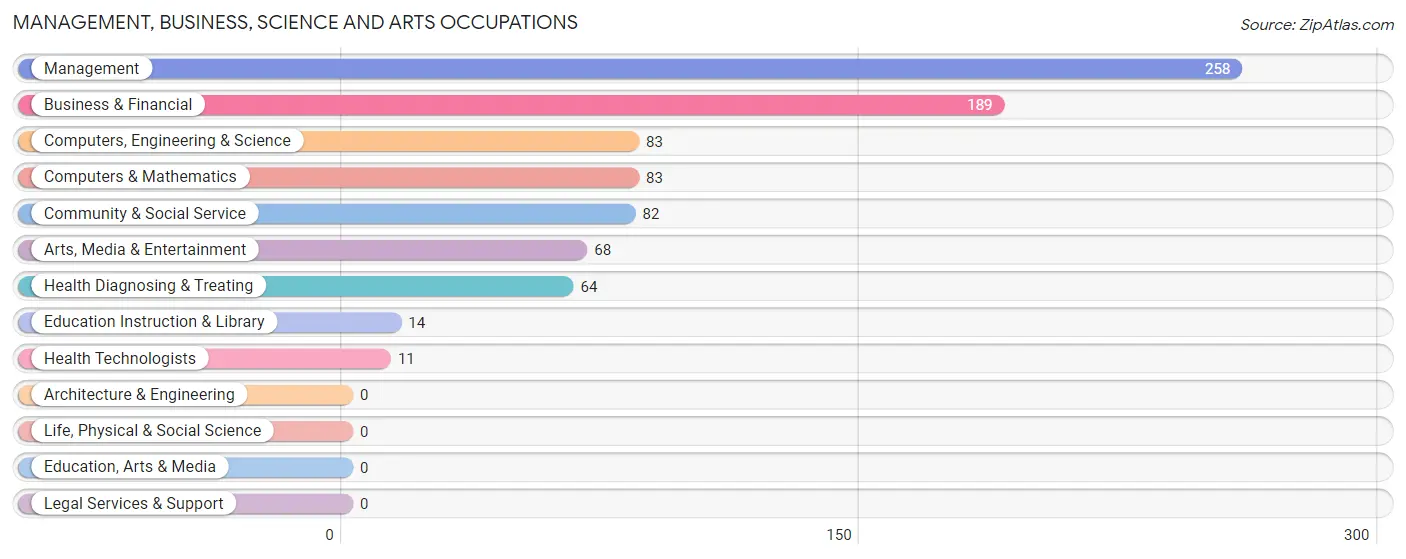
Management, Business, Science and Arts Occupations
The most common Management, Business, Science and Arts occupations in Conley are Management (258 | 9.6%), Business & Financial (189 | 7.0%), Computers, Engineering & Science (83 | 3.1%), Computers & Mathematics (83 | 3.1%), and Community & Social Service (82 | 3.0%).
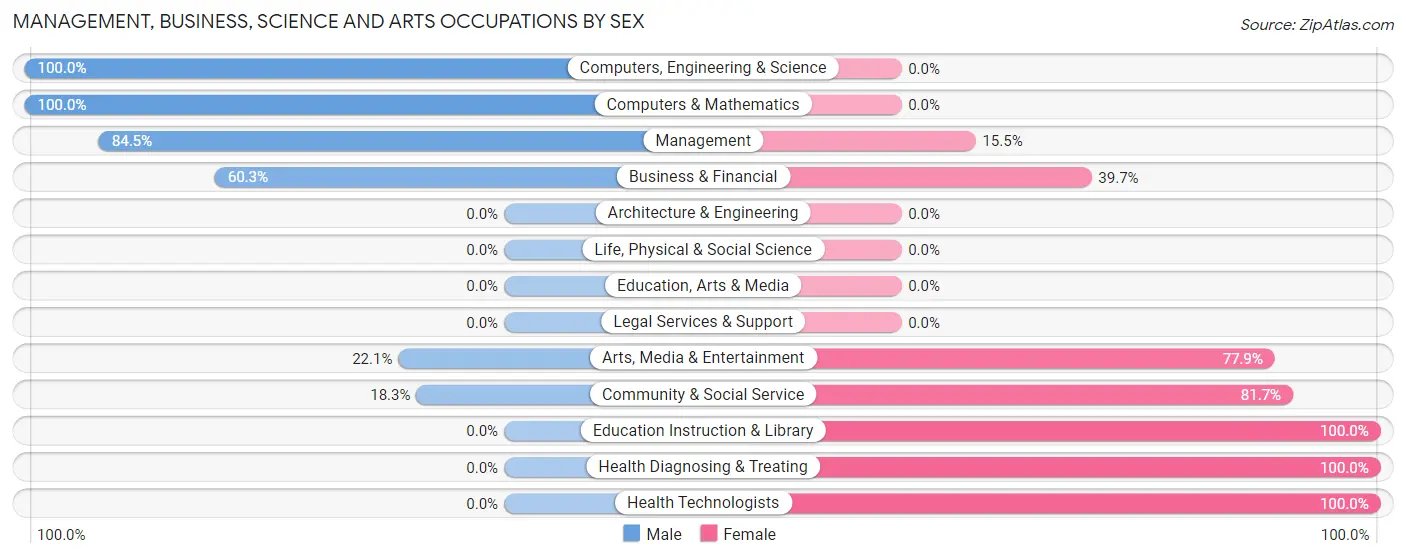
Management, Business, Science and Arts Occupations by Sex
Within the Management, Business, Science and Arts occupations in Conley, the most male-oriented occupations are Computers, Engineering & Science (100.0%), Computers & Mathematics (100.0%), and Management (84.5%), while the most female-oriented occupations are Education Instruction & Library (100.0%), Health Diagnosing & Treating (100.0%), and Health Technologists (100.0%).
| Occupation | Male | Female |
| Management | 218 (84.5%) | 40 (15.5%) |
| Business & Financial | 114 (60.3%) | 75 (39.7%) |
| Computers, Engineering & Science | 83 (100.0%) | 0 (0.0%) |
| Computers & Mathematics | 83 (100.0%) | 0 (0.0%) |
| Architecture & Engineering | 0 (0.0%) | 0 (0.0%) |
| Life, Physical & Social Science | 0 (0.0%) | 0 (0.0%) |
| Community & Social Service | 15 (18.3%) | 67 (81.7%) |
| Education, Arts & Media | 0 (0.0%) | 0 (0.0%) |
| Legal Services & Support | 0 (0.0%) | 0 (0.0%) |
| Education Instruction & Library | 0 (0.0%) | 14 (100.0%) |
| Arts, Media & Entertainment | 15 (22.1%) | 53 (77.9%) |
| Health Diagnosing & Treating | 0 (0.0%) | 64 (100.0%) |
| Health Technologists | 0 (0.0%) | 11 (100.0%) |
| Total (Category) | 430 (63.6%) | 246 (36.4%) |
| Total (Overall) | 1,477 (54.7%) | 1,224 (45.3%) |
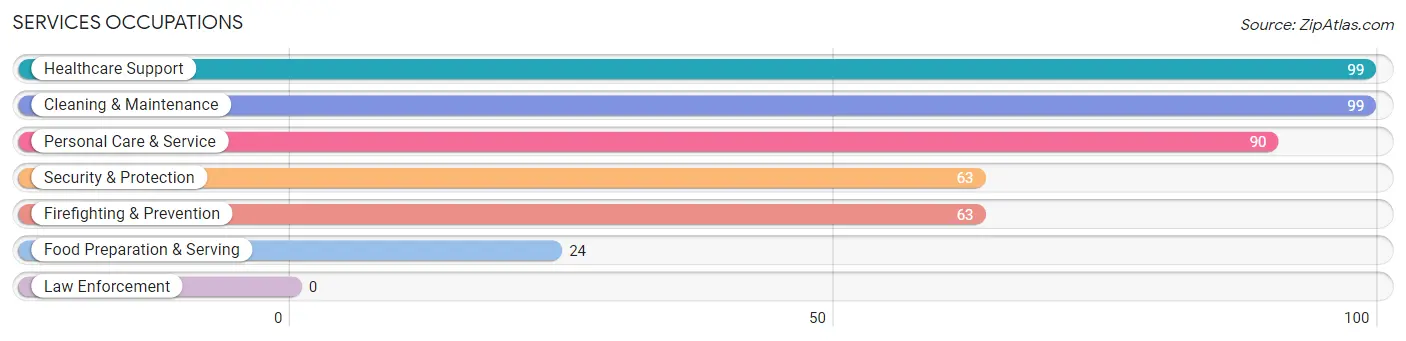
Services Occupations
The most common Services occupations in Conley are Healthcare Support (99 | 3.7%), Cleaning & Maintenance (99 | 3.7%), Personal Care & Service (90 | 3.3%), Security & Protection (63 | 2.3%), and Firefighting & Prevention (63 | 2.3%).
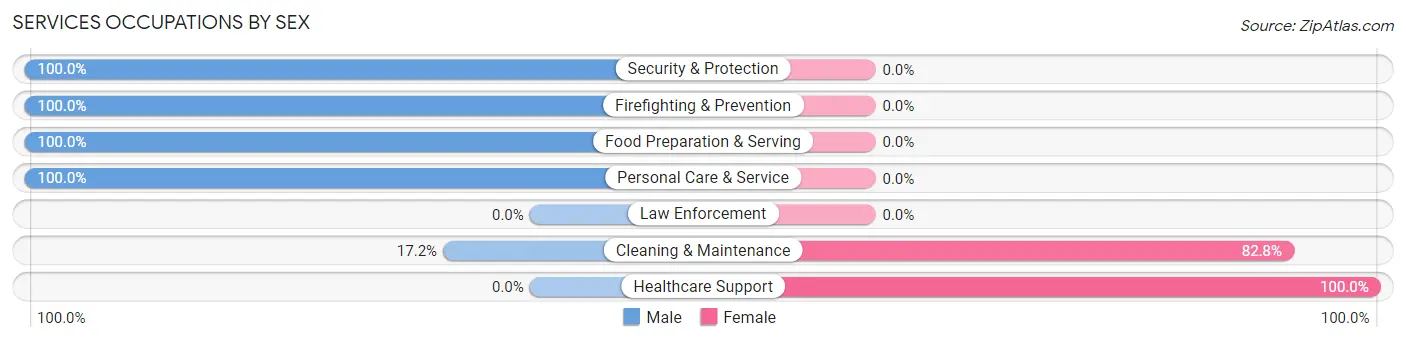
Services Occupations by Sex
Within the Services occupations in Conley, the most male-oriented occupations are Security & Protection (100.0%), Firefighting & Prevention (100.0%), and Food Preparation & Serving (100.0%), while the most female-oriented occupations are Healthcare Support (100.0%), and Cleaning & Maintenance (82.8%).
| Occupation | Male | Female |
| Healthcare Support | 0 (0.0%) | 99 (100.0%) |
| Security & Protection | 63 (100.0%) | 0 (0.0%) |
| Firefighting & Prevention | 63 (100.0%) | 0 (0.0%) |
| Law Enforcement | 0 (0.0%) | 0 (0.0%) |
| Food Preparation & Serving | 24 (100.0%) | 0 (0.0%) |
| Cleaning & Maintenance | 17 (17.2%) | 82 (82.8%) |
| Personal Care & Service | 90 (100.0%) | 0 (0.0%) |
| Total (Category) | 194 (51.7%) | 181 (48.3%) |
| Total (Overall) | 1,477 (54.7%) | 1,224 (45.3%) |
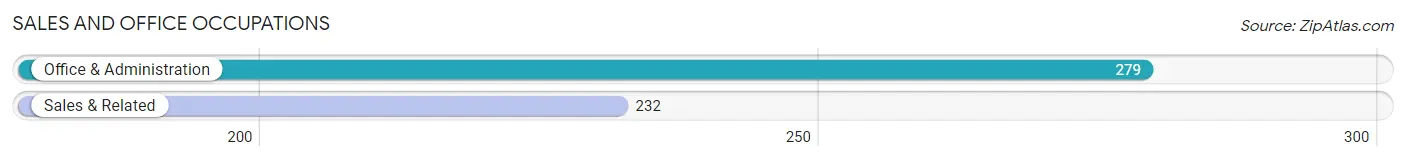
Sales and Office Occupations
The most common Sales and Office occupations in Conley are Office & Administration (279 | 10.3%), and Sales & Related (232 | 8.6%).
Sales and Office Occupations by Sex
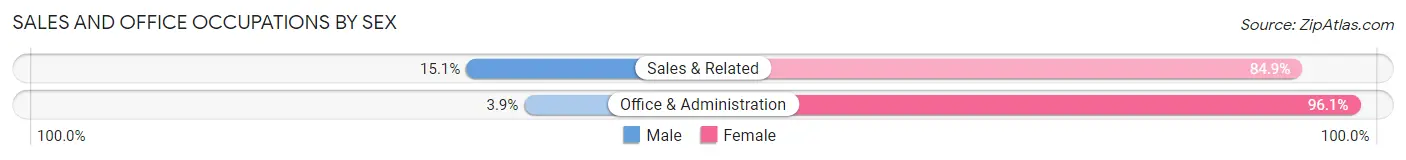
| Occupation | Male | Female |
| Sales & Related | 35 (15.1%) | 197 (84.9%) |
| Office & Administration | 11 (3.9%) | 268 (96.1%) |
| Total (Category) | 46 (9.0%) | 465 (91.0%) |
| Total (Overall) | 1,477 (54.7%) | 1,224 (45.3%) |
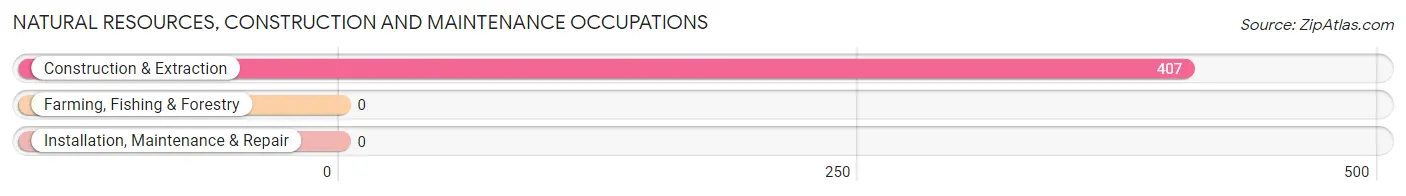
Natural Resources, Construction and Maintenance Occupations
The most common Natural Resources, Construction and Maintenance occupations in Conley are , and Construction & Extraction (407 | 15.1%).
Natural Resources, Construction and Maintenance Occupations by Sex
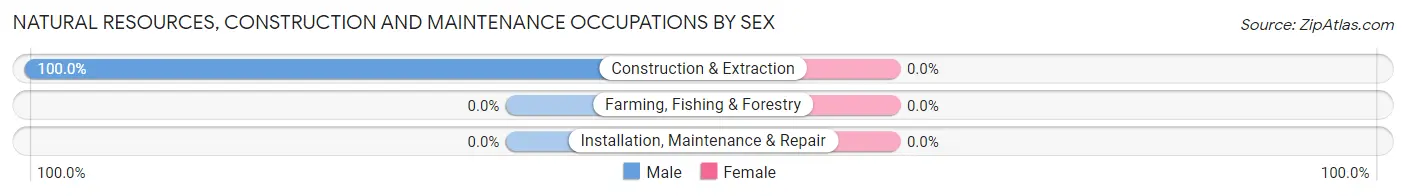
| Occupation | Male | Female |
| Farming, Fishing & Forestry | 0 (0.0%) | 0 (0.0%) |
| Construction & Extraction | 407 (100.0%) | 0 (0.0%) |
| Installation, Maintenance & Repair | 0 (0.0%) | 0 (0.0%) |
| Total (Category) | 407 (100.0%) | 0 (0.0%) |
| Total (Overall) | 1,477 (54.7%) | 1,224 (45.3%) |
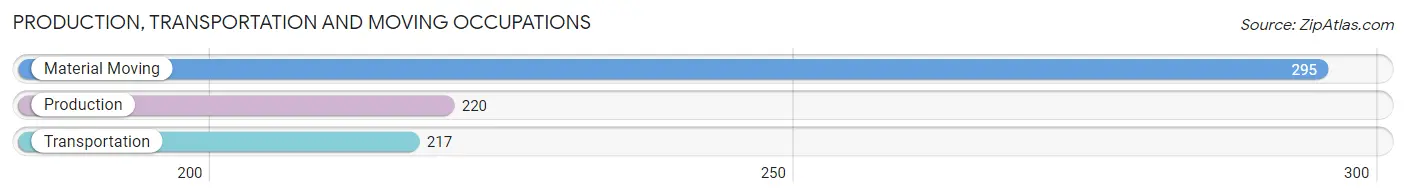
Production, Transportation and Moving Occupations
The most common Production, Transportation and Moving occupations in Conley are Material Moving (295 | 10.9%), Production (220 | 8.2%), and Transportation (217 | 8.0%).
Production, Transportation and Moving Occupations by Sex
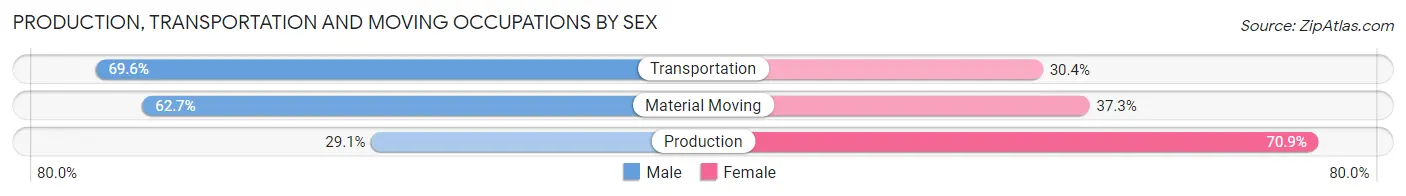
| Occupation | Male | Female |
| Production | 64 (29.1%) | 156 (70.9%) |
| Transportation | 151 (69.6%) | 66 (30.4%) |
| Material Moving | 185 (62.7%) | 110 (37.3%) |
| Total (Category) | 400 (54.6%) | 332 (45.4%) |
| Total (Overall) | 1,477 (54.7%) | 1,224 (45.3%) |
Employment Industries by Sex in Conley
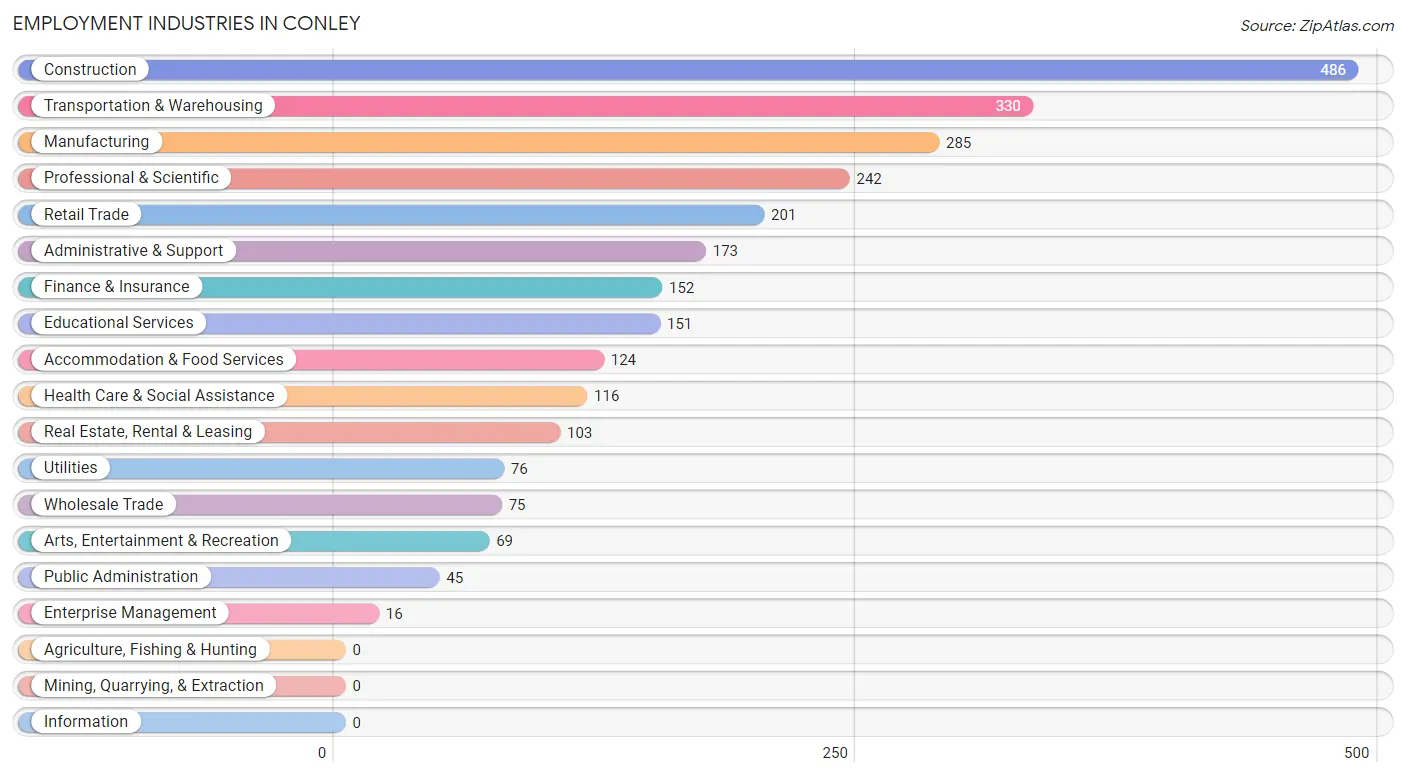
Employment Industries in Conley
The major employment industries in Conley include Construction (486 | 18.0%), Transportation & Warehousing (330 | 12.2%), Manufacturing (285 | 10.5%), Professional & Scientific (242 | 9.0%), and Retail Trade (201 | 7.4%).
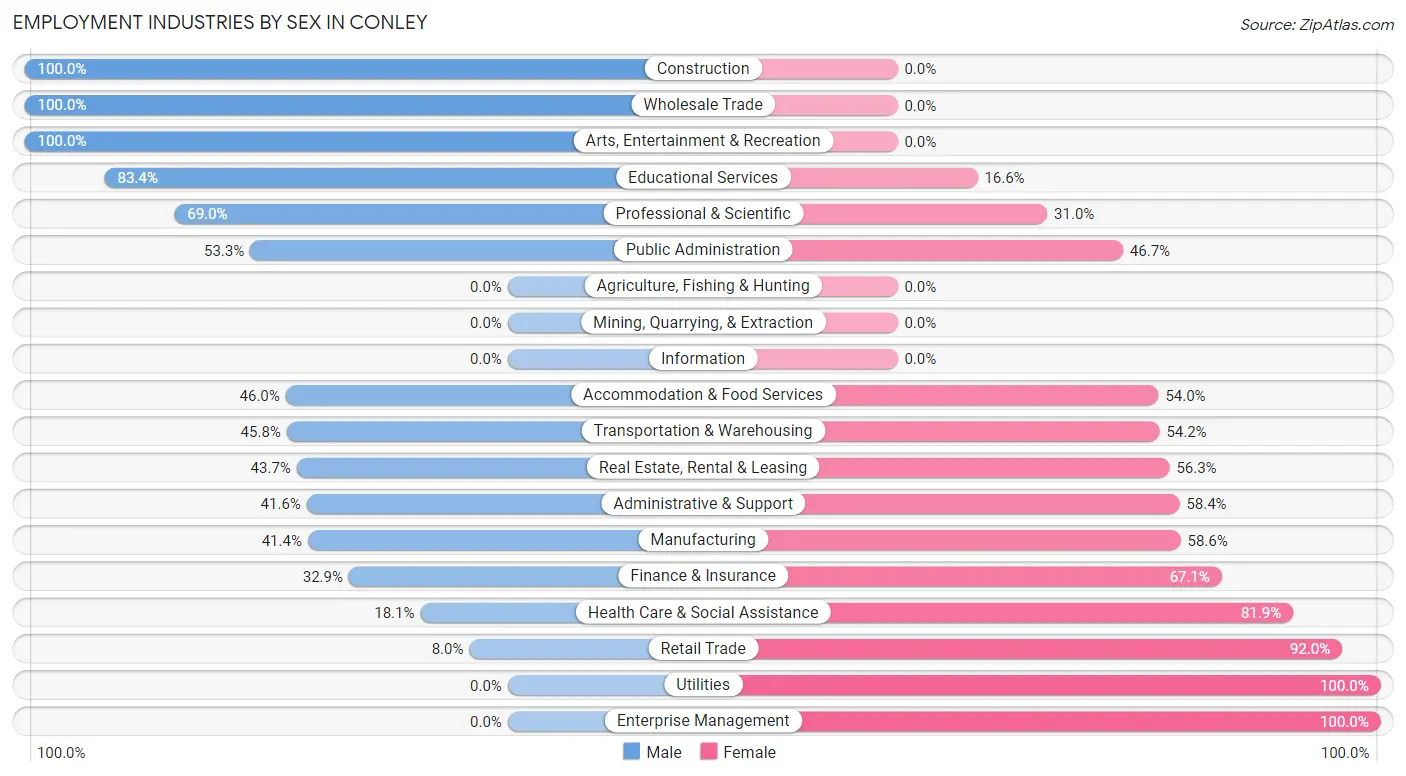
Employment Industries by Sex in Conley
The Conley industries that see more men than women are Construction (100.0%), Wholesale Trade (100.0%), and Arts, Entertainment & Recreation (100.0%), whereas the industries that tend to have a higher number of women are Utilities (100.0%), Enterprise Management (100.0%), and Retail Trade (92.0%).
| Industry | Male | Female |
| Agriculture, Fishing & Hunting | 0 (0.0%) | 0 (0.0%) |
| Mining, Quarrying, & Extraction | 0 (0.0%) | 0 (0.0%) |
| Construction | 486 (100.0%) | 0 (0.0%) |
| Manufacturing | 118 (41.4%) | 167 (58.6%) |
| Wholesale Trade | 75 (100.0%) | 0 (0.0%) |
| Retail Trade | 16 (8.0%) | 185 (92.0%) |
| Transportation & Warehousing | 151 (45.8%) | 179 (54.2%) |
| Utilities | 0 (0.0%) | 76 (100.0%) |
| Information | 0 (0.0%) | 0 (0.0%) |
| Finance & Insurance | 50 (32.9%) | 102 (67.1%) |
| Real Estate, Rental & Leasing | 45 (43.7%) | 58 (56.3%) |
| Professional & Scientific | 167 (69.0%) | 75 (31.0%) |
| Enterprise Management | 0 (0.0%) | 16 (100.0%) |
| Administrative & Support | 72 (41.6%) | 101 (58.4%) |
| Educational Services | 126 (83.4%) | 25 (16.6%) |
| Health Care & Social Assistance | 21 (18.1%) | 95 (81.9%) |
| Arts, Entertainment & Recreation | 69 (100.0%) | 0 (0.0%) |
| Accommodation & Food Services | 57 (46.0%) | 67 (54.0%) |
| Public Administration | 24 (53.3%) | 21 (46.7%) |
| Total | 1,477 (54.7%) | 1,224 (45.3%) |
Education in Conley
School Enrollment in Conley
The most common levels of schooling among the 1,070 students in Conley are college / undergraduate (302 | 28.2%), middle school (248 | 23.2%), and elementary school (234 | 21.9%).
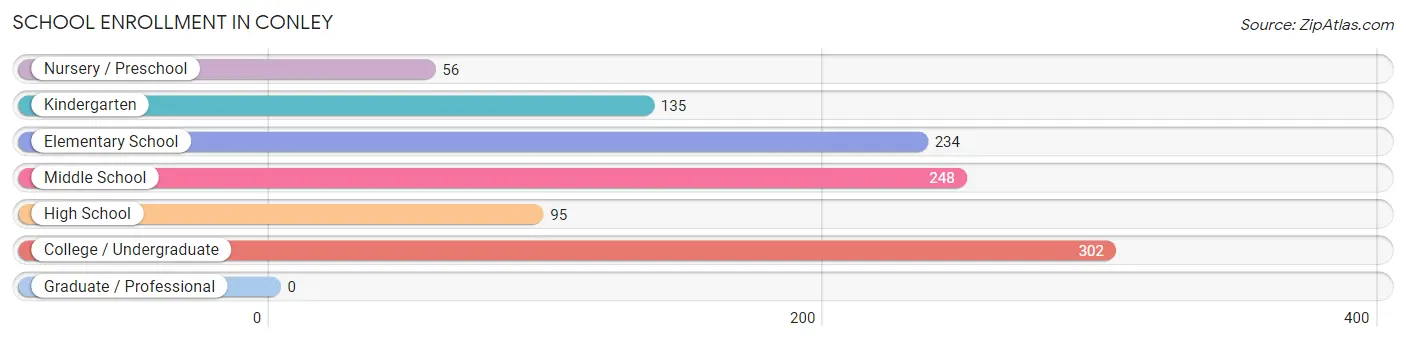
| School Level | # Students | % Students |
| Nursery / Preschool | 56 | 5.2% |
| Kindergarten | 135 | 12.6% |
| Elementary School | 234 | 21.9% |
| Middle School | 248 | 23.2% |
| High School | 95 | 8.9% |
| College / Undergraduate | 302 | 28.2% |
| Graduate / Professional | 0 | 0.0% |
| Total | 1,070 | 100.0% |
School Enrollment by Age by Funding Source in Conley
Out of a total of 1,070 students who are enrolled in schools in Conley, 221 (20.7%) attend a private institution, while the remaining 849 (79.3%) are enrolled in public schools. The age group of 35 years and over has the highest likelihood of being enrolled in private schools, with 26 (100.0% in the age bracket) enrolled. Conversely, the age group of 3 to 4 year olds has the lowest likelihood of being enrolled in a private school, with 62 (100.0% in the age bracket) attending a public institution.
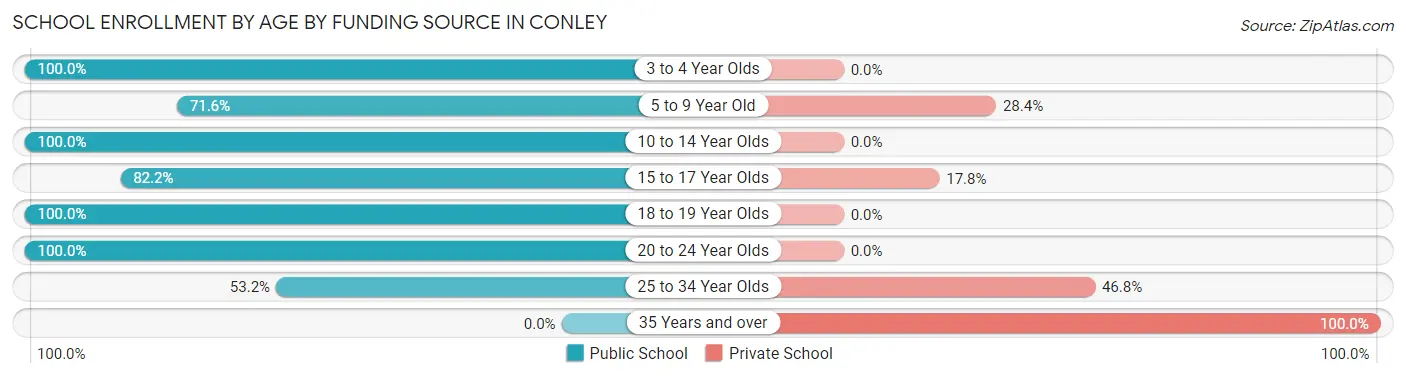
| Age Bracket | Public School | Private School |
| 3 to 4 Year Olds | 62 (100.0%) | 0 (0.0%) |
| 5 to 9 Year Old | 260 (71.6%) | 103 (28.4%) |
| 10 to 14 Year Olds | 248 (100.0%) | 0 (0.0%) |
| 15 to 17 Year Olds | 120 (82.2%) | 26 (17.8%) |
| 18 to 19 Year Olds | 14 (100.0%) | 0 (0.0%) |
| 20 to 24 Year Olds | 70 (100.0%) | 0 (0.0%) |
| 25 to 34 Year Olds | 75 (53.2%) | 66 (46.8%) |
| 35 Years and over | 0 (0.0%) | 26 (100.0%) |
| Total | 849 (79.3%) | 221 (20.7%) |
Educational Attainment by Field of Study in Conley
Business (194 | 28.2%), education (98 | 14.2%), visual & performing arts (75 | 10.9%), computers & mathematics (63 | 9.2%), and literature & languages (62 | 9.0%) are the most common fields of study among 688 individuals in Conley who have obtained a bachelor's degree or higher.
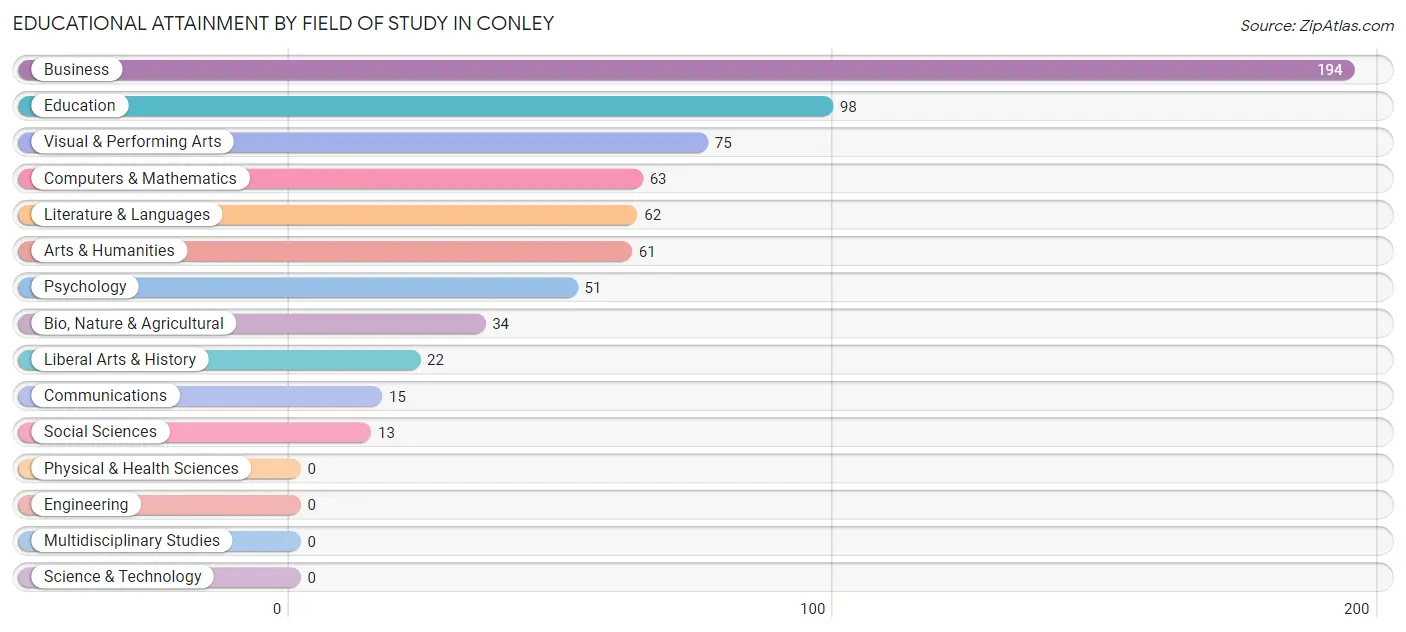
| Field of Study | # Graduates | % Graduates |
| Computers & Mathematics | 63 | 9.2% |
| Bio, Nature & Agricultural | 34 | 4.9% |
| Physical & Health Sciences | 0 | 0.0% |
| Psychology | 51 | 7.4% |
| Social Sciences | 13 | 1.9% |
| Engineering | 0 | 0.0% |
| Multidisciplinary Studies | 0 | 0.0% |
| Science & Technology | 0 | 0.0% |
| Business | 194 | 28.2% |
| Education | 98 | 14.2% |
| Literature & Languages | 62 | 9.0% |
| Liberal Arts & History | 22 | 3.2% |
| Visual & Performing Arts | 75 | 10.9% |
| Communications | 15 | 2.2% |
| Arts & Humanities | 61 | 8.9% |
| Total | 688 | 100.0% |
Transportation & Commute in Conley
Vehicle Availability by Sex in Conley
The most prevalent vehicle ownership categories in Conley are males with 1 vehicle (612, accounting for 41.4%) and females with 1 vehicle (391, making up 50.0%).
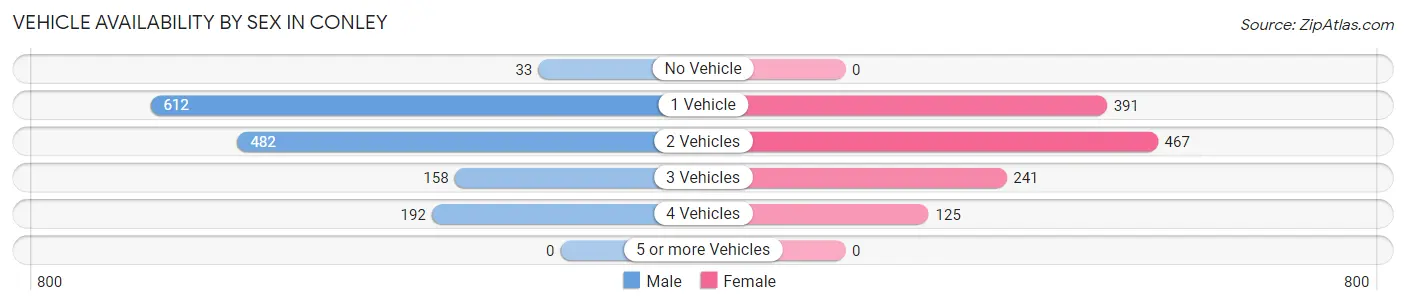
| Vehicles Available | Male | Female |
| No Vehicle | 33 (2.2%) | 0 (0.0%) |
| 1 Vehicle | 612 (41.4%) | 391 (31.9%) |
| 2 Vehicles | 482 (32.6%) | 467 (38.2%) |
| 3 Vehicles | 158 (10.7%) | 241 (19.7%) |
| 4 Vehicles | 192 (13.0%) | 125 (10.2%) |
| 5 or more Vehicles | 0 (0.0%) | 0 (0.0%) |
| Total | 1,477 (100.0%) | 1,224 (100.0%) |
Commute Time in Conley
The most frequently occuring commute durations in Conley are 30 to 34 minutes (612 commuters, 23.8%), 20 to 24 minutes (435 commuters, 16.9%), and 15 to 19 minutes (352 commuters, 13.7%).
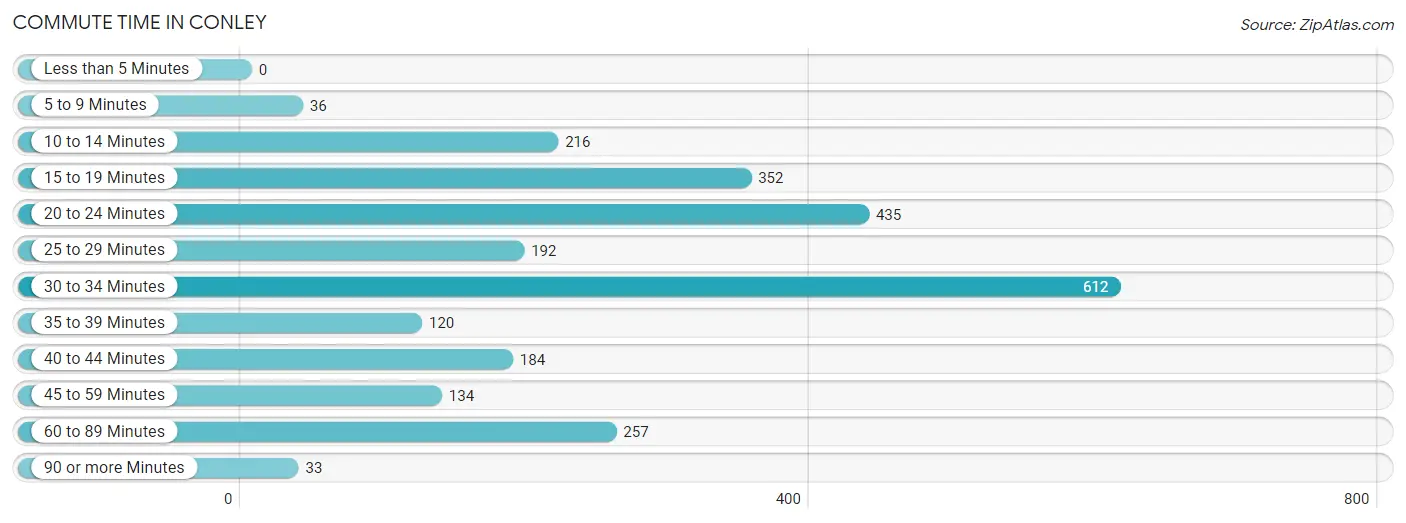
| Commute Time | # Commuters | % Commuters |
| Less than 5 Minutes | 0 | 0.0% |
| 5 to 9 Minutes | 36 | 1.4% |
| 10 to 14 Minutes | 216 | 8.4% |
| 15 to 19 Minutes | 352 | 13.7% |
| 20 to 24 Minutes | 435 | 16.9% |
| 25 to 29 Minutes | 192 | 7.5% |
| 30 to 34 Minutes | 612 | 23.8% |
| 35 to 39 Minutes | 120 | 4.7% |
| 40 to 44 Minutes | 184 | 7.2% |
| 45 to 59 Minutes | 134 | 5.2% |
| 60 to 89 Minutes | 257 | 10.0% |
| 90 or more Minutes | 33 | 1.3% |
Commute Time by Sex in Conley
The most common commute times in Conley are 30 to 34 minutes (543 commuters, 37.4%) for males and 20 to 24 minutes (327 commuters, 29.2%) for females.
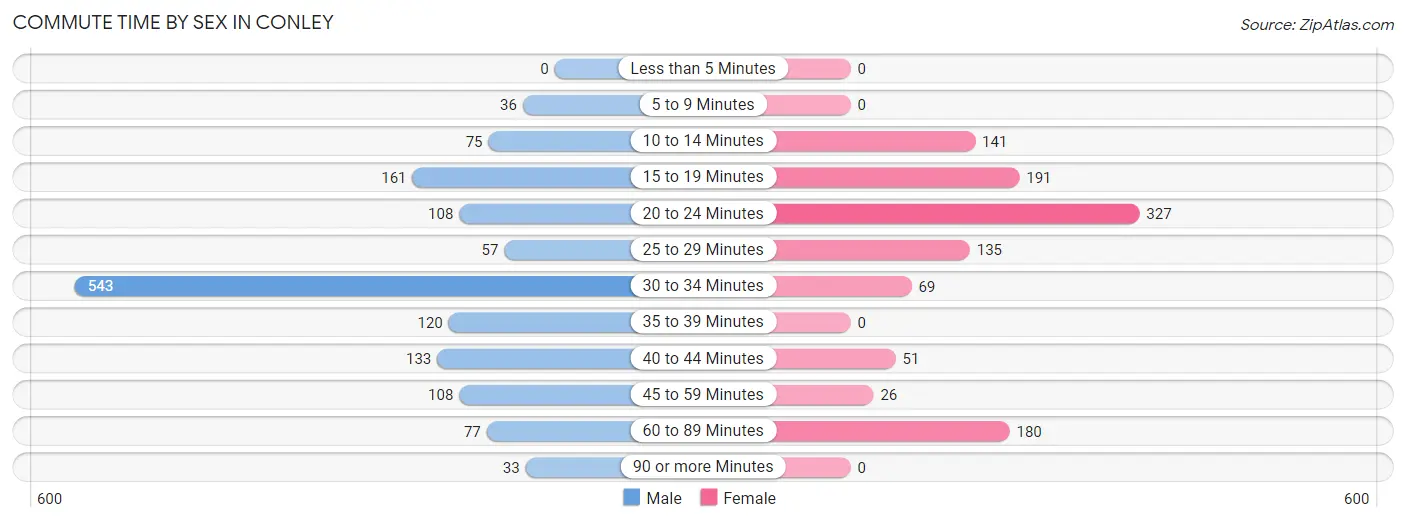
| Commute Time | Male | Female |
| Less than 5 Minutes | 0 (0.0%) | 0 (0.0%) |
| 5 to 9 Minutes | 36 (2.5%) | 0 (0.0%) |
| 10 to 14 Minutes | 75 (5.2%) | 141 (12.6%) |
| 15 to 19 Minutes | 161 (11.1%) | 191 (17.1%) |
| 20 to 24 Minutes | 108 (7.4%) | 327 (29.2%) |
| 25 to 29 Minutes | 57 (3.9%) | 135 (12.0%) |
| 30 to 34 Minutes | 543 (37.4%) | 69 (6.2%) |
| 35 to 39 Minutes | 120 (8.3%) | 0 (0.0%) |
| 40 to 44 Minutes | 133 (9.2%) | 51 (4.5%) |
| 45 to 59 Minutes | 108 (7.4%) | 26 (2.3%) |
| 60 to 89 Minutes | 77 (5.3%) | 180 (16.1%) |
| 90 or more Minutes | 33 (2.3%) | 0 (0.0%) |
Time of Departure to Work by Sex in Conley
The most frequent times of departure to work in Conley are 5:30 AM to 5:59 AM (429, 29.6%) for males and 6:00 AM to 6:29 AM (235, 21.0%) for females.
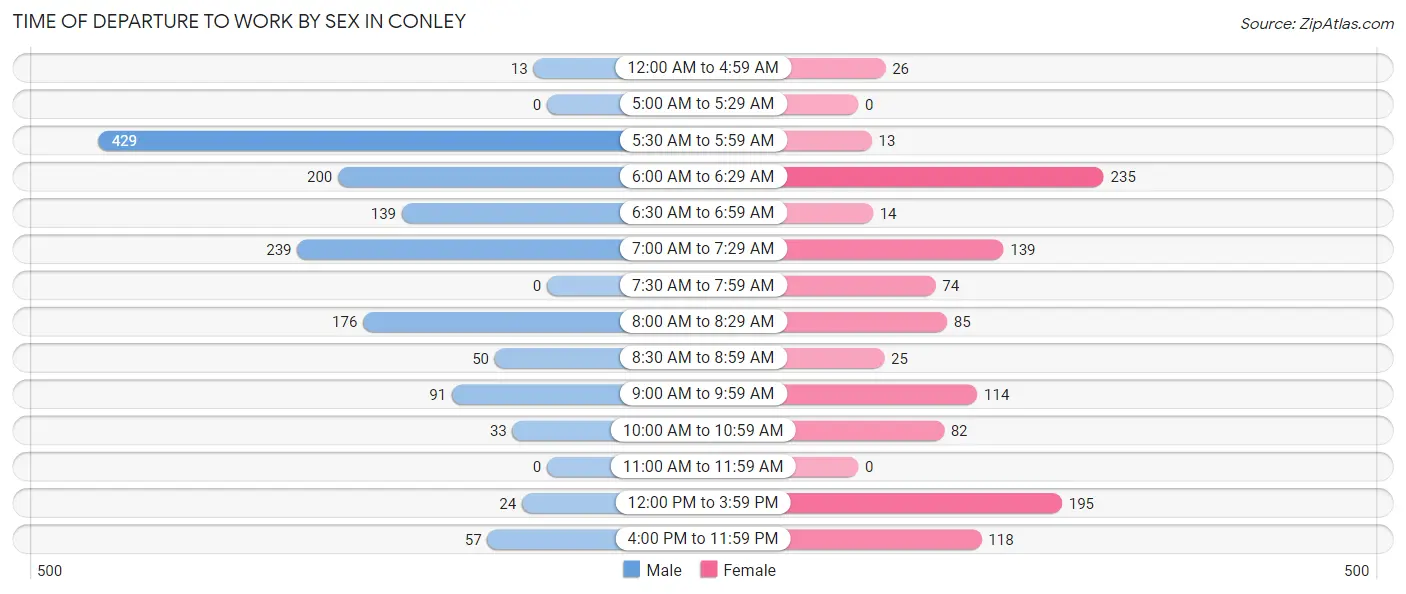
| Time of Departure | Male | Female |
| 12:00 AM to 4:59 AM | 13 (0.9%) | 26 (2.3%) |
| 5:00 AM to 5:29 AM | 0 (0.0%) | 0 (0.0%) |
| 5:30 AM to 5:59 AM | 429 (29.6%) | 13 (1.2%) |
| 6:00 AM to 6:29 AM | 200 (13.8%) | 235 (21.0%) |
| 6:30 AM to 6:59 AM | 139 (9.6%) | 14 (1.3%) |
| 7:00 AM to 7:29 AM | 239 (16.5%) | 139 (12.4%) |
| 7:30 AM to 7:59 AM | 0 (0.0%) | 74 (6.6%) |
| 8:00 AM to 8:29 AM | 176 (12.1%) | 85 (7.6%) |
| 8:30 AM to 8:59 AM | 50 (3.5%) | 25 (2.2%) |
| 9:00 AM to 9:59 AM | 91 (6.3%) | 114 (10.2%) |
| 10:00 AM to 10:59 AM | 33 (2.3%) | 82 (7.3%) |
| 11:00 AM to 11:59 AM | 0 (0.0%) | 0 (0.0%) |
| 12:00 PM to 3:59 PM | 24 (1.7%) | 195 (17.4%) |
| 4:00 PM to 11:59 PM | 57 (3.9%) | 118 (10.5%) |
| Total | 1,451 (100.0%) | 1,120 (100.0%) |
Housing Occupancy in Conley
Occupancy by Ownership in Conley
Of the total 2,690 dwellings in Conley, owner-occupied units account for 1,877 (69.8%), while renter-occupied units make up 813 (30.2%).
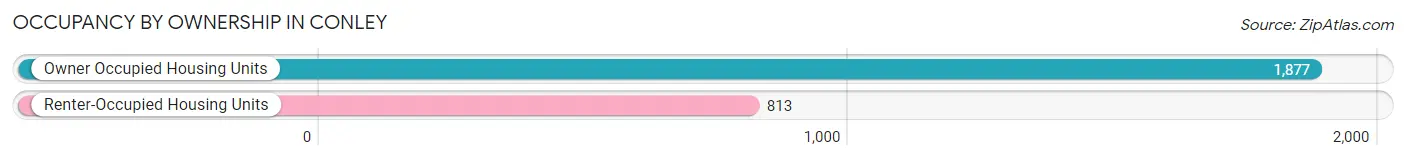
| Occupancy | # Housing Units | % Housing Units |
| Owner Occupied Housing Units | 1,877 | 69.8% |
| Renter-Occupied Housing Units | 813 | 30.2% |
| Total Occupied Housing Units | 2,690 | 100.0% |
Occupancy by Household Size in Conley
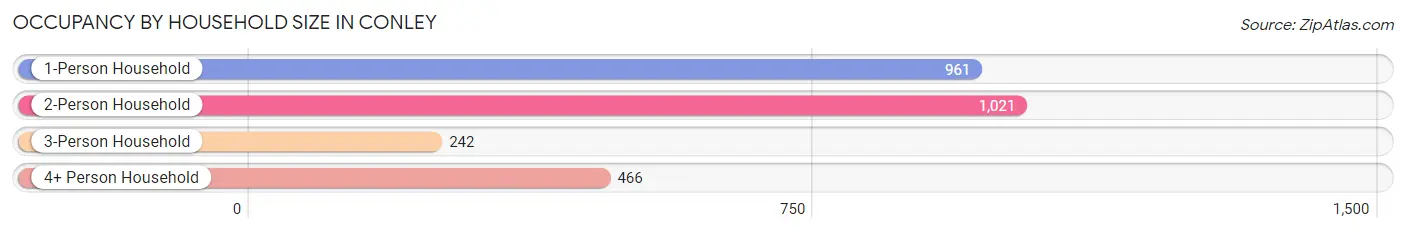
| Household Size | # Housing Units | % Housing Units |
| 1-Person Household | 961 | 35.7% |
| 2-Person Household | 1,021 | 38.0% |
| 3-Person Household | 242 | 9.0% |
| 4+ Person Household | 466 | 17.3% |
| Total Housing Units | 2,690 | 100.0% |
Occupancy by Ownership by Household Size in Conley
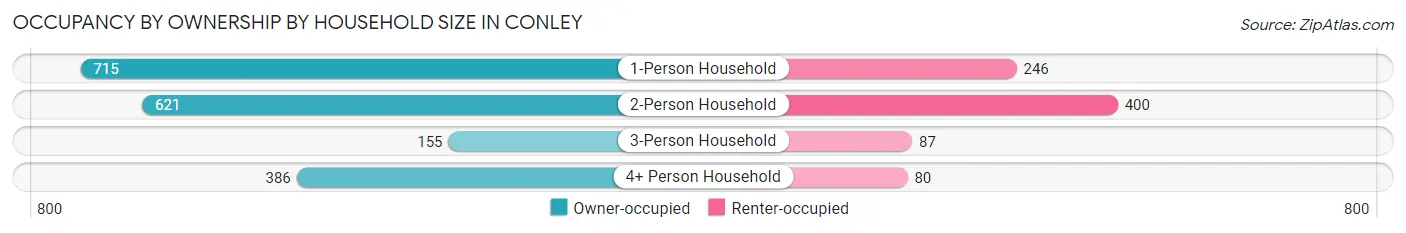
| Household Size | Owner-occupied | Renter-occupied |
| 1-Person Household | 715 (74.4%) | 246 (25.6%) |
| 2-Person Household | 621 (60.8%) | 400 (39.2%) |
| 3-Person Household | 155 (64.0%) | 87 (35.9%) |
| 4+ Person Household | 386 (82.8%) | 80 (17.2%) |
| Total Housing Units | 1,877 (69.8%) | 813 (30.2%) |
Occupancy by Educational Attainment in Conley
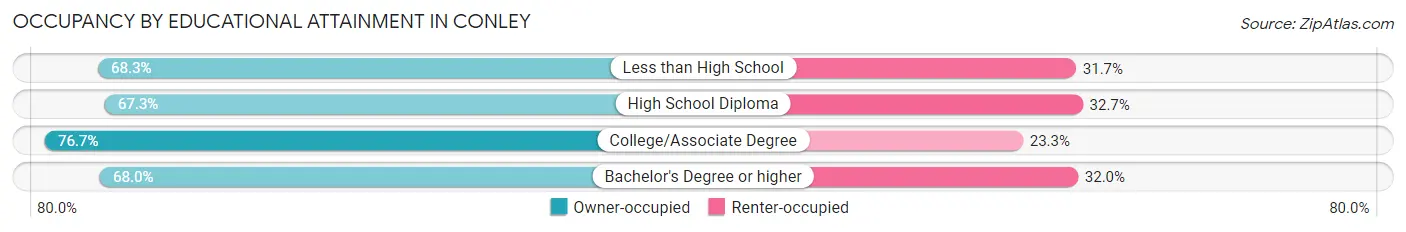
| Household Size | Owner-occupied | Renter-occupied |
| Less than High School | 453 (68.3%) | 210 (31.7%) |
| High School Diploma | 641 (67.3%) | 312 (32.7%) |
| College/Associate Degree | 462 (76.7%) | 140 (23.3%) |
| Bachelor's Degree or higher | 321 (68.0%) | 151 (32.0%) |
Occupancy by Age of Householder in Conley
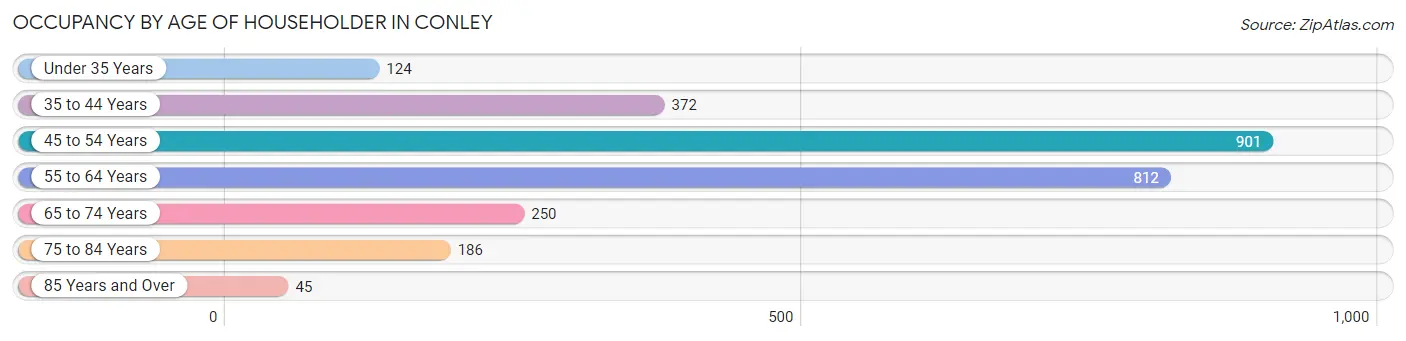
| Age Bracket | # Households | % Households |
| Under 35 Years | 124 | 4.6% |
| 35 to 44 Years | 372 | 13.8% |
| 45 to 54 Years | 901 | 33.5% |
| 55 to 64 Years | 812 | 30.2% |
| 65 to 74 Years | 250 | 9.3% |
| 75 to 84 Years | 186 | 6.9% |
| 85 Years and Over | 45 | 1.7% |
| Total | 2,690 | 100.0% |
Housing Finances in Conley
Median Income by Occupancy in Conley
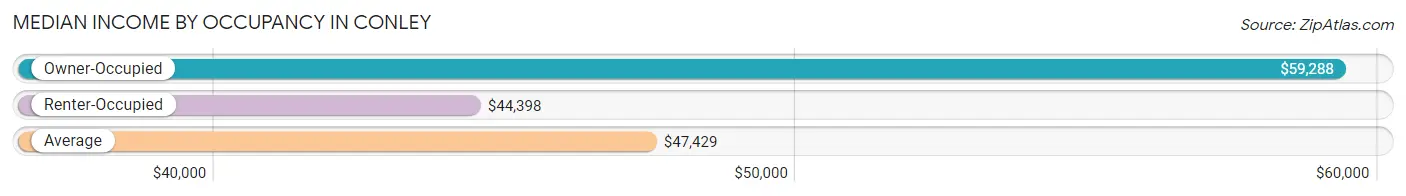
| Occupancy Type | # Households | Median Income |
| Owner-Occupied | 1,877 (69.8%) | $59,288 |
| Renter-Occupied | 813 (30.2%) | $44,398 |
| Average | 2,690 (100.0%) | $47,429 |
Occupancy by Householder Income Bracket in Conley
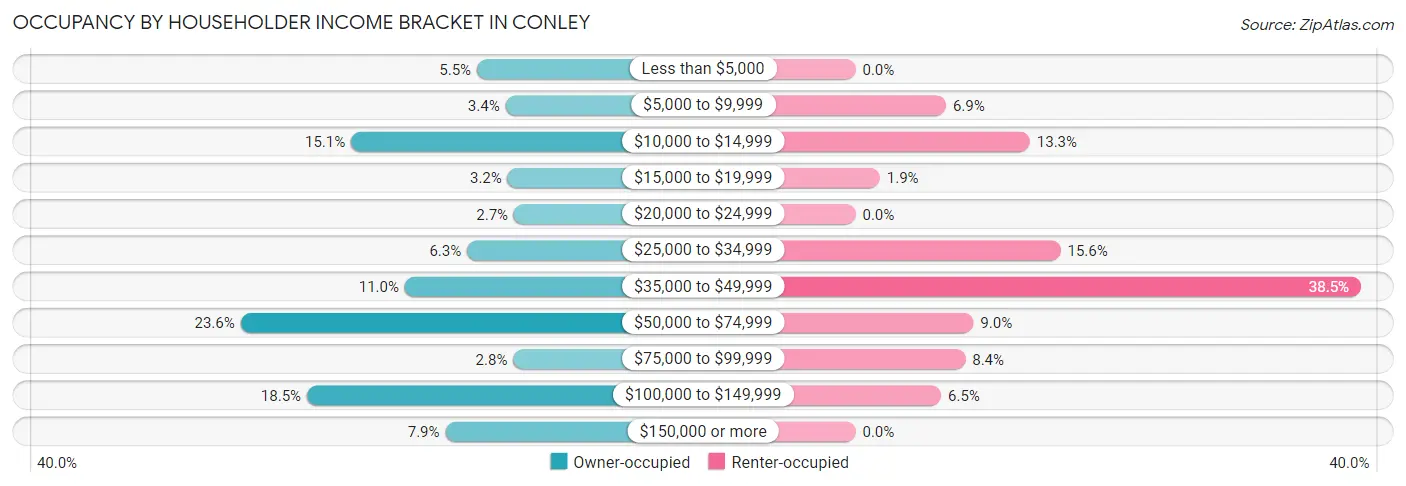
| Income Bracket | Owner-occupied | Renter-occupied |
| Less than $5,000 | 104 (5.5%) | 0 (0.0%) |
| $5,000 to $9,999 | 63 (3.4%) | 56 (6.9%) |
| $10,000 to $14,999 | 284 (15.1%) | 108 (13.3%) |
| $15,000 to $19,999 | 60 (3.2%) | 15 (1.8%) |
| $20,000 to $24,999 | 51 (2.7%) | 0 (0.0%) |
| $25,000 to $34,999 | 118 (6.3%) | 127 (15.6%) |
| $35,000 to $49,999 | 207 (11.0%) | 313 (38.5%) |
| $50,000 to $74,999 | 442 (23.5%) | 73 (9.0%) |
| $75,000 to $99,999 | 52 (2.8%) | 68 (8.4%) |
| $100,000 to $149,999 | 347 (18.5%) | 53 (6.5%) |
| $150,000 or more | 149 (7.9%) | 0 (0.0%) |
| Total | 1,877 (100.0%) | 813 (100.0%) |
Monthly Housing Cost Tiers in Conley
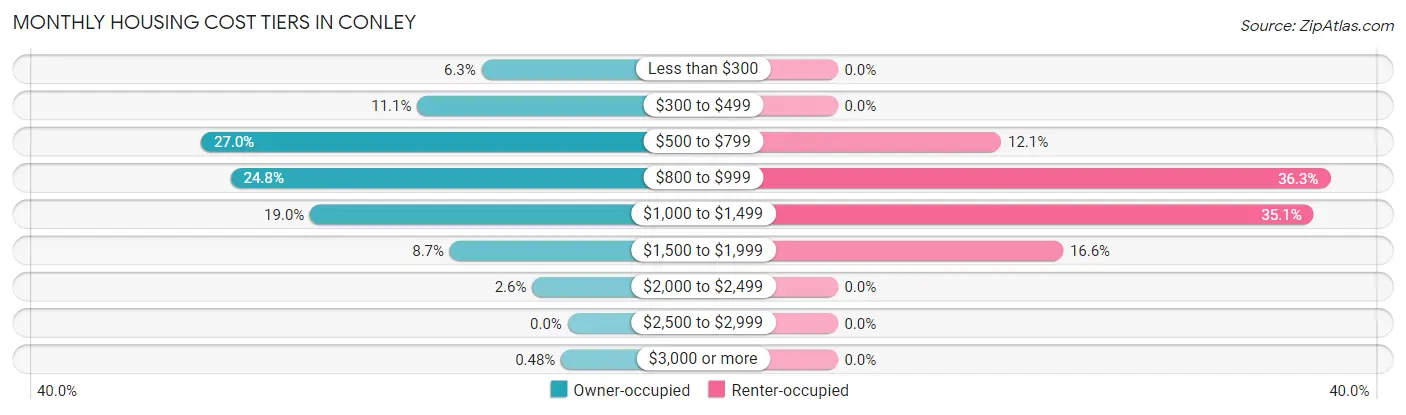
| Monthly Cost | Owner-occupied | Renter-occupied |
| Less than $300 | 119 (6.3%) | 0 (0.0%) |
| $300 to $499 | 208 (11.1%) | 0 (0.0%) |
| $500 to $799 | 507 (27.0%) | 98 (12.0%) |
| $800 to $999 | 466 (24.8%) | 295 (36.3%) |
| $1,000 to $1,499 | 356 (19.0%) | 285 (35.1%) |
| $1,500 to $1,999 | 163 (8.7%) | 135 (16.6%) |
| $2,000 to $2,499 | 49 (2.6%) | 0 (0.0%) |
| $2,500 to $2,999 | 0 (0.0%) | 0 (0.0%) |
| $3,000 or more | 9 (0.5%) | 0 (0.0%) |
| Total | 1,877 (100.0%) | 813 (100.0%) |
Physical Housing Characteristics in Conley
Housing Structures in Conley
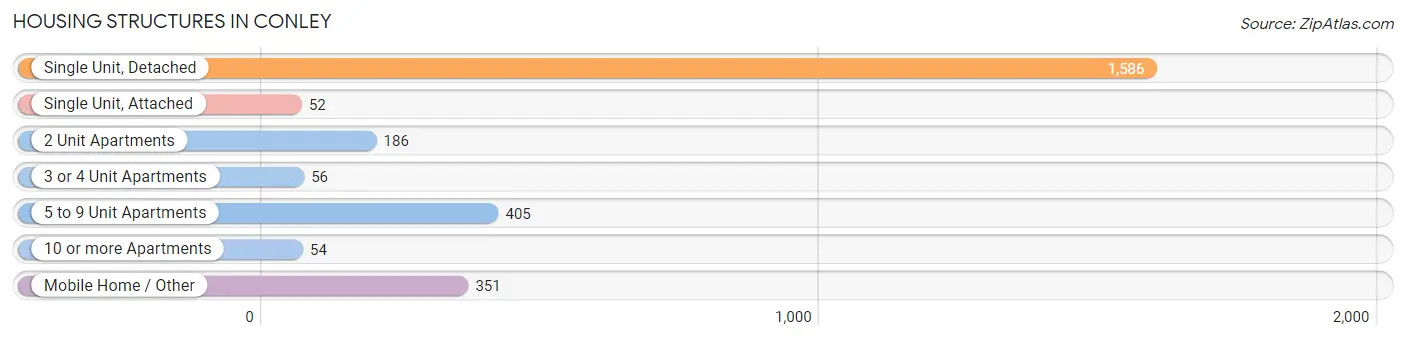
| Structure Type | # Housing Units | % Housing Units |
| Single Unit, Detached | 1,586 | 59.0% |
| Single Unit, Attached | 52 | 1.9% |
| 2 Unit Apartments | 186 | 6.9% |
| 3 or 4 Unit Apartments | 56 | 2.1% |
| 5 to 9 Unit Apartments | 405 | 15.1% |
| 10 or more Apartments | 54 | 2.0% |
| Mobile Home / Other | 351 | 13.1% |
| Total | 2,690 | 100.0% |
Housing Structures by Occupancy in Conley
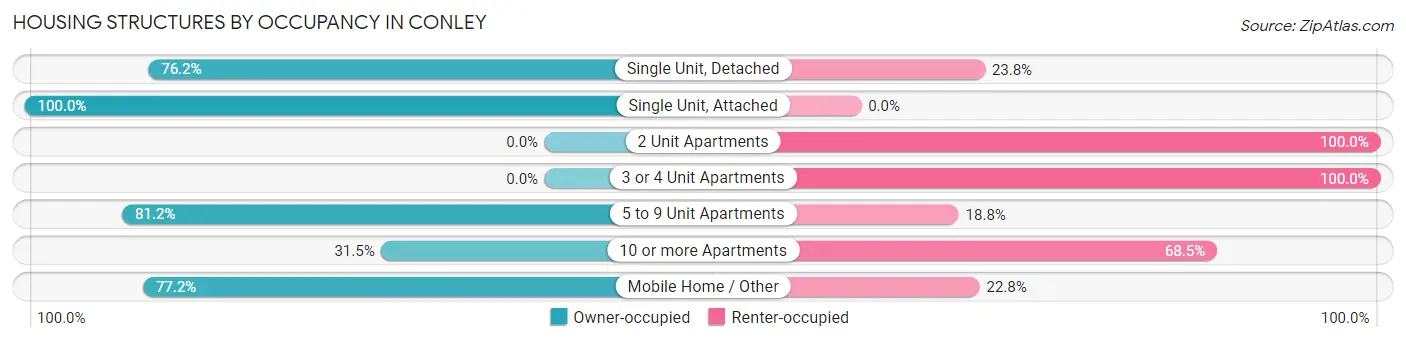
| Structure Type | Owner-occupied | Renter-occupied |
| Single Unit, Detached | 1,208 (76.2%) | 378 (23.8%) |
| Single Unit, Attached | 52 (100.0%) | 0 (0.0%) |
| 2 Unit Apartments | 0 (0.0%) | 186 (100.0%) |
| 3 or 4 Unit Apartments | 0 (0.0%) | 56 (100.0%) |
| 5 to 9 Unit Apartments | 329 (81.2%) | 76 (18.8%) |
| 10 or more Apartments | 17 (31.5%) | 37 (68.5%) |
| Mobile Home / Other | 271 (77.2%) | 80 (22.8%) |
| Total | 1,877 (69.8%) | 813 (30.2%) |
Housing Structures by Number of Rooms in Conley
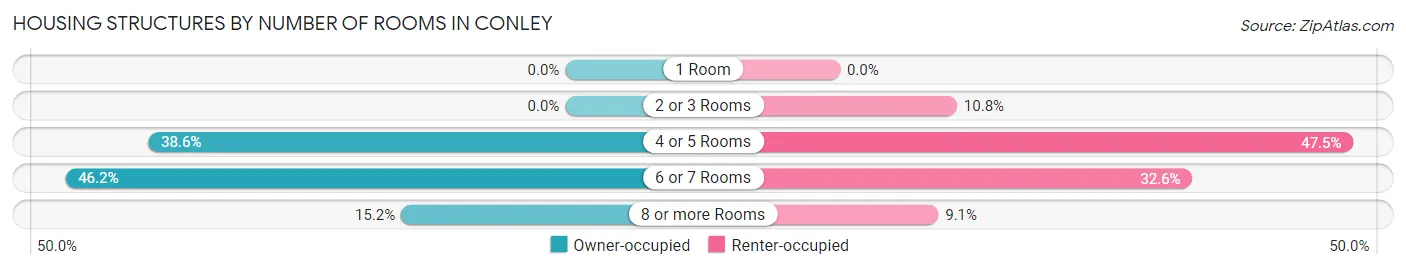
| Number of Rooms | Owner-occupied | Renter-occupied |
| 1 Room | 0 (0.0%) | 0 (0.0%) |
| 2 or 3 Rooms | 0 (0.0%) | 88 (10.8%) |
| 4 or 5 Rooms | 724 (38.6%) | 386 (47.5%) |
| 6 or 7 Rooms | 868 (46.2%) | 265 (32.6%) |
| 8 or more Rooms | 285 (15.2%) | 74 (9.1%) |
| Total | 1,877 (100.0%) | 813 (100.0%) |
Housing Structure by Heating Type in Conley
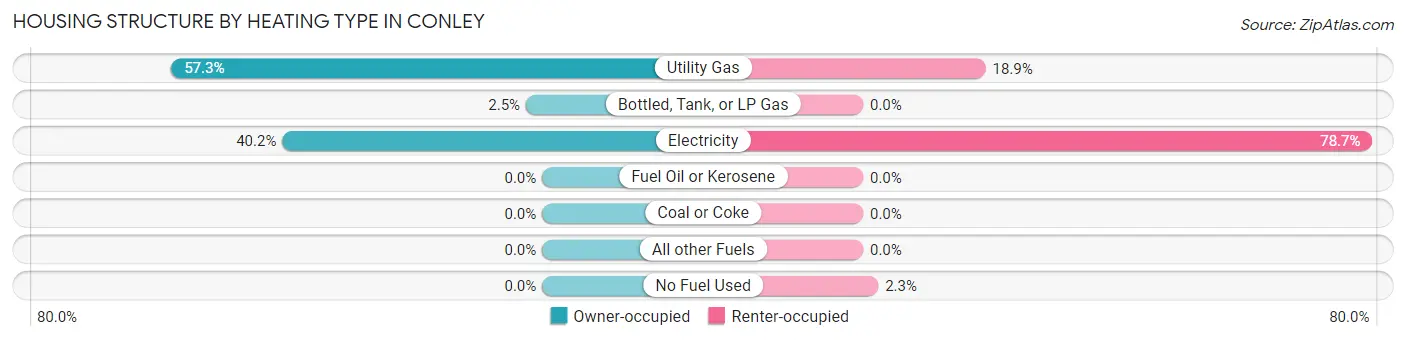
| Heating Type | Owner-occupied | Renter-occupied |
| Utility Gas | 1,076 (57.3%) | 154 (18.9%) |
| Bottled, Tank, or LP Gas | 47 (2.5%) | 0 (0.0%) |
| Electricity | 754 (40.2%) | 640 (78.7%) |
| Fuel Oil or Kerosene | 0 (0.0%) | 0 (0.0%) |
| Coal or Coke | 0 (0.0%) | 0 (0.0%) |
| All other Fuels | 0 (0.0%) | 0 (0.0%) |
| No Fuel Used | 0 (0.0%) | 19 (2.3%) |
| Total | 1,877 (100.0%) | 813 (100.0%) |
Household Vehicle Usage in Conley
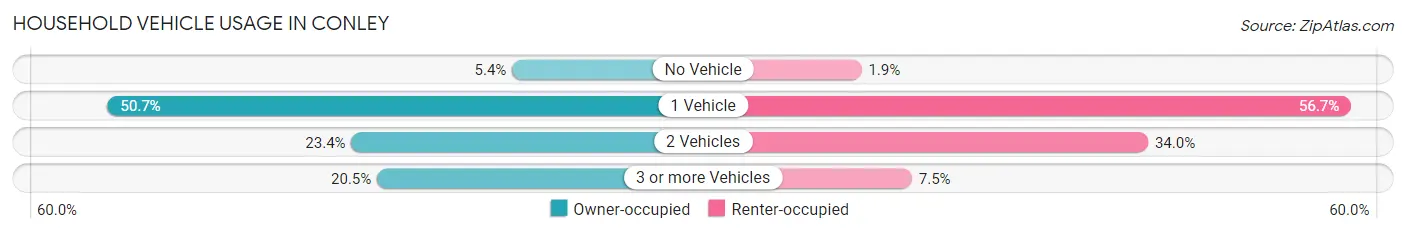
| Vehicles per Household | Owner-occupied | Renter-occupied |
| No Vehicle | 101 (5.4%) | 15 (1.8%) |
| 1 Vehicle | 952 (50.7%) | 461 (56.7%) |
| 2 Vehicles | 439 (23.4%) | 276 (34.0%) |
| 3 or more Vehicles | 385 (20.5%) | 61 (7.5%) |
| Total | 1,877 (100.0%) | 813 (100.0%) |
Real Estate & Mortgages in Conley
Real Estate and Mortgage Overview in Conley
| Characteristic | Without Mortgage | With Mortgage |
| Housing Units | 702 | 1,175 |
| Median Property Value | $62,700 | $137,700 |
| Median Household Income | $92,988 | $96 |
| Monthly Housing Costs | $609 | $0 |
| Real Estate Taxes | - | - |
Property Value by Mortgage Status in Conley
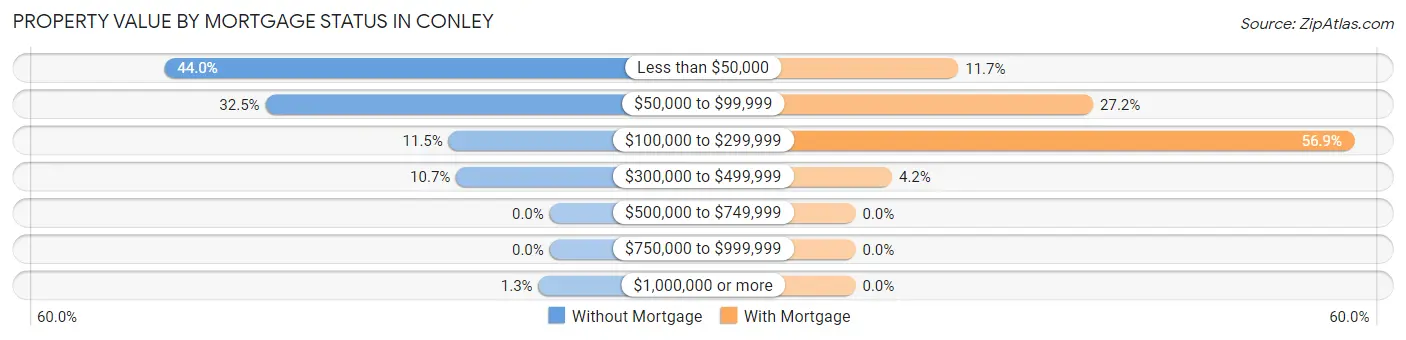
| Property Value | Without Mortgage | With Mortgage |
| Less than $50,000 | 309 (44.0%) | 138 (11.7%) |
| $50,000 to $99,999 | 228 (32.5%) | 319 (27.2%) |
| $100,000 to $299,999 | 81 (11.5%) | 669 (56.9%) |
| $300,000 to $499,999 | 75 (10.7%) | 49 (4.2%) |
| $500,000 to $749,999 | 0 (0.0%) | 0 (0.0%) |
| $750,000 to $999,999 | 0 (0.0%) | 0 (0.0%) |
| $1,000,000 or more | 9 (1.3%) | 0 (0.0%) |
| Total | 702 (100.0%) | 1,175 (100.0%) |
Household Income by Mortgage Status in Conley
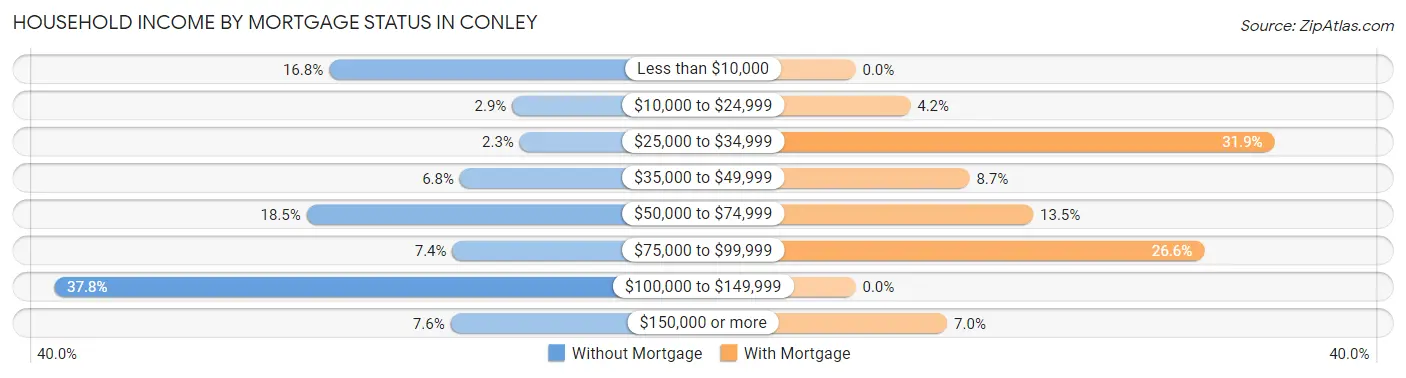
| Household Income | Without Mortgage | With Mortgage |
| Less than $10,000 | 118 (16.8%) | 0 (0.0%) |
| $10,000 to $24,999 | 20 (2.9%) | 49 (4.2%) |
| $25,000 to $34,999 | 16 (2.3%) | 375 (31.9%) |
| $35,000 to $49,999 | 48 (6.8%) | 102 (8.7%) |
| $50,000 to $74,999 | 130 (18.5%) | 159 (13.5%) |
| $75,000 to $99,999 | 52 (7.4%) | 312 (26.6%) |
| $100,000 to $149,999 | 265 (37.8%) | 0 (0.0%) |
| $150,000 or more | 53 (7.5%) | 82 (7.0%) |
| Total | 702 (100.0%) | 1,175 (100.0%) |
Property Value to Household Income Ratio in Conley
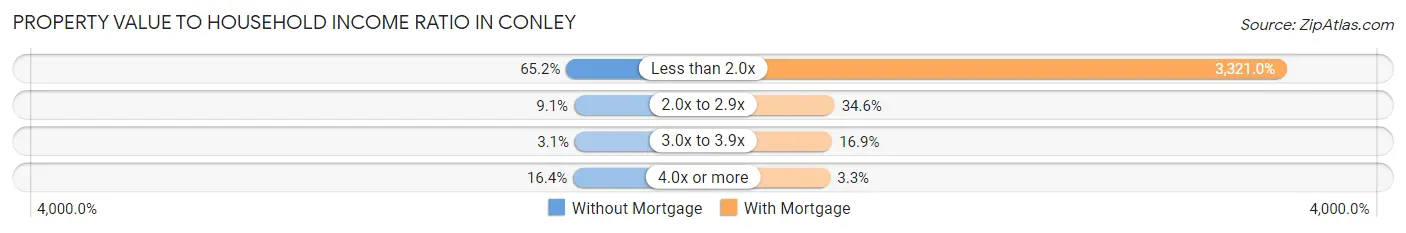
| Value-to-Income Ratio | Without Mortgage | With Mortgage |
| Less than 2.0x | 458 (65.2%) | 39,022 (3,321.0%) |
| 2.0x to 2.9x | 64 (9.1%) | 407 (34.6%) |
| 3.0x to 3.9x | 22 (3.1%) | 199 (16.9%) |
| 4.0x or more | 115 (16.4%) | 39 (3.3%) |
| Total | 702 (100.0%) | 1,175 (100.0%) |
Real Estate Taxes by Mortgage Status in Conley
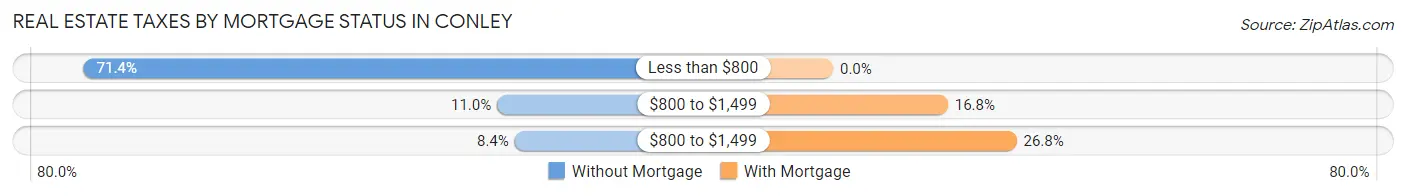
| Property Taxes | Without Mortgage | With Mortgage |
| Less than $800 | 501 (71.4%) | 0 (0.0%) |
| $800 to $1,499 | 77 (11.0%) | 197 (16.8%) |
| $800 to $1,499 | 59 (8.4%) | 315 (26.8%) |
| Total | 702 (100.0%) | 1,175 (100.0%) |
Health & Disability in Conley
Health Insurance Coverage by Age in Conley
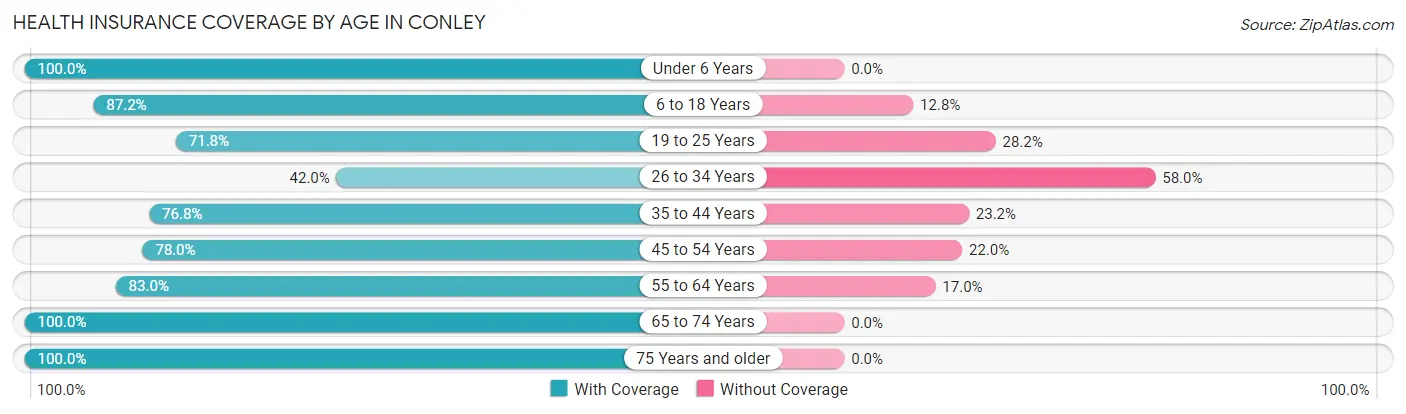
| Age Bracket | With Coverage | Without Coverage |
| Under 6 Years | 259 (100.0%) | 0 (0.0%) |
| 6 to 18 Years | 699 (87.2%) | 103 (12.8%) |
| 19 to 25 Years | 252 (71.8%) | 99 (28.2%) |
| 26 to 34 Years | 315 (42.0%) | 435 (58.0%) |
| 35 to 44 Years | 476 (76.8%) | 144 (23.2%) |
| 45 to 54 Years | 963 (78.0%) | 271 (22.0%) |
| 55 to 64 Years | 1,031 (83.0%) | 211 (17.0%) |
| 65 to 74 Years | 314 (100.0%) | 0 (0.0%) |
| 75 Years and older | 320 (100.0%) | 0 (0.0%) |
| Total | 4,629 (78.6%) | 1,263 (21.4%) |
Health Insurance Coverage by Citizenship Status in Conley
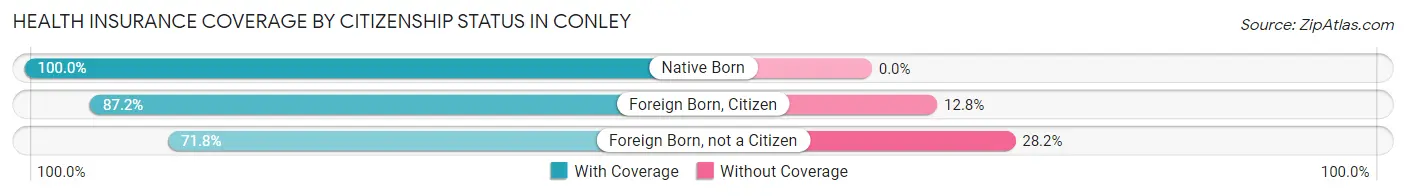
| Citizenship Status | With Coverage | Without Coverage |
| Native Born | 259 (100.0%) | 0 (0.0%) |
| Foreign Born, Citizen | 699 (87.2%) | 103 (12.8%) |
| Foreign Born, not a Citizen | 252 (71.8%) | 99 (28.2%) |
Health Insurance Coverage by Household Income in Conley
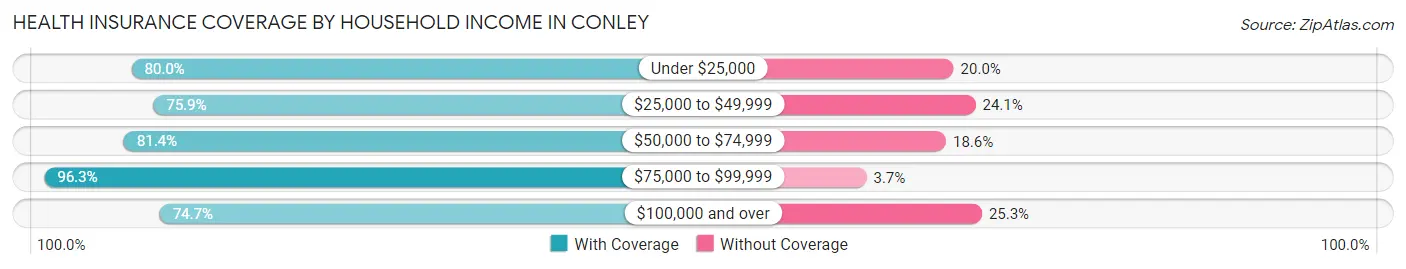
| Household Income | With Coverage | Without Coverage |
| Under $25,000 | 907 (80.0%) | 227 (20.0%) |
| $25,000 to $49,999 | 1,460 (75.9%) | 464 (24.1%) |
| $50,000 to $74,999 | 985 (81.4%) | 225 (18.6%) |
| $75,000 to $99,999 | 286 (96.3%) | 11 (3.7%) |
| $100,000 and over | 991 (74.7%) | 336 (25.3%) |
Public vs Private Health Insurance Coverage by Age in Conley
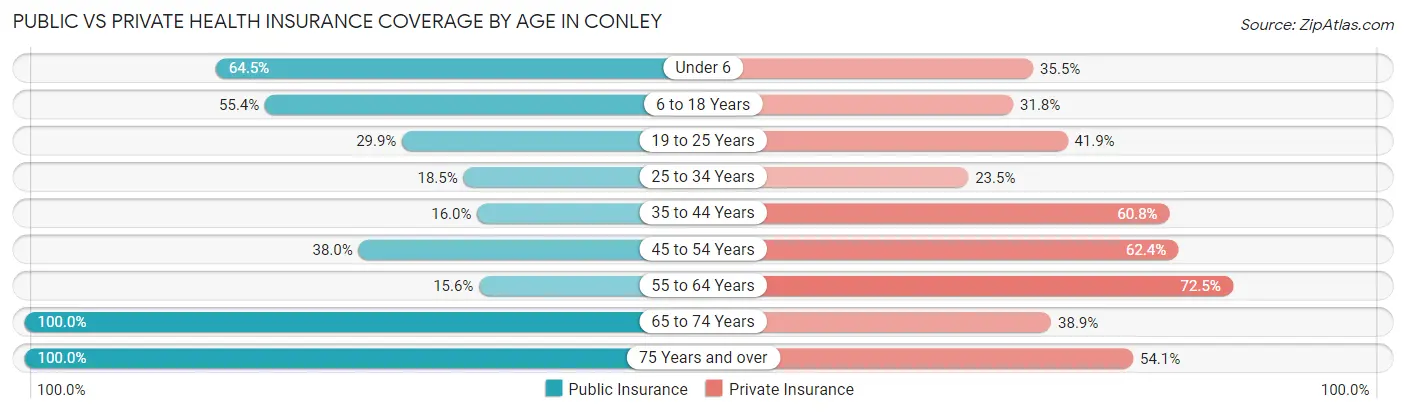
| Age Bracket | Public Insurance | Private Insurance |
| Under 6 | 167 (64.5%) | 92 (35.5%) |
| 6 to 18 Years | 444 (55.4%) | 255 (31.8%) |
| 19 to 25 Years | 105 (29.9%) | 147 (41.9%) |
| 25 to 34 Years | 139 (18.5%) | 176 (23.5%) |
| 35 to 44 Years | 99 (16.0%) | 377 (60.8%) |
| 45 to 54 Years | 469 (38.0%) | 770 (62.4%) |
| 55 to 64 Years | 194 (15.6%) | 901 (72.5%) |
| 65 to 74 Years | 314 (100.0%) | 122 (38.9%) |
| 75 Years and over | 320 (100.0%) | 173 (54.1%) |
| Total | 2,251 (38.2%) | 3,013 (51.1%) |
Disability Status by Sex by Age in Conley
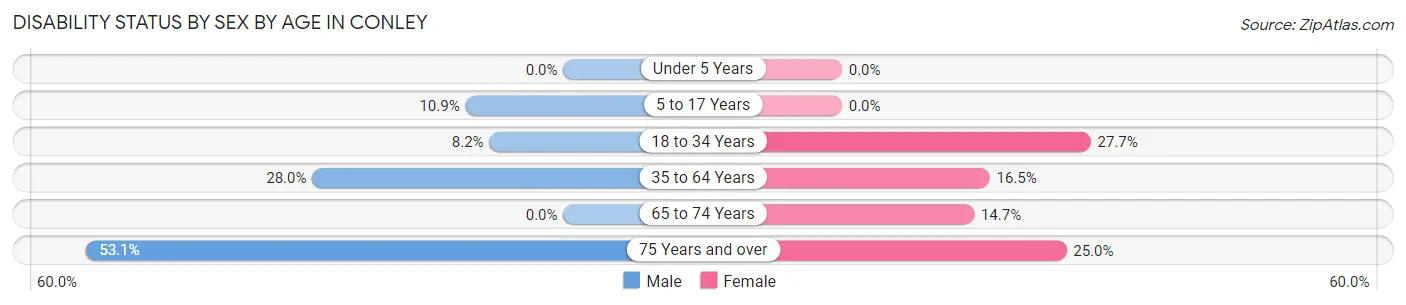
| Age Bracket | Male | Female |
| Under 5 Years | 0 (0.0%) | 0 (0.0%) |
| 5 to 17 Years | 23 (10.9%) | 0 (0.0%) |
| 18 to 34 Years | 40 (8.2%) | 192 (27.7%) |
| 35 to 64 Years | 480 (28.0%) | 227 (16.5%) |
| 65 to 74 Years | 0 (0.0%) | 24 (14.7%) |
| 75 Years and over | 68 (53.1%) | 48 (25.0%) |
Disability Class by Sex by Age in Conley
Disability Class: Hearing Difficulty
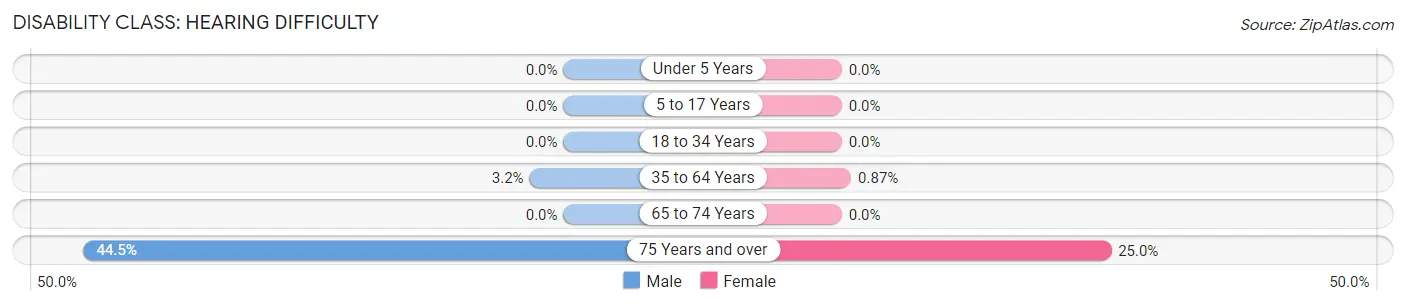
| Age Bracket | Male | Female |
| Under 5 Years | 0 (0.0%) | 0 (0.0%) |
| 5 to 17 Years | 0 (0.0%) | 0 (0.0%) |
| 18 to 34 Years | 0 (0.0%) | 0 (0.0%) |
| 35 to 64 Years | 54 (3.2%) | 12 (0.9%) |
| 65 to 74 Years | 0 (0.0%) | 0 (0.0%) |
| 75 Years and over | 57 (44.5%) | 48 (25.0%) |
Disability Class: Vision Difficulty
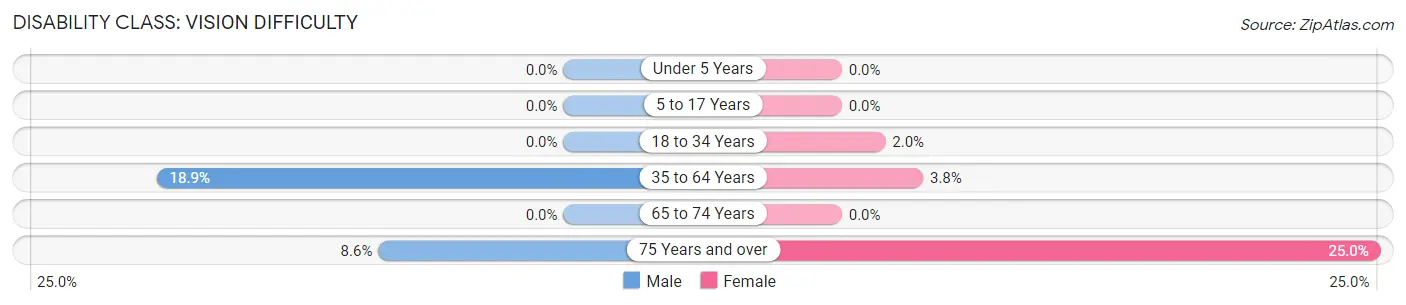
| Age Bracket | Male | Female |
| Under 5 Years | 0 (0.0%) | 0 (0.0%) |
| 5 to 17 Years | 0 (0.0%) | 0 (0.0%) |
| 18 to 34 Years | 0 (0.0%) | 14 (2.0%) |
| 35 to 64 Years | 324 (18.9%) | 52 (3.8%) |
| 65 to 74 Years | 0 (0.0%) | 0 (0.0%) |
| 75 Years and over | 11 (8.6%) | 48 (25.0%) |
Disability Class: Cognitive Difficulty
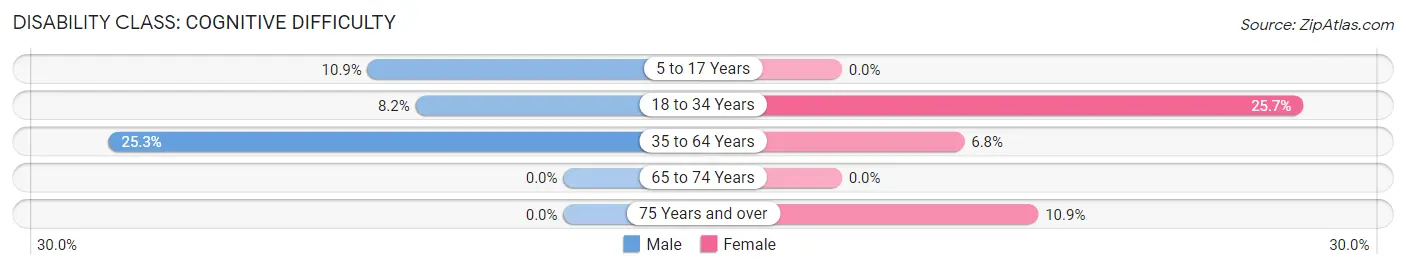
| Age Bracket | Male | Female |
| 5 to 17 Years | 23 (10.9%) | 0 (0.0%) |
| 18 to 34 Years | 40 (8.2%) | 178 (25.7%) |
| 35 to 64 Years | 435 (25.3%) | 94 (6.8%) |
| 65 to 74 Years | 0 (0.0%) | 0 (0.0%) |
| 75 Years and over | 0 (0.0%) | 21 (10.9%) |
Disability Class: Ambulatory Difficulty
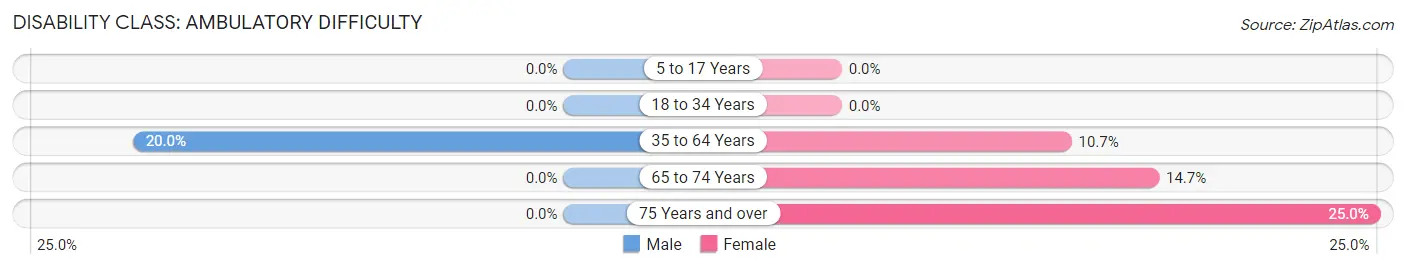
| Age Bracket | Male | Female |
| 5 to 17 Years | 0 (0.0%) | 0 (0.0%) |
| 18 to 34 Years | 0 (0.0%) | 0 (0.0%) |
| 35 to 64 Years | 343 (20.0%) | 147 (10.7%) |
| 65 to 74 Years | 0 (0.0%) | 24 (14.7%) |
| 75 Years and over | 0 (0.0%) | 48 (25.0%) |
Disability Class: Self-Care Difficulty
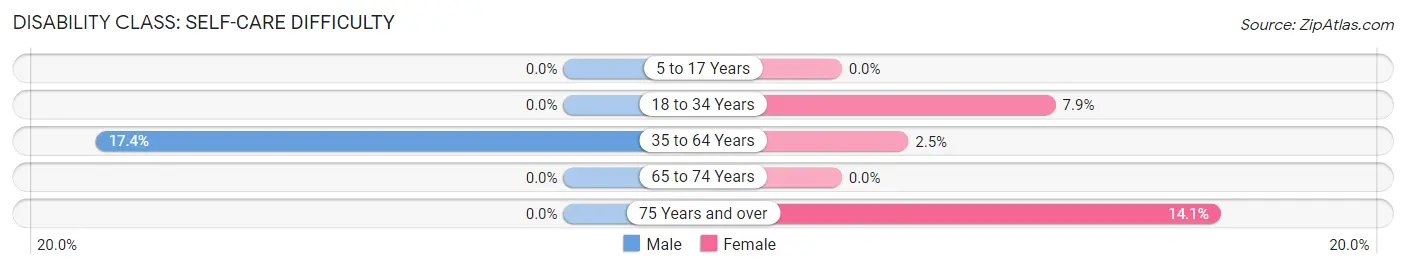
| Age Bracket | Male | Female |
| 5 to 17 Years | 0 (0.0%) | 0 (0.0%) |
| 18 to 34 Years | 0 (0.0%) | 55 (7.9%) |
| 35 to 64 Years | 298 (17.4%) | 34 (2.5%) |
| 65 to 74 Years | 0 (0.0%) | 0 (0.0%) |
| 75 Years and over | 0 (0.0%) | 27 (14.1%) |
Technology Access in Conley
Computing Device Access in Conley
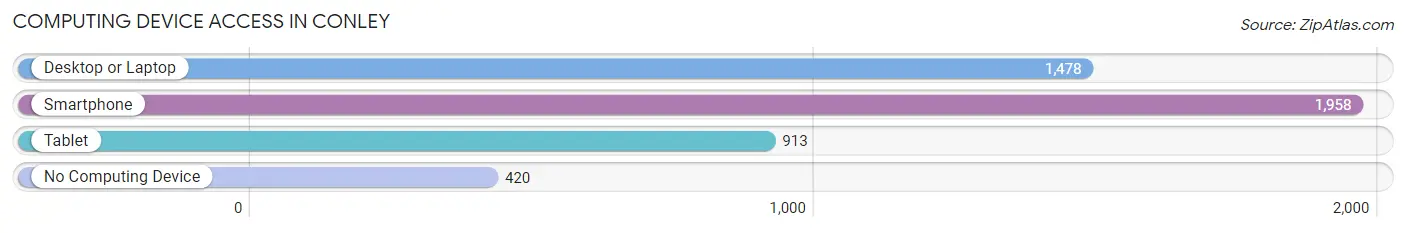
| Device Type | # Households | % Households |
| Desktop or Laptop | 1,478 | 54.9% |
| Smartphone | 1,958 | 72.8% |
| Tablet | 913 | 33.9% |
| No Computing Device | 420 | 15.6% |
| Total | 2,690 | 100.0% |
Internet Access in Conley
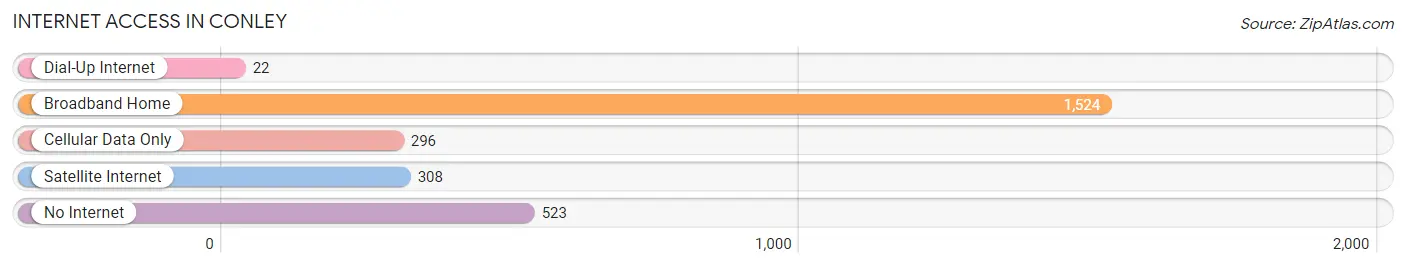
| Internet Type | # Households | % Households |
| Dial-Up Internet | 22 | 0.8% |
| Broadband Home | 1,524 | 56.7% |
| Cellular Data Only | 296 | 11.0% |
| Satellite Internet | 308 | 11.5% |
| No Internet | 523 | 19.4% |
| Total | 2,690 | 100.0% |
Conley Summary
Conley, Georgia is a small city located in Clayton County, just south of Atlanta. It is part of the Atlanta metropolitan area and is home to a population of just over 5,000 people. The city is known for its rich history, diverse geography, and vibrant economy.
History
Conley was founded in 1883 by the Georgia Railroad and Banking Company. The city was named after the railroad's president, William H. Conley. The railroad was instrumental in the development of the city, as it provided transportation and access to the surrounding area. The city was incorporated in 1891 and quickly grew in population and industry.
In the early 1900s, Conley was a thriving industrial center, with several factories and mills. The city was also home to a large African American population, which was largely employed in the factories and mills. During this time, the city was known for its vibrant music scene, with many jazz and blues clubs.
In the 1950s, the city began to decline as the factories and mills closed. The city's population decreased and the economy suffered. In the 1970s, the city began to experience a resurgence, as new businesses and industries moved into the area.
Geography
Conley is located in the southern part of Clayton County, just south of Atlanta. The city is situated on the banks of the Flint River, which provides a scenic backdrop for the city. The city is surrounded by rolling hills and lush forests, providing a beautiful landscape for residents and visitors alike.
The city is divided into several distinct neighborhoods, including the historic downtown area, the industrial district, and the residential neighborhoods. The downtown area is home to many historic buildings, including the old railroad station, which is now a museum. The industrial district is home to many businesses and factories, while the residential neighborhoods are home to a diverse population.
Economy
Conley's economy is largely based on manufacturing and services. The city is home to several factories and mills, which produce a variety of products, including textiles, furniture, and electronics. The city is also home to many service-based businesses, such as restaurants, retail stores, and medical offices.
The city is also home to several large employers, including the Georgia-Pacific Corporation, which is one of the largest employers in the area. The city is also home to several educational institutions, including Clayton State University and Georgia State University.
Demographics
As of the 2010 census, Conley had a population of 5,072 people. The population is largely African American, with a small Hispanic population. The median household income is $37,000, and the median home value is $125,000.
Conley is a diverse city, with a variety of cultures and backgrounds. The city is home to many churches, schools, and businesses, providing a vibrant and welcoming atmosphere for residents and visitors alike.
Conclusion
Conley, Georgia is a small city with a rich history, diverse geography, and vibrant economy. The city is home to a diverse population, with a variety of cultures and backgrounds. The city is home to many businesses and industries, providing employment opportunities for its residents. Conley is a great place to live, work, and visit, and is sure to continue to grow and thrive in the years to come.
Common Questions
What is Per Capita Income in Conley?
Per Capita income in Conley is $24,096.
What is the Median Family Income in Conley?
Median Family Income in Conley is $48,639.
What is the Median Household income in Conley?
Median Household Income in Conley is $47,429.
What is Income or Wage Gap in Conley?
Income or Wage Gap in Conley is 22.7%.
Women in Conley earn 77.3 cents for every dollar earned by a man.
What is Inequality or Gini Index in Conley?
Inequality or Gini Index in Conley is 0.45.
What is the Total Population of Conley?
Total Population of Conley is 5,892.
What is the Total Male Population of Conley?
Total Male Population of Conley is 2,773.
What is the Total Female Population of Conley?
Total Female Population of Conley is 3,119.
What is the Ratio of Males per 100 Females in Conley?
There are 88.91 Males per 100 Females in Conley.
What is the Ratio of Females per 100 Males in Conley?
There are 112.48 Females per 100 Males in Conley.
What is the Median Population Age in Conley?
Median Population Age in Conley is 45.7 Years.
What is the Average Family Size in Conley
Average Family Size in Conley is 3.0 People.
What is the Average Household Size in Conley
Average Household Size in Conley is 2.2 People.
How Large is the Labor Force in Conley?
There are 2,829 People in the Labor Forcein in Conley.
What is the Percentage of People in the Labor Force in Conley?
56.2% of People are in the Labor Force in Conley.
What is the Unemployment Rate in Conley?
Unemployment Rate in Conley is 4.6%.