Cedartown, GA Map & Demographics
Cedartown Map
Cedartown Overview
$26,262
PER CAPITA INCOME
$53,594
AVG FAMILY INCOME
$30,655
AVG HOUSEHOLD INCOME
24.5%
WAGE / INCOME GAP [ % ]
75.5¢/ $1
WAGE / INCOME GAP [ $ ]
$12,368
FAMILY INCOME DEFICIT
0.57
INEQUALITY / GINI INDEX
10,166
TOTAL POPULATION
4,966
MALE POPULATION
5,200
FEMALE POPULATION
95.50
MALES / 100 FEMALES
104.71
FEMALES / 100 MALES
31.1
MEDIAN AGE
3.4
AVG FAMILY SIZE
2.6
AVG HOUSEHOLD SIZE
4,382
LABOR FORCE [ PEOPLE ]
56.3%
PERCENT IN LABOR FORCE
7.4%
UNEMPLOYMENT RATE
Cedartown Zip Codes
Income in Cedartown
Income Overview in Cedartown
Per Capita Income in Cedartown is $26,262, while median incomes of families and households are $53,594 and $30,655 respectively.
| Characteristic | Number | Measure |
| Per Capita Income | 10,166 | $26,262 |
| Median Family Income | 2,334 | $53,594 |
| Mean Family Income | 2,334 | $83,131 |
| Median Household Income | 3,793 | $30,655 |
| Mean Household Income | 3,793 | $65,623 |
| Income Deficit | 2,334 | $12,368 |
| Wage / Income Gap (%) | 10,166 | 24.47% |
| Wage / Income Gap ($) | 10,166 | 75.53¢ per $1 |
| Gini / Inequality Index | 10,166 | 0.57 |
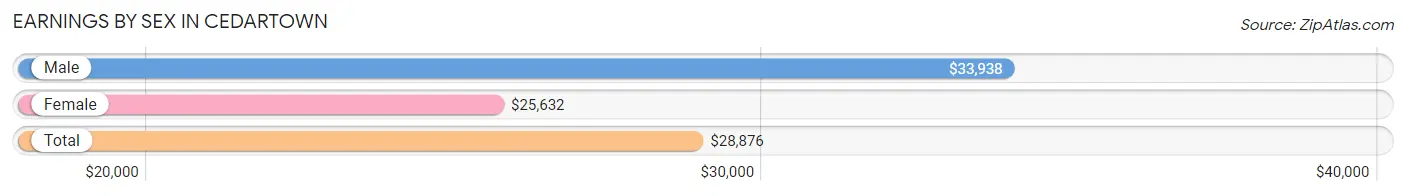
Earnings by Sex in Cedartown
Average Earnings in Cedartown are $28,876, $33,938 for men and $25,632 for women, a difference of 24.5%.
| Sex | Number | Average Earnings |
| Male | 2,531 (54.7%) | $33,938 |
| Female | 2,093 (45.3%) | $25,632 |
| Total | 4,624 (100.0%) | $28,876 |
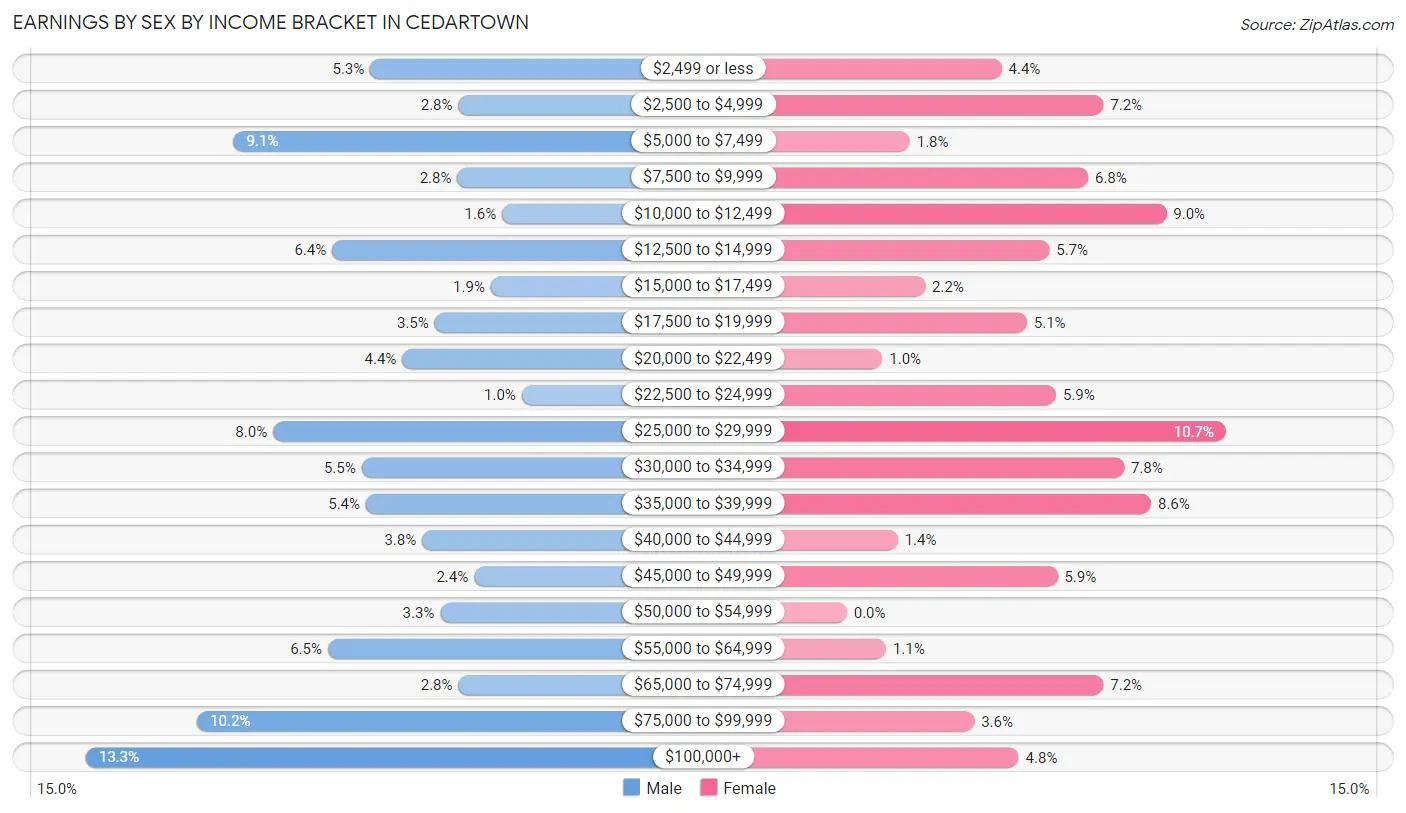
Earnings by Sex by Income Bracket in Cedartown
The most common earnings brackets in Cedartown are $100,000+ for men (336 | 13.3%) and $25,000 to $29,999 for women (223 | 10.6%).
| Income | Male | Female |
| $2,499 or less | 134 (5.3%) | 91 (4.3%) |
| $2,500 to $4,999 | 71 (2.8%) | 151 (7.2%) |
| $5,000 to $7,499 | 231 (9.1%) | 37 (1.8%) |
| $7,500 to $9,999 | 72 (2.8%) | 142 (6.8%) |
| $10,000 to $12,499 | 40 (1.6%) | 188 (9.0%) |
| $12,500 to $14,999 | 161 (6.4%) | 119 (5.7%) |
| $15,000 to $17,499 | 48 (1.9%) | 46 (2.2%) |
| $17,500 to $19,999 | 88 (3.5%) | 106 (5.1%) |
| $20,000 to $22,499 | 111 (4.4%) | 21 (1.0%) |
| $22,500 to $24,999 | 26 (1.0%) | 123 (5.9%) |
| $25,000 to $29,999 | 203 (8.0%) | 223 (10.6%) |
| $30,000 to $34,999 | 140 (5.5%) | 163 (7.8%) |
| $35,000 to $39,999 | 137 (5.4%) | 179 (8.6%) |
| $40,000 to $44,999 | 97 (3.8%) | 30 (1.4%) |
| $45,000 to $49,999 | 60 (2.4%) | 124 (5.9%) |
| $50,000 to $54,999 | 84 (3.3%) | 0 (0.0%) |
| $55,000 to $64,999 | 164 (6.5%) | 23 (1.1%) |
| $65,000 to $74,999 | 71 (2.8%) | 151 (7.2%) |
| $75,000 to $99,999 | 257 (10.2%) | 75 (3.6%) |
| $100,000+ | 336 (13.3%) | 101 (4.8%) |
| Total | 2,531 (100.0%) | 2,093 (100.0%) |
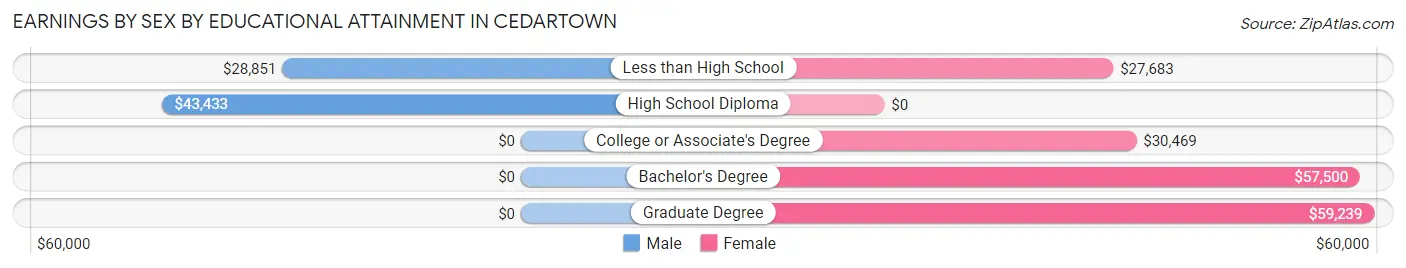
Earnings by Sex by Educational Attainment in Cedartown
Average earnings in Cedartown are $43,900 for men and $28,937 for women, a difference of 34.1%. Men with an educational attainment of high school diploma enjoy the highest average annual earnings of $43,433, while those with less than high school education earn the least with $28,851. Women with an educational attainment of graduate degree earn the most with the average annual earnings of $59,239, while those with less than high school education have the smallest earnings of $27,683.
| Educational Attainment | Male Income | Female Income |
| Less than High School | $28,851 | $27,683 |
| High School Diploma | $43,433 | $0 |
| College or Associate's Degree | - | - |
| Bachelor's Degree | - | - |
| Graduate Degree | - | - |
| Total | $43,900 | $28,937 |
Family Income in Cedartown
Family Income Brackets in Cedartown
According to the Cedartown family income data, there are 408 families falling into the $100,000 to $149,999 income range, which is the most common income bracket and makes up 17.5% of all families. Conversely, the $150,000 to $199,999 income bracket is the least frequent group with only 114 families (4.9%) belonging to this category.
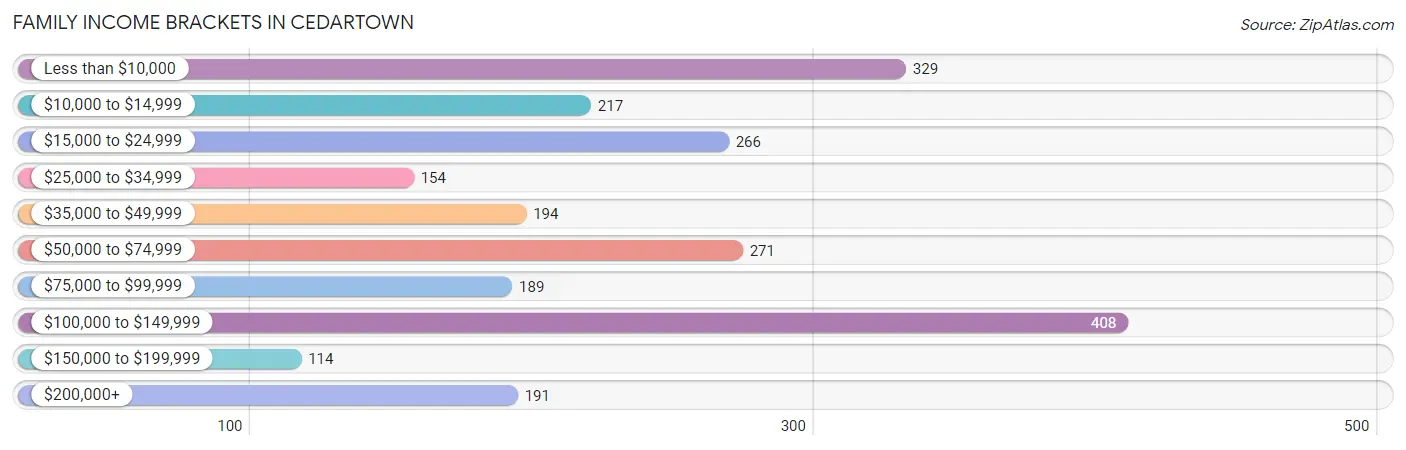
| Income Bracket | # Families | % Families |
| Less than $10,000 | 329 | 14.1% |
| $10,000 to $14,999 | 217 | 9.3% |
| $15,000 to $24,999 | 266 | 11.4% |
| $25,000 to $34,999 | 154 | 6.6% |
| $35,000 to $49,999 | 194 | 8.3% |
| $50,000 to $74,999 | 271 | 11.6% |
| $75,000 to $99,999 | 189 | 8.1% |
| $100,000 to $149,999 | 408 | 17.5% |
| $150,000 to $199,999 | 114 | 4.9% |
| $200,000+ | 191 | 8.2% |
Family Income by Famaliy Size in Cedartown
6-person families (59 | 2.5%) account for the highest median family income in Cedartown with $175,121 per family, while 6-person families (59 | 2.5%) have the highest median income of $29,187 per family member.
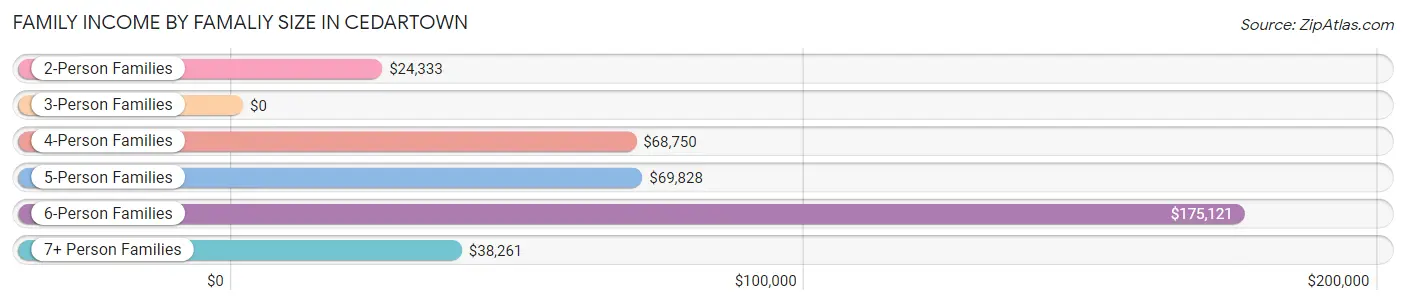
| Income Bracket | # Families | Median Income |
| 2-Person Families | 734 (31.5%) | $24,333 |
| 3-Person Families | 614 (26.3%) | $0 |
| 4-Person Families | 600 (25.7%) | $68,750 |
| 5-Person Families | 219 (9.4%) | $69,828 |
| 6-Person Families | 59 (2.5%) | $175,121 |
| 7+ Person Families | 108 (4.6%) | $38,261 |
| Total | 2,334 (100.0%) | $53,594 |
Family Income by Number of Earners in Cedartown
The median family income in Cedartown is $53,594, with families comprising 3+ earners (135) having the highest median family income of $130,282, while families with no earners (377) have the lowest median family income of $17,050, accounting for 5.8% and 16.2% of families, respectively.
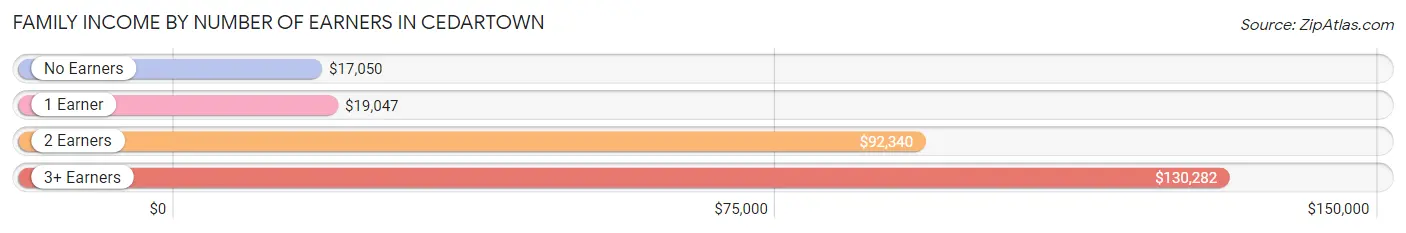
| Number of Earners | # Families | Median Income |
| No Earners | 377 (16.2%) | $17,050 |
| 1 Earner | 867 (37.1%) | $19,047 |
| 2 Earners | 955 (40.9%) | $92,340 |
| 3+ Earners | 135 (5.8%) | $130,282 |
| Total | 2,334 (100.0%) | $53,594 |
Household Income in Cedartown
Household Income Brackets in Cedartown
With 626 households falling in the category, the $15,000 to $24,999 income range is the most frequent in Cedartown, accounting for 16.5% of all households. In contrast, only 114 households (3.0%) fall into the $150,000 to $199,999 income bracket, making it the least populous group.
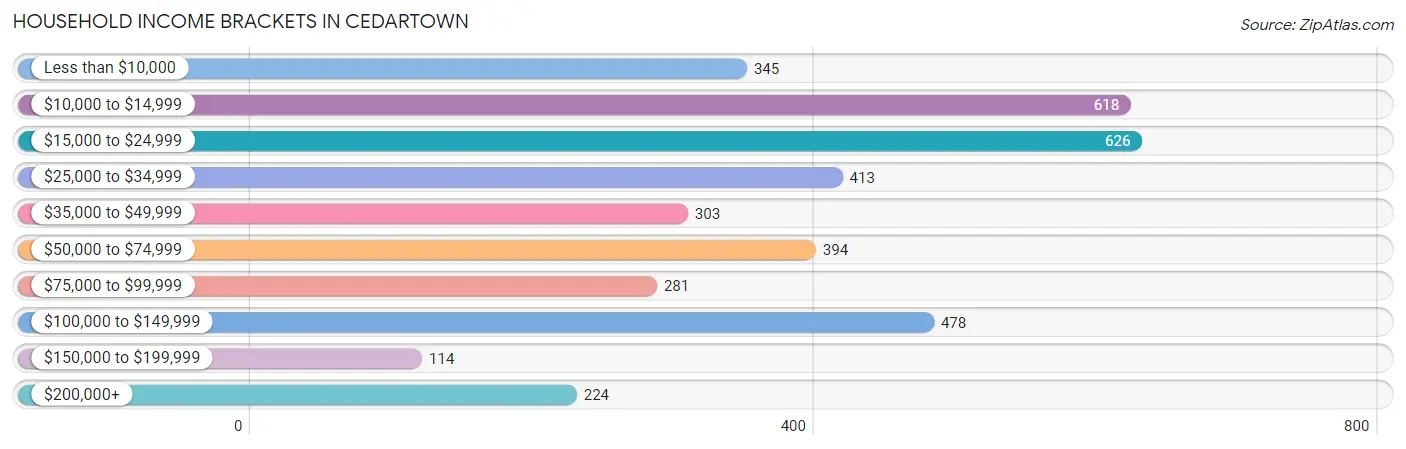
| Income Bracket | # Households | % Households |
| Less than $10,000 | 345 | 9.1% |
| $10,000 to $14,999 | 618 | 16.3% |
| $15,000 to $24,999 | 626 | 16.5% |
| $25,000 to $34,999 | 413 | 10.9% |
| $35,000 to $49,999 | 303 | 8.0% |
| $50,000 to $74,999 | 394 | 10.4% |
| $75,000 to $99,999 | 281 | 7.4% |
| $100,000 to $149,999 | 478 | 12.6% |
| $150,000 to $199,999 | 114 | 3.0% |
| $200,000+ | 224 | 5.9% |
Household Income by Householder Age in Cedartown
The median household income in Cedartown is $30,655, with the highest median household income of $61,741 found in the 45 to 64 years age bracket for the primary householder. A total of 1,043 households (27.5%) fall into this category. Meanwhile, the 15 to 24 years age bracket for the primary householder has the lowest median household income of $0, with 416 households (11.0%) in this group.
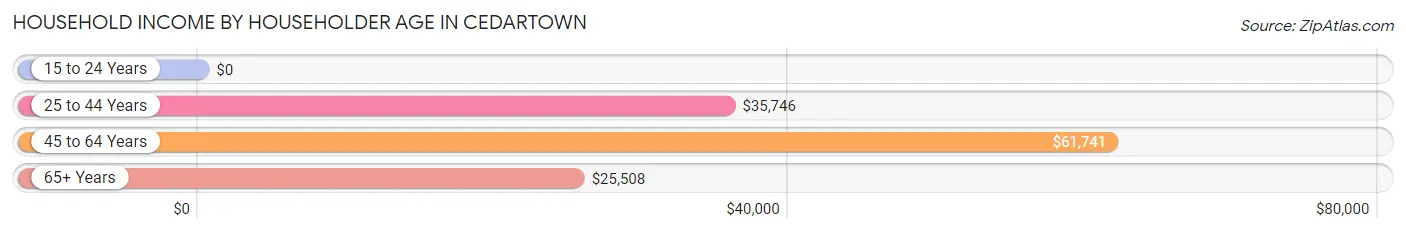
| Income Bracket | # Households | Median Income |
| 15 to 24 Years | 416 (11.0%) | $0 |
| 25 to 44 Years | 1,402 (37.0%) | $35,746 |
| 45 to 64 Years | 1,043 (27.5%) | $61,741 |
| 65+ Years | 932 (24.6%) | $25,508 |
| Total | 3,793 (100.0%) | $30,655 |
Poverty in Cedartown
Income Below Poverty by Sex and Age in Cedartown
With 35.1% poverty level for males and 32.5% for females among the residents of Cedartown, 15 year old males and 12 to 14 year old females are the most vulnerable to poverty, with 192 males (98.5%) and 153 females (81.4%) in their respective age groups living below the poverty level.
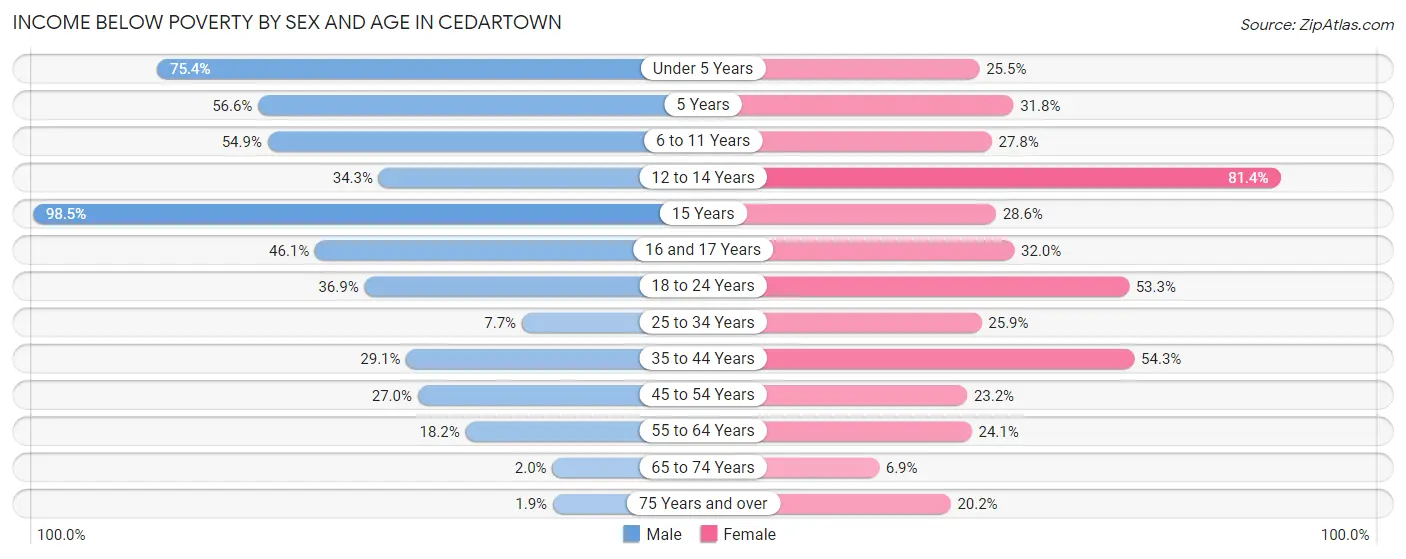
| Age Bracket | Male | Female |
| Under 5 Years | 319 (75.4%) | 87 (25.5%) |
| 5 Years | 64 (56.6%) | 14 (31.8%) |
| 6 to 11 Years | 152 (54.9%) | 157 (27.8%) |
| 12 to 14 Years | 62 (34.3%) | 153 (81.4%) |
| 15 Years | 192 (98.5%) | 16 (28.6%) |
| 16 and 17 Years | 100 (46.1%) | 63 (32.0%) |
| 18 to 24 Years | 375 (36.9%) | 204 (53.3%) |
| 25 to 34 Years | 40 (7.7%) | 238 (25.9%) |
| 35 to 44 Years | 197 (29.1%) | 426 (54.3%) |
| 45 to 54 Years | 117 (27.0%) | 69 (23.2%) |
| 55 to 64 Years | 69 (18.2%) | 125 (24.1%) |
| 65 to 74 Years | 4 (2.0%) | 30 (6.9%) |
| 75 Years and over | 4 (1.9%) | 71 (20.2%) |
| Total | 1,695 (35.1%) | 1,653 (32.5%) |
Income Above Poverty by Sex and Age in Cedartown
According to the poverty statistics in Cedartown, males aged 75 years and over and females aged 65 to 74 years are the age groups that are most secure financially, with 98.1% of males and 93.1% of females in these age groups living above the poverty line.
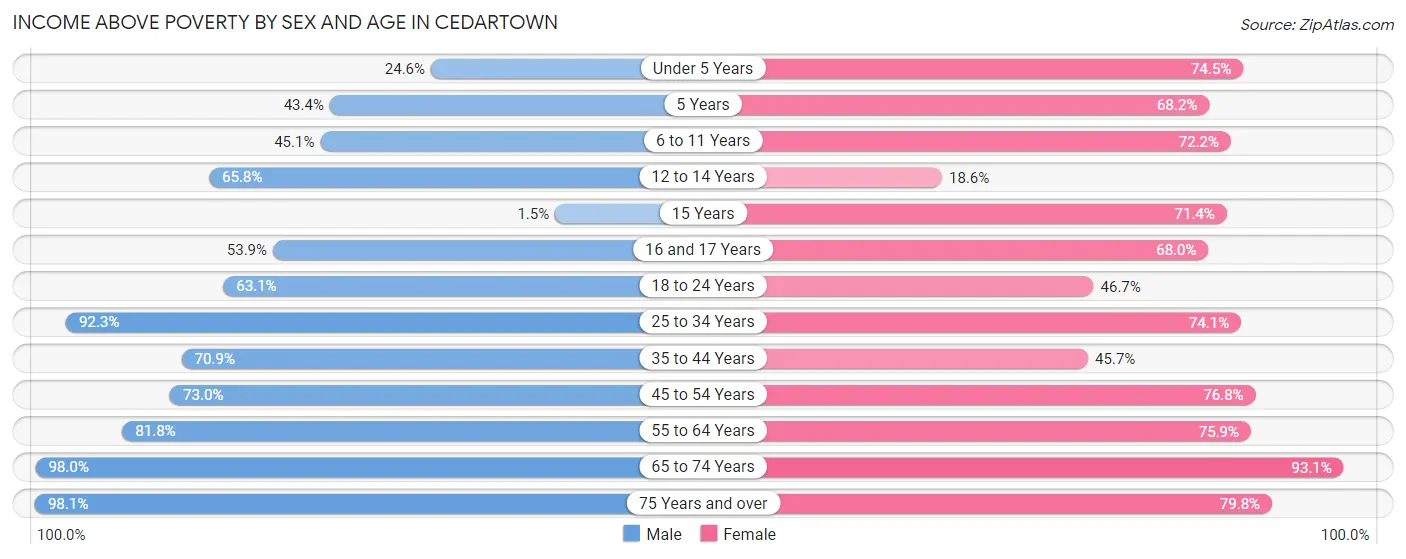
| Age Bracket | Male | Female |
| Under 5 Years | 104 (24.6%) | 254 (74.5%) |
| 5 Years | 49 (43.4%) | 30 (68.2%) |
| 6 to 11 Years | 125 (45.1%) | 408 (72.2%) |
| 12 to 14 Years | 119 (65.7%) | 35 (18.6%) |
| 15 Years | 3 (1.5%) | 40 (71.4%) |
| 16 and 17 Years | 117 (53.9%) | 134 (68.0%) |
| 18 to 24 Years | 641 (63.1%) | 179 (46.7%) |
| 25 to 34 Years | 480 (92.3%) | 681 (74.1%) |
| 35 to 44 Years | 479 (70.9%) | 359 (45.7%) |
| 45 to 54 Years | 316 (73.0%) | 228 (76.8%) |
| 55 to 64 Years | 311 (81.8%) | 394 (75.9%) |
| 65 to 74 Years | 193 (98.0%) | 407 (93.1%) |
| 75 Years and over | 203 (98.1%) | 281 (79.8%) |
| Total | 3,140 (64.9%) | 3,430 (67.5%) |
Income Below Poverty Among Married-Couple Families in Cedartown
The poverty statistics for married-couple families in Cedartown show that 8.0% or 110 of the total 1,374 families live below the poverty line. Families with 5 or more children have the highest poverty rate of 100.0%, comprising of 17 families. On the other hand, families with 1 or 2 children have the lowest poverty rate of 2.6%, which includes 18 families.
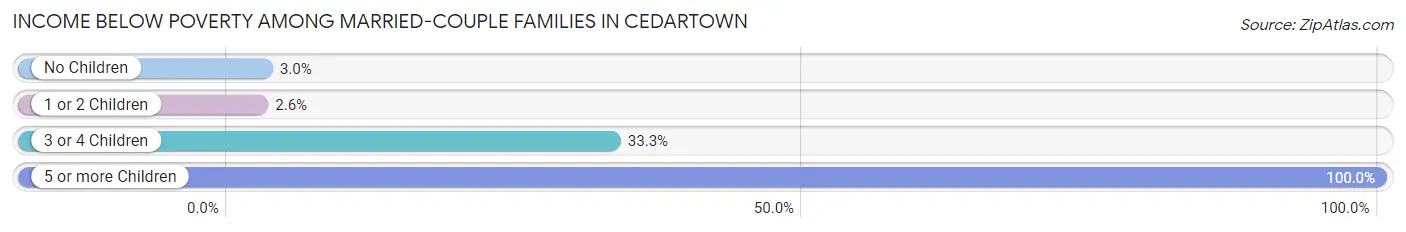
| Children | Above Poverty | Below Poverty |
| No Children | 479 (97.0%) | 15 (3.0%) |
| 1 or 2 Children | 665 (97.4%) | 18 (2.6%) |
| 3 or 4 Children | 120 (66.7%) | 60 (33.3%) |
| 5 or more Children | 0 (0.0%) | 17 (100.0%) |
| Total | 1,264 (92.0%) | 110 (8.0%) |
Income Below Poverty Among Single-Parent Households in Cedartown
According to the poverty data in Cedartown, 39.5% or 68 single-father households and 81.6% or 643 single-mother households are living below the poverty line. Among single-father households, those with 1 or 2 children have the highest poverty rate, with 57 households (57.6%) experiencing poverty. Likewise, among single-mother households, those with 3 or 4 children have the highest poverty rate, with 155 households (100.0%) falling below the poverty line.
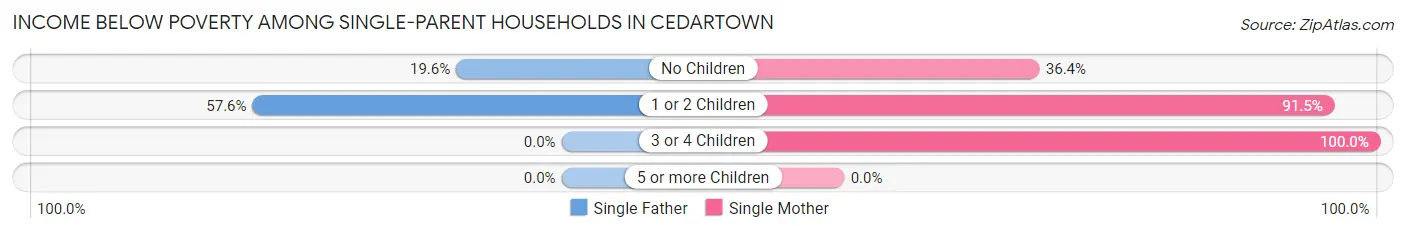
| Children | Single Father | Single Mother |
| No Children | 11 (19.6%) | 60 (36.4%) |
| 1 or 2 Children | 57 (57.6%) | 428 (91.4%) |
| 3 or 4 Children | 0 (0.0%) | 155 (100.0%) |
| 5 or more Children | 0 (0.0%) | 0 (0.0%) |
| Total | 68 (39.5%) | 643 (81.6%) |
Income Below Poverty Among Married-Couple vs Single-Parent Households in Cedartown
The poverty data for Cedartown shows that 110 of the married-couple family households (8.0%) and 711 of the single-parent households (74.1%) are living below the poverty level. Within the married-couple family households, those with 5 or more children have the highest poverty rate, with 17 households (100.0%) falling below the poverty line. Among the single-parent households, those with 3 or 4 children have the highest poverty rate, with 155 household (90.1%) living below poverty.
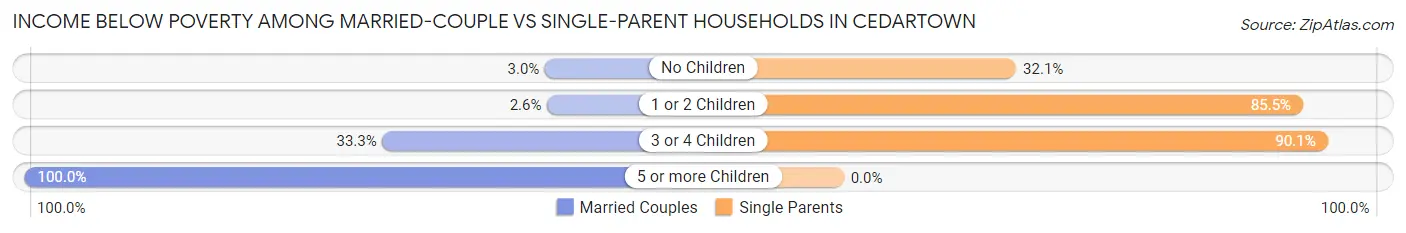
| Children | Married-Couple Families | Single-Parent Households |
| No Children | 15 (3.0%) | 71 (32.1%) |
| 1 or 2 Children | 18 (2.6%) | 485 (85.5%) |
| 3 or 4 Children | 60 (33.3%) | 155 (90.1%) |
| 5 or more Children | 17 (100.0%) | 0 (0.0%) |
| Total | 110 (8.0%) | 711 (74.1%) |
Race in Cedartown
The most populous races in Cedartown are White / Caucasian (6,411 | 63.1%), Hispanic or Latino (3,198 | 31.5%), and Black / African American (2,403 | 23.6%).
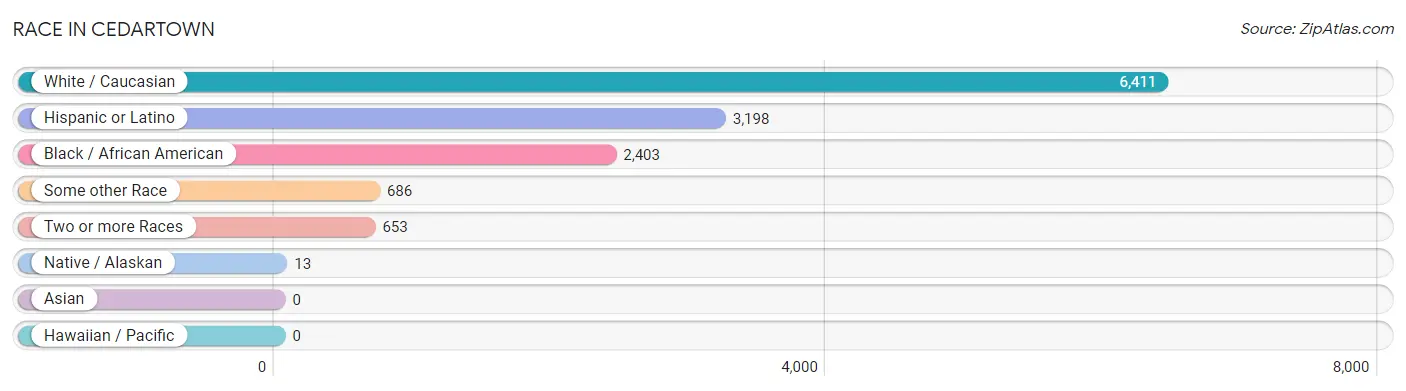
| Race | # Population | % Population |
| Asian | 0 | 0.0% |
| Black / African American | 2,403 | 23.6% |
| Hawaiian / Pacific | 0 | 0.0% |
| Hispanic or Latino | 3,198 | 31.5% |
| Native / Alaskan | 13 | 0.1% |
| White / Caucasian | 6,411 | 63.1% |
| Two or more Races | 653 | 6.4% |
| Some other Race | 686 | 6.8% |
| Total | 10,166 | 100.0% |
Ancestry in Cedartown
The most populous ancestries reported in Cedartown are Mexican (1,732 | 17.0%), American (1,617 | 15.9%), Central American (1,162 | 11.4%), Guatemalan (1,162 | 11.4%), and English (1,047 | 10.3%), together accounting for 66.1% of all Cedartown residents.
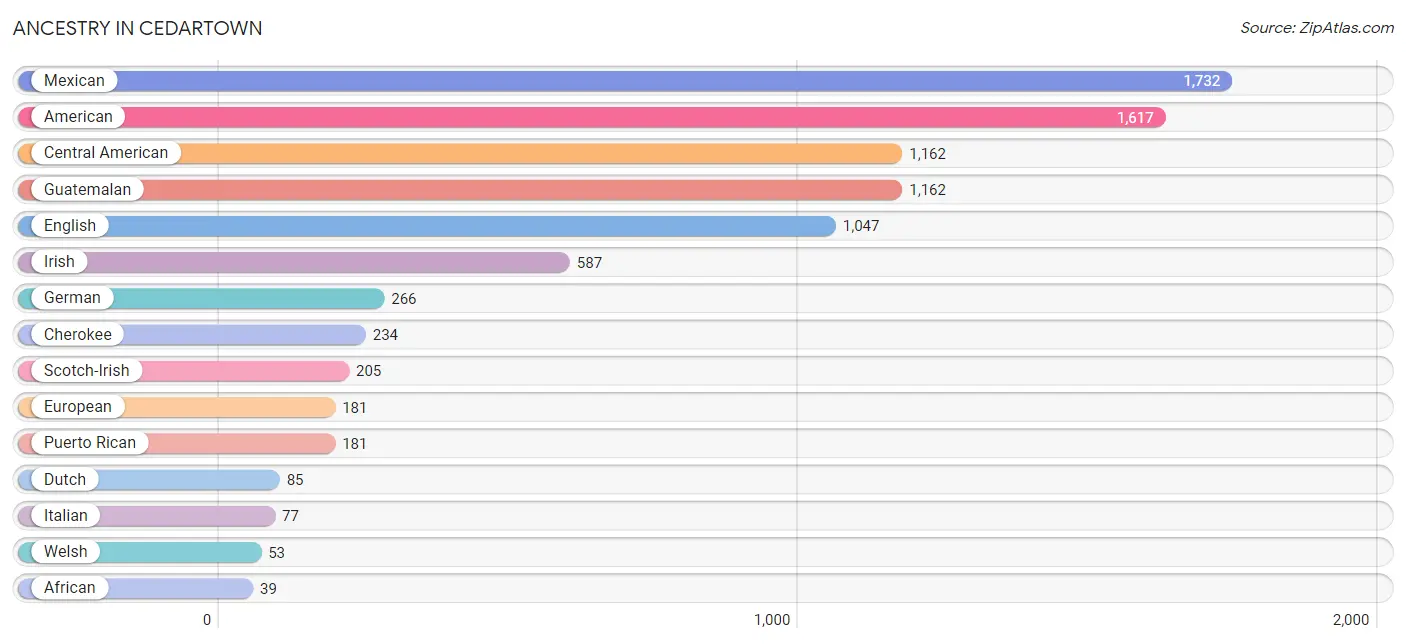
| Ancestry | # Population | % Population |
| African | 39 | 0.4% |
| American | 1,617 | 15.9% |
| Central American | 1,162 | 11.4% |
| Cherokee | 234 | 2.3% |
| Colombian | 35 | 0.3% |
| Dutch | 85 | 0.8% |
| English | 1,047 | 10.3% |
| European | 181 | 1.8% |
| French | 29 | 0.3% |
| German | 266 | 2.6% |
| Guatemalan | 1,162 | 11.4% |
| Hungarian | 6 | 0.1% |
| Irish | 587 | 5.8% |
| Italian | 77 | 0.8% |
| Jamaican | 8 | 0.1% |
| Lithuanian | 14 | 0.1% |
| Mexican | 1,732 | 17.0% |
| Mexican American Indian | 3 | 0.0% |
| Norwegian | 15 | 0.2% |
| Polish | 12 | 0.1% |
| Puerto Rican | 181 | 1.8% |
| Scotch-Irish | 205 | 2.0% |
| Scottish | 6 | 0.1% |
| South American | 35 | 0.3% |
| Subsaharan African | 39 | 0.4% |
| Swedish | 11 | 0.1% |
| Welsh | 53 | 0.5% | View All 27 Rows |
Immigrants in Cedartown
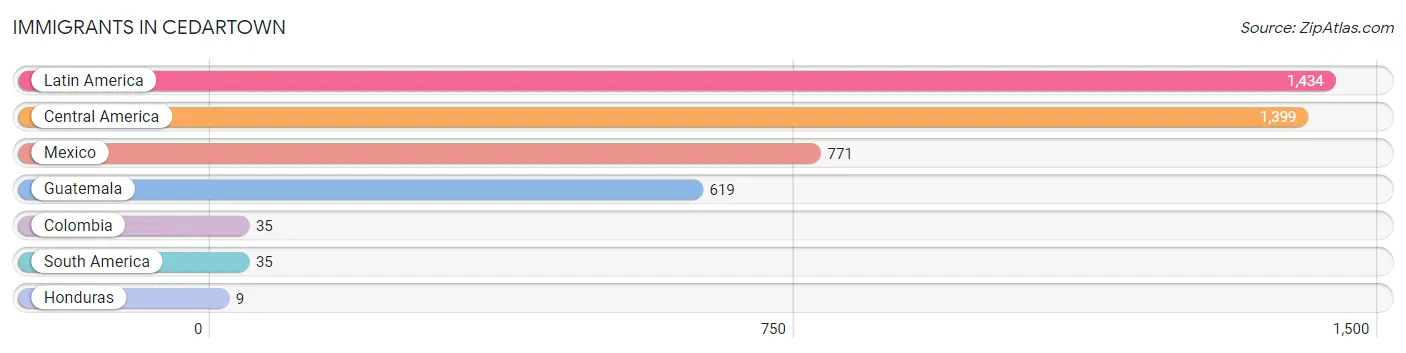
The most numerous immigrant groups reported in Cedartown came from Latin America (1,434 | 14.1%), Central America (1,399 | 13.8%), Mexico (771 | 7.6%), Guatemala (619 | 6.1%), and Colombia (35 | 0.3%), together accounting for 41.9% of all Cedartown residents.
| Immigration Origin | # Population | % Population |
| Central America | 1,399 | 13.8% |
| Colombia | 35 | 0.3% |
| Guatemala | 619 | 6.1% |
| Honduras | 9 | 0.1% |
| Latin America | 1,434 | 14.1% |
| Mexico | 771 | 7.6% |
| South America | 35 | 0.3% | View All 7 Rows |
Sex and Age in Cedartown
Sex and Age in Cedartown
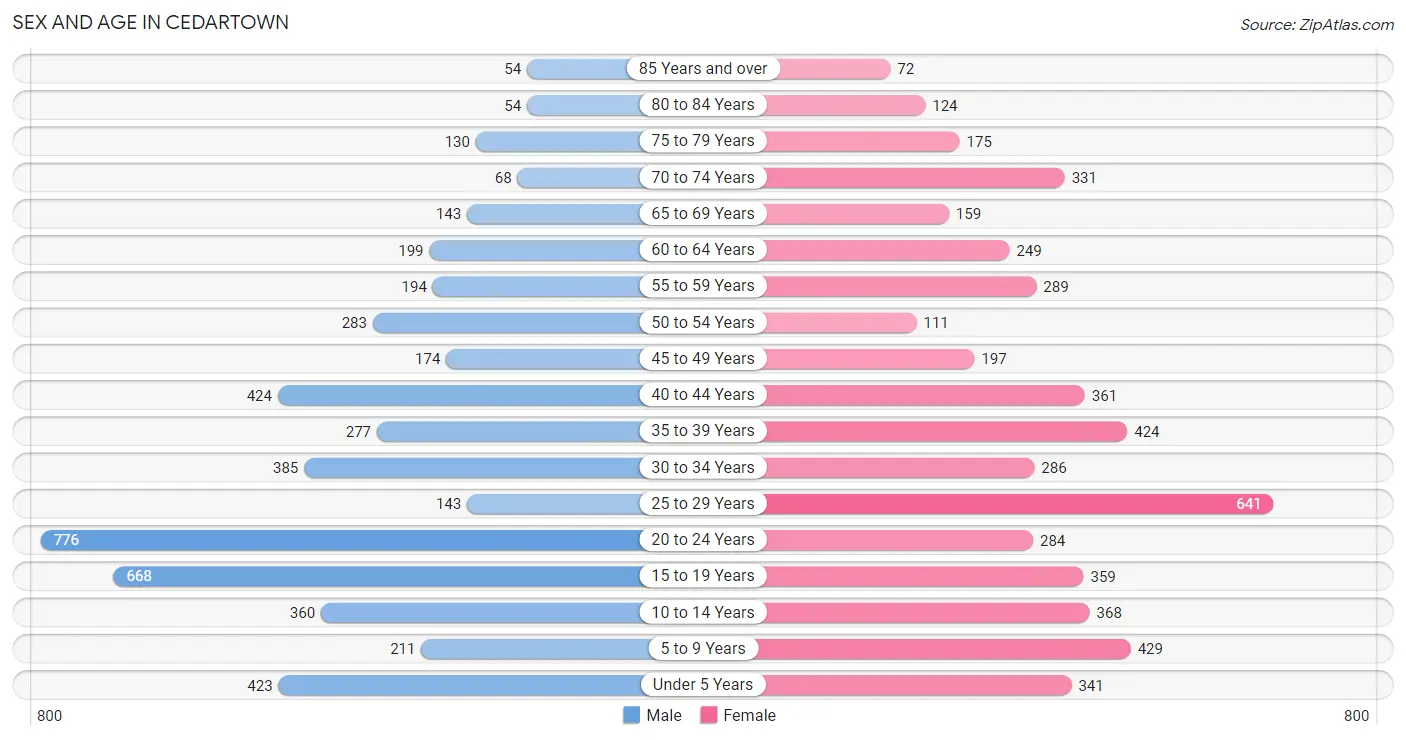
The most populous age groups in Cedartown are 20 to 24 Years (776 | 15.6%) for men and 25 to 29 Years (641 | 12.3%) for women.
| Age Bracket | Male | Female |
| Under 5 Years | 423 (8.5%) | 341 (6.6%) |
| 5 to 9 Years | 211 (4.3%) | 429 (8.3%) |
| 10 to 14 Years | 360 (7.2%) | 368 (7.1%) |
| 15 to 19 Years | 668 (13.5%) | 359 (6.9%) |
| 20 to 24 Years | 776 (15.6%) | 284 (5.5%) |
| 25 to 29 Years | 143 (2.9%) | 641 (12.3%) |
| 30 to 34 Years | 385 (7.7%) | 286 (5.5%) |
| 35 to 39 Years | 277 (5.6%) | 424 (8.2%) |
| 40 to 44 Years | 424 (8.5%) | 361 (6.9%) |
| 45 to 49 Years | 174 (3.5%) | 197 (3.8%) |
| 50 to 54 Years | 283 (5.7%) | 111 (2.1%) |
| 55 to 59 Years | 194 (3.9%) | 289 (5.6%) |
| 60 to 64 Years | 199 (4.0%) | 249 (4.8%) |
| 65 to 69 Years | 143 (2.9%) | 159 (3.1%) |
| 70 to 74 Years | 68 (1.4%) | 331 (6.4%) |
| 75 to 79 Years | 130 (2.6%) | 175 (3.4%) |
| 80 to 84 Years | 54 (1.1%) | 124 (2.4%) |
| 85 Years and over | 54 (1.1%) | 72 (1.4%) |
| Total | 4,966 (100.0%) | 5,200 (100.0%) |
Families and Households in Cedartown
Median Family Size in Cedartown
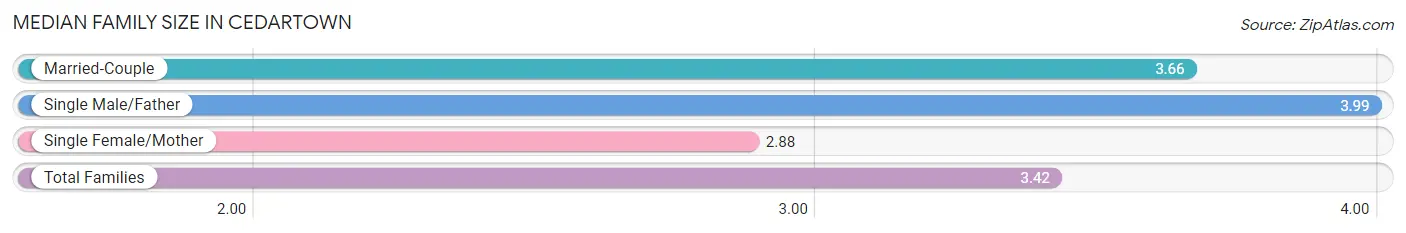
The median family size in Cedartown is 3.42 persons per family, with single male/father families (172 | 7.4%) accounting for the largest median family size of 3.99 persons per family. On the other hand, single female/mother families (788 | 33.8%) represent the smallest median family size with 2.88 persons per family.
| Family Type | # Families | Family Size |
| Married-Couple | 1,374 (58.9%) | 3.66 |
| Single Male/Father | 172 (7.4%) | 3.99 |
| Single Female/Mother | 788 (33.8%) | 2.88 |
| Total Families | 2,334 (100.0%) | 3.42 |
Median Household Size in Cedartown
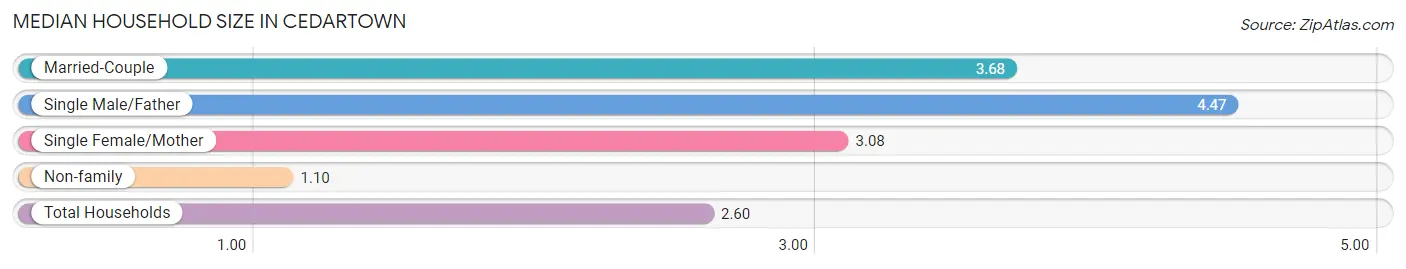
The median household size in Cedartown is 2.60 persons per household, with single male/father households (172 | 4.5%) accounting for the largest median household size of 4.47 persons per household. non-family households (1,459 | 38.5%) represent the smallest median household size with 1.10 persons per household.
| Household Type | # Households | Household Size |
| Married-Couple | 1,374 (36.2%) | 3.68 |
| Single Male/Father | 172 (4.5%) | 4.47 |
| Single Female/Mother | 788 (20.8%) | 3.08 |
| Non-family | 1,459 (38.5%) | 1.10 |
| Total Households | 3,793 (100.0%) | 2.60 |
Household Size by Marriage Status in Cedartown
Out of a total of 3,793 households in Cedartown, 2,334 (61.5%) are family households, while 1,459 (38.5%) are nonfamily households. The most numerous type of family households are 3-person households, comprising 693, and the most common type of nonfamily households are 1-person households, comprising 1,161.
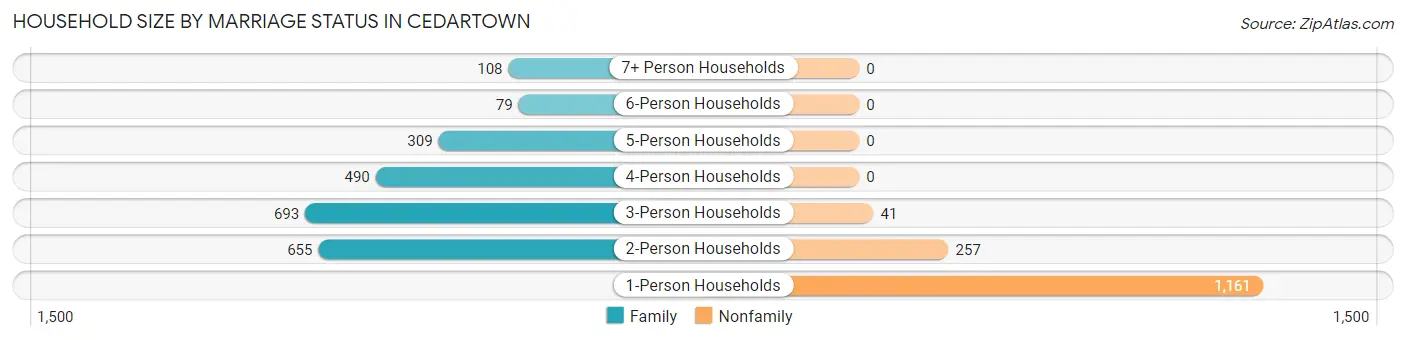
| Household Size | Family Households | Nonfamily Households |
| 1-Person Households | - | 1,161 (30.6%) |
| 2-Person Households | 655 (17.3%) | 257 (6.8%) |
| 3-Person Households | 693 (18.3%) | 41 (1.1%) |
| 4-Person Households | 490 (12.9%) | 0 (0.0%) |
| 5-Person Households | 309 (8.2%) | 0 (0.0%) |
| 6-Person Households | 79 (2.1%) | 0 (0.0%) |
| 7+ Person Households | 108 (2.9%) | 0 (0.0%) |
| Total | 2,334 (61.5%) | 1,459 (38.5%) |
Female Fertility in Cedartown
Fertility by Age in Cedartown
Average fertility rate in Cedartown is 55.0 births per 1,000 women. Women in the age bracket of 20 to 34 years have the highest fertility rate with 119.0 births per 1,000 women. Women in the age bracket of 20 to 34 years acount for 100.0% of all women with births.
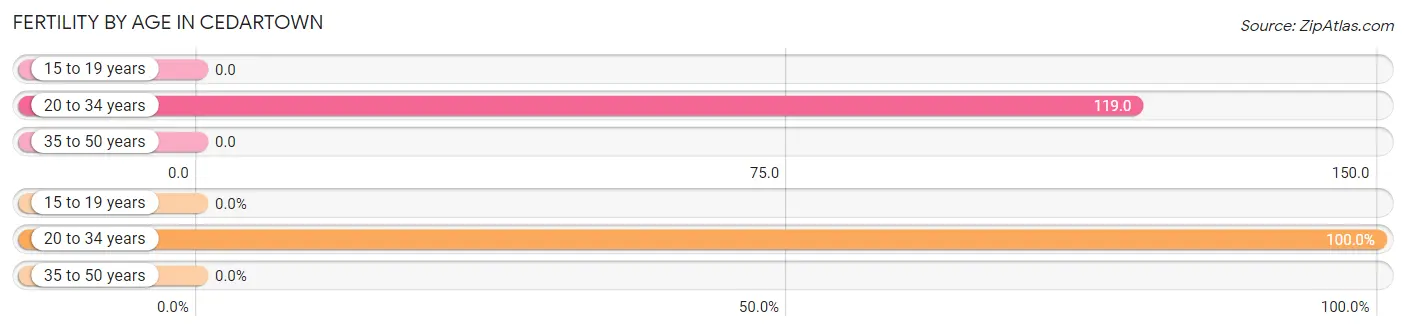
| Age Bracket | Women with Births | Births / 1,000 Women |
| 15 to 19 years | 0 (0.0%) | 0.0 |
| 20 to 34 years | 144 (100.0%) | 119.0 |
| 35 to 50 years | 0 (0.0%) | 0.0 |
| Total | 144 (100.0%) | 55.0 |
Fertility by Age by Marriage Status in Cedartown
40.3% of women with births (144) in Cedartown are married. The highest percentage of unmarried women with births falls into 20 to 34 years age bracket with 59.7% of them unmarried at the time of birth, while the lowest percentage of unmarried women with births belong to 20 to 34 years age bracket with 59.7% of them unmarried.
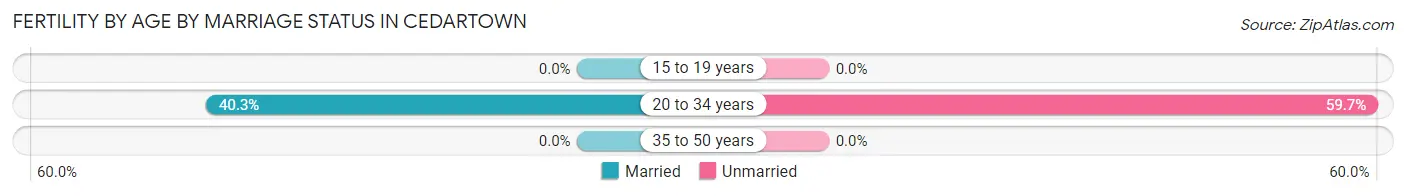
| Age Bracket | Married | Unmarried |
| 15 to 19 years | 0 (0.0%) | 0 (0.0%) |
| 20 to 34 years | 58 (40.3%) | 86 (59.7%) |
| 35 to 50 years | 0 (0.0%) | 0 (0.0%) |
| Total | 58 (40.3%) | 86 (59.7%) |
Fertility by Education in Cedartown
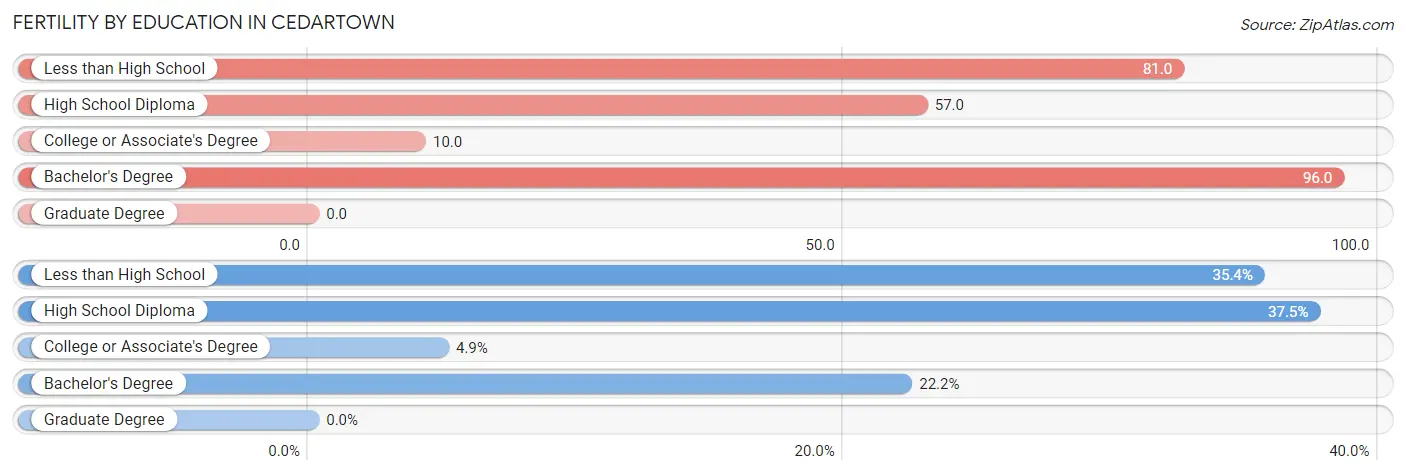
| Educational Attainment | Women with Births | Births / 1,000 Women |
| Less than High School | 51 (35.4%) | 81.0 |
| High School Diploma | 54 (37.5%) | 57.0 |
| College or Associate's Degree | 7 (4.9%) | 10.0 |
| Bachelor's Degree | 32 (22.2%) | 96.0 |
| Graduate Degree | 0 (0.0%) | 0.0 |
| Total | 144 (100.0%) | 55.0 |
Fertility by Education by Marriage Status in Cedartown
59.7% of women with births in Cedartown are unmarried. Women with the educational attainment of less than high school are most likely to be married with 100.0% of them married at childbirth, while women with the educational attainment of high school diploma are least likely to be married with 100.0% of them unmarried at childbirth.
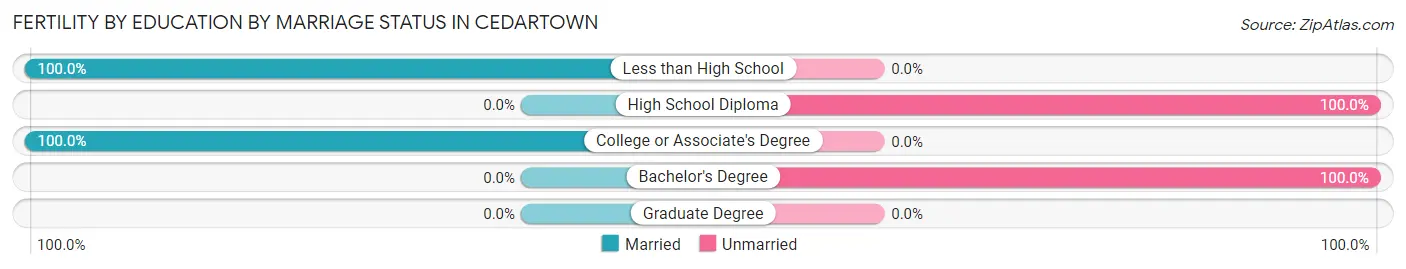
| Educational Attainment | Married | Unmarried |
| Less than High School | 51 (100.0%) | 0 (0.0%) |
| High School Diploma | 0 (0.0%) | 54 (100.0%) |
| College or Associate's Degree | 7 (100.0%) | 0 (0.0%) |
| Bachelor's Degree | 0 (0.0%) | 32 (100.0%) |
| Graduate Degree | 0 (0.0%) | 0 (0.0%) |
| Total | 58 (40.3%) | 86 (59.7%) |
Employment Characteristics in Cedartown
Employment by Class of Employer in Cedartown
Among the 3,955 employed individuals in Cedartown, private company employees (2,748 | 69.5%), self-employed (not incorporated) (294 | 7.4%), and self-employed (incorporated) (257 | 6.5%) make up the most common classes of employment.
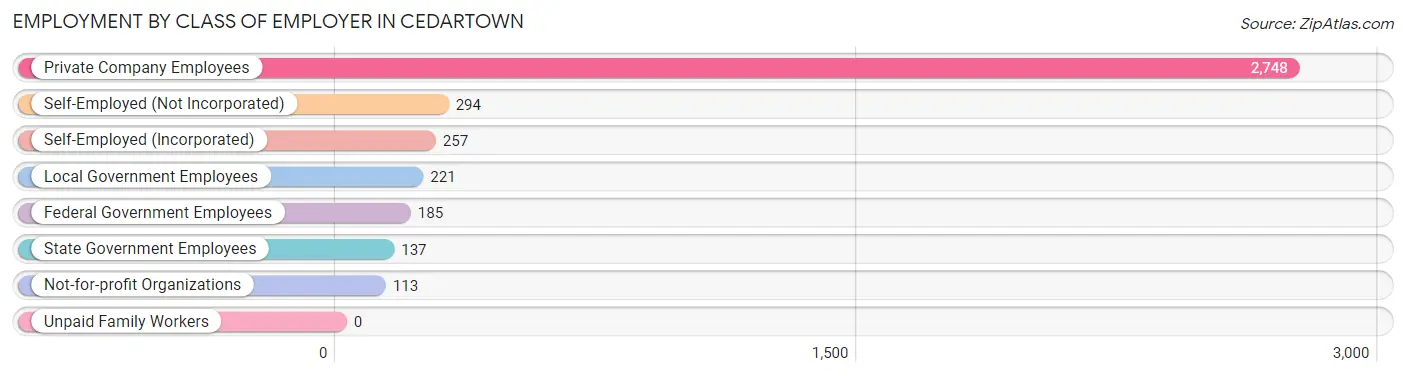
| Employer Class | # Employees | % Employees |
| Private Company Employees | 2,748 | 69.5% |
| Self-Employed (Incorporated) | 257 | 6.5% |
| Self-Employed (Not Incorporated) | 294 | 7.4% |
| Not-for-profit Organizations | 113 | 2.9% |
| Local Government Employees | 221 | 5.6% |
| State Government Employees | 137 | 3.5% |
| Federal Government Employees | 185 | 4.7% |
| Unpaid Family Workers | 0 | 0.0% |
| Total | 3,955 | 100.0% |
Employment Status by Age in Cedartown
According to the labor force statistics for Cedartown, out of the total population over 16 years of age (7,783), 56.3% or 4,382 individuals are in the labor force, with 7.4% or 324 of them unemployed. The age group with the highest labor force participation rate is 45 to 54 years, with 82.1% or 628 individuals in the labor force. Within the labor force, the 35 to 44 years age range has the highest percentage of unemployed individuals, with 18.9% or 228 of them being unemployed.
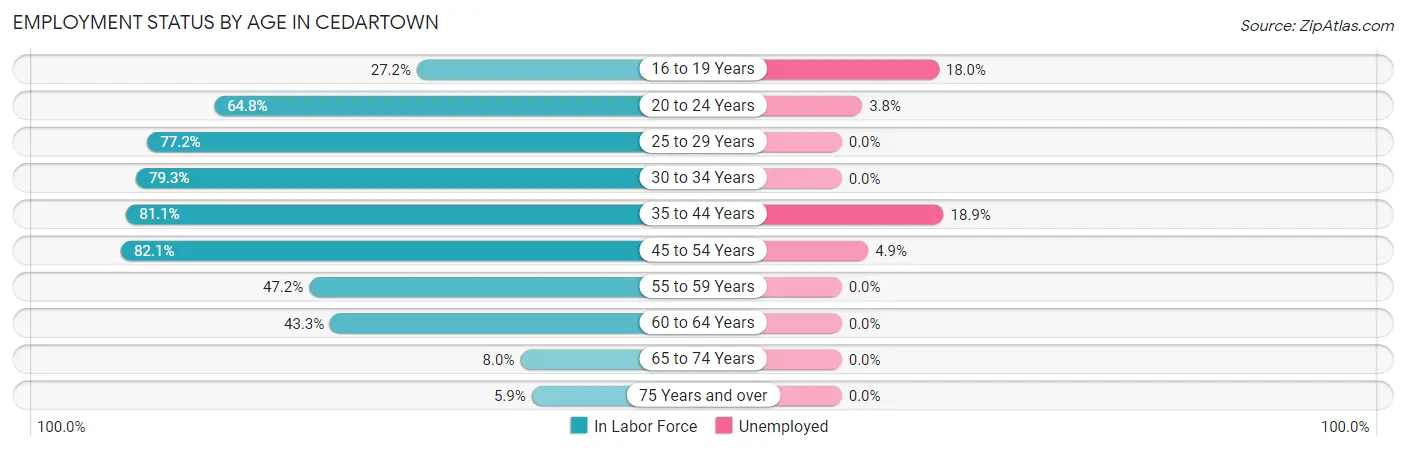
| Age Bracket | In Labor Force | Unemployed |
| 16 to 19 Years | 211 (27.2%) | 38 (18.0%) |
| 20 to 24 Years | 687 (64.8%) | 26 (3.8%) |
| 25 to 29 Years | 605 (77.2%) | 0 (0.0%) |
| 30 to 34 Years | 532 (79.3%) | 0 (0.0%) |
| 35 to 44 Years | 1,205 (81.1%) | 228 (18.9%) |
| 45 to 54 Years | 628 (82.1%) | 31 (4.9%) |
| 55 to 59 Years | 228 (47.2%) | 0 (0.0%) |
| 60 to 64 Years | 194 (43.3%) | 0 (0.0%) |
| 65 to 74 Years | 56 (8.0%) | 0 (0.0%) |
| 75 Years and over | 36 (5.9%) | 0 (0.0%) |
| Total | 4,382 (56.3%) | 324 (7.4%) |
Employment Status by Educational Attainment in Cedartown
According to labor force statistics for Cedartown, 73.2% of individuals (3,394) out of the total population between 25 and 64 years of age (4,637) are in the labor force, with 7.7% or 261 of them being unemployed. The group with the highest labor force participation rate are those with the educational attainment of bachelor's degree or higher, with 85.3% or 614 individuals in the labor force. Within the labor force, individuals with high school diploma education have the highest percentage of unemployment, with 12.5% or 145 of them being unemployed.
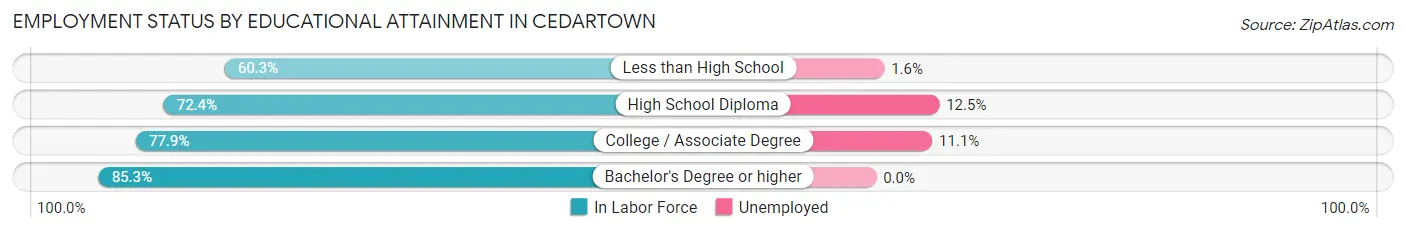
| Educational Attainment | In Labor Force | Unemployed |
| Less than High School | 636 (60.3%) | 17 (1.6%) |
| High School Diploma | 1,161 (72.4%) | 200 (12.5%) |
| College / Associate Degree | 980 (77.9%) | 140 (11.1%) |
| Bachelor's Degree or higher | 614 (85.3%) | 0 (0.0%) |
| Total | 3,394 (73.2%) | 357 (7.7%) |
Employment Occupations by Sex in Cedartown
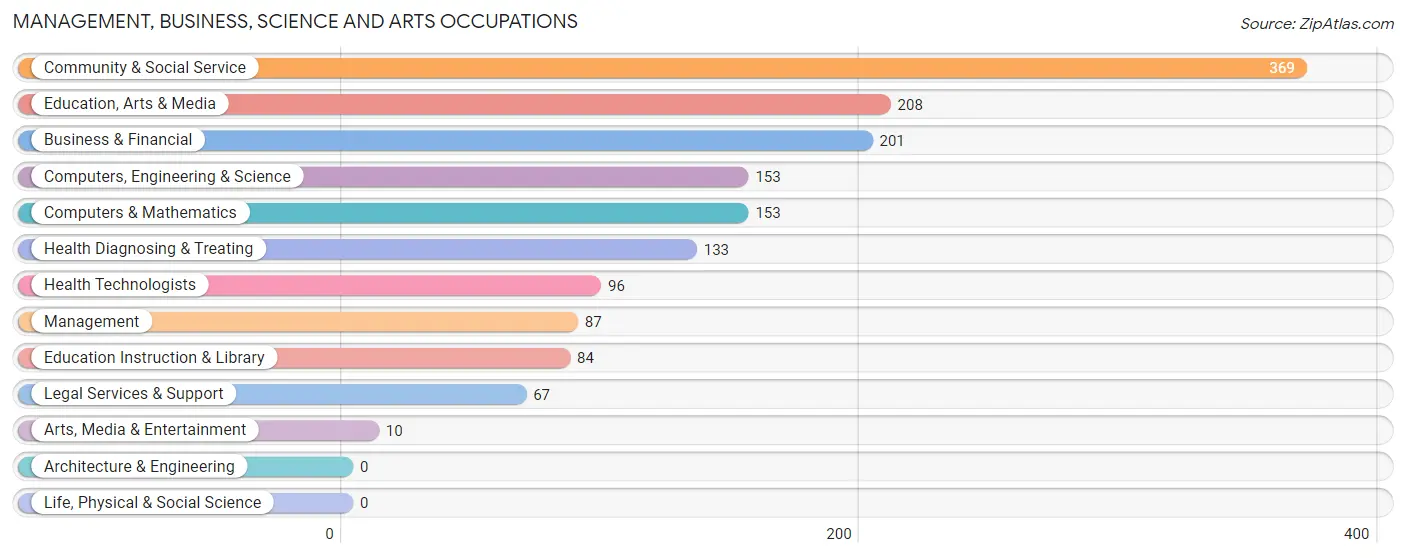
Management, Business, Science and Arts Occupations
The most common Management, Business, Science and Arts occupations in Cedartown are Community & Social Service (369 | 9.2%), Education, Arts & Media (208 | 5.2%), Business & Financial (201 | 5.0%), Computers, Engineering & Science (153 | 3.8%), and Computers & Mathematics (153 | 3.8%).
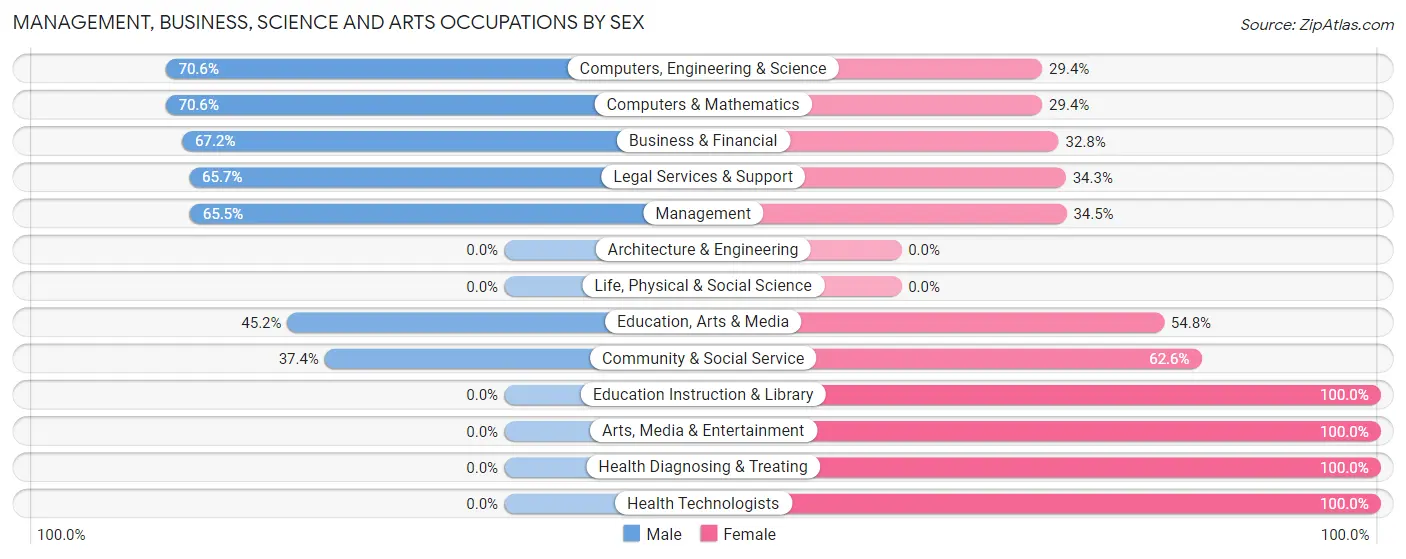
Management, Business, Science and Arts Occupations by Sex
Within the Management, Business, Science and Arts occupations in Cedartown, the most male-oriented occupations are Computers, Engineering & Science (70.6%), Computers & Mathematics (70.6%), and Business & Financial (67.2%), while the most female-oriented occupations are Education Instruction & Library (100.0%), Arts, Media & Entertainment (100.0%), and Health Diagnosing & Treating (100.0%).
| Occupation | Male | Female |
| Management | 57 (65.5%) | 30 (34.5%) |
| Business & Financial | 135 (67.2%) | 66 (32.8%) |
| Computers, Engineering & Science | 108 (70.6%) | 45 (29.4%) |
| Computers & Mathematics | 108 (70.6%) | 45 (29.4%) |
| Architecture & Engineering | 0 (0.0%) | 0 (0.0%) |
| Life, Physical & Social Science | 0 (0.0%) | 0 (0.0%) |
| Community & Social Service | 138 (37.4%) | 231 (62.6%) |
| Education, Arts & Media | 94 (45.2%) | 114 (54.8%) |
| Legal Services & Support | 44 (65.7%) | 23 (34.3%) |
| Education Instruction & Library | 0 (0.0%) | 84 (100.0%) |
| Arts, Media & Entertainment | 0 (0.0%) | 10 (100.0%) |
| Health Diagnosing & Treating | 0 (0.0%) | 133 (100.0%) |
| Health Technologists | 0 (0.0%) | 96 (100.0%) |
| Total (Category) | 438 (46.5%) | 505 (53.5%) |
| Total (Overall) | 2,193 (54.6%) | 1,824 (45.4%) |
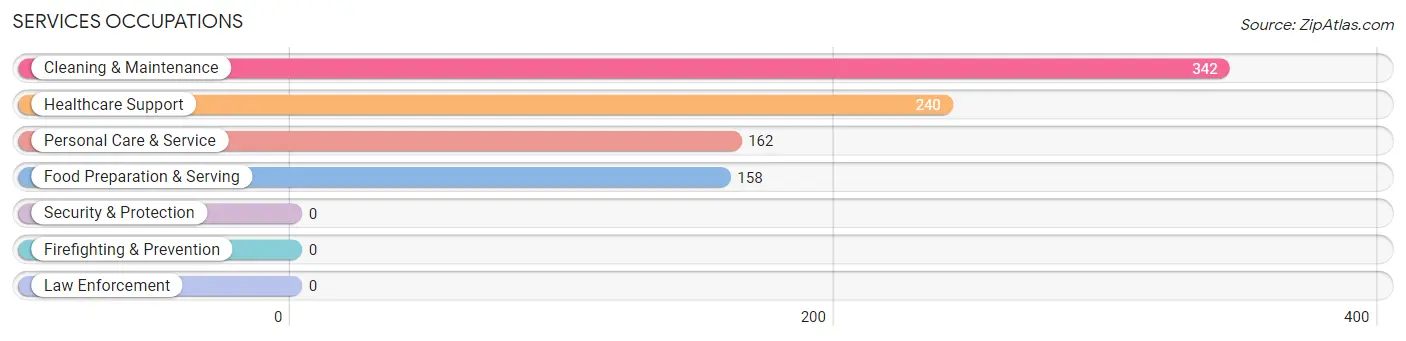
Services Occupations
The most common Services occupations in Cedartown are Cleaning & Maintenance (342 | 8.5%), Healthcare Support (240 | 6.0%), Personal Care & Service (162 | 4.0%), and Food Preparation & Serving (158 | 3.9%).
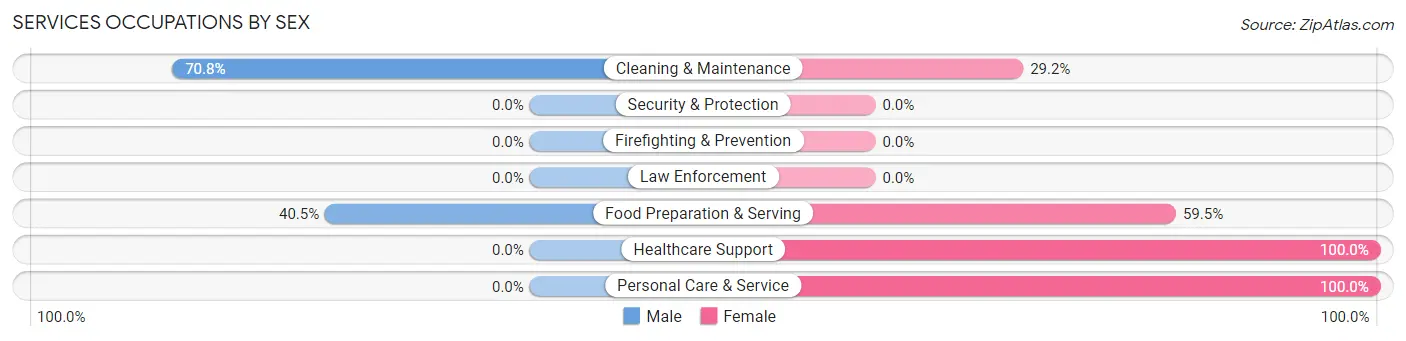
Services Occupations by Sex
Within the Services occupations in Cedartown, the most male-oriented occupations are Cleaning & Maintenance (70.8%), and Food Preparation & Serving (40.5%), while the most female-oriented occupations are Healthcare Support (100.0%), Personal Care & Service (100.0%), and Food Preparation & Serving (59.5%).
| Occupation | Male | Female |
| Healthcare Support | 0 (0.0%) | 240 (100.0%) |
| Security & Protection | 0 (0.0%) | 0 (0.0%) |
| Firefighting & Prevention | 0 (0.0%) | 0 (0.0%) |
| Law Enforcement | 0 (0.0%) | 0 (0.0%) |
| Food Preparation & Serving | 64 (40.5%) | 94 (59.5%) |
| Cleaning & Maintenance | 242 (70.8%) | 100 (29.2%) |
| Personal Care & Service | 0 (0.0%) | 162 (100.0%) |
| Total (Category) | 306 (33.9%) | 596 (66.1%) |
| Total (Overall) | 2,193 (54.6%) | 1,824 (45.4%) |
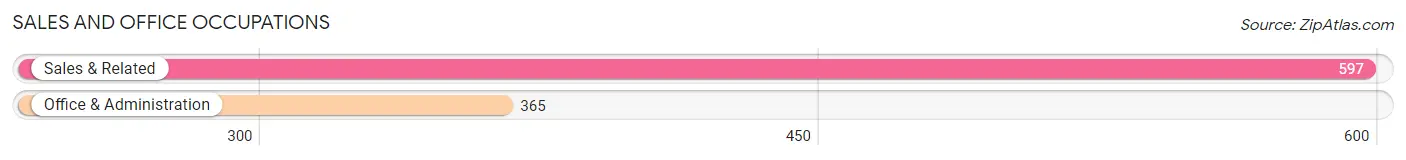
Sales and Office Occupations
The most common Sales and Office occupations in Cedartown are Sales & Related (597 | 14.9%), and Office & Administration (365 | 9.1%).
Sales and Office Occupations by Sex

| Occupation | Male | Female |
| Sales & Related | 389 (65.2%) | 208 (34.8%) |
| Office & Administration | 64 (17.5%) | 301 (82.5%) |
| Total (Category) | 453 (47.1%) | 509 (52.9%) |
| Total (Overall) | 2,193 (54.6%) | 1,824 (45.4%) |
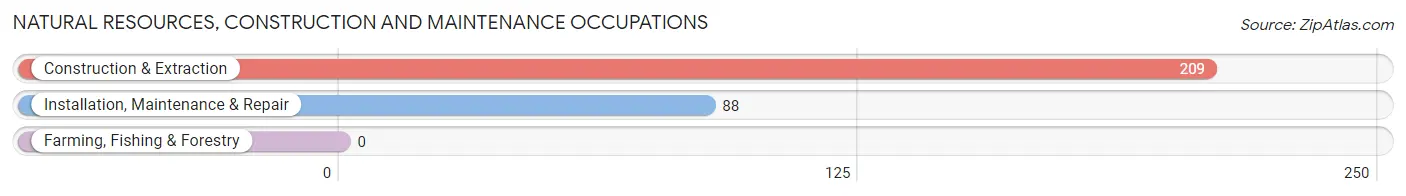
Natural Resources, Construction and Maintenance Occupations
The most common Natural Resources, Construction and Maintenance occupations in Cedartown are Construction & Extraction (209 | 5.2%), and Installation, Maintenance & Repair (88 | 2.2%).
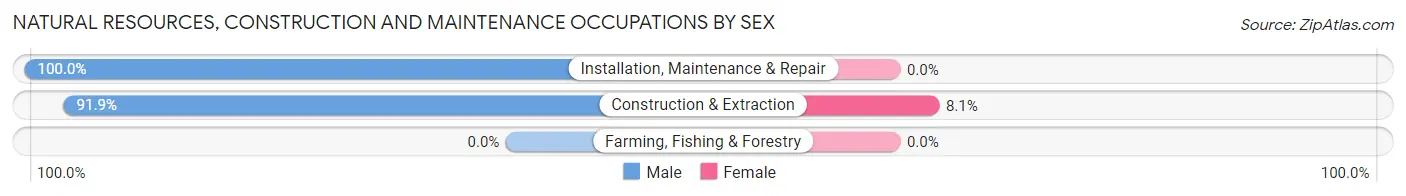
Natural Resources, Construction and Maintenance Occupations by Sex
| Occupation | Male | Female |
| Farming, Fishing & Forestry | 0 (0.0%) | 0 (0.0%) |
| Construction & Extraction | 192 (91.9%) | 17 (8.1%) |
| Installation, Maintenance & Repair | 88 (100.0%) | 0 (0.0%) |
| Total (Category) | 280 (94.3%) | 17 (5.7%) |
| Total (Overall) | 2,193 (54.6%) | 1,824 (45.4%) |
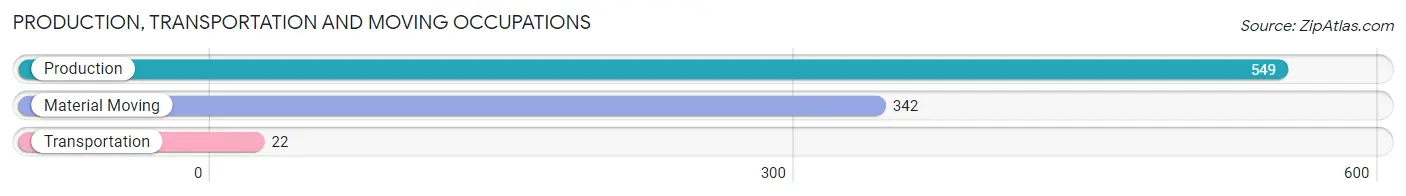
Production, Transportation and Moving Occupations
The most common Production, Transportation and Moving occupations in Cedartown are Production (549 | 13.7%), Material Moving (342 | 8.5%), and Transportation (22 | 0.5%).
Production, Transportation and Moving Occupations by Sex
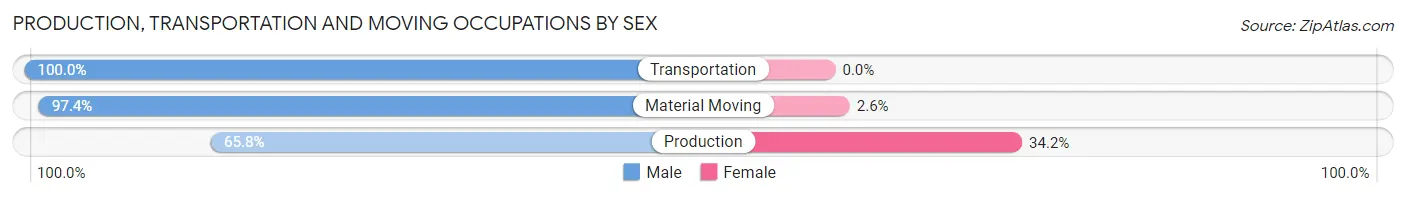
| Occupation | Male | Female |
| Production | 361 (65.8%) | 188 (34.2%) |
| Transportation | 22 (100.0%) | 0 (0.0%) |
| Material Moving | 333 (97.4%) | 9 (2.6%) |
| Total (Category) | 716 (78.4%) | 197 (21.6%) |
| Total (Overall) | 2,193 (54.6%) | 1,824 (45.4%) |
Employment Industries by Sex in Cedartown
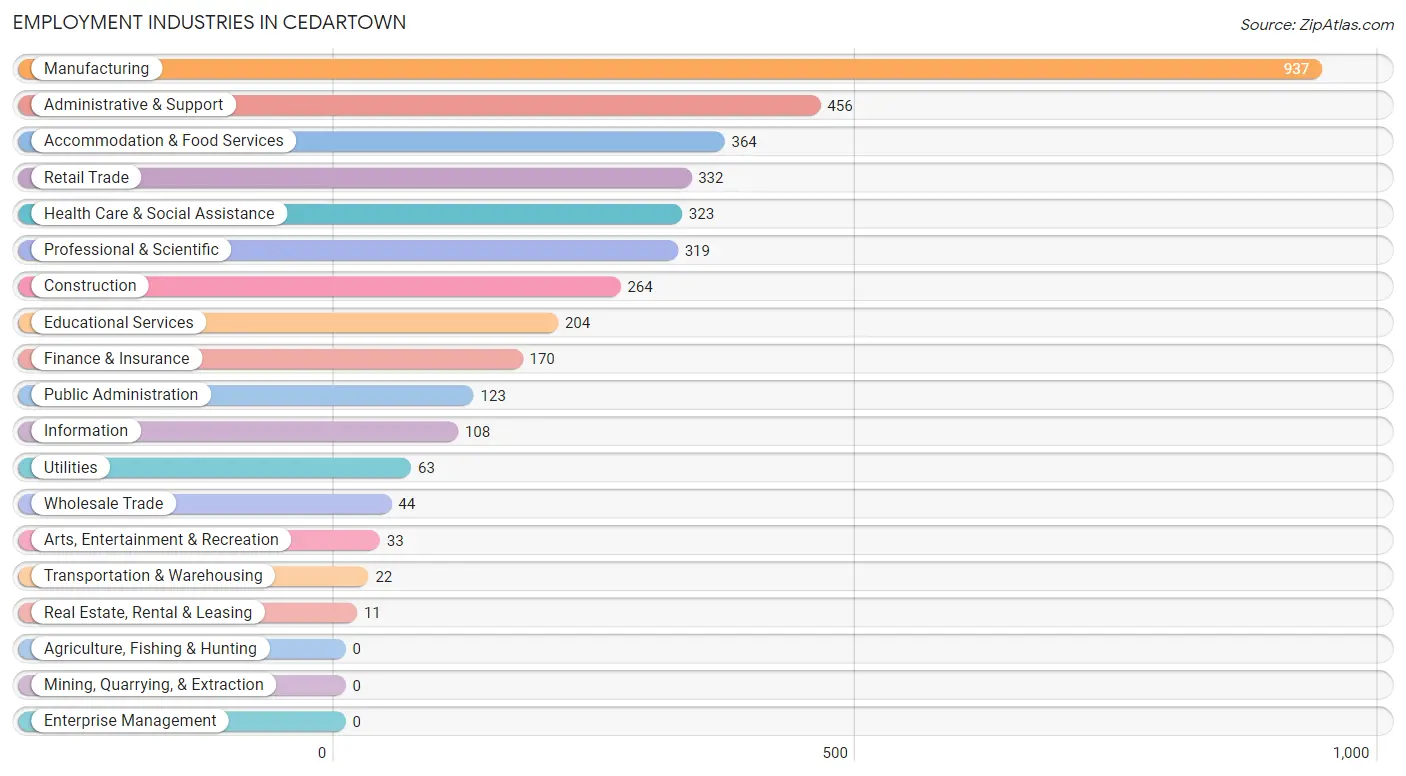
Employment Industries in Cedartown
The major employment industries in Cedartown include Manufacturing (937 | 23.3%), Administrative & Support (456 | 11.4%), Accommodation & Food Services (364 | 9.1%), Retail Trade (332 | 8.3%), and Health Care & Social Assistance (323 | 8.0%).
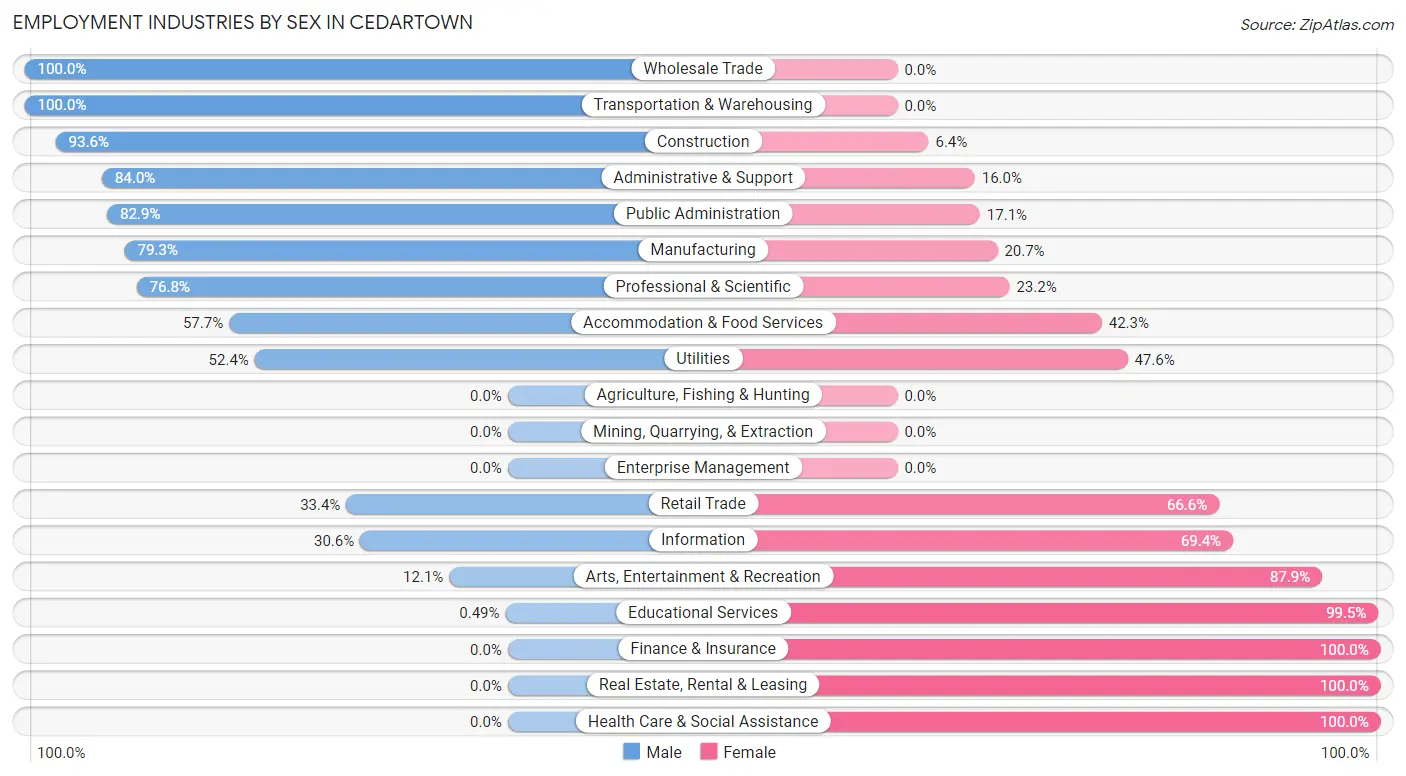
Employment Industries by Sex in Cedartown
The Cedartown industries that see more men than women are Wholesale Trade (100.0%), Transportation & Warehousing (100.0%), and Construction (93.6%), whereas the industries that tend to have a higher number of women are Finance & Insurance (100.0%), Real Estate, Rental & Leasing (100.0%), and Health Care & Social Assistance (100.0%).
| Industry | Male | Female |
| Agriculture, Fishing & Hunting | 0 (0.0%) | 0 (0.0%) |
| Mining, Quarrying, & Extraction | 0 (0.0%) | 0 (0.0%) |
| Construction | 247 (93.6%) | 17 (6.4%) |
| Manufacturing | 743 (79.3%) | 194 (20.7%) |
| Wholesale Trade | 44 (100.0%) | 0 (0.0%) |
| Retail Trade | 111 (33.4%) | 221 (66.6%) |
| Transportation & Warehousing | 22 (100.0%) | 0 (0.0%) |
| Utilities | 33 (52.4%) | 30 (47.6%) |
| Information | 33 (30.6%) | 75 (69.4%) |
| Finance & Insurance | 0 (0.0%) | 170 (100.0%) |
| Real Estate, Rental & Leasing | 0 (0.0%) | 11 (100.0%) |
| Professional & Scientific | 245 (76.8%) | 74 (23.2%) |
| Enterprise Management | 0 (0.0%) | 0 (0.0%) |
| Administrative & Support | 383 (84.0%) | 73 (16.0%) |
| Educational Services | 1 (0.5%) | 203 (99.5%) |
| Health Care & Social Assistance | 0 (0.0%) | 323 (100.0%) |
| Arts, Entertainment & Recreation | 4 (12.1%) | 29 (87.9%) |
| Accommodation & Food Services | 210 (57.7%) | 154 (42.3%) |
| Public Administration | 102 (82.9%) | 21 (17.1%) |
| Total | 2,193 (54.6%) | 1,824 (45.4%) |
Education in Cedartown
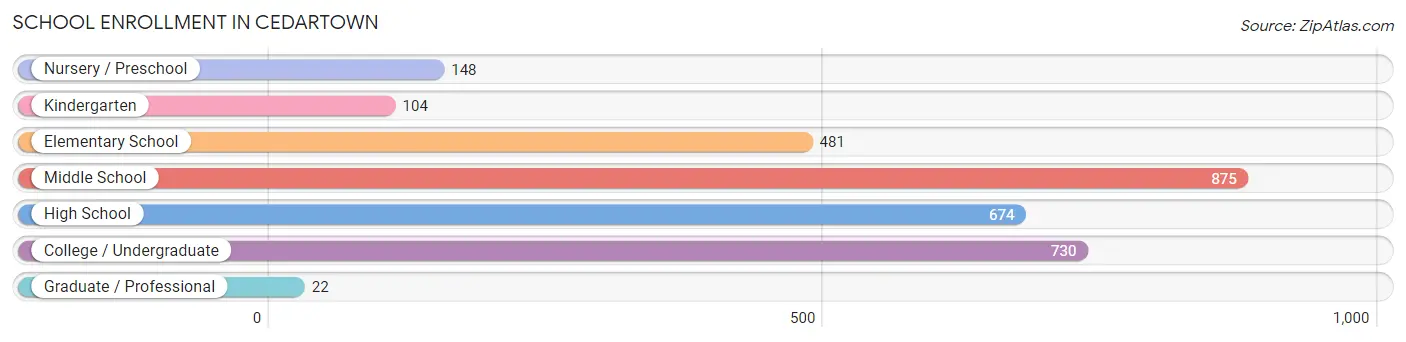
School Enrollment in Cedartown
The most common levels of schooling among the 3,034 students in Cedartown are middle school (875 | 28.8%), college / undergraduate (730 | 24.1%), and high school (674 | 22.2%).
| School Level | # Students | % Students |
| Nursery / Preschool | 148 | 4.9% |
| Kindergarten | 104 | 3.4% |
| Elementary School | 481 | 15.9% |
| Middle School | 875 | 28.8% |
| High School | 674 | 22.2% |
| College / Undergraduate | 730 | 24.1% |
| Graduate / Professional | 22 | 0.7% |
| Total | 3,034 | 100.0% |
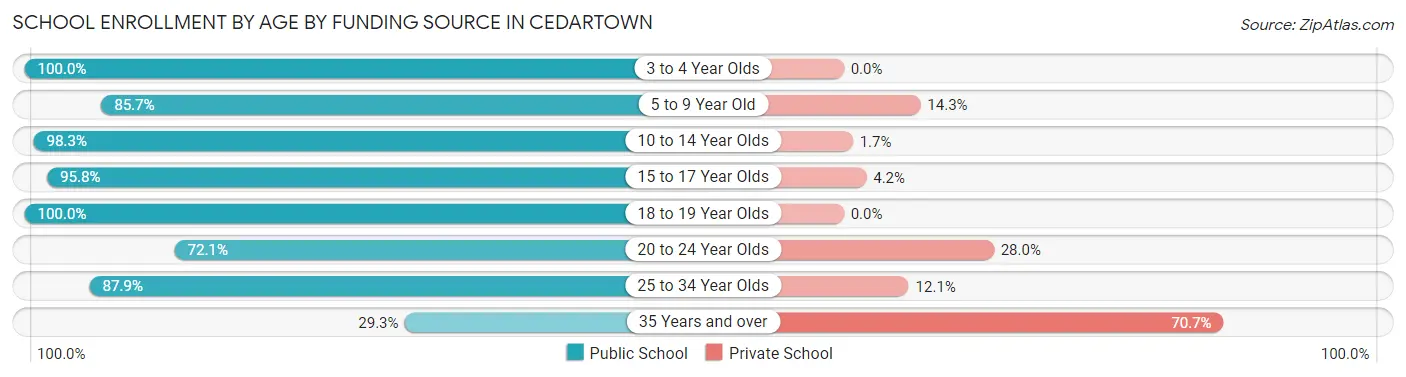
School Enrollment by Age by Funding Source in Cedartown
Out of a total of 3,034 students who are enrolled in schools in Cedartown, 337 (11.1%) attend a private institution, while the remaining 2,697 (88.9%) are enrolled in public schools. The age group of 35 years and over has the highest likelihood of being enrolled in private schools, with 29 (70.7% in the age bracket) enrolled. Conversely, the age group of 3 to 4 year olds has the lowest likelihood of being enrolled in a private school, with 84 (100.0% in the age bracket) attending a public institution.
| Age Bracket | Public School | Private School |
| 3 to 4 Year Olds | 84 (100.0%) | 0 (0.0%) |
| 5 to 9 Year Old | 528 (85.7%) | 88 (14.3%) |
| 10 to 14 Year Olds | 702 (98.3%) | 12 (1.7%) |
| 15 to 17 Year Olds | 592 (95.8%) | 26 (4.2%) |
| 18 to 19 Year Olds | 243 (100.0%) | 0 (0.0%) |
| 20 to 24 Year Olds | 428 (72.1%) | 166 (28.0%) |
| 25 to 34 Year Olds | 109 (87.9%) | 15 (12.1%) |
| 35 Years and over | 12 (29.3%) | 29 (70.7%) |
| Total | 2,697 (88.9%) | 337 (11.1%) |
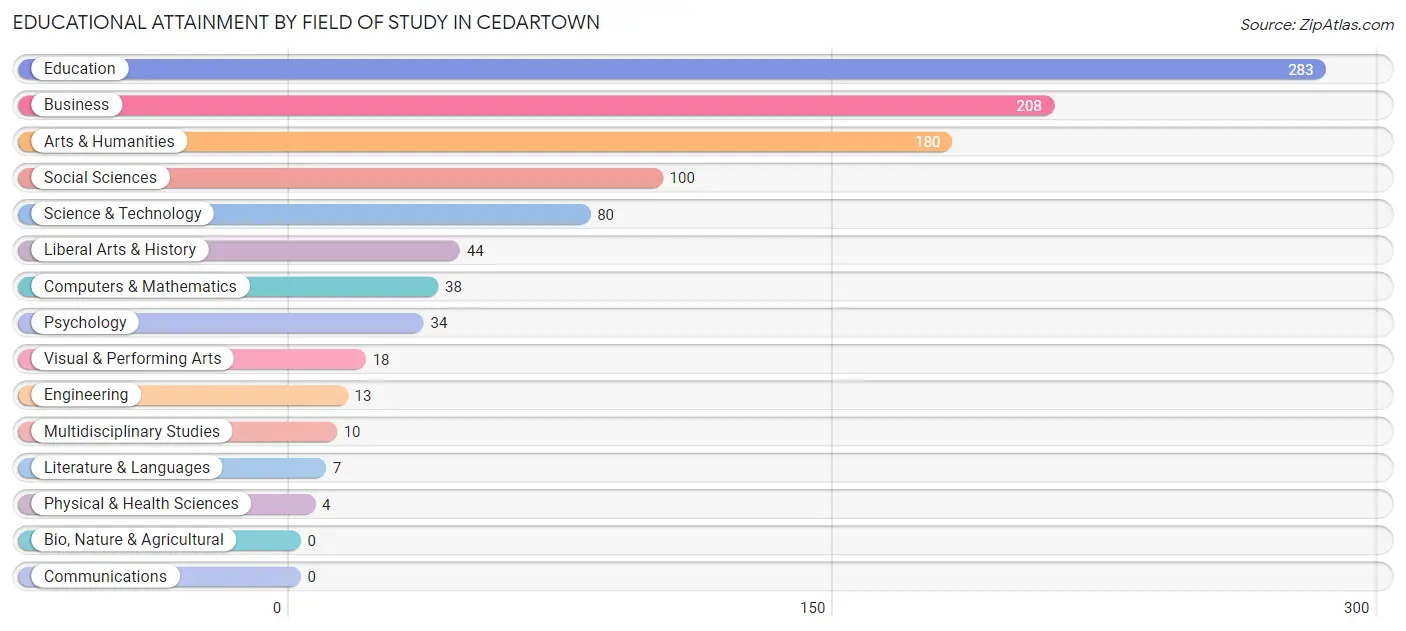
Educational Attainment by Field of Study in Cedartown
Education (283 | 27.8%), business (208 | 20.4%), arts & humanities (180 | 17.7%), social sciences (100 | 9.8%), and science & technology (80 | 7.9%) are the most common fields of study among 1,019 individuals in Cedartown who have obtained a bachelor's degree or higher.
| Field of Study | # Graduates | % Graduates |
| Computers & Mathematics | 38 | 3.7% |
| Bio, Nature & Agricultural | 0 | 0.0% |
| Physical & Health Sciences | 4 | 0.4% |
| Psychology | 34 | 3.3% |
| Social Sciences | 100 | 9.8% |
| Engineering | 13 | 1.3% |
| Multidisciplinary Studies | 10 | 1.0% |
| Science & Technology | 80 | 7.9% |
| Business | 208 | 20.4% |
| Education | 283 | 27.8% |
| Literature & Languages | 7 | 0.7% |
| Liberal Arts & History | 44 | 4.3% |
| Visual & Performing Arts | 18 | 1.8% |
| Communications | 0 | 0.0% |
| Arts & Humanities | 180 | 17.7% |
| Total | 1,019 | 100.0% |
Transportation & Commute in Cedartown
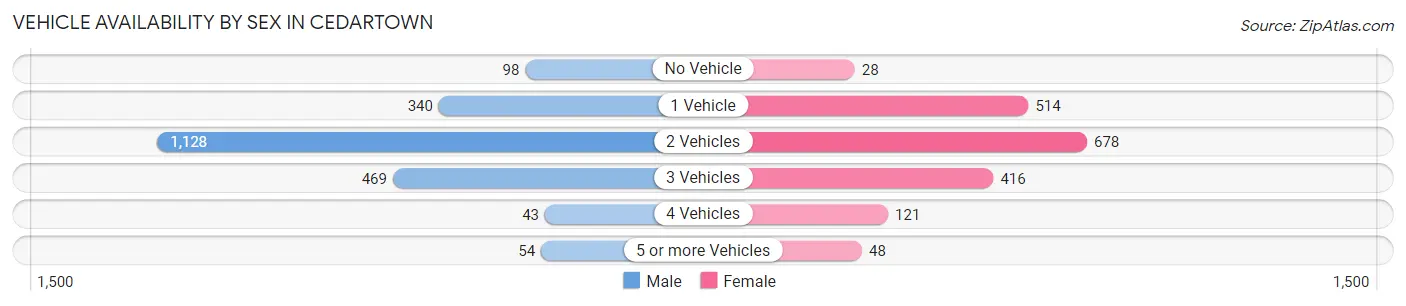
Vehicle Availability by Sex in Cedartown
The most prevalent vehicle ownership categories in Cedartown are males with 2 vehicles (1,128, accounting for 52.9%) and females with 2 vehicles (678, making up 62.5%).
| Vehicles Available | Male | Female |
| No Vehicle | 98 (4.6%) | 28 (1.5%) |
| 1 Vehicle | 340 (16.0%) | 514 (28.5%) |
| 2 Vehicles | 1,128 (52.9%) | 678 (37.6%) |
| 3 Vehicles | 469 (22.0%) | 416 (23.1%) |
| 4 Vehicles | 43 (2.0%) | 121 (6.7%) |
| 5 or more Vehicles | 54 (2.5%) | 48 (2.7%) |
| Total | 2,132 (100.0%) | 1,805 (100.0%) |
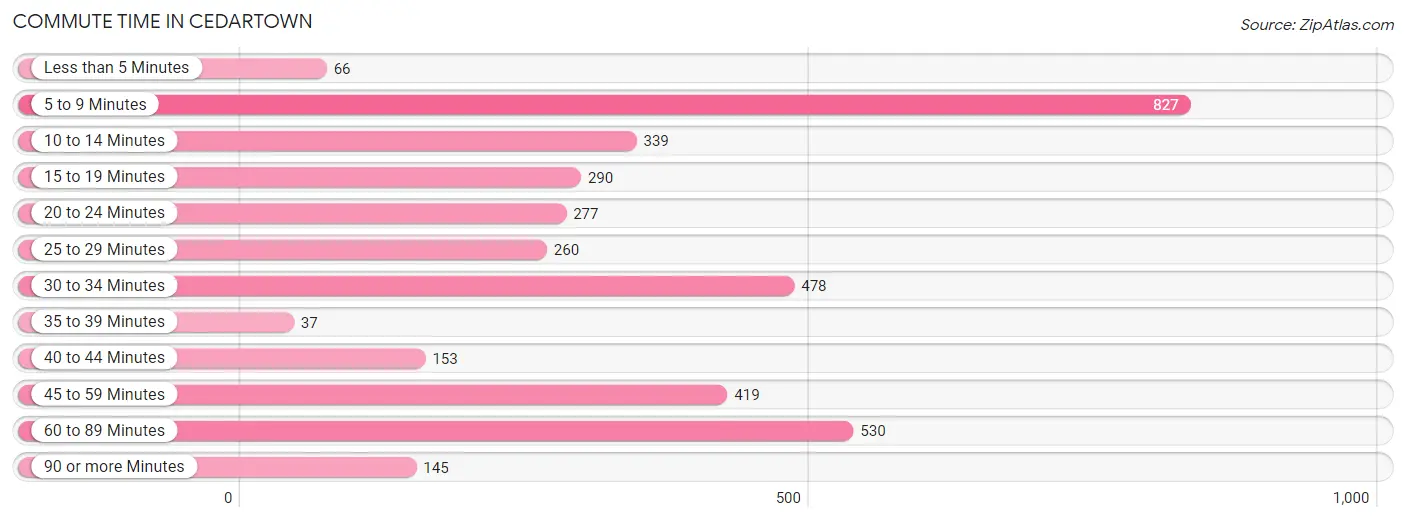
Commute Time in Cedartown
The most frequently occuring commute durations in Cedartown are 5 to 9 minutes (827 commuters, 21.6%), 60 to 89 minutes (530 commuters, 13.9%), and 30 to 34 minutes (478 commuters, 12.5%).
| Commute Time | # Commuters | % Commuters |
| Less than 5 Minutes | 66 | 1.7% |
| 5 to 9 Minutes | 827 | 21.6% |
| 10 to 14 Minutes | 339 | 8.9% |
| 15 to 19 Minutes | 290 | 7.6% |
| 20 to 24 Minutes | 277 | 7.2% |
| 25 to 29 Minutes | 260 | 6.8% |
| 30 to 34 Minutes | 478 | 12.5% |
| 35 to 39 Minutes | 37 | 1.0% |
| 40 to 44 Minutes | 153 | 4.0% |
| 45 to 59 Minutes | 419 | 11.0% |
| 60 to 89 Minutes | 530 | 13.9% |
| 90 or more Minutes | 145 | 3.8% |
Commute Time by Sex in Cedartown
The most common commute times in Cedartown are 60 to 89 minutes (513 commuters, 23.9%) for males and 5 to 9 minutes (630 commuters, 37.6%) for females.
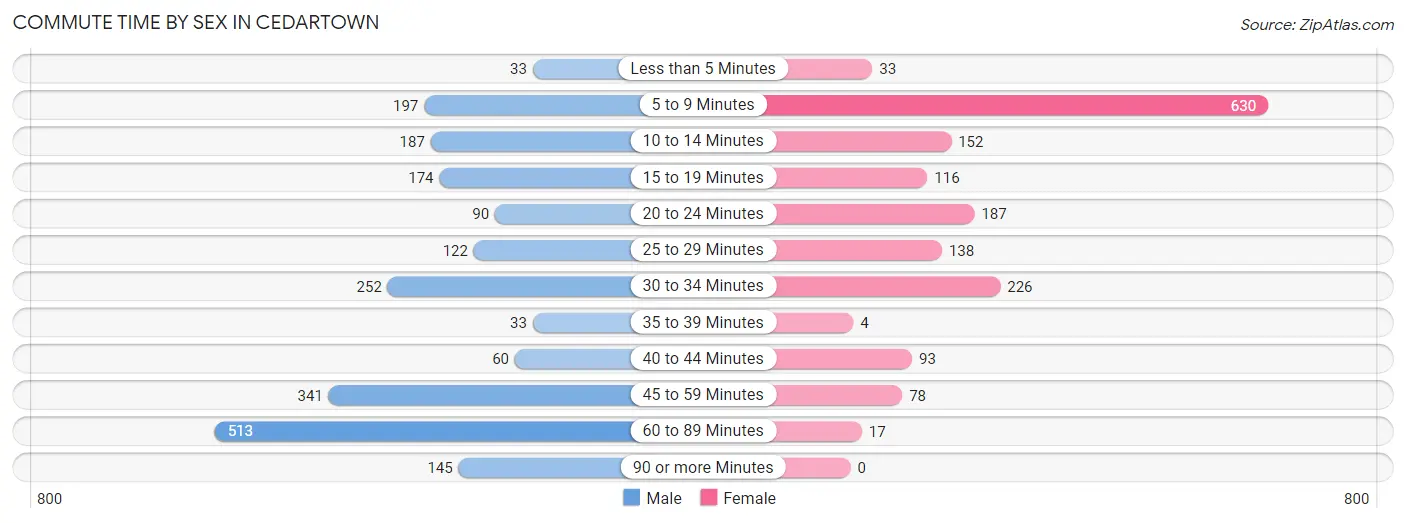
| Commute Time | Male | Female |
| Less than 5 Minutes | 33 (1.5%) | 33 (2.0%) |
| 5 to 9 Minutes | 197 (9.2%) | 630 (37.6%) |
| 10 to 14 Minutes | 187 (8.7%) | 152 (9.1%) |
| 15 to 19 Minutes | 174 (8.1%) | 116 (6.9%) |
| 20 to 24 Minutes | 90 (4.2%) | 187 (11.2%) |
| 25 to 29 Minutes | 122 (5.7%) | 138 (8.2%) |
| 30 to 34 Minutes | 252 (11.7%) | 226 (13.5%) |
| 35 to 39 Minutes | 33 (1.5%) | 4 (0.2%) |
| 40 to 44 Minutes | 60 (2.8%) | 93 (5.6%) |
| 45 to 59 Minutes | 341 (15.9%) | 78 (4.7%) |
| 60 to 89 Minutes | 513 (23.9%) | 17 (1.0%) |
| 90 or more Minutes | 145 (6.8%) | 0 (0.0%) |
Time of Departure to Work by Sex in Cedartown
The most frequent times of departure to work in Cedartown are 6:00 AM to 6:29 AM (524, 24.4%) for males and 7:00 AM to 7:29 AM (387, 23.1%) for females.
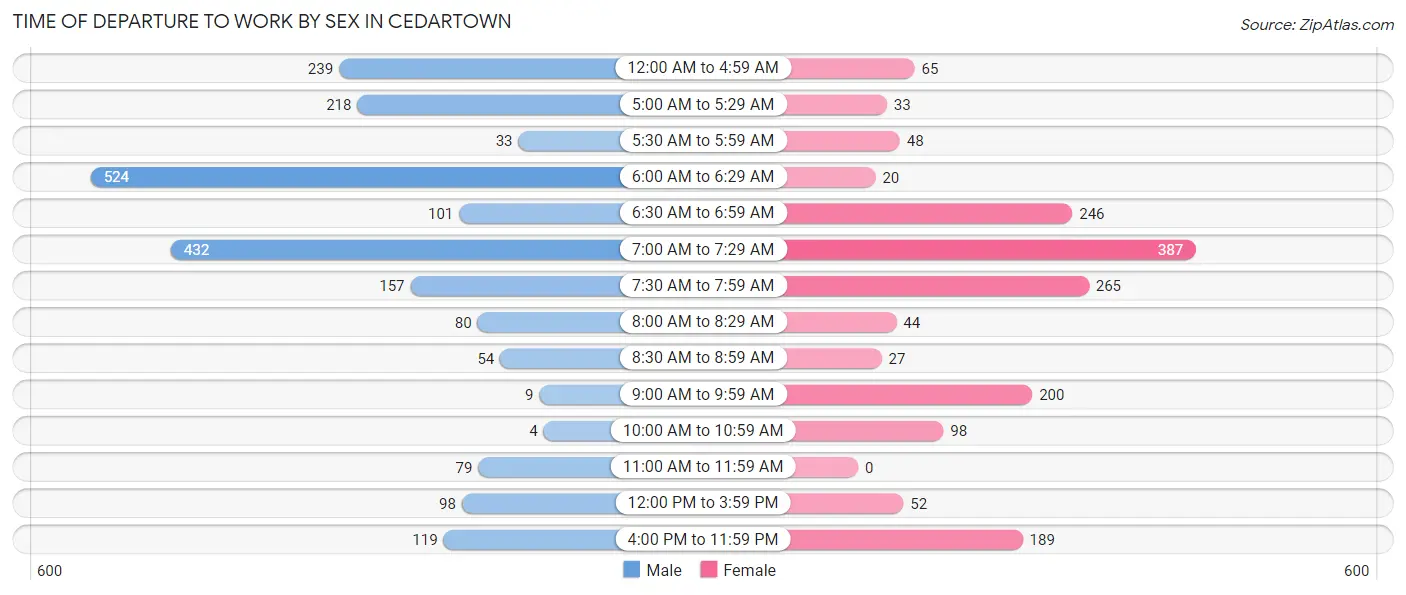
| Time of Departure | Male | Female |
| 12:00 AM to 4:59 AM | 239 (11.1%) | 65 (3.9%) |
| 5:00 AM to 5:29 AM | 218 (10.2%) | 33 (2.0%) |
| 5:30 AM to 5:59 AM | 33 (1.5%) | 48 (2.9%) |
| 6:00 AM to 6:29 AM | 524 (24.4%) | 20 (1.2%) |
| 6:30 AM to 6:59 AM | 101 (4.7%) | 246 (14.7%) |
| 7:00 AM to 7:29 AM | 432 (20.1%) | 387 (23.1%) |
| 7:30 AM to 7:59 AM | 157 (7.3%) | 265 (15.8%) |
| 8:00 AM to 8:29 AM | 80 (3.7%) | 44 (2.6%) |
| 8:30 AM to 8:59 AM | 54 (2.5%) | 27 (1.6%) |
| 9:00 AM to 9:59 AM | 9 (0.4%) | 200 (11.9%) |
| 10:00 AM to 10:59 AM | 4 (0.2%) | 98 (5.9%) |
| 11:00 AM to 11:59 AM | 79 (3.7%) | 0 (0.0%) |
| 12:00 PM to 3:59 PM | 98 (4.6%) | 52 (3.1%) |
| 4:00 PM to 11:59 PM | 119 (5.5%) | 189 (11.3%) |
| Total | 2,147 (100.0%) | 1,674 (100.0%) |
Housing Occupancy in Cedartown
Occupancy by Ownership in Cedartown
Of the total 3,793 dwellings in Cedartown, owner-occupied units account for 1,789 (47.2%), while renter-occupied units make up 2,004 (52.8%).
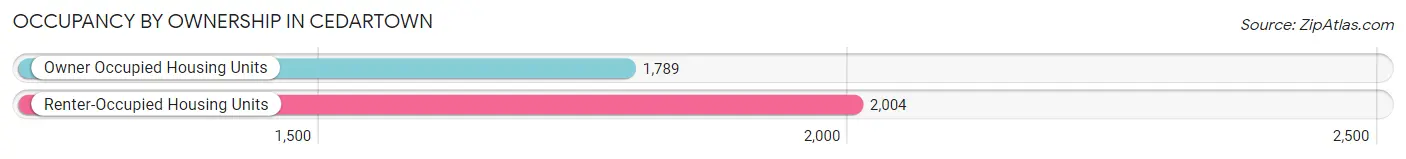
| Occupancy | # Housing Units | % Housing Units |
| Owner Occupied Housing Units | 1,789 | 47.2% |
| Renter-Occupied Housing Units | 2,004 | 52.8% |
| Total Occupied Housing Units | 3,793 | 100.0% |
Occupancy by Household Size in Cedartown
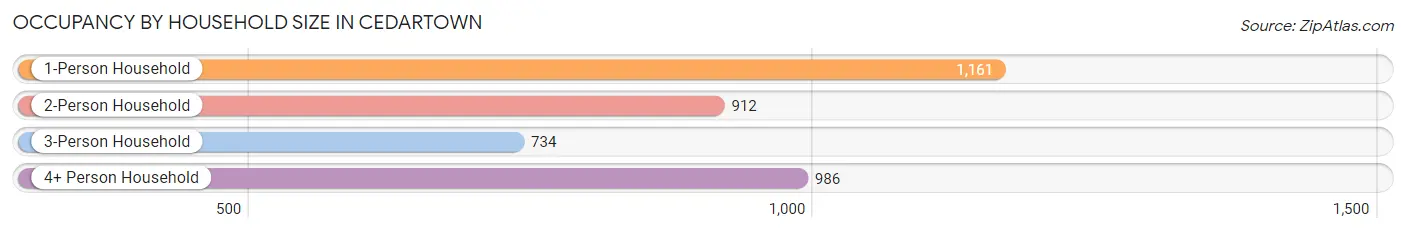
| Household Size | # Housing Units | % Housing Units |
| 1-Person Household | 1,161 | 30.6% |
| 2-Person Household | 912 | 24.0% |
| 3-Person Household | 734 | 19.4% |
| 4+ Person Household | 986 | 26.0% |
| Total Housing Units | 3,793 | 100.0% |
Occupancy by Ownership by Household Size in Cedartown
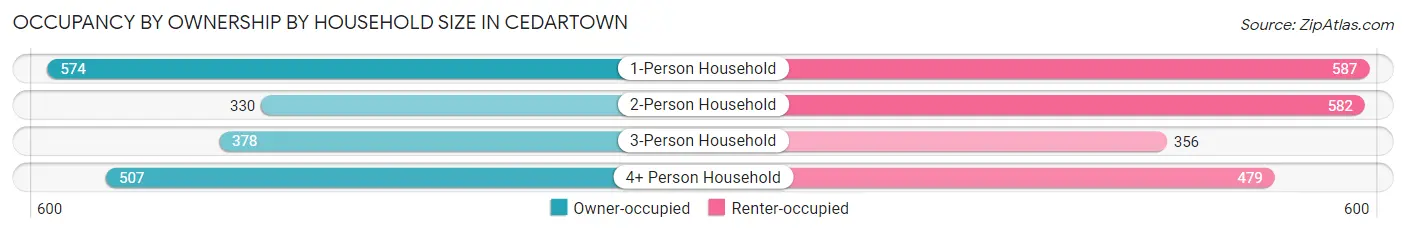
| Household Size | Owner-occupied | Renter-occupied |
| 1-Person Household | 574 (49.4%) | 587 (50.6%) |
| 2-Person Household | 330 (36.2%) | 582 (63.8%) |
| 3-Person Household | 378 (51.5%) | 356 (48.5%) |
| 4+ Person Household | 507 (51.4%) | 479 (48.6%) |
| Total Housing Units | 1,789 (47.2%) | 2,004 (52.8%) |
Occupancy by Educational Attainment in Cedartown
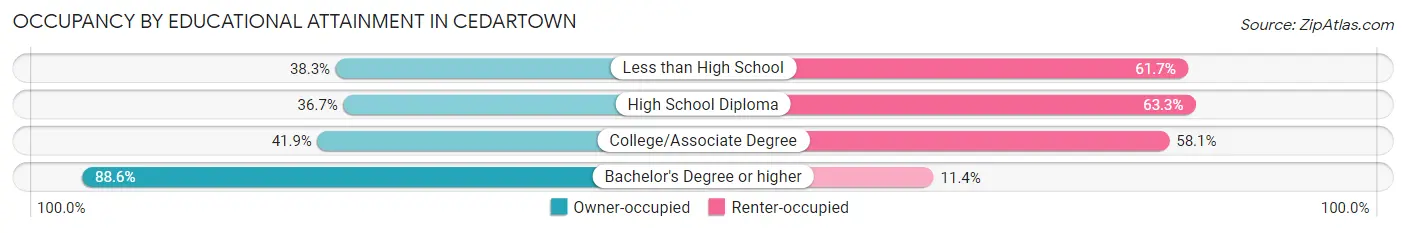
| Household Size | Owner-occupied | Renter-occupied |
| Less than High School | 305 (38.3%) | 492 (61.7%) |
| High School Diploma | 503 (36.7%) | 866 (63.3%) |
| College/Associate Degree | 413 (41.9%) | 573 (58.1%) |
| Bachelor's Degree or higher | 568 (88.6%) | 73 (11.4%) |
Occupancy by Age of Householder in Cedartown
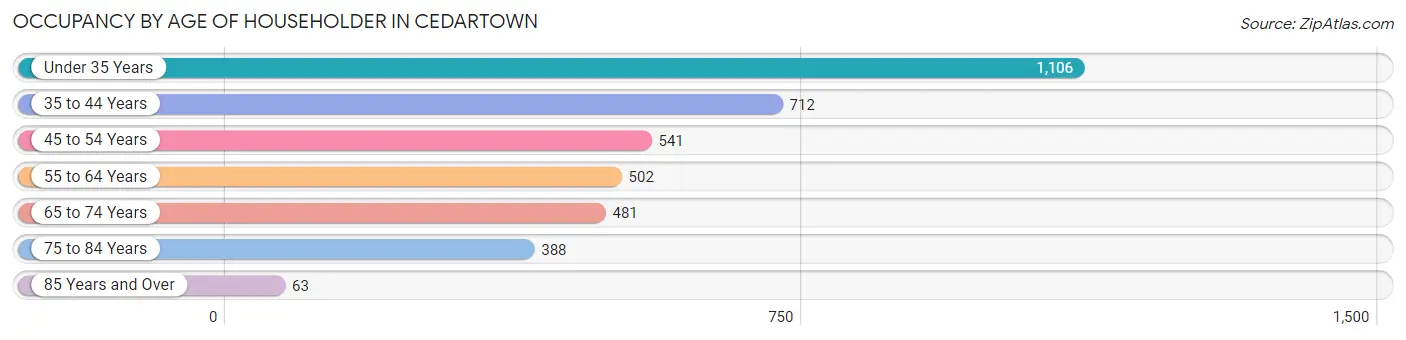
| Age Bracket | # Households | % Households |
| Under 35 Years | 1,106 | 29.2% |
| 35 to 44 Years | 712 | 18.8% |
| 45 to 54 Years | 541 | 14.3% |
| 55 to 64 Years | 502 | 13.2% |
| 65 to 74 Years | 481 | 12.7% |
| 75 to 84 Years | 388 | 10.2% |
| 85 Years and Over | 63 | 1.7% |
| Total | 3,793 | 100.0% |
Housing Finances in Cedartown
Median Income by Occupancy in Cedartown
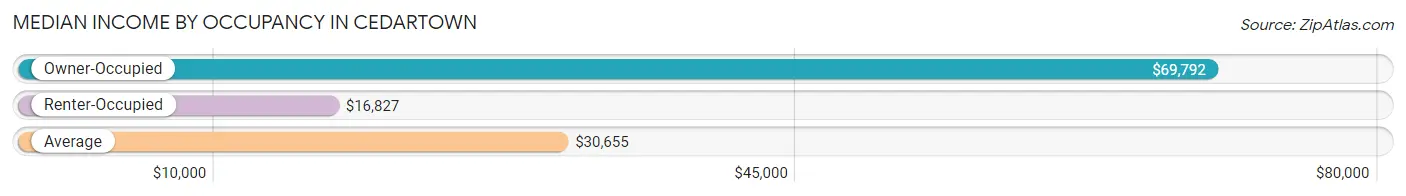
| Occupancy Type | # Households | Median Income |
| Owner-Occupied | 1,789 (47.2%) | $69,792 |
| Renter-Occupied | 2,004 (52.8%) | $16,827 |
| Average | 3,793 (100.0%) | $30,655 |
Occupancy by Householder Income Bracket in Cedartown
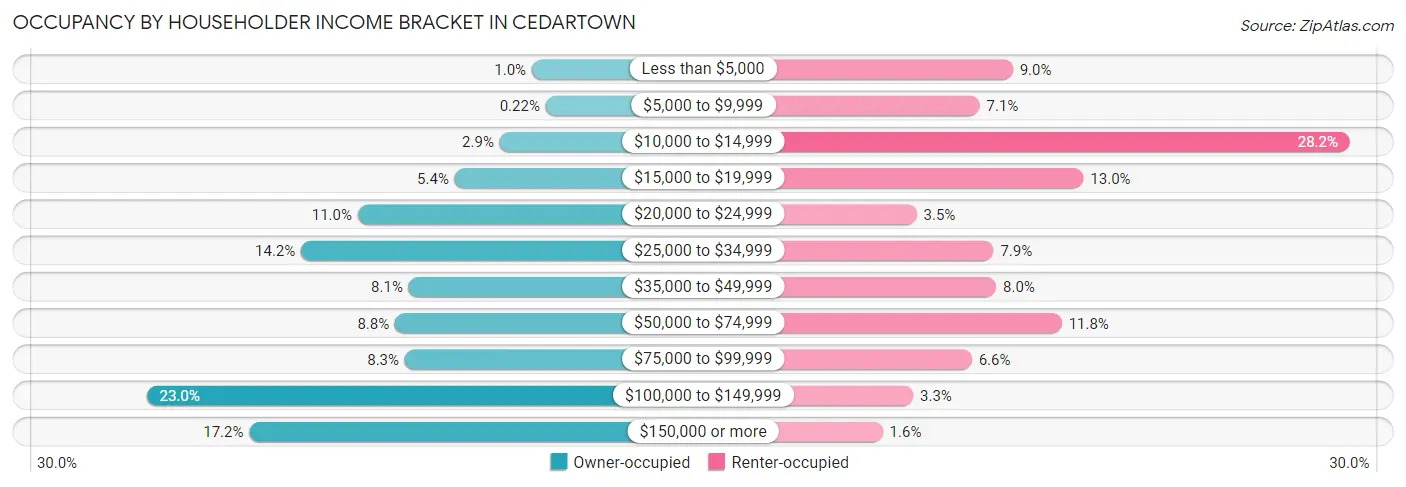
| Income Bracket | Owner-occupied | Renter-occupied |
| Less than $5,000 | 18 (1.0%) | 180 (9.0%) |
| $5,000 to $9,999 | 4 (0.2%) | 142 (7.1%) |
| $10,000 to $14,999 | 51 (2.9%) | 566 (28.2%) |
| $15,000 to $19,999 | 97 (5.4%) | 261 (13.0%) |
| $20,000 to $24,999 | 196 (11.0%) | 70 (3.5%) |
| $25,000 to $34,999 | 254 (14.2%) | 158 (7.9%) |
| $35,000 to $49,999 | 144 (8.1%) | 161 (8.0%) |
| $50,000 to $74,999 | 158 (8.8%) | 236 (11.8%) |
| $75,000 to $99,999 | 148 (8.3%) | 133 (6.6%) |
| $100,000 to $149,999 | 412 (23.0%) | 66 (3.3%) |
| $150,000 or more | 307 (17.2%) | 31 (1.5%) |
| Total | 1,789 (100.0%) | 2,004 (100.0%) |
Monthly Housing Cost Tiers in Cedartown
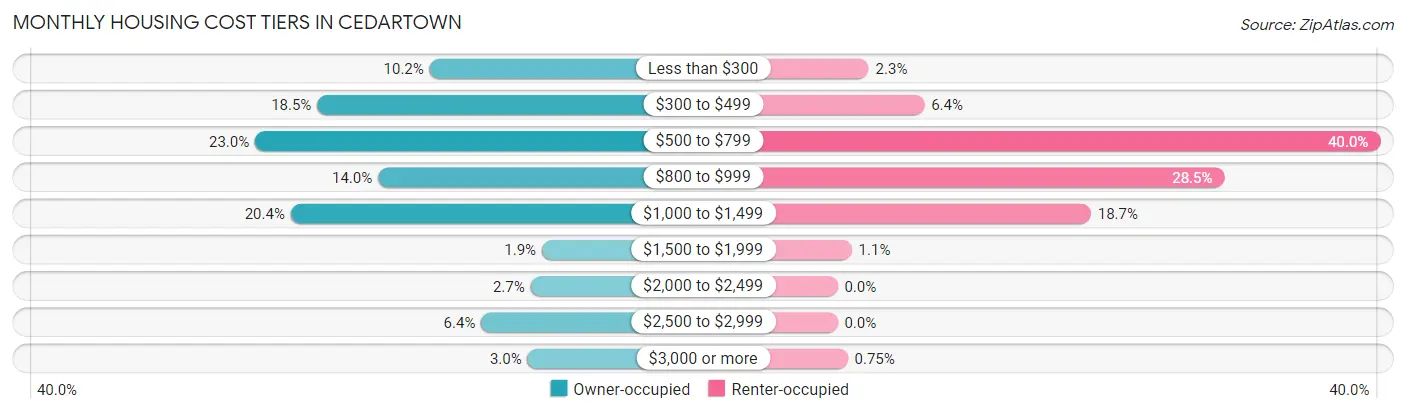
| Monthly Cost | Owner-occupied | Renter-occupied |
| Less than $300 | 182 (10.2%) | 46 (2.3%) |
| $300 to $499 | 330 (18.4%) | 128 (6.4%) |
| $500 to $799 | 412 (23.0%) | 801 (40.0%) |
| $800 to $999 | 250 (14.0%) | 571 (28.5%) |
| $1,000 to $1,499 | 365 (20.4%) | 374 (18.7%) |
| $1,500 to $1,999 | 34 (1.9%) | 21 (1.1%) |
| $2,000 to $2,499 | 49 (2.7%) | 0 (0.0%) |
| $2,500 to $2,999 | 114 (6.4%) | 0 (0.0%) |
| $3,000 or more | 53 (3.0%) | 15 (0.7%) |
| Total | 1,789 (100.0%) | 2,004 (100.0%) |
Physical Housing Characteristics in Cedartown
Housing Structures in Cedartown
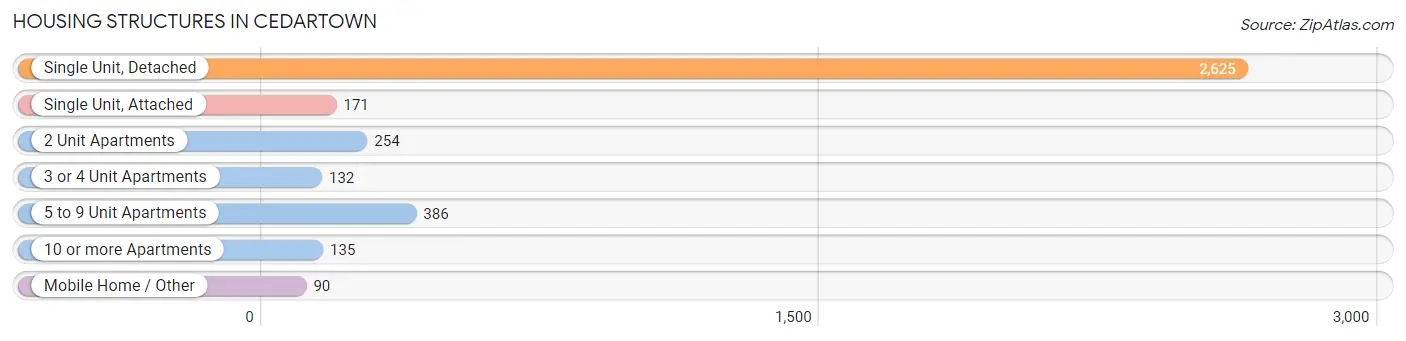
| Structure Type | # Housing Units | % Housing Units |
| Single Unit, Detached | 2,625 | 69.2% |
| Single Unit, Attached | 171 | 4.5% |
| 2 Unit Apartments | 254 | 6.7% |
| 3 or 4 Unit Apartments | 132 | 3.5% |
| 5 to 9 Unit Apartments | 386 | 10.2% |
| 10 or more Apartments | 135 | 3.6% |
| Mobile Home / Other | 90 | 2.4% |
| Total | 3,793 | 100.0% |
Housing Structures by Occupancy in Cedartown
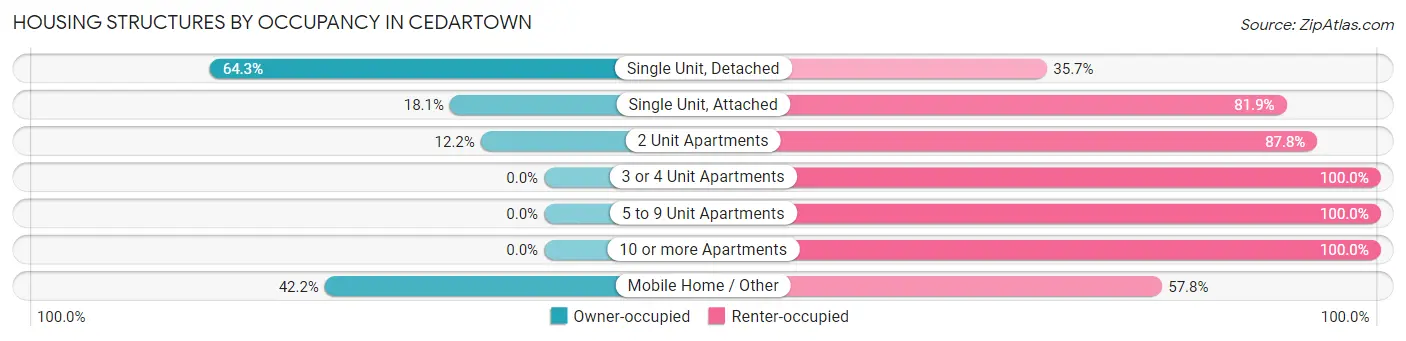
| Structure Type | Owner-occupied | Renter-occupied |
| Single Unit, Detached | 1,689 (64.3%) | 936 (35.7%) |
| Single Unit, Attached | 31 (18.1%) | 140 (81.9%) |
| 2 Unit Apartments | 31 (12.2%) | 223 (87.8%) |
| 3 or 4 Unit Apartments | 0 (0.0%) | 132 (100.0%) |
| 5 to 9 Unit Apartments | 0 (0.0%) | 386 (100.0%) |
| 10 or more Apartments | 0 (0.0%) | 135 (100.0%) |
| Mobile Home / Other | 38 (42.2%) | 52 (57.8%) |
| Total | 1,789 (47.2%) | 2,004 (52.8%) |
Housing Structures by Number of Rooms in Cedartown
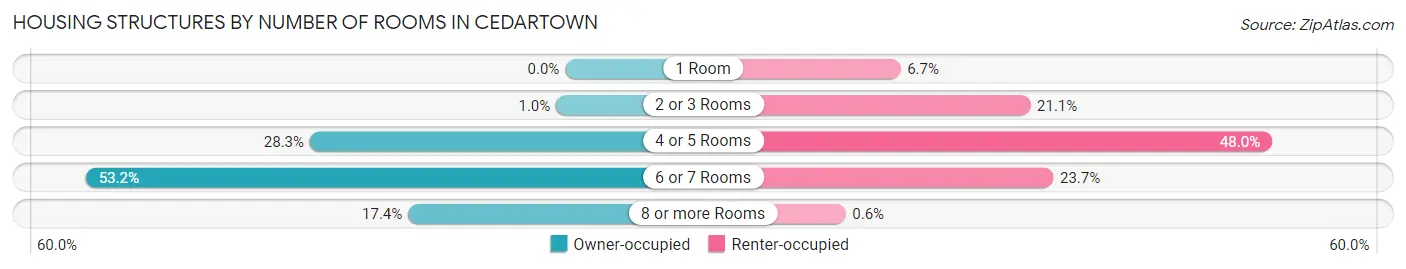
| Number of Rooms | Owner-occupied | Renter-occupied |
| 1 Room | 0 (0.0%) | 134 (6.7%) |
| 2 or 3 Rooms | 18 (1.0%) | 423 (21.1%) |
| 4 or 5 Rooms | 507 (28.3%) | 961 (47.9%) |
| 6 or 7 Rooms | 952 (53.2%) | 474 (23.6%) |
| 8 or more Rooms | 312 (17.4%) | 12 (0.6%) |
| Total | 1,789 (100.0%) | 2,004 (100.0%) |
Housing Structure by Heating Type in Cedartown
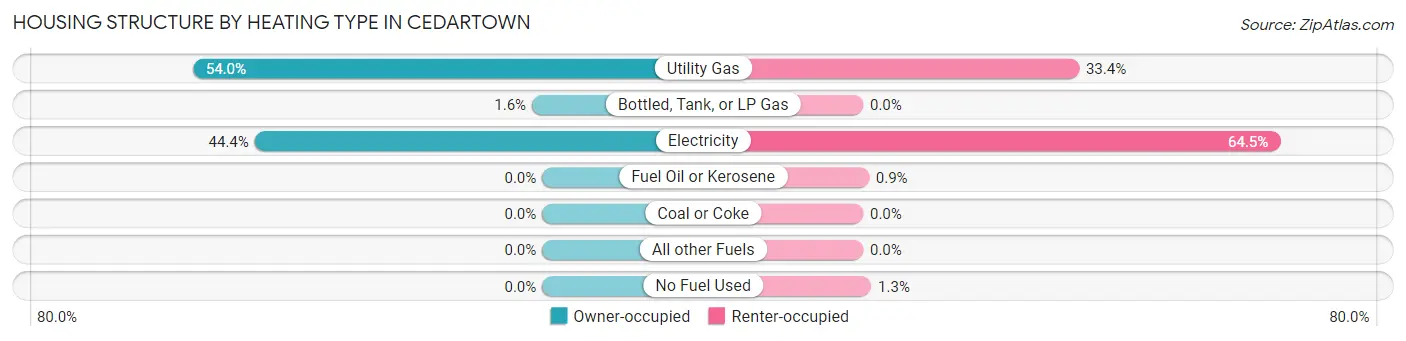
| Heating Type | Owner-occupied | Renter-occupied |
| Utility Gas | 966 (54.0%) | 669 (33.4%) |
| Bottled, Tank, or LP Gas | 28 (1.6%) | 0 (0.0%) |
| Electricity | 795 (44.4%) | 1,292 (64.5%) |
| Fuel Oil or Kerosene | 0 (0.0%) | 18 (0.9%) |
| Coal or Coke | 0 (0.0%) | 0 (0.0%) |
| All other Fuels | 0 (0.0%) | 0 (0.0%) |
| No Fuel Used | 0 (0.0%) | 25 (1.3%) |
| Total | 1,789 (100.0%) | 2,004 (100.0%) |
Household Vehicle Usage in Cedartown
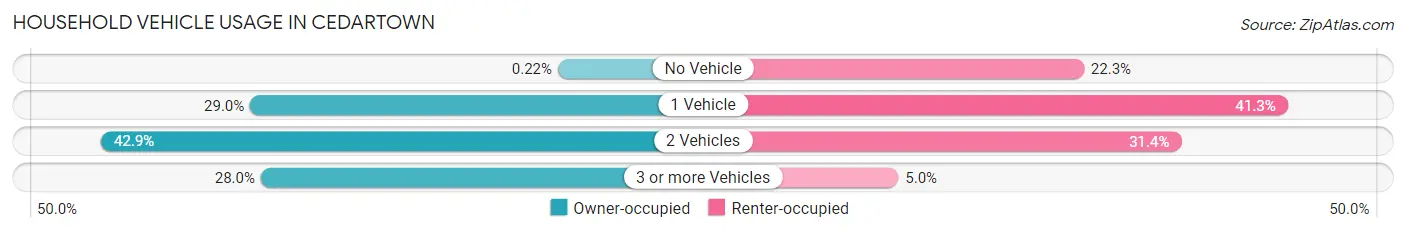
| Vehicles per Household | Owner-occupied | Renter-occupied |
| No Vehicle | 4 (0.2%) | 447 (22.3%) |
| 1 Vehicle | 518 (28.9%) | 828 (41.3%) |
| 2 Vehicles | 767 (42.9%) | 629 (31.4%) |
| 3 or more Vehicles | 500 (28.0%) | 100 (5.0%) |
| Total | 1,789 (100.0%) | 2,004 (100.0%) |
Real Estate & Mortgages in Cedartown
Real Estate and Mortgage Overview in Cedartown
| Characteristic | Without Mortgage | With Mortgage |
| Housing Units | 898 | 891 |
| Median Property Value | $102,200 | $148,500 |
| Median Household Income | $40,167 | $189 |
| Monthly Housing Costs | $477 | $53 |
| Real Estate Taxes | $1,130 | $0 |
Property Value by Mortgage Status in Cedartown
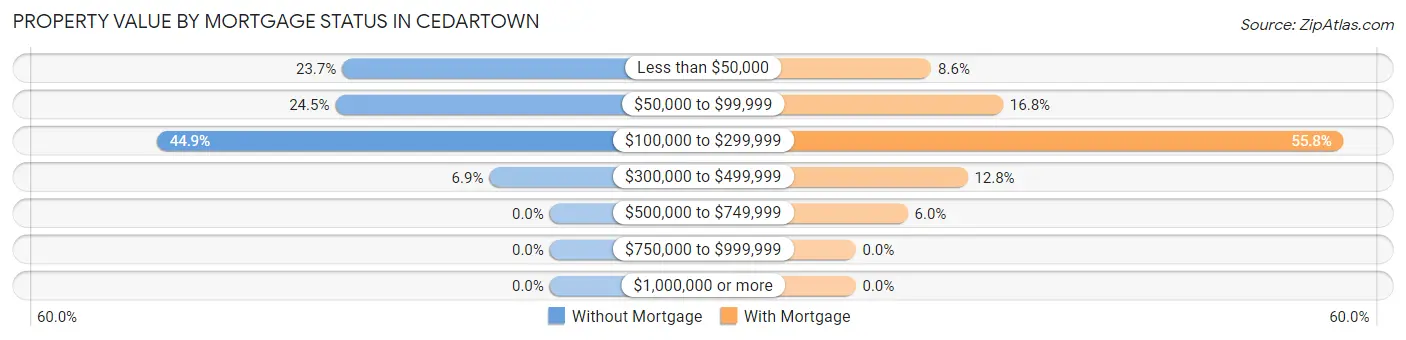
| Property Value | Without Mortgage | With Mortgage |
| Less than $50,000 | 213 (23.7%) | 77 (8.6%) |
| $50,000 to $99,999 | 220 (24.5%) | 150 (16.8%) |
| $100,000 to $299,999 | 403 (44.9%) | 497 (55.8%) |
| $300,000 to $499,999 | 62 (6.9%) | 114 (12.8%) |
| $500,000 to $749,999 | 0 (0.0%) | 53 (5.9%) |
| $750,000 to $999,999 | 0 (0.0%) | 0 (0.0%) |
| $1,000,000 or more | 0 (0.0%) | 0 (0.0%) |
| Total | 898 (100.0%) | 891 (100.0%) |
Household Income by Mortgage Status in Cedartown
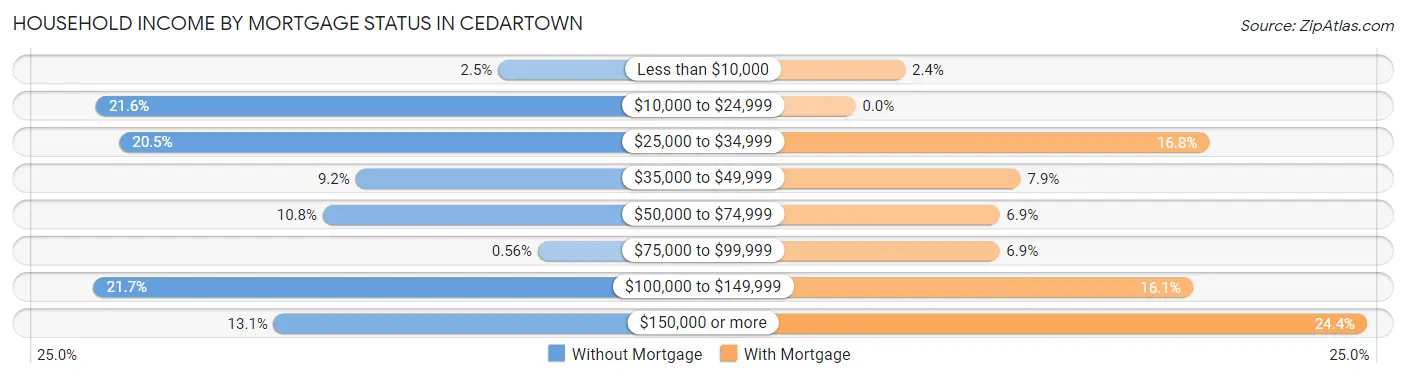
| Household Income | Without Mortgage | With Mortgage |
| Less than $10,000 | 22 (2.5%) | 21 (2.4%) |
| $10,000 to $24,999 | 194 (21.6%) | 0 (0.0%) |
| $25,000 to $34,999 | 184 (20.5%) | 150 (16.8%) |
| $35,000 to $49,999 | 83 (9.2%) | 70 (7.9%) |
| $50,000 to $74,999 | 97 (10.8%) | 61 (6.9%) |
| $75,000 to $99,999 | 5 (0.6%) | 61 (6.9%) |
| $100,000 to $149,999 | 195 (21.7%) | 143 (16.1%) |
| $150,000 or more | 118 (13.1%) | 217 (24.3%) |
| Total | 898 (100.0%) | 891 (100.0%) |
Property Value to Household Income Ratio in Cedartown
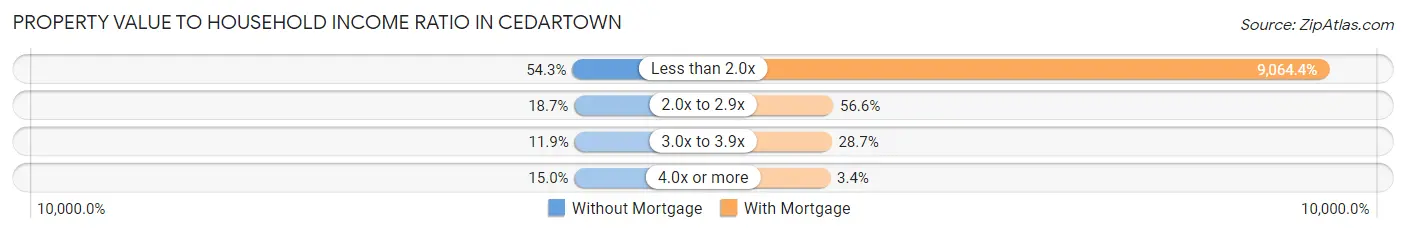
| Value-to-Income Ratio | Without Mortgage | With Mortgage |
| Less than 2.0x | 488 (54.3%) | 80,764 (9,064.4%) |
| 2.0x to 2.9x | 168 (18.7%) | 504 (56.6%) |
| 3.0x to 3.9x | 107 (11.9%) | 256 (28.7%) |
| 4.0x or more | 135 (15.0%) | 30 (3.4%) |
| Total | 898 (100.0%) | 891 (100.0%) |
Real Estate Taxes by Mortgage Status in Cedartown
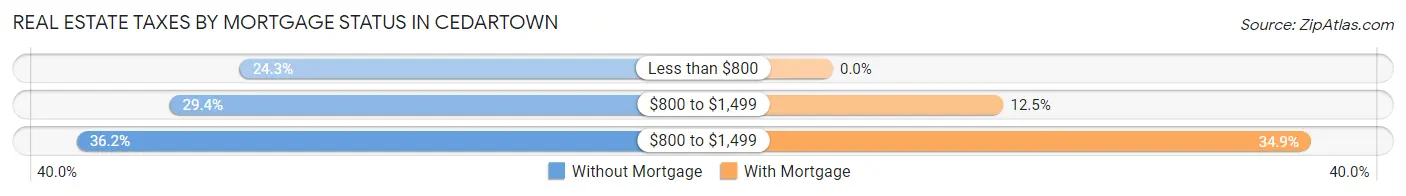
| Property Taxes | Without Mortgage | With Mortgage |
| Less than $800 | 218 (24.3%) | 0 (0.0%) |
| $800 to $1,499 | 264 (29.4%) | 111 (12.5%) |
| $800 to $1,499 | 325 (36.2%) | 311 (34.9%) |
| Total | 898 (100.0%) | 891 (100.0%) |
Health & Disability in Cedartown
Health Insurance Coverage by Age in Cedartown
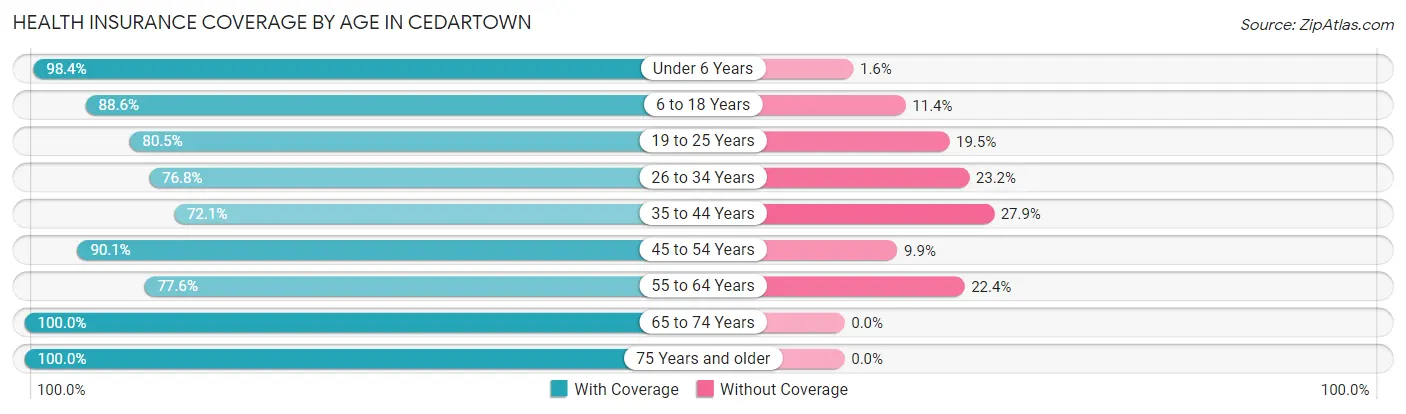
| Age Bracket | With Coverage | Without Coverage |
| Under 6 Years | 906 (98.4%) | 15 (1.6%) |
| 6 to 18 Years | 1,851 (88.6%) | 238 (11.4%) |
| 19 to 25 Years | 1,046 (80.5%) | 254 (19.5%) |
| 26 to 34 Years | 985 (76.8%) | 298 (23.2%) |
| 35 to 44 Years | 1,054 (72.1%) | 407 (27.9%) |
| 45 to 54 Years | 658 (90.1%) | 72 (9.9%) |
| 55 to 64 Years | 698 (77.6%) | 201 (22.4%) |
| 65 to 74 Years | 634 (100.0%) | 0 (0.0%) |
| 75 Years and older | 559 (100.0%) | 0 (0.0%) |
| Total | 8,391 (85.0%) | 1,485 (15.0%) |
Health Insurance Coverage by Citizenship Status in Cedartown
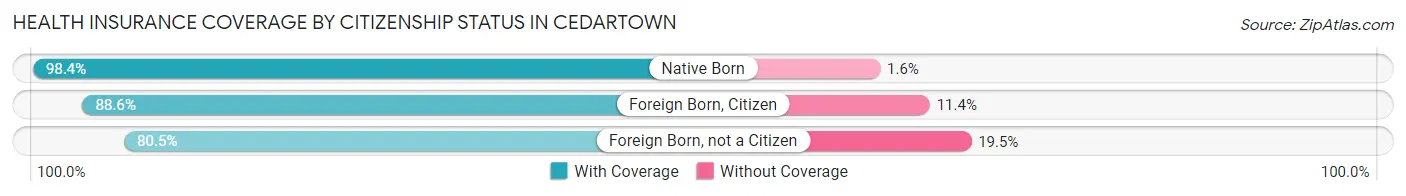
| Citizenship Status | With Coverage | Without Coverage |
| Native Born | 906 (98.4%) | 15 (1.6%) |
| Foreign Born, Citizen | 1,851 (88.6%) | 238 (11.4%) |
| Foreign Born, not a Citizen | 1,046 (80.5%) | 254 (19.5%) |
Health Insurance Coverage by Household Income in Cedartown
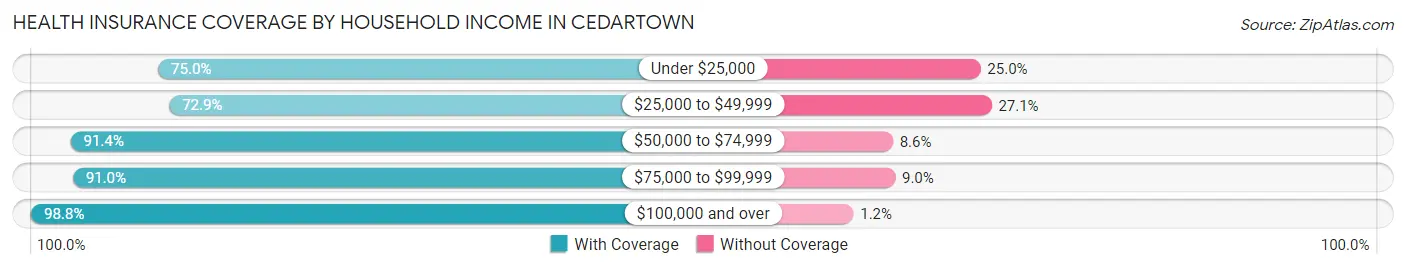
| Household Income | With Coverage | Without Coverage |
| Under $25,000 | 2,175 (75.0%) | 726 (25.0%) |
| $25,000 to $49,999 | 1,313 (72.9%) | 488 (27.1%) |
| $50,000 to $74,999 | 1,189 (91.4%) | 112 (8.6%) |
| $75,000 to $99,999 | 1,157 (91.0%) | 115 (9.0%) |
| $100,000 and over | 2,520 (98.8%) | 31 (1.2%) |
Public vs Private Health Insurance Coverage by Age in Cedartown
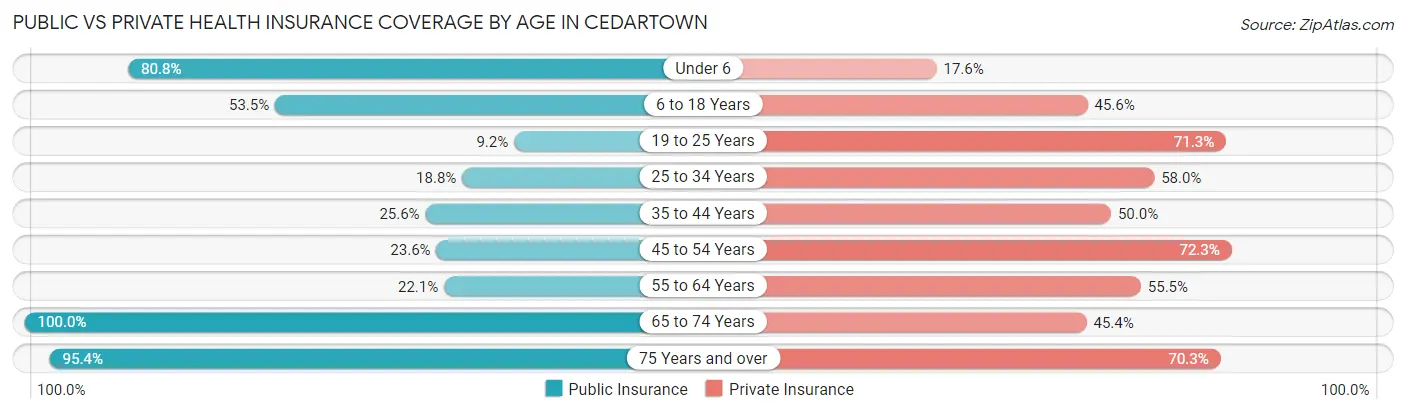
| Age Bracket | Public Insurance | Private Insurance |
| Under 6 | 744 (80.8%) | 162 (17.6%) |
| 6 to 18 Years | 1,118 (53.5%) | 953 (45.6%) |
| 19 to 25 Years | 119 (9.1%) | 927 (71.3%) |
| 25 to 34 Years | 241 (18.8%) | 744 (58.0%) |
| 35 to 44 Years | 374 (25.6%) | 730 (50.0%) |
| 45 to 54 Years | 172 (23.6%) | 528 (72.3%) |
| 55 to 64 Years | 199 (22.1%) | 499 (55.5%) |
| 65 to 74 Years | 634 (100.0%) | 288 (45.4%) |
| 75 Years and over | 533 (95.4%) | 393 (70.3%) |
| Total | 4,134 (41.9%) | 5,224 (52.9%) |
Disability Status by Sex by Age in Cedartown
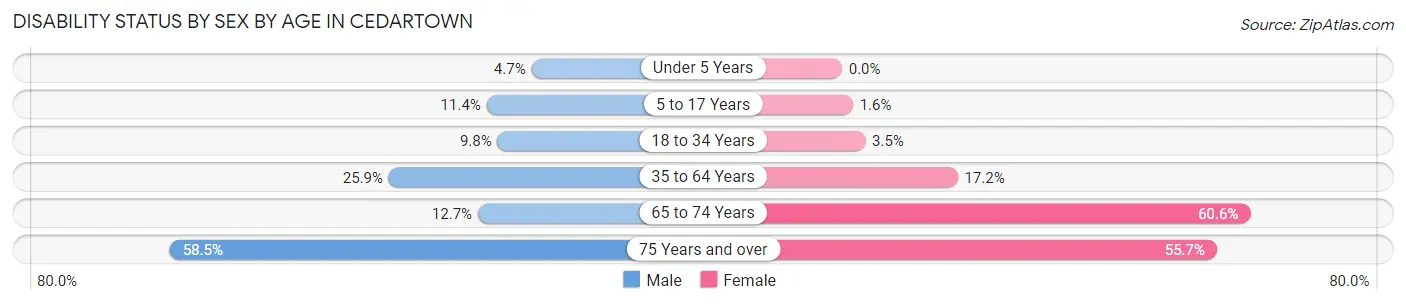
| Age Bracket | Male | Female |
| Under 5 Years | 20 (4.7%) | 0 (0.0%) |
| 5 to 17 Years | 112 (11.4%) | 17 (1.6%) |
| 18 to 34 Years | 146 (9.8%) | 45 (3.5%) |
| 35 to 64 Years | 386 (25.9%) | 275 (17.2%) |
| 65 to 74 Years | 25 (12.7%) | 265 (60.6%) |
| 75 Years and over | 121 (58.5%) | 196 (55.7%) |
Disability Class by Sex by Age in Cedartown
Disability Class: Hearing Difficulty
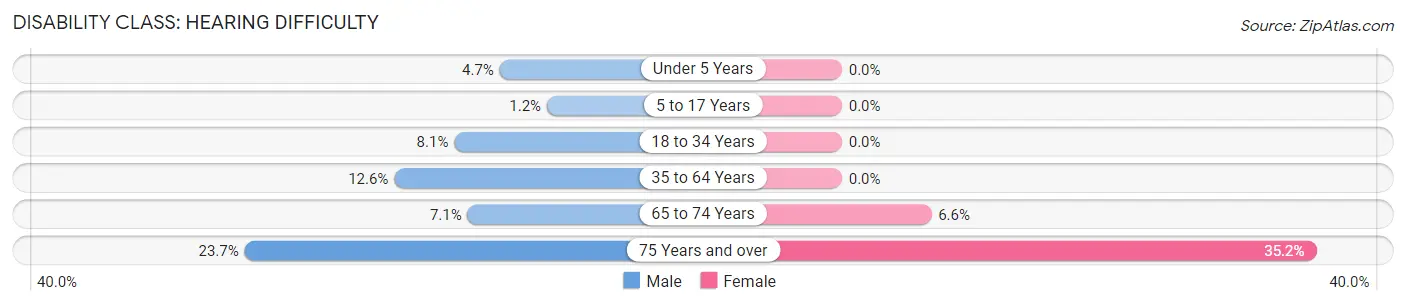
| Age Bracket | Male | Female |
| Under 5 Years | 20 (4.7%) | 0 (0.0%) |
| 5 to 17 Years | 12 (1.2%) | 0 (0.0%) |
| 18 to 34 Years | 121 (8.1%) | 0 (0.0%) |
| 35 to 64 Years | 187 (12.6%) | 0 (0.0%) |
| 65 to 74 Years | 14 (7.1%) | 29 (6.6%) |
| 75 Years and over | 49 (23.7%) | 124 (35.2%) |
Disability Class: Vision Difficulty
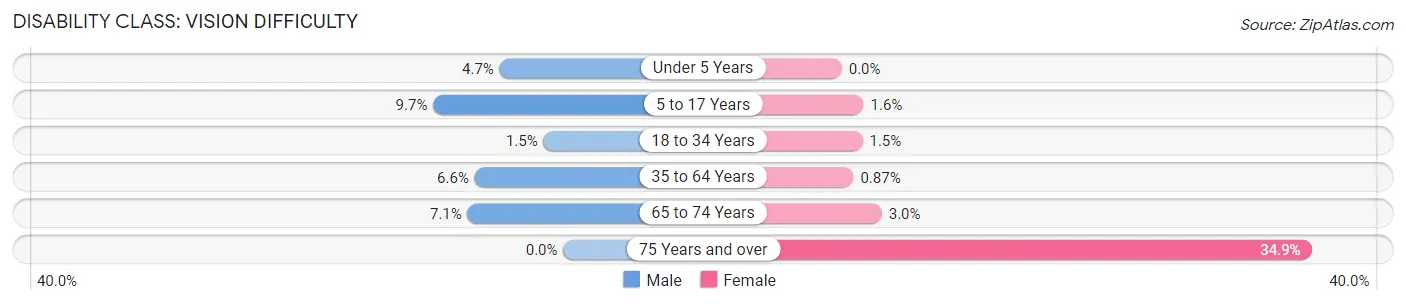
| Age Bracket | Male | Female |
| Under 5 Years | 20 (4.7%) | 0 (0.0%) |
| 5 to 17 Years | 95 (9.7%) | 17 (1.6%) |
| 18 to 34 Years | 22 (1.5%) | 20 (1.5%) |
| 35 to 64 Years | 98 (6.6%) | 14 (0.9%) |
| 65 to 74 Years | 14 (7.1%) | 13 (3.0%) |
| 75 Years and over | 0 (0.0%) | 123 (34.9%) |
Disability Class: Cognitive Difficulty
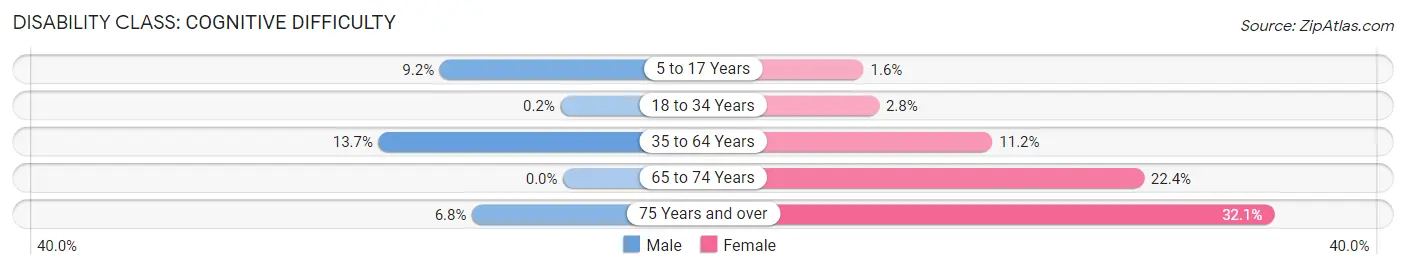
| Age Bracket | Male | Female |
| 5 to 17 Years | 90 (9.2%) | 17 (1.6%) |
| 18 to 34 Years | 3 (0.2%) | 36 (2.8%) |
| 35 to 64 Years | 204 (13.7%) | 179 (11.2%) |
| 65 to 74 Years | 0 (0.0%) | 98 (22.4%) |
| 75 Years and over | 14 (6.8%) | 113 (32.1%) |
Disability Class: Ambulatory Difficulty
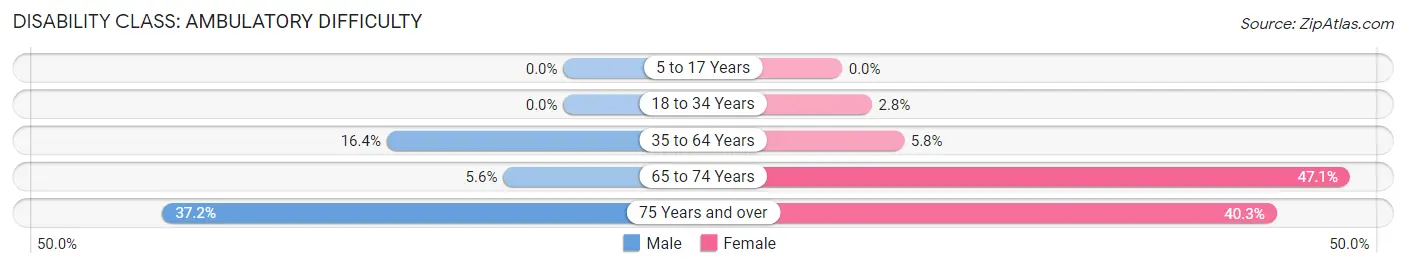
| Age Bracket | Male | Female |
| 5 to 17 Years | 0 (0.0%) | 0 (0.0%) |
| 18 to 34 Years | 0 (0.0%) | 36 (2.8%) |
| 35 to 64 Years | 244 (16.4%) | 92 (5.8%) |
| 65 to 74 Years | 11 (5.6%) | 206 (47.1%) |
| 75 Years and over | 77 (37.2%) | 142 (40.3%) |
Disability Class: Self-Care Difficulty
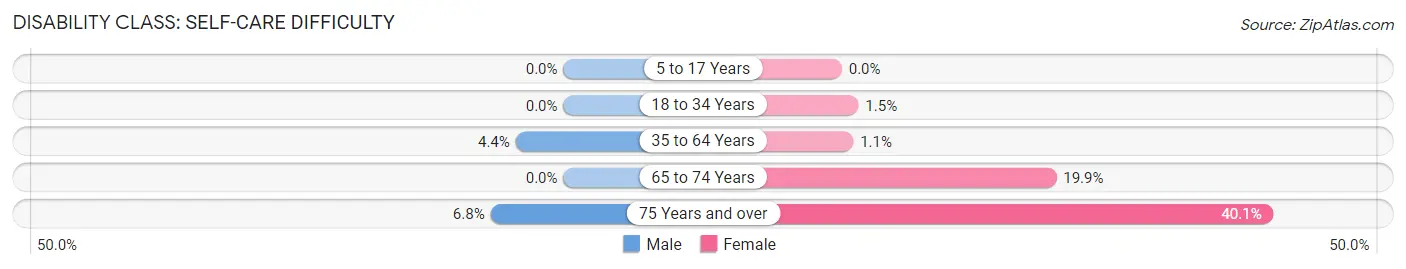
| Age Bracket | Male | Female |
| 5 to 17 Years | 0 (0.0%) | 0 (0.0%) |
| 18 to 34 Years | 0 (0.0%) | 20 (1.5%) |
| 35 to 64 Years | 66 (4.4%) | 17 (1.1%) |
| 65 to 74 Years | 0 (0.0%) | 87 (19.9%) |
| 75 Years and over | 14 (6.8%) | 141 (40.1%) |
Technology Access in Cedartown
Computing Device Access in Cedartown
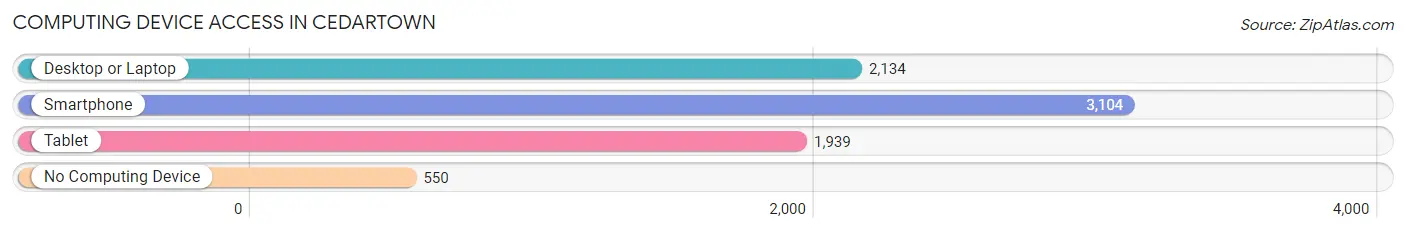
| Device Type | # Households | % Households |
| Desktop or Laptop | 2,134 | 56.3% |
| Smartphone | 3,104 | 81.8% |
| Tablet | 1,939 | 51.1% |
| No Computing Device | 550 | 14.5% |
| Total | 3,793 | 100.0% |
Internet Access in Cedartown
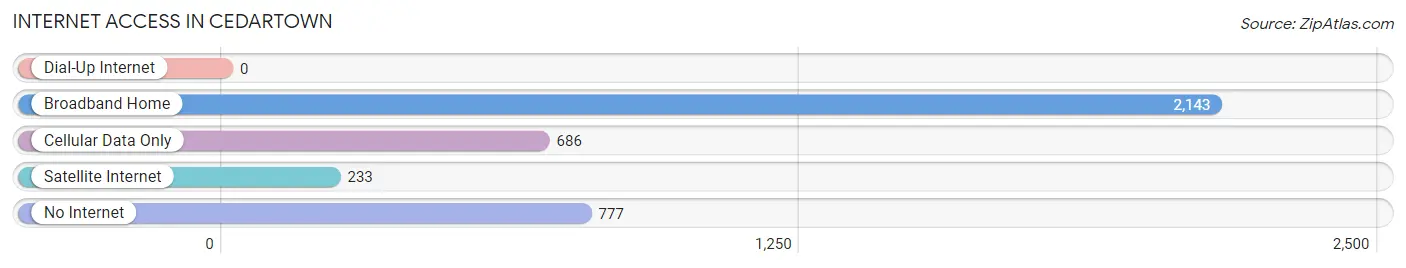
| Internet Type | # Households | % Households |
| Dial-Up Internet | 0 | 0.0% |
| Broadband Home | 2,143 | 56.5% |
| Cellular Data Only | 686 | 18.1% |
| Satellite Internet | 233 | 6.1% |
| No Internet | 777 | 20.5% |
| Total | 3,793 | 100.0% |
Cedartown Summary
Cedartown is a city located in Polk County, Georgia, United States. It is the county seat of Polk County. As of the 2010 census, the city had a population of 9,750. The city is the principal city of the Cedartown, Georgia Micropolitan Statistical Area, which is included in the Atlanta-Sandy Springs-Gainesville, Georgia-Alabama Combined Statistical Area.
Geography
Cedartown is located at 34°1′17″N 85°14′17″W (34.021445, -85.237945). According to the United States Census Bureau, the city has a total area of 8.2 square miles (21.2 km2), of which 8.2 square miles (21.2 km2) is land and 0.04 square miles (0.1 km2) (0.24%) is water.
History
Cedartown was founded in 1836 as the county seat of Polk County. The city was named for the abundance of cedar trees in the area. The city was incorporated in 1851.
During the Civil War, Cedartown was the site of a major battle between Union and Confederate forces in 1864. The Battle of Cedartown resulted in a Confederate victory.
In the late 19th century, Cedartown was a major center for the production of iron and steel. The city was home to several iron and steel mills, including the Cedartown Iron and Steel Company, which was founded in 1887.
Economy
Cedartown's economy is largely based on manufacturing and agriculture. The city is home to several manufacturing companies, including Georgia-Pacific, which produces paper products, and Mohawk Industries, which produces carpets and rugs.
Agriculture is also an important part of the local economy. The city is home to several farms, including the Cedartown Dairy Farm, which produces milk and other dairy products.
Demographics
As of the 2010 census, there were 9,750 people, 3,845 households, and 2,541 families residing in the city. The population density was 1,190.3 people per square mile (459.3/km2). There were 4,093 housing units at an average density of 498.3 per square mile (192.3/km2). The racial makeup of the city was 68.2% White, 28.2% African American, 0.3% Native American, 0.7% Asian, 0.1% Pacific Islander, 0.7% from other races, and 1.9% from two or more races. Hispanic or Latino of any race were 2.7% of the population.
There were 3,845 households, out of which 30.2% had children under the age of 18 living with them, 41.2% were married couples living together, 19.2% had a female householder with no husband present, and 35.2% were non-families. 30.2% of all households were made up of individuals, and 13.2% had someone living alone who was 65 years of age or older. The average household size was 2.45 and the average family size was 3.03.
In the city, the population was spread out, with 25.2% under the age of 18, 8.7% from 18 to 24, 27.2% from 25 to 44, 22.7% from 45 to 64, and 16.2% who were 65 years of age or older. The median age was 37 years. For every 100 females, there were 87.2 males. For every 100 females age 18 and over, there were 82.3 males.
The median income for a household in the city was $30,917, and the median income for a family was $37,917. Males had a median income of $30,917 versus $21,917 for females. The per capita income for the city was $16,917. About 14.2% of families and 17.2% of the population were below the poverty line, including 25.2% of those under age 18 and 14.2% of those age 65 or over.
Common Questions
What is Per Capita Income in Cedartown?
Per Capita income in Cedartown is $26,262.
What is the Median Family Income in Cedartown?
Median Family Income in Cedartown is $53,594.
What is the Median Household income in Cedartown?
Median Household Income in Cedartown is $30,655.
What is Income or Wage Gap in Cedartown?
Income or Wage Gap in Cedartown is 24.5%.
Women in Cedartown earn 75.5 cents for every dollar earned by a man.
What is Family Income Deficit in Cedartown?
Family Income Deficit in Cedartown is $12,368.
Families that are below poverty line in Cedartown earn $12,368 less on average than the poverty threshold level.
What is Inequality or Gini Index in Cedartown?
Inequality or Gini Index in Cedartown is 0.57.
What is the Total Population of Cedartown?
Total Population of Cedartown is 10,166.
What is the Total Male Population of Cedartown?
Total Male Population of Cedartown is 4,966.
What is the Total Female Population of Cedartown?
Total Female Population of Cedartown is 5,200.
What is the Ratio of Males per 100 Females in Cedartown?
There are 95.50 Males per 100 Females in Cedartown.
What is the Ratio of Females per 100 Males in Cedartown?
There are 104.71 Females per 100 Males in Cedartown.
What is the Median Population Age in Cedartown?
Median Population Age in Cedartown is 31.1 Years.
What is the Average Family Size in Cedartown
Average Family Size in Cedartown is 3.4 People.
What is the Average Household Size in Cedartown
Average Household Size in Cedartown is 2.6 People.
How Large is the Labor Force in Cedartown?
There are 4,382 People in the Labor Forcein in Cedartown.
What is the Percentage of People in the Labor Force in Cedartown?
56.3% of People are in the Labor Force in Cedartown.
What is the Unemployment Rate in Cedartown?
Unemployment Rate in Cedartown is 7.4%.