Forest Park, GA Map & Demographics
Forest Park Map
Forest Park Overview
$20,145
PER CAPITA INCOME
$44,389
AVG FAMILY INCOME
$41,837
AVG HOUSEHOLD INCOME
6.5%
WAGE / INCOME GAP [ % ]
93.5¢/ $1
WAGE / INCOME GAP [ $ ]
0.39
INEQUALITY / GINI INDEX
19,619
TOTAL POPULATION
9,912
MALE POPULATION
9,707
FEMALE POPULATION
102.11
MALES / 100 FEMALES
97.93
FEMALES / 100 MALES
31.3
MEDIAN AGE
3.6
AVG FAMILY SIZE
2.7
AVG HOUSEHOLD SIZE
8,648
LABOR FORCE [ PEOPLE ]
59.7%
PERCENT IN LABOR FORCE
8.9%
UNEMPLOYMENT RATE
Forest Park Zip Codes
Forest Park Area Codes
Income in Forest Park
Income Overview in Forest Park
Per Capita Income in Forest Park is $20,145, while median incomes of families and households are $44,389 and $41,837 respectively.
| Characteristic | Number | Measure |
| Per Capita Income | 19,619 | $20,145 |
| Median Family Income | 3,992 | $44,389 |
| Mean Family Income | 3,992 | $59,703 |
| Median Household Income | 7,021 | $41,837 |
| Mean Household Income | 7,021 | $54,337 |
| Income Deficit | 3,992 | $0 |
| Wage / Income Gap (%) | 19,619 | 6.46% |
| Wage / Income Gap ($) | 19,619 | 93.54¢ per $1 |
| Gini / Inequality Index | 19,619 | 0.39 |
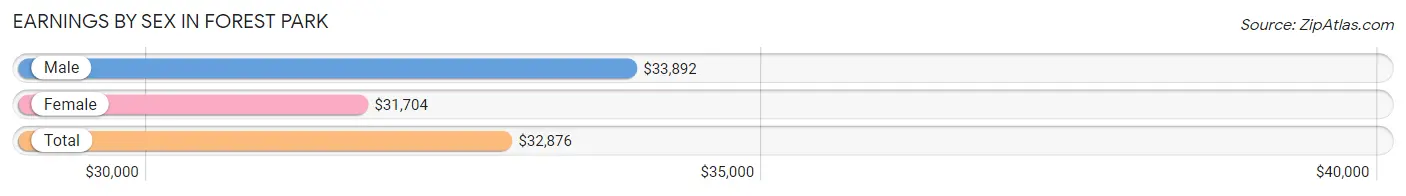
Earnings by Sex in Forest Park
Average Earnings in Forest Park are $32,876, $33,892 for men and $31,704 for women, a difference of 6.5%.
| Sex | Number | Average Earnings |
| Male | 4,486 (52.5%) | $33,892 |
| Female | 4,053 (47.5%) | $31,704 |
| Total | 8,539 (100.0%) | $32,876 |
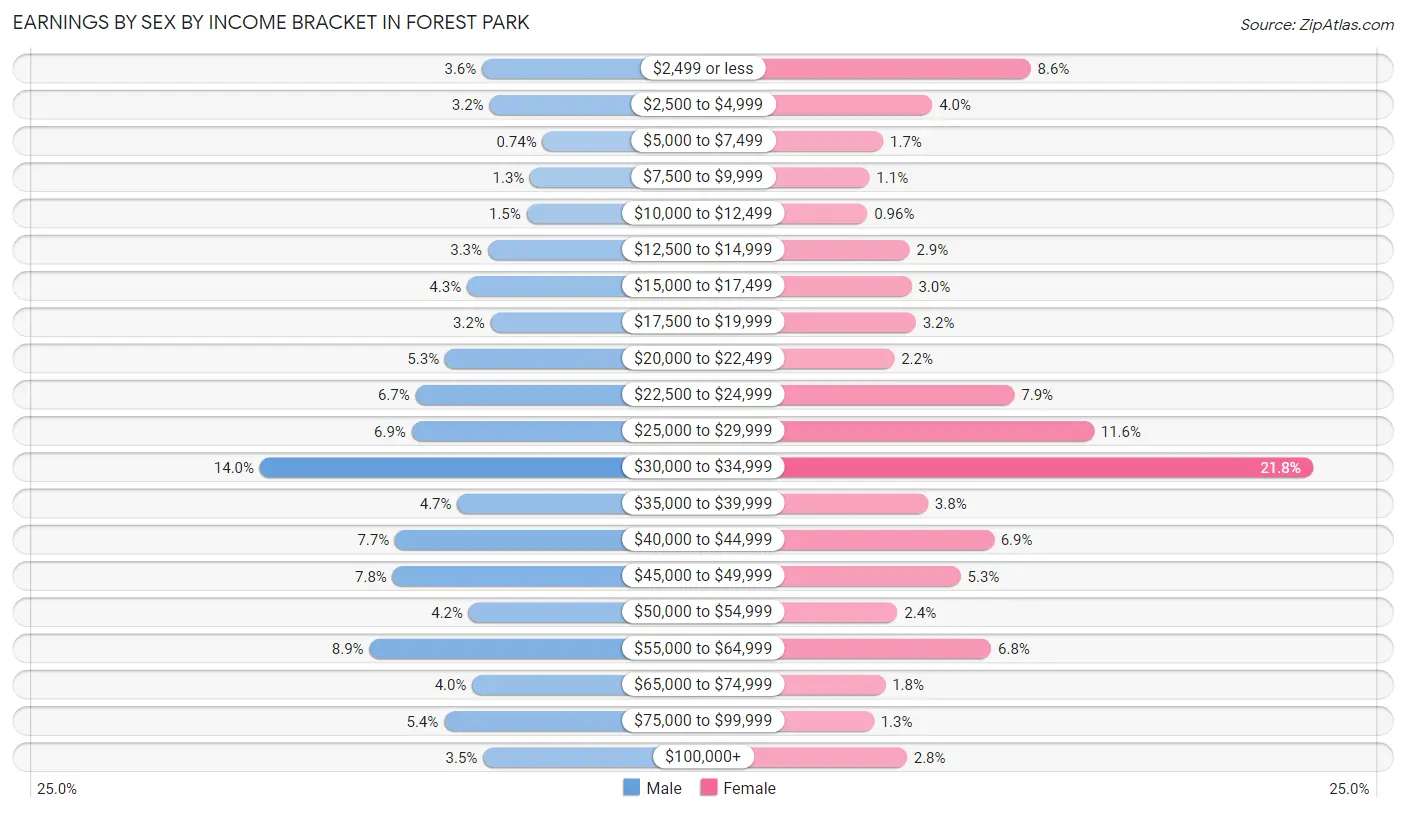
Earnings by Sex by Income Bracket in Forest Park
The most common earnings brackets in Forest Park are $30,000 to $34,999 for men (627 | 14.0%) and $30,000 to $34,999 for women (884 | 21.8%).
| Income | Male | Female |
| $2,499 or less | 160 (3.6%) | 349 (8.6%) |
| $2,500 to $4,999 | 145 (3.2%) | 162 (4.0%) |
| $5,000 to $7,499 | 33 (0.7%) | 69 (1.7%) |
| $7,500 to $9,999 | 59 (1.3%) | 43 (1.1%) |
| $10,000 to $12,499 | 67 (1.5%) | 39 (1.0%) |
| $12,500 to $14,999 | 148 (3.3%) | 119 (2.9%) |
| $15,000 to $17,499 | 192 (4.3%) | 123 (3.0%) |
| $17,500 to $19,999 | 142 (3.2%) | 131 (3.2%) |
| $20,000 to $22,499 | 238 (5.3%) | 90 (2.2%) |
| $22,500 to $24,999 | 300 (6.7%) | 318 (7.9%) |
| $25,000 to $29,999 | 308 (6.9%) | 469 (11.6%) |
| $30,000 to $34,999 | 627 (14.0%) | 884 (21.8%) |
| $35,000 to $39,999 | 212 (4.7%) | 154 (3.8%) |
| $40,000 to $44,999 | 343 (7.6%) | 279 (6.9%) |
| $45,000 to $49,999 | 348 (7.8%) | 216 (5.3%) |
| $50,000 to $54,999 | 188 (4.2%) | 96 (2.4%) |
| $55,000 to $64,999 | 397 (8.8%) | 274 (6.8%) |
| $65,000 to $74,999 | 181 (4.0%) | 73 (1.8%) |
| $75,000 to $99,999 | 240 (5.3%) | 51 (1.3%) |
| $100,000+ | 158 (3.5%) | 114 (2.8%) |
| Total | 4,486 (100.0%) | 4,053 (100.0%) |
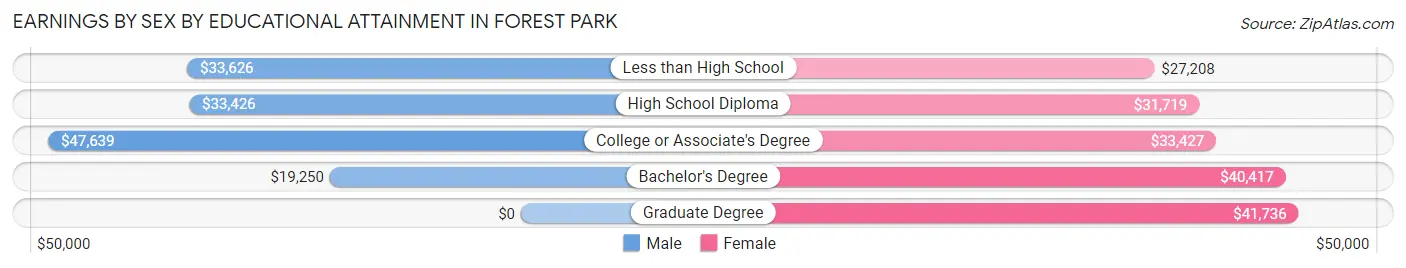
Earnings by Sex by Educational Attainment in Forest Park
Average earnings in Forest Park are $34,076 for men and $32,931 for women, a difference of 3.4%. Men with an educational attainment of college or associate's degree enjoy the highest average annual earnings of $47,639, while those with bachelor's degree education earn the least with $19,250. Women with an educational attainment of graduate degree earn the most with the average annual earnings of $41,736, while those with less than high school education have the smallest earnings of $27,208.
| Educational Attainment | Male Income | Female Income |
| Less than High School | $33,626 | $27,208 |
| High School Diploma | $33,426 | $31,719 |
| College or Associate's Degree | $47,639 | $33,427 |
| Bachelor's Degree | $19,250 | $40,417 |
| Graduate Degree | - | - |
| Total | $34,076 | $32,931 |
Family Income in Forest Park
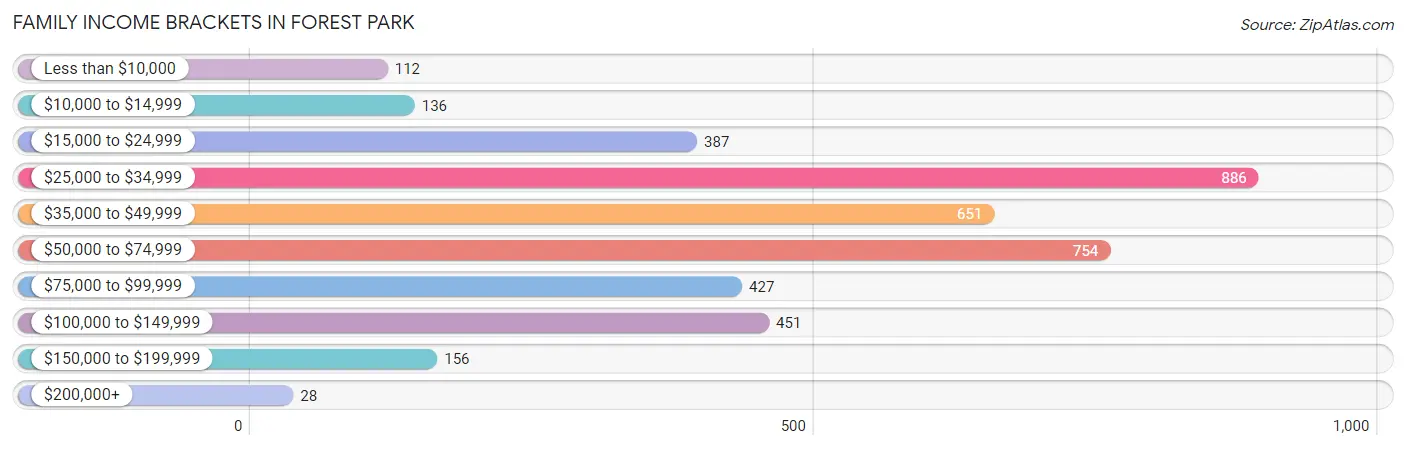
Family Income Brackets in Forest Park
According to the Forest Park family income data, there are 886 families falling into the $25,000 to $34,999 income range, which is the most common income bracket and makes up 22.2% of all families. Conversely, the $200,000+ income bracket is the least frequent group with only 28 families (0.7%) belonging to this category.
| Income Bracket | # Families | % Families |
| Less than $10,000 | 112 | 2.8% |
| $10,000 to $14,999 | 136 | 3.4% |
| $15,000 to $24,999 | 387 | 9.7% |
| $25,000 to $34,999 | 886 | 22.2% |
| $35,000 to $49,999 | 651 | 16.3% |
| $50,000 to $74,999 | 754 | 18.9% |
| $75,000 to $99,999 | 427 | 10.7% |
| $100,000 to $149,999 | 451 | 11.3% |
| $150,000 to $199,999 | 156 | 3.9% |
| $200,000+ | 28 | 0.7% |
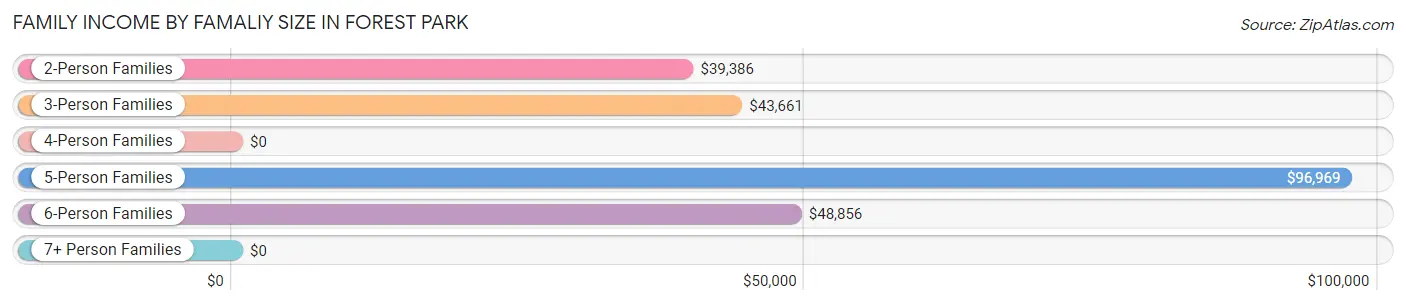
Family Income by Famaliy Size in Forest Park
5-person families (375 | 9.4%) account for the highest median family income in Forest Park with $96,969 per family, while 2-person families (1,344 | 33.7%) have the highest median income of $19,693 per family member.
| Income Bracket | # Families | Median Income |
| 2-Person Families | 1,344 (33.7%) | $39,386 |
| 3-Person Families | 932 (23.4%) | $43,661 |
| 4-Person Families | 1,008 (25.3%) | $0 |
| 5-Person Families | 375 (9.4%) | $96,969 |
| 6-Person Families | 273 (6.8%) | $48,856 |
| 7+ Person Families | 60 (1.5%) | $0 |
| Total | 3,992 (100.0%) | $44,389 |
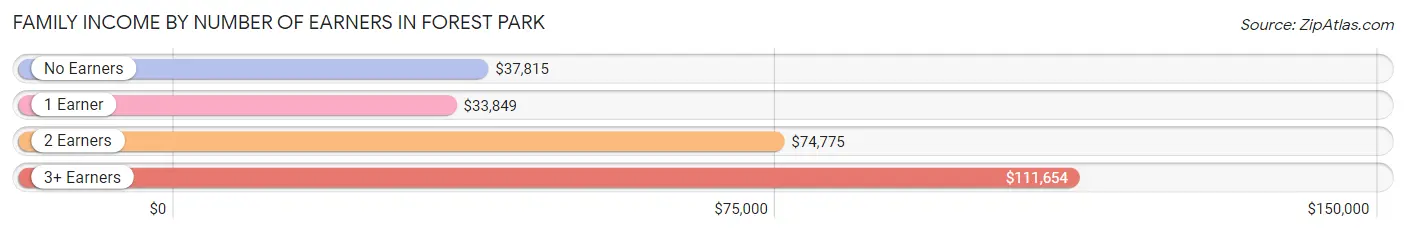
Family Income by Number of Earners in Forest Park
The median family income in Forest Park is $44,389, with families comprising 3+ earners (403) having the highest median family income of $111,654, while families with 1 earner (1,798) have the lowest median family income of $33,849, accounting for 10.1% and 45.0% of families, respectively.
| Number of Earners | # Families | Median Income |
| No Earners | 559 (14.0%) | $37,815 |
| 1 Earner | 1,798 (45.0%) | $33,849 |
| 2 Earners | 1,232 (30.9%) | $74,775 |
| 3+ Earners | 403 (10.1%) | $111,654 |
| Total | 3,992 (100.0%) | $44,389 |
Household Income in Forest Park
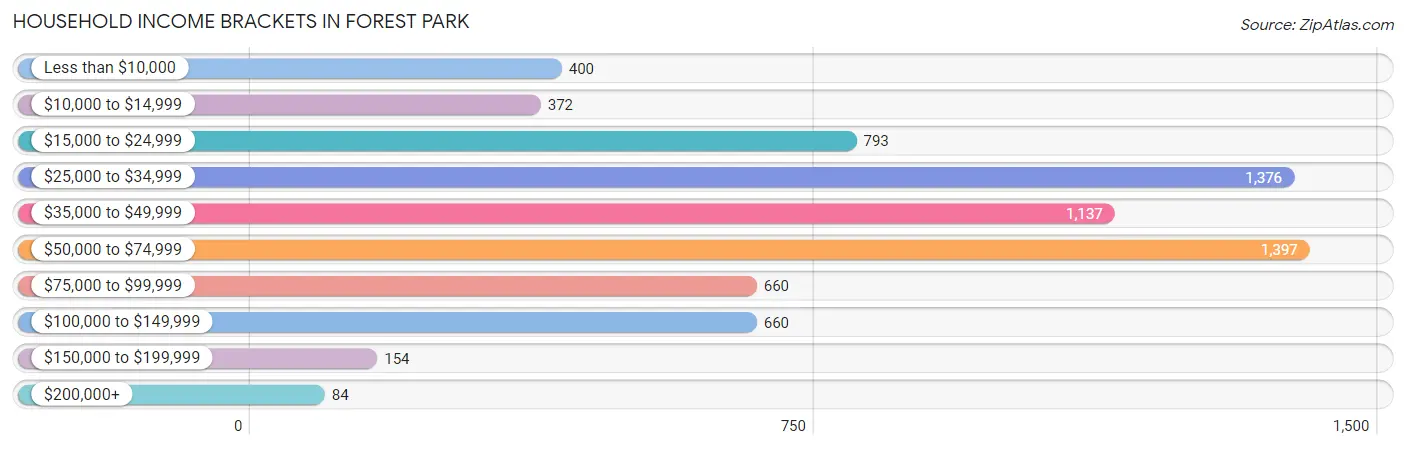
Household Income Brackets in Forest Park
With 1,397 households falling in the category, the $50,000 to $74,999 income range is the most frequent in Forest Park, accounting for 19.9% of all households. In contrast, only 84 households (1.2%) fall into the $200,000+ income bracket, making it the least populous group.
| Income Bracket | # Households | % Households |
| Less than $10,000 | 400 | 5.7% |
| $10,000 to $14,999 | 372 | 5.3% |
| $15,000 to $24,999 | 793 | 11.3% |
| $25,000 to $34,999 | 1,376 | 19.6% |
| $35,000 to $49,999 | 1,137 | 16.2% |
| $50,000 to $74,999 | 1,397 | 19.9% |
| $75,000 to $99,999 | 660 | 9.4% |
| $100,000 to $149,999 | 660 | 9.4% |
| $150,000 to $199,999 | 154 | 2.2% |
| $200,000+ | 84 | 1.2% |
Household Income by Householder Age in Forest Park
The median household income in Forest Park is $41,837, with the highest median household income of $50,594 found in the 45 to 64 years age bracket for the primary householder. A total of 2,285 households (32.6%) fall into this category. Meanwhile, the 65+ years age bracket for the primary householder has the lowest median household income of $32,401, with 1,845 households (26.3%) in this group.
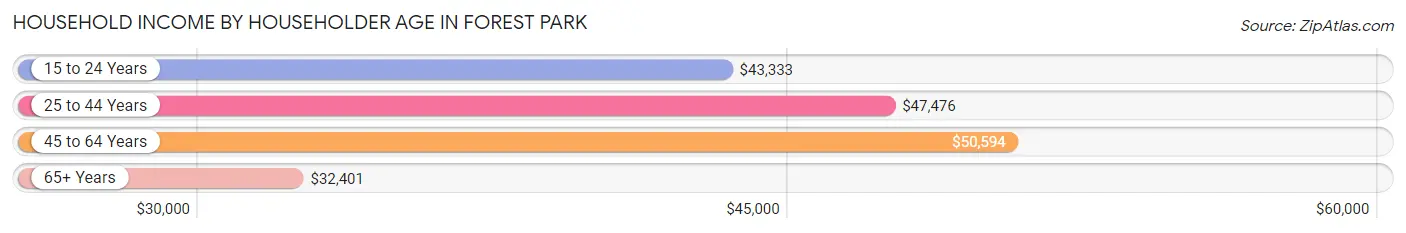
| Income Bracket | # Households | Median Income |
| 15 to 24 Years | 520 (7.4%) | $43,333 |
| 25 to 44 Years | 2,371 (33.8%) | $47,476 |
| 45 to 64 Years | 2,285 (32.6%) | $50,594 |
| 65+ Years | 1,845 (26.3%) | $32,401 |
| Total | 7,021 (100.0%) | $41,837 |
Poverty in Forest Park
Income Below Poverty by Sex and Age in Forest Park
With 13.8% poverty level for males and 22.2% for females among the residents of Forest Park, 15 year old males and 18 to 24 year old females are the most vulnerable to poverty, with 39 males (34.8%) and 317 females (34.9%) in their respective age groups living below the poverty level.
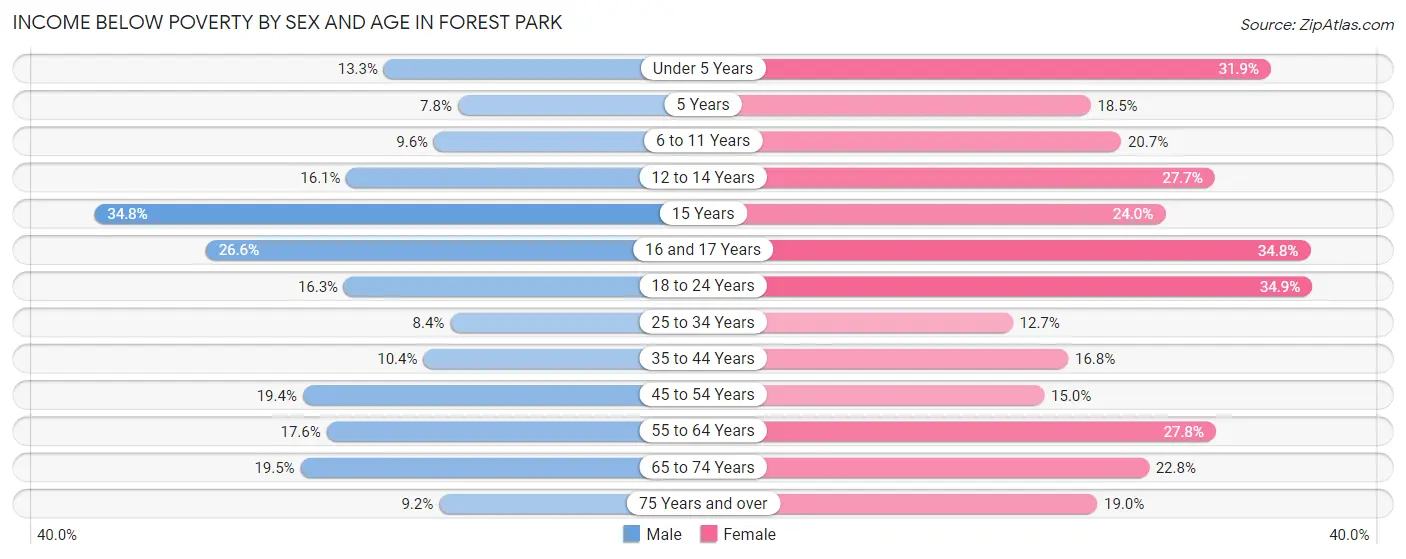
| Age Bracket | Male | Female |
| Under 5 Years | 70 (13.3%) | 201 (31.9%) |
| 5 Years | 12 (7.8%) | 24 (18.5%) |
| 6 to 11 Years | 134 (9.6%) | 222 (20.7%) |
| 12 to 14 Years | 77 (16.1%) | 127 (27.7%) |
| 15 Years | 39 (34.8%) | 24 (24.0%) |
| 16 and 17 Years | 60 (26.6%) | 121 (34.8%) |
| 18 to 24 Years | 153 (16.3%) | 317 (34.9%) |
| 25 to 34 Years | 128 (8.4%) | 188 (12.7%) |
| 35 to 44 Years | 125 (10.4%) | 212 (16.8%) |
| 45 to 54 Years | 201 (19.4%) | 122 (15.0%) |
| 55 to 64 Years | 160 (17.6%) | 254 (27.8%) |
| 65 to 74 Years | 105 (19.5%) | 211 (22.8%) |
| 75 Years and over | 42 (9.2%) | 112 (19.0%) |
| Total | 1,306 (13.8%) | 2,135 (22.2%) |
Income Above Poverty by Sex and Age in Forest Park
According to the poverty statistics in Forest Park, males aged 5 years and females aged 25 to 34 years are the age groups that are most secure financially, with 92.2% of males and 87.3% of females in these age groups living above the poverty line.
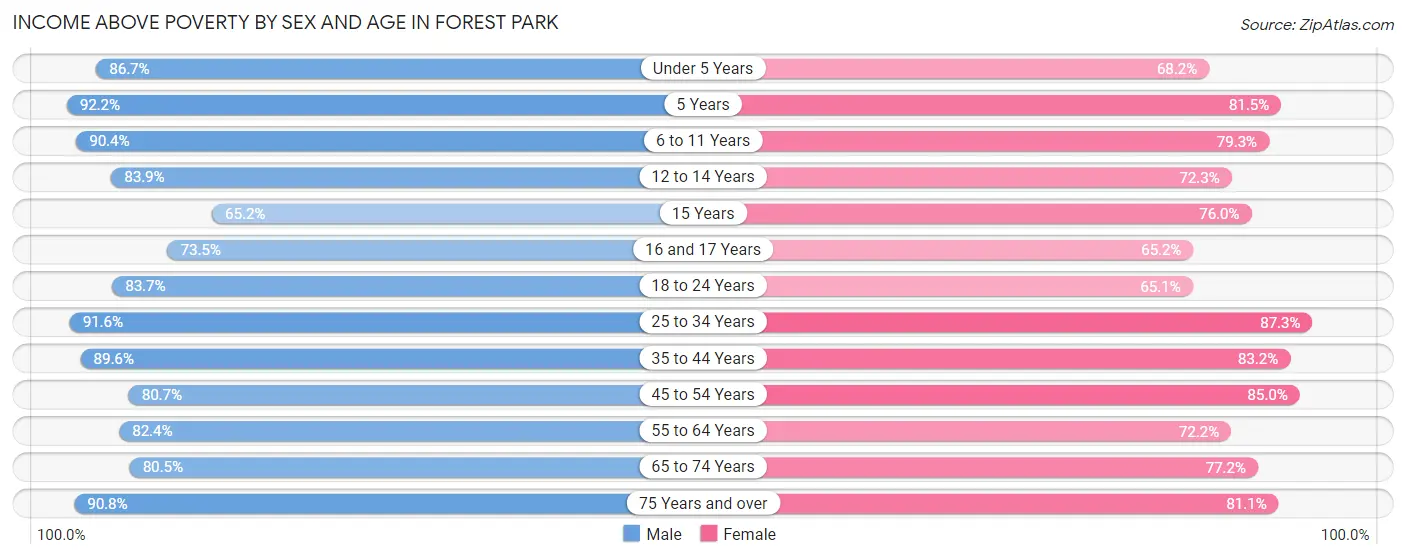
| Age Bracket | Male | Female |
| Under 5 Years | 455 (86.7%) | 430 (68.1%) |
| 5 Years | 141 (92.2%) | 106 (81.5%) |
| 6 to 11 Years | 1,261 (90.4%) | 849 (79.3%) |
| 12 to 14 Years | 401 (83.9%) | 332 (72.3%) |
| 15 Years | 73 (65.2%) | 76 (76.0%) |
| 16 and 17 Years | 166 (73.5%) | 227 (65.2%) |
| 18 to 24 Years | 786 (83.7%) | 591 (65.1%) |
| 25 to 34 Years | 1,396 (91.6%) | 1,295 (87.3%) |
| 35 to 44 Years | 1,077 (89.6%) | 1,050 (83.2%) |
| 45 to 54 Years | 838 (80.6%) | 690 (85.0%) |
| 55 to 64 Years | 750 (82.4%) | 661 (72.2%) |
| 65 to 74 Years | 433 (80.5%) | 715 (77.2%) |
| 75 Years and over | 413 (90.8%) | 479 (81.0%) |
| Total | 8,190 (86.3%) | 7,501 (77.8%) |
Income Below Poverty Among Married-Couple Families in Forest Park
The poverty statistics for married-couple families in Forest Park show that 10.0% or 184 of the total 1,843 families live below the poverty line. Families with 1 or 2 children have the highest poverty rate of 12.1%, comprising of 107 families. On the other hand, families with no children have the lowest poverty rate of 7.3%, which includes 55 families.
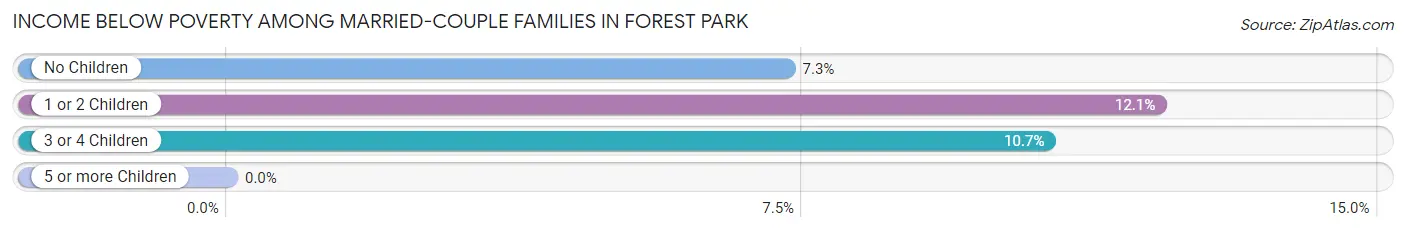
| Children | Above Poverty | Below Poverty |
| No Children | 700 (92.7%) | 55 (7.3%) |
| 1 or 2 Children | 775 (87.9%) | 107 (12.1%) |
| 3 or 4 Children | 184 (89.3%) | 22 (10.7%) |
| 5 or more Children | 0 (0.0%) | 0 (0.0%) |
| Total | 1,659 (90.0%) | 184 (10.0%) |
Income Below Poverty Among Single-Parent Households in Forest Park
According to the poverty data in Forest Park, 1.8% or 10 single-father households and 20.7% or 331 single-mother households are living below the poverty line. Among single-father households, those with no children have the highest poverty rate, with 10 households (4.0%) experiencing poverty. Likewise, among single-mother households, those with 5 or more children have the highest poverty rate, with 40 households (100.0%) falling below the poverty line.
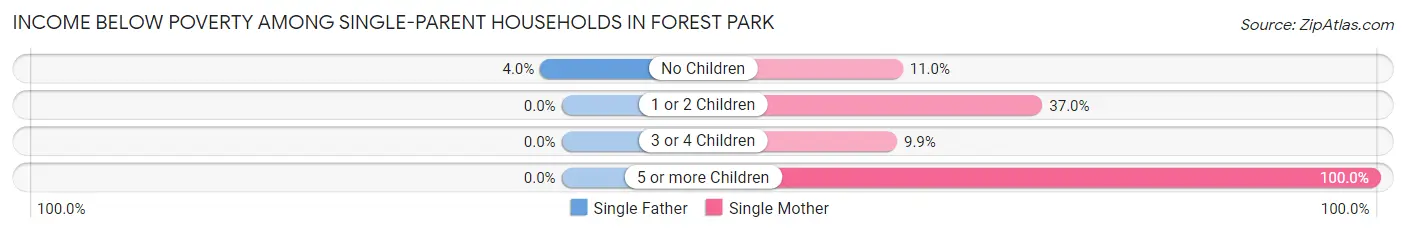
| Children | Single Father | Single Mother |
| No Children | 10 (4.0%) | 61 (11.0%) |
| 1 or 2 Children | 0 (0.0%) | 178 (37.0%) |
| 3 or 4 Children | 0 (0.0%) | 52 (9.9%) |
| 5 or more Children | 0 (0.0%) | 40 (100.0%) |
| Total | 10 (1.8%) | 331 (20.7%) |
Income Below Poverty Among Married-Couple vs Single-Parent Households in Forest Park
The poverty data for Forest Park shows that 184 of the married-couple family households (10.0%) and 341 of the single-parent households (15.9%) are living below the poverty level. Within the married-couple family households, those with 1 or 2 children have the highest poverty rate, with 107 households (12.1%) falling below the poverty line. Among the single-parent households, those with 5 or more children have the highest poverty rate, with 40 household (54.0%) living below poverty.
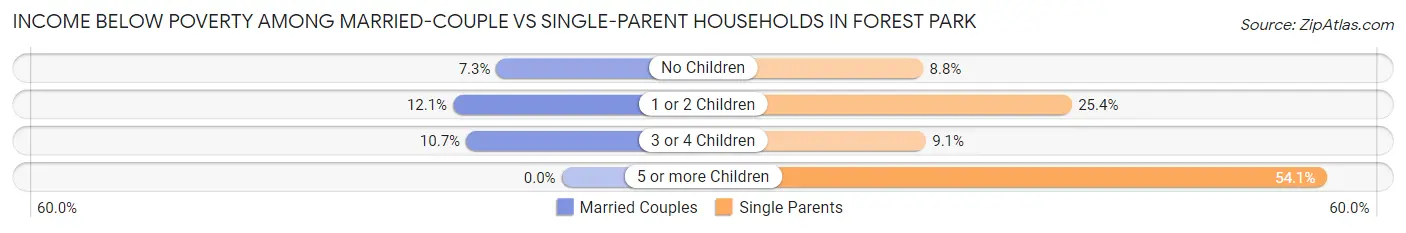
| Children | Married-Couple Families | Single-Parent Households |
| No Children | 55 (7.3%) | 71 (8.8%) |
| 1 or 2 Children | 107 (12.1%) | 178 (25.4%) |
| 3 or 4 Children | 22 (10.7%) | 52 (9.1%) |
| 5 or more Children | 0 (0.0%) | 40 (54.0%) |
| Total | 184 (10.0%) | 341 (15.9%) |
Race in Forest Park
The most populous races in Forest Park are Black / African American (10,647 | 54.3%), Hispanic or Latino (4,521 | 23.0%), and White / Caucasian (3,956 | 20.2%).
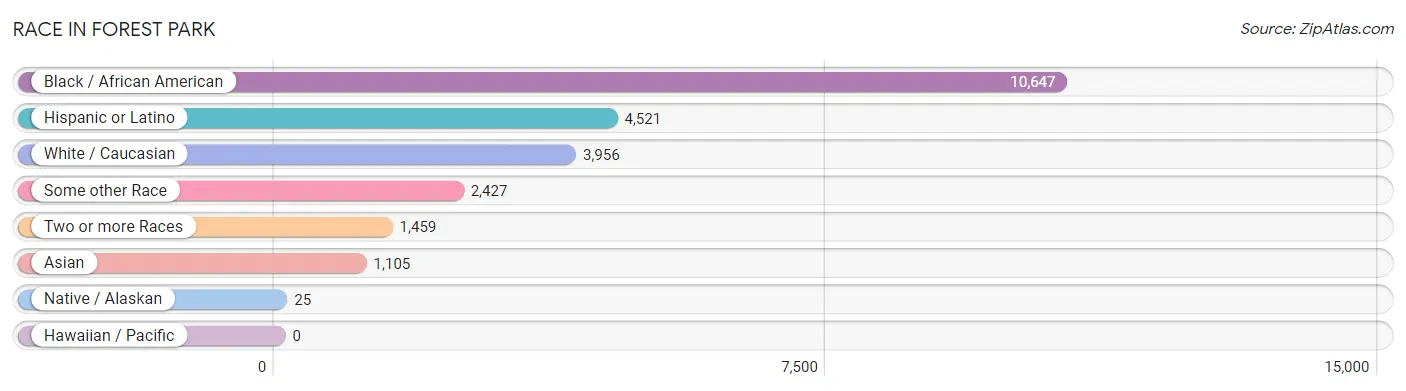
| Race | # Population | % Population |
| Asian | 1,105 | 5.6% |
| Black / African American | 10,647 | 54.3% |
| Hawaiian / Pacific | 0 | 0.0% |
| Hispanic or Latino | 4,521 | 23.0% |
| Native / Alaskan | 25 | 0.1% |
| White / Caucasian | 3,956 | 20.2% |
| Two or more Races | 1,459 | 7.4% |
| Some other Race | 2,427 | 12.4% |
| Total | 19,619 | 100.0% |
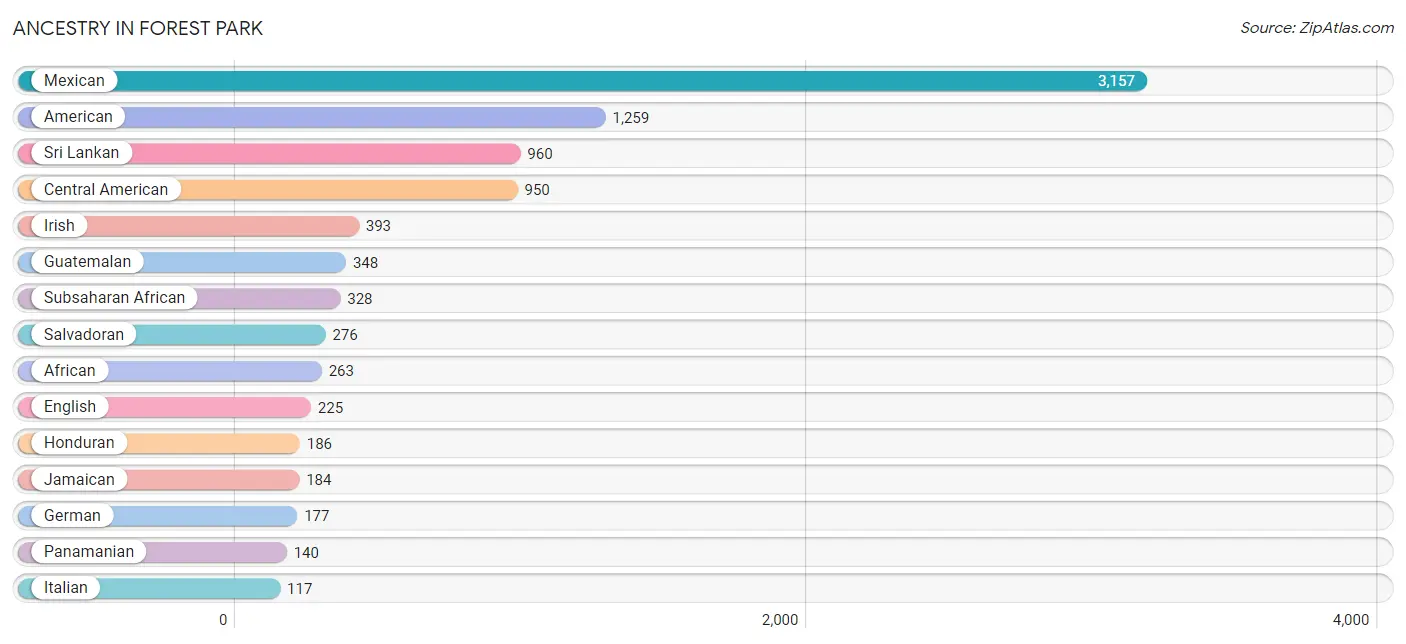
Ancestry in Forest Park
The most populous ancestries reported in Forest Park are Mexican (3,157 | 16.1%), American (1,259 | 6.4%), Sri Lankan (960 | 4.9%), Central American (950 | 4.8%), and Irish (393 | 2.0%), together accounting for 34.2% of all Forest Park residents.
| Ancestry | # Population | % Population |
| African | 263 | 1.3% |
| American | 1,259 | 6.4% |
| Bhutanese | 69 | 0.4% |
| Blackfeet | 3 | 0.0% |
| Brazilian | 4 | 0.0% |
| Cape Verdean | 5 | 0.0% |
| Central American | 950 | 4.8% |
| Central American Indian | 11 | 0.1% |
| Cherokee | 17 | 0.1% |
| Czech | 25 | 0.1% |
| Danish | 10 | 0.1% |
| Dominican | 98 | 0.5% |
| Dutch | 36 | 0.2% |
| Eastern European | 13 | 0.1% |
| English | 225 | 1.1% |
| European | 105 | 0.5% |
| French | 31 | 0.2% |
| German | 177 | 0.9% |
| Guatemalan | 348 | 1.8% |
| Haitian | 86 | 0.4% |
| Honduran | 186 | 0.9% |
| Hungarian | 33 | 0.2% |
| Irish | 393 | 2.0% |
| Israeli | 33 | 0.2% |
| Italian | 117 | 0.6% |
| Jamaican | 184 | 0.9% |
| Japanese | 16 | 0.1% |
| Korean | 77 | 0.4% |
| Malaysian | 2 | 0.0% |
| Mexican | 3,157 | 16.1% |
| Mexican American Indian | 13 | 0.1% |
| Mongolian | 19 | 0.1% |
| Nigerian | 50 | 0.3% |
| Norwegian | 14 | 0.1% |
| Pakistani | 57 | 0.3% |
| Panamanian | 140 | 0.7% |
| Peruvian | 34 | 0.2% |
| Polish | 91 | 0.5% |
| Portuguese | 45 | 0.2% |
| Puerto Rican | 91 | 0.5% |
| Russian | 71 | 0.4% |
| Salvadoran | 276 | 1.4% |
| Scotch-Irish | 52 | 0.3% |
| Scottish | 23 | 0.1% |
| Slavic | 10 | 0.1% |
| South American | 70 | 0.4% |
| Sri Lankan | 960 | 4.9% |
| Subsaharan African | 328 | 1.7% |
| Sudanese | 10 | 0.1% |
| Venezuelan | 36 | 0.2% |
| Welsh | 12 | 0.1% |
| West Indian | 37 | 0.2% | View All 52 Rows |
Immigrants in Forest Park
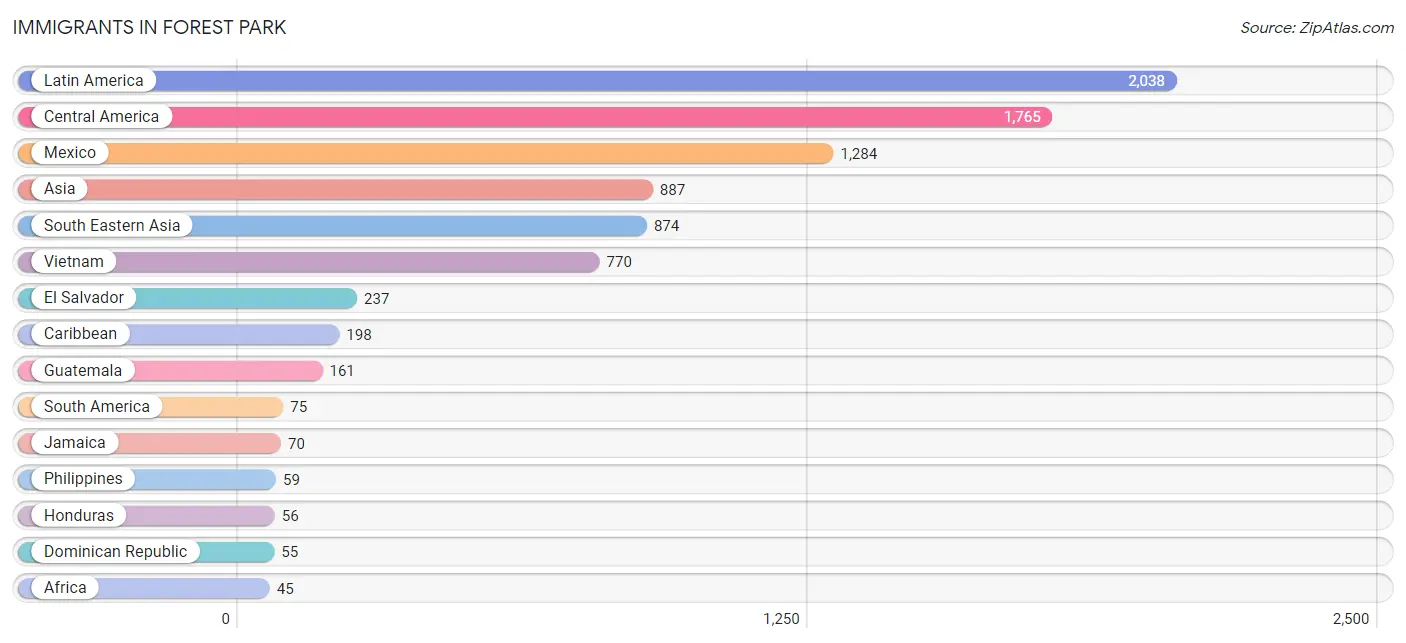
The most numerous immigrant groups reported in Forest Park came from Latin America (2,038 | 10.4%), Central America (1,765 | 9.0%), Mexico (1,284 | 6.5%), Asia (887 | 4.5%), and South Eastern Asia (874 | 4.4%), together accounting for 34.9% of all Forest Park residents.
| Immigration Origin | # Population | % Population |
| Africa | 45 | 0.2% |
| Asia | 887 | 4.5% |
| Cambodia | 16 | 0.1% |
| Canada | 12 | 0.1% |
| Caribbean | 198 | 1.0% |
| Central America | 1,765 | 9.0% |
| Dominican Republic | 55 | 0.3% |
| El Salvador | 237 | 1.2% |
| Europe | 9 | 0.1% |
| Germany | 7 | 0.0% |
| Guatemala | 161 | 0.8% |
| Haiti | 42 | 0.2% |
| Honduras | 56 | 0.3% |
| India | 13 | 0.1% |
| Jamaica | 70 | 0.4% |
| Laos | 2 | 0.0% |
| Latin America | 2,038 | 10.4% |
| Mexico | 1,284 | 6.5% |
| Panama | 27 | 0.1% |
| Peru | 34 | 0.2% |
| Philippines | 59 | 0.3% |
| Sierra Leone | 45 | 0.2% |
| South America | 75 | 0.4% |
| South Central Asia | 13 | 0.1% |
| South Eastern Asia | 874 | 4.4% |
| Southern Europe | 2 | 0.0% |
| Spain | 2 | 0.0% |
| Thailand | 27 | 0.1% |
| Trinidad and Tobago | 31 | 0.2% |
| Venezuela | 36 | 0.2% |
| Vietnam | 770 | 3.9% |
| Western Africa | 45 | 0.2% |
| Western Europe | 7 | 0.0% | View All 33 Rows |
Sex and Age in Forest Park
Sex and Age in Forest Park
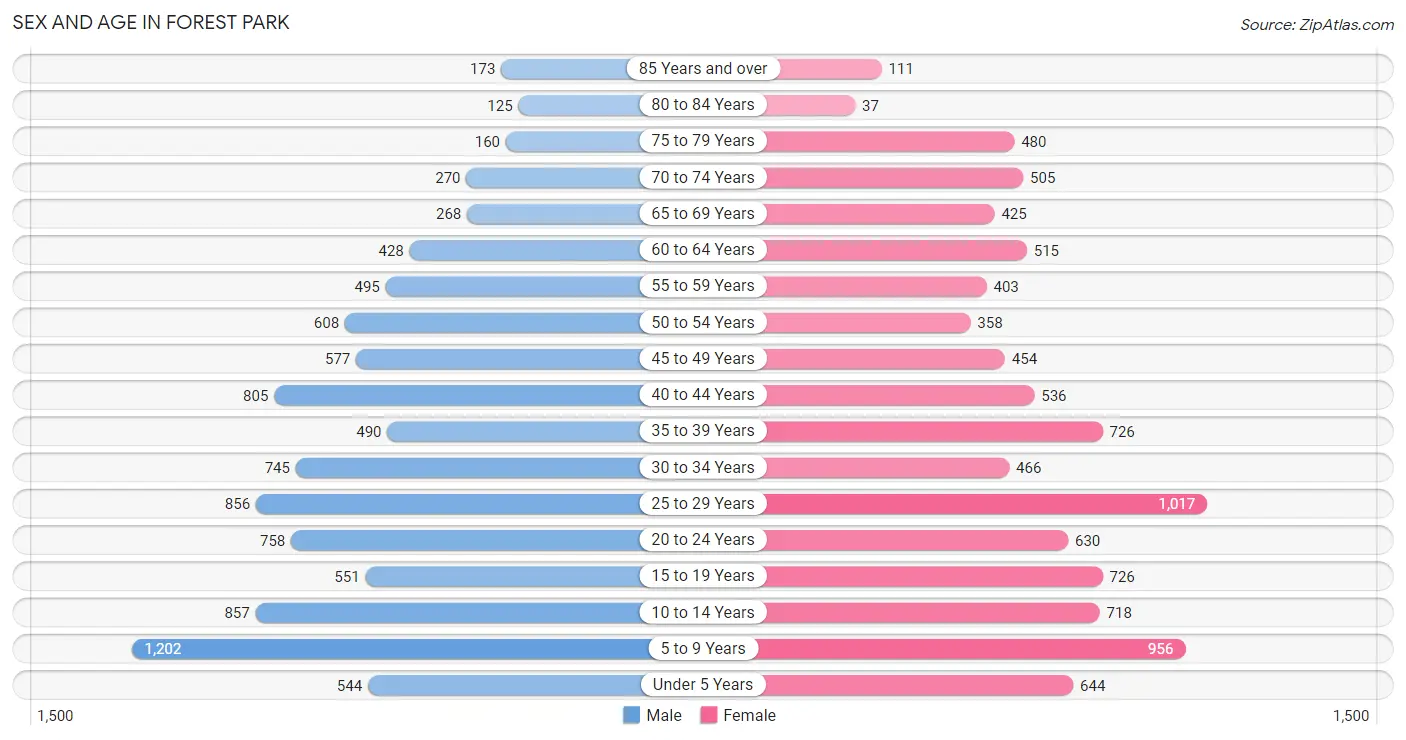
The most populous age groups in Forest Park are 5 to 9 Years (1,202 | 12.1%) for men and 25 to 29 Years (1,017 | 10.5%) for women.
| Age Bracket | Male | Female |
| Under 5 Years | 544 (5.5%) | 644 (6.6%) |
| 5 to 9 Years | 1,202 (12.1%) | 956 (9.9%) |
| 10 to 14 Years | 857 (8.6%) | 718 (7.4%) |
| 15 to 19 Years | 551 (5.6%) | 726 (7.5%) |
| 20 to 24 Years | 758 (7.6%) | 630 (6.5%) |
| 25 to 29 Years | 856 (8.6%) | 1,017 (10.5%) |
| 30 to 34 Years | 745 (7.5%) | 466 (4.8%) |
| 35 to 39 Years | 490 (4.9%) | 726 (7.5%) |
| 40 to 44 Years | 805 (8.1%) | 536 (5.5%) |
| 45 to 49 Years | 577 (5.8%) | 454 (4.7%) |
| 50 to 54 Years | 608 (6.1%) | 358 (3.7%) |
| 55 to 59 Years | 495 (5.0%) | 403 (4.2%) |
| 60 to 64 Years | 428 (4.3%) | 515 (5.3%) |
| 65 to 69 Years | 268 (2.7%) | 425 (4.4%) |
| 70 to 74 Years | 270 (2.7%) | 505 (5.2%) |
| 75 to 79 Years | 160 (1.6%) | 480 (4.9%) |
| 80 to 84 Years | 125 (1.3%) | 37 (0.4%) |
| 85 Years and over | 173 (1.8%) | 111 (1.1%) |
| Total | 9,912 (100.0%) | 9,707 (100.0%) |
Families and Households in Forest Park
Median Family Size in Forest Park
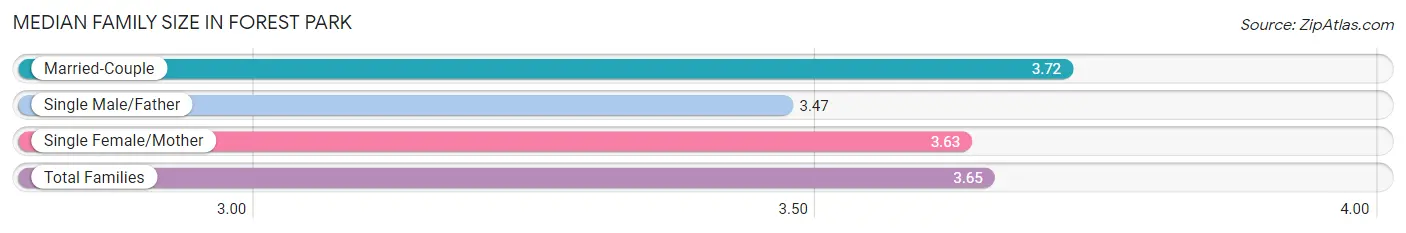
The median family size in Forest Park is 3.65 persons per family, with married-couple families (1,843 | 46.2%) accounting for the largest median family size of 3.72 persons per family. On the other hand, single male/father families (551 | 13.8%) represent the smallest median family size with 3.47 persons per family.
| Family Type | # Families | Family Size |
| Married-Couple | 1,843 (46.2%) | 3.72 |
| Single Male/Father | 551 (13.8%) | 3.47 |
| Single Female/Mother | 1,598 (40.0%) | 3.63 |
| Total Families | 3,992 (100.0%) | 3.65 |
Median Household Size in Forest Park
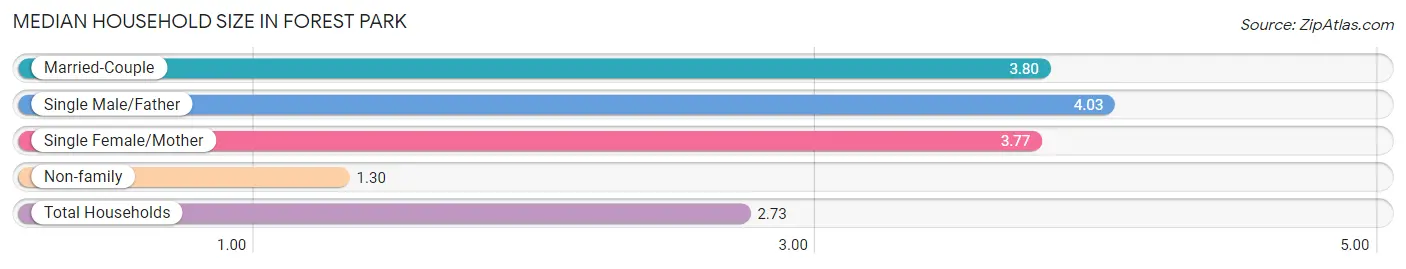
The median household size in Forest Park is 2.73 persons per household, with single male/father households (551 | 7.9%) accounting for the largest median household size of 4.03 persons per household. non-family households (3,029 | 43.1%) represent the smallest median household size with 1.30 persons per household.
| Household Type | # Households | Household Size |
| Married-Couple | 1,843 (26.3%) | 3.80 |
| Single Male/Father | 551 (7.9%) | 4.03 |
| Single Female/Mother | 1,598 (22.8%) | 3.77 |
| Non-family | 3,029 (43.1%) | 1.30 |
| Total Households | 7,021 (100.0%) | 2.73 |
Household Size by Marriage Status in Forest Park
Out of a total of 7,021 households in Forest Park, 3,992 (56.9%) are family households, while 3,029 (43.1%) are nonfamily households. The most numerous type of family households are 4-person households, comprising 1,118, and the most common type of nonfamily households are 1-person households, comprising 2,324.
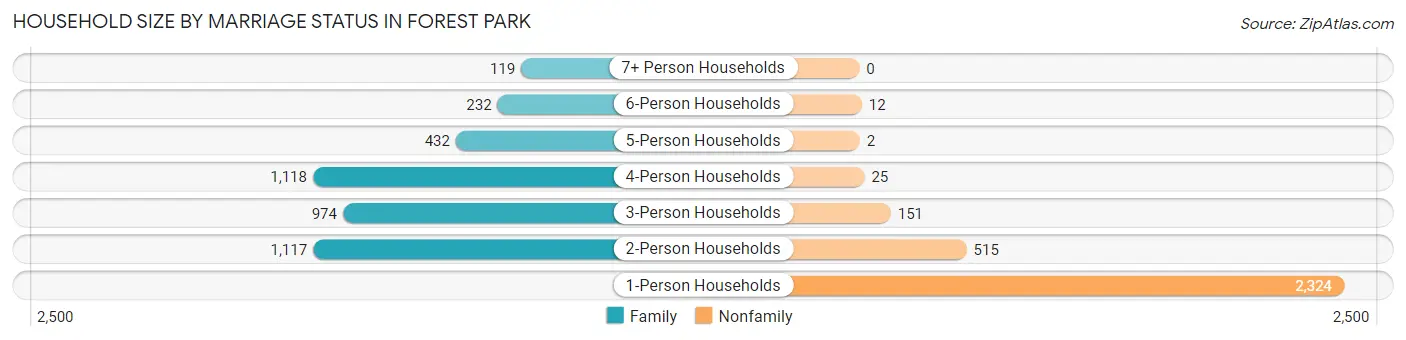
| Household Size | Family Households | Nonfamily Households |
| 1-Person Households | - | 2,324 (33.1%) |
| 2-Person Households | 1,117 (15.9%) | 515 (7.3%) |
| 3-Person Households | 974 (13.9%) | 151 (2.1%) |
| 4-Person Households | 1,118 (15.9%) | 25 (0.4%) |
| 5-Person Households | 432 (6.1%) | 2 (0.0%) |
| 6-Person Households | 232 (3.3%) | 12 (0.2%) |
| 7+ Person Households | 119 (1.7%) | 0 (0.0%) |
| Total | 3,992 (56.9%) | 3,029 (43.1%) |
Female Fertility in Forest Park
Fertility by Age in Forest Park
Average fertility rate in Forest Park is 74.0 births per 1,000 women. Women in the age bracket of 20 to 34 years have the highest fertility rate with 112.0 births per 1,000 women. Women in the age bracket of 20 to 34 years acount for 69.1% of all women with births.
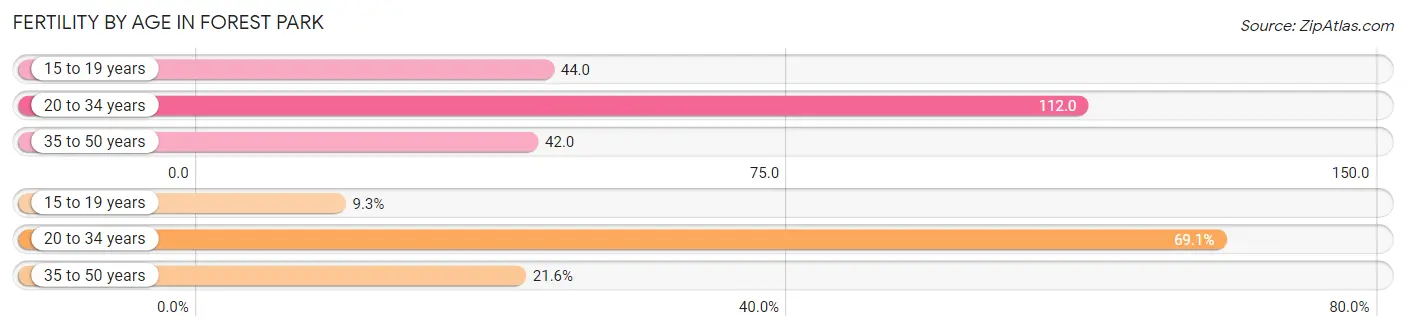
| Age Bracket | Women with Births | Births / 1,000 Women |
| 15 to 19 years | 32 (9.3%) | 44.0 |
| 20 to 34 years | 237 (69.1%) | 112.0 |
| 35 to 50 years | 74 (21.6%) | 42.0 |
| Total | 343 (100.0%) | 74.0 |
Fertility by Age by Marriage Status in Forest Park
39.1% of women with births (343) in Forest Park are married. The highest percentage of unmarried women with births falls into 15 to 19 years age bracket with 100.0% of them unmarried at the time of birth, while the lowest percentage of unmarried women with births belong to 20 to 34 years age bracket with 43.5% of them unmarried.
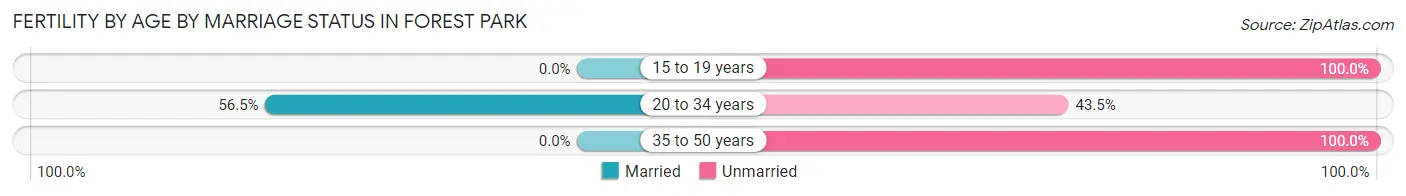
| Age Bracket | Married | Unmarried |
| 15 to 19 years | 0 (0.0%) | 32 (100.0%) |
| 20 to 34 years | 134 (56.5%) | 103 (43.5%) |
| 35 to 50 years | 0 (0.0%) | 74 (100.0%) |
| Total | 134 (39.1%) | 209 (60.9%) |
Fertility by Education in Forest Park
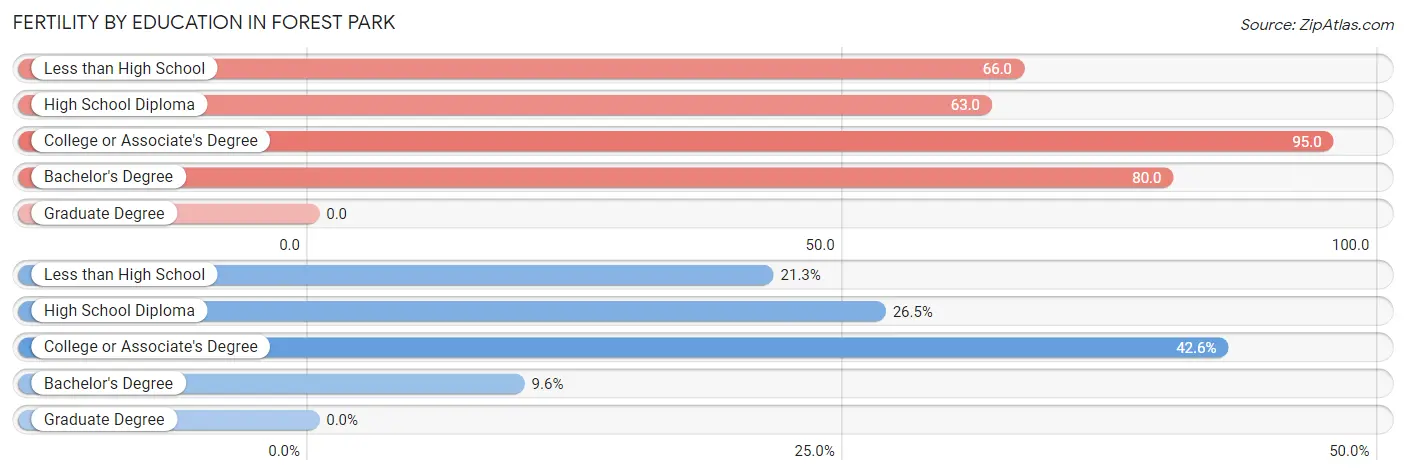
| Educational Attainment | Women with Births | Births / 1,000 Women |
| Less than High School | 73 (21.3%) | 66.0 |
| High School Diploma | 91 (26.5%) | 63.0 |
| College or Associate's Degree | 146 (42.6%) | 95.0 |
| Bachelor's Degree | 33 (9.6%) | 80.0 |
| Graduate Degree | 0 (0.0%) | 0.0 |
| Total | 343 (100.0%) | 74.0 |
Fertility by Education by Marriage Status in Forest Park
60.9% of women with births in Forest Park are unmarried. Women with the educational attainment of bachelor's degree are most likely to be married with 100.0% of them married at childbirth, while women with the educational attainment of less than high school are least likely to be married with 100.0% of them unmarried at childbirth.
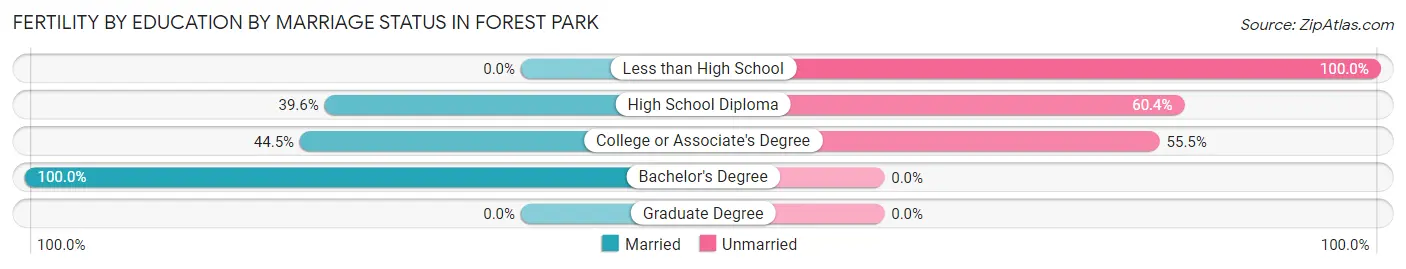
| Educational Attainment | Married | Unmarried |
| Less than High School | 0 (0.0%) | 73 (100.0%) |
| High School Diploma | 36 (39.6%) | 55 (60.4%) |
| College or Associate's Degree | 65 (44.5%) | 81 (55.5%) |
| Bachelor's Degree | 33 (100.0%) | 0 (0.0%) |
| Graduate Degree | 0 (0.0%) | 0 (0.0%) |
| Total | 134 (39.1%) | 209 (60.9%) |
Employment Characteristics in Forest Park
Employment by Class of Employer in Forest Park
Among the 7,644 employed individuals in Forest Park, private company employees (6,131 | 80.2%), self-employed (not incorporated) (567 | 7.4%), and local government employees (297 | 3.9%) make up the most common classes of employment.
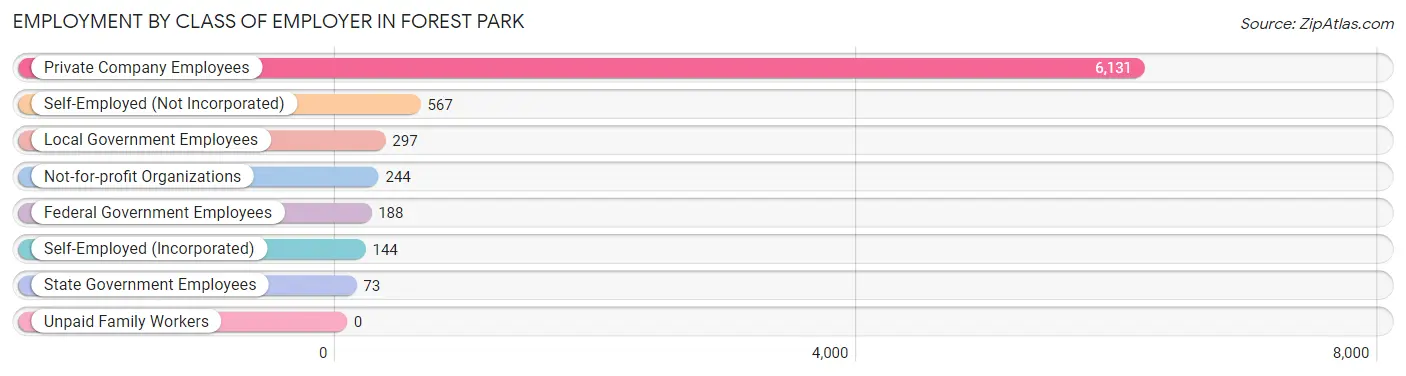
| Employer Class | # Employees | % Employees |
| Private Company Employees | 6,131 | 80.2% |
| Self-Employed (Incorporated) | 144 | 1.9% |
| Self-Employed (Not Incorporated) | 567 | 7.4% |
| Not-for-profit Organizations | 244 | 3.2% |
| Local Government Employees | 297 | 3.9% |
| State Government Employees | 73 | 0.9% |
| Federal Government Employees | 188 | 2.5% |
| Unpaid Family Workers | 0 | 0.0% |
| Total | 7,644 | 100.0% |
Employment Status by Age in Forest Park
According to the labor force statistics for Forest Park, out of the total population over 16 years of age (14,486), 59.7% or 8,648 individuals are in the labor force, with 8.9% or 770 of them unemployed. The age group with the highest labor force participation rate is 25 to 29 years, with 87.9% or 1,646 individuals in the labor force. Within the labor force, the 20 to 24 years age range has the highest percentage of unemployed individuals, with 22.7% or 226 of them being unemployed.
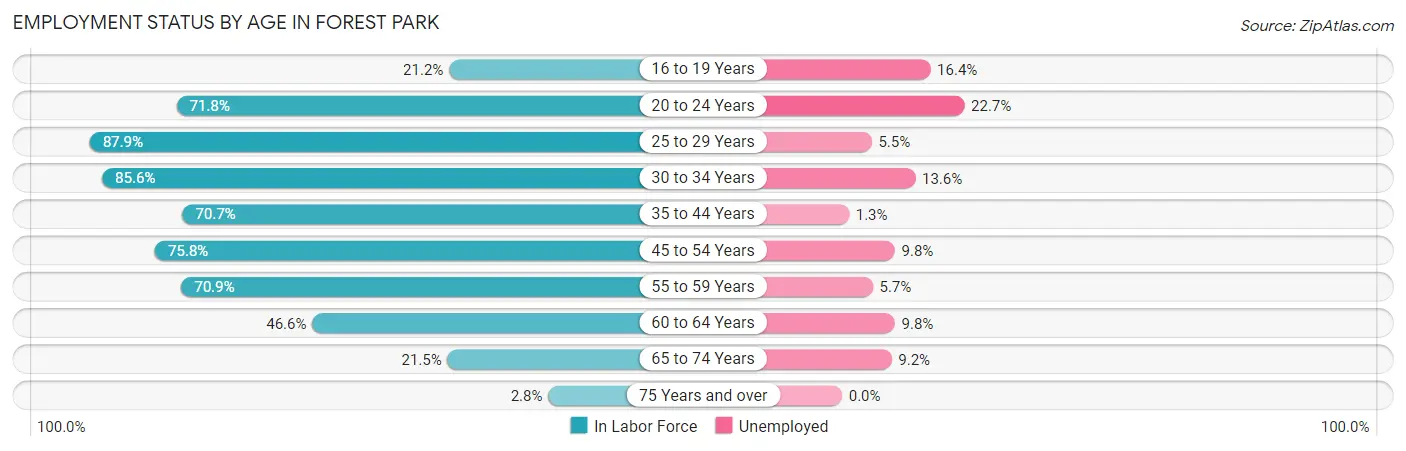
| Age Bracket | In Labor Force | Unemployed |
| 16 to 19 Years | 226 (21.2%) | 37 (16.4%) |
| 20 to 24 Years | 997 (71.8%) | 226 (22.7%) |
| 25 to 29 Years | 1,646 (87.9%) | 91 (5.5%) |
| 30 to 34 Years | 1,037 (85.6%) | 141 (13.6%) |
| 35 to 44 Years | 1,808 (70.7%) | 24 (1.3%) |
| 45 to 54 Years | 1,514 (75.8%) | 148 (9.8%) |
| 55 to 59 Years | 637 (70.9%) | 36 (5.7%) |
| 60 to 64 Years | 439 (46.6%) | 43 (9.8%) |
| 65 to 74 Years | 316 (21.5%) | 29 (9.2%) |
| 75 Years and over | 30 (2.8%) | 0 (0.0%) |
| Total | 8,648 (59.7%) | 770 (8.9%) |
Employment Status by Educational Attainment in Forest Park
According to labor force statistics for Forest Park, 74.7% of individuals (7,081) out of the total population between 25 and 64 years of age (9,479) are in the labor force, with 6.8% or 482 of them being unemployed. The group with the highest labor force participation rate are those with the educational attainment of bachelor's degree or higher, with 86.3% or 822 individuals in the labor force. Within the labor force, individuals with less than high school education have the highest percentage of unemployment, with 9.2% or 124 of them being unemployed.
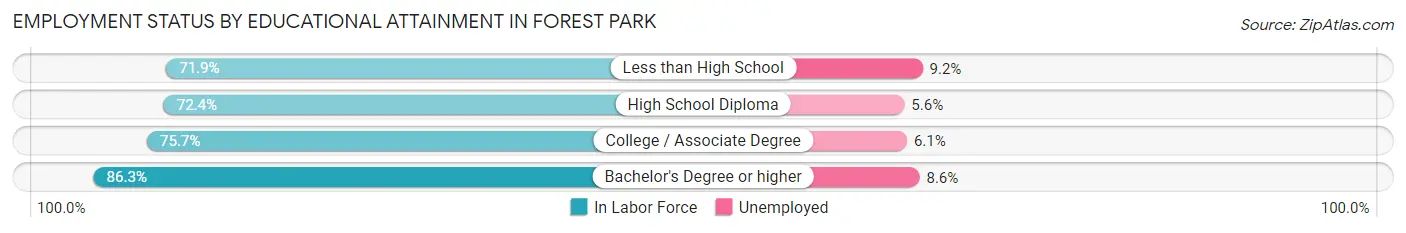
| Educational Attainment | In Labor Force | Unemployed |
| Less than High School | 1,344 (71.9%) | 172 (9.2%) |
| High School Diploma | 2,685 (72.4%) | 208 (5.6%) |
| College / Associate Degree | 2,233 (75.7%) | 180 (6.1%) |
| Bachelor's Degree or higher | 822 (86.3%) | 82 (8.6%) |
| Total | 7,081 (74.7%) | 645 (6.8%) |
Employment Occupations by Sex in Forest Park
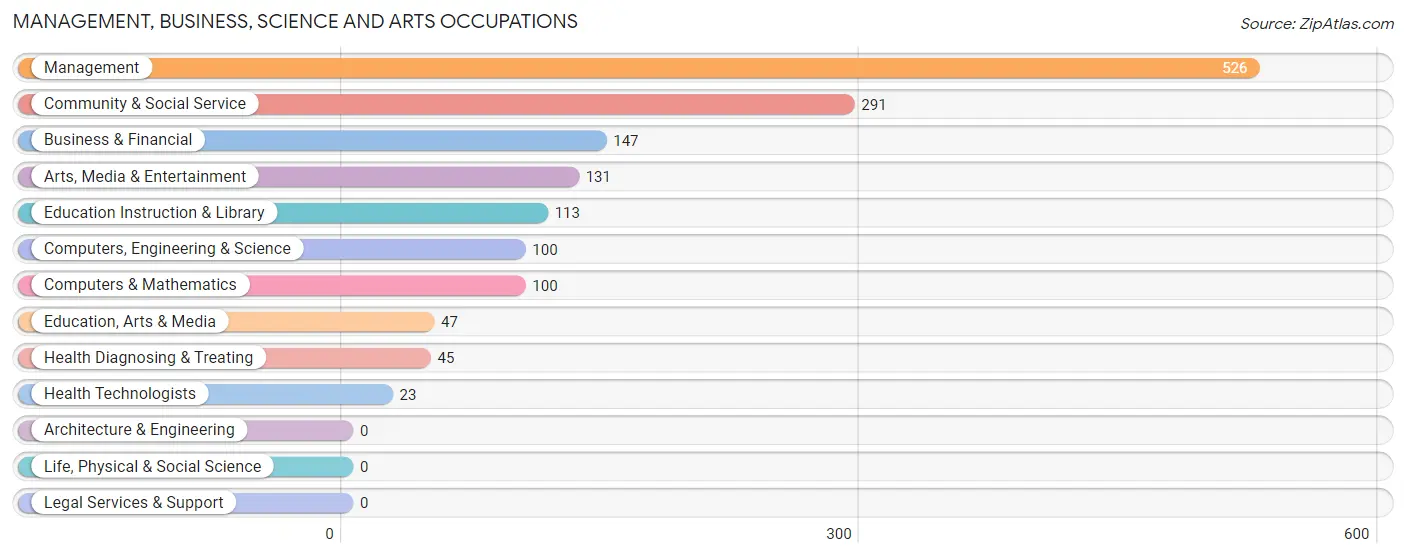
Management, Business, Science and Arts Occupations
The most common Management, Business, Science and Arts occupations in Forest Park are Management (526 | 6.7%), Community & Social Service (291 | 3.7%), Business & Financial (147 | 1.9%), Arts, Media & Entertainment (131 | 1.7%), and Education Instruction & Library (113 | 1.4%).
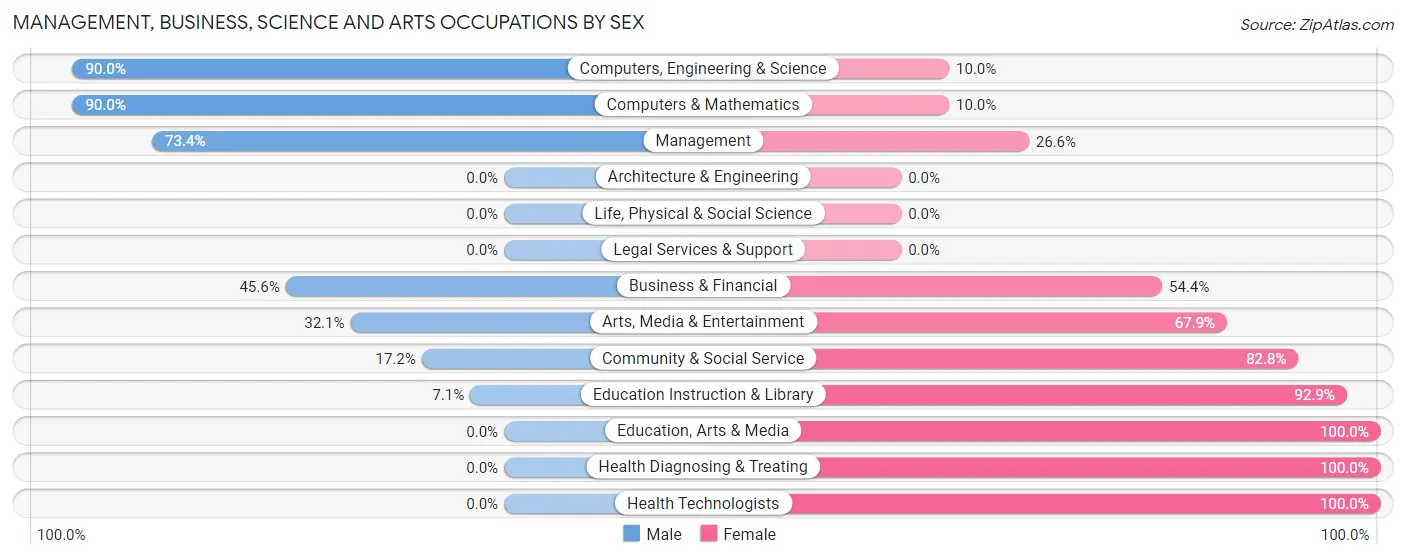
Management, Business, Science and Arts Occupations by Sex
Within the Management, Business, Science and Arts occupations in Forest Park, the most male-oriented occupations are Computers, Engineering & Science (90.0%), Computers & Mathematics (90.0%), and Management (73.4%), while the most female-oriented occupations are Education, Arts & Media (100.0%), Health Diagnosing & Treating (100.0%), and Health Technologists (100.0%).
| Occupation | Male | Female |
| Management | 386 (73.4%) | 140 (26.6%) |
| Business & Financial | 67 (45.6%) | 80 (54.4%) |
| Computers, Engineering & Science | 90 (90.0%) | 10 (10.0%) |
| Computers & Mathematics | 90 (90.0%) | 10 (10.0%) |
| Architecture & Engineering | 0 (0.0%) | 0 (0.0%) |
| Life, Physical & Social Science | 0 (0.0%) | 0 (0.0%) |
| Community & Social Service | 50 (17.2%) | 241 (82.8%) |
| Education, Arts & Media | 0 (0.0%) | 47 (100.0%) |
| Legal Services & Support | 0 (0.0%) | 0 (0.0%) |
| Education Instruction & Library | 8 (7.1%) | 105 (92.9%) |
| Arts, Media & Entertainment | 42 (32.1%) | 89 (67.9%) |
| Health Diagnosing & Treating | 0 (0.0%) | 45 (100.0%) |
| Health Technologists | 0 (0.0%) | 23 (100.0%) |
| Total (Category) | 593 (53.5%) | 516 (46.5%) |
| Total (Overall) | 4,049 (51.4%) | 3,828 (48.6%) |
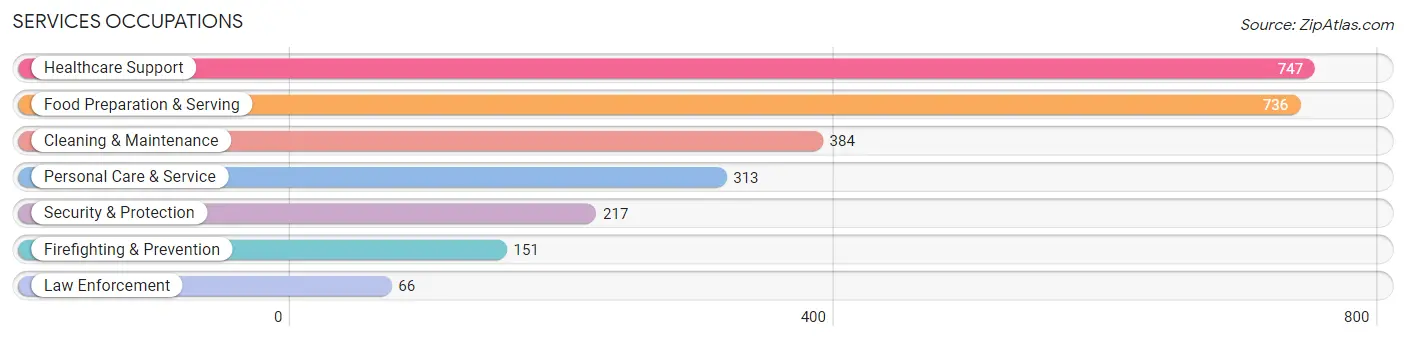
Services Occupations
The most common Services occupations in Forest Park are Healthcare Support (747 | 9.5%), Food Preparation & Serving (736 | 9.3%), Cleaning & Maintenance (384 | 4.9%), Personal Care & Service (313 | 4.0%), and Security & Protection (217 | 2.8%).
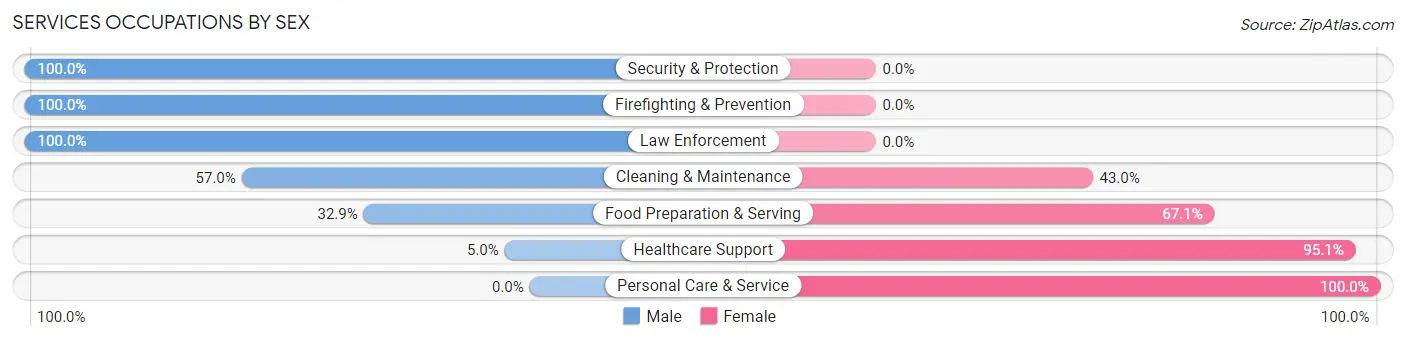
Services Occupations by Sex
Within the Services occupations in Forest Park, the most male-oriented occupations are Security & Protection (100.0%), Firefighting & Prevention (100.0%), and Law Enforcement (100.0%), while the most female-oriented occupations are Personal Care & Service (100.0%), Healthcare Support (95.1%), and Food Preparation & Serving (67.1%).
| Occupation | Male | Female |
| Healthcare Support | 37 (5.0%) | 710 (95.1%) |
| Security & Protection | 217 (100.0%) | 0 (0.0%) |
| Firefighting & Prevention | 151 (100.0%) | 0 (0.0%) |
| Law Enforcement | 66 (100.0%) | 0 (0.0%) |
| Food Preparation & Serving | 242 (32.9%) | 494 (67.1%) |
| Cleaning & Maintenance | 219 (57.0%) | 165 (43.0%) |
| Personal Care & Service | 0 (0.0%) | 313 (100.0%) |
| Total (Category) | 715 (29.8%) | 1,682 (70.2%) |
| Total (Overall) | 4,049 (51.4%) | 3,828 (48.6%) |
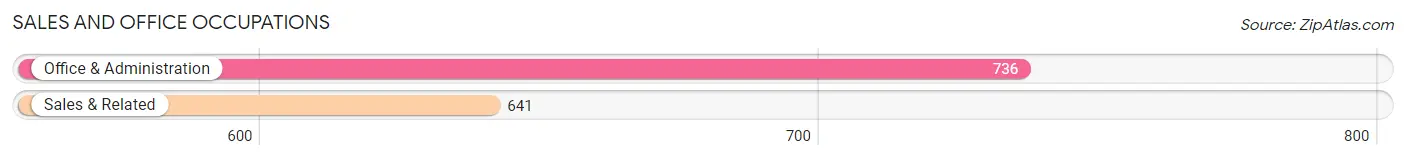
Sales and Office Occupations
The most common Sales and Office occupations in Forest Park are Office & Administration (736 | 9.3%), and Sales & Related (641 | 8.1%).
Sales and Office Occupations by Sex
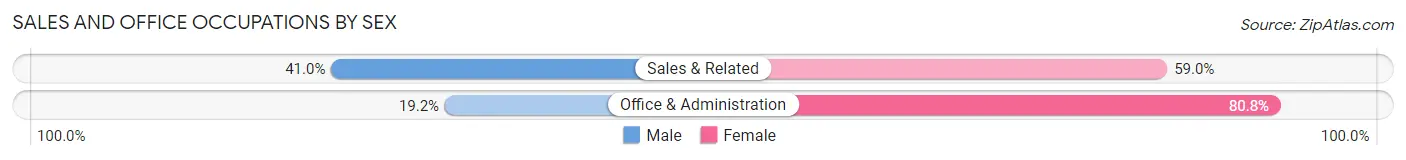
| Occupation | Male | Female |
| Sales & Related | 263 (41.0%) | 378 (59.0%) |
| Office & Administration | 141 (19.2%) | 595 (80.8%) |
| Total (Category) | 404 (29.3%) | 973 (70.7%) |
| Total (Overall) | 4,049 (51.4%) | 3,828 (48.6%) |
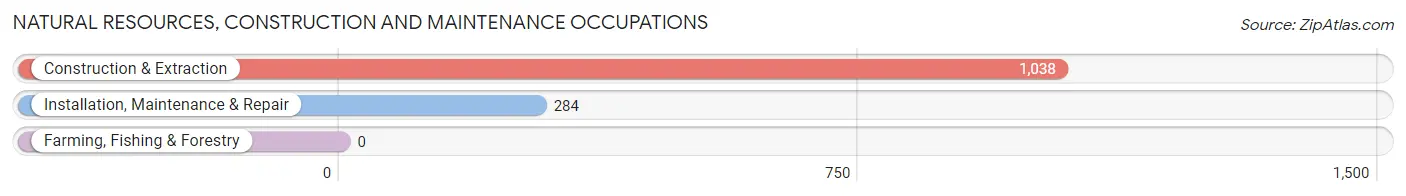
Natural Resources, Construction and Maintenance Occupations
The most common Natural Resources, Construction and Maintenance occupations in Forest Park are Construction & Extraction (1,038 | 13.2%), and Installation, Maintenance & Repair (284 | 3.6%).
Natural Resources, Construction and Maintenance Occupations by Sex
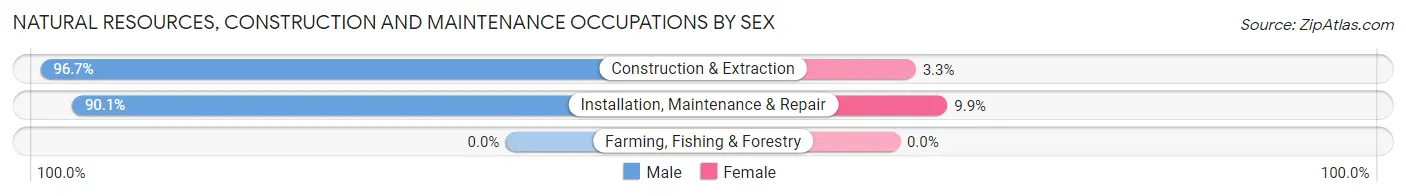
| Occupation | Male | Female |
| Farming, Fishing & Forestry | 0 (0.0%) | 0 (0.0%) |
| Construction & Extraction | 1,004 (96.7%) | 34 (3.3%) |
| Installation, Maintenance & Repair | 256 (90.1%) | 28 (9.9%) |
| Total (Category) | 1,260 (95.3%) | 62 (4.7%) |
| Total (Overall) | 4,049 (51.4%) | 3,828 (48.6%) |
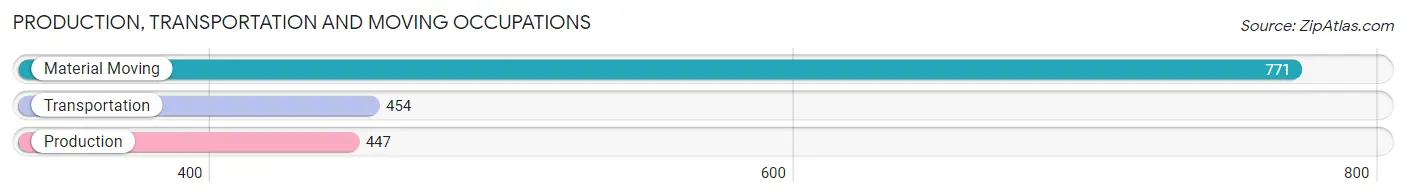
Production, Transportation and Moving Occupations
The most common Production, Transportation and Moving occupations in Forest Park are Material Moving (771 | 9.8%), Transportation (454 | 5.8%), and Production (447 | 5.7%).
Production, Transportation and Moving Occupations by Sex
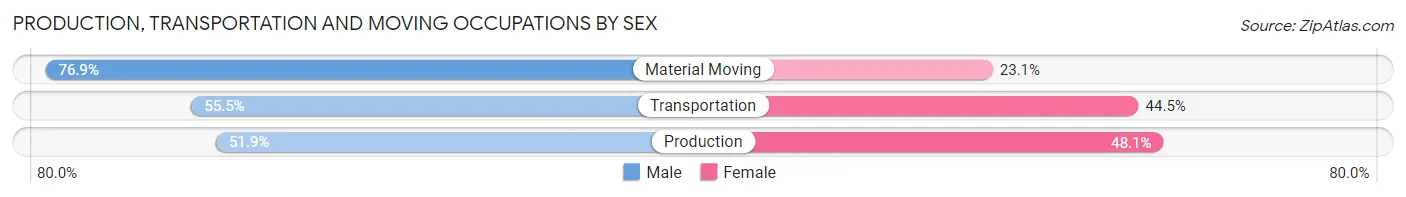
| Occupation | Male | Female |
| Production | 232 (51.9%) | 215 (48.1%) |
| Transportation | 252 (55.5%) | 202 (44.5%) |
| Material Moving | 593 (76.9%) | 178 (23.1%) |
| Total (Category) | 1,077 (64.4%) | 595 (35.6%) |
| Total (Overall) | 4,049 (51.4%) | 3,828 (48.6%) |
Employment Industries by Sex in Forest Park
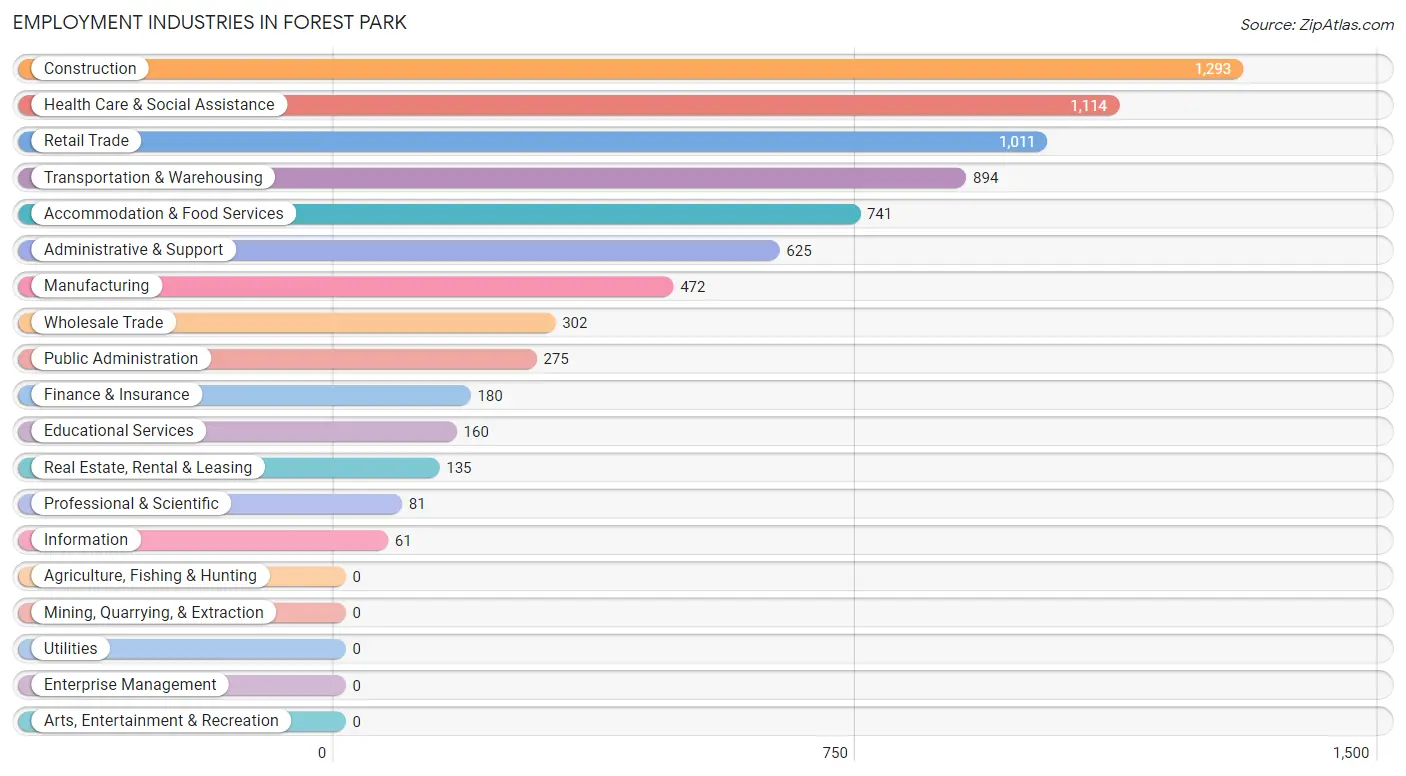
Employment Industries in Forest Park
The major employment industries in Forest Park include Construction (1,293 | 16.4%), Health Care & Social Assistance (1,114 | 14.1%), Retail Trade (1,011 | 12.8%), Transportation & Warehousing (894 | 11.4%), and Accommodation & Food Services (741 | 9.4%).
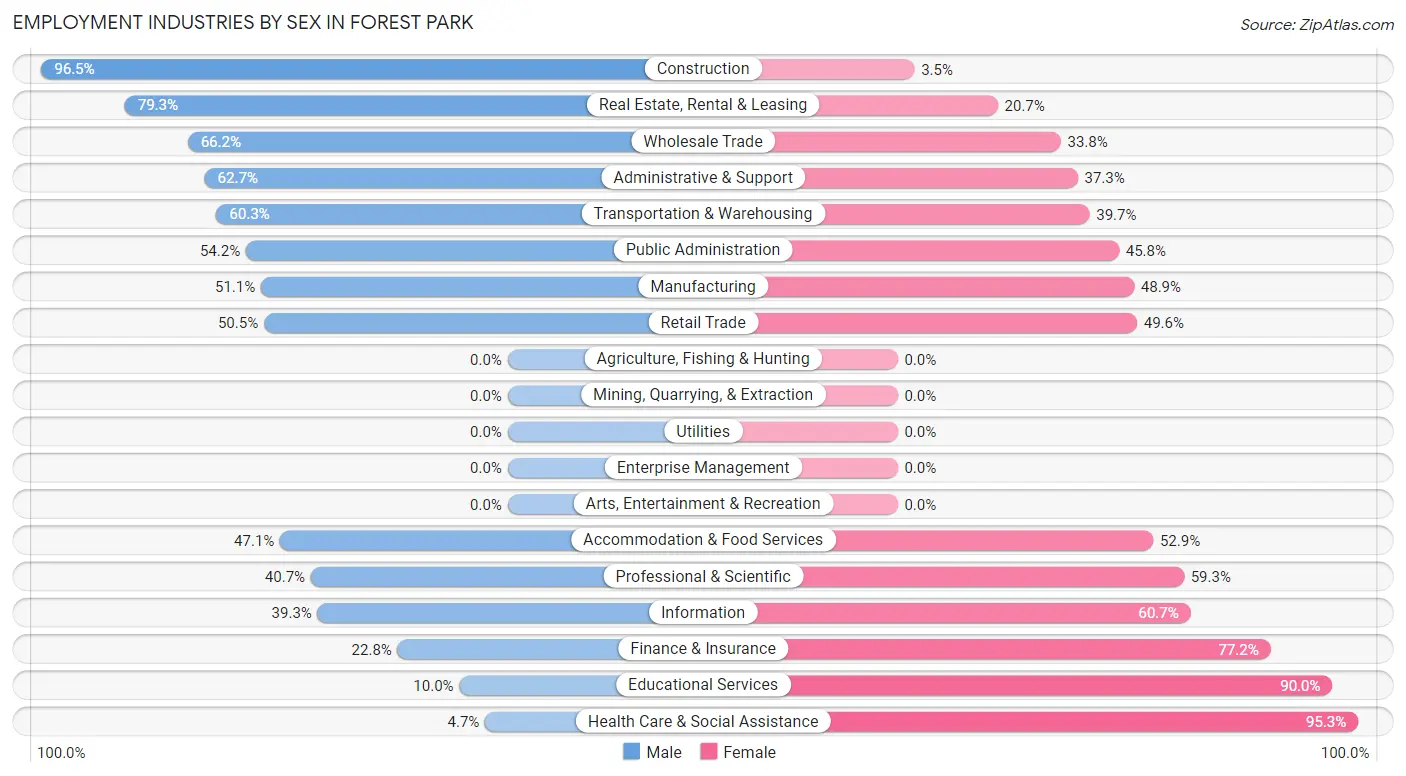
Employment Industries by Sex in Forest Park
The Forest Park industries that see more men than women are Construction (96.5%), Real Estate, Rental & Leasing (79.3%), and Wholesale Trade (66.2%), whereas the industries that tend to have a higher number of women are Health Care & Social Assistance (95.3%), Educational Services (90.0%), and Finance & Insurance (77.2%).
| Industry | Male | Female |
| Agriculture, Fishing & Hunting | 0 (0.0%) | 0 (0.0%) |
| Mining, Quarrying, & Extraction | 0 (0.0%) | 0 (0.0%) |
| Construction | 1,248 (96.5%) | 45 (3.5%) |
| Manufacturing | 241 (51.1%) | 231 (48.9%) |
| Wholesale Trade | 200 (66.2%) | 102 (33.8%) |
| Retail Trade | 510 (50.4%) | 501 (49.5%) |
| Transportation & Warehousing | 539 (60.3%) | 355 (39.7%) |
| Utilities | 0 (0.0%) | 0 (0.0%) |
| Information | 24 (39.3%) | 37 (60.7%) |
| Finance & Insurance | 41 (22.8%) | 139 (77.2%) |
| Real Estate, Rental & Leasing | 107 (79.3%) | 28 (20.7%) |
| Professional & Scientific | 33 (40.7%) | 48 (59.3%) |
| Enterprise Management | 0 (0.0%) | 0 (0.0%) |
| Administrative & Support | 392 (62.7%) | 233 (37.3%) |
| Educational Services | 16 (10.0%) | 144 (90.0%) |
| Health Care & Social Assistance | 52 (4.7%) | 1,062 (95.3%) |
| Arts, Entertainment & Recreation | 0 (0.0%) | 0 (0.0%) |
| Accommodation & Food Services | 349 (47.1%) | 392 (52.9%) |
| Public Administration | 149 (54.2%) | 126 (45.8%) |
| Total | 4,049 (51.4%) | 3,828 (48.6%) |
Education in Forest Park
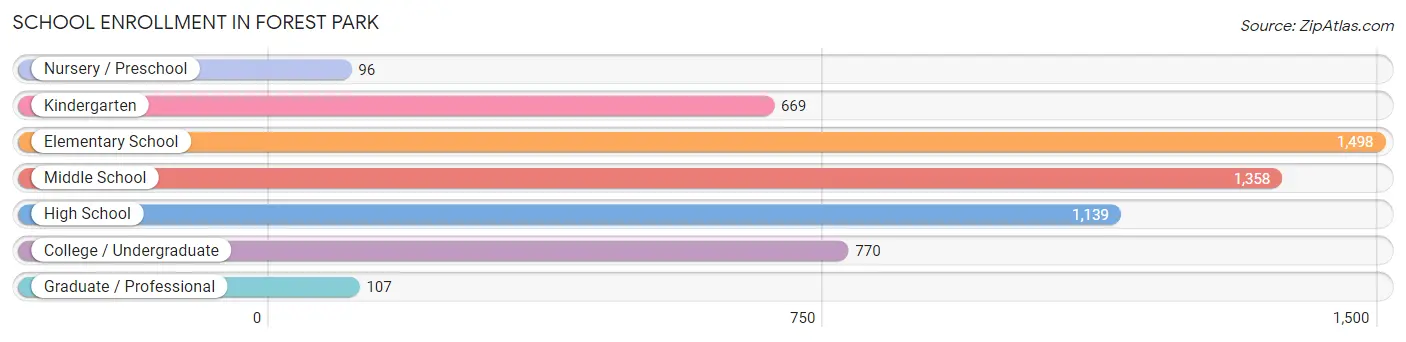
School Enrollment in Forest Park
The most common levels of schooling among the 5,637 students in Forest Park are elementary school (1,498 | 26.6%), middle school (1,358 | 24.1%), and high school (1,139 | 20.2%).
| School Level | # Students | % Students |
| Nursery / Preschool | 96 | 1.7% |
| Kindergarten | 669 | 11.9% |
| Elementary School | 1,498 | 26.6% |
| Middle School | 1,358 | 24.1% |
| High School | 1,139 | 20.2% |
| College / Undergraduate | 770 | 13.7% |
| Graduate / Professional | 107 | 1.9% |
| Total | 5,637 | 100.0% |
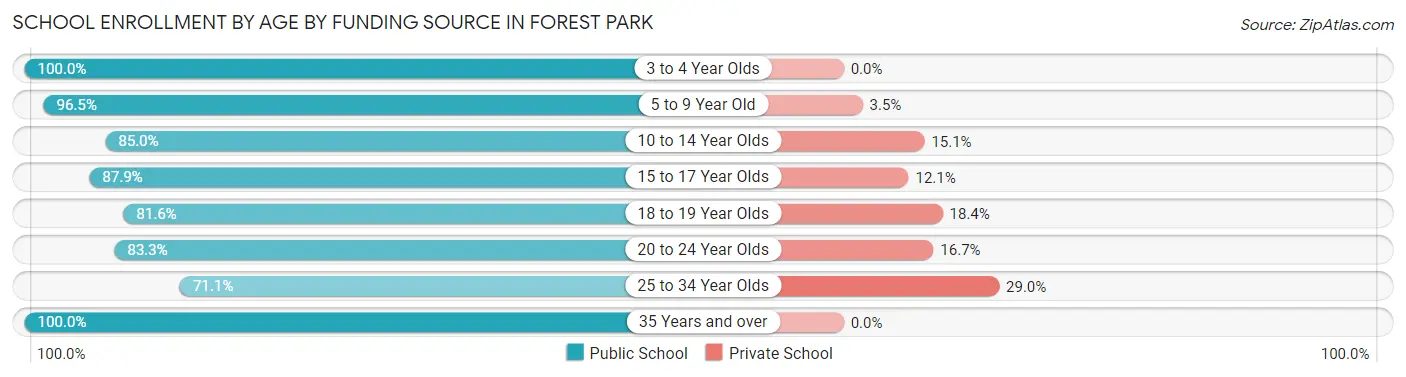
School Enrollment by Age by Funding Source in Forest Park
Out of a total of 5,637 students who are enrolled in schools in Forest Park, 603 (10.7%) attend a private institution, while the remaining 5,034 (89.3%) are enrolled in public schools. The age group of 25 to 34 year olds has the highest likelihood of being enrolled in private schools, with 77 (28.9% in the age bracket) enrolled. Conversely, the age group of 3 to 4 year olds has the lowest likelihood of being enrolled in a private school, with 113 (100.0% in the age bracket) attending a public institution.
| Age Bracket | Public School | Private School |
| 3 to 4 Year Olds | 113 (100.0%) | 0 (0.0%) |
| 5 to 9 Year Old | 1,995 (96.5%) | 73 (3.5%) |
| 10 to 14 Year Olds | 1,321 (85.0%) | 234 (15.0%) |
| 15 to 17 Year Olds | 677 (87.9%) | 93 (12.1%) |
| 18 to 19 Year Olds | 297 (81.6%) | 67 (18.4%) |
| 20 to 24 Year Olds | 299 (83.3%) | 60 (16.7%) |
| 25 to 34 Year Olds | 189 (71.1%) | 77 (28.9%) |
| 35 Years and over | 142 (100.0%) | 0 (0.0%) |
| Total | 5,034 (89.3%) | 603 (10.7%) |
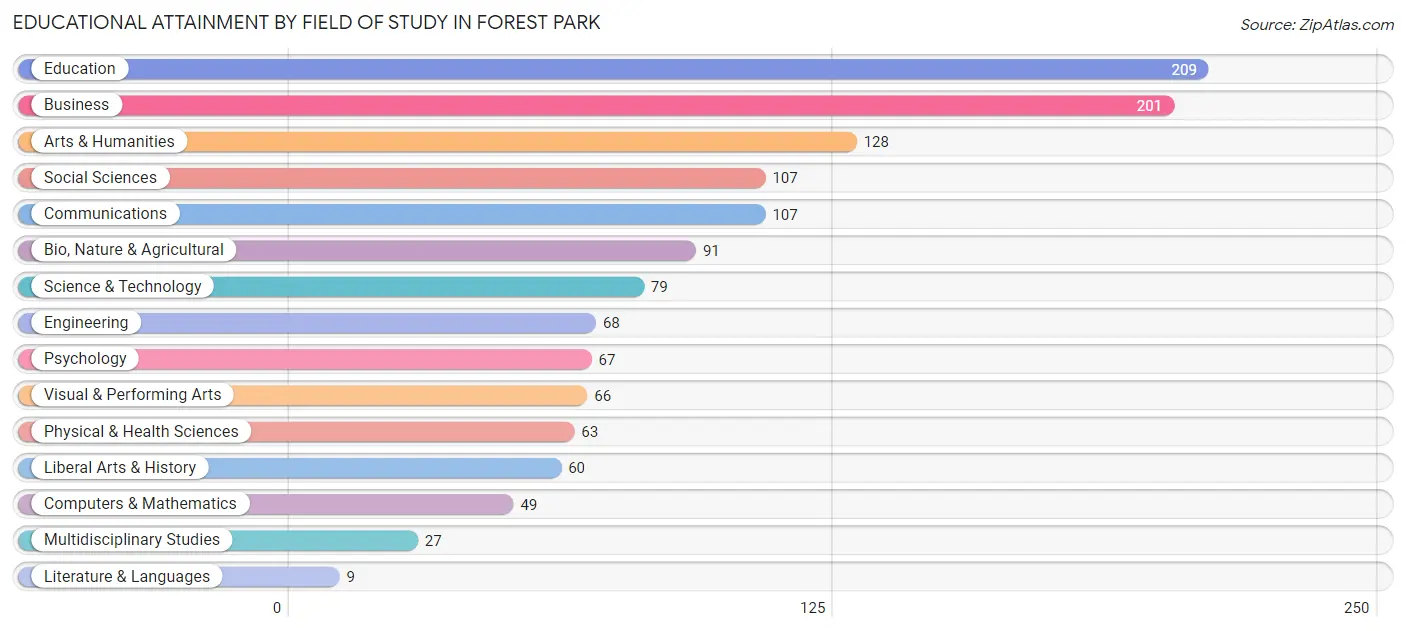
Educational Attainment by Field of Study in Forest Park
Education (209 | 15.7%), business (201 | 15.1%), arts & humanities (128 | 9.6%), social sciences (107 | 8.0%), and communications (107 | 8.0%) are the most common fields of study among 1,331 individuals in Forest Park who have obtained a bachelor's degree or higher.
| Field of Study | # Graduates | % Graduates |
| Computers & Mathematics | 49 | 3.7% |
| Bio, Nature & Agricultural | 91 | 6.8% |
| Physical & Health Sciences | 63 | 4.7% |
| Psychology | 67 | 5.0% |
| Social Sciences | 107 | 8.0% |
| Engineering | 68 | 5.1% |
| Multidisciplinary Studies | 27 | 2.0% |
| Science & Technology | 79 | 5.9% |
| Business | 201 | 15.1% |
| Education | 209 | 15.7% |
| Literature & Languages | 9 | 0.7% |
| Liberal Arts & History | 60 | 4.5% |
| Visual & Performing Arts | 66 | 5.0% |
| Communications | 107 | 8.0% |
| Arts & Humanities | 128 | 9.6% |
| Total | 1,331 | 100.0% |
Transportation & Commute in Forest Park
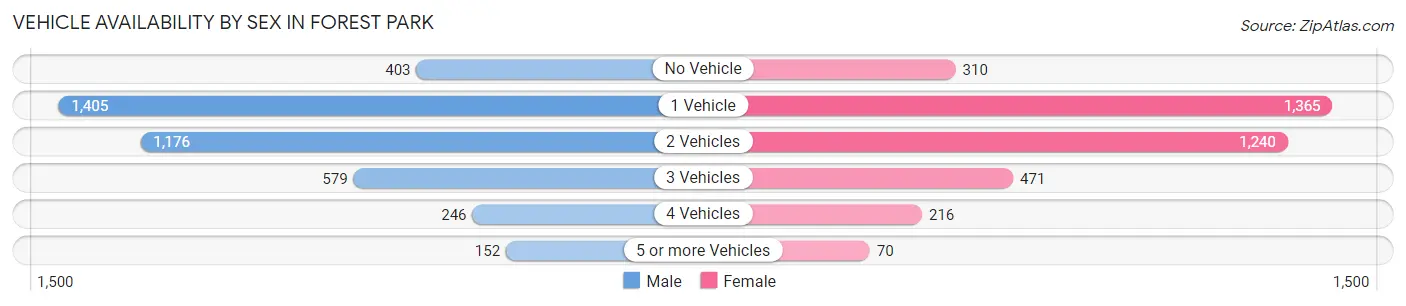
Vehicle Availability by Sex in Forest Park
The most prevalent vehicle ownership categories in Forest Park are males with 1 vehicle (1,405, accounting for 35.5%) and females with 1 vehicle (1,365, making up 38.3%).
| Vehicles Available | Male | Female |
| No Vehicle | 403 (10.2%) | 310 (8.4%) |
| 1 Vehicle | 1,405 (35.5%) | 1,365 (37.2%) |
| 2 Vehicles | 1,176 (29.7%) | 1,240 (33.8%) |
| 3 Vehicles | 579 (14.6%) | 471 (12.8%) |
| 4 Vehicles | 246 (6.2%) | 216 (5.9%) |
| 5 or more Vehicles | 152 (3.8%) | 70 (1.9%) |
| Total | 3,961 (100.0%) | 3,672 (100.0%) |
Commute Time in Forest Park
The most frequently occuring commute durations in Forest Park are 15 to 19 minutes (1,530 commuters, 20.8%), 20 to 24 minutes (1,162 commuters, 15.8%), and 30 to 34 minutes (1,131 commuters, 15.4%).
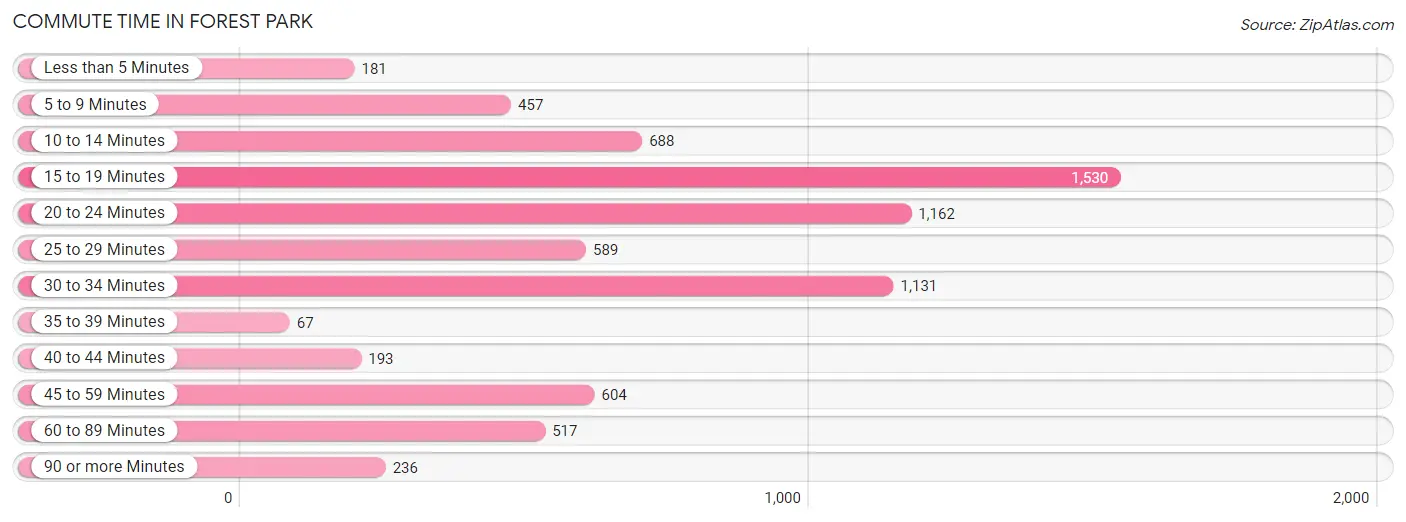
| Commute Time | # Commuters | % Commuters |
| Less than 5 Minutes | 181 | 2.5% |
| 5 to 9 Minutes | 457 | 6.2% |
| 10 to 14 Minutes | 688 | 9.3% |
| 15 to 19 Minutes | 1,530 | 20.8% |
| 20 to 24 Minutes | 1,162 | 15.8% |
| 25 to 29 Minutes | 589 | 8.0% |
| 30 to 34 Minutes | 1,131 | 15.4% |
| 35 to 39 Minutes | 67 | 0.9% |
| 40 to 44 Minutes | 193 | 2.6% |
| 45 to 59 Minutes | 604 | 8.2% |
| 60 to 89 Minutes | 517 | 7.0% |
| 90 or more Minutes | 236 | 3.2% |
Commute Time by Sex in Forest Park
The most common commute times in Forest Park are 15 to 19 minutes (888 commuters, 23.5%) for males and 20 to 24 minutes (760 commuters, 21.3%) for females.
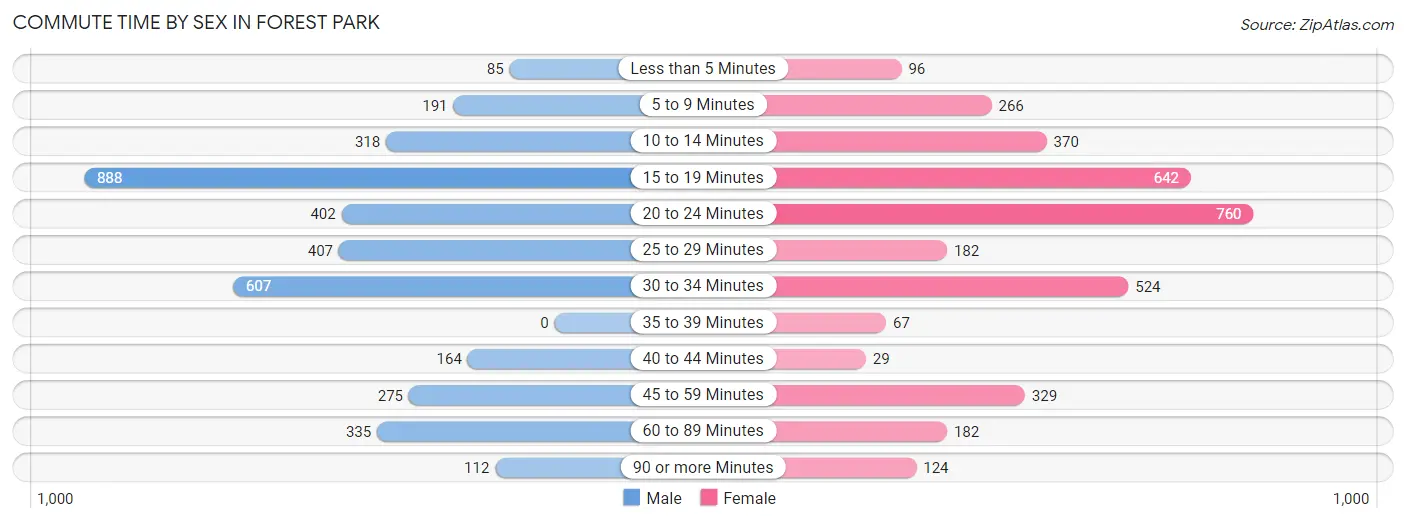
| Commute Time | Male | Female |
| Less than 5 Minutes | 85 (2.2%) | 96 (2.7%) |
| 5 to 9 Minutes | 191 (5.1%) | 266 (7.4%) |
| 10 to 14 Minutes | 318 (8.4%) | 370 (10.4%) |
| 15 to 19 Minutes | 888 (23.5%) | 642 (18.0%) |
| 20 to 24 Minutes | 402 (10.6%) | 760 (21.3%) |
| 25 to 29 Minutes | 407 (10.8%) | 182 (5.1%) |
| 30 to 34 Minutes | 607 (16.0%) | 524 (14.7%) |
| 35 to 39 Minutes | 0 (0.0%) | 67 (1.9%) |
| 40 to 44 Minutes | 164 (4.3%) | 29 (0.8%) |
| 45 to 59 Minutes | 275 (7.3%) | 329 (9.2%) |
| 60 to 89 Minutes | 335 (8.8%) | 182 (5.1%) |
| 90 or more Minutes | 112 (3.0%) | 124 (3.5%) |
Time of Departure to Work by Sex in Forest Park
The most frequent times of departure to work in Forest Park are 12:00 PM to 3:59 PM (646, 17.1%) for males and 12:00 PM to 3:59 PM (639, 17.9%) for females.
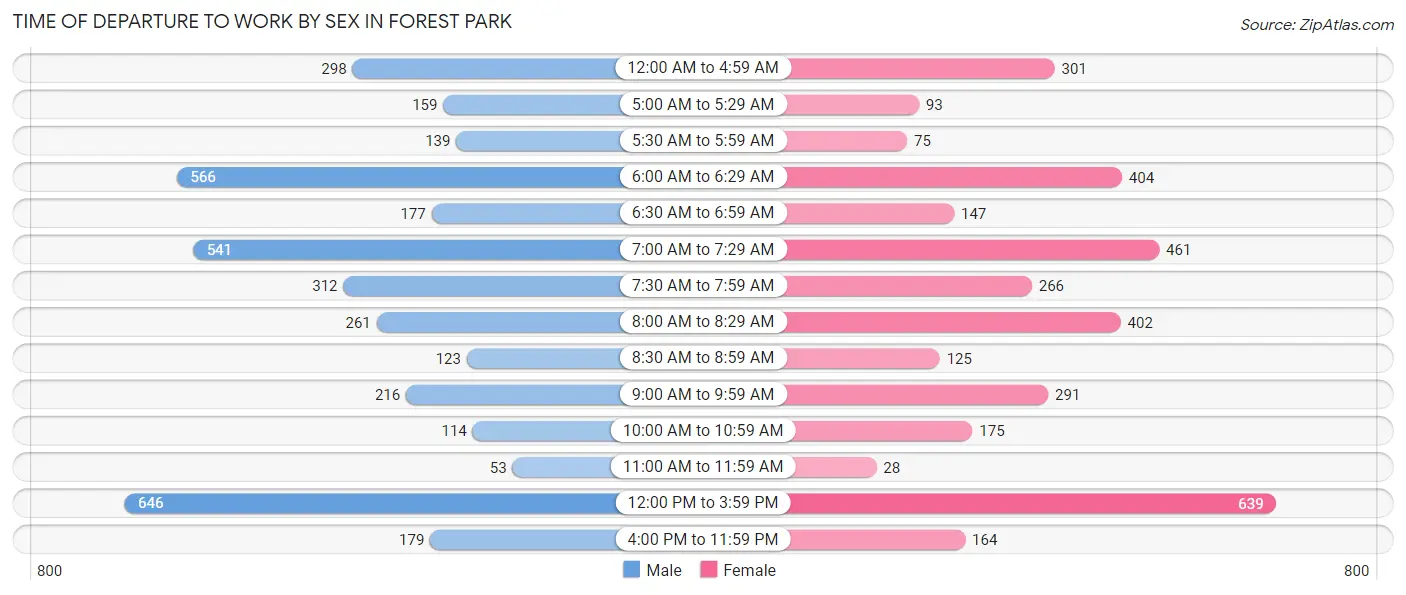
| Time of Departure | Male | Female |
| 12:00 AM to 4:59 AM | 298 (7.9%) | 301 (8.4%) |
| 5:00 AM to 5:29 AM | 159 (4.2%) | 93 (2.6%) |
| 5:30 AM to 5:59 AM | 139 (3.7%) | 75 (2.1%) |
| 6:00 AM to 6:29 AM | 566 (15.0%) | 404 (11.3%) |
| 6:30 AM to 6:59 AM | 177 (4.7%) | 147 (4.1%) |
| 7:00 AM to 7:29 AM | 541 (14.3%) | 461 (12.9%) |
| 7:30 AM to 7:59 AM | 312 (8.3%) | 266 (7.4%) |
| 8:00 AM to 8:29 AM | 261 (6.9%) | 402 (11.3%) |
| 8:30 AM to 8:59 AM | 123 (3.3%) | 125 (3.5%) |
| 9:00 AM to 9:59 AM | 216 (5.7%) | 291 (8.2%) |
| 10:00 AM to 10:59 AM | 114 (3.0%) | 175 (4.9%) |
| 11:00 AM to 11:59 AM | 53 (1.4%) | 28 (0.8%) |
| 12:00 PM to 3:59 PM | 646 (17.1%) | 639 (17.9%) |
| 4:00 PM to 11:59 PM | 179 (4.7%) | 164 (4.6%) |
| Total | 3,784 (100.0%) | 3,571 (100.0%) |
Housing Occupancy in Forest Park
Occupancy by Ownership in Forest Park
Of the total 7,021 dwellings in Forest Park, owner-occupied units account for 2,528 (36.0%), while renter-occupied units make up 4,493 (64.0%).
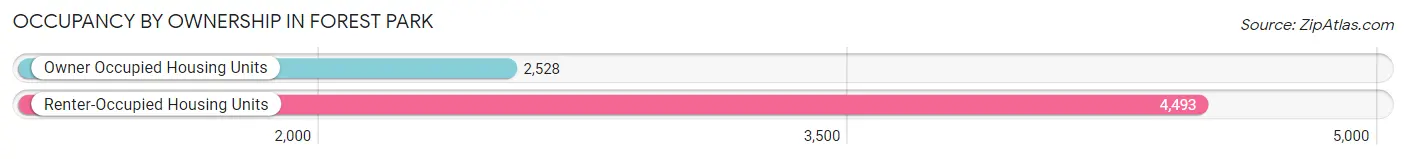
| Occupancy | # Housing Units | % Housing Units |
| Owner Occupied Housing Units | 2,528 | 36.0% |
| Renter-Occupied Housing Units | 4,493 | 64.0% |
| Total Occupied Housing Units | 7,021 | 100.0% |
Occupancy by Household Size in Forest Park
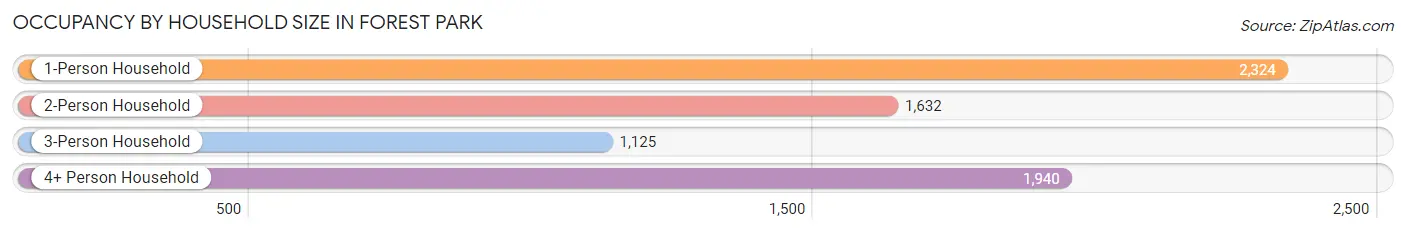
| Household Size | # Housing Units | % Housing Units |
| 1-Person Household | 2,324 | 33.1% |
| 2-Person Household | 1,632 | 23.2% |
| 3-Person Household | 1,125 | 16.0% |
| 4+ Person Household | 1,940 | 27.6% |
| Total Housing Units | 7,021 | 100.0% |
Occupancy by Ownership by Household Size in Forest Park
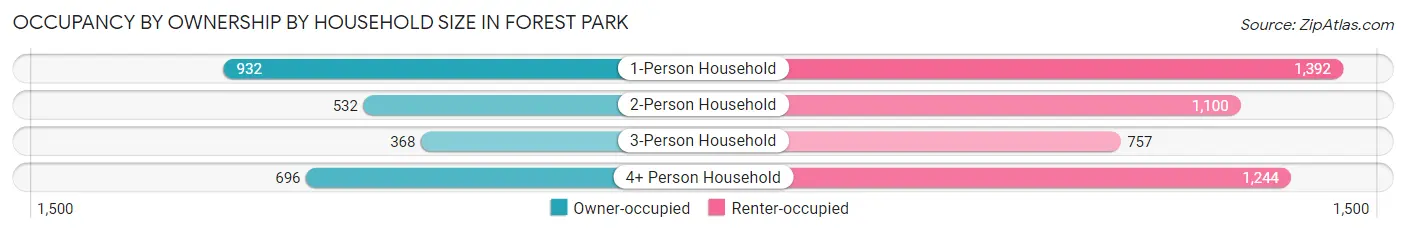
| Household Size | Owner-occupied | Renter-occupied |
| 1-Person Household | 932 (40.1%) | 1,392 (59.9%) |
| 2-Person Household | 532 (32.6%) | 1,100 (67.4%) |
| 3-Person Household | 368 (32.7%) | 757 (67.3%) |
| 4+ Person Household | 696 (35.9%) | 1,244 (64.1%) |
| Total Housing Units | 2,528 (36.0%) | 4,493 (64.0%) |
Occupancy by Educational Attainment in Forest Park
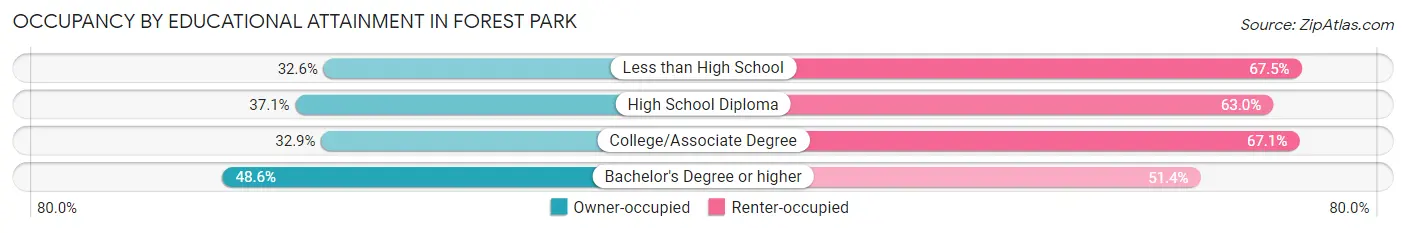
| Household Size | Owner-occupied | Renter-occupied |
| Less than High School | 444 (32.6%) | 920 (67.4%) |
| High School Diploma | 898 (37.0%) | 1,526 (62.9%) |
| College/Associate Degree | 809 (32.9%) | 1,648 (67.1%) |
| Bachelor's Degree or higher | 377 (48.6%) | 399 (51.4%) |
Occupancy by Age of Householder in Forest Park
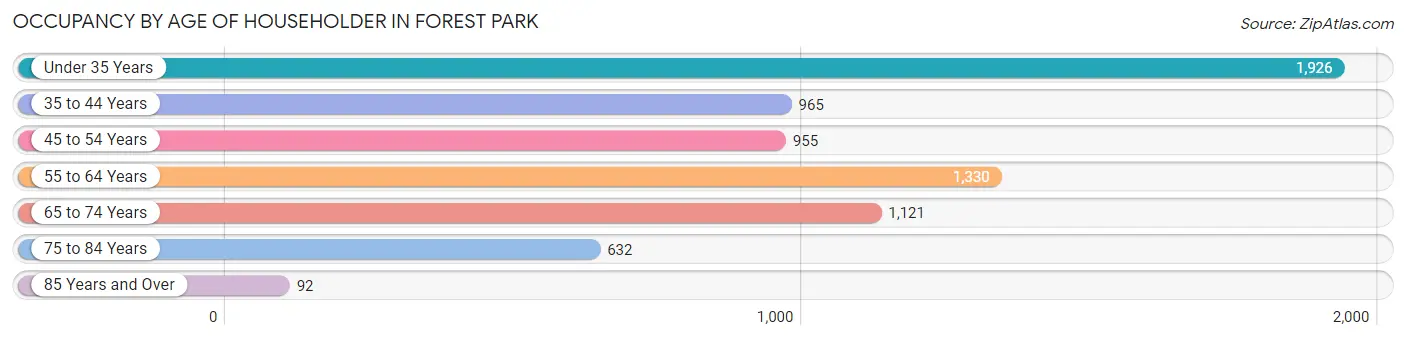
| Age Bracket | # Households | % Households |
| Under 35 Years | 1,926 | 27.4% |
| 35 to 44 Years | 965 | 13.7% |
| 45 to 54 Years | 955 | 13.6% |
| 55 to 64 Years | 1,330 | 18.9% |
| 65 to 74 Years | 1,121 | 16.0% |
| 75 to 84 Years | 632 | 9.0% |
| 85 Years and Over | 92 | 1.3% |
| Total | 7,021 | 100.0% |
Housing Finances in Forest Park
Median Income by Occupancy in Forest Park
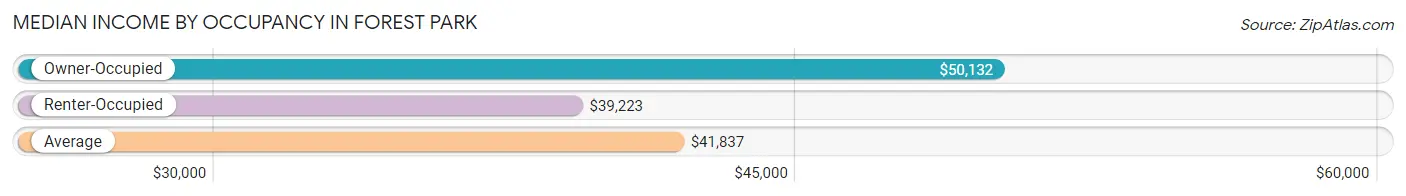
| Occupancy Type | # Households | Median Income |
| Owner-Occupied | 2,528 (36.0%) | $50,132 |
| Renter-Occupied | 4,493 (64.0%) | $39,223 |
| Average | 7,021 (100.0%) | $41,837 |
Occupancy by Householder Income Bracket in Forest Park
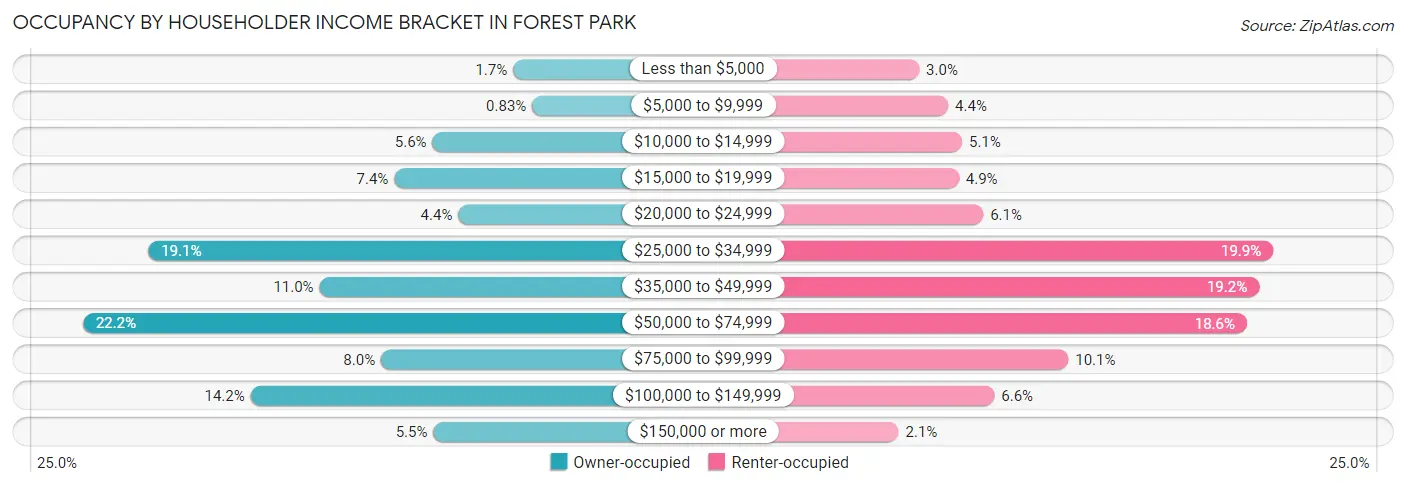
| Income Bracket | Owner-occupied | Renter-occupied |
| Less than $5,000 | 44 (1.7%) | 136 (3.0%) |
| $5,000 to $9,999 | 21 (0.8%) | 198 (4.4%) |
| $10,000 to $14,999 | 141 (5.6%) | 228 (5.1%) |
| $15,000 to $19,999 | 187 (7.4%) | 221 (4.9%) |
| $20,000 to $24,999 | 110 (4.3%) | 273 (6.1%) |
| $25,000 to $34,999 | 483 (19.1%) | 893 (19.9%) |
| $35,000 to $49,999 | 277 (11.0%) | 863 (19.2%) |
| $50,000 to $74,999 | 562 (22.2%) | 837 (18.6%) |
| $75,000 to $99,999 | 203 (8.0%) | 455 (10.1%) |
| $100,000 to $149,999 | 360 (14.2%) | 297 (6.6%) |
| $150,000 or more | 140 (5.5%) | 92 (2.1%) |
| Total | 2,528 (100.0%) | 4,493 (100.0%) |
Monthly Housing Cost Tiers in Forest Park
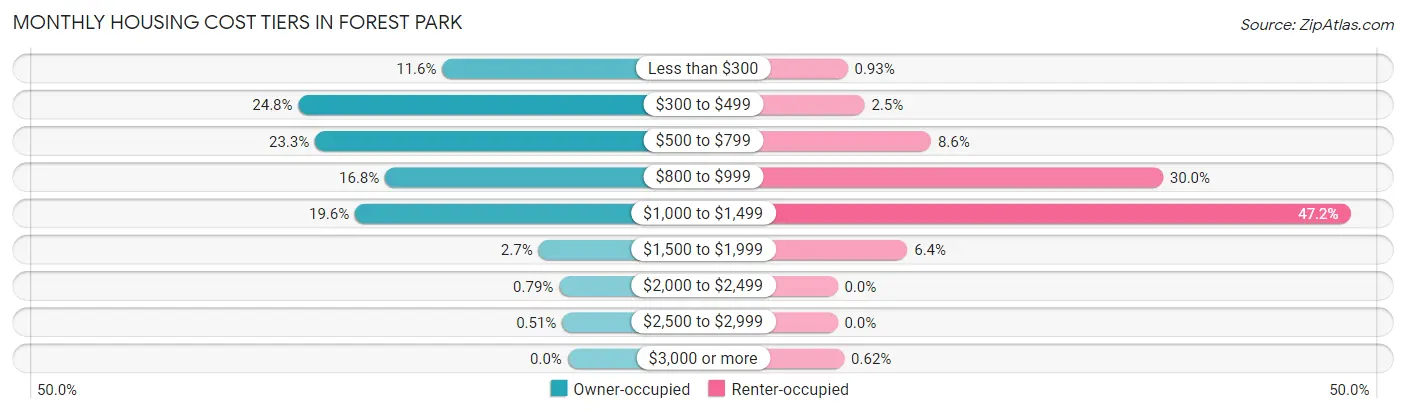
| Monthly Cost | Owner-occupied | Renter-occupied |
| Less than $300 | 292 (11.6%) | 42 (0.9%) |
| $300 to $499 | 627 (24.8%) | 112 (2.5%) |
| $500 to $799 | 588 (23.3%) | 387 (8.6%) |
| $800 to $999 | 425 (16.8%) | 1,346 (30.0%) |
| $1,000 to $1,499 | 495 (19.6%) | 2,121 (47.2%) |
| $1,500 to $1,999 | 68 (2.7%) | 289 (6.4%) |
| $2,000 to $2,499 | 20 (0.8%) | 0 (0.0%) |
| $2,500 to $2,999 | 13 (0.5%) | 0 (0.0%) |
| $3,000 or more | 0 (0.0%) | 28 (0.6%) |
| Total | 2,528 (100.0%) | 4,493 (100.0%) |
Physical Housing Characteristics in Forest Park
Housing Structures in Forest Park
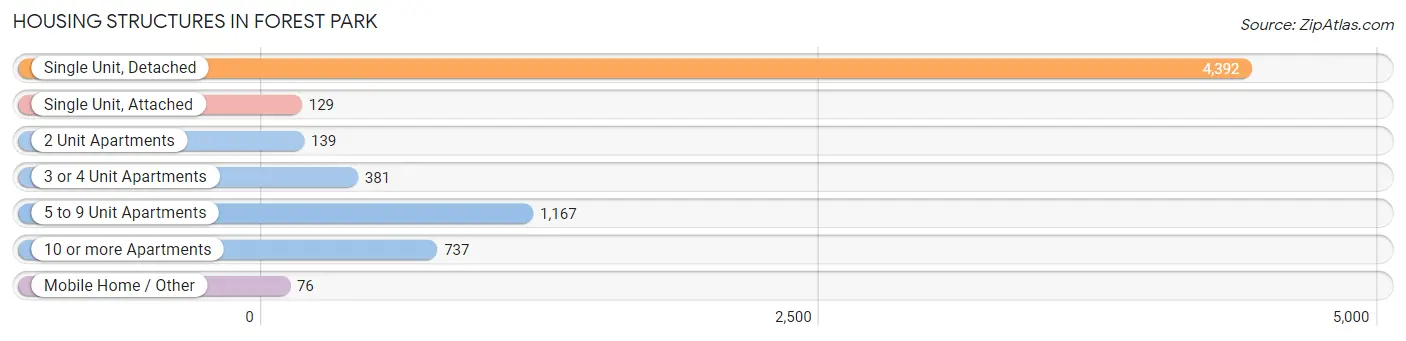
| Structure Type | # Housing Units | % Housing Units |
| Single Unit, Detached | 4,392 | 62.6% |
| Single Unit, Attached | 129 | 1.8% |
| 2 Unit Apartments | 139 | 2.0% |
| 3 or 4 Unit Apartments | 381 | 5.4% |
| 5 to 9 Unit Apartments | 1,167 | 16.6% |
| 10 or more Apartments | 737 | 10.5% |
| Mobile Home / Other | 76 | 1.1% |
| Total | 7,021 | 100.0% |
Housing Structures by Occupancy in Forest Park
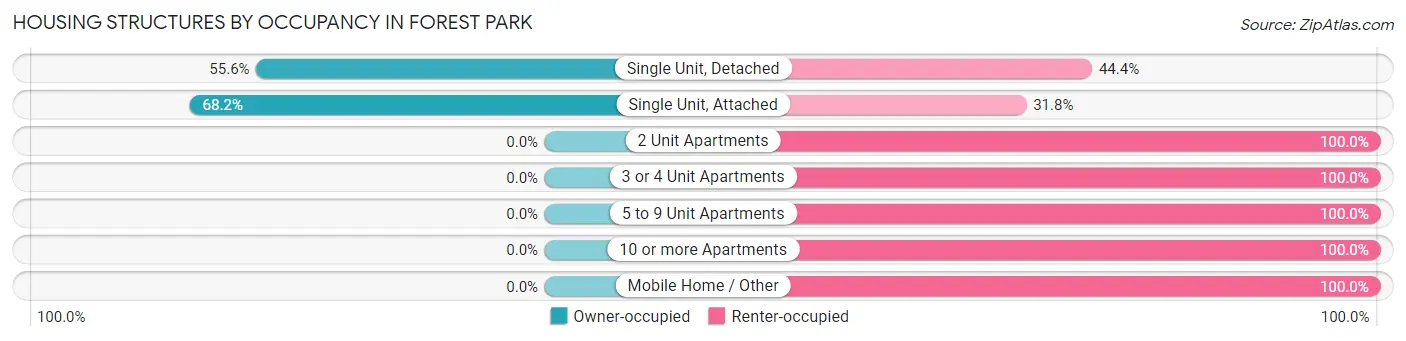
| Structure Type | Owner-occupied | Renter-occupied |
| Single Unit, Detached | 2,440 (55.6%) | 1,952 (44.4%) |
| Single Unit, Attached | 88 (68.2%) | 41 (31.8%) |
| 2 Unit Apartments | 0 (0.0%) | 139 (100.0%) |
| 3 or 4 Unit Apartments | 0 (0.0%) | 381 (100.0%) |
| 5 to 9 Unit Apartments | 0 (0.0%) | 1,167 (100.0%) |
| 10 or more Apartments | 0 (0.0%) | 737 (100.0%) |
| Mobile Home / Other | 0 (0.0%) | 76 (100.0%) |
| Total | 2,528 (36.0%) | 4,493 (64.0%) |
Housing Structures by Number of Rooms in Forest Park
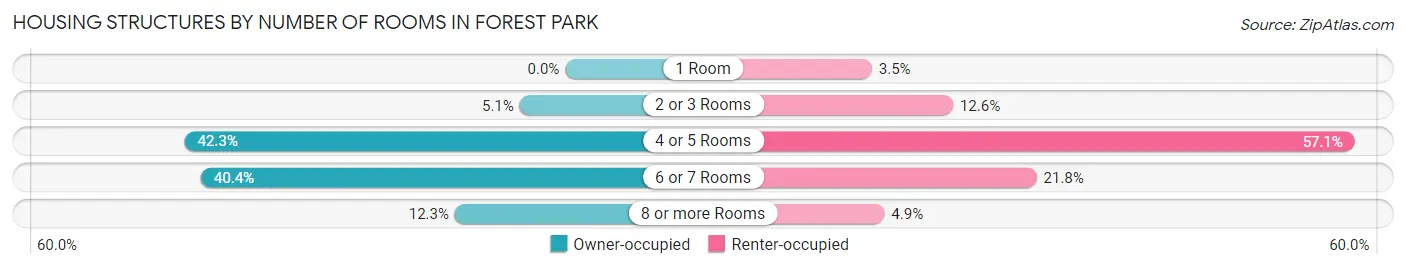
| Number of Rooms | Owner-occupied | Renter-occupied |
| 1 Room | 0 (0.0%) | 159 (3.5%) |
| 2 or 3 Rooms | 128 (5.1%) | 564 (12.6%) |
| 4 or 5 Rooms | 1,068 (42.2%) | 2,567 (57.1%) |
| 6 or 7 Rooms | 1,022 (40.4%) | 981 (21.8%) |
| 8 or more Rooms | 310 (12.3%) | 222 (4.9%) |
| Total | 2,528 (100.0%) | 4,493 (100.0%) |
Housing Structure by Heating Type in Forest Park
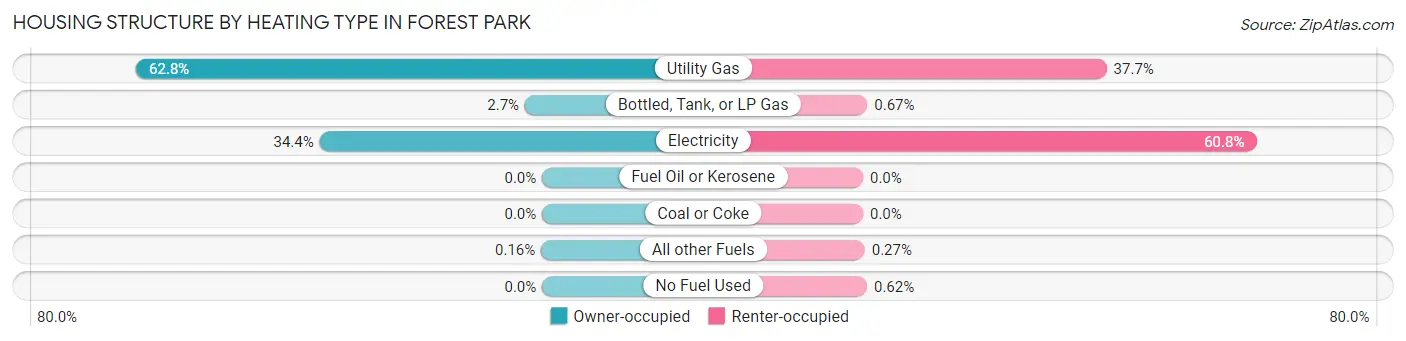
| Heating Type | Owner-occupied | Renter-occupied |
| Utility Gas | 1,587 (62.8%) | 1,692 (37.7%) |
| Bottled, Tank, or LP Gas | 67 (2.6%) | 30 (0.7%) |
| Electricity | 870 (34.4%) | 2,731 (60.8%) |
| Fuel Oil or Kerosene | 0 (0.0%) | 0 (0.0%) |
| Coal or Coke | 0 (0.0%) | 0 (0.0%) |
| All other Fuels | 4 (0.2%) | 12 (0.3%) |
| No Fuel Used | 0 (0.0%) | 28 (0.6%) |
| Total | 2,528 (100.0%) | 4,493 (100.0%) |
Household Vehicle Usage in Forest Park
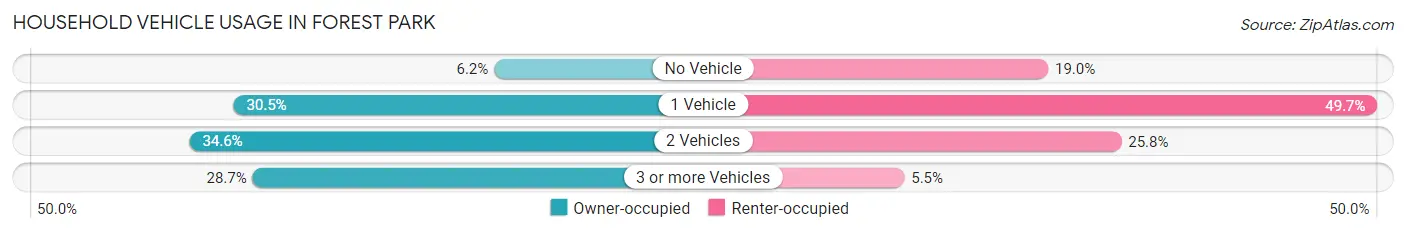
| Vehicles per Household | Owner-occupied | Renter-occupied |
| No Vehicle | 156 (6.2%) | 852 (19.0%) |
| 1 Vehicle | 771 (30.5%) | 2,233 (49.7%) |
| 2 Vehicles | 875 (34.6%) | 1,159 (25.8%) |
| 3 or more Vehicles | 726 (28.7%) | 249 (5.5%) |
| Total | 2,528 (100.0%) | 4,493 (100.0%) |
Real Estate & Mortgages in Forest Park
Real Estate and Mortgage Overview in Forest Park
| Characteristic | Without Mortgage | With Mortgage |
| Housing Units | 1,239 | 1,289 |
| Median Property Value | $97,200 | $94,100 |
| Median Household Income | $42,631 | $44 |
| Monthly Housing Costs | $439 | $0 |
| Real Estate Taxes | $996 | $111 |
Property Value by Mortgage Status in Forest Park
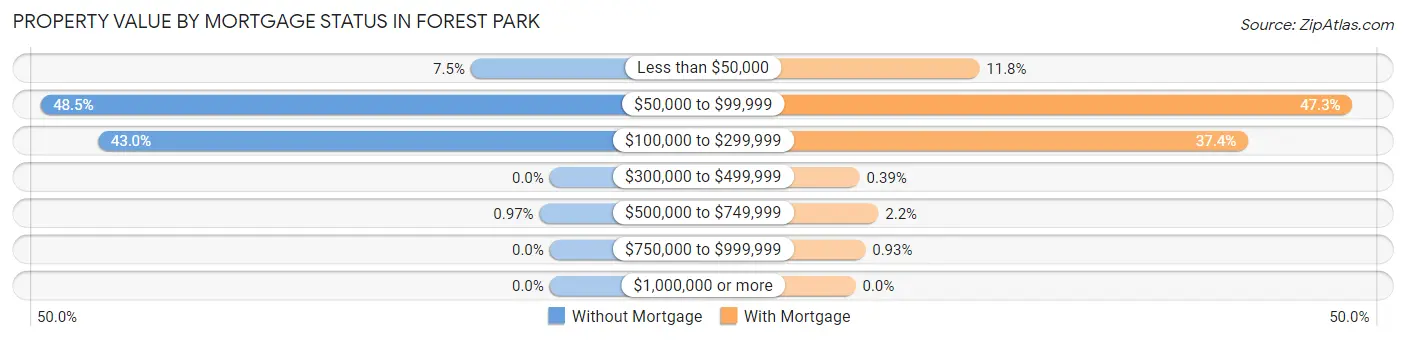
| Property Value | Without Mortgage | With Mortgage |
| Less than $50,000 | 93 (7.5%) | 152 (11.8%) |
| $50,000 to $99,999 | 601 (48.5%) | 610 (47.3%) |
| $100,000 to $299,999 | 533 (43.0%) | 482 (37.4%) |
| $300,000 to $499,999 | 0 (0.0%) | 5 (0.4%) |
| $500,000 to $749,999 | 12 (1.0%) | 28 (2.2%) |
| $750,000 to $999,999 | 0 (0.0%) | 12 (0.9%) |
| $1,000,000 or more | 0 (0.0%) | 0 (0.0%) |
| Total | 1,239 (100.0%) | 1,289 (100.0%) |
Household Income by Mortgage Status in Forest Park
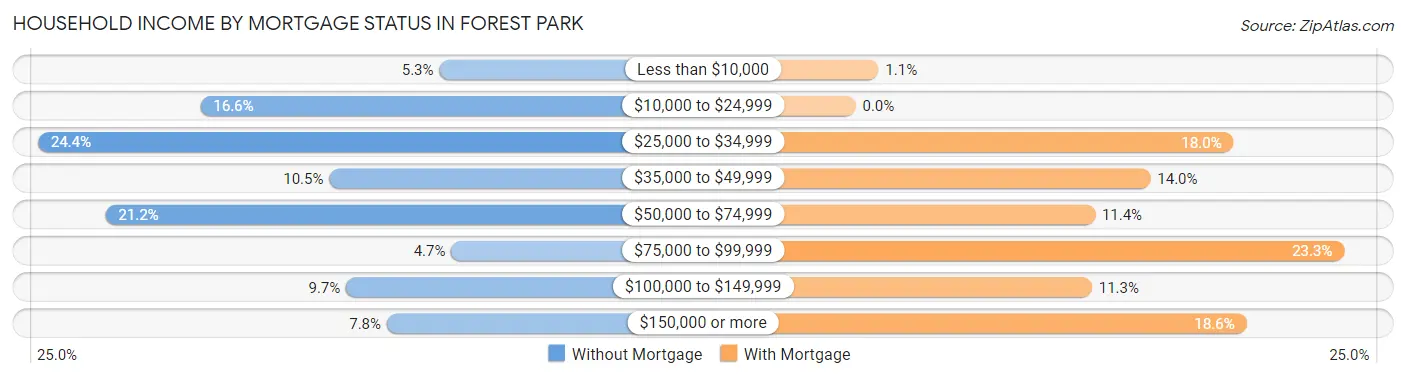
| Household Income | Without Mortgage | With Mortgage |
| Less than $10,000 | 65 (5.2%) | 14 (1.1%) |
| $10,000 to $24,999 | 206 (16.6%) | 0 (0.0%) |
| $25,000 to $34,999 | 302 (24.4%) | 232 (18.0%) |
| $35,000 to $49,999 | 130 (10.5%) | 181 (14.0%) |
| $50,000 to $74,999 | 262 (21.1%) | 147 (11.4%) |
| $75,000 to $99,999 | 58 (4.7%) | 300 (23.3%) |
| $100,000 to $149,999 | 120 (9.7%) | 145 (11.3%) |
| $150,000 or more | 96 (7.7%) | 240 (18.6%) |
| Total | 1,239 (100.0%) | 1,289 (100.0%) |
Property Value to Household Income Ratio in Forest Park
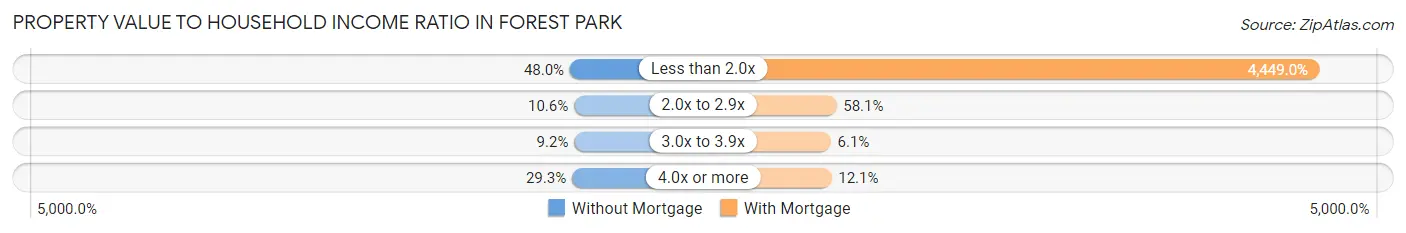
| Value-to-Income Ratio | Without Mortgage | With Mortgage |
| Less than 2.0x | 595 (48.0%) | 57,347 (4,448.9%) |
| 2.0x to 2.9x | 131 (10.6%) | 749 (58.1%) |
| 3.0x to 3.9x | 114 (9.2%) | 79 (6.1%) |
| 4.0x or more | 363 (29.3%) | 156 (12.1%) |
| Total | 1,239 (100.0%) | 1,289 (100.0%) |
Real Estate Taxes by Mortgage Status in Forest Park
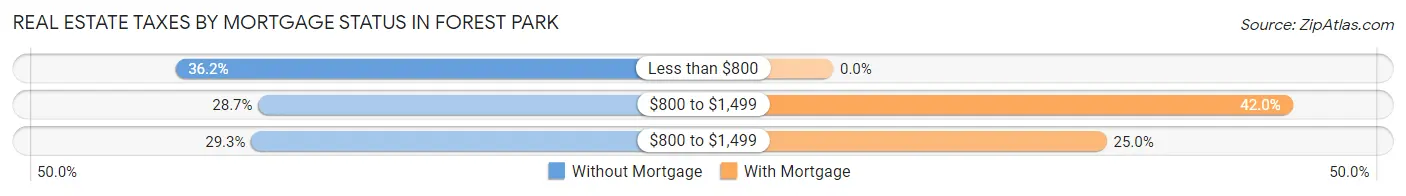
| Property Taxes | Without Mortgage | With Mortgage |
| Less than $800 | 449 (36.2%) | 0 (0.0%) |
| $800 to $1,499 | 355 (28.6%) | 541 (42.0%) |
| $800 to $1,499 | 363 (29.3%) | 322 (25.0%) |
| Total | 1,239 (100.0%) | 1,289 (100.0%) |
Health & Disability in Forest Park
Health Insurance Coverage by Age in Forest Park
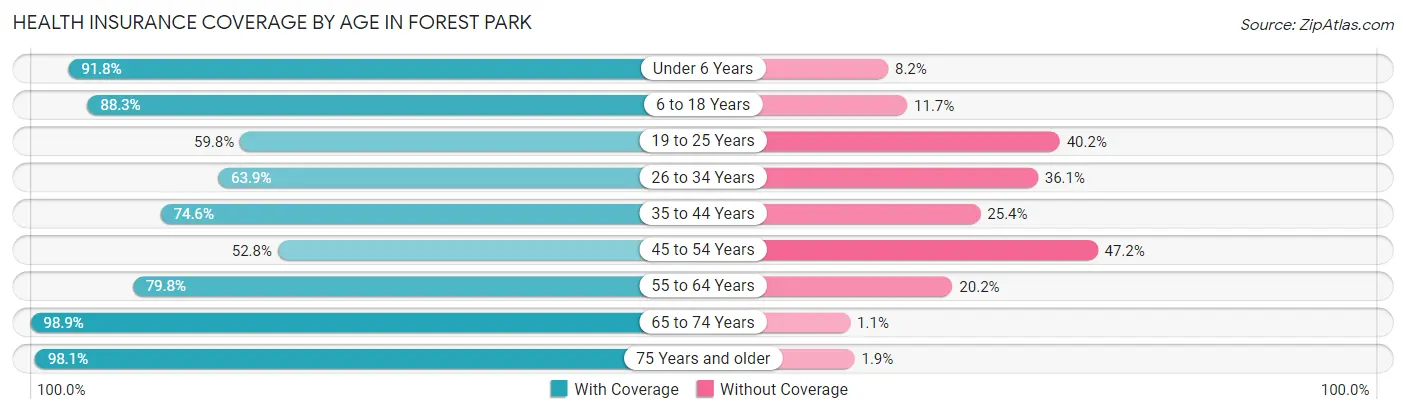
| Age Bracket | With Coverage | Without Coverage |
| Under 6 Years | 1,351 (91.8%) | 120 (8.2%) |
| 6 to 18 Years | 4,040 (88.3%) | 536 (11.7%) |
| 19 to 25 Years | 1,042 (59.8%) | 700 (40.2%) |
| 26 to 34 Years | 1,772 (63.9%) | 1,000 (36.1%) |
| 35 to 44 Years | 1,839 (74.6%) | 625 (25.4%) |
| 45 to 54 Years | 977 (52.8%) | 874 (47.2%) |
| 55 to 64 Years | 1,457 (79.8%) | 368 (20.2%) |
| 65 to 74 Years | 1,448 (98.9%) | 16 (1.1%) |
| 75 Years and older | 1,026 (98.1%) | 20 (1.9%) |
| Total | 14,952 (77.8%) | 4,259 (22.2%) |
Health Insurance Coverage by Citizenship Status in Forest Park
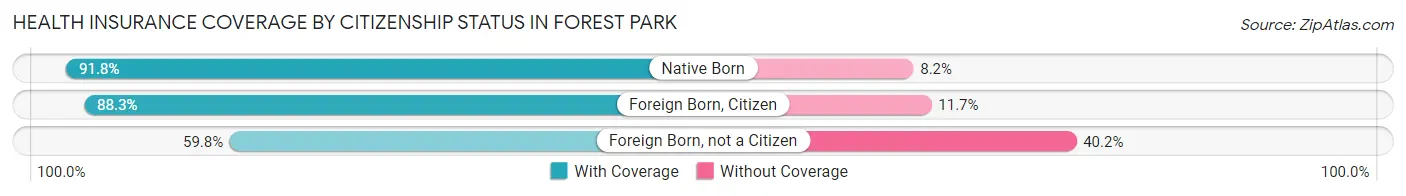
| Citizenship Status | With Coverage | Without Coverage |
| Native Born | 1,351 (91.8%) | 120 (8.2%) |
| Foreign Born, Citizen | 4,040 (88.3%) | 536 (11.7%) |
| Foreign Born, not a Citizen | 1,042 (59.8%) | 700 (40.2%) |
Health Insurance Coverage by Household Income in Forest Park
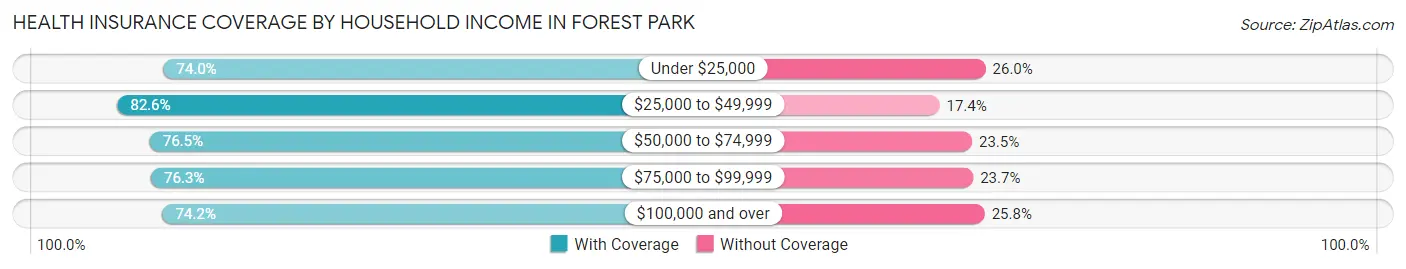
| Household Income | With Coverage | Without Coverage |
| Under $25,000 | 2,173 (74.0%) | 764 (26.0%) |
| $25,000 to $49,999 | 5,630 (82.6%) | 1,184 (17.4%) |
| $50,000 to $74,999 | 2,860 (76.5%) | 877 (23.5%) |
| $75,000 to $99,999 | 1,681 (76.3%) | 522 (23.7%) |
| $100,000 and over | 2,586 (74.2%) | 901 (25.8%) |
Public vs Private Health Insurance Coverage by Age in Forest Park
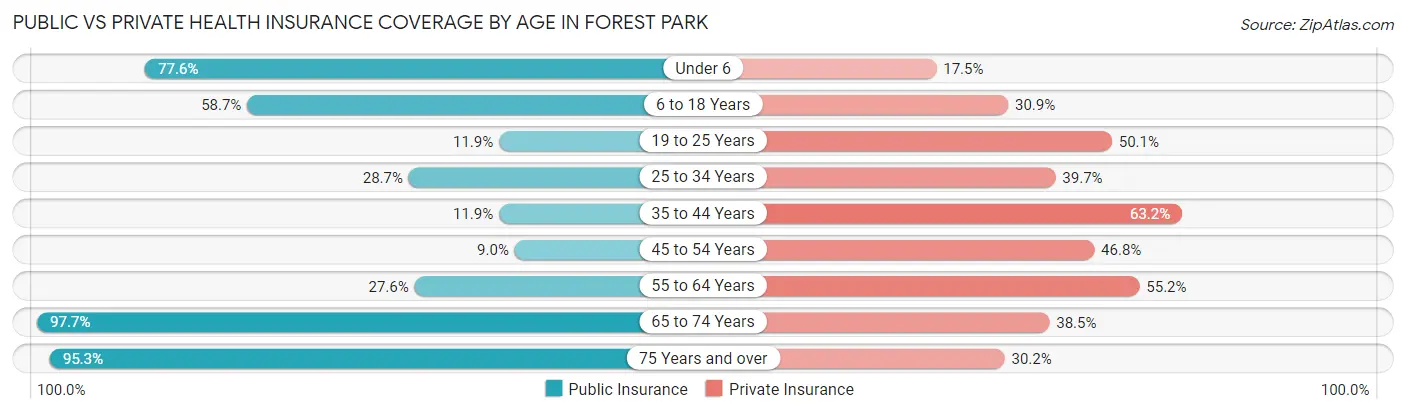
| Age Bracket | Public Insurance | Private Insurance |
| Under 6 | 1,142 (77.6%) | 258 (17.5%) |
| 6 to 18 Years | 2,685 (58.7%) | 1,412 (30.9%) |
| 19 to 25 Years | 208 (11.9%) | 873 (50.1%) |
| 25 to 34 Years | 795 (28.7%) | 1,099 (39.7%) |
| 35 to 44 Years | 294 (11.9%) | 1,556 (63.1%) |
| 45 to 54 Years | 167 (9.0%) | 867 (46.8%) |
| 55 to 64 Years | 504 (27.6%) | 1,008 (55.2%) |
| 65 to 74 Years | 1,430 (97.7%) | 564 (38.5%) |
| 75 Years and over | 997 (95.3%) | 316 (30.2%) |
| Total | 8,222 (42.8%) | 7,953 (41.4%) |
Disability Status by Sex by Age in Forest Park
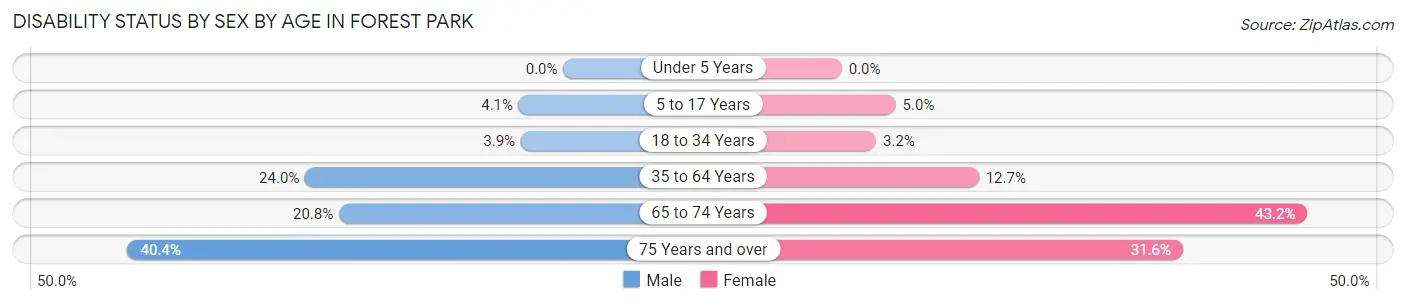
| Age Bracket | Male | Female |
| Under 5 Years | 0 (0.0%) | 0 (0.0%) |
| 5 to 17 Years | 99 (4.1%) | 106 (5.0%) |
| 18 to 34 Years | 97 (3.9%) | 76 (3.2%) |
| 35 to 64 Years | 755 (24.0%) | 380 (12.7%) |
| 65 to 74 Years | 112 (20.8%) | 400 (43.2%) |
| 75 Years and over | 184 (40.4%) | 187 (31.6%) |
Disability Class by Sex by Age in Forest Park
Disability Class: Hearing Difficulty
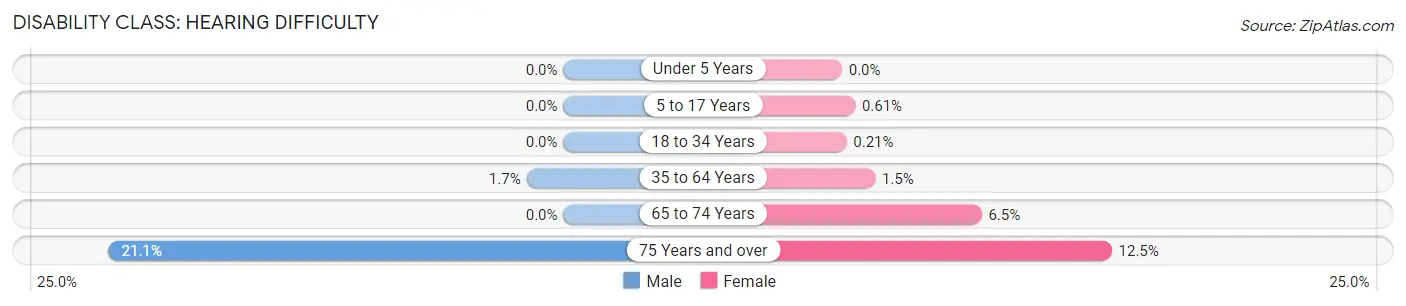
| Age Bracket | Male | Female |
| Under 5 Years | 0 (0.0%) | 0 (0.0%) |
| 5 to 17 Years | 0 (0.0%) | 13 (0.6%) |
| 18 to 34 Years | 0 (0.0%) | 5 (0.2%) |
| 35 to 64 Years | 54 (1.7%) | 46 (1.5%) |
| 65 to 74 Years | 0 (0.0%) | 60 (6.5%) |
| 75 Years and over | 96 (21.1%) | 74 (12.5%) |
Disability Class: Vision Difficulty
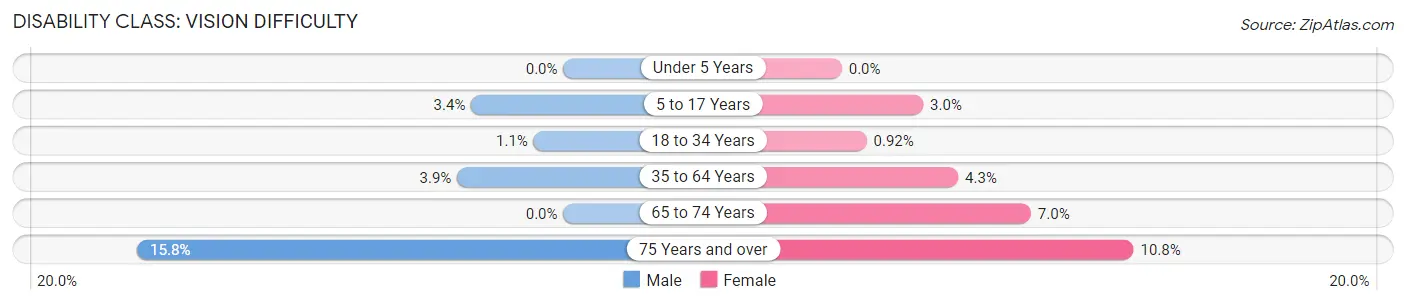
| Age Bracket | Male | Female |
| Under 5 Years | 0 (0.0%) | 0 (0.0%) |
| 5 to 17 Years | 82 (3.4%) | 64 (3.0%) |
| 18 to 34 Years | 27 (1.1%) | 22 (0.9%) |
| 35 to 64 Years | 124 (3.9%) | 129 (4.3%) |
| 65 to 74 Years | 0 (0.0%) | 65 (7.0%) |
| 75 Years and over | 72 (15.8%) | 64 (10.8%) |
Disability Class: Cognitive Difficulty
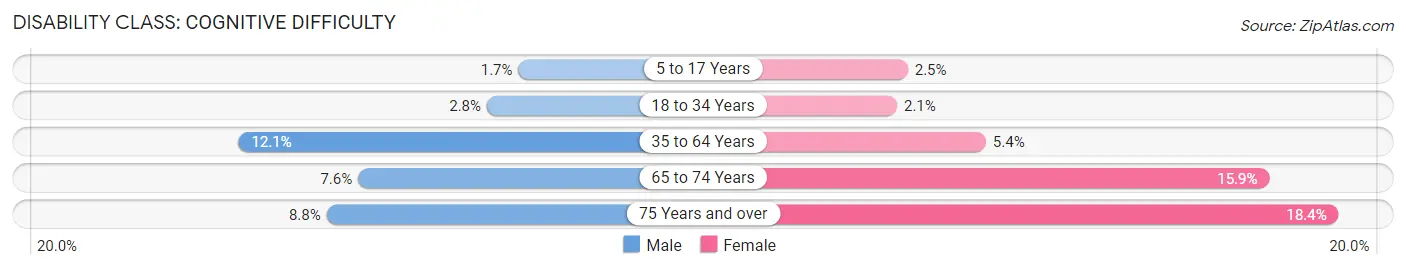
| Age Bracket | Male | Female |
| 5 to 17 Years | 40 (1.7%) | 52 (2.5%) |
| 18 to 34 Years | 70 (2.8%) | 49 (2.1%) |
| 35 to 64 Years | 380 (12.1%) | 160 (5.3%) |
| 65 to 74 Years | 41 (7.6%) | 147 (15.9%) |
| 75 Years and over | 40 (8.8%) | 109 (18.4%) |
Disability Class: Ambulatory Difficulty
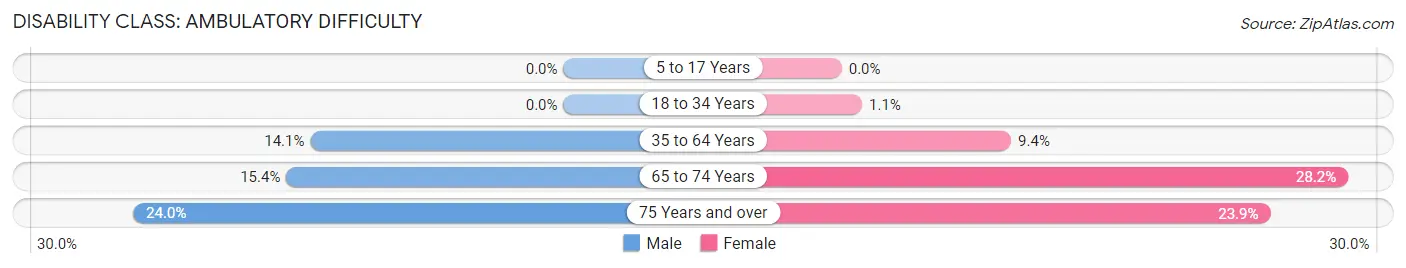
| Age Bracket | Male | Female |
| 5 to 17 Years | 0 (0.0%) | 0 (0.0%) |
| 18 to 34 Years | 0 (0.0%) | 27 (1.1%) |
| 35 to 64 Years | 444 (14.1%) | 282 (9.4%) |
| 65 to 74 Years | 83 (15.4%) | 261 (28.2%) |
| 75 Years and over | 109 (24.0%) | 141 (23.9%) |
Disability Class: Self-Care Difficulty
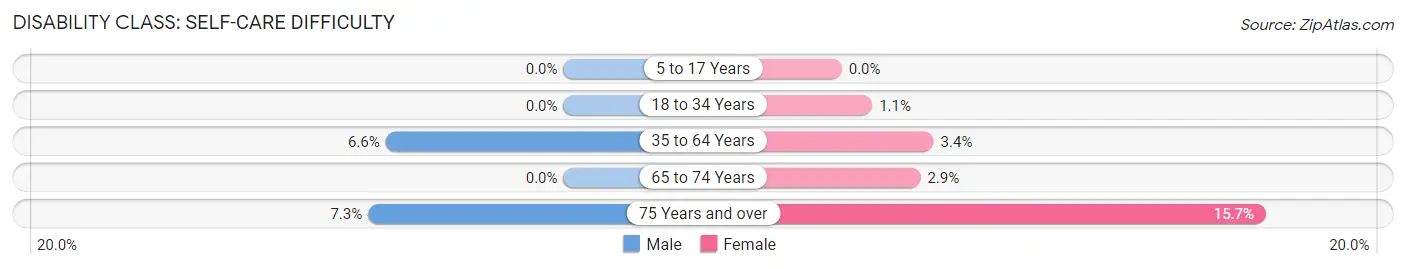
| Age Bracket | Male | Female |
| 5 to 17 Years | 0 (0.0%) | 0 (0.0%) |
| 18 to 34 Years | 0 (0.0%) | 27 (1.1%) |
| 35 to 64 Years | 208 (6.6%) | 102 (3.4%) |
| 65 to 74 Years | 0 (0.0%) | 27 (2.9%) |
| 75 Years and over | 33 (7.2%) | 93 (15.7%) |
Technology Access in Forest Park
Computing Device Access in Forest Park
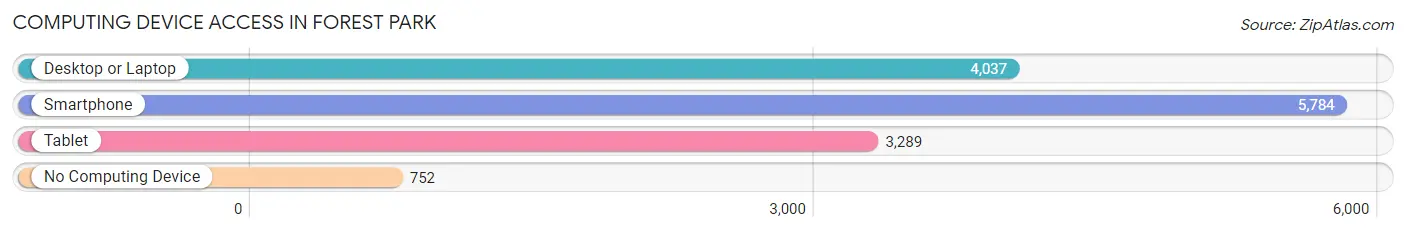
| Device Type | # Households | % Households |
| Desktop or Laptop | 4,037 | 57.5% |
| Smartphone | 5,784 | 82.4% |
| Tablet | 3,289 | 46.9% |
| No Computing Device | 752 | 10.7% |
| Total | 7,021 | 100.0% |
Internet Access in Forest Park
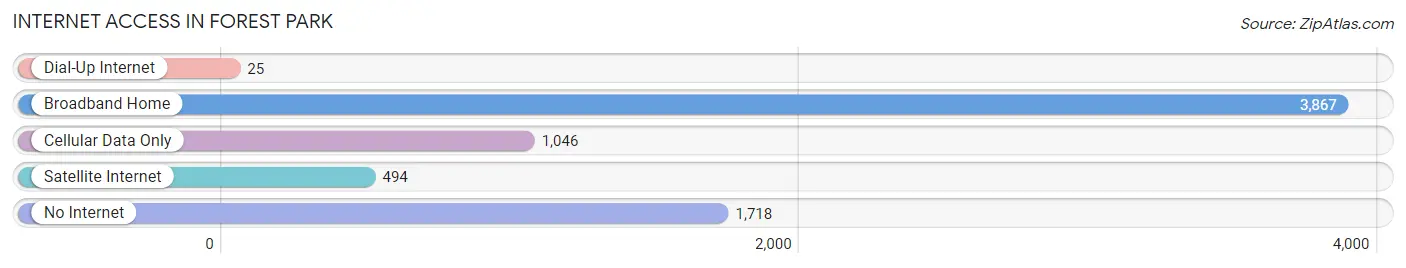
| Internet Type | # Households | % Households |
| Dial-Up Internet | 25 | 0.4% |
| Broadband Home | 3,867 | 55.1% |
| Cellular Data Only | 1,046 | 14.9% |
| Satellite Internet | 494 | 7.0% |
| No Internet | 1,718 | 24.5% |
| Total | 7,021 | 100.0% |
Forest Park Summary
Forest Park is a city located in Clayton County, Georgia, United States. It is located approximately nine miles south of Atlanta and is part of the Atlanta metropolitan area. The population was 18,468 at the 2010 census.
Geography
Forest Park is located at 33°38'17" North, 84°23'17" West (33.6379, -84.3881). According to the United States Census Bureau, the city has a total area of 8.2 square miles (21.2 km2), of which 8.1 square miles (21.0 km2) is land and 0.1 square miles (0.2 km2) is water.
History
The area that is now Forest Park was originally inhabited by the Creek Indians. The first white settlers arrived in the area in the early 1800s. The town was originally known as Forest Station, and was a stop on the Macon and Western Railroad. The town was renamed Forest Park in 1887.
In the early 1900s, the town was a popular destination for wealthy Atlantans looking to escape the city. The town was incorporated in 1908.
In the 1950s, the town began to experience rapid growth due to its proximity to Atlanta. The population of Forest Park increased from 1,890 in 1950 to 18,468 in 2010.
Economy
Forest Park is home to a variety of businesses, including manufacturing, retail, and service industries. The city is home to several large employers, including Delta Air Lines, Georgia-Pacific, and the Clayton County Board of Education.
The city is also home to several shopping centers, including Forest Park Mall, which is anchored by Macy's, JCPenney, and Sears.
Demographics
As of the 2010 census, there were 18,468 people, 6,945 households, and 4,717 families residing in the city. The population density was 2,279.3 people per square mile (882.2/km2). There were 7,541 housing units at an average density of 930.3 per square mile (359.2/km2). The racial makeup of the city was 44.2% White, 43.3% African American, 0.4% Native American, 5.2% Asian, 0.1% Pacific Islander, 4.3% from other races, and 2.5% from two or more races. Hispanic or Latino of any race were 10.2% of the population.
There were 6,945 households, out of which 33.2% had children under the age of 18 living with them, 41.2% were married couples living together, 19.7% had a female householder with no husband present, and 33.7% were non-families. 28.2% of all households were made up of individuals, and 8.7% had someone living alone who was 65 years of age or older. The average household size was 2.63 and the average family size was 3.22.
In the city, the population was spread out, with 26.2% under the age of 18, 10.2% from 18 to 24, 30.3% from 25 to 44, 22.2% from 45 to 64, and 11.1% who were 65 years of age or older. The median age was 34 years. For every 100 females, there were 91.2 males. For every 100 females age 18 and over, there were 87.2 males.
The median income for a household in the city was $37,890, and the median income for a family was $45,890. Males had a median income of $32,917 versus $26,945 for females. The per capita income for the city was $18,945. About 11.2% of families and 13.7% of the population were below the poverty line, including 19.2% of those under age 18 and 8.7% of those age 65 or over.
Common Questions
What is Per Capita Income in Forest Park?
Per Capita income in Forest Park is $20,145.
What is the Median Family Income in Forest Park?
Median Family Income in Forest Park is $44,389.
What is the Median Household income in Forest Park?
Median Household Income in Forest Park is $41,837.
What is Income or Wage Gap in Forest Park?
Income or Wage Gap in Forest Park is 6.5%.
Women in Forest Park earn 93.5 cents for every dollar earned by a man.
What is Inequality or Gini Index in Forest Park?
Inequality or Gini Index in Forest Park is 0.39.
What is the Total Population of Forest Park?
Total Population of Forest Park is 19,619.
What is the Total Male Population of Forest Park?
Total Male Population of Forest Park is 9,912.
What is the Total Female Population of Forest Park?
Total Female Population of Forest Park is 9,707.
What is the Ratio of Males per 100 Females in Forest Park?
There are 102.11 Males per 100 Females in Forest Park.
What is the Ratio of Females per 100 Males in Forest Park?
There are 97.93 Females per 100 Males in Forest Park.
What is the Median Population Age in Forest Park?
Median Population Age in Forest Park is 31.3 Years.
What is the Average Family Size in Forest Park
Average Family Size in Forest Park is 3.6 People.
What is the Average Household Size in Forest Park
Average Household Size in Forest Park is 2.7 People.
How Large is the Labor Force in Forest Park?
There are 8,648 People in the Labor Forcein in Forest Park.
What is the Percentage of People in the Labor Force in Forest Park?
59.7% of People are in the Labor Force in Forest Park.
What is the Unemployment Rate in Forest Park?
Unemployment Rate in Forest Park is 8.9%.